Attached files
| file | filename |
|---|---|
| EX-31.1 - EX-31.1 - PERRY ELLIS INTERNATIONAL, INC | d57310dex311.htm |
| EX-21.1 - EX-21.1 - PERRY ELLIS INTERNATIONAL, INC | d57310dex211.htm |
| EX-32.2 - EX-32.2 - PERRY ELLIS INTERNATIONAL, INC | d57310dex322.htm |
| EX-23.1 - EX-23.1 - PERRY ELLIS INTERNATIONAL, INC | d57310dex231.htm |
| EX-12.1 - EX-12.1 - PERRY ELLIS INTERNATIONAL, INC | d57310dex121.htm |
| EX-31.2 - EX-31.2 - PERRY ELLIS INTERNATIONAL, INC | d57310dex312.htm |
| EX-32.1 - EX-32.1 - PERRY ELLIS INTERNATIONAL, INC | d57310dex321.htm |
Table of Contents
UNITED STATES
SECURITIES AND EXCHANGE COMMISSION
Washington, D.C. 20549
FORM 10-K
(Mark One)
| x | ANNUAL REPORT PURSUANT TO SECTION 13 OR 15(d) OF THE SECURITIES EXCHANGE ACT OF 1934 |
For the fiscal year ended January 30, 2016
OR
| ¨ | TRANSITION REPORT PURSUANT TO SECTION 13 OR 15(d) OF THE SECURITIES EXCHANGE ACT OF 1934 |
For the transition period from to .
Commission File number 0-21764
Perry Ellis International, Inc.
(Exact Name of Registrant as Specified in Its Charter)
| Florida | 59-1162998 | |
| (State or Other Jurisdiction of Incorporation or Organization) |
(I.R.S. Employer Identification No.) | |
| 3000 N.W. 107th Avenue Miami, Florida | 33172 | |
| (Address of Principal Executive Offices) | (Zip Code) | |
(305) 592-2830
(Registrant’s telephone number, including area code)
Securities registered pursuant to Section 12(b) of the Act:
| Common Stock, $.01 par value | NASDAQ Global Select Market | |
| Title of Each Class | Name of Each Exchange on Which Registered |
Securities registered pursuant to Section 12(g) of the Act: None
Indicate by check mark if the registrant is a well-known seasoned issuer, as defined in Rule 405 of the Securities Act. Yes ¨ No x
Indicate by check mark if the registrant is not required to file reports pursuant to Section 13 or Section 15(d) of the Act. Yes ¨ No x
Indicate by check mark whether the registrant (1) has filed all reports required to be filed by Section 13 or 15(d) of the Securities Exchange Act of 1934 during the preceding 12 months (or for such shorter period that the registrant was required to file such reports), and (2) has been subject to such filing requirements for the past 90 days. Yes x No ¨
Indicate by check mark whether the registrant has submitted electronically and posted on its corporate Web site, if any, every Interactive Data File required to be submitted and posted pursuant to Rule 405 of Regulation S-T during the preceding 12 months (or for such shorter period that the registrant was required to submit and post such files). Yes x No ¨
Indicate by check mark if disclosure of delinquent filers pursuant to Item 405 of Regulation S-K is not contained herein, and will not be contained, to the best of the registrant’s knowledge, in definitive proxy or information statements incorporated by reference in Part III of this Form 10-K or any amendment to this Form 10-K. ¨
Indicate by check mark whether the registrant is a large accelerated filer, an accelerated filer, a non-accelerated filer or a smaller reporting company. See the definitions of “large accelerated filer,” “accelerated filer” and “small reporting company” in Rule 12b-2 of the Exchange Act. (Check one):
| Large accelerated filer | ¨ | Accelerated filer | x | |||
| Non-accelerated filer | ¨ | Smaller reporting company | ¨ | |||
Indicate by check mark whether the registrant is a shell company (as defined in Rule 12b-2 of the Exchange Act) Yes ¨ No x
The aggregate market value of the voting stock held by non-affiliates of the registrant is approximately $300,411,000 (as of August 1, 2015).
The number of shares outstanding of the registrant’s Common Stock is 15,387,000 (as of April 7, 2016).
DOCUMENTS INCORPORATED BY REFERENCE
The following documents are incorporated by reference:
Portions of the Company’s Proxy Statement for the 2016 Annual Meeting—Part III
Table of Contents
| Page | ||||||
| Part I | ||||||
| Item 1. |
4 | |||||
| Item 1A. |
17 | |||||
| Item 1B. |
24 | |||||
| Item 2. |
25 | |||||
| Item 3. |
25 | |||||
| Item 4. |
26 | |||||
| Part II | ||||||
| Item 5. |
26 | |||||
| Item 6. |
30 | |||||
| Item 7. |
Management’s Discussion and Analysis of Financial Condition and Results of Operations |
31 | ||||
| Item 7A. |
45 | |||||
| Item 8. |
45 | |||||
| Item 9. |
Changes in and Disagreements with Accountants on Accounting and Financial Disclosure |
45 | ||||
| Item 9A. |
46 | |||||
| Item 9B. |
48 | |||||
| Part III | ||||||
| Item 10. |
48 | |||||
| Item 11. |
48 | |||||
| Item 12. |
Security Ownership of Certain Beneficial Owners and Management and Related Stockholder Matters |
48 | ||||
| Item 13. |
Certain Relationships and Related Transactions and Director Independence |
48 | ||||
| Item 14. |
48 | |||||
| Part IV | ||||||
| Item 15. |
49 | |||||
| 55 | ||||||
1
Table of Contents
Unless the context otherwise requires, all references to “Perry Ellis,” the “Company,” “we,” “us” or “our” include Perry Ellis International, Inc. and its subsidiaries. References in this report to annual financial data for Perry Ellis refer to fiscal years ended January 30, 2016, January 31, 2015 and February 1, 2014. The periods presented in these financial statements are the fiscal years ended January 30, 2016 (“fiscal 2016”), January 31, 2015 (“fiscal 2015”) and February 1, 2014 (“fiscal 2014”). This Form 10-K contains references to trademarks held by us and those of third parties.
General information about Perry Ellis can be found at www.pery.com. We make our annual report on Form 10-K, quarterly reports on Form 10-Q, current reports on Form 8-K and amendments to these reports filed or furnished pursuant to Section 13 or 15(d) of the Securities Exchange Act of 1934, available free of charge on our website, as soon as reasonably practicable after they are electronically filed with the SEC. The information contained on our website is not included as part of or incorporated by reference into this Form 10-K.
FORWARD-LOOKING STATEMENTS
We caution readers that this report includes “forward-looking statements” as that term is used in the Private Securities Litigation Reform Act of 1995. Forward-looking statements are based on current expectations rather than historical facts and they are indicated by words or phrases such as “anticipate,” “believe,” “budget,” “contemplate,” “continue,” “could,” “envision,” “estimate,” “expect,” “guidance,” “indicate,” “intend,” “may,” “might,” “plan,” “possibly,” “potential,” “predict,” “probably,” “pro-forma,” “project,” “seek,” “should,” “target,” or “will” or the negative thereof or other variations thereon and similar words or phrases or comparable terminology. Such forward-looking statements include, but are not limited to, statements regarding Perry Ellis’ strategic operating review, growth initiatives and internal operating improvements intended to drive revenues and enhance profitability, the implementation of Perry Ellis’ profitability improvement plan and Perry Ellis’ plans to exit underperforming, low growth brands and businesses. We have based such forward-looking statements on our current expectations, assumptions, estimates and projections. While we believe these expectations, assumptions, estimates and projections are reasonable, such forward-looking statements are only predictions and involve known and unknown risks and uncertainties, and other factors that may cause actual results, performance or achievements to be materially different from any future results, performance or achievements expressed or implied by such forward-looking statements, many of which are beyond our control. These and other important factors may cause our actual results, performance or achievements to differ materially from any future results, performance or achievements expressed or implied by these forward-looking statements. Some of the factors that could affect our financial performance, cause actual results to differ from our estimates, or underlie such forward-looking statements, are as set forth below and in various places in this report. These factors include, but are not limited to:
| • | general economic conditions, |
| • | a significant decrease in business from or loss of any of our major customers or programs, |
| • | anticipated and unanticipated trends and conditions in our industry, including the impact of recent or future retail and wholesale consolidation, |
| • | recent and future economic conditions, including turmoil in the financial and credit markets, |
| • | the effectiveness of our planned advertising, marketing and promotional campaigns, |
| • | our ability to contain costs, |
| • | disruptions in the supply chain, including, but not limited to those caused by port disruptions, |
| • | our future capital needs and our ability to obtain financing, |
| • | our ability to protect our trademarks, |
2
Table of Contents
| • | our ability to integrate acquired businesses, trademarks, tradenames, and licenses, |
| • | our ability to predict consumer preferences and changes in fashion trends and consumer acceptance of both new designs and newly introduced products, |
| • | the termination or non-renewal of any material license agreements to which we are a party, |
| • | changes in the costs of raw materials, labor and advertising, |
| • | our ability to carry out growth strategies including expansion in international and direct-to-consumer retail markets, |
| • | our plans, strategies, objectives, expectations and intentions, which are subject to change at any time at our discretion, |
| • | potential cyber risk and technology failures that could disrupt operations or result in a data breach, |
| • | the level of consumer spending for apparel and other merchandise, |
| • | our ability to compete, |
| • | exposure to foreign currency risk and interest rate risk, |
| • | possible disruption in commercial activities due to terrorist activity and armed conflict, |
| • | actions of activist investors and the cost and disruption of responding to those actions, and |
| • | other factors set forth in this report and in our other Securities and Exchange Commission (“SEC”) filings. |
You are cautioned that all forward-looking statements involve risks and uncertainties detailed in our filings with the SEC. You are cautioned not to place undue reliance on these forward-looking statements, which are valid only as of the date they were made. We undertake no obligation to update or revise any forward-looking statements to reflect new information or the occurrence of unanticipated events or otherwise.
3
Table of Contents
Perry Ellis International, organized in 1967, is a global leader in the design, manufacturing, marketing and distribution of branded lifestyle apparel and accessories. We are one of the largest apparel companies in the world with a portfolio consisting of nationally and internationally recognized lifestyle brand names, some of which have a heritage dating back over 100 years.
We sell our products under our owned global brands, licensed brands and private retailer labels. Our owned brands include the global designer lifestyle brands, Perry Ellis® and Original Penguin ® by Munsingwear ® (“Original Penguin”) as well as Ben Hogan ®, Cubavera ®, Farah ®, Grand Slam ®, Jantzen ®, Laundry by Shelli Segal ®, Rafaella ® and Savane ®. We license the Callaway Golf® brand, PGA TOUR® brand, and the Jack Nicklaus® brand for golf apparel, the Jag® brand for swimwear and cover-ups and the Nike® brand for swimwear and accessories.
We have four reportable segments – Men’s Sportswear and Swim, Women’s Sportswear, Direct-to-Consumer, and Licensing – and we have a strategically diversified global distribution network focused on leading department stores, company-operated retail stores, specialty stores and select licensing partners. We distribute our products primarily to wholesale customers that represent all major levels of retail distribution including department stores, national and regional chain stores, mass merchants, specialty stores, sporting goods stores, the corporate wear market, e-commerce, as well as clubs and independent retailers, in North America and Europe. Our largest customers include Walmart Stores Inc., which includes Sam’s Wholesale Club (“Sam’s”) together (“Walmart”), The Marmaxx Group, and Macy’s, Inc. (“Macy’s”).
We also distribute through our own retail stores. As of April 1, 2016, we operated 41 Perry Ellis, 12 Original Penguin and two multi-brand retail outlet stores located primarily in upscale retail outlet malls across the United States, United Kingdom and Puerto Rico. As of April 1, 2016 we also operated three Perry Ellis, two Cubavera, 16 Original Penguin and one multi-brand full price retail stores located in upscale demographic markets in the United States and United Kingdom. In addition, we leverage our design, sourcing and logistics expertise by offering a limited number of private label programs to retailers.
In fiscal 2016, our Men’s Sportswear and Swim segment, which is comprised of men’s sportswear, swimwear and accessories, accounted for 71% of our total revenues, our Women’s Sportswear segment accounted for 14% of our total revenues, our Direct-to-Consumer segment, which is comprised of retail and e-commerce, accounted for 11% of our total revenues and our licensing segment accounted for approximately 4% of our total revenues. Finally, our U.S. based business represented approximately 87% of total revenues, while our foreign operations represented 13% of total revenues for fiscal 2016.
The revenue generated through our licensing business, which we license to third parties for certain production, sales and/or distribution rights through geographic licensing arrangements is a significant contributor to our operating income and our arrangements heighten the overall awareness of our brands without requiring us to make capital investments or incur additional operating expenses. As of fiscal 2016, we licensed our brands through four worldwide, 71 domestic and 91 international license agreements covering over 100 countries.
A synopsis of some of our major brands follows:
Ben Hogan. Ben Hogan was winner of 64 PGA TOUR events and holder of nine major championships. The Ben Hogan collection is reflective of the legend himself, in that it is characterized by an exceptional sense of style with a passion for excellence.
Callaway Golf. We became the official apparel licensee of Callaway Golf Company in March 2009. The Callaway Golf apparel men’s and women’s collection includes classic and fashion lines featuring knit and woven shirts, pullovers, jackets, sweaters, vests, pants, shorts, headwear and accessories. We launched a direct-to-consumer website, callawayapparel.com, and took over sales and distribution of Callaway Apparel in Europe, the Middle East, and Africa, in an agreement that runs through December 2017, with an option to extend through 2022.
4
Table of Contents
Grand Slam. Munsingwear introduced the world famous Grand Slam knit shirt in 1951. In 1954, an iconic logo was added to the left chest area—a groundbreaking design element that created a classic. Today, Grand Slam is a performance line that reflects the classic golf lifestyle, on and off the course.
Jack Nicklaus. Nicknamed the “Golden Bear,” Jack Nicklaus is widely regarded as a sports icon and one of the greatest champions in the history of golf, winning a record total of 18 professional major-championship titles and 73 PGA official PGA TOUR victories worldwide. There is no line of premium pro-performance clothing more deserving of his name than Jack Nicklaus® golf apparel. The current licensing agreement runs through December 2018 with an option to extend through 2023.
Laundry by Shelli Segal. From red carpet to runway, the Laundry by Shelli Segal collection is a reflection of the “L.A. Girl”- feminine and contemporary with an energetic and free-spirited attitude, always craving the next fashion statement. Every season, Laundry by Shelli Segal styles interpret the latest trends, while adding unique style to create a signature look. The line is sought after by fashionistas and Hollywood A-listers alike. Launched in 1988, Laundry by Shelli Segal dresses will take you from work to play—the label offers the perfect dress for the occasion. For more information visit laundrybyshellisegal.com.
Nike. Revolutionizing swim through constant innovation in competition and training, Nike Swim is defining the next generation of outfitting for sport. We are the official licensee in the United States, Canada and Mexico. Nike Swim products are sold through sporting goods, better specialty and department stores. The license agreement was extended to additional international territories and runs through 2021, with an option to extend to 2023.
Original Penguin. The Original Penguin brand is a cultural icon and represents a mix of iconic American sportswear and contemporary fashion that appeals to a style-savvy consumer who’s into the details but doesn’t take fashion too seriously. Focused on the millennial consumer, the Original Penguin lifestyle re-defines the terms ‘geek-chic’ and ‘eccentric preppy’ with a strong focus on Americana and vintage-inspired looks. The product line is sold worldwide at upscale department and upper-tier specialty stores and includes apparel, shoes and accessory items. The brand is also sold through stand-alone stores in the United States as well as the United Kingdom, Argentina, Chile and the Philippines. It is also sold online at originalpenguin.com (U.S.) and at originalpenguin.co.uk (Europe).
Perry Ellis. The Perry Ellis brand is faithful to a witty vision of American sportswear updated to address current trends, and does so with a strong focus on quality, value, comfort and innovation. The Perry Ellis lifestyle appeals primarily to higher-income, fashion-conscious professional men. We also license the Perry Ellis brand to third parties for a wide variety of apparel and non-apparel products. Perry Ellis products are sold in upscale and major department stores, both domestically and internationally, in stand-alone stores, and online at perryellis.com.
PGA TOUR. The PGA TOUR is synonymous with high performance and a commitment to excellence - qualities that have been incorporated into PGA TOUR apparel. The official PGA TOUR season is covered in virtually every major market in North America with hundreds of thousands of on-site fans and millions of television viewers worldwide. The brand is sold to mid-tier department stores and sporting goods stores. The line offers superior quality, performance and comfort for golfers and non-golfers alike. PGA TOUR apparel performs like a champion while remaining a fashion leader. The license was originally acquired in 2004, and has been extended through July 2017.
Rafaella. Rafaella focuses on understanding the needs of the modern woman who leads an on-the-go lifestyle. The brand’s continued success is a result of combining luxury fabrics and great style with an impeccable fit. The line provides sophisticated style that transitions easily from day to night. Rafaella Sport launched in spring 2015 with a casual “athleisure” complement to the main collection. The brand is sold in better department stores and on e-commerce sites.
5
Table of Contents
Savane. The Savane collection offers an array of styles, silhouettes and fabrications for every wearing occasion. Innovative product launches include: Eco-Start® products made with Repreve® recycled fibers, and slim fit Travel Intelligence® that utilizes our signature CRUSHPROOF® technology. Comfort, innovation and performance are the key attributes of Savane. The line is available at national department and regional specialty stores. For further information visit savane.com.
Our Competitive Strengths
We believe that we have the following competitive strengths in our industry:
Portfolio of nationally and internationally recognized brands. We have built a broad and deep portfolio of global and licensed brands. We believe our brands are well-known and have a loyal following of both fashion-conscious consumers and retailers who desire high quality, well-designed fashion apparel and accessories.
Diversified business model. We market our products at multiple price points and across multiple channels of distribution, allowing us to provide products to a broad range of consumers, while reducing our reliance on any one demographic segment, merchandise preference or distribution channel. Specifically, we view our business as being well diversified:
By brand. We maintain a global portfolio of over 30 highly recognized brands that appeal to fashion conscious consumers across various income levels. We design, source, market and license most of our products on a brand-by-brand basis targeting distinct consumer demographic and lifestyle profiles. For example, we market the Perry Ellis and Original Penguin brands to higher-income consumers, and market the Grand Slam and Savane brands to middle-income consumers. We also market brands that target women through our Rafaella and Laundry by Shelli Segal brands, as well as through our family of golf and swimwear brands which include Callaway, Jantzen and Nike. In addition, our brands such as Gotcha, Manhattan and Pro Player are distributed through direct license. This allows us to maintain strong brand integrity without a direct wholesale or retail commitment of resources.
By product. We design and market apparel and accessories in a broad range of both men’s and women’s product categories, which we believe increases the stability of our business. Our menswear offerings include career and casual sportswear, golf apparel, sports apparel, swimwear, activewear and accessories. Our womenswear offerings include dresses, sportswear, swimwear, activewear and accessories. We believe that our product diversity decreases our dependence on a single product line or fashion trend and contributes substantially to our growth opportunities.
By distribution channel. We market our products across multiple levels of retail distribution, allowing us to reach a broad range of consumers domestically and internationally. We distribute our products through luxury stores, department stores, national and regional chain stores, mass merchants, specialty stores, sporting goods stores, the corporate wear market, e-commerce, as well as clubs and independent retailers. Our products are distributed through approximately 25,000 doors at some of the nation’s leading retailers, including Walmart, the Marmaxx Group and Macy’s. We also distribute our products through our own retail stores, which include 41 Perry Ellis, 12 Original Penguin and two multi-brand retail outlet stores and three Perry Ellis, two Cubavera and 16 Original Penguin and one multi-brand full-price retail stores. We also operate e-commerce sites for several of our brands. Finally, we have successfully expanded product and brand distribution in the United Kingdom, Canada, Latin America and Europe, and believe additional opportunities exist for further international expansion of our brand base.
6
Table of Contents
The following table illustrates the current diversity of a cross section of our brands and products we produce and market and their respective distribution channels:
| Distribution Channels |
Brands | |||||||
| Luxury Stores | Original Penguin | Laundry by Shelli Segal | Callaway Golf | |||||
| Department Stores | Perry Ellis | Rafaella | Callaway Golf | Jag | ||||
| Savane Original Penguin | Laundry by Shelli Segal Jack Nicklaus | PGA TOUR Cubavera | Nike Swim Jantzen | |||||
| Chain Stores | Savane Jack Nicklaus | Jag Grand Slam | PGA TOUR | Nike Swim | ||||
| Mass Merchants | Ben Hogan | |||||||
| Corporate/Green Grass/ Sporting Goods |
Callaway Golf | Jack Nicklaus | PGA TOUR | Nike Swim | ||||
| Specialty Stores | Jag Savane | Original Penguin Laundry by Shelli Segal | Jantzen | Nike Swim | ||||
| International (1) | Perry Ellis Original Penguin Farah | Callaway Golf Laundry by Shelli Segal Rafaella | PGA TOUR Ben Hogan Manhattan | Jantzen Nike Swim | ||||
| Direct-to-Consumer | Original Penguin Perry Ellis | Rafaella Callaway Golf | Cubavera | Farah | ||||
| (1) | This channel includes Company operated retail stores, e-commerce and concession locations. |
Leadership position in the Men’s Wholesale business. We believe that our established relationships with retailers allow us to maximize the selling space dedicated to our products, monitor our brand presentation and merchandising selection, and proactively introduce new brands and products. Because of our quality brands and products, dedication to customer service, design expertise and sourcing capabilities, we have developed and maintained long-standing relationships with our largest customers. In addition, we are engaged in wholesale growth initiatives that are designed to transform our respective brands’ displays at select department stores into branded “shop-in-shops.” By installing customized freestanding fixtures, wall casings and components, decorative items and flooring, as well as deploying specially trained staff, we believe that our shop-in-shops provide department store consumers with a more personalized shopping experience than traditional retail department store configurations.
Growing Licensing business. The strengths of our brands have been instrumental in helping us build our global licensing business. We collaborate with over 120 high-quality product licensees who produce and sell what we believe are products requiring specialized expertise that are enhanced by our brands’ respective strengths. We provide support to these business partners and ensure the integrity of our brand names by taking an active role in the design, quality control, advertising, marketing and distribution of licensed products. Our relationships with our product licensees have helped us leverage our success across demographics and categories by taking advantage of their unique expertise, resulting in total royalty revenue for licensed products increasing from $31.7 million in fiscal 2015 to $34.7 million in fiscal 2016. In addition, we have entered into agreements with non-manufacturing third-party licensees who we believe have particular expertise in the distribution of fashion apparel and accessories in specific geographic territories, such as the Middle East, Eastern Europe, Latin America and the Caribbean, throughout Asia and Australia.
Manufacturing, Sourcing and Distribution. Product design and innovation, including fit, fabric, finish and quality are important elements across our businesses. We have sourced our products globally for over 45 years and employ sophisticated logistics and supply chain management systems to maintain maximum flexibility. Our network of worldwide company-owned sourcing offices and agents enables us to meet our customers’ needs in an efficient and high quality manner without relying on any one vendor, factory, or country. In fiscal 2016, based on the total units, we sourced our products from Asia (77%), the Middle East (16%) and the Americas (7%). We maintain a staff of over 290 experienced sourcing professionals in four offices in China (including Hong Kong),
7
Table of Contents
as well as in the United States, Taiwan, Bangladesh, and Vietnam. Our sourcing offices closely monitor our suppliers and provide strict quality assurance analyses that allow us to consistently maintain our high quality standard for our customers. We have a compliance department that works closely with our quality assurance staff to ensure that our sourcing partners comply with Company-mandated and country-specific labor and employment regulations. We believe that sourcing our products allows us to manage our inventories more effectively while avoiding capital investments in production facilities. Because of our sourcing experience, capabilities and relationships, we believe that we are well positioned to take advantage of the changing textile and apparel quota environment. We limit our sourcing exposure through, among other measures: (i) shifting of production among countries and factories, (ii) sourcing production to merchandise categories where product expertise exists and (iii) sourcing from countries with tariff preference and free trade agreements.
Design expertise and advanced technology. We maintain a staff of designers, merchandisers and artists who are supported by a staff of design professionals, including assistant designers, technical designers, graphic artists and production assistants. Our in-house design staff designs substantially all of our products using advanced three dimensional computer-aided design technology that minimizes the time-intensive and costly production of sewn prototypes. In addition, this technology provides our customers with products that have been custom designed for their specific needs and meet current fashion trends. We design and employ advanced fabric and design technologies to ensure a proper fit and outstanding performance when creating our women’s and men’s golf and swimwear apparel. We seek to regularly upgrade and improve our products with the latest in innovative technology while broadening our product offerings. Our goal, to deliver superior performance in all our products, provides our developers and licensees with a clear, overarching direction for the brand and helps them identify new opportunities to create products that meet the changing needs of consumers. We regularly upgrade our computer technology, including our Product Lifecycle Management systems, to enhance our design capabilities, and facilitate communication with our global suppliers and customers on a real-time basis resulting in faster new product developments thereby meeting the ever-changing needs of our customers.
Our sales planners have an enhanced ability to manage and monitor our retail customers’ inventory at the stock keeping unit (“SKU”) level through utilization of our Oracle Retail Planning system. This system helps planners maximize the sales and margins of our products by identifying opportunities for our retailer customers to improve inventory turns which reduces our product returns and markdowns and improves our profitability. We use PerrySolutions in-house planning software and Oracle Retail during the assortment planning process to allocate the optimal size/color and quantity mix for the initial retail product rollout.
Our Data Warehouse, Geographical Information Systems and IBM SPSS, a forecasting model, are utilized to detect future trends and identify new business opportunities. Our e-commerce environment utilizes Demandware coupled with the best of the breed e-commerce cloud and social media services to create an integrated leading edge environment. We recently completed implementation of a cloud loyalty system utilizing Salesforce, Oracle-Eloqua, and Starmount’s mobile POS. These solutions improve our understanding of our direct-to-consumer market allowing us to engage the customer at the time of purchase resulting in significant increases in revenue per transaction.
Proven and experienced management team. Our senior management team averages more than 30 years in the apparel industry and has extensive experience in growing and rejuvenating brands and building strong relationships with global suppliers, licensees and retailers. With an average of 25 years of experience in the retail industry, including at a number of public companies, and an average of 15 years with Perry Ellis International, our senior management team has strong creative and operational experience and a successful track record. This extensive experience extends beyond our senior management team and deep into our organization.
8
Table of Contents
Our Business Strategy
Our goal is to increase our revenue and profits with a portfolio of brands that we offer in multiple channels of retail distribution through the following strategies:
Continue to strengthen the competitive position and recognition of our lifestyle brands. We intend to continue growing brand awareness and customer loyalty in North America and internationally, in a number of ways including by:
| • | Managing our brands individually, and developing a distinctive merchandising and marketing strategy for every product category and distribution channel. |
| • | Opening new retail stores in key geographical locations. |
| • | We maintain our advertising position in global fashion publications, participation in trade shows, event and celebrity sponsorships, cooperative advertising in print and broadcast media, as well as growing our online advertising exposure and internet presence directly to consumers. |
| • | Increasingly using e-commerce, digital, social media, and mobile applications to both support the initiatives of our wholesale partners as well as interact with our customers in order to enhance the shopping experience. We are investing in initiatives to provide attractive, effective, reliable, user-friendly e-commerce platforms that offer a wide assortment of merchandise with rapid delivery options that continually meet the changing expectations of online shoppers. In addition, we have built a state of the art photography studio to provide greater creative functionality. |
We partner with leading wholesale customers in national and regional department, chain, mass market, specialty and independent stores in North America and Europe. These longstanding relationships enable us to access large numbers of our key consumers in a targeted manner. In addition, we are engaged in wholesale growth initiatives such as advertising support in the form of point-of-sale fixtures and signage to enhance the presentation and brand image of our products. We also participate in shop-in-shops which are the primary component of our retail marketing strategy to increase and brand floor space dedicated to our products within our major retail accounts. The design and funding of our concept shops within our major retail accounts has been a key initiative for securing prime floor space, educating the consumer and creating an exciting environment for the consumer to experience our branded products. Our shops enhance our brand’s presentation within our major retail accounts with a shop-in-shop approach, using dedicated floor space exclusively for our products, including flooring, lighting, walls, displays and images. We participate in incentive programs with our retailer customers, including customer loyalty, discounts, allowances and cooperative advertising funds. We also offer sales incentive programs directly to consumers through our “Supreme Perks” Loyalty Program which targets consumers in our direct-to-consumer channel.
The strength and agility of our global brands has been instrumental in helping us expand our licensing business. We collaborate with a select number of product licensees who produce and sell products requiring specialized expertise that are enhanced by our brands’ strengths. In addition, we have entered into agreements with non-manufacturing licensees who have particular expertise in the distribution of our products in countries and geographic territories such as South Korea, the Philippines, the Middle East, China, South Africa, Latin America and the Caribbean.
Expand our product offerings. We have been a leader in men’s apparel for over 40 years and believe we can continue to grow this business by leveraging our expertise and experience in design and manufacturing in our relationships with leading retailers, and in our sourcing capabilities to expand to new product categories by capitalizing on our brands’ strong awareness and loyalty among consumers. We can both optimize our strong business opportunities and attract new customers to our brands. For example, this year our product offerings within Perry Ellis expanded to include “athleisure” components under Perry Ellis 360°. The line incorporates performance fabrics, reflective tape and materials that provide function and versatility.
Grow our Direct-to-Consumer channel. We seek to expand and leverage the high gross margin direct-to-consumer channel, which includes e-commerce, outlet stores and full-price stores, and where we control all aspects of the operation, thereby complementing our wholesale business. This business segment operates under a single operating group to ensure our omni-channel operations are interdependent. This has enabled our company to increase comparable store sales with a number of initiatives already under way to increase the size and frequency of purchases by our existing customers and to attract new customers. Such initiatives include, among others, maximizing productivity with existing stores, creating compelling store environments and offering new products, including menswear, small leather goods, and active footwear.
9
Table of Contents
E-commerce is our fastest growing direct-to-consumer channel. As a complement to our wholesale business, we currently market Perry Ellis, Original Penguin, Farah, Rafaella, Cubavera and Callaway Golf Apparel products online in the United States and internationally. We are continuing to enhance the online capabilities and functionality of our e-commerce sites to improve the shopping experience and increase sales. At the same time, these enhancements enable us to expand the number of countries to which we are able to ship. In addition, we plan to continue servicing our indirect e-commerce channel platforms for our retail partners by further investing in product presentation and selling capabilities to strengthen the competitive position and image of our current brands on their respective websites.
In addition to e-commerce, our stores allow us to showcase a brand’s full line of current season products, with fixtures and imagery, which we believe reinforce our brand image and enables us to control the entire customer experience. We intend to expand our store base both domestically and internationally by opening new retail locations for Perry Ellis, Original Penguin and other brands. We also continue to increase global comparable store sales with a number of initiatives already under way to increase the size and frequency of purchases by our existing customers and to attract new customers. Such initiatives include, among others, maximizing the merchandise assortment within existing stores, providing exceptional customer service, creating compelling store environments and offering new products, small leather goods, travel products and accessories.
In addition to our direct-to-consumer operations, our licensees, distributors and other independent parties own and operate over 90 stores. These are primarily mono brand stores selling company-branded products with the same look and feel as company-operated stores. The majority of these stores are located in Latin America and Asia.
Grow our International businesses. We believe that our strong brand portfolio and broad product offerings enable us to seek additional growth opportunities in geographic areas where we are underpenetrated, such as Europe and Asia. Our historic growth focused primarily on the wholesale channel within the United States, and accordingly, our revenues are concentrated in that distribution channel. We intend to strengthen our existing markets and successfully expand our business in relatively underdeveloped or under-optimized markets. Our immediate concentration is supporting our momentum in Europe, Canada and Latin America while expanding our penetration in Asia and the Middle East. For example, last year we significantly expanded our penetration in Europe, with development in France, Spain, Benelux and Italy. In addition, we plan to introduce Perry Ellis America, Nike Swim and Ben Hogan in Europe this year. We also seek to expand revenue through licensing partnerships across Asian, Middle Eastern, African and Indian markets. We executed new licensing relationships in India and the Middle East for Original Penguin this year as well.
Adapt to our continually changing marketplace. We will continue to make investments and implement strategies to meet the growing needs of our customers on a timely basis in the ever-changing apparel industry. We are currently focusing on expanding our business in the following areas:
| • | We continue to elevate our Perry Ellis brand by leveraging the creative talent of our design and merchandising teams. We hold runway shows which reinforce Perry Ellis’ designer status and high-fashion image, creating excitement around the collections and generating global multimedia press coverage. We continue to make investments in global advertising and integrated marketing programs, with the popular “Very Perry” advertising campaign as the current cornerstone of our global marketing strategies. |
| • | We implemented a successful wholesale strategy for Original Penguin, transitioning from a classification business to full-lifestyle offerings at wholesale in order to more efficiently and effectively exploit the development opportunities for the brand. The “Be an Original” spirit of the brand inspires a wide range of contemporary, all-American designs that appeal to a diverse array of global consumers. |
10
Table of Contents
| • | We continue to increase our wholesale sales by increasing shop-in-shops for Perry Ellis, Original Penguin and Rafaella. We believe that our shop-in-shop initiatives effectively communicate our brand image within the department store, enhance the presentation of our merchandise and create a more personalized shopping experience for department store customers. We plan to grow our North American shop-in-shop footprint at select department stores by continuing to convert existing wholesale door space into shop-in-shops and expanding the size of existing shop-in-shops. |
| • | We are a leading manufacturer of golf lifestyle products and our branded portfolio includes Callaway Golf, PGA TOUR, Grand Slam, Ben Hogan, and Jack Nicklaus. We believe there is opportunity to capitalize on the evolution of golf apparel which continues to replace traditional sportswear attire and permits us to expand across multiple distribution channels. We added Callaway Golf to our portfolio of golf brands during fiscal 2010, and in fiscal 2013 expanded our licensing agreement to include off-course, green grass and sporting goods retailers while also expanding the territory to the entire Western Hemisphere. In fiscal 2013, we concluded the purchase of the Ben Hogan trademark and launched apparel with a retail partner during the latter part of that year. In fiscal 2014, we also entered into an agreement to develop apparel for the Jack Nicklaus brand. In fiscal 2015, we expanded the penetration of our distribution under the Callaway Golf brand into Europe, the Middle East and Africa. |
| • | We are focused on several initiatives to increase our direct-to-consumer sales, including further growth and expansion of our retail stores and our e-commerce websites. Operationally, we seek to maximize the omni-channel experience through store fulfillment of online orders, executing small-door and climate-right strategies and expanding higher margin businesses including luggage, footwear and accessories. |
| • | We continue to evaluate our businesses for productivity and profitability. This year, we continued to focus on cost controls within cost of goods sold and selling general and administrative expenses, through process enhancements, inventory management and consolidation. |
| • | Since the beginning of fiscal 2014, we have exited 32 underperforming brands and businesses, totaling $108 million in revenues. The process has enabled our company to better manage working capital and focus on deriving value from our core brands and higher-margin businesses. |
Expand our licensing opportunities. We believe licensing to third parties is an attractive opportunity for our brands by providing increased customer exposure domestically and internationally, as well as opportunities for future product extensions. We intend to continue to expand the international distribution of our brands through licensing. This year, we entered into 26 new licensing agreements to expand our product offerings under our well-known brands and broaden the markets that we serve. We have over 160 license agreements, covering over 100 territories outside of the United States, to use our brands in numerous product categories, including apparel, accessories, footwear, soft home goods and fragrances. We have an active pipeline of new agreements in development as we expand product categories and markets.
We provide support to these business partners and ensure the integrity of our brand names by taking an active role in the design, quality control, advertising, marketing and distribution of licensed products. We are focusing resources on globalizing core brands and upgrading existing licensees. We intend to leverage the 2016 introduction of Perry Ellis in Europe as a springboard for additional licensing revenue. For Original Penguin, we seek to continue to grow in key licensed categories including kid’s apparel and footwear, accessories, watches and eyewear.
11
Table of Contents
Licensing arrangements relate to a broad range of our brands. In addition to the revenues and brand awareness that licensing provides us, we also believe that licensing our brands benefits us by providing significant high-margin operating income contribution.
Pursue strategic acquisitions and opportunities that leverage and enhance our global product offerings. We continually review acquisition opportunities and believe that our existing infrastructure and management depth will enable us to complete additional acquisitions in the apparel industry should there be an attractive prospect. While we believe we have a diverse portfolio of brands with growth potential, we will continue to explore trademarks and licensing opportunities that we believe are additive to our overall business. New license opportunities allow us to fill new product and brand portfolio needs. We take a disciplined approach to acquisitions, seeking business opportunities that we can grow profitably and expand by leveraging our infrastructure and core competencies and, where appropriate, by extending the brand through licensing.
Recent Developments
On April 6, 2015, we elected to call for the partial redemption of $100 million of our $150 million outstanding 7.875% Senior Subordinated Notes due 2019 (the “Notes”) and a notice of redemption was sent to all registered holders of the Notes. The redemption price for the Notes is equal to 103.938% of the principal amount of the Notes, plus accrued and unpaid interest to, but not including, the redemption date. On May 6, 2015, we completed the redemption of the $100 million of our senior subordinated notes. We incurred debt extinguishment costs of approximately $5.1 million in connection with the redemption, including the redemption premium as well as the write-off of note issuance costs.
In connection with the partial redemption of the Notes, on April 1, 2015, we entered into a commitment letter with Wells Fargo Bank, National Association, as agent under the Amended and Restated Loan and Security Agreement dated as of December 2, 2011, as amended (the “Loan Agreement”), pursuant to which the maximum principal balance that may be outstanding under the Loan Agreement was increased by $75 million to a maximum of $200 million. The closing occurred during April 2015.
On March 31, 2015, we expanded our licensing agreement with Nike, Inc. to include additional territories globally with immediate expansion into certain countries within Europe, Central and South America.
On March 19, 2015, we entered into an agreement to sell the intellectual property of the C&C California brand to ACH C&C LLC.
During the fourth quarter of fiscal 2016, we entered into a sales agreement, in the amount of $8.2 million, for the sale of our sourcing office building located in Beijing, China. As a result of this transaction, we recorded a gain in the amount of $4.5 million, net of expenses of $1.9 million.
Products and Product Design
Perry Ellis International has assembled a world-class design team, positioned in critical locations around the world. The extensive team is seasoned and well-versed in many product categories. The company’s core competency continues to remain menswear, offering products ranging from casual to career sportswear, niche lifestyle apparel in the Latin-inspired markets, emerging Big and Tall markets, as well as technology-rich innovation in the market for authentic golf. Key sport extensions include swim, training and the corresponding accessories. Womenswear continues as a powerful opportunity for the company, with ever-expanding offerings in the sport separates and dress markets, as well as parallel extensions to the men’s product stable in swim and active.
We continue to make technology investment a priority in all areas of the Company. The in-house design organization continues to benefit from the latest updates in state-of-the-art computer added design (“CAD”) technology. Woven and knitted fabric patterns, print patterns and silhouette enhancements are mapped and confirmed with speed and accuracy, as well as with great cost-efficiency. The latest evolutions in style and fashion quickly travel from concept to factory-ready reality.
12
Table of Contents
Our creative mission is to offer and market fashion-right branded lifestyle products that appeal to a broad and diverse customer base. Extensive consumer and fashion trend research, along with the ever-vigilant monitoring of retail sales, enables us to deliver the right products at the right time to the right sector.
Licensing Operations
We license certain brands to third parties for various product categories in distribution channels and countries where we may not distribute our brands directly. Licensing enhances the images of our brands by widening the range, product offerings and distribution of products sold under our brands without requiring us to make capital investments or incur additional operating expenses. As a result of this strategy, we are experienced in identifying licensing opportunities and have established relationships with numerous licensees. Our licensing operation is also a significant contributor to our operating income.
As of January 30, 2016, we were the licensor of over 160 license and distribution agreements, for various products including footwear, men’s suits, sportswear, dress shirts, tailored clothing, underwear, loungewear, outerwear, activewear, neckwear, fragrances, eyewear, accessories and home, and for various international territories. Wholesale sales of licensed products by our licensees were approximately $697 million, $637 million and $596 million in fiscal 2016, 2015, and 2014, respectively. We received royalties from these sales of approximately $34.7 million, $31.7 million and $29.7 million in fiscal 2016, 2015, and 2014, respectively. We believe that our long-term licensing opportunities will continue to grow domestically and internationally. Although the Perry Ellis brand has international recognition, we still perceive the brand to be under-penetrated in international markets such as Europe, Latin America and Asia. We are actively working to optimize and expand our base of licensees for the Perry Ellis brand in international markets. We believe that our brand and licensing experience will enable us to capitalize on these international opportunities and that our operations in Europe will assist us in this endeavor.
We have been successful with licensing our Original Penguin brand, both domestically and internationally, in categories such as footwear, fragrance, eyewear, dress shirts, tailored clothing, neckwear and kids apparel. We also believe that Laundry by Shelli Segal and Rafaella provide additional licensing opportunities such as accessories and footwear. Other brands within our portfolio we license for certain product categories and territories include Farah, Jantzen, Gotcha, Manhattan, and Ben Hogan among others.
To maintain a brand’s image, we closely monitor our licensees and approve all licensed products. In evaluating a prospective licensee, we consider the candidate’s experience in product design and manufacturing, financial stability, marketing ability and experience in wholesale and retail. We also evaluate the marketability and compatibility of the proposed products with our brands. We regularly monitor product design, development, merchandising and marketing of licensees, and schedule meetings throughout the year with licensees to ensure product quality and brand consistency. We expose our products and fashion collections to our licensees and share our expectations of product positioning in the marketplace. In addition to approving, in advance, all licensees’ products, we also approve their advertising, promotional and packaging materials.
As part of our licensing strategy, we work with our licensees to further enhance the development, image, and sales of their products. We offer licensees marketing support, and our relationships with retailers help the licensees generate higher revenues.
Our license agreements generally extend for a period of three to five years with options to renew prior to expiration for an additional multi-year period based upon a licensee meeting certain performance criteria. The typical agreement requires that the licensee pay us the greater of a royalty based on a percentage of the licensee’s net sales of the licensed products or a guaranteed minimum royalty that typically increases annually over the term of the agreement. Generally, licensees are required to contribute to us additional funds for advertising and promotion of the brand.
Marketing, Advertising and Promotions
Our strategy to market and promote our products begins with our portfolio of brands across the four business segments. We strive to be locally relevant with the marketing and visual merchandising of our products across an array of developed and emerging markets within the channels of distribution in which we operate.
13
Table of Contents
Our marketing strategies vary by brand and local market. Our portfolio of brands employ different engagement models suited to each brand’s equity, distribution, product focus and understanding of the core consumer. This enables us to elevate the consumer experience as we attract new customers, build loyalty and drive advocacy. Our marketing planning approach leverages local insights to optimize allocation of resources across different media outlets and retail touch points to resonate with our most discerning consumers most effectively. Most of our creative marketing work is done by in-house creative teams that design and produce the sales materials, advertisements and packaging for products in each brand. We build brand equity and drive traffic to retail locations and to our websites through magazines and newspapers, digital and social media, television, billboards in cities and airports, and direct mail and email. In addition, we seek editorial coverage for our brands and products not only in publications and other traditional media, but increasingly in digital and social media, leveraging significant opportunities for growth.
We are increasing our brand awareness and sales by expanding our digital presence, encompassing e-commerce and mobile-commerce, as well as digital and social media. We continue to innovate to better meet consumer online shopping preferences, support e-commerce and mobile-commerce businesses via digital and social marketing activities designed to build brand equity and consumer engagement, and support our authorized retailers to strengthen their e-commerce businesses and drive sales of our brands on their websites. We have opportunities to expand our brand portfolio online around the world, and we have developed omni-channel concepts to better serve consumers as they shop across channels. We have dedicated resources to implement coordinated, brand-enhancing strategies across all online activities to increase our direct access to consumers.
Promotional activities and in-store displays are designed to attract new consumers and introduce existing consumers to other product offerings from the respective brands. Our marketing efforts also benefit from cooperative advertising programs with some retailers, some of which are supported by coordinated promotions. Our marketing and sales executives spend considerable time in the field meeting with consumers and retailers at the points of sale.
Distribution and Customers
We operate 41 Perry Ellis, 12 Original Penguin and two multi-brand retail outlet stores and three Perry Ellis, two Cubavera and 16 Original Penguin and one multi-brand full-price retail stores. We also operate e-commerce sites for several of our brands with goals to expand our e-commerce offerings.
We believe that customer service is a key factor in successfully marketing our products. We coordinate efforts with customers to develop products meeting their specific needs using our design expertise and CAD technology. Utilizing our sourcing capabilities, we strive to produce and deliver products to our customers on a timely basis.
We sell merchandise to a broad spectrum of retailers, including national and regional chains, department, mass merchant and specialty stores. Our largest customers include Walmart, The Marmaxx Group and Macy’s. We have developed and maintained long-standing relationships with these customers. Additionally, we sell merchandise to other retailers such as: Belk, Dillard’s and Hudson Bay Company. We also sell merchandise to corporate wear distributors.
Net sales to our five largest customers accounted for approximately 47%, 49% and 43% of net sales in fiscal 2016, 2015 and 2014, respectively. For fiscal 2016, three customers accounted for over 10% of net sales; Walmart accounted for 12%, The Marmaxx Group accounted for 11% and Macy’s accounted for 10% of net sales, respectively. For fiscal 2015, four customers accounted for over 10% of net sales; Walmart accounted for 14% and Kohl’s, Macy’s and The Marmaxx Group each accounted for 10% of net sales, respectively. For fiscal 2014, two customers accounted for over 10% of net sales; Kohl’s and Macy’s accounted for approximately 11% and 10% of net sales, respectively.
Information Systems
Our in-house sales staff is responsible for customer follow-up and support, including monitoring prompt order fulfillment and timely delivery. We utilize EDI and a self-hosted site for certain customers in order to provide
14
Table of Contents
advance-shipping notices, process orders and conduct billing operations. In addition, certain customers use the EDI system to communicate their weekly inventory requirements per store to us. We then fill these orders either by shipping directly to the individual stores or by sending shipments, individually packaged and bar coded by store, to a centralized customer distribution center.
We use PerrySolutions in-house planning software that enables our sales planners to manage our retail customers’ inventory at the SKU level. In addition, we use Oracle Retail during the assortment planning process to allocate the correct quantities for the initial rollout of product at retail. These systems help us maximize sales and margins of our products by increasing inventory turns for the retailer, which in turn reduces our product returns and markdowns and increases our profitability. We also use demographic mapping data software that helps us develop specific micro-market plans for our customers and provide them with enhanced returns on our various product lines. Our Data Warehouse, Geographical Information Systems and IBM SPSS are utilized to detect future trends and identify new business opportunities. Our e-commerce environment utilizes Demandware coupled with the best of breed e-commerce, Cloud and social media services creating an integrated leading edge environment.
We use the Oracle Retail suite of products with the goal of reducing markdowns, increasing inventory turns and increasing revenues while automating the process. The different modules allow us to monitor our customers’ product by store and quickly react to changes in consumer behavior. The suite also includes best of breed store inventory and point of sales software, which allows us to keep just in time inventory at our retail stores. This investment shows our commitment to understanding our consumer in order to strengthen our brands as well as our effort to support the continued expansion of our direct retail businesses. Additionally, we invested in Trade Management Oracle Financials software to quickly and positively resolve customer claims.
In addition, we use Google Apps for Work to provide real-time collaboration across our global offices, with face to face video conferencing available to every associate, for training and business meetings.
Seasonality and Backlog
Our products are geared towards lighter weight apparel generally worn during the spring and summer months. We believe that this seasonality has been reduced with our introduction of fall, winter and holiday merchandise. The swimwear business, however, is highly seasonal in nature, with the vast majority of our sales occurring in our first and fourth quarters.
We generally receive orders from our retailers approximately five to seven months prior to shipment. For the majority of our sales, we have orders from our retailers before we place orders with our suppliers. A summary of the order and delivery cycle for our four primary selling seasons, excluding swimwear, is illustrated below:
| Merchandise Season |
Advance Order Period |
Delivery Period to Retailers | ||
| Spring | July to September | January to March | ||
| Summer | October to December | April and May | ||
| Fall | January to March | June to September | ||
| Holiday | April to June | October and November |
Sales and receivables are recorded when inventory is shipped. Our backlog of orders includes confirmed and unconfirmed orders, which we believe, based on our past experience and industry practice, will be confirmed. As of March 24, 2016, the backlog for orders and shipments to date of our products was approximately $570 million, as compared to approximately $577 million as of March 25, 2015. The amount of unfilled orders at a point in time is affected by a number of factors, including the mix of product, the timing of the receipt and processing of customer orders and the scheduling of the sourcing and shipping of the product, which in most cases depends on the desires of the customer. Our backlog is also affected by an on-going trend among retailers to reduce the lead-time on their orders. In recent years, our customers have been more cautious of their inventory levels and have delayed placing orders and re-orders compared to our previous experience. Due to these factors, a comparison of unfilled orders from period to period is not necessarily meaningful and may not be indicative of eventual actual shipments.
15
Table of Contents
Supply of Products and Quality Control
We currently use independent contract manufacturers to supply the substantial majority of the products we sell. Of the total units of sourced products in fiscal 2016, 77% was sourced from suppliers in Asia, 16% was sourced from suppliers in the Middle East and 7% was sourced from suppliers in the Americas, respectively. We believe that the use of numerous independent contract manufacturers allows us to maximize production flexibility, while avoiding significant capital expenditures, work-in-process inventory build-ups and the costs of maintaining and operating production facilities. We have had relationships with some suppliers for over 30 years, however, none of these relationships are formal or require either party to purchase or supply any fixed quantity of product.
The vast majority of our products are purchased as “full packages,” where we place an order with the supplier and the supplier purchases all the raw materials, assembles the garments and ships them to our distribution facilities or third party facilities.
We maintain a staff of experienced sourcing professionals in four buying offices in China (including Hong Kong), as well as the United States, Taiwan, Bangladesh, and Vietnam. This staff sources our products worldwide, monitors our suppliers’ purchases of raw material, and monitors production at contract manufacturing facilities in order to ensure quality control and timely delivery. We also operate through independent agents in Asia and the Middle East. Our sourcing personnel based in our United States offices perform similar functions with respect to our suppliers worldwide. We conduct inspections of samples of product prior to cutting by contractors, during the manufacturing process and prior to shipment. We also have full-time quality assurance inspectors located globally.
Generally, the foreign contractors purchase the raw material in accordance with our specifications. Raw materials, which are in most instances made and/or colored especially for us, consist principally of piece goods and yarn and are specified by us to be purchased from a number of foreign and domestic textile mills and converters.
We are committed to ethical sourcing standards and require our independent contractors to comply with our code of conduct. We monitor compliance by our foreign contract manufacturers with applicable laws and regulations including labor and employment. As part of our compliance program, we maintain compliance departments in the United States and overseas and routinely perform audits of our contract manufacturers and require corrective action when necessary.
Import Operations and Import Restrictions
Our import operations are subject to constraints imposed by bilateral trade agreements between the United States and a number of foreign countries. These agreements impose quotas on the amount and type of goods that can be imported into the United States from some countries. Most of our imported products are also subject to United States customs duties.
We closely monitor developments in quotas, duties, and tariffs and continually seek to minimize our exposure to these risks through, among other things, geographical diversification of our contract manufacturers, allocating overseas production to product categories where more quotas are available, and shifting of production among countries and manufacturers.
Under the terms of the World Trade Organization (“WTO”) Agreement on Textiles and Clothing, WTO members removed all quotas effective January 1, 2005. Although the danger of quota embargoes has subsided since the removal of quotas for WTO member countries, threats to some apparel categories in China and Vietnam present themselves on occasion through proposed protectionist legislation in the U.S. Congress. We monitor these events closely and our board and executive level memberships in various apparel trade associations ensure early awareness of developments and timely communication of developments to our sourcing staff.
We believe that our extensive management and sourcing capability, our flexible sourcing model, and our experience and relationships throughout the world enable us to take advantage of the changing textile and apparel environment. Because of our sourcing experience, capabilities and relationships, we believe we are well positioned to take advantage of the changing textile and apparel quota environment.
16
Table of Contents
Competition
The apparel industry is highly competitive and fragmented. Our competitors include numerous apparel designers, manufacturers, importers, licensors, and our own customers’ private label programs, many of which are larger and have greater financial and marketing resources than we have available to us. We believe that the principal competitive factors in the industry are: (1) brand name and brand identity, (2) timeliness, consistency, reliability and quality of services provided, (3) market share and visibility, (4) price, and (5) the ability to anticipate customer and consumer demands and maintain appeal of products to customers.
We strive to focus on these points and have proven our ability to anticipate and respond quickly to customer demands with our brands, range of products and our ability to operate within the industry’s production and delivery constraints. We believe that our continued dedication to customer service, product assortment and quality control, as well as our aggressive pursuit of licensing opportunities, directly addresses the competitive factors in all market segments. Our established brands and relationships with retailers have resulted in a loyal following of customers.
We understand that the level of competition and the nature of our competitors vary by product segment. In particular, in the mass market channel, manufacturers constitute our main competitors in this less expensive segment of the market, while high profile domestic and foreign designers and licensors account for our main competitors in the more upscale segment of the market. Although we have been able to compete successfully to date, there can be no assurance that significant new competitors will not develop in the future.
Trademarks
Trademarks, trade names, copyrights and domain names, as well as related logos and designs are valuable in the development and marketing of our products and are important to our continued success including the growth of our international licensed businesses. We have registered our material trademarks in the United States and in more than 180 countries where our products are manufactured or sold. We regard our trademarks and other proprietary rights as valuable assets that are critical in the marketing of our products, and, therefore, we vigorously protect our trademarks and other proprietary rights against infringements.
Environmental Matters
We are committed to minimizing the negative impact of our business activities on the environment and believe our operations are in compliance with all applicable laws and regulations. Additionally, our business activities could be negatively impacted by severe weather conditions which could affect the sale of our products or disrupt our sourcing.
Employees
As of March 2016 and 2015, we had approximately 2,700 and 2,600, employees worldwide, respectively. None of our employees is subject to a collective bargaining agreement. We consider our employee relations to be satisfactory.
Our business faces certain risks. The risks described below may not be the only risks we face. Additional risks that we do not yet know of or that we currently think are immaterial may also impair our business. If any of the events or circumstances described as risks below or elsewhere in this report actually occurs, our business, results of operations or financial condition could be materially and adversely affected.
We rely on a few key customers, and a significant decrease in business from the loss of any one key customer or key program could substantially reduce our revenues and harm our business.
We derive a significant amount of our revenues from a few major customers. For example, net sales to our five largest customers accounted for approximately 47%, 49% and 43% of net sales for fiscal 2016, 2015 and 2014, respectively. For fiscal 2016, three customers accounted for over 10% of net sales; Walmart accounted for
17
Table of Contents
12%, The Marmaxx Group accounted for 11% and Macy’s accounted for 10% of net sales, respectively. For fiscal 2015, four customers accounted for over 10% of net sales; Walmart accounted for 14% and Kohl’s, Macy’s and The Marmaxx Group each accounted for 10% of net sales, respectively. For fiscal 2014, two customers accounted for over 10% of net sales; Kohl’s and Macy’s accounted for approximately 11% and 10% of net sales, respectively.
A significant decrease in business from or loss of any of our major customers could harm our financial condition by causing a significant decline in revenues.
We do not have long-term contracts with any of our customers and purchases generally occur on an order-by-order basis. We believe that purchasing decisions are generally made independently by individual department stores within a company-controlled group. There has been a trend, however, toward more centralized purchasing decisions. As such decisions become more centralized, the risk to us of such concentration increases. Furthermore, our customers could curtail or cease their business with us because of changes in their strategic and operational initiatives, such as an increased focus on private label, consolidation with another retailer, changes in our customer’s buying patterns, financial instability and other reasons. If our customers curtail or cease business with us, our revenues could significantly decrease and our financial condition could be significantly harmed.
Recent and future economic conditions, including turmoil in the financial and credit markets, may adversely affect our business.
Recent economic conditions may adversely affect our business, our customers, and our financing and other contractual arrangements. In addition, conditions may remain depressed in the future or may be subject to further deterioration. Recent and future developments in the United States and global economies may lead to further reductions in consumer spending, which could have an adverse effect on the sales of our products. Such events could adversely affect the business of our wholesale and retail customers, which may among other things, result in financial difficulties leading to restructuring, bankruptcies, liquidations, and other unfavorable events of our customers, and may cause such customers to reduce or discontinue orders of our products. Financial difficulties of our customers may also affect the ability of our customers to access credit markets or lead to higher credit risk relating to receivables from customers. Recent or future turmoil in the financial and credit markets could make it more difficult for us to obtain financing or refinance existing debt when the need arises or on terms that would be acceptable to us.
Domestic and international political situations may also affect consumer confidence. The threat, outbreak or escalation of terrorism, military conflicts or other hostilities could lead to further decreases in consumer spending.
The worldwide apparel industry is heavily influenced by general economic conditions, which could negatively impact our orders and our overall results of operations.
The apparel industry is highly cyclical and heavily dependent upon the overall level of consumer spending. Purchases of apparel and related goods tend to be highly correlated with cycles in the disposable income of consumers. Our wholesale customers may anticipate and respond to adverse changes in economic conditions and uncertainty by reducing inventories and canceling orders. Accordingly, a reduction in consumer spending in any of the regions in which we compete as a result of any substantial deterioration in general economic conditions (including as a result of uncertainty in world financial markets, weakness in the credit markets, changes in the price of fuel, international turmoil or terrorist attacks) or increases in interest rates could adversely affect the sales of our products.
We may not be able to anticipate consumer preferences and fashion trends, which could negatively affect acceptance of our products by retailers and consumers and result in a significant decrease in net sales.
Our failure to anticipate, identify and respond effectively to changing consumer demands and fashion trends could adversely affect acceptance of our products by retailers and consumers and may result in a significant decrease in net sales or leave us with a substantial amount of unsold inventory. We believe that our success depends on our ability to anticipate, identify and respond to changing fashion trends in a timely manner. Our products must appeal to a broad range of consumers whose preferences cannot be predicted with certainty and are subject to rapid change. We may not be able to continue to develop appealing styles or successfully meet constantly changing consumer demands in the future. In addition, any new products or brands that we introduce may not be successfully received by retailers and consumers. Due to the acquisitions of Laundry by Shelli Segal,
18
Table of Contents
and Rafaella, we have increased our exposure to women’s apparel, thus making us subject to additional changes in fashion trends as women’s fashion trends have historically changed more rapidly than men’s. If our products are not successfully received by retailers and consumers and we are left with a substantial amount of unsold inventory, we may be forced to rely on markdowns or promotional sales to dispose of excess, slow-moving inventory. If this occurs, our business, financial condition, results of operations and prospects may be harmed.
The failure of our suppliers to use acceptable ethical business practices could cause our business to suffer.
We require our suppliers to operate in compliance with applicable laws and regulations regarding working conditions, employment practices, conflict minerals and environmental compliance. Additionally, we or our customers’ operating guidelines may require additional obligations in those areas. We do not, however, control our suppliers or their labor and other business practices. If one of our suppliers violates labor or other laws or implements labor or other business practices that are generally regarded as unethical in the United States, the shipment of finished products to us could be interrupted, orders could be cancelled, relationships could be terminated and our reputation could be damaged. Any of these events could have a material adverse effect on our revenue and, consequently, our results of operations.
Increases in the prices of raw materials used to manufacture our products or increases in costs to transport our products could materially increase our costs and decrease our profitability.
The principal fabrics used in our business are made from cotton, wool, silk, synthetic and cotton-synthetic blends. The prices we pay for these fabrics are dependent on the market prices for the raw materials used to produce them, primarily cotton and chemical components of synthetic fabrics. These raw materials are subject to price volatility caused by weather, supply conditions, government regulations, energy costs, economic climate and other unpredictable factors. Fluctuations in petroleum prices may also influence the prices of related items such as chemicals, dyestuffs and polyester yarn as well as the costs we incur to transport products from our suppliers and costs we incur to distribute products to our customers. Any raw material price increase or increase in costs related to the transport of our products (primarily petroleum costs) could increase our cost of sales and decrease our profitability unless we are able to pass higher prices on to our customers. In addition, if one or more of our competitors is able to reduce its production costs by taking greater advantage of any reductions in raw material prices or favorable sourcing agreements, we may face pricing pressures from those competitors and may be forced to reduce our prices or face a decline in net sales, either of which could have an adverse effect on our business, results of operations or financial condition.
Fluctuations in the price, availability and quality of the fabrics or other raw materials used to manufacture our products, as well as the price for labor, marketing and transportation, could have a material adverse effect on our cost of sales or our ability to meet our customers’ demands. The prices for such fabrics depend largely on the market prices for the raw materials used to produce them. The price and availability of such raw materials may fluctuate significantly, depending on many factors. In the future, we may not be able to pass all or a portion of such higher prices on to our customers.
We are dependent upon the revenues generated by brands we license from third parties, and the loss or inability to renew certain of these licenses could reduce our net income.
The interruption of the business of third parties that license their brands to us could adversely affect our net income. We currently license the Nike, Jag, PGA TOUR, Jack Nicklaus and Callaway Golf brands from third parties. These licenses vary in length of term, renewal conditions and royalty obligations. The average initial term of these licenses is three to five years with automatic renewals depending upon whether we achieve certain targeted sales goals. We may not be able to renew or extend any of these licenses on favorable terms, if at all. If we are unable to renew or extend any of these licenses, we could experience a decrease in net income.
We are dependent upon the revenues generated by the licensing of our brands to third parties, and the loss or inability to renew certain of these licenses could reduce our royalty income and consequently reduce our net income.
The loss of several licensees of our brands at any one time could adversely affect our royalty income and net income. Royalty income from licensing our brands to third parties accounted for $34.7 million, or 4% of total
19
Table of Contents
revenues, for fiscal 2016 and $31.7 million, or 4% of total revenues, for fiscal 2015. These licenses vary in length of term, renewal conditions and royalty obligations. The average term of these licenses is three to five years with automatic renewals depending upon whether certain targeted performance goals are met. We may not be able to renew or extend any of these licenses on favorable terms, if at all. If we are unable to renew or extend any of these licenses, we could experience a decrease in royalty income and net income.
Our business could be harmed if we do not deliver quality products in a timely manner.
Our sourcing, logistics and technology functions operate within substantial production and delivery requirements and subjects us to the risks associated with suppliers, transportation, distribution facilities and other risks. Labor disruptions at independent factories where our goods are produced, the shipping ports we use, or our transportation carriers create significant risks for our business, particularly if these disputes result in work slowdowns, lockouts, strikes, or other disruptions. In fiscal 2015, we experienced the impact of the West Coast port slowdowns and work stoppages, which resulted in a significant backup of cargo containers at West Coast ports including the port through which we sourced a significant portion of our products. We experienced delays in the shipment of our products as a result of this disruption.
If we do not comply with customer product requirements or meet their delivery requirements, our customers could reduce our selling prices, require significant margin support, reduce the amount of business they do with us, or cease to do business with us, all of which could harm our business.
Our sales and operating results are influenced by weather patterns and natural disasters.
Like other companies in the apparel industry, our sales volume may be adversely affected by unseasonable weather conditions or natural disasters, which may cause consumers to alter their purchasing habits or result in a disruption to our operations. Because of the seasonality of our business and the concentration of a significant proportion of our customers in certain geographic regions, the occurrence of such events could disproportionately impact our business, financial condition and operating results.
We are subject to United States federal and state laws and if any of the laws or regulations are amended or if new laws or regulations are adopted, compliance could become more expensive and directly affect our income.
We are subject to U.S. federal, state and local laws and regulations affecting our business, including those promulgated under the Occupational Safety and Health Act, the Consumer Product Safety Act, the Flammable Fabrics Act, the Textile Fiber Product Identification Act, the rules and regulations of the Consumer Products Safety Commission, the Department of Homeland Security and various labor, workplace and related laws, as well as environmental laws and regulations. If any of these laws is amended or new laws are adopted, compliance could become more costly, and our failure to comply with such laws may expose us to potential liabilities, which could have an adverse impact on our results of operation.
Because we do business abroad, our business could be harmed by changes in foreign exchange rates.
Our business operations have several international components including sourcing of product, licensing and distribution arrangements and direct operations in Canada, Mexico and Europe, which expose us to foreign exchange risk and such risk may increase as we expand our international operations and licensing and distribution portfolio. Changes in exchange rates between the United States dollar and other currencies can impact our financial results in two ways; a translation impact and a transaction impact. The translation impact refers to the impact that changes in exchange rates can have on our published financial results, as our revenue and profit earned in local foreign currencies is translated into United States dollars using an average exchange rate over the representative period. Accordingly, during times of a strengthening United States dollar, particularly against the British Pound, the Canadian dollar, and the Mexican Peso, our results of operations will be negatively impacted, as was the case during fiscal 2016 and fiscal 2015, and during times of a weakening United States dollar, our results of operations will be favorably impacted.
Although we have not been affected in a material way by any of the foregoing factors, we cannot predict the likelihood or frequency of any such events occurring and any material disruption may have an adverse affect on our business.
20
Table of Contents
We may face challenges integrating the operations of our acquired brands or any businesses we may acquire, which may negatively impact our business.
As part of our strategy of making selective acquisitions, we acquire new brands and product categories, including our acquisitions of Rafaella and Ben Hogan. Acquisitions have inherent risks, including the risk that the projected sales and net income from the acquisition may not be generated, the risk that the integration is more costly and takes longer than anticipated, risks of retaining key personnel, and risks associated with unanticipated events and unknown legal liabilities. Any of these and other risks may harm our business. We cannot assure you that any acquisition will not have a material adverse impact on our financial condition and results of operations.
With respect to previous acquisitions, we faced challenges in consolidating functions and integrating management procedures, personnel and operations in an efficient and effective manner, which if not managed as projected, could have negatively impacted our business. Some of these challenges included increased demands on management related to the significant increase in the size and diversity of our business after the acquisition, the dedication of management’s attention to implement our strategies for the business, the retention and integration of key employees, determining aspects of the acquired business that were to be kept separate and distinct from our other businesses, and difficulties in assimilating corporate culture and practices into ours.
We have outstanding debt, which could have important negative consequences to us, including making it difficult for us to satisfy all of our obligations in the event we experience financial difficulties.
As of January 30, 2016, we had approximately $134.3 million of debt outstanding as compared to approximately $172.9 million as of January 31, 2015 (excluding amounts outstanding under our letter of credit facility). Our indebtedness could have important consequences, including:
| • | making it more difficult for us to satisfy our obligations with respect to our senior subordinated notes, |
| • | increasing our vulnerability to adverse general economic and industry conditions, as we are required to devote a proportionally greater amount of our cash flow to paying principal and interest on our debt, |
| • | limiting our ability to obtain additional financing to fund large capital expenditures, acquisitions and other general corporate requirements, |
| • | requiring us to dedicate a substantial portion of our cash flow from operations to payments on our indebtedness, thereby reducing the availability of our cash flow to fund capital expenditures or other general corporate purposes, |
| • | increasing our vulnerability to adverse changes in governmental regulations, |
| • | limiting our flexibility in planning for, or reacting to, changes in our business and the industry in which we operate, and |
| • | placing us at a competitive disadvantage compared to our less leveraged competitors during periods in which we experience lower earnings and cash flow. |
Our ability to pay interest on our indebtedness and to satisfy our other debt obligations will depend upon, among other things, our future operating performance and cash flow and possibly our ability to refinance indebtedness when necessary. Each of these factors is, to a large extent, dependent on general economic, financial, competitive, legislative, regulatory and other factors beyond our control. If, in the future, we cannot generate sufficient cash from operations to make scheduled payments on our indebtedness or to meet our liquidity needs or other obligations, we will need to refinance our existing debt, obtain additional financing or sell assets. If we are unable to do so, we cannot assure you that we will be able otherwise to renegotiate or refinance any of our debt, or obtain additional debt, on commercially reasonable terms or at all. We cannot assure you that our business will generate cash flow, or that we will be able to obtain funding sufficient to satisfy our debt service requirements.
21
Table of Contents
Our profitability may decline as a result of increasing pressure on margins.
The apparel industry is subject to significant pricing pressure caused by many factors, including intense competition, consolidation in the retail industry, pressure from retailers to reduce the costs of products and changes in consumer spending patterns. These factors may cause us to reduce our sales prices to retailers and consumers, which could cause our gross margin to decline if we are unable to appropriately manage inventory levels and/or reduce our operating costs. If we fail to adequately manage our product costs or operating expenses, our profitability will decline. This could have a material adverse effect on our results of operations, liquidity and financial condition.
Our ability to conduct business in international markets may be affected by legal, regulatory, political and economic risks.
Our ability to capitalize on growth in new international markets and to maintain the current level of operations in our existing international markets is subject to risks associated with international operations. These include:
| • | the burdens of complying with a variety of foreign laws and regulations, |
| • | compliance with U.S. and other country laws relating to foreign operations, including U.S. and foreign anti-corruption laws such as the Foreign Corrupt Practices Act, which prohibits U.S. companies from making improper payments to foreign officials for the purpose of obtaining or retaining business, |
| • | unexpected changes in regulatory requirements, |
| • | new tariffs or other barriers in some international markets, |
| • | political instability and terrorist attacks, |
| • | changes in diplomatic and trade relationships, and |
| • | general economic fluctuations in specific countries or markets. |
We cannot predict whether quotas, duties, taxes, or other similar restrictions will be imposed by the United States, the European Union, countries in Asia, or other countries upon the import or export of our products in the future, or what effect any of these actions would have on our business, financial condition or results of operations. Changes in regulatory, geopolitical, social or economic policies and other factors may have a material adverse effect on our business in the future or may require us to significantly modify our current business practices.
We operate in a highly competitive and fragmented industry and our failure to successfully compete could result in a loss of one or more significant customers.
The apparel industry is highly competitive and fragmented. Our competitors include numerous apparel designers, manufacturers, importers and licensors, many of which have greater financial and marketing resources than us. We believe that the principal competitive factors in the apparel industry are:
| • | brand name and brand identity, |
| • | timeliness, reliability and quality of services provided, |
| • | market share and visibility, |
| • | the ability to obtain sufficient retail floor space, |
| • | price, and |
| • | the ability to anticipate customer and consumer demands and maintain appeal of products to customers. |
22
Table of Contents
The level of competition and the nature of our competitors varies by product segment with low-margin, mass-market manufacturers being our main competitors in the less expensive segment of the market and U.S. and foreign designers and licensors competing with us in the more upscale segment of the market. If we do not maintain our brand names and identities and continue to provide high quality and reliable services on a timely basis at competitive prices, we may not be able to continue to successfully compete in our industry. If we are unable to compete successfully, we could lose one or more of our significant customers, which, if not replaced, could negatively impact our sales and financial performance.
Our balance sheet includes intangible assets. A decline in the estimated fair value of an intangible asset or of a reporting unit could result in an impairment charge recorded in our operating results, which could be material.
Indefinite-lived intangible assets are tested for impairment annually and between annual tests if an event occurs or circumstances change that would indicate the carrying amount may be impaired. Also, we review our amortizable intangible assets for impairment if an event occurs or circumstances change that would indicate the carrying amount may not be recoverable. If the carrying value of an intangible asset were to exceed its fair value, the asset would be written down to its fair value, with the impairment charge recognized as a noncash expense in our operating results. Adverse changes in future market conditions or weaker operating results compared to our expectations may impact our projected cash flows and estimates of weighted average cost of capital, which could result in a potentially material impairment charge if we are unable to recover the carrying value of our intangible assets.
Our success depends upon the continued protection of our trademarks and other intellectual property rights.
Our registered and common law trademarks, as well as certain of our licensed trademarks, have significant value and are instrumental to our ability to market our products. Our failure to successfully protect our intellectual property rights, or the substantial costs that we may incur in doing so, may have an adverse effect on our operations.
We may have additional tax liabilities.
We are subject to income taxes in the United States and many foreign jurisdictions. In addition to judgments associated with valuation accounts, our current tax provision can be affected by our mix of income and identification or resolution of uncertain tax positions. Because income from domestic and international sources may be taxed at different rates, the shift in mix during a year or over years can cause the effective tax rate to change. We regularly are under audit by tax authorities. Although we believe our tax estimates are reasonable, the final determination of our tax liabilities as a result of tax audits and any related litigation could be materially different from our historical income tax provisions and accruals. The results of an audit or litigation could have a material effect on our financial position, results of operations, or cash flows in the period or periods for which that determination is made. In addition, there have been proposals to reform U.S. tax laws that would significantly impact how U.S. multinational corporations are taxed on foreign earnings. We earn a portion of our income in foreign countries. Although we cannot predict whether or in what form this proposed legislation will pass, if enacted it could have a material adverse impact on our tax expense and cash flow.
We depend on certain key personnel the loss of which could negatively impact our ability to manage our business.
Our future success depends to a significant extent on retaining the services of certain executive officers and directors, in particular George Feldenkreis, our Chairman of the Board and Chief Executive Officer, and Oscar Feldenkreis, our Vice Chairman, President and Chief Operating Officer. We are currently discussing the terms of their new employment agreements. The loss of the services of either George Feldenkreis or Oscar Feldenkreis, or any other key member of management, could have a material adverse effect on our ability to
23
Table of Contents
manage our business. Our continued success is dependent upon our ability to attract and retain qualified management and operational personnel to support our future growth. Our inability to do so may have a significant negative impact on our ability to manage our business.
We rely significantly on the use of information technology. Cybersecurity risks - any technology failures causing a material disruption to operational technology or cyber-attacks on our systems affecting our ability to protect the integrity and security of customer and employee information could harm our reputation and/or could disrupt our operations and negatively impact our business.
We increasingly rely on information technology systems to process, transmit and store electronic information. A significant portion of the communication between personnel, customers and suppliers depends on information technology. We use information technology systems and networks in our operations and supporting departments such as marketing, accounting, finance, and human resources. The future success and growth of our business depend on streamlined processes made available through information systems, global communications, internet activity and other network processes.
Like most companies, despite our current security measures, our information technology systems, and those of our third-party service providers, may be vulnerable to information security breaches, acts of vandalism, computer viruses and interruption or loss of valuable business data. Stored data might be improperly accessed due to a variety of events beyond our control, including, but not limited to, natural disasters, terrorist attacks, telecommunications failures, computer viruses, hackers and other security issues. We have technology security initiatives and disaster recovery plans in place to mitigate our risk to these vulnerabilities, but these measures may not be adequate or implemented properly to ensure that our operations are not disrupted or that data security breaches do not occur. Any disruption to these systems or networks could result in product fulfillment delays, key personnel being unable to perform duties or communicate throughout the organization, loss of retail and internet sales, significant costs for data restoration and other adverse impacts on our business and reputation.
Hackers and data thieves are increasingly sophisticated and operate large-scale and complex automated attacks. Any breach of our network may result in the loss of valuable business data, misappropriation of our consumers’ or employees’ personal information, or a disruption of our business. Despite our existing security procedures and controls, if our network was compromised, it could give rise to unwanted media attention, materially damage our customer relationships, harm our business, reputation, results of operations, cash flows and financial condition, result in fines or lawsuits, and may increase the costs we incur to protect against such information security breaches, such as increased investment in technology, the costs of compliance with consumer protection laws and costs resulting from consumer fraud.
Item 1B. Unresolved Staff Comments
None.
24
Table of Contents
Properties
The general location, use, ownership status, approximate size, and lease expiration dates of the principle properties which we currently occupy are set forth below:
| Location |
Use |
Lease Expiration |
Ownership Status |
Approximate Area in Square Feet |
||||||
| Miami, Florida |
Principal Executive and Administrative Offices; Warehouse and Distribution Facility | N/A | Owned | 240,000 | ||||||
| Miami, Florida |
Administrative Functions | 2019 | Leased | 16,000 | ||||||
| Seneca, South Carolina |
Distribution Center | N/A | Owned | 345,000 | ||||||
| Tampa, Florida |
Distribution Center | N/A | Owned | 305,000 | ||||||
| New York, New York |
Office, Design and Showrooms | 2023 through 2028 |
Leased | 135,150 | ||||||
| Portland, Oregon |
Office Space | 2016 | Leased | 19,000 | ||||||
| Commerce, California |
Office Space | 2018 | Leased | 39,400 | ||||||
| Witham and London, UK |
Distribution and Administrative Functions | 2023 | Leased | 67,100 | ||||||
In addition, we lease several locations in Texas, Wisconsin, and Georgia totaling approximately 7,600 square feet of office space/showroom.
We also lease 77 retail stores, comprising approximately 198,000 square feet of selling space in the United States and United Kingdom.
In addition, we lease several locations internationally totaling approximately 50,000 square feet of offices.
Our principal executive and administrative office, warehouse and distribution facility is encumbered by an $11.3 million mortgage, which loan is due on August 1, 2020. The facility in Tampa, Florida is encumbered by an $11.1 million mortgage, which loan is due on January 23, 2019.
The Company is, from time to time, a party to litigation that arises in the normal course of its business operations. The Company is not presently a party to any litigation that it believes might have a material adverse effect on its business operations.
We were a defendant in Joseph T. Cook v. Perry Ellis International, Inc. and Oscar Feldenkreis, Case No. 1:2015-cv-08290 (New York Southern District Court), involving claims of employment practices, including discrimination and retaliation, which was resolved in January 2016. We reached an amicable settlement and such amount was provided for in our results of operations for fiscal 2016.
25
Table of Contents
Item 4. Mine Safety Disclosures
Not applicable.
| Item 5. | Market for Registrant’s Common Equity, Related Stockholder Matters and Issuer Purchases of Equity Securities |
| (a) | Market Information |
Our common stock is currently listed for trading on the NASDAQ Global Select Market under the symbol “PERY” and was previously listed for trading on the Nasdaq Global Market (formerly the Nasdaq National Market) under the symbol “PERY” since June 1999. Prior to that date, our trading symbol was “SUPI” based upon our former name, Supreme International Corporation. The following table sets forth, for the periods indicated, the range of high and low per share bids of our common stock as reported by the NASDAQ Global Select Market. Such quotations represent inter-dealer prices, without retail mark-up, mark-down or commission and may not necessarily represent actual transactions.
| High | Low | |||||||
| Fiscal Year 2016 |
||||||||
| First Quarter |
$ | 26.08 | $ | 21.50 | ||||
| Second Quarter |
28.19 | 23.05 | ||||||
| Third Quarter |
25.55 | 20.70 | ||||||
| Fourth Quarter |
22.12 | 16.47 | ||||||
| Fiscal Year 2015 |
||||||||
| First Quarter |
$ | 15.85 | $ | 12.37 | ||||
| Second Quarter |
18.92 | 14.40 | ||||||
| Third Quarter |
21.71 | 17.11 | ||||||
| Fourth Quarter |
27.00 | 20.00 | ||||||
| (b) | Holders |
As of April 7, 2016, there were approximately 300 registered shareholders of record of our common stock. We believe the number of beneficial owners of our common stock is in excess of 5,000.
| (c) | Dividends |
Not applicable.
| (d) | Securities Authorized for Issuance under Equity Compensation Plans |
26
Table of Contents
Equity Compensation Plan Information for Fiscal 2016
The following table summarizes as of January 30, 2016, the shares of our common stock subject to outstanding awards or available for future awards under our equity compensation plans.
| Plan Category |
Number of shares to be issued upon exercise of outstanding options, and rights |
Weighted- average exercise price of outstanding options, and rights |
Number of shares remaining available for future issuance under equity compensation plans (excluding shares reflected in the first column) |
|||||||||
| Equity compensation plans approved by security holders (1) |
542,019 | $ | 23.25 | 1,125,491 | ||||||||
| (1) | Represents awards made pursuant to our 2015 Long-Term Incentive Compensation Plan, which is an amendment and restatement of our Second Amended and Restated 2005 Long-Term Incentive Compensation Plan. |
| (e) | Performance Graph |
The following graph compares the cumulative total shareholder return on our common stock with the cumulative total shareholder return on the Nasdaq Composite and the S&P Apparel, Accessories & Luxury Goods Index commencing on January 31, 2011 and ending on January 30, 2016. The graph assumes that $100 was invested on January 31, 2011 in our common stock or in the Nasdaq Composite Index and the S&P Apparel, Accessories & Luxury Goods Index, and that all dividends are reinvested. Past performance is not necessarily indicative of future performance.
27
Table of Contents
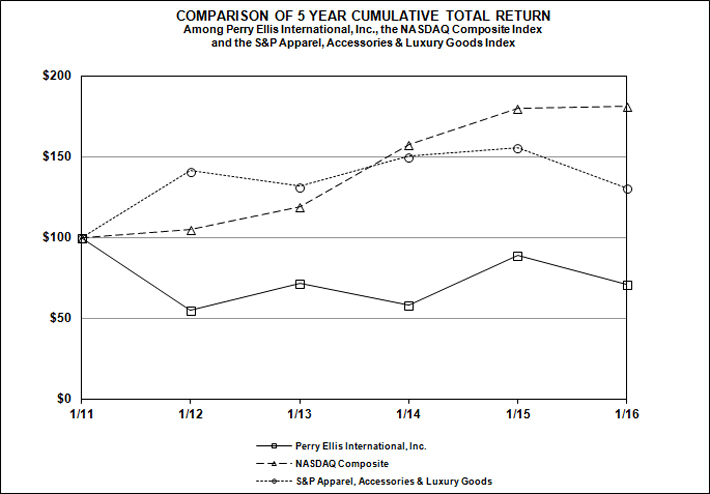
| INDEXED RETURNS Years Ending |
||||||||||||||||||||||||
| Company / Index |
Base Period Jan11 |
Jan12 | Jan13 | Jan14 | Jan15 | Jan16 | ||||||||||||||||||
| Perry Ellis International, Inc. |
100 | 55.20 | 72.00 | 58.46 | 89.20 | 70.92 | ||||||||||||||||||
| NASDAQ Composite |
100 | 105.26 | 119.08 | 157.58 | 180.11 | 181.37 | ||||||||||||||||||
| S&P Apparel, Accessories & Luxury Goods |
100 | 141.38 | 131.74 | 150.34 | 155.86 | 130.59 | ||||||||||||||||||
| (f) | Sales of Unregistered Securities |
Not Applicable.
| (g) | Purchase of Equity Securities by the Issuer and Affiliated Purchasers. |
28
Table of Contents
| Period |
Total Number of Shares Purchased |
Average Price Paid per Share |
Total Number of Shares Purchased as Part of Publicly Announced Plans or Programs(1) |
Maximum Approximate Dollar Value that May Yet Be Purchased under the Plans or Programs |
||||||||||||
| November 1, 2015 to November 28, 2015 |
64,806 | $ | 20.92 | 64,806 | $ | 16,960,258 | ||||||||||
| November 29, 2015 to January 2, 2016 |
152,498 | $ | 18.93 | 152,498 | $ | 14,073,471 | ||||||||||
| January 3, 2016 to January 30, 2016 |
155,793 | $ | 17.39 | 155,793 | $ | 11,364,231 | ||||||||||
|
|
|
|
|
|||||||||||||
| Total |
373,097 | 373,097 | ||||||||||||||
|
|
|
|
|
|||||||||||||
| (1) | During fiscal 2016, our Board of Directors extended the stock repurchase program to authorize us to purchase, from time to time and as market and business conditions warrant, up to $70 million of our common stock for cash in the open market or in privately negotiated transactions through October 31, 2016. Although our Board of Directors allocated a maximum of $70 million to carry out the program, we are not obligated to purchase any specific number of outstanding shares and will reevaluate the program on an ongoing basis. Total purchases under the plan to date amount to $58.6 million. |
29
Table of Contents
| Item 6. | Selected Financial Data |
Summary Historical Financial Information
(Amounts in thousands, except for per share data)
The following selected financial data is qualified by reference to, and should be read in conjunction with, the Consolidated Financial Statements of Perry Ellis and related Footnotes thereto included in Item 8 of this report and “Item 7. Management’s Discussion and Analysis of Financial Condition and Results of Operations.”
| Fiscal Years Ended |
January 30, 2016 |
January 31, 2015 |
February 1, 2014 |
February 2, 2013 |
January 28, 2012 |
|||||||||||||||
| Income Statement Data: |
||||||||||||||||||||
| Net sales |
$ | 864,806 | $ | 858,237 | $ | 882,573 | $ | 942,451 | $ | 955,549 | ||||||||||
| Royalty income |
34,709 | 31,735 | 29,651 | 27,102 | 25,043 | |||||||||||||||
|
|
|
|
|
|
|
|
|
|
|
|||||||||||
| Total revenues |
899,515 | 889,972 | 912,224 | 969,553 | 980,592 | |||||||||||||||
| Cost of sales |
580,448 | 586,968 | 609,436 | 652,352 | 656,850 | |||||||||||||||
|
|
|
|
|
|
|
|
|
|
|
|||||||||||
| Gross profit |
319,067 | 303,004 | 302,788 | 317,201 | 323,742 | |||||||||||||||
| Selling, general and administrative expenses |
275,863 | 268,783 | 272,716 | 263,854 | 248,618 | |||||||||||||||
| Depreciation and amortization |
13,693 | 12,198 | 12,626 | 13,896 | 13,673 | |||||||||||||||
| Impairment on assets |
20,604 | — | 35,205 | 3,516 | 6,066 | |||||||||||||||
| Impairment on goodwill |
6,022 | — | 7,772 | — | — | |||||||||||||||
| Gain on sale of long-lived assets |
3,779 | 885 | 6,162 | 410 | — | |||||||||||||||
|
|
|
|
|
|
|
|
|
|
|
|||||||||||
| Operating income (loss) |
6,664 | 22,908 | (19,369 | ) | 36,345 | 55,385 | ||||||||||||||
| Costs on early extinguishment of debt |
5,121 | — | — | — | 1,306 | |||||||||||||||
| Interest expense |
9,267 | 14,291 | 15,025 | 14,836 | 16,103 | |||||||||||||||
|
|
|
|
|
|
|
|
|
|
|
|||||||||||
| Net (loss) income before income taxes |
(7,724 | ) | 8,617 | (34,394 | ) | 21,509 | 37,976 | |||||||||||||
| Income tax (benefit) provision |
(432 | ) | 45,792 | (11,615 | ) | 6,708 | 12,459 | |||||||||||||
|
|
|
|
|
|
|
|
|
|
|
|||||||||||
| Net (loss) income |
$ | (7,292 | ) | $ | (37,175 | ) | $ | (22,779 | ) | $ | 14,801 | $ | 25,517 | |||||||
|
|
|
|
|
|
|
|
|
|
|
|||||||||||
| Net (loss) income per share: |
||||||||||||||||||||
| Basic |
$ | (0.49 | ) | $ | (2.50 | ) | $ | (1.52 | ) | $ | 1.01 | $ | 1.71 | |||||||
| Diluted |
$ | (0.49 | ) | $ | (2.50 | ) | $ | (1.52 | ) | $ | 0.97 | $ | 1.60 | |||||||
| Weighted average number of shares outstanding |
||||||||||||||||||||
| Basic |
14,968 | 14,856 | 14,988 | 14,715 | 14,927 | |||||||||||||||
| Diluted |
14,968 | 14,856 | 14,988 | 15,315 | 15,950 | |||||||||||||||
| Other Financial Data: |
||||||||||||||||||||
| EBITDA (a) |
$ | 20,357 | $ | 35,106 | $ | (6,743 | ) | $ | 50,241 | $ | 69,058 | |||||||||
| EBITDA margin (b) |
2.3 | % | 3.9 | % | (0.7 | %) | 5.2 | % | 7.0 | % | ||||||||||
| Cash flows from operations |
30,165 | 55,143 | 220 | 76,981 | 712 | |||||||||||||||
| Cash flows from investing |
2,987 | (21,147 | ) | (27,354 | ) | (8,908 | ) | (2,327 | ) | |||||||||||
| Cash flows from financing |
(45,441 | ) | (17,785 | ) | (588 | ) | (37,085 | ) | 7,011 | |||||||||||
| Capital expenditures |
(17,170 | ) | (16,918 | ) | (22,246 | ) | (10,740 | ) | (13,811 | ) | ||||||||||
| Balance Sheet Data (at year end): |
||||||||||||||||||||
| Working capital |
$ | 218,757 | $ | 240,170 | $ | 278,197 | $ | 273,773 | $ | 289,916 | ||||||||||
| Total assets |
622,447 | 684,989 | 706,735 | 763,129 | 724,195 | |||||||||||||||
| Total debt (c) |
134,322 | 172,900 | 181,875 | 175,382 | 197,490 | |||||||||||||||
| Total stockholders’ equity |
291,481 | 302,017 | 347,533 | 371,240 | 366,495 | |||||||||||||||
| a) | EBITDA represents earnings before interest expense, cost on early extinguishment of debt, depreciation and amortization, and income taxes as outlined below in tabular format. EBITDA is not a measurement of financial performance under accounting principles generally accepted in the United States of America, and does not represent cash flow from operations. EBITDA is presented solely as a supplemental disclosure because we believe that it is a common measure of operating performance in the apparel industry. The following provides a reconciliation of net income to EBITDA: |
30
Table of Contents
| Fiscal Years Ended |
January 30, 2016 |
January 31, 2015 |
February 1, 2014 |
February 2, 2013 |
January 28, 2012 |
|||||||||||||||
| (in thousands) | ||||||||||||||||||||
| Net (loss) income |
$ | (7,292 | ) | $ | (37,175 | ) | $ | (22,779 | ) | $ | 14,801 | $ | 25,517 | |||||||
| Depreciation and amortization |
13,693 | 12,198 | 12,626 | 13,896 | 13,673 | |||||||||||||||
| Interest expense |
9,267 | 14,291 | 15,025 | 14,836 | 16,103 | |||||||||||||||
| Income tax (benefit) provision |
(432 | ) | 45,792 | (11,615 | ) | 6,708 | 12,459 | |||||||||||||
| Costs on early extinguishment of debt |
5,121 | — | — | — | 1,306 | |||||||||||||||
|
|
|
|
|
|
|
|
|
|
|
|||||||||||
| EBITDA |
$ | 20,357 | $ | 35,106 | $ | (6,743 | ) | $ | 50,241 | $ | 69,058 | |||||||||
|
|
|
|
|
|
|
|
|
|
|
|||||||||||
| b) | EBITDA margin represents EBITDA as a percentage of total revenues. EBITDA margin as a percentage of revenue is presented solely as a supplemental disclosure because we believe that it is a common measure of operating performance in the apparel industry. The following provides a reconciliation of gross profit to EBITDA margin as a percentage of revenue: |
| Fiscal Years Ended |
January 30, 2016 |
January 31, 2015 |
February 1, 2014 |
February 2, 2013 |
January 28, 2012 |
|||||||||||||||
| (in thousands) | ||||||||||||||||||||
| Gross profit |
$ | 319,067 | $ | 303,004 | $ | 302,788 | $ | 317,201 | $ | 323,742 | ||||||||||
| Less: |
||||||||||||||||||||
| Selling, general and administrative expenses |
275,863 | 268,783 | 272,716 | 263,854 | 248,618 | |||||||||||||||
| Impairment on assets |
20,604 | — | 35,205 | 3,516 | 6,066 | |||||||||||||||
| Impairment of goodwill |
6,022 | — | 7,772 | — | — | |||||||||||||||
| Plus: |
||||||||||||||||||||
| Gain on sale of long-lived assets |
3,779 | 885 | 6,162 | 410 | — | |||||||||||||||
|
|
|
|
|
|
|
|
|
|
|
|||||||||||
| EBITDA |
$ | 20,357 | $ | 35,106 | $ | (6,743 | ) | $ | 50,241 | $ | 69,058 | |||||||||
|
|
|
|
|
|
|
|
|
|
|
|||||||||||
| Total revenue |
$ | 899,515 | $ | 889,972 | $ | 912,224 | $ | 969,553 | $ | 980,592 | ||||||||||
| EBITDA margin as a percentage of revenue |
2.3 | % | 3.9 | % | -0.7 | % | 5.2 | % | 7.0 | % | ||||||||||
| c) | Total debt includes balances outstanding under Perry Ellis International’s senior credit facility, senior subordinated notes payable, real estate mortgages, and lease payable-long term. |
| Item 7. | Management’s Discussion and Analysis of Financial Condition and Results of Operations |
We sell our products under our owned global brands, licensed brands and private retailer labels. Our owned brands include the global designer lifestyle brands, Perry Ellis and Original Penguin by Munsingwear (“Original Penguin”) as well as Ben Hogan , Cubavera , Farah , Grand Slam , Jantzen , Laundry by Shelli Segal , Rafaella and Savane . We license the Callaway Golf brand, PGA TOUR brand, and the Jack Nicklaus brand for golf apparel, the Jag brand for swimwear and cover-ups and the Nike brand for swimwear and accessories.
We have four reportable segments – Men’s Sportswear and Swim, Women’s Sportswear, Direct-to-Consumer, and Licensing – and we have a strategically diversified global distribution network focused on leading department stores, company-operated retail stores, specialty stores and select licensing partners. We distribute our products primarily to wholesale customers that represent all major levels of retail distribution including department stores, national and regional chain stores, mass merchants, specialty stores, sporting goods stores, the corporate wear market, e-commerce, as well as clubs and independent retailers, in North America and Europe. Our largest customers include Walmart Stores Inc., which includes Sam’s Wholesale Club (“Sam’s”) together (“Walmart”), The Marmaxx Group, and Macy’s, Inc. (“Macy’s”).
We also distribute through our own retail stores. As of April 1, 2016, we operated 41 Perry Ellis, 12 Original Penguin and two multi-brand retail outlet stores located primarily in upscale retail outlet malls across the United
31
Table of Contents
States, United Kingdom and Puerto Rico. As of April 1, 2016 we also operated three Perry Ellis, two Cubavera, 16 Original Penguin and one multi-brand full price retail stores located in upscale demographic markets in the United States and United Kingdom. In addition, we leverage our design, sourcing and logistics expertise by offering a limited number of private label programs to retailers.
In fiscal 2016, our Men’s Sportswear and Swim segment, which is comprised of men’s sportswear, swimwear and accessories, accounted for 71% of our total revenues, our Women’s Sportswear segment accounted for 14% of our total revenues, our Direct-to-Consumer segment, which is comprised of retail and e-commerce, accounted for 11% of our total revenues and our licensing segment accounted for approximately 4% of our total revenues. Finally, our U.S. based business represented approximately 87% of total revenues, while our foreign operations represented 13% of total revenues for fiscal 2016.
The revenue generated through our licensing business, which we license to third parties for certain production, sales and/or distribution rights through geographic licensing arrangements is a significant contributor to our operating income and our arrangements heighten the overall awareness of our brands without requiring us to make capital investments or incur additional operating expenses. As of Fiscal 2016, we licensed our brands through four worldwide, 71 domestic and 91 international license agreements covering over 100 countries.
Our products have historically been geared towards lighter weight apparel generally worn during the spring and summer months. We believe that this seasonality has been reduced with the strengthening of our fall, winter, and holiday merchandise. Our swimwear business, however, is highly seasonal in nature, with the significant majority of our sales occurring in our first and fourth quarters. Seasonality can be affected by a variety of factors, including the mix of advance and fill-in orders, the amount of sales to different distribution channels, and overall product mix among traditional merchandise, fashion merchandise and swimwear. Our higher-priced products generally tend to be less sensitive to economic and weather conditions. Revenues for our second quarter will typically be lower than our other quarters due to the impact of seasonal sales.
We believe that our future growth will come as a result of organic growth from our continued emphasis on our existing brands; new and expanded product lines; domestic and international licensing opportunities; international, direct retail and e-commerce opportunities and selective acquisitions and opportunities that fit strategically with our business model. Our future results may be impacted by risks and trends set forth in “Item 1A. Risk Factors” and elsewhere in this report.
Recent Accounting Pronouncements
See Footnotes to the Consolidated Financial Statements in “Item 8. Financial Statements and Supplementary Data” for recent accounting pronouncements.
Critical Accounting Policies
Included in the footnotes to the consolidated financial statements in this report is a summary of all significant accounting policies used in the preparation of our consolidated financial statements. We follow the accounting methods and practices as required by accounting principles generally accepted in the United States of America (“GAAP”). In particular, our critical accounting policies and areas in which we use judgment are revenue recognition, the estimated collectability of accounts receivable, the recoverability of obsolete or overstocked inventory, the impairment of assets that are our trademarks and goodwill, the recoverability of deferred tax assets and the measurement of retirement related benefits.
Revenue Recognition. Sales are recognized at the time legal title to the product passes to the customer, generally FOB Perry Ellis’ distribution facilities, net of trade allowances, discounts, estimated returns and other allowances, considering historical and anticipated trends. Revenues are recorded net of corresponding sales taxes. Retail store revenue is recognized net of estimated returns and corresponding sales tax at the time of sale to consumers. Royalty income is recognized when earned on the basis of the terms specified in the underlying contractual agreements.
Accounts Receivable. We maintain an allowance for doubtful accounts receivable and an allowance for estimated trade discounts, co-op advertising, allowances provided to retail customers to flow goods through the
32
Table of Contents
retail channel, and losses resulting from the inability of our retail customers to make required payments considering historical and anticipated trends. Management reviews these allowances and considers the aging of account balances, historical experience, changes in customer creditworthiness, current economic and product trends, customer payment activity and other relevant factors. A small portion of our accounts receivable are insured for collections. Should any of these factors change, the estimates made by management may also change, which could affect the level of future provisions.
Inventories. Our inventories are valued at the lower of cost or market value. Estimates and judgment are required in determining what items to stock and at what levels, and what items to discontinue and how to value them. We evaluate all of our inventory style-size-color stock keeping units, or SKUs, to determine excess or slow-moving SKUs based on orders on hand and projections of future demand and market conditions. For those units in inventory that are so identified, we estimate their market value or net sales value based on current realization trends. If the projected net sales value is less than cost, on an individual SKU basis, we write down inventory to reflect the lower value. This methodology recognizes projected inventory losses at the time such losses are evident rather than at the time goods are actually sold.
Intangible Assets. We review our intangible assets with indefinite useful lives for possible impairments at least annually and perform impairment testing during the fourth quarter of each year by among other things, obtaining independent third party valuations. We evaluate the “fair value” of our identifiable intangible assets for purposes of recognition and measurement of impairment losses. Evaluating indefinite useful life assets for impairment involves certain judgments and estimates, including the interpretation of current economic indicators and market valuations, our strategic plans with regard to our operations, historical and anticipated performance of our operations and other factors. If we incorrectly anticipate these trends or unexpected events occur, our results of operations could be materially affected. We estimate the fair value of the trademarks based on the application of (1) the relief from royalty method for our wholesale business and (2) the yield capitalization method for our licensing business. The combination of these two values represents the total value of each of the trademarks to the Company. The cash flow models we use to estimate the fair values of our trademarks involve several assumptions. Changes in these assumptions could materially impact our fair value estimates. Assumptions critical to the fair value estimates are: (i) discount rates used to derive the present value factors used in determining the fair value of the trademarks; (ii) royalty rates used in the trademark valuations; (iii) projected revenue and expense growth rates; and (iv) projected long-term growth rates used in the derivation of terminal year values. These and other assumptions are impacted by economic conditions and expectations of management and could change in the future based on period-specific facts and circumstances. We base our fair value estimates on assumptions we believe to be reasonable, but which are unpredictable and inherently uncertain.
Goodwill. Goodwill represents the excess of the purchase price over the value assigned to tangible and identifiable intangible assets of businesses acquired and accounted for under the acquisition method. We review goodwill at least annually for possible impairment during the fourth quarter of each year using a discounted cash flow analysis that requires that certain assumptions and estimates be made regarding industry economic factors and future profitability and cash flows. Evaluating goodwill for impairment involves certain judgments and estimates, including the interpretation of current economic indicators and market valuations, our strategic plans with regard to our operations, historical and anticipated performance of our operations and other factors. If we incorrectly anticipate these trends or unexpected events occur, our results of operations could be materially affected. Assumptions critical to the fair value estimates are: (i) discount rates used to derive the present value factors used in determining the fair value of each reporting unit; (ii) projected revenue and expense growth rates; and (iii) projected long-term growth rates used in the derivation of terminal year values. Adverse changes in these assumptions could materially impact our fair value estimates and result in additional goodwill impairments. The goodwill impairment test is a two-step process that requires us to make decisions in determining appropriate assumptions to use in the calculation. The first step consists of estimating the fair value of each reporting unit and comparing those estimated fair values with the carrying values, which include the allocated goodwill. If the estimated fair value is less than the carrying value, a second step is performed to compute the amount of the impairment, if any, by determining an “implied fair value” of goodwill. The determination of each reporting unit’s implied fair value of goodwill requires us to allocate the estimated fair value of the reporting unit to its assets and liabilities. Any unallocated fair value represents the implied fair value of goodwill, which is compared to its corresponding carrying amount.
33
Table of Contents
Deferred Taxes. We account for income taxes under the liability method. Deferred tax assets and liabilities are recognized based on the differences between financial statement and tax basis of assets and liabilities using presently enacted tax rates. The ultimate realization of the deferred tax assets is assessed based upon all available positive and negative evidence, including future reversals of existing taxable temporary differences, projected future taxable income, tax planning strategies and recent financial operations. A valuation allowance is recorded, if required, to reduce deferred tax assets to the portion that is expected to more likely than not be realized.
The ultimate realization of the deferred tax assets, related to net operating losses, is dependent upon the generation of future taxable income during the periods prior to their expiration. If our estimates and assumptions about future taxable income are not appropriate, the value of our deferred tax asset may not be recoverable, and may result in an increase to our valuation allowance that will impact current earnings.
It is our policy to provide for uncertain tax positions and the related interest and penalties based upon management’s assessment of whether a tax benefit is more likely than not to be sustained upon examination by tax authorities. To the extent that we prevail in matters for which a liability for an unrecognized tax benefit is established or are required to pay amounts in excess of the liability, our effective tax rate in a given financial statement period may be affected.
In addition to judgments associated with valuation accounts, our current tax provision can be affected by our mix of income and identification or resolution of uncertain tax positions. Because income from domestic and international sources may be taxed at different rates, the shift in mix during a year or over years can cause the effective tax rate to change.
Retirement-Related Benefits. The pension obligations related to our defined benefit pension plans are developed from actuarial valuations. Inherent in these valuations are key assumptions, including the discount rate, expected return of plan assets, future compensation increases, and other factors, which are updated on an annual basis. Management is required to consider current market conditions, including changes in interest rates, in making these assumptions. Actual results that differ from the assumptions are accumulated and amortized over future periods, and therefore, generally affect the recognized pension expense or benefit and our pension obligation in future periods. The fair value of plan assets is based on the performance of the financial markets, particularly the equity markets. Therefore, the market value of the plan assets can change dramatically in a relatively short period of time. Additionally, the measurement of the plan’s benefit obligation is highly sensitive to changes in interest rates. As a result, if the equity market declines and/or interest rates decrease, the plan’s estimated accumulated benefit obligation could exceed the fair value of the plan assets and therefore, we would be required to establish an additional minimum liability, which would result in a reduction in shareholders’ equity for the amount of the shortfall.
34
Table of Contents
Our Results of Operations for Fiscal 2016
The following table sets forth, for the periods indicated selected items in our consolidated statements of operations expressed as a percentage of total revenues:
| Fiscal Years Ended |
January 30, 2016 |
January 31, 2015 |
February 1, 2014 |
|||||||||
| Net sales |
96.1 | % | 96.4 | % | 96.7 | % | ||||||
| Royalty income |
3.9 | % | 3.6 | % | 3.3 | % | ||||||
|
|
|
|
|
|
|
|||||||
| Total revenues |
100.0 | % | 100.0 | % | 100.0 | % | ||||||
| Cost of sales |
64.5 | % | 66.0 | % | 66.8 | % | ||||||
|
|
|
|
|
|
|
|||||||
| Gross profit |
35.5 | % | 34.0 | % | 33.2 | % | ||||||
| Selling, general and administrative expenses |
30.7 | % | 30.2 | % | 29.9 | % | ||||||
| Depreciation and amortization |
1.5 | % | 1.4 | % | 1.4 | % | ||||||
| Impairment on long-lived assets |
2.3 | % | 0.0 | % | 3.8 | % | ||||||
| Impairment of goodwill |
0.7 | % | 0.0 | % | 0.9 | % | ||||||
| Gain on sale of long-lived assets |
0.4 | % | 0.1 | % | 0.7 | % | ||||||
|
|
|
|
|
|
|
|||||||
| Operating income (loss) |
0.7 | % | 2.5 | % | -2.1 | % | ||||||
| Costs on early extinguishment of debt |
0.6 | % | 0.0 | % | 0.0 | % | ||||||
| Interest expense |
1.0 | % | 1.6 | % | 1.7 | % | ||||||
|
|
|
|
|
|
|
|||||||
| Net (loss) income before income taxes |
-0.9 | % | 0.9 | % | -3.8 | % | ||||||
| Income tax (benefit) provision |
-0.05 | % | 5.1 | % | -1.3 | % | ||||||
|
|
|
|
|
|
|
|||||||
| Net (loss) |
-0.8 | % | -4.2 | % | -2.5 | % | ||||||
|
|
|
|
|
|
|
|||||||
35
Table of Contents
The following table sets forth, for the periods indicated, selected financial data expressed by segments and includes a reconciliation of EBITDA to operating income by segment, the most directly comparable GAAP financial measure:
| January 30, 2016 |
January 31, 2015 |
February 1, 2014 |
||||||||||
| (in thousands) | ||||||||||||
| Revenues by segment: |
||||||||||||
| Men’s Sportswear and Swim |
$ | 640,600 | $ | 635,182 | $ | 664,824 | ||||||
| Women’s Sportswear |
127,692 | 130,852 | 135,994 | |||||||||
| Direct-to-Consumer |
96,514 | 92,203 | 81,755 | |||||||||
| Licensing |
34,709 | 31,735 | 29,651 | |||||||||
|
|
|
|
|
|
|
|||||||
| Total revenues |
$ | 899,515 | $ | 889,972 | $ | 912,224 | ||||||
|
|
|
|
|
|
|
|||||||
| January 30, 2016 |
January 31, 2015 |
February 1, 2014 |
||||||||||
| (in thousands) | ||||||||||||
| Reconciliation of operating income to EBITDA |
||||||||||||
| Operating income (loss) by segment: |
||||||||||||
| Men’s Sportswear and Swim |
$ | 20,068 | $ | 3,847 | $ | 8,975 | ||||||
| Women’s Sportswear |
(9,248 | ) | 859 | (10,883 | ) | |||||||
| Direct-to-Consumer |
(11,805 | ) | (6,675 | ) | (12,306 | ) | ||||||
| Licensing |
7,649 | 24,877 | (5,155 | ) | ||||||||
|
|
|
|
|
|
|
|||||||
| Total operating income (loss) |
$ | 6,664 | $ | 22,908 | $ | (19,369 | ) | |||||
|
|
|
|
|
|
|
|||||||
| Add: |
||||||||||||
| Depreciation and amortization |
||||||||||||
| Men’s Sportswear and Swim |
$ | 7,375 | $ | 6,627 | $ | 7,043 | ||||||
| Women’s Sportswear |
2,250 | 1,903 | 1,899 | |||||||||
| Direct-to-Consumer |
3,884 | 3,519 | 3,549 | |||||||||
| Licensing |
184 | 149 | 135 | |||||||||
|
|
|
|
|
|
|
|||||||
| Total depreciation and amortization |
$ | 13,693 | $ | 12,198 | $ | 12,626 | ||||||
|
|
|
|
|
|
|
|||||||
| EBITDA by segment: |
||||||||||||
| Men’s Sportswear and Swim |
$ | 27,443 | $ | 10,474 | $ | 16,018 | ||||||
| Women’s Sportswear |
(6,998 | ) | 2,762 | (8,984 | ) | |||||||
| Direct-to-Consumer |
(7,921 | ) | (3,156 | ) | (8,757 | ) | ||||||
| Licensing |
7,833 | 25,026 | (5,020 | ) | ||||||||
|
|
|
|
|
|
|
|||||||
| Total EBITDA |
$ | 20,357 | $ | 35,106 | $ | (6,743 | ) | |||||
|
|
|
|
|
|
|
|||||||
| EBITDA margin by segment |
||||||||||||
| Men’s Sportswear and Swim |
4.3 | % | 1.6 | % | 2.4 | % | ||||||
| Women’s Sportswear |
(5.5 | %) | 2.1 | % | (6.6 | %) | ||||||
| Direct-to-Consumer |
(8.2 | %) | (3.4 | %) | (10.7 | %) | ||||||
| Licensing |
22.6 | % | 78.9 | % | (16.9 | %) | ||||||
| Total EBITDA margin |
2.3 | % | 3.9 | % | (0.7 | %) | ||||||
EBITDA consists of earnings before interest, cost on early extinguishment of debt, depreciation and amortization, and income taxes. EBITDA is not a measurement of financial performance under accounting principles generally accepted in the United States of America, and does not represent cash flow from operations. The most directly comparable GAAP financial measure, presented above, is operating income by segment. EBITDA and EBITDA margin by segment are presented solely as a supplemental disclosure because management believes that they are a common measure of operating performance in the apparel industry.
The following is a discussion of our results of operations for the fiscal year ended January 30, 2016 (“fiscal 2016”) as compared with the fiscal year ended fiscal year ended January 31, 2015 (“fiscal 2015”) and fiscal 2015 as compared with the fiscal year ended February 1, 2014 (“fiscal 2014”).
Our fiscal 2016 results as compared to our fiscal 2015 results
Net sales. Men’s Sportswear and Swim net sales in fiscal 2016 were $640.6 million, an increase of $5.4 million, or 0.9%, from $635.2 million in fiscal 2015. The net sales increase was attributed primarily to increases in the Perry Ellis and Original Penguin collections and golf lifestyle apparel, partially offset by decreases in our mid-tier sportswear as we reduced penetration of our exclusive branded products.
36
Table of Contents
Women’s Sportswear net sales in fiscal 2016 were $127.7 million, a decrease of $3.2 million, or 2.4%, from $130.9 million in fiscal 2015. The net sales decrease was primarily due to the sale of C&C California in the first quarter of fiscal 2016. The net sales decrease was partially offset by increases in our contemporary Laundry by Shelli Segal dresses and Rafaella sportswear, driven by solid performance at retail.
Direct-to-Consumer net sales in fiscal 2016 were $96.5 million, an increase of $4.3 million, or 4.7%, from $92.2 million in fiscal 2015. The increase was driven by e-commerce, which posted a 27.2% increase in comparable sales, while retail comparable same store sales were even.
Royalty income. Royalty income for fiscal 2016 was $34.7 million, an increase of $3.0 million, or 9.5%, from $31.7 million in fiscal 2015. Royalty income increases were attributed to increases in our Perry Ellis and Original Penguin businesses as well as 26 new licenses signed during fiscal 2016. Approximately 88.0% of our royalty income was attributed to guaranteed minimum royalties with the balance attributable to royalty income in excess of guaranteed minimums for fiscal 2016.
Gross profit. Gross profit was $319.1 million in fiscal 2016, an increase of $16.1 million, or 5.3%, as compared to $303.0 million in fiscal 2015. This increase is attributed to the sales mix composition described above and the factors described within the gross profit margin section below.
Gross profit margin. In fiscal 2016, gross profit margins were 35.5% as a percentage of total revenue as compared to 34.0% in fiscal 2015, an increase of 150 basis points. This increase was primarily associated with expansion across our licensing and core domestic collections; partially offset by the exit of the Elite component of our Nike licensed business, the inventory liquidation of divested C&C California, as well as the consolidation of our foreign sourcing offices. Gross margin was also positively impacted by reduced markdowns and favorable merchandising margins in domestic businesses as well as a favorable mix driven by higher margin in direct-to-consumer and licensing businesses.
Selling, general and administrative expenses. Selling, general and administrative expenses in fiscal 2016 were $275.9 million, an increase of $7.1 million, or 2.6%, from $268.8 million in fiscal 2015. The increase reflects $4.4 million in fiscal 2016 related to pension costs on lump sum settlement payments on the termination of the defined benefit plan that we expect to complete during fiscal 2017. In addition, increases were realized related to the activist campaign, consolidation of our N.Y. corporate office space and sourcing office, as well as incentive plan accruals and investments in international business. These increases were partially offset by cost savings initiatives implemented during fiscal 2015 which included tighter expense control across our infrastructure.
EBITDA. Men’s Sportswear and Swim EBITDA margin in fiscal 2016 increased 270 basis points to 4.3%, from 1.6% in fiscal 2015. The EBITDA margin increase was driven principally by the expansion in gross margin in our Perry Ellis and Original Penguin collection businesses. We also realized favorable leverage in selling, general and administrative expenses, most notably in employee related expenses, which was partially offset by the planned increased infrastructure expenditures in this segment, as well as exit costs associated with the Elite component of our licensed Nike business. Additionally the segment benefited from the gain on the sale of the Beijing building as discussed below.
Women’s Sportswear EBITDA margin in fiscal 2016 decreased 760 basis points to (5.5%), from 2.1% in fiscal 2015. The EBITDA margin was unfavorably impacted by exit costs associated with C&C California. The margin was also negatively impacted by the impairment of goodwill, which is further discussed below. The decrease was partially offset by the expansion in the Rafaella collection business coupled with favorable leverage in selling, general and administrative expenses, most notably in employee expenses and other overhead.
Direct-to-Consumer EBITDA margin in fiscal 2016 decreased 480 basis points to (8.2%), from (3.4%) in fiscal 2015. The decrease was primarily due to an increase in occupancy costs attributable to renewal of leases coupled with additional costs associated with freight and professional fees. The margin was further impacted negatively by the impairment of certain leasehold improvements, which is further discussed below.
37
Table of Contents
Licensing EBITDA margin in fiscal 2016 decreased to 22.6%, from 78.9% in fiscal 2015. In fiscal 2016, an impairment of $18.2 million on long-lived assets was recognized. No such impairment was recognized during fiscal 2015, thus the large decrease in EBITDA margin. Additionally, we realized a loss on the sale of the C&C California brand, while in fiscal 2015 we realized a gain from the sale of the Jantzen rights as described below. These decreases were partially offset by an increase in royalty income.
Depreciation and amortization. Depreciation and amortization in fiscal 2016 was $13.7 million, an increase of $1.5 million, or 12.3%, from $12.2 million in fiscal 2015. The increase is attributed to depreciation related to our capital expenditures and leaseholds, primarily in the men’s sportswear and swim segment, as well as the direct-to-consumer segment. For fiscal 2016 we had capital expenditures of $17.2 million as compared to capital expenditures of $16.9 million in fiscal 2015.
Impairment on assets and goodwill. As a result of our annual impairment analysis, during fiscal 2016, we recorded trademark and goodwill impairment charges of $18.2 million and $6.0 million, respectively, due to decreases in our projected revenues principally resulting from our internal review of brands and businesses that will be afforded a reduced focus in our forward strategy. This is a positive step as we streamline our business/brand model. Some of the impairments resulted from a decline in the future anticipated cash flows from these trademarks, which was due, in part, to the current economic challenges and market conditions in the apparel industry. There was no such impairment for fiscal 2015. In addition, we recorded a $2.4 million impairment charge to reduce the net carrying value of certain long-lived assets (primarily leaseholds in our direct-to-consumer segment) to their estimated fair value.
Gain (Loss) on sale of long-lived assets. During fiscal 2016, we entered into a sales agreement, in the amount of $8.2 million, for the sale of our sourcing office building located in Beijing, China. As a result of this transaction we recorded a gain in the amount of $4.5 million. Also during fiscal 2016, we entered into an agreement to sell the intellectual property of our C&C California brand to a third party. As a result of this transaction, we recorded a loss of ($0.7) million in the licensing segment.
During fiscal 2015, we entered into a sales agreement, in the amount of $1.3 million, for the sale of Australian, Fiji and New Zealand trademark rights with respect to Jantzen. Payments on the purchase price are due in five installments of $250,000 over a five year period. Interest on the purchase price that remains unpaid will accrue at a rate of 3.5% per annum calculated on an annual basis. As a result of this transaction, we recorded a gain of $0.9 million in the licensing segment.
Cost on early extinguishment of debt. On April 6, 2015, we called for the partial redemption of $100 million of our $150 million outstanding 7 7⁄8% Senior Subordinated Notes. The redemption terms provided for the payment of a redemption premium of 103.938% of the principal amount redeemed. On May 6, 2015, we completed the redemption of $100 million of our senior subordinated notes. We incurred debt extinguishment costs of approximately $5.1 million in connection with the redemption premium and the write-off of note issuance costs.
Interest expense. Interest expense in 2016 was $9.3 million, a decrease of $5.0 million, or 35.0%, from $14.3 million in fiscal 2015. The decrease was primarily attributable to a decrease in interest resulting from the partial redemption of $100 million of our senior subordinated notes. This decrease was partially offset by a higher average amount borrowed on our credit facility as compared to the comparable period of the prior year. The increase in the credit facility was due to its use for the redemption of the notes as discussed above.
Income taxes. Our income tax (benefit) provision in fiscal 2016 was ($0.4) million, a $46.2 million decrease as compared to $45.8 million in 2015. For fiscal 2016, our effective tax rate was 5.6% as compared to 531.4% for 2015. The decrease in the tax rate is primarily attributed to the establishment of the valuation allowance against our domestic deferred tax assets which occurred during fiscal 2015. See Footnotes to the Consolidated Financial Statements in “Item 8. Financial Statements and Supplementary Data” for further details regarding taxable income by jurisdiction.
Net loss. Our net loss in fiscal 2016 was ($7.3) million, a reduction in loss of $29.9 million in income, or 80.4%, as compared to a net loss of ($37.2) million in fiscal 2015. The changes in operating results were due to the items described above.
38
Table of Contents
Our fiscal 2015 results as compared to our fiscal 2014 results
Net sales. Men’s Sportswear and Swim net sales in fiscal 2015 were $635.2 million, a decrease of $29.6 million, or 4.5%, from $664.8 million in fiscal 2014. The net sales decrease was attributed primarily to the exit of $20 million in certain private and retailer exclusive branded programs and planned reductions in Perry Ellis domestically. Additionally, the impact of the West Coast port congestion and lockdown impacted our fourth quarter significantly. We had $18 million in missed shipments due to this issue at fiscal year-end. These decreases were partially offset by increases across our golf sportswear brands, Original Penguin and Nike swim.
Women’s Sportswear net sales in fiscal 2015 were $130.9 million, a decrease of $5.1 million, or 3.8%, from $136.0 million in fiscal 2014. The segment was negatively impacted by $5 million of the missed West Coast port shipments. Despite this, we refined distribution to focus on full price specialty and department stores and reduced programs to the special markets channel and have begun to see market share gains in our products.
Direct-to-Consumer net sales in fiscal 2015 were $92.2 million, an increase of $10.4 million, or 12.7%, from $81.8 million in fiscal 2014. The increase was driven by a 3.2% comparable same store sales improvement driven by Perry Ellis, as well as by our direct e-commerce sales, which posted a 34.1% sales increase over the comparable period last year.
Royalty income. Royalty income for fiscal 2015 was $31.7 million, an increase of $2.0 million, or 6.7%, from $29.7 million in fiscal 2014. Royalty income increases were attributed to increases in the Perry Ellis, Original Penguin and Laundry brands, as well as, 27 new licensing agreements executed during the period. Approximately 82.6% of our royalty income was attributed to guaranteed minimum royalties with the balance attributable to royalty income in excess of guaranteed minimums for fiscal 2015.
Gross profit. Gross profit was $303.0 million in fiscal 2015, an increase of $0.2 million, or 0.1%, as compared to $302.8 million in fiscal 2014. Despite our net sales decrease, gross profit is essentially even as compared to prior year, due to the factors described below regarding our margin expansion during fiscal 2015 and our expansion in royalty income as described above.
Gross profit margin. In fiscal 2015, gross profit margins were 34.0% as a percentage of total revenue as compared to 33.2% in fiscal 2014, an increase of 80 basis points. The increase was primarily attributed to a reduction in promotional activity in the sportswear collection businesses, a more favorable revenue mix between branded and private label revenues, as well as, a stronger contribution from our higher margin international platform and licensing revenues. Direct-to-consumer segment also realized fewer promotions across all venues. These margin improvements were partially offset by liquidation of exited programs in golf and sportswear.
Selling, general and administrative expenses. Selling, general and administrative expenses in fiscal 2015 were $268.8 million, a decrease of $3.9 million, or 1.4%, from $272.7 million in fiscal 2014. The decrease is primarily attributed to a $9 million reduction associated with our infrastructure review, which was partially offset by $3 million in investments in our international growth strategy, which included the launch of our golf business in Europe. We also experienced a $1.8 million unfavorable foreign exchange loss principally driven by the strength of the U.S. dollar against global currencies.
EBITDA. Men’s Sportswear and Swim EBITDA margin in fiscal 2015 decreased 80 basis points to 1.6%, from 2.4% in fiscal 2014. The EBITDA margin was negatively impacted by the reduced leverage due to the decrease in net sales described above. The EBITDA margin was favorably impacted from cost savings as a result of our infrastructure review, as well as, favorable gross margin expansion driven by the mix of revenue in our international business coupled with increased margins in our Perry Ellis and Original Penguin sportswear collections. During fiscal 2014, the margin was negatively impacted by costs associated with our relocation of our New York offices.
Women’s Sportswear EBITDA margin in fiscal 2015 increased 870 basis points to 2.1%, from (6.6%) in fiscal 2014. The EBITDA margin was positively impacted by the increase in gross margin experienced in Rafaella sportswear, partially offset by the negative impact of the reduced leverage from the decrease in net sales described above. Additionally, during fiscal 2014, the margin was negatively impacted by costs associated with the relocation of our New York offices.
Direct-to-Consumer EBITDA margin in fiscal 2015 increased 730 basis points to (3.4%), from (10.7%) in fiscal 2014. The increase was primarily attributable to the increase in revenue from our stores and e-commerce
39
Table of Contents
business, as described above. The increase in revenue resulted in a favorable leverage in selling, general and administrative expenses. In addition, we consolidated our businesses under one operational team thereby reducing overhead. EBITDA margin also benefited from the expansion in gross profit margins discussed above.
Licensing EBITDA margin in fiscal 2015 increased to 78.9%, from (16.9%) in fiscal 2014. In fiscal 2014, an impairment of $34.3 million on long-lived assets was recognized. No such impairment was recognized during fiscal 2015, thus the large increase in EBITDA margin. Additionally, other increases were attributed to the increase in royalty income from the 27 new licensing agreements.
Depreciation and amortization. Depreciation and amortization in fiscal 2015 was $12.2 million, a decrease of $0.4 million, or 3.2%, from $12.6 million in fiscal 2014. The decrease is attributed to assets becoming fully depreciated and fewer capital expenditures during the current year. For fiscal 2015 we had capital expenditures of $16.9 million as compared to capital expenditures of $22.2 million in fiscal 2014.
Gain on sale of long-lived assets. During fiscal 2015, we entered into a sales agreement, in the amount of $1.3 million, for the sale of Australian, Fiji and New Zealand trademark rights with respect to Jantzen. Payments on the purchase price are due in five installments of $250,000 over a five year period. Interest on the purchase price that remains unpaid will accrue at a rate of 3.5% per annum calculated on an annual basis. As a result of this transaction, we recorded a gain of $0.9 million in the licensing segment.
During fiscal 2013, we entered into a sales agreement, in the amount of $7.5 million, for certain Asian trademark rights with respect our John Henry brand. The transaction closed in the first quarter of fiscal 2014. As a result of this transaction, we recorded a gain of $6.3 million. This gain was included in our licensing segment’s operating income. The gain of $6.3 million was partially offset by the ($0.1) million loss related to the sale of our Winnsboro distribution facility during the third quarter of fiscal 2014.
Interest expense. Interest expense in 2015 was $14.3 million, a decrease of $0.7 million, or 4.7%, from $15.0 million in fiscal 2014. The primary reason for the decrease is related to the savings generated from the refinancing of our mortgage loans in the second half of fiscal 2014, as well as lower average borrowings on our credit facility as compared to our borrowings in the prior year.
Income taxes. Our income tax (benefit) provision in fiscal 2015 was $45.8 million, a $57.4 million increase as compared to ($11.6) million in 2014. For fiscal 2015, our effective tax rate was 531.4% as compared to 33.8% for 2014. The fiscal 2015 provision was impacted by a charge of $42.4 million due to the establishment of a valuation allowance on our domestic differed tax assets. The West Coast port congestion and our cumulative losses under Accounting Standards Codification 740 resulted in the non-cash valuation reserve being required. The position does not impact the Company’s ability to use its deferred tax assets in the future. See Footnotes to the Consolidated Financial Statements in “Item 8. Financial Statements and Supplementary Data” for further details regarding taxable income by jurisdiction.
Net loss. Our net loss in fiscal 2015 was ($37.2) million, an increase of $14.4 million, or 63.2%, as compared to net loss of ($22.8) million in fiscal 2014. The changes in operating results were due to the items described above.
Our Liquidity and Capital Resources
We rely principally on cash flow from operations and borrowings under our senior credit facility to finance our operations, pension funding requirements, acquisitions, and capital expenditures. We believe that our working capital requirements will increase for next year as we continue to expand internationally. As of January 30, 2016, our total working capital was $218.8 million as compared to $240.2 million as of January 31, 2015. We believe that our cash flows from operations and availability under our senior credit facility and remaining letter of credit facilities are sufficient to meet our working capital needs and capital expenditure needs over the next year.
We consider the undistributed earnings of our foreign subsidiaries as of January 30, 2016, to be indefinitely reinvested and, accordingly, no U.S. income taxes have been provided thereon. As of January 30, 2016, the amount of cash associated with indefinitely reinvested foreign earnings was approximately $31.1 million. We have not, nor do we anticipate the need to, repatriate funds to the United States to satisfy domestic liquidity needs arising in the ordinary course of business, including liquidity needs associated with our domestic debt service requirements.
40
Table of Contents
Net cash provided by operating activities was $30.2 million in fiscal 2016 as compared to cash provided by operating activities of $55.1 million in fiscal 2015 and cash provided by operating activities of $0.2 million in fiscal 2014.
Although in fiscal 2016 we had a net loss, the loss was primarily attributed to non-cash charges of $26.6 million for impairments, $14.3 million for depreciation and amortization, and $4.4 million for the pension settlement charge. When added back to the net loss, we generated $38.0 million in cash from operations. Further sources of increases in cash from operations were a decrease in accounts receivable of $3.1 million and a decrease of prepaid income taxes of $4.6 million. These increases were partially offset by a decrease in accounts payable and accrued expenses of $10.3 million, a decrease in deferred pension obligation of $1.1 million, a decrease in accrued interest payable of $2.5 million and a slight increase in inventories of $1.2 million. Our inventory turnover ratio increased to 3.7 as compared to 3.4 for fiscal 2015 resulting from tighter inventory management.
The cash provided by operating activities in fiscal 2015 is primarily attributable to a decrease in inventory of $20.1 million, a decrease in accounts receivable of $6.5 million, a decrease of prepaid income taxes of $1.1 million and an increase in accounts payable and accrued expenses of $4.2 million; partially offset by a decrease in deferred pension obligation of $3.6 million. Our inventory turnover ratio remained flat at 3.4 as compared to fiscal 2014. While the inventory turnover ratio remained flat, inventory levels declined as noted above resulting from tighter inventory management.
Net cash provided by investing activities was $3.0 million in fiscal 2016, as compared to cash used by investing activities of $21.1 million in fiscal 2015. The net cash provided during fiscal 2016, primarily reflects proceeds from investment maturities of $22.2 million, the proceeds from the sale of C&C California in the amount of $2.5 million, the proceeds from notes receivable associated with the sale of Australian, Fiji and New Zealand Jantzen trademark rights in the amount of $0.3 million and the proceeds from the sale of the Beijing building of $8.2 million offset by related expenses for the sale of $1.9 million. Further reductions include the purchase of property and equipment of $16.2 million, primarily for new leaseholds, and the purchase of investments in the amount of $12.1 million. Capital expenditures for fiscal 2017 are expected to be approximately $15 million.
Net cash used in investing activities was $21.1 million in fiscal 2015, as compared to cash used by investing activities of $27.4 million in fiscal 2014. The net cash used during fiscal 2015, primarily reflects the purchase of property and equipment of $16.7 million, primarily for new leaseholds, and the purchase of investments in the amount of $31.5 million; partially offset by proceeds from investment maturities of $26.6 million and the proceeds from notes receivable associated with the sale of Australian, Fiji and New Zealand Jantzen trademark rights in the amount of $0.3 million.
Net cash used in financing activities was $45.4 million in fiscal 2016, as compared to cash used in financing activities of $17.8 million in fiscal 2015. The net cash used during fiscal 2016 primarily reflects payments for the partial redemption on our senior subordinated notes of $100 million, purchases of treasury stock of $7.0 million, payments of deferred financing fees on the senior credit facility of $0.6 million, payments on real estate mortgages of $0.8 million, and payments on capital leases of $0.3 million; partially offset by net borrowings on our senior credit facility of $61.8 million and proceeds from exercises of stock options of $1.4 million.
Net cash used in financing activities was $17.8 million in fiscal 2015, as compared to cash used in financing activities of $0.6 million in fiscal 2014. The net cash used during fiscal 2015 primarily reflects net payments on our senior credit facility of $8.2 million, purchases of treasury stock of $8.8 million, payments on real estate mortgages of $0.8 million, and payments on capital leases of $0.3 million; partially offset by proceeds from exercises of stock options of $0.4 million.
Our Board of Directors has authorized us to purchase, from time to time and as market and business conditions warrant, up to $70 million of our common stock for cash in the open market or in privately negotiated transactions through October 31, 2016. Although our Board of Directors allocated a maximum of $70 million to carry out the program, we are not obligated to purchase any specific number of outstanding shares and will reevaluate the program on an ongoing basis.
During fiscal 2016, 2015 and 2014, we repurchased shares of our common stock at a cost of $7.0 million, $8.8 million and $7.0 million, respectively. There were no shares outstanding as of January 30, 2016 and as of January 31, 2015, there were 770,753 shares of treasury stock outstanding at a cost of approximately $15.7 million.
41
Table of Contents
During fiscal 2016, we retired shares of treasury stock recorded at a cost of approximately $22.7 million. Accordingly, during fiscal 2016, we reduced common stock and additional paid in capital by $11,000 and $22.7 million, respectively.
7 7⁄8% $150 Million Senior Subordinated Notes Payable
In March 2011, we issued $150 million 7 7⁄8% senior subordinated notes, due April 1, 2019. The proceeds of this offering were used to retire the $150 million 8 7⁄8% senior subordinated notes due September 15, 2013 and to repay a portion of the outstanding balance on the senior credit facility. The proceeds to us were $146.5 million yielding an effective interest rate of 8.0%.
On April 6, 2015, we elected to call for the partial redemption of $100 million of our $150 million 7 7 /8 % senior subordinated notes due 2019 and a notice of redemption was sent to all registered holders of the senior subordinated notes. The redemption terms provided for the payment of a redemption premium of 103.938% of the principal amount redeemed. On May 6, 2015, we completed the redemption of the $100 million of our senior subordinated notes. We incurred debt extinguishment costs of approximately $5.1 million in connection with the redemption, including the redemption premium as well as the write-off of note issuance costs.
Certain Covenants. The indenture governing the senior subordinated notes contains certain covenants which restrict our ability and the ability of our subsidiaries to, among other things, incur additional indebtedness in certain circumstances, pay dividends or make other distributions on, redeem or repurchase capital stock, make investments or other restricted payments, create liens on assets to secure debt, engage in transactions with affiliates, and effect a consolidation or merger. We are not aware of any non-compliance with any of our covenants in this indenture. We could be materially harmed if we violate any covenants because the indenture’s trustee could declare the outstanding notes, together with accrued interest, to be immediately due and payable, which we may not be able to satisfy. In addition, a violation could also constitute a cross-default under the senior credit facility, the letter of credit facilities and the real estate mortgages resulting in all of our debt obligations becoming immediately due and payable, which we may not be able to satisfy.
Senior Credit Facility
On April 22, 2015, we amended and restated our existing senior credit facility (the “Credit Facility”), with Wells Fargo Bank, National Association, as agent for the lenders, and Bank of America, N.A., as syndication agent. The Credit Facility provides a revolving credit facility of up to an aggregate amount of $200 million. The Credit Facility has been extended through April 30, 2020 (“Maturity Date”). In connection with this amendment and restatement, we paid fees in the amount of $0.6 million. These fees will be amortized over the term of the Credit Facility as interest expense. At January 30, 2016, we had outstanding borrowings of $61.8 million under the Credit Facility. At January 31, 2015, we had no outstanding borrowings under the Credit Facility.
Certain Covenants. The Credit Facility contains certain financial and other covenants, which, among other things, require the Company to maintain a minimum fixed charge coverage ratio if availability falls below certain thresholds. We are not aware of any non-compliance with any of our covenants in this Credit Facility. These covenants may restrict our ability and the ability of our subsidiaries to, among other things, incur additional indebtedness and liens in certain circumstances, redeem or repurchase capital stock, make certain investments or sell assets. We may pay cash dividends subject to certain restrictions set forth in the covenants including, but not limited to, meeting a minimum excess availability threshold and no occurrence of a default. We could be materially harmed if we violate any covenants, as the lenders under the Credit Facility could declare all amounts outstanding, together with accrued interest, to be immediately due and payable. If we are unable to repay those amounts, the lenders could proceed against our assets and the assets of our subsidiaries that are borrowers or guarantors. In addition, a covenant violation that is not cured or waived by the lenders could also constitute a cross-default under certain of our other outstanding indebtedness, such as the indenture relating to our 7 7 / 8 % senior subordinated notes due April 1, 2019, our letter of credit facilities, or our real estate mortgage loans. A cross-default could result in all of our debt obligations becoming immediately due and payable, which we may not be able to satisfy. Additionally, our Credit Facility includes a subjective acceleration clause if a “material adverse change” in our business occurs. We believe that the likelihood of the lender exercising this right is remote .
42
Table of Contents
Borrowing Base. Borrowings under the Credit Facility are limited to a borrowing base calculation, which generally restricts the outstanding balance to the sum of (a) 87.5% of eligible receivables plus (b) 87.5% of eligible foreign accounts up to $1.5 million plus (c) the lesser of (i) the inventory loan limit, which equals 80% of the maximum credit under the Credit Facility at the time, (ii) a maximum of 70.0% of eligible finished goods inventory with an inventory limit not to exceed $125 million, or 90.0% of the net recovery percentage (as defined in the Credit Facility) of eligible inventory.
Interest. Interest on the outstanding principal balance drawn under the Credit Facility accrues at the prime rate and at the rate quoted by the agent for Eurodollar loans. The margin adjusts quarterly, in a range of 0.50% to 1.00% for prime rate loans and 1.50% to 2.00% for Eurodollar loans, based on the previous quarterly average of excess availability plus excess cash on the last day of the previous quarter.
Security. As security for the indebtedness under the Credit Facility, we granted to the lenders a first priority security interest (subject to liens permitted under the Credit Facility to be senior thereto) in substantially all of our existing and future assets, including, without limitation, accounts receivable, inventory, deposit accounts, general intangibles, equipment and capital stock or membership interests, as the case may be, of certain subsidiaries, and real estate, but excluding our non-U.S. subsidiaries and all of our trademark portfolio.
Letter of Credit Facilities
As of January 30, 2016, we maintained one U.S. dollar letter of credit facilities totaling $30.0 million and one letter of credit facility totaling $0.3 million utilized by our United Kingdom subsidiary. Each documentary letter of credit is secured primarily by the consignment of merchandise in transit under that letter of credit and certain subordinated liens on our assets.
During the first quarter of fiscal 2016, a $15 million line of credit expired and was not renewed. During fiscal 2014, we decreased the letter of credit sublimit in our Senior Credit Facility to $30.0 million. At January 30, 2016 and January 31, 2015, there was $18.9 million and $33.7 million, respectively, available under the existing letter of credit facilities
Real Estate Mortgage Loans
In July 2010, we paid off our then existing real estate mortgage loan and refinanced our main administrative office, warehouse and distribution facility in Miami with a $13.0 million mortgage loan. The loan is due on August 1, 2020. The interest rate has been modified since the refinancing date. The interest rate was 4.25% per annum and monthly payments of principal and interest of $71,000 were due, based on a 25-year amortization, with the outstanding principal due at maturity. In July 2013, we amended the mortgage loan agreement to modify the interest rate. The interest rate was reduced to 3.9% per annum and the terms were restated to reflect new monthly payments of principal and interest of $69,000, based on a 25-year amortization, with the outstanding principal due at maturity. At January 30, 2016, the balance of the real estate mortgage loan totaled $11.0 million, net of discount, of which $357,000 is due within one year.
In June 2006, we entered into a mortgage loan for $15 million secured by our Tampa facility. The loan is due on January 23, 2019. The mortgage loan has been refinanced and the interest rate has been modified since such date. The interest rate was 4.00% per annum and quarterly payments of principal and interest of approximately $248,000 were due, based on a 20-year amortization, with the outstanding principal due at maturity. In January 2014, we amended the mortgage loan to modify the interest rate. The interest rate was reduced to 3.25% per annum and the terms were restated to reflect new monthly payments of principal and interest of approximately $68,000, based on a 20-year amortization, with the outstanding principal due at maturity. At January 30, 2016, the balance of the real estate mortgage loan totaled $11.1 million, net of discount, of which approximately $460,000 is due within one year.
The real estate mortgage loans contain certain covenants. We are not aware of any non-compliance with any of the covenants. If we violate any covenants, the lender under the real estate mortgage loan could declare all amounts outstanding thereunder to be immediately due and payable, which we may not be able to satisfy. A covenant violation could constitute a cross-default under our senior credit facility, the letter of credit facilities and the indenture relating to our senior subordinated notes resulting in all of our debt obligations becoming immediately due and payable, which we may not be able to satisfy.
43
Table of Contents
Contractual Obligations and Commercial Contingent Commitments
The following tables illustrate the balance of our contractual obligations and commercial contingent commitments as of January 30, 2016:
| Payments Due by Period | ||||||||||||||||||||
| (in thousands) | ||||||||||||||||||||
| Contractual Obligations |
Total | Less than 1 year |
1-3 years | 4-5 years | After 5 years | |||||||||||||||
| Long-term debt, net of interest |
$ | 134,132 | $ | 817 | $ | 11,490 | $ | 121,825 | $ | — | ||||||||||
| Interest on long-term debt (1) |
18,665 | 4,739 | 9,378 | 4,548 | — | |||||||||||||||
| Operating leases |
178,100 | 22,369 | 40,994 | 36,158 | 78,579 | |||||||||||||||
| Capital leases |
647 | 263 | 384 | — | — | |||||||||||||||
| Employee agreements |
1,500 | 500 | 1,000 | — | — | |||||||||||||||
| Pension liability |
30,970 | 30,970 | — | — | — | |||||||||||||||
| Royalty minimum guaranties |
37,175 | 10,581 | 14,795 | 10,066 | 1,733 | |||||||||||||||
|
|
|
|
|
|
|
|
|
|
|
|||||||||||
| Total contractual obligations |
$ | 401,189 | $ | 70,239 | $ | 78,041 | $ | 172,597 | $ | 80,312 | ||||||||||
|
|
|
|
|
|
|
|
|
|
|
|||||||||||
| (1) | Includes interest payments based on contractual terms and excludes interest on the senior credit facilty, which typically approximates $1.0 million to $2.0 million per year. |
| Amount of Contingent Commitment Expiration Per Period | ||||||||||||||||||||
| (in thousands) | ||||||||||||||||||||
| Other Commercial Contingent Commitments |
Total | Less than 1 year |
1-3 years | 4-5 years | After 5 years | |||||||||||||||
| Standby letters of credit |
$ | 11,395 | $ | 11,395 | $ | — | $ | — | $ | — | ||||||||||
|
|
|
|
|
|
|
|
|
|
|
|||||||||||
| Total commercial commitments |
$ | 11,395 | $ | 11,395 | $ | — | $ | — | $ | — | ||||||||||
|
|
|
|
|
|
|
|
|
|
|
|||||||||||
| Total contractual obligations and other commercial contingent commitments |
$ | 412,584 | $ | 81,634 | $ | 78,041 | $ | 172,597 | $ | 80,312 | ||||||||||
|
|
|
|
|
|
|
|
|
|
|
|||||||||||
At January 30, 2016, we had a liability for unrecognized tax benefits and an accrual for the payment of related interest and penalties totaling $1.1 million. Due to the uncertainties related to these tax matters, we are unable to make a reasonably reliable estimate when cash settlement with a taxing authority will occur in relation to these liabilities, and thus this liability is not included in the above tables.
Off-Balance Sheet Arrangements
We are not a party to any “off-balance sheet arrangements,” as defined by applicable GAAP and SEC rules.
Derivative Financial Instruments
Derivative financial instruments such as interest rate swap contracts and foreign exchange contracts are recognized in the financial statements and measured at fair value regardless of the purpose or intent for holding them. Changes in the fair value of derivative financial instruments are either recognized in income or stockholders’ equity (as a component of comprehensive income), depending on whether or not the derivative is designated as a hedge of changes in fair value or cash flows. When designated as a hedge of changes in fair value, the effective portion of the hedge is recognized as an offset in income with a corresponding adjustment to the hedged item. When designated as a hedge of changes in cash flows, the effective portion of the hedge is recognized as an offset in comprehensive income with a corresponding adjustment to the hedged item and recognized in income in the same period as the hedged item is settled. See “Item 7A – Quantitative and Qualitative Disclosures About Market Risk” for further discussion about derivative financial instruments.
Effects of Inflation and Foreign Currency Fluctuations
We do not believe that inflation or foreign currency fluctuations significantly affected our financial position and results of operations as of and for the fiscal year ended January 30, 2016.
44
Table of Contents
Item 7A. Quantitative and Qualitative Disclosures About Market Risk
The market risk inherent in our financial statements represents the potential changes in the fair value, earnings or cash flows arising from changes in interest rates. We manage this exposure through regular operating and financing activities and, when deemed appropriate, through the use of derivative financial instruments. Our policy allows the use of derivative financial instruments for identifiable market risk exposure, including interest rate. We currently do not have any derivative financial instruments for identifiable market risk.
The table below provides information about our financial instruments that are sensitive to changes in interest rates:
| Less than 1 yr | 1 - 3 yrs | 4 - 5 yrs | After 5 yrs | Fair Value | ||||||||||||||||||||||||||||
| 2017 | 2018 | 2019 | 2020 | 2021 | Thereafter | Total | 2016 | |||||||||||||||||||||||||
| Long-term Liabilities: |
||||||||||||||||||||||||||||||||
| 7 7⁄8% Senior Subordinated Notes Payable |
$ | 0.0 | $ | 0.0 | $ | 0.0 | $ | 50.0 | $ | 0.0 | $ | 0.0 | $ | 50.0 | $ | 49.0 | ||||||||||||||||
| Fixed Interest Rate |
7.88 | % | 7.88 | % | 7.88 | % | 7.88 | % | N/A | N/A | 7.88 | % | ||||||||||||||||||||
| Real Estate Mortgage Loan |
$ | 0.4 | $ | 0.4 | $ | 0.4 | $ | 0.4 | $ | 9.6 | $ | 0.0 | $ | 11.2 | $ | 11.2 | ||||||||||||||||
| Fixed Interest Rate |
3.90 | % | 3.90 | % | 3.90 | % | 3.90 | % | 3.90 | % | N/A | 3.90 | % | |||||||||||||||||||
| Real Estate Mortgage Loan |
$ | 0.5 | $ | 0.5 | $ | 10.2 | $ | 0.0 | $ | 0.0 | $ | 0.0 | $ | 11.2 | $ | 11.2 | ||||||||||||||||
| Fixed Interest Rate |
3.25 | % | 3.25 | % | 3.25 | % | N/A | N/A | N/A | 3.25 | % | |||||||||||||||||||||
| Senior Credit Facility |
$ | 0.0 | $ | 0.0 | $ | 0.0 | $ | 0.0 | $ | 62.0 | $ | 0.0 | $ | 62.0 | $ | 62.0 | ||||||||||||||||
| Average Variable Interest Rate (A) |
2.18 | % | 2.18 | % | 2.18 | % | 2.18 | % | 2.18 | % | N/A | 2.18 | % | |||||||||||||||||||
| (A) | The senior credit facility has a variable rate of interest of either 1) the published prime lending rate or 2) the Eurodollar rate with adjustments of both rates based on meeting certain financial conditions. |
Commodity Price Risk
We are exposed to market risks for the pricing of cotton and other fibers, which may impact fabric prices. Fabric is a portion of the overall product cost, which includes various components. We manage our fabric prices by using a combination of different strategies including the utilization of sophisticated logistics and supply chain management systems, which allow us to maintain maximum flexibility in our global sourcing of products. This provides us with the ability to re-direct our sourcing of products to the most cost-effective jurisdictions. In addition, we may modify our product offerings to our customers based on the availability of new fibers, yield enhancement techniques and other technological advances that allow us to utilize more cost effective fibers. Finally, we also have the ability to adjust our price points of such products, to the extent market conditions allow. These factors, along with our foreign-based sourcing offices, allow us to procure product from lower cost countries or capitalize on certain tariff-free arrangements, which help mitigate any commodity price increases that may occur. We have not historically managed, and do not currently intend to manage, commodity price exposures by using derivative instruments.
Item 8. Financial Statements And Supplementary Data
See pages F-1 through F-50 appearing at the end of this report.
Item 9. Changes in and Disagreements with Accountants on Accounting and Financial Disclosure
None
45
Table of Contents
Item 9A. Controls and Procedures
Evaluation of Disclosure Controls and Procedures
As required by Exchange Act Rule 13a-15(b), we carried out an evaluation, under the supervision and with the participation of our Chairman of the Board and Chief Executive Officer and our Chief Financial Officer, of the effectiveness of the design and operation of our disclosure controls and procedures as of January 30, 2016.
The purpose of disclosure controls and procedures is to ensure that information required to be disclosed in our reports filed with or submitted to the SEC is recorded, processed, summarized and reported within the time periods specified in the SEC’s rules and forms. Disclosure controls and procedures are also designed with the objective of ensuring that such information is accumulated and communicated to our management, including our Chief Executive Officer and our Chief Financial Officer, as appropriate to allow timely decisions regarding required disclosure.
Our management does not expect that our disclosure controls and procedures or our internal controls over financial reporting will prevent all errors and all fraud. A control system, no matter how well conceived and operated, can provide only reasonable rather than absolute assurance that the objectives of the control system are met. The design of a control system must also reflect the fact that there are resource constraints, with the benefits of controls considered relative to their costs. Because of the inherent limitations in all control systems, no evaluation of controls can provide absolute assurance that all control issues and instances of fraud (if any) within a company have been detected. These inherent limitations include the realities that judgments in decision-making can be faulty and that simple errors or mistakes can occur. Controls can also be circumvented by the individual acts of some persons, by collusion of two or more people, or by management override of the control. The design of any system of controls also is based in part upon certain assumptions about the likelihood of future events, and there can be no assurance that any design will succeed in achieving its stated goals under all potential future conditions; over time, controls may become inadequate because of changes in conditions, or the degree of compliance with the policies or procedures may deteriorate. Because of the inherent limitations in a cost-effective control system, misstatements due to error or fraud may occur and not be detected.
Our internal controls are evaluated on an ongoing basis by our internal audit function and by other personnel in our organization. The overall goals of these various evaluation activities are to monitor our disclosure and internal controls and to make modifications as necessary, as disclosure and internal controls are intended to be dynamic systems that change (including improvements and corrections) as conditions warrant. Part of this evaluation is to determine whether there were any significant deficiencies or material weaknesses in our internal controls, or whether we had identified any acts of fraud involving personnel who have a significant role in our internal controls. Significant deficiencies are control issues that could have a significant adverse effect on the ability to record, process, summarize and report financial data in the financial statements. Material weaknesses are particularly serious conditions where the internal control does not reduce to a relatively low level the risk that misstatements caused by error or fraud may occur in amounts that would be material in relation to the financial statements and not be detected within a timely period by employees in the normal course of performing their assigned functions.
Based upon this evaluation, our Chairman of the Board and Chief Executive Officer and our Chief Financial Officer concluded that, our disclosure controls and procedures were effective as of January 30, 2016 in providing reasonable assurance that the information required to be disclosed by us in the reports that we file or submit under the Securities Exchange Act is (i) recorded, processed, summarized and reported within the time periods specified in the SEC’s rules and forms and (ii) that such information is accumulated and communicated to our management, including our principal executive officer and principal financial officer, as appropriate, to allow timely decisions regarding required disclosure.
46
Table of Contents
MANAGEMENT’S REPORT ON INTERNAL CONTROL OVER FINANCIAL REPORTING
April 14, 2016
Management of Perry Ellis International, Inc. is responsible for establishing and maintaining adequate internal control over financial reporting. Internal control over financial reporting is a process designed by, or under the supervision of, our principal executive and principal financial officers and effected by our board of directors, management and other personnel to provide reasonable assurance regarding the reliability of financial reporting and the preparation of financial statements for external purposes in accordance with generally accepted accounting principles and includes those policies and procedures that:
| • | pertain to the maintenance of records that in reasonable detail accurately and fairly reflect the transactions and dispositions of our assets; |
| • | provide reasonable assurance that transactions are recorded as necessary to permit preparation of financial statements in accordance with generally accepted accounting principles, and that our receipts and expenditures are being made only in accordance with authorizations of our management and directors; and |
| • | provide reasonable assurance regarding prevention or timely detection of unauthorized acquisition, use or disposition of our assets that could have a material effect on the financial statements. |
Because of inherent limitations, internal control over financial reporting may not prevent or detect misstatements. Projections of any evaluation of effectiveness to future periods are subject to the risks that controls may become inadequate because of changes in conditions, or that the degree of compliance with the policies or procedures may deteriorate.
Management assessed the effectiveness of our internal control over financial reporting as of January 30, 2016. In making this assessment, management used the criteria set forth by the Committee of Sponsoring Organizations of the Treadway Commission in Internal Control-Integrated Framework (2013).
Management determined that, as of January 30, 2016, our internal control over financial reporting was effective.
Our internal control over financial reporting as of January 30, 2016, has been audited by PricewaterhouseCoopers LLP, an independent registered certified public accounting firm, as stated in their report, which is included in Part II, Item 8.
| /s/ George Feldenkreis |
/s/ Anita Britt | |||
| George Feldenkreis | Anita Britt | |||
| Chairman of the Board and Chief Executive Officer | Chief Financial Officer |
47
Table of Contents
Changes in Internal Controls over Financial Reporting
There have been no changes in our internal controls over financial reporting that occurred during our last fiscal quarter that have materially affected, or are reasonably likely to materially affect, our internal control over financial reporting.
Not applicable.
Item 10. Directors, Executive Officers and Corporate Governance
Information regarding our directors and executive officers required by this item is included in our Proxy Statement relating to our 2016 Annual Meeting under the captions “Election of Directors” and is incorporated herein by reference.
Information regarding our audit committee and our audit committee financial expert required by this item is included in our Proxy Statement relating to our 2016 Annual Meeting under the caption “Corporate Governance- Meetings and Committees of the Board of Directors” and is incorporated herein by reference.
Information regarding compliance with Section 16 of the Securities Exchange Act of 1934 is included in our Proxy Statement relating to our 2016 Annual Meeting under the caption “Section 16(a) Beneficial Ownership Reporting Compliance” and is incorporated herein by reference.
We have adopted a Code of Ethics that applies to all of our directors, officers, and employees. The Code of Ethics is posted on our website at www.pery.com. Amendments to, and waivers granted under, our Code of Ethics, if any, will be posted to our website as well.
Information describing any material changes to the procedures by which security holders may recommend nominees to our Board of Directors is included in our Proxy Statement related to our 2016 Annual Meeting under the caption “Corporate Governance-Meetings and Committees of the Board of Directors.”
Item 11. Executive Compensation
Information required by this item is included in our Proxy Statement related to our 2016 Annual Meeting under the captions “Executive Compensation”, “Compensation Discussion and Analysis,” “Director Compensation” and “Compensation Committee Report” and is incorporated herein by reference.
Item 12. Security Ownership of Certain Beneficial Owners and Management and Related Stockholder Matters
Information required by this item is included in our Proxy Statement related to our 2016 Annual Meeting under the captions “Security Ownership of Certain Beneficial Owners and Management” and “Executive Compensation” and is incorporated herein by reference.
Item 13. Certain Relationships and Related Transactions and Director Independence
Information required by this item is included in our Proxy Statement related to our 2016 Annual Meeting under the captions “Certain Relationships and Related Transactions” and “Corporate Governance-Meetings and Committees of the Board of Directors” and is incorporated herein by reference.
Item 14. Principal Accountant Fees and Services
Information required by this item is included in our Proxy Statement related to our 2016 Annual Meeting Statement under the caption “Principal Accountant Fees and Services” and is incorporated herein by reference.
48
Table of Contents
PART IV
Item 15. Exhibits and Financial Statement Schedules
| (a) | Documents filed as part of this report |
| (1) | Consolidated Financial Statements. |
The following Consolidated Financial Statements of Perry Ellis International, Inc. and subsidiaries are included in Part II, Item 8:
| Page | ||||
| F-2 | ||||
| F-3 | ||||
| F-4 | ||||
| F-5 | ||||
| F-6 | ||||
| F-7 | ||||
| F-9 | ||||
| (2) | Consolidated Financial Statement Schedule |
| F-50 |
All other schedules required by applicable Securities and Exchange Commission regulations are either not required under the related instructions or inapplicable, therefore such schedules have been omitted.
| (3) | Exhibits |
| Exhibit |
Exhibit Description |
Where Filed | ||
| 3.1 | Registrant’s Amended and Restated Articles of Incorporation | Filed as an Exhibit to the Registrant’s Proxy Statement for its 1998 Annual Meeting and incorporated herein by reference. | ||
| 3.2 | Articles of Amendment to Articles of Incorporation | Filed as an Annex to the Registrant’s Proxy Statement for its 2003 Annual Meeting and incorporated herein by reference. | ||
| 3.3 | Registrant’s Amended and Restated Bylaws | Filed as an Exhibit to the Registrant’s Registration Statement on Form S-1 (File No. 33-60750) and incorporated herein by reference. | ||
| 3.4 | Amended and Restated Bylaws of Perry Ellis International, Inc. | Filed as an Exhibit to the Registrant’s Current Report on Form 8-K dated December 8, 2014 and incorporated herein by reference. | ||
| 3.5 | Third Restated Articles of Incorporation of Perry Ellis International, Inc. | Filed as an Exhibit to the Registrant’s Current Report on Form 8-K dated December 8, 2014 and incorporated herein by reference. | ||
49
Table of Contents
| 3.6 | Fourth Restated Articles of Incorporation of Perry Ellis International, Inc. | Filed as an Exhibit to the Registrant’s Current Report on Form 8-K dated February 6, 2015 and incorporated herein by reference. | ||
| 4.1 | Form of Common Stock Certificate | Filed as an Exhibit to the Registrant’s Registration Statement on Form S-1 (File No. 33-60750) and incorporated herein by reference. | ||
| 4.7 | Indenture by and among Perry Ellis International, Inc., the Subsidiary Guarantors party thereto and U.S. Bank Trust National Association dated March 8, 2011 | Filed as an Exhibit to the Registrant’s Registration Statement on Form S-3 (File No. 333-167728) dated December 23, 2014 and incorporated herein by reference. | ||
| 4.8 | First Supplemental Indenture by and among Perry Ellis International, Inc., the Subsidiary Guarantors party thereto and U.S. Bank National Association dated March 8, 2011 | Filed as an Exhibit to the Registrant’s Current Report on Form 8-K dated March 14, 2011 and incorporated herein by reference. | ||
| 4.9 | Form of Perry Ellis International, Inc. 7.875% Senior Subordinated Note due April 1, 2019 (set forth in Exhibit A to Exhibit 4.8 above) | Filed as an Exhibit to the Registrant’s Current Report on Form 8-K dated March 14, 2011 and incorporated herein by reference. | ||
| 10.1 | Form of Indemnification Agreement between the Registrant and each of the Registrant’s Directors and Officers (1) | Filed as an Exhibit to the Registrant’s Annual Report on Form 10-K for the fiscal year ended January 31, 2005 and incorporated herein by reference. | ||
| 10.4 | Profit Sharing Plan (1) | Filed as an Exhibit to the Registrant’s Registration Statement on Form S-1 (File No. 33-96304) and incorporated herein by reference. | ||
| 10.5 | Incentive Compensation Plan (1) | Filed as an Exhibit to the Registrant’s Proxy Statement for its 2000 Annual Meeting and incorporated herein by reference. | ||
| 10.12 | Form of Stock Option Agreement pursuant to the 2002 Stock Option Plan (1) | Filed as an Exhibit to the Registrant’s Quarterly Report on Form 10-Q for the quarterly period ended October 31, 2004 and incorporated herein by reference. | ||
50
Table of Contents
| 10.25 | Form of Stock Option Agreement pursuant to the 2005 Long-Term Incentive Compensation Plan (1) | Filed as an Exhibit to the Registrant’s Quarterly Report on Form 10-Q for the quarterly period ended July 31, 2005 and incorporated herein by reference. | ||
| 10.26 | Form of Restricted Stock Agreement pursuant to the 2005 Long-Term Incentive Compensation Plan (1) | Filed as an Exhibit to the Registrant’s Quarterly Report on Form 10-Q for the quarterly period ended July 31, 2005 and incorporated herein by reference. | ||
| 10.34 | Promissory Note dated June 7, 2006 in favor Commercebank, N.A. | Filed as an Exhibit to the Registrant’s Current Report on Form 8-K dated June 13, 2006 and incorporated herein by reference. | ||
| 10.35 | Mortgage and Security Agreement dated June 7, 2006 in favor Commercebank, N.A. | Filed as an Exhibit to the Registrant’s Current Report on Form 8-K dated June 13, 2006 and incorporated herein by reference. | ||
| 10.46 | Amended Form of Restricted Stock Agreement pursuant to the 2005 Long-Term Incentive Compensation Plan (1) | Filed as an Exhibit to the Registrant’s Annual Report on Form 10-K for the fiscal year ended January 31, 2008 and incorporated herein by reference. | ||
| 10.53 | Form of Stock-Settled Stock Appreciation Right Agreement pursuant to the 2005 Long-Term Incentive Compensation Plan (1) | Filed as an Exhibit to the Registrant’s Quarterly Report on Form 10-Q for the quarterly period ended May 1, 2010, and incorporated herein by reference. | ||
| 10.56 | Form of Performance-Based Restricted Stock Agreement pursuant to the Second Amended and Restated 2005 Long-Term Incentive Compensation Plan (1) | Filed as an Exhibit to the Registrant’s Quarterly Report on Form 10-Q for the quarterly period ended July 30, 2011, and incorporated herein by reference. | ||
| 10.57 | Form of Restricted Stock Agreement pursuant to the Second Amended and Restated 2005 Long-Term Incentive Compensation Plan (1) | Filed as an Exhibit to the Registrant’s Quarterly Report on Form 10-Q for the quarterly period ended July 30, 2011, and incorporated herein by reference. | ||
51
Table of Contents
| 10.58 | Form of Stock-Settled Stock Appreciation Right Agreement pursuant to the Second Amended and Restated 2005 Long-Term Incentive Compensation Plan (1) | Filed as an Exhibit to the Registrant’s Quarterly Report on Form 10-Q for the quarterly period ended July 30, 2011, and incorporated herein by reference. | ||
| 10.59 | Form of Non-Qualified Stock Option Agreement pursuant to the Second Amended and Restated 2005 Long-Term Incentive Compensation Plan (1) | Filed as an Exhibit to the Registrant’s Quarterly Report on Form 10-Q for the quarterly period ended July 30, 2011, and incorporated herein by reference. | ||
| 10.60 | Amended and Restated Loan and Security Agreement dated December 2, 2011 among Perry Ellis International, Inc., the subsidiaries named as Borrowers or Guarantors therein, the Lenders named therein, Wells Fargo Bank, National Association, as agent for the Lenders, and Bank of America, N.A., as syndication agent | Filed as an Exhibit to the Registrant’s Current Report on Form 8-K dated December 2, 2011, and incorporated herein by reference. | ||
| 10.61 | Second Amended and Restated 2005 Long-Term Incentive Compensation Plan (1) | Filed as an Annex to the Registrant’s Proxy Statement for its 2011 Annual Meeting and incorporated herein by reference. | ||
| 10.62 | 2011 Management Incentive Compensation Plan (1) | Filed as an Annex to the Registrant’s Proxy Statement for its 2011 Annual Meeting and incorporated herein by reference. | ||
| 10.63 | Form of Performance-Based Units Agreement pursuant to the Second Amended and Restated 2005 Long-Term Incentive Compensation Plan (1) | Filed as an Exhibit to the Registrant’s Quarterly Report on Form 10-Q for the quarterly period ended May 4, 2013, and incorporated herein by reference. | ||
| 10.64 | Employment Agreement dated September 9, 2013 between Stanley Silverstein and the Registrant (1) | Filed as an Exhibit to the Registrant’s Quarterly Report on Form 10-Q for the quarterly period ended November 11, 2013, and incorporated herein by reference. | ||
| 10.65 | Amendment No. 1 dated January 9, 2014 to the Amended and Restated Loan and Security Agreement dated as of December 2, 2011 among Perry Ellis International, Inc., the subsidiaries named as Borrowers or Guarantors therein, the Lenders named therein, Wells Fargo Bank, National Association, as agent for the Lenders, and Bank of America, N.A., as syndication agent | Filed as an Exhibit to the Registrant’s Current Report on Form 8-K dated January 9, 2014 and incorporated herein by reference. | ||
52
Table of Contents
| 10.66 | Employment Agreement by and between Perry Ellis International, Inc. and George Feldenkreis (1) | Filed as an Exhibit to the Registrant’s Current Report on Form 8-K dated May 10, 2013 and incorporated herein by reference. | ||
| 10.67 | Employment Agreement by and between Perry Ellis International, Inc. and Oscar Feldenkreis (1) | Filed as an Exhibit to the Registrant’s Current Report on Form 8-K dated May 10, 2013 and incorporated herein by reference. | ||
| 10.1 | Form of Indemnification Agreement between the Registrant and each of the Registrant’s Directors and Officers (1) | Filed as an Exhibit to the Registrant’s Current Report on Form 8-K dated December 8, 2014 and incorporated herein by reference. | ||
| 10.68 | Amendment No. 2 to Amended and Restated Loan and Security Agreement dated as of April 22, 2015, among Perry Ellis International, Inc., the subsidiaries named as Borrowers or Guarantors therein, the Lenders named therein, and Wells Fargo Bank, National Association, as agent for the Lenders. | Filed as an Exhibit to the Registrant’s Current Report on Form 8-K dated April 27, 2016 and incorporated herein by reference. | ||
| 10.69 | Form of Performance-Based Restricted Stock Agreement pursuant to the 2015 Long-Term Incentive Compensation Plan (1) | Filed as an Exhibit to the Registrant’s Quarterly Report on Form 10-Q for the quarterly period ended August 1, 2015, and incorporated herein by reference. | ||
| 10.70 | Form of Performance Unit Agreement pursuant to the 2015 Long-Term Incentive Compensation Plan (1) | Filed as an Exhibit to the Registrant’s Quarterly Report on Form 10-Q for the quarterly period ended August 1, 2015, and incorporated herein by reference. | ||
| 10.71 | Form of Restricted Stock Agreement pursuant to the 2015 Long-Term Incentive Compensation Plan) (1) | Filed as an Exhibit to the Registrant’s Quarterly Report on Form 10-Q for the quarterly period ended August 1, 2015, and incorporated herein by reference. | ||
53
Table of Contents
| 10.72 | Form of Stock-Settled Stock Appreciation Right Agreement pursuant to the 2015 Long-Term Incentive Compensation Plan (1) | Filed as an Exhibit to the Registrant’s Quarterly Report on Form 10-Q for the quarterly period ended August 1, 2015, and incorporated herein by reference. | ||
| 10.73 | Form of Non-Qualified Stock Option Agreement pursuant to the 2015 Long-Term Incentive Compensation Plan (1) | Filed as an Exhibit to the Registrant’s Quarterly Report on Form 10-Q for the quarterly period ended August 1, 2015, and incorporated herein by reference. | ||
| 12.1 | Computation of Earnings to Fixed Charges | Filed herewith. | ||
| 21.1 | Subsidiaries of the Registrant | Filed herewith. | ||
| 23.1 | Consent of PricewaterhouseCoopers LLP, independent registered certified public accounting firm regarding financial statements and internal controls over financial reporting of the Registrant | Filed herewith. | ||
| 31.1 | Certification of Chief Executive Officer pursuant to Rule 13a-14(a) and Rule 15d-14(a), promulgated under the Securities Exchange Act of 1934, as amended | Filed herewith. | ||
| 31.2 | Certification of Chief Financial Officer pursuant to Rule 13a-14(a) and Rule 15d-14(a), promulgated under the Securities Exchange Act of 1934, as amended | Filed herewith. | ||
| 32.1 | Certification of Chief Executive Officer pursuant to 18 U.S.C. Section 1350, as adopted pursuant to Section 906 of the Sarbanes-Oxley Act of 2002 | Filed herewith. | ||
| 32.2 | Certification of Chief Financial Officer pursuant to 18 U.S.C. Section 1350, as adopted pursuant to Section 906 of the Sarbanes-Oxley Act of 2002 | Filed herewith. | ||
| 101.INS | XBRL Instance Document | Filed herewith. | ||
| 101.SCH | XBRL Taxonomy Extension Schema | Filed herewith. | ||
| 101.CAL | XBRL Taxonomy Extension Calculation Linkbase | Filed herewith. | ||
| 101.DEF | XBRL Taxonomy Extension Definition Linkbase | Filed herewith. | ||
| 101.LAB | XBRL Taxonomy Extension Label Linkbase | Filed herewith. | ||
| 101.PRE | XBRL Taxonomy Extension Presentation Linkbase | |||
| (1) | Management Contract or Compensation Plan. |
| (b) | Item 601 Exhibits |
The exhibits required by Item 601 of Regulation S-K are set forth in (a) (3) above.
| (c) | Financial Statement Schedules |
The financial statement schedules required by Regulation S-K are set forth in (a) (2) above.
54
Table of Contents
Pursuant to the requirements of Section 13 or 15(d) of the Securities Exchange Act of 1934, the Registrant has duly caused this report to be signed on its behalf by the undersigned, thereunto duly authorized.
| PERRY ELLIS INTERNATIONAL, INC. | ||||||
| Dated: April 14, 2016 | By: | /S/ GEORGE FELDENKREIS | ||||
| George Feldenkreis | ||||||
| Chairman of the Board and Chief Executive Officer | ||||||
Pursuant to the requirements of the Securities Exchange Act of 1934, this report has been signed below by the following persons on behalf of the Registrant and in the capacities and on the dates indicated.
| Name and Signature |
Title |
Date | ||
| /S/ GEORGE FELDENKREIS George Feldenkreis |
Chairman of the Board and Chief Executive Officer (Principal Executive Officer) |
April 14, 2016 | ||
| /S/ OSCAR FELDENKREIS Oscar Feldenkreis |
Vice Chairman of the Board, President, Chief Operating Officer and Director |
April 14, 2016 | ||
| /S/ ANITA BRITT Anita Britt |
Chief Financial Officer (Principal Financial and Accounting Officer) |
April 14, 2016 | ||
| /S/ JOE ARRIOLA Joe Arriola |
Director | April 14, 2016 | ||
| /S/ JANE DEFLORIO Jane DeFlorio |
Director | April 14, 2016 | ||
| /s/ Bruce J. Klatsky Bruce J. Klatsky |
Director | April 14, 2016 | ||
| /s/ Michael W. Rayden Michael W. Rayden |
Director | April 14, 2016 | ||
| /S/ J. DAVID SCHEINER J. David Scheiner |
Director | April 14, 2016 | ||
| /S/ ALEXANDRA WILSON Alexandra Wilson |
Director | April 14, 2016 | ||
55
Table of Contents
PERRY ELLIS INTERNATIONAL, INC. AND SUBSIDIARIES
| F-2 | ||||
| F-3 | ||||
| F-4 | ||||
| F-5 | ||||
| F-6 | ||||
| F-7 | ||||
| F-9 | ||||
| F-50 | ||||
F-1
Table of Contents
Report of Independent Registered Certified Public Accounting Firm
To the Board of Directors and Stockholders
of Perry Ellis International, Inc.:
In our opinion, the accompanying consolidated balance sheets and the related consolidated statements of operations, of comprehensive loss, of changes in stockholders’ equity and of cash flows present fairly, in all material respects, the financial position of Perry Ellis International, Inc. and its subsidiaries at January 30, 2016 and January 31, 2015, and the results of their operations and their cash flows for each of the three years in the period ended January 30, 2016 in conformity with accounting principles generally accepted in the United States of America. In addition, in our opinion, the financial statement schedule listed in the index appearing under Item 15(a)(2) for the three years ended January 30, 2016 presents fairly, in all material respects, the information set forth therein when read in conjunction with the related consolidated financial statements. Also in our opinion, the Company maintained, in all material respects, effective internal control over financial reporting as of January 30, 2016, based on criteria established in Internal Control - Integrated Framework - 2013 issued by the Committee of Sponsoring Organizations of the Treadway Commission (COSO). The Company’s management is responsible for these financial statements and financial statement schedule, for maintaining effective internal control over financial reporting and for its assessment of the effectiveness of internal control over financial reporting, included in Management’s Report on Internal Control over Financial Reporting appearing under item 9A. Our responsibility is to express opinions on these financial statements and on the Company’s internal control over financial reporting based on our integrated audits. We conducted our audits in accordance with the standards of the Public Company Accounting Oversight Board (United States). Those standards require that we plan and perform the audits to obtain reasonable assurance about whether the financial statements are free of material misstatement and whether effective internal control over financial reporting was maintained in all material respects. Our audits of the financial statements included examining, on a test basis, evidence supporting the amounts and disclosures in the financial statements, assessing the accounting principles used and significant estimates made by management, and evaluating the overall financial statement presentation. Our audit of internal control over financial reporting included obtaining an understanding of internal control over financial reporting, assessing the risk that a material weakness exists, and testing and evaluating the design and operating effectiveness of internal control based on the assessed risk. Our audits also included performing such other procedures as we considered necessary in the circumstances. We believe that our audits provide a reasonable basis for our opinions.
A company’s internal control over financial reporting is a process designed to provide reasonable assurance regarding the reliability of financial reporting and the preparation of financial statements for external purposes in accordance with generally accepted accounting principles. A company’s internal control over financial reporting includes those policies and procedures that (i) pertain to the maintenance of records that, in reasonable detail, accurately and fairly reflect the transactions and dispositions of the assets of the company; (ii) provide reasonable assurance that transactions are recorded as necessary to permit preparation of financial statements in accordance with generally accepted accounting principles, and that receipts and expenditures of the company are being made only in accordance with authorizations of management and directors of the company; and (iii) provide reasonable assurance regarding prevention or timely detection of unauthorized acquisition, use, or disposition of the company’s assets that could have a material effect on the financial statements.
Because of its inherent limitations, internal control over financial reporting may not prevent or detect misstatements. Also, projections of any evaluation of effectiveness to future periods are subject to the risk that controls may become inadequate because of changes in conditions, or that the degree of compliance with the policies or procedures may deteriorate.
/s/ PricewaterhouseCoopers LLP
Miami, Florida
April 14, 2016
F-2
Table of Contents
PERRY ELLIS INTERNATIONAL, INC. AND SUBSIDIARIES
CONSOLIDATED BALANCE SHEETS
(amounts in thousands, except share data)
| January 30, | January 31, | |||||||
| 2016 | 2015 | |||||||
| ASSETS |
||||||||
| Current Assets: |
||||||||
| Cash and cash equivalents |
$ | 31,902 | $ | 43,547 | ||||
| Accounts receivable, net |
132,066 | 137,432 | ||||||
| Inventories |
182,750 | 183,734 | ||||||
| Investments, at fair value |
9,782 | 19,996 | ||||||
| Deferred income taxes |
— | 725 | ||||||
| Prepaid income taxes |
1,818 | 6,384 | ||||||
| Prepaid expenses and other current assets |
8,461 | 7,124 | ||||||
|
|
|
|
|
|||||
| Total current assets |
366,779 | 398,942 | ||||||
|
|
|
|
|
|||||
| Property and equipment, net |
63,908 | 64,633 | ||||||
| Other intangible assets, net |
187,919 | 210,201 | ||||||
| Goodwill |
— | 6,022 | ||||||
| Deferred income tax |
442 | — | ||||||
| Other assets |
3,399 | 5,191 | ||||||
|
|
|
|
|
|||||
| TOTAL |
$ | 622,447 | $ | 684,989 | ||||
|
|
|
|
|
|||||
| LIABILITIES AND EQUITY |
||||||||
| Current Liabilities: |
||||||||
| Accounts payable |
$ | 103,684 | $ | 117,789 | ||||
| Accrued expenses and other liabilities |
26,497 | 22,355 | ||||||
| Accrued interest payable |
1,521 | 4,045 | ||||||
| Unearned revenues |
4,213 | 4,856 | ||||||
| Deferred pension obligation |
12,107 | 8,930 | ||||||
| Deferred income taxes |
— | 797 | ||||||
|
|
|
|
|
|||||
| Total current liabilities |
148,022 | 158,772 | ||||||
|
|
|
|
|
|||||
| Senior subordinated notes payable, net |
50,000 | 150,000 | ||||||
| Senior credit facility |
61,758 | — | ||||||
| Real estate mortgages |
21,318 | 22,109 | ||||||
| Unearned revenues and other long-term liabilities |
14,853 | 15,009 | ||||||
| Deferred income taxes |
35,015 | 37,082 | ||||||
|
|
|
|
|
|||||
| Total long-term liabilities |
182,944 | 224,200 | ||||||
|
|
|
|
|
|||||
| Total liabilities |
330,966 | 382,972 | ||||||
|
|
|
|
|
|||||
| Commitment and contingencies |
||||||||
| Equity: |
||||||||
| Preferred stock $.01 par value; 5,000,000 shares authorized; no shares issued or outstanding |
— | — | ||||||
| Common stock $.01 par value; 100,000,000 shares authorized; 15,409,310 shares issued and outstanding as of January 30, 2016 and 16,128,775 shares issued and outstanding as of January 31, 2015 and |
154 | 161 | ||||||
| Additional paid-in-capital |
144,025 | 161,336 | ||||||
| Retained earnings |
161,810 | 169,102 | ||||||
| Accumulated other comprehensive loss |
(14,508 | ) | (12,852 | ) | ||||
|
|
|
|
|
|||||
| Total |
291,481 | 317,747 | ||||||
| Treasury stock at cost; no shares as of January 30, 2016 and 770,753 shares as of January 31, 2015 |
— | (15,730 | ) | |||||
|
|
|
|
|
|||||
| Total equity |
291,481 | 302,017 | ||||||
|
|
|
|
|
|||||
| TOTAL |
$ | 622,447 | $ | 684,989 | ||||
|
|
|
|
|
|||||
See footnotes to consolidated financial statements
F-3
Table of Contents
PERRY ELLIS INTERNATIONAL, INC. AND SUBSIDIARIES
CONSOLIDATED STATEMENTS OF OPERATIONS
FOR THE YEARS ENDED
(amounts in thousands, except per share data)
| January 30, | January 31, | February 1, | ||||||||||
| 2016 | 2015 | 2014 | ||||||||||
| Revenues: |
||||||||||||
| Net sales |
$ | 864,806 | $ | 858,237 | $ | 882,573 | ||||||
| Royalty income |
34,709 | 31,735 | 29,651 | |||||||||
|
|
|
|
|
|
|
|||||||
| Total revenues |
899,515 | 889,972 | 912,224 | |||||||||
| Cost of sales |
580,448 | 586,968 | 609,436 | |||||||||
|
|
|
|
|
|
|
|||||||
| Gross profit |
319,067 | 303,004 | 302,788 | |||||||||
| Operating expenses: |
||||||||||||
| Selling, general and administrative expenses |
275,863 | 268,783 | 272,716 | |||||||||
| Depreciation and amortization |
13,693 | 12,198 | 12,626 | |||||||||
| Impairment on assets |
20,604 | — | 35,205 | |||||||||
| Impairment on goodwill |
6,022 | — | 7,772 | |||||||||
|
|
|
|
|
|
|
|||||||
| Total operating expenses |
316,182 | 280,981 | 328,319 | |||||||||
|
|
|
|
|
|
|
|||||||
| Gain on sale of long-lived assets |
3,779 | 885 | 6,162 | |||||||||
|
|
|
|
|
|
|
|||||||
| Operating income (loss) |
6,664 | 22,908 | (19,369 | ) | ||||||||
| Costs on early extinguishment of debt |
5,121 | — | — | |||||||||
| Interest expense |
9,267 | 14,291 | 15,025 | |||||||||
|
|
|
|
|
|
|
|||||||
| Net (loss) income before income taxes |
(7,724 | ) | 8,617 | (34,394 | ) | |||||||
| Income tax (benefit) provision |
(432 | ) | 45,792 | (11,615 | ) | |||||||
|
|
|
|
|
|
|
|||||||
| Net loss |
$ | (7,292 | ) | $ | (37,175 | ) | $ | (22,779 | ) | |||
|
|
|
|
|
|
|
|||||||
| Net loss per share: |
||||||||||||
| Basic |
$ | (0.49 | ) | $ | (2.50 | ) | $ | (1.52 | ) | |||
|
|
|
|
|
|
|
|||||||
| Diluted |
$ | (0.49 | ) | $ | (2.50 | ) | $ | (1.52 | ) | |||
|
|
|
|
|
|
|
|||||||
| Weighted average number of shares outstanding |
||||||||||||
| Basic |
14,968 | 14,856 | 14,988 | |||||||||
| Diluted |
14,968 | 14,856 | 14,988 | |||||||||
See footnotes to consolidated financial statements
F-4
Table of Contents
PERRY ELLIS INTERNATIONAL, INC. AND SUBSIDIARIES
CONSOLIDATED STATEMENTS OF COMPREHENSIVE LOSS
FOR THE YEARS ENDED
(amounts in thousands)
| January 30, | January 31, | February 1, | ||||||||||
| 2016 | 2015 | 2014 | ||||||||||
| Net loss |
$ | (7,292 | ) | $ | (37,175 | ) | $ | (22,779 | ) | |||
|
|
|
|
|
|
|
|||||||
| Other comprehensive (loss) income: |
||||||||||||
| Foreign currency translation adjustments, net |
(2,357 | ) | (3,211 | ) | (679 | ) | ||||||
| Unrealized gain (loss) on pension liability, net of tax (1) |
717 | (2,219 | ) | 1,310 | ||||||||
| Unrealized (loss) gain on investments |
(16 | ) | 46 | (39 | ) | |||||||
|
|
|
|
|
|
|
|||||||
| Total other comprehensive (loss) income |
(1,656 | ) | (5,384 | ) | 592 | |||||||
|
|
|
|
|
|
|
|||||||
| Comprehensive loss |
$ | (8,948 | ) | $ | (42,559 | ) | $ | (22,187 | ) | |||
|
|
|
|
|
|
|
|||||||
| (1) | Unrealized gain (loss) on pension liability for the twelve months ended January 30, 2016, January 31, 2015 and February 1, 2014 is net of tax provision in the amount of $0, $0 and $831. See footnote 20 to the consolidated financial statements for further information. |
See footnotes to consolidated financial statements
F-5
Table of Contents
PERRY ELLIS INTERNATIONAL, INC. AND SUBSIDIARIES
CONSOLIDATED STATEMENTS OF CHANGES IN STOCKHOLDERS’ EQUITY
FOR THE YEARS ENDED JANUARY 30, 2016, JANUARY 31, 2015 AND FEBRUARY 1, 2014
(amounts in thousands, except share data)
| ACCUMULATED | ||||||||||||||||||||||||||||
| OTHER | ||||||||||||||||||||||||||||
| ADDITIONAL | COMPREHENSIVE | |||||||||||||||||||||||||||
| COMMON STOCK | PAID-IN | TREASURY | (LOSS) | RETAINED | ||||||||||||||||||||||||
| SHARES | AMOUNT | CAPITAL | STOCK | INCOME | EARNINGS | TOTAL | ||||||||||||||||||||||
| BALANCE, FEBRUARY 2, 2013 |
15,326,658 | $ | 153 | $ | 150,091 | $ | — | $ | (8,060 | ) | $ | 229,056 | $ | 371,240 | ||||||||||||||
| Exercise of stock options |
33,230 | — | 154 | — | — | — | 154 | |||||||||||||||||||||
| Tax benefit of restricted shares and non-qualified stock options |
— | — | (1 | ) | — | — | — | (1 | ) | |||||||||||||||||||
| Restricted shares and options issued as compensation |
542,068 | 6 | 5,278 | — | — | — | 5,284 | |||||||||||||||||||||
| Net loss |
— | — | — | — | — | (22,779 | ) | (22,779 | ) | |||||||||||||||||||
| Purchase of treasury stock |
— | — | — | (6,957 | ) | — | — | (6,957 | ) | |||||||||||||||||||
| Other comprehensive income |
— | — | — | — | 592 | — | 592 | |||||||||||||||||||||
|
|
|
|
|
|
|
|
|
|
|
|
|
|
|
|||||||||||||||
| BALANCE, FEBRUARY 1, 2014 |
15,901,956 | 159 | 155,522 | (6,957 | ) | (7,468 | ) | 206,277 | 347,533 | |||||||||||||||||||
| Exercise of stock options |
36,043 | — | 404 | — | — | — | 404 | |||||||||||||||||||||
| Tax benefit of restricted shares and non-qualified stock options |
— | — | (272 | ) | — | — | — | (272 | ) | |||||||||||||||||||
| Restricted shares and options issued as compensation |
212,585 | 2 | 6,033 | — | — | — | 6,035 | |||||||||||||||||||||
| Restricted shares withheld for income taxes |
(21,809 | ) | — | (351 | ) | — | — | — | (351 | ) | ||||||||||||||||||
| Net loss |
— | — | — | — | — | (37,175 | ) | (37,175 | ) | |||||||||||||||||||
| Purchase of treasury stock |
— | — | — | (8,773 | ) | — | — | (8,773 | ) | |||||||||||||||||||
| Other comprehensive loss |
— | — | — | — | (5,384 | ) | — | (5,384 | ) | |||||||||||||||||||
|
|
|
|
|
|
|
|
|
|
|
|
|
|
|
|||||||||||||||
| BALANCE, JANUARY 31, 2015 |
16,128,775 | 161 | 161,336 | (15,730 | ) | (12,852 | ) | 169,102 | 302,017 | |||||||||||||||||||
| Exercise of stock options |
314,036 | 3 | 1,405 | — | — | — | 1,408 | |||||||||||||||||||||
| Restricted shares withheld for income taxes |
(27,325 | ) | — | (664 | ) | — | — | — | (664 | ) | ||||||||||||||||||
| Net settlement of stock appreciation rights for taxes |
— | — | (578 | ) | — | — | — | (578 | ) | |||||||||||||||||||
| Restricted shares and options issued as compensation |
137,674 | 1 | 5,195 | — | — | — | 5,196 | |||||||||||||||||||||
| Net loss |
— | — | — | — | — | (7,292 | ) | (7,292 | ) | |||||||||||||||||||
| Purchase of treasury stock |
— | — | — | (6,950 | ) | — | — | (6,950 | ) | |||||||||||||||||||
| Other comprehensive loss |
— | — | — | — | (1,656 | ) | — | (1,656 | ) | |||||||||||||||||||
| Retirement of treasury stock |
(1,143,850 | ) | (11 | ) | (22,669 | ) | 22,680 | — | — | — | ||||||||||||||||||
|
|
|
|
|
|
|
|
|
|
|
|
|
|
|
|||||||||||||||
| BALANCE, JANUARY 30, 2016 |
15,409,310 | $ | 154 | $ | 144,025 | $ | — | $ | (14,508 | ) | $ | 161,810 | $ | 291,481 | ||||||||||||||
|
|
|
|
|
|
|
|
|
|
|
|
|
|
|
|||||||||||||||
See footnotes to consolidated financial statements
F-6
Table of Contents
PERRY ELLIS INTERNATIONAL, INC. AND SUBSIDIARIES
CONSOLIDATED STATEMENTS OF CASH FLOWS
FOR THE YEARS ENDED
(amounts in thousands)
| January 30, | January 31, | February 1, | ||||||||||
| 2016 | 2015 | 2014 | ||||||||||
| CASH FLOWS FROM OPERATING ACTIVITIES: |
||||||||||||
| Net loss |
$ | (7,292 | ) | $ | (37,175 | ) | $ | (22,779 | ) | |||
| Adjustments to reconcile net loss to net cash provided by operating activities: |
||||||||||||
| Depreciation and amortization |
14,318 | 12,933 | 13,211 | |||||||||
| Provision for bad debts |
528 | 812 | (98 | ) | ||||||||
| Impairment on assets |
20,604 | — | 35,205 | |||||||||
| Impairment on good will |
6,022 | — | 7,772 | |||||||||
| Amortization of debt issue costs |
472 | 645 | 705 | |||||||||
| Amortization of premiums and discounts |
143 | 413 | 113 | |||||||||
| Amortization of unrealized (gain) loss on pension liability |
538 | 399 | 534 | |||||||||
| Pension settlement charge |
4,427 | — | — | |||||||||
| Costs on early extinguishment of debt |
1,158 | — | — | |||||||||
| Deferred income taxes |
(2,581 | ) | 43,730 | (14,875 | ) | |||||||
| Gain on sale of long-lived assets, net |
(3,779 | ) | (885 | ) | (6,162 | ) | ||||||
| Share-based compensation |
5,196 | 6,035 | 5,284 | |||||||||
| Changes in operating assets and liabilities, net of acquisitions |
||||||||||||
| Accounts receivable, net |
3,078 | 6,459 | 28,049 | |||||||||
| Inventories |
(1,193 | ) | 20,116 | (23,925 | ) | |||||||
| Prepaid income taxes |
4,592 | 1,090 | (270 | ) | ||||||||
| Prepaid expenses and other current assets |
(1,399 | ) | 167 | 1,099 | ||||||||
| Other assets |
487 | (408 | ) | (244 | ) | |||||||
| Accounts payable and accrued expenses |
(10,342 | ) | 4,202 | (20,780 | ) | |||||||
| Accrued interest payable |
(2,524 | ) | (50 | ) | 34 | |||||||
| Unearned revenues and other liabilities |
(1,219 | ) | 210 | 564 | ||||||||
| Deferred pension obligation |
(1,069 | ) | (3,550 | ) | (3,217 | ) | ||||||
|
|
|
|
|
|
|
|||||||
| Net cash provided by operating activities |
30,165 | 55,143 | 220 | |||||||||
|
|
|
|
|
|
|
|||||||
| CASH FLOWS FROM INVESTING ACTIVITIES: |
||||||||||||
| Purchase of property and equipment |
(16,150 | ) | (16,733 | ) | (22,243 | ) | ||||||
| Purchase of investments |
(12,086 | ) | (31,501 | ) | (15,437 | ) | ||||||
| Proceeds from investments maturities |
22,197 | 26,592 | — | |||||||||
| Proceeds on sale of intangible asset |
2,500 | — | 4,875 | |||||||||
| Proceeds from sale of building |
8,163 | — | — | |||||||||
| Payment of expenses related to sale of building |
(1,887 | ) | — | — | ||||||||
| Proceeds on termination of life insurance |
— | 245 | 3,559 | |||||||||
| Proceeds from note receivable |
250 | 250 | — | |||||||||
| Proceeds on sale of long-lived assets, net |
— | — | 1,892 | |||||||||
|
|
|
|
|
|
|
|||||||
| Net cash provided by (used in) investing activities |
2,987 | (21,147 | ) | (27,354 | ) | |||||||
|
|
|
|
|
|
|
|||||||
| CASH FLOWS FROM FINANCING ACTIVITIES: |
||||||||||||
| Borrowings from senior credit facility |
408,209 | 234,137 | 415,885 | |||||||||
| Payments on senior credit facility |
(346,451 | ) | (242,299 | ) | (407,723 | ) | ||||||
| Payments on senior subordinated notes |
(100,000 | ) | — | — | ||||||||
| Purchase of treasury stock |
(6,950 | ) | (8,773 | ) | (6,957 | ) | ||||||
| Payments on real estate mortgages |
(821 | ) | (792 | ) | (1,385 | ) | ||||||
| Payments on capital leases |
(262 | ) | (301 | ) | (318 | ) | ||||||
| Deferred financing fees |
(574 | ) | — | (327 | ) | |||||||
| Proceeds from exercise of stock options |
1,408 | 404 | 154 | |||||||||
| Tax benefit from exercise of equity instruments |
— | (161 | ) | 83 | ||||||||
|
|
|
|
|
|
|
|||||||
| Net cash used in financing activities |
(45,441 | ) | (17,785 | ) | (588 | ) | ||||||
|
|
|
|
|
|
|
|||||||
| Effect of exchange rate changes on cash and cash equivalents |
644 | 347 | (246 | ) | ||||||||
|
|
|
|
|
|
|
|||||||
| NET (DECREASE) INCREASE IN CASH AND CASH EQUIVALENTS |
(11,645 | ) | 16,558 | (27,968 | ) | |||||||
| CASH AND CASH EQUIVALENTS AT BEGINNING OF YEAR |
43,547 | 26,989 | 54,957 | |||||||||
|
|
|
|
|
|
|
|||||||
| CASH AND CASH EQUIVALENTS AT END OF YEAR |
$ | 31,902 | $ | 43,547 | $ | 26,989 | ||||||
|
|
|
|
|
|
|
|||||||
Continued
F-7
Table of Contents
PERRY ELLIS INTERNATIONAL, INC. AND SUBSIDIARIES
CONSOLIDATED STATEMENTS OF CASH FLOWS
FOR THE YEARS ENDED
(amounts in thousands)
| January 30, | January 31, | February 1, | ||||||||||
| 2016 | 2015 | 2014 | ||||||||||
| SUPPLEMENTAL DISCLOSURE OF CASH FLOW INFORMATION: |
||||||||||||
| Cash paid during the period for: |
||||||||||||
| Interest |
$ | 11,176 | $ | 13,283 | $ | 14,173 | ||||||
|
|
|
|
|
|
|
|||||||
| Income taxes |
$ | 718 | $ | 662 | $ | 1,608 | ||||||
|
|
|
|
|
|
|
|||||||
| NON-CASH FINANCING AND INVESTING ACTIVITIES: |
||||||||||||
| Capital lease financing |
$ | 810 | $ | — | $ | — | ||||||
|
|
|
|
|
|
|
|||||||
| Accrued purchases of property and equipment |
$ | 210 | $ | 185 | $ | 3 | ||||||
|
|
|
|
|
|
|
|||||||
| Unrealized gain (loss) on pension liability included in comprehensive loss |
$ | 717 | $ | (2,219 | ) | $ | 1,310 | |||||
|
|
|
|
|
|
|
|||||||
See footnotes to consolidated financial statements
F-8
Table of Contents
PERRY ELLIS INTERNATIONAL, INC. AND SUBSIDIARIES
FOOTNOTES TO CONSOLIDATED FINANCIAL STATEMENTS
| 1. | General |
Perry Ellis International, Inc. and Subsidiaries (the “Company”) is one of the leading apparel companies in the United States and manages a portfolio of major brands, some of which were established over 100 years ago. The Company designs, sources, markets and licenses products nationally and internationally at multiple price points and across all major levels of retail distribution. The Company’s portfolio of highly recognized brands includes: the global designer lifestyle brands, Perry Ellis® and Original Penguin ® by Munsingwear ® (“Original Penguin”) as well as Ben Hogan ®, Cubavera ®, Farah ®, Grand Slam ®, Jantzen ®, Laundry by Shelli Segal ®, Rafaella ® and Savane ®. We license the Callaway Golf® brand, PGA TOUR® brand, and the Jack Nicklaus® brand for golf apparel, the Jag® brand for swimwear and cover-ups and the Nike® brand for swimwear and accessories.
The periods presented in these financial statements are the fiscal years ended January 30, 2016 (“fiscal 2016”), January 31, 2015 (“fiscal 2015”) and February 1, 2014 (“fiscal 2014”).
| 2. | Summary of Significant Accounting Policies |
The following is a summary of the Company’s significant accounting policies:
PRINCIPLES OF CONSOLIDATION - The consolidated financial statements include the accounts of Perry Ellis International, Inc. and its wholly-owned and controlled subsidiaries. All intercompany transactions and balances have been eliminated in consolidation. The Company consolidates any entity in which the Company would be deemed a primary beneficiary.
USE OF ESTIMATES - The preparation of financial statements in conformity with accounting principles generally accepted in the United States of America requires management to make estimates and assumptions that affect the amounts in the consolidated financial statements and the accompanying footnotes. Actual results could differ from those estimates.
CASH AND CASH EQUIVALENTS - Cash and cash equivalents include cash, deposits and liquid short-term investments that have a maturity of three months or less when purchased.
INVESTMENTS - The Company’s investments include certificates of deposit for the fiscal years ended January 30, 2016 and January 31, 2015. The Company’s investments also included marketable securities for the fiscal year ended January 31, 2015. All investments are classified as available-for-sale. Investments are stated at fair value. The estimated fair value of the marketable securities is based on quoted prices in an active market. Gains and losses on investment transactions are determined using the specific identification method and are recognized in income based on trade dates. Unrealized gains and losses on securities available-for-sale are included in accumulated other comprehensive income until realized. Management evaluates securities held with unrealized losses for other-than-temporary impairment at least on a quarterly basis. Consideration is given to (a) the length of time and the extent to which the fair value has been less than cost; (b) the financial condition and near-term prospects of the issuer; and (c) the intent and ability of the Company to retain its investment in the issuer for a period of time sufficient to allow for any anticipated recovery in fair value.
INVENTORIES - Inventories are stated at the lower of cost (weighted moving average cost) or market. Cost principally consists of the purchase price (adjusted for lower of cost or market), customs, duties, freight, and commissions to buying agents.
PROPERTY AND EQUIPMENT - Property and equipment are stated at cost. Depreciation is computed using the straight-line method over the estimated useful lives of the assets. Amortization of leasehold improvements and capital leases is computed using the straight-line method over the shorter of the lease term or estimated useful lives of the assets or improvements. The useful lives are as follows:
| Asset Class |
Average Useful Lives in Years | |
| Furniture, fixtures and equipment |
3-10 | |
| Vehicles |
5-7 | |
| Leasehold improvements |
4-15 | |
| Buildings and building improvements |
10-39 |
F-9
Table of Contents
INTANGIBLE ASSETS AND GOODWILL - Intangible assets were comprised of trademarks, goodwill and customer lists. The trademarks and goodwill were identified as intangible assets with indefinite useful lives, and accordingly, are not being amortized. The Company assesses the carrying value of intangible assets and goodwill at least annually. Customer lists were identified as intangible assets with finite useful lives and are amortized using a method of amortization that reflects the pattern in which the economic benefits of the intangible assets are consumed or otherwise realized.
FAIR VALUE MEASUREMENTS - A description of the Company’s policies regarding fair value measurement is summarized below.
The Company has chosen not to elect the fair value measurement option for any instruments not required to be measured at fair value on a recurring basis.
Fair Value Hierarchy - The fair value hierarchy requires disclosure about how fair value is determined for assets and liabilities and establishes a hierarchy for which these assets and liabilities must be grouped, based on significant levels of observable or unobservable inputs. Observable inputs reflect market data obtained from independent sources, while unobservable inputs reflect the Company’s market assumptions. This hierarchy requires the use of observable market data when available. These two types of inputs have created the following fair-value hierarchy:
| • | Level 1 – Quoted prices for identical instruments in active markets. |
| • | Level 2 – Quoted prices for similar instruments in active markets; quoted prices for identical or similar instruments in markets that are not active; and model-derived valuations in which all significant inputs and significant value drivers are observable in active markets. |
| • | Level 3 – Valuations derived from valuation techniques in which one or more significant inputs or significant value drivers are unobservable. |
Determination of Fair Value - The Company generally uses quoted market prices (unadjusted) in active markets for identical assets or liabilities for which the Company has the ability to determine fair value, and classifies such items in Level 1. Fair values determined by Level 2 inputs utilize inputs other than quoted market prices included in Level 1 that are observable for the asset or liability, either directly or indirectly. Level 2 inputs include quoted market prices in active markets for similar assets or liabilities, and inputs other than quoted market prices that are observable for the asset or liability. Level 3 inputs are unobservable inputs for the asset or liability, and include situations where there is little, if any, market activity for the asset or liability.
If quoted market prices are not available, fair value is based upon internally developed valuation techniques that use, where possible, current market-based or independently sourced market parameters, such as interest rates, currency rates, etc. Assets or liabilities valued using such internally generated valuation techniques are classified according to the lowest level input or value driver that is significant to the valuation. Thus, an item may be classified in Level 3 even though there may be some significant inputs that are readily observable.
DERIVATIVES - Derivative financial instruments such as interest rate swap contracts and foreign exchange contracts are recognized in the financial statements and measured at fair value regardless of the purpose or intent for holding them. Changes in the fair value of derivative financial instruments are either recognized in income or stockholders’ equity (as a component of comprehensive income), depending on whether or not the derivative is designated as a hedge of changes in fair value or cash flows. When designated as a hedge of changes in fair value, the effective portion of the hedge is recognized as an offset in income with a corresponding adjustment to the hedged item. When designated as a hedge of changes in cash flows, the effective portion of the hedge is recognized as an offset in comprehensive income with a corresponding adjustment to the hedged item and recognized in income in the same period as the hedged item is settled.
F-10
Table of Contents
LEASES - Leases are evaluated and classified as either operating or capital leases for financial reporting purposes. Capital leases, which transfer substantially all of the risks and benefits incidental to ownership of the leased item, are capitalized at the inception of the lease at the fair value of the leased property or, if lower, at the present value of the minimum lease payments. Lease payments are apportioned between the finance charges and reduction of the lease liability so as to achieve a constant rate of interest on the remaining balance of the liability. Finance charges are charged directly against income as a component of interest expense. Capitalized leased assets are depreciated over the shorter of the estimated useful life of the asset or the lease term. Operating lease payments, other than contingent rentals, are recognized as an expense in the income statement on a straight-line basis over the lease term, whereby an equal amount of rent expense is attributed to each period during the term of the lease, regardless of when actual payments are made. This generally results in rent expense in excess of cash payments during the early years of a lease and rent expense less than cash payments in the later years. The difference between rent expense recognized and actual rental payments is recorded as deferred rent and included in liabilities. Percentage rent expense is generally based on sales levels and is accrued when determined that it is probable that such sales levels will be achieved.
DEFERRED DEBT ISSUE COSTS - Costs incurred in connection with financing transactions have been capitalized and are being amortized on a straight-line basis, which approximates the interest method, over the term of the related debt instrument. Unamortized debt issue costs are included in other assets in the consolidated balance sheet.
LONG-LIVED ASSETS - Property and equipment, along with other long-lived assets, are evaluated for impairment periodically whenever events or changes in circumstances indicate that their related carrying amounts may not be recoverable. In evaluating long-lived assets for recoverability, the Company uses its best estimate of future cash flows expected to result from the use of the asset and its eventual disposition. To the extent that estimated future undiscounted net cash flows attributable to the asset are less than the carrying amount, an impairment loss is recognized equal to the difference between the carrying value of such asset and its fair value. Fair value is estimated based on the future expected discounted cash flows for the assets. Judgments regarding the existence of impairment indicators are based on market and operational performance. Preparation of estimated expected future cash flows is inherently subjective and is based on management’s best estimate of assumptions concerning future conditions.
The Company recorded a $2.4 million and $0.9 million impairment charge, in fiscal 2016 and fiscal 2014, respectively, to reduce the net carrying value of certain long-lived assets (primarily real property and leaseholds) to their estimated fair value, considered a level 3 fair value measure. There was no such impairment charge for fiscal 2015. Impairment charges are included in impairment on assets in the accompanying consolidated statements of operations and were related to the Direct-to Consumer segment.
RETIREMENT-RELATED BENEFITS - The Company accounts for its defined benefit pension plan using actuarial models. These models use an attribution approach that generally spreads the individual events over the service lives of the employees in the plan. The principle underlying the required attribution approach is that employees render service over their service lives on a relatively consistent basis and therefore, the income statement effects of pensions or non-pension postretirement benefit plans are earned in, and should follow, the same pattern.
The principal components of the net periodic pension calculations are the expected long-term rate of return on plan assets, discount rate and the rate of compensation increases. The Company uses long-term historical actual return information, the mix of investments that comprise plan assets, and future estimates of long-term investment returns by reference to external sources to develop its expected return on plan assets. The discount rate assumptions used for pension and non-pension postretirement benefit plan accounting reflects the rates available on high-quality fixed income debt instruments at the Company’s fiscal year end.
ADVERTISING AND RELATED COSTS - The Company’s accounting policy relating to advertising and related costs is to expense these costs in the period incurred. Advertising and related costs were $15.1 million, $15.2 million and $16.4 million for the years ended January 30, 2016, January 31, 2015 and February 1, 2014, respectively, and are included in selling, general and administrative expenses.
COST OF SALES - Cost of sales includes costs to acquire and source inventory, produce inventory for sale, and provisions for inventory shrinkage and obsolescence. These costs include costs of purchased products, inbound freight, custom duties, buying commissions, cargo insurance, customs inspection and licensed product royalty expenses.
F-11
Table of Contents
SELLING, GENERAL AND ADMINISTRATIVE EXPENSES - Selling expenses include costs incurred in the selling of merchandise. General and administrative expenses include costs incurred in the administration or general operations of the business. Selling, general and administrative expenses include employee and related costs, advertising, professional fees, distribution, warehouse costs, and other related selling costs.
TREASURY STOCK - Treasury stock is recorded at acquisition cost. Gains and losses on disposition are recorded as increases or decreases to additional paid-in capital with losses in excess of previously recorded gains charged directly to retained earnings. The carrying amount in excess of par is allocated to additional paid-in capital when treasury shares are retired.
REVENUE RECOGNITION - Sales are recognized at the time title transfers to the customer, generally upon shipment. Trade allowances and a provision for estimated returns and other allowances are recorded at the time sales are made, considering historical and anticipated trends. The Company records revenues net of corresponding sales taxes. Retail store revenue is recognized net of estimated returns and corresponding sales tax at the time of sale to consumers. The Company operates predominantly in North America, with 90% of its sales in that market. Three customers accounted for approximately 12%, 11% and 10%, respectively, of net sales for fiscal 2016. Four customers accounted for approximately 14%, 10%, 10% and 10%, respectively, of net sales for fiscal 2015. Two customers accounted for approximately 11% and 10%, respectively, of net sales for fiscal 2014. Sales to these customers are included in the Men’s Sportswear and Swim, as well as, the Women’s Sportswear segments. A significant decrease in business from or loss of any of the major customers could harm the financial condition of the Company by causing a significant decline in revenues attributable to such customers. The Company does not believe that concentrations of credit risk represent a material risk of loss with respect to its financial position as of January 30, 2016.
Royalty income is recognized when earned on the basis of the terms specified in the underlying contractual agreements. A liability for unearned royalty income is recognized when licensees pay contractual obligations before being earned or when up-front fees are collected. This liability is recognized as royalty income over the applicable term of the respective license agreement.
ADVERTISING REIMBURSEMENTS - The majority of the Company’s license agreements require licensees to reimburse the Company for advertising placed on behalf of the licensees based on a percentage of the licensees’ net sales. The Company records earned advertising reimbursements received from its licensees as a reduction of the related advertising costs in selling, general and administrative expenses. For the fiscal years 2016, 2015 and 2014, the Company has reduced selling, general and administrative expenses by $6.6 million, $6.8 million and $5.9 million of licensee reimbursements, respectively. Unearned advertising reimbursements result when a licensee pays required reimbursements prior to the Company incurring the advertising expense. A liability is recorded for these unearned advertising reimbursements.
FOREIGN CURRENCY TRANSLATION - For the Company’s international operations, local currencies are generally considered their functional currencies. The Company translates assets and liabilities to their U.S. dollar equivalents at rates in effect at the balance sheet date and revenue and expenses are translated at average monthly exchange rates. Translation adjustments resulting from this process are recorded in stockholders’ equity as a component of accumulated other comprehensive (loss) income. Transactions in foreign currencies during the year are re-measured at rates of exchange at the date of the transaction. Gains and losses related to re-measurement of items arising through operating activities are included in the accompanying consolidated statements of operations.
INCOME TAXES - Deferred income taxes result primarily from timing differences in the recognition of expenses for tax and financial reporting purposes, which requires the liability method of computing deferred income taxes. Under the liability method, deferred taxes are adjusted for tax rate changes as they occur.
The Company records net deferred tax assets to the extent it believes these assets will more likely than not be realized. In the event that a net deferred tax asset is not realizable, a valuation allowance would be recorded. In making such determination, it considers all available positive and negative evidence, including future reversals of existing taxable temporary differences, projected future taxable income, tax planning strategies and recent financial operations. In the event the Company were to determine that it would be able to realize its
F-12
Table of Contents
deferred income tax assets in the future in excess of its net recorded amount, an adjustment to the valuation allowance would be recorded, which would reduce the provision for income taxes in the period of such determination.
In regards to the accounting for uncertainty in income taxes recognized in the financial statements, a tax benefit from an uncertain tax position may be recognized when it is more likely than not that the position will be sustained upon examination, including resolutions of any related appeals or litigation processes, based on its technical merits.
NET LOSS PER SHARE - Basic net loss per share is computed by dividing net loss by the weighted average shares of outstanding common stock. The calculation of diluted net loss per share is similar to basic earnings per share except that the denominator includes potentially dilutive common stock. The potentially dilutive common stock included in the Company’s computation of diluted net loss per share includes the effects of stock options, stock appreciation rights (“SARS”), and unvested restricted shares as determined using the treasury stock method.
The following table sets forth the computation of basic and diluted loss per share:
| 2016 | 2015 | 2014 | ||||||||||
| (in thousands, except per share data) | ||||||||||||
| Numerator: |
||||||||||||
| Net loss |
$ | (7,292 | ) | $ | (37,175 | ) | $ | (22,779 | ) | |||
|
|
|
|
|
|
|
|||||||
| Denominator: |
||||||||||||
| Basic - weighted average shares |
14,968 | 14,856 | 14,988 | |||||||||
| Diluted - weighted average shares |
14,968 | 14,856 | 14,988 | |||||||||
|
|
|
|
|
|
|
|||||||
| Basic loss per share |
$ | (0.49 | ) | $ | (2.50 | ) | $ | (1.52 | ) | |||
|
|
|
|
|
|
|
|||||||
| Diluted loss income per share |
$ | (0.49 | ) | $ | (2.50 | ) | $ | (1.52 | ) | |||
|
|
|
|
|
|
|
|||||||
| Antidilutive effect: (1) |
1,154 | 1,748 | 1,945 | |||||||||
|
|
|
|
|
|
|
|||||||
| (1) | Represents weighted average of stock options to purchase shares of common stock, SARS and unvested restricted stock that were not included in computing diluted income per share because their effects were antidilutive for the respective periods. |
ACCOUNTING FOR STOCK-BASED COMPENSATION - Accounting for stock-based compensation requires that the cost resulting from all share-based payment transactions be recognized in the financial statements. The Company uses fair value as the measurement objective in accounting for share-based payment arrangements and applies a fair-value-based measurement method in accounting for share-based payment transactions with employees except for equity instruments held by employee share ownership plans.
For fiscal 2016, 2015 and 2014, approximately $5.2 million, $6.0 million and $5.3 million in compensation expense has been recognized in selling, general and administrative expenses in the consolidated statements of operations related to stock options, SARS and restricted stock, respectively. During fiscal 2014, the Company reversed $0.3 million of previously recognized compensation expense into earnings, since it was no longer probable that the previously established performance targets would be met and those equity awards were no longer expected to vest. Compensation expense for these awards is based on the fair value at the original grant date. During fiscal 2016, 2015, and 2014, the Company received cash of $1.4 million, $0.4 million and $0.2 million, respectively, from the exercise of stock options and realized a tax benefit of approximately ($0.2) million, and $0.1 million, during fiscal 2015 and fiscal 2014, respectively, from such exercises. There was no tax benefit from such exercises during fiscal 2016.
F-13
Table of Contents
The fair value of restricted stock awards is based on the quoted market price on the date of grant. The fair value of the options is estimated at the date of grant using the Black-Scholes Option Pricing Model. This model was developed for use in estimating the fair value of traded options that have no vesting restrictions and are fully transferable. In addition, option valuation models require the input of highly subjective assumptions including: expected volatility based on the expected price of the Company’s common stock over the expected life of the option; the risk free rate of return based on the U.S. Treasury yield curve in effect at the time of grant for the expected term of the option; the expected life based on the period of time the options are expected to be outstanding using historical data to estimate option exercises and employee terminations; and dividend yield based on the Company’s history and expectation of dividend payments. Using the Black-Scholes Option Pricing Model, the estimated weighted-average fair value per option granted in fiscal years 2016, 2015 and 2014 was $12.30, $10.22 and $10.06, respectively.
The following weighted-average assumptions for 2016, 2015 and 2014 were derived from the Black-Scholes model and used to determine the fair value of stock options:
| 2016 | 2015 | 2014 | ||||||
| Risk free interest |
1.5 | % | 2.2 - 2.4% | 2.4% - 2.7% | ||||
| Dividend yield |
0.0 | % | 0.0% | 0.0% | ||||
| Volatility factors |
61.4 | % | 62.3% - 63.3% | 63.7% - 64.8% | ||||
| Weighted-average life (years) |
5.0 | 5.0 | 5.0 | |||||
RECENT ACCOUNTING PRONOUNCEMENTS - In May 2014, the Financial Accounting Standards Board (“FASB”) issued Accounting Standards Update (“ASU”) No. 2014-09, “Revenue from Contracts with Customers.” ASU No. 2014-09 clarifies the principles for recognizing revenue and develops a common revenue standard for GAAP and International Financial Reporting Standards (“IFRS”) that removes inconsistencies and weaknesses in revenue requirements, provides a more robust framework for addressing revenue issues, improves comparability of revenue recognition practices across entities, industries, jurisdictions, and capital markets, provides more useful information to users of financial statements through improved disclosure requirements and simplifies the preparation of financial statements by reducing the number of requirements to which an entity must refer. ASU No. 2014-09 is effective for fiscal years, and interim periods within those years, beginning after December 15, 2017. Companies can choose to apply the ASU using either the full retrospective approach or a modified retrospective approach. The Company is currently evaluating both methods of adoption and the impact, if any, that the adoption of this ASU will have on the Company’s results of operations or the Company’s financial position.
In June 2014, the FASB issued ASU No. 2014-12, “Accounting for Share-Based Payments When the Terms of an Award Provide That a Performance Target Could Be Achieved after the Requisite Service Period (a consensus of the FASB Emerging Issues Task Force).” ASU No. 2014-12 requires that a performance target that affects vesting and that could be achieved after the requisite service period be treated as a performance condition. ASU No. 2014-12 is effective for fiscal years, and interim periods within those years, beginning after December 15, 2015. Earlier adoption is permitted. The amendments can be applied either prospectively to all awards granted or modified after the effective date or retrospectively to all awards with performance targets that are outstanding as of the beginning of the earliest annual period presented in the financial statements and to all new or modified awards. The adoption of ASU No. 2014-12 is not expected to have a material impact on the Company’s results of operations or the Company’s financial position
In February 2015, the FASB issued ASU 2015-02, “Amendments to the Consolidation Analysis”, which change the guidance for evaluating whether to consolidate certain legal entities. Specifically, the amendments modify the evaluation of whether limited partnerships and similar legal entities are variable interest entities (“VIEs”) or voting interest entities. Additionally, the amendments eliminate the presumption that a general partner should consolidate a limited partnership, as well as affect the consolidation analysis of reporting entities that are involved with VIEs, particularly those that have fee arrangements and related party relationships. ASU 2015-02 is
F-14
Table of Contents
effective for periods beginning after December 15, 2015 and early adoption is permitted, including adoption during an interim period. Companies have an option of using either a full retrospective or modified retrospective adoption approach. The adoption of ASU No. 2015-02 is not expected to have a material impact on the Company’s results of operations or the Company’s financial position.
In March 2015, the FASB issued ASU 2015-03, “Interest - Imputation of Interest (Subtopic 835-30)”, which is simplifying the Presentation of Debt Issuance Costs. The standard requires that debt issuance costs related to a recognized debt liability be presented in the balance sheet as a direct deduction from the carrying amount of that debt liability, consistent with debt discounts. ASU 2015-03 is effective for interim periods beginning after December 15, 2015. The Company expects the adoption of the standard will result in the presentation of debt issuance costs, which are currently included in other assets, in the consolidated balance sheets, as a direct deduction from the carrying amount of the related debt instrument.
In July 2015, the FASB issued ASU 2015-11, “Inventory (Topic 330): Simplifying the Measurement of Inventory”, which requires inventory measured using any method other than last-in, first out (“LIFO”) or the retail inventory method to be subsequently measured at the lower of cost or net realizable value, rather than at the lower of cost or market. Under this ASU, subsequent measurement of inventory using the LIFO and retail inventory method is unchanged. ASU 2015-11 is effective prospectively for fiscal years, and for interim periods within those years, beginning after December 15, 2016. Early application is permitted. The adoption of ASU No. 2015-11 is not expected to have a material impact on the Company’s results of operations or the Company’s financial position.
In November 2015, the FASB issued ASU No. 2015-17, “Balance Sheet Classification of Deferred Taxes,” requiring all deferred tax assets and liabilities, and any related valuation allowance, to be classified as non-current on the balance sheet. The classification change for all deferred taxes as non-current simplifies entities’ processes as it eliminates the need to separately identify the net current and net non-current deferred tax asset or liability in each jurisdiction and allocate valuation allowances. The Company elected to prospectively adopt the accounting standard in the beginning of the fourth quarter of fiscal 2016. Prior periods in the consolidated financial statements were not retrospectively adjusted.
In February 2016, the FASB issued ASU No. 2016-02, “Leases (Topic 842)” which requires an entity that is a lessee to recognize the assets and liabilities arising from leases on the balance sheet. This guidance also requires disclosures about the amount, timing and uncertainty of cash flows arising from leases. This guidance is effective for annual reporting periods beginning after December 15, 2018, and interim periods within those annual periods, using a modified retrospective approach, and early adoption is permitted. The Company is evaluating the effect that the adoption will have on its consolidated financial statements and related disclosures.
| 3. | Accounts Receivable |
Accounts receivable consisted of the following as of:
| January 30, 2016 |
January 31, 2015 |
|||||||
| (in thousands) | ||||||||
| Trade accounts |
$ | 144,708 | $ | 150,515 | ||||
| Royalties |
5,892 | 6,662 | ||||||
| Other receivables |
1,769 | 1,034 | ||||||
|
|
|
|
|
|||||
| Total |
152,369 | 158,211 | ||||||
| Less: Allowances |
(20,303 | ) | (20,779 | ) | ||||
|
|
|
|
|
|||||
| Total |
$ | 132,066 | $ | 137,432 | ||||
|
|
|
|
|
|||||
The Company reports accounts receivable at amounts it expects to be collected, less allowances for trade discounts, co-op advertising, allowances it provides to its retail customers to effectively flow goods through the retail channels, an allowance for potential non-collection due to the financial position of its customers and credit card accounts, and an allowance for estimated sales returns. Management reviews these allowances and considers
F-15
Table of Contents
the aging of account balances, historical experience, changes in customer creditworthiness, current economic and product trends, customer payment activity and other relevant factors. A small portion of our accounts receivable are insured for collections. Should any of these factors change, the estimates made by management may also change, which could affect the level of future provisions.
| 4. | Inventories |
Inventories consisted of the following as of:
| January 30, 2016 |
January 31, 2015 |
|||||||
| (in thousands) | ||||||||
| Finished goods |
$ | 182,414 | $ | 183,468 | ||||
| Raw materials and in process |
336 | 266 | ||||||
|
|
|
|
|
|||||
| Total |
$ | 182,750 | $ | 183,734 | ||||
|
|
|
|
|
|||||
The Company’s inventories are valued at the lower of cost (weighted moving average cost) or market. The Company evaluates all of its inventory stock keeping units (SKUs) to determine excess or slow moving SKUs based on orders on hand and projections of future demand and market conditions. For those units in inventory that are identified as excess or slow moving, the Company estimates their market value based on current sales trends. If the projected net sales value is less than cost, on an individual SKU basis, the Company writes down inventory to reflect the lower value. This methodology recognizes projected inventory losses at the time such losses are evident rather than at the time goods are actually sold.
| 5. | Prepaid expenses and other current assets |
Prepaid expenses and other current assets consisted of the following as of:
| January 30, 2016 |
January 31, 2015 |
|||||||
| (in thousands) | ||||||||
| Prepaid expenses |
$ | 8,149 | $ | 6,861 | ||||
| Other current assets |
312 | 263 | ||||||
|
|
|
|
|
|||||
| Total |
$ | 8,461 | $ | 7,124 | ||||
|
|
|
|
|
|||||
The Company previously closed its Winnsboro distribution facility (“Winnsboro”) and listed the property for sale. Accordingly, Winnsboro was classified as a held-for-sale asset in the amount of $2.0 million. During the third quarter of fiscal 2014, the Company sold Winnsboro for a total sales price of $2.0 million, less selling commissions and closing costs. As a result of this transaction, the Company recorded a loss of $0.1 million.
| 6. | Investments |
The Company’s investments include certificates of deposit for the fiscal years ended January 30, 2016 and January 31, 2015. The Company’s investments also included marketable securities for the fiscal year ended January 31, 2015. Certificates of deposit are classified as available-for-sale with $9.8 million with maturity dates within one year or less. Investments are stated at fair value. Marketable securities are classified as available-for-sale and consist of corporate bonds with maturity dates less than one year. The estimated fair value of the marketable securities is based on quoted prices in an active market (Level 1 fair value measures).
F-16
Table of Contents
Investments consisted of the following as of January 30, 2016:
| Cost | Gross Unrealized Gains |
Gross Unrealized Losses |
Estimated Fair Value |
|||||||||||||
| (in thousands) | ||||||||||||||||
| Certificates of deposit |
$ | 9,791 | $ | — | $ | (9 | ) | $ | 9,782 | |||||||
|
|
|
|
|
|
|
|
|
|||||||||
| Total investments |
$ | 9,791 | $ | — | $ | (9 | ) | $ | 9,782 | |||||||
|
|
|
|
|
|
|
|
|
|||||||||
Investments consisted of the following as of January 31, 2015:
| Cost | Gross Unrealized Gains |
Gross Unrealized Losses |
Estimated Fair Value |
|||||||||||||
| (in thousands) | ||||||||||||||||
| Marketable securities |
$ | 12,247 | $ | 9 | $ | 0 | $ | 12,256 | ||||||||
| Certificates of deposit |
7,742 | 1 | (3 | ) | 7,740 | |||||||||||
|
|
|
|
|
|
|
|
|
|||||||||
| Total investments |
$ | 19,989 | $ | 10 | $ | (3 | ) | $ | 19,996 | |||||||
|
|
|
|
|
|
|
|
|
|||||||||
| 7. | Property and Equipment |
Property and equipment consisted of the following as of:
| January 30, 2016 |
January 31, 2015 |
|||||||
| (in thousands) | ||||||||
| Furniture, fixtures and equipment |
$ | 84,634 | $ | 79,225 | ||||
| Buildings and building improvements |
19,462 | 19,719 | ||||||
| Vehicles |
523 | 569 | ||||||
| Leasehold improvements |
46,882 | 47,807 | ||||||
| Land |
9,430 | 9,488 | ||||||
|
|
|
|
|
|||||
| Total |
160,931 | 156,808 | ||||||
| Less: accumulated depreciation and amortization |
(97,023 | ) | (92,175 | ) | ||||
|
|
|
|
|
|||||
| Total |
$ | 63,908 | $ | 64,633 | ||||
|
|
|
|
|
|||||
The above table of property and equipment includes assets held under capital leases as of:
| January 30, 2016 |
January 31, 2015 |
|||||||
| (in thousands) | ||||||||
| Furniture, fixtures and equipment |
$ | 810 | $ | 888 | ||||
| Less: accumulated depreciation and amortization |
(182 | ) | (791 | ) | ||||
|
|
|
|
|
|||||
| Total |
$ | 628 | $ | 97 | ||||
|
|
|
|
|
|||||
Depreciation and amortization expense relating to property and equipment amounted to $13.4 million, $12.0 million and $12.3 million for the fiscal years ended January 30, 2016, January 31, 2015, and February 1, 2014, respectively. These amounts include amortization expense for leased property under capital leases.
F-17
Table of Contents
During the fourth quarter of fiscal 2016, the Company executed a sales agreement, in the amount of $8.2 million, for the sale of our sourcing office building located in Beijing, China. As a result of this transaction the Company recorded a gain in the amount of $4.5 million, net of expenses of $1.9 million, in the men’s sportswear and swim segment.
| 8. | Other Intangible Assets |
Trademarks
Trademarks, included in other intangible assets, net, are considered indefinite-lived assets and totaled $184.1 million at January 30, 2016 and $205.5 million at January 31, 2015.
On March 19, 2015, the Company entered into an agreement to sell the intellectual property of its C&C California brand to a third party. The sales price was $2.5 million, which was collected during the first quarter of fiscal 2016. In connection with this transaction, the Company recorded a loss of ($0.7) million in the licensing segment.
On August 1, 2014, the Company entered into a sales agreement, in the amount of $1.3 million, for the sale of Australian, Fiji and New Zealand trademark rights with respect to Jantzen. Payments on the purchase price are due in five installments of $250,000 over a five year period. Interest on the purchase price that remains unpaid will accrue at a rate of 3.5% per annum calculated on an annual basis. The first payment was due within four days of the completion date and has been paid. The second payment was paid and the remaining three payments will be paid annually commencing on August 1, 2016 with the final payment to be made on August 1, 2018. As a result of this transaction, the Company recorded a gain of $0.9 million in the licensing segment.
During the fourth quarter of fiscal 2013, the Company entered into a sales agreement, in the amount of $7.5 million, for certain Asian trademark rights with respect to John Henry. This transaction closed in the first quarter of fiscal 2014. The Company collected proceeds of $4.9 million and $2.6 million during the first quarter of fiscal 2014 and the fourth quarter of fiscal 2013, respectively. As a result of this transaction, the Company recorded a gain of $6.3 million in the licensing segment. The Company plans to continue executing on its domestic strategy for the John Henry brand as a modern lifestyle resource to select retailers and through its licensing relationships in Latin America.
These trademarks are not subject to amortization but are reviewed at least annually for potential impairment. The fair value of each trademark asset is compared to the carrying value of the trademark. The Company recognizes an impairment loss when the estimated fair value of the trademark asset is less than the carrying value. The Company’s impairment test is performed annually during the fourth quarter.
The Company estimates the fair value of the trademarks based on an income approach using the relief-from-royalty method. This methodology assumes that, in lieu of ownership, a third party would be willing to pay a royalty in order to exploit the related benefits of trademark assets. The cash flow models the Company uses to estimate the fair values of its trademarks involve several assumptions. The fair values are considered to be Level 3 fair value measures due to the use of significant unobservable inputs. Changes in these assumptions could materially impact the Company’s fair value estimates. Assumptions critical to the fair value estimates are: (i) discount rates used to derive the present value factors used in determining the fair value of the trademarks; (ii) royalty rates used in the trademark valuations; (iii) projected revenue growth rates; and (iv) projected long-term growth rates used in the derivation of terminal year values. These and other assumptions are impacted by economic conditions and expectations of management and could change in the future based on period-specific facts and circumstances. The Company bases its fair value estimates on assumptions it believes to be reasonable, but which are unpredictable and inherently uncertain.
As a result of the annual trademark impairment analysis performed during the fiscal years ended January 30, 2016 and February 1, 2014, the Company determined that the carrying value of certain trademarks exceeded their estimated fair value. Accordingly, the Company recorded non-cash, pre-tax charges of $18.2 million and $34.3 million, respectively, to reduce the value of these trademarks, which are assigned to the licensing segment, to their estimated fair values, and are included in impairment on assets in the accompanying consolidated statements of operations. The impairments resulted from a decline in the future anticipated cash flows from these trademarks, which was due, in part, to the economic challenges and market
F-18
Table of Contents
conditions in the apparel industry at such time. Impairment charges are included in impairment on assets in the accompanying consolidated statements of operations. Based on the annual trademark impairment analysis performed during the fiscal year January 31, 2015, the Company determined that the estimated fair value of the trademarks exceeded their carrying value.
Goodwill
Goodwill represents the excess of the purchase price over the value assigned to tangible and identifiable intangible assets of businesses acquired and accounted for under the acquisition method. The Company reviews goodwill at least annually for possible impairment during the fourth quarter of each year using a discounted cash flow analysis that requires that certain assumptions and estimates be made regarding industry economic factors and future profitability and cash flows. The goodwill impairment test is a two-step process that requires the Company to make decisions in determining appropriate assumptions to use in the calculation. The fair values are considered to be Level 3 fair value measures due to the use of significant unobservable inputs. Assumptions critical to the fair value estimates are: (i) discount rates used to derive the present value factors used in determining the fair value of each reporting unit; (ii) projected revenue and expense growth rates; and (iii) projected long-term growth rates used in the derivation of terminal year values. The first step consists of estimating the fair value of each reporting unit and comparing those estimated fair values with the actual carrying values, which include the allocated goodwill. If the estimated fair value is less than the actual carrying value, a second step is performed to compute the amount of the impairment, if any, by determining an “implied fair value” of goodwill. The determination of each reporting unit’s implied fair value of goodwill requires the Company to allocate the estimated fair value of the reporting unit to its assets and liabilities. Any unallocated fair value represents the implied fair value of goodwill which is compared to its corresponding carrying amount.
Based on the annual goodwill impairment analysis performed during the fiscal year ended January 30, 2016 and February 1, 2014, the Company determined that the carrying value exceeded the estimated fair value of goodwill. Accordingly, the Company recorded non-cash, pre-tax charges of $6.0 million and $7.8 million, respectively, to reduce the value of goodwill, which is assigned to the Women’s Sportswear segment, and are included in impairment on goodwill in the accompanying consolidated statements of operations. The impairment resulted from a decline in the future anticipated cash flows. Based on the annual goodwill impairment analysis performed during the fiscal year ended January 31, 2015, the Company determined that the estimated fair value of goodwill exceeded the carrying value. The carrying value of goodwill existing in the Company’s Women’s Sportswear segment was approximately $6.0 million as of January 31, 2015. As of January 30, 2016, the Company no longer carries any goodwill.
Other
Other intangible assets represent customer lists as of:
| January 30, 2016 |
January 31, 2015 |
|||||||
| (in thousands) | ||||||||
| Customer lists |
$ | 8,450 | $ | 8,450 | ||||
| Less: accumulated amortization |
(4,677 | ) | (3,782 | ) | ||||
|
|
|
|
|
|||||
| Total |
$ | 3,773 | $ | 4,668 | ||||
|
|
|
|
|
|||||
For the years ended January 30, 2016 and January 31, 2015, amortization expense relating to customer lists amounted to approximately $0.9 million and $0.9 million, respectively. Other intangible assets are amortized over their estimated useful lives of 10 years. Assuming no impairment, the table sets forth the estimated amortization expense for future periods based on recorded amounts as of January 30, 2016:
| (in thousands) | ||||
| 2017 |
$ | 868 | ||
| 2018 |
835 | |||
| 2019 |
793 | |||
| 2020 |
734 | |||
| 2021 |
543 | |||
F-19
Table of Contents
| 9. | Investment in Joint Venture |
On April 20, 2012, the Company formed a joint venture, Manhattan China Limited, with China Outfitters Holdings Limited (“COHL”). Under the joint venture agreement, Manhattan China Limited has 10,000,000 initial authorized shares of capital (“joint venture shares”). COHL holds 7,500,000 joint venture shares, a 75% ownership interest in the joint venture, and the Company holds 2,500,000 joint venture shares, a 25% ownership interest in Manhattan China Limited, which is accounted for under the equity method. As of January 30, 2016 and January 31, 2015, the Company’s investment in the unconsolidated joint venture, which is classified as an other long-term asset in the accompanying consolidated balance sheets, was approximately $50,000 and $0.4 million, respectively.
| 10. | Accrued Expenses and Other Liabilities |
Accrued expenses and other liabilities consisted of the following as of:
| January 30, 2016 |
January 31, 2015 |
|||||||
| (in thousands) | ||||||||
| Salaries and commissions |
$ | 6,476 | $ | 3,702 | ||||
| Royalties |
3,002 | 2,992 | ||||||
| Unearned advertising reimbursement |
1,999 | 1,997 | ||||||
| Insurance and rent |
2,532 | 2,651 | ||||||
| State sales and other taxes |
2,496 | 2,364 | ||||||
| Professional fees |
361 | 1,299 | ||||||
| Current portion - real estate mortgages |
817 | 791 | ||||||
| Other |
8,814 | 6,559 | ||||||
|
|
|
|
|
|||||
| Total |
$ | 26,497 | $ | 22,355 | ||||
|
|
|
|
|
|||||
| 11. | Senior Subordinated Notes Payable |
In March 2011, the Company issued $150 million 7 7⁄8% senior subordinated notes, due April 1, 2019. The proceeds of this offering were used to retire the $150 million 8 7⁄8% senior subordinated notes due September 15, 2013 and to repay a portion of the outstanding balance on the senior credit facility. The proceeds to the Company were $146.5 million yielding an effective interest rate of 8.0%.
On April 6, 2015, the Company elected to call for the partial redemption of $100 million of its $150 million 7 7⁄8% senior subordinated notes due 2019 and a notice of redemption was sent to all registered holders of the senior subordinated notes. The redemption terms provided for the payment of a redemption premium of
F-20
Table of Contents
103.938% of the principal amount redeemed. On May 6, 2015, the Company completed the redemption of the $100 million of its senior subordinated notes. The Company incurred debt extinguishment costs of approximately $5.1 million in connection with the redemption, including the redemption premium as well as the write-off of note issuance costs.
Certain Covenants. The indenture governing the senior subordinated notes contains certain covenants which restrict the Company’s ability and the ability of its subsidiaries to, among other things, incur additional indebtedness in certain circumstances, pay dividends or make other distributions on, redeem or repurchase capital stock, make investments or other restricted payments, create liens on assets to secure debt, engage in transactions with affiliates, and effect a consolidation or merger. The Company is not aware of any non-compliance with any of its covenants in this indenture. The Company could be materially harmed if it violated any covenants because the indenture’s trustee could declare the outstanding notes, together with accrued interest, to be immediately due and payable, which the Company may not be able to satisfy. In addition, a violation could also constitute a cross-default under the senior credit facility, the letter of credit facility and the real estate mortgages resulting in all of the Company’s debt obligations becoming immediately due and payable, which it may not be able to satisfy.
| 12. | Senior Credit Facility |
On April 22, 2015, the Company amended and restated its existing senior credit facility (the “Credit Facility”), with Wells Fargo Bank, National Association, as agent for the lenders, and Bank of America, N.A., as syndication agent. The Credit Facility provides a revolving credit facility of up to an aggregate amount of $200 million. The Credit Facility has been extended through April 30, 2020 (“Maturity Date”). In connection with this amendment and restatement, the Company paid fees in the amount of $0.6 million. These fees will be amortized over the term of the credit facility as interest expense. At January 30, 2016, the Company had outstanding borrowings of $61.8 million under the Credit Facility. At January 31, 2015, the Company had no outstanding borrowings under the Credit Facility.
Certain Covenants. The Credit Facility contains certain financial and other covenants, which, among other things, require the Company to maintain a minimum fixed charge coverage ratio if availability falls below certain thresholds. The Company is not aware of any non-compliance with any of its covenants in this Credit Facility. These covenants may restrict its ability and the ability of its subsidiaries to, among other things, incur additional indebtedness and liens in certain circumstances, redeem or repurchase capital stock, make certain investments or sell assets. The Company may pay cash dividends subject to certain restrictions set forth in the covenants including, but not limited to, meeting a minimum excess availability threshold and no occurrence of a default. The Company could be materially harmed if it violates any covenants, as the lenders under the Credit Facility could declare all amounts outstanding, together with accrued interest, to be immediately due and payable. If the Company is unable to repay those amounts, the lenders could proceed against its assets and the assets of its subsidiaries that are borrowers or guarantors. In addition, a covenant violation that is not cured or waived by the lenders could also constitute a cross-default under certain of its other outstanding indebtedness, such as the indenture relating to its 7 7⁄8% senior subordinated notes due April 1, 2019, its letter of credit facilities, or its real estate mortgage loans. A cross-default could result in all of its debt obligations becoming immediately due and payable, which it may not be able to satisfy. Additionally, the Credit Facility includes a subjective acceleration clause if a “material adverse change” in the Company’s business occurs. The Company believes that the likelihood of the lender exercising this right is remote.
Borrowing Base. Borrowings under the Credit Facility are limited to a borrowing base calculation, which generally restricts the outstanding balance to the sum of (a) 87.5% of eligible receivables plus (b) 87.5% of eligible foreign accounts up to $1.5 million plus (c) the lesser of (i) the inventory loan limit, which equals 80% of the maximum credit under the Credit Facility at the time, (ii) a maximum of 70.0% of eligible finished goods inventory with an inventory limit not to exceed $125 million, or 90.0% of the net recovery percentage (as defined in the Credit Facility) of eligible inventory.
Interest. Interest on the outstanding principal balance drawn under the Credit Facility accrues at the prime rate and at the rate quoted by the agent for Eurodollar loans. The margin adjusts quarterly, in a range of 0.50% to 1.00% for prime rate loans and 1.50% to 2.00% for Eurodollar loans, based on the previous quarterly average of excess availability plus excess cash on the last day of the previous quarter.
Security. As security for the indebtedness under the Credit Facility, the Company granted to the lenders a first priority security interest (subject to liens permitted under the Credit Facility to be senior thereto) in substantially all of its existing and future assets, including, without limitation, accounts receivable, inventory, deposit accounts, general intangibles, equipment and capital stock or membership interests, as the case may be, of certain subsidiaries, and real estate but excluding its non-U.S. subsidiaries and all of its trademark portfolio.
F-21
Table of Contents
| 13. | Letter of Credit Facilities |
As of January 30, 2016, the Company maintained one U.S. dollar letter of credit facility totaling $30.0 million and one letter of credit facility totaling $0.3 million utilized by its United Kingdom subsidiary. Each documentary letter of credit is secured primarily by the consignment of merchandise in transit under that letter of credit and certain subordinated liens on the Company’s assets. During fiscal 2016, a $15.0 million line of credit expired and was not renewed.
Amounts under letter of credit facilities consisted of the following as of:
| January 30, 2016 |
January 31, 2015 |
|||||||
| (in thousands) | ||||||||
| Total letter of credit facilities |
$ | 30,286 | $ | 45,301 | ||||
| Outstanding letters of credit |
(11,395 | ) | (11,595 | ) | ||||
|
|
|
|
|
|||||
| Total credit available |
$ | 18,891 | $ | 33,706 | ||||
|
|
|
|
|
|||||
| 14. | Real Estate Mortgages |
In July 2010, the Company paid off its then existing real estate mortgage loan and refinanced its main administrative office, warehouse and distribution facility in Miami with a $13.0 million mortgage loan. The loan is due on August 1, 2020. The interest rate has been modified since the refinancing date. The interest rate was 4.25% per annum and monthly payments of principal and interest of $71,000 were due, based on a 25-year amortization with the outstanding principal due at maturity. In July 2013, the Company amended the mortgage loan agreement to modify the interest rate. The interest rate was reduced to 3.9% per annum and the terms were restated to reflect new monthly payments of principal and interest of $69,000, based on a 25-year amortization, with the outstanding principal due at maturity. At January 30, 2016, the balance of the real estate mortgage loan totaled $11.0 million, net of discount, of which $357,000 is due within one year.
In June 2006, the Company entered into a mortgage loan for $15 million secured by the Company’s Tampa facility. The loan is due on January 23, 2019. The mortgage loan has been refinanced and the interest rate has been modified since such date. The interest rate was 4.00% per annum and quarterly payments of principal and interest of approximately $248,000 were due, based on a 20-year amortization, with the outstanding principal due at maturity. In January 2014, the Company again amended the mortgage loan to modify the interest rate. The interest rate was reduced to 3.25% per annum and the terms were restated to reflect new monthly payments of principal and interest of approximately $68,000, based on a 20-year amortization, with the outstanding principal due at maturity. At January 30, 2016, the balance of the real estate mortgage loan totaled $11.1 million, net of discount, of which approximately $460,000 is due within one year.
The real estate mortgage loans contain certain covenants. The Company is not aware of any non-compliance with any of the covenants. If the Company violates any covenants, the lender under the real estate mortgage loan could declare all amounts outstanding thereunder to be immediately due and payable, which the Company may not be able to satisfy. A covenant violation could constitute a cross-default under the Company’s senior credit facility, the letter of credit facility and the indenture relating to its senior subordinated notes resulting in all of its debt obligations becoming immediately due and payable, which the Company may not be able to satisfy.
F-22
Table of Contents
The contractual maturities of the real estate mortgages are as follows:
Fiscal year ending:
| Amount | ||||
| (in thousands) | ||||
| 2017 |
$ | 817 | ||
| 2018 |
881 | |||
| 2019 |
10,609 | |||
| 2020 |
439 | |||
| 2021 |
9,629 | |||
|
|
|
|||
| 22,375 | ||||
| Less discount |
(240 | ) | ||
|
|
|
|||
| Total |
$ | 22,135 | ||
|
|
|
|||
| 15. | Retirement Plan |
The Company has a 401(k) Plan (the “Plan”) which includes a discretionary Company match that has ranged from 0% to 50% of the first 6% contributed to the Plan by eligible employees. Eligible employees may participate in the Plan upon the attainment of age 21, and completion of three continuous months of service. Participants may elect to contribute up to 60% of their compensation, subject to maximum statutory limits. The Company’s discretionary contributions to the Plan were approximately $1.0 million, $1.0 million and $0.9 million for the fiscal years ended January 30, 2016, January 31, 2015 and February 1, 2014, respectively.
| 16. | Benefit Plans |
The Company sponsors two qualified pension plans as a result of the Perry Ellis Menswear acquisition that occurred in June 2003. The plans were frozen and merged as of December 31, 2003.
During fiscal 2015, the Board of Directors resolved to terminate the pension plan. Distribution of plan assets pursuant to the termination will not be made until the plan termination satisfies the regulatory requirements prescribed by the Internal Revenue Service and the Pension Benefit Guaranty Corporation, which is expected to occur in late fiscal 2017.
F-23
Table of Contents
The following tables provide a reconciliation of the changes in the plans’ benefit obligations and fair value of assets over the plan years beginning January 31, 2015 and ended January 30, 2016, and a statement of the funded status as of January 30, 2016.
| For the fiscal year ended: | January 30, 2016 |
January 31, 2015 |
||||||
| (in thousands) | ||||||||
| Change in benefit obligation |
||||||||
| Benefit obligation at beginning of plan year |
$ | 45,829 | $ | 42,426 | ||||
| Service cost |
250 | 250 | ||||||
| Interest cost |
1,349 | 1,635 | ||||||
| Actuarial gain (loss) |
1,097 | 4,524 | ||||||
| Lump sums plus annuities paid |
(17,554 | ) | (3,006 | ) | ||||
|
|
|
|
|
|||||
| Benefit obligation at end of plan year |
$ | 30,971 | $ | 45,829 | ||||
|
|
|
|
|
|||||
| Change in plan assets |
||||||||
| Fair value of plan assets at beginning of plan year |
$ | 36,899 | $ | 32,564 | ||||
| Actual return on plan assets |
(522 | ) | 4,380 | |||||
| Company contributions |
41 | 2,961 | ||||||
| Lump sums plus annuities paid |
(17,554 | ) | (3,006 | ) | ||||
|
|
|
|
|
|||||
| Fair value of plan assets at end of plan year |
$ | 18,864 | $ | 36,899 | ||||
|
|
|
|
|
|||||
| Unfunded status at end of plan year |
$ | 12,107 | $ | 8,930 | ||||
|
|
|
|
|
|||||
The net unfunded amount is classified as a liability in the caption deferred pension obligation on the consolidated balance sheet. At January 30, 2016, the deferred loss included in accumulated other comprehensive loss was $11.1 million before tax and $7.4 million on an after-tax basis. At January 31, 2015, the deferred loss included in accumulated other comprehensive loss was $11.8 million before tax and $8.1 million on an after-tax basis.
The following table provides the components of net benefit cost for the plans for the fiscal years ended:
| January 30, 2016 |
January 31, 2015 |
February 1, 2014 |
||||||||||
| (in thousands) | ||||||||||||
| Service cost |
$ | 250 | $ | 250 | $ | 250 | ||||||
| Interest cost |
1,349 | 1,635 | 1,625 | |||||||||
| Expected return on plan assets |
(2,631 | ) | (2,398 | ) | (2,219 | ) | ||||||
| Settlement |
4,427 | — | — | |||||||||
| Amortization of unrecognized net loss |
538 | 399 | 533 | |||||||||
|
|
|
|
|
|
|
|||||||
| Net periodic benefit cost |
$ | 3,933 | $ | (114 | ) | $ | 189 | |||||
|
|
|
|
|
|
|
|||||||
The prior service costs are amortized on a straight-line basis over the average remaining service period of active participants. Gains and losses in excess of 10% of the greater of the benefit obligation and the market-related value of assets are amortized over the average remaining service period of active participants.
The settlement charges of $4.4 million in fiscal 2016 were the result of lump sum distributions from the plan’s assets in fiscal 2016 in anticipation of the plans termination in fiscal 2017.
The assumptions used in the measurement of the Company’s benefit obligation are shown in the following table for the plan years ended:
| January 30, 2016 |
January 31, 2015 |
|||||||
| Discount rate |
3.19 | % | 3.05 | % | ||||
| Rate of compensation increase |
N/A | N/A | ||||||
F-24
Table of Contents
The assumptions used in the measurement of the net periodic benefit cost are as follows:
| January 30, 2016 |
January 31, 2015 |
|||||||
| Discount rate |
3.05 | % | 3.05 | % | ||||
| Expected return on plan assets |
7.50 | % | 7.50 | % | ||||
| Rate of compensation increase |
N/A | N/A | ||||||
The pension plan weighted-average asset allocations by asset category are as follows:
| January 30, 2016 |
January 31, 2015 |
|||||||
| Asset category: |
||||||||
| Debt securities |
35.00 | % | 94.10 | % | ||||
| Cash |
65.00 | % | 5.90 | % | ||||
|
|
|
|
|
|||||
| Total |
100.00 | % | 100.00 | % | ||||
|
|
|
|
|
|||||
The Company’s Investment Committee establishes investment guidelines and strategies, and regularly monitors the performance of the investments. The Company’s investment strategy with respect to pension assets is to invest the assets in accordance with applicable laws and regulations. The primary objectives for the Company’s pension assets are to (1) provide for a reasonable amount of growth of capital, without undue exposure to risk; and protect the assets from erosion of purchasing power, and (2) provide investment results that meet or exceed the plans’ actuarially assumed rate of return.
The fair value of plan assets by asset category is as follows:
| At January 30, 2016 | ||||||||||||||||
| Level 1 | Level 2 | Level 3 | Total | |||||||||||||
| (in thousands) | ||||||||||||||||
| Asset category: |
||||||||||||||||
| Debt securities |
$ | 6,602 | $ | — | $ | — | $ | 6,602 | ||||||||
| Cash |
12,262 | — | — | 12,262 | ||||||||||||
|
|
|
|
|
|
|
|
|
|||||||||
| Total |
$ | 18,864 | $ | — | $ | — | $ | 18,864 | ||||||||
|
|
|
|
|
|
|
|
|
|||||||||
| At January 31, 2015 | ||||||||||||||||
| Level 1 | Level 2 | Level 3 | Total | |||||||||||||
| (in thousands) | ||||||||||||||||
| Asset category: |
||||||||||||||||
| Debt securities |
$ | 34,722 | $ | — | $ | — | $ | 34,722 | ||||||||
| Cash |
2,177 | — | — | 2,177 | ||||||||||||
|
|
|
|
|
|
|
|
|
|||||||||
| Total |
$ | 36,899 | $ | — | $ | — | $ | 36,899 | ||||||||
|
|
|
|
|
|
|
|
|
|||||||||
F-25
Table of Contents
The expected future benefit payments are as follows for fiscal years ending:
| Expected Future Benefits Payments |
(in thousands) | |||
| 2017 |
$ | 30,970 | ||
The Company’s contributions for fiscal 2017 are expected to be approximately $12.0 million. The Company will review the funding status during fiscal 2017 and the incremental funding provisions may change in future periods.
| 17. | Unearned Revenues and Other Long-Term Liabilities |
Unearned revenues and other long-term liabilities consisted of the following as of:
| January 30, 2016 |
January 31, 2015 |
|||||||
| (in thousands) | ||||||||
| Deferred rent long-term |
$ | 12,848 | $ | 12,324 | ||||
| Deferred gain long-term |
— | 878 | ||||||
| Unearned revenue |
— | 688 | ||||||
| Deferred advertising |
— | 688 | ||||||
| Long-term Incentive Compensation |
1,464 | — | ||||||
| Other |
541 | 431 | ||||||
|
|
|
|
|
|||||
| Total |
$ | 14,853 | $ | 15,009 | ||||
|
|
|
|
|
|||||
In connection with an agreement entered into on January 25, 2007, with Falic Fashion Group, LLC, (“Falic”) the Company recorded an accounting gain from the sale of certain assets in the amount of approximately $9.6 million. The gain is being deferred over the term of the license agreement with Falic that was entered into simultaneously with the sale of the assets, as an adjustment to the effective royalty rate. As such, approximately $0.9 million and $1.0 million are recorded in unearned revenues, respectively, and approximately $0.0 million and $0.9 million are recorded in unearned revenues and other long-term liabilities in the accompanying consolidated balance sheet as of January 30, 2016 and January 31, 2015.
| 18. | Income Taxes |
For financial reporting purposes, income (loss) before income tax (benefit) provision includes the following components:
| January 30, 2016 |
January 31, 2015 |
February 1, 2014 |
||||||||||
| (in thousands) | ||||||||||||
| Domestic |
$ | (19,447 | ) | $ | 1,404 | $ | (46,948 | ) | ||||
| Foreign |
11,723 | 7,213 | 12,554 | |||||||||
|
|
|
|
|
|
|
|||||||
| Total |
$ | (7,724 | ) | $ | 8,617 | $ | (34,394 | ) | ||||
|
|
|
|
|
|
|
|||||||
F-26
Table of Contents
The income tax (benefit) provision consisted of the following components for each of the years ended:
| January 30, 2016 |
January 31, 2015 |
February 1, 2014 |
||||||||||
| (in thousands) | ||||||||||||
| Current income taxes: |
||||||||||||
| Federal |
$ | 5 | $ | 398 | $ | 350 | ||||||
| State |
205 | 505 | 40 | |||||||||
| Foreign |
1,939 | 1,159 | 2,870 | |||||||||
|
|
|
|
|
|
|
|||||||
| Total current income taxes |
2,149 | 2,062 | 3,260 | |||||||||
|
|
|
|
|
|
|
|||||||
| Deferred income taxes: |
||||||||||||
| Federal |
(2,246 | ) | 41,225 | (12,728 | ) | |||||||
| State |
(617 | ) | 2,974 | (2,018 | ) | |||||||
| Foreign |
282 | (469 | ) | (129 | ) | |||||||
|
|
|
|
|
|
|
|||||||
| Total deferred income taxes |
(2,581 | ) | 43,730 | (14,875 | ) | |||||||
|
|
|
|
|
|
|
|||||||
| Total |
$ | (432 | ) | $ | 45,792 | $ | (11,615 | ) | ||||
|
|
|
|
|
|
|
|||||||
The Company’s effective income tax rate was as follows for each of the years ended:
| January 30, 2016 |
January 31, 2015 |
February 1, 2014 |
||||||||||
| Statutory federal income tax rate |
35.0 | % | 35.0 | % | (35.0 | %) | ||||||
| Increase (decrease) resulting from State income taxes, net of federal income tax benefit |
5.2 | % | (1.7 | %) | (6.4 | %) | ||||||
| Foreign tax rate differential |
35.9 | % | (28.8 | %) | (6.7 | %) | ||||||
| Change in reserves |
(2.2 | %) | 3.3 | % | 0.6 | % | ||||||
| Change in valuation allowance |
(38.6 | %) | 506.9 | % | 3.6 | % | ||||||
| Non-deductible items |
(32.2 | %) | 14.7 | % | 8.3 | % | ||||||
| Prior year tax provision adjustments |
1.8 | % | (0.6 | %) | 0.0 | % | ||||||
| Change in deferred rate |
4.1 | % | (0.4 | %) | (2.8 | %) | ||||||
| Other |
(3.4 | %) | 3.0 | % | 4.6 | % | ||||||
|
|
|
|
|
|
|
|||||||
| Total |
5.6 | % | 531.4 | % | (33.8 | %) | ||||||
|
|
|
|
|
|
|
|||||||
F-27
Table of Contents
Deferred income taxes are provided for the temporary differences between financial reporting basis and the tax basis of the Company’s assets and liabilities. The tax effects of temporary differences were as follows, as of the years ended:
| January 30, 2016 |
January 31, 2015 |
|||||||
| (in thousands) | ||||||||
| Deferred tax assets: |
||||||||
| Inventory |
$ | 6,251 | $ | 6,631 | ||||
| Accounts receivable |
1,295 | 1,479 | ||||||
| Accrued expenses |
7,930 | 6,488 | ||||||
| Net operating losses |
19,882 | 18,667 | ||||||
| Deferred pension obligation |
4,741 | 3,723 | ||||||
| Stock compensation |
3,497 | 4,411 | ||||||
| Fixed assets |
7,142 | 5,130 | ||||||
| Intangible assets |
3,681 | — | ||||||
| Other |
4,434 | 5,130 | ||||||
|
|
|
|
|
|||||
| 58,853 | 51,659 | |||||||
|
|
|
|
|
|||||
| Deferred tax liabilities: |
||||||||
| Intangible assets |
(36,642 | ) | (37,361 | ) | ||||
| Prepaid expenses |
(1,993 | ) | (1,436 | ) | ||||
| Other |
— | (3 | ) | |||||
|
|
|
|
|
|||||
| (38,635 | ) | (38,800 | ) | |||||
|
|
|
|
|
|||||
| Valuation allowance |
(54,791 | ) | (50,013 | ) | ||||
|
|
|
|
|
|||||
| Net deferred tax liability |
$ | (34,573 | ) | $ | (37,154 | ) | ||
|
|
|
|
|
|||||
During fiscal 2009, the Company initially recorded a $1.0 million deferred tax asset with realized and unrealized losses associated with marketable securities. Management believes it is more likely than not that the related deferred tax asset associated with these losses will not be realized due to tax limitations imposed on the utilization of capital losses. During fiscal 2014, the deferred tax asset associated with these losses was reduced by $0.1 million relating to the expiration of capital loss carryforwards and the reassessment of the deferred tax rate. The balance of the valuation allowance associated with the unrealized losses associated with marketable securities for fiscal 2016 and 2015 was $0.9 million.
During fiscal years 2016 and 2015, the Company realized tax-effected losses of $0.1 million and $0.5 million, respectively, associated with the operations of its U.K. subsidiary. For U.K. tax purposes, the operating loss has an indefinite carryforward period. Based upon operating results from the three most recent fiscal years, including fiscal 2016, management of the Company has determined that its U.K. subsidiary represents a cumulative loss company. Therefore, management has determined that a valuation allowance for deferred income tax assets is necessary. The balance of the valuation allowance associated with the U.K. operating loss carryforward for fiscal 2016 and 2015 was $2.1 million and $2.4 million, respectively. During fiscal 2016, the net decrease in valuation allowance was $0.3 million, which was attributable to a decrease in the valuation allowance of $0.3 million related to the difference between the actual and estimated prior year loss, changes in the foreign exchange rate, and an increase associated with the fiscal 2016 loss. There is no tax benefit associated with the decrease of $0.3 million as the asset and the valuation allowance changes offset each other.
During fiscal year 2016, the Company realized additional tax-effected losses of $0.2 million associated with the operations of its Hong Kong subsidiary. Based upon operating results from the three most recent fiscal years, including fiscal 2016, management of the Company has determined that its Hong Kong subsidiary represents a cumulative loss company. Therefore, management has determined that a valuation allowance for deferred income tax assets is necessary. The balance of the valuation allowance associated with the Hong Kong subsidiary for fiscal 2016 and 2015 was $1.0 million and $0.2 million, respectively. During fiscal 2016, the increase in the valuation allowance was $0.8 million, which was attributable to the addition of the fiscal 2016 loss and the difference between the actual and estimated prior year losses. There is no tax expense associated with the increase of $0.8 million as the asset and the valuation allowance changes offset each other.
F-28
Table of Contents
Based upon operating results from the three most recent fiscal years, including fiscal 2016, management of the Company has determined that its Mexican subsidiary represents a cumulative loss company. Therefore, management has determined that a valuation allowance for deferred income tax assets is necessary. As such, during fiscal year 2016, the Company established a $0.6 million valuation allowance against the deferred income tax assets of the Mexican subsidiary.
In connection with the 2003 Perry Ellis Menswear acquisition, the Company originally acquired a net deferred tax asset of approximately $53.5 million, net of a $20.3 million valuation allowance. Additionally, the acquisition of Perry Ellis Menswear caused an “ownership change” for federal income tax purposes. As a result, the use of any net operating losses existing at the date of the ownership change to offset future taxable income of the Company is limited by Section 382 of the Internal Revenue Code of 1986, as amended (“Section 382”). As of the acquisition date, Perry Ellis Menswear had available federal net operating losses of which approximately $56.0 million expired unutilized as a result of the annual usage limitations under Section 382.
The Company has available at January 30, 2016, a net federal operating tax loss carry-forward of approximately $36.6 million and an additional $0.3 million of net operating tax loss carry-forward from stock options which will benefit additional paid-in capital when the loss is utilized.
The following table reflects the expiration of the remaining federal net operating losses:
| Fiscal Year |
(in thousands) | |||
| 2017 |
$ | — | ||
| 2018-2023 |
30,621 | |||
| 2024-2027 |
— | |||
| Thereafter |
5,955 | |||
|
|
|
|||
| $ | 36,576 | |||
|
|
|
|||
In addition to the Company’s U.S. federal net operating loss, the Company has reflected in its income tax provision deferred tax assets associated with net operating losses generated in various U.S. state jurisdictions. However, with respect to jurisdictions where the Company either has limited operations or statutory limitations on the use of acquired net operating losses, the ability to utilize such losses is restricted. Therefore, management has determined that a valuation allowance for deferred income tax assets is necessary, as the assets are not expected to be fully realized. The balance of the valuation allowance associated with U.S. state net operating losses in states where use is restricted for fiscal 2016 and 2015 was $2.7 million and $2.7 million, respectively. During fiscal 2016, the valuation allowance did not change and during fiscal 2015 the valuation allowance increased by $0.4 million.
At the end of fiscal 2016, the Company had a $1.3 million deferred tax asset relating to charitable contribution carryovers. These charitable contributions originated in fiscal years 2012 through 2015. Management believes it is more likely than not that the deferred tax asset associated with the charitable contributions that originated in 2012 through 2016 will not be realized during the carryforward period, which begins to expire in fiscal year 2017. The balance of the valuation allowance associated with charitable contributions whose use will be restricted due to carryforward limitations for fiscal 2016 and 2015 was $1.3 million and $1.4 million, respectively. During fiscal 2016 and 2015, the valuation allowance decreased by $0.1 million and increased by $0.8 million, respectively. During fiscal 2016 the net decrease in the valuation allowance of $0.1 million was attributable to the expiration of the fiscal 2011 carryovers and the addition of the fiscal 2016 carryovers.
At the end of fiscal 2016, the Company maintained a $46.2 million valuation allowance against its remaining domestic deferred tax asset; including, but not limited to, the federal net operating loss carryforward and the U.S. state net operating loss carryforwards, whose utilization is not restricted by factors beyond the Company’s control. The establishment of valuation allowances and development of projected annual effective tax rates requires significant judgment and is impacted by various estimates. Both positive and negative evidence, as
F-29
Table of Contents
well as the objectivity and verifiability of that evidence, is considered in determining the appropriateness of recording a valuation allowance on deferred tax assets. An accumulation of recent pretax losses is considered strong negative evidence in that evaluation. The Company’s performance during the past fiscal year led to the cumulative pretax results for the past 36 months to reach loss positions. The Company would be able to remove the valuation allowances in future periods when positive evidence outweighs the negative evidence from the relevant look-back period. However, the actual timing and amount of potential removal of the valuation allowances currently cannot be reliably estimated. The short-term consequence of being unable to record deferred tax benefits may cause the Company’s effective tax rate to change significantly from period to period. The balance of the valuation allowance associated with the remaining deferred tax assets whose utilization is not restricted by factors beyond the Company’s control, for fiscal 2016 and 2015 was $46.2 million and $42.4 million, respectively. During fiscal 2016 and 2015, the valuation allowance increased by $3.8 million and $42.4 million, respectively.
Deferred taxes have not been recognized on approximately $77.1 million of unremitted earnings of certain foreign subsidiaries of the Company based on the “indefinite reversal” criteria. No provision is made for income tax that would be payable upon the distribution of earnings, and it is not practicable to determine the amount of the related unrecognized deferred income tax liability because of the complexity of the hypothetical calculation.
The federal and state income tax provisions do not reflect the tax savings resulting from deductions associated with the Company’s stock option plans. These savings were $0.0 million, ($0.2) million, and $0.1 million for fiscal 2016, 2015 and 2014, respectively.
The Company or one of its subsidiaries files income tax returns in the U.S. federal jurisdiction, and various states and foreign jurisdictions. The Company’s U.S. federal income tax returns for fiscal 2011 through 2016 are open tax years. The statute of limitations related to the Company’s 2011, 2012 and 2013 U.S. federal tax years was extended by agreement with the Internal Revenue Service until December 31, 2016. The Company’s state and foreign tax filings are subject to varying statutes of limitations. The Company’s unrecognized state tax benefits are related to state tax returns open from 2005 through 2016, depending on each state’s particular statute of limitation. During the fiscal year ended January 30, 2016, the U.S. federal income tax return for fiscal year 2013 was selected for examination by the Internal Revenue Service. Furthermore, various other state and local income tax returns are also under examination by taxing authorities.
As of January 31, 2015, the Company had a $1.0 million liability recorded for unrecognized tax benefits, which included interest and penalties of $0.2 million. As of January 30, 2016, the Company had a $1.1 million liability recorded for unrecognized tax benefits, which included interest and penalties of $0.2 million. All of the unrecognized tax benefits, if recognized, would affect the Company’s effective tax rate.
F-30
Table of Contents
A reconciliation of the beginning balance of the Company’s unrecognized tax benefits and the ending amount of the unrecognized tax benefits is as follows as of:
| January 30, 2016 |
January 31, 2015 |
February 1, 2014 |
||||||||||
| (in thousands) | ||||||||||||
| Balance at beginning of period |
$ | 1,018 | $ | 841 | $ | 648 | ||||||
| Additions based on tax positions related to the current year |
98 | 80 | 113 | |||||||||
| Deductions based on tax positions related to the current year |
— | (7 | ) | — | ||||||||
| Additions for tax positions of prior years |
123 | 327 | 192 | |||||||||
| Reductions for tax positions of prior years |
(2 | ) | (46 | ) | (61 | ) | ||||||
| Reductions due to lapses of statutes of limitations |
(49 | ) | — | (51 | ) | |||||||
| Settlements |
(97 | ) | (177 | ) | — | |||||||
|
|
|
|
|
|
|
|||||||
| Balance at end of period |
$ | 1,091 | $ | 1,018 | $ | 841 | ||||||
|
|
|
|
|
|
|
|||||||
The Company recognizes interest and penalties accrued related to unrecognized tax benefits as a component of income tax expense. During fiscal 2016, there was an immaterial change in interest and penalties, comparatively, for fiscal 2015 and 2014, the Company recognized approximately $0.1 million and $0.2 million in interest and penalties, respectively. The Company had approximately $0.2 million and $0.2 million for the payment of interest and penalties accrued at January 30, 2016 and January 31, 2015, respectively.
In the next twelve months it is reasonably possible the Company could resolve the examinations related to the 2011, 2012 and 2013 tax years.
| 19. | Fair Value Measurements |
Accounts receivable, accounts payable, accrued interest payable and accrued expenses. The carrying amounts reported in the consolidated balance sheets approximate fair value due to the short-term nature of these instruments.
Investments. (classified within Level 1 of the valuation hierarchy) – The carrying amounts of the available-for-sale investments are measured at fair value on a recurring basis in the consolidated balance sheets.
Real estate mortgages. (classified within Level 2 of the valuation hierarchy) - The carrying amounts of the real estate mortgages were approximately $22.0 million and $23.0 million at January 30, 2016 and January 31, 2015, respectively. The carrying values of the real estate mortgages at January 30, 2016 and January 31, 2015, approximate their fair values since the interest rates approximate market.
Senior credit facility. The carrying amount of the senior credit facility approximates fair value due to the frequent resets of its floating interest rate.
Senior subordinated notes payable. (classified within Level 1 of the valuation hierarchy) - The carrying amounts of the 7 7⁄8% senior subordinated notes payable were approximately $50.0 million and $150.0 million at January 30, 2016 and January 31, 2015. The fair value of the 7 7⁄8% senior subordinated notes payable was approximately $49.0 million and $157.0 million as of January 30, 2016 and January 31, 2015, respectively, based on quoted market prices.
These estimated fair value amounts have been determined using available market information and appropriate valuation methods.
F-31
Table of Contents
| 20. | Accumulated Other Comprehensive Loss |
Changes in accumulated other comprehensive loss by component, net of tax, are as follows:
| Unrealized Loss on Pension Liability |
Foreign Currency Translation Adjustments, Net |
Unrealized Loss on Investments |
Total | |||||||||||||
| (in thousands) | ||||||||||||||||
| Balance, January 31, 2015 |
$ | (8,085 | ) | $ | (4,774 | ) | $ | 7 | $ | (12,852 | ) | |||||
| Other comprehensive loss before reclassifications |
(4,248 | ) | (2,357 | ) | (16 | ) | (6,621 | ) | ||||||||
| Amounts reclassified from accumulated other comprehensive loss |
4,965 | — | — | 4,965 | ||||||||||||
|
|
|
|
|
|
|
|
|
|||||||||
| Balance, January 30, 2016 |
$ | (7,368 | ) | $ | (7,131 | ) | $ | (9 | ) | $ | (14,508 | ) | ||||
|
|
|
|
|
|
|
|
|
|||||||||
| Unrealized Loss on Pension Liability |
Foreign Currency Translation Adjustments, Net |
Unrealized Gain on Investments |
Total | |||||||||||||
| (in thousands) | ||||||||||||||||
| Balance, February 1, 2014 |
$ | (5,866 | ) | $ | (1,563 | ) | $ | (39 | ) | $ | (7,468 | ) | ||||
| Other comprehensive (loss) income before reclassifications |
(2,618 | ) | (3,211 | ) | 46 | (5,783 | ) | |||||||||
| Amounts reclassified from accumulated other comprehensive loss |
399 | — | — | 399 | ||||||||||||
|
|
|
|
|
|
|
|
|
|||||||||
| Balance, January 31, 2015 |
$ | (8,085 | ) | $ | (4,774 | ) | $ | 7 | $ | (12,852 | ) | |||||
|
|
|
|
|
|
|
|
|
|||||||||
| Unrealized Gain on Pension Liability |
Foreign Currency Translation Adjustments, Net |
Unrealized Loss on Investments |
Total | |||||||||||||
| (in thousands) | ||||||||||||||||
| Balance, February 2, 2013 |
$ | (7,176 | ) | $ | (884 | ) | $ | — | $ | (8,060 | ) | |||||
| Other comprehensive income (loss) before reclassifications |
984 | (679 | ) | (39 | ) | 266 | ||||||||||
| Amounts reclassified from accumulated other comprehensive loss |
326 | — | — | 326 | ||||||||||||
|
|
|
|
|
|
|
|
|
|||||||||
| Balance, February 1, 2014 |
$ | (5,866 | ) | $ | (1,563 | ) | $ | (39 | ) | $ | (7,468 | ) | ||||
|
|
|
|
|
|
|
|
|
|||||||||
A summary of the impact on the consolidated statements of operations line items is as follows:
| January 30, 2016 |
January 31, 2015 |
February 1, 2014 |
||||||||||||
| (in thousands) | ||||||||||||||
| Amortization of defined benefit pension items |
||||||||||||||
| Actuarial losses |
$ | 538 | $ | 399 | $ | 533 | Selling, general and administrative expenses | |||||||
| Lump sum settlement |
$ | 4,427 | $ | — | $ | — | Selling, general and administrative expenses | |||||||
| Tax benefit |
— | — | (207 | ) | Income tax benefit | |||||||||
|
|
|
|
|
|
|
|||||||||
| Total, net of tax |
$ | 4,965 | $ | 399 | $ | 326 | ||||||||
|
|
|
|
|
|
|
|||||||||
| 21. | Related Party Transactions |
The Company leases approximately 16,000 square feet for administrative offices, and leased approximately 50,000 square feet for warehouse distribution and retail, at facilities owned by our Chairman of the Board and CEO, George Feldenkreis. These facilities were designed specifically for use by the Company and were originally leased by the Company under a 10-year lease for the office space and a 10-year lease for the warehouse and retail space. These facilities are in close proximity to our Miami, Florida headquarters. During the first half of fiscal 2015, the Company amended the leases to extend the term for five years, beginning July 1, 2014 and expiring June 30, 2019. Pursuant to those amendments, beginning July 1, 2014, the basic monthly rent became $41,750 and increases 3% on the first month of each of the remaining 12-month periods during the extended term.
Rent expense, including insurance and taxes, for these leases amounted to approximately $487,000, or $9.87 per square foot , $610,000, or $9.25 per square foot and $602,000, or $9.13 per square foot, for the years ended January 30, 2016, January 31, 2015, and February 1, 2014, respectively.
As of October 1, 2014, the Company transitioned its operations out of the warehouse space. In order to minimize the costs associated with an early termination of the lease relating to the warehouse and retail space, the Company engaged a real estate broker to assist us in finding a replacement tenant and agreed to be responsible for the related brokerage fees incurred of approximately $215,000. The retained broker identified a new tenant for the warehouse and retail space that is unrelated to the Company. The Company entered into a lease termination agreement relating to the warehouse and retail space on April 13, 2015. The Company incurred $180,000 of lease
F-32
Table of Contents
termination fees, including costs related to certain tenant improvements such as painting the interior and exterior of the building and improvements to the parking lot, which were agreed upon in order to induce the new tenant to lease the space and allow the Company to terminate the lease prior to its expiration.
Because of the termination of the warehouse and retail lease, the basic monthly rent has been reduced to $14,666 and will increase 3% on the first of each of the remaining 12-month periods during the extended term.
During the years ended January 30, 2016, January 31, 2015, and February 1, 2014, the Company chartered an aircraft from a third party aircraft charter business, who chartered the aircraft from an entity controlled by the Chairman and the President and Chief Operating Officer (the “President”). During fiscal 2016, the Company still charters aircrafts from the same third party aircraft charter business; however, the aircraft it charters is no longer the one owned by its CEO and President/COO. In fiscal 2016, the Company paid $42,000 for flights related to the aircraft owned by its CEO and President/COO. For the years ended January 31, 2015, and February 1, 2014, respectively, the Company paid, under the previous agreement, to the third party, $1.6 million and $1.5 million.
The Company is a party to licensing agreements with Isaco International, Inc. (“Isaco”), pursuant to which Isaco has been granted the exclusive license to use various Perry Ellis trademarks in the United States and Puerto Rico to market a line of men’s underwear, hosiery and loungewear. The principal shareholder of Isaco is the father-in-law of the Company’s President. Royalty income earned from the Isaco license agreements amounted to approximately $2.1 million, $2.3 million and $2.2 million for the years ended January 30, 2016, January 31, 2015, and February 1, 2014, respectively. Advertising reimbursements from the Isaco license agreements amounted to approximately $0.5 million for each of the years ended January 30, 2016, January 31, 2015, and February 1, 2014. In addition, the Company has purchased product from Isaco for sales in its direct to consumer business. Total product purchased amounted to approximately $0.7 million, $0.8 million and $0.8 million for the years ended January 30, 2016, January 31, 2015, and February 1, 2014, respectively.
The Company is party to an agreement with Sprezzatura Insurance Group LLC. Joseph Hanono, the grandson of the Company’s Chief Executive Officer, is a member of Sprezzatura Insurance Group. The Company paid under this agreement, to this third party $0.9 million $1.0 million and $1.0 million in premiums for property and casualty insurance for the years ended January 30, 2016, January 31, 2015, and February 1, 2014, respectively.
The Company appointed Alexandra Wilson, co-founder and at such time was Head of Strategic Alliances of Gilt Groupe, Inc., to the Board of Directors effective February 20, 2014. Gilt is the innovative online shopping destination founded in 2007, offering highly-coveted luxury lifestyle products and experiences to over eight million members. The Company’s net sales to Gilt were $0.6 million and $0.4 million for the years ended January 31, 2015, and February 1, 2014, respectively. After December 2014, Alexandra Wilson was no longer an officer or director of Gilt Groupe, Inc.
| 22. | Equity |
During the third quarter of fiscal 2016, the Board of Directors extended the stock repurchase program to authorize the Company to purchase, from time to time and as market and business conditions warranted, up to $70 million of the Company’s common stock for cash in the open market or in privately negotiated transactions through October 31, 2016. Although the Board of Directors allocated a maximum of $70 million to carry out the program, the Company is not obligated to purchase any specific number of outstanding shares and will reevaluate the program on an ongoing basis. Total purchases under the plan to date amount to approximately $58.6 million. Purchases of treasury shares are subject to certain covenants under the senior credit facility and the indenture governing the senior subordinated notes. See footnotes 11 and 12 to the consolidated financial statements for further information.
During fiscal 2016, 2015 and 2014, the Company repurchased shares of its common stock at a cost of $7.0 million, $8.8 million and $7.0 million, respectively. There were no treasury shares outstanding as of January 30, 2016, and as of January 31, 2015, there were 770,753 shares of treasury stock outstanding at a cost of approximately $15.7 million.
F-33
Table of Contents
During fiscal 2016, the Company retired shares of treasury stock recorded at a cost of approximately $22.7 million. Accordingly, the Company reduced common stock and additional paid in capital by $11,000 and $22.7 million, respectively.
| 23. | Stock Options, SARS and Restricted Shares |
In 2002, the Company adopted the 2002 Stock Option Plan (the “2002 Plan”). The 2002 Plan was amended in 2003 to increase the number of shares reserved for issuance thereunder, among other changes. As amended, the 2002 Plan allowed the Company to grant Options to purchase up to an aggregate of 1,500,000 shares of the Company’s common stock. In 2005, the Company adopted the 2005 Long-Term Incentive Compensation Plan (the “2005 Plan”). The 2005 Plan allowed the Company to grant Options and other awards to purchase or receive up to an aggregate of 2,250,000 shares of the Company’s common stock, reduced by any awards outstanding under the 2002 Plan. On March 13, 2008, the Board of Directors unanimously adopted an amendment and restatement of the 2005 Plan that increased the number of shares available for grants to an aggregate of 4,750,000 shares of common stock. On March 17, 2011, the Board of Directors unanimously adopted the second amendment and restatement of the 2005 Plan, which increased the number of shares available for grants by an additional 500,000 shares to an aggregate of 5,250,000 shares of common stock. On May 20, 2015, the Board of Directors unanimously adopted, subject to shareholder approval at the annual meeting, the Perry Ellis International, Inc. 2015 Long Term Incentive Compensation Plan, which is an amendment and restatement of the 2005 Plan (the “2015 Plan, and collectively with the 2002 Plan and the prior 2005 Plan, as amended, the “Stock Plans”). The amendment was approved by the shareholders at the Company’s 2015 annual meeting.
The 2015 Plan extends the existing term until July 17, 2025 as well as increases the number of shares of common stock reserved for issuance by an additional 1,000,000 shares to an aggregate of 6,250,000 shares.
The Stock Plans are designed to serve as an incentive for attracting and retaining qualified and competent employees, officers, directors, consultants, and other persons who provide services to the Company.
The 2015 Plan provides for the grants of Incentive Stock Options and Nonstatutory Stock Options. An Incentive Stock Option is an option to purchase common stock, which meets the requirements set forth under Section 422 of the Internal Revenue Code of 1986, as amended (“Section 422”). A Nonstatutory Stock Option is an option to purchase common stock, which meets the requirements of the 2015 Plan, but does not meet the definition of an “incentive stock option” under Section 422.
The 2015 Plan is administered by the Compensation Committee of the Board of Directors (the “Committee”), which is comprised of two or more non-employee directors. Subject to the terms of the 2015 Plan, the Committee determines the participants, the allotment of shares to participants, and the term of the options. The Committee also determines the exercise price and certain other terms of the options; provided, however that the per share exercise price of options granted under the 2015 Plan may not be less than the fair market value of the common stock on the date of grant, and in the case of an Incentive Stock Option granted to a 10% shareholder, the per share exercise price cannot be less than 110% of the fair market value of the common stock on the date of grant.
The following table lists information regarding shares under the 2015 Plan as of January 30, 2016:
| Shares Underlying Outstanding Grants |
Unvested Restricted Shares |
Shares Available for Grant |
||||||||||
| 2015 Stock Option Plan |
542,019 | 612,018 | 1,125,491 | |||||||||
F-34
Table of Contents
During fiscal 2016, the Company granted an aggregate of 8,130 SARs, to be settled in shares of common stock to two new directors. The SARs have an exercise price of $23.38, generally vest over a three-year period and have a seven-year term, at an estimated value, based on the Black-Scholes Option Pricing Model, of approximately $0.1 million. This value is being recorded as compensation expense on a straight-line basis over the vesting period of the restricted stock.
During fiscal 2015, the Company granted SARS to purchase shares of common stock to certain key employees. The Company awarded an aggregate of 3,501 SARS with an exercise price of $20.12, which generally vest over a three-year period and have a seven-year term. The total fair value of the SARS, based on the Black-Scholes Option Pricing Model, amounted to approximately $38,000, which is being recorded as compensation expense on a straight-line basis over the vesting period of each SAR.
Also, during fiscal 2015, the Company granted an aggregate of 5,883, 5,157 and 3,816 SARs, to be settled in shares of common stock, to three directors, respectively. The SARs have an exercise price of $15.49, $17.71 and $24.26, respectively, generally vest over a three-year period and have a seven-year term. The total fair value of the SARs, based on the Black-Scholes Option Pricing Model, amounted to approximately $50,000, $50,000 and $50,000 respectively, which is being recorded as compensation expense on a straight-line basis over the vesting period of each SAR.
During fiscal 2014, the Company granted SARS to purchase shares of common stock to certain key employees. The Company awarded an aggregate of 14,000 SARS with exercise prices ranging from $16.79 to $18.57, which generally vest over a three-year period and have a seven-year term. The total fair value of the SARS, based on the Black-Scholes Option Pricing Model, amounted to approximately $0.1 million, which is being recorded as compensation expense on a straight-line basis over the vesting period of each SAR.
A summary of the stock option and SARS activity for grants issued under the 2002 Plan and 2015 Plan is as follows:
| Option and SARS Price Per Share | ||||||||||||||||||||||||||||
| Number of Shares |
Low | High | Weighted | Weighted Average Exercise Price |
Weighted Average Remaining Contractual Life (years) |
Aggregate Intrinsic Value (in thousands) |
||||||||||||||||||||||
| Outstanding February 2, 2013 |
1,284,125 | $ | 16.86 | 4.46 | $ | 6,281 | ||||||||||||||||||||||
| Vested or expected to vest |
1,284,125 | $ | 16.86 | 4.46 | $ | 6,281 | ||||||||||||||||||||||
| Options and SARS Exercisable |
779,986 | $ | 13.99 | 4.58 | $ | 5,817 | ||||||||||||||||||||||
| Granted |
14,000 | $ | 16.79 | $ | 18.57 | $ | 18.10 | |||||||||||||||||||||
| Exercised |
(33,230 | ) | $ | 4.63 | $ | 4.89 | $ | 4.68 | ||||||||||||||||||||
| Cancelled |
(48,323 | ) | $ | 13.29 | $ | 28.38 | $ | 19.63 | ||||||||||||||||||||
|
|
|
|
|
|
|
|
|
|||||||||||||||||||||
| Outstanding February 1, 2014 |
1,216,572 | $ | 17.12 | 3.56 | $ | 3,657 | ||||||||||||||||||||||
| Vested or expected to vest |
1,216,572 | $ | 17.12 | 3.56 | $ | 3,657 | ||||||||||||||||||||||
| Options and SARS Exercisable |
959,971 | $ | 16.24 | 3.51 | $ | 3,653 | ||||||||||||||||||||||
| Granted |
18,357 | $ | 15.49 | $ | 24.26 | $ | 18.82 | |||||||||||||||||||||
| Exercised |
(52,574 | ) | $ | 4.89 | $ | 20.59 | $ | 14.42 | ||||||||||||||||||||
| Cancelled |
(151,725 | ) | $ | 16.59 | $ | 28.38 | $ | 17.25 | ||||||||||||||||||||
|
|
|
|
|
|
|
|
|
|||||||||||||||||||||
| Outstanding January 31, 2015 |
1,030,630 | $ | 17.27 | 3.49 | $ | 7,905 | ||||||||||||||||||||||
| Vested or expected to vest |
1,030,630 | $ | 17.27 | 3.49 | $ | 7,905 | ||||||||||||||||||||||
| Options and SARS Exercisable |
912,273 | $ | 17.13 | 2.98 | $ | 7,238 | ||||||||||||||||||||||
| Granted |
8,130 | $ | 23.38 | $ | 23.38 | $ | 23.38 | |||||||||||||||||||||
| Exercised |
(487,834 | ) | $ | 4.63 | $ | 22.46 | $ | 10.60 | ||||||||||||||||||||
| Cancelled |
(8,907 | ) | $ | 18.19 | $ | 30.00 | $ | 23.74 | ||||||||||||||||||||
|
|
|
|
|
|
|
|
|
|||||||||||||||||||||
| Outstanding January 30, 2016 |
542,019 | $ | 23.25 | 2.06 | $ | 752 | ||||||||||||||||||||||
| Vested or expected to vest |
542,019 | $ | 23.25 | 2.06 | $ | 752 | ||||||||||||||||||||||
| Options and SARS Exercisable |
516,651 | $ | 23.41 | 1.84 | $ | 729 | ||||||||||||||||||||||
F-35
Table of Contents
The aggregate intrinsic value for stock options and SARS in the preceding table represents the total pre-tax intrinsic value based on the Company’s closing stock price of $19.01, $23.91 and $15.67 at January 30, 2016, January 31, 2015 and February 1, 2014, respectively. This amount represents the total pre-tax intrinsic value that would have been received by the holders of the stock-based awards had the awards been exercised and sold as of that date. The total intrinsic value of stock options and SARS exercised in fiscal 2016, 2015 and 2014 was approximately $7.4 million, $0.3 million and $0.5 million, respectively. The total fair value of stock options and SARS vested in fiscal 2016, 2015 and 2014 was approximately $1.0 million, $1.9 million and $2.9 million, respectively.
Additional information regarding options and SARS outstanding and exercisable as of January 30, 2016 is as follows:
| Options and SARS Outstanding | Options and SARS Exercisable | |||||||||||||||||||||
| Range of Exercise Prices |
Number Outstanding |
Weighted Average Remaining Contractual Life (in years) |
Weighted Average Exercise Price |
Number Exercisable |
Weighted Average Exercise Price |
|||||||||||||||||
| $ | 4.00 - $ 5.00 | 46,768 | 3.15 | $ | 4.67 | 46,768 | $ | 4.67 | ||||||||||||||
| $ | 15.00 - $21.00 | 84,893 | 3.12 | $ | 18.15 | 70,199 | $ | 18.29 | ||||||||||||||
| $ | 23.00 - $26.00 | 232,536 | 1.43 | $ | 24.85 | 221,862 | $ | 24.91 | ||||||||||||||
| $ | 27.00 - $31.00 | 177,822 | 2.09 | $ | 28.49 | 177,822 | $ | 28.49 | ||||||||||||||
|
|
|
|
|
|||||||||||||||||||
| 542,019 | 516,651 | |||||||||||||||||||||
|
|
|
|
|
|||||||||||||||||||
Restricted Stock – Under the 2015 Plan, restricted stock awards are granted subject to restrictions on transferability, risk of forfeiture and other restrictions, if any, as the Committee may impose, or as otherwise provided in the 2015 Plan, covering a period of time specified by the Committee. The terms of any restricted stock awards granted under the 2015 Plan are set forth in a written Award Agreement, which contains provisions determined by the Committee and not inconsistent with the 2015 Plan. The restrictions may lapse separately or in combination at such times, under such circumstances (including based on achievement of performance goals and/or future service requirements), in such installments or otherwise, as the Committee may determine at the date of grant or thereafter. Except to the extent restricted under the terms of the 2005 Plan and any Award Agreement relating to a restricted stock award, a participant granted restricted stock shall have all of the rights of a shareholder, including the right to vote the restricted stock and the right to receive dividends thereon (subject to any mandatory reinvestment or other requirement imposed by the Committee). During the Restriction Period (as defined in the 2005 Plan), the restricted stock may not be sold, transferred, pledged, hypothecated, margined or otherwise encumbered by the participant.
During fiscal 2016, the Company granted an aggregate of 219,566 shares of restricted stock to certain key employees, which vest primarily over a three-year period, at an estimated value of $5.4 million. This value is being recorded as compensation expense on a straight-line basis over the vesting period of the restricted stock.
Also, during fiscal 2016, the Company awarded to five directors an aggregate of 12,840 shares of restricted stock. The restricted stock awarded vests primarily over a three-year period, at an estimated value of $0.3 million. This value is being recorded as compensation expense on a straight-line basis over the vesting period of the restricted stock.
During fiscal 2016, of the 242,968 restricted shares that vested, a total of 91,083 shares had 27,325 shares withheld to cover the employees’ minimum statutory income tax requirements. The estimated value of the withheld shares was $0.7 million.
During fiscal 2015, the Company granted an aggregate of 255,390 shares of restricted stock to certain key employees, with an estimated value of $3.8 million, which vest over a three to five year period.
During fiscal 2015, the Company awarded to six directors an aggregate of 18,186 shares of restricted stock, which vest over a three-year period at an estimated value of $0.3 million.
F-36
Table of Contents
During fiscal 2015, of the 223,595 restricted shares that vested, a total of 52,389 shares had 21,809 shares withheld to cover the employees’ minimum statutory income tax requirements, respectively. The estimated value of the withheld shares was $0.4 million.
During fiscal 2014, the Company granted performance based restricted stock to certain key employees pursuant to the Company’s Second Amended and Restated 2005 Long-Term Incentive Compensation Plan, as amended, and subject to certain conditions in the grant agreement. Such stock generally vests 100% in April 2016, provided that each employee is still an employee of the Company on such date, and the Company has met certain performance criteria. A total of 109,644 shares of performance-based restricted stock were issued at an estimated value of $1.9 million. Additionally, the Company granted an aggregate of 480,598 shares of restricted stock to certain key employees, with an estimated value of $8.9 million, which vest over a three to five year period.
During fiscal 2014, the Company awarded to five directors an aggregate of 13,740 shares of restricted stock, which vest over a three-year period at an estimated value of $0.3 million.
During fiscal 2014, the Company reversed approximately $0.3 million of previously recognized compensation expense into earnings since it was no longer probable that the previously established performance targets would be met with respect to certain performance based restricted shares granted during fiscal 2014 and those equity awards were no longer expected to vest. Additionally, in connection with these long-term incentive plans, the cash portion, which was also subject to performance-based targets, was reversed in the amount of approximately $0.5 million of previously recognized compensation.
The values of the restricted stock expected to vest are being recorded as compensation expense on a straight-line basis over the vesting period of the restricted shares. The fair value of restricted stock grants is estimated on the date of grant and is generally equal to the closing stock price of the Company’s common stock on the date of grant.
The following table summarizes the restricted stock-based award activity:
| Restricted Shares |
Weighted Average Grant Price |
Weighted Average Remaining Vesting Period |
||||||||||
| Unvested as of February 2, 2013 |
328,307 | $ | 18.26 | 3.54 | ||||||||
| Granted |
603,982 | |||||||||||
| Vested |
(142,052 | ) | ||||||||||
| Forfeited |
(61,915 | ) | ||||||||||
|
|
|
|
|
|
|
|||||||
| Unvested as of February 1, 2014 |
728,322 | $ | 18.80 | 2.34 | ||||||||
| Granted |
273,576 | |||||||||||
| Vested |
(223,595 | ) | ||||||||||
| Forfeited |
(60,992 | ) | ||||||||||
|
|
|
|
|
|
|
|||||||
| Unvested as of January 31, 2015 |
717,311 | $ | 17.18 | 1.84 | ||||||||
| Granted |
232,406 | |||||||||||
| Vested |
(242,968 | ) | ||||||||||
| Forfeited |
(94,731 | ) | ||||||||||
|
|
|
|
|
|
|
|||||||
| Unvested as of January 30, 2016 |
612,018 | $ | 19.79 | 1.55 | ||||||||
As of January 30, 2016, the total unrecognized compensation cost related to unvested stock options and SARS outstanding under the Stock Plans is approximately $0.2 million. That cost is expected to be recognized
F-37
Table of Contents
over a weighted-average period of 2 years. As of January 30, 2016, the total unrecognized compensation cost related to unvested restricted stock was approximately $7.5 million, which is expected to be recognized over a weighted-average period of 3 years.
| 24. | Segment Information |
The Company has four reportable segments: Men’s Sportswear and Swim, Women’s Sportswear, Direct-to-Consumer and Licensing. The Men’s Sportswear and Swim and Women’s Sportswear segments derive revenues from the design, import and distribution of apparel to department stores and other retail outlets, principally throughout the United States. The Direct-to-Consumer segment derives its revenues from the sale of the Company’s branded and licensed products through the Company’s retail stores and e-commerce platform. The Licensing segment derives its revenues from royalties associated from the use of the Company’s brand names, principally Perry Ellis, Original Penguin, Laundry, Gotcha, Pro Player, Farah, Ben Hogan, John Henry, Jantzen, and Savane. See footnote 2 to the consolidated financial statements for disclosure of major customers.
The Company allocates certain corporate selling, general and administrative expenses based primarily on the revenues generated by the segments.
F-38
Table of Contents
| January 30, 2016 |
January 31, 2015 |
February 1, 2014 |
||||||||||
| (in thousands) | ||||||||||||
| Revenues: |
||||||||||||
| Men’s Sportswear and Swim |
$ | 640,600 | $ | 635,182 | $ | 664,824 | ||||||
| Women’s Sportswear |
127,692 | 130,852 | 135,994 | |||||||||
| Direct-to-Consumer |
96,514 | 92,203 | 81,755 | |||||||||
| Licensing |
34,709 | 31,735 | 29,651 | |||||||||
|
|
|
|
|
|
|
|||||||
| Total revenues |
$ | 899,515 | $ | 889,972 | $ | 912,224 | ||||||
|
|
|
|
|
|
|
|||||||
| Depreciation and amortization |
||||||||||||
| Men’s Sportswear and Swim |
$ | 7,375 | $ | 6,627 | $ | 7,043 | ||||||
| Women’s Sportswear |
2,250 | 1,903 | 1,899 | |||||||||
| Direct-to-Consumer |
3,884 | 3,519 | 3,549 | |||||||||
| Licensing |
184 | 149 | 135 | |||||||||
|
|
|
|
|
|
|
|||||||
| Total depreciation and amortization |
$ | 13,693 | $ | 12,198 | $ | 12,626 | ||||||
|
|
|
|
|
|
|
|||||||
| Operating income (loss): |
||||||||||||
| Men’s Sportswear and Swim |
$ | 20,068 | $ | 3,847 | $ | 8,975 | ||||||
| Women’s Sportswear |
(9,248 | ) | 859 | (10,883 | ) | |||||||
| Direct-to-Consumer |
(11,805 | ) | (6,675 | ) | (12,306 | ) | ||||||
| Licensing |
7,649 | 24,877 | (5,155 | ) | ||||||||
|
|
|
|
|
|
|
|||||||
| Total operating income (loss) |
6,664 | 22,908 | (19,369 | ) | ||||||||
| Costs on early extinguishment of debt |
5,121 | — | — | |||||||||
| Total interest expense |
9,267 | 14,291 | 15,025 | |||||||||
|
|
|
|
|
|
|
|||||||
| Total net (loss) income before income taxes |
$ | (7,724 | ) | $ | 8,617 | $ | (34,394 | ) | ||||
|
|
|
|
|
|
|
|||||||
| Identifiable assets |
||||||||||||
| Men’s Sportswear and Swim |
$ | 308,572 | $ | 330,152 | ||||||||
| Women’s Sportswear |
41,721 | 52,990 | ||||||||||
| Direct-to-Consumer |
20,948 | 27,009 | ||||||||||
| Licensing |
224,182 | 247,620 | ||||||||||
| Corporate |
27,024 | 27,218 | ||||||||||
|
|
|
|
|
|||||||||
| Total identifiable assets |
$ | 622,447 | $ | 684,989 | ||||||||
|
|
|
|
|
|||||||||
Revenues from external customers and long-lived assets excluding deferred taxes related to continuing operations in the United States and foreign countries are as follows:
| January 30, 2016 |
January 31, 2015 |
February 1, 2014 |
||||||||||
| (in thousands) | ||||||||||||
| Revenues |
||||||||||||
| United States |
$ | 785,493 | $ | 786,046 | $ | 821,986 | ||||||
| International |
114,022 | 103,926 | 90,238 | |||||||||
|
|
|
|
|
|
|
|||||||
| Total revenues |
$ | 899,515 | $ | 889,972 | $ | 912,224 | ||||||
|
|
|
|
|
|
|
|||||||
F-39
Table of Contents
Long-lived assets at years ended,
| January 30, 2016 |
January 31, 2015 |
|||||||
| (in thousands) | ||||||||
| United States |
$ | 216,847 | $ | 242,802 | ||||
| International |
34,980 | 38,054 | ||||||
|
|
|
|
|
|||||
| Total long-lived assets |
$ | 251,827 | $ | 280,856 | ||||
|
|
|
|
|
|||||
| 25. | Commitments and Contingencies |
The Company has licensing agreements, as licensee, for the use of certain branded and designer labels. The license agreements expire on varying dates through December 2019. Total royalty payments under these license agreements amounted to approximately $13.2 million, $13.8 million and $12.8 million for the years ended January 30, 2016, January 31, 2015 and February 1, 2014, respectively, and were classified as cost of sales. Under certain licensing agreements, the Company has to pay certain guaranteed minimum payments. Future minimum payments under these contracts amount to $37.2 million.
The Company leases approximately 16,000 square feet for administrative offices, from its Chairman. During fiscal 2015, the Company amended the lease to extend the term for 60 months, beginning July 1, 2014 and expiring June 30, 2019. Beginning July 1, 2014, the basic monthly rent was $14,666, which increases 3% on the first of each of the remaining 12-month periods during the extended term.
The Company leases several locations for offices, showrooms and retail stores primarily throughout the United States. Lease terms generally range from approximately 3 to 15 years, including anticipated renewal options. The leases generally provide for minimum annual rental payments and are subject to escalations based upon increases in the consumer price index, contractual base rent increases, real estate taxes and other costs. In addition, certain leases contain contingent rental provisions based upon the sales of the underlying retail stores. Certain leases also provide for rent deferral during the initial term of such lease, landlord contributions, and/or scheduled minimum rent increases during the terms of the leases. These leases are classified as either capital leases or operating leases as appropriate. For financial reporting purposes, rent expense associated with operating leases is recorded on a straight-line basis over the life of the lease. These leases expire through 2028. Minimum aggregate annual commitments for the Company’s non-cancelable, unrelated operating lease commitments are as follows:
| Year Ending |
Amount | |||
| (in thousands) | ||||
| 2017 |
$ | 22,369 | ||
| 2018 |
21,251 | |||
| 2019 |
19,743 | |||
| 2020 |
18,473 | |||
| 2021 |
17,685 | |||
| Thereafter |
78,579 | |||
|
|
|
|||
| Total |
$ | 178,100 | ||
|
|
|
|||
Rent expense for these operating leases, including the related party rent payments discussed in footnote 21 to the consolidated financial statements amounted to $27.2 million, $26.2 million, and $26.5 million for the years ended January 30, 2016, January 31, 2015, and February 1, 2014 respectively.
F-40
Table of Contents
Capital lease obligations primarily relate to equipment as indicated in footnote 7 to the consolidated financial statements. The current portion of the capital lease obligation in the amount of $0.3 million is included in accrued expenses and other liabilities. Minimum aggregate annual commitments for the Company’s capital lease obligations are as follows:
| Year Ending |
Amount | |||
| (in thousands) | ||||
| 2017 |
$ | 263 | ||
| 2018 |
284 | |||
| 2019 |
100 | |||
|
|
|
|||
| Total |
$ | 647 | ||
|
|
|
|||
On September 9, 2013, the Company entered into an employment agreement with Stanley Silverstein, the President of International Development and Global Licensing. The term of the agreement ends on September 9, 2018. Pursuant to the employment agreement, Mr. Silverstein receives an annual salary of $500,000, subject to annual reviews for increases at the sole discretion of the Company’s Chief Executive Officer. Additionally, Mr. Silverstein is eligible to participate in the Company’s incentive compensation plans.
The Company was a defendant in Joseph T. Cook v. Perry Ellis International, Inc. and Oscar Feldenkreis, Case No. 1:2015-cv-08290 (New York Southern District Court), involving claims of employment practices, including discrimination and retaliation, which was resolved in January 2016. The parties reached an amicable settlement and such amount was provided for in the Company’s results of operations for fiscal 2016.
The Company was a defendant in Humberto Ordaz v. Perry Ellis International, Inc., Case No. BC490485 (Cal. Sup. Ct. 2012), involving claims for unpaid wages, missed breaks and related claims, which was originally filed on August 17, 2012 by a former employee in our California administrative offices. The plaintiff sought an unspecified amount of damages. The lawsuit was pleaded but not certified as a class action. The parties reached a settlement on August 12, 2015. The settlement amount was provided for in the Company’s results of operations for fiscal 2015.
F-41
Table of Contents
| 26. | Summarized Quarterly Financial Data (Unaudited) |
| First Quarter |
Second Quarter |
Third Quarter |
Fourth Quarter |
Total Year |
||||||||||||||||
| (Dollars in thousands, except per share data) | ||||||||||||||||||||
| FISCAL YEAR ENDED JANUARY 30, 2016 |
||||||||||||||||||||
| Net Sales |
$ | 258,257 | $ | 204,638 | $ | 196,447 | $ | 205,464 | $ | 864,806 | ||||||||||
| Royalty Income |
8,157 | 8,661 | 8,992 | 8,899 | 34,709 | |||||||||||||||
|
|
|
|
|
|
|
|
|
|
|
|||||||||||
| Total Revenues |
266,414 | 213,299 | 205,439 | 214,363 | 899,515 | |||||||||||||||
| Gross Profit |
90,100 | 75,942 | 73,295 | 79,730 | 319,067 | |||||||||||||||
| Net income (loss) |
9,411 | (1,281 | ) | 2,273 | (17,695 | ) | (7,292 | ) | ||||||||||||
| Net income (loss) per share: |
||||||||||||||||||||
| Basic |
$ | 0.64 | ($ | 0.09 | ) | $ | 0.15 | ($ | 1.18 | ) | (0.49 | ) | ||||||||
| Diluted |
$ | 0.62 | ($ | 0.09 | ) | $ | 0.15 | ($ | 1.18 | ) | (0.49 | ) | ||||||||
| FISCAL YEAR ENDED JANUARY 31, 2015 |
||||||||||||||||||||
| Net Sales |
$ | 249,916 | $ | 196,010 | $ | 203,267 | $ | 209,044 | $ | 858,237 | ||||||||||
| Royalty Income |
7,398 | 7,522 | 8,173 | 8,642 | 31,735 | |||||||||||||||
|
|
|
|
|
|
|
|
|
|
|
|||||||||||
| Total Revenues |
257,314 | 203,532 | 211,440 | 217,686 | 889,972 | |||||||||||||||
| Gross Profit |
87,665 | 70,464 | 70,307 | 74,568 | 303,004 | |||||||||||||||
| Net income (loss) |
7,775 | (1,616 | ) | (437 | ) | (42,897 | ) | (37,175 | ) | |||||||||||
| Net income (loss) per share: |
||||||||||||||||||||
| Basic |
$ | 0.53 | ($ | 0.11 | ) | ($ | 0.03 | ) | ($ | 2.90 | ) | ($ | 2.50 | ) | ||||||
| Diluted |
$ | 0.52 | ($ | 0.11 | ) | ($ | 0.03 | ) | ($ | 2.90 | ) | ($ | 2.50 | ) | ||||||
| FISCAL YEAR ENDED FEBRUARY 1, 2014 |
||||||||||||||||||||
| Net Sales |
$ | 255,484 | $ | 204,492 | $ | 214,700 | $ | 207,897 | $ | 882,573 | ||||||||||
| Royalty Income |
6,835 | 7,213 | 7,421 | 8,182 | 29,651 | |||||||||||||||
|
|
|
|
|
|
|
|
|
|
|
|||||||||||
| Total Revenues |
262,319 | 211,705 | 222,121 | 216,079 | 912,224 | |||||||||||||||
| Gross Profit |
88,681 | 68,546 | 71,364 | 74,197 | 302,788 | |||||||||||||||
| Net income (loss) |
11,320 | (2,830 | ) | (3,022 | ) | (28,247 | ) | (22,779 | ) | |||||||||||
| Net income (loss) per share: |
||||||||||||||||||||
| Basic |
$ | 0.75 | ($ | 0.19 | ) | ($ | 0.20 | ) | ($ | 1.91 | ) | ($ | 1.52 | ) | ||||||
| Diluted |
$ | 0.74 | ($ | 0.19 | ) | ($ | 0.20 | ) | ($ | 1.91 | ) | ($ | 1.52 | ) | ||||||
See footnotes 2 and 8 to the consolidated financial statements for further information regarding the impairments on long-lived assets and trademarks that occurred during the fourth quarter ended January 30, 2016 and February 1, 2014. See footnote 18 to the consolidated financial statements for further information regarding the income tax valuation allowance that occurred during the fourth quarter ended January 31, 2015.
27. Condensed Consolidating Financial Statements
The Company and several of its subsidiaries (the “Guarantors”) have fully and unconditionally guaranteed the senior subordinated notes payable on a joint and several basis. These guarantees are subject to release in limited circumstances (only upon the occurrence of certain customary conditions). The following are condensed consolidating financial statements, which present, in separate columns: Perry Ellis International, Inc., (Parent Only), the Guarantors on a combined, or where appropriate, consolidated basis, and the Non-Guarantors on a combined, or where appropriate, consolidated basis. Additional columns present eliminating adjustments and consolidated totals as of January 30, 2016 and January 31, 2015 and for each of the years ended January 30, 2016, January 31, 2015 and February 1, 2014. The combined Guarantors are 100% owned subsidiaries of Perry Ellis International, Inc., and have fully and unconditionally guaranteed the senior subordinated notes payable on a joint and several basis.
F-42
Table of Contents
PERRY ELLIS INTERNATIONAL, INC. AND SUBSIDIARIES
CONDENSED CONSOLIDATING BALANCE SHEET
AS OF JANUARY 30, 2016
(amounts in thousands)
| Parent Only | Guarantors | Non- Guarantors |
Eliminations | Consolidated | ||||||||||||||||
| ASSETS |
||||||||||||||||||||
| Current Assets: |
||||||||||||||||||||
| Cash and cash equivalents |
$ | — | $ | 775 | $ | 31,127 | $ | — | $ | 31,902 | ||||||||||
| Accounts receivable, net |
— | 106,018 | 26,048 | — | 132,066 | |||||||||||||||
| Intercompany receivable, net |
74,132 | — | — | (74,132 | ) | — | ||||||||||||||
| Inventories |
— | 155,703 | 27,047 | — | 182,750 | |||||||||||||||
| Investment, at fair value |
— | — | 9,782 | — | 9,782 | |||||||||||||||
| Deferred income taxes |
— | — | — | — | — | |||||||||||||||
| Prepaid income taxes |
1,017 | — | — | 801 | 1,818 | |||||||||||||||
| Prepaid expenses and other current assets |
— | 7,426 | 1,035 | — | 8,461 | |||||||||||||||
|
|
|
|
|
|
|
|
|
|
|
|||||||||||
| Total current assets |
75,149 | 269,922 | 95,039 | (73,331 | ) | 366,779 | ||||||||||||||
| Property and equipment, net |
— | 61,260 | 2,648 | — | 63,908 | |||||||||||||||
| Other intangible assets, net |
— | 155,587 | 32,332 | — | 187,919 | |||||||||||||||
| Investment in subsidiaries |
267,422 | — | — | (267,422 | ) | — | ||||||||||||||
| Deferred income tax |
— | — | 442 | — | 442 | |||||||||||||||
| Other assets |
431 | 2,191 | 777 | — | 3,399 | |||||||||||||||
|
|
|
|
|
|
|
|
|
|
|
|||||||||||
| TOTAL |
$ | 343,002 | $ | 488,960 | $ | 131,238 | $ | (340,753 | ) | $ | 622,447 | |||||||||
|
|
|
|
|
|
|
|
|
|
|
|||||||||||
| LIABILITIES AND EQUITY |
||||||||||||||||||||
| Current Liabilities: |
||||||||||||||||||||
| Accounts payable |
$ | — | $ | 89,961 | $ | 13,723 | $ | — | $ | 103,684 | ||||||||||
| Accrued expenses and other liabilities |
— | 21,524 | 4,973 | — | 26,497 | |||||||||||||||
| Accrued interest payable |
1,521 | — | — | — | 1,521 | |||||||||||||||
| Income taxes payable |
— | 623 | 272 | (895 | ) | — | ||||||||||||||
| Unearned revenues |
— | 2,952 | 1,261 | — | 4,213 | |||||||||||||||
| Deferred pension obligation |
— | 12,025 | 82 | — | 12,107 | |||||||||||||||
| Intercompany payable, net |
— | 60,425 | 21,449 | (81,874 | ) | — | ||||||||||||||
|
|
|
|
|
|
|
|
|
|
|
|||||||||||
| Total current liabilities |
1,521 | 187,510 | 41,760 | (82,769 | ) | 148,022 | ||||||||||||||
|
|
|
|
|
|
|
|
|
|
|
|||||||||||
| Senior subordinated notes payable, net |
50,000 | — | — | — | 50,000 | |||||||||||||||
| Senior credit facility |
— | 61,758 | — | — | 61,758 | |||||||||||||||
| Real estate mortgages |
— | 21,318 | — | — | 21,318 | |||||||||||||||
| Unearned revenues and other long-term liabilities |
— | 14,608 | 245 | — | 14,853 | |||||||||||||||
| Deferred income taxes |
— | 33,319 | — | 1,696 | 35,015 | |||||||||||||||
|
|
|
|
|
|
|
|
|
|
|
|||||||||||
| Total long-term liabilities |
50,000 | 131,003 | 245 | 1,696 | 182,944 | |||||||||||||||
|
|
|
|
|
|
|
|
|
|
|
|||||||||||
| Total liabilities |
51,521 | 318,513 | 42,005 | (81,073 | ) | 330,966 | ||||||||||||||
|
|
|
|
|
|
|
|
|
|
|
|||||||||||
| Total equity |
291,481 | 170,447 | 89,233 | (259,680 | ) | 291,481 | ||||||||||||||
|
|
|
|
|
|
|
|
|
|
|
|||||||||||
| TOTAL |
$ | 343,002 | $ | 488,960 | $ | 131,238 | $ | (340,753 | ) | $ | 622,447 | |||||||||
|
|
|
|
|
|
|
|
|
|
|
|||||||||||
F-43
Table of Contents
PERRY ELLIS INTERNATIONAL, INC. AND SUBSIDIARIES
CONDENSED CONSOLIDATING BALANCE SHEET
AS OF JANUARY 31, 2015
(amounts in thousands)
| Parent Only | Guarantors | Non- Guarantors |
Eliminations | Consolidated | ||||||||||||||||
| ASSETS |
||||||||||||||||||||
| Current Assets: |
||||||||||||||||||||
| Cash and cash equivalents |
$ | — | $ | 30,055 | $ | 13,492 | $ | — | $ | 43,547 | ||||||||||
| Accounts receivable, net |
— | 114,325 | 23,107 | — | 137,432 | |||||||||||||||
| Intercompany receivable, net |
174,264 | — | — | (174,264 | ) | — | ||||||||||||||
| Inventories |
— | 156,107 | 27,627 | — | 183,734 | |||||||||||||||
| Investments, at fair value |
— | — | 19,996 | — | 19,996 | |||||||||||||||
| Deferred income taxes |
— | — | 725 | — | 725 | |||||||||||||||
| Prepaid income taxes |
5,275 | — | 314 | 795 | 6,384 | |||||||||||||||
| Prepaid expenses and other current assets |
— | 6,159 | 965 | — | 7,124 | |||||||||||||||
|
|
|
|
|
|
|
|
|
|
|
|||||||||||
| Total current assets |
179,539 | 306,646 | 86,226 | (173,469 | ) | 398,942 | ||||||||||||||
| Property and equipment, net |
— | 60,216 | 4,417 | — | 64,633 | |||||||||||||||
| Other intangible assets, net |
— | 176,563 | 33,638 | — | 210,201 | |||||||||||||||
| Goodwill |
— | 6,022 | — | — | 6,022 | |||||||||||||||
| Investment in subsidiaries |
274,714 | — | — | (274,714 | ) | — | ||||||||||||||
| Other assets |
1,809 | 1,926 | 1,456 | — | 5,191 | |||||||||||||||
|
|
|
|
|
|
|
|
|
|
|
|||||||||||
| TOTAL |
$ | 456,062 | $ | 551,373 | $ | 125,737 | $ | (448,183 | ) | $ | 684,989 | |||||||||
|
|
|
|
|
|
|
|
|
|
|
|||||||||||
| LIABILITIES AND EQUITY |
||||||||||||||||||||
| Current Liabilities: |
||||||||||||||||||||
| Accounts payable |
$ | — | $ | 105,046 | $ | 12,743 | $ | — | $ | 117,789 | ||||||||||
| Accrued expenses and other liabilities |
— | 17,945 | 4,410 | — | 22,355 | |||||||||||||||
| Accrued interest payable |
4,045 | — | — | — | 4,045 | |||||||||||||||
| Income taxes payable |
— | 901 | — | (901 | ) | — | ||||||||||||||
| Unearned revenues |
— | 3,023 | 1,833 | — | 4,856 | |||||||||||||||
| Deferred pension obligation |
— | 8,878 | 52 | — | 8,930 | |||||||||||||||
| Deferred income taxes |
— | 797 | — | — | 797 | |||||||||||||||
| Intercompany payable, net |
— | 156,438 | 23,211 | (179,649 | ) | — | ||||||||||||||
|
|
|
|
|
|
|
|
|
|
|
|||||||||||
| Total current liabilities |
4,045 | 293,028 | 42,249 | (180,550 | ) | 158,772 | ||||||||||||||
|
|
|
|
|
|
|
|
|
|
|
|||||||||||
| Senior subordinated notes payable, net |
150,000 | — | — | — | 150,000 | |||||||||||||||
| Real estate mortgages |
— | 22,109 | — | — | 22,109 | |||||||||||||||
| Unearned revenues and other long-term liabilities |
— | 13,620 | 1,389 | — | 15,009 | |||||||||||||||
| Deferred income taxes |
— | 35,383 | 3 | 1,696 | 37,082 | |||||||||||||||
|
|
|
|
|
|
|
|
|
|
|
|||||||||||
| Total long-term liabilities |
150,000 | 71,112 | 1,392 | 1,696 | 224,200 | |||||||||||||||
|
|
|
|
|
|
|
|
|
|
|
|||||||||||
| Total liabilities |
154,045 | 364,140 | 43,641 | (178,854 | ) | 382,972 | ||||||||||||||
|
|
|
|
|
|
|
|
|
|
|
|||||||||||
| Total equity |
302,017 | 187,233 | 82,096 | (269,329 | ) | 302,017 | ||||||||||||||
|
|
|
|
|
|
|
|
|
|
|
|||||||||||
| TOTAL |
$ | 456,062 | $ | 551,373 | $ | 125,737 | $ | (448,183 | ) | $ | 684,989 | |||||||||
|
|
|
|
|
|
|
|
|
|
|
|||||||||||
F-44
Table of Contents
PERRY ELLIS INTERNATIONAL, INC. AND SUBSIDIARIES
CONDENSED CONSOLIDATING STATEMENT OF COMPREHENSIVE (LOSS) INCOME
FOR THE YEAR ENDED JANUARY 30, 2016
(amounts in thousands)
| Parent Only | Guarantors | Non- Guarantors |
Eliminations | Consolidated | ||||||||||||||||
| Revenues: |
||||||||||||||||||||
| Net sales |
$ | — | $ | 765,102 | $ | 99,704 | $ | — | $ | 864,806 | ||||||||||
| Royalty income |
— | 20,843 | 13,866 | — | 34,709 | |||||||||||||||
|
|
|
|
|
|
|
|
|
|
|
|||||||||||
| Total revenues |
— | 785,945 | 113,570 | — | 899,515 | |||||||||||||||
| Cost of sales |
— | 518,410 | 62,038 | — | 580,448 | |||||||||||||||
|
|
|
|
|
|
|
|
|
|
|
|||||||||||
| Gross profit |
— | 267,535 | 51,532 | — | 319,067 | |||||||||||||||
| Operating expenses: |
||||||||||||||||||||
| Selling, general and administrative expenses |
— | 234,129 | 41,734 | — | 275,863 | |||||||||||||||
| Depreciation and amortization |
— | 12,500 | 1,193 | — | 13,693 | |||||||||||||||
| Impairment on long-lived assets |
— | 19,299 | 1,305 | — | 20,604 | |||||||||||||||
| Impairment of goodwill |
— | 6,022 | — | — | 6,022 | |||||||||||||||
|
|
|
|
|
|
|
|
|
|
|
|||||||||||
| Total operating expenses |
— | 271,950 | 44,232 | — | 316,182 | |||||||||||||||
|
|
|
|
|
|
|
|
|
|
|
|||||||||||
| Loss on sale of long-lived assets |
— | (697 | ) | 4,476 | — | 3,779 | ||||||||||||||
|
|
|
|
|
|
|
|
|
|
|
|||||||||||
| Operating (loss) income |
— | (5,112 | ) | 11,776 | — | 6,664 | ||||||||||||||
| Costs of early extinguishment of debt |
— | 5,121 | — | — | 5,121 | |||||||||||||||
| Interest expense |
— | 9,205 | 62 | — | 9,267 | |||||||||||||||
|
|
|
|
|
|
|
|
|
|
|
|||||||||||
| Net (loss) income before income taxes |
— | (19,438 | ) | 11,714 | — | (7,724 | ) | |||||||||||||
| Income tax (benefit) provision |
— | (2,652 | ) | 2,220 | — | (432 | ) | |||||||||||||
|
|
|
|
|
|
|
|
|
|
|
|||||||||||
| Equity in earnings of subsidiaries, net |
(7,292 | ) | — | — | 7,292 | — | ||||||||||||||
|
|
|
|
|
|
|
|
|
|
|
|||||||||||
| Net (loss) income |
(7,292 | ) | (16,786 | ) | 9,494 | 7,292 | (7,292 | ) | ||||||||||||
|
|
|
|
|
|
|
|
|
|
|
|||||||||||
| Other comprehensive (loss) income |
(1,656 | ) | 717 | (2,373 | ) | 1,656 | (1,656 | ) | ||||||||||||
|
|
|
|
|
|
|
|
|
|
|
|||||||||||
| Comprehensive (loss) income |
$ | (8,948 | ) | $ | (16,069 | ) | $ | 7,121 | $ | (8,948 | ) | $ | (8,948 | ) | ||||||
|
|
|
|
|
|
|
|
|
|
|
|||||||||||
F-45
Table of Contents
PERRY ELLIS INTERNATIONAL, INC. AND SUBSIDIARIES
CONDENSED CONSOLIDATING STATEMENT OF COMPREHENSIVE (LOSS) INCOME
FOR THE YEAR ENDED JANUARY 31, 2015
(amounts in thousands)
| Parent Only | Guarantors | Non- Guarantors |
Eliminations | Consolidated | ||||||||||||||||
| Revenues: |
||||||||||||||||||||
| Net sales |
$ | — | $ | 766,934 | $ | 91,303 | $ | — | $ | 858,237 | ||||||||||
| Royalty income |
— | 19,113 | 12,622 | — | 31,735 | |||||||||||||||
|
|
|
|
|
|
|
|
|
|
|
|||||||||||
| Total revenues |
— | 786,047 | 103,925 | — | 889,972 | |||||||||||||||
| Cost of sales |
— | 529,315 | 57,653 | — | 586,968 | |||||||||||||||
|
|
|
|
|
|
|
|
|
|
|
|||||||||||
| Gross profit |
— | 256,732 | 46,272 | — | 303,004 | |||||||||||||||
| Operating expenses: |
||||||||||||||||||||
| Selling, general and administrative expenses |
— | 229,808 | 38,975 | — | 268,783 | |||||||||||||||
| Depreciation and amortization |
— | 11,210 | 988 | — | 12,198 | |||||||||||||||
|
|
|
|
|
|
|
|
|
|
|
|||||||||||
| Total operating expenses |
— | 241,018 | 39,963 | — | 280,981 | |||||||||||||||
|
|
|
|
|
|
|
|
|
|
|
|||||||||||
| Gain on sale of long-lived assets |
— | — | 885 | — | 885 | |||||||||||||||
|
|
|
|
|
|
|
|
|
|
|
|||||||||||
| Operating income |
— | 15,714 | 7,194 | — | 22,908 | |||||||||||||||
| Interest expense |
— | 14,310 | (19 | ) | — | 14,291 | ||||||||||||||
|
|
|
|
|
|
|
|
|
|
|
|||||||||||
| Net income before income taxes |
— | 1,404 | 7,213 | — | 8,617 | |||||||||||||||
| Income tax provision |
— | 44,889 | 903 | — | 45,792 | |||||||||||||||
|
|
|
|
|
|
|
|
|
|
|
|||||||||||
| Equity in (loss) earnings of subsidiaries, net |
(37,175 | ) | — | — | 37,175 | — | ||||||||||||||
|
|
|
|
|
|
|
|
|
|
|
|||||||||||
| Net (loss) income |
(37,175 | ) | (43,485 | ) | 6,310 | 37,175 | (37,175 | ) | ||||||||||||
|
|
|
|
|
|
|
|
|
|
|
|||||||||||
| Other comprehensive loss |
(5,384 | ) | (2,219 | ) | (3,165 | ) | 5,384 | (5,384 | ) | |||||||||||
|
|
|
|
|
|
|
|
|
|
|
|||||||||||
| Comprehensive (loss) income |
$ | (42,559 | ) | $ | (45,704 | ) | $ | 3,145 | $ | 42,559 | $ | (42,559 | ) | |||||||
|
|
|
|
|
|
|
|
|
|
|
|||||||||||
F-46
Table of Contents
PERRY ELLIS INTERNATIONAL, INC. AND SUBSIDIARIES
CONDENSED CONSOLIDATING STATEMENT OF COMPREHENSIVE INCOME (LOSS)
FOR THE YEAR ENDED FEBRUARY 1, 2014
(amounts in thousands)
| Parent Only | Guarantors | Non- Guarantors |
Eliminations | Consolidated | ||||||||||||||||
| Revenues: |
||||||||||||||||||||
| Net sales |
$ | — | $ | 804,374 | $ | 78,199 | $ | — | $ | 882,573 | ||||||||||
| Royalty income |
— | 17,612 | 12,039 | — | 29,651 | |||||||||||||||
|
|
|
|
|
|
|
|
|
|
|
|||||||||||
| Total revenues |
— | 821,986 | 90,238 | — | 912,224 | |||||||||||||||
| Cost of sales |
— | 561,895 | 47,541 | — | 609,436 | |||||||||||||||
|
|
|
|
|
|
|
|
|
|
|
|||||||||||
| Gross profit |
— | 260,091 | 42,697 | — | 302,788 | |||||||||||||||
| Operating expenses: |
||||||||||||||||||||
| Selling, general and administrative expenses |
— | 240,871 | 31,845 | — | 272,716 | |||||||||||||||
| Depreciation and amortization |
— | 11,860 | 766 | — | 12,626 | |||||||||||||||
| Impairment on assets |
— | 30,777 | 4,428 | — | 35,205 | |||||||||||||||
| Impairment of goodwill |
— | 7,772 | — | — | 7,772 | |||||||||||||||
|
|
|
|
|
|
|
|
|
|
|
|||||||||||
| Total operating expenses |
— | 291,280 | 37,039 | — | 328,319 | |||||||||||||||
|
|
|
|
|
|
|
|
|
|
|
|||||||||||
| (Loss) gain on sale of long-lived assets |
— | (799 | ) | 6,961 | — | 6,162 | ||||||||||||||
|
|
|
|
|
|
|
|
|
|
|
|||||||||||
| Operating (loss) income |
— | (31,988 | ) | 12,619 | — | (19,369 | ) | |||||||||||||
| Interest expense |
— | 14,961 | 64 | — | 15,025 | |||||||||||||||
|
|
|
|
|
|
|
|
|
|
|
|||||||||||
| Net (loss) income before income taxes |
— | (46,949 | ) | 12,555 | — | (34,394 | ) | |||||||||||||
| Income tax (benefit) provision |
— | (14,356 | ) | 2,741 | — | (11,615 | ) | |||||||||||||
|
|
|
|
|
|
|
|
|
|
|
|||||||||||
| Equity in loss of subsidiaries, net |
(22,779 | ) | — | — | 22,779 | — | ||||||||||||||
|
|
|
|
|
|
|
|
|
|
|
|||||||||||
| Net (loss) income |
(22,779 | ) | (32,593 | ) | 9,814 | 22,779 | (22,779 | ) | ||||||||||||
|
|
|
|
|
|
|
|
|
|
|
|||||||||||
| Other comprehensive income (loss) |
592 | 1,310 | (718 | ) | (592 | ) | 592 | |||||||||||||
|
|
|
|
|
|
|
|
|
|
|
|||||||||||
| Comprehensive (loss) income |
$ | (22,187 | ) | $ | (31,283 | ) | $ | 9,096 | $ | 22,187 | $ | (22,187 | ) | |||||||
|
|
|
|
|
|
|
|
|
|
|
|||||||||||
F-47
Table of Contents
PERRY ELLIS INTERNATIONAL, INC. AND SUBSIDIARIES
CONDENSED CONSOLIDATING STATEMENT OF CASH FLOWS
FOR THE YEAR ENDED JANUARY 30, 2016
(amounts in thousands)
| Parent Only | Guarantors | Non- Guarantors |
Eliminations | Consolidated | ||||||||||||||||
| NET CASH PROVIDED BY OPERATING ACTIVITIES: |
$ | 3,112 | $ | 22,571 | $ | 4,482 | $ | — | $ | 30,165 | ||||||||||
|
|
|
|
|
|
|
|
|
|
|
|||||||||||
| CASH FLOWS FROM INVESTING ACTIVITIES: |
||||||||||||||||||||
| Purchase of property and equipment |
— | (14,424 | ) | (1,726 | ) | — | (16,150 | ) | ||||||||||||
| Purchase of investments |
— | — | (12,086 | ) | — | (12,086 | ) | |||||||||||||
| Proceeds from investment maturities |
— | — | 22,197 | — | 22,197 | |||||||||||||||
| Proceeds on sale of intangible assets |
— | 2,500 | — | — | 2,500 | |||||||||||||||
| Proceeds on sale of building |
— | — | 8,163 | — | 8,163 | |||||||||||||||
| Payment of expenses related to sale of building |
— | — | (1,887 | ) | — | (1,887 | ) | |||||||||||||
| Proceeds from note receivable |
— | — | 250 | — | 250 | |||||||||||||||
| Intercompany transactions |
101,786 | — | — | (101,786 | ) | — | ||||||||||||||
|
|
|
|
|
|
|
|
|
|
|
|||||||||||
| Net cash provided by (used in) investing activities |
101,786 | (11,924 | ) | 14,911 | (101,786 | ) | 2,987 | |||||||||||||
|
|
|
|
|
|
|
|
|
|
|
|||||||||||
| CASH FLOWS FROM FINANCING ACTIVITIES: |
||||||||||||||||||||
| Payments on senior subordinated notes |
(100,000 | ) | — | — | — | (100,000 | ) | |||||||||||||
| Borrowings from senior credit facility |
— | 408,209 | — | — | 408,209 | |||||||||||||||
| Payments on senior credit facility |
— | (346,451 | ) | — | — | (346,451 | ) | |||||||||||||
| Payments on real estate mortgages |
— | (821 | ) | — | — | (821 | ) | |||||||||||||
| Payments on capital leases |
— | (262 | ) | — | — | (262 | ) | |||||||||||||
| Deferred financing fees |
— | (574 | ) | — | — | (574 | ) | |||||||||||||
| Proceeds from exercise of stock options |
1,408 | — | — | — | 1,408 | |||||||||||||||
| Purchase of treasury stock |
(6,950 | ) | — | — | — | (6,950 | ) | |||||||||||||
| Intercompany transactions |
— | (100,028 | ) | (2,402 | ) | 102,430 | — | |||||||||||||
|
|
|
|
|
|
|
|
|
|
|
|||||||||||
| Net cash used in financing activities |
(105,542 | ) | (39,927 | ) | (2,402 | ) | 102,430 | (45,441 | ) | |||||||||||
| Effect of exchange rate changes on cash and cash equivalents |
644 | — | 644 | (644 | ) | 644 | ||||||||||||||
|
|
|
|
|
|
|
|
|
|
|
|||||||||||
| NET (DECREASE) INCREASE IN CASH AND CASH EQUIVALENTS |
— | (29,280 | ) | 17,635 | — | (11,645 | ) | |||||||||||||
| CASH AND CASH EQUIVALENTS AT BEGINNING OF PERIOD |
— | 30,055 | 13,492 | — | 43,547 | |||||||||||||||
|
|
|
|
|
|
|
|
|
|
|
|||||||||||
| CASH AND CASH EQUIVALENTS AT END OF PERIOD |
$ | — | $ | 775 | $ | 31,127 | $ | — | $ | 31,902 | ||||||||||
|
|
|
|
|
|
|
|
|
|
|
|||||||||||
PERRY ELLIS INTERNATIONAL, INC. AND SUBSIDIARIES
CONDENSED CONSOLIDATING STATEMENT OF CASH FLOWS
FOR THE YEAR ENDED JANUARY 31, 2015
(amounts in thousands)
| Parent Only | Guarantors | Non- Guarantors |
Eliminations | Consolidated | ||||||||||||||||
| NET CASH PROVIDED BY (USED IN) OPERATING ACTIVITIES: |
$ | 8,285 | $ | 52,522 | $ | (626 | ) | $ | (5,038 | ) | $ | 55,143 | ||||||||
|
|
|
|
|
|
|
|
|
|
|
|||||||||||
| CASH FLOWS FROM INVESTING ACTIVITIES: |
||||||||||||||||||||
| Purchase of property and equipment |
— | (15,748 | ) | (985 | ) | — | (16,733 | ) | ||||||||||||
| Purchase of investments |
— | — | (31,501 | ) | — | (31,501 | ) | |||||||||||||
| Proceeds from investments maturities |
— | — | 26,592 | — | 26,592 | |||||||||||||||
| Proceeds on termination of life insurance |
245 | — | — | — | 245 | |||||||||||||||
| Proceeds from note receivable |
— | — | 250 | — | 250 | |||||||||||||||
| Intercompany transactions |
(347 | ) | — | — | 347 | — | ||||||||||||||
|
|
|
|
|
|
|
|
|
|
|
|||||||||||
| Net cash (used in) provided by investing activities |
(102 | ) | (15,748 | ) | (5,644 | ) | 347 | (21,147 | ) | |||||||||||
|
|
|
|
|
|
|
|
|
|
|
|||||||||||
| CASH FLOWS FROM FINANCING ACTIVITIES: |
||||||||||||||||||||
| Borrowings from senior credit facility |
— | 234,137 | — | — | 234,137 | |||||||||||||||
| Payments on senior credit facility |
— | (242,299 | ) | — | — | (242,299 | ) | |||||||||||||
| Payments on real estate mortgages |
— | (792 | ) | — | — | (792 | ) | |||||||||||||
| Purchase of treasury stock |
(8,773 | ) | — | — | — | (8,773 | ) | |||||||||||||
| Payments on capital leases |
— | (301 | ) | — | — | (301 | ) | |||||||||||||
| Proceeds from exercise of stock options |
404 | — | — | — | 404 | |||||||||||||||
| Tax benefit from exercise of equity instruments |
(161 | ) | — | — | — | (161 | ) | |||||||||||||
| Dividends paid to stockholders |
— | — | (8,037 | ) | 8,037 | — | ||||||||||||||
| Intercompany transactions |
— | 2,536 | (2,536 | ) | — | — | ||||||||||||||
|
|
|
|
|
|
|
|
|
|
|
|||||||||||
| Net cash (used in) provided by financing activities |
(8,530 | ) | (6,719 | ) | (10,573 | ) | 8,037 | (17,785 | ) | |||||||||||
| Effect of exchange rate changes on cash and cash equivalents |
347 | — | 347 | (347 | ) | 347 | ||||||||||||||
|
|
|
|
|
|
|
|
|
|
|
|||||||||||
| NET INCREASE (DECREASE) IN CASH AND CASH EQUIVALENTS |
— | 30,055 | (16,496 | ) | 2,999 | 16,558 | ||||||||||||||
| CASH AND CASH EQUIVALENTS AT BEGINNING OF PERIOD |
— | — | 29,988 | (2,999 | ) | 26,989 | ||||||||||||||
|
|
|
|
|
|
|
|
|
|
|
|||||||||||
| CASH AND CASH EQUIVALENTS AT END OF PERIOD |
$ | — | $ | 30,055 | $ | 13,492 | $ | — | $ | 43,547 | ||||||||||
|
|
|
|
|
|
|
|
|
|
|
|||||||||||
F-48
Table of Contents
PERRY ELLIS INTERNATIONAL, INC. AND SUBSIDIARIES
CONDENSED CONSOLIDATING STATEMENT OF CASH FLOWS
FOR THE YEAR ENDED FEBRUARY 1, 2014
(amounts in thousands)
| Parent Only | Guarantors | Non- Guarantors |
Eliminations | Consolidated | ||||||||||||||||
| NET CASH (USED IN) PROVIDED BY OPERATING ACTIVITIES: |
$ | (8,510 | ) | $ | 16,328 | $ | (4,599 | ) | $ | (2,999 | ) | $ | 220 | |||||||
|
|
|
|
|
|
|
|
|
|
|
|||||||||||
| CASH FLOWS FROM INVESTING ACTIVITIES: |
||||||||||||||||||||
| Purchase of property and equipment |
— | (20,874 | ) | (1,369 | ) | — | (22,243 | ) | ||||||||||||
| Purchase of investments |
— | — | (15,437 | ) | — | (15,437 | ) | |||||||||||||
| Proceeds on sale of intangible assets |
— | — | 4,875 | — | 4,875 | |||||||||||||||
| Proceeds on termination of insurance |
3,559 | — | — | — | 3,559 | |||||||||||||||
| Proceeds on sale of long-lived assets, net |
— | 1,892 | — | — | 1,892 | |||||||||||||||
| Intercompany transactions |
11,917 | — | — | (11,917 | ) | — | ||||||||||||||
|
|
|
|
|
|
|
|
|
|
|
|||||||||||
| Net cash provided by (used in) investing activities |
15,476 | (18,982 | ) | (11,931 | ) | (11,917 | ) | (27,354 | ) | |||||||||||
|
|
|
|
|
|
|
|
|
|
|
|||||||||||
| CASH FLOWS FROM FINANCING ACTIVITIES: |
||||||||||||||||||||
| Borrowings from senior credit facility |
— | 415,885 | — | — | 415,885 | |||||||||||||||
| Payments on senior credit facility |
— | (407,723 | ) | — | — | (407,723 | ) | |||||||||||||
| Purchase of treasury stock |
(6,957 | ) | — | — | — | (6,957 | ) | |||||||||||||
| Payments on real estate mortgages |
— | (1,385 | ) | — | — | (1,385 | ) | |||||||||||||
| Payments on capital leases |
— | (318 | ) | — | — | (318 | ) | |||||||||||||
| Tax benefit from exercise of stock options |
83 | — | — | — | 83 | |||||||||||||||
| Deferred financing fees |
— | (327 | ) | — | — | (327 | ) | |||||||||||||
| Proceeds from exercise of stock options |
154 | — | — | — | 154 | |||||||||||||||
| Intercompany transactions |
— | (18,303 | ) | 6,632 | 11,671 | — | ||||||||||||||
|
|
|
|
|
|
|
|
|
|
|
|||||||||||
| Net cash (used in) provided by financing activities |
(6,720 | ) | (12,171 | ) | 6,632 | 11,671 | (588 | ) | ||||||||||||
| Effect of exchange rate changes on cash and cash equivalents |
(246 | ) | — | (246 | ) | 246 | (246 | ) | ||||||||||||
|
|
|
|
|
|
|
|
|
|
|
|||||||||||
| NET (DECREASE) INCREASE IN CASH AND CASH EQUIVALENTS |
— | (14,825 | ) | (10,144 | ) | (2,999 | ) | (27,968 | ) | |||||||||||
| CASH AND CASH EQUIVALENTS AT BEGINNING OF PERIOD |
— | 14,825 | 40,132 | — | 54,957 | |||||||||||||||
|
|
|
|
|
|
|
|
|
|
|
|||||||||||
| CASH AND CASH EQUIVALENTS AT END OF PERIOD |
$ | — | $ | — | $ | 29,988 | $ | (2,999 | ) | $ | 26,989 | |||||||||
|
|
|
|
|
|
|
|
|
|
|
|||||||||||
F-49
Table of Contents
PERRY ELLIS INTERNATIONAL, INC. AND SUBSIDIARIES
VALUATION AND QUALIFYING ACCOUNTS
FOR THE YEARS ENDED
(amounts in thousands)
| Balance at beginning of period |
Charged to expense |
Adjustments to valuation accounts |
Deductions | Balance at end of period |
||||||||||||||||
| Year Ended January 30, 2016: |
||||||||||||||||||||
| Allowance for doubtful accounts |
$ | 1,181 | 528 | — | (516 | ) | $ | 1,193 | ||||||||||||
| Allowance for deferred tax asset |
$ | 50,013 | 3,223 | 1,555 | — | $ | 54,791 | |||||||||||||
| Allowance for operational chargebacks, returns, and customer markdowns |
$ | 19,598 | 69,610 | — | (70,098 | ) | $ | 19,110 | ||||||||||||
| Year Ended January 31, 2015: |
||||||||||||||||||||
| Allowance for doubtful accounts |
$ | 1,074 | 812 | — | (705 | ) | $ | 1,181 | ||||||||||||
| Allowance for deferred tax asset |
$ | 5,998 | 43,474 | 541 | — | $ | 50,013 | |||||||||||||
| Allowance for operational chargebacks, returns, and customer markdowns |
$ | 20,348 | 74,399 | — | (75,149 | ) | $ | 19,598 | ||||||||||||
| Year Ended February 1, 2014: |
||||||||||||||||||||
| Allowance for doubtful accounts |
$ | 1,287 | (98 | ) | — | (115 | ) | $ | 1,074 | |||||||||||
| Allowance for deferred tax asset |
$ | 5,317 | 1,684 | (1,003 | ) | — | $ | 5,998 | ||||||||||||
| Allowance for operational chargebacks, returns, and customer markdowns |
$ | 24,556 | 83,164 | — | (87,372 | ) | $ | 20,348 | ||||||||||||
F-50
Table of Contents
Exhibit Index
| Exhibit No |
Description of Exhibit | |
| 12.1 | Computation of Earnings to Fixed Charges | |
| 21.1 | Subsidiaries of Registrant | |
| 23.1 | Consent of PricewaterhouseCoopers LLP | |
| 31.1 | Certification of Chief Executive Officer pursuant to Rule 13a-14(a) and Rule 15d-14(a), promulgated under the Securities Exchange Act of 1934, as amended | |
| 31.2 | Certification of Chief Financial Officer pursuant to Rule 13a-14(a) and Rule 15d-14(a), promulgated under the Securities Exchange Act of 1934, as amended | |
| 32.1 | Certification of Chief Executive Officer pursuant to 18 U.S.C Section 1350, as adopted pursuant to Section 906 of the Sarbanes-Oxley Act of 2002 | |
| 32.2 | Certification of Chief Financial Officer pursuant to 18 U.S.C Section 1350, as adopted pursuant to Section 906 of the Sarbanes-Oxley Act of 2002 | |
| 101.INS | XBRL Instance Document | |
| 101.SCH | XBRL Taxonomy Extension Schema | |
| 101.CAL | XBRL Taxonomy Extension Calculation Linkbase | |
| 101.DEF | XBRL Taxonomy Extension Definition Linkbase | |
| 101.LAB | XBRL Taxonomy Extension Label Linkbase | |
| 101.PRE | XBRL Taxonomy Extension Presentation Linkbase | |