Attached files
| file | filename |
|---|---|
| EX-99 - EXHIBIT 99.1 - MICT, Inc. | exhibit_99-1.htm |
| 8-K - 8-K - MICT, Inc. | zk1618356.htm |
Exhibit 99.2

4Q 15 Financial ResultsConference Call

Forward Looking Statement 2 This presentation contains express or implied forward-looking statements within the Private Securities Litigation Reform Act of 1995 and other U.S. Federal securities laws. These forward-looking statements include, but are not limited to those statements regarding our future revenue growth, momentum and profitability, our pipeline and backlog, increased volumes and demand in the markets in which we operate, shipments of delayed products, the roll-out of our new All-In-One wireless platforms, the expected market potential created by the ELD mandate, and expected new opportunities for the Company and anticipated Company growth resulting from the ELD mandate. Such forward-looking statements and their implications involve known and unknown risks, uncertainties and other factors that may cause actual results or performance to differ materially from those projected. The forward-looking statements contained in this press release are subject to other risks and uncertainties, including those discussed in the "Risk Factors" section and elsewhere in the Company's annual report on Form 10-K for the year ended December 31, 2015 and in subsequent filings with the Securities and Exchange Commission. Except as otherwise required by law, the Company is under no obligation to (and expressly disclaims any such obligation to) update or alter its forward-looking statements whether as a result of new information, future events or otherwise.

Presenters 3 David LucatzChairman of the Board and CEO Shai LustgartenCEO of Micronet Ltd. Tali DinarCFO of Enertec Electronic Ltd.
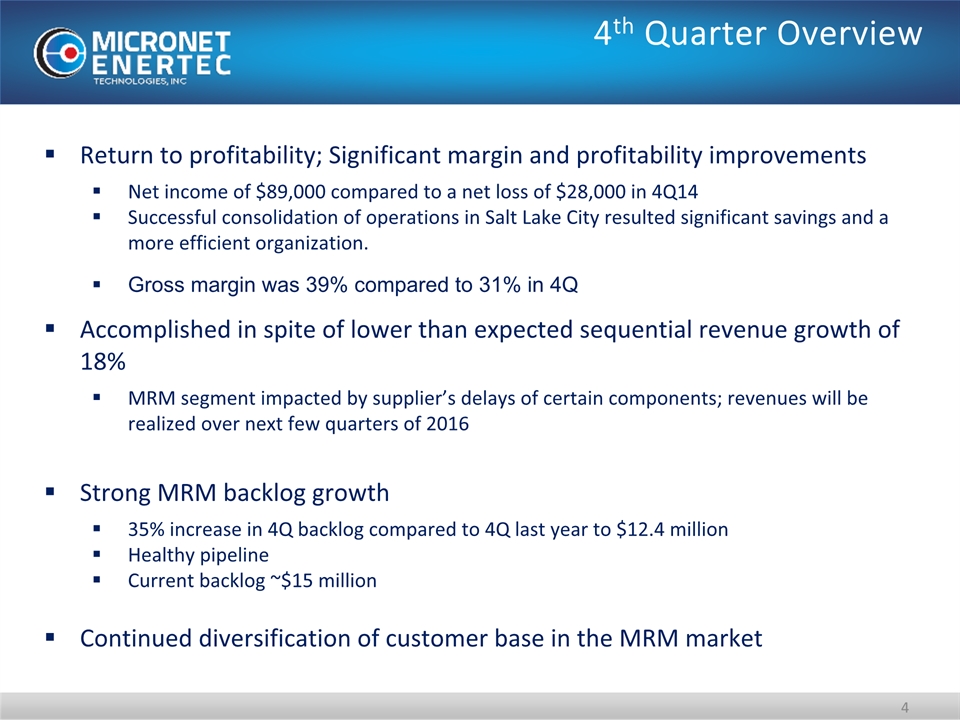
4 4th Quarter Overview Return to profitability; Significant margin and profitability improvementsNet income of $89,000 compared to a net loss of $28,000 in 4Q14Successful consolidation of operations in Salt Lake City resulted significant savings and a more efficient organization.Gross margin was 39% compared to 31% in 4QAccomplished in spite of lower than expected sequential revenue growth of 18% MRM segment impacted by supplier’s delays of certain components; revenues will be realized over next few quarters of 2016Strong MRM backlog growth35% increase in 4Q backlog compared to 4Q last year to $12.4 millionHealthy pipeline Current backlog ~$15 millionContinued diversification of customer base in the MRM market

ELD Mandate Opportunity 5 New regulation implemented in December 2015 mandates all truck drivers to keep electronic records of hours of service (HOS).Electronic Logging Devices (ELDs)* connect to engine and replace paper logbooks. Micronet’s comprehensive products provide state of the art solutions for the ELD requirementsExpect to see increased demand as fleet managers and commercial truck and bus owners comply with ELD mandate in advance of 2017 enforcement date * Federal Motor Carrier Safety Administration, Electronic Logging Devices and Hours of Service Supporting Documents”- March 2014 2016 1M ELD equipped trucks*2017 ~2.6 Million trucks will require ELD Our tablets are fully compliant with the regulation requirements

6 New Purchase Order Announced this week that MICT subsidiary Micronet, received a $2 million purchase order for the A-317 rugged Android tablet.A-317 product is used as part of compliance solution related to the ELD mandate.A breakthrough order proving that our A-317 is a qualified solution for the ELD mandate. Mandate should prove to be a significant catalyst for our revenues

7 Acquisition Update Announced intention to acquire the Telematics business of Novatel Wireless in February of 2016Following Due Diligence process, the Asset Purchase Agreement was terminated. Refocused on the considerable opportunity to drive organic revenue growth and profits going forward

Positive Outlook 8 MRMLocal fleet market and the ELD expected to be the growth engines of the company The All In One line of new developed tablets becoming the company’s best sellers with wider market acceptance. Aerospace/Defense Continued reliance on missile defense systems supports potential demand for our missile defense offerings Potential demand for new Mobile Command & Control Centers Trends

4Q14 vs 4Q15 Revenues
Sales Breakdown
Consolidated revenue for the quarter
4Q14 vs 4Q15 Revenues 9 (in millions) MRM (in millions) (in millions) Sales Breakdown Consolidated revenue for the quarter
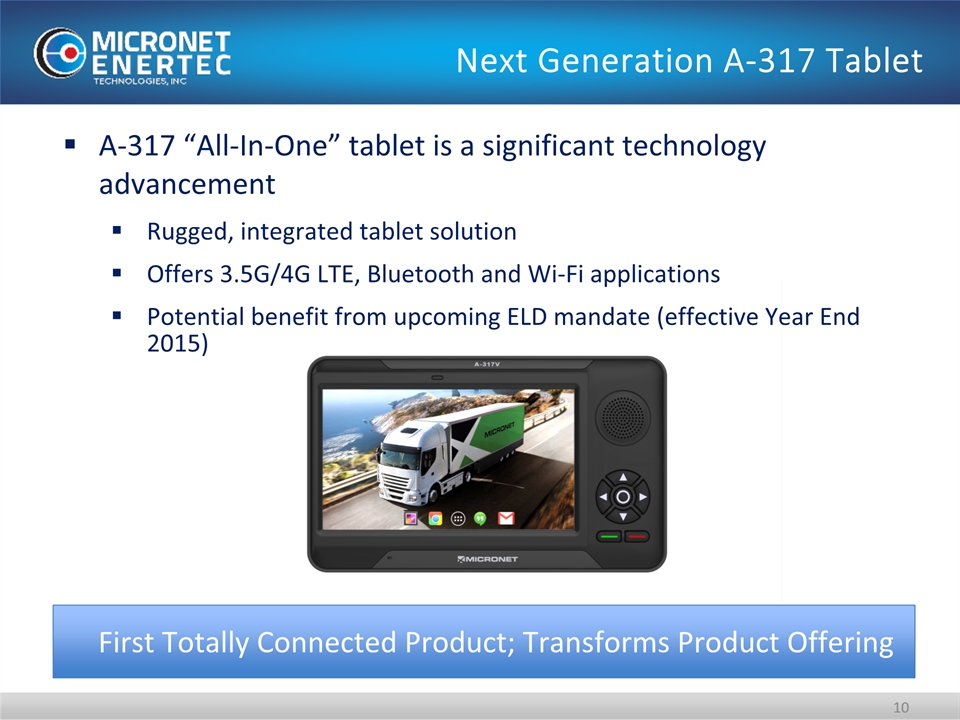
10 Next Generation A-317 Tablet A-317 “All-In-One” tablet is a significant technology advancementRugged, integrated tablet solutionOffers 3.5G/4G LTE, Bluetooth and Wi-Fi applicationsPotential benefit from upcoming ELD mandate (effective Year End 2015) First Totally Connected Product; Transforms Product Offering

11 A-317 Tablet Roll Out Product R&D Carrier Certification;Testing & Approval Adaptation & Orders CompletedOngoing refinement with customersContinue to invest significantly in product improvement and customization Carrier CertificationVerizon complete AT&T in progressIn discussions with additional carriersCustomer Testing/ApprovalMultiple customers currently testing new product ~16,000 unit orders at the end of the year$2M transportation purchase order in April$1.4M public transportation purchase order in July 2015$4M+ school bus purchase order in May 2015

12
Income Statement Highlights
(in 000s except share and per share data)
(in 000s except share and per share data)
|
|
Three Months Ended December 31,
|
Years Ended December 31,
|
||
|
|
2015
|
2014
|
2015
|
2014
|
|
|
|
|
|
|
|
Revenues
|
$ 6,604
|
$ 10,670
|
$ 23,587
|
$ 34,238
|
|
Cost of revenues
|
4,009
|
7,390
|
16,284
|
24,180
|
|
Gross profit
|
2,595 |
3,280
|
7,303 |
10,058
|
|
Gross profit margin
|
39%
|
31%
|
31%
|
29%
|
|
Operating expenses:
|
|
|
|
|
|
Research and development
|
501
|
643
|
2,453
|
2,807
|
|
% of sales
|
8%
|
6%
|
10%
|
8%
|
|
Selling and marketing
|
316
|
739
|
1,530
|
1,947
|
|
% of sales
|
5%
|
7%
|
6%
|
6%
|
|
General and administrative
|
1,317
|
2,070
|
4,723
|
6,290
|
|
% of sales
|
20%
|
19%
|
20%
|
18%
|
|
Amortization of intangible assets
|
229
|
293
|
1,118
|
850
|
|
Total operating expenses
|
2,363
|
3,745
|
9,824
|
11,894
|
|
% of sales
|
36%
|
35%
|
42%
|
35%
|
|
|
|
|
|
|
|
Net income (loss) attributable to MICT
|
89
|
(28)
|
(2,467)
|
(2,139)
|
|
Basic and diluted income (loss) per share
|
0.02
|
(0.00)
|
(0.42)
|
(0.37)
|
|
Weighted average common shares outstanding:
|
5,865,221
|
5,843,746
|
5,861,630
|
5,834,371
|
12 Income Statement Highlights (in 000s except share and per share data) Three Months Ended December 31, Years Ended December 31, 2015 2014 2015 2014 Revenues $ 6,604 $ 10,670 $ 23,587 $ 34,238 Cost of revenues 4,009 7,390 16,284 24,180 Gross profit 2,595 3,280 7,303 10,058 Gross profit margin 39% 31% 31% 29% Operating expenses: Research and development 501 643 2,453 2,807 % of sales 8% 6% 10% 8% Selling and marketing 316 739 1,530 1,947 % of sales 5% 7% 6% 6% General and administrative 1,317 2,070 4,723 6,290 % of sales 20% 19% 20% 18% Amortization of intangible assets 229 293 1,118 850 Total operating expenses 2,363 3,745 9,824 11,894 % of sales 36% 35% 42% 35% Net income (loss) attributable to MICT 89 (28) (2,467) (2,139) Basic and diluted income (loss) per share 0.02 (0.00) (0.42) (0.37) Weighted average common shares outstanding: 5,865,221 5,843,746 5,861,630 5,834,371

Non-GAAP(in 000s except share and per share data) 13 Three Months EndedDecember 31, Years EndedDecember 31, 2015 2014 2015 2014 GAAP net income (loss) attributed to MICT 89 (28) (2,467) (2,139) Amortization of acquired intangible assets 144 144 701 492 Change in fair value of call options and warrants 0 (8) 0 299 Amortization of note discount and related expenses 0 6 0 67 Stock-based compensation and shares issued to service providers 82 381 336 402 Expenses related to the purchase of business 0 0 0 369 Income tax-effect of above non-GAAP adjustments (2) (6) (25) (32) Total non-GAAP net income (loss) attributed to MICT 313 489 (1,455) (542) Non-GAAP net income (loss) per diluted share 0.05 0.08 (0.25) (0.09) Shares used in per share calculations 5,865,221 5,843,746 5,861,630 5,834,371 GAAP net income (loss) per diluted share attributable to Micronet Enertec Technologies, Inc. 0.02 (0.00) (0.42) (0.37) Shares used in per share calculations 5,865,221 5,843,746 5,861,630 5,834,371

Strong Balance Sheet December 31, 2015 December 31,2014 Cash, cash equivalents and marketable securities $12.1M $15.0M Bank & others debts $14.4M $14.3M Net Working Capital $13.3M $16.4M Stockholders' Equity $17.5M $20.2M 14

Thank You 15 Q & A
