Attached files
| file | filename |
|---|---|
| EX-2.1 - EXHIBIT 2.1 - Ready Capital Corp | v436445_ex2-1.htm |
| EX-10.2 - EXHIBIT 10.2 - Ready Capital Corp | v436445_ex10-2.htm |
| EX-10.1 - EXHIBIT 10.1 - Ready Capital Corp | v436445_ex10-1.htm |
| EX-10.3 - EXHIBIT 10.3 - Ready Capital Corp | v436445_ex10-3.htm |
| EX-99.1 - EXHIBIT 99.1 - Ready Capital Corp | v436445_ex99-1.htm |
| 8-K - FORM 8-K - Ready Capital Corp | v436445_8k.htm |
ZAIS Financial Corp. to combine with Sutherland Asset Management Corp. Merger Presentation April 7, 2016 Exhibit 99.2
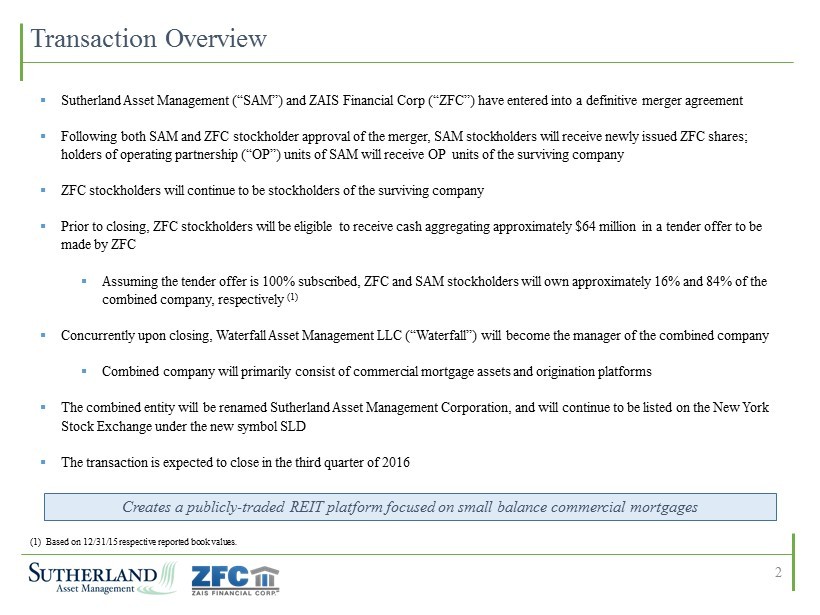
Transaction Overview Creates a publicly - traded REIT platform focused on small balance commercial mortgages 2 (1) Based on 12/31/15 respective reported book values. ▪ Sutherland Asset Management (“SAM”) and ZAIS Financial Corp (“ZFC”) have entered into a definitive merger agreement ▪ Following both SAM and ZFC stockholder approval of the merger, SAM stockholders will receive newly issued ZFC shares; holders of operating partnership (“OP”) units of SAM will receive OP units of the surviving company ▪ ZFC stockholders will continue to be stockholders of the surviving company ▪ Prior to closing, ZFC stockholders will be eligible to receive cash aggregating approximately $64 million in a tender offer t o b e made by ZFC ▪ Assuming the tender offer is 100% subscribed, ZFC and SAM stockholders will own approximately 16% and 84% of the combined company, respectively (1) ▪ Concurrently upon closing, Waterfall Asset Management LLC (“Waterfall”) will become the manager of the combined company ▪ Combined company will primarily consist of commercial mortgage assets and origination platforms ▪ The combined entity will be renamed Sutherland Asset Management Corporation, and will continue to be listed on the New York Stock Exchange under the new symbol SLD ▪ The transaction is expected to close in the third quarter of 2016
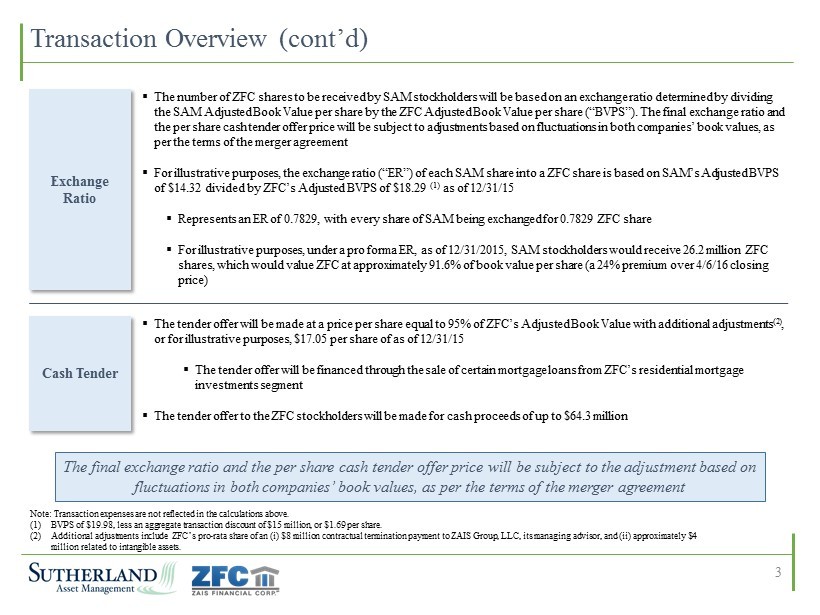
▪ The number of ZFC shares to be received by SAM stockholders will be based on an exchange ratio determined by dividing the SAM Adjusted Book Value per share by the ZFC Adjusted Book Value per share (“BVPS”). The final exchange ratio and the per share cash tender offer price will be subject to adjustments based on fluctuations in both companies’ book values, as per the terms of the merger agreement ▪ For illustrative purposes, the exchange ratio (“ER”) of each SAM share into a ZFC share is based on SAM’s Adjusted BVPS of $14.32 divided by ZFC’s Adjusted BVPS of $18.29 (1) as of 12/31/15 ▪ Represents an ER of 0.7829, with every share of SAM being exchanged for 0.7829 ZFC share ▪ For illustrative purposes, under a pro forma ER, as of 12/31/2015, SAM stockholders would receive 26.2 million ZFC shares, which would value ZFC at approximately 91.6% of book value per share (a 24% premium over 4/6/16 closing price) Exchange Ratio ▪ The tender offer will be made at a price per share equal to 95% of ZFC’s Adjusted Book Value with additional adjustments (2) , or for illustrative purposes, $17.05 per share of as of 12/31/15 ▪ The tender offer will be financed through the sale of certain mortgage loans from ZFC’s residential mortgage investments segment ▪ The tender offer to the ZFC stockholders will be made for cash proceeds of up to $64.3 million Cash Tender Transaction Overview (cont’d) The final exchange ratio and the per share cash tender offer price will be subject to the adjustment based on fluctuations in both companies’ book values, as per the terms of the merger agreement Note: Transaction expenses are not reflected in the calculations above. (1) BVPS of $19.98, less an aggregate transaction discount of $15 million, or $1.69 per share. (2) Additional adjustments include ZFC’s pro - rata share of an ( i ) $8 million contractual termination payment to ZAIS Group, LLC, its managing advisor, and (ii) approximately $4 million related to intangible assets. 3
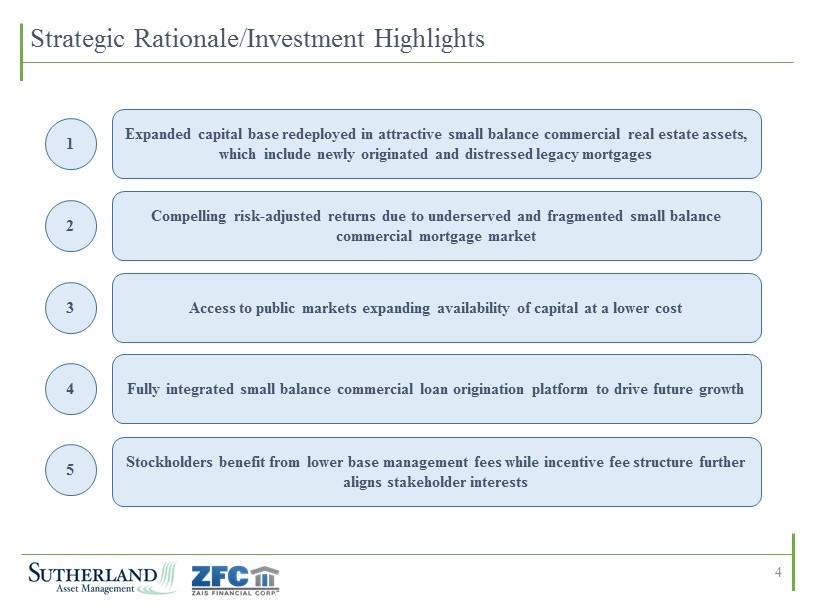
Strategic Rationale/Investment Highlights 1 2 3 4 Expanded capital base redeployed in attractive small balance commercial real estate assets, which include newly originated and distressed legacy mortgages Compelling risk - adjusted returns due to underserved and fragmented small balance commercial mortgage market Access to public markets expanding availability of capital at a lower cost Fully integrated small balance commercial loan origination platform to drive future growth Stockholders benefit from lower base management fees while incentive fee structure further aligns stakeholder interests 5 4
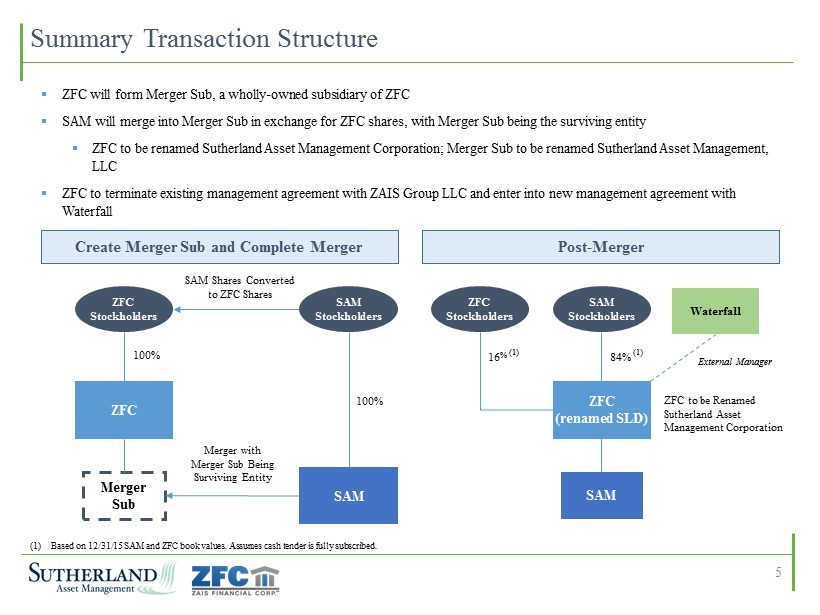
Summary Transaction Structure 5 ▪ ZFC will form Merger Sub, a wholly - owned subsidiary of ZFC ▪ SAM will merge into Merger Sub in exchange for ZFC shares, with Merger Sub being the surviving entity ▪ ZFC to be renamed Sutherland Asset Management Corporation; Merger Sub to be renamed Sutherland Asset Management, LLC ▪ ZFC to terminate existing management agreement with ZAIS Group LLC and enter into new management agreement with Waterfall Create Merger Sub and Complete Merger Post - Merger ZFC ZFC Stockholders SAM SAM Stockholders Merger Sub 100 % 100 % Merger with Merger Sub Being Surviving Entity SAM Shares Converted to ZFC Shares ZFC (renamed SLD) SAM SAM Stockholders ZFC Stockholders External Manager Waterfall ZFC to be Renamed Sutherland Asset Management Corporation 16 % ( 1 ) 84 % ( 1 ) (1) Based on 12/31/15 SAM and ZFC book values. Assumes cash tender is fully subscribed.
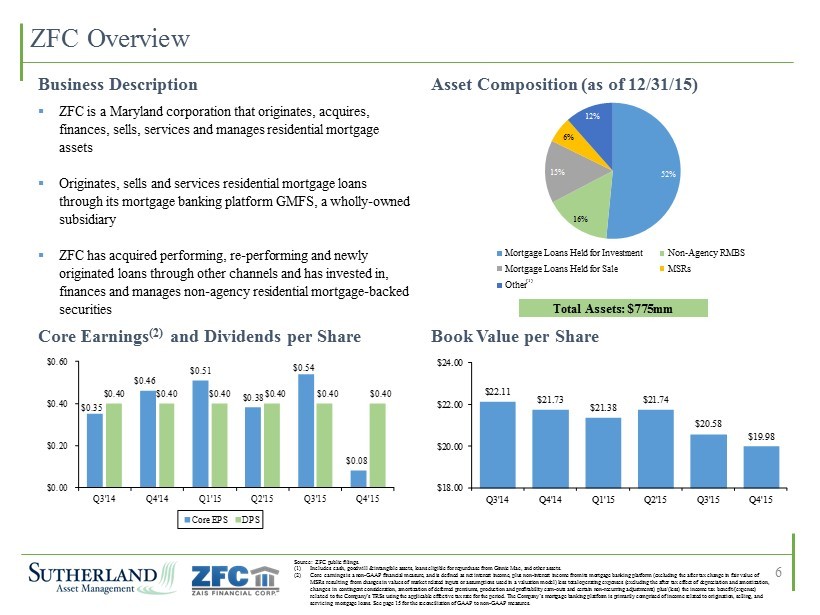
52% 16% 15% 6% 12% ZFC Overview Core Earnings (2) and Dividends per Share Business Description ▪ ZFC is a Maryland corporation that originates, acquires, finances, sells, services and manages residential mortgage assets ▪ Originates, sells and services residential mortgage loans through its mortgage banking platform GMFS, a wholly - owned subsidiary ▪ ZFC has acquired performing, re - performing and newly originated loans through other channels and has invested in, finances and manages non - agency residential mortgage - backed securities Book Value per Share Asset Composition (as of 12/31/15) Source: ZFC public filings. (1) Includes cash, goodwill & intangible assets, loans eligible for repurchase from Ginnie Mae, and other assets. (2) Core earnings is a non - GAAP financial measure, and is defined as net interest income, plus non - interest income from its mortgage banking platform (excluding the after tax change in fair value of MSRs resulting from changes in values of market related inputs or assumptions used in a valuation model) less total operating ex penses (excluding the after tax effect of depreciation and amortization, changes in contingent consideration, amortization of deferred premiums, production and profitability earn - outs and certain non - r ecurring adjustments) plus/(less) the income tax benefit/(expense) related to the Company’s TRSs using the applicable effective tax rate for the period. The Company’s mortgage banking platform is primarily comprised of income related to origination, selling, and servicing mortgage loans. See page 15 for the reconciliation of GAAP to non - GAAP measures. $22.11 $21.73 $21.38 $21.74 $20.58 $19.98 $18.00 $20.00 $22.00 $24.00 Q3'14 Q4'14 Q1'15 Q2'15 Q3'15 Q4'15 Total Assets: $775mm $0.35 $0.46 $0.51 $0.38 $0.54 $0.08 $0.40 $0.40 $0.40 $0.40 $0.40 $0.40 $0.00 $0.20 $0.40 $0.60 Q3'14 Q4'14 Q1'15 Q2'15 Q3'15 Q4'15 Core EPS DPS 6 (1) Mortgage Loans Held for Investment Non - Agency RMBS Mortgage Loans Held for Sale MSRs Other
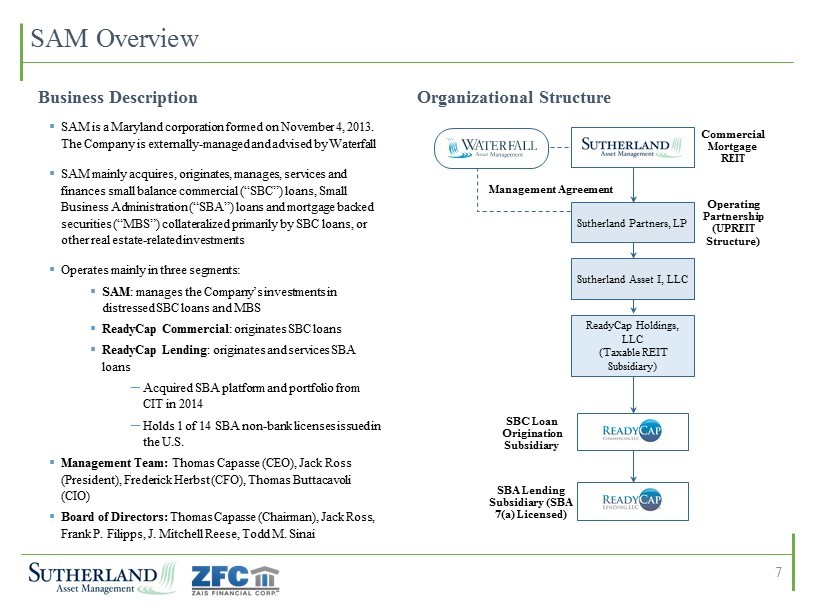
SAM Overview ▪ SAM is a Maryland corporation formed on November 4, 2013. The Company is externally - managed and advised by Waterfall ▪ SAM mainly acquires, originates, manages, services and finances small balance commercial (“SBC”) loans, Small Business Administration (“SBA”) loans and mortgage backed securities (“MBS”) collateralized primarily by SBC loans, or other real estate - related investments ▪ Operates mainly in three segments: ▪ SAM : manages the Company’s investments in distressed SBC loans and MBS ▪ ReadyCap Commercial : originates SBC loans ▪ ReadyCap Lending : originates and services SBA loans ─ Acquired SBA platform and portfolio from CIT in 2014 ─ Holds 1 of 14 SBA non - bank licenses issued in the U.S. ▪ Management Team: Thomas Capasse (CEO), Jack Ross (President), Frederick Herbst (CFO), Thomas Buttacavoli (CIO) ▪ Board of Directors: Thomas Capasse (Chairman), Jack Ross, Frank P. Filipps , J. Mitchell Reese, Todd M. Sinai Business Description Organizational Structure Management Agreement Commercial Mortgage REIT Operating Partnership (UPREIT Structure) SBC Loan Origination Subsidiary SBA Lending Subsidiary (SBA 7(a) Licensed) ReadyCap Holdings, LLC (Taxable REIT Subsidiary) Sutherland Partners, LP Sutherland Asset I, LLC 7
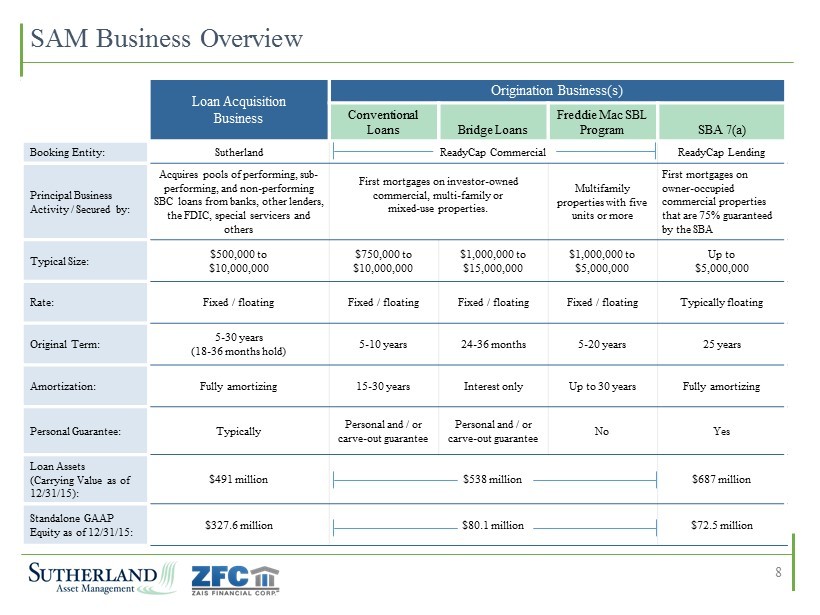
SAM Business Overview 8 Loan Acquisition Business Origination Business(s) Conventional Loans Bridge Loans Freddie Mac SBL Program SBA 7(a) Booking Entity: Sutherland ReadyCap Commercial ReadyCap Lending Principal Business Activity / Secured by: Acquires pools of performing, sub - performing, and non - performing SBC loans from banks, other lenders, the FDIC, special servicers and others First mortgages on investor - owned commercial, multi - family or mixed - use properties. Multifamily properties with five units or more First mortgages on owner - occupied commercial properties that are 75% guaranteed by the SBA Typical Size: $500,000 to $10,000,000 $750,000 to $10,000,000 $1,000,000 to $15,000,000 $1,000,000 to $5,000,000 Up to $5,000,000 Rate: Fixed / floating Fixed / floating Fixed / floating Fixed / floating Typically floating Original Term: 5 - 30 years (18 - 36 months hold) 5 - 10 years 24 - 36 months 5 - 20 years 25 years Amortization: Fully amortizing 15 - 30 years Interest only Up to 30 years Fully amortizing Personal Guarantee: Typically Personal and / or carve - out guarantee Personal and / or carve - out guarantee No Yes Loan Assets (Carrying Value as of 12/31/15): $491 million $538 million $687 million Standalone GAAP Equity as of 12/31/15 : $327.6 million $80.1 million $72.5 million
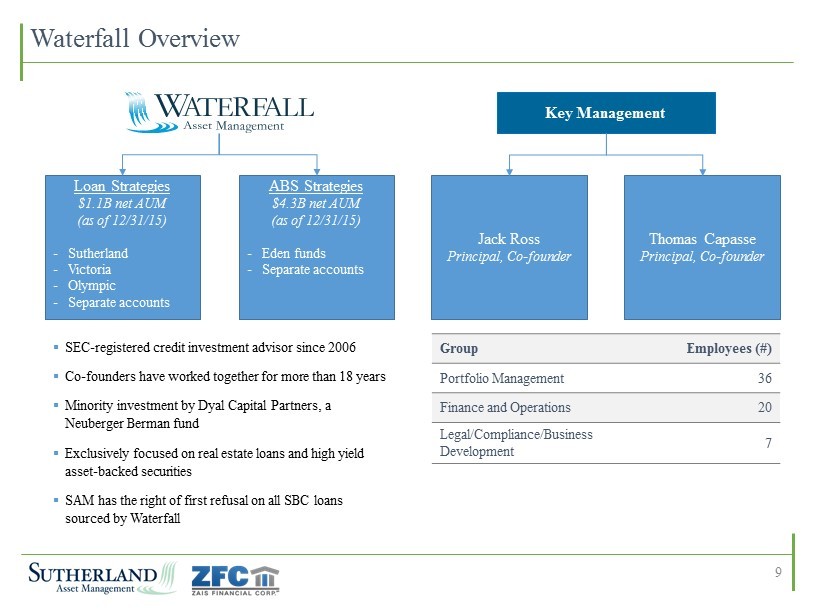
Waterfall Overview Loan Strategies $1.1B net AUM (as of 12/31/15) - Sutherland - Victoria - Olympic - Separate accounts ABS Strategies $4.3B net AUM (as of 12/31/15) - Eden funds - Separate accounts Jack Ross Principal, Co - founder Thomas Capasse Principal, Co - founder ▪ SEC - registered credit investment advisor since 2006 ▪ Co - founders have worked together for more than 18 years ▪ Minority investment by Dyal Capital Partners, a Neuberger Berman fund ▪ Exclusively focused on real estate loans and high yield asset - backed securities ▪ SAM has the right of first refusal on all SBC loans sourced by Waterfall Group Employees (#) Portfolio Management 36 Finance and Operations 20 Legal/Compliance/Business Development 7 Key Management 9
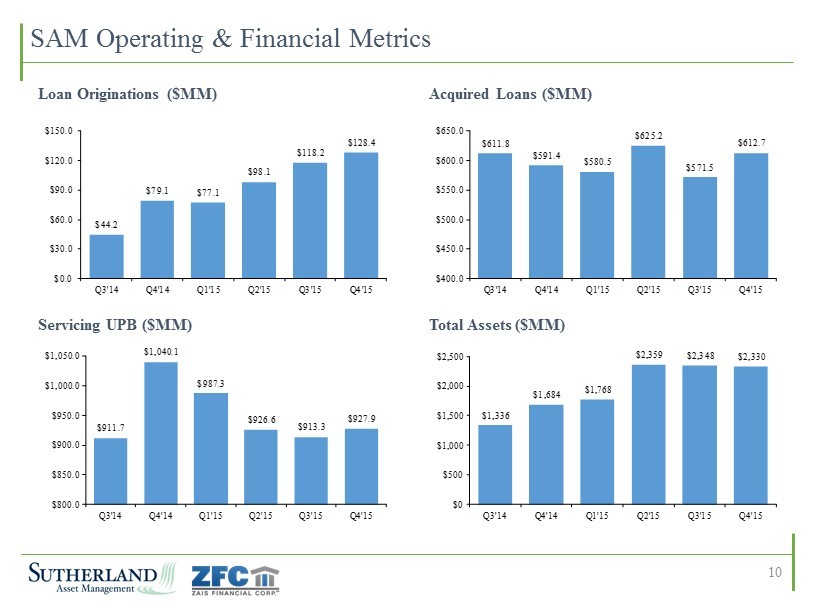
SAM Operating & Financial Metrics 10 Loan Originations ($MM) Acquired Loans ($MM) Total Assets ($MM) Servicing UPB ($MM) $611.8 $591.4 $580.5 $625.2 $571.5 $612.7 $400.0 $450.0 $500.0 $550.0 $600.0 $650.0 Q3'14 Q4'14 Q1'15 Q2'15 Q3'15 Q4'15 $911.7 $1,040.1 $987.3 $926.6 $913.3 $927.9 $800.0 $850.0 $900.0 $950.0 $1,000.0 $1,050.0 Q3'14 Q4'14 Q1'15 Q2'15 Q3'15 Q4'15 $1,336 $1,684 $1,768 $2,359 $2,348 $2,330 $0 $500 $1,000 $1,500 $2,000 $2,500 Q3'14 Q4'14 Q1'15 Q2'15 Q3'15 Q4'15 $44.2 $79.1 $77.1 $98.1 $118.2 $128.4 $0.0 $30.0 $60.0 $90.0 $120.0 $150.0 Q3'14 Q4'14 Q1'15 Q2'15 Q3'15 Q4'15
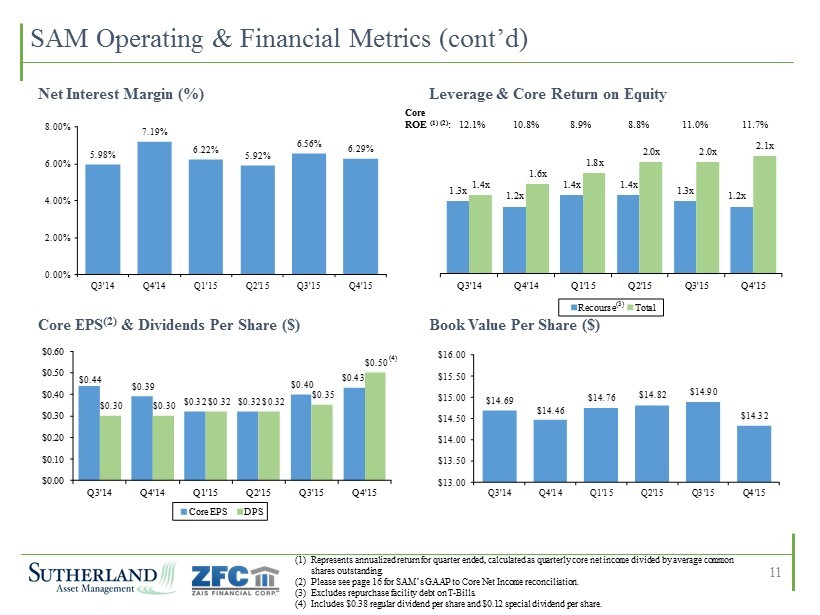
11 Net Interest Margin (%) Leverage & Core Return on Equity Core EPS (2) & Dividends Per Share ($) Book Value Per Share ($) Core ROE (1) (2) : 12.1% 10.8% 8.9% 8.8% 11.0% 11.7% (1) Represents annualized return for quarter ended, calculated as quarterly core net income divided by average common shares outstanding. (2) Please see page 16 for SAM’s GAAP to Core Net Income reconciliation. (3) Excludes repurchase facility debt on T - Bills. (4) Includes $0.38 regular dividend per share and $0.12 special dividend per share. (4) 5.98% 7.19% 6.22% 5.92% 6.56% 6.29% 0.00% 2.00% 4.00% 6.00% 8.00% Q3'14 Q4'14 Q1'15 Q2'15 Q3'15 Q4'15 $14.69 $14.46 $14.76 $14.82 $14.90 $14.32 $13.00 $13.50 $14.00 $14.50 $15.00 $15.50 $16.00 Q3'14 Q4'14 Q1'15 Q2'15 Q3'15 Q4'15 $0.44 $0.39 $0.32 $0.32 $0.40 $0.43 $0.30 $0.30 $0.32 $0.32 $0.35 $0.50 $0.00 $0.10 $0.20 $0.30 $0.40 $0.50 $0.60 Q3'14 Q4'14 Q1'15 Q2'15 Q3'15 Q4'15 Core EPS DPS 1.3x 1.2x 1.4x 1.4x 1.3x 1.2x 1.4x 1.6x 1.8x 2.0x 2.0x 2.1x Q3'14 Q4'14 Q1'15 Q2'15 Q3'15 Q4'15 Recourse Total (3) SAM Operating & Financial Metrics (cont’d)
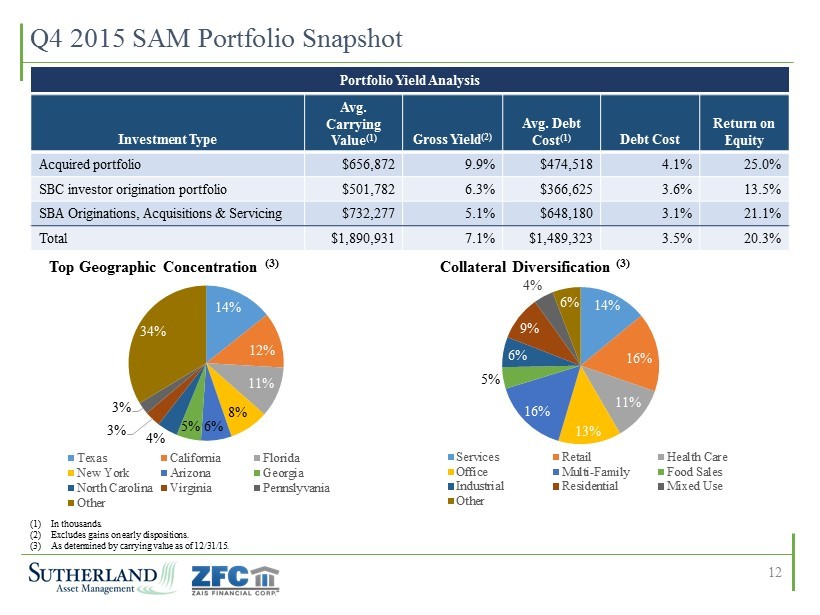
14% 12% 11% 8% 6% 5% 4% 3% 3% 34% Texas California Florida New York Arizona Georgia North Carolina Virginia Pennslyvania Other Q4 2015 SAM Portfolio Snapshot Portfolio Yield Analysis Investment Type Avg. Carrying Value (1) Gross Yield (2) Avg. Debt Cost (1) Debt Cost Return on Equity Acquired portfolio $656,872 9.9% $474,518 4.1% 25.0% SBC investor origination portfolio $501,782 6.3% $366,625 3.6% 13.5% SBA Originations, Acquisitions & Servicing $732,277 5.1% $648,180 3.1% 21.1% Total $1,890,931 7.1% $1,489,323 3.5% 20.3% 14% 16% 11% 13% 16% 5% 6% 9% 4% 6% Services Retail Health Care Office Multi-Family Food Sales Industrial Residential Mixed Use Other Top Geographic Concentration (3) Collateral Diversification (3) (1) In thousands. (2) Excludes gains on early dispositions. (3) As determined by carrying value as of 12/31/15. 12
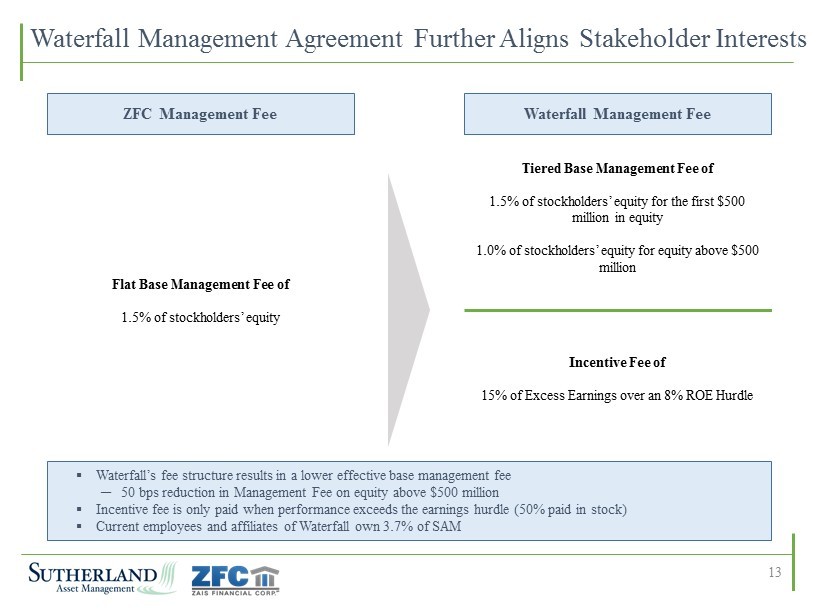
Waterfall Management Agreement Further Aligns Stakeholder Interests ZFC Management Fee Waterfall Management Fee Tiered Base Management Fee of 1.5% of stockholders’ equity for the first $500 million in equity 1.0% of stockholders’ equity for equity above $500 million Incentive Fee of 15% of Excess Earnings over an 8% ROE Hurdle ▪ Waterfall’s fee structure results in a lower effective base management fee ─ 50 bps reduction in Management Fee on equity above $500 million ▪ Incentive fee is only paid when performance exceeds the earnings hurdle (50% paid in stock) ▪ Current employees and affiliates of Waterfall own 3.7% of SAM Flat Base Management Fee of 1.5% of stockholders’ equity 13
Conclusion ▪ Creates a publicly - traded mortgage REIT focused on small balance commercial mortgages ▪ Primary focus will remain small balance commercial lending with ~10% target equity allocation to residential mortgage assets ▪ Significantly increases scale and creates a combined company with a stockholders’ equity base in excess of $550 million (1) ▪ Substantially increases the liquidity in the stock ▪ Public equity currency enhances SAM access to the capital markets at potentially lower cost, improving returns further ▪ Stockholders benefit from lower base management fees while incentive fee structure further aligns stakeholder interests 14 (1) Assumes the tender is fully - subscribed and other transaction adjustments as described on page 3.
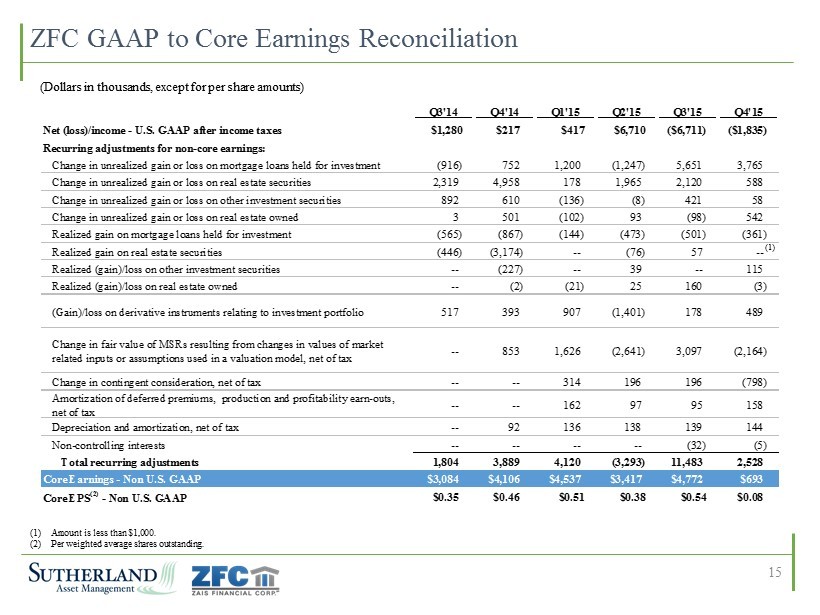
(1) Amount is less than $1,000. (2) Per weighted average shares outstanding. 15 ZFC GAAP to Core Earnings Reconciliation (Dollars in thousands, except for per share amounts) (1) Q3'14 Q4'14 Q1'15 Q2'15 Q3'15 Q4'15 Net (loss)/income - U.S. GAAP after income taxes $1,280 $217 $417 $6,710 ($6,711) ($1,835) Recurring adjustments for non-core earnings: Change in unrealized gain or loss on mortgage loans held for investment (916) 752 1,200 (1,247) 5,651 3,765 Change in unrealized gain or loss on real estate securities 2,319 4,958 178 1,965 2,120 588 Change in unrealized gain or loss on other investment securities 892 610 (136) (8) 421 58 Change in unrealized gain or loss on real estate owned 3 501 (102) 93 (98) 542 Realized gain on mortgage loans held for investment (565) (867) (144) (473) (501) (361) Realized gain on real estate securities (446) (3,174) -- (76) 57 -- Realized (gain)/loss on other investment securities -- (227) -- 39 -- 115 Realized (gain)/loss on real estate owned -- (2) (21) 25 160 (3) (Gain)/loss on derivative instruments relating to investment portfolio 517 393 907 (1,401) 178 489 Change in fair value of MSRs resulting from changes in values of market related inputs or assumptions used in a valuation model, net of tax -- 853 1,626 (2,641) 3,097 (2,164) Change in contingent consideration, net of tax -- -- 314 196 196 (798) Amortization of deferred premiums, production and profitability earn-outs, net of tax -- -- 162 97 95 158 Depreciation and amortization, net of tax -- 92 136 138 139 144 Non-controlling interests -- -- -- -- (32) (5) Total recurring adjustments 1,804 3,889 4,120 (3,293) 11,483 2,528 Core Earnings - Non U.S. GAAP $3,084 $4,106 $4,537 $3,417 $4,772 $693 Core EPS (2) - Non U.S. GAAP $0.35 $0.46 $0.51 $0.38 $0.54 $0.08
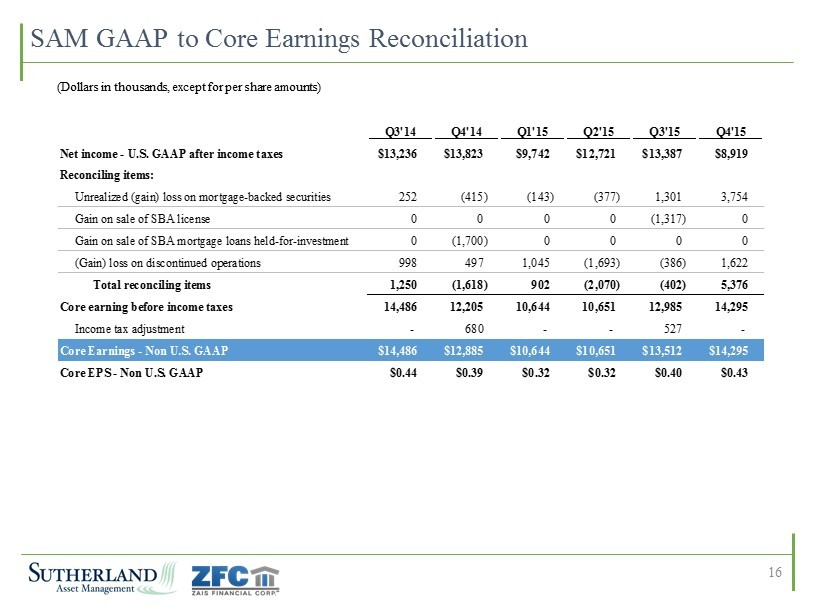
SAM GAAP to Core Earnings Reconciliation 16 Q3'14 Q4'14 Q1'15 Q2'15 Q3'15 Q4'15 Net income - U.S. GAAP after income taxes $13,236 $13,823 $9,742 $12,721 $13,387 $8,919 Reconciling items: Unrealized (gain) loss on mortgage-backed securities 252 (415) (143) (377) 1,301 3,754 Gain on sale of SBA license 0 0 0 0 (1,317) 0 Gain on sale of SBA mortgage loans held-for-investment 0 (1,700) 0 0 0 0 (Gain) loss on discontinued operations 998 497 1,045 (1,693) (386) 1,622 Total reconciling items 1,250 (1,618) 902 (2,070) (402) 5,376 Core earning before income taxes 14,486 12,205 10,644 10,651 12,985 14,295 Income tax adjustment - 680 - - 527 - Core Earnings - Non U.S. GAAP $14,486 $12,885 $10,644 $10,651 $13,512 $14,295 Core EPS - Non U.S. GAAP $0.44 $0.39 $0.32 $0.32 $0.40 $0.43 (Dollars in thousands, except for per share amounts)
Disclaimer Forward - Looking Statements ▪ This presentation contains statements that constitute “forward - looking statements,” as such term is defined in Section 27A of th e Securities Act of 1933, as amended, and Section 21E of the Securities Exchange Act of 1934, as amended, and such statements are intended to be covered by the safe harbors provided by t he same. These statements are based on current expectations and beliefs of management and are subject to a number of trends and uncertainties that could cause actual results to differ mater ial ly from those described in the forward - looking statements; neither SAM nor ZFC can give any assurance that expectations will be attained. ▪ Factors that could cause actual results to differ materially from expectations include, but are not limited to, the risk that th e merger will not be consummated within the expected time period or at all; the occurrence of any event, change or other circumstances that could give rise to the termination of the merger agreement; t he inability to obtain stockholder approvals relating to the merger or the failure to satisfy the other conditions to completion of the merger; fluctuations in the adjusted book value per share of the sh ares of both SAM and ZFC; risks related to disruption of management attention from the companies’ ongoing business operations due to the proposed merger; the effect of the announcement of the p rop osed merger on SAM’s and ZFC’s operating results and businesses generally; the outcome of any legal proceedings relating to the merger; changes in future loan production; the ability to ret ain key managers of GMFS; availability of suitable investment opportunities; changes in interest rates; changes in the yield curve; changes in prepayment rates; the availability and terms of financing; general economic conditions; market conditions; conditions in the market for mortgage - related investments; legislative and regulatory changes that could adversely affect the businesses of ZF C and SAM; and other factors, including those set forth in the Risk Factors section of ZFC’s most recent Annual Report on Form 10 - K filed with the Securities and Exchange Commission (the “SEC”), a nd other reports filed by ZFC with the SEC, copies of which are available on the SEC’s website, www.sec.gov. Neither SAM nor ZFC undertakes any obligation to update these statements for re visions or changes after the date of this presentation, except as required by law. Additional Information About the Merger • In connection with the proposed merger, ZFC expects to prepare and file with the U.S. Securities and Exchange Commission (“SE C”) a registration statement on Form S - 4 containing a joint proxy statement/prospectus and other documents with respect to the proposed merger. The joint proxy/prospectus will contain importa nt information about the proposed transaction and related matters. INVESTORS ARE URGED TO READ THE JOINT PROXY STATEMENT/PROSPECTUS (INCLUDING ALL AMENDMENTS AND SUPPLEMENTS THERETO) AND OTHER RE LEVANT DOCUMENTS FILED BY ZFC WITH THE SEC CAREFULLY IF AND WHEN THEY BECOME AVAILABLE BECAUSE THEY WILL CONTAIN IMPORTANT INFORMATI ON ABOUT ZFC, SAM AND THE PROPOSED MERGER. • Investors and stockholders of ZFC and SAM may obtain free copies of the registration statement, the joint proxy statement/pro spe ctus and other relevant documents filed by ZFC with the SEC (if and when they become available) through the website maintained by the SEC at www.sec.gov. Copies of the documents filed by ZF C w ith the SEC are also available free of charge on ZFC’s website at www.zaisfinancial.com. • This communication shall not constitute an offer to sell or the solicitation of an offer to buy any securities, nor shall the re be any sale of securities in any jurisdiction in which such offer, solicitation or sale would be unlawful prior to registration or qualification under the securities laws of any such jurisdiction. No offer ing of securities shall be made except by means of a prospectus meeting the requirements of Section 10 of the U.S. Securities Act of 1933, as amended. • In addition, additional details about the proposed merger can be found in ZFC’s Current Report on Form 8 - K to be filed with the SEC. Copies can be obtained from the SEC website at www.sec.gov, or on ZFC’s website at www.zaisfinancial.com. ZFC stockholders may also contact ZFC Investor Services for additional informat ion by calling 212 - 827 - 3773 or emailing mmeek@mww.com. Participants in Solicitation Relating to the Merger • ZFC, SAM and their respective directors and executive officers may be deemed to be participants in the solicitation of proxie s f rom ZFC’s and SAM’s stockholders in respect of the proposed merger. Information regarding ZFC’s directors and executive officers can be found in ZFC’s definitive proxy statement filed with the SEC on March 31, 2015, the Form 8 - K filed on June 1, 2015, and the Company’s most recent Annual Report filed on Form 10 - K on March 10, 2016. Information regarding SAM’s directors and executive o fficers can be found in SAM’s Form S - 11/A filed with the SEC on December 14, 2015. Additional information regarding the interests of such potential participants will be included in the joint proxy statement/prospectus and other relevant documents filed with the SEC in connection with the proposed merger if and when they become available. These documents are available free of cha rge on the SEC’s website and from ZFC or SAM, as applicable, using the sources indicated above. 17