Attached files
| file | filename |
|---|---|
| 8-K - FORM 8-K - RITE AID CORP | v436302_8k.htm |
| EX-99.1 - EXHIBIT 99.1 - RITE AID CORP | v436302_ex99-1.htm |
Exhibit 99.2
April 7, 2016
Investors are urged to review Rite Aid’s SEC filings . Statements , estimates, targets and other information included herein might be considered forward - looking . These statements and estimates are based upon various assumptions that may not prove to be correct . Such assumptions are inherently subject to significant uncertainties and contingencies, many of which are beyond the company’s control . No representation is made, and no assurance can be given, that such results can or will be attained . The risk factors associated with those uncertainties are described in Rite Aid’s most recent Form 10 - K, its Form 10 - Q’s and other filings with the SEC . Rite Aid assumes no obligation to update the information or the forward - looking statements contained herein, whether as a result of new information or otherwise . Also included herein are non - GAAP financial measures . The definition and purpose for using these measures are in Rite Aid’s Form 8 - K furnished to the SEC on the date hereof . Safe Harbor Statement
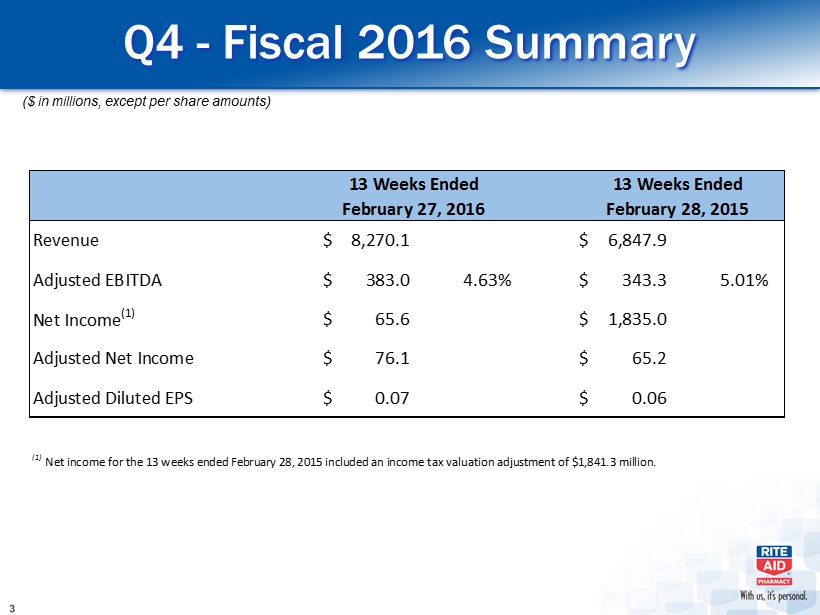
Q4 - Fiscal 2016 Summary ($ in millions, except per share amounts) Revenue 8,270.1$ 6,847.9$ Adjusted EBITDA 383.0$ 4.63% 343.3$ 5.01% Net Income (1) 65.6$ 1,835.0$ Adjusted Net Income 76.1$ 65.2$ Adjusted Diluted EPS 0.07$ 0.06$ (1) Net income for the 13 weeks ended February 28, 2015 included an income tax valuation adjustment of $1,841.3 million. 13 Weeks Ended February 27, 2016 13 Weeks Ended February 28, 2015
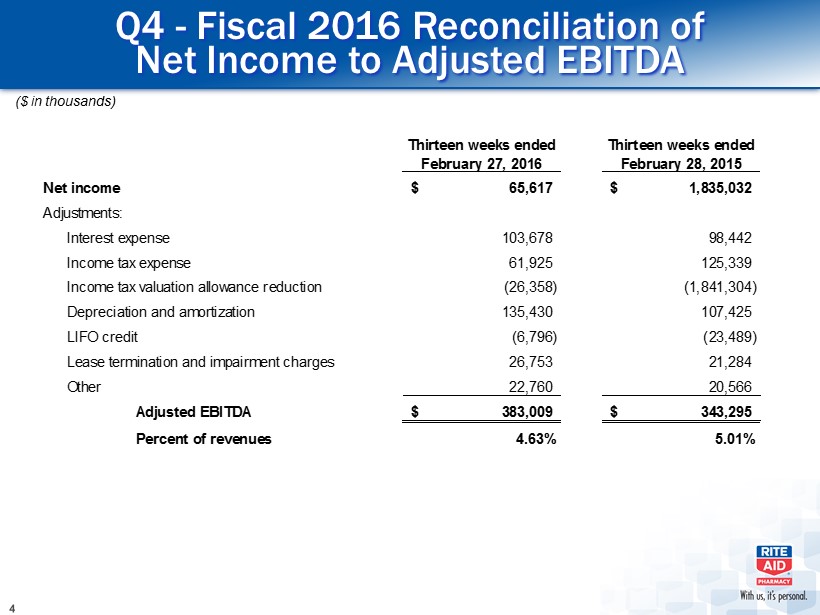
Q4 - Fiscal 2016 Reconciliation of Net Income to Adjusted EBITDA ($ in thousands) Thirteen weeks ended February 27, 2016 Thirteen weeks ended February 28, 2015 Net income 65,617$ 1,835,032$ Adjustments: Interest expense 103,678 98,442 Income tax expense 61,925 125,339 Income tax valuation allowance reduction (26,358) (1,841,304) Depreciation and amortization 135,430 107,425 LIFO credit (6,796) (23,489) Lease termination and impairment charges 26,753 21,284 Other 22,760 20,566 Adjusted EBITDA 383,009$ 343,295$ Percent of revenues 4.63% 5.01%
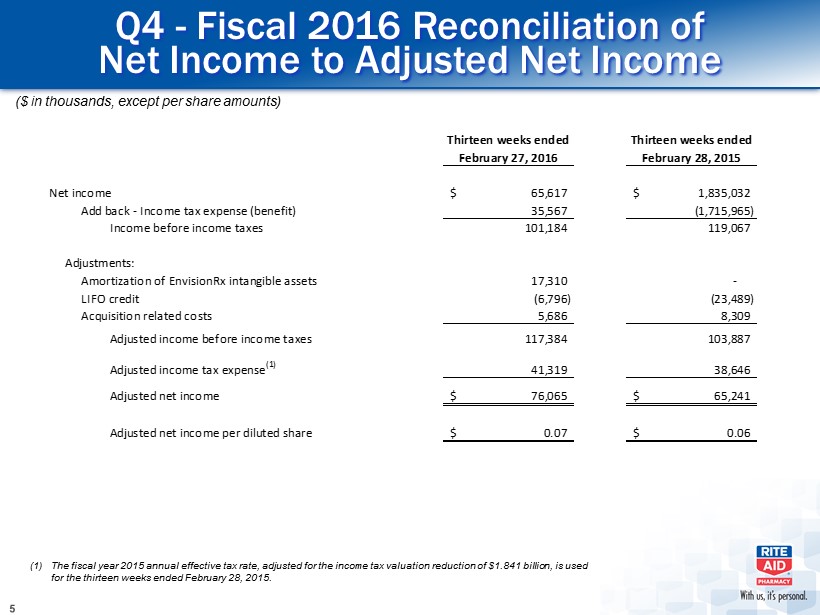
Q4 - Fiscal 2016 Reconciliation of Net Income to Adjusted Net Income ($ in thousands, except per share amounts) Thirteen weeks ended Thirteen weeks ended February 27, 2016 February 28, 2015 Net income 65,617$ 1,835,032$ Add back - Income tax expense (benefit) 35,567 (1,715,965) Income before income taxes 101,184 119,067 Adjustments: Amortization of EnvisionRx intangible assets 17,310 - LIFO credit (6,796) (23,489) Acquisition related costs 5,686 8,309 Adjusted income before income taxes 117,384 103,887 Adjusted income tax expense (1) 41,319 38,646 Adjusted net income 76,065$ 65,241$ Adjusted net income per diluted share 0.07$ 0.06$ (1) The fiscal year 2015 annual effective tax rate, adjusted for the income tax valuation reduction of $1.841 billion, is used for the thirteen weeks ended February 28, 2015.
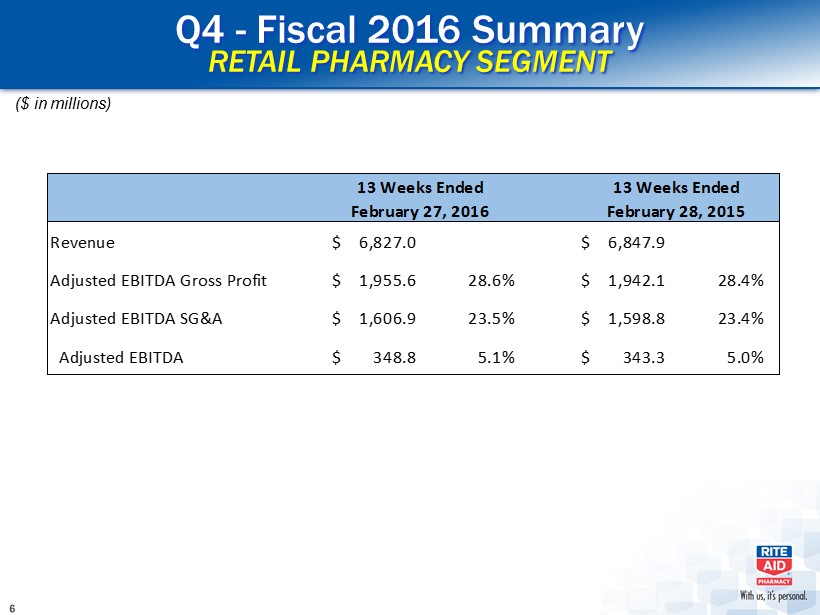
Q4 - Fiscal 2016 Summary RETAIL PHARMACY SEGMENT ($ in millions) Revenue 6,827.0$ 6,847.9$ Adjusted EBITDA Gross Profit 1,955.6$ 28.6% 1,942.1$ 28.4% Adjusted EBITDA SG&A 1,606.9$ 23.5% 1,598.8$ 23.4% Adjusted EBITDA 348.8$ 5.1% 343.3$ 5.0% 13 Weeks Ended February 27, 2016 13 Weeks Ended February 28, 2015
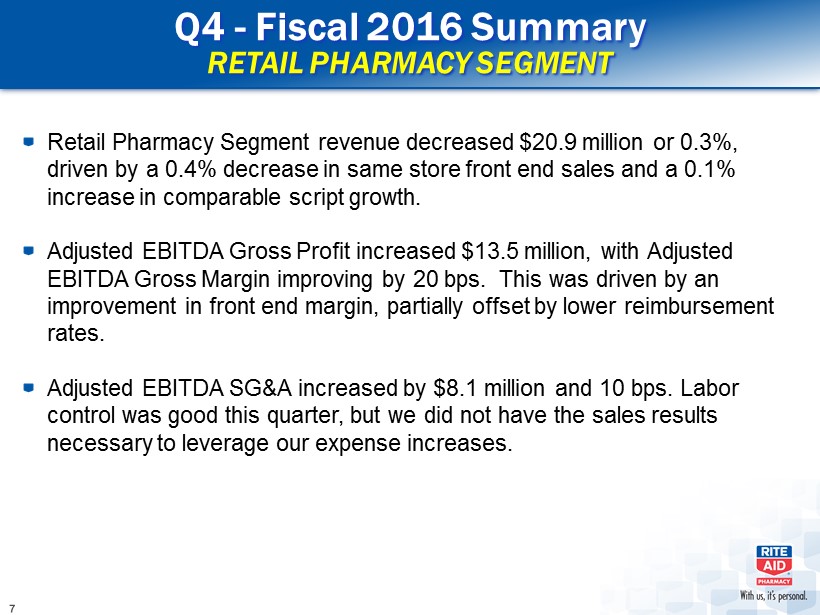
Q4 - Fiscal 2016 Summary RETAIL PHARMACY SEGMENT Retail Pharmacy Segment revenue decreased $20.9 million or 0.3%, driven by a 0.4% decrease in same store front end sales and a 0.1% increase in comparable script growth. Adjusted EBITDA Gross Profit increased $13.5 million, with Adjusted EBITDA Gross Margin improving by 20 bps. This was driven by an improvement in front end margin, partially offset by lower reimbursement rates. Adjusted EBITDA SG&A increased by $8.1 million and 10 bps. Labor control was good this quarter, but we did not have the sales results necessary to leverage our expense increases.
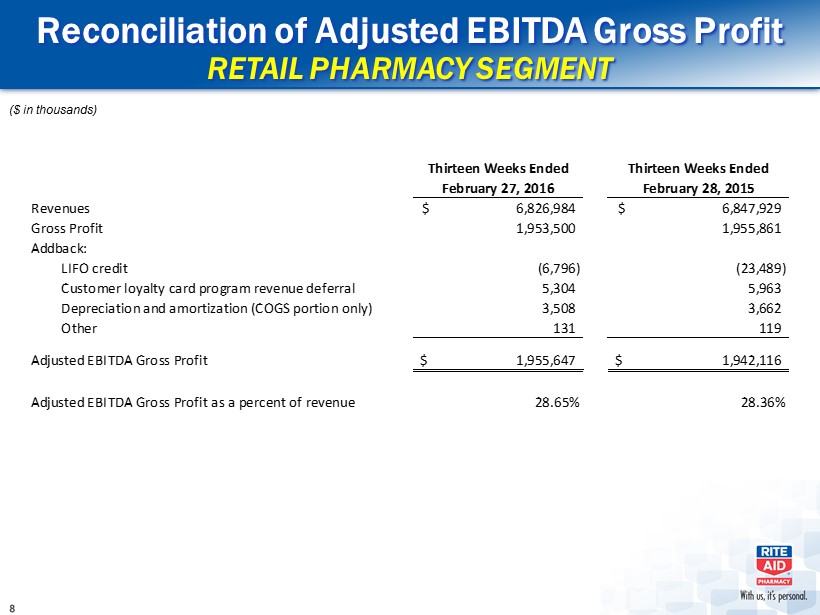
Reconciliation of Adjusted EBITDA Gross Profit RETAIL PHARMACY SEGMENT ($ in thousands) Thirteen Weeks Ended Thirteen Weeks Ended February 27, 2016 February 28, 2015 Revenues 6,826,984$ 6,847,929$ Gross Profit 1,953,500 1,955,861 Addback: LIFO credit (6,796) (23,489) Customer loyalty card program revenue deferral 5,304 5,963 Depreciation and amortization (COGS portion only) 3,508 3,662 Other 131 119 Adjusted EBITDA Gross Profit 1,955,647$ 1,942,116$ Adjusted EBITDA Gross Profit as a percent of revenue 28.65% 28.36%
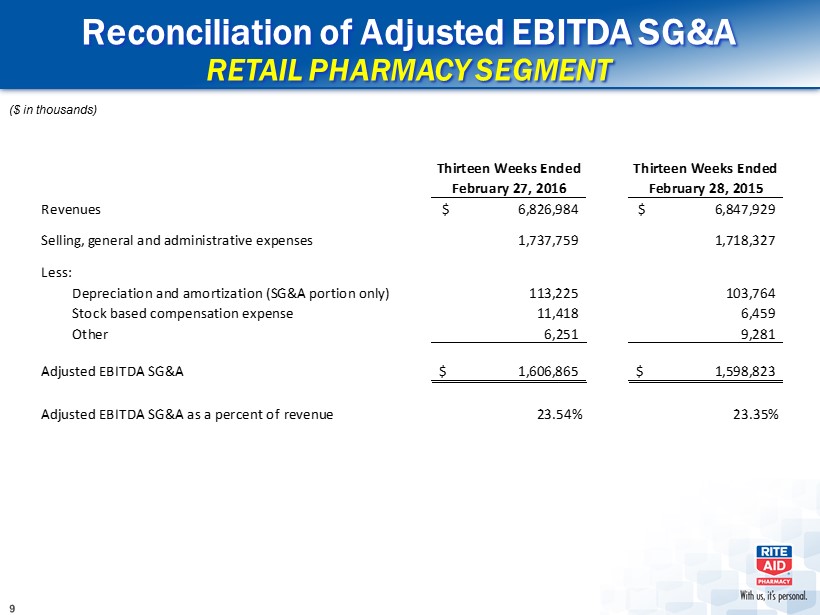
Reconciliation of Adjusted EBITDA SG&A RETAIL PHARMACY SEGMENT ($ in thousands) Thirteen Weeks Ended Thirteen Weeks Ended February 27, 2016 February 28, 2015 Revenues 6,826,984$ 6,847,929$ Selling, general and administrative expenses 1,737,759 1,718,327 Less: Depreciation and amortization (SG&A portion only) 113,225 103,764 Stock based compensation expense 11,418 6,459 Other 6,251 9,281 Adjusted EBITDA SG&A 1,606,865$ 1,598,823$ Adjusted EBITDA SG&A as a percent of revenue 23.54% 23.35%
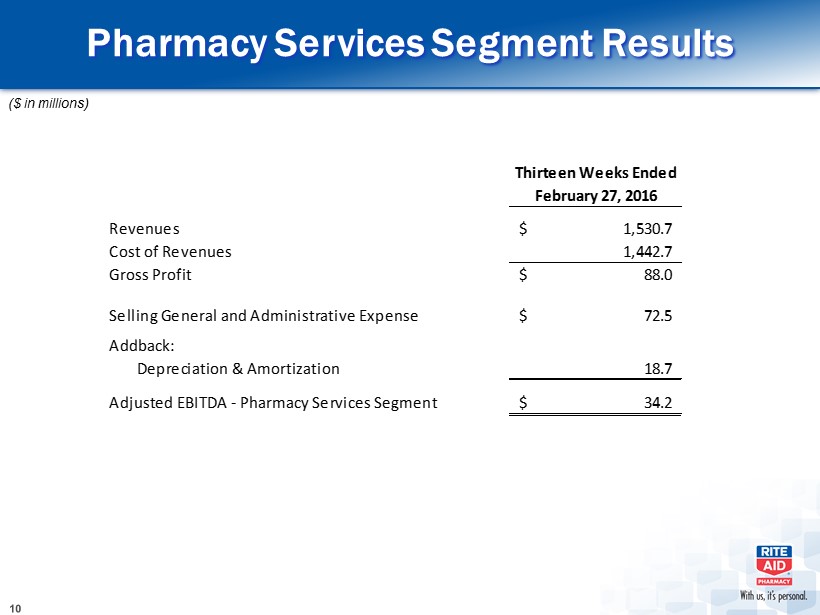
Pharmacy Services Segment Results ($ in millions) Thirteen Weeks Ended February 27, 2016 Revenues 1,530.7$ Cost of Revenues 1,442.7 Gross Profit 88.0$ Selling General and Administrative Expense 72.5$ Addback: Depreciation & Amortization 18.7 Adjusted EBITDA - Pharmacy Services Segment 34.2$
Q4 - FY 2016 Summary PHARMACY SERVICES SEGMENT Revenues were strong due to the addition of lives at both Envision and MedTrak Gross profit increased over the comparable prior year period due to the increase in lives. Gross margin was consistent year over year Selling, general and administrative expenses increased over the comparable prior year period as headcount was added to handle the increase in lives
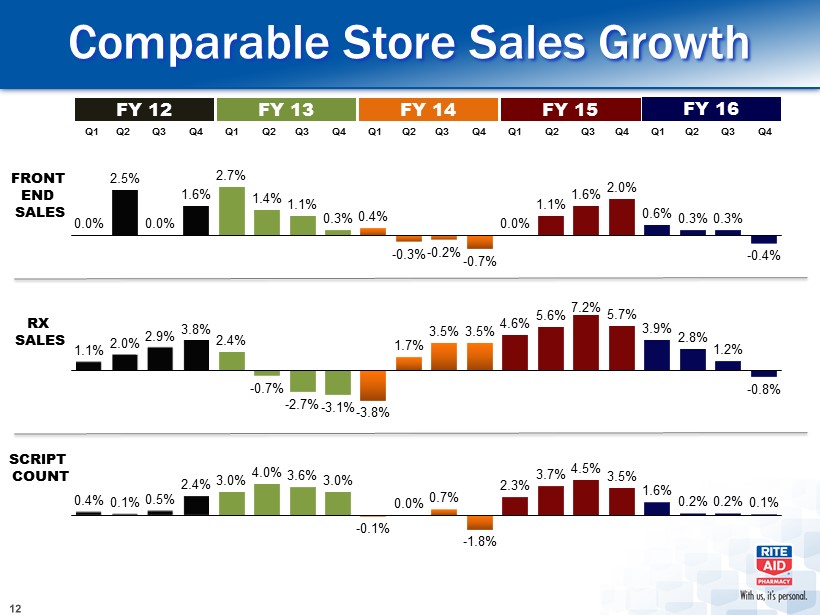
FRONT END SALES RX SALES SCRIPT COUNT 0.0% 2.5% 0.0% 1.6% 2.7% 1.4% 1.1% 0.3% 0.4% - 0.3% - 0.2% - 0.7% 0.0% 1.1% 1.6% 2.0% 0.6% 0.3% 0.3% - 0.4% 1.1% 2.0% 2.9% 3.8% 2.4% - 0.7% - 2.7% - 3.1% - 3.8% 1.7% 3.5% 3.5% 4.6% 5.6% 7.2% 5.7% 3.9% 2.8% 1.2% - 0.8% Q1 Q2 Q3 Q4 Q1 Q2 Q3 Q4 Q1 Q2 Q3 Q4 Q1 Q2 Q3 Q4 Q1 Q2 Q3 Q4 Comparable Store Sales Growth FY 12 FY 13 FY 14 FY 15 FY 16 0.4% 0.1% 0.5% 2.4% 3.0% 4.0% 3.6% 3.0% - 0.1% 0.0% 0.7% - 1.8% 2.3% 3.7% 4.5% 3.5% 1.6% 0.2% 0.2% 0.1%
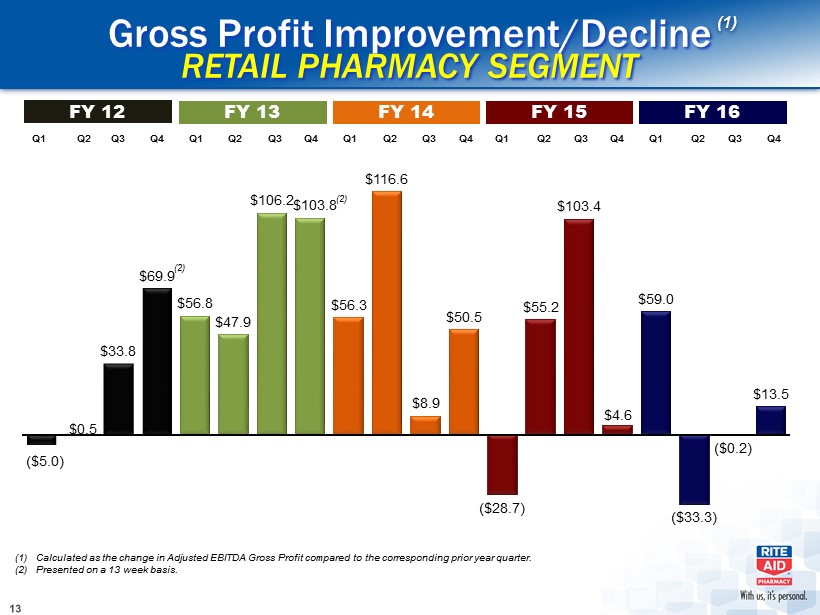
Gross Profit Improvement/Decline RETAIL PHARMACY SEGMENT ($5.0) $0.5 $33.8 $69.9 $56.8 $47.9 $106.2 $103.8 $56.3 $116.6 $8.9 $50.5 ($28.7) $55.2 $103.4 $4.6 $59.0 ($33.3) ($0.2) $13.5 (1) (1) Calculated as the change in Adjusted EBITDA Gross Profit compared to the corresponding prior year quarter. (2) Presented on a 13 week basis. (2) (2) Q1 Q2 Q3 Q4 Q1 Q2 Q3 Q4 Q1 Q2 Q3 Q4 Q1 Q2 Q3 Q4 Q1 Q2 Q3 Q4 FY 12 FY 13 FY 14 FY 15 FY 16
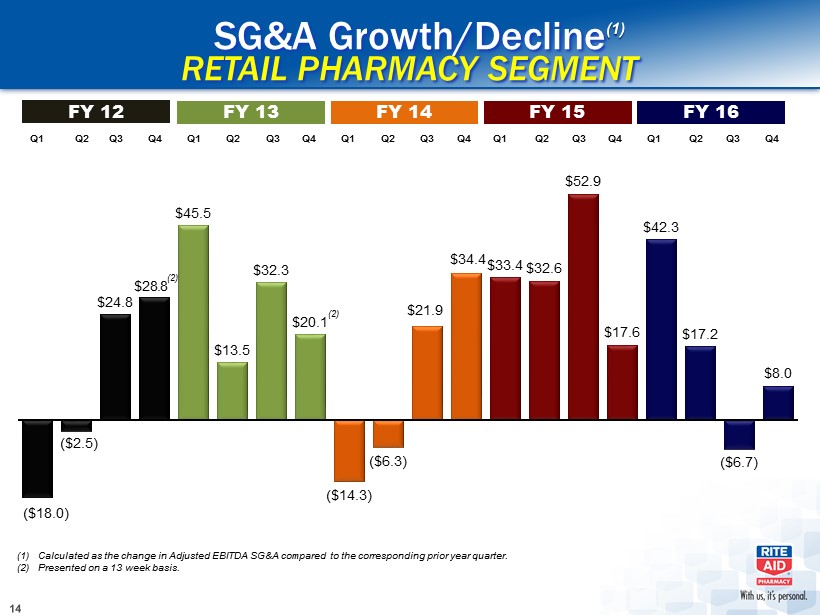
SG&A Growth/Decline RETAIL PHARMACY SEGMENT ($18.0) ($2.5) $24.8 $28.8 $45.5 $13.5 $32.3 $20.1 ($14.3) ($6.3) $21.9 $34.4 $33.4 $32.6 $52.9 $17.6 $42.3 $17.2 ($6.7) $8.0 (2) (2) (1) Calculated as the change in Adjusted EBITDA SG&A compared to the corresponding prior year quarter. (2) Presented on a 13 week basis. Q1 Q2 Q3 Q4 Q1 Q2 Q3 Q4 Q1 Q2 Q3 Q4 Q1 Q2 Q3 Q4 Q1 Q2 Q3 Q4 FY 12 FY 13 FY 14 FY 15 FY 16
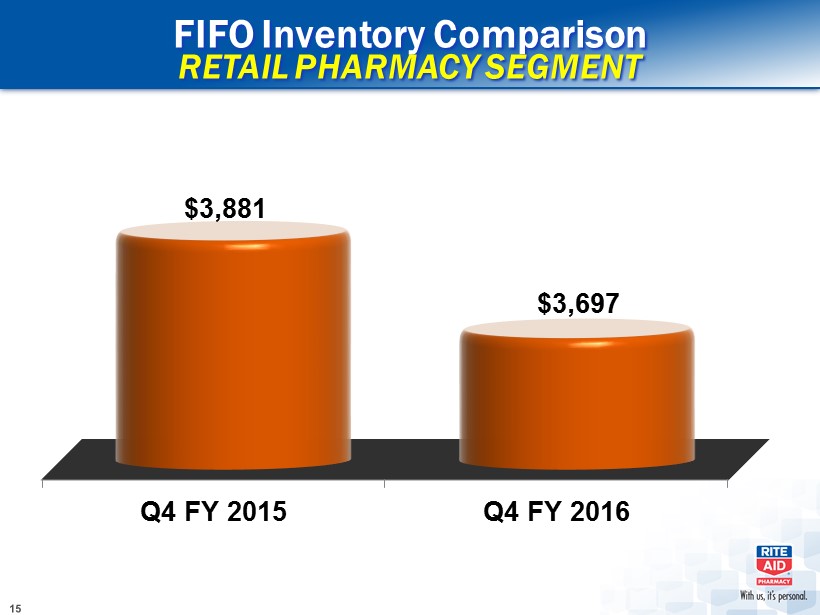
FIFO Inventory Comparison RETAIL PHARMACY SEGMENT Q4 FY 2015 Q4 FY 2016 $3,881 $3,697
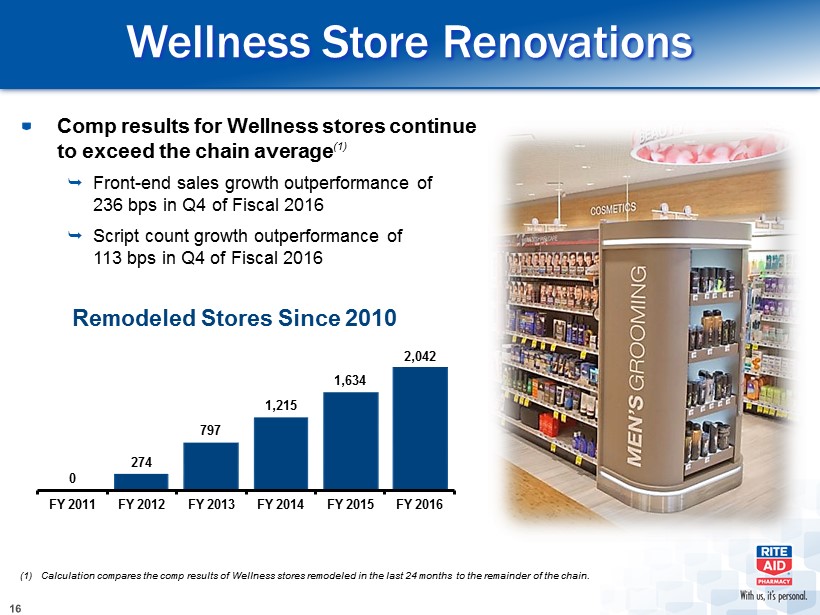
Wellness Store Renovations Comp results for Wellness stores continue to exceed the chain average (1) Front - end sales growth outperformance of 236 bps in Q4 of Fiscal 2016 Script count growth outperformance of 113 bps in Q4 of Fiscal 2016 0 274 797 1,215 1,634 2,042 FY 2011 FY 2012 FY 2013 FY 2014 FY 2015 FY 2016 Remodeled Stores Since 2010 (1) Calculation compares the comp results of Wellness stores remodeled in the last 24 months to the remainder of the chain.
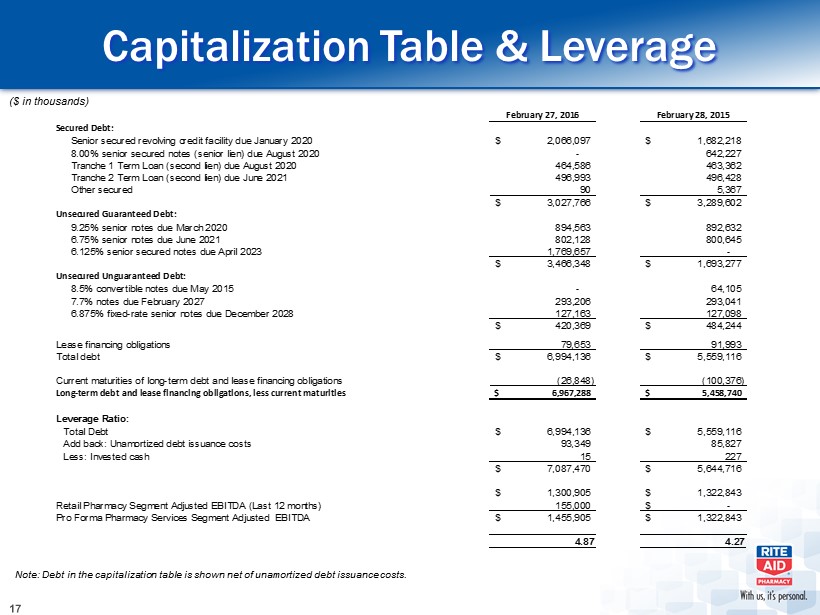
Capitalization Table & Leverage February 27, 2016 February 28, 2015 Secured Debt: Senior secured revolving credit facility due January 2020 2,066,097$ 1,682,218$ 8.00% senior secured notes (senior lien) due August 2020 - 642,227 Tranche 1 Term Loan (second lien) due August 2020 464,586 463,362 Tranche 2 Term Loan (second lien) due June 2021 496,993 496,428 Other secured 90 5,367 3,027,766$ 3,289,602$ Unsecured Guaranteed Debt: 9.25% senior notes due March 2020 894,563 892,632 6.75% senior notes due June 2021 802,128 800,645 6.125% senior secured notes due April 2023 1,769,657 - 3,466,348$ 1,693,277$ Unsecured Unguaranteed Debt: 8.5% convertible notes due May 2015 - 64,105 7.7% notes due February 2027 293,206 293,041 6.875% fixed-rate senior notes due December 2028 127,163 127,098 420,369$ 484,244$ Lease financing obligations 79,653 91,993 Total debt 6,994,136$ 5,559,116$ Current maturities of long-term debt and lease financing obligations (26,848) (100,376) Long-term debt and lease financing obligations, less current maturities 6,967,288$ 5,458,740$ Leverage Ratio: Total Debt 6,994,136$ 5,559,116$ Add back: Unamortized debt issuance costs 93,349 85,827 Less: Invested cash 15 227 7,087,470$ 5,644,716$ 1,300,905$ 1,322,843$ Retail Pharmacy Segment Adjusted EBITDA (Last 12 months) 155,000 -$ Pro Forma Pharmacy Services Segment Adjusted EBITDA 1,455,905$ 1,322,843$ 4.87 4.27 ($ in thousands) Note: Debt in the capitalization table is shown net of unamortized debt issuance costs.
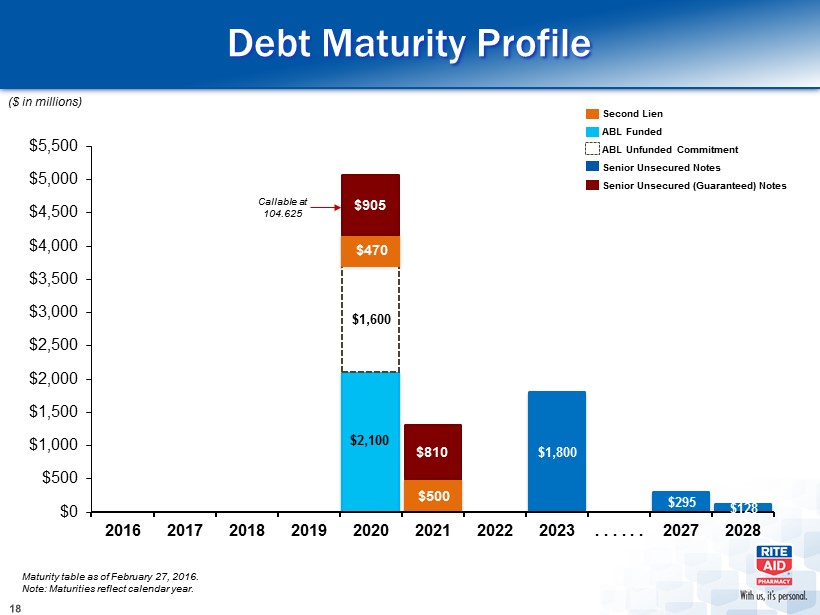
Debt Maturity Profile Maturity table as of February 27, 2016. Note: Maturities reflect calendar year. $2,100 $1,600 $1,800 $295 $128 $470 $500 $905 $810 $0 $500 $1,000 $1,500 $2,000 $2,500 $3,000 $3,500 $4,000 $4,500 $5,000 $5,500 2016 2017 2018 2019 2020 2021 2022 2023 . . . . . . 2027 2028 ($ in millions) Second Lien ABL Funded ABL Unfunded Commitment Senior Unsecured Notes Senior Unsecured (Guaranteed) Notes C allable at 104.625