Attached files
| file | filename |
|---|---|
| EX-10.11 - EX-10.11 - MATTRESS FIRM HOLDING CORP. | mfrm-20160202ex1011a7ade.htm |
| EX-31.1 - EX-31.1 - MATTRESS FIRM HOLDING CORP. | mfrm-20160202ex311cd5163.htm |
| EX-10.7 - EX-10.7 - MATTRESS FIRM HOLDING CORP. | mfrm-20160202ex107cfc0ff.htm |
| EX-10.10 - EX-10.10 - MATTRESS FIRM HOLDING CORP. | mfrm-20160202ex1010c90c9.htm |
| EX-31.2 - EX-31.2 - MATTRESS FIRM HOLDING CORP. | mfrm-20160202ex312316c85.htm |
| EX-23.1 - EX-23.1 - MATTRESS FIRM HOLDING CORP. | mfrm-20160202ex231f31ba7.htm |
| EX-10.29 - EX-10.29 - MATTRESS FIRM HOLDING CORP. | mfrm-20160202ex1029c18b8.htm |
| EX-10.12 - EX-10.12 - MATTRESS FIRM HOLDING CORP. | mfrm-20160202ex1012e787f.htm |
| EX-32.2 - EX-32.2 - MATTRESS FIRM HOLDING CORP. | mfrm-20160202ex32252792d.htm |
| EX-21.1 - EX-21.1 - MATTRESS FIRM HOLDING CORP. | mfrm-20160202ex2116951d5.htm |
| EX-32.1 - EX-32.1 - MATTRESS FIRM HOLDING CORP. | mfrm-20160202ex321e65303.htm |
UNITED STATES
SECURITIES AND EXCHANGE COMMISSION
WASHINGTON, D.C. 20549
FORM 10‑K
|
(Mark One) |
|
|
☒ |
ANNUAL REPORT PURSUANT TO SECTION 13 OR 15(d) OF THE SECURITIES EXCHANGE ACT OF 1934 |
|
For the fiscal year ended February 2, 2016 |
|
|
OR |
|
|
☐ |
TRANSITION REPORT PURSUANT TO SECTION 13 OR 15(d) SECURITIES EXCHANGE |
|
For the Transition Period from to |
|
Commission file number 001‑35354
MATTRESS FIRM HOLDING CORP.
(Exact Name of Registrant as Specified in Its Charter)
|
Delaware |
20‑8185960 |
5815 Gulf Freeway
Houston, Texas 77023
(Address of Principal Executive Offices)(Zip Code)
(713) 923‑1090
Registrant’s telephone number, including area code
Securities registered pursuant to Section 12(b) of the Act:
|
Title of Each Class |
Name of Each Exchange on which Registered |
|
Common Stock, par value $0.01 per share |
NASDAQ Global Select Market |
Securities registered pursuant to Section 12(g) of the Act: None
Indicate by check mark if the registrant is a well‑known seasoned issuer as defined in Rule 405 of the Securities Act Yes ☒ No ☐
Indicate by check mark if the registrant is not required to file reports pursuant to Section 13 or Section 15(d) of the Act. Yes ☐ No ☒
Indicate by check mark whether the registrant (1) has filed all reports required to be filed by Section 13 or 15(d) of the Securities Exchange Act of 1934 during the preceding 12 months (or for such shorter period that the registrant was required to file such reports), and (2) has been subject to such filing requirements for the past 90 days. Yes ☒ No ☐
Indicate by check mark whether the registrant has submitted electronically and posted on its corporate Website, if any, every Interactive Data File required to be submitted and posted pursuant to Rule 405 of Regulation S‑T during the preceding 12 months (or for such shorter period that the registrant was required to submit and post such files). Yes ☒ No ☐
Indicate by check mark if disclosure of delinquent filers pursuant to Item 405 of Regulation S‑K is not contained herein, and will not be contained, to the best of registrant’s knowledge, in definitive proxy or information statements incorporated by reference in Part III of this Form 10‑K or any amendment to this Form 10‑K. ☐
Indicate by check mark whether the registrant is a large accelerated filer, an accelerated filer, a non‑accelerated filer, or a smaller reporting company. See definitions of “large accelerated filer,” “accelerated filer,” and “smaller reporting company” in Rule 12b‑2 of the Exchange Act.
|
Large accelerated filer ☒ |
Accelerated filer ☐ |
Non‑accelerated filer ☐ |
Smaller reporting company ☐ |
Indicate by check mark whether registrant is a shell company (as defined in Rule 12b‑2 of the Act). Yes ☐ No ☒
On August 4, 2015, the last business day of the registrant’s most recently completed second fiscal quarter, the aggregate market value of the shares of common stock beneficially held by non‑affiliates of the registrant was approximately $1,277.0 million. (For purposes hereof, directors, executive officers and 10% or greater stockholders have been deemed affiliates).
As of March 31, 2016, 37,073,956 shares of common stock, par value $0.01 per share, of the registrant were outstanding.
DOCUMENTS INCORPORATED BY REFERENCE:
Items 10 through 14 of Part III of this Annual Report on Form 10‑K incorporate by reference certain information from the registrant’s definitive proxy statement for the 2016 annual meeting of stockholders, which the registrant intends to file with the Securities and Exchange Commission no later than 120 days after February 2, 2016, the end of the registrant’s 2015 fiscal year. With the exception of the sections of the definitive proxy statement specifically incorporated herein by reference, the definitive proxy statement is not deemed to be filed as part of this Annual Report on Form 10‑K.
CAUTIONARY NOTE REGARDING FORWARD‑LOOKING STATEMENTS
This Annual Report on Form 10‑K contains forward‑looking statements within the meaning of federal securities laws that relate to future events or our future financial performance. In many cases, you can identify forward‑looking statements by terminology such as “may,” “would,” “should,” “expect,” “plan,” “anticipate,” “believe,” “estimate,” “predict,” “intend,” “potential” or “continue” or the negative of these terms or other comparable terminology. These forward‑looking statements are made based on our management’s expectations and beliefs concerning future events affecting us and are subject to uncertainties and factors relating to our operations and business environment, all of which are difficult to predict and many of which are beyond our control. These uncertainties and other factors could cause our actual results to differ materially from those matters expressed or implied by these forward‑looking statements.
Although we believe that the expectations reflected in the forward‑looking statements are reasonable, we cannot guarantee future results, levels of activity, performance or achievements. Important factors that may cause actual results to differ materially from the results expressed or implied by these forward‑looking statements are set forth under “Risk Factors” in Item 1A. of Part I of this Annual Report on Form 10‑K. All forward‑looking statements in this Annual Report on Form 10‑K are based on information available to us as of the date of this report. We undertake no obligation to publicly update or revise any of the forward‑looking statements, whether as a result of new information, future events or otherwise.
Some of the important factors that could cause our actual results, performance or financial condition to differ materially from expectations include:
|
· |
a reduction in discretionary spending by consumers; |
|
· |
our ability to profitably open and operate new stores; |
|
· |
our relationship with certain mattress manufacturers as our primary suppliers; |
|
· |
our dependence on a few key employees; |
|
· |
the failure of our acquired businesses to achieve the results we expect; |
|
· |
the possible impairment of our goodwill or other acquired intangible assets; |
|
· |
the effect of our planned growth and the integration of our acquisitions on our business infrastructure; |
|
· |
the impact of seasonality on our financial results and comparable‑store sales; |
|
· |
fluctuations in our comparable‑store sales from quarter to quarter; |
|
· |
the effectiveness and efficiency of our advertising expenditures; |
|
· |
our success in keeping warranty claims and exchange return rates within acceptable levels; |
|
· |
our ability to deliver our products in a timely manner; |
|
· |
our status as a holding company with no business operations; |
|
· |
our ability to anticipate consumer trends; |
|
· |
heightened competition; |
|
· |
the impact of significant weather events; |
2
|
· |
changes in applicable regulations; |
|
· |
risks related to our franchises, including our lack of control over their operations, their ability to finance and open new stores and our liabilities if they default on note or lease obligations; |
|
· |
risks related to our stock; and |
|
· |
other factors discussed in “Item 1A. Risk Factors” of Part I of this Annual Report on Form 10‑K and elsewhere in this report and in our other filings with the Securities and Exchange Commission (the “SEC”). |
NOTE REGARDING TRADEMARKS AND SERVICE MARKS
We own or have rights to use the trademarks, service marks and trade names that we use in conjunction with the operation of our business. Some of the more important trademarks that we own that appear in this Annual Report on Form 10‑K include “Mattress Firm®,” “Comfort By Color®,” “Mattress Firm Red Carpet Delivery Service®,” “Hampton & Rhodes®,” “Mattress Firm SuperCenter®,” “Happiness Guarantee®,” “Sleep Train®,” “Sleep Country®,” “Sleepy’s®” and “Mattress Discounters.®” Trademarks, trade names or service marks of other companies appearing in this Annual Report on Form 10‑K are, to our knowledge, the property of their respective owners
NOTE REGARDING MARKET AND INDUSTRY DATA
Industry and market data included in this Annual Report on Form 10-K were obtained from our own internal data, data from industry trade publications and groups (primarily Furniture Today and the International Sleep Products Association, or “ISPA”), consumer research and marketing studies and, in some cases, are management estimates based on industry and other knowledge and experience in the markets in which we operate. Our estimates have been based on information obtained from our suppliers, customers, trade and business organizations and other contacts in the markets in which we operate. We believe these estimates and the third party information mentioned above to be accurate as of the date of this Annual Report on Form 10-K.
3
MATTRESS FIRM HOLDING CORP.
4
Unless the context otherwise requires, the terms “Mattress Firm,” “our company,” “the Company,” “we,” “us,” “our” and the like refer to Mattress Firm Holding Corp. and its consolidated subsidiaries. Unless otherwise indicated, (i) the term “our stores” refers to our company‑operated stores and our franchised stores and (ii) when used in relation to our company, the terms “market” and “markets” refer to the metropolitan statistical area or an aggregation of the metropolitan statistical areas in which we or our franchisees operate.
In this report, we refer to earnings before interest, taxes, depreciation and amortization as “EBITDA” and we refer to earnings before interest expense, taxes, depreciation and amortization and other adjustments (such as goodwill impairment charges, loss on store closings and acquisition expenses) as “Adjusted EBITDA.” EBITDA and Adjusted EBITDA are not performance measures under accounting principles generally accepted in the United States, or “U.S. GAAP.” See “Item 6. Selected Financial Data” below for a definition of EBITDA and Adjusted EBITDA and a reconciliation of Adjusted EBITDA to EBITDA and to net income.
We report on the basis of a 52‑ or 53‑week fiscal year, which ends on the Tuesday closest to January 31. Each fiscal year is described by the period of the calendar year that comprises the majority of the fiscal year period. For example, the fiscal year ended February 2, 2016 is described as “fiscal 2015.”Fiscal 2015 contained 52 weeks.
Our Company
Through one or more of our operating subsidiaries, we have been doing business under the Mattress Firm® brand name since 1986, and today we are a leading specialty retailer of mattresses and related products and accessories in the United States. We were formed as a Delaware corporation in 2007 and became a publicly held company on November 18, 2011 once shares of our common stock began trading on the NASDAQ Global Select Market under the trading symbol “MFRM”. As of February 2, 2016, the last day of our fiscal 2015, we and our franchisees operated over 2,400 stores, primarily under the Mattress Firm® and Sleep Train ® brand names, in 105 markets across 41 states. On February 5, 2016, during the first week of our fiscal year ending January 31, 2017 (“fiscal 2016”), we completed the acquisition of all of the outstanding equity interests in HMK Mattress Holdings LLC, the holding company of Sleepy’s, LLC and related entities (collectively, “Sleepy’s”), pursuant to which we acquired over 1,050 additional stores operating primarily under the Sleepy’s ® brand name in 17 states in the Northeast, New England, the Mid-Atlantic and Illinois. We also offer merchandise through several digital channels, including www.mattressfirm.com and www.sleepys.com, and at special events such as state fairs, pop-up events and similar expositions. We are the #1 U.S. mattress specialty retailer by store count, sales, year‑over‑year sales growth and market share according to Furniture Today Top 25, September 2015. We carry an extensive assortment of conventional and specialty mattresses and bedding related products across a wide range of price points. For fiscal 2015, total mattress sales represented 90.9% of our total net sales.
We believe that in our markets, Mattress Firm®, Sleepy’s ® and Sleep Train ® are highly recognized brands known for broad selection, superior service and compelling value proposition. Based on our analysis of public store information, we believe that, within markets where we have operated for more than one year, more than 90% of our company‑operated stores are located in markets in which we had the number one market share position as of February 2, 2016. Since our founding in 1986 in Houston, Texas, we have expanded our operations to emerge as the only border-to-border and coast-to-coast multi‑brand specialty mattress retailer in the United States, with net sales of approximately $2.5 billion in fiscal 2015.
We believe our destination retail format provides our customers with a convenient, distinctive and enjoyable shopping experience. Our stores carry both a broad assortment of leading national mattress brands and our exclusive brands. With a wide range of styles, sizes, price points and unique features, we provide our customers with their choice of specialty and traditional mattresses from a variety of brands, including Tempur‑Pedic (for which we are the largest retailer in the United States according to Tempur‑Pedic’s public SEC filings), Sealy, Serta, Simmons and Stearns & Foster. We focus on higher average unit price (“AUP”) specialty mattresses that use premium support systems, such as latex and memory foam, rather than the steel innerspring coil systems found in traditional mattresses.
5
We focus on driving profitability in each of the markets in which we operate through a strategy of penetrating a market with stores and leveraging fixed and discretionary costs, such as occupancy, advertising and overhead, as we gain sales volume and scale. We have a proven track record of growing our store base through both organic new store openings and acquisitions. For example, since January 30, 2013 through February 5, 2016 – the day that we completed the Sleepy’s acquisition – we have almost tripled our store count by adding over 2,300 net new stores, which includes over 1,700 stores added through strategic acquisitions.
Our Industry
Overall Market
We operate in the large, fragmented and growing U.S. mattress retail market, in which retail sales were approximately $14 billion in 2014. Prior to Mattress Firm’s acquisition of Sleepy’s, the market was highly fragmented, with no single retailer holding more than an 8% market share in 2014. The top eight participants accounted for approximately one third of the total market in 2014. According to Furniture Today, in 2014, mattress specialty retailers had a market share of approximately 47%, which represented the largest share of the market, having more than doubled their percentage share over the past 15 years. According to the information released in October 2015 by ISPA, there is a 6.5% increase expected in the value of mattress shipments in 2016.
We believe that several trends support the positive outlook for long‑term growth of the U.S. mattress retail market:
|
· |
Large industry with strong growth. The wholesale mattress industry is $8.0 billion in size and grew at a CAGR of 5.3% since 1980. We believe that the replacement nature of mattress purchases shields the industry over the longer term from much of the volatility experienced in the housing market. Mattress sales held steady in three of the four recessionary periods since 1980 and only suffered a decline in the “Great Recession” of 2008 and 2009. Moreover, periods of slower growth have historically been followed by faster growth periods due to pent‑up consumer demand that builds from deferred purchases and aging mattresses. After the last four downturns, industry wholesale sales growth increased at rates of 23%, 16%, 24% and 11%, respectively, in the two years following the recessionary period. |
|
· |
Structural shift towards specialty mattress retailers. We believe the specialty sleep retail channel has gained significant market share at the expense of traditional furniture and department stores because specialty stores carry a wider product selection, have a more knowledgeable sales force and more dedicated floor space. Specialty sleep retailers have increased their market share from 19% of total retail sales in 1993 to 47% in 2014; over the same period, furniture retailers and department stores have lost market share, declining from 56% to 34%, and 11% to 5%, respectively. Despite the emergence of the mass channel over the last decade, we believe “big box” retailers have not captured significant share of the mattress market as they lack the knowledgeable sales force to sell the product, do not wish to carry a breadth of bulky SKUs and have shown little desire to enter the home delivery business. Further, the Internet channel has gained limited traction, as it is difficult to compare mattress SKUs across different retailers. We believe the Internet remains primarily a research vehicle (“click‑to‑brick”) given the tactile nature of the product. |
|
· |
Significant pent‑up demand. Given that the primary driver in the industry is replacement sales and unit volume remains 20% to 24% below its peak in 2005, we believe that there is a large amount of pent‑up demand that could provide meaningful upside. Unit growth has been atypical since the last recession as value‑focused consumers continue to struggle and manufacturer advertising is below peak levels. Fifty percent of the units in the retail mattress industry are below $500, providing an opportunity for upside when the economy does materially improve for the value‑conscious consumer. |
|
· |
Consistent increase in average unit price of wholesale shipments. According to ISPA, AUP has increased in 19 of the last 21 years (1994–2014). The industry‑wide average prices at wholesale of mattresses and foundations continue to climb, having grown at a CAGR of 3.9% since 1994, based on data published by ISPA, aided by the increase in higher‑priced specialty mattress products, technological |
6
benefits, manufacturer advertising and a shift towards queen and king‑sized mattresses. Further price growth potential exists, driven by continued innovations such as memory foams, gels and hybrids. |
Overall, AUPs for a wholesale mattress and foundation increased by 3.6% in 2014 when compared with 2013, marking the fourth consecutive annual increase in unit prices since 2010. Industry‑wide AUPs are projected to increase by 2.5% in 2016.
Our Competitive Strengths
Although the retail bedding industry in the United States is highly competitive, we believe the following competitive strengths differentiate us from our competitors and favorably position us to execute our growth strategy:
Leading specialty retailer. We believe our proven and effective operating model combines a broad merchandise selection, superior customer service by educated, extensively‑trained associates, a compelling value proposition and highly visible and convenient store locations. The key attributes of the Mattress Firm® experience include:
|
· |
Extensive and differentiated product assortment. We offer a broad assortment of mattresses and related products and accessories, making us a preferred choice for our customers. The breadth of our merchandise offering includes a wide range of comfort choices, styles, sizes and price points. We focus our offering on the best known national brands, providing our customers the choice of both conventional and specialty mattresses. In addition, we also offer our Hampton & Rhodes® private label mattresses and Simmons exclusive hybrid mattresses to provide our customers with a broad range of value choices. |
|
· |
Contemporary, easy‑to‑navigate store layout. Our stores feature a high‑energy, casually elegant environment which utilizes a circular, race‑track layout to guide the customer through the mattress selection process. Our stores also create a consultative environment, educating the customer on various comfort options before directing them towards the SleepRx® (premium specialty sleep gallery), Value Center (promotional) or Clearance Center (special buys and blemished) sections of our store. We use our proprietary Comfort By Color® merchandising approach that groups all of our mattresses into five distinct comfort categories, each represented by its own color, to help simplify the purchasing decision for customers. As our acquired stores adopted the Comfort By Color® approach, we have observed favorable customer responses. |
|
· |
Compelling customer value proposition. Our compelling price and value proposition is a critical element of our merchandising strategy. With our low price guarantee, we promise to beat the lowest competitor‑advertised price on a comparable product by 10% at any time up to 100 days after purchase and refund the customer the difference. Our Happiness GuaranteeTM policy enables our customers to return their mattress for a refund within 100 days of purchase if they are not fully satisfied with their product. Our consumer financing options, which are provided by third party financial institutions and are non‑recourse to us, are also an important element of our service and value proposition. We believe that these services and guarantees build lasting trust and loyalty with our customers and lead to better ticket average, conversion rates and customer referrals. |
7
|
· |
Extensive Customer Service. Our educated, extensively‑trained sales associates are required to participate in a comprehensive, on‑going training program that we believe exceeds industry practices. We have implemented performance‑monitoring programs to ensure that our sales associates are customer‑focused and are effectively educating our customers on the various features and benefits of our products. As of February 2, 2016, over 97% of our associates were full‑time employees, supporting our goal of hiring highly motivated, career‑oriented individuals. Our sales associates receive a significant portion of their compensation in the form of commissions, which aligns their goals with those of our company. Another key element of our industry‑leading customer service is our Mattress Firm Red Carpet Delivery Service®, through which we offer a three‑hour guaranteed delivery window and same‑day delivery, which we believe is distinctive in the industry. |
|
· |
Attractive, highly visible and convenient store locations. We have a dedicated and disciplined real estate strategy that helps us select store locations that are convenient to our target customers, are generally highly visible from the road and have high impact signage opportunities. A typical Mattress Firm® location is a freestanding or “end‑cap” (corner) location in a high‑traffic shopping center in a major retail trade area. We believe the quality of our real estate locations, combined with the distinctive and fresh feel of our stores, drives very attractive customer traffic and sales levels. |
Attractive new store economic model. Mattress Firm has exceptional new store economics with average cash‑on‑cash store-level returns in year one in excess of 100% and store payback in less than 12 months due to high inventory turns, strong purchasing leverage and low build‑out costs. Given the national footprint of our vendors and the “showroom” nature of our stores, we are able to maintain limited inventory levels both at the store level and at our distribution centers. On average, our stores are fully “ramped” within the first year of opening.
Store 4‑wall profitability is measured using store revenues, store product costs and all direct costs of operating our store. We expect our store 4‑wall profitability to average approximately 22‑25% of net sales inclusive of funds received from vendors upon the opening of a new store.
Proven track record of driving profitability with our Relative Market Share (“RMS”) model. We strive to grow our market‑level profitability by increasing our Relative Market Share (defined as our estimated market share relative to the estimated market share of the top competitor in such market) in a given market primarily through the addition of strategically‑located stores. Given that we are only able to estimate our market share and our competitors market share, we use average market penetration per population as a proxy for RMS. Typically as we increase our RMS in a market, we are able to leverage fixed and discretionary costs such as occupancy and advertising. By doing so, we increase our “share of voice,” as measured by per capita advertising spend. This drives increased traffic, higher customer conversion and comparable store net sales in the market. The RMS model also increases leverage over other market‑level costs such as recruiting, training, warehouse, delivery and overhead. We expect the RMS model to drive overall profitability as we continue to increase our store penetration across key markets, gain sales volume, grow brand presence and increase operational scale.
Scale benefits and strong market share position. We believe our scale and strong market share positions provide us with a number of competitive advantages, including:
|
· |
Strong vendor relationships. Given our significant scale and the scope of our retail network, we believe we are a very important customer for the leading vendors in the industry and for our other suppliers. We believe that the strength of our supplier relationships enables us to source our merchandise and other cost inputs in a more cost‑effective manner than our mattress specialty retailer competitors, as well as receive higher vendor incentives and advertising support. Importantly, we believe that our significant scale gives us priority access to a wide range of styles and sub‑brands, exclusive access to premium products and enables us to develop and source our proprietary brand cost‑effectively. |
|
· |
Robust landlord relationships. We have developed strong relationships with real estate developers and landlords across the country due to our extensive store network and strong operating performance. We believe that our history and size position us favorably compared to our mattress specialty retailer competitors, as real estate companies prefer to lease to large, well‑capitalized and established retailers. |
8
Ability to leverage national advertising and grow a national brand. We have developed a footprint that is capable of allowing us to create a national brand, supported by national advertising. We have developed excellent relationships with advertising personnel across the country and will be in position to leverage this capability once we convert our stores to one national brand. We believe that our multi-brand mattress specialty retailer competitors do not have the resources to advertise at the national level.
Experienced and invested management team. Our experienced senior management team has extensive experience in the retail and mattress industries. Steve Stagner, our Executive Chairman and Chairman of our board of directors, has over 20 years of experience in the mattress industry and originally was a top‑performing Mattress Firm® franchisee before Mattress Firm purchased his company in December 2004. Our President and Chief Executive Officer, Ken Murphy, joined Mattress Firm 16 years ago from Sealy Corporation and brings experience managing multiple different areas of sales and operations of ours in his career. Our Chief Financial Officer, Alex Weiss, is an experienced finance professional who joined Mattress Firm in April 2013.
We believe our management’s breadth of experience in the industry has enabled us to anticipate and respond effectively to industry trends and competitive dynamics while driving superior customer service and cultivating long‑standing relationships with our vendors.
Our Growth Strategies
We seek to enhance our position as the #1 specialty retailer of mattresses and related products and accessories and drive profitable sales growth. To achieve these objectives, we plan on executing the following key strategies:
Expand our company‑operated store base. The highly fragmented U.S. retail mattress market provides us with a significant opportunity to expand our store base through targeted growth. From January 30, 2013 to February 2, 2016, we added 1,302 new company‑operated stores, including 310 store openings in fiscal 2015 and 9 stores through acquisitions in fiscal 2015. Additionally, as noted above, we added over 1,050 stores to our company-operated store base during the first week of our fiscal 2016 when we completed our acquisition of Sleepy’s. We plan to continue to expand our store base through a targeted combination of new stores and acquisition opportunities in both existing and new markets. As of the end of our fiscal 2015, we achieved an average market penetration rate across the United States of one Mattress Firm® store per approximately 89,000 in population. In our most established and profitable markets, we have a higher penetration rate of one Mattress Firm® store per 50,000 in population. We believe we could operate at least 4,500 store locations in both new and existing markets over time. We believe that attractive opportunities in the real estate market and strategic acquisitions will help us execute our expansion strategy.
|
· |
Organic growth in new and existing markets. We continually research and survey the geographic landscape and have highlighted several markets with characteristics that we believe are attractive opportunities for market entry or further penetration and growth. We seek to strengthen our relative market share with the goal of achieving the number one position in each of our markets. From January 30, 2013 through February 2, 2016, we averaged over 190 net store openings per year. Given our highly attractive new store economic model and our improving market level profitability as we continue to open stores, we believe we are well positioned to expand our presence and achieve economies of scale across regions. |
|
· |
Acquisition opportunities. Making strategic acquisitions has been a core component of our growth strategy of increasing penetration in existing markets and entering new markets with high growth potential. In fiscal 2014, we acquired the Sleep Train brand portfolio, a leading specialty retailer on the West Coast with 314 retail stores acquired. The Sleep Train acquisition allowed us to achieve immediate scale in West Coast markets and provided us with a clear runway for growth in the highly populated and attractive West Coast region where we previously had a minimal presence. During fiscal 2015, we also committed to purchase the Sleepy’s brand portfolio, and we completed our acquisition of Sleepy’s in the first week of our fiscal 2016. The Sleepy’s acquisition allows our company to achieve immediate scale and presence in New England and in the Northeast where we previously had little to no presence. We have a strong track record over the last decade of supplementing our organic growth through acquisitions by acquiring retail mattress chains on an opportunistic basis and have completed more than 15 acquisitions since 2009. Given our established infrastructure and track record, we believe that we can efficiently acquire retailers, integrate them, implement our operating model and generate synergies. |
9
Increase sales and profitability within our existing network of stores. We have achieved positive comparable‑store net sales growth in 21 of the last 24 fiscal quarters. Our strategy is to continue to drive comparable‑store net sales growth within our existing portfolio of stores by:
|
· |
Increasing customer traffic. Consistent with our expectations, as we have increased our presence in a market and deployed additional marketing, we have seen an increase in customer traffic and sales and have been able to leverage fixed and discretionary costs. We will continue to undertake advertising and marketing initiatives that are aimed at efficiently and effectively improving our customer traffic. |
|
· |
Improving customer conversion. We will continue to focus on the training of our sales associates, who are our primary points of contact with our customers. In addition, we continually strive to improve our merchandising approach so that the customer shopping experience is optimized. |
|
· |
Increasing the average sales price of a transaction. Through effective sales techniques and the increasing demand for premium and luxury mattresses, we expect the average price of a customer transaction to increase over time. We have strategically focused and built a strong market position in the premium and luxury mattress categories. As such, we believe that we are well positioned to capture increasing sales and profitability as premium and luxury mattresses continue to gain share. |
Distribution
The overwhelming majority of our merchandise comes to us directly from manufacturers such as Tempur Sealy and Serta Simmons and, in the case of our private label products, Corsicana Bedding and Sherwood Bedding. Manufacturers ship merchandise, based on our inventory needs, to our network of over 75 distribution centers. The majority of our merchandise sold is then delivered from our distribution centers to consumers directly through our network of independent delivery contractors, and in limited markets, by our associates. Customers may pick-up purchased merchandise directly from our stores, distribution centers or at special events, which reduces delivery costs. For certain items purchased via our e-commerce channels or at special events, manufacturers may arrange for product delivery.
Employees
As of February 2, 2016, the end of fiscal 2015, we had approximately 7,186 employees, substantially all of whom were employed by us on a full‑time basis. Immediately after we completed the Sleepy’s acquisition, on February 5, 2016, we employed approximately 10,552 employees. We have not experienced any work stoppages and we consider our relations with our employees to be good.
Government Regulation
We believe that we are in compliance in all material respects with the laws to which we are subject. In particular, our business subjects us to regulation in the following areas:
Regulations relating to consumer protection and the bedding industry. Our operations are subject to federal, state and local consumer protection regulations and other regulations relating specifically to the bedding industry. These regulations vary among the states where we operate, but generally impose requirements as to (i) the proper labeling of bedding merchandise, (ii) restrictions regarding the identification of merchandise as “new” or otherwise, (iii) controls as to hygiene and other aspects of product handling and disposal, and (iv) marketing language and promotions used in connection with the offer and sale of products and, in all cases, penalties for violations. We also are subject to a standard established by the U.S. Consumer Product Safety Commission, which sets mandatory national fire performance criteria for all mattresses sold in the United States on or after July 1, 2007, and to new legislation in California, Connecticut and Rhode Island which require the recycling of mattresses discarded in their states.
Franchise laws and regulations. We are subject to Federal Trade Commission (the “FTC”) regulations and various state laws regulating the offer and sale of franchises. The FTC and various state laws require us to furnish to prospective franchisees a franchise disclosure document containing prescribed information. Unless an exemption applies, certain states require registration of a franchise offering circular or a filing with state authorities. Substantive
10
state laws that regulate the franchisor‑franchisee relationship presently exist in a substantial number of states, and bills have been introduced in the U.S. Congress from time to time which provide for federal regulation of the franchisor‑franchisee relationship in certain respects. The state laws often limit, among other things, the duration and scope of non‑competition provisions and the ability of a franchisor to terminate or refuse to renew a franchise. The failure to comply with these laws and regulations in any jurisdiction or to obtain required government approvals could result in a ban or temporary suspension on future franchise sales, fines, other penalties, or require us to make offers of rescission or restitution, any of which could adversely affect our business and operating results.
Segment Financial Information
We operate through two reportable segments—retail operations and franchise operations. Company-operated stores, our e-commerce website operations and multi-channel sales operations consisting primarily of special events comprise our retail operations segment. For our franchise operations segment, franchise fees and royalty income received from our franchisees fully represent results of operations. See Note 1 to our Consolidated Financial Statements for further information about our segments. Segment financial information can be found under “Results of Operations” within Item 7. “Management’s Discussion and Analysis of Financial Condition and Results of Operations.”
Seasonality
Our business is subject to seasonal fluctuations and we generally have experienced more sales and a greater portion of income during the second and third quarters of our fiscal year due to a concentration of summer season holidays, including Memorial Day, the Fourth of July and Labor Day, and other seasonal factors. While we expect this trend to continue for the foreseeable future, especially in light of our acquisition of the Sleepy’s business which historically has experienced more sales and greater portion of income during the second and third fiscal quarters, we also expect that the timing of new store openings and other acquisitions we have made or may make and the timing of those acquisitions may have some effect on the impact of these seasonal fluctuations.
Available Information
The Company maintains an internet website at http://ir.mattressfirm.com where our Annual Reports on Form 10‑K, Quarterly Reports on Form 10‑Q, Current Reports on Form 8‑K, proxy statement and other documents and all amendments to those reports and documents are available without charge, as soon as reasonably practicable following the time they are filed with, or furnished to, the SEC. References to the Company’s website address do not constitute incorporation by reference of the information contained on the website, and the information contained on the website is not part of this document.
The public may read and copy any materials that the Company files with the SEC at the SEC’s Public Reference Room at 100 F Street, NE, Washington, DC 20549. The public may obtain information on the operation of the Public Reference Room by calling the SEC at 1‑800‑SEC‑0330. Also, the SEC maintains an internet website that contains reports, proxy and information statements, and other information regarding issuers, including the Company, that file electronically with the SEC. The public can obtain any documents that the Company files with the SEC at http://www.sec.gov.
11
Our financial performance is subject to various risks and uncertainties. The risks described below are those which we believe are the material risks we face. Any of the risk factors described below could significantly and adversely affect our business, prospects, sales, gross profit, cash flows, financial condition and results of operations.
Risks Related to Our Business
Our business is dependent on general economic conditions in our markets.
Our sales depend, in part, on discretionary spending by our customers. Pressure on discretionary income brought on by economic downturns and slow recoveries, including housing market declines, financial market volatility, changing energy prices, fiscal uncertainty, political uncertainty and weak labor markets, may cause consumers to reduce the amount they spend on discretionary items. If recovery from any economic downturn is slow or prolonged, our growth, prospects, results of operations, cash flows and financial condition could be adversely impacted. General economic conditions and discretionary spending are beyond our control and are affected by, among other things:
|
· |
consumer confidence in the economy; |
|
· |
unemployment trends; |
|
· |
consumer debt levels; |
|
· |
consumer credit availability; |
|
· |
the housing market; |
|
· |
gasoline and fuel prices; |
|
· |
interest rates and inflation; |
|
· |
price deflation, which may result from the introduction of low‑cost imports; |
|
· |
slower rates of growth in real disposable personal income; |
|
· |
natural disasters; |
|
· |
national security concerns; |
|
· |
the presidential election; |
|
· |
tax rates and tax policy; and |
|
· |
other matters that influence consumer confidence and spending. |
Increasing volatility in financial markets may cause some of the above factors to change with an even greater degree of frequency and magnitude.
Our ability to grow and remain profitable may be limited by direct or indirect competition in the U.S. retail bedding industry, which is highly competitive.
The retail bedding industry in the United States is highly competitive. Participants in the bedding industry compete primarily based on store location, service, price, product selection, brand name recognition and advertising. There can be no assurance that we will be able to continue to compete favorably with our competitors in these areas. Our
12
store competitors include regional and local specialty retailers of bedding (such as Mattress1One and American Mattress), national and regional chains of retail furniture stores carrying bedding (such as Ashley Furniture, Haverty’s and Rooms‑To‑Go), department store chains with bedding departments (such as Macy’s, Sears and JC Penney), big box retailers (such as Wal‑Mart), warehouse clubs (such as Costco), factory direct stores (such as Original Mattress), non-traditional mattress retailers (such as P.C. Richards and Sons) and e-commerce retailers (such as amazon.com marketplace). While a small percentage of the total, we also have experienced increased competition from online specialty mattress retailers (such as Casper, Tuft and Needle and us-mattress.com). Additionally, retail furniture stores or bedding manufacturers may open retail locations specifically targeted for specialty bedding as a way to directly compete with us and other specialty retailers. In the past, we have faced periods of heightened competition that materially affected our results of operations. Certain of our competitors have substantially greater financial and other resources than us. Accordingly, we may face periods of intense competition in the future that could have a material adverse effect on our planned growth and future results of operations. In addition, the barriers to entry into the retail bedding industry are relatively low. New or existing bedding retailers could enter our markets and increase the competition we face. Competition in existing and new markets may also prevent or delay our ability to gain relative market share. Any of the developments described above could have a material adverse effect on our planned growth and future results of operations.
If we fail to successfully manage the challenges posed by our planned growth or encounter unexpected difficulties during our expansion, our net sales and profitability could be materially adversely affected.
One of our central long term objectives is to increase sales and profitability through market share leadership. Our ability to achieve market share leadership, however, is contingent upon our ability to (i) open and/or acquire stores in favorable locations, (ii) advertise our stores in an effective and cost‑efficient manner and (iii) achieve operating results in new stores at the same level as our similarly situated current stores. There can be no assurance, however, that we will be able to open and/or acquire stores in new markets as required to achieve market leadership in such markets, identify and obtain favorable store sites, identify and acquire acquisition targets, arrange favorable leases for stores or obtain governmental and other third‑party consents, permits and licenses needed to open or operate stores in a timely manner, train and hire a sufficient number of qualified managers for new stores, retain key personnel from acquired stores, attract a strong customer base and create brand familiarity in new markets, or successfully compete with established mattress stores in the new markets we enter. Moreover, if we are unable to open and/or acquire an adequate number of stores in a market, or if store‑level profitability is lower than expectations, we may be unable to achieve the market presence necessary to justify the considerable expense of radio or television advertising and could be forced to rely upon less effective advertising mediums. Failure to open and/or acquire stores in favorable locations or to advertise in an effective and cost‑efficient manner could place us at a competitive disadvantage as compared to retailers who were more adept than us at managing these challenges, which, in turn, could negatively affect our overall operating results.
Our comparable‑store sales and results of operations fluctuate due to a variety of economic, operating, industry and environmental factors and may not be fair indicators of our performance.
Our comparable‑store sales and operating results have experienced fluctuations, which can be expected to continue. Numerous factors affect our comparable‑store sales results, including among others, the timing of new and relocated store openings, the relative proportion of new and relocated stores to mature stores, cannibalization resulting from the opening of new stores in existing markets, the acquisition and rebranding of competitors’ stores in existing Mattress Firm markets (including the timing of such acquisitions), changes in advertising and other operating costs, the timing and level of markdowns, changes in our product mix, weather conditions, retail trends, the retail sales environment, economic conditions, inflation, the impact of competition, changes in consumer preferences and our ability to execute our business strategy efficiently. As a result, comparable‑store sales and operating results may fluctuate, and may cause the price of our common stock to fluctuate significantly. Therefore, we believe period‑to‑period comparisons of our results may not be a fair indicator of, and should not be relied upon as a measure of, our operating performance.
13
We intend to aggressively open additional stores in certain of our existing markets, which may diminish sales in our existing stores in those markets, strain our ability to find qualified personnel or divert resources from our existing stores, negatively affecting our overall operating results.
Pursuant to our expansion strategy, we intend to aggressively open additional stores in our existing markets until penetrated to an optimal level, whether through organic growth or acquisitions, including relocations of existing stores. Because our stores typically draw customers from their local areas, additional stores may draw customers away from nearby existing stores and may cause our comparable‑store sales performance and customer counts at those existing stores to decline, which may adversely affect our overall operating results. In addition, our ability to open additional stores or convert and maintain acquired stores will be dependent on our ability to promote, recruit and/or retain enough qualified field managers, store managers, assistant store managers and sales associates. The time and effort required to train and supervise a large number of new managers and associates and integrate them into our culture may divert resources from our existing stores. If we are unable to profitably open additional stores or convert and maintain acquired stores in existing markets and limit the adverse impact of those new or acquired stores on existing stores, it may reduce our comparable‑store sales and overall operating results during the implementation of our expansion strategy.
Our expansion strategy will be dependent upon, and limited by, the availability of adequate capital.
Our expansion strategy will require additional capital for, among other purposes, opening new stores and entering into new markets. Such capital expenditures will include (i) researching real estate and consumer markets, (ii) lease, inventory, property and equipment costs, (iii) integration of new stores and markets into company‑wide systems and programs, and (iv) other costs associated with new stores and market entry expenses and growth. If cash generated internally is insufficient to fund capital requirements, or if funds are not available under our existing credit facility, we will require additional debt or equity financing. Adequate financing may not be available or, if available, may only be available on unfavorable terms. In addition, our debt agreements provide a limit on the amount and nature of capital expenditures we may make. If we fail to obtain sufficient additional capital in the future or we are unable to make capital expenditures under our debt agreements, we could be forced to curtail our expansion strategies by reducing or delaying capital expenditures relating to new stores and new market entry. As a result, there can be no assurance that we will be able to fund our current plans for the opening of new stores or entry into new markets. Additionally, we expect to use cash generated internally to fund the purchase price of acquisitions that align with our expansion strategy. As a result, the available cash resources will be limited for other capital expenditures such as inventory, property and equipment costs. You may disagree with the purchase price we agree to pay or the use of cash for acquisitions. If we fail to obtain sufficient capital to offset the use of cash for acquisitions, or if we are unable to realize a value from an acquisition sufficient to justify the purchase price we paid, other capital expenditures could be delayed and our overall operating results could be adversely affected.
We may from time to time acquire complementary businesses, including operations of our franchisees, which will subject us to a number of risks.
Any acquisitions we may undertake involve a number of risks, including:
|
· |
failure of the acquired businesses to achieve the results we expect; |
|
· |
potential comparable‑store sales declines as a result of sales culture integration challenges and conversion of acquired stores to a single brand; |
|
· |
diversion of capital and management attention from operational matters; |
|
· |
our inability to retain key personnel of the acquired businesses; |
|
· |
risks associated with unanticipated events or liabilities; |
|
· |
the potential disruption and strain on our existing business and resources that could result from our planned growth and continuing integration of our acquisitions; and |
14
|
· |
customer dissatisfaction or performance problems at the acquired businesses. |
For example, during fiscal 2015, we began the process of integrating and managing the more than 650 stores, including the more than 300 operated by Sleep Train that we acquired in over 10 states in fiscal 2014. We also, during fiscal 2015 acquired the retail operations and assets for 9 stores formerly operated by one of our franchisees in Texas and Louisiana and committed to purchase 1,050 stores operating primarily under the Sleepy’s brand in the Northeast, New England, Mid-Atlantic and Illinois by agreeing to acquire all of the equity interests in HMK Mattress Holdings, LLC, the holding company of Sleepy’s, LLC and related entities (collectively, “Sleepy’s”). We completed our acquisition of Sleepy’s in the first week of our fiscal 2016. If we are unable to fully integrate or successfully manage these acquired businesses or any other business that we acquire, we may not realize anticipated cost savings, improved efficiencies or revenue growth, which may result in reduced profitability or operating losses. In addition, we may face competition for acquisition candidates, which may limit the number of acquisition opportunities and may lead to higher acquisition prices. Moreover, acquisitions of businesses may require the incurrence of additional debt financing or the issuance of additional equity financing, which respectively, could affect our credit rating and ability to obtain financing on favorable terms, or would result in the dilution of our existing stockholder base. The realization of all or any of the risks described above could materially and adversely affect our reputation and our results of operations.
A deterioration in our relationships with, or a deterioration of the brand images of, our primary suppliers could adversely affect our brand and customer satisfaction and result in reduced sales and operating results.
We currently rely on Tempur Sealy and Serta Simmons as our primary suppliers of branded mattresses. Purchases of products from these manufacturers accounted for 79% of our mattress product costs for fiscal 2015. Because of the large volume of our business with these manufacturers and our use of their branding in our marketing initiatives, our success depends on the continued popularity and reputation of these manufacturers. Additionally, our continued focus on increasing market share may result in a reduction of retailers who hold stronger relationships with certain of these vendors than us, which could affect our relationship with these vendors. Any (i) deterioration of their brand image, (ii) reduction in vendor incentives, (iii) adverse change in our relationship with any of them, (iv) adverse change in their financial condition, production efficiency, product development or marketing capabilities, or (v) change in their management could adversely affect our own brand, our product assortment and the level of our customers’ satisfaction, among other things, which could result in reduced sales and operating results.
During fiscal 2015 we used Corsicana Bedding and Sherwood Bedding as the primary suppliers of our private label mattresses, which accounted for 8% and 3%, respectively, of our mattress product costs. If any of our relationships with Tempur Sealy and Simmons Serta or any of our private-label manufacturers like Sherwood or Corsicana is terminated or otherwise impaired, or if any of them materially increase their prices, it could have a material adverse effect on our business and financial condition.
We depend on a limited number of primary suppliers, and any failure by any of them to supply us with products either meeting our needs or at all may impair our inventory and adversely affect our ability to meet customer demands, which could result in a decrease in net sales.
Through our operating subsidiaries, we maintain supply agreements with two subsidiaries of Tempur Sealy and with Simmons, Serta, Sherwood Bedding and Corsicana, among others. Our current suppliers may not continue to sell products to us on acceptable terms or at all, and we may not be able to establish relationships with new suppliers to ensure delivery of products in a timely manner or on terms acceptable to us, as well as ensuring that such merchandise complies with applicable product safety laws and regulations. We may not be able to acquire desired merchandise in sufficient quantities on terms acceptable to us in the future. We are also dependent on suppliers for assuring the quality of merchandise supplied to us. Our inability to acquire suitable merchandise in the future or the loss of one or more of our suppliers and our failure to replace them may harm our relationship with our customers and our ability to attract new customers, resulting in a decrease in net sales.
Certain of our suppliers have recently undergone business combinations, which may reduce product offerings and increase pressures on pricing.
We rely on a limited number of primary suppliers. The consolidation of two or more of these suppliers may reduce the number of products offered as the combined entity re‑evaluates redundant product lines. Additionally,
15
business combinations may increase the prices that we pay for the products in order to offset costs or otherwise take advantage of the suppliers’ more significant position in the industry. We may not be able to pass any price increases on to our customers or identify and obtain additional products to supplement our product offerings, which may have an adverse effect on our results of operations.
If customers are unable to obtain third‑party financing at acceptable rates, sales of our products could be materially adversely affected.
We offer financing to consumers through third party consumer finance companies. In fiscal 2015, approximately 41% of our sales were financed through third party consumer finance companies. We plan to continue to offer such financing services, and in April 2016, we plan to offer such financing services through a new primary lending partner. Our business is affected by the availability and terms of financing to customers. During much of the fourth quarter of fiscal 2008 and continuing into fiscal 2009, we experienced significantly lower credit approval rates for our customers. Sales results were negatively affected as a result. Another reduction of credit availability to our customers could have a material impact on our results of operations. Likewise, our inability to successfully manage the transition of our financing program to our new primary lending partner could delay or reduce approval rates and negatively affect sales.
We may not be able to successfully anticipate consumer trends and our failure to do so may lead to loss of consumer acceptance of the products we sell, resulting in reduced net sales.
Our success depends on our ability to anticipate and respond to changing trends and consumer demands in a timely manner. If we fail to identify and respond to emerging trends, consumer acceptance of the merchandise we sell and our image with current or potential customers may be harmed, which could reduce our net sales. For example, we responded to the trend in favor of specialty bedding products and innovative sleep systems, such as viscoelastic foam mattresses, by entering into new arrangements with suppliers and reallocating store display space without certainty of success or that existing relationships with conventional mattress suppliers will not be jeopardized. We have also started offering a bed-in-a-box product, the Dream Bed, which is a viscoelastic foam mattress that ships in compressed form directly to consumers. If we misjudge market trends, we may significantly overstock unpopular products and be forced to take significant inventory markdowns, which would have a negative impact on our gross profit and cash flow. Conversely, shortages of models that prove popular could also reduce our net sales.
We depend on a few key employees, and if we lose the services of certain of our principal executive officers, we may not be able to run our business effectively.
Our future success depends in part on our ability to attract and retain key executive, merchandising, marketing and sales personnel. Our executive officers include Steve Stagner, our Executive Chairman and Chairman of our board of directors, Ken Murphy, our President and Chief Executive Officer, and Alex Weiss, our Chief Financial Officer. We have an employment agreement with each of Messrs. Stagner, Murphy and Weiss. If any of these executive officers cease to be employed by us, we would have to hire additional qualified personnel. Our ability to successfully attract and hire other experienced and qualified executive officers cannot be assured and may be difficult because we face competition for these professionals from our competitors, our suppliers and other companies operating in our industry. As a result, the loss or unavailability of any of our executive officers could have a material adverse effect on us.
Our substantial debt could adversely affect us, make us more vulnerable to adverse economic or industry conditions and prevent us from fulfilling our debt obligations or from funding our expansion strategy.
We have a substantial amount of debt outstanding. On February 5, 2016, our subsidiary, Mattress Holding Corp., entered into an amendment to its existing $125 million asset-backed loan credit agreement, dated October 20, 2014, among Mattress Holding Corp., as borrower, Mattress Holdco, Inc., the lenders party thereto, and Barclays Bank PLC, as administrative agent, collateral agent and issuer (as amended, the “ABL Credit Agreement”), which increased the revolving credit commitments thereunder by $75 million to $200 million. Additionally, on February 5, 2016, Mattress Holding Corp. entered into an amendment to its existing $720 million term loan credit agreement, dated October 20, 2014, among Mattress Holding Corp., as borrower, Mattress Holdco, Inc., the lenders party thereto, and Barclays Bank PLC, as administrative agent and collateral agent (as amended, the “Term Loan Credit Agreement”) to,
16
among other things, add a $665 million incremental term loan facility thereunder. The Term Loan Credit Agreement and the ABL Credit Agreement are collectively referred to in this Annual Report on Form 10-K as the “Senior Credit Facility”. As of February 2, 2016, we had $690.9 million of total indebtedness, consisting primarily of $685.1 million outstanding under the Senior Credit Facility. Upon completion of the Sleepy’s acquisition, on February 5, 2016, we had $1,468.2 million of total indebtedness, of which $1,413.7 million represented borrowings under our Senior Credit Facility. The February 5, 2016 debt balance includes the effect of Accounting Standard Update (“ASU”) No. 2015-03, Interest- Imputation of Interest- Simplifying the Presentation of Debt Issuance Costs, which requires debt issuance costs related to a recognized debt liability to be presented in the balance sheet as a direct deduction from the carrying amount of that debt liability. We adopted this ASU the first day of our fiscal 2016 year. Our substantial indebtedness could have serious consequences, such as:
|
· |
limiting our ability to obtain additional financing to fund our working capital, capital expenditures, debt service requirements, expansion strategy or other purposes; |
|
· |
placing us at a competitive disadvantage compared to competitors with less debt; |
|
· |
increasing our vulnerability to, and reducing our flexibility in planning for, adverse changes in economic, industry and competitive conditions; |
|
· |
increasing our vulnerability to increases in interest rates because borrowings under the Senior Credit Facility are subject to variable interest rates; and; |
|
· |
encouraging our vendors to demand more aggressive payment terms or collateralization in the form of letters of credit, cash deposits or other security in exchange for extending credit to us in the ordinary course of business. |
The potential consequences of our substantial indebtedness make us more vulnerable to defaults and place us at a competitive disadvantage. A substantial or extended increase in interest rates could significantly affect our cash available to make scheduled payments on the Senior Credit Facility or to fund our expansion strategy.
We may be unable to generate sufficient cash to service all of our indebtedness and other liquidity requirements and may be forced to take other actions to satisfy such requirements, which may not be successful.
We will be required to repay borrowings under the ABL Credit Agreement on February 5, 2021 and term borrowings under the Term Loan Credit Agreement on October 20, 2021. Our ability to make payments on and to refinance our indebtedness and to fund planned capital expenditures will depend on our ability to generate cash in the future. This, to a certain extent, is subject to general economic, financial, competitive, legislative, regulatory and other factors that are beyond our control.
Our debt agreements contain restrictions that limit our flexibility in operating our business.
The Senior Credit Facility contains negative covenants that limit our ability to engage in specified types of transactions. These covenants limit our ability and the ability of our restricted subsidiaries to, among other things:
|
· |
incur indebtedness; |
|
· |
create liens; |
|
· |
engage in mergers or consolidations; |
|
· |
sell assets (including pursuant to sale and leaseback transactions); |
|
· |
pay dividends and distributions or repurchase our capital stock; |
|
· |
make investments, acquisitions, loans or advances; |
|
· |
repay, prepay or redeem certain indebtedness; |
17
|
· |
engage in certain transactions with affiliates; |
|
· |
amend material agreements governing certain indebtedness; and |
|
· |
change our lines of business. |
The Term Loan Credit Agreement further has an affirmative financial covenant. Commencing with the fiscal quarter ending on July 31, 2016, Mattress Holding Corp., the borrower, must not exceed a total net leverage ratio subject to specified stepdowns.
A breach of any of these covenants could result in an event of default under the Senior Credit Facility. Upon the occurrence of an event of default under the Senior Credit Facility, the lenders could elect to declare all amounts outstanding under such facility to be immediately due and payable and terminate all commitments to extend further credit, or seek amendments to our debt agreements that would provide for terms more favorable to such lenders and that we may have to accept under the circumstances. If we were unable to repay those amounts, the lenders under the Senior Credit Facility could proceed against the collateral granted to them to secure that indebtedness. We have pledged a significant portion of our assets as collateral under the Senior Credit Facility. If the lenders under the Senior Credit Facility accelerate the repayment of borrowings, we cannot guarantee that we will have sufficient assets to repay the Senior Credit Facility.
If we fail to hire, train and retain qualified managers, sales associates and other employees our superior customer service could be compromised and we could lose sales to our competitors.
A key element of our competitive strategy is to provide product expertise to our customers through our extensively trained, commissioned sales associates. If we are unable to attract and retain qualified personnel and managers as needed in the future, including qualified sales personnel, our level of customer service may decline, which may decrease our net sales and profitability.
Our future growth and profitability will be dependent in part on the effectiveness and efficiency of our advertising expenditures.
Our advertising expenditures, which are the largest component of our sales and marketing expenses, are expected to continue to increase for the foreseeable future. A significant portion of our advertising expenditures are made in the higher cost radio and television formats. We cannot assure you that our planned increases in advertising expenditures or the advertising message that we select will result in increased customer traffic, sales, levels of brand name awareness or market share or that we will be able to manage such advertising expenditures on a cost‑effective basis. Should we fail to realize the anticipated benefits of our advertising program, or should we fail to effectively manage advertising costs, this could have a material adverse effect on our growth prospects and profitability.
Our operating results are seasonal and subject to adverse weather and other circumstances, the occurrence of which during periods of expected higher sales may result in disproportionately reduced sales for the entire year.
We historically have experienced and expect to continue to experience seasonality in our net sales and net income. We generally have experienced more sales and a greater portion of income during the second and third quarters of our fiscal year due to a concentration of holidays such as Memorial Day, the Fourth of July and Labor Day occurring in the summer and a higher number of home sales occurring in autumn. Over the past five fiscal years, (i) the second fiscal quarter generated 25.0% of our net sales, (ii) the third fiscal quarter generated 26.8% of our net sales and (iii) the other fiscal quarters generated 48.2% of our net sales. We expect this seasonality trend to skew slightly further towards more sales during the second and third quarters as the slightly more seasonal Sleepy’s business enters the combined company. Any decrease in our second or third quarter sales, whether because of adverse economic conditions, adverse weather conditions, timing of holidays or acquisitions within our quarters or other unfavorable circumstances or prolonged atypical adverse weather conditions in our primary markets during any quarter, could have a disproportionately adverse effect on net sales and operating results for the entire fiscal year.
18
If we are unable to renew or replace our current store leases or if we are unable to enter into leases for additional stores on favorable terms, or if one or more of our current leases are terminated prior to expiration of their stated term and we cannot find suitable alternate locations, our growth and profitability could be negatively impacted.
We currently lease nearly all of our store locations. Many of our current leases provide for our unilateral option to renew for several additional rental periods at specific rental rates. Our ability to re‑negotiate favorable terms on an expiring lease or to negotiate favorable terms for a suitable alternate location, and our ability to negotiate favorable lease terms for additional store locations could depend on conditions in the real estate market, competition for desirable properties, our relationships with current and prospective landlords or on other factors that are not within our control. Any or all of these factors and conditions could negatively impact our growth and profitability.
Because we have a significant concentration of stores in several geographic regions of the United States, we are subject to regional risks.
We have a high concentration of stores in certain geographic regions such as the Gulf Coast, Northeast, Mid-Atlantic, Great Lakes and the Southeast. We therefore have exposure to these local economies as well as weather conditions and natural disasters occurring in these regions, including hurricanes, severe flooding, snowstorms, severe freezing conditions and other natural disasters. If these markets individually or collectively suffer an economic downturn or other significant adverse event, there could be an adverse impact on our comparable‑store sales, net sales and profitability and our ability to implement our planned expansion program. Any natural disaster or other serious disruption in these markets due to hurricanes, severe flooding, snowstorms, severe freezing conditions or any other calamity could damage inventory and could result in decreased sales.
Our results may be adversely affected by fluctuations in raw material and energy costs.
Our results may be affected by the prices of the components and raw materials used in the manufacture of the mattress products and accessories we sell. These prices may fluctuate based on a number of factors beyond our control, including: oil prices and other energy related costs, changes in supply and demand, general economic conditions, labor costs, competition, import duties, tariffs, currency exchange rates and government regulation. These fluctuations may result in an increase in our transportation costs for distribution, utility costs for our retail stores and overall costs to purchase products from our vendors.
We may not be able to adjust the prices of our products or other fees charged to our customers, especially in the short‑term, to recover these cost increases in raw materials and energy. A continual rise in raw material and energy costs could adversely affect consumer spending and demand for our products and increase our operating costs, both of which could have a material adverse effect on our financial condition and results of operations.
We are subject to government regulation and audits from various taxing authorities, which could impose substantial costs on our operations or reduce our operational flexibility.
Our products and our marketing and advertising programs are and will continue to be subject to regulation in the U.S. by various federal, state and local regulatory authorities, including the FTC. Compliance with these regulations may have an adverse effect on our business. In addition, our operations are subject to federal, state and local consumer protection regulations and other laws relating specifically to the bedding industry. For example, U.S. Consumer Product Safety Commission has adopted rules relating to fire retardancy standards for the mattress and pillow industry. Additionally, California, Rhode Island and Connecticut have all enacted laws requiring the recycling of mattresses discarded in their states. State and local bedding industry regulations vary among the states in which we operate but generally impose requirements as to the proper labeling of bedding merchandise, restrictions regarding the identification of merchandise as “new” or otherwise, controls as to hygiene and other aspects of product handling, disposal, sales and resales and penalties for violations. We and/or our suppliers may be required to incur significant expense to the extent that these regulations change and require new and different compliance measures. For example, new legislation aimed at improving the fire retardancy of mattresses, regulating the handling of mattresses in connection with preventing or controlling the spread of bed bugs could be passed, or requires the recycling of the discarded mattresses that we pick up in connection with product deliveries, which could result in product recalls or in, as applicable, a significant increase in
19
the cost of operating our business. In addition, failure to comply with these various regulations may result in penalties, the inability to conduct business as previously conducted or at all, and/or adverse publicity, among other things.
We are also subject to FTC and state laws regarding the offering of franchises and their operations and management. State franchise laws may delay or prevent us from terminating a franchise or withholding consent to renew or transfer a franchise. We may, therefore, be required to retain an underperforming franchise and may be unable to replace the franchise, which could have an adverse effect on franchise revenues. Although we believe that we are in compliance with these bedding industry and franchise regulations, we may be required in the future to incur expense and/or modify our operations in order to ensure such compliance.
We are also subject to audits from various taxing authorities. Changes in tax laws in any of the multiple jurisdictions in which we operate, or adverse outcomes from tax audits that we may be subject to in any of the jurisdictions in which we operate, could result in an unfavorable change in our effective tax rate, which could have an adverse effect on our business and results of our operations.
We are subject to varying, inconsistent laws and regulations of state and local jurisdictions, which could result in penalties and other costs if we are unable to establish and maintain compliance efficiently.
We are subject to tax and employee‑related laws and regulations imposed by multiple state and local jurisdictions. Often these laws and regulations vary by jurisdiction and may not conform to our existing tax, payroll and other practices. If we are unable to efficiently identify, monitor and comply with these varying laws and regulations, penalties, fines and other costs may be imposed on the Company and our relationship with certain of our employees could be threatened, each of which could have an adverse effect on our business and results of operations.
Our success is highly dependent on our ability to provide timely delivery to our customers, and any disruption in our delivery capabilities or our related planning and control processes may adversely affect our operating results.
An important part of our success is due to our ability to deliver mattresses and bedding‑related products quickly to our customers. This in turn is due to our successful planning and distribution infrastructure, including merchandise ordering, transportation and receipt processing, the ability of our suppliers to meet our distribution requirements and the ability of our contractors to meet our delivery requirements. Our ability to maintain this success depends on the continued identification and implementation of improvements to our planning processes, distribution infrastructure and supply chain. We also need to ensure that our distribution infrastructure and supply chain keep pace with our anticipated growth and increased number of stores. The cost of these enhanced processes could be significant and any failure to maintain, grow or improve them could adversely affect our operating results. Our business could also be adversely affected if there are delays in product shipments to us due to freight difficulties, difficulties of our suppliers or contractors involving strikes or other difficulties at their principal transport providers or otherwise.
Our ability to control labor costs is limited, which may negatively affect our business.
Our ability to control labor costs is subject to numerous external factors, including (i) prevailing wage rates and overtime pay regulations, (ii) the impact of proposed legislation limiting the flexibility of employee schedules, (iii) the impact of legislation or regulations governing healthcare benefits, such as the Patient Protection and Affordable Care Act, (iv) labor relations, such as the Employee Free Choice Act, (v) health and other insurance costs and (vi) regulations concerning the proper classification of employees and independent contractors. If our labor and/or benefit costs increase, we may not be able to hire or maintain qualified personnel to the extent necessary to execute our competitive strategy, which could adversely affect our results of operations.
There can be no assurance that our warranty claims and comfort exchange return rates will remain within acceptable levels.
Under the terms of our supply agreements with some of our major suppliers of conventional mattress products, we are currently compensated to assume the risk for returns resulting from product defects. Generally, we also provide our customers with a 100‑day comfort satisfaction guarantee at Mattress Firm branded stores whereby, within 100 days from the date of original purchase, if the customer is not satisfied with the new mattress, we will exchange it for a mattress of equal or similar quality with an exchange fee, subject to standard transportation charges. Additionally, we provide our customers with a low price guarantee whereby if a customer finds the same or comparable sleep set
20
advertised for less than our displayed or advertised price within 100 days of purchase, we will beat our competitor’s advertised price on such comparable sleep set by 10% and refund the customer the difference. While we establish reserves at the time of sale for these exposures, there can be no assurance that our reserves adequately reflect this exposure and no assurance that warranty claims and comfort exchange return rates will remain within acceptable levels. An increase in warranty claims and comfort exchange return rates could have a material adverse effect on our business, financial condition and results of operations.
If we fail to successfully integrate Sleepy’s into our internal controls over financial reporting or if Sleepy’s’ internal controls are found to be ineffective, the integrity of our financial reporting could be compromised.
As a privately-held company prior to being acquired by the Company, neither HMK Mattress Holdings LLC, the holding company of Sleepy’s, LLC and related entities, nor any of its consolidated subsidiaries was subject to the Securities Exchange Act of 1934, as amended, (the “Exchange Act”), with respect to internal control over financial reporting, and, for a period of time after the consummation of the Sleepy’s acquisition, the management evaluation and auditor attestation regarding the effectiveness of our internal controls over financial reporting may exclude the operations of HMK Mattress Holdings LLC and its consolidated subsidiaries. We expect that the integration of Sleepy’s into our internal controls over financial reporting will require significant time and resources from our management and other personnel and will increase our compliance costs. If we fail to successfully integrate the operations of Sleepy’s into our internal controls over financial reporting, our internal controls over financial reporting might not be effective. Failure to achieve and maintain an effective internal controls environment could have a material adverse effect on our ability to accurately report our financial results, the market’s perception of our business and our stock price. In addition, if Sleepy’s internal controls are found to be ineffective, the integrity of our and Sleepy’s financial statements for prior periods could be adversely impacted.
If we determine that our goodwill or other acquired intangible assets are impaired, we may have to write off all or a portion of the impaired assets.
As of February 2, 2016, we had goodwill and intangible assets, net of accumulated amortization, of $826.7 million and $214.9 million, respectively. Management is required to exercise significant judgment in identifying and assessing whether impairment indicators exist, or if events or changes in circumstances have occurred, including market conditions, operating results, competition and general economic conditions. Current accounting guidance requires that we test our goodwill and indefinite‑lived intangible assets for impairment on an annual basis, or more frequently if warranted by the circumstances. Any changes in key assumptions about the business units and their prospects or changes in market conditions or other external factors could result in an impairment charge, and such a charge could have a material adverse effect on our business, results of operations and financial condition. In addition, as we test goodwill impairment at the reporting unit level, which is at a regional level, we may be required to incur goodwill impairment charges based on adverse changes affecting a particular region, regardless of our overall performance. Such impairment charges may have a material adverse effect on our results of operations.
21
Historically, we have experienced losses on store closings and impairment of store assets. There can be no guarantee that we will not experience similar or greater losses of this kind in the future due to (i) general economic conditions, (ii) competitive or operating factors, or (iii) other reasons, which may have a material adverse effect on our results of operations.
We experienced losses on store closings and impairment of store assets of $1.5 million, $1.8 million and $7.5 million in fiscal 2013, fiscal 2014 and fiscal 2015, respectively. These amounts include a non‑cash impairment charge for long‑lived assets to reduce the carrying value to estimated fair value based on our periodic assessment of whether projected future cash flows of individual stores are sufficient to recover the carrying value of the related assets. This non‑cash impairment charge for long‑lived assets consists primarily of store leasehold costs and related equipment and was $0.5 million, $0.9 million and $5.5 million during fiscal 2013, fiscal 2014 and fiscal 2015, respectively. On March 21, 2016, we announced that we anticipate closing stores in fiscal 2016 as part of our efforts to optimize our store base. We expect that, for some of these stores, we will incur payments to landlords to terminate or “buy out” leases that will not terminate concurrently with their natural expiration. Even though we have allocated funds to aid us in this initiative, the financial impact of our efforts will vary depending on the terms of the applicable leases, the condition of local property markets, demand for the specific properties, our relationships with landlords and the availability of potential sub-lease tenants. If we close additional or more stores in the future due to general economic conditions, competitive or operating factors or other reasons, the related losses may have a material adverse effect on our results of operations. In addition, if we are unsuccessful in our expansion strategy and are required to close more stores than we anticipate, or if we face unexpected costs associated with the stores that we plan to close, the risk of incurring losses on store closings may increase.
We are a holding company with no business operations of our own and depend on cash flow from our subsidiaries to meet our obligations.
We are a holding company with no business operations of our own or material assets other than the stock of our subsidiaries. Accordingly, all of our operations are conducted by our subsidiaries. As a holding company, we require dividends and other payments from our subsidiaries to meet cash requirements. The terms of the Senior Credit Facility restrict our subsidiaries from paying dividends and otherwise transferring cash or other assets to us. We currently have no obligations that require cash funding from our subsidiaries. If there is an insolvency, liquidation or other reorganization of any of our subsidiaries, our stockholders likely will have no right to proceed against the assets of those subsidiaries. Creditors of those subsidiaries will be entitled to payment in full from the sale or other disposal of the assets of those subsidiaries before we, as an equity holder, would be entitled to receive any distribution from that sale or disposal. If our subsidiaries are unable to pay us dividends or make other payments to us when needed, we will be unable to pay dividends or satisfy our obligations.
Product safety and quality control issues, including product recalls, could harm our reputation, divert resources, reduce sales and increase costs.
The products we sell in our stores are subject to regulation by the U. S. Consumer Product Safety Commission and similar state and international regulatory authorities. Such products could be subject to recalls and other actions by these authorities. Product safety concerns may require us to voluntarily remove selected products from our stores. Such recalls and voluntary removal of products can result in, among other things, lost sales, diverted resources, potential harm to our reputation and increased customer service costs, which could have a material adverse effect on our financial condition.
Our business exposes us to personal injury, property damage and product liability claims, which could result in adverse publicity and harm to our brands and our results of operations.
We are from time to time subject to claims due to the alleged injury of an individual in our stores or on our property. In addition, we may be subject to product liability claims for the products that we sell. We are also subject, from time to time, to property damage claims arising in connection with our product deliveries. Subject to certain exceptions, our purchase orders generally require the manufacturer to indemnify us against any product liability claims; however, if a manufacturer does not have insurance or becomes insolvent, there is a risk we would not be indemnified. Similarly, our independent delivery contractor agreements require our independent delivery contractors to indemnify us, subject to certain exceptions, for any property damage or personal injury that may occur as a result of their actions. Our
22
ability to be made whole under these arrangements is conditioned on our delivery contractors’ financial condition as well as their maintaining appropriate insurance coverage. Any personal injury, property damage or product liability claim made against us, whether or not it has merit, could be time consuming and costly to defend, resulting in adverse publicity, or damage to our reputation, and have an adverse effect on our results of operations. In addition, any negative publicity involving our vendors, employees, delivery contractors and other parties who are not within our control could negatively impact us.
Our business operations could be disrupted if our information technology systems fail to perform adequately or we are unable to protect the integrity and security of our customers’ information.
We depend largely upon our information technology systems in the conduct of all aspects of our operations. If our information technology systems fail to perform as anticipated, we could experience difficulties in virtually any area of our operations, including but not limited to replenishing inventories or delivering our products to store locations in response to consumer demands. If we experience difficulties in implementing new or upgraded information systems or experience significant system failures, or if we are unable to successfully modify our information systems to respond to changes in our business needs, our ability to run our business could be adversely affected. It is also possible that our competitors could develop better e‑commerce platforms than ours, which could negatively impact our internet sales. Any of these or other systems‑related problems could, in turn, adversely affect our sales and profitability.
In addition, in the ordinary course of our business, we collect and store certain personal information from individuals, such as our customers and suppliers, and we process customer payment card and check information via our internet platform. Computer hackers may attempt to penetrate our computer system and, if successful, misappropriate personal information, payment card or check information or confidential Company business information. In addition, a Company employee, contractor or other third party with whom we do business may attempt to circumvent our security measures in order to obtain such information and may purposefully or inadvertently cause a breach involving such information. Any failure to maintain the security of our customers’ confidential information, or data belonging to us or our suppliers, could put us at a competitive disadvantage, result in deterioration in our customers’ confidence in us, subject us to potential litigation and liability, and subject us to fines and penalties, result in our breach of certain material agreements, resulting in a possible material adverse impact on our business, results of operations, cash flows and financial performance.
We may be responsible for theft and other liabilities at leased properties that we have vacated prior to the expiration of the lease term.
From time to time, we may vacate a leased facility prior to the expiration of the lease term. Unless otherwise agreed by the landlord, we will continue to be responsible as the tenant under any such lease, which may include liability for any theft or other damage to the leased property. Our current insurance policy does not cover our liability for theft or certain other damages at vacated properties, and we have not identified additional insurance policies at commercially reasonable rates that would cover this exposure.
Our strategy to expand our e-commerce business may be unsuccessful.
We offer mattresses, related bedding products and furniture for sale through our websites. As a result, we encounter risks and difficulties frequently experienced by internet-based businesses, including risks related to our ability to attract and retain customers on a cost-effective basis and our ability to operate, support, expand and develop our internet operations, website and software and other related operational systems. Although we believe that our participation in both e-commerce and physical store sales is a distinct advantage for us due to synergies and the potential for new customers, supporting product offerings through both of these channels could create issues that have the potential to adversely affect our results of operations. For example, if our e-commerce business successfully grows, it may do so in part by attracting existing customers, rather than new customers, who choose to purchase products from us online rather than from our physical stores, thereby reducing the financial performance of our stores. In addition, persons may use our website simply to research products that they intend to purchase from brick and mortar competitors and thereby reduce or eliminate the impact of funds spent on our e-commerce efforts. As we continue to grow our e-commerce business, the impact of attracting existing rather than new customers, of conflicts between product offerings
23
online and through our stores, and of opening up our channels to increased internet competition could have a material adverse impact on our business, results of operations, cash flows and financial performance.
Risks Related to Our Franchises
A portion of our income is generated from our franchisees and our income could decrease if our franchisees do not conduct their operations profitably.
As of February 2, 2016, approximately 5% of our stores were operated by franchisees. During fiscal 2013, fiscal 2014 and fiscal 2015 we derived $5.6 million, $4.6 million and $5.2 million, respectively, from franchise fees and royalties. Franchisees are independent contractors and are not our employees. We provide training and support to franchisees, but the quality of franchised store operations may be diminished by any number of factors beyond our control, including (i) the closing of franchised stores, (ii) the failure of franchisees to comply with our standard operating procedures, (iii) failure to honor our national advertising campaign offers, (iv) effectively run their operations, (v) the failure of franchisees to hire and adequately train qualified managers and other personnel, or (vi) the failure of franchisees to appropriately manage our brand could adversely affect our image and reputation, and the image and reputation of other franchisees, and could reduce the amount of our revenues and our franchise revenues, which could result in lower franchise fees and royalties to us. Additionally, from time to time, we are involved in legal proceedings instituted by third parties relating to actions or inactions of our franchisees, which divert resources away from other operations and may result in adverse publicity. These factors could have a material adverse effect on our financial condition and results of operations. In addition, litigation with franchisees that may arise from time to time could be costly and the outcome thereof would be difficult to predict.
We may be unable to audit or otherwise independently monitor the results of our franchisees, which could adversely affect our results of operations.
Franchisees pay us franchise fees and royalties as a percentage of their gross sales. Although the agreements with our franchisees give us the right to audit their books and records, we may not be able to audit or otherwise readily and independently monitor franchisee performance on a regular basis or at all. As a result, we may experience delays or failures in discovering and/or recouping underpayments. In addition, to the extent that we rely on the integrity of the financial and other information from our franchisees, we may experience difficulties with respect to internal control, measurement and reporting of our franchise fee and royalty receipts and receivables.
The existence of franchisees in some of our markets may restrict our ability to grow in those markets through acquisitions or organically.
We enter into franchise agreements with our franchisees which, among other things, limit our ability to compete with the franchisees in the markets in which they operate. If we determine at some point in the future that we would like to grow in those markets through acquisitions or organically, our ability to do so may be substantially restricted under the franchise agreements.
Risks Related To Our Common Stock
Our stock price could be extremely volatile and, as a result, you could lose all or a part of your investment.
Since our initial public offering in November 2011 through February 2, 2016, the price of our common stock, as reported by the NASDAQ Global Select Market, has ranged from a low of $21.03 on November 21, 2011 to a high of $71.82 on November 18, 2014. In addition, the stock market in general, and the market for stocks of some specialty retailers in particular, has been highly volatile in recent years. As a result, the market price of our common stock is likely to be similarly volatile, and investors in our common stock may experience a decrease, which could be substantial, in the value of their stock, including decreases unrelated to our operating performance or prospects, and could lose part or all of their investment. The price of our common stock could be subject to wide fluctuations in response to a number of factors, including those described elsewhere in this Item 1.A, and others such as:
|
· |
variations in our operating performance and the performance of our competitors; |
24
|
· |
actual or anticipated fluctuations in our quarterly or annual operating results; |
|
· |
changes in our net sales, comparable-store sales or earnings estimates or recommendations by securities analysts; |
|
· |
publication of research reports by securities analysts about us or our competitors or our industry; |
|
· |
our failure or the failure of our competitors or vendors to meet analysts' projections or guidance that we or our competitors or vendors may give to the market; |
|
· |
additions and departures of key personnel; |
|
· |
strategic decisions by us or our competitors or vendors, such as acquisitions, divestitures, spin-offs, joint ventures, strategic investments or changes in business strategy; |
|
· |
the passage of legislation or other regulatory developments affecting us or our industry; |
|
· |
equity issuances by us, or share resales by our stockholders, or the perception that such issuances or resales may occur; |
|
· |
price and volume fluctuations in the overall stock market from time to time; |
|
· |
speculation in the press or investment community; |
|
· |
terrorist acts, acts of war or periods of widespread civil unrest; |
|
· |
publicly voiced opinions of our stockholders; and |
|
· |
changes in general market and economic conditions. |
Because we have no current plans to pay cash dividends on our common stock for the foreseeable future, you may not receive any return on investment unless you sell your common stock for a price greater than that which you paid for it.
We may retain future earnings, if any, for future operations, expansion and debt repayment and have no current plans to pay any cash dividends for the foreseeable future. Our Senior Credit Facility also restricts our ability to pay dividends on our common stock. Any decision to declare and pay dividends in the future will be made at the discretion of our board of directors and will depend on, among other things, our results of operations, financial condition, cash requirements, contractual restrictions and other factors that our board of directors may deem relevant. In addition, our ability to pay dividends may be limited by covenants of any existing and future outstanding indebtedness we or our subsidiaries incur. As a result, you may not receive any return on an investment in our common stock unless you sell our common stock for a price greater than that which you paid for it.
You may experience future dilution as a result of future securities issuances.
On February 5, 2016, we issued an aggregate of 1,762,236 shares of our common stock in connection with our completion of the Sleepy’s acquisition. A portion of the shares were issued to raise cash to pay part of the acquisition’s cash purchase price and a portion of the shares were issued, as partial payment of the purchase price, in exchange for equity interests in HMK Holdings, LLC, the holding company of Sleepy’s, LLC and related entities. To the extent we issue securities in the future, including shares of our common stock or other securities convertible into or exchangeable for shares of our common stock, to raise capital, as consideration in future acquisitions or otherwise, our stockholders
25
may experience substantial dilution. In addition, you may experience additional dilution upon (i) the exercise of any outstanding and future grants of options and warrants to purchase our common stock and (ii) future grants of restricted stock or other equity awards under our stock incentive plans, including our 2011 Omnibus Incentive Plan. Furthermore, investors purchasing shares or other securities in the future could have rights, preferences or privileges senior to those of existing stockholders and you may experience dilution. Because our decision to issue additional equity or debt securities in any future offering will depend on market conditions and other factors beyond our control, we cannot predict or estimate the amount, timing or nature of our future issuances, if any.
J.W. Childs Associates, Inc. and its affiliates, whose interests may be different from yours, may be able to exert substantial influence over us.
According to publicly available information, investment funds associated with J.W. Childs Associates, Inc. (collectively, “J.W. Childs”) indirectly own approximately 36% of our outstanding common stock. Although J.W. Childs does not directly or indirectly own shares of common stock representing more than 50% of the voting power of our common stock, J.W. Childs could exercise significant influence over our business and affairs, including any determinations with respect to director nominees, mergers or other business combinations, the acquisition or disposition of assets, the incurrence of indebtedness, the issuance of any additional common stock or other equity securities, the repurchase or redemption of common stock and the payment of dividends. Similarly, certain investment funds associated with J.W. Childs may be able to determine matters requiring stockholder approval. The interests of J.W. Childs, which has investments in other companies, may from time to time differ from, or be opposed to, the interests of our other stockholders.
J.W. Childs is not subject to any contractual obligations to retain its ownership interest in the Company. There can be no assurance as to the period of time during which J.W. Childs will maintain its ownership of our common stock.
Recent volatility in our stock price, as well as the securities offering that we completed on February 5, 2016, may result in private litigation against us and/or certain of our directors and officers, that could result in significant financial losses, as well as reputational damage, to us.
Recently a securities litigation firm announced that it had commenced an investigation into the Company and certain of our officers and directors concerning possible violations of federal securities laws. The Company is also aware of at least one other organization that is attempting to contact our stockholders for the purpose of discussing potential claims against the Company and/or management. To the Company’s knowledge, the above matters appear to be related to our financial performance and the decline in our stock price over fiscal year 2015. Additionally, one of our large stockholders recently publicly criticized a private securities offering that we completed on February 5, 2016, whereby we sold an aggregate of 699,300 shares of our common stock, at a purchase price of $35.75 per share (the price at which our common stock sold at the close of trading on February 2, 2016), to Mr. Stagner, our chief executive officer at the time, and certain investment fund affiliates of J.W. Childs. If we become the subject of any litigation, especially private class actions, alleging that we or any of our directors or officers violated applicable securities laws, we may be forced to spend significant time and resources to defend such litigation and ultimately experience financial and reputational losses, regardless of whether we are successful on the merits of any such litigation. If we or any of our officers or directors are found liable for violating any securities laws, we may experience significant financial losses in the form of damages and penalties (and may be further subject to government investigations and actions), that may not be covered by insurance, and we may be forced to make unanticipated organizational changes that could affect our ability to operate optimally. These potential effects, alone or combined, if realized, could have an adverse effect on our stock price and as a result, you could lose some, if not all of your investment.
Item 1B. Unresolved Staff Comments
None.
26
Our corporate headquarters are located in Houston, Texas and adjoins one of our Mattress Firm SuperCenter® stores. We lease nearly all of our company‑operated stores, which are located in 44 states, including Texas, California, Florida, Illinois, New York, and North Carolina. Initial lease terms are generally for five to ten years, and most leases contain multiple five‑year renewal options and rent escalation provisions. We have historically been able to renew or extend leases for our company‑operated stores. Our franchisees also lease their own space.
We also lease nearly all of the distribution centers that serve our company‑operated stores, generally subject to five year leases, most of which contain renewal options ranging from one to five years. As we expand our operations, we may need to find additional distribution center locations or replace existing distribution centers with larger locations to accommodate the increased level of operations. Additionally, from time to time, we may assume lease obligations for distribution centers in connection with our acquisitions, including in markets where we already operate a distribution center. In such an event, we expect to operate many of those acquired distribution centers for a limited time until our distribution operations can be consolidated. We believe that we would not have any difficulty replacing these facilities if we were required to do so. Our largest distribution centers are located in Texas, Florida and California.
From time to time, we are involved in litigation relating to claims arising out of our operations in the normal course of business. We believe, however, that we are not a party to any legal proceedings which, if determined adversely to us, individually or in the aggregate, would have a material adverse effect on our financial position, results of operations or cash flows.
Item 4. Mine Safety Disclosures
Not applicable.
Item 5. Market for Registrant’s Common Equity, Related Stockholder Matters and Issuer Purchases of Equity Securities
Market Information About Our Common Stock
Our common stock is traded on the NASDAQ Global Select Market under the symbol “MFRM.” The following table sets forth, for the period indicated, the high and low sales prices of our common stock as reported by the NASDAQ Global Select Market:
|
|
|
|
|
|
|
|
|
|
Fiscal Quarter |
|
High |
|
Low |
|
||
|
2014 |
|
|
|
|
|
|
|
|
First quarter (from January 29, 2014 through April 29, 2014) |
|
$ |
49.81 |
|
$ |
37.01 |
|
|
Second quarter (from April 30, 2014 through July 29, 2014) |
|
$ |
50.34 |
|
$ |
41.97 |
|
|
Third quarter (from July 30, 2014 through October 28, 2014) |
|
$ |
64.97 |
|
$ |
43.31 |
|
|
Fourth quarter (from October 29, 2014 through February 3, 2015) |
|
$ |
71.82 |
|
$ |
55.12 |
|
|
2015 |
|
|
|
|
|
|
|
|
First quarter (from February 4, 2015 through May 5, 2015) |
|
$ |
70.42 |
|
$ |
55.65 |
|
|
Second quarter (from May 6, 2015 through August 4, 2015) |
|
$ |
63.43 |
|
$ |
55.26 |
|
|
Third quarter (from August 5, 2015 through November 3, 2015) |
|
$ |
65.51 |
|
$ |
38.66 |
|
|
Fourth quarter (from November 4, 2015 through February 2, 2016) |
|
$ |
57.23 |
|
$ |
35.01 |
|
27
Stockholders
On March 31, 2016, the closing price reported on the NASDAQ Global Select Market of our common stock was $42.39 per share. As of March 31, 2016, we had approximately 70 holders of record of our common stock. This does not include persons whose stock is in nominee or “street name” accounts through brokers.
Dividends
No dividends were declared or paid in fiscal years 2014 or 2015. We anticipate that we will retain future earnings, if any, to finance the continued development and expansion of our business. We do not anticipate paying cash dividends in the foreseeable future. Additionally, because we are a holding company, our ability to pay dividends is limited by the ability of our subsidiaries to pay dividends or make distributions to us. We are also limited in our ability to pay dividends due to restrictions under the terms of the Senior Credit Facility and other agreements governing our indebtedness outstanding from time to time. Any future determination with respect to the payment of dividends will be at the discretion of our board of directors and will be dependent upon, among other things, our financial condition, results of operations, capital requirements, the terms of our then existing indebtedness, general economic conditions and other factors considered relevant by our board of directors.
28
Securities Authorized for Issuance Under Equity Compensation Plans
The following table sets forth information as of February 2, 2016 regarding the Company’s equity compensation plans. The only plan pursuant to which the Company may grant equity‑based awards is the Mattress Firm Holding Corp. 2011 Omnibus Incentive Plan (the “Omnibus Plan”), which was approved by the board of directors and the Company’s stockholders on November 3, 2011.
|
|
|
|
|
|
|
|
|
|
|
|
|
Number of securities |
|
|
|
|
Number of securities |
|
|
|
|
to be issued upon |
|
Weighted‑average |
|
remaining available |
|
|
|
|
|
exercise of |
|
exercise price of |
|
for future issuance |
|
|
|
|
|
outstanding options, |
|
outstanding options, |
|
under equity |
|
|
|
Plan Category |
|
warrants and rights |
|
warrants and rights |
|
compensation plans |
|
|
|
Equity compensation plans approved by stockholders |
|
1,245,724 |
|
$ |
26.78 |
|
2,200,333 |
|
|
Equity compensation plans not approved by stockholders |
|
— |
|
|
— |
|
— |
|
|
Total |
|
1,245,724 |
|
$ |
26.78 |
|
2,200,333 |
|
29
Performance Graph
The graph set forth below compares the cumulative total shareholder return on our common stock between November 18, 2011 (our first trading day on the NASDAQ Global Select Market) and February 2, 2016 to (i) the cumulative total return of companies listed on the NASDAQ Composite and (ii) the cumulative total return of a peer group selected by the Company. This graph assumes an initial investment of $100 on November 18, 2011, in our common stock, the market index and the peer group and assumes the reinvestment of dividends, if any. The graph also assumes that the price of our common stock on November 18, 2011 was equal to the closing price of $22.00. The historical information set forth below is not necessarily indicative of future price performance.
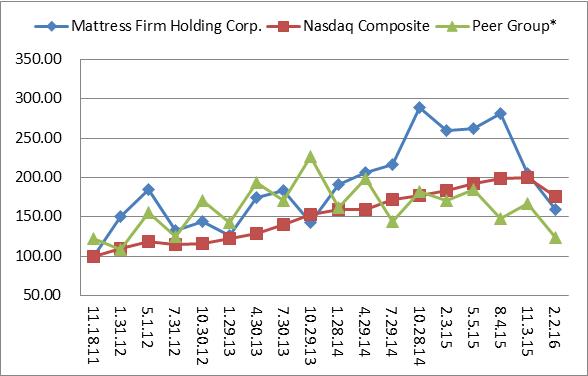
|
|
|
|
* |
Peer Group Companies |
|
|
Select Comfort Corporation |
|
|
Tempur Sealy International, Inc. |
|
|
Bed, Bath & Beyond, Inc. |
|
|
Dick’s Sporting Goods, Inc. |
|
|
Lumber Liquidators Holdings, Inc. PetSmart, Inc. |
|
|
Ulta Salon, Cosmetics & Fragrance, Inc. |
|
|
Vitamin Shoppe, Inc. |
|
|
Williams‑Sonoma, Inc. |
Item 6. Selected Financial Data
The following table sets forth a summary of our selected consolidated financial data. We derived the selected balance sheet data as of February 3, 2015 and February 2, 2016 and the statement of operations data and per share data for the fiscal years ended January 28, 2014, February 3, 2015 and February 2, 2016, from our audited consolidated financial statements included elsewhere in this Annual Report on Form 10‑K.
The selected balance sheet data as of January 31, 2012, January 29, 2013 and January 28, 2014, and the statement of operations data and per share data for the fiscal years ended January 31, 2012 and January 29, 2013, have been derived from our consolidated financial statements for such years, which are not included in this Annual Report on Form 10‑K.
30
Our fiscal year consists of 52 or 53 weeks, ending on the Tuesday nearest to January 31. Each fiscal year is described by the period of the year that comprises the majority of the fiscal year period. For example, the fiscal year ended February 2, 2016 is described as “fiscal 2015.” Each of the fiscal years ended January 31, 2012 (“Fiscal 2011”), January 29, 2013 (“Fiscal 2012”), January 28, 2014 (“Fiscal 2013”) and February 2, 2016 (“Fiscal 2015”) consisted of 52 weeks. The fiscal year ended February 3, 2015 (“Fiscal 2014”) consisted of 53 weeks.
The selected consolidated financial data set forth below is not necessarily indicative of results of future operations and should be read in conjunction with the discussion under “Item 7. Management’s Discussion and Analysis of Financial Condition and Results of Operations” and other financial information included elsewhere in this Annual Report on Form 10‑K.
|
|
|
Fiscal Year |
|
|||||||||||||
|
|
|
2011 |
|
2012 |
|
2013 |
|
2014 |
|
2015 |
|
|||||
|
|
|
(dollar amounts in thousands, except per share data and store units) |
|
|||||||||||||
|
Statement of Operations: |
|
|
|
|
|
|
|
|
|
|
|
|
|
|
|
|
|
Net sales |
|
$ |
703,910 |
|
$ |
1,007,337 |
|
$ |
1,216,812 |
|
$ |
1,806,029 |
|
$ |
2,541,672 |
|
|
Cost of sales |
|
|
428,018 |
|
|
614,572 |
|
|
751,487 |
|
|
1,116,666 |
|
|
1,590,636 |
|
|
Gross profit from retail operations |
|
|
275,892 |
|
|
392,765 |
|
|
465,325 |
|
|
689,363 |
|
|
951,036 |
|
|
Franchise fees and royalty income |
|
|
4,697 |
|
|
5,396 |
|
|
5,617 |
|
|
4,584 |
|
|
5,232 |
|
|
Total gross profit |
|
|
280,589 |
|
|
398,161 |
|
|
470,942 |
|
|
693,947 |
|
|
956,268 |
|
|
Sales and marketing expenses |
|
|
167,605 |
|
|
245,555 |
|
|
289,533 |
|
|
427,401 |
|
|
621,597 |
|
|
General and administrative expenses |
|
|
51,684 |
|
|
73,640 |
|
|
82,964 |
|
|
167,035 |
|
|
183,405 |
|
|
Intangible asset impairment charge |
|
|
— |
|
|
2,100 |
|
|
— |
|
|
— |
|
|
— |
|
|
Loss on store closings and impairment of store assets(1) |
|
|
759 |
|
|
1,050 |
|
|
1,499 |
|
|
1,813 |
|
|
7,524 |
|
|
Total operating expenses |
|
|
220,048 |
|
|
322,345 |
|
|
373,996 |
|
|
596,249 |
|
|
812,526 |
|
|
Income from operations |
|
|
60,541 |
|
|
75,816 |
|
|
96,946 |
|
|
97,698 |
|
|
143,742 |
|
|
Interest expense, net(2) |
|
|
29,301 |
|
|
9,247 |
|
|
10,864 |
|
|
21,924 |
|
|
40,147 |
|
|
Loss from debt extinguishment(3) |
|
|
5,704 |
|
|
— |
|
|
— |
|
|
2,288 |
|
|
— |
|
|
Total other expenses |
|
|
35,005 |
|
|
9,247 |
|
|
10,864 |
|
|
24,212 |
|
|
40,147 |
|
|
Income before income taxes |
|
|
25,536 |
|
|
66,569 |
|
|
86,082 |
|
|
73,486 |
|
|
103,595 |
|
|
Income tax expense (benefit) |
|
|
(8,815) |
|
|
26,698 |
|
|
33,158 |
|
|
29,235 |
|
|
39,073 |
|
|
Net income |
|
$ |
34,351 |
|
$ |
39,871 |
|
$ |
52,924 |
|
$ |
44,251 |
|
$ |
64,522 |
|
|
Per Share Data: |
|
|
|
|
|
|
|
|
|
|
|
|
|
|
|
|
|
Basic net income per common share(4) |
|
$ |
1.40 |
|
$ |
1.18 |
|
$ |
1.56 |
|
$ |
1.29 |
|
$ |
1.83 |
|
|
Diluted net income per common share(4) |
|
$ |
1.40 |
|
$ |
1.18 |
|
$ |
1.55 |
|
$ |
1.27 |
|
$ |
1.82 |
|
|
As adjusted diluted net income per common share(5) |
|
$ |
0.94 |
|
$ |
1.49 |
|
$ |
1.66 |
|
$ |
2.03 |
|
$ |
2.36 |
|
|
Basic weighted average shares outstanding(4) |
|
|
24,586,274 |
|
|
33,770,779 |
|
|
33,870,461 |
|
|
34,389,282 |
|
|
35,212,124 |
|
|
Diluted weighted average shares outstanding(4) |
|
|
24,586,274 |
|
|
33,853,276 |
|
|
34,131,456 |
|
|
34,811,076 |
|
|
35,540,357 |
|
31
|
|
|
|
|
|
|
|
|
|
|
|
|
|
|
|
|
|
|
|
|
Fiscal Year |
|
|||||||||||||
|
|
|
2011 |
|
2012 |
|
2013 |
|
2014 |
|
2015 |
|
|||||
|
|
|
(dollar amounts in thousands, except per share data and store units) |
|
|||||||||||||
|
Other Financial Data: |
|
|
|
|
|
|
|
|
|
|
|
|
|
|
|
|
|
EBITDA(6) |
|
$ |
74,005 |
|
$ |
100,829 |
|
$ |
128,933 |
|
$ |
140,936 |
|
$ |
210,972 |
|
|
Adjusted EBITDA(7) |
|
$ |
87,487 |
|
$ |
120,968 |
|
$ |
139,979 |
|
$ |
190,177 |
|
$ |
254,629 |
|
|
Adjusted EBITDA, percentage of net sales(7) |
|
|
12.4 |
% |
|
12.0 |
% |
|
11.5 |
% |
|
10.5 |
% |
|
10.0 |
% |
|
Income from operations, percentage of net sales |
|
|
8.6 |
% |
|
7.5 |
% |
|
8.0 |
% |
|
5.4 |
% |
|
5.7 |
% |
|
As adjusted income from operations(5) |
|
$ |
61,185 |
|
$ |
92,147 |
|
$ |
103,074 |
|
$ |
138,454 |
|
$ |
174,247 |
|
|
As adjusted income from operations, percentage of net sales(5) |
|
|
8.7 |
% |
|
9.1 |
% |
|
8.5 |
% |
|
7.7 |
% |
|
6.9 |
% |
|
Capital expenditures |
|
$ |
34,356 |
|
$ |
68,604 |
|
$ |
55,546 |
|
$ |
79,897 |
|
$ |
130,529 |
|
|
Depreciation and amortization |
|
$ |
17,450 |
|
$ |
23,507 |
|
$ |
29,498 |
|
$ |
41,740 |
|
$ |
62,247 |
|
|
Operational Data: |
|
|
|
|
|
|
|
|
|
|
|
|
|
|
|
|
|
Comparable-stores sales growth(8) |
|
|
20.5 |
% |
|
6.1 |
% |
|
1.3 |
% |
|
6.1 |
% |
|
2.1 |
% |
|
Stores open at period-end |
|
|
729 |
|
|
1,057 |
|
|
1,225 |
|
|
2,094 |
|
|
2,359 |
|
|
Average net sales per store unit(9) |
|
$ |
1,107 |
|
$ |
1,136 |
|
$ |
1,061 |
|
$ |
1,111 |
|
$ |
1,123 |
|
|
Balance Sheet Data: |
|
|
|
|
|
|
|
|
|
|
|
|
|
|
|
|
|
Working capital |
|
$ |
36,684 |
|
$ |
(24,805) |
|
$ |
14,006 |
|
$ |
(6,002) |
|
$ |
5,820 |
|
|
Total assets |
|
$ |
600,907 |
|
$ |
720,969 |
|
$ |
779,902 |
|
$ |
1,600,142 |
|
$ |
1,665,908 |
|
|
Total debt |
|
$ |
228,354 |
|
$ |
252,999 |
|
$ |
221,208 |
|
$ |
770,038 |
|
$ |
690,921 |
|
|
Stockholders’ equity |
|
$ |
224,259 |
|
$ |
267,496 |
|
$ |
328,492 |
|
$ |
435,483 |
|
$ |
511,482 |
|
|
(1) |
Includes a non‑cash impairment charge for long‑lived assets, consisting primarily of store leasehold costs and related equipment, to reduce the carrying value to estimated fair value, based on our periodic assessment of whether projected future cash flows of individual stores are sufficient to recover the carrying value of the related assets, in the amounts of $0.1 million, $0.2 million, $0.5 million, $0.9 million and $5.5 million during fiscal 2011, fiscal 2012, fiscal 2013, fiscal 2014 and fiscal 2015, respectively. |
|
(2) |
Interest expense includes interest that was accrued and paid in kind by adding the interest to the outstanding balance of debt related to our 2009 Loan Facility (defined below), Convertible Notes (defined below) and PIK Notes (defined below) in the amount of $20.6 million during fiscal 2011. |
|
(3) |
During fiscal 2011, a loss from debt extinguishment in the total amount of $5.7 million was recognized, consisting of $1.9 million in connection with the $40.2 million prepayment of the 2009 Loan Facility in July 2011, and $3.8 million in connection with (i) the repayment in full of the 2009 Loan Facility, (ii) the repayment of a portion of the outstanding balance of PIK Notes and the conversion of the remaining outstanding balance of PIK Notes not repaid into shares of our common stock and (iii) the conversion of the outstanding balance of Convertible Notes into shares of our common stock in connection with the initial public offering in November 2011. During fiscal 2014, a loss from debt extinguishment in the total amount of $2.3 million was recognized in connection with the termination of the credit agreement with UBS Securities LLC and certain of its affiliates and other lenders for a senior secured term loan and revolving credit facility, which was amended and restated on November 5, 2012 and further amended on February 27, 2014 (as amended, the “2012 Senior Credit Facility”). |
|
(4) |
Gives effect to a 227,058‑for‑one stock split effected on November 3, 2011 resulting in 22,399,952 shares of common stock outstanding immediately prior to the consummation of our initial public offering in November 2011, and the issuance of (i) 6,388,888 shares of the Company’s common stock as part of the initial public offering, (ii) 2,205,953 additional shares upon the conversion of the Convertible Notes in connection with the initial public offering and (iii) 2,774,035 additional shares upon the conversion of the PIK Notes in connection with the initial public offering, in each case at a price or conversion rate equal to the initial public offering price of $19.00 per share. |
32
|
(5) |
Our “As Adjusted” data is considered a non‑U.S. GAAP financial measure and is not in accordance with, or preferable to, “As Reported,” or GAAP financial data. However, we are providing this information as we believe it facilitates year‑over‑year comparisons for investors and financial analysts. |
|
|
|
|
|
|
|
|
|
|
|
|
|
|
|
|
|
Fiscal Year 2011 |
||||||||||||
|
|
Income From Operations |
|
Income Before Income Taxes |
|
Net |
|
Diluted |
|
Diluted EPS* |
||||
|
As Reported |
$ |
60,541 |
|
$ |
25,536 |
|
$ |
34,351 |
|
24,586,274 |
|
$ |
1.40 |
|
% of sales |
|
8.6 |
% |
|
3.6 |
% |
|
4.9 |
% |
|
|
|
|
|
IPO Pro Forma Adjustments (a) |
|
|
|
|
|
|
|
|
|
|
|
|
|
|
Diluted share count adjustment |
|
|
|
|
|
|
|
|
|
9,182,554 |
|
|
(0.38) |
|
Management fees |
|
644 |
|
|
644 |
|
|
405 |
|
|
|
|
0.01 |
|
Interest expense |
|
— |
|
|
21,131 |
|
|
13,291 |
|
|
|
|
0.39 |
|
Loss from debt extinguishment |
|
— |
|
|
5,688 |
|
|
3,578 |
|
|
|
|
0.11 |
|
Other Adjustments |
|
|
|
|
|
|
|
|
|
|
|
|
|
|
Release of valuation allowance on |
|
— |
|
|
— |
|
|
(20,050) |
|
|
|
|
(0.59) |
|
Total adjustments |
|
644 |
|
|
27,463 |
|
|
(2,776) |
|
9,182,554 |
|
|
(0.46) |
|
As Adjusted |
$ |
61,185 |
|
$ |
52,999 |
|
$ |
31,575 |
|
33,768,828 |
|
$ |
0.94 |
|
% of sales |
|
8.7 |
% |
|
7.5 |
% |
|
4.5 |
% |
|
|
|
|
|
|
Fiscal Year 2012 |
||||||||||||
|
|
Income From Operations |
|
Income Before Income Taxes |
|
Net |
|
Diluted |
|
Diluted EPS* |
||||
|
As Reported |
$ |
75,816 |
|
$ |
66,569 |
|
$ |
39,871 |
|
33,853,276 |
|
$ |
1.18 |
|
% of sales |
|
7.5 |
% |
|
6.6 |
% |
|
4.0 |
% |
|
|
|
|
|
Acquisition-related costs (c) |
|
11,980 |
|
|
11,980 |
|
|
7,616 |
|
|
|
|
0.23 |
|
Secondary offering costs (d) |
|
1,915 |
|
|
1,915 |
|
|
1,403 |
|
|
|
|
0.04 |
|
Impairment charges (e) |
|
2,256 |
|
|
2,256 |
|
|
1,386 |
|
|
|
|
0.04 |
|
Other (f) |
|
180 |
|
|
180 |
|
|
111 |
|
|
|
|
0.00 |
|
Total adjustments |
|
16,331 |
|
|
16,331 |
|
|
10,516 |
|
— |
|
|
0.31 |
|
As Adjusted |
$ |
92,147 |
|
$ |
82,900 |
|
$ |
50,387 |
|
33,853,276 |
|
$ |
1.49 |
|
% of sales |
|
9.1 |
% |
|
8.2 |
% |
|
5.0 |
% |
|
|
|
|
|
|
Fiscal Year 2013 |
||||||||||||
|
|
Income From Operations |
|
Income Before Income Taxes |
|
Net |
|
Diluted |
|
Diluted EPS* |
||||
|
As Reported |
$ |
96,946 |
|
$ |
86,082 |
|
$ |
52,924 |
|
34,131,456 |
|
$ |
1.55 |
|
% of sales |
|
8.0 |
% |
|
7.1 |
% |
|
4.3 |
% |
|
|
|
|
|
Acquisition-related costs (c) |
|
1,736 |
|
|
1,736 |
|
|
1,065 |
|
|
|
|
0.03 |
|
ERP system implementation costs (g) |
|
3,966 |
|
|
3,966 |
|
|
2,432 |
|
|
|
|
0.07 |
|
Impairment charges (e) |
|
426 |
|
|
426 |
|
|
261 |
|
|
|
|
0.01 |
|
Total adjustments |
|
6,128 |
|
|
6,128 |
|
|
3,758 |
|
- |
|
|
0.11 |
|
As Adjusted |
$ |
103,074 |
|
$ |
92,210 |
|
$ |
56,682 |
|
34,131,456 |
|
$ |
1.66 |
|
% of sales |
|
8.5 |
% |
|
7.6 |
% |
|
4.7 |
% |
|
|
|
|
33
|
|
Fiscal Year 2014 |
||||||||||||
|
|
Income |
|
Income |
|
Net |
|
Diluted |
|
Diluted |
||||
|
As Reported |
$ |
97,698 |
|
$ |
73,486 |
|
$ |
44,251 |
|
34,811,076 |
|
$ |
1.27 |
|
% of sales |
|
5.4 |
% |
|
4.1 |
% |
|
2.5 |
% |
|
|
|
|
|
Acquisition-related costs (c) |
|
30,113 |
|
|
30,113 |
|
|
18,248 |
|
|
|
|
0.52 |
|
Secondary offering costs (d) |
|
563 |
|
|
563 |
|
|
563 |
|
|
|
|
0.02 |
|
ERP system implementation costs (g) |
|
7,736 |
|
|
7,736 |
|
|
4,688 |
|
|
|
|
0.13 |
|
Impairment charges (e) |
|
937 |
|
|
937 |
|
|
568 |
|
|
|
|
0.02 |
|
Other (f) |
|
1,407 |
|
|
3,695 |
|
|
2,239 |
|
|
|
|
0.06 |
|
Total adjustments |
|
40,756 |
|
|
43,044 |
|
|
26,306 |
|
- |
|
|
0.76 |
|
As Adjusted |
$ |
138,454 |
|
$ |
116,530 |
|
$ |
70,557 |
|
34,811,076 |
|
$ |
2.03 |
|
% of sales |
|
7.7 |
% |
|
6.5 |
% |
|
3.9 |
% |
|
|
|
|
|
|
Fiscal Year 2015 |
||||||||||||
|
|
Income |
|
Income |
|
Net |
|
Diluted |
|
Diluted |
||||
|
As Reported |
$ |
143,742 |
|
$ |
103,595 |
|
$ |
64,522 |
|
35,540,357 |
|
$ |
1.82 |
|
% of sales |
|
5.7 |
% |
|
4.1 |
% |
|
2.5 |
% |
|
|
|
|
|
Acquisition-related costs (c) |
|
23,273 |
|
|
23,273 |
|
|
14,494 |
|
|
|
|
0.41 |
|
Secondary offering costs (d) |
|
487 |
|
|
487 |
|
|
487 |
|
|
|
|
0.01 |
|
ERP system implementation costs (g) |
|
666 |
|
|
666 |
|
|
415 |
|
|
|
|
0.01 |
|
Impairment charges (e) |
|
5,452 |
|
|
5,452 |
|
|
3,396 |
|
|
|
|
0.10 |
|
Other (f) |
|
627 |
|
|
627 |
|
|
390 |
|
|
|
|
0.01 |
|
Total adjustments |
|
30,505 |
|
|
30,505 |
|
|
19,182 |
|
- |
|
|
0.54 |
|
As Adjusted |
$ |
174,247 |
|
$ |
134,100 |
|
$ |
83,704 |
|
35,540,357 |
|
$ |
2.36 |
|
% of sales |
|
6.9 |
% |
|
5.3 |
% |
|
3.3 |
% |
|
|
|
|
*Due to rounding to the nearest cent per diluted share, totals may not equal the sum of the line items in the tables above.
|
(a) |
IPO Pro Forma Adjustments give effect to the initial public offering that was completed on November 23, 2011, as if the offering had occurred at the beginning of fiscal 2011 (February 2, 2011). These pro forma adjustments reflect the following assumptions: (i) the application of the net proceeds from the initial public offering to repay debt resulting in a decrease to interest expense and a loss from debt extinguishment, (ii) the conversion of a significant portion of convertible debt for which such conversion was elected into shares of our common stock, resulting in a decrease to interest expense, a loss from debt extinguishment, (iii) the reduction in management fee expense in connection with the termination of the management agreement between J.W. Childs Associates, L.P. and the Company that became effective with the completion of the initial public offering, and (iv) the effect on diluted EPS as if the common stock shares outstanding at the completion of the offering had been outstanding for the entire period presented. |
|
(b) |
The release of the valuation allowance on deferred tax assets reflects utilization of net operating loss carryforwards throughout fiscal 2011 and an expectation of increased future taxable income effective with the completion of our initial public offering and the resulting reduction of outstanding debt and the elimination of interest expense thereon, which provided sufficient evidence that it was more‑likely‑than‑not that deferred tax assets would be realized in future periods and supported the release of the remaining valuation allowance in fiscal 2011. |
|
(c) |
Acquisition-related costs, which are included in the “As Reported” results of operations, consist of acquisition-related costs as defined under U.S. GAAP, including advisory, legal, accounting, valuation, and other professional or consulting fees and, in addition, costs of integrating store and warehouse operations and corporate functions that are not expected to recur as acquisitions are absorbed. On May 2, 2012, we acquired all of the equity interests of MGHC Holding Corporation (“Mattress Giant”), including 181 mattress specialty retail stores. On September 25, 2012, we acquired the assets and operations of Mattress XPress, Inc. and Mattress XPress of Georgia, Inc. (collectively, “Mattress X‑Press”), including 34 mattress specialty retail stores. On December 11, 2012, we acquired the assets and operations of Factory Mattress & Water Bed Outlet of Charlotte, Inc. (“Mattress Source”), including 27 mattress specialty retail stores. On June 14, 2013, we acquired the assets and operations of Olejo, Inc., an online retailer primarily focused on mattresses and bedding-related products. On November 13, 2013, we acquired the equity interests of NE Mattress People, LLC (“Mattress People”), including 5 mattress specialty retail stores. On December 10, 2013, we acquired the assets and operations of Perfect Mattress of Wisconsin, LLC (“Perfect Mattress”), including 39 mattress specialty retail stores. On December 31, 2013, we acquired the assets and operations of 2 mattress specialty retail stores in Houston, Texas (“Mattress Expo”). On March 3, 2014, we acquired the assets and operations of Yotes, Inc. (“Yotes”), including 34 mattress specialty retail stores. On March 3, 2014, we acquired the Virginia assets and operations of Southern Max LLC (“Southern Max”), including 3 mattress specialty retail stores. On April 3, 2014, we acquired the outstanding partnership interests in Sleep Experts Partners, L.P. (“Sleep Experts”), including 55 mattress specialty retail stores. On June 4, 2014, we acquired substantially all of the mattress specialty retail assets and operations of Mattress Liquidators, Inc., including 67 mattress specialty retail stores, which operated Mattress King retail stores in Colorado and BedMart retail stores in Arizona. On September 8, 2014, we acquired substantially all of the mattress specialty retail assets and operations of Best Mattress Co., Inc. related to the operation of 15 mattress specialty retail stores |
34
under the brand Mattress Discounters in Pennsylvania. On September 30, 2014, we acquired substantially all of the mattress specialty retail assets and operations of Back to Bed Inc., M World Mattress LLC, MCStores LLC and TBE Orlando LLC, related to the operation of 131 mattress specialty retail stores under the brands Back to Bed and Bedding Experts in the Chicago metropolitan area and Mattress Barn in the Orlando metropolitan area. On October 20, 2014, we acquired 100% of the outstanding equity interests in The Sleep Train, Inc., related to the operations of 314 mattress specialty retail stores in California, Oregon, Washington, Nevada, Idaho and Hawaii. On January 6, 2015, we acquired substantially all of the mattress specialty retail assets and operations of Sleep America LLC (“Sleep America”), which operated approximately 45 Sleep America retail stores in Arizona. On January 13, 2015 we acquired substantially all of the mattress specialty retail assets and operations of Mattress World, Inc. (“Mattress World”), related to the operation of 4 mattress specialty retail stores under the brand Mattress World in Pennsylvania. On November 17, 2015, we acquired the assets and operations of Double J-RD, LLC (“Double J-RD”), including nine mattress specialty retail stores. Acquisition-related costs, consisting of direct transaction costs and integration costs are included in the results of operations as incurred. We incurred approximately $12.0 million, $1.7 million, $30.1 million and $23.3 million of acquisition‑related costs during fiscal 2012, fiscal 2013, fiscal 2014 and fiscal 2015, respectively. |
|
(d) |
Reflects $1.9 million, $0.6 million and $0.5 million of costs borne by us in connection with secondary offerings of shares of common stock by certain of our selling shareholders which were completed in October 2012, December 2014 and April 2015, respectively. No offering proceeds were received by the Company. |
|
(e) |
Reflects an intangible trade name impairment charge in the amount of $2.1 million related to the Mattress Discounters trade name recorded during fiscal 2012, and a $0.2 million, $0.4 million, $0.9 million and $5.5 million impairment of store assets recorded during fiscal 2012, fiscal 2013, fiscal 2014 and fiscal 2015, respectively. |
|
(f) |
Reflects $0.2 million in expensed legal fees relating to our November 2012 debt amendment and extension recorded during fiscal 2012. Reflects $0.2 million of expensed legal fees relating to our February 2014 debt amendment and extension, $1.2 million of severance expense resulting from the Company's realignment of its management structure in the second fiscal quarter of fiscal 2014 and a $2.3 million loss on debt extinguishment recorded during fiscal 2014 related to the October 2014 termination of the 2012 Senior Credit Facility. Reflects $0.6 million of severance expense related to our changes in organization structure recorded during fiscal 2015. |
|
(g) |
Reflects implementation costs included in the results of operations as incurred during fiscal 2013, fiscal 2014 and fiscal 2015 of approximately $4.0 million, $7.7 million and $0.7 million, respectively, consisting primarily of training‑related costs in connection with the roll‑out of the Microsoft Dynamics AX for Retail Enterprise Resource Planning system (“ERP system”). These amounts include $1.6 million, $0.4 million and none, respectively, of accelerated depreciation expense on our legacy ERP system. |
|
(6) |
EBITDA represents net income before income tax expense, interest income, interest expense, depreciation and amortization. We have presented EBITDA because we consider it an important supplemental measure of our performance and believe it is frequently used by analysts, investors and other interested parties in the evaluation of companies in our industry. Management uses EBITDA as a measurement tool for evaluating our actual operating performance compared to budget and prior periods. Other companies in our industry may calculate EBITDA differently than we do. EBITDA is not a measure of performance under U.S. GAAP, and should not be considered as a substitute for net income prepared in accordance with U.S. GAAP. EBITDA has limitations as an analytical tool, and you should not consider it in isolation or as a substitute for analysis of our results as reported under U.S. GAAP. Some of these limitations are: |
|
· |
EBITDA does not reflect our cash expenditures, or future requirements, for capital expenditures or contractual commitments; |
|
· |
EBITDA does not reflect interest expense or the cash requirements necessary to service interest or principal payments on our debt; |
|
· |
EBITDA does not reflect tax expense or the cash requirements necessary to pay for tax obligations; and |
|
· |
Although depreciation and amortization are non‑cash charges, the asset being depreciated and amortized will often have to be replaced in the future, and EBITDA does not reflect any cash requirements for such replacements. |
We compensate for these limitations by relying primarily on our U.S. GAAP results and using EBITDA only as a supplemental measure.
|
(7) |
Adjusted EBITDA is defined as EBITDA, without giving effect to non‑cash goodwill and intangible asset impairment charges, gains or losses on store closings and impairment of store assets, gains or losses related to the early extinguishment of debt, secondary offering costs, non‑cash charges related to stock‑based awards and other items that are excluded by management in reviewing the results of operations. We have presented Adjusted EBITDA because we believe that the exclusion of these items is appropriate to provide additional information to investors about our ongoing operating performance excluding certain non‑cash and other items and to provide additional information with respect to our ability to comply with various covenants in documents governing our indebtedness and as a means to evaluate our period‑to‑period results. In evaluating Adjusted EBITDA, you should be aware that in the future we may incur expenses that are the same as or similar to some of the adjustments in this presentation. Our presentation of Adjusted EBITDA should not be construed to imply that our future results will be unaffected by any such adjustments. We have provided this information to analysts, investors and other third parties to enable them to perform more meaningful comparisons of past, present and future operating results and as a means to evaluate the results of our ongoing operations. The Compensation Committee uses Adjusted EBITDA as a performance measure under our short‑term incentive programs for our executive officers. In addition, our compliance with certain covenants under our Senior Credit Facility that are calculated based on similar measures, which differ from Adjusted EBITDA primarily by the inclusion of pro forma results for acquired businesses in those similar measures. Other companies in our industry may calculate Adjusted EBITDA differently than we do. Adjusted EBITDA is not a measure of performance under U.S. GAAP and |
35
should not be considered as a substitute for net income prepared in accordance with U.S. GAAP. Adjusted EBITDA has similar limitations as an analytical tool to those set forth in note (6) related to the use of EBITDA, and you should not consider it in isolation or as a substitute for analysis of our results as reported under U.S. GAAP. Some of the additional limitations to the use of Adjusted EBITDA are: |
|
· |
Adjusted EBITDA does not reflect the cash requirements of closing underperforming stores; |
|
· |
Adjusted EBITDA does not reflect the cash requirements of completing the acquisition and integration of acquired stores; |
|
· |
Adjusted EBITDA does not reflect costs related to management services previously provided by JWC Mattress Holdings, LLC, a limited liability company managed by J.W. Childs Associates, Inc. (“J.W. Childs”); and |
|
· |
Adjusted EBITDA does not reflect certain other costs that may recur in future periods. |
We compensate for these limitations by relying primarily on our U.S. GAAP results and using Adjusted EBITDA only as a supplemental measure. The following table contains a reconciliation of our net income (loss) determined in accordance with U.S. GAAP to EBITDA and Adjusted EBITDA for the periods indicated:
|
|
|
Fiscal Year |
|
|||||||||||||
|
|
|
2011 |
|
2012 |
|
2013 |
|
2014 |
|
2015 |
|
|||||
|
Net income |
|
$ |
34,351 |
|
$ |
39,871 |
|
$ |
52,924 |
|
$ |
44,251 |
|
$ |
64,522 |
|
|
Income tax expense |
|
|
(8,815) |
|
|
26,698 |
|
|
33,158 |
|
|
29,235 |
|
|
39,073 |
|
|
Interest expense, net |
|
|
29,301 |
|
|
9,247 |
|
|
10,864 |
|
|
20,102 |
|
|
40,147 |
|
|
Depreciation and amortization |
|
|
17,450 |
|
|
23,507 |
|
|
29,498 |
|
|
41,740 |
|
|
62,247 |
|
|
Intangible assets and other amortization |
|
|
1,718 |
|
|
1,506 |
|
|
2,489 |
|
|
5,608 |
|
|
4,983 |
|
|
EBITDA |
|
|
74,005 |
|
|
100,829 |
|
|
128,933 |
|
|
140,936 |
|
|
210,972 |
|
|
Intangible asset impairment charge |
|
|
— |
|
|
2,100 |
|
|
— |
|
|
— |
|
|
— |
|
|
Loss on store closings and impairment of store assets |
|
|
759 |
|
|
1,050 |
|
|
1,499 |
|
|
1,813 |
|
|
7,524 |
|
|
Loss from debt extinguishment |
|
|
5,704 |
|
|
— |
|
|
— |
|
|
2,288 |
|
|
— |
|
|
Stock-based compensation |
|
|
523 |
|
|
2,856 |
|
|
4,846 |
|
|
8,122 |
|
|
8,802 |
|
|
Secondary offering costs |
|
|
— |
|
|
1,915 |
|
|
— |
|
|
563 |
|
|
487 |
|
|
Vendor new store funds(a) |
|
|
3,169 |
|
|
953 |
|
|
808 |
|
|
(1,208) |
|
|
1,921 |
|
|
Acquisition-related expenses(b) |
|
|
886 |
|
|
11,980 |
|
|
1,736 |
|
|
30,113 |
|
|
23,273 |
|
|
Other(c) |
|
|
2,441 |
|
|
(715) |
|
|
2,157 |
|
|
7,550 |
|
|
1,650 |
|
|
Adjusted EBITDA |
|
$ |
87,487 |
|
$ |
120,968 |
|
$ |
139,979 |
|
$ |
190,177 |
|
$ |
254,629 |
|
|
(a) |
We receive cash payments from certain vendors for each new incremental store that we open (“new store funds”). New store funds are initially recorded in other noncurrent liabilities when received and are then amortized as a reduction of cost of sales over 36 months in our financial statements. Historically, we have considered new store funds as a component of Adjusted EBITDA when received since new store funds are included in cash provided from operations. The adjustment includes the amount of new store funds received during the period presented and eliminates the non‑cash reduction in cost of sales included in our results of operations. |
|
(b) |
Reflects both non‑cash effects included in net income related to acquisition accounting adjustments made to inventories and other acquisition related cash costs included in net income, such as direct acquisition costs and costs related to integration of acquired businesses. |
|
(c) |
Consists of various items that management excludes in reviewing the results of operations, including a $0.5 million benefit in fiscal 2012 for a recovery from the claims‑made reversionary fund established to administer a lawsuit settlement and $2.4 million, $7.3 million and $0.7 million of ERP system implementation costs incurred during fiscal 2013, fiscal 2014 and fiscal 2015, respectively. |
|
(8) |
Comparable-store sales is a measure commonly used in the retail industry, which indicates store performance by measuring the growth in revenue for certain stores for a particular period over the corresponding period in the prior year. New stores are included in the comparable-store sales calculation beginning in the thirteenth full month of operation. Acquired stores are included in the comparable-store sales calculation beginning in the first month following the one-year anniversary date of the acquisition. The comparable-store sales calculation includes our e-commerce and multi-channel sales. New stores that are relocated within a two mile radius of a closed store are included in the comparable-store sales calculation beginning with the first full month of operations by measuring the growth in revenue against the prior year sales of the closed store. Stores that are closed, other than relocated stores, are removed from the comparable-store sales calculation in the month of closing. Comparable-store sales during fiscal years that are comprised of 53 weeks exclude sales for the fifty-third week of the year. The method of calculating comparable-store sales varies across the retail industry and our method may not be the same as other retailers' methods. |
|
(9) |
Calculated using net sales for stores open at both the beginning and the end of the period, excluding e-commerce and multi-channel sales. |
36
Item 7. Management’s Discussion and Analysis of Financial Condition and Results of Operations
The following discussion should be read in conjunction with our audited consolidated financial statements and related notes appearing elsewhere in this Annual Report on Form 10‑K. The discussion in this section contains forward‑looking statements that involve risks and uncertainties. See “Cautionary Note Regarding Forward‑Looking Statements” included elsewhere in this Annual Report on Form 10‑K for a discussion of important factors that could cause actual results to differ materially from those described or implied by the forward‑looking statements contained herein.
Executive Summary
Our operations consist primarily of the retail sale of mattresses and bedding‑related products in various metropolitan areas in the United States through company‑operated and franchisee‑operated mattress specialty stores that operate primarily under the Mattress Firm®, Sleep Train ® and as of February 5, 2016, Sleepy’s ® brand names. The Company manages and evaluates its company‑operated stores on a geographic basis. The Company also generates sales through its e‑commerce website and special events business primarily to customers who reside in the metropolitan areas in which company‑operated stores are located and utilizes its existing distribution centers to deliver products to these customers efficiently. The Company’s operating segments consist of its (i) company‑operated store operations, with each geographic region considered a separate operating segment, (ii) e‑commerce website operations, (iii) multi‑channel sales operations, consisting primarily of special events and (iv) franchise operations, which consists primarily of franchise fees and royalty income earned on the sales from franchisee‑operated mattress specialty stores. A reportable segment is an operating segment or an aggregation of two or more operating segments that contain similar economic characteristics. The company‑operated store regions, e‑commerce website and multi‑channel operating segments are aggregated into a single reportable segment (“retail segment”) as a result of the similar nature of the products sold and other similar economic characteristics that are expected to continue into future periods. Franchise operations are a separate reportable segment, for which the results of operations, as viewed by management, are fully represented by the franchise fees and royalty income reported on the face of the statements of operations.
Key results for fiscal 2015 include:
|
· |
Net income increased $20.2 million to $64.5 million for fiscal 2015 compared to $44.3 million for fiscal 2014. |
|
· |
Income from operations on an “As Reported” basis (in accordance with U.S. GAAP) increased $46.0 million to $143.7 million for fiscal 2015 as compared to $97.7 million for fiscal 2014. Income from operations on an “As Adjusted” basis, which excludes acquisition‑related, secondary offering, ERP system implementation, impairment and severance charges, increased $35.8 million to $174.3 million for fiscal 2015 as compared to $138.5 million for fiscal 2014, and adjusted operating margin decreased 80 basis points to 6.9% for fiscal 2015 from 7.7% in fiscal 2014. This operating margin decrease on an adjusted basis (excluding acquisition-related, secondary offering, ERP system implementation costs, impairment and severance charges) is comprised of 80 basis-points of expense leverage from general and administrative expense, an 80 basis-point decrease in gross margin and 80 basis-points of decrease in sales and marketing expense leverage. (See “Item 6. Selected Financial Data” for a definition of adjusted income from operations and a reconciliation of adjusted income from operations to income from operations.) |
|
· |
Net sales increased $735.7 million, or 40.7%, to $2,541.7 million for fiscal 2015, compared to $1,806.0 million for fiscal 2014. This increase is due to increased comparable-store sales, the addition of new stores, and the full year impact of the acquisitions made during 2014.Comparable‑store sales increased 2.1% during fiscal 2015. |
37
The components of the net sales increase were as follows (in millions):
|
|
|
|
|
|
|
|
|
|
|
|
Progression in Net Sales |
|
||||
|
|
|
Fiscal 2014 |
|
Fiscal 2015 |
|
||
|
Net sales for prior year period |
|
$ |
1,216.8 |
|
$ |
1,806.0 |
|
|
Increase (decrease) in net sales: |
|
|
|
|
|
|
|
|
Comparable-store sales |
|
|
73.4 |
|
|
36.5 |
|
|
New stores |
|
|
193.8 |
|
|
223.2 |
|
|
Acquired stores |
|
|
292.3 |
|
|
537.0 |
|
|
Closed stores |
|
|
(17.7) |
|
|
(13.6) |
|
|
Effect of 53 week year |
|
|
47.4 |
|
|
(47.4) |
|
|
Increase in net sales, net |
|
|
589.2 |
|
|
735.7 |
|
|
Net sales for current year period |
|
$ |
1,806.0 |
|
$ |
2,541.7 |
|
|
% increase |
|
|
48.4 |
% |
|
40.7 |
% |
The components of net sales by major category of product and services were as follows (in millions):
|
|
|
|
|
|
|
|
|
|
|
|
|
|
|
|
|
|
|
|
|
|
|
Fiscal |
|
% of |
|
|
Fiscal |
|
% of |
|
|
Fiscal |
|
% of |
|
|||
|
|
|
2013 |
|
Total |
|
|
2014 |
|
Total |
|
|
2015 |
|
Total |
|
|||
|
Conventional mattresses |
|
$ |
569.0 |
|
46.8 |
% |
|
$ |
852.8 |
|
47.2 |
% |
|
$ |
1,297.0 |
|
51.0 |
% |
|
Specialty mattresses |
|
|
540.2 |
|
44.4 |
% |
|
|
781.1 |
|
43.3 |
% |
|
|
1,013.7 |
|
39.9 |
% |
|
Furniture and accessories |
|
|
85.2 |
|
7.0 |
% |
|
|
141.4 |
|
7.8 |
% |
|
|
194.0 |
|
7.6 |
% |
|
Total product sales |
|
|
1,194.4 |
|
98.2 |
% |
|
|
1,775.3 |
|
98.3 |
% |
|
|
2,504.7 |
|
98.5 |
% |
|
Delivery service revenues |
|
|
22.4 |
|
1.8 |
% |
|
|
30.7 |
|
1.7 |
% |
|
|
37.0 |
|
1.5 |
% |
|
Total net sales |
|
$ |
1,216.8 |
|
100.0 |
% |
|
$ |
1,806.0 |
|
100.0 |
% |
|
$ |
2,541.7 |
|
100.0 |
% |
The activity with respect to the number of company‑operated store units was as follows:
|
|
|
|
|
|
|
|
|
|
|
|
Fiscal 2013 |
|
Fiscal 2014 |
|
Fiscal 2015 |
|
|
Store units, beginning of period |
|
1,057 |
|
1,225 |
|
2,094 |
|
|
New stores |
|
154 |
|
232 |
|
310 |
|
|
Acquired stores |
|
46 |
|
668 |
|
9 |
|
|
Closed stores |
|
(32) |
|
(31) |
|
(54) |
|
|
Store units, end of period |
|
1,225 |
|
2,094 |
|
2,359 |
|
|
· |
Adjusted EBITDA increased $64.4 million to $254.6 million for fiscal 2015 compared with $190.2 million for fiscal 2014. Adjusted EBITDA as a percentage of sales decreased to 10.0% during fiscal 2015 compared with 10.5% for fiscal 2014. (Adjusted EBITDA is not a performance measure under U.S. GAAP. See “Item 6. Selected Financial Data” for a definition of Adjusted EBITDA and a reconciliation of Adjusted EBITDA to net income). |
|
· |
Operating cash flows were $196.4 million during fiscal 2015, which was a funding source for capital expenditures and debt repayments. |
|
· |
There were $0 in outstanding revolver borrowings and $4.2 million of outstanding standby letters of credit at February 2, 2016, resulting in $97.6 million of borrowing capacity under our revolving credit facility. |
We expect to continue the expansion of our company‑operated store base through new store openings in existing markets to increase our market share and new store openings in new markets to provide a platform for future growth. We plan to net 180 to 200 new company‑operated store openings in fiscal 2016. Net new store growth is before any incremental closures on the proposed store optimization program we announced on March 21, 2016.
38
We also strive to increase sales and profitability within our existing network of stores through a combination of (i) advertising and marketing initiatives that are aimed at increasing customer traffic, (ii) improved customer conversion through our merchandising approach that improves the customer’s shopping experience and the efforts of our highly trained sales associates and (iii) increasing the average price of a transaction through effective sales techniques and the increasing demand for specialty mattresses.
On November 17, 2015, we acquired substantially all of the retail assets and operations of Double J-RD, LLC (“Double J-RD”), a former franchisee which operated stores under the Mattress Firm brand in East Texas and Louisiana, relating to the operation of nine mattress specialty retail stores for a total purchase price of approximately $3.7 million, subject to further working capital adjustments.
On November 25, 2015, we entered into a Securities Purchase Agreement to purchase all of the outstanding equity interests in HMK Mattress Holdings LLC, the holding company of Sleepy’s LLC and related entities (collectively, “Sleepy’s”), for an aggregate purchase price of approximately $780 million, subject to working capital and other customary post-closing purchase price adjustments. Sleepy’s operates approximately 1,050 specialty mattress retail stores located in 17 states in the Northeast, New England, the Mid-Atlantic and Illinois and employs approximately 3,366 persons. We completed the acquisition of Sleepy’s on February 5, 2016, during the first week of our fiscal 2016. Upon the closing of the Sleepy’s acquisition, Adam Blank, Sleepy’s chief operating officer and general counsel immediately prior to closing, became the president of Sleepy’s.
Results of Operations
The following table presents the consolidated historical financial operating data for our business expressed as a percentage of net sales for each period indicated. Our fiscal year consists of 52 or 53 weeks, ending on the Tuesday nearest to January 31, divided into twelve fiscal periods of four or five weeks each. Each fiscal year is described by the period of the calendar year that comprises the majority of the fiscal year period. The fiscal year ended February 2, 2016 is described as “fiscal 2015,” the fiscal year ended February 3, 2015 is described as “fiscal 2014,” and the fiscal year ended January 28, 2014 is described as “fiscal 2013”. Fiscal 2013 and 2015 consisted of 52 weeks of operations. Fiscal 2014 consisted of 53 weeks of operations. The historical results are not necessarily indicative of results to be expected for any future period (in thousands).
|
|
|
Fiscal |
|
% of |
|
|
Fiscal |
|
% of |
|
|
Fiscal |
|
% of |
|
|||
|
Net sales |
|
$ |
1,216,812 |
|
100.0 |
% |
|
$ |
1,806,029 |
|
100.0 |
% |
|
$ |
2,541,672 |
|
100.0 |
% |
|
Costs of sales |
|
|
751,487 |
|
61.8 |
% |
|
|
1,116,666 |
|
61.8 |
% |
|
|
1,590,636 |
|
62.6 |
% |
|
Gross profit from retail operations |
|
|
465,325 |
|
38.2 |
% |
|
|
689,363 |
|
38.2 |
% |
|
|
951,036 |
|
37.4 |
% |
|
Franchise fees and royalty income |
|
|
5,617 |
|
0.5 |
% |
|
|
4,584 |
|
0.2 |
% |
|
|
5,232 |
|
0.2 |
% |
|
Total gross profit |
|
|
470,942 |
|
38.7 |
% |
|
|
693,947 |
|
38.4 |
% |
|
|
956,268 |
|
37.6 |
% |
|
Sales and marketing expenses |
|
|
289,533 |
|
23.8 |
% |
|
|
427,401 |
|
23.7 |
% |
|
|
621,597 |
|
24.5 |
% |
|
General and administrative expenses |
|
|
82,964 |
|
6.8 |
% |
|
|
167,035 |
|
9.2 |
% |
|
|
183,405 |
|
7.1 |
% |
|
Loss on store closings and impairment of store assets |
|
|
1,499 |
|
0.1 |
% |
|
|
1,813 |
|
0.1 |
% |
|
|
7,524 |
|
0.3 |
% |
|
Income from operations |
|
|
96,946 |
|
8.0 |
% |
|
|
97,698 |
|
5.4 |
% |
|
|
143,742 |
|
5.7 |
% |
|
Other expense, net |
|
|
10,864 |
|
0.9 |
% |
|
|
24,212 |
|
1.3 |
% |
|
|
40,147 |
|
1.6 |
% |
|
Income before income taxes |
|
|
86,082 |
|
7.1 |
% |
|
|
73,486 |
|
4.1 |
% |
|
|
103,595 |
|
4.1 |
% |
|
Income tax expense |
|
|
33,158 |
|
2.7 |
% |
|
|
29,235 |
|
1.6 |
% |
|
|
39,073 |
|
1.5 |
% |
|
Net income |
|
$ |
52,924 |
|
4.3 |
% |
|
$ |
44,251 |
|
2.5 |
% |
|
$ |
64,522 |
|
2.5 |
% |
Due to rounding, totals may not equal the sum of the line items in the table above.
Fiscal 2015 Compared to Fiscal 2014
Net sales are recognized upon delivery and acceptance of mattresses and bedding products by our customers, include fees collected for delivery services, and are recorded net of estimated returns and net of sales tax collected from customers and remitted to various taxing jurisdictions. Net sales increased $735.7 million, or 40.7%, to $2,541.7 million during fiscal 2015, compared to $1,806.0 million during fiscal 2014 primarily as a result of an increase in the number of stores we operated and an increase in comparable-store sales. The components of the net sales increase for fiscal 2015 as compared to fiscal 2014 were as follows (in millions):
|
|
|
|
|
|
39
|
|
|
Progression in Net Sales |
|
|
|
|
|
Fiscal 2015 |
|
|
|
Net sales for prior year period |
|
$ |
1,806.0 |
|
|
Increase (decrease) in net sales: |
|
|
|
|
|
Comparable-store sales |
|
|
36.5 |
|
|
New stores |
|
|
223.2 |
|
|
Acquired stores |
|
|
537.0 |
|
|
Closed stores |
|
|
(13.6) |
|
|
Effect of 53 week year |
|
|
(47.4) |
|
|
Increase in net sales, net |
|
|
735.7 |
|
|
Net sales for current year period |
|
$ |
2,541.7 |
|
|
% increase |
|
|
40.7 |
% |
Comparable-store net sales increased 2.1%, which was primarily the result of an increase in average ticket for specialty mattress sales, offset by a decline in mattress unit sales. The increase in our net sales from new stores was the result of 310 new stores opened at various times during fiscal 2015 compared to 232 stores opened during fiscal 2014, prior to their inclusion in the comparable-store sales calculation which begins with the thirteenth full fiscal period of operations. The increase in net sales from acquired stores was the result of the acquisitions of 34 stores formerly operated by Yotes in March 2014, three stores formerly operated by Southern Max in March 2014, 55 Sleep Experts stores in April 2014, 67 stores formerly owned by Mattress Liquidators in June 2014, 15 stores formerly owned by Best Mattress in September 2014, 131 stores formerly owned by Back to Bed in September 2014, 314 Sleep Train stores in October 2014, 45 Sleep America stores in January 2015, four Mattress World stores in January 2015 and nine Double J-RD stores in November 2015. We closed 54 and 31 stores in fiscal 2015 and 2014, respectively, and the reduction in sales during fiscal 2015 from these closings totaled $13.6 million, as compared with $17.7 million from store closings in fiscal 2014. Fiscal 2015 and fiscal 2014 were comprised of 52 weeks and 53 weeks, respectively, resulting in one additional week of operations in fiscal 2014, which resulted in higher net sales in fiscal 2014 of $47.4 million due to sales in the 53rd week of fiscal 2014. We operated 2,359 stores at the end of fiscal 2015, compared with 2,094 stores at the end of fiscal 2014.
Cost of sales. Cost of sales consists of the following:
|
· |
Costs associated with purchasing and delivering our products to our stores and customers, net of vendor incentives earned on the purchase of products subsequently sold; |
|
· |
Physical inventory losses; |
|
· |
Store and warehouse occupancy and depreciation expense of related facilities and equipment; |
|
· |
Store and warehouse operating costs, including warehouse (i) labor costs, (ii) utilities, (iii) repairs and maintenance, (iv) supplies and (v) store facilities; and |
|
· |
Estimated costs to provide for customer returns and exchanges and to service customer warranty claims. |
Cost of sales increased $473.9 million, or 42.5%, to $1,590.6 million during fiscal 2015, compared to $1,116.7 million during fiscal 2014. The major components of the increase in cost of sales are discussed below. Cost of sales as a percentage of net sales increased to 62.6% during fiscal 2015, as compared to 61.8% during fiscal 2014.
Product costs increased by $276.7 million, or 40.5%, to $959.2 million during fiscal 2015, compared with $682.5 million during fiscal 2014. The increase in the amount of product costs was the result of the corresponding increase in net sales. Product costs as a percentage of net sales decreased to 37.7% during fiscal 2015 as compared to 37.8% during fiscal 2014.
Store and warehouse occupancy costs, consisting primarily of lease related costs of rented facilities, increased $114.3 million, or 44.7%, to $370.0 million during fiscal 2015, compared to $255.7 million for the corresponding prior year period. The increase in the amount of store and warehouse occupancy costs during fiscal 2015 was mainly attributable to the increase in the number of stores we operated and the warehouse operations in a number of new markets opened during fiscal 2015. Store and warehouse occupancy costs as a percentage of net sales increased to 14.6% in fiscal 2015 as compared to 14.2% in fiscal 2014.
40
Depreciation expense related to leasehold improvements and other fixed assets used in stores and warehouse operations increased $17.4 million, or 48.4%, to $53.3 million, during fiscal 2015, compared to $35.9 million during fiscal 2014. The increase in expense was primarily attributable to the increase in the number of stores we operated during fiscal 2015, as compared to the comparable prior year period.
Other cost of sales, consisting of store and warehouse operating and delivery costs, increased $65.5 million, or 46.0%, to $208.0 million during fiscal 2015, compared to $142.5 million during fiscal 2014, primarily as a result of the increase in net sales and in the increase in the number of stores we operated during fiscal 2015, as compared to the corresponding prior year period.
Gross profit from retail operations. As a result of the above, gross profit from retail operations increased $261.6 million, or 38.0%, to $951.0 million during fiscal 2015, compared with $689.4 million during fiscal 2014. Gross profit from retail operations as a percentage of net sales decreased to 37.4% in fiscal 2015, as compared to 38.2% in fiscal 2014, for the reasons discussed above.
Franchise fees and royalty income. Franchise fees and royalty income represents initial franchise fees earned upon the opening of new franchisee stores and ongoing royalties based on a percentage of gross franchisee sales. Franchise fees and royalty income increased $0.7 million, or 14.1%, to $5.2 million for fiscal 2015, compared to $4.5 million during the corresponding prior year period. Our franchisees operated 122 stores at February 2, 2016.
Sales and marketing expenses. Sales and marketing expenses consist of the following:
|
· |
Advertising and media production; |
|
· |
Payroll and benefits for sales associates; and |
|
· |
Merchant service fees for customer credit and debit card payments, check guarantee fees and promotional financing expense. |
Sales and marketing expenses increased $194.2 million, or 45.4%, to $621.6 million during fiscal 2015, compared to $427.4 million during fiscal 2014. Sales and marketing expenses as a percentage of net sales increased to 24.5% during fiscal 2015 as compared to 23.7% in fiscal 2014. The components of sales and marketing expenses are explained below.
Advertising expense increased $55.3 million, or 35.6%, to $210.6 million during fiscal 2015, from $155.3 million during fiscal 2014. The increase in the amount of advertising spend was mainly attributable to increased spending to enhance our market share in many of our established markets and, to a lesser extent, our expansion into new markets. Advertising expense as a percentage of net sales decreased to 8.3% during fiscal 2015, compared to 8.6% during fiscal 2014, primarily due to generating greater leverage from the increase in net sales in certain markets. We receive funds from time to time from certain vendors for the advertisement of their products, and we recognize these funds as a direct reduction of advertising expense. The amount of vendor advertising funds that were recognized as a reduction of advertising expense totaled $12.4 million during fiscal 2015, compared with $11.7 million during fiscal 2014.
Other sales and marketing expenses, consisting mainly of salesman compensation costs, but also including costs incurred to accept payments from our customers, such as credit card and third party finance fees, increased $138.9 million, or 51.1%, to $411.0 million during fiscal 2015, compared to $272.1 million during fiscal 2014, primarily as a result of the increase in net sales during the period. Other sales and marketing expenses as a percentage of net sales remained increased to 16.2% in fiscal 2015, as compared to 15.1% during fiscal 2014.
General and administrative expenses. General and administrative expenses consist of the following:
|
· |
Payroll and benefit costs for corporate office and regional management employees; |
|
· |
Stock-based compensation costs; |
|
· |
Occupancy costs of corporate facilities; |
|
· |
Information systems hardware, software and maintenance; |
41
|
· |
Depreciation related to corporate assets; |
|
· |
Insurance; and |
|
· |
Other overhead costs. |
General and administrative expenses increased $16.4 million, or 9.8%, to $183.4 million for fiscal 2015, compared to $167.0 million for fiscal 2014. The increase in general and administrative expenses was primarily a result of our growth, including a $12.0 million increase in wages, benefits and stock-based compensation resulting from employee additions to our corporate office (which includes a $4.2 million decrease in costs associated with our group health life insurance plan), a $6.6 million increase in information systems related costs, a $4.3 million increase in depreciation expense related primarily to increased information systems assets, a $6.5 million increase in various other general and administrative expense categories, partially offset by a $6.7 million decrease in ERP implementation training costs and a $6.3 million decrease in acquisition-related costs. General and administrative expenses as a percentage of net sales decreased to 7.1% during fiscal 2015, compared to 9.2% for the comparable prior year period. The decrease in general and administrative expenses as a percentage of net sales is primarily due to the decrease in acquisition-related costs noted above, the decrease in ERP implementation costs noted above and a decrease in the cost of administrative labor as a percentage of net sales. General and administrative expenses for fiscal 2015 and fiscal 2014 included $25.1 million and $39.8 million, respectively, of acquisition-related costs, secondary offering costs, ERP implementation training costs, and severance charges. We expect to continue making investments in our corporate infrastructure commensurate with our growth strategy.
Loss on store closings and impairment of store assets. Loss on store closings and impairment of store assets consists of the following:
|
· |
Estimated future costs to close locations at the time of closing including, as applicable, the difference between future lease obligations and anticipated sublease rentals; |
|
· |
The write off of unamortized fixed assets related to store leasehold costs on closed stores; and |
|
· |
Non-cash charges recognized for long-lived assets generally consisting of leasehold costs and related equipment resulting in a reduction of the carrying value to estimated fair value, based on our periodic assessment of whether projected future cash flows of individual stores are sufficient to recover the carrying value of the related assets. |
Loss on store closings and impairment of store assets increased $5.7 million to $7.5 million during fiscal 2015, compared to $1.8 million for fiscal 2014, primarily as a result of an increase of $4.5 million in store-level fixed asset impairment charges over the prior year period and an increase of $1.2 million in the amount of remaining commitments on stores that we closed during respective periods. Of the $7.5 million recognized during fiscal 2015 approximately $4.0 million represents impairment losses related to sign write-offs in connection with rebranding stores.
Other expense, net. Other expense, net, for both periods consisted primarily of interest expense and a loss on early debt extinguishment. Interest expense increased $18.2 million to $40.1 million during fiscal 2015, compared to $21.9 million during fiscal 2014, primarily as a result of an increase in term and revolver borrowings to fund the fiscal 2014 acquisitions. We incurred a $2.3 million loss on early debt extinguishment during fiscal 2014 related to the termination of our 2012 Senior Credit Facility.
Income tax expense. We recognized $39.1 million of income tax expense during fiscal 2015, compared to $29.2 million of income tax expense during fiscal 2014. The effective tax rate was 37.7% during fiscal 2015, compared to 39.8% during fiscal 2014, and differs primarily as a result of the impact of state income taxes.
Net income. As a result of the above, net income was $64.5 million during fiscal 2015 compared to $44.3 million during fiscal 2014.
42
Fiscal 2014 Compared to Fiscal 2013
Net sales increased $589.2 million, or 48.4%, to $1,806.0 million during fiscal 2014, compared to $1,216.8 million during fiscal 2013 primarily as a result of an increase in the number of stores we operated and an increase in comparable-store sales. The components of the net sales increase for fiscal 2014 as compared to fiscal 2013 were as follows (in millions):
|
|
|
|
|
|
|
|
|
Progression in Net Sales |
|
|
|
|
|
Fiscal 2014 |
|
|
|
Net sales for prior year period |
|
$ |
1,216.8 |
|
|
Increase (decrease) in net sales: |
|
|
|
|
|
Comparable-store sales |
|
|
73.4 |
|
|
New stores |
|
|
193.8 |
|
|
Acquired stores |
|
|
292.3 |
|
|
Closed stores |
|
|
(17.7) |
|
|
Increase in net sales, net |
|
|
589.2 |
|
|
Net sales for current year period |
|
$ |
1,806.0 |
|
|
% increase |
|
|
48.4 |
% |
Comparable-store net sales increased 6.1%, which was primarily the result of an increase in unit sales and an increase in average ticket for specialty mattress sales. The increase in our net sales from new stores was the result of 232 new stores opened at various times during fiscal 2014 compared to 154 stores opened during fiscal 2013, prior to their inclusion in the comparable-store sales calculation which begins with the thirteenth full fiscal period of operations. The increase in net sales from acquired stores was the result of the acquisitions of 34 stores formerly operated by Yotes in March 2014, three stores formerly operated by Southern Max in March 2014, 55 Sleep Experts stores in April 2014, 67 stores formerly owned by Mattress Liquidators in June 2014, 15 stores formerly owned by Best Mattress in September 2014, 131 stores formerly owned by Back to Bed in September 2014, 314 Sleep Train stores in October 2014, 45 Sleep America stores in January 2015 and four Mattress World stores in January 2015. We closed 31 and 32 stores in fiscal 2014 and 2013, respectively, and the reduction in sales during fiscal 2014 from these closings totaled $17.7 million, as compared with $13.9 million from store closings in fiscal 2013. Fiscal 2013 and fiscal 2014 were comprised of 52 weeks and 53 weeks, respectively, resulting in one additional week of operations in fiscal 2014, which resulted in higher net sales in fiscal 2014 of $47.4 million due to sales in the 53rd week. We operated 2,094 stores at the end of fiscal 2014, compared with 1,225 stores at the end of fiscal 2013.
Cost of sales. Cost of sales increased $365.2 million, or 48.6%, to $1,116.7 million during fiscal 2014, compared to $751.5 million during fiscal 2013. The major components of the increase in cost of sales are discussed below. Cost of sales as a percentage of net sales remained flat at 61.8% during both fiscal 2014 and fiscal 2013.
Product costs increased by $220.1 million, or 47.6%, to $682.5 million during fiscal 2014, compared with $462.5 million during fiscal 2013. The increase in the amount of product costs was the result of the corresponding increase in net sales. Product costs as a percentage of net sales decreased to 37.8% during fiscal 2014 as compared to 38.0% during fiscal 2013.
Store and warehouse occupancy costs, consisting primarily of lease related costs of rented facilities, increased $84.9 million, or 49.7%, to $255.7 million during fiscal 2014, compared to $170.8 million for the corresponding prior year period. The increase in the amount of store and warehouse occupancy costs during fiscal 2014 was mainly attributable to the increase in the number of stores we operated and the warehouse operations in a number of new markets opened during fiscal 2014. Store and warehouse occupancy costs as a percentage of net sales increased to 14.2% in fiscal 2014 as compared to 14.0% in fiscal 2013.
Depreciation expense related to leasehold improvements and other fixed assets used in stores and warehouse operations increased $10.3 million, or 40.4%, to $35.9 million, during fiscal 2014, compared to $25.6 million during fiscal 2013. The increase in expense was primarily attributable to the increase in the number of stores we operated during fiscal 2014, as compared to the comparable prior year period.
43
Other cost of sales, consisting of store and warehouse operating and delivery costs, increased $49.8 million, or 53.8%, to $142.5 million during fiscal 2014, compared to $92.6 million during fiscal 2013, primarily as a result of the increase in net sales and in the increase in the number of stores we operated during fiscal 2014, as compared to the corresponding prior year period.
Gross profit from retail operations. As a result of the above, gross profit from retail operations increased $224.1 million, or 48.2%, to $689.4 million during fiscal 2014, compared with $465.3 million during fiscal 2013. Gross profit from retail operations as a percentage of net sales remained flat at 38.2% in both fiscal 2014 and fiscal 2013, for the reasons discussed above.
Franchise fees and royalty income. Franchise fees and royalty income decreased $1.1 million, or 19.6%, to $4.5 million for fiscal 2014, compared to $5.6 million during the corresponding prior year period. The decrease in income was primarily a result of our acquisitions of certain formerly franchised operations, as described above. Our franchisees operated 114 stores at February 3, 2015.
Sales and marketing expenses. Sales and marketing expenses increased $137.9 million, or 47.6%, to $427.4 million during fiscal 2014, compared to $289.5 million during fiscal 2013. Sales and marketing expenses as a percentage of net sales decreased to 23.7% during fiscal 2014 as compared to 23.8% in fiscal 2013. The components of sales and marketing expenses are explained below.
Advertising expense increased $50.0 million, or 47.4%, to $155.3 million during fiscal 2014, from $105.3 million during fiscal 2013. The increase in the amount of advertising spend was mainly attributable to increased spending to enhance our market share in many of our established markets and, to a lesser extent, our expansion into new markets. Advertising expense as a percentage of net sales decreased to 8.6% during fiscal 2014, compared to 8.7% during fiscal 2013, primarily due to generating greater leverage from the increase in net sales in certain markets. We receive funds from time to time from certain vendors for the advertisement of their products, and we recognize these funds as a direct reduction of advertising expense. The amount of vendor advertising funds that were recognized as a reduction of advertising expense totaled $11.7 million during fiscal 2014, compared with $9.1 million during fiscal 2013.
Other sales and marketing expenses, consisting mainly of salesman compensation costs, but also including costs incurred to accept payments from our customers, such as credit card and third party finance fees, increased $87.9 million, or 47.7%, to $272.1 million during fiscal 2014, compared to $184.2 million during fiscal 2013, primarily as a result of the increase in net sales during the period. Other sales and marketing expenses as a percentage of net sales remained flat at 15.1% in both fiscal 2014 and fiscal 2013.
General and administrative expenses. General and administrative expenses increased $84.0 million, or 101.2%, to $167.0 million for fiscal 2014, compared to $83.0 million for fiscal 2013. The increase in general and administrative expenses was primarily a result of our growth, including a $36.0 million increase in wages, benefits and stock-based compensation resulting from employee additions to our corporate office, a $6.9 million increase in costs associated with our group health life insurance plan, a $28.4 million increase in acquisition-related costs, a $3.8 million increase in ERP implementation training costs and a $8.9 million increase in various other general and administrative expense categories. General and administrative expenses as a percentage of net sales increased to 9.2% during fiscal 2014, compared to 6.8% for the comparable prior year period. The increase in general and administrative expenses as a percentage of net sales is primarily due to the increase in acquisition-related costs noted above, an increase in ERP implementation costs noted above, an increase in cost of group health life insurance and administrative labor as a percentage of net sales and increases in various other areas. General and administrative expenses for fiscal 2014 and fiscal 2013 included $39.8 million and $5.7 million, respectively, of acquisition-related costs, secondary offering costs, ERP implementation training costs, and severance charges. We expect to continue making investments in our corporate infrastructure commensurate with our growth strategy.
Loss on store closings and impairment of store assets. Loss on store closings and impairment of store assets increased $0.3 million to $1.8 million during fiscal 2014, compared to $1.5 million for fiscal 2013, primarily as a result of an increase of $0.5 million in store-level fixed asset impairment charges over the prior year period, offset by a
44
decrease of $0.2 million in the amount of remaining lease commitments on stores that we closed during respective periods.
Other expense, net. Other expense, net, for both periods consisted primarily of interest expense and a loss on early debt extinguishment. Interest expense increased $11.0 million, or 101.6%, to $21.9 million during fiscal 2014, compared to $10.9 million during fiscal 2013, primarily as a result of an increase in term and revolver borrowings to fund the recent acquisitions as compared to the prior year period. We incurred a $2.3 million loss on early debt extinguishment related to the termination of our prior senior credit facility during fiscal 2014.
Income tax expense. We recognized $29.2 million of income tax expense during fiscal 2014, compared to $33.2 million of income tax expense during fiscal 2013. The effective tax rate was 39.8% during fiscal 2014, compared to 38.5% during fiscal 2013, and differs primarily as a result of the impact of state income taxes and non-deductible secondary offering costs in 2014.
Net income. As a result of the above, net income was $44.3 million during fiscal 2014 compared to $52.9 million during fiscal 2013.
Liquidity and Capital Resources
Cash Flows
The following table summarizes the principal elements of our cash flows (in thousands):
|
|
|
|
|
|
|
|
|
|
|
|
|
|
|
Fiscal 2013 |
|
Fiscal 2014 |
|
Fiscal 2015 |
|
|||
|
Total cash provided by (used in): |
|
|
|
|
|
|
|
|
|
|
|
Operating activities |
|
$ |
103,441 |
|
$ |
104,813 |
|
$ |
196,351 |
|
|
Investing activities |
|
|
(64,379) |
|
|
(646,419) |
|
|
(128,217) |
|
|
Financing activities |
|
|
(30,740) |
|
|
532,203 |
|
|
(79,831) |
|
|
Net increase (decrease) in cash and cash equivalents |
|
|
8,322 |
|
|
(9,403) |
|
|
(11,697) |
|
|
Cash and cash equivalents, beginning of period |
|
|
14,556 |
|
|
22,878 |
|
|
13,475 |
|
|
Cash and cash equivalents, end of period |
|
$ |
22,878 |
|
$ |
13,475 |
|
$ |
1,778 |
|
Operating cash flows.
Net cash provided by operating activities was $196.4 million for fiscal 2015 compared to $104.8 million for fiscal 2014. The $91.6 million increase in cash flows from operating activities as compared to the prior year period was primarily due to an increase in net income of $20.3 million in fiscal 2015 compared to fiscal 2014, the add-back of non-cash charges such as depreciation expense resulting in an additional $45.5 million in operating cash flows in fiscal 2015 as compared to fiscal 2014 and an increase of $2.8 million in cash received as construction allowances from landlords in fiscal 2015 as compared to fiscal 2014, and changes in operating assets and liabilities related to normal fluctuations in the timing of cash collections and cash requirements which provided an additional $23.0 million in cash in fiscal 2015 as compared to fiscal 2014.
Net cash provided by operating activities was $104.8 million for fiscal 2014 compared to $103.4 million for fiscal 2013. The $1.4 million increase in cash flows from operating activities as compared to the prior year period was primarily due to changes in operating assets and liabilities related to normal fluctuations in the timing of cash collections and cash requirements which used an additional $4.7 million in cash. Although net income decreased by $8.6 million in fiscal 2014 compared to fiscal 2013, the add-back of non-cash charges such as depreciation expense resulted in an additional $14.7 million increase resulting in a net increase to cash of $6.1 million.
Investing cash flows.
Net cash used in investing activities was $128.2 million for fiscal 2015 compared to net cash used of $646.4 million fiscal 2014. The $518.2 million decrease was primarily due to a $563.0 million decrease in cash used for acquisitions during fiscal 2015 and $5.8 million in cash received from the sales of property and equipment in fiscal 2015.
45
In addition, capital expenditures increased $50.6 million primarily due to new store openings and the rebranding of previously acquired stores. We opened 310 new stores during fiscal 2015, compared to 232 new stores in fiscal 2014.
Net cash used in investing activities was $646.4 million for fiscal 2014 compared to net cash used of $64.4 million fiscal 2013. The $582.0 million increase was primarily due to a $557.7 million increase in cash used for acquisitions during fiscal 2014. In addition, capital expenditures increased $24.3 million primarily due to new store openings. We opened 232 new stores during fiscal 2014, compared to 154 new stores in fiscal 2013.
Financing cash flows.
Net cash used in financing activities was $79.8 million for fiscal 2015 compared to net cash provided of $532.2 million for fiscal 2014. The $612.0 million decrease in cash provided by financing activities was primarily the result of net decreased borrowings of $617.3 million which were used to finance fiscal 2014 acquisitions, a decrease of $2.8 million of cash provided by the exercise of common stock options, a $1.8 million decrease of cash provided by the excess tax benefits associated with stock-based awards, and an increase of $0.3 million of cash used for the purchase of vested stock-based awards, partially offset by decreased debt issuance costs incurred in fiscal 2014 of $10.2 million related to the Senior Credit Facility.
Net cash provided by financing activities was $532.2 million for fiscal 2014 compared to net cash used of $30.7 million for fiscal 2013. The $562.9 million increase in cash provided by financing activities was primarily the result of net increased borrowings of $569.7 million which were used to finance acquisitions, an increase of $1.8 million of cash provided by the exercise of common stock options, and a $2.2 million increase of cash provided by the excess tax benefits associated with stock-based awards, partially offset by debt issuance costs of $10.2 million related to the Senior Credit Facility and an increase of $0.6 million of cash used for the purchase of vested stock-based awards.
Sources of Liquidity and Capital Requirements
Our primary uses of cash are to fund growth capital and maintenance expenditures for our stores and distribution centers, purchases and replacement of floor sample inventories maintained in our stores, scheduled debt service payments and strategic acquisitions of mattress specialty retailers. Historically, we have satisfied these cash requirements from cash flows provided by our operations and availability under the revolving portion of the Senior Credit Facility.
Typically, we collect payment from our customers at or near the time of sale, and, as such, we do not carry significant accounts receivable balances from our customers. Many of our suppliers deliver product to our distribution centers within 48 hours following our placement of a purchase order, which allows us to carry lower inventory levels. We pay the majority of our vendors for our purchases on terms that, on average, allow us to collect payments on the sale of our products before we must pay our vendors. The attributes of our operating cycle lower our working capital requirements and have historically allowed us to operate for extended periods while maintaining a negative working capital position.
Our future capital requirements will vary based on the number of additional stores, including relocated stores, we open and the number of stores we choose to renovate, and the number and size of any acquisitions we choose to make, including franchisee acquisitions. Our decisions regarding opening, relocating or renovating stores, and whether to engage in strategic acquisitions, are based in part on macroeconomic factors and the general state of the U.S. economy, as well as the local economies in the markets in which our stores are located.
We plan to spend approximately $130.0 million in gross capital expenditures during fiscal 2016, including estimated costs related to the recent Sleepy’s acquisition, partially offset by an estimated $10.0 million of construction allowances from landlords.
We believe that we will be able to satisfy our capital requirements for the next twelve months, including supporting our existing operations, continuing our growth strategy, and satisfying our scheduled debt service payments, through a combination of our existing reserves of cash and cash equivalents, internally generated cash flows from operations, and, as required, revolving and incremental term loan borrowings under the Senior Credit Facility. The
46
revolving portion of the Senior Credit Facility permits aggregate borrowings of up to $200 million, and contains within the facility, a letter of credit facility that, at any time outstanding, is limited to $60 million and a swing line facility that, at any time outstanding, is limited to $30 million. There were no outstanding borrowings and $4.2 million in outstanding standby letters of credit under the revolving facility as of February 2, 2016, resulting in $97.6 million of available borrowings as of such date. There were approximately $80 million in borrowings and $12.4 million in outstanding standby letters of credit under the amended revolving facility as of March 18, 2016, resulting in $68 million of available borrowings. Total term loan borrowings were approximately $1.4 billion as of March 18, 2016. The maturity date of the revolving credit facility is February 5, 2021. In addition, we had $1.8 million of cash and cash equivalents as of February 2, 2016.
Debt Service
As of February 2, 2016, we had total indebtedness of $690.9 million. The components of our debt as of February 2, 2016 were as follows (in thousands):
|
|
|
|
|
|
|
Senior Credit Facility |
|
$ |
685,113 |
|
|
Other |
|
|
5,808 |
|
|
Total long term debt |
|
$ |
690,921 |
|
Senior Credit Facility— Effective October 20, 2014, Mattress Holding Corp. (“MHC”), a Delaware corporation and indirect subsidiary of Mattress Firm Holding Corp., entered into a $125 million asset-backed loan credit agreement dated October 20, 2014, among MHC, as borrower, Mattress Holdco, Inc., the lenders party thereto, and Barclays Bank PLC, as administrative agent, collateral agent and issuer (the “ABL Credit Agreement”). Effective February 5, 2016, MHC entered into Amendment No. 1 to the ABL Credit Agreement, which amended the ABL Credit Agreement to, among other things, increase the available revolving credit commitments thereunder by $75.0 million to $200 million.
The ABL Credit Agreement is a committed senior revolving credit facility, secured by the assets of the borrower and the guarantors, that permits aggregate borrowings of up to $200 million, and contains within the facility, a letter of credit facility that, at any time outstanding, is limited to $60 million and a swing line facility that, at any time outstanding, is limited to $20 million. Subject to customary conditions, the Company may request that the lenders’ aggregate commitments with respect to the revolving credit facility be increased by up to $50 million. The maturity date under the ABL Credit Agreement is February 5, 2021.
Loans under the ABL Credit Agreement bear interest by reference, at MHC’s election, to the LIBOR rate or base rate, provided, that swing line loans bear interest by reference only to the base rate. Prior to the effectiveness of the amendment, the applicable margin on LIBOR rate loans varied from 1.25% to 1.75% and the applicable margin on base rate loans varied from 0.25% to 0.75%. Effective as of February 5, 2016, the applicable margin for LIBOR rate loans varies from 1.25% to 1.50% and the applicable margin for base rate loans varies from 0.25% to 0.50%. The interest rate for loans under the ABL Credit Agreement, whether tied to LIBOR or the base rate, is determined based upon the Company’s average excess available borrowing capacity for the prior three month period. A letter of credit issuance fee is payable by the Company equal to 0.125% per annum multiplied by the average daily amount available to be drawn under the applicable letter of credit, as well as an additional fee equal to the applicable margin for LIBOR rate loans times the daily amount available to be drawn under all outstanding letters of credit. The commitment fee rate payable to the lenders for each of the revolving facility and term facility varied from 0.25% to 0.375% per annum prior to the effectiveness of the amendment and is now, effective as of February 5, 2016, equal to 0.25% per annum.
Mattress Holdco, Inc., the parent company of the borrower, and each domestic subsidiary of MHC other than immaterial subsidiaries, as determined by certain ratios in the credit agreement, has unconditionally guaranteed all existing and future indebtedness and liabilities of the other guarantors and the Company arising under the ABL Credit Agreement and other loan documents. As wholly-owned, domestic subsidiaries of MHC, Sleepy’s LLC and certain of its related entities are now guarantors under the ABL Credit Agreement.
The ABL Credit Agreement requires compliance with one financial covenant. The Company cannot permit its fixed charge coverage ratio to fall below 1.0. The ABL Credit Agreement generally defines the fixed charge coverage
47
ratio as the ratio of (a) adjusted EBITDA, less capital expenditures, less all taxes paid or payable in cash by the borrower and guarantors to (b) the sum of fixed charges, in each case, determined as of the most recently ended four fiscal quarter period. As of February 2, 2016, the fixed charge coverage ratio was 3.05 to 1.0. The ABL Credit Agreement also contains customary representations, warranties and affirmative and negative covenants.
Events of default under the ABL Credit Agreement include failure to pay principal or interest when due, failure to comply with the financial and operational covenants, as well as a cross default event, Loan Document (as defined in the ABL Credit Agreement) enforceability event, change of control event and bankruptcy and other insolvency events. If an event of default occurs and is continuing, then the lenders holding the majority of the outstanding loans have the right, among others, to (i) terminate the commitments under the ABL Credit Agreement, (ii) accelerate and require the Company to repay all the outstanding amounts owed under any Loan Document (provided that in limited circumstances with respect to insolvency and bankruptcy of the Company, such acceleration is automatic), and (iii) require the Company to cash collateralize any outstanding letters of credit.
There were no outstanding ABL Credit Agreement borrowings at February 2, 2016. Outstanding letters of credit on the revolving facility were $4.2 million at February 2, 2016, resulting in $97.6 million of availability for revolving borrowings.
Effective October 20, 2014, MHC entered into a $720 million term loan credit agreement dated October 20, 2014, among MHC, as borrower, Mattress Holdco, Inc., the lenders party thereto, and Barclays Bank PLC, as administrative agent and collateral agent (the “Term Loan Credit Agreement”). Effective February 5, 2016, MHC entered into Amendment No. 1 to the Term Loan Credit Agreement, which amended the Term Loan Credit Agreement to, among other things, add a $665.0 million incremental term loan facility thereunder. The Term Loan Credit Agreement and the ABL Credit Agreement, each as amended, are collectively referred to as the “Senior Credit Facility”.
Term loans in the aggregate principal amount of $720 million and $665 million were issued under the Term Loan Credit Agreement on October 20, 2014 and February 5, 2016, respectively. The maturity date under the Term Loan Credit Agreement is October 20, 2021. Loans under the Term Loan Credit Agreement bear interest by reference, at MHC’s election, to (i) the LIBOR rate, which prior to the amendment varied from 4.00% to 4.25% and which now, effective as of February 5, 2016, is 5.25%%, or (ii) the base rate, which prior to the amendment varied from 3.00% to 3.25%, and which now, effective as of February 5, 2016, is 4.25%. The interest rate for loans under the Term Loan Credit Agreement, whether tied to LIBOR or the base rate, is determined based upon the Company’s total net leverage ratio. The weighted average interest rate applicable to outstanding borrowings under the Term Loan Credit Agreement was 5.00% as of February 2, 2016.
Mattress Holdco, Inc., the parent company of the borrower, and each domestic subsidiary of MHC other than immaterial subsidiaries, as determined by certain ratios in the Term Loan Credit Agreement, has unconditionally guaranteed all existing and future indebtedness and liabilities of the other guarantors and MHC arising under the Term Loan Credit Agreement and other loan documents. As wholly-owned, domestic subsidiaries of MHC, Sleepy’s LLC and certain of its related entities are now guarantors under the Term Loan Credit Agreement. Effective as of February 5, 2016, the Term Loan Credit Agreement requires compliance with one financial covenant. Commencing with the fiscal quarter ending as of July 31, 2016, MHC must not exceed a total net leverage ratio subject to specified stepdowns. The Term Loan Credit Agreement generally defines the total net leverage coverage ratio as the ratio of (a) consolidated net debt to (b) adjusted EBITDA of MHC, in each case, determined as of the last day of the four fiscal quarter period ending on such test date. The Term Loan Credit Agreement contains customary representations, warranties and affirmative and negative covenants.
Events of default under the Term Loan Credit Agreement include failure to pay principal or interest when due, failure to comply with the covenants, as well as a cross default event, Loan Document (as defined in the Term Loan Credit Agreement) enforceability event, change of control event and bankruptcy and other insolvency events. If an event of default occurs and is continuing, then the lenders holding a majority of the outstanding loans have the right, among others, to (i) terminate the commitments under the Term Loan Credit Agreement, and (ii) accelerate and require the Company to repay all the outstanding amounts owed under any Loan Document (provided that in limited circumstances with respect to insolvency and bankruptcy of the Company, such acceleration is automatic).
Other Indebtedness—A subsidiary of the Company has outstanding notes payable related to the purchase of
48
mattress specialty retail stores formerly operated by Mattress Liquidators, in the aggregate principal amount of $0.7 million that bears interest at 6.00% with quarterly principal and interest payments through fiscal 2016.
In conjunction with the acquisition of The Sleep Train, Inc., the Company assumed notes payable in the aggregate principal amount of $4.0 million that primarily bear interest at 2.97% with monthly principal and interest payments through fiscal 2027.
Covenant Compliance
We were in compliance with all of the financial covenants required under the Senior Credit Facility and our other indebtedness as of February 2, 2016. We believe that we will be able to maintain compliance with the various covenants required under our debt agreements for the next twelve months without amending any of the debt agreements or requesting waivers from the lenders that are party to the debt agreements.
Critical Accounting Policies and Use of Estimates
Our consolidated financial statements are prepared in accordance with U.S. GAAP. In connection with the preparation of our financial statements, we are required to make assumptions and estimates about future events, and apply judgments that affect the reported amounts of assets, liabilities, revenues, expenses and the related disclosures. We base our assumptions, estimates and judgments on historical experience, current trends and other factors that management believes to be relevant at the time our consolidated financial statements are prepared. On a regular basis, we review the accounting policies, assumptions, estimates and judgments to ensure that our financial statements are presented fairly and in accordance with U.S. GAAP. However, because future events and their effects cannot be determined with certainty, actual results could differ from our assumptions and estimates, and such differences could be material.
Our significant accounting policies are discussed in Note 1, Business and Summary of Significant Accounting Policies, of the Notes to Consolidated Financial Statements, included elsewhere in this Annual Report on Form 10‑K. We believe that the following accounting estimates are the most critical to aid in fully understanding and evaluating our reported financial results, and they require our most difficult subjective or complex judgments, resulting from the need to make estimates about the effect of matters that are inherently uncertain. We have reviewed these critical accounting estimates and related disclosures with the audit committee of our board of directors.
49
|
Description |
|
|
Judgments and Uncertainties |
|
|
Effect if Actual Results Differ From Assumptions |
|
Revenue Recognition |
|
|
|
|
|
|
|
Sales revenue, including fees collected for delivery services, is recognized upon delivery and acceptance of mattresses and bedding products by the Company’s customers and is recorded net of returns. Customer deposits collected prior to the delivery of merchandise are recorded as a liability. |
|
|
Our revenue recognition accounting methodology contains uncertainties in that management is required to make assumptions and to apply judgment to estimate future sales returns and exchanges and the associated costs. |
|
|
We have not made any material changes in the policy we use to measure the estimated liability for sales returns and exchanges. The Happiness Guarantee® has resulted in an increase in such costs and we will review and revise our estimates as additional experience is obtained. However, if actual results are not consistent with our estimates or assumptions, we may be exposed to losses or gains that could be material. |
50
|
Description |
|
|
Judgments and Uncertainties |
|
|
Effect if Actual Results Differ From Assumptions |
|
Vendor Incentives |
|
|
|
|
|
|
|
Cash payments received from vendors as incentives to enter into or to maintain long‑term supply arrangements, including payments received in connection with the opening of new stores and volume‑based incentives requiring minimum purchase volumes during the term of the supply agreement, are deferred and amortized as a reduction of cost of sales using a systematic approach. Vendor incentives that are based on a percentage of the cost of purchased merchandise, such as cooperative advertising funds, are accounted for as a reduction of the price of the vendor’s products and result in a reduction of cost of sales when the merchandise is sold. Vendor incentives that are direct reimbursements of costs incurred by the Company to sell the vendor’s products are accounted for as a reduction of the related costs when recognized in the Company’s results of operations.
|
|
|
Certain of our vendor agreements contain purchase volume incentives that require minimum purchase volumes and may provide for increased incentives when graduated purchase volumes are met. Amounts accrued as vendor receivables throughout the year could be impacted if actual purchase volumes differ from projected annual purchase volumes. |
|
|
We have not made any material changes in the policy we use to recognize vendor receivables during the past three fiscal years.
If actual results are not consistent with the assumptions and estimates used, we may be exposed to additional adjustments that could materially, either positively or negatively, impact our gross profit and inventory valuation. However, substantially all receivables associated with these activities are collected within the following fiscal year and all amounts deferred against inventory turnover within the following fiscal year are realized. As a result, subjective long‑term estimates are not required. Adjustments to our gross profit and inventory in the following fiscal year have historically not been material. |
|
The Company receives cash funds from certain vendors upon the opening of a new store (“new store funds”) if the opening results in an increase in the total number of stores in operation. Under the current supply arrangements, the Company is not required to purchase a stated amount of products for an individual store or in total as a condition to receipt of the new store funds, although it is obligated to repay a portion of new store funds if a new store is subsequently closed, if the Company ceases to sell the supplier’s products in the new store or if a supply arrangement is terminated early. The Company classifies new store funds as a noncurrent liability and recognizes a pro‑rata reduction of cost of sales in the results of operations over 36 months, which is the period that most closely aligns with the terms of the Company’s supply agreements regarding the manner in which new store funds are earned. |
|
|
|
|
|
|
51
|
Description |
|
|
Judgments and Uncertainties |
|
|
Effect if Actual Results Differ From Assumptions |
|
Self‑Insured Liabilities |
|
|
|
|
|
|
|
We are self‑insured for certain losses related to employee health and workers’ compensation liability claims. However, we obtain third‑party insurance coverage to limit our exposure to these claims.
|
|
|
Our self‑insurance liabilities contain uncertainties because management is required to make assumptions and to apply judgment to estimate the ultimate cost to settle reported claims and claims incurred but not reported at the balance sheet date. |
|
|
We have not made any material changes in the policy we use to establish our self‑insured liabilities during the past three fiscal years. During 2015, the Company began participating in a captive insurance program with regard to workers’ compensation liability claims. Although still a self-insurance program, the captive does provide a level of risk sharing among the members of the captive. This program does not, however, materially impact the assumptions used in establishing required self-insured liabilities. |
|
Goodwill and Indefinite‑Lived Intangible Assets |
|
|
|
|
|
|
|
We evaluate goodwill and indefinite‑lived intangible assets for impairment annually or whenever events or changes in circumstances indicate the carrying value of the goodwill or indefinite‑lived intangible assets may not be recoverable. Prior to Fiscal 2015, the annual impairment test was performed as of fiscal year-end, however, beginning in Fiscal 2015, this test was performed as of the first day of the fourth quarter. |
|
|
The impairment test for goodwill is performed for each reporting unit. A reporting unit is defined as an operating segment or one level below a segment, a component. We manage our company‑operated stores on a geographic basis. Our operating segments consist of each of our geographic regions of company‑operated stores (“regions”), e‑commerce sales, multi‑channel sales representing our special events operations and the franchise business. Geographic territory components comprise each of the company‑operated store regions and are aggregated within each region as all territory components possess similar economic characteristics. The e‑commerce, multi‑channel sales and franchise operating segments have no lower level components and each of these operating segments is a reporting unit. All of our goodwill is assigned to our region and e‑commerce reporting units. The method of assigning goodwill to reporting units is applied in a consistent manner and may involve estimates and assumptions. |
|
|
As we test goodwill impairment at the reporting unit level, we may be required to incur goodwill impairment charges based on adverse changes affecting a particular reporting unit, regardless of overall performance. Such impairment charges may have a material adverse effect on our results of operations. |
52
|
Description |
|
|
Judgments and Uncertainties |
|
|
Effect if Actual Results Differ From Assumptions |
||||
|
We assign the carrying value of these intangible assets to their “reporting units” and apply the impairment test at the reporting unit level. We complete our impairment evaluation by performing internal valuation analyses, considering other publicly available market information and using an independent valuation firm, as appropriate.
The impairment test for indefinite‑lived assets consists of a comparison of the fair value of the asset with its carrying amount. If the carrying amount of an intangible asset exceeds its fair value, an impairment loss is recognized in an amount equal to that excess. After an impairment loss is recognized, the adjusted carrying amount of the asset establishes the new accounting basis.
|
|
|
In the quantitative evaluation of goodwill impairment, we determine fair value for each of these reporting units by using widely accepted valuation techniques, including the income approach and the market approach. These types of valuation techniques contain uncertainties because they require management to make assumptions and to apply judgment to estimate industry economic factors and the profitability of future business strategies. It is our policy to conduct impairment testing based on our current business strategy in light of present industry and economic conditions, as well as our future expectations.
In the qualitative assessment of goodwill impairment, events and circumstances reviewed include slowed growth rates or declines in sales, adverse changes in legal factors or the business climate, movements in the stock price or market capitalization, unanticipated competition, or general changes in consumer buying behavior. |
|
|
The fair values of two of our three reporting units were substantially in excess of the assigned carrying values in the most recent impairment test performed as of the first day of the fourth quarter of fiscal 2015. For the one reporting unit, which holds $43.0 million carrying value of goodwill, or 5.2% of total goodwill, the fair value exceeded the carrying value by 12.7%. |
||||
53
|
Description |
|
|
Judgments and Uncertainties |
|
|
Effect if Actual Results Differ From Assumptions |
|||||
|
|
|
|
|
|
|
|
|||||
|
Long-Lived Assets
Long‑lived assets are evaluated for impairment whenever events or changes in circumstances indicate that the carrying value may not be recoverable. Our investment in store leasehold improvements, including fixtures and equipment, is the most significant long‑lived asset.
|
|
|
The impairment review of long‑lived assets related to stores is evaluated at the individual store level. The results of individual stores may deteriorate based on factors outside the control of the Company, such as the proximity of competitors, shifting retail trade area demographics and other macro‑economic factors. |
|
|
We have not made any material changes in the policy we use to assess impairment losses during the past three fiscal years. |
|||||
|
Costs Associated With Location Closings |
|
|
|
|
|
|
|||||
|
We lease the vast majority of our stores and other locations under long‑term leases and we occasionally vacate locations prior to the expiration of the related lease. For vacated locations that are under long‑term leases, we record an expense for the difference between our future lease payments and related costs (e.g., real estate taxes and common area maintenance) from the date of closure through the end of the remaining lease term, net of expected future sublease rental income. |
|
|
The liability recorded for location closures contains uncertainties because management is required to make assumptions and to apply judgment to estimate the duration of future vacancy periods, the amount and timing of future settlement payments, and the amount and timing of potential sublease rental income. When making these assumptions, management considers a number of factors, including the historical settlement experience, the owner of the property, the location and condition of the property, the terms of the underlying lease, the specific marketplace demand and general economic conditions. |
|
|
We have not made any material changes in the policy we use to establish our location closing liability during the past three fiscal years.
A 10% change in our location closing liability at February 2, 2016, would have affected net income by less than $0.1 million in fiscal 2015. |
|||||
|
Our estimate of future cash flows is based on historical experience; our analysis of the specific real estate market, including input from independent real estate firms; and economic conditions that can be difficult to predict. We do not discount cash flows in estimating the liability recorded for location closures. |
|
|
|
|
|
|
|||||
54
|
Description |
|
|
Judgments and Uncertainties |
|
|
Effect if Actual Results Differ From Assumptions |
|
Acquisitions – Purchase Price Allocation In accordance with accounting for business acquisitions, we allocate the purchase price of an acquired business to its identifiable assets and liabilities based on estimated fair values. The excess of the purchase price over the amount allocated to the assets and liabilities, if any, is recorded to goodwill, which is assigned to reporting units. |
|
|
Our purchase price allocation methodology contains uncertainties because it requires management to make assumptions and to apply judgment to estimate the fair value of acquired assets and liabilities.
|
|
|
We do not believe there is a reasonable likelihood that there will be a material change in the future estimates or assumptions we use to complete the purchase price allocation and estimate the fair values of acquired assets and liabilities for those acquisitions completed in fiscal 2013, fiscal 2014 and fiscal 2015. However, if actual results are not consistent with our estimates or assumptions, we may be exposed to losses or gains that could be material. |
55
|
Description |
|
|
Judgments and Uncertainties |
|
|
Effect if Actual Results Differ From Assumptions |
|
Product Warranties |
|
|
|
|
|
|
|
Pursuant to certain of our negotiated supply agreements we are responsible for manufacturer service warranties and any extended warranties we may offer. The customer is not charged a fee for warranty coverage. |
|
|
In estimating the liability for product warranties, we consider the impact of recoverable salvage value on the product received back under warranty. Based upon our historical warranty claims experience, as well as recent trends that might suggest that past experience may differ from future claims, we periodically review and adjust, if necessary, the liability for product warranties. |
|
|
If our actual claims during the period are materially different than our provision for warranty claims, our results could be materially and adversely affected. |
|
|
|
|
|
|
|
|
|
Income Taxes |
|
|
|
|
|
|
|
Our income tax expense is based on our income, statutory tax rates, and tax planning opportunities available in the various jurisdictions in which we operate.
The Company adopted Accounting Standards Update 2015-17, Income Taxes (Topic 740): Balance Sheet Classification of Deferred Taxes which requires that all deferred tax assets and liabilities, along with any related valuation allowance, be classified as noncurrent in the balance sheet. As such, the amounts previously reported as current deferred tax assets were decreased and amounts previously reported as noncurrent deferred tax liabilities were decreased.
|
|
|
Tax laws are complex and subject to different interpretations by the taxpayer and respective governmental tax authorities. Significant judgment is required in determining our income tax expense and in evaluating our tax position, including evaluating uncertainties. Management reviews tax positions at least quarterly and adjusts the balances as new information becomes available. |
|
|
We performed an analysis of all available evidence, both positive and negative, consistent with provision of ASC 740‑10‑30‑17 “Establishment of a Valuation Allowance for Deferred Tax Assets”. As of February 2, 2016 we determined that it was more likely than not that the deferred tax assets would be realized. |
56
|
Description |
|
|
Judgments and Uncertainties |
|
|
Effect if Actual Results Differ From Assumptions |
|
Stock‑Based Compensation |
|
|
|
|
|
|
|
For all stock‑based awards, we measure compensation cost at fair value on the date of grant and recognize compensation expense over the service period in which the awards are expected to vest. |
|
|
The Company estimates the fair value of stock awards granted pursuant to the Omnibus Plan based upon the nature of the awards. Stock options that vest based upon the passage of time are valued using a Black‑Scholes option pricing model, which utilizes assumptions for risk‑free interest rate, dividend yield, stock price volatility and weighted average expected term. Restricted stock awards that vest based upon the passage of time are valued using the closing market price per share on the date of grant. Stock options and restricted stock awards that include additional market vesting conditions are valued using a Monte Carlo Simulation approach, which utilizes similar input assumptions as the Black‑Scholes option pricing model, plus a suboptimal exercise factor. The assumptions involving stock price volatility and stock option term are subject to a higher degree of uncertainty due to the limited period of time that the Company’s equity shares have been publicly traded and limited experience with stock option awards. The Company has utilized data of publicly‑traded peer companies to provide a reasonable basis for such assumptions and has applied the simplified method as permitted by SAB 107 and SAB 110 in determining the stock option term. |
|
|
We have not made any material changes in the policy we use to estimate the fair value of stock‑based awards and the period over which compensation expense is recognized. However, if actual results are not consistent with our estimates or assumptions, we may be exposed to changes in stock‑based compensation expense that could be material. |
57
Summary Disclosures about Contractual Obligations and Commercial Commitments
The following summarizes certain of our contractual obligations at February 2, 2016 and the effect such obligations are expected to have on our liquidity and cash flows in future periods (in thousands):
|
|
|
|
|
|
|
|
|
|
|
|
|
|
|
|
|
|
|
|
|
|
|
|
|
|
|
Payments Due by Period |
|
|||||||||||||||||||
|
|
|
Fiscal |
|
Fiscal |
|
Fiscal |
|
Fiscal |
|
Fiscal |
|
|
|
|
|
|
|
|||||
|
|
|
2016 |
|
2017 |
|
2018 |
|
2019 |
|
2020 |
|
Thereafter |
|
Total |
|
|||||||
|
Long‑term debt, including principal and interest(1) |
|
$ |
53,458 |
|
$ |
50,797 |
|
$ |
50,379 |
|
$ |
49,962 |
|
$ |
49,545 |
|
$ |
698,772 |
|
$ |
952,912 |
|
|
Operating leases(2) |
|
|
293,664 |
|
|
261,750 |
|
|
225,375 |
|
|
193,360 |
|
|
169,502 |
|
|
569,520 |
|
|
1,713,171 |
|
|
Operating contracts(3) |
|
|
3,837 |
|
|
3,446 |
|
|
2,138 |
|
|
1,193 |
|
|
— |
|
|
— |
|
|
10,614 |
|
|
Letters of credit(4) |
|
|
25 |
|
|
125 |
|
|
— |
|
|
— |
|
|
— |
|
|
— |
|
|
150 |
|
|
Total |
|
$ |
350,984 |
|
$ |
316,118 |
|
$ |
277,892 |
|
$ |
244,515 |
|
$ |
219,047 |
|
$ |
1,268,292 |
|
$ |
2,676,847 |
|
|
(1) |
Future contractual obligations on the Senior Credit Facility reflect the Company’s current interest rate, which is based on a 1.0% LIBOR rate plus 5.25% on the Term Loan. |
|
(2) |
Does not include certain other expenses required to be paid by the Company under such operating leases, comprised primarily of the Company’s proportionate share of common area maintenance, property taxes and insurance. These other expenses have typically amounted to approximately 25% of the base rent expense during recent fiscal years. |
|
(3) |
We have certain operating contracts related to sponsorships and space rentals at special event venues. |
|
(4) |
We have outstanding letters of credit at February 2, 2016, which expire at varying times through 2017, including $4.0 million that are subject to automatic renewal for an additional one‑year period on the anniversary date of the agreement, unless we receive notice from the counterparty that the letter of credit agreement has been terminated at least 30 to 60 days prior to the automatic renewal date. |
Off‑Balance Sheet Arrangements
We do not have any “off‑balance sheet arrangements” (as such term is defined in Item 303 of Regulation S‑K), other than the operating leases, operating contracts and letters of credit shown above in the Contractual Obligations and Commercial Commitments table, that are reasonably likely to have a current or future effect on our financial condition, changes in financial condition, revenues or expenses, results of operations, liquidity, capital expenditures or capital resources.
Item 7A. Quantitative and Qualitative Disclosures About Market Risk
Interest Rate Risk. Our earnings are affected by changes in interest rates due to the impact those changes have on our interest expense on borrowings under the Senior Credit Facility with interest rates that vary in direct relationship to changes in the prime interest rate or LIBOR. Our floating rate indebtedness was approximately $685.1 million at February 2, 2016. If short‑term floating interest rates increased by 100 basis points during the prior twelve months, our interest expense would have increased by approximately $7.2 million during that year. This amount is determined by considering the impact of the hypothetical change in interest rates on our average amount of floating rate indebtedness outstanding for fiscal 2015.
58
Item 8. Financial Statements and Supplementary Data
INDEX TO CONSOLIDATED FINANCIAL STATEMENTS
| 60 | |
| 62 | |
| 63 | |
| 64 | |
| 65 | |
| 66 | |
| 106 |
59
REPORT OF INDEPENDENT REGISTERED PUBLIC ACCOUNTING FIRM
To the Board of Directors and Stockholders of
Mattress Firm Holding Corp.
Houston, Texas
We have audited the accompanying consolidated balance sheets of Mattress Firm Holding Corp. and subsidiaries (the "Company") as of February 2, 2016 and February 3, 2015, and the related consolidated statements of operations, stockholders' equity, and cash flows for each of the three years ended February 2, 2016, February 3, 2015 and January 28, 2014. Our audits also included the financial statement schedules listed in the Index at Item 15. These financial statements and financial statement schedules are the responsibility of the Company's management. Our responsibility is to express an opinion on the financial statements and financial statement schedules based on our audits.
We conducted our audits in accordance with the standards of the Public Company Accounting Oversight Board (United States). Those standards require that we plan and perform the audit to obtain reasonable assurance about whether the financial statements are free of material misstatement. An audit includes examining, on a test basis, evidence supporting the amounts and disclosures in the financial statements. An audit also includes assessing the accounting principles used and significant estimates made by management, as well as evaluating the overall financial statement presentation. We believe that our audits provide a reasonable basis for our opinion.
In our opinion, such consolidated financial statements present fairly, in all material respects, the financial position of Mattress Firm Holding Corp. and subsidiaries as of February 2, 2016 and February 3, 2015, and the results of their operations and their cash flows for each of the three years in the periods ended February 2, 2016, February 3, 2015 and January 28, 2014, in conformity with accounting principles generally accepted in the United States of America. Also, in our opinion, such financial statement schedules, when considered in relation to the basic consolidated financial statements taken as a whole, present fairly, in all material respects, the information set forth therein.
As discussed in Note 1 to the consolidated financial statements, the Company changed its method of accounting for inventory from the First-In, First-Out cost flow method to the Weighted Average cost flow method.
We have also audited, in accordance with the standards of the Public Company Accounting Oversight Board (United States), the Company's internal control over financial reporting as of February 2, 2016, based on the criteria established in Internal Control — Integrated Framework (2013) issued by the Committee of Sponsoring Organizations of the Treadway Commission and our report dated April 4, 2016 expressed an unqualified opinion on the Company's internal control over financial reporting.
/s/ DELOITTE & TOUCHE LLP
April 4, 2016
Houston, Texas
60
REPORT OF INDEPENDENT REGISTERED PUBLIC ACCOUNTING FIRM
To the Board of Directors and Stockholders of
Mattress Firm Holding Corp.
Houston, Texas
We have audited the internal control over financial reporting of Mattress Firm Holding Corp. and subsidiaries (the "Company") as of February 2, 2016, based on criteria established in Internal Control — Integrated Framework (2013) issued by the Committee of Sponsoring Organizations of the Treadway Commission. The Company's management is responsible for maintaining effective internal control over financial reporting and for its assessment of the effectiveness of internal control over financial reporting, included in the accompanying Management’s Report on Internal Control over Financial Reporting. Our responsibility is to express an opinion on the Company's internal control over financial reporting based on our audit.
We conducted our audit in accordance with the standards of the Public Company Accounting Oversight Board (United States). Those standards require that we plan and perform the audit to obtain reasonable assurance about whether effective internal control over financial reporting was maintained in all material respects. Our audit included obtaining an understanding of internal control over financial reporting, assessing the risk that a material weakness exists, testing and evaluating the design and operating effectiveness of internal control based on the assessed risk, and performing such other procedures as we considered necessary in the circumstances. We believe that our audit provides a reasonable basis for our opinion.
A company's internal control over financial reporting is a process designed by, or under the supervision of, the company's principal executive and principal financial officers, or persons performing similar functions, and effected by the company's board of directors, management, and other personnel to provide reasonable assurance regarding the reliability of financial reporting and the preparation of financial statements for external purposes in accordance with generally accepted accounting principles. A company's internal control over financial reporting includes those policies and procedures that (1) pertain to the maintenance of records that, in reasonable detail, accurately and fairly reflect the transactions and dispositions of the assets of the company; (2) provide reasonable assurance that transactions are recorded as necessary to permit preparation of financial statements in accordance with generally accepted accounting principles, and that receipts and expenditures of the company are being made only in accordance with authorizations of management and directors of the company; and (3) provide reasonable assurance regarding prevention or timely detection of unauthorized acquisition, use, or disposition of the company's assets that could have a material effect on the financial statements.
Because of the inherent limitations of internal control over financial reporting, including the possibility of collusion or improper management override of controls, material misstatements due to error or fraud may not be prevented or detected on a timely basis. Also, projections of any evaluation of the effectiveness of the internal control over financial reporting to future periods are subject to the risk that the controls may become inadequate because of changes in conditions, or that the degree of compliance with the policies or procedures may deteriorate.
In our opinion, the Company maintained, in all material respects, effective internal control over financial reporting as of February 2, 2016, based on the criteria established in Internal Control — Integrated Framework (2013) issued by the Committee of Sponsoring Organizations of the Treadway Commission.
We have also audited, in accordance with the standards of the Public Company Accounting Oversight Board (United States), the consolidated financial statements and financial statement schedules as of and for the year ended February 2, 2016 of the Company and our report dated April 4, 2016 expressed an unqualified opinion on those financial statements and financial statement schedules and included an explanatory paragraph regarding the Company’s adoption of a change in accounting for inventory from the First-In, First-Out cost flow method to the Weighted Average cost flow method.
/s/ DELOITTE & TOUCHE LLP
April 4, 2016
Houston, Texas
61
MATTRESS FIRM HOLDING CORP.
|
|
|
February 3, |
|
February 2, |
|
||
|
|
|
2015 |
|
2016 |
|
||
|
|
|
(in thousands, except share amounts) |
|
||||
|
Assets |
|
|
|
|
|
|
|
|
Current assets: |
|
|
|
|
|
|
|
|
Cash and cash equivalents |
|
$ |
13,475 |
|
$ |
1,778 |
|
|
Accounts receivable, net |
|
|
51,193 |
|
|
64,923 |
|
|
Inventories |
|
|
163,518 |
|
|
161,190 |
|
|
Prepaid expenses and other current assets |
|
|
43,019 |
|
|
55,176 |
|
|
Total current assets |
|
|
271,205 |
|
|
283,067 |
|
|
Property and equipment, net |
|
|
267,602 |
|
|
317,451 |
|
|
Intangible assets, net |
|
|
215,953 |
|
|
214,942 |
|
|
Goodwill |
|
|
821,349 |
|
|
826,728 |
|
|
Debt issue costs and other, net |
|
|
24,033 |
|
|
23,720 |
|
|
Total assets |
|
$ |
1,600,142 |
|
$ |
1,665,908 |
|
|
Liabilities and Stockholders’ Equity |
|
|
|
|
|
|
|
|
Current liabilities: |
|
|
|
|
|
|
|
|
Notes payable and current maturities of long-term debt |
|
$ |
9,947 |
|
$ |
8,664 |
|
|
Accounts payable |
|
|
149,612 |
|
|
164,686 |
|
|
Accrued liabilities |
|
|
98,250 |
|
|
83,869 |
|
|
Customer deposits |
|
|
19,398 |
|
|
20,028 |
|
|
Total current liabilities |
|
|
277,207 |
|
|
277,247 |
|
|
Long-term debt, net of current maturities |
|
|
760,091 |
|
|
682,257 |
|
|
Deferred income tax liability |
|
|
32,573 |
|
|
52,299 |
|
|
Other noncurrent liabilities |
|
|
94,788 |
|
|
142,623 |
|
|
Total liabilities |
|
|
1,164,659 |
|
|
1,154,426 |
|
|
|
|
|
|
|
|
|
|
|
Commitments and contingencies (Note 10) |
|
|
|
|
|
|
|
|
|
|
|
|
|
|
|
|
|
Stockholders’ equity: |
|
|
|
|
|
|
|
|
Common stock, $0.01 par value; 120,000,000 shares authorized; 35,134,187 and 35,101,632 shares issued and outstanding at February 3, 2015; and 35,356,859 and 35,294,568 shares issued and outstanding at February 2, 2016, respectively |
|
|
351 |
|
|
353 |
|
|
Additional paid-in capital |
|
|
435,882 |
|
|
447,357 |
|
|
(Accumulated deficit) retained earnings |
|
|
(750) |
|
|
63,772 |
|
|
Total stockholders’ equity |
|
|
435,483 |
|
|
511,482 |
|
|
Total liabilities and stockholders’ equity |
|
$ |
1,600,142 |
|
$ |
1,665,908 |
|
The accompanying notes are an integral part of these consolidated financial statements.
62
MATTRESS FIRM HOLDING CORP.
CONSOLIDATED STATEMENTS OF OPERATIONS
|
|
|
Fiscal |
|
Fiscal |
|
Fiscal |
|
|||
|
|
|
2013 |
|
2014 |
|
2015 |
|
|||
|
|
|
(in thousands, except share and per share amounts) |
|
|||||||
|
Net sales |
|
$ |
1,216,812 |
|
$ |
1,806,029 |
|
$ |
2,541,672 |
|
|
Cost of sales |
|
|
751,487 |
|
|
1,116,666 |
|
|
1,590,636 |
|
|
Gross profit from retail operations |
|
|
465,325 |
|
|
689,363 |
|
|
951,036 |
|
|
Franchise fees and royalty income |
|
|
5,617 |
|
|
4,584 |
|
|
5,232 |
|
|
Total gross profit |
|
|
470,942 |
|
|
693,947 |
|
|
956,268 |
|
|
Operating expenses: |
|
|
|
|
|
|
|
|
|
|
|
Sales and marketing expenses |
|
|
289,533 |
|
|
427,401 |
|
|
621,597 |
|
|
General and administrative expenses |
|
|
82,964 |
|
|
167,035 |
|
|
183,405 |
|
|
Loss on store closings and impairment of store assets |
|
|
1,499 |
|
|
1,813 |
|
|
7,524 |
|
|
Total operating expenses |
|
|
373,996 |
|
|
596,249 |
|
|
812,526 |
|
|
Income from operations |
|
|
96,946 |
|
|
97,698 |
|
|
143,742 |
|
|
Other expenses: |
|
|
|
|
|
|
|
|
|
|
|
Interest expense, net |
|
|
10,864 |
|
|
21,924 |
|
|
40,147 |
|
|
Loss from debt extinguishment |
|
|
— |
|
|
2,288 |
|
|
— |
|
|
Total other expenses |
|
|
10,864 |
|
|
24,212 |
|
|
40,147 |
|
|
Income before income taxes |
|
|
86,082 |
|
|
73,486 |
|
|
103,595 |
|
|
Income tax expense |
|
|
33,158 |
|
|
29,235 |
|
|
39,073 |
|
|
Net income |
|
$ |
52,924 |
|
$ |
44,251 |
|
$ |
64,522 |
|
|
|
|
|
|
|
|
|
|
|
|
|
|
Basic net income per common share |
|
$ |
1.56 |
|
$ |
1.29 |
|
$ |
1.83 |
|
|
Diluted net income per common share |
|
$ |
1.55 |
|
$ |
1.27 |
|
$ |
1.82 |
|
|
|
|
|
|
|
|
|
|
|
|
|
|
Basic weighted average shares outstanding |
|
|
33,870,461 |
|
|
34,389,282 |
|
|
35,212,124 |
|
|
Diluted weighted average shares outstanding |
|
|
34,131,456 |
|
|
34,811,076 |
|
|
35,540,357 |
|
The accompanying notes are an integral part of these consolidated financial statements.
63
MATTRESS FIRM HOLDING CORP.
CONSOLIDATED STATEMENTS OF STOCKHOLDERS’ EQUITY
|
|
|
|
|
|
|
|
|
|
|
(Accumulated |
|
|
|
||
|
|
|
|
|
|
|
|
Additional |
|
Deficit) |
|
Total |
|
|||
|
|
|
Common Stock |
|
Paid-In |
|
Retained |
|
Stockholders’ |
|
||||||
|
|
|
Shares |
|
Par Value |
|
Capital |
|
Earnings |
|
Equity |
|
||||
|
|
|
(in thousands, except share amounts) |
|
||||||||||||
|
Balances at January 29, 2013 |
|
33,795,630 |
|
$ |
338 |
|
$ |
365,083 |
|
$ |
(97,925) |
|
$ |
267,496 |
|
|
Exercise of common stock options |
|
158,563 |
|
|
2 |
|
|
3,025 |
|
|
— |
|
|
3,027 |
|
|
Excess tax benefits associated with stock ‑based awards |
|
— |
|
|
— |
|
|
692 |
|
|
— |
|
|
692 |
|
|
Vesting of restricted stock |
|
48,788 |
|
|
— |
|
|
— |
|
|
— |
|
|
— |
|
|
Purchase of vested stock ‑based awards |
|
(12,600) |
|
|
— |
|
|
(493) |
|
|
— |
|
|
(493) |
|
|
Stock ‑based compensation |
|
— |
|
|
— |
|
|
4,846 |
|
|
— |
|
|
4,846 |
|
|
Net income |
|
— |
|
|
— |
|
|
— |
|
|
52,924 |
|
|
52,924 |
|
|
Balances at January 28, 2014 |
|
33,990,381 |
|
|
340 |
|
|
373,153 |
|
|
(45,001) |
|
|
328,492 |
|
|
Sleep Experts equity consideration |
|
71,619 |
|
|
1 |
|
|
3,439 |
|
|
— |
|
|
3,440 |
|
|
Sleep Train equity consideration |
|
745,107 |
|
|
7 |
|
|
44,214 |
|
|
— |
|
|
44,221 |
|
|
Exercise of common stock options |
|
218,216 |
|
|
2 |
|
|
4,875 |
|
|
— |
|
|
4,877 |
|
|
Excess tax benefits associated with stock ‑based awards |
|
— |
|
|
— |
|
|
2,932 |
|
|
— |
|
|
2,932 |
|
|
Vesting of restricted stock |
|
96,264 |
|
|
1 |
|
|
— |
|
|
— |
|
|
1 |
|
|
Purchase of vested stock ‑based awards |
|
(19,955) |
|
|
— |
|
|
(1,131) |
|
|
— |
|
|
(1,131) |
|
|
Stock ‑based compensation |
|
— |
|
|
— |
|
|
8,400 |
|
|
— |
|
|
8,400 |
|
|
Net income |
|
— |
|
|
— |
|
|
— |
|
|
44,251 |
|
|
44,251 |
|
|
Balances at February 3, 2015 |
|
35,101,632 |
|
$ |
351 |
|
$ |
435,882 |
|
$ |
(750) |
|
$ |
435,483 |
|
|
Exercise of common stock options |
|
104,221 |
|
|
1 |
|
|
2,078 |
|
|
— |
|
|
2,079 |
|
|
Excess tax benefits associated with stock ‑based awards |
|
— |
|
|
— |
|
|
1,162 |
|
|
— |
|
|
1,162 |
|
|
Vesting of restricted stock |
|
118,451 |
|
|
1 |
|
|
— |
|
|
— |
|
|
1 |
|
|
Purchase of vested stock ‑based awards |
|
(29,736) |
|
|
— |
|
|
(1,439) |
|
|
— |
|
|
(1,439) |
|
|
Stock ‑based compensation |
|
— |
|
|
— |
|
|
9,674 |
|
|
— |
|
|
9,674 |
|
|
Net income |
|
— |
|
|
— |
|
|
— |
|
|
64,522 |
|
|
64,522 |
|
|
Balances at February 2, 2016 |
|
35,294,568 |
|
$ |
353 |
|
$ |
447,357 |
|
$ |
63,772 |
|
$ |
511,482 |
|
The accompanying notes are an integral part of these consolidated financial statements.
64
MATTRESS FIRM HOLDING CORP.
CONSOLIDATED STATEMENTS OF CASH FLOWS
|
|
|
|
|
|||||||
|
|
|
Fiscal |
|
Fiscal |
|
Fiscal |
|
|||
|
|
|
2013 |
|
2014 |
|
2015 |
|
|||
|
|
|
(in thousands) |
|
|||||||
|
Cash flows from operating activities: |
|
|
|
|
|
|
|
|
|
|
|
Net income |
|
$ |
52,924 |
|
$ |
44,251 |
|
$ |
64,522 |
|
|
Adjustments to reconcile net income to cash flows provided by operating activities: |
|
|
|
|
|
|
|
|
|
|
|
Depreciation and amortization |
|
|
29,498 |
|
|
41,740 |
|
|
62,247 |
|
|
Loan fee and other amortization |
|
|
2,207 |
|
|
5,608 |
|
|
7,379 |
|
|
Loss from debt extinguishment |
|
|
— |
|
|
2,288 |
|
|
— |
|
|
Gain from disposals of property and equipment |
|
|
(10) |
|
|
(11) |
|
|
(73) |
|
|
Deferred income tax expense |
|
|
12,349 |
|
|
5,269 |
|
|
23,865 |
|
|
Stock-based compensation |
|
|
4,846 |
|
|
8,400 |
|
|
9,674 |
|
|
Loss on store closings and impairment of store assets |
|
|
1,499 |
|
|
1,813 |
|
|
7,524 |
|
|
Construction allowances from landlords |
|
|
5,464 |
|
|
7,561 |
|
|
10,380 |
|
|
Excess tax benefits associated with stock-based awards |
|
|
(692) |
|
|
(2,932) |
|
|
(1,162) |
|
|
Effects of changes in operating assets and liabilities, excluding business acquisitions: |
|
|
|
|
|
|
|
|
|
|
|
Accounts receivable |
|
|
6,168 |
|
|
(18,403) |
|
|
(11,609) |
|
|
Inventories |
|
|
(15,964) |
|
|
(18,258) |
|
|
2,989 |
|
|
Prepaid expenses and other current assets |
|
|
2,901 |
|
|
(18,943) |
|
|
(12,102) |
|
|
Other assets |
|
|
(3,049) |
|
|
(4,367) |
|
|
(4,506) |
|
|
Accounts payable |
|
|
3,183 |
|
|
27,480 |
|
|
18,270 |
|
|
Accrued liabilities |
|
|
(709) |
|
|
24,231 |
|
|
(13,363) |
|
|
Customer deposits |
|
|
840 |
|
|
(558) |
|
|
552 |
|
|
Other noncurrent liabilities |
|
|
1,986 |
|
|
(356) |
|
|
31,764 |
|
|
Net cash provided by operating activities |
|
|
103,441 |
|
|
104,813 |
|
|
196,351 |
|
|
Cash flows from investing activities: |
|
|
|
|
|
|
|
|
|
|
|
Purchases of property and equipment |
|
|
(55,546) |
|
|
(79,897) |
|
|
(130,529) |
|
|
Sales of property and equipment |
|
|
— |
|
|
— |
|
|
5,853 |
|
|
Business acquisitions, net of cash acquired |
|
|
(8,833) |
|
|
(566,522) |
|
|
(3,541) |
|
|
Net cash used in investing activities |
|
|
(64,379) |
|
|
(646,419) |
|
|
(128,217) |
|
|
Cash flows from financing activities: |
|
|
|
|
|
|
|
|
|
|
|
Proceeds from issuance of debt |
|
|
72,000 |
|
|
1,014,800 |
|
|
93,000 |
|
|
Principal payments of debt |
|
|
(105,966) |
|
|
(479,087) |
|
|
(174,633) |
|
|
Debt issuance costs |
|
|
— |
|
|
(10,188) |
|
|
— |
|
|
Proceeds from exercise of common stock options |
|
|
3,027 |
|
|
4,877 |
|
|
2,079 |
|
|
Excess tax benefits associated with stock-based awards |
|
|
692 |
|
|
2,932 |
|
|
1,162 |
|
|
Purchase of vested stock-based awards |
|
|
(493) |
|
|
(1,131) |
|
|
(1,439) |
|
|
Net cash (used in) provided by financing activities |
|
|
(30,740) |
|
|
532,203 |
|
|
(79,831) |
|
|
Net increase (decrease) in cash and cash equivalents |
|
|
8,322 |
|
|
(9,403) |
|
|
(11,697) |
|
|
Cash and cash equivalents, beginning of period |
|
|
14,556 |
|
|
22,878 |
|
|
13,475 |
|
|
Cash and cash equivalents, end of period |
|
$ |
22,878 |
|
$ |
13,475 |
|
$ |
1,778 |
|
The accompanying notes are an integral part of these consolidated financial statements.
65
MATTRESS FIRM HOLDING CORP.
NOTES TO CONSOLIDATED FINANCIAL STATEMENTS
1. Business and Summary of Significant Accounting Policies
Business—Mattress Firm Holding Corp., through its direct and indirect subsidiaries, is engaged in the retail sale of mattresses and bedding-related products in various metropolitan markets in the United States through company-operated and franchisee-owned mattress specialty stores that operate primarily under the brand names Mattress Firm® and Sleep Train® and as of February 5, 2016, the Sleepy’s® brand name as well. Mattress Firm Holding Corp. and its subsidiaries are referred to collectively as the “Company” or “Mattress Firm.”
Ownership—As of February 2, 2016, JWC Mattress Holdings, LLC, a limited liability company managed by J.W. Childs Associates, Inc. (“J.W. Childs”), owns approximately 12.7 million shares (approximately 36%) of the common stock of Mattress Firm Holding Corp. and is the Company’s largest stockholder. Prior to the initial public offering, the Company was a wholly‑owned subsidiary of Mattress Holdings, LLC, which was majority owned by JWC Mattress Holdings, LLC and had various minority owners including certain members of the Company’s management (together with J.W. Childs, the “Equity Owners”). On September 27, 2012, Mattress Holdings, LLC distributed its holdings of Mattress Firm Holding Corp. common stock to the Equity Owners and was subsequently dissolved.
Basis of Presentation—The accompanying financial statements present the consolidated balance sheets, statements of operations, stockholders’ equity and cash flows of the Company. All intercompany accounts and transactions have been eliminated.
Fiscal Year—The Company’s fiscal year consists of 52 or 53 weeks ending on the Tuesday closest to January 31. Each of the fiscal years ended January 28, 2014 (“Fiscal 2013”) and February 2, 2016 (“Fiscal 2015”) consisted of 52 weeks. The fiscal year ended February 3, 2015 (“Fiscal 2014”) consisted of 53 weeks.
Accounting Estimates—The preparation of financial statements in conformity with United States Generally Accepted Accounting Principles (“U.S. GAAP”) requires management to make estimates and assumptions that affect the reported amounts of (i) assets and liabilities, (ii) disclosure of contingent assets and liabilities at the date of the financial statements and (iii) the reported amounts of revenues and expenses during the reporting periods. Actual results could differ from those estimates. Estimates that are more susceptible to change in the near term are the accruals for sales returns and exchanges, product warranty costs, asset impairments, vendor incentives, self-insured liabilities, store closing costs and acquisition accounting fair values.
Fair Value Measures—The amounts reported in the consolidated balance sheets for cash and cash equivalents, accounts receivable, accounts payable and accrued liabilities approximate their respective fair values due to the short-term maturity of these instruments.
The Financial Accounting Standards Board (the “FASB”) has issued guidance on the definition of fair value, the framework for using fair value to measure assets hierarchy, which prioritizes the inputs used to measure fair value. These tiers include:
|
· |
Level 1: Defined as observable inputs such as quoted prices in active markets for identical assets or liabilities as of the reporting date. Active markets are those in which transactions for the asset or liability occur in sufficient frequency and volume to provide pricing information on an ongoing basis. |
|
· |
Level 2: Defined as pricing inputs other than quoted prices in active markets included in Level 1, which are either directly or indirectly observable as of the reporting date. Level 2 includes those financial instruments that are valued using models or other valuation methodologies. These models are primarily industry standard models that consider various assumptions, including quoted forward prices for commodities, time value, volatility factors and current market and contractual prices for the underlying instruments, as well as other relevant economic measures. |
66
|
· |
Level 3: Defined as pricing inputs that are unobservable from objective sources. These inputs may be used with internally developed methodologies that result in management’s best estimate of fair value. |
The Company measures the fair value of its nonqualified deferred compensation plan on a recurring basis. The plan’s assets are valued based on the marketable securities tied to the plan. Additionally, the Company measures the fair values of goodwill, intangible assets, and property and equipment on a nonrecurring basis if required by impairment tests applicable to these assets.
Assets requiring recurring or non‑recurring fair value measurements consisted of the following (in thousands):
|
|
|
Net Book |
|
|
|
|
|
|
|
|
|
|
|
|
|
|
|
|
|
Value as of |
|
|
|
|
|
|
|
|
|
|
|
|
|
|
|
|
|
February 3, |
|
Fair Value Measurements |
|
Fiscal 2014 |
|
|||||||||
|
|
|
2015 |
|
Level 1 |
|
Level 2 |
|
Level 3 |
|
Impairments |
|
|||||
|
Nonqualified deferred compensation plan (Note 13) |
|
$ |
1,247 |
|
$ |
— |
|
$ |
1,247 |
|
$ |
— |
|
$ |
— |
|
|
Property and equipment requiring impairment review (Note 3) |
|
$ |
702 |
|
$ |
— |
|
$ |
— |
|
$ |
702 |
|
$ |
937 |
|
|
|
|
Net Book |
|
|
|
|
|
|
|
|
|
|
|
|
|
|
|
|
|
Value as of |
|
|
|
|
|
|
|
|
|
|
|
|
|
|
|
|
|
February 2, |
|
Fair Value Measurements |
|
Fiscal 2015 |
|
|||||||||
|
|
|
2016 |
|
Level 1 |
|
Level 2 |
|
Level 3 |
|
Impairments |
|
|||||
|
Nonqualified deferred compensation plan (Note 13) |
|
$ |
1,698 |
|
$ |
— |
|
$ |
1,698 |
|
$ |
— |
|
$ |
— |
|
|
Property and equipment requiring impairment review (Note 3) |
|
$ |
727 |
|
$ |
— |
|
$ |
— |
|
$ |
727 |
|
$ |
1,525 |
|
|
Senior Credit Facility term loans (Note 5) |
|
$ |
685,113 |
|
$ |
— |
|
$ |
670,270 |
|
$ |
— |
|
$ |
— |
|
The significant Level 3 unobservable input used in the fair value measurement of the Company’s property and equipment was the weighted average cost of capital (“WACC”). Increases (decreases) in WACC inputs in isolation would result in a lower (higher) fair value measurement.
67
The following tables are not intended to be all-inclusive, but rather provide a summary of the significant unobservable inputs used in the fair value measurement of the Company’s Level 3 assets in which impairment testing was performed.
Impairment testing performed as of February 3, 2015
|
|
|
|
|
|
|
|
|
|
|
|
Unobservable |
|
|
Valuation Technique |
|
Significant Unobservable Inputs |
|
Input Range |
|
|
Property and Equipment Impairment Testing |
|
|
|
|
|
|
Income approach |
|
WACC |
|
13.5 |
% |
Impairment testing performed as of February 2, 2016
|
|
|
|
|
|
|
|
|
|
|
|
Unobservable |
|
|
Valuation Technique |
|
Significant Unobservable Inputs |
|
Input Range |
|
|
Property and Equipment Impairment Testing |
|
|
|
|
|
|
Income approach |
|
WACC |
|
13.5 |
% |
The fair value of the Senior Credit Facility term loans was estimated based on the ask and bid prices quoted from an external source. The carrying values of the Senior Credit Facility term loans and other debt instruments at fixed rates are not materially different than their face value.
Net Sales—Sales revenue, including fees collected for delivery services, is recognized upon delivery and acceptance of mattresses and bedding products by the Company’s customers and is recorded net of estimated returns. Customer deposits collected prior to the delivery of merchandise are recorded as a liability. Net sales are recognized net of the sales tax collected from customers and remitted to various taxing jurisdictions. Fiscal 2015 and fiscal 2014 were comprised of 52 weeks and 53 weeks, respectively, resulting in one additional week of operations in fiscal 2014, which resulted in higher net sales in fiscal 2014 of $47.4 million due to sales in the 53rd week.
Cost of Sales, Sales and Marketing and General and Administrative Expense—The following summarizes the primary costs classified in each major expense category (the classification of which may vary within the Company’s industry).
Cost of sales:
|
· |
Costs associated with purchasing and delivering the Company’s products to the Company’s stores and customers, net of vendor incentives earned on the purchase of products subsequently sold; |
|
· |
Physical inventory losses; |
|
· |
Store and warehouse occupancy and depreciation expense of related facilities and equipment; |
|
· |
Store and warehouse operating costs, including (i) warehouse labor costs, (ii) utilities, (iii) repairs and maintenance, (iv) supplies, (v) and store facilities; and |
|
· |
Estimated costs to provide for customer returns and exchanges and to service customer warranty claims. |
Sales and marketing expenses:
|
· |
Advertising and media production; |
68
|
· |
Payroll and benefits for sales associates; and |
|
· |
Merchant service fees for customer credit and debit card payments, check guarantee fees and promotional financing expense. |
General and administrative expenses:
|
· |
Payroll and benefit costs for corporate office and regional management employees; |
|
· |
Stock‑based compensation costs; |
|
· |
Occupancy costs of corporate facility; |
|
· |
Information systems hardware, software and maintenance; |
|
· |
Depreciation related to corporate assets; |
|
· |
Management fees; |
|
· |
Insurance; and |
|
· |
Other overhead costs. |
Vendor Incentives—Cash payments received from vendors as incentives to enter into or to maintain long‑term supply arrangements, including new store funds described in the following paragraph, are deferred and amortized as a reduction of cost of sales using a systematic approach. Vendor incentives that are based on a percentage of the cost of purchased merchandise, such as cooperative advertising funds, are accounted for as a reduction of the price of the vendor’s products and result in a reduction of cost of sales when the merchandise is sold. Certain vendor arrangements provide for volume‑based incentives that require minimum purchase volumes and may provide for increased incentives upon higher levels of volume purchased. The recognition of earned incentives that vary based on purchase levels includes the effect of estimates of the Company’s purchases of the vendor’s products and may result in adjustments in subsequent periods if actual purchase volumes deviate from the estimates. Vendor incentives that are direct reimbursements of costs incurred by the Company to sell the vendor’s products are accounted for as a reduction of the related costs when recognized in the Company’s results of operations. The Company classifies deferred vendor incentives as a noncurrent liability. From time to time, certain vendors provide funds to the Company to advertise their products. The Company recognized $9.1 million, $11.7 million and $12.4 million as a reduction to sales and marketing expense during fiscal 2013, fiscal 2014 and fiscal 2015, respectively, related to such direct vendor advertising funds.
The Company receives cash funds from certain vendors upon the opening of a new store (“new store funds”) if the opening results in an increase in the total number of stores in operation. Under the current supply arrangements, the Company is not required to purchase a stated amount of products for an individual store or in total as a condition to receipt of the new store funds, although it is obligated to repay a portion of new store funds if a new store is subsequently closed, if the Company ceases to sell the supplier’s products in the new store or if a supply arrangement is terminated early. The Company classifies new store funds as a noncurrent liability and recognizes a pro‑rata reduction of cost of sales in the results of operations over 36 months, which is the period that most closely aligns with the terms of the Company’s supply agreements regarding the manner in which new store funds are earned.
Sales Returns and Exchanges—The Company accrues a liability for estimated costs of sales returns and exchanges in the period that the related sales are recognized. The Company provides its customers with a comfort satisfaction guarantee whereby the customer may receive a refund or exchange the original mattress for a replacement of equal or similar quality for a specified period after the original purchase and the payment of a return fee. Mattresses received back under this policy are reconditioned pursuant to state laws and resold through the Company’s clearance center stores as used merchandise. The Company accrues a liability for the estimated costs related to the revaluation of the returned merchandise to the lower of cost or market at the time the sale is recorded based upon historical experience. The Company regularly assesses and adjusts the estimated liability by updating claims rates based on actual trends and projected claim costs. A revision of estimated claim rates and claim costs or revisions to the Company’s exchange policies may have a material adverse effect on future results of operations.
69
Activity with respect to the liability for sales returns and exchanges, included in accrued liabilities, was as follows (in thousands):
|
|
|
|
|
|
|
|
|
|
|
|
|
|
|
Fiscal |
|
Fiscal |
|
Fiscal |
|
|||
|
|
|
2013 |
|
2014 |
|
2015 |
|
|||
|
Balance at beginning of period |
|
$ |
1,485 |
|
$ |
1,996 |
|
$ |
3,051 |
|
|
Sales return and exchange provision |
|
|
8,802 |
|
|
11,636 |
|
|
15,484 |
|
|
Sales return and exchange claims |
|
|
(8,291) |
|
|
(10,581) |
|
|
(16,182) |
|
|
Balance at end of period |
|
$ |
1,996 |
|
$ |
3,051 |
|
$ |
2,353 |
|
Product Warranties—Pursuant to certain of the Company’s supply agreements, the Company may be responsible for manufacturer service warranties and any extended warranties the Company may offer. Generally, the customer is not charged a fee for warranty coverage. The Company accrues for the estimated cost of warranty coverage at the time the sale is recorded. In estimating the liability for product warranties, the Company considers the impact of resale value on product received back under warranty. Based upon the Company’s historical warranty claim experience, as well as recent trends that might suggest that past experience may differ from future claims, management periodically reviews and adjusts, if necessary, the liability for product warranties.
Activity with respect to the liability for product warranties was as follows (in thousands):
|
|
|
|
|
|
|
|
|
|
|
|
|
|
|
Fiscal |
|
Fiscal |
|
Fiscal |
|
|||
|
|
|
2013 |
|
2014 |
|
2015 |
|
|||
|
Balance at beginning of period |
|
$ |
3,779 |
|
$ |
4,801 |
|
$ |
6,851 |
|
|
Warranty provision |
|
|
2,932 |
|
|
4,577 |
|
|
14,177 |
|
|
Warranty claims |
|
|
(1,910) |
|
|
(2,527) |
|
|
(7,414) |
|
|
Balance at end of period |
|
|
4,801 |
|
|
6,851 |
|
|
13,614 |
|
|
Less: Current portion included in accrued liabilities |
|
|
1,994 |
|
|
3,340 |
|
|
4,830 |
|
|
Noncurrent portion included in other non-current liabilities |
|
$ |
2,807 |
|
$ |
3,511 |
|
$ |
8,784 |
|
Franchise Fees and Royalty Income—The Company has granted franchise rights to private operators to operate Mattress Firm stores for a term of generally 20 to 30 years on a market‑by‑market basis. The Company provides standard operating procedure manuals, the right to use systems and trademarks, assistance in site locations of stores and warehouses, training and support services, advertising materials and management and accounting software to its franchisees. The Company is entitled to a nonrefundable initial franchise fee that is recognized in income when all material services have been substantially performed, which is upon the opening of a new store. In addition, the Company earns ongoing royalties based on a percentage of gross franchisee sales, payable twice a month, which are recognized in income during the period sales are recognized by the franchisees.
The Company evaluates the credentials, business plans and the financial strength of potential franchisees before entering into franchise agreements and before extending credit terms for franchise fee and royalty payments. Concentrations of credit risk with respect to accounts receivable with franchisees after considering existing allowances for doubtful accounts, are considered by management to be limited as a result of the small size of the franchisee network relative to company‑operated stores and the years of experience with the current franchisee owners. The Company generally has the right, under the terms of its franchise agreements, to assume the operations of franchisees that do not comply with the conditions of the franchise agreement, including a default on the payments owed to the Company. In such instances, the assumption may involve purchase consideration in the form of cash and the assumption of certain franchisee obligations, including obligations to the Company. Based upon collection experience with existing franchisees and the collateral position, an allowance for doubtful accounts was less than $0.1 million as of February 3, 2015 and February 2, 2016.
70
Pre‑opening Expense—Store pre‑opening expenses, which consist primarily of occupancy costs, are expensed as incurred. Pre-opening expenses are reported as a component of “Cost of sales” and “Sales and marketing expenses” in the statements of operations based on the type of expense.
Advertising and Media Production Expense—The Company incurs advertising costs associated with print and broadcast advertisements. Such costs are expensed as incurred except for media production costs, which are deferred and charged to expense in the period that the advertisement initially airs. Advertising and media production expense, net of direct funds received from certain vendors, was $105.3 million, $155.3 million, and $210.6 million for fiscal 2013, fiscal 2014 and fiscal 2015, respectively.
Income Taxes—Income taxes are accounted for using the asset and liability method to account for deferred income taxes by applying the statutory tax rates in effect at the balance sheet date to temporary differences between the amount of assets and liabilities for financial and tax reporting purposes that will reverse in subsequent years. The effect on deferred tax assets and liabilities from a change in the tax rate is recognized in the statement of operations in the period that the change is effective.
Tax positions are reviewed at least quarterly and adjusted as new information becomes available. The recoverability of deferred tax assets is evaluated by assessing the adequacy of future expected taxable income from all sources, including reversal of taxable temporary differences, forecasted operating earnings and available tax planning strategies. These estimates of future taxable income inherently require significant judgment. To the extent it is considered more likely than not that a deferred tax asset will not be recovered, a valuation allowance is established.
The Company accounts for its total liability for uncertain tax positions according to the provisions of Accounting Standards Codification (ASC) section 740‑10‑25 “Income Taxes”. The amount of income taxes the Company pays is subject to ongoing audits by federal and state tax authorities. Reserves are provided for potential exposures when it is considered more‑likely‑than‑not that a taxing authority may take a sustainable position on a matter contrary to the Company’s position. The Company evaluates these reserves, including interest thereon, on a periodic basis to ensure that they have been appropriately adjusted for events, including audit settlements that may impact the ultimate payment for such exposure. To the extent that the Company’s assessment of such tax positions changes, the change in estimate is recorded in the period in which the determination is made. The Company reports tax‑related interest and penalties as a component of income tax expense. (See Note 6 for further discussion.)
Stock‑Based Compensation—The Company measures compensation cost with respect to equity instruments granted as stock‑based payments to employees based upon the estimated fair value of the equity instruments at the date of the grant according to the provisions of ASC 718 “Compensation – Stock Compensation”. The cost as measured is recognized as expense over the period during which an employee is required to provide services in exchange for the award, or to their eligible retirement date, if earlier. The benefit of tax deductions in excess of recognized compensation expense, if any, is reported as a financing cash flow in the Statement of Cash Flows.
The Company follows the SEC’s Staff Accounting Bulletin No. 107 “Share‑Based Payment” (“SAB 107”), as amended by Staff Accounting Bulletin No. 110 (“SAB 110”), which provides supplemental application guidance based on the views of the SEC. The Company estimates the expected term that its stock options will remain outstanding using the simplified method as permitted by SAB 107 and SAB 110 because it has insufficient historical exercise data to provide a reasonable basis upon which to estimate the expected terms of its stock options.
Cash and Cash Equivalents—Cash and cash equivalents include cash and highly liquid investments that are readily convertible into cash within three months or less when purchased. In addition, cash equivalents include sales proceeds in the course of settlement from credit card merchant service providers, which typically convert to cash within three days of the sales transaction.
Accounts Receivable—Accounts receivable are recorded net of an allowance for expected losses.
The Company offers financing to customers by utilizing the services of independent, third party finance and lease‑to‑own companies (collectively “finance companies”) that extend credit directly to the Company’s customers with no recourse to the Company for credit related losses. The finance companies have the discretion to establish and revise the credit criteria used in evaluating whether to extend financing to the Company’s customers. Accounts receivable include sales proceeds of financed sales, net of related fees, which are in the course of funding by the finance companies.
71
The Company reviews the financial condition of its finance companies and has experienced no losses on the collection of accounts receivable resulting from the financial condition of the finance companies. The Company’s experience in submitting certain information to the finance companies required to receive timely funding of financed sales is also considered in determining the potential loss on the collection of accounts receivable. Accounts receivable from finance companies are recorded net of an allowance for expected losses of approximately $1.5 million and $0.9 million as of February 3, 2015 and February 2, 2016, respectively. The remaining receivables are periodically evaluated for collectability and an allowance is established based on historical collection trends and write‑off history as appropriate.
Accounts receivable consists of the following (in thousands):
|
|
|
|
|
|
|
|
|
|
|
|
February 3, |
|
February 2, |
|
||
|
|
|
2015 |
|
2016 |
|
||
|
Vendor incentives |
|
$ |
28,231 |
|
$ |
37,776 |
|
|
Finance companies |
|
|
14,261 |
|
|
14,180 |
|
|
Tenant improvement allowances |
|
|
4,161 |
|
|
6,214 |
|
|
Franchisees and other |
|
|
4,540 |
|
|
6,753 |
|
|
|
|
$ |
51,193 |
|
$ |
64,923 |
|
Inventories—The Company’s inventories consist of finished goods inventories of mattresses and other products, including finished goods that are for showroom display in the Company’s stores. Inventories consist primarily of the purchase price paid to vendors, as adjusted to include the effect of vendor incentives that are generally based on a percentage of the cost of purchased merchandise. The Company does not purchase or hold inventories on behalf of franchisees.
The Company completed the process in fiscal 2014 of implementing a new computer system that provides sales tracking, inventory management, financial reporting and warehouse management capabilities (“new ERP system”) to enhance functionality and to support the Company’s growth strategy. The new ERP system utilizes the weighted average cost flow method for determining inventory cost (“Weighted Average”) and, as the new ERP system was rolled out across the Company’s markets, replaced the First‑In, First‑Out cost flow method (“FIFO”) utilized by our legacy system. The Weighted Average and FIFO methods are both allowable under U.S. GAAP. The FASB has issued guidance that when there are two allowable alternative accounting principles, a company must determine which one is preferable. The adoption of the Weighted Average method is considered preferable by the Company due to the fact that it aligns with the functionality of the new ERP system. The Company also considered other factors that support preferability of the Weighted Average method, including closer alignment with the physical flow of the Company’s inventories and prevalence among industry peers. Consistent with FASB requirements, if a change in accounting principle is determined to be preferable, the change shall be reported through retrospective application to the financial statements of all prior periods, unless the effects are not material. The Company determined that the effects of adopting the Weighted Average method are not material to its financial statements. This determination is supported by certain inherent characteristics of the Company’s business, including the ability to hold low inventories relative to sales levels, continuous product replenishment, the relatively short life cycles of most mattress products and the infrequency of vendor price changes during the life cycle of the majority of products that are carried. Therefore, the change in accounting principle has not been retrospectively applied to prior periods.
The Company acquired Sleep Train in October 2014, and Sleep Train's legacy system utilizes the FIFO method of inventory costing. As a result, Sleep Train inventory of $45.5 million and $43.0 million as of February 3, 2015 and February 2, 2016, respectively, is valued at FIFO. The Company determined the difference between Weighted Average and FIFO costs is not material at February 3, 2015 and February 2, 2016. During the course of fiscal 2016, the Sleep Train system is expected to be converted to use the Weighted Average inventory costing method.
Property and Equipment—Property and equipment are stated at cost less accumulated depreciation. Improvements to leased property are amortized over the shorter of their estimated useful lives or lease periods (including expected renewal periods). Repairs and maintenance are expensed as incurred. Expenditures which extend asset useful
72
lives are capitalized. Property and equipment acquired in acquisitions is valued at fair value consistent with acquisition accounting (Note 2).
Depreciation of property and equipment, other than improvements to leased property, is provided on the straight‑line method at rates based on the estimated useful lives of individual assets or classes of assets as follows:
|
|
|
|
|
|
|
|
Years |
|
|
Buildings |
|
30 |
|
|
Equipment, computers and software |
|
3 - 5 |
|
|
Furniture and fixtures |
|
7 |
|
|
Store signs |
|
7 |
|
|
Vehicles |
|
5 |
|
The Company capitalizes costs of software developed or purchased for internal use in accordance with ASC 350‑40 “Accounting for the Costs of Computer Software Developed or Obtained for Internal Use”. Once the capitalization criteria have been met, external direct costs of materials and services used in development of internal‑use software, payroll and payroll related costs for employees directly involved in the development of internal‑use software and interest costs incurred when developing software for internal use are capitalized. These capitalized costs are amortized over the useful life of the software on a straight‑line basis.
The cost and accumulated depreciation of assets sold or otherwise disposed of are removed from the accounts and any gain or loss thereon is included in the results of operations.
The Company considers future asset retirement obligations at the time an asset is acquired or constructed with a corresponding increase in the cost basis of the asset. The Company generally has minimal conditional obligations with respect to the termination and abandonment of leased locations and the estimated fair value of such obligations is immaterial for the fiscal years ended February 3, 2015 and February 2, 2016.
The Company reviews long‑lived assets for impairment when events or changes in circumstances indicate the carrying value of these assets may exceed their current fair values. The investments in store leasehold costs and related equipment represent the Company’s most significant long‑lived assets. The Company evaluates store‑level results to determine whether projected future cash flows over the remaining lease terms are sufficient to recover the carrying value of the fixed asset investment in each individual store. If projected future cash flows are less than the carrying value of the fixed asset investment, an impairment charge is recognized to the extent that the fair value, as determined by discounted cash flows or appraisals, is less than the carrying value of such assets. The carrying value of leasehold improvements as well as certain other property and equipment are subject to impairment write‑downs as a result of such evaluation. After an impairment loss is recognized, the adjusted carrying amount of the asset group establishes the new accounting basis. As further described in Note 3, the Company has recognized impairment losses during fiscal 2013, fiscal 2014 and fiscal 2015.
Goodwill and Intangible Assets—Assets acquired and liabilities assumed in a business acquisition are recorded at fair value on the date of the acquisition. Purchase consideration in excess of the aggregate fair value of acquired net assets is allocated to identifiable intangible assets, to the extent of their fair value, and any remaining excess purchase consideration is allocated to goodwill. The total amount of goodwill arising from an acquisition may be assigned to one or more of the Company’s reporting units.
A reporting unit is defined as an operating segment or one level below an operating segment, a component. As further discussed in the section “Reportable Segments”, the Company’s operating segments consist of company‑operated store regions, e‑commerce, multi‑channel sales and the franchise business. Territory unit components comprise each of the company‑operated store regions and, since all territory units possess similar economic characteristics, are aggregated within each region to determine a reportable unit. The e‑commerce, multi‑channel sales and franchise operating segments have no lower level components and each of these operating segments is a reporting unit. The method of assigning goodwill to reporting units is applied in a consistent manner and may involve estimates and assumptions.
73
Goodwill is not amortized but is tested annually for impairment at the reporting unit level. Prior to Fiscal 2015, the Company performed this testing as of the fiscal year-end, however, beginning in Fiscal 2015, the Company performed this test as of the first day of the fourth quarter. The Company has the option to first assess qualitative factors to determine whether events and circumstances indicate that it is more likely than not that goodwill is impaired. If after such assessment with regard to each reporting unit the Company concludes that the goodwill of a reporting unit is not impaired, then no further action is required (commonly referred to as the step zero approach). The Company determined under this qualitative assessment that for all reporting units except three that it was more likely than not that goodwill impairment did not exist.
For those reporting units where a significant change or event occurs, and where potential impairment indicators exist, the Company then performs a quantitative assessment by comparing the fair value of the reporting units to their respective carrying amounts, including goodwill, as of the end of each fiscal year or when events and circumstances indicate that the carrying value of these assets may exceed their current fair values. All of the carrying value of goodwill has been assigned to the Region and e‑commerce reporting units for impairment testing purposes. The Company establishes fair value for the purpose of impairment testing by considering the income and market approaches to fair value. The income approach provides an estimated fair value based on the Company’s anticipated cash flows that are discounted using a weighted average cost of capital rate based on comparable industry average rates. The market approach provides an estimated fair value based on market multiples applied to the Company’s historical operating results. If the carrying value of a reporting unit exceeds fair value, the fair value of goodwill is compared to the respective carrying value and an impairment loss is recognized in the amount of the excess. The Company recognized no goodwill impairment losses during fiscal 2013, fiscal 2014 and fiscal 2015.
The impairment test for indefinite lived intangible assets consists of a comparison of the fair value of the asset against its carrying amount. If the carrying amount of an intangible asset exceeds its fair value, an impairment loss is recognized in an amount equal to that excess. After an impairment loss is recognized, the adjusted carrying amount of the asset establishes the new accounting basis. The Company determines the fair value of intangible trade names by utilizing the “relief from royalty method,” a specific discounted cash flow approach that estimates value by royalties saved from owning the respective name rather than having to license it from another party.
Debt Issue Costs and Other Assets—Significant components of other assets include debt issue costs, lease deposits and other assets. Debt issue costs are amortized to interest expense over the term of the related debt instruments, and other assets are amortized over their estimated useful lives. Accumulated amortization on debt issue costs and other assets was $8.6 million and $12.2 million as of February 3, 2015 and February 2, 2016, respectively.
Deferred Lease Liabilities—Rent expense is recognized on a straight‑line basis over the lease term (including expected renewal periods), after consideration of rent escalations, rent holidays and up‑front payments or rent allowances provided by landlords as incentives to enter into lease agreements. The start of the lease term for the purposes of the calculation is the earlier of the lease commencement date or the date the Company takes possession of the property. A deferred lease liability is recognized for the cumulative difference between rental payments and straight‑line rent expense. Deferred lease liabilities are a component of other noncurrent liabilities.
Reportable Segments—The Company’s operations consist primarily of the retail sale of mattresses and bedding‑related products in various metropolitan areas in the United States through company‑operated and franchisee‑operated mattress specialty stores that operate primarily under the Mattress Firm name. The Company manages its company‑operated stores on a geographic basis. The Company also generates sales through its e‑commerce website and special events business primarily to customers who reside in the metropolitan areas in which company‑operated stores are located.
During fiscal 2013, in response to the growth in sales, store units and metropolitan areas in which the Company operates, the Company revised the geographic management structure of its company‑operated stores to add hierarchical layers, which broadened management’s control over the business and re‑aligned the internal reporting structure to reflect the geographic territories used by management to review, evaluate and operate the expanded business efficiently. As a result, the determination of an operating segment, as it relates to company‑owned stores, was revised from a “metropolitan market” to a “region,” with each region defined as the aggregation of each geographic “territory” within
74
the region, and each territory defined as the aggregation of the metropolitan markets within the territory. As now reflected by the geographic management structure, the Company’s chief operating decision maker reviews the results of operations and makes decisions regarding the allocation of resources at the regional level.
A reportable segment is an operating segment or an aggregation of two or more operating segments that contain similar economic characteristics. After giving effect to the geographic management structure discussed in the preceding paragraph, the Company’s 11 operating segments consisting of eight company‑operated store regions, the e‑commerce website, multi‑channel sales and the franchise business. The company‑operated store regions, e‑commerce website and special events business segments are aggregated into a single reportable segment (“retail segment”) as a result of the similar nature of the products sold and other similar economic characteristics that are expected to continue into future periods. Furthermore, the Company generates franchise fees and royalty income from the operation of franchisee‑operated Mattress Firm stores in metropolitan markets in which the Company does not operate. Franchise operations are a separate reportable segment, for which the results of operations, as viewed by management, are fully represented by the franchise fees and royalty income reported on the face of the statements of operations because costs associated with the franchise business are not distinguished from other cost data viewed by management. The Company’s assets are used primarily in the operation of its retail segment and the assets directly attributable to the franchise operations are not separately disclosed because they are not material.
New Accounting Standards Adopted in this Report— In November 2015, the FASB issued Accounting Standards Update ("ASU") No. 2015-17, Income Taxes (Topic 740): Balance Sheet Classification of Deferred Taxes, which requires that all deferred tax assets and liabilities, along with any related valuation allowance, be classified as noncurrent in the balance sheet. As a result, each jurisdiction will now only have one net noncurrent deferred tax asset or liability. However, the new guidance does not change the existing requirement that only permits offsetting within a jurisdiction. Companies are still prohibited from offsetting deferred tax liabilities from one jurisdiction against deferred tax assets of another jurisdiction. The amendments in this accounting standard are effective for public companies for interim and annual reporting periods beginning after December 15, 2016, with early application permitted. The Company has retrospectively applied the change in accounting as of February 2, 2016. As such, the prior year amounts previously reported as current deferred tax assets and noncurrent deferred tax liabilities were recast and resulted in a decrease of $8.9 million, respectively, in the Consolidated Balance Sheet as of February 3, 2015. The change in accounting principle does not have an impact on the Company’s results of operations, cash flows or stockholders’ equity.
New Accounting Standards Not Yet Adopted in this Report— In May 2014, the FASB issued ASU No. 2014-09, Revenue From Contracts With Customers, that outlines a single comprehensive model for entities to use in accounting for revenue arising from contracts with customers and supersedes most current revenue recognition guidance, including industry-specific guidance. The ASU is based on the core principle that an entity should recognize revenue to depict the transfer of promised goods or services to customers in an amount that reflects the consideration to which the entity expects to be entitled in exchange for those goods or services. This ASU also requires disclosures sufficient to enable users to understand the nature, amount, timing, and uncertainty of revenue and cash flows arising from contracts with customers, including qualitative and quantitative disclosures about contracts with customers, significant judgments and changes in judgments, and assets recognized from the costs to obtain or fulfill a contract. Entities have the option of using either a full retrospective or a modified retrospective approach for the adoption of the new standard. This ASU is effective for fiscal years beginning after December 15, 2017 including interim periods within that reporting period. The Company is currently evaluating the guidance to determine the Company's adoption method and the effect it will have on the Company's Consolidated Financial Statements.
In April 2015, the FASB issued ASU No. 2015-03, Interest- Imputation of Interest- Simplifying the Presentation of Debt Issuance Costs, which requires debt issuance costs related to a recognized debt liability to be presented in the balance sheet as a direct deduction from the carrying amount of that debt liability. This ASU is effective on a retrospective basis for annual reporting periods beginning after December 15, 2015, however early adoption is permitted. The Company will apply this ASU on a retrospective basis beginning in 2016. The adoption of this ASU is not expected to have an effect on the Company's Consolidated Statements of Income or Cash Flows; however, the unamortized balance of debt issuance costs will be reclassified from other long-term assets to an offset against long-term debt on the Consolidated Balance Sheets.
75
In September 2015, the FASB issued ASU No. 2015-16, Business Combinations- Simplifying the Accounting for Measurement-Period Adjustments, which requires that an acquirer recognize adjustments to provisional amounts that are identified during the measurement period in the reporting period in which the adjustment amounts are determined. This ASU is effective on a prospective basis for annual reporting periods beginning after December 15, 2015, however early adoption is permitted. The Company will apply this ASU on a prospective basis beginning in 2016. The Company is currently evaluating the guidance to determine the effect it will have on the Company's Consolidated Financial Statements.
In February 2016, the FASB issued ASU No. 2016-02, Leases, which require organizations that lease assets to recognize the rights and obligations created by those leases on the balance sheet. This ASU is effective for fiscal years beginning after December 15, 2018 including interim periods within that reporting period, however early adoption is permitted. The Company will apply this ASU on a retrospective basis beginning in 2019. The Company is currently evaluating the guidance to determine the effect it will have on the Company's Consolidated Financial Statements.
In March 2016, the FASB issued ASU No. 2016-09, Compensation-Stock Compensation- Improvements to Employee Share-Based Payment Accounting, which involves several aspects of the accounting for share-based payment transactions, including the income tax consequences, classification of awards as either equity or liabilities, and classification on the statement of cash flows. Under the new standard, income tax benefits and deficiencies are to be recognized as income tax expense or benefit in the income statement and the tax effects of exercised or vested awards should be treated as discrete items in the reporting period in which they occur. An entity should also recognize excess tax benefits regardless of whether the benefit reduces taxes payable in the current period. Excess tax benefits should be classified along with other income tax cash flows as an operating activity. In regards to forfeitures, the entity may make an entity-wide accounting policy election to either estimate the number of awards that are expected to vest or account for forfeitures when they occur.This ASU is effective for fiscal years beginning after December 15, 2016 including interim periods within that reporting period, however early adoption is permitted. The Company is currently evaluating the guidance to determine the Company's adoption method and the effect it will have on the Company's Consolidated Financial Statements.
2. Acquisitions
The Company completed a number of acquisitions of the equity interests or operating assets of specialty mattress retailers during fiscal 2013, fiscal 2014 and fiscal 2015. These acquisitions: (i) increase the Company’s store locations and market share in markets in which the Company currently operates, which generally results in expense synergies and improved leverage over market‑ level costs, such as advertising and warehousing, or (ii) provide an efficient way to enter new markets in which the Company did not previously operate and which provide a platform for further growth. Results of operations of the acquired businesses are included in the Company’s results of operations from the respective effective dates of the acquisitions.
Goodwill represents the future economic benefits arising from other assets acquired that could not be individually identified and separately recognized. The Company’s goodwill is primarily related to the increase in the Company’s store locations and market share with expectations of expense synergies and leverage over costs, such as advertising and warehousing. The measurement periods for purchase price allocations end as soon as information on the facts and circumstances become available, but do not exceed 12 months. Adjustments in purchase price allocations may require a recasting of the amounts allocated to goodwill.
Acquisition During Fiscal 2015— Effective November 17, 2015, the Company acquired substantially all of the retail assets and operations of Double J-RD, LLC (“Double J-RD”), a former franchisee which operated stores under the Mattress Firm brand in East Texas and Louisiana, relating to the operation of nine mattress specialty retail stores for a total purchase price of approximately $3.7 million, subject to further working capital adjustments.
76
The allocation of the purchase price to the acquired assets and liabilities, based on management’s estimate of their fair values on the acquisition date, is as follows (in thousands):
|
|
|
Double |
|
|
Accounts receivable |
|
$ |
57 |
|
Inventories |
|
|
705 |
|
Prepaid expenses and other current assets |
|
|
55 |
|
Property and equipment |
|
|
489 |
|
Intangible assets |
|
|
544 |
|
Goodwill |
|
|
2,537 |
|
Deferred income tax asset |
|
|
97 |
|
Other assets |
|
|
70 |
|
Accounts payable |
|
|
(312) |
|
Accrued liabilities |
|
|
(305) |
|
Customer deposits |
|
|
(79) |
|
Deferred rent liabilities |
|
|
(198) |
|
Cash used in acquisitions, net of cash acquired |
|
$ |
3,660 |
|
|
|
|
|
The acquisition resulted in $2.5 million of goodwill based on management’s estimate on the acquisition closing date, of which $2.3 million will be deductible for income tax purposes.
Intangible assets represent the reacquired franchise rights which are being amortized over their estimated useful life of approximately 15 years.
The net sales included in the Company’s consolidated statement of operations derived from the Double J-RD acquisition from the acquisition date to February 2, 2016 was $1.8 million. The earnings included in the Company’s consolidated statement of operations derived from the Double J-RD acquisition from the acquisition date to February 2, 2016 was $0.3 million.
Acquisition-related costs for U.S. GAAP purposes are costs the acquirer incurs to effect a business combination, including advisory, legal, accounting, valuation, and other professional or consulting fees. The Company incurred a total of approximately $3.5 million of acquisition-related costs charged to general and administrative expenses during the fiscal year ended February 2, 2016. Of the $3.5 million, approximately $1.5 million relates to our 2014 acquisitions described below, less than $0.1 million relates to the Double J-RD acquisition and approximately $1.9 million relates to our acquisition of Sleepy’s, which closed during the first week of fiscal 2016. (See Note 17 for further discussion.)
The acquisition above was not material to the Company’s financial position or results of operations; therefore, pro forma operating results have not been included in this disclosure.
The Company is continuing to evaluate the fair values of the assets and liabilities acquired, and as a result, adjustments to the values presented above may be modified over the next several quarters.
Acquisitions During Fiscal 2014—Effective March 3, 2014, the Company acquired certain leasehold interests, store assets, distribution center assets and related inventories, and assumed certain liabilities of Yotes, Inc. (“Yotes”), a franchisee of the Company, relating to the operation of 34 mattress specialty retail stores located in Colorado and Kansas for a total purchase price of approximately $14.3 million, including working capital adjustments.
Effective March 3, 2014, the Company acquired the leasehold interests and store assets, and assumed certain liabilities, of Southern Max LLC (“Southern Max”), a franchisee of the Company, relating to the operations of three mattress specialty retail stores located in Virginia for a total purchase price of approximately $0.5 million, including working capital adjustments.
77
Effective April 3, 2014, the Company acquired one hundred percent of the outstanding partnership interests in Sleep Experts Partners, L.P. (“Sleep Experts”), related to the operation of 55 mattress specialty retail stores in Texas under the brand Sleep Experts, for a total purchase price of approximately $67.8 million, including working capital adjustments. The purchase price consisted of cash of $62.8 million (net of $1.6 million of cash acquired), and $3.4 million delivered in the form of 71,619 shares of common stock, par value $0.01 per share, of Mattress Firm Holding Corp. common stock as calculated in accordance with the terms of the purchase agreement.
The Company funded the cash requirements of the Yotes and Southern Max acquisitions using cash reserves and revolver borrowings. The Company raised $100 million of incremental term borrowings under the 2012 Senior Credit Facility (defined in Note 4 below) to fund the cash requirements of the Sleep Experts acquisition and to pay down outstanding revolver borrowings. The new incremental term borrowings were scheduled to mature in January 2016 and were subject to the same interest rate as the existing outstanding incremental borrowings under the 2012 Senior Credit Facility. Effective October 20, 2014, as described below, these term borrowings were repaid in full using the proceeds of the Senior Credit Facility (defined below).
Effective June 4, 2014, the Company acquired substantially all of the mattress specialty retail assets and operations of Mattress Liquidators, Inc. (“Mattress Liquidators”), which operated Mattress King retail stores in Colorado and BedMart retail stores in Arizona, related to the operation of 67 mattress specialty retail stores, for a total purchase price of approximately $33.0 million, including working capital adjustments. The purchase price consisted of cash of $29.5 million funded by cash reserves and revolver borrowings, as well as a $3.5 million seller note, payable in quarterly installments over two years.
Effective September 8, 2014, the Company acquired substantially all of the mattress specialty retail assets and operations of Best Mattress Co., Inc. (“Best Mattress”), which operated Mattress Discounters retail stores in Pennsylvania, related to the operation of 15 mattress specialty retail stores, for a total purchase price of approximately $6.2 million, giving effect to certain preliminary adjustments, and is subject to further customary adjustments. The purchase price consisted of cash of $5.6 million funded by cash reserves and revolver borrowings, as well as a $0.6 million seller note, payable in quarterly installments over two years.
Effective September 30, 2014, the Company acquired substantially all of the mattress specialty retail assets and operations of Back to Bed Inc., M World Mattress LLC, MCStores LLC and TBE Orlando LLC (collectively, “Back to Bed”), which operated Back to Bed and Bedding Experts retail stores in Illinois, Indiana and Wisconsin and Bedding Experts and Mattress Barn retail stores in Florida, related to the operation of 131 mattress specialty retail stores, for a total purchase price of approximately $64.5 million, giving effect to certain preliminary adjustments, and is subject to further customary adjustments. The purchase price consisted of cash of $64.5 million funded by cash reserves and revolver borrowings, of which $19.0 million was placed in escrow.
Effective October 20, 2014, the Company acquired 100% of the outstanding equity interests in The Sleep Train, Inc., (“Sleep Train”) , which operates Sleep Train, Sleep Country, Mattress Discounters and Got Sleep retail stores in California, Washington, Oregon, Nevada, Idaho and Hawaii, related to the operation of 314 mattress specialty retail stores, for a total purchase price of approximately $442.5 million, giving effect to certain preliminary adjustments, and is subject to further customary adjustments, along with the assumption of certain additional liabilities totaling approximately $15 million. The Company expects to receive future annual cash income tax benefits of approximately $11 million over the next 15 years from deductible tax basis goodwill generated from the transaction, subject to the Company’s ability to generate future taxable income. The purchase price consisted of cash of $374.9 million (net of $23.4 million of cash acquired), of which $49.0 million was placed in escrow, and $44.2 million delivered in the form of 745,107 shares of common stock, par value $0.01 per share, of Mattress Firm Holding Corp. common stock as calculated in accordance with the terms of the purchase agreement.
Concurrently with the closing of the Sleep Train acquisition, the Company entered into a new senior secured credit facility with Barclays Bank PLC, Merrill Lynch, Pierce, Fenner & Smith Incorporated, J.P. Morgan Securities LLC, and UBS Securities LLC, as joint bookrunning managers and joint lead arrangers. At the time of Sleep Train acquisition, the senior secured credit facility was comprised of (i) an asset based revolver of $125 million that includes a sublimit for letters of credit and swingline loans, subject to certain conditions and limits and (ii) a term loan B borrowing
78
of $720 million (See Note 5). Approximately $49 million of the availability under the asset based revolver were drawn at closing to fund the Sleep Train acquisition.
Effective January 6, 2015 the Company acquired substantially all of the mattress specialty retail assets and operations of Sleep America LLC (“Sleep America”), which operated Sleep America retail stores in Arizona, related to the operation of 45 mattress specialty retail stores, for a total purchase price of approximately $12.4 million, giving effect to certain preliminary adjustments, and is subject to further customary adjustments. The purchase price consisted of cash of $12.4 million funded by cash reserves and revolver borrowings.
Effective January 13, 2015 the Company acquired substantially all of the mattress specialty retail assets and operations of Mattress World, Inc. (“Mattress World”), which operated Mattress World retail stores in Pennsylvania, related to the operation of 4 mattress specialty retail stores, for a total purchase price of approximately $2.2 million, giving effect to certain preliminary adjustments, and is subject to further customary adjustments. The purchase price consisted of cash of $2.2 million funded by cash reserves and revolver borrowings.
The allocation of the purchase price to the acquired assets and liabilities, based on management’s estimate of their fair values on the acquisition date, is as follows (in thousands):
|
|
|
|
|
|
|
|
|
|
|
|
|
|
|
|
|
|
|
|
|
|
|
|
|
|
|
|
|
|
|
|
|
|
|
|
Yotes |
|
Southern Max |
|
Sleep |
|
Mattress |
|
Best |
|
Back |
|
Sleep |
|
Sleep |
|
Mattress |
|
Total |
|
||||||||||
|
Cash |
|
$ |
— |
|
$ |
— |
|
$ |
1,637 |
|
$ |
5 |
|
$ |
9 |
|
$ |
— |
|
$ |
23,375 |
|
$ |
7 |
|
$ |
50 |
|
$ |
25,083 |
|
|
Accounts receivable |
|
|
504 |
|
|
— |
|
|
533 |
|
|
260 |
|
|
130 |
|
|
528 |
|
|
7,555 |
|
|
290 |
|
|
1 |
|
|
9,801 |
|
|
Inventories |
|
|
1,765 |
|
|
54 |
|
|
5,233 |
|
|
1,501 |
|
|
416 |
|
|
3,446 |
|
|
49,251 |
|
|
1,732 |
|
|
354 |
|
|
63,752 |
|
|
Prepaid expenses and other current assets |
|
|
380 |
|
|
— |
|
|
1,095 |
|
|
38 |
|
|
133 |
|
|
1,364 |
|
|
4,665 |
|
|
55 |
|
|
— |
|
|
7,730 |
|
|
Property and equipment |
|
|
1,275 |
|
|
232 |
|
|
6,743 |
|
|
1,681 |
|
|
854 |
|
|
7,142 |
|
|
25,786 |
|
|
3,115 |
|
|
266 |
|
|
47,094 |
|
|
Intangible assets |
|
|
3,980 |
|
|
— |
|
|
2,575 |
|
|
1,791 |
|
|
502 |
|
|
2,743 |
|
|
120,833 |
|
|
946 |
|
|
111 |
|
|
133,481 |
|
|
Goodwill |
|
|
10,444 |
|
|
152 |
|
|
58,511 |
|
|
32,283 |
|
|
4,961 |
|
|
53,405 |
|
|
281,252 |
|
|
10,890 |
|
|
2,238 |
|
|
454,136 |
|
|
Deferred income tax asset |
|
|
126 |
|
|
— |
|
|
562 |
|
|
192 |
|
|
329 |
|
|
353 |
|
|
1,655 |
|
|
— |
|
|
— |
|
|
3,217 |
|
|
Other assets |
|
|
142 |
|
|
14 |
|
|
344 |
|
|
276 |
|
|
13 |
|
|
357 |
|
|
1,383 |
|
|
1 |
|
|
1 |
|
|
2,531 |
|
|
Notes payable and current maturities of long-term debt |
|
|
— |
|
|
— |
|
|
— |
|
|
(72) |
|
|
— |
|
|
— |
|
|
(333) |
|
|
— |
|
|
— |
|
|
(405) |
|
|
Accounts payable |
|
|
(3,394) |
|
|
— |
|
|
(2,349) |
|
|
(2,781) |
|
|
(100) |
|
|
(2,572) |
|
|
(31,430) |
|
|
(1,768) |
|
|
(519) |
|
|
(44,913) |
|
|
Accrued liabilities |
|
|
(410) |
|
|
— |
|
|
(4,590) |
|
|
(1,789) |
|
|
(134) |
|
|
(1,733) |
|
|
(21,332) |
|
|
(1,916) |
|
|
(30) |
|
|
(31,934) |
|
|
Customer deposits |
|
|
(391) |
|
|
— |
|
|
(651) |
|
|
(181) |
|
|
(167) |
|
|
(636) |
|
|
(8,095) |
|
|
(418) |
|
|
(100) |
|
|
(10,639) |
|
|
Deferred rent liabilities |
|
|
(139) |
|
|
— |
|
|
(917) |
|
|
(106) |
|
|
(771) |
|
|
68 |
|
|
(2,847) |
|
|
(559) |
|
|
(169) |
|
|
(5,440) |
|
|
Long-term debt, net of current maturities |
|
|
— |
|
|
— |
|
|
— |
|
|
(69) |
|
|
— |
|
|
— |
|
|
(6,219) |
|
|
— |
|
|
— |
|
|
(6,288) |
|
|
Other noncurrent liabilities |
|
|
— |
|
|
— |
|
|
(887) |
|
|
— |
|
|
— |
|
|
— |
|
|
(2,953) |
|
|
— |
|
|
— |
|
|
(3,840) |
|
|
Fair value of assets and liabilities acquired |
|
|
14,282 |
|
|
452 |
|
|
67,839 |
|
|
33,029 |
|
|
6,175 |
|
|
64,465 |
|
|
442,546 |
|
|
12,375 |
|
|
2,203 |
|
|
643,366 |
|
|
Reconciliation to cash used in acquisitions: |
|
|
|
|
|
|
|
|
|
|
|
|
|
|
|
|
|
|
|
|
|
|
|
|
|
|
|
|
|
|
|
|
Seller note issued |
|
|
— |
|
|
— |
|
|
— |
|
|
(3,500) |
|
|
(600) |
|
|
— |
|
|
— |
|
|
— |
|
|
— |
|
|
(4,100) |
|
|
Fair value of equity consideration transferred |
|
|
— |
|
|
— |
|
|
(3,440) |
|
|
— |
|
|
— |
|
|
— |
|
|
(44,221) |
|
|
— |
|
|
— |
|
|
(47,661) |
|
|
Cash of acquired businesses |
|
|
— |
|
|
— |
|
|
(1,637) |
|
|
(5) |
|
|
(9) |
|
|
— |
|
|
(23,375) |
|
|
(7) |
|
|
(50) |
|
|
(25,083) |
|
|
Cash used in acquisitions, net of cash acquired |
|
$ |
14,282 |
|
$ |
452 |
|
$ |
62,762 |
|
$ |
29,524 |
|
$ |
5,566 |
|
$ |
64,465 |
|
$ |
374,950 |
|
$ |
12,368 |
|
$ |
2,153 |
|
$ |
566,522 |
|
The acquisitions resulted in $454.1 million of goodwill based on management’s estimate on the acquisition closing dates, of which $448.7 million will be deductible for income tax purposes over 15 years.
79
Intangible assets acquired in relation to the Sleep Train acquisition consist primarily of the indefinite lived Sleep Train tradename.
The net sales included in the Company’s consolidated statement of operations derived from the Yotes, Southern Max, Sleep Experts, Mattress Liquidators, Best Mattress, Back to Bed, Sleep Train, Sleep America and Mattress World acquisitions from the respective acquisition dates to February 3, 2015 were $31.8 million, $0.8 million, $55.3 million, $35.0 million, $3.6 million, $24.7 million, $147.5 million, $2.4 million and $0.2 million, respectively. The earnings included in the Company’s consolidated statement of operations derived from the Yotes, Southern Max, Sleep Experts, Mattress Liquidators, Best Mattress, Back to Bed, Sleep Train, Sleep America and Mattress World acquisitions from the respective acquisition dates to February 3, 2015 were $8.2 million, ($0.4) million, $14.8 million, $7.1 million, $0.5 million, $1.5 million, $38.1 million, $0.1 million and ($0.1) million, respectively.
As noted previously, acquisition-related costs for U.S. GAAP purposes are costs the acquirer incurs to effect a business combination, including advisory, legal, accounting, valuation, and other professional or consulting fees. The Company incurred a total of approximately $8.6 million of acquisition-related costs charged to general and administrative expenses during the fiscal year ended February 3, 2015.
The following table presents the selected consolidated financial information of the Company on a pro forma basis, assuming the acquisitions described above had occurred as of January 30, 2013. The historical financial information has been adjusted to give effect to the pro forma items that are directly attributable to the acquisition and are expected to have a continuing impact on the consolidated results.
The unaudited financial information set forth below has been compiled from the historical financial statements and other information, but is not necessarily indicative of the results that actually would have been achieved had the transactions occurred on the dates indicated or that may be achieved in the future (amounts in thousands, except per share amounts):
|
|
|
|
|
|
|
|
|
|
|
|
|
|
Fiscal Year Ended February 3, 2015 |
|||||||
|
|
|
As Reported |
|
Pro Forma |
|
Pro Forma |
|||
|
Net sales |
|
$ |
1,806,029 |
|
$ |
511,735 |
|
$ |
2,317,764 |
|
Net income |
|
|
44,251 |
|
|
2,555 |
|
|
46,806 |
|
Diluted net income per common share |
|
$ |
1.27 |
|
$ |
0.08 |
|
$ |
1.33 |
|
|
|
|
|
|
|
|
|
|
|
|
|
|
Fiscal Year Ended January 28, 2014 |
|||||||
|
|
|
As Reported |
|
Pro Forma |
|
Pro Forma |
|||
|
Net sales |
|
$ |
1,216,812 |
|
$ |
565,577 |
|
$ |
1,782,389 |
|
Net income |
|
|
52,924 |
|
|
4,075 |
|
|
56,999 |
|
Diluted net income per common share |
|
$ |
1.55 |
|
$ |
0.12 |
|
$ |
1.67 |
*Due to rounding to the nearest cent, totals may not equal the sum of the lines in the table above.
In the fiscal year ended February 2, 2016, the Company increased the Sleep Train liabilities by $6.1 million, primarily related to the warranty reserve, increased the property, plant and equipment related to Sleep Train by $0.3 million and increased the deferred tax asset balances related to the fiscal 2014 acquisitions of the assets and operations described above in the amount of $2.4 million, resulting in $3.4 million of additional goodwill. A working capital adjustment in fiscal 2015 related to the Sleep Train acquisition described above reduced cash used in acquisitions by approximately $0.1 million.
Acquisitions During Fiscal 2013—Effective June 14, 2013, the Company acquired substantially all of the assets and liabilities of Olejo, Inc. (“Olejo”), a growing online retailer focused primarily on mattresses and related accessories, for a total purchase price of approximately $3.2 million, including working capital adjustments. The purchase price consisted of cash of $2.0 million (net of $0.1 million of cash acquired), and a contingent earnout of
80
$1.1 million payable over the next two fiscal years based on the achievement of certain defined sales targets for the Company’s e‑commerce sales business.
Effective November 13, 2013, the Company acquired the equity interests of NE Mattress People, LLC (“Mattress People”) relating to the operation of five mattress specialty stores located in Nebraska and Iowa for a total purchase price of approximately $2.0 million, including working capital adjustments.
Effective December 10, 2013, the Company acquired the leasehold interests, store assets, distribution center assets and related inventories, and assumed certain liabilities of a franchisee—Perfect Mattress of Wisconsin, LLC (“Perfect Mattress”) relating to the operation of 39 mattress specialty stores located in Wisconsin and Illinois for a total purchase price of approximately $6.5 million, subject to customary post‑closing adjustments. Under the terms of the purchase agreement, Perfect Mattress provided unsecured financing to the Company in the amount of approximately $2.0 million in connection with the purchase, which is payable over a term of one year in quarterly installments, including interest at an annual rate of 7.75%. All borrowings have been repaid by the Company.
Effective December 31, 2013, the Company acquired the leasehold interests, store assets and related inventories of two mattress specialty stores in the Houston market (“Mattress Expo”) for a total purchase price of approximately $0.4 million.
The allocation of the purchase price to the acquired assets and liabilities, based on management’s estimate of their fair values on the acquisition date, is as follows (in thousands):
|
|
|
|
|
|
|
|
|
|
|
|
|
|
|
|
|
|
|
|
|
|
|
Mattress |
|
Perfect |
|
Mattress |
|
|
|
|
||||
|
|
|
Olejo |
|
People |
|
Mattress |
|
Expo |
|
Total |
|
|||||
|
Cash |
|
$ |
79 |
|
$ |
48 |
|
$ |
— |
|
$ |
— |
|
$ |
127 |
|
|
Accounts receivable |
|
|
2 |
|
|
33 |
|
|
379 |
|
|
— |
|
|
414 |
|
|
Inventories |
|
|
17 |
|
|
306 |
|
|
1,966 |
|
|
26 |
|
|
2,315 |
|
|
Prepaid expenses and other current assets |
|
|
16 |
|
|
35 |
|
|
344 |
|
|
— |
|
|
395 |
|
|
Property and equipment |
|
|
— |
|
|
547 |
|
|
2,422 |
|
|
— |
|
|
2,969 |
|
|
Intangible assets |
|
|
2,317 |
|
|
— |
|
|
— |
|
|
— |
|
|
2,317 |
|
|
Goodwill |
|
|
1,720 |
|
|
1,161 |
|
|
4,469 |
|
|
319 |
|
|
7,669 |
|
|
Deferred income tax asset |
|
|
— |
|
|
142 |
|
|
198 |
|
|
— |
|
|
340 |
|
|
Other assets |
|
|
12 |
|
|
29 |
|
|
270 |
|
|
15 |
|
|
326 |
|
|
Accounts payable |
|
|
(851) |
|
|
(150) |
|
|
(2,759) |
|
|
— |
|
|
(3,760) |
|
|
Accrued liabilities |
|
|
— |
|
|
(117) |
|
|
(495) |
|
|
— |
|
|
(612) |
|
|
Customer deposits |
|
|
(117) |
|
|
(25) |
|
|
(324) |
|
|
— |
|
|
(466) |
|
|
Fair value of assets and liabilities acquired |
|
|
3,195 |
|
|
2,009 |
|
|
6,470 |
|
|
360 |
|
|
12,034 |
|
|
Reconciliation to cash used in acquisitions: |
|
|
|
|
|
|
|
|
|
|
|
|
|
|
|
|
|
Seller note issued |
|
|
— |
|
|
— |
|
|
(2,000) |
|
|
— |
|
|
(2,000) |
|
|
Fair value of contingent consideration |
|
|
(1,074) |
|
|
— |
|
|
— |
|
|
— |
|
|
(1,074) |
|
|
Cash of acquired businesses |
|
|
(79) |
|
|
(48) |
|
|
— |
|
|
— |
|
|
(127) |
|
|
Cash used in acquisitions, net of cash acquired |
|
$ |
2,042 |
|
$ |
1,961 |
|
$ |
4,470 |
|
$ |
360 |
|
$ |
8,833 |
|
The acquisitions resulted in $7.7 million of goodwill based on management’s estimate on the acquisition closing dates, of which $1.1 million will not be deductible for income tax purposes.
Intangible assets represent the Olejo trade name, the technology platform acquired in the acquisition and non‑compete agreements entered into with certain Olejo personnel, which are being amortized over their estimated useful lives of 20, 15 and 4 years, respectively.
The net sales included in the Company’s consolidated statement of operations derived from the Olejo, Mattress People, Perfect Mattress and Mattress Expo acquisitions from the respective acquisition dates to January 28, 2014 were $4.3 million, $0.6 million, $2.5 million and $0.1 million, respectively.
81
As noted previously, acquisition‑related costs for U.S. GAAP purposes are costs the acquirer incurs to effect a business combination, including advisory, legal, accounting, valuation, and other professional or consulting fees. The Company incurred a total of approximately $0.3 million of acquisition‑related costs charged to general and administrative expenses during fiscal 2013 related to the acquisitions discussed above.
The acquisitions above were not material to the Company’s financial position or results of operations; therefore, pro forma operating results have not been included in this disclosure.
In the fiscal year ended February 3, 2015, the Company adjusted the deferred tax balances related to the fiscal 2013 acquisitions of the assets and operations described above resulting in $0.6 million of additional goodwill.
3. Property and Equipment
Property and equipment consist of the following (in thousands):
|
|
|
|
|
|
|
|
|
|
|
|
February 3, |
|
February 2, |
|
||
|
|
|
2015 |
|
2016 |
|
||
|
Land |
|
$ |
1,159 |
|
$ |
— |
|
|
Building |
|
|
1,895 |
|
|
— |
|
|
Leasehold improvements |
|
|
277,815 |
|
|
340,029 |
|
|
Equipment, computers and software |
|
|
74,122 |
|
|
83,879 |
|
|
Store signs |
|
|
39,518 |
|
|
56,149 |
|
|
Furniture and fixtures |
|
|
31,494 |
|
|
36,730 |
|
|
Vehicles |
|
|
1,761 |
|
|
1,738 |
|
|
Property and equipment |
|
|
427,764 |
|
|
518,525 |
|
|
Accumulated depreciation |
|
|
(160,162) |
|
|
(201,074) |
|
|
Property and equipment, net |
|
$ |
267,602 |
|
$ |
317,451 |
|
Depreciation expense was $29.5 million, $41.7 million and $62.2 million for fiscal 2013, fiscal 2014 and fiscal 2015, respectively. Based upon the review of the performance of individual stores, including a decline in performance of certain stores, impairment losses of approximately $0.5 million, $0.9 million and $1.5 million were recognized during fiscal 2013, fiscal 2014 and fiscal 2015, respectively. Impairment losses are reported as a component of “Loss on store closings and impairment of store assets” in the statements of operations. The impairment loss amounts were determined as the excess of the carrying value of property and equipment of those stores with potential impairment in excess of the estimated fair value based on estimated cash flows. Estimated cash flows are primarily based on projected revenues, operating costs and maintenance capital expenditures of individual stores and are discounted based on comparable industry average rates for weighted average cost of capital.
In addition impairment losses of approximately $4.0 million were recognized during fiscal 2015 related to sign write-offs in connection with rebranding stores booked as a component of “Loss on store closings and impairment of store assets.”
82
4. Goodwill and Intangible Assets
The Company’s goodwill is all attributable to the retail segment. A summary of the changes in the carrying amounts of goodwill and non‑amortizable intangible assets for fiscal 2014 and fiscal 2015 were as follows (in thousands):
|
|
|
|
|
|
Nonamortizable |
|
|
|
|
|
Goodwill |
|
Intangibles |
|
||
|
Balance at January 28, 2014 |
|
$ |
366,647 |
|
$ |
72,066 |
|
|
Prior year business acquisition adjustment (See Note 2) |
|
|
566 |
|
|
— |
|
|
Current period business acquisitions (see Note 2) |
|
|
454,136 |
|
|
106,711 |
|
|
Deferred tax adjustment (See Note 6) |
|
|
— |
|
|
(419) |
|
|
Balance at February 3, 2015 |
|
|
821,349 |
|
|
178,358 |
|
|
Prior year business acquisition adjustment (See Note 2) |
|
|
2,842 |
|
|
— |
|
|
Current period business acquisitions (see Note 2) |
|
|
2,537 |
|
|
— |
|
|
Balance at February 2, 2016 |
|
$ |
826,728 |
|
$ |
178,358 |
|
A summary of the changes in the carrying amounts of amortizable intangible assets for fiscal 2014 and fiscal 2015 were as follows (in thousands):
|
|
|
|
|
|
|
|
|
Net |
|
|
|
|
|
|
|
|
Accumulated |
|
Carrying |
|
||
|
|
|
Gross Cost |
|
Amortization |
|
Value |
|
|||
|
Balance at January 28, 2014 |
|
$ |
16,050 |
|
|
(3,725) |
|
|
12,325 |
|
|
Current period business acquisitions (See Note 2) |
|
|
26,770 |
|
|
— |
|
|
26,770 |
|
|
Trademarks defense |
|
|
249 |
|
|
— |
|
|
249 |
|
|
Amortization expense |
|
|
— |
|
|
(1,749) |
|
|
(1,749) |
|
|
Balance at February 3, 2015 |
|
|
43,069 |
|
|
(5,474) |
|
|
37,595 |
|
|
Current period business acquisitions (See Note 2) |
|
|
544 |
|
|
— |
|
|
544 |
|
|
Reacquired franchise rights |
|
|
50 |
|
|
— |
|
|
50 |
|
|
Non-compete agreement |
|
|
1,000 |
|
|
|
|
|
1,000 |
|
|
Trademarks defense |
|
|
273 |
|
|
— |
|
|
273 |
|
|
Amortization expense |
|
|
— |
|
|
(2,878) |
|
|
(2,878) |
|
|
Balance at February 2, 2016 |
|
$ |
44,936 |
|
$ |
(8,352) |
|
$ |
36,584 |
|
The components of intangible assets were as follows (dollar amounts in thousands):
|
|
|
|
|
|
February 3, 2015 |
|
February 2, 2016 |
||||||||||||||
|
|
|
|
|
|
Gross |
|
|
|
|
|
Gross |
|
|
|
|
||||||
|
|
|
|
Useful Life |
|
Carrying |
|
Accumulated |
|
Net |
|
Carrying |
|
Accumulated |
|
Net |
||||||
|
|
|
|
(Years) |
|
Amount |
|
Amortization |
|
Amount |
|
Amount |
|
Amortization |
|
Amount |
||||||
|
Nonamortizing: |
|
|
|
|
|
|
|
|
|
|
|
|
|
|
|
|
|
|
|
|
|
|
Trade names and trademarks |
|
|
|
|
$ |
178,358 |
|
$ |
— |
|
$ |
178,358 |
|
$ |
178,358 |
|
$ |
— |
|
$ |
178,358 |
|
Amortizing: |
|
|
|
|
|
|
|
|
|
|
|
|
|
|
|
|
|
|
|
|
|
|
Franchise agreement rights |
|
|
20 |
|
|
5,313 |
|
|
854 |
|
|
4,459 |
|
|
5,907 |
|
|
1,266 |
|
|
4,641 |
|
Acquired trade names and trademarks |
|
|
2 - 20 |
|
|
34,699 |
|
|
3,281 |
|
|
31,418 |
|
|
34,972 |
|
|
5,518 |
|
|
29,454 |
|
Software technology |
|
|
15 |
|
|
1,573 |
|
|
170 |
|
|
1,403 |
|
|
1,573 |
|
|
275 |
|
|
1,298 |
|
Non-compete agreements |
|
|
3 - 5 |
|
|
1,484 |
|
|
1,169 |
|
|
315 |
|
|
2,484 |
|
|
1,293 |
|
|
1,191 |
|
Intangible assets, net |
|
|
|
|
$ |
221,427 |
|
$ |
5,474 |
|
$ |
215,953 |
|
$ |
223,294 |
|
$ |
8,352 |
|
$ |
214,942 |
83
|
|
|
|
|
|
|
|
|
|
|
|
|
|
|
|
|
|
|
|
|
|
|
Expense included in general and administrative expense related to the amortization of intangible assets was $0.8 million, $1.7 million and $2.9 million for fiscal 2013, fiscal 2014 and fiscal 2015, respectively.
The weighted average amortization period remaining for intangible assets is 13 years. As of February 2, 2016, amortization expense for intangible assets is expected to be as follows for each of the next five fiscal years (in thousands):
|
Fiscal Year |
|
|
|
|
|
2016 |
|
$ |
3,178 |
|
|
2017 |
|
$ |
3,060 |
|
|
2018 |
|
$ |
3,054 |
|
|
2019 |
|
$ |
3,007 |
|
|
2020 |
|
$ |
2,993 |
|
|
Thereafter |
|
$ |
21,292 |
|
No goodwill impairment charges were recognized in fiscal 2013, fiscal 2014 and fiscal 2015.
No impairment charges related to intangible assets were recognized in fiscal 2013, fiscal 2014 and fiscal 2015.
5. Notes Payable and Long‑term Debt
Notes payable and long‑term debt consists of the following (in thousands):
|
|
|
February 3, |
|
February 2, |
|
||
|
|
|
2015 |
|
2016 |
|
||
|
Senior Credit Facility - term loans |
|
$ |
718,200 |
|
$ |
691,000 |
|
|
Senior Credit Facility - term loans discount |
|
|
(6,823) |
|
|
(5,887) |
|
|
Senior Credit Facility - revolver borrowings |
|
|
50,000 |
|
|
— |
|
|
Equipment financing and other notes payable |
|
|
8,661 |
|
|
5,808 |
|
|
Total long-term debt |
|
|
770,038 |
|
|
690,921 |
|
|
Current maturities of long-term debt |
|
|
9,947 |
|
|
8,664 |
|
|
Long-term debt, net of current maturities |
|
$ |
760,091 |
|
$ |
682,257 |
|
Senior Credit Facility— Effective October 20, 2014, Mattress Holding Corp. (“MHC”), a Delaware corporation and indirect subsidiary of Mattress Firm Holding Corp., entered into a $125 million asset-backed loan credit agreement dated October 20, 2014, among MHC, as borrower, Mattress Holdco, Inc., the lenders party thereto, and Barclays Bank PLC, as administrative agent, collateral agent and issuer (the “ABL Credit Agreement”).
The ABL Credit Agreement is a committed senior revolving credit facility, secured by the assets of the borrower and the guarantors, that permits aggregate borrowings of up to $125 million, and contains within the facility, a letter of credit facility that, at any time outstanding, is limited to $50 million and a swing line facility that, at any time outstanding, is limited to $20 million. Subject to customary conditions, the Company may request that the lenders’ aggregate commitments with respect to the revolving credit facility be increased by up to $75 million. The maturity date under the ABL Credit Agreement is October 20, 2019.
Loans under the ABL Credit Agreement bear interest by reference, at the Company’s election, to the LIBOR rate or base rate, provided, that swing line loans bear interest by reference only to the base rate. The applicable margin on LIBOR rate loans varies from 1.25% to 1.75% and the applicable margin on base rate loans varies from 0.25% to 0.75%, in each case determined based upon the Company’s average excess available borrowing capacity for the prior three month period. A letter of credit issuance fee is payable by the Company equal to 0.125% per annum multiplied by the average daily amount available to be drawn under the applicable letter of credit, as well as an additional fee equal to
84
the applicable margin for LIBOR rate loans times the daily amount available to be drawn under all outstanding letters of credit. The commitment fee rate payable to the lenders for each of the revolving facility and term facility varies from 0.25% to 0.375%.
Mattress Holdco, Inc., the parent company of the borrower, and each domestic subsidiary of MHC other than immaterial subsidiaries, as determined by certain ratios in the credit agreement, has unconditionally guaranteed all existing and future indebtedness and liabilities of the other guarantors and the Company arising under the ABL Credit Agreement and other loan documents. Mattress Holdco, Inc. and subsidiaries own all assets and liabilities of the Company, with the exception of a minimal cash balance. See Schedule I for the condensed parent company financial statements of Mattress Firm Holding Corp., the indirect parent of Mattress Holdco, Inc.
The ABL Credit Agreement requires compliance with one financial covenant. The Company cannot permit its fixed charge coverage ratio to fall below 1.0. The ABL Credit Agreement generally defines the fixed charge coverage ratio as the ratio of (a) adjusted EBITDA, less capital expenditures, less all taxes paid or payable in cash by the borrower and guarantors to (b) the sum of fixed charges, in each case, determined as of the most recently ended fiscal quarter. As of February 2, 2016, the fixed charge coverage ratio was 2.91 to 1.0. The ABL Credit Agreement also contains customary representations, warranties and affirmative and negative covenants.
Events of default under the ABL Credit Agreement include failure to pay principal or interest when due, failure to comply with the financial and operational covenants, as well as a cross default event, Loan Document (as defined in the ABL Credit Agreement) enforceability event, change of control event and bankruptcy and other insolvency events. If an event of default occurs and is continuing, then the lenders holding the majority of the outstanding loans have the right, among others, to (i) terminate the commitments under the ABL Credit Agreement, (ii) accelerate and require the Company to repay all the outstanding amounts owed under any Loan Document (provided that in limited circumstances with respect to insolvency and bankruptcy of the Company, such acceleration is automatic), and (iii) require the Company to cash collateralize any outstanding letters of credit.
There were no outstanding ABL Credit Agreement borrowings at February 2, 2016. Outstanding letters of credit on the revolving facility were $4.2 million at February 2, 2016, resulting in $97.6 million of availability for revolving borrowings.
Effective October 20, 2014, MHC entered into a $720 million term loan credit agreement dated October 20, 2014, among MHC, as borrower, Mattress Holdco, Inc., the lenders party thereto, and Barclays Bank PLC, as administrative agent and collateral agent (the “Term Loan Credit Agreement”). The Term Loan Credit Agreement and the ABL Credit Agreement are collectively referred to as the “Senior Credit Facility”.
Term loans in the aggregate principal amount of $720 million were issued under the Term Loan Credit Agreement on October 20, 2014. The maturity date under the Term Loan Credit Agreement is October 20, 2021. Loans under the Term Loan Credit Agreement bear interest by reference, at the Company’s election, to the LIBOR rate, varying from 4.00% to 4.25% or base rate, varying from 3.00% to 3.25%, in each case determined based upon the Company’s total net leverage ratio. The weighted average interest rate applicable to outstanding borrowings under the Term Loan Credit Agreement was 5.00% as of February 2, 2016.
Mattress Holdco, Inc., the parent company of the borrower, and each domestic subsidiary of MHC other than immaterial subsidiaries, as determined by certain ratios in the credit agreement, has unconditionally guaranteed all existing and future indebtedness and liabilities of the other guarantors and the Company arising under the Term Loan Credit Agreement and other loan documents. The Term Loan Credit Agreement contains customary representations, warranties and affirmative and negative covenants. Mattress Holdco, Inc. and subsidiaries own all assets and liabilities of the Company, with the exception of a minimal cash balance. See Schedule I for the condensed parent company financial statements of Mattress Firm Holding Corp., the indirect parent of Mattress Holdco, Inc.
Events of default under the Term Loan Credit Agreement include failure to pay principal or interest when due, failure to comply with the covenants, as well as a cross default event, Loan Document (as defined in the Term Loan Credit Agreement) enforceability event, change of control event and bankruptcy and other insolvency events. If an event
85
of default occurs and is continuing, then the lenders holding a majority of the outstanding loans have the right, among others, to (i) terminate the commitments under the Term Loan Credit Agreement, and (ii) accelerate and require the Company to repay all the outstanding amounts owed under any Loan Document (provided that in limited circumstances with respect to insolvency and bankruptcy of the Company, such acceleration is automatic).
Equipment Financing and Other Short-Term Notes Payable—A subsidiary of the Company has outstanding notes payable related to the purchase of mattress specialty retail stores formerly operated by Mattress Liquidators, in the aggregate principal amount of $0.7 million that bears interest at 6.00% with quarterly principal and interest payments through fiscal 2016.
In conjunction with the acquisition of Sleep Train the Company assumed notes payable in the aggregate principal amount of $4.0 million that primarily bear interest at 2.97% with monthly principal and interest payments through fiscal 2027.
Covenant Compliance—We were in compliance with all of the financial covenants required under the Senior Credit Facility and our other indebtedness as of February 2, 2016. We believe that we will be able to maintain compliance with the various covenants required under our debt agreements for the next twelve months without amending any of the debt agreements or requesting waivers from the lenders that are party to the debt agreements.
Future Maturities of Notes Payable and Long‑Term Debt—The aggregate maturities of notes payable and long‑term debt at February 2, 2016 were as follows (in thousands):
|
|
|
|
|
|
|
Fiscal Year |
|
|
|
|
|
2016 |
|
$ |
8,664 |
|
|
2017 |
|
|
6,523 |
|
|
2018 |
|
|
6,523 |
|
|
2019 |
|
|
6,523 |
|
|
2020 |
|
|
6,523 |
|
|
Thereafter |
|
|
656,165 |
|
|
|
|
$ |
690,921 |
|
6. Income Taxes
Income tax expense (benefit) consists of the following (in thousands):
|
|
|
|
|
|
|
|
|
|
|
|
|
|
|
Fiscal |
|
Fiscal |
|
Fiscal |
|
|||
|
|
|
2013 |
|
2014 |
|
2015 |
|
|||
|
Current: |
|
|
|
|
|
|
|
|
|
|
|
Federal |
|
$ |
17,872 |
|
$ |
18,718 |
|
$ |
12,387 |
|
|
State |
|
|
2,937 |
|
|
5,248 |
|
|
2,821 |
|
|
|
|
|
20,809 |
|
|
23,966 |
|
|
15,208 |
|
|
Deferred: |
|
|
|
|
|
|
|
|
|
|
|
Federal |
|
|
10,447 |
|
|
5,914 |
|
|
21,761 |
|
|
State |
|
|
1,902 |
|
|
(645) |
|
|
2,104 |
|
|
|
|
|
12,349 |
|
|
5,269 |
|
|
23,865 |
|
|
Total income tax expense |
|
$ |
33,158 |
|
$ |
29,235 |
|
$ |
39,073 |
|
86
The differences between the effective tax rate reflected in the provision for income taxes on income before income taxes and the statutory federal rate is as follows (in thousands, except for percentages):
|
|
|
|
|
|
|
|
|
|
|
|
|
|
|
Fiscal |
|
Fiscal |
|
Fiscal |
|
|||
|
|
|
2013 |
|
2014 |
|
2015 |
|
|||
|
Computed tax at 35% of income |
|
$ |
30,129 |
|
$ |
25,720 |
|
$ |
36,258 |
|
|
State income taxes, net of federal income tax benefit |
|
|
2,994 |
|
|
3,296 |
|
|
3,845 |
|
|
Non-deductible items. |
|
|
165 |
|
|
528 |
|
|
524 |
|
|
Other |
|
|
(130) |
|
|
(309) |
|
|
(1,554) |
|
|
Total income tax expense |
|
$ |
33,158 |
|
$ |
29,235 |
|
$ |
39,073 |
|
|
Effective income tax rate |
|
|
38.5 |
% |
|
39.8 |
% |
|
37.7 |
% |
The effective tax rate was 37.7% for the year ended February 2, 2016 compared to 39.8% for the year ended February 3, 2015, and differs primarily as a result of the impact of state income taxes and the reversal of a previously unrecognized tax position in the amount of $0.4 million as a result of settling an IRS audit (discussed below).
The effective tax rate was 39.8% for the year ended February 3, 2015 compared to 38.5% for the year ended January 28, 2014, and differs primarily as a result of the impact of state income taxes and secondary offering costs in 2014.
Deferred income taxes reflect the net tax effects of temporary differences between the carrying amount of assets and liabilities for financial reporting purposes and the amounts used for income tax purposes. The significant components of the Company’s deferred tax assets and liabilities are as follows (in thousands):
|
|
|
February 3, |
|
February 2, |
|
||
|
|
|
Noncurrent |
|
Noncurrent |
|
||
|
Deferred tax assets (liabilities): |
|
|
|
|
|
|
|
|
Allowance for doubtful accounts |
|
$ |
562 |
|
$ |
305 |
|
|
Inventories |
|
|
1,039 |
|
|
2,044 |
|
|
Accrued liabilities |
|
|
7,262 |
|
|
7,171 |
|
|
Noncurrent liabilities |
|
|
12,570 |
|
|
20,077 |
|
|
Net operating loss carryforward |
|
|
2,292 |
|
|
1,272 |
|
|
Nonamortizing intangible assets |
|
|
(27,500) |
|
|
(27,476) |
|
|
Goodwill |
|
|
(11,287) |
|
|
(24,749) |
|
|
Prepaid expenses |
|
|
(966) |
|
|
(2,965) |
|
|
Amortizable intangible assets |
|
|
1,442 |
|
|
(660) |
|
|
Property and equipment |
|
|
(17,987) |
|
|
(27,318) |
|
|
Net deferred income tax assets (liabilities) |
|
$ |
(32,573) |
|
$ |
(52,299) |
|
|
|
|
|
|
|
|
|
|
In November 2015, the FASB issued ASU No. 2015-17, Income Taxes (Topic 740): Balance Sheet Classification of Deferred Taxes, which requires that all deferred tax assets and liabilities, along with any related valuation allowance, be classified as noncurrent in the balance sheet. As a result, each jurisdiction will now only have one net noncurrent deferred tax asset or liability. However, the new guidance does not change the existing requirement that only permits offsetting within a jurisdiction. Companies are still prohibited from offsetting deferred tax liabilities from one jurisdiction against deferred tax assets of another jurisdiction. The amendments in this accounting standard are effective for public companies for interim and annual reporting periods beginning after December 15, 2016, with early application permitted. The Company has retrospectively applied the change in accounting as of February 2, 2016. As such, the prior year amounts previously reported as current deferred tax assets and noncurrent deferred tax liabilities were recast and resulted in a decrease of $8.9 million, respectively, in the Consolidated Balance Sheet as of February 3, 2015. The change in accounting principle does not have an impact on the Company’s results of operations, cash flows or stockholders’ equity.
87
During fiscal 2012, the Company fully utilized the remaining net operating loss carryforwards generated in prior years to reduce a significant portion of federal and state current income tax requirements. Additional net operating loss carryforwards were inherited in the acquisition of MGHC Holding Corporation during fiscal 2012 and, after application of Section 382 of the Internal Revenue Code of 1986 as amended, are limited to an average use of $1.8 million per year over the next two years. The Company had approximately $3.5 million of remaining net operating loss carryforwards at February 2, 2016 from the MGHC Holding Corporation acquisition that will begin expiring in fiscal 2029 if not utilized to offset future taxable income.
The Company has an intangible asset for the Mattress Firm trade name that arose from an acquisition prior to December 15, 2008. The intangible asset has a tax basis that generates amortization for tax purposes, for which there is no corresponding expense for financial reporting purposes since the asset has an indefinite life and is non‑amortizable. The tax benefit from the amortization of the intangible asset, a portion which was suspended in prior year net operating losses and was realized with the utilization of net operating loss carryforwards during fiscal 2012, was recorded as a direct reduction of the financial reporting carrying value of intangible assets in the amount of $0.4 million and $1.2 million during fiscal 2014 and fiscal 2013, respectively. The tax benefits of this intangible asset have been fully realized as of February 3, 2015.
The Company evaluates the realizability of its deferred tax assets on a quarterly basis. The Company performed an analysis of all available evidence, both positive and negative, consistent with the provisions of ASC 740‑10‑30‑17 “Establishment of a Valuation Allowance for Deferred Tax Assets” and determined that it was more likely than not that the deferred tax assets would be realized for each quarterly evaluation during fiscal 2015.
The Company and its subsidiaries are included in a consolidated income tax return in the U.S. federal jurisdiction and file separate income tax returns in several states. As of February 2, 2016, open tax years in federal and some state jurisdictions date back to 2013 and 2012, respectively. The Company and its subsidiaries settled an income tax examination of fiscal 2012 by the Internal Revenue Service during fiscal 2015.
In the normal course of business the Company provides for uncertain tax positions and the related interest and penalties and adjusts its unrecognized tax benefits and accrued interest and penalties accordingly. A reconciliation of the beginning and ending amount of unrecognized tax benefits is as follows (in thousands):
|
|
|
|
|
|
|
Balances at January 29, 2013 |
|
$ |
385 |
|
|
Increases related to prior year tax positions |
|
|
15 |
|
|
Balance at January 28, 2014 |
|
|
400 |
|
|
Increases related to prior year tax positions |
|
|
20 |
|
|
Balance at February 3, 2015 |
|
|
420 |
|
|
Decreases related to prior year tax positions |
|
|
(420) |
|
|
Balance at February 2, 2016 |
|
$ |
— |
|
As a result of settling the IRS audit of fiscal year 2012 the Company recognized the benefit of a previously unrecognized tax position bringing the liability down from $0.4 million as of February 3, 2015 to zero as of February 2, 2016.
The Company recognizes interest and penalties related to uncertain tax positions in income tax expense. There was no accrued interest as of February 2, 1016 and less than $0.1 million accrued interest related to uncertain tax positions as of February 3, 2015.
The determination of the consolidated provision for income taxes, deferred tax assets and liabilities and related valuation allowance requires management to make judgments and estimates. Although management believes that its tax estimates are reasonable, the ultimate tax determination involves significant judgments that could become subject to audit by tax authorities in the ordinary course of business, as well as the generation of sufficient future taxable income.
88
7. Prepaid Expenses and Other Current Assets
Prepaid expenses and other current assets consist of the following (in thousands):
|
|
|
|
|
|
|
|
|
|
|
|
February 3, |
|
February 2, |
|
||
|
|
|
2015 |
|
2016 |
|
||
|
Prepaid rent |
|
$ |
26,760 |
|
$ |
32,098 |
|
|
Prepaid insurance |
|
|
2,213 |
|
|
5,752 |
|
|
Prepaid computer software and hardware services |
|
|
1,488 |
|
|
3,317 |
|
|
Prepaid income taxes |
|
|
— |
|
|
2,722 |
|
|
Prepaid point-of-purchase inventory |
|
|
1,422 |
|
|
2,032 |
|
|
Prepaid special event space rental |
|
|
2,511 |
|
|
1,924 |
|
|
Prepaid advertising |
|
|
1,662 |
|
|
1,903 |
|
|
Prepaid music royalty fees |
|
|
294 |
|
|
117 |
|
|
Prepaid venue sponsorship |
|
|
1,078 |
|
|
— |
|
|
Other |
|
|
5,591 |
|
|
5,311 |
|
|
|
|
$ |
43,019 |
|
$ |
55,176 |
|
8. Accrued Liabilities and Other Noncurrent Liabilities
The Company estimates certain liabilities in an effort to recognize those expenses in the period incurred. The most significant estimates relate to employee wages, payroll taxes and withholdings, product warranty returns (see Note 1) and insurance‑related expenses, significant portions of which are self‑insured related to workers’ compensation and employee health insurance.
Accrued liabilities consist of the following (in thousands):
|
|
|
|
|
|
|
|
|
|
|
|
February 3, |
|
February 2, |
|
||
|
|
|
2015 |
|
2016 |
|
||
|
Unbilled advertising |
|
$ |
17,518 |
|
$ |
22,452 |
|
|
Employee wages, payroll taxes and withholdings |
|
|
17,701 |
|
|
13,537 |
|
|
Sales and property tax |
|
|
15,832 |
|
|
10,642 |
|
|
Insurance |
|
|
6,454 |
|
|
8,837 |
|
|
Product warranty returns |
|
|
3,340 |
|
|
4,830 |
|
|
Accrued employee compensated absences |
|
|
4,952 |
|
|
4,756 |
|
|
Accrued rent |
|
|
3,530 |
|
|
3,526 |
|
|
Accrued construction in‑progress costs |
|
|
8,607 |
|
|
3,274 |
|
|
Utilities |
|
|
2,015 |
|
|
2,391 |
|
|
Sales returns and exchanges |
|
|
3,051 |
|
|
2,353 |
|
|
Accrued interest |
|
|
1,346 |
|
|
843 |
|
|
Accrued acquisition costs |
|
|
5,980 |
|
|
790 |
|
|
Closed store lease reserve |
|
|
1,065 |
|
|
630 |
|
|
Income tax payable |
|
|
750 |
|
|
— |
|
|
Other |
|
|
6,109 |
|
|
5,008 |
|
|
|
|
$ |
98,250 |
|
$ |
83,869 |
|
89
Other noncurrent liabilities consist of the following (in thousands):
|
|
|
|
|
|
|
|
|
|
|
|
February 3, |
|
February 2, |
|
||
|
|
|
2015 |
|
2016 |
|
||
|
Deferred lease liabilities |
|
$ |
72,846 |
|
$ |
95,047 |
|
|
Deferred vendor incentives |
|
|
16,748 |
|
|
35,026 |
|
|
Product warranty returns, less current portion |
|
|
3,511 |
|
|
8,784 |
|
|
Other |
|
|
1,683 |
|
|
3,766 |
|
|
|
|
$ |
94,788 |
|
$ |
142,623 |
|
9. Stockholders’ Equity
Dividends
As a holding company, the ability of Mattress Firm Holding Corp. to pay dividends is limited by its ability to receive dividends or distributions from its subsidiaries. The Senior Credit Facility imposes restrictions on Mattress Holding Corp. and its subsidiary guarantors with respect to the payment of dividends to Mattress Firm Holding Corp. As of February 2, 2016, the net assets of Mattress Holding Corp. subject to such restrictions under the Senior Credit Facility was $511.4 million. Since inception of Mattress Firm Holding Corp. no dividends have been paid to its stockholders.
Common Stock
On December 16, 2014, the Company completed the secondary offering of 2,512,899 shares of common stock by certain selling shareholders. The Company did not sell any shares of common stock in the offering and did not receive any proceeds from the sale. The Company incurred approximately $0.6 million in costs related to the offering.
On April 13, 2015, the Company completed the secondary offering of 1,505,000 shares of common stock by certain selling stockholders. The Company did not sell any shares of common stock in the offering and did not receive any proceeds from the sale. The Company incurred approximately $0.5 million in costs related to the offering.
Common Stock Reserved for Future Issuance
As further described in Note 14, approximately 4,206,000 shares of common stock are reserved for issuances under the 2011 Omnibus Incentive Plan. As of February 2, 2016, there were 2,200,333 shares available for future grants under the 2011 Omnibus Incentive Plan.
Earnings per Share
Basic net income per common share is computed by dividing the net income applicable to common shares by the weighted average number of common shares outstanding during the period. Diluted net income per common share is computed by dividing net income by the weighted average number of common shares outstanding during the period, adjusted to reflect potentially dilutive securities using the treasury stock method for stock option awards. Diluted net income per common share adjusts basic net income per common share for the effects of stock options and other potentially dilutive financial instruments only in the periods in which such effect is dilutive.
90
The following table presents a reconciliation of the weighted average shares outstanding used in the earnings per share calculations:
|
|
|
|
|
|
|
|
|
|
|
|
Fiscal |
|
Fiscal |
|
Fiscal |
|
|
|
|
2013 |
|
2014 |
|
2015 |
|
|
Basic weighted average shares outstanding |
|
33,870,461 |
|
34,389,282 |
|
35,212,124 |
|
|
Effect of dilutive securities: |
|
|
|
|
|
|
|
|
Stock options |
|
226,508 |
|
355,874 |
|
260,745 |
|
|
Restricted shares |
|
34,487 |
|
65,920 |
|
67,488 |
|
|
Diluted weighted average shares outstanding |
|
34,131,456 |
|
34,811,076 |
|
35,540,357 |
|
Diluted net income per common share for fiscal 2013, fiscal 2014 and fiscal 2015 excludes stock options for the purchase of 323,909, 132,719 and 92,404 shares, respectively, of common stock as their inclusion would be anti‑dilutive. Diluted net income per common share for fiscal 2013, fiscal 2014 and fiscal 2015 excludes non‑vested restricted stock grants of 78,465, 60,617 and 109,271 shares, respectively, as their inclusion would be anti‑dilutive.
Certain stock option and restricted stock awards contain vesting conditions based on specified stock price targets for the Company’s common stock as measured at each of the annual vesting dates (“market‑based awards”). The Company includes such market‑based awards in the determination of dilutive weighted average shares outstanding under the treasury stock method when, as of the date of determination, the specified stock price targets are met and the common stock shares pursuant to those awards become contingently issuable. Accordingly, the determination of diluted weighted average shares outstanding excludes, as of the date of determination, stock options for the purchase of 141,687, 15,388 and 20,896 shares of common stock for fiscal 2013, fiscal 2014 and fiscal 2015, respectively, and excludes 72,006, 144,664 and 190,029 shares of non‑vested restricted stock for fiscal 2013, fiscal 2014 and fiscal 2015, respectively.
10. Commitments and Contingencies
The Company conducts the majority of its operations from leased store and warehouse facilities pursuant to non‑cancellable operating lease agreements with initial terms generally ranging from five to 15 years. Certain leases include renewal options generally ranging from one to five years and contain certain rent escalation clauses. Most leases require the Company to pay its proportionate share of the property tax, insurance and maintenance expenses of the property. Certain leases provide for contingent rentals based on sales volumes; however, incremental rent expense resulting from such arrangements are accrued for those stores expected to surpass the sales threshold subject to their respective lease agreements.
Total expense incurred under operating leases, consisting of base rents and other expenses (comprised primarily of common area maintenance, property tax, and insurance), is as follows (in thousands):
|
|
|
|
|
|
|
|
|
|
|
|
|
|
|
Base |
|
Other |
|
Total Lease |
|
|||
|
|
|
Rents |
|
Expense |
|
Expense |
|
|||
|
Fiscal 2013 |
|
$ |
139,444 |
|
$ |
32,025 |
|
$ |
171,469 |
|
|
Fiscal 2014 |
|
$ |
211,127 |
|
$ |
45,965 |
|
$ |
257,092 |
|
|
Fiscal 2015 |
|
$ |
302,744 |
|
$ |
68,794 |
|
$ |
371,538 |
|
91
Future minimum lease payments under operating leases as of February 2, 2016, related to properties operated by the Company is as follows (in thousands):
|
|
|
|
|
|
|
Fiscal Year |
|
|
|
|
|
2016 |
|
$ |
293,664 |
|
|
2017 |
|
|
261,750 |
|
|
2018 |
|
|
225,375 |
|
|
2019 |
|
|
193,360 |
|
|
2020 |
|
|
169,502 |
|
|
Thereafter |
|
|
569,520 |
|
|
|
|
$ |
1,713,171 |
|
The Company remains directly and contingently obligated under lease agreements related to leased properties no longer operated by the Company. In certain instances, the Company has entered into assignment and sublease agreements with third parties, although the Company remains contingently liable with respect to future lease obligations for such leased properties. Future minimum lease payments under operating leases as of February 2, 2016, associated with properties no longer operated by the Company, and the related future sublease rentals is as follows (in thousands):
|
|
|
|
|
|
|
|
|
|
|
|
Company’s |
|
Sublease |
|
||
|
Fiscal Year |
|
Commitment |
|
Rentals |
|
||
|
2016 |
|
$ |
993 |
|
$ |
571 |
|
|
2017 |
|
|
624 |
|
|
448 |
|
|
2018 |
|
|
46 |
|
|
14 |
|
|
2019 |
|
|
— |
|
|
— |
|
|
2020 |
|
|
— |
|
|
— |
|
|
Thereafter |
|
|
— |
|
|
— |
|
|
|
|
$ |
1,663 |
|
$ |
1,033 |
|
As of February 2, 2016, the Company guarantees and is primarily liable for approximately $0.4 million in future lease commitments through November 30, 2017 with respect to a real estate lease of a franchisee.
The Company has contracts related to sponsorships and space rentals at special event venues, with future minimum commitments as of February 2, 2016 of $3.8 million, $3.5 million, $2.1 million, and $1.2 million for fiscal 2016, fiscal 2017, fiscal 2018, and fiscal 2019, respectively.
The Company is subject to legal proceedings and claims that arise in the ordinary course of business. Management does not believe that the outcome of any of those matters will have a material adverse effect on the Company’s financial position, results of operations or cash flows.
The Company has conducted an internal investigation, with the assistance of outside counsel and forensic consultants, of potential related party transactions involving contracts and leases entered into by the Company. While no related party transactions were uncovered, in the course of the investigation, the Company discovered that two employees of the Company’s real estate group had conflicts of interest involving business relationships with certain of the Company’s real estate vendors that were not disclosed to the Company in accordance with policy. The two employees were terminated for violating Company policy. As a further step, the Company, with the assistance of outside counsel, is conducting a more detailed investigation into its real estate and leasing practices. In the course of this second investigation, the Company has reason to believe that there may have been improper gifts made to certain of its employees from vendors. However, this second investigation is still ongoing and, as of the date of the filing of these financial statements, the Company is unable to determine whether other matters will be uncovered, the quantitative impact of any such matters, or what the ultimate impact will be on the Company. No provision with respect to these investigations and actions taken or to be taken by the Company has been made in the Company’s financial statements.
92
11. Concentration Risk
Financial instruments that potentially subject the Company to concentrations of risk are primarily cash and cash equivalents and accounts receivable. Information with respect to the credit risk associated with accounts receivable is described in Note 1.
The Company places its cash deposits with financial institutions. At times, such amounts may be in excess of the federally insured limits. Management believes the financial strength of the financial institutions minimizes the credit risk related to the Company’s deposits.
The Company currently relies on Tempur Sealy and Serta Simmons as the primary suppliers of branded mattresses. Purchases of products from these manufacturers accounted for 79% of the Company’s mattress product costs for fiscal 2015.
The Company uses Corsicana Bedding and Sherwood Bedding as the primary suppliers of the private label mattresses, which accounted for 8% and 3% respectively, of the Company’s mattress product costs for fiscal 2015.
12. Related Party Transactions
Corporate Office Leases – Rocklin, California
By our subsidiary, Sleep Train, we were party to two commercial lease agreements, the landlord of which is Cabernet Sunsets, LLC, a California limited liability company beneficially owned, in part, by Dale R. Carlsen, one of our directors, for the majority of fiscal 2015. The leases provided Sleep Train with office building space located at 2205 Plaza Drive, Rocklin, CA and 2204 Plaza Drive, Rocklin, CA. The terms of the leases, which were entered into years prior to our consummation of the Sleep Train acquisition, provide for ten year terms and minimum monthly rent obligations that are marginally above current market rates. Annual minimum rent for fiscal year 2015 was approximately $0.5 million, in the aggregate, for both leases. Of this amount, Mr. Carlsen held an interest in approximately $0.2 million, on a gross profits basis.
On September 1, 2015, Cabernet Sunsets, LLC sold the property located at 2205 Plaza Drive, Rocklin, CA to an entity that is not affiliated with Mr. Carlsen. The property located at 2204 Plaza Drive, Rocklin, CA continues to be owned by Cabernet Sunsets.
13. Retirement Plans
The Company sponsors a 401(k) defined contribution plan (the “Retirement Plan”) that covers substantially all employees. Participants may elect to defer a percentage of their salary, subject to annual limitations imposed by the Internal Revenue Code. The Company makes matching contributions at its discretion.
Approximate matching contributions and other expenses related to the Retirement Plan were as follows (in thousands):
|
|
|
|
|
|
|
Fiscal 2013 |
|
$ |
911 |
|
|
Fiscal 2014 |
|
$ |
1,322 |
|
|
Fiscal 2015 |
|
$ |
2,400 |
|
The Company also sponsors an executive nonqualified deferred compensation plan. Participants may elect to defer a percentage of their earned wages to the plan. The Company may, at its discretion, provide matching and profit‑sharing contributions under this plan. The Company has not elected to make any discretionary contributions. The plan assets and related deferred compensation liability included in other assets and other noncurrent liabilities at February 3, 2015 and February 2, 2016, were approximately $1.2 million and $1.7 million, respectively. The plan assets are held within a rabbi trust and are restricted from Company access.
Prior to its acquisition by the Company in October 2014, Sleep Train had an employee stock ownership plan (ESOP). As part of the purchase of Sleep Train, the ESOP received cash proceeds and Company stock in exchange for the stock of Sleep Train held by the ESOP. The acquisition agreement provided that (i) the ESOP shall be “frozen” as of
93
the Closing such that no new participants shall enter the plan, no further vesting credit shall accrue, and no additional contributions shall be made to the ESOP, (ii) all ESOP participants shall become immediately 100% vested in their accounts, (iii) all proceeds from the sale of the ESOP’s suspense account shares shall be properly allocated in a manner permissible by the IRS and for the exclusive benefit of participants in the ESOP, and (iv) the ESOP shall be terminated and the entire balance of an ESOP participant’s account shall be distributable in cash or securities as soon as administratively feasible after receipt of the IRS Approval or such earlier date as the Buyer may determine.
2011 Omnibus Incentive Plan—On November 3, 2011, the Company’s board of directors and shareholders adopted the Mattress Firm Holding Corp. 2011 Omnibus Incentive Plan to provide for the grant of equity‑based awards to Company employees, directors and other service providers. A total of 4,206,000 shares of the Company’s common stock were reserved for grants under the 2011 Omnibus Incentive Plan. There were 2,200,333 shares available for future grants under the stock incentive plan as of February 2, 2016.
Stock Options—A portion of the stock options granted to the Company’s employees are subject to time‑based vesting schedules, while the remaining portion of the stock options are subject to market‑based vesting schedules, with such vesting based on specified stock price targets. The exercise price of the options is based upon the closing market price per share of the Company’s common stock on the date of grant, and the options have a term of 10 years.
The following table summarizes the stock option grants, exercises, and forfeitures for fiscal 2013, fiscal 2014, and fiscal 2015 (in thousands, except per share amounts):
|
|
|
|
|
|
|
|
|
|
|
|
|
|
|
|
|
|
|
|
|
Fiscal 2013 |
|
Fiscal 2014 |
|
Fiscal 2015 |
|
|||||||||
|
|
|
|
|
Weighted |
|
|
|
Weighted |
|
|
|
Weighted |
|
|||
|
|
|
|
|
Average |
|
|
|
Average |
|
|
|
Average |
|
|||
|
|
|
Stock |
|
Exercise Price |
|
Stock |
|
Exercise Price |
|
Stock |
|
Exercise Price |
|
|||
|
|
|
Options |
|
Per Share |
|
Options |
|
Per Share |
|
Options |
|
Per Share |
|
|||
|
Outstanding, beginning of fiscal year |
|
1,250 |
|
$ |
19.86 |
|
1,291 |
|
$ |
23.32 |
|
957 |
|
$ |
23.86 |
|
|
Granted(a) |
|
236 |
|
$ |
38.63 |
|
56 |
|
$ |
55.89 |
|
41 |
|
$ |
60.68 |
|
|
Exercised(b) |
|
(159) |
|
$ |
19.79 |
|
(218) |
|
$ |
21.84 |
|
(104) |
|
$ |
19.95 |
|
|
Forfeited |
|
(36) |
|
$ |
19.00 |
|
(172) |
|
$ |
32.85 |
|
(144) |
|
$ |
22.04 |
|
|
Outstanding, end of fiscal year(c) |
|
1,291 |
|
$ |
23.32 |
|
957 |
|
$ |
23.86 |
|
750 |
|
$ |
26.78 |
|
|
Exercisable, end of fiscal year(d) |
|
361 |
|
$ |
19.33 |
|
476 |
|
$ |
20.33 |
|
516 |
|
$ |
22.19 |
|
|
(a) |
The weighted average grant date fair value of stock options granted during fiscal 2013, fiscal 2014 and fiscal 2015 was $18.44, $32.10 and $34.47, respectively. |
|
(b) |
The aggregate intrinsic value of stock options exercised during fiscal 2013, fiscal 2014 and fiscal 2015 was $3.1 million, $7.4 million and $4.4 million, respectively. The weighted average market price of shares exercised during fiscal 2013, fiscal 2014 and fiscal 2015 was $39.61, $55.90 and $61.96, respectively. |
|
(c) |
Stock options outstanding as of February 2, 2016 have a weighted average remaining contractual term of 5.73 years and an aggregate intrinsic value of $8.7 million based on the market value of the Company’s common stock on February 2, 2016. |
|
(d) |
Stock options exercisable as of February 2, 2016 have a weighted average remaining contractual term of 5.14 years and an aggregate intrinsic value of $7.2 million based on the market value of the Company’s common stock on February 2, 2016. |
94
Future vesting dates on the stock options range from April 24, 2016 to September 9, 2019, and expiration dates range from November 17, 2021 to September 9, 2025 at exercise prices and average contractual lives as follows:
|
Range of Exercise Prices |
|
Outstanding as of February 2, 2016 (in thousands) |
|
Weighted |
|
Weighted |
|
Exercisable as of February 2, 2016 (in thousands) |
|
Weighted |
|
Weighted |
|
||
|
Time Based |
|
|
|
|
|
|
|
|
|
|
|
|
|
|
|
|
$19.00 - $29.26 |
|
334 |
|
5.19 |
|
$ |
19.35 |
|
240 |
|
4.92 |
|
$ |
19.35 |
|
|
$36.84 - $57.05 |
|
126 |
|
7.54 |
|
$ |
44.29 |
|
53 |
|
6.88 |
|
$ |
44.29 |
|
|
$60.74 - $60.74 |
|
41 |
|
9.61 |
|
$ |
60.74 |
|
— |
|
— |
|
$ |
— |
|
|
Market Based |
|
|
|
|
|
|
|
|
|
|
|
|
|
|
|
|
$19.00 - $29.26 |
|
231 |
|
4.72 |
|
$ |
19.37 |
|
214 |
|
4.87 |
|
$ |
19.37 |
|
|
$36.84 - $57.05 |
|
18 |
|
7.23 |
|
$ |
36.84 |
|
9 |
|
7.23 |
|
$ |
36.84 |
|
The Company accounts for employee stock options under the fair value method of accounting using a Black‑Scholes methodology to measure time‑based option fair value at the date of grant and a Monte Carlo Simulation approach to measure market‑based option fair value at the date of grant. The fair value of the stock options at the date of grant is recognized as expense over the vesting term, which represents the requisite service period.
The following assumptions were used to calculate the fair value of the Company’s time‑based stock options on the date of grant utilizing the Black‑Scholes option pricing model:
|
|
|
|
|
|
|
|
|
|
|
|
|
|
|
Fiscal |
|
Fiscal |
|
Fiscal |
|
|||
|
|
|
2013 |
|
2014 |
|
2015 |
|
|||
|
Weighted average expected life (in years) |
|
6.25 to 6.50 |
|
|
6.25 |
|
|
6.25 |
|
|
|
Volatility factor |
|
60 |
% |
|
60 |
% |
|
50 |
% |
|
|
Dividend yield |
|
— |
% |
|
— |
% |
|
— |
% |
|
|
Risk-free interest rate |
|
1.02 to 2.13 |
% |
|
1.95 to 2.08 |
% |
|
1.65 |
% |
|
The following assumptions were used to calculate the fair value of the Company’s market‑based stock options on the grant date utilizing a Monte Carlo Simulation approach:
|
|
|
Fiscal |
|
|
|
|
2013 |
|
|
Suboptimal exercise factor |
|
2.5x |
|
|
Volatility factor |
|
60 |
% |
|
Dividend yield |
|
— |
% |
|
Risk-free interest rate |
|
1.02 |
% |
The Company issued no market-based stock options in fiscal 2014 or fiscal 2015.
The Company bases its expected option life on the expected exercise and termination behavior of the option holders and an appropriate model of the Company’s future stock price. The expected volatility assumption is derived from the historical volatility of similar companies’ common stock over the most recent period commensurate with the estimated expected life of the Company’s stock options, combined with other relevant factors. The dividend yield is the annual rate of dividends per share over the exercise price of the option as of the grant date.
For fiscal 2013, fiscal 2014 and fiscal 2015, the Company recognized $2.9 million, $3.8 million and $2.8 million, respectively, of compensation expense associated with stock option awards in general and administrative expenses in the consolidated statement of operations. The Company did not capitalize any equity‑based compensation costs related to stock options during fiscal 2013, fiscal 2014 and fiscal 2015.
95
As of February 2, 2016, the Company estimates that a total of approximately $3.3 million of currently unrecognized forfeiture adjusted compensation expense will be recognized over a weighted average period of 2.26 years for unvested stock option awards issued and outstanding.
Restricted Stock—The Company grants restricted stock to certain employees and to non‑employee independent directors. A portion of the restricted stock granted to the Company’s employees is subject to time‑based vesting schedules, while the remaining portion of the restricted stock is subject to market‑based vesting schedules, with such vesting based on specified stock price targets.
The following table summarizes the restricted stock grants, vesting, and forfeitures for fiscal 2013, fiscal 2014, and fiscal 2015 (in thousands, except per share amounts):
|
|
|
|
|
|
|
|
|
|
|
|
|
|
|
|
|
|
|
|
|
Fiscal 2013 |
|
Fiscal 2014 |
|
Fiscal 2015 |
|
|||||||||
|
|
|
|
|
|
Weighted |
|
|
|
|
Weighted |
|
|
|
|
Weighted |
|
|
|
|
Restricted |
|
|
Average |
|
Restricted |
|
|
Average |
|
Restricted |
|
|
Average |
|
|
|
|
Shares |
|
|
Fair Value |
|
Shares |
|
|
Fair Value |
|
Shares |
|
|
Fair Value |
|
|
Outstanding, beginning of fiscal year |
|
139 |
|
$ |
29.10 |
|
249 |
|
$ |
29.93 |
|
350 |
|
$ |
35.81 |
|
|
Granted(a) |
|
159 |
|
$ |
30.45 |
|
229 |
|
$ |
38.84 |
|
283 |
|
$ |
50.49 |
|
|
Vested(b) |
|
(49) |
|
$ |
29.24 |
|
(96) |
|
$ |
30.70 |
|
(119) |
|
$ |
42.92 |
|
|
Forfeited |
|
— |
|
|
— |
|
(32) |
|
$ |
27 |
|
(18) |
|
$ |
34.66 |
|
|
Unvested, end of fiscal year |
|
249 |
|
$ |
29.93 |
|
350 |
|
$ |
35.81 |
|
496 |
|
$ |
42.53 |
|
|
(a) |
The total grant‑date fair value of restricted stock awards granted during fiscal 2013, fiscal 2014 and fiscal 2015 was $4.8 million, $8.9 million and $14.3 million respectively. |
|
(b) |
The total fair value of awards vested during fiscal 2013, fiscal 2014 and fiscal 2015 was $1.6 million, $5.6 million and $5.8 million, respectively. |
The Company accounts for restricted stock under the fair value method of accounting using the closing market price per share of the Company’s stock to measure time‑based restricted stock fair value at the date of grant and a Monte Carlo Simulation approach to measure market‑based restricted stock fair value at the date of grant. The fair value of the restricted stock at the date of grant is recognized as expense over the vesting term, which represents the requisite service period.
The following assumptions were used to calculate the fair value of the Company’s market‑based restricted stock on the grant date utilizing a Monte Carlo Simulation approach:
|
|
|
Fiscal 2013 |
|
|
Fiscal 2014 |
|
|
Fiscal 2015 |
|
|
Weighted average expected life (in years) |
|
4 |
|
|
4 |
|
|
4 |
|
|
Volatility factor |
|
40 |
% |
|
40 |
% |
|
40 |
% |
|
Dividend yield |
|
— |
% |
|
— |
% |
|
— |
% |
|
Risk-free interest rate |
|
1.32 |
% |
|
1.33 to 1.34 |
% |
|
1.29 |
% |
For fiscal 2013, fiscal 2014 and fiscal 2015, the Company recognized $1.9 million, $4.6 million and $6.9 million, respectively, of compensation expense associated with restricted stock awards in general and administrative expenses in the consolidated statement of operations. The Company did not capitalize any equity‑based compensation costs related to restricted stock awards during fiscal 2013, fiscal 2014 and fiscal 2015.
As of February 2, 2016, the Company estimates that a total of approximately $14.8 million of currently unrecognized forfeiture adjusted compensation expense will be recognized over a weighted average period of 2.87 years for unvested restricted stock awards.
96
15. Supplemental Statement of Cash Flow Information
Supplemental information to the statement of cash flows is as follows (in thousands):
|
|
|
Fiscal |
|
Fiscal |
|
Fiscal |
|
|||
|
|
|
2013 |
|
2014 |
|
2015 |
|
|||
|
Interest paid |
|
$ |
11,255 |
|
$ |
20,184 |
|
$ |
38,262 |
|
|
Taxes paid |
|
$ |
28,612 |
|
$ |
16,011 |
|
$ |
18,508 |
|
|
Unpaid liabilities for capital expenditures |
|
$ |
6,276 |
|
$ |
15,859 |
|
$ |
6,973 |
|
|
Capital leases for equipment |
|
$ |
— |
|
$ |
— |
|
$ |
706 |
|
Noncash Investing and Financing Activities—Assets acquired, liabilities assumed, debt and equity issued in connection with business combinations are described in Note 2.
16. Quarterly Results of Operations (Unaudited)
|
|
|
|
|
|
|
|
|
|
|
|
|
|
|
|
|
|
|
|
|
|
|
|
|
|
|
|
|
|
1st Quarter |
|
2nd Quarter |
|
3rd Quarter |
|
4th Quarter |
|
||||||||||||||||
|
|
|
FY 2014 |
|
FY 2015 |
|
FY 2014 |
|
FY 2015 |
|
FY 2014 |
|
FY 2015 |
|
FY 2014 |
|
FY 2015 |
|
||||||||
|
Net sales |
|
$ |
333,502 |
|
$ |
562,554 |
|
$ |
409,951 |
|
$ |
661,064 |
|
$ |
464,278 |
|
$ |
699,507 |
|
$ |
598,298 |
|
$ |
618,547 |
|
|
Cost of sales |
|
|
212,652 |
|
|
361,283 |
|
|
246,547 |
|
|
403,557 |
|
|
281,323 |
|
|
434,767 |
|
|
376,144 |
|
|
391,029 |
|
|
Gross profit from retail operations |
|
|
120,850 |
|
|
201,271 |
|
|
163,404 |
|
|
257,507 |
|
|
182,955 |
|
|
264,740 |
|
|
222,154 |
|
|
227,518 |
|
|
Franchise fees and royalty income |
|
|
1,186 |
|
|
1,115 |
|
|
1,092 |
|
|
1,285 |
|
|
1,238 |
|
|
1,578 |
|
|
1,068 |
|
|
1,254 |
|
|
Total gross profit |
|
|
122,036 |
|
|
202,386 |
|
|
164,496 |
|
|
258,792 |
|
|
184,193 |
|
|
266,318 |
|
|
223,222 |
|
|
228,772 |
|
|
Operating expenses: |
|
|
|
|
|
|
|
|
|
|
|
|
|
|
|
|
|
|
|
|
|
|
|
|
|
|
Sales and marketing expenses |
|
|
75,665 |
|
|
131,896 |
|
|
99,998 |
|
|
169,121 |
|
|
109,632 |
|
|
168,312 |
|
|
142,105 |
|
|
152,268 |
|
|
General and administrative expenses |
|
|
30,686 |
|
|
51,364 |
|
|
36,888 |
|
|
42,893 |
|
|
42,783 |
|
|
49,608 |
|
|
56,678 |
|
|
39,540 |
|
|
Loss (gain) on store closings and impairment of store assets |
|
|
258 |
|
|
295 |
|
|
648 |
|
|
1,173 |
|
|
133 |
|
|
586 |
|
|
774 |
|
|
5,470 |
|
|
Total operating expenses |
|
|
106,609 |
|
|
183,555 |
|
|
137,534 |
|
|
213,187 |
|
|
152,548 |
|
|
218,506 |
|
|
199,557 |
|
|
197,278 |
|
|
Income from operations |
|
|
15,427 |
|
|
18,831 |
|
|
26,962 |
|
|
45,605 |
|
|
31,645 |
|
|
47,812 |
|
|
23,665 |
|
|
31,494 |
|
|
Other income: |
|
|
|
|
|
|
|
|
|
|
|
|
|
|
|
|
|
|
|
|
|
|
|
|
|
|
Interest expense, net |
|
|
2,816 |
|
|
10,253 |
|
|
3,469 |
|
|
10,046 |
|
|
4,067 |
|
|
10,161 |
|
|
11,572 |
|
|
9,687 |
|
|
Loss from debt extinguishment |
|
|
— |
|
|
— |
|
|
— |
|
|
— |
|
|
2,288 |
|
|
— |
|
|
— |
|
|
— |
|
|
Total other expense |
|
|
2,816 |
|
|
10,253 |
|
|
3,469 |
|
|
10,046 |
|
|
6,355 |
|
|
10,161 |
|
|
11,572 |
|
|
9,687 |
|
|
Income before income taxes |
|
|
12,611 |
|
|
8,578 |
|
|
23,493 |
|
|
35,559 |
|
|
25,290 |
|
|
37,651 |
|
|
12,093 |
|
|
21,807 |
|
|
Income tax expense |
|
|
4,891 |
|
|
3,100 |
|
|
9,194 |
|
|
13,678 |
|
|
9,677 |
|
|
13,778 |
|
|
5,473 |
|
|
8,517 |
|
|
Net income |
|
$ |
7,720 |
|
$ |
5,478 |
|
$ |
14,299 |
|
$ |
21,881 |
|
$ |
15,613 |
|
$ |
23,873 |
|
$ |
6,620 |
|
$ |
13,290 |
|
|
Basic net income per common share |
|
$ |
0.23 |
|
$ |
0.16 |
|
$ |
0.42 |
|
$ |
0.62 |
|
$ |
0.46 |
|
$ |
0.68 |
|
$ |
0.19 |
|
$ |
0.38 |
|
|
Diluted net income per common share |
|
$ |
0.22 |
|
$ |
0.15 |
|
$ |
0.41 |
|
$ |
0.61 |
|
$ |
0.45 |
|
$ |
0.67 |
|
$ |
0.19 |
|
$ |
0.37 |
|
Due to the method of calculating weighted average common shares outstanding, the sum of the quarterly per share amounts may not equal net earnings per common share attributable to common shareholders for the respective years.
97
17. Subsequent Events
Sleepy’s Acquisition
On November 25, 2015, the Company entered into a Securities Purchase Agreement to purchase all of the outstanding equity interests in HMK Mattress Holdings LLC, the holding company of Sleepy’s LLC and related entities (collectively, “Sleepy’s”), for an aggregate purchase price of approximately $780 million, subject to working capital and other customary post-closing purchase price adjustments. Sleepy’s operates approximately 1,050 specialty mattress retail stores located in 17 states in the Northeast, New England, the Mid-Atlantic and Illinois and employs approximately 3,366 persons. The Company completed its acquisition of Sleepy’s on February 5, 2016, during the first week of fiscal 2016. Upon the closing of the Sleepy’s acquisition, Adam Blank, Sleepy’s chief operating officer and general counsel immediately prior to closing, became the president of Sleepy’s. The Sleepy’s acquisition allows the Company to achieve immediate scale and presence in New England and in the Northeast where it previously had little to no presence.
The purchase price payable to the selling equityholders of HMK Mattress Holdings LLC was reduced by certain payment obligations of Sleepy’s, including the repayment of certain indebtedness of Sleepy’s. As described below, the Company funded a portion of the cash purchase price for the Sleepy’s acquisition by borrowing approximately $749.2 million under its Senior Credit Facility. A portion of the cash purchase price was funded, as described below, by capital that the Company raised by issuing an aggregate of 699,300 shares of its common stock to Steve Stagner, its chief executive officer at the time, and certain investment funds affiliated with J.W. Childs Associates, Inc., an existing stockholder. The remainder of the Sleepy’s purchase price was paid by the Company, as described below, through the issuance of an aggregate of 1,062,936 shares of its common stock to certain affiliates of Adam Blank, the chief operating officer and general counsel of Sleepy’s immediately prior to the closing of the acquisition, and Calera Capital Partners IV, L.P. (“Calera”) in exchange for the aggregate equity value that Mr. Blank and Calera held in HMK Mattress Holdings LLC. As noted above, the purchase price for the Sleepy’s acquisition is subject to certain post-closing adjustments, including, but not limited to, working capital adjustments.
Due to the timing of the closing of the acquisition in early February 2016, the Company has not completed the work required to include all of the disclosures required by ASC 805, however, the required disclosures will be included in the Company’s Quarterly Report on Form 10-Q for the first quarter of its 2016 fiscal year. In addition, certain of the required disclosures will be included in the pro forma financial information which will be filed as an amendment to the Company’s Current Report on Form 8-K filed with the SEC on February 5, 2016.
Amendments to Senior Credit Facility
Effective February 5, 2016, Mattress Holding Corp., the Company’s wholly owned subsidiary (the “Borrower”), amended its then-existing senior credit facility primarily to increase the amount of available financing thereunder to be used to fund a portion of the Sleepy’s acquisition’s cash purchase price.
In particular, the Borrower entered into Amendment No. 1 to ABL Credit Agreement (the “ABL Amendment”) with Mattress Holdco, Inc. (“Holdings”), the lenders and issuers party thereto and Barclays Bank PLC, as administrative agent and collateral agent (in such capacity, the “ABL Agent”), which amended the Borrower’s then-existing $125 million asset-backed loan credit agreement dated October 20, 2014 (as amended by the ABL Amendment, the “ABL Credit Agreement”), among the Borrower, Holdings, the guarantor subsidiaries of the Borrower, the lenders and issuers party thereto and the ABL Agent to, among other things, increase the revolving credit commitments in favor of the Borrower thereunder by $75 million to $200 million and extend the maturity date of the facility to February 5, 2021. Approximately $104.1 million was drawn under the ABL Credit Agreement on February 5, 2016 to fund a portion of the Sleepy’s acquisition’s cash purchase price. Prior to the effectiveness of the ABL Amendment, the applicable margin on LIBOR rate loans under the ABL Credit Agreement varied from 1.25% to 1.75% and the applicable margin on base rate loans varied from 0.25% to 0.75%. Effective as of February 5, 2016, the applicable margin for LIBOR rate loans under the ABL Credit Agreement varies from 1.25% to 1.50% and the applicable margin for base rate loans varies from 0.25% to 0.50%.
98
Additionally, the Borrower entered into Amendment No. 1 to Term Loan Credit Agreement (the “Term Loan Amendment”) with Holdings, the lenders party thereto, and Barclays Bank PLC, as administrative agent and collateral agent (in such capacity, the “Term Loan Agent”), which amended the Borrower’s then-existing $720.0 million term loan credit agreement dated October 20, 2014 (as amended by the Term Loan Amendment, the “Term Loan Credit Agreement”), among the Borrower, Holdings, the guarantor subsidiaries of the Borrower, the lenders party thereto, and the Term Loan Agent to, among other things, add a $665.0 million incremental term loan facility thereunder. Approximately $645.1 of the incremental term loan was used by the Company on February 5, 2016 to fund a portion of the Sleepy’s acquisition’s cash purchase price. Immediately prior to the effectiveness of the Term Loan Amendment, the outstanding loans under the Term Loan Credit Agreement were subject to an interest rate of LIBOR plus 4.00% per annum, and as of February 5, 2016 bear interest at a rate of LIBOR plus 5.25%. Previously under the Term Loan Credit Agreement, loans bearing interest by reference to LIBOR had interest rates varying from 4.00% to 4.25% and loans bearing interest by reference to the base rate had interest rates varying from 3.00% to 3.25%. Effective as of February 5, 2016, the interest rate for all loans under the Term Loan Credit Agreement, including those previously outstanding, is LIBOR plus 5.25% for LIBOR loans and 4.25% per annum for base rate loans.
Securities Issuance
On February 3, 2016, the Company entered into a share purchase agreement with Winter Street Opportunities Fund, L.P. and JWC Fund III Coinvest, LLC, investment fund affiliates of J.W. Childs Associates, Inc., an existing stockholder, and Steve Stagner, its chief executive officer at the time, pursuant to which the investment funds and Mr. Stagner agreed to purchase from the Company an aggregate of 699,300 shares of its common stock at a price per share equal to $35.75 per share (which is in excess of the price at which the Company’s common sold at the close of trading on February 2, 2016). The Company completed the stock sale on February 5, 2016, concurrent with its closing of the Sleepy’s acquisition. Mr. Stagner purchased 139,860 shares of the Company’s common stock and the investment funds purchased, in the aggregate, 559,440 shares of the Company’s common stock. As noted above, the approximately $25 million in capital that the Company raised from the sale was used to fund a portion of the acquisition’s cash purchase price.
In addition, the Company issued, on February 5, 2016, as partial purchase price consideration for the Sleepy’s acquisition, an aggregate of 1,062,936 shares of its common stock to designated affiliates of Mr. Blank and to Calera, in exchange for $38 million of the aggregate equity value that Mr. Blank and Calera held in HMK Mattress Holdings LLC. In exchange for their contributions, Mr. Blank received, indirectly, 223,776 shares of the Company’s common stock and Calera received 839,160 shares of the Company’s common stock, each at an exchange price of $35.75 per share (which is in excess of the price at which the Company’s common sold at the close of trading on February 2, 2016).
The above issuances, in the aggregate, equated to approximately 4.8% of the currently issued and outstanding shares of the Company’s common stock as of February 5, 2016.
Item 9. Changes in and Disagreements with Accountants on Accounting and Financial Disclosure
None.
Item 9A. Controls and Procedures
Evaluation of Disclosure Controls and Procedures
We have established disclosure controls and procedures (as defined in Rule 13a‑15(e) under the Securities Exchange Act of 1934, as amended (the “Exchange Act”)) to ensure that information relating to our company, including our consolidated subsidiaries, that would be required to be disclosed in Exchange Act reports is recorded, processed, summarized and reported within the time periods specified in the SEC’s rules and forms, and such information is accumulated and communicated to the officers who certify our financial reports and to other members of senior management and our board of directors.
99
We carried out an evaluation, under the supervision and with the participation of our management, including our Chief Executive Officer and Chief Financial Officer, of the effectiveness of the design of our disclosure controls and procedures (as defined in Rules 13a‑15(e) and 15d‑15(e) under the Exchange Act) as of February 2, 2016. Based on that evaluation, our Chief Executive Officer and Chief Financial Officer have concluded that our disclosure controls and procedures (as defined in Rules 13a‑15(e) and 15d‑15(e) under the Exchange Act) are effective as of February 2, 2016.
Our management, including our Chief Executive Officer and Chief Financial Officer, does not expect that our disclosure controls and procedures or internal controls will prevent all possible error and fraud. Our disclosure controls and procedures are, however, designed to provide reasonable assurance of achieving their objectives, and our Chief Executive Officer and Chief Financial Officer have concluded that our financial controls and procedures are effective at that reasonable assurance level.
Management’s Report on Internal Control over Financial Reporting
Our management is responsible for establishing and maintaining adequate internal control over financial reporting as defined in Rule 13a‑15(f) under the Exchange Act. Our management conducted an evaluation of the effectiveness of our internal controls over financial reporting based on the framework in Internal Control—Integrated Framework issued by the Committee of Sponsoring Organizations of the Treadway Commission (2013). Based on its evaluation our management concluded that our internal control over financial reporting was effective as of February 2, 2016.
Deloitte & Touche LLP, an independent registered public accounting firm, has issued an attestation report on our internal control over financial reporting. The attestation report is included herein.
Changes in Internal Control Over Financial Reporting
There has been no change in our internal control over financial reporting during the fourth quarter of fiscal 2015 that has materially affected, or is reasonably likely to materially affect, our internal control over financial reporting.
None.
Item 10. Directors, Executive Officers and Corporate Governance
The information required by this item will be contained in our definitive proxy statement for our 2015 Annual Meeting of Stockholders, which will be filed no later than 120 days after February 2, 2016, the end of our 2015 fiscal year (the “Definitive Proxy Statement”) and is incorporated herein by reference.
Item 11. Executive Compensation
The information required by this item will be contained in the Definitive Proxy Statement and is incorporated herein by reference. The Compensation Committee Report and related information incorporated by reference herein shall not be deemed “soliciting material” or to be “filed” with the SEC, nor shall such information be incorporated by reference into any future filing under the Securities Act of 1933, as amended, or Securities Exchange Act of 1934, as amended, except to the extent that the Company specifically incorporates such information by reference into such a filing.
100
Item 12. Security Ownership of Certain Beneficial Owners and Management and Related Stockholder Matters
The information required by this item will be contained in the Definitive Proxy Statement and is incorporated herein by reference.
Item 13. Certain Relationships and Related Transactions, and Director Independence
The information required by this item will be contained in the Definitive Proxy Statement and is incorporated herein by reference.
Item 14. Principal Accountant Fees and Services
The information required by this item will be contained in the Definitive Proxy Statement and is incorporated herein by reference.
Item 15. Exhibits and Financial Statement Schedules
Documents filed as a part of the report:
|
(1) |
Financial Statements. |
As listed in the Index to Financial Statements and Supplementary Data on page 59.
|
(2) |
Financial Statement Schedules. |
As listed in the Index to Financial Statements and Supplementary Data on page 59.
Note: All other schedules are omitted as the required information is not applicable or the information is presented in the consolidated financial statements or related notes.
|
(3) |
Exhibits. |
See Exhibit Index on pages 102-105 for lists of exhibits filed with this Annual Report on Form 10-K Management contracts and compensatory plans or arrangements are identified with asterisks on the Exhibit Index.
101
|
Exhibit |
|
Exhibit Title |
|
2.1 |
|
Stock Purchase Agreement dated as of April 9, 2012, by and among Mattress Firm, Inc., as buyer, the sellers party thereto and FS Equity Partners V, L.P., as seller representative (incorporated by reference to Exhibit 2.1 to Mattress Firm Holding Corp’s Current Report on Form 8‑K filed April 10, 2012). |
|
2.2 |
|
Asset Purchase Agreement dated September 4, 2012, by and among Mattress Firm, Inc., as buyer, Mattress XPress, Inc., Mattress XPress of Georgia, Inc., Steven Milesic and Steve Lytell (incorporated by reference to Exhibit 2.1 to Mattress Firm Holding Corp.’s Current Report on Form 8‑ K filed September 6, 2012). |
|
2.3 |
|
Purchase and Sale Agreement dated March 7, 2014, among Mattress Firm, Inc., as buyer, Christopher T. Cook and Sleep Xperts, Inc. (incorporated by reference to Exhibit 2.1 to Mattress Firm Holding Corp.’s Current Report on Form 8‑K filed March 10, 2014). |
|
2.4 |
|
Asset Purchase Agreement dated April 25, 2014, by and between Mattress Firm, Inc., as buyer, and Mattress Liquidators, Inc., David Dolan and Sarah Thomas (incorporated by reference to Exhibit 2.1 to Mattress Firm Holding Corp.’s Current Report on Form 8‑K (File No. 001-35354) filed April 28, 2014). |
|
2.5 |
|
Asset Purchase Agreement dated August 28, 2014, by and among Mattress Firm, Inc., as buyer, and Back to Bed, Inc., M World Mattress LLC, MCStores, LLC, TBE Orlando LL, MIFORMA, LLC, Hilltop Leasing, Inc., Mattress, Inc., Mattress Express, LLC, Dreamz Agency, Inc., Glen Haneberg and Vito Favia (incorporated by reference to Exhibit 2.1 to Mattress Firm Holding Corp.’s Current Report on Form 8‑K (File No. 001-35354) filed August 29, 2014). |
|
2.6 |
|
Purchase and Sale Agreement dated September 3, 2014, by and among Mattress Firm, Inc., as buyer, Mattress Firm Holding Corp., The Sleep Train, Inc., the shareholders of The Sleep Train, Inc. as named therein, Dale R. Carlsen, in his individual capacity, Robert D. Killgore, in his individual capacity, and Dale R. Carlsen, as shareholder representative (incorporated by reference to Exhibit 2.1 to Mattress Firm Holding Corp.’s Current Report on Form 8‑K (File No. 001-35354) filed September 4, 2014). |
|
2.7 |
|
Securities Purchase Agreement dated November 25, 2015, by and among Mattress Firm, Inc., HMK Mattress Holdings LLC, CCP IV Holdings, LLC (“CCP IV Blocker”), CXV Holdings, LLC (“CXV Blocker”), and CCP IV SBS Holdings, LLC (“CCP IV SBS Blocker,” and collectively with CCP IV Blocker and CXV Blocker, the “Blockers”), the equityholders of HMK Mattress Holdings LLC and the Blockers, David Acker, both individually and in his capacity as a representative of the sellers, and Calera Capital Partners IV, L.P., both as a seller and in its capacity as a representative of the sellers. (incorporated by reference to Exhibit 2.1 to Mattress Firm Holding Corp.’s Current Report on Form 8‑K (File No. 001-35354) filed November 30, 2015). |
|
2.8 |
|
First Amendment to Securities Purchase Agreement dated February 3, 2016, by and among Mattress Firm, Inc., HMK Mattress Holdings LLC, CCP IV Holdings, LLC, CXV Holdings, LLC, CCP IV SBS Holdings, LLC, David Acker, solely in his capacity as a representative of the Sellers, Calera Capital Partners IV, L.P., solely in its capacity as a representative of the Sellers, Adam Blank, as trustee of the Adam Blank 2012 GRAT, and Andrew Singer and Diane Weissman, as trustees of the Adam Blank 2012 Dynasty Trust (incorporated by reference to Exhibit 4.1 to Mattress Firm Holding Corp.’s Current Report on Form 8‑K (File No. 001-35354) filed February 3, 2016). |
|
2.9 |
|
Contribution Agreement, dated November 25, 2015, by and among Mattress Firm, Inc., Mattress Firm Holding Corp. and Adam Blank (incorporated by reference to Exhibit 2.2 to Mattress Firm Holding Corp.’s Current Report on Form 8-K (File No. 001-35354) filed November 30, 2015). |
|
2.10 |
|
Joinder to Contribution Agreement dated February 3, 2016, by and among Mattress Firm, Inc., Mattress Firm Holding Corp., Adam Blank, individually and in his capacity as trustee of the Adam Blank 2012 GRAT, and Andrew Singer and Diane Weissman, as trustees of the Adam Blank 2012 Dynasty Trust (incorporated by reference to Exhibit 10.1 to Mattress Firm Holding Corp.’s Current Report on Form 8‑K (File No. 001-35354) filed February 3, 2016). |
102
|
Exhibit
|
|
Exhibit Title |
|
3.1 |
|
Amended and Restated Certificate of Incorporation of Mattress Firm Holding Corp. (incorporated by reference to Exhibit 3.1 to Mattress Firm Holding Corp’s Current Report on Form 8‑K filed November 29, 2011). |
|
3.2 |
Amended and Restated Bylaws of Mattress Firm Holding Corp. |
|
|
4.1 |
|
Registration Rights Agreement between Mattress Firm Holding Corp. and certain equity holders of Mattress Holdings, LLC (incorporated by reference to Exhibit 4.1 to Mattress Firm Holding Corp.’s Registration Statement on Form S‑1/A (File No. 333‑174830) filed September 28, 2011). |
|
10.1+ |
|
Mattress Firm Holding Corp. 2011 Omnibus Incentive Plan (incorporated by reference to Exhibit 10.1 to Mattress Firm Holding Corp.’s Registration Statement on Form S‑1/A (File No. 333‑174830) filed November 7, 2011). |
|
10.2+ |
|
Third Amended and Restated Employment Agreement of R. Stephen Stagner, dated March 21, 2016 (incorporated by reference to Exhibit 10.2 to Mattress Firm Holding Corp.’s Current Report on Form 8‑K (File No. 001-35354) filed March 21, 2016). |
|
10.3+ |
|
Employment Agreement of Alexander S. Weiss, dated September 3, 2014 (incorporated by reference to Exhibit 10.1 to Mattress Firm Holding Corp.’s Current Report on Form 8-K (File No. 001-35354) filed September 4, 2014). |
|
10.4+ |
|
First Amendment to Employment Agreement effective February 3, 2016, by and among Mattress Firm Holding Corp., Mattress Firm, Inc. and Alex Weiss (incorporated by reference to Exhibit 10.3 to Mattress Firm Holding Corp.’s Current Report on Form 8-K (File No. 333‑174830) filed February 19, 2016). |
|
10.5+ |
|
Employment Agreement dated October 20, 2014, by and among Mattress Firm Holding Corp., Mattress Firm, Inc. and Dale R. Carlsen (incorporated by reference to Exhibit 10.3 to Mattress Firm Holding Corp.’s Current Report on Form 8-K (File No. 001-35354) filed October 21, 2014). |
|
10.6+ |
|
First Amendment to Employment Agreement effective September 10, 2015, by and among Mattress Firm Holding Corp., Mattress Holding Corp. and Dale R. Carlsen (incorporated by reference to Exhibit 10.3 to Mattress Firm Holding Corp.’s Current Report on Form 8‑ K filed September 11, 2015). |
|
10.7+* |
|
Confidential Separation Agreement and Release, dated December 14, 2015, by and among Mattress Firm Holding Corp., Mattress Firm, Inc., Mattress Holding Corp. and each of their affiliates including but not limited to The Sleep Train, Inc. and Dale R. Carlsen |
|
10.8+ |
|
Employment Agreement dated October 20, 2014, by and among Mattress Firm Holding Corp., Mattress Firm, Inc. and Robert D. Killgore (incorporated by reference to Exhibit 10.4 to Mattress Firm Holding Corp.’s Current Report on Form 8-K (File No. 001-35354) filed October 21, 2014). |
|
10.9+ |
|
First Amendment to Employment Agreement effective September 10, 2015, by and among Mattress Firm Holding Corp., Mattress Holding Corp. and Robert D. Killgore (incorporated by reference to Exhibit 10.2 to Mattress Firm Holding Corp.’s Current Report on Form 8-K (File No. 333‑174830) filed September 11, 2015). |
|
10.10+* |
|
Confidential Separation Agreement and General Release dated April 1, 2016, by and among Mattress Firm Holding Corp., Mattress Firm, Inc. and Robert D. Killgore. |
|
10.11+* |
|
Offer Letter and Employment, Confidentiality and Non‑Competition Agreement of Karrie Forbes, dated February 23, 2015 and March 2, 2015, respectively. |
|
10.12+* |
|
Letter Agreement, dated August 20, 2015, between Karrie Forbes and Mattress Firm, Inc. |
|
10.13+ |
|
Amended & Restated Employment Agreement of Kenneth E. Murphy III, dated March 21, 2016(incorporated by reference to Exhibit 10.1 to Mattress Firm Holding Corp.’s Current Report on Form 8-K (File No. 001-35354) filed March 21, 2016). |
|
10.14+ |
|
Employment Agreement dated February 5, 2016, by and among Mattress Firm Holding Corp., Mattress Firm, Inc. and Adam Blank (incorporated by reference to Exhibit 10.3 to Mattress Firm Holding Corp.’s Current Report on Form 8-K (File No. 001-35354) filed February 5, 2016). |
103
|
Exhibit
|
|
Exhibit Title |
|
10.15 |
|
ABL Credit Agreement, dated as of October 20, 2014, among Mattress Holding Corp., as borrower, Mattress Holdco, Inc., Barclays Bank PLC, as administrative agent, collateral agent and issuer, and the other lenders and issuers party thereto (incorporated by reference to Exhibit 10.1 to Mattress Firm Holding Corp.’s Current Report on Form 8-K (File No. 001-35354) filed October 21, 2014). |
|
10.16 |
|
Amendment No. 1 to ABL Credit Agreement, among Mattress Holding Corp., Mattress Holdco, Inc., the lenders and issuers party thereto, and Barclays Bank PLC, as administrative agent and collateral agent (incorporated by reference to Exhibit 10.1 to Mattress Firm Holding Corp.’s Current Report on Form 8-K (File No. 001-35354) filed February 5, 2016). |
|
10.17 |
|
Term Loan Credit Agreement, dated as of October 20, 2014, among, Mattress Holding Corp., as borrower, Mattress Holdco, Inc., Barclays Bank PLC, as administrative agent and collateral agent, and the other lenders party thereto (incorporated by reference to Exhibit 10.2 to Mattress Firm Holding Corp.’s Current Report on Form 8-K (File No. 001-35354) filed October 21, 2014). |
|
10.18 |
|
Amendment No. 1 to Term Loan Credit Agreement, among Mattress Holding Corp., Mattress Holdco, Inc., the lenders party thereto, and Barclays Bank PLC, as administrative agent and collateral agent (incorporated by reference to Exhibit 10.2 to Mattress Firm Holding Corp.’s Current Report on Form 8-K (File No. 001-35354) filed February 5, 2016). |
|
10.19 |
|
Form of Director and Officer Indemnification Agreement (incorporated by reference to Exhibit 10.4 to Mattress Firm Holding Corp.’s Current Report on Form 8-K (File No. 001-35354) filed October 21, 2014). |
|
10.20 |
|
Master Retailer Agreement between Simmons Bedding Company and Mattress Firm, Inc., effective January 1, 2014 (incorporated by reference to Exhibit 10.11 to Mattress Firm Holding Corp.’s Annual Report on Form 10-K (File No. 001-35354) filed on March 27, 2014). |
|
10.21 |
|
Master Retailer Agreement between Serta, Inc. and Mattress Firm, Inc., effective January 1, 2014 (incorporated by reference to Exhibit 10.12 to Mattress Firm Holding Corp.’s Annual Report on Form 10-K (File No. 001-35354) filed on March 27, 2014). |
|
10.22 |
|
Master Retailer Agreement between Tempur-Pedic North America, LLC and Mattress Firm, Inc., effective January 1, 2014 (incorporated by reference to Exhibit 10.1 to Mattress Firm Holding Corp.’s Current Report on Form 8-K (File No. 001-35354) filed December 2, 2014). |
|
10.23 |
|
Addendum No. 1 to Master Retailer Agreement, between Tempur-Pedic North America, LLC and Mattress Firm, Inc., dated effective January 1, 2015 (incorporated by reference to Exhibit 10.1 to Mattress Firm Holding Corp.’s Quarterly Report on Form 10-Q (File No. 001-35354) filed December 8, 2015). |
|
10.24 |
|
Amendment to Master Retailer Agreement, between Tempur-Pedic North America, LLC and Mattress Firm, Inc., dated effective June 15, 2015 (incorporated by reference to Exhibit 10.3 to Mattress Firm Holding Corp.’s Quarterly Report on Form 10-Q (File No. 001-35354) filed December 8, 2015). |
|
10.25 |
|
Master Retailer Agreement between Sealy Mattress Company and Mattress Firm, Inc., effective January 1, 2014 (incorporated by reference to Exhibit 10.1 to Mattress Firm Holding Corp.’s Current Report on Form 8-K (File No. 001-35354) filed July 15, 2014). |
|
10.26 |
|
Addendum No. 1 to Master Retailer Agreement between Sealy Mattress Company and Mattress Firm, Inc., dated effective January 1, 2015 (incorporated by reference to Exhibit 10.2 to Mattress Firm Holding Corp.’s Quarterly Report on Form 10-Q (File No. 001-35354) filed December 8, 2015). |
|
10.27 |
|
Amendment to Master Retailer Agreement, between Sealy Mattress Company and Mattress Firm, Inc., dated effective June 15, 2015 (incorporated by reference to Exhibit 10.4 to Mattress Firm Holding Corp.’s Quarterly Report on Form 10-Q (File No. 001-35354) filed December 8, 2015). |
|
10.28 |
|
Mattress Firm Holding Corp. Executive Annual Incentive Plan (incorporated by reference to Exhibit 10.21 to Mattress Firm Holding Corp.’s Registration Statement on Form S‑1/A (File No. 333‑174830) filed November 7, 2011). |
|
10.29+* |
|
Independent Director Compensation Policy, effective December 16, 2015. |
104
|
Exhibit
|
|
Exhibit Title |
|
10.30 |
|
Share Purchase Agreement dated February 3, 2016, by and among Mattress Firm Holding Corp., Winter Street Opportunities Fund, L.P., JWC Fund III Coinvest, LLC and R. Stephen Stagner (incorporated by reference to Exhibit 10.2 to Mattress Firm Holding Corp.’s Current Report on Form 8‑K (File No. 001-35354) filed February 3, 2016). |
|
21.1* |
|
Subsidiaries of Mattress Firm Holding Corp. |
|
23.1* |
|
Consent of Deloitte & Touche LLP. |
|
31.1* |
|
Principal Executive Officer Certification Pursuant to Securities Exchange Act Rules 13a‑14 and 15d‑14 as Adopted Pursuant to the Section 302 of the Sarbanes‑Oxley Act of 2002. |
|
31.2* |
|
Principal Financial Officer Certification Pursuant to Securities Exchange Act Rules 13a‑14 and 15d‑14 as Adopted Pursuant to the Section 302 of the Sarbanes‑Oxley Act of 2002. |
|
32.1** |
|
Principal Executive Officer Certification Pursuant to 18 U.S.C. Section 1350 as Adopted Pursuant to Section 906 of the Sarbanes‑Oxley Act of 2002. |
|
32.2** |
|
Principal Financial Officer Certification Pursuant to 18 U.S.C. Section 1350 as Adopted Pursuant to Section 906 of the Sarbanes‑Oxley Act of 2002. |
|
101.INS* |
|
XBRL Instance Document |
|
101.SCH* |
|
XBRL Taxonomy Extension Schema Document |
|
101.CAL* |
|
XBRL Taxonomy Extension Calculation Linkbase Document |
|
101.LAB* |
|
XBRL Taxonomy Extension Lables Linkbase Document |
|
101.PRE* |
|
XBRL Taxonomy Extension Presentation Linkbase Document |
|
101.DEF* |
|
XBRL Taxonomy Extension Definition Linkbase Document |
+Management contract or compensatory plan or arrangement.
*Filed herewith.
**Furnished herewith.
105
MATTRESS FIRM HOLDING CORP.
SCHEDULE I—CONDENSED FINANCIAL INFORMATION OF
MATTRESS FIRM HOLDING CORP.
(PARENT COMPANY)
These condensed parent company financial statements of Mattress Firm Holding Corp. (the “Company”) should be read in conjunction with the consolidated financial statements of Mattress Firm Holding Corp. and subsidiaries. The Senior Credit Facility of Mattress Holding Corp., an indirect subsidiary of Mattress Firm Holding Corp., contains provisions whereby Mattress Holding Corp. is prohibited from distributing dividends to Mattress Firm Holding Corp. or other subsidiaries of Mattress Firm Holding Corp. As of February 3, 2015 and February 2, 2016, the net assets of Mattress Holding Corp. subject to such restrictions under the Senior Credit Facility were $435.4 million and $511.4 million, respectively.
106
MATTRESS FIRM HOLDING CORP.
SCHEDULE I—CONDENSED FINANCIAL INFORMATION OF
MATTRESS FIRM HOLDING CORP.
(PARENT COMPANY)
BALANCE SHEETS
|
|
|
February 3, |
|
February 2, |
|
||
|
|
|
2015 |
|
2016 |
|
||
|
|
|
(in thousands, except |
|
||||
|
|
|
share amounts) |
|
||||
|
Assets |
|
|
|
|
|
|
|
|
Cash and cash equivalents |
|
$ |
37 |
|
|
42 |
|
|
Investment in subsidiary |
|
|
435,446 |
|
|
511,440 |
|
|
Total assets |
|
$ |
435,483 |
|
$ |
511,482 |
|
|
Liabilities and Stockholder’s Equity |
|
|
|
|
|
|
|
|
Commitments and contingencies |
|
|
|
|
|
|
|
|
Common stock, $0.01 par value; 120,000,000 shares authorized; 35,134,187 and 35,101,632 shares issued and outstanding at February 3, 2015; and 35,356,859 and 35,294,568 shares issued and outstanding at February 2, 2016, respectively |
|
|
351 |
|
|
353 |
|
|
Additional paid-in capital |
|
|
435,882 |
|
|
447,357 |
|
|
(Accumulated deficit) retained earnings |
|
|
(750) |
|
|
63,772 |
|
|
Total stockholder’s equity |
|
|
435,483 |
|
|
511,482 |
|
|
Total liabilities and stockholder’s equity |
|
$ |
435,483 |
|
$ |
511,482 |
|
107
MATTRESS FIRM HOLDING CORP.
SCHEDULE I—CONDENSED FINANCIAL INFORMATION OF
MATTRESS FIRM HOLDING CORP.
(PARENT COMPANY)
STATEMENTS OF OPERATIONS
|
|
|
|
|
|
|
|
|
|
|
|
|
|
|
Fiscal 2013 |
|
Fiscal 2014 |
|
Fiscal 2015 |
|
|||
|
|
|
(in thousands) |
|
|||||||
|
Equity in undistributed earnings of subsidiary |
|
$ |
52,905 |
|
$ |
44,232 |
|
$ |
64,522 |
|
|
Interest income |
|
|
19 |
|
|
19 |
|
|
— |
|
|
Net income |
|
|
52,924 |
|
$ |
44,251 |
|
$ |
64,522 |
|
108
MATTRESS FIRM HOLDING CORP.
SCHEDULE I—CONDENSED FINANCIAL INFORMATION OF
MATTRESS FIRM HOLDING CORP.
(PARENT COMPANY)
STATEMENTS OF CASH FLOWS
|
|
|
Fiscal 2013 |
|
Fiscal 2014 |
|
Fiscal 2015 |
|
|||
|
|
|
(in thousands) |
|
|||||||
|
Cash flows from operating activities: |
|
|
|
|
|
|
|
|
|
|
|
Net income |
|
$ |
52,924 |
|
$ |
44,251 |
|
$ |
64,522 |
|
|
Adjustments to reconcile net income to net cash provided by operating activities: |
|
|
|
|
|
|
|
|
|
|
|
Equity in earnings of subsidiary |
|
|
(52,905) |
|
|
(44,232) |
|
|
(64,522) |
|
|
Effects of changes in operating assets and liabilities: |
|
|
|
|
|
|
|
|
|
|
|
Accrued liabilities |
|
|
548 |
|
|
(548) |
|
|
— |
|
|
Net cash provided by (used in) operating activities |
|
|
567 |
|
|
(529) |
|
|
— |
|
|
Cash flows from investing activities: |
|
|
|
|
|
|
|
|
|
|
|
Contribution to subsidiary |
|
|
— |
|
|
(19,085) |
|
|
(2,074) |
|
|
Net cash used in investing activities |
|
|
— |
|
|
(19,085) |
|
|
(2,074) |
|
|
Cash flows from financing activities: |
|
|
|
|
|
|
|
|
|
|
|
Proceeds from exercise of common stock options |
|
|
3,027 |
|
|
4,877 |
|
|
2,079 |
|
|
Net cash provided by financing activities |
|
|
3,027 |
|
|
4,877 |
|
|
2,079 |
|
|
Net change in cash and cash equivalents |
|
|
3,594 |
|
|
(14,737) |
|
|
5 |
|
|
Cash and cash equivalents, beginning of period |
|
|
11,180 |
|
|
14,774 |
|
|
37 |
|
|
Cash and cash equivalents, end of period |
|
$ |
14,774 |
|
$ |
37 |
|
$ |
42 |
|
|
|
|
|
|
|
|
|
|
|
|
|
|
Non-Cash Investing Activities |
|
|
|
|
|
|
|
|
|
|
|
Equity issued in acquisitions by subsidiary |
|
|
— |
|
|
47,661 |
|
|
— |
|
109
MATTRESS FIRM HOLDING CORP.
SCHEDULE II—VALUATION AND QUALIFYING ACCOUNTS
For the three years ended February 2, 2016
|
|
|
|
|
|
|
|
|
|
|
|
|
|
|
|
|
|
|
|
|
Balance at |
|
Additions |
|
|
|
|
|
|
|
|||||
|
|
|
Beginning of |
|
Charged to |
|
Charged to |
|
Deductions from |
|
Balance at |
|
|||||
|
Description |
|
Period |
|
Income |
|
Other Accounts |
|
Reserves(1) |
|
End of Period |
|
|||||
|
|
|
(in thousands) |
|
|||||||||||||
|
Year Ended January 28, 2014 |
|
|
|
|
|
|
|
|
|
|
|
|
|
|
|
|
|
Uncollectible accounts receivable |
|
$ |
269 |
|
$ |
831 |
|
$ |
— |
|
$ |
- |
|
$ |
1,100 |
|
|
Sales returns reserve |
|
|
1,485 |
|
|
8,753 |
|
|
49 |
|
|
8,291 |
|
|
1,996 |
|
|
Store closing reserve |
|
|
241 |
|
|
31 |
|
|
— |
|
|
228 |
|
|
44 |
|
|
Year Ended February 3, 2015 |
|
|
|
|
|
|
|
|
|
|
|
|
|
|
|
|
|
Uncollectible accounts receivable |
|
$ |
1,100 |
|
$ |
364 |
|
$ |
— |
|
$ |
— |
|
$ |
1,464 |
|
|
Sales returns reserve |
|
|
1,996 |
|
|
9,526 |
|
|
2,110 |
|
|
10,581 |
|
|
3,051 |
|
|
Store closing reserve |
|
|
44 |
|
|
184 |
|
|
991 |
|
|
154 |
|
|
1,065 |
|
|
Year Ended February 2, 2016 |
|
|
|
|
|
|
|
|
|
|
|
|
|
|
|
|
|
Uncollectible accounts receivable |
|
$ |
1,464 |
|
$ |
— |
|
$ |
— |
|
$ |
611 |
|
$ |
853 |
|
|
Sales returns reserve |
|
|
3,051 |
|
|
15,474 |
|
|
10 |
|
|
16,182 |
|
|
2,353 |
|
|
Store closing reserve |
|
|
1,065 |
|
|
350 |
|
|
— |
|
|
785 |
|
|
630 |
|
|
(1) |
Deductions from reserves represent losses or expenses for which the respective reserves were created. In the case of the uncollectible accounts receivable, deductions are net of recovered amounts previously written off. |
110
Pursuant to the requirements of Section 13 or 15(d) of the Securities Exchange Act of 1934, the registrant has duly caused this report to be signed on its behalf by the undersigned, thereunto duly authorized.
|
|
MATTRESS FIRM HOLDING CORP. |
||
|
|
|
||
|
|
By: |
/s/ Kenneth E. Murphy III |
|
|
|
|
Name: |
Kenneth E. Murphy III |
|
|
|
Title: |
President and Chief Executive Officer |
Date: April 4, 2016
Pursuant to the requirements of the Securities Exchange Act of 1934, this report has been signed below by the following persons on behalf of the registrant and in the capacities and on the dates indicated:
|
Signature |
|
Title |
|
Date |
|
|
|
|
|
|
|
/s/ Kenneth E. Murphy III |
President and Chief Executive Officer (principal executive officer) |
April 4, 2016 |
||
|
Kenneth E. Murphy III |
||||
|
/s/ R. Stephen Stagner |
Executive Chairman, Director |
April 4, 2016 |
||
|
R. Stephen Stagner |
||||
|
|
|
|
|
|
|
/s/ Alex Weiss |
Chief Financial Officer (principal financial officer) |
April 4, 2016 |
||
|
Alex Weiss |
||||
|
|
|
|
|
|
|
/s/ Cathy Hauslein |
Senior Vice President and Chief Accounting Officer (principal accounting officer) |
April 4, 2016 |
||
|
Cathy Hauslein |
||||
|
|
|
|
|
|
|
/s/ John W. Childs |
Director |
April 4, 2016 |
||
|
John W. Childs |
||||
|
|
|
|
|
|
|
/s/ Adam L. Suttin |
Director |
April 4, 2016 |
||
|
Adam L. Suttin |
||||
|
|
|
|
|
|
|
/s/ David A. Fiorentino |
Director |
April 4, 2016 |
||
|
David A. Fiorentino |
||||
|
|
|
|
|
|
|
/s/ William E. Watts |
Director |
April 4, 2016 |
||
|
William E. Watts |
||||
|
|
|
|
|
|
|
/s/ Frederick C. Tinsey III |
Director |
April 4, 2016 |
||
|
Frederick C. Tinsey III |
||||
|
|
|
|
|
|
|
/s/ Charles R. Eitel |
Director |
April 4, 2016 |
||
|
Charles R. Eitel |
||||
|
/s/ Joseph M. Fortunato |
Director |
April 4, 2016 |
||
|
Joseph M. Fortunato |
||||
|
/s/ Robert E. Creager |
Director |
April 4, 2016 |
||
|
Robert E. Creager |
||||
|
/s/ Dale R. Carlsen |
Director |
April 4, 2016 |
||
|
Dale R. Carlsen |
111