Attached files
| file | filename |
|---|---|
| EX-32.1 - CERTIFICATION - BLUE DOLPHIN ENERGY CO | bdco_ex321.htm |
| EX-31.2 - CERTIFICATION - BLUE DOLPHIN ENERGY CO | bdco_ex312.htm |
| EX-31.1 - CERTIFICATION - BLUE DOLPHIN ENERGY CO | bdco_ex311.htm |
| EX-32.2 - CERTIFICATION - BLUE DOLPHIN ENERGY CO | bdco_ex322.htm |
| EX-21.1 - LIST OF SUBSIDIARIES OF BLUE DOLPHIN - BLUE DOLPHIN ENERGY CO | bdco_ex211.htm |
| EX-23.1 - CONSENT OF UHY LLP - BLUE DOLPHIN ENERGY CO | bdco_ex231.htm |
|
UNITED STATES
SECURITIES AND EXCHANGE COMMISSION
Washington, D.C. 20549
|
FORM 10-K
(Mark One)
|
[ Ö ]
|
ANNUAL REPORT PURSUANT TO SECTION 13 OR 15(d) OF THE SECURITIES EXCHANGE ACT OF 1934
|
For the fiscal year ended December 31, 2015
or
|
[ ]
|
TRANSITION REPORT PURSUANT TO SECTION 13 OR 15(d) OF THE SECURITIES EXCHANGE ACT OF 1934
|
For the transition period from to .
Commission File No. 0-15905
BLUE DOLPHIN ENERGY COMPANY
(Exact name of registrant as specified in its charter)
|
Delaware
|
73-1268729
|
|
|
State or other jurisdiction of incorporation or organization
|
(I.R.S. Employer Identification No.)
|
|
801 Travis Street, Suite 2100
Houston, Texas
|
77002
|
|
|
(Address of principal executive offices)
|
(Zip Code)
|
(713) 568-4725
Registrant’s telephone number, including area code
Securities registered pursuant to Section 12(b) of the Act:
|
Title of each class
|
Name of each exchange on which registered
|
|
|
Common Stock, par value $0.01 per share
|
OTCQX
|
Securities registered pursuant to Section 12(g) of the Act:
|
(Title of class)
|
Indicate by check mark if the registrant is a well-known seasoned issuer, as defined in Rule 405 of the Securities Act. Yes [ ] No [ Ö ]
Indicate by check mark if the registrant is not required to file reports pursuant to Section 13 or Section 15(d) of the Act. Yes [ ] No [ Ö ]
Indicate by check mark whether the registrant (1) has filed all reports required to be filed by Section 13 or 15(d) of the Securities Exchange Act of 1934 during the preceding 12 months (or for such shorter period that the registrant was required to file such reports), and (2) has been subject to such filing requirements for the past 90 days. Yes [ Ö ] No [ ]
Indicate by check mark whether the registrant has submitted electronically and posted on its corporate Web site, if any, every Interactive Data File required to be submitted and posted pursuant to Rule 405 of Regulation S-T (§232.405 of this chapter) during the preceding 12 months (or for such shorter period that the registrant was required to submit and post such files). Yes [ Ö ] No [ ]
Indicate by check mark if disclosure of delinquent filers pursuant to Item 405 of Regulation S-K (§229.405 of this chapter) is not contained herein, and will not be contained, to the best of registrant’s knowledge, in definitive proxy or information statements incorporated by reference in Part III of this Form 10-K or any amendment to this Form 10-K. [ Ö ]
Indicate by check mark whether the registrant is a large accelerated filer, an accelerated filer, a non-accelerated filer, or a smaller reporting company. See the definition of “large accelerated filer,” “accelerated filer” and “smaller reporting company” in Rule 12b-2 of the Act.
Large accelerated filer [ ] Accelerated filer [ ] Non-accelerated filer [ ] Smaller Reporting Company [ Ö ]
Indicate by check mark whether the registrant is a shell company (as defined in Rule 12b-2 of the Act). Yes [ ] No [ Ö ]
The aggregate market value of shares of common stock held by non-affiliates of the registrant was $10,000,310 based on the number of shares of common stock held by non-affiliates and the last reported sale price of the registrant's common stock on December 31, 2015.
|
Number of shares of common stock, par value $0.01 per share outstanding as of March 30, 2016: 10,453,802
|
|
BLUE DOLPHIN ENERGY COMPANY
|
2015 FORM 10-K
|
INTRODUCTION
This Annual Report on Form 10-K is a document that U.S. public companies file with the Securities and Exchange Commission (“SEC”) every year. Part I of the Annual Report provides a general overview of our business, including relevant risk factors. Part II of the Annual Report contains financial information and management’s discussion and analysis of our financial condition and results of operations. We hope investors will find it useful to have all of this information in a single document.
Within this Annual Report, “Blue Dolphin,” “we,” “our,” and “us” are used interchangeably to refer to Blue Dolphin Energy Company or to Blue Dolphin Energy Company and its subsidiaries, as appropriate to the context. Information in this Annual Report is current as of the filing date, unless otherwise specified.
CAUTION REGARDING FORWARD-LOOKING STATEMENTS
In this Annual Report, and from time to time throughout the year, we share our expectations for our future performance. These forward-looking statements include statements about our business plans; our expected financial performance, including the anticipated effect of strategic actions; previously reported material weakness in our internal control over financial reporting; economic, political and market conditions; and other factors that could affect our future results of operations or financial position, including, without limitation, statements under the sections entitled “Part I, Item 1. Business,” “Part I, Item 3. Legal Proceedings” and “Part II, Item 7. Management’s Discussion and Analysis of Financial Condition and Results of Operations”. Any statements we make that are not matters of current reportage or historical fact should be considered forward-looking. Such statements often include words such as “believe,” “expect,” “anticipate,” “intend,” “plan,” “estimate,” “will,” and similar expressions. By their nature, these types of statements are uncertain and are not guarantees of our future performance. Our forward-looking statements represent our estimates and expectations at the time that we make them. However, circumstances change constantly, often unpredictably, and investors should not place undue reliance on these statements. Many events beyond our control will determine whether our expectations will be realized. We disclaim any current intention or obligation to revise or update any forward-looking statements, or the factors that may affect their realization, whether in light of new information, future events or otherwise, and investors should not rely on us to do so. In the interests of our investors, and in accordance with the “safe harbor” provisions of the Private Securities Litigation Reform Act of 1995, “Part I, Item 1A. Risk Factors” within this Annual Report explains some of the important reasons that actual results may be materially different from those that we anticipate.
Remainder of Page Intentionally Left Blank
2
|
BLUE DOLPHIN ENERGY COMPANY
|
2015 FORM 10-K
|
GLOSSARY OF SELECTED OIL AND GAS TERMS
The following are abbreviations and definitions of certain terms used in this Annual Report, which are commonly used in the oil and gas industry:
|
Atmospheric gas oil (“AGO”). The heaviest product boiled by a crude distillation unit operating at atmospheric pressure. This fraction ordinarily sells as distillate fuel oil, either in pure form or blended with cracked stocks. In-blends atmospheric gas oil, usually serves as the premium quality component used to lift lesser streams to the standards of saleable furnace oil or diesel engine fuel. Certain ethylene plants, called heavy oil crackers, can take AGO as feedstock.
Barrel (“Bbl”). One stock tank barrel, or 42 U.S. gallons of liquid volume, used in reference to oil or other liquid hydrocarbons.
Blending. The physical mixture of a number of different liquid hydrocarbons to produce a finished product with certain desired characteristics. Products can be blended in-line through a manifold system, or batch blended in tanks and vessels. In-line blending of gasoline, distillates, jet fuel and kerosene is accomplished by injecting proportionate amounts of each component into the main stream where turbulence promotes thorough mixing. Additives, including octane enhancers, metal deactivators, anti-oxidants, anti-knock agents, gum and rust inhibitors, and detergents, are added during and/or after blending to result in specifically desired properties not inherent in hydrocarbons.
Barrels per Day (“Bpd”). A measure of oil output, represented by the number of barrels of oil produced in a single day.
Based on operating days.
Capacity utilization rate. A percentage measure that indicates the amount of available capacity that is being used at a facility.
Complexity. A numerical score that denotes, for a given refinery, the extent, capability, and capital intensity of the refining processes downstream of the crude oil distillation unit. The higher a refinery’s complexity, the greater the refinery’s capital investment and number of operating units used to separate feedstock into fractions, improve their quality, and increase the production of higher-valued products. Refinery complexities range from the relatively simple crude oil distillation unit (“topping unit”), which has a complexity of 1.0, to the more complex deep conversion (“coking”) refineries, which have a complexity of 12.0.
Condensate. Liquid hydrocarbons that are produced in conjunction with natural gas. Condensate is chemically more complex than liquefied petroleum gas. Although condensate is sometimes similar to crude oil, it is usually lighter.
Crude oil. A mixture of thousands of chemicals and compounds, primarily hydrocarbons. Crude oil quality is measured in terms of density (light to heavy) and sulfur content (sweet to sour). Crude oil must be broken down into its various components by distillation before these chemicals and compounds can be used as fuels or converted to more valuable products.
Crude oil distillation unit. The refinery processing unit where initial crude oil distillation takes place. See also definition of topping unit.
Cut. One or more crude oil compounds that vaporize and are extracted within a certain temperature range during the crude distillation process.
Depropanizer unit. A distillation column that is used to isolate propane from a mixture containing butane and other heavy components.
Desalting. Removal of salt from crude oil. Desalting is preferably performed prior to commercialization of the crude; must be performed prior to refining.
|
Distillates. The result of crude distillation and therefore any refined oil product. Distillate is more commonly used as an abbreviated form of middle distillate. There are mainly four (4) types of distillates: (i) very light oils or light distillates (e.g., natural gasoline, kerosene, and light and heavy naphtha), (ii) light oils or middle distillates (e.g., kerosene, light and heavy diesel), (iii) medium oils, and (iv) heavy fuel oils, such as our heavy oil-based mud blendstock (“HOBM”).
Distillation. The first step in the refining process whereby crude oil and condensate is heated at atmospheric pressure in the base of a distillation tower. As the temperature increases, the various compounds vaporize in succession at their various boiling points and then rise to prescribed levels within the tower according to their densities, from lightest to heaviest. They then condense in distillation trays and are drawn off individually for further refining. Distillation is also used at other points in the refining process to remove impurities. Lighter products produced in this process can be further refined in a catalytic cracking unit or reforming unit. Heavier products, which cannot be vaporized and separated in this process, can be further distilled in a vacuum distillation unit or coker.
Distillation tower. A tall column-like vessel in which crude oil and condensate is heated and its vaporized components distilled by means of distillation trays.
Exchanger (heat exchanger). A device used to transfer heat from one process liquid to another.
Feedstocks. Crude oil and other hydrocarbons, such as condensate and/or intermediate products, that are used as basic input materials in a refining process. Feedstocks are transformed into one or more finished products.
Fractionation. The separation of crude oil and condensate into its more valuable and usable components through distillation.
Field. An area consisting of a single reservoir or multiple reservoirs all grouped on or related to the same individual geological structural feature and/or stratigraphic condition.
Finished petroleum products. Materials or products which have received the final increments of value through processing operations, and which are being held in inventory for delivery, sale, or use.
Heat exchanger. See definition for exchanger.
Intermediate petroleum products. A petroleum product that might require further processing before it is saleable to the ultimate consumer. This further processing might be done by the producer or by another processor. Thus, an intermediate petroleum product might be a final product for one company and an input for another company that will process it further.
Jet fuel. A high-quality kerosene product primarily used in aviation. Kerosene-type jet fuel (including Jet A and Jet A-1) has a carbon number distribution between about 8 and 16 carbon atoms per molecule; wide-cut or naphtha-type jet fuel (including Jet B) has between about 5 and 15 carbon atoms per molecule. Jet fuel is a white product, so-called because it is transparent.
Kerosene. A middle distillate fraction of crude oil that is produced at higher temperatures than naphtha and lower temperatures than gas oil. It is usually used as jet turbine fuel and sometimes for domestic cooking, heating, and lighting.
|
3
|
BLUE DOLPHIN ENERGY COMPANY
|
2015 FORM 10-K
|
|
Leasehold interest. The interest of a lessee under an oil and gas lease.
Light crude. A liquid petroleum that has a low density and flows freely at room temperature. It has a low viscosity, low specific gravity, and a high API gravity due to the presence of a high proportion of light hydrocarbon fractions.
Liquefied petroleum gas (“LPG”). Manufactured during the refining of crude oil and condensate; burns relatively cleanly with no soot and very few sulfur emissions.
Low sulfur diesel. Not to be confused with ultra low sulfur diesel, low sulfur diesel contains a maximum 500 ppm sulfur.
MMcf. One million cubic feet; a measurement of gas volume only.
Naphtha. A refined or partly refined light distillate fraction of crude oil. Blended further or mixed with other materials it can make high-grade motor gasoline or jet fuel. It is also a generic term applied to the lightest and most volatile petroleum fractions.
Net revenue interest. The percentage of production to which the owner of a working interest is entitled.
Non-road, locomotive and marine diesel (“NRLM”). Used in locomotive, marine and non-road diesel engines and equipment, such as farm or construction equipment. Commonly referred to as “off-road” diesel. In the U.S., the EPA fuel standard for “off-road” vehicles was progressively lowered from low sulfur diesel (500 ppm sulfur) to ultra low sulfur diesel (15 ppm sulfur).
Overriding royalty interest. An interest in oil and gas produced at the surface, free of the expense of production that is in addition to the usual royalty interest reserved to the lessor in an oil and gas lease.
Petroleum. A naturally occurring flammable liquid consisting of a complex mixture of hydrocarbons of various molecular weights and other liquid organic compounds. The name petroleum covers both the naturally occurring unprocessed crude oils and petroleum products that are made up of refined crude oil.
Parts per Million “(ppm”). Represents the mass of a chemical or contaminate per unit volume of water.
Product slate. The type of refined petroleum products produced by the refining process.
Propane. A by-product of natural gas processing and petroleum refining. Propane is one of a group of liquefied petroleum gases. The others include butane, propylene, butadiene, butylene, isobutylene and mixtures thereof. See definition of liquefied petroleum gas.
Recommissioning. While commissioning of a new plant facility or refinery helps ensure correct operation of its major systems when first installed, recommissioning helps to restore an existing plant facility or refinery to its originally intended operating performance or capacity. Both processes comprise the integrated application of a set of engineering techniques and procedures to check, inspect and test every operational component of the project, from individual functions such as instruments and equipment, up to complex amalgamations, such as modules, subsystems and systems.
|
Refined petroleum products. Refined petroleum products are derived from crude oil and condensate that have been processed through various refining methods. The resulting products include gasoline, home heating oil, jet fuel, diesel, lubricants and the raw materials for fertilizer, chemicals, and pharmaceuticals. Following the refining process, the products are transported to terminals or local distribution centers for sale to various end-users and consumers.
Refinery. Within the oil and gas industry, a refinery is an industrial processing plant where crude oil and condensate is separated and transformed into marketable refined petroleum products.
Separation. The separation of the different hydrocarbons present in crude oil and condensate depending on their respective boiling ranges. This process takes place in a distillation column.
Sour crude. Crude oil containing sulfur content of more than 0.5%.
Stabilizer unit. A distillation column intended to remove the lighter boiling compounds, such as butane or propane from a product.
Sweet crude. Crude oil containing sulfur content of less than 0.5%.
Sulfur. Present at various levels of concentration in many hydrocarbon deposits, such as petroleum, coal, or natural gas. Also produced as a byproduct of removing sulfur-containing contaminants from natural gas and petroleum. Some of the most commonly used hydrocarbon deposits are categorized according to their sulfur content, with lower sulfur fuels usually selling at a higher, premium price and higher sulfur fuels selling at a lower, or discounted, price.
Topping unit. A type of petroleum refinery that engages in only the first step of the refining process -- crude distillation. A topping unit uses atmospheric distillation to separate crude oil and condensate into constituent petroleum products. A topping unit has a refinery complexity range of 1.0 to 2.0.
Throughput. The volume processed through a unit or a refinery or transported through a pipeline.
Turnaround. Scheduled large-scale maintenance activity wherein an entire process unit is taken offline for a week or more for comprehensive revamp and renewal.
Ultra low sulfur diesel (“ULSD”). A cleaner-burning diesel fuel containing a maximum 15 ppm sulfur. Primarily used for highway vehicles. Commonly referred to as “on-road” diesel.
Undivided interest. A form of ownership interest in which more than one person concurrently owns an interest in the same oil and gas lease or pipeline and in which the interests of the parties are not specified whether by percentage or portion of the property.
West Texas Intermediate (“WTI”). A grade of crude oil used as a benchmark in oil pricing. Described as intermediate because of its relative mid-range density and mid-range sulfur content.
Working interest. The operating interest that gives the owner the right to drill, produce, and conduct operating activities on the property and receive a share of production after the corresponding percentage of operational costs and royalties are paid.
Yield. The percentage of refined petroleum products that is produced from crude oil and other feedstocks.
|
4
|
BLUE DOLPHIN ENERGY COMPANY
|
2015 FORM 10-K
|
TABLE OF CONTENTS
|
PART I
|
6 | |
|
ITEM 1.
|
BUSINESS
|
6
|
|
ITEM 1A.
|
RISK FACTORS
|
17
|
|
ITEM 1B.
|
UNRESOLVED STAFF COMMENTS
|
25
|
|
ITEM 2.
|
PROPERTIES
|
25
|
|
ITEM 3.
|
LEGAL PROCEEDINGS
|
26
|
|
ITEM 4.
|
MINE SAFETY DISCLOSURES
|
26
|
|
PART II
|
27
|
|
|
ITEM 5.
|
MARKET FOR REGISTRANT’S COMMON EQUITY, RELATED STOCKHOLDER MATTERS AND ISSUER PURCHASES OF EQUITY SECURITIES
|
27
|
|
ITEM 6.
|
SELECTED FINANCIAL DATA
|
27
|
|
ITEM 7.
|
MANAGEMENT'S DISCUSSION AND ANALYSIS OF FINANCIAL CONDITION AND RESULTS OF OPERATIONS
|
28
|
|
ITEM 7A.
|
QUANTITATIVE AND QUALITATIVE DISCLOSURES ABOUT MARKET RISK
|
41
|
|
ITEM 8.
|
FINANCIAL STATEMENTS AND SUPPLEMENTARY DATA
|
42
|
|
ITEM 9.
|
CHANGES IN AND DISAGREEMENTS WITH ACCOUNTANTS ON ACCOUNTING AND FINANCIAL DISCLOSURE
|
73
|
|
ITEM 9A.
|
CONTROLS AND PROCEDURES
|
73
|
|
ITEM 9B.
|
OTHER INFORMATION
|
74
|
|
PART III
|
75
|
|
|
ITEM 10.
|
DIRECTORS, EXECUTIVE OFFICERS AND CORPORATE GOVERNANCE
|
75
|
|
ITEM 11.
|
EXECUTIVE COMPENSATION
|
79
|
|
ITEM 12.
|
SECURITY OWNERSHIP OF CERTAIN BENEFICIAL OWNERS AND MANAGEMENT AND RELATED STOCKHOLDER MATTERS
|
81
|
|
ITEM 13.
|
CERTAIN RELATIONSHIPS AND RELATED TRANSACTIONS, AND DIRECTOR INDEPENDENCE
|
82
|
|
ITEM 14.
|
PRINCIPAL ACCOUNTING FEES AND SERVICES
|
83
|
|
PART IV
|
84
|
|
|
ITEM 15.
|
EXHIBITS, FINANCIAL STATEMENT SCHEDULES
|
84
|
|
SIGNATURES
|
92
|
5
|
BLUE DOLPHIN ENERGY COMPANY
|
2015 FORM 10-K
|
PART I
ITEM 1. BUSINESS
Nature of Operations
We are primarily an independent refiner and marketer of petroleum products. Our primary asset is a 15,000 bpd crude oil and condensate processing facility that is located in Nixon, Texas (the “Nixon Facility”). As part of our refinery business segment, we conduct petroleum storage and terminaling operations under third-party lease agreements at the Nixon Facility. We also own and operate pipeline assets and have leasehold interests in oil and gas properties.
Structure and Management
We were formed as a Delaware corporation in 1986. We are currently controlled by Lazarus Energy Holdings, LLC (“LEH”), which owns approximately 81% of our common stock, par value $0.01 per share (the “Common Stock). LEH manages and operates all of our properties pursuant to an Operating Agreement (the “Operating Agreement”). Jonathan P. Carroll is Chairman of the Board of Directors (the “Board”), Chief Executive Officer and President of Blue Dolphin, as well as a majority owner of LEH. See “Part II, Item 8. Financial Statements and Supplementary Data – Note (9) Accounts Payable, Related Party,” “Note (12) Long-Term Debt,” and “Note (20) Commitments and Contingencies – Financing Agreements” of this Annual Report for additional disclosures related to the Operating Agreement, Jonathan P. Carroll, and LEH.
Our operations are conducted through the following operating subsidiaries:
|
·
|
Lazarus Energy, LLC, a Delaware limited liability company (“LE”);
|
|
·
|
Lazarus Refining & Marketing, LLC, a Delaware limited liability company (“LRM”);
|
|
·
|
Blue Dolphin Pipe Line Company, a Delaware corporation;
|
|
·
|
Blue Dolphin Petroleum Company, a Delaware corporation; and
|
|
·
|
Blue Dolphin Services Co., a Texas corporation.
|
Refinery Operations
Overview
The Nixon Facility is situated on approximately 56 acres in Nixon, Wilson County, Texas. The Nixon Facility consists of a distillation unit, naphtha stabilizer unit, depropanizer unit, and related loading and unloading facilities and utilities. At December 31, 2015, the site contained approximately 398,000 bbls of crude oil, condensate, and refined petroleum product storage capacity. We are currently constructing an additional 700,000 bbls of petroleum storage capacity at the Nixon Facility. When construction is complete, total crude oil, condensate, and refind petroleum product storage capacity at the Nixon Facility will exceed 1,000,000 bbls.
The existing Nixon Facility was built in 1980, with a processing capacity of 15,000 bpd. The refinery operated intermittently under various owners from 1980 to 1992. The refinery sat dormant from 1992 until acquired by LE in 2006. LE refurbished the facility, replaced certain key components, and placed the refinery back in service in 2012.
The Nixon Facility is located in the Eagle Ford Shale region of South-Central Texas, among a high concentration of oil and gas properties. Management closely monitors and adjusts the yields of the Nixon Facility’s most profitable refined petroleum products, utilizes an inventory risk management policy to reduce commodity price risk, and tightly manages refinery operating expenses in an effort to maximize refining margins. Under our inventory risk management policy, Genesis Energy, LLC (“Genesis”) may, but is not required to, use derivative instruments when certain of our refined petroleum product inventories exceed certain thresholds.
6
|
BLUE DOLPHIN ENERGY COMPANY
|
2015 FORM 10-K
|
Refining Industry Overview
Crude oil refining is the process of separating the hydrocarbons present in crude oil into usable or refined petroleum products such as naphtha, diesel, jet fuel and other products. Crude oil refining is primarily a margin-based business where both crude oil and refined petroleum products are commodities with prices that can fluctuate independently for short periods due to supply, demand, transportation and other factors. In order to increase profitability, or improve margins, it is important for a crude oil refinery to maximize the yields of higher value petroleum products and to minimize the costs of feedstocks and operating expenses. There are also a number of operational efficiencies that can be deployed to improve margins. These include selecting the appropriate crude oil or condensate to fulfill anticipated product demand, increasing the amount and value of refined petroleum products processed from the crude oil or condensate, reducing downtime for maintenance, repair and investment, developing valuable by-products or production inputs out of materials that are typically discarded, and adjusting utilization rates.
Crude oil and condensate supply and demand dynamics vary by region, creating differentiated margin opportunities based on the refinery’s location. The Nixon Facility is located in the Gulf Coast region of the U.S., which is represented by the Energy Information Administration as Petroleum Administration for Defense District 3 (“PADD 3”).
A refinery's product slate depends on the refinery's configuration and the type of crude oil and/or condensate being refined, and can be adjusted based on market demand. Although an increase or decrease in the price for crude oil generally results in a similar increase or decrease in prices for refined petroleum products, there is normally a time lag in the realization of the similar increase or decrease in prices for refined petroleum products. The effect of changes in crude oil prices on a refinery’s results of operations depends, in part, on how quickly and how fully refined petroleum products prices adjust to reflect these changes.
Nixon Facility Process Summary
With a current capacity of 15,000 bpd, the Nixon Facility is considered a “topping unit” because it is primarily comprised of a crude distillation unit, the first stage of the crude oil refining process. The Nixon Facility’s current level of complexity allows us to refine crude oil and condensate into finished and intermediate petroleum products. Our jet fuel is sold in nearby markets, and our intermediate products, including LPG, naphtha, HOBM, and AGO are sold to wholesalers and nearby refineries for further blending and processing. The Nixon Facility uses light crude oil and condensate sourced in the Eagle Ford Shale as feedstock.
Remainder of Page Intentionally Left Blank
7
|
BLUE DOLPHIN ENERGY COMPANY
|
2015 FORM 10-K
|
The below diagram represents a high level overview of the current crude oil and condensate refining process at the Nixon Facility.
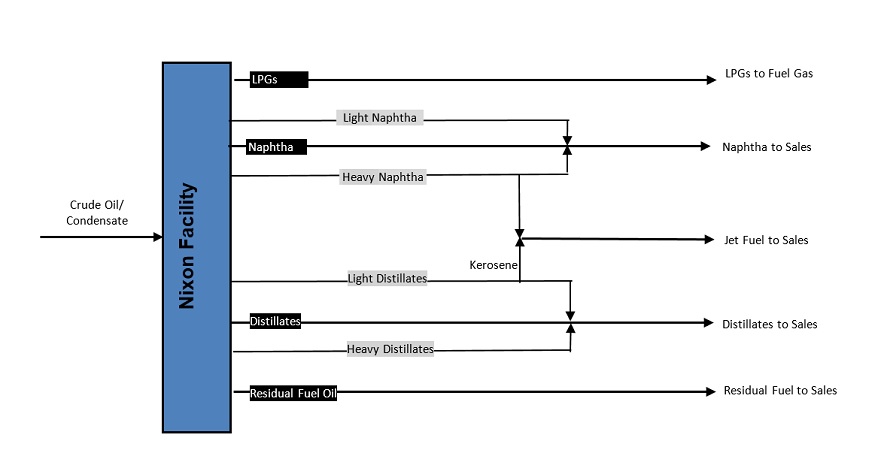
Example represents a simplified plant configuration. The specific configuration will vary based on various market and operational factors.
Refinery Operations Business Strategy
We plan to continue improving the Nixon Facility in order to support near-term performance. In 2015, we announced plans to expand the Nixon Facility by constructing additional petroleum storage tanks, as well as purchasing, refurbishing, and redeploying idle refinery equipment. Potential benefits of the Nixon Facility expansion plan include:
|
·
|
generating additional revenue from leasing product and crude storage to third parties;
|
|
·
|
having crude and product storage to support refinery throughput and future expansion of up to 30,000 bbls per day; and
|
|
·
|
increasing the processing capacity and complexity of the Nixon Facility.
|
During 2015, we secured $35.0 million in 19 year financing for the Nixon Facility expansion project. To date, we have:
|
(i)
|
completed refurbishment of the naphtha stabilizer and depropanizer units, which improve the overall quality of the naphtha that we produce and help increase the capacity utilization rate of the Nixon Facility;
|
|
(ii)
|
purchased idle refinery equipment, including, among others, a Merox unit, vacuum tower, prefrac tower unit, and LPG fractionator, which may, over time, be refurbished for use at the Nixon Facility;
|
|
(iii)
|
continued debottlenecking efforts, which improve production and efficiency;
|
|
(iv)
|
completed construction of an additional 100,000 bbls of petroleum storage tanks at the Nixon Facility; and
|
8
|
BLUE DOLPHIN ENERGY COMPANY
|
2015 FORM 10-K
|
|
(v)
|
made smaller, impactful capital improvements to the Nixon Facility, including refurbishment of the wastewater system, and construction of a new parking area, new access roads, drainage, and tank firewalls.
|
We are currently constructing an additional 700,000 bbls of petroleum storage capacity at the Nixon Facility. When construction is complete, total crude oil, condensate, and refined petroleum product storage capacity at the Nixon Facility will exceed 1,000,000 bbls.
Raw Material Supply
The primary input for the Nixon Facility is crude oil and condensate sourced from the Eagle Ford Shale. As a result of the declining price of crude oil and condensate from late 2014 through 2015, our average crude oil and condensate costs were lower. However, the number of barrels of crude oil and condensate that we processed increased year over year by 317,601 bbls, or nearly 8%, from 3,862,351 bbls for the year ended December 31, 2014, to 4,179,952 bbls for the year ended December 31, 2015.
According to the Energy Information Administration’s January 2016 Short-Term Energy Outlook, there is still high uncertainty in the crude oil price outlook, and crude oil prices are expected to remain low as supply continues to outpace demand in 2016 and more crude oil is placed into storage. With regard to domestic production, although there was a significant decline in total rig counts in 2015, rig counts have largely stabilized in the core counties of the Bakken, Eagle Ford, Niobrara, and Permian. In these areas, falling costs and ongoing technological and process improvements in rig, labor, and well productivity are anticipated to lead to faster rates of well completions and less-rapid production declines relative to other areas. The ongoing gains in learning-by-doing, cost reductions, and rig and well productivity are expected to enhance the economic viability of these areas as well as to be disseminated to other regions, incrementally reducing the breakeven costs of production in more marginal areas.
Crude Oil and Condensate Supply
We purchase the light crude oil and condensate for the Nixon Facility pursuant to an exclusive Crude Oil Supply and Throughput Services Agreement (the “Crude Supply Agreement”) with GEL TEX Marketing, LLC (“GEL”), an affiliate of Genesis. We have the ability to purchase crude oil and condensate from other suppliers with the prior consent of GEL. All crude oil and condensate supplied pursuant to the Crude Supply Agreement is paid for pursuant to the terms of the Joint Marketing Agreement. In addition, we have granted GEL right of first refusal to use three petroleum storage tanks at the Nixon Facility during the term of the Crude Supply Agreement. See “Part II, Item 7. Management’s Discussion and Analysis of Financial Condition and Results of Operations – Relationship with Genesis” of this Annual Report for more information related to the Crude Supply Agreement.
Subject to certain termination rights, the Crude Supply Agreement had an initial term of three years. The initial term ended in August 2014. However, in October 2013, LE entered into a Letter Agreement Regarding Certain Advances and Related Agreements with GEL and Milam Services, Inc. (“Milam”) (the “October 2013 Letter Agreement”), effective in October 2013. In accordance with the terms of the October 2013 Letter Agreement, LE agreed not to terminate the Crude Supply Agreement and GEL agreed to automatically renew the Crude Supply Agreement at the end of the initial term for successive one year periods until August 2019 unless sooner terminated by GEL with 180 days prior written notice.
Crude oil and condensate is currently received at the Nixon Facility by truck and stored in tanks. The Nixon Facility property is crossed by a crude oil and condensate pipeline owned by Koch Pipeline Company. The pipeline represents a potential future opportunity to receive crude oil and condensate at the Nixon Facility, which could reduce trucking costs.
Electrical Power Supply
A regional electric cooperative supplies electrical power to the Nixon Facility.
Fuel Supply
Fuel gas (LPGs) that are produced at the Nixon Facility are used as fuel within the refinery. In addition, small amounts of propane are occasionally acquired for use in starting-up the Nixon Facility.
9
|
BLUE DOLPHIN ENERGY COMPANY
|
2015 FORM 10-K
|
Turnaround and Refinery Reliability
We are committed to the safe and efficient operation of the Nixon Facility. Turnarounds are used to repair, restore, refurbish or replace refinery equipment such as vessels, tanks, reactors, piping, rotating equipment, instrumentation, electrical equipment, heat exchangers and fired heaters. Typically a refinery undergoes a major facility turnaround every three to five years. Since the Nixon Facility is still in the recommissioning phase, one or more of the units may require additional unscheduled downtime for unanticipated maintenance or repairs that are more frequent than our scheduled turnarounds.
Petroleum Refining Market and Competition
The principal competitive factors affecting refineries are crude oil and other feedstock costs, capacity utilization rates, refinery operating expenses, refined petroleum products mix, and product distribution/transportation costs. Many of our principal competitors are larger, independent refining or multinational integrated oil companies (such as Valero, Chevron, ExxonMobil, Shell and ConocoPhillips). These competitors are often better able to withstand volatile market conditions, compete on the basis of price, obtain crude oil in times of shortage and bear the economic risk inherent in all phases of the refining industry because of their larger capitalization, diversified operations, multiple locations, and larger refinery complexities. We compete primarily on the basis of cost. Due to the low complexity of our simple “topping unit” refinery, we can be relatively nimble in adjusting our refined petroleum products slate as a result of changing commodity prices, market demand, and refinery operating costs.
Refining Operations Customers
Customers for our refined petroleum products include distributors, wholesalers and refineries primarily in the lower portion of the Texas Triangle (the Houston - San Antonio - Dallas/Fort Worth area). We have bulk term contracts, including month-to-month, six months, and up to five year terms, in place with most of our customers. Certain of our contracts require us to sell fixed quantities and/or minimum quantities of intermediate and finished petroleum products and many of these arrangements are subject to periodic renegotiation, which could result in us receiving higher or lower relative prices for our refined petroleum products. See “Part II, Item 8. Financial Statements and Supplementary Data – Note (14) Concentration of Risk” of this Annual Report for disclosures related to significant customers.
Pipeline Transportation
Our pipeline transportation operations involve the gathering and transportation of oil and natural gas for producers/shippers operating offshore in the vicinity of our pipelines, as well as leasehold interests in oil and natural gas properties, in the Gulf of Mexico. Our pipeline transportation operations represented less than 1% of total revenue for the years ended December 31, 2015 and 2014.
Acquisition, Disposition and Restructuring Activities
Consistent with our growth strategy, we are continuously engaged in discussions with potential sellers of assets, including LEH, our majority stockholder, regarding the possible purchase of assets and operations that are strategic and complementary to our existing operations. These acquisition efforts may involve participation by us in processes that have been made public and involve a number of potential buyers, commonly referred to as “auction” processes, as well as situations in which we believe we are the only potential buyer or one of a limited number of potential buyers in negotiations with the potential seller. These acquisition efforts often involve assets and operations which, if acquired, could have a material effect on our financial condition and results of operations and require special financing. The closing of any transaction for which we have entered into a definitive agreement will be subject to customary and other closing conditions, which may not ultimately be satisfied or waived. Accordingly, we can give no assurance that any anticipated acquisition efforts will be successful. Although we expect acquisitions to be accretive in the long-term, there can be no assurance that such expectations will ultimately be realized.
10
|
BLUE DOLPHIN ENERGY COMPANY
|
2015 FORM 10-K
|
In February 2013, the Board established a Master Limited Partnership (“MLP”) Conversion special committee to oversee a potential conversion of Blue Dolphin from a Delaware “C” corporation to a Delaware MLP. Due to a less hospitable financing market, MLPs were negatively impacted during 2015. The special committee is continuing to evaluate the market. There can be no assurance that the special committee’s review will lead to a proposal for a conversion or restructuring of Blue Dolphin, or if a proposal is made, that such a proposed transaction will be approved or consummated.
Insurance and Risk Management
Our operations are subject to significant hazards and risks inherent in crude oil and condensate refining operations and in the transportation and storage of crude oil and condensate, as well as intermediate and finished petroleum products. We have property damage and business interruption coverage at the Nixon Facility, as well as business interruption coverage for 24 months from the date of the loss, subject to a deductible with a 45 day waiting period. Our property damage insurance has deductibles ranging from $5,000 to $500,000. In addition, we have a full suite of insurance policies covering workers compensation, general liability, directors’ and officers’ liability, environmental liability, and other business risks. These are supported by safety and other risk management programs. See also, “Part I, Item 1A. Risk Factors – Risks Related to Our Business” in this Annual Report.
Governmental Regulation
Our operations and properties are subject to extensive and complex federal, state, and local environmental, health, and safety statutes, regulations, and ordinances. These rules govern, among other things, the generation, storage, handling, use and transportation of petroleum, solid wastes, hazardous wastes, and hazardous substances; the emission and discharge of materials into the environment and environmental protection; waste management; characteristics and composition of diesel and other fuels; and the monitoring, reporting and control of greenhouse gas emissions. These laws impose certain obligations on our operations, including requiring the acquisition of permits and authorizations to conduct regulated activities, restricting the manner in which regulated activities are conducted, limiting the quantities and types of materials that may be released into the environment, and requiring the monitoring of releases of materials into the environment.
Failure to comply with environmental, health or safety laws and our permits or other authorizations issued under such laws could result in fines, civil or criminal penalties or other sanctions, injunctive relief compelling the installation of additional controls, or a revocation of our permits and the shutdown of our facilities.
We cannot predict the extent to which additional environmental, health, and safety laws will be enacted in the future, or how existing or future laws will be interpreted with respect to our operations. Many environmental, health, and safety laws and regulations are becoming increasingly stringent. The cost of compliance with and governmental enforcement of environmental, health, and safety laws may increase in the future. We may be required to make significant capital expenditures or incur increased operating costs to achieve compliance with applicable environmental, health, and safety laws. This Governmental Regulation section should be read in conjunction with “Part I, Item 1A. Risk Factors” of this Annual Report, which discuss our expectations regarding future events, results or outcomes based on currently available information.
Air Emissions
Toxic Air Pollutants. The federal Clean Air Act (the “CAA”) is a comprehensive law that regulates toxic air pollutants from stationary and mobile sources. Among other things, the law authorizes the Environmental Protection Agency (the “EPA”) to establish National Ambient Air Quality Standards to protect public health and public welfare and to regulate emissions of hazardous air pollutants. The CAA, as well as corresponding state laws and regulations regarding emissions of pollutants into the air, affect our crude oil and condensate processing operations and impact certain emissions sources located offshore. Under the CAA, facilities that emit volatile organic compounds (“VOCs”) or nitrogen oxides face increasingly stringent regulations.
Refineries, which are major stationary sources of Hazardous Air Pollutants (“HAPs”), have historically been high-visibility targets for enforcement by the EPA under the CAA. In August 1995, the EPA implemented the National Standards for Hazardous Air Pollutants for petroleum refineries. These standards require petroleum refineries to meet emission standards reflecting the application of the maximum achievable control technology. The affected sources at petroleum refineries are defined to include all process vents, storage vessels, marine tank vessel loading operations, gasoline rack operations, equipment leaks, and wastewater treatment systems located at the refinery. In order to meet emission standards, we are required to obtain permits, as well as test, monitor, report, and implement control requirements.
11
|
BLUE DOLPHIN ENERGY COMPANY
|
2015 FORM 10-K
|
In February 2007, the EPA finalized a rule to reduce HAPs from mobile sources. Mobile Source Air Toxics (“MSAT”) regulations established stringent new controls on gasoline, passenger vehicles, and gas cans to further reduce emissions of mobile source air toxics. The EPA has continued to adopt MSAT emission control programs to further reduce HAPs from mobile sources, including sulfur control requirements in gasoline and diesel transportation fuels. New sulfur control standards required most refineries to produce transportation fuels for highway use at or below 15 ppm sulfur for “on-road” diesel and 30 ppm sulfur for gasoline. “Off-road” diesel requirements were also reduced to 15 ppm sulfur in June 2014. We no longer produce transportation-related diesel fuel products. In May 2014, we ceased production of NRLM, a transportation-related diesel fuel product. In June 2014, we began producing HOBM, a non-transportation lubricant blend product. The shift in product slate from NRLM to HOBM was the result of the EPA’s new sulfur control requirements. “Topping units,” like the Nixon Facility, typically lack a desulfurization process unit to lower sulfur content levels within the range required by the EPA’s new sulfur control standards, and integration of such a desulfurization unit generally requires additional permitting and significant capital upgrades. We can still produce and sell diesel with sulfur content levels above the EPA’s new sulfur control standards in the U.S. as a feedstock to other refineries and blenders and to other countries as a finished petroleum product.
In August 2015, the EPA proposed a suite of requirements in an effort to further reduce air pollution, provide greater certainty about CAA permitting requirements, and combat climate change. These proposals include: (i) building on the 2012 New Source Performance Standards for VOC emissions to reduce methane and add emission reduction requirements, (ii) drafting control technique guidelines to reduce VOC emissions from existing equipment and processes, and (iii) clarifying permitting requirements. Final rules on these new proposals are not expected until sometime in 2016.
Greenhouse Gas Emissions. In 2007, the U.S. Supreme Court held in Massachusetts vs. EPA that emission of Greenhouse Gases (“GHGs”) may be regulated as an air pollutant under the CAA. In December 2009, the EPA published its findings that GHGs, including carbon dioxide and methane, are contributing to the warming of the Earth’s atmosphere and other climatic conditions, presenting a potential danger to public health and the environment. By allowing the regulation of GHGs under the CAA, the EPA’s findings also indirectly impacted many other carbon-intensive industries, which would potentially become subject to federal New Source Review Prevention of Significant Deterioration (“PSD”) and Title V permitting requirements under the CAA (the “CAA Permitting Requirements”).
In March 2010, an EPA final decision allowed the EPA to continue applying its existing interpretation of capturing pollutants under CAA Permitting Requirements. In May 2010, the EPA set GHG emissions thresholds to define when permits under the CAA Permitting Requirements are required for new and existing industrial facilities (the “2010 Tailoring Rule”). Emissions from small farms, restaurants, and all but the very largest commercial facilities are not covered by the 2010 Tailoring Rule. The 2010 Tailoring Rule established a schedule that: (i) initially focused on the largest stationary sources with the most CAA permitting experience, (ii) then expanded to cover the largest stationary sources of GHG that may not have been previously covered by the CAA for other pollutants, and (iii) finally described the EPA’s plan for any additional steps in this process. Without this tailoring rule, the lower emissions thresholds would have taken effect automatically for GHGs in January 2011, leading to dramatic increases in the number of required permits. The EPA phased in the 2010 Tailoring Rule in two initial steps:
|
-
|
Step 1 (January 2, 2011 – June 30, 2011). Only stationary sources then subject to the PSD permitting program (i.e., those that are newly-constructed or modified in a way that significantly increases emissions of a pollutant other than GHGs) were subject to permitting requirements for their GHG emissions under PSD. Similarly for the Title V permitting program, only stationary sources then subject to the program (i.e., newly constructed or existing major stationary sources for a pollutant other than GHGs) were subject to Title V permitting requirements for GHG. During this time, no stationary sources were subject to CAA permitting requirements due solely to GHG emissions.
|
12
|
BLUE DOLPHIN ENERGY COMPANY
|
2015 FORM 10-K
|
|
-
|
Step 2 (July 1, 2011 to June 30, 2013). Step 2 built on Step 1. In this phase, PSD permitting requirements covered for the first time new construction projects that emit GHG emissions of at least 100,000 tons per year even if they did not exceed the permitting thresholds for any other pollutant. Modifications at existing facilities that increased GHG emissions by at least 75,000 tons per year were subject to permitting requirements, even if they did not significantly increase emissions of any other pollutant. In Step 2, operating permit requirements did, for the first time, apply to stationary sources based on their GHG emissions even if they did not apply based on emissions of any other pollutant. Facilities that emitted at least 100,000 tons per year carbon dioxide equivalent were subject to Title V permitting requirements.
|
Under the 2010 Tailoring Rule, the EPA committed to undertake another rulemaking to add a Step 3 for phasing in GHG permitting and potentially discuss whether certain smaller stationary sources could be permanently excluded from permitting.
In December 2010, the EPA issued a series of rules that put the necessary regulatory framework in place to ensure that: (i) industrial facilities could get CAA permits covering their GHG emissions when needed, and (ii) facilities emitting GHGs at levels below those to be established in a final rule tailoring the requirements would not need to obtain CAA permits. In July 2012, the EPA issued a final 2010 Tailoring Rule Step 3, which retained existing GHG permitting thresholds that were established in Steps 1 and 2 of the 2010 Tailoring Rule. Further, since the EPA and state permitting authorities did not have the opportunity to develop and implement streamlining approaches, it was determined that it was not appropriate to apply CAA Permitting Requirements to additional, smaller stationary sources of GHG emissions.
In August 2015, the EPA issued a good cause final rule to remove portions of its CAA Permitting that were initially promulgated under Step 2 of the 2010 Tailoring Rule, of which the Court of Appeals for the District of Columbia Circuit specifically identified as vacated in the Coalition for Responsible Regulation vs. EPA Amended Judgment that followed the U.S. Supreme Court decision in Utility Air Regulatory Group vs. EPA.
Although we are not currently subject to reporting requirements under GHG-related regulations, the future adoption of any regulations that require reporting of GHGs or otherwise limit emissions of GHGs from the Nixon Facility could require us to incur significant costs and expenses or changes in operations, which could adversely affect our operations and financial condition.
Renewable Fuels
Pursuant to the Energy Policy Act of 2005 and the Energy Independence and Security Act of 2007, the EPA issued Renewable Fuels Standards (“RFS”) that require the blending of biofuels into transportation fuel. Since the compliance mechanism for RFS - Renewable Identification Numbers (“RINs”) – would have created a burden on the Nixon Facility related to its NRLM production through May 2014, we applied for an extension of the temporary exemption afforded small refineries through December 31, 2010 under the CAA Section 211(o)(9)(B). In September 2014, the EPA granted the Nixon Facility a small refinery exemption from RFS requirements for 2013 and 2014. We no longer produce transportation-related diesel fuel products. In May 2014, we ceased production of NRLM, a transportation-related diesel fuel product. In June 2014, we began producing HOBM, a non-transportation lubricant blend product.
Hazardous Waste
The Comprehensive Environmental Response, Compensation, and Liability Act (“CERCLA”) provides a federal "superfund" to clean up uncontrolled or abandoned hazardous waste sites, as well as accidents, spills, and other emergency releases of pollutants and contaminants into the environment. The law authorizes two kinds of response actions: (i) short-term removals, where actions may be taken to address releases or threatened releases requiring prompt response, and (ii) long-term remedial response actions, that permanently and significantly reduce the dangers associated with releases or threats of releases of hazardous substances that are serious, but not immediately life threatening. These actions can be conducted only at sites listed on the EPA's National Priorities List.
13
|
BLUE DOLPHIN ENERGY COMPANY
|
2015 FORM 10-K
|
In October 2014, the EPA finalized an amendment to the “All Appropriate Inquiries” (“AAI”) rule. As a result of the amendment, ASTM E-1527-05: Standard Practice for Environmental Site Assessments is no longer adequate to establish landowner and lender liability protections under CERCLA. This means that ASTM E-1527-05 no longer establishes a CERCLA defense. Site buyers, sellers, and lenders will now need to ensure that an AAI is conducted under the newer 2013 ASTM standard. As of the filing of this Annual Report, neither we nor any of our predecessors have been designated as a potentially responsible party under CERCLA or a similar state statute.
The Resource Conservation and Recovery Act (“RCRA”) and comparable state and local laws impose requirements related to the handling, storage, treatment and disposal of solid and hazardous wastes. Our refining operations generate petroleum product wastes, solid wastes, and ordinary industrial wastes, such as from paint and solvents, that are regulated under RCRA and state law. Certain wastes generated by the Nixon Facility are currently exempt from regulation as hazardous wastes, but are subject to non-hazardous waste regulations. In the future these wastes could be designated as hazardous wastes under RCRA or other applicable statutes and therefore may become subject to more rigorous and costly requirements.
In January 2015, the EPA published a final Definition of Solid Waste (“DSW”) rule that distinguished between a waste and a recyclable material under the RCRA. This definition is used to determine the threshold question of whether a given material is regulated as a solid or hazardous waste under RCRA or is instead a recyclable material exempt from regulation. The new DSW rule took effect six months after publication in the Federal Register.
The Nixon Facility has been used for refining activities for many years. Although prior owners and operators may have used operating and waste disposal practices that were standard in the industry at the time, petroleum hydrocarbons and various wastes may have been released on or under the Nixon Facility site. A 2008 third-party environmental study determined that petroleum hydrocarbon and VOC concentrations were below Tier 1 protective concentration levels (“PCLs”). However, RCRA-8 metals were found to be above Tier 1 PCLs. An additional third-party study determined that metal concentrations from the soil would not leach beyond groundwater concentrations exceeding their respective PCLs. As a result, groundwater resources would not be threatened and no further reporting was required.
Water Discharges
Stormwater from the Nixon Facility is tested and discharged pursuant to applicable stormwater permits. Process wastewater from the Nixon Facility is tested and discharged to a nearby municipal treatment facility pursuant to applicable process wastewater permits. Wastewater from our offshore facilities, including our oil and natural gas pipelines and anchor platform, are tested and discharged pursuant to applicable produced water permits.
Spill Prevention and Control
The federal Water Pollution Control Act of 1972, as amended, also known as the Clean Water Act (the “CWA”), and analogous state laws impose restrictions and stringent controls on the discharge of pollutants, including oil, into federal and state waters. These laws affect our crude oil and condensate processing operations and petroleum storage and terminaling operations, as well as our pipeline, facilities, and exploration and production assets. The CWA prohibits the discharge of pollutants into U.S. waters except as authorized by the terms of a permit issued by the EPA or a state agency with delegated authority. Spill prevention, control, and countermeasure requirements mandate the use of structures, such as berms and other secondary containment, to prevent hydrocarbons or other pollutants from reaching a jurisdictional body of water in the event of a spill or leak. Federal and state regulatory agencies can impose administrative, civil, and criminal penalties for non-compliance with discharge permits or other requirements of the CWA or analogous state laws and regulations.
The EPA covers inland oil spills. In June 2015, the EPA published a final rule expanding the definition of “Waters of the United States” under the CWA. The final rule does not expand federal jurisdiction. However, the final rule identifies waters that are specifically excluded from jurisdiction, including, among others, depressions incidental to mining or construction that may become filled with water, puddles, groundwater, and stormwater control features constructed to convey, treat, or store stormwater on dry land. See “Offshore Safety and Environmental Oversight” within this governmental regulation section for information on oil spills that occur in coastal waters.
14
|
BLUE DOLPHIN ENERGY COMPANY
|
2015 FORM 10-K
|
Offshore Safety and Environmental Oversight
In addition to the CAA, our pipeline, exploration and production assets are also subject to the requirements of the Outer Continental Shelf Lands Act (the “OCSLA”). The OCSLA is administered by the Bureau of Ocean Energy Management (the “BOEM”) and the Bureau of Safety and Environmental Enforcement (the “BSEE”). The BOEM manages the nation's offshore resources in an environmentally and economically responsible way, including leasing, plan administration, environmental studies, National Environmental Policy Act analysis, resource evaluation, economic analysis, and the Renewable Energy Program. The BSEE enforces safety and environmental regulations, including permitting and research, inspections, offshore regulatory programs, oil spill response, and training and environmental compliance functions. With regard to oil spill response, the BSEE has partnered with the U.S. Coast Guard (“USCG”). In the event of an oil spill, the BSEE is responsible for monitoring and directing all efforts related to securing the source of the spill and re-establishing control over the facility. The USCG is responsible for monitoring and directing all efforts to mitigate a spill’s impact on the water, shoreline, or economic centers that could be impacted, as well as recovering any oil that has spilled. In response to the Deepwater Horizon explosion in 2010, the West Delta 32 explosion in 2012, and the resultant oil spills in the Gulf of Mexico, the BOEM and the BSEE have been more aggressive in proposing and implementing a number of reforms to offshore oil and gas regulations.
Spill Liability. The Oil Pollution Act of 1990 (the “OPA”) and the CWA, in connection with the OCSLA, impose liability on owners or operators of vessels and facilities that discharge harmful quantities of oil into the navigable waters of the U.S., adjoining shorelines, waters of the contiguous zone, or when the discharge may affect natural resources of the U.S. With limited exceptions, responsible parties are: (i) jointly and strictly liable for all removal costs incurred by a governmental authority and (ii) strictly liable for removal costs incurred by and damages to third parties affected by oil spills. Damages recovered from responsible parties include: injury or economic losses resulting from destruction of real or personal property, damages or loss of use of natural resources used for subsistence, lost tax revenue, royalties, rents, or net profit shares suffered by federal, state, or local governments due to injury to real or personal property, lost profits or impaired earning power because of injury to real or personal property or natural resources, and the net costs of providing increased or additional public services during or after removal activities.
In January 2015, the BOEM increased the offshore limit of liability for damages under the OPA from $75 million to $133.65 million, plus all clean-up costs, to reflect the significant increase in the Consumer Price Index. The onshore facilities limit of liability for damages under the OPA is $350 million plus all clean-up costs. A party cannot take advantage of the liability limits if the spill is caused by gross negligence or willful misconduct or resulted from a violation of federal safety, construction or operating regulations. If a party fails to report a spill or cooperate in the clean-up, liability limits do not apply.
The OPA requires responsible parties to provide proof of financial responsibility for potential spills The evidence of financial responsibility amount required is $35 million for certain types of offshore facilities located seaward of the seaward boundary of a state, including properties used for oil transportation. The BOEM’s January 2015 regulatory change did not affect the ongoing required coverage amount. We currently maintain the statutory $35 million coverage.
Spill Response. Pursuant to the OPA, the National Oil and Hazardous Substances Pollution Contingency Plan, more commonly called the National Contingency Plan, provides a blueprint for responding to both oil spills and hazardous substance releases. The National Contingency Plan requires, among other things, that responsible parties have an oil spill response plan in place. We currently have the required oil spill response plan in place.
Decommissioning Requirements. In order to cover the various obligations of lessees and rights-of-way holders operating in federal waters of the Gulf of Mexico, the BOEM generally requires that lessees and rights-of-way holders demonstrate financial strength and reliability according to regulations or post bonds or other acceptable assurances that such obligations will be satisfied, unless the BOEM exempts the lessee or rights-of-way holder from such financial assurance requirements. Such obligations include the cost of plugging and abandoning wells and decommissioning and removing platforms and pipelines at the end of production or service activities. Once plugging and abandonment work has been completed, the collateral backing the financial assurance is released by the BOEM.
In August 2014, the BOEM issued an Advanced Notice of Proposed Rulemaking outlining proposed changes to financial assurance requirements in order to modernize financial assurance and risk management and better address potential costs and liabilities of offshore energy development. Part of the Advanced Notice of Proposed Rulemaking includes the BOEM revising its supplemental bonding procedures by shifting from the current “waiver” model for self-insurance to a credit based model. Following a public comment period, the BOEM plans to publish a revised notice to lessees in 2016 that will outline new financial assurance requirements.
15
|
BLUE DOLPHIN ENERGY COMPANY
|
2015 FORM 10-K
|
In August 2015, we received a letter from the BOEM requiring additional supplemental bonds or acceptable financial assurance of approximately $4.2 million for existing pipeline rights-of-way. We are currently working with the BOEM to develop a tailored plan to address the financial assurance requirements. There can be no assurance that the BOEM will accept a reduced amount of supplemental financial assurance or not require additional supplemental pipeline bonds related to our existing pipeline rights-of-way.
At December 31, 2015, we maintained approximately $0.9 million in credit and cash-backed rights-of-way bonds issued to the BOEM. At December 31, 2014, we maintained approximately $1.6 million in credit and cash-backed rights-of-way bonds issued to the BOEM. In December 2014, we completed work to abandon-in-place the pipeline associated with Right-of-Way Number OCS-G 08606. As a result, in November 2015, the BOEM released approximately $0.7 million in cash collateral backing this supplemental pipeline bond.
Offshore Safety. In October 2010, the BSEE issued The Workplace Safety Rule, which requires operators to employ a comprehensive safety and environmental management system (“SEMS”). Revisions to SEMS (“SEMS II”), which added several requirements to the original SEMS, became effective in June 2013. The purpose of SEMS II is to reduce human and organizational errors as root causes of work-related accidents and offshore spills, develop protocols as to who at the facility has the ultimate operational safety and decision-making authority, and establish procedures to provide all personnel with “stop work” authority. SEMS II must be periodically audited by an independent third party auditor approved by the BSEE. We currently have a SEMS II plan in place.
Health, Safety and Maintenance
We are subject to a number of federal and state laws and regulations related to the health and safety of workers pursuant to the Occupational Safety and Health Act of 1970. These laws and regulations are administered by the Occupational Safety and Health Administration (the “OSHA”) and, in states not participating in OSHA-approved state safety plans, comparable state regulatory bodies.
Our refinery operations are also subject to OSHA process safety management regulations. In 2007, the OSHA launched the National Emphasis Program for Petroleum Refineries (the “RNEP”), which requires inspections of all refineries for compliance with process safety management regulations. Under RNEP, the Nixon Facility is subject to inspections that may last from two to six months, including one to three months onsite. Inspectors primarily focus on process safety management implementation and recordkeeping. The Nixon Facility was inspected by OSHA in 2013. As a result of the inspection, we entered into an OSHA settlement agreement in 2014, complying with abatement certification provisions primarily related to documentation and notice posting requirements and paying a penalty totaling $38,500.
We operate a comprehensive safety, health and security program, with participation by personnel at all levels of the organization. We have developed comprehensive safety programs aimed at preventing OSHA recordable incidents. Despite our efforts to achieve excellence in our safety and health performance, there can be no assurances that there will not be accidents resulting in injuries or even fatalities. We routinely monitor our programs and consider improvements in our management systems.
Intellectual Property
We rely on intellectual property laws to protect our brand, as well as those of our subsidiaries. “Blue Dolphin Energy Company” is a registered trademark in the U.S. in name and logo form. “Petroport, Inc.” is a registered trademark in the U.S. in name form. In addition, “www.blue-dolphin-energy.com” is a registered domain name.
16
|
BLUE DOLPHIN ENERGY COMPANY
|
2015 FORM 10-K
|
Personnel
We rely on the services of LEH pursuant to an Operating Agreement to manage our property and the property of our subsidiaries, including the Nixon Facility, in the ordinary course of business. LEH provides us with the following services under the Operating Agreement, among others:
|
·
|
Personnel serving in capacities equivalent to the capacities of corporate executive officers, including Chief Executive Officer and Chief Financial Officer, as well as general manager and environmental, health and safety personnel; and
|
|
·
|
Personnel providing administrative and professional services, including accounting, human resources, insurance, and regulatory compliance.
|
See “Part II, Item 8. Financial Statements and Supplementary Data - Note (9), Accounts Payable, Related Party” of this Annual Report for additional disclosures related to LEH.
Available Information
The Securities and Exchange Commission (the “SEC”) maintains and makes available public records, which includes reports filed by regulated companies and individuals, through conventional and electronic reading rooms. The SEC’s conventional reading room is located at 100 F Street, Northeast, Washington, D.C. 20549 and can be reached at (202) 551-8300. The SEC’s electronic reading room, which maintains records created by the SEC on or after November 1, 1996, is available online at http://www.sec.gov/foia/efoiapg.htm. Reports filed with the SEC by regulated entities and individuals are available at http://www.sec.gov/edgar/searchedgar/webusers.htm. We also make our public filings available on our website (http://www.blue-dolphin-energy.com) as soon as reasonably practicable after such material is filed, or furnished, to the SEC. A copy of our filings will also be furnished free of charge upon request.
ITEM 1A. RISK FACTORS
An investment in our Common Stock involves risks. In addition to the other information in this Annual Report and our other filings with the SEC, you should carefully consider the following risk factors in evaluating us and our business. The risks described below are not the only risks we face. Additional risks and uncertainties not specified herein, not currently known to us, or currently deemed to be immaterial may also materially adversely affect our business, financial condition, operating results and/or cash flows.
Any one of these factors or a combination of these factors could materially affect our future results of operations and could influence whether any forward-looking statements ultimately prove to be accurate. Our forward-looking statements are not guarantees of future performance, and actual results and future performance may differ materially from those suggested in any forward-looking statements. We do not intend to update these statements unless we are required to do so.
Risks Related to Our Business and Industry
The dangers inherent in oil and gas operations could expose us to potentially significant losses, costs or liabilities and reduce our liquidity.
Oil and gas operations are inherently subject to significant hazards and risks. These hazards and risks include, but are not limited to, fires, explosions, ruptures, blowouts, spills, third-party interference and equipment failure, any of which could result in interruption or termination of operations, pollution, personal injury and death, or damage to our assets and the property of others. These risks could harm our reputation and business, result in claims against us, and have a material adverse effect on our results of operations and financial condition.
The geographic concentration of our assets creates a significant exposure to the risks of the regional economy and other regional adverse conditions.
Our primary operating asset, the Nixon Facility, is located in Nixon, Texas in the Eagle Ford Shale and we market our refined petroleum products in a single, relatively limited geographic area. In addition, our onshore facilities assets are located in Freeport, Texas, and all of our pipelines, offshore facilities and oil and gas properties are located within the Gulf of Mexico. As a result, our operations are more susceptible to regional economic conditions than our more geographically diversified competitors. Any changes in market conditions, unforeseen circumstances or other events affecting the area in which our assets are located could have a material adverse effect on our business, financial condition, and results of operations. These factors include, among other things, changes in the economy, weather conditions, demographics, and population.
17
|
BLUE DOLPHIN ENERGY COMPANY
|
2015 FORM 10-K
|
Competition from companies having greater financial and other resources could materially and adversely affect our business and results of operations.
The refining industry is highly competitive. Our refining operations compete with domestic refiners and marketers in PADD 3 (Gulf Coast), domestic refiners in other PADD regions, and foreign refiners that import products into the U.S. Certain of our competitors have larger, more complex refineries and may be able to realize higher margins per barrel of production. Several of our principal competitors are integrated national or international oil companies that are larger and have substantially greater resources than we do and have access to proprietary sources of controlled crude oil production. Unlike these competitors, we obtain all of our feedstocks from a single supplier. Because of their integrated operations and larger capitalization, larger, more complex refineries may be more flexible in responding to volatile industry or market conditions, such as crude oil and other feedstocks supply shortages or commodity price fluctuations. If we are unable to compete effectively, we may lose existing customers or fail to acquire new customers.
Environmental laws and regulations could require us to make substantial capital expenditures to remain in compliance or to remediate current or future contamination that could give rise to material liabilities.
Our operations are subject to a variety of federal, state and local environmental laws and regulations relating to the protection of the environment, including those governing the emission or discharge of pollutants into the environment, product specifications and the generation, treatment, storage, transportation, disposal and remediation of solid and hazardous wastes. Violations of these laws and regulations or permit conditions can result in substantial penalties, injunctive orders compelling installation of additional controls, civil and criminal sanctions, permit revocations and/or facility shutdowns.
In addition, new environmental laws and regulations, new interpretations of existing laws and regulations, increased governmental enforcement of laws and regulations or other developments could require us to make additional unforeseen expenditures. Many of these laws and regulations are becoming increasingly stringent, and the cost of compliance with these requirements can be expected to increase over time. The requirements to be met, as well as the technology and length of time available to meet those requirements, continue to develop and change. These expenditures or costs for environmental compliance could have a material adverse effect on our results of operations, financial condition and profitability.
The Nixon Facility operates under a number of federal and state permits, licenses and approvals with terms and conditions containing a significant number of prescriptive limits and performance standards in order to operate. All of these permits, licenses, approvals, limits and standards require a significant amount of monitoring, record keeping and reporting in order to demonstrate compliance with the underlying permit, license, approval, limit or standard. Non-compliance or incomplete documentation of our compliance status may result in the imposition of fines, penalties and injunctive relief. Additionally, due to the nature of our refining processes, there may be times when we are unable to meet the standards and terms and conditions of our permits, licenses and approvals due to operational upsets or malfunctions, which may lead to the imposition of fines and penalties or operating restrictions that may have a material adverse effect on our ability to operate our facilities, and accordingly our financial performance.
We are subject to strict laws and regulations regarding personnel and process safety, and failure to comply with these laws and regulations could have a material adverse effect on our results of operations, financial condition and profitability.
We are subject to the requirements of OSHA and comparable state statutes that regulate the protection of the health and safety of workers, and the proper design, operation and maintenance of our equipment. In addition, OSHA and certain environmental regulations require that we maintain information about hazardous materials used or produced in our operations and that we provide this information to personnel and state and local governmental authorities. Failure to comply with these requirements, including general industry standards, record keeping requirements and monitoring and control of occupational exposure to regulated substances, may result in significant fines or compliance costs, which could have a material adverse effect on our results of operations, financial condition and cash flows.
18
|
BLUE DOLPHIN ENERGY COMPANY
|
2015 FORM 10-K
|
Our insurance policies may be inadequate or expensive.
Our insurance coverage does not cover all potential losses, costs or liabilities. We could suffer losses for uninsurable or uninsured risks or in amounts in excess of our existing insurance coverage. Our ability to obtain and maintain adequate insurance may be affected by conditions in the insurance market over which we have no control. In addition, if we experience insurable events, we may experience an increase in annual premiums, a limit on coverage, or loss of coverage. Inadequate insurance or loss of coverage could have a material adverse effect on our business, financial condition, and results of operations.
LEH holds a significant interest in us, and our related party transactions with LEH and its affiliates may cause conflicts of interest that may adversely affect us.
Jonathan P. Carroll, our Chief Executive Officer, President, Assistant Treasurer and Secretary, is also a majority owner of LEH. LEH owns approximately 81% of our Common Stock, and, pursuant to the Operating Agreement, manages and operates all of our properties. LEH and Mr. Carroll have significant influence over matters such as the election of our Board of Directors (the “Board”), control over our business, policies and affairs and other matters submitted to our stockholders. LEH and Mr. Carroll are entitled to vote the Common Stock owned by LEH in accordance with its interests, which may be contrary to the interests of other stockholders. LEH has interests that may differ from the interests of other stockholders and, as a result, there is a risk that important business decisions will not be made in the best interest of some of our stockholders.
LEH and its affiliates are not limited in their ability to compete with us and are not obligated to offer us business opportunities. We believe that the transactions and agreements that we have entered into with LEH and its affiliates are on terms that are at least as favorable as could reasonably have been obtained at such time from third-parties. However, these relationships could create, or appear to create, potential conflicts of interest when our Board is faced with decisions that could have different implications for us and LEH or its affiliates. The appearance of conflicts, even if such conflicts do not materialize, might adversely affect the public’s perception of us, as well as our relationship with other companies and our ability to enter into new relationships in the future, which may have a material adverse effect on our ability to do business.
We may have capital needs for which our internally generated cash flows and other sources of liquidity may not be adequate.
If we are unable to generate sufficient cash flows or otherwise secure sufficient liquidity to support our short-term and long-term capital requirements, we may not be able to meet our payment obligations or pursue our business strategies, any of which could have a material adverse effect on our results of operations or liquidity. Our short-term working capital needs are primarily related to repayment of debt obligations and capital expenditures for maintenance, upgrades, and refurbishment of equipment at the Nixon Facility. Our long-term working capital needs are primarily related to repayment of long-term debt obligations. In addition, we continue to utilize capital to reduce operational, safety and environmental risks. We may incur substantial compliance costs in connection with any new environmental, health and safety regulations. Our liquidity will affect our ability to satisfy any of these needs.
Our ability to use net operating loss (“NOL”) carryforwards to offset future taxable income for U.S. federal income tax purposes is subject to limitation.
Under Section 382 of the Internal Revenue Code of 1986, as amended (“IRC Section 382”), a corporation that undergoes an “ownership change” is subject to limitations on its ability to utilize its pre-change NOL carryforwards to offset future taxable income. Within the meaning of IRC Section 382, an “ownership change” occurs when the aggregate stock ownership of certain stockholders (generally 5% shareholders, applying certain look-through rules) increases by more than 50 percentage points over such stockholders' lowest percentage ownership during the testing period (generally three years).
As of December 31, 2015, we reported a net deferred tax asset of approximately $3.6 million. Blue Dolphin experienced ownership changes in 2005 in connection with a series of private placements, and in 2012 as a result of a reverse acquisition. The 2012 ownership change limits our ability to utilize NOLs following the 2005 ownership change that were not previously subject to limitation. Limitations imposed on our ability to use NOLs to offset future taxable income could cause U.S. federal income taxes to be paid earlier than otherwise would be paid if such limitations were not in effect, and could cause such NOLs to expire unused, in each case reducing or eliminating the benefit of such NOLs. Similar rules and limitations may apply for state income tax purposes. NOLs generated after the 2012 ownership change are not subject to limitation.
19
|
BLUE DOLPHIN ENERGY COMPANY
|
2015 FORM 10-K
|
Terrorist attacks, cyber-attacks, threats of war, or actual war may negatively affect our operations, financial condition, results of operations, and cash flows.
Energy-related assets in the U.S. may be at a greater risk for future terrorist attacks than other potential targets. A direct attack on our assets or assets used by us could have a material adverse effect on our operations, financial condition, results of operations, and cash flows. In addition, any terrorist attack in the U.S. could have an adverse impact on energy prices, including prices for crude oil and refined petroleum products, and refining margins. Disruption or significant increases in energy prices could result in government imposed price controls. While we currently maintain some insurance that provides coverage against terrorist attacks, such insurance has become increasingly expensive and difficult to obtain. As a result, insurance providers may not continue to offer this coverage to us on terms that we consider affordable, or at all.
Our operations are dependent on our technology infrastructure, which includes a data network, telecommunications system, internet access, and various computer hardware equipment and software applications. Our technology infrastructure is subject to damage or interruption from a number of potential sources, including natural disasters, software viruses or other malware, power failures, cyber-attacks, and/or other events. To the extent that our technology infrastructure is under our control, we have implemented measures such as virus protection software and emergency recovery processes to address identified risks. However, there can be no assurance that a security breach or cyber-attack will not compromise confidential, business critical information, cause a disruption in our operations, or harm our reputation, any of which could have a material adverse effect on our business, financial condition, results of operations and cash flows.
Risks Related to Our Refining Operations
Refining margins are volatile, and a reduction in refining margins will adversely affect the amount of cash we will have available for working capital.
Historically, refining margins have been volatile, and they are likely to continue to be volatile in the future. Our financial results are primarily affected by the relationship, or margin, between our refined petroleum product sales prices and our crude oil and condensate costs. Our crude oil and condensate acquisition costs and the prices at which we can ultimately sell our refined petroleum products depend upon numerous factors beyond our control.
The prices at which we sell refined petroleum products are strongly influenced by the commodity price of crude oil. If crude oil prices increase, our “refinery operations” business segment margins will fall unless we are able to pass along these price increases to our wholesale customers. Increases in the selling prices for refined petroleum products typically lag behind the rising cost of crude oil and may be difficult to implement when crude oil costs increase dramatically over a short period of time.
The price volatility of crude oil, other feedstocks, refined petroleum products, and fuel and utility services may have a material adverse effect on our earnings, cash flows and liquidity.
Our refining earnings, cash flows and liquidity from operations depend primarily on the margin above operating expenses (including the cost of refinery feedstocks, such as crude oil and condensate that are processed and blended into refined petroleum products) at which we are able to sell refined petroleum products. Crude oil refining is primarily a margin-based business. In order to improve margins, it is important for a crude oil refinery to maximize the yields of high value finished petroleum produces and to minimize the costs of feedstocks and operating expenses. When the margin between refined petroleum product prices and crude oil and other feedstock costs decreases, our margins are negatively affected. Crude oil refining margins have historically been volatile, and are likely to continue to be volatile, as a result of a variety of factors, including fluctuations in the prices of crude oil, other feedstocks, refined petroleum products, and fuel and utility services. While an increase or decrease in the price of crude oil may result in a similar increase or decrease in prices for refined petroleum products, there may be a time lag in the realization of the similar increase or decrease in prices for refined petroleum products. The effect of changes in crude oil and condensate prices on our refining margins therefore depends, in part, on how quickly and how fully refined petroleum product prices adjust to reflect these changes.
20
|
BLUE DOLPHIN ENERGY COMPANY
|
2015 FORM 10-K
|
Prices of crude oil, other feedstocks and refined petroleum products depend on numerous factors beyond our control, including the supply of and demand for crude oil, other feedstocks, and refined petroleum products. Such supply and demand are affected by, among other things:
|
●
|
changes in foreign, domestic, and local economic conditions;
|
|
●
|
foreign and domestic demand for fuel products;
|
|
●
|
worldwide political conditions, particularly in significant oil producing regions;
|
|
●
|
foreign and domestic production levels of crude oil, other feedstocks, and refined petroleum products and the volume of crude oil, feedstocks, and refined petroleum products imported into the U.S.;
|
|
●
|
availability of and access to transportation infrastructure;
|
|
●
|
capacity utilization rates of refineries in the U.S.;
|
|
●
|
Organization of Petroleum Exporting Countries’ influence on oil prices;
|
|
●
|
development and marketing of alternative and competing fuels;
|
|
●
|
commodities speculation;
|
|
●
|
natural disasters (such as hurricanes and tornadoes), accidents, interruptions in transportation, inclement weather or other events that can cause unscheduled shutdowns or otherwise adversely affect our refineries;
|
|
●
|
federal and state governmental regulations and taxes; and
|
|
●
|
local factors, including market conditions, weather conditions and the level of operations of other refineries and pipelines in our markets.
|
Potential downtime at the Nixon Facility could result in lost margin opportunity, increased maintenance expense, increased inventory, and a reduction in cash available for payment of our obligations.
The safe and reliable operation of the Nixon Facility is key to our financial performance and results of operations, and we are particularly vulnerable to disruptions in our operations because all of our refining operations are conducted at a single facility. Although currently operating at anticipated levels, the Nixon Facility is still in a recommissioning phase and may require unscheduled downtime for unanticipated reasons, including maintenance and repairs, voluntary regulatory compliance measures, or cessation or suspension by regulatory authorities. Occasionally, the Nixon Facility experiences a temporary shutdown due to power outages as a result of high winds and thunderstorms. In the case of such a shutdown, the refinery must initiate a standard start-up process, and such process can last several days although we are typically able to resume normal operations the next day. Any scheduled or unscheduled downtime may result in lost margin opportunity, increased maintenance expense and a build-up of refined petroleum products inventory, which could reduce our ability to meet our payment obligations.
Loss of market share by a key customer or consolidation among our customer base that could harm our operating results.
For the year ended December 31, 2015, 56% of our refined petroleum products sales came from three customers. These customers have a variety of suppliers to choose from and therefore can make substantial demands on us, including demands on product pricing and on contractual terms, which often results in the allocation of risk to us as the supplier. Our ability to maintain strong relationships with our principal customers is essential to our future performance. Our operating results could be harmed if a key customer is lost, reduces their order quantity, requires us to reduce our prices, is acquired by a competitor, or suffers financial hardship.
21
|
BLUE DOLPHIN ENERGY COMPANY
|
2015 FORM 10-K
|
Additionally, our profitability could be adversely affected if there is consolidation among our customer base and our customers command increased leverage in negotiating prices and other terms of sale. We could decide not to sell our refined petroleum products to a particular customer if, as a result of increased leverage, the customer pressures us to reduce our pricing such that our gross margins are diminished, which could result in a decrease in our revenue. Consolidation may also lead to reduced demand for our products, replacement of our products by the combined entity with those of our competitors, and cancellations of orders, each of which could harm our operating results.
The sale of refined petroleum products to the wholesale market is our primary business, and if we fail to maintain and grow the market share of our refined petroleum products, our operating results could suffer.
Our success in the wholesale market depends in large part on our ability to maintain and grow our image and reputation as a reliable operator and to expand into and gain market acceptance of our refined petroleum products. Adverse perceptions of product quality, whether or not justified, or allegations of product quality issues, even if false or unfounded, could tarnish our reputation and cause our wholesale customers to choose refined petroleum products offered by our competitors.
We are dependent on third-parties for the transportation of crude oil and condensate into and refined petroleum products out of our Nixon Facility, and if these third-parties become unavailable to us, our ability to process crude oil and condensate and sell refined petroleum products to wholesale markets could be materially and adversely affected.
We rely on trucks for the receipt of crude oil and condensate into and the sale of refined petroleum products out of our Nixon Facility. Since we do not own or operate any of these trucks, their continuing operation is not within our control. If any of the third-party trucking companies that we use, or the trucking industry in general, become unavailable to transport crude oil, condensate, and/or our refined petroleum products because of acts of God, accidents, government regulation, terrorism or other events, our revenue and net income would be materially and adversely affected.
Our supplier sources a substantial amount, if not all, of our crude oil and condensate from the Eagle Ford Shale and may experience interruptions of supply from that region.
Our supplier sources a substantial amount, if not all, of our crude oil and condensate from the Eagle Ford Shale. As a result, we may be disproportionately exposed to the impact of delays or interruptions of supply from that region caused by transportation capacity constraints, curtailment of production, unavailability of equipment, facilities, personnel or services, significant governmental regulation, natural disasters, adverse weather conditions, plant closures for scheduled maintenance or interruption of transportation of oil or natural gas produced from the wells in that area.
Our refining operations and customers are primarily located within the Eagle Ford Shale and changes in the supply/demand balance in this region could result in lower refining margins.
Our primary operating asset, the Nixon Facility, is located in the Eagle Ford Shale and we market our refined petroleum products in a single, relatively limited geographic area. As a result, we are more susceptible to regional economic conditions than our more geographically diversified competitors. Should the supply/demand balance shift in our region as a result of changes in the local economy, an increase in refining capacity or other reasons, resulting in supply in the PADD 3 (Gulf Coast) region to exceed demand, we would have to deliver refined petroleum products to customers outside of our current operating region and thus incur considerably higher transportation costs, resulting in lower refining margins.
Hedging of our refined petroleum products and crude oil and condensate may limit our gains and expose us to other risks.
We are exposed to commodity price risk related to our refined petroleum products and crude oil and condensate inventories. The spread between the cost of crude oil and condensate and refined petroleum product sales prices is the primary factor affecting our operations, liquidity and financial condition. Our feedstock acquisition costs and refined petroleum products sales prices depend on numerous factors beyond our control. These factors include the supply of and demand for crude oil, gasoline, and refined petroleum products. Supply and demand for these products depend on various factors, including changes in domestic and foreign economies, weather conditions, domestic and foreign political affairs, production levels, availability of imports and exports, marketing of competitive fuels, and government regulation.
22
|
BLUE DOLPHIN ENERGY COMPANY
|
2015 FORM 10-K
|
Under our inventory risk management policy, Genesis may, but is not required to, use derivative instruments as certain of our refined petroleum product inventories exceed certain thresholds in an effort to reduce our commodity price risk. However, Genesis’ execution of the inventory risk management plan is outside of our control. Accordingly, there could be situations in which Genesis fails to execute on the plan or executes on the plan in a manner that causes significant losses to us, all of which are beyond our control. In the event that our inventory risk management system fails and/or is implemented poorly or not at all, we could experience a material and negative adverse effect on our operations, liquidity and financial condition.
Our operations are highly dependent on our relationships with Genesis, and, if we are unable to successfully maintain these relationships, our operations, liquidity and financial condition may be harmed.
We are party to a variety of contracts and agreements with Genesis and its affiliates that enable the purchase of crude oil and condensate, transportation of crude oil and condensate, and other services. Certain of these agreements with Genesis and its affiliates have successive one-year renewals until August 2019 unless sooner terminated by Genesis or its affiliates with 180 days prior written notice. These agreements and understandings require us to have a close working relationship with Genesis in order for us to be successful in fully executing our business strategy. If we are unable to maintain these relationships or our relationships are not on good terms, it could have a material adverse effect on our operations, liquidity and financial condition.
We have an understanding with Genesis related to inventory risk management, which is intended to reduce the commodity price risk of our refined petroleum product inventories and generate a more consistent gross profit margin for each barrel of refined petroleum products. We also purchase 100% of our crude oil and other feedstocks exclusively from a Genesis affiliate. We have the ability to purchase crude oil and condensate from other suppliers with the prior consent of the Genesis affiliate. To the extent that the volume of crude oil and other feedstocks that are supplied to us are reduced as a result of declining production, competition, or otherwise, our sales, net income and cash available for payments of our debt obligations would decline unless we were able to acquire comparable supplies of crude oil and other feedstocks on comparable terms from other suppliers. Further, a material decrease in either crude oil and condensate production or drilling activity in the fields that supply the Nixon Facility, as a result of depressed commodity prices, natural production declines, governmental moratoriums on drilling or production activities, the availability and the cost of capital or otherwise, could result in a decline in the volume of crude oil and condensate that we refine.
Our business may suffer if any of the executive officers or other key personnel discontinues employment with us. Furthermore, a shortage of skilled labor or disruptions in our labor force may make it difficult for us to maintain productivity.
Our future success depends to a large extent on the services of the executive officers and other key personnel and on our continuing ability to recruit, train and retain highly qualified personnel in all areas of our operations. Furthermore, our operations require skilled and experienced personnel with proficiency in multiple tasks. Competition for skilled personnel with industry-specific experience is intense, and the loss of these executives or personnel could harm our business. If any of these executives or other key personnel resign or become unable to continue in their present roles and are not adequately replaced, our business could be materially adversely affected.
LEH may, but is not required to, fund our working capital requirements in the event our internally generated cash flows and other sources of liquidity are inadequate.
Historically, we relied on LEH to fund working capital requirements when cash reserves and revenue from operations, including sales of refined petroleum products and rental of petroleum storage tanks, were insufficient to fund our working capital requirements. As of December 31, 2015 and 2014, working capital requirements funded by LEH were $0 and $1,174,168, respectively, and are reflected in accounts payable, related party in our consolidated balance sheets. In the event our working capital requirements are inadequate, or we are otherwise unable to secure sufficient liquidity to support our short term and/or long-term capital requirements, we may not be able to meet our payment obligations, comply with certain deadlines related to environmental regulations and standards or pursue our business strategies, any of which may have a material adverse effect on our results of operations or liquidity. Our long-term needs for cash include ongoing capital expenditures for equipment to improve the Nixon Facility and reduce operational, safety and environmental risks. Our liquidity will affect our ability to satisfy any of these needs.
23
|
BLUE DOLPHIN ENERGY COMPANY
|
2015 FORM 10-K
|
Regulation of greenhouse gas emissions could increase our operational costs and reduce demand for our products.
Continued political focus on climate change, human activities contributing to the release of large amounts of carbon dioxide and other greenhouse gases into the atmosphere, and potential mitigation through regulation could have a material impact on our operations and financial results. International agreements and federal, state and local regulatory measures to limit greenhouse gas emissions are currently in various stages of discussion and implementation. These and other greenhouse gas emissions-related laws, policies, and regulations may result in substantial capital, compliance, operating, and maintenance costs. The level of expenditure required to comply with these laws and regulations is uncertain and is expected to vary depending on the laws enacted in each jurisdiction, our activities in the particular jurisdiction, and market conditions. The effect of regulation on our financial performance will depend on a number of factors including, among others, the sectors covered, the greenhouse gas emissions reductions required by law, the extent to which we would be entitled to receive emission allowance allocations, our ability to acquire compliance related equipment, the price and availability of emission allowances and credits, and our ability to recover incurred regulatory compliance costs through the pricing of our products. Material price increases or incentives to conserve or use alternative energy sources could also reduce demand for products we currently sell and adversely affect our sales volumes, revenues and margins.
Risks Related to Our Pipelines and Oil and Gas Properties
Requests by the BOEM to increase bonds or other sureties in order to maintain compliance with the BOEM’s regulations could significantly impact our liquidity and financial condition.
In order to cover the various obligations of lessees on the Outer Continental Shelf, such as the cost to plug and abandon wells and decommission and remove platforms and pipelines at the end of production, the BOEM generally requires that lessees demonstrate financial strength and reliability according to regulations or post bonds or other acceptable assurances that such obligations will be satisfied, unless the BOEM exempts the lessee from such financial assurance requirements. In August 2014, the BOEM issued an Advanced Notice of Proposed Rulemaking in which the agency indicated that it was considering changing the financial assurance requirements, and it currently plans to publish a revised notice to lessees in 2016. Part of the Advanced Notice of Proposed Rulemaking includes the BOEM revising its supplemental bonding procedures by shifting from the current “waiver” model for self-insurance to a credit based model. The cost of these bonds or assurances can be substantial, and there is no assurance that they can be obtained in all cases.
In August 2015, we received notice from the BOEM requesting additional supplemental bonds or acceptable financial assurance of approximately $4.2 million for existing pipeline rights-of-way. We are currently working with the BOEM to develop a tailored plan to address the financial assurance requirements. There can be no assurance that the BOEM will accept a reduced amount of supplemental financial assurance or not require additional supplemental pipeline bonds related to our existing pipeline rights-of-way.
At December 31, 2015, we maintained approximately $0.9 million in credit and cash-backed rights-of-way bonds issued to the BOEM. At December 31, 2014, we maintained approximately $1.6 million in credit and cash-backed rights-of-way bonds issued to the BOEM. In December 2014, we completed work to abandon-in-place the pipeline associated with Right-of-Way Number OCS-G 08606. As a result, in November 2015, the BOEM released approximately $0.7 million in cash collateral backing this supplemental pipeline bond.
More stringent requirements imposed by the BOEM and the BSEE related to the decommissioning, plugging, and abandonment of wells, platforms, and pipelines could materially increase our estimate of future AROs.
In October 2010, the BOEM issued a notice to lessees that establishes a more stringent regimen for the timely decommissioning of what is known as “idle iron” – wells, platforms, and pipelines that are no longer producing or serving exploration or support functions related to an operator’s lease. The notice to lessees sets forth more stringent standards for decommissioning timing by requiring that any well that has not been used during the past five years for exploration or production on active leases and is no longer capable of producing in paying quantities must be permanently plugged or temporarily abandoned within three years. Plugging or abandonment of wells may be delayed by two years if all of the well’s hydrocarbon and sulfur zones are appropriately isolated. Similarly, platforms or other facilities which are no longer useful for operations must be removed within five years of the cessation of operations. The triggering of these plugging, abandonment, and removal activities under what may be viewed as an accelerated schedule in comparison to historical decommissioning efforts could cause an increase, perhaps materially, in our future plugging, abandonment, and removal costs, which may translate into a need to increase our estimate of future AROs. Although management has used its best efforts to determine future AROs, assumptions and estimates can be influenced by many factors beyond management’s control. Such factors, include, but are not limited to, changes in regulatory requirements, changes in costs for abandonment related services and technologies, which could increase or decrease based on supply and demand, and/or extreme weather conditions, such as hurricanes, which may cause structural or other damage to pipeline and related assets and oil and gas properties. As of December 31, 2015, our estimated future asset retirement obligations were approximately $2.0 million. See “Part II, Item 8. Financial Statements and Supplementary Data – Note (11) Asset Retirement Obligations” of this Annual Report for additional information regarding asset retirement obligations.
24
|
BLUE DOLPHIN ENERGY COMPANY
|
2015 FORM 10-K
|
ITEM 1B. UNRESOLVED STAFF COMMENTS
None.
ITEM 2. PROPERTIES
LEH manages and operates all of our properties pursuant to the Operating Agreement. We believe that our properties are generally adequate for our operations and are maintained in a good state of repair in the ordinary course of business. Following is a summary of our principal facilities and assets:
|
Property
|
Operating Subsidiary
|
Description
|
Business Segment
|
Owned / Leased
|
Location
|
|||||
|
Nixon Facility (56 acres)
|
Lazarus Energy, LLC
Lazarus Refining & Marketing, LLC
|
Petroleum Processing
Petroleum Storage and Terminaling
|
Refinery Operations
|
Owned
|
Nixon, Texas
|
|||||
|
Freeport Facility (193 acres)
|
Blue Dolphin Pipe Line Company
|
Pipeline Operations
|
Pipeline Transportation
|
Owned
|
Freeport, Texas
|
|||||
|
Pipelines, Oil and Gas Assets
|
Blue Dolphin Pipe Line Company
Blue Dolphin Petroleum Company
|
Exploration and Production
|
Pipeline Transportation
|
Owned/
Leasehold Interests
|
Gulf of Mexico
|
|||||
|
Corporate Headquarters
|
Blue Dolphin Services Co.
|
Administrative Services
|
Corporate and Other
|
Leased
|
Houston, Texas
|
Nixon Facility. The 15,000 bpd Nixon Facility consists of a distillation unit, naphtha stabilizer unit, depropanizer unit, approximately 398,000 bbls of crude oil, condensate, and refined petroleum product storage capacity, as well as related loading and unloading facilities and utilities. The Nixon Facility is currently undergoing construction of an additional 700,000 bbls of petroleum storage capacity. When construction is complete, total crude oil, condensate, and refined petroleum product storage capacity at the Nixon Facility will exceed 1,000,000 bbls. The Nixon Facility is pledged as collateral under certain of our long-term debt as discussed in Part II, Item 8 “Financial Statements and Supplementary Data – Note (12) Long-Term Debt” of this Annual Report.
Freeport Facility. The Freeport Facility includes pipeline easements and rights-of-way, crude oil and natural gas separation and dehydration facilities, a vapor recovery unit and two onshore pipelines. The two onshore pipelines consist of approximately 4 miles of the 20-inch Blue Dolphin Pipeline and a 16-inch natural gas pipeline that connects the Freeport Facility to the Dow Chemical Plant Complex in Freeport, Texas.
Pipelines and Oil and Gas Assets. In February 2014, we entered into an Asset Sale Agreement (the “Purchase Agreement”) with WBI Energy Midstream, LLC, a Colorado limited liability company (“WBI”), whereby we reacquired WBI’s 1/6th interest in the Blue Dolphin Pipeline System, the Galveston Area Block 350 Pipeline and the Omega Pipeline (the “Pipeline Assets”) effective in October 2013. Prior to the Purchase Agreement, we owned approximately 83% of the Pipeline Assets. Pursuant to the Purchase Agreement, WBI paid us $100,000 in cash, and a surety company $850,000 in cash as collateral for additional supplemental pipeline bonds for our benefit in exchange for the payment and discharge of any and all payables, claims, and obligations related to the Pipeline Assets. See “Part I, Governmental Regulation -- Offshore Safety and Environmental Oversight – Decommissioning Requirements” for a discussion related to supplemental pipeline bonds.
25
|
BLUE DOLPHIN ENERGY COMPANY
|
2015 FORM 10-K
|
The following provides a summary of the Pipeline Assets, all of which are located in the Gulf of Mexico:
|
Natural Gas
|
||||||||||||
|
Capacity
|
||||||||||||
|
Pipeline
|
Ownership
|
Miles
|
(MMcf/d)
|
|||||||||
|
Blue Dolphin Pipeline(1)
|
100 | % | 38 | 180 | ||||||||
|
GA 350 Pipeline
|
100 | % | 13 | 65 | ||||||||
|
Omega Pipeline(2)
|
100 | % | 18 | 110 | ||||||||
|
(1)
|
Currently inactive.
|
|
(2)
|
Currently abandoned in place.
|
|
·
|
Blue Dolphin Pipeline – The Blue Dolphin Pipeline consists of 16-inch and 20-inch offshore pipeline segments, including a trunk line and lateral lines, that run from an offshore anchor platform in Galveston Area Block 288 to our Freeport Facility;
|
|
·
|
GA 350 Pipeline – The GA 350 Pipeline is an 8-inch offshore pipeline extending from Galveston Area Block 350 to a subsea interconnect and tie-in with a transmission pipeline in Galveston Area Block 391; and
|
|
·
|
Omega Pipeline – The Omega Pipeline is a 12-inch offshore pipeline that originates in the High Island Area, East Addition Block A-173 and extends to West Cameron Block 342, where it was previously connected to the High Island Offshore System.
|
Oil and gas properties include a 2.5% working interest and a 2.008% net revenue interest in High Island Block 115, a 0.5% overriding royalty interest in Galveston Area Block 321, and a 2.88% working interest and 2.246% net revenue interest in High Island Block 37. All of the leases associated with these oil and gas properties have expired.
Corporate Headquarters. We lease 13,878 square feet of office space, 7,389 square feet of which is used and paid for by LEH. Our office lease is discussed more fully in Part II, Item 8 “Financial Statements and Supplementary Data – Note (15) Leases” of this Annual Report.
From time to time we are subject to various lawsuits, claims, liens and administrative proceedings that arise out of the normal course of business. Vendors have placed mechanic’s liens on the Nixon Facility as protection during construction activities. Management does not believe that such liens have a material adverse effect on our results of operations.
ITEM 4. MINE SAFETY DISCLOSURES
Not applicable.
26
|
BLUE DOLPHIN ENERGY COMPANY
|
2015 FORM 10-K
|
PART II
|
MARKET FOR REGISTRANT’S COMMON EQUITY, RELATED STOCKHOLDER MATTERS AND ISSUER PURCHASES OF EQUITY SECURITIES
|
Market Information
Our Common Stock currently trades on the OTCQX U.S. Premier tier of the OTC Markets under the ticker symbol “BDCO." The following table sets forth, for the periods indicated, the high and low prices for our Common Stock as reported by the OTC Markets. The quotations reflect inter-dealer prices, without adjustment for retail mark-ups, markdowns or commissions and may not represent actual transactions.
|
Quarter Ended
|
High
|
Low
|
||||||
|
2015
|
||||||||
|
December 31
|
$ | 5.51 | $ | 3.77 | ||||
|
September 30
|
$ | 5.35 | $ | 3.51 | ||||
|
June 30
|
$ | 7.00 | $ | 4.49 | ||||
|
March 31
|
$ | 5.00 | $ | 4.00 | ||||
|
2014
|
||||||||
|
December 31
|
$ | 6.20 | $ | 3.51 | ||||
|
September 30
|
$ | 9.99 | $ | 5.99 | ||||
|
June 30
|
$ | 10.75 | $ | 3.50 | ||||
|
March 31
|
$ | 6.05 | $ | 4.75 | ||||
Stockholders
As of March 30, 2016, we had 271 record holders of our Common Stock. We have approximately 3,000 beneficial holders of our Common Stock.
Dividends
We have not declared or paid any dividends on our Common Stock since our incorporation. We currently intend to retain earnings for our capital needs and expansion of our business and do not anticipate paying cash dividends on the Common Stock in the foreseeable future. We expect that any loan agreements we enter into in the future will likely contain restrictions on the payment of dividends on our Common Stock. Future policy with respect to dividends will be determined by the Board based upon our earnings and financial condition, capital requirements and other considerations.
ITEM 6. SELECTED FINANCIAL DATA
Not applicable.
27
|
BLUE DOLPHIN ENERGY COMPANY
|
2015 FORM 10-K
|
ITEM 7. MANAGEMENT'S DISCUSSION AND ANALYSIS OF FINANCIAL CONDITION AND RESULTS OF OPERATIONS
You should read the following discussion together with the financial statements and the notes thereto included elsewhere in this Annual Report. This discussion contains forward-looking statements that are based on management’s current expectations, estimates, and projections about our business and operations. The cautionary statements made in this Annual Report should be read as applying to all related forward-looking statements wherever they appear in this Annual Report. Our actual results may differ materially from those currently anticipated and expressed in such forward-looking statements as a result of a number of factors, including those we discuss under “Part I, Item 1A. Risk Factors” and elsewhere in this Annual Report. You should read such risk factors and forward-looking statements in this Annual Report.
Company Overview
See “Part I, Item 1. Business” included in this Annual Report for detailed information on our business.
Major Influences on Results of Operations
Our earnings and cash flows from our refinery operations business segment are primarily affected by the relationship between refined petroleum product prices and the prices for crude oil and other feedstocks. Crude oil refining is primarily a margin-based business, and in order to increase profitability, it is important for the refinery to maximize the yields of higher value finished and intermediate products and to minimize the costs of feedstock and operating expenses. Our cost to acquire crude oil and condensate and the price for which our refined petroleum products are ultimately sold depend on several factors, many of which are beyond our control, including the supply of, and demand for, crude oil and refined petroleum products, which depend on changes in domestic and foreign economies, weather conditions, domestic and foreign political affairs, production levels, availability of and access to transportation infrastructure, the availability of imports, the marketing of competitive fuel, and governmental regulations, among other factors.
Crude oil and refined petroleum product prices are also affected by other factors, such as local and general market conditions and the operating levels of competing refineries. Crude oil costs and the prices of refined petroleum products have historically been subject to wide fluctuations. An expansion or upgrade of our competitors’ facilities, price volatility, international political and economic developments, and other factors beyond our control are likely to continue to play an important role in crude oil refining industry economics. Moreover, the refining industry typically experiences seasonal fluctuations in demand for refined petroleum products, such as increases in the demand for gasoline during the summer driving season and for home heating oil during the winter. These factors can impact, among other things, the level of inventories in the market, resulting in price volatility and a negative impact on product margins. In addition to current market conditions, there are long-term factors that may impact the demand for refined petroleum products. These factors include mandated renewable fuels standards, proposed climate change laws and regulations, and increased mileage standards for vehicles.
Key Relationships
Relationship with LEH
We rely on cash from operations to fund our working capital requirements. LEH manages and operates all of our properties pursuant to the Operating Agreement. For services rendered, LEH receives reimbursements and fees. See “Part II, Item 8. Financial Statements – Note (9) Accounts Payable, Related Party” for additional disclosures related to LEH and the Operating Agreement.
28
|
BLUE DOLPHIN ENERGY COMPANY
|
2015 FORM 10-K
|
Management’s Discussion and Analysis of Financial Condition and Results of Operations (Continued)
Relationship with Genesis
We were previously subject to three agreements with Genesis and its affiliates. Under the Construction and Funding Agreement, Milam Services, Inc. (“Milam”) committed funding for the Nixon Facility’s initial start-up refurbishment. Payments under the Construction and Funding Agreement began in the first quarter of 2012, when the Nixon Facility was placed in service. As a result of our repayment of amounts due to Milam under the Construction and Funding Agreement in May 2014, we now receive up to 80% of the Gross Profits as our Profit Share under the Joint Marketing Agreement, which is described below. Our relationship with Genesis and its affiliates is currently governed by two agreements, as follows:
Crude Supply Agreement. Under the Crude Supply Agreement, GEL is our exclusive supplier of crude oil and condensate. We have the ability to purchase crude oil and condensate from other suppliers with the prior consent of GEL. GEL supplies crude oil and condensate to us at cost plus freight expense and any costs associated with GEL’s hedging. All crude oil and condensate supplied to us pursuant to the Crude Supply Agreement is paid for pursuant to the terms of the Joint Marketing Agreement as described above. In addition, GEL has a first right of refusal to use three petroleum storage tanks at the Nixon Facility during the term of the Crude Supply Agreement. Subject to certain termination rights, the Crude Supply Agreement had an initial term of three years expiring in August 2014. In accordance with the terms of the October 2013 Letter Agreement, we agreed not to terminate the Crude Supply Agreement and GEL agreed to automatically renew the Crude Supply Agreement at the end of the initial term for successive one year periods until August 2019, unless sooner terminated by GEL with 180 days prior written notice; and
Joint Marketing Agreement. Under the Joint Marketing Agreement, we, together with GEL, jointly market and sell the output produced at the Nixon Facility and share the Gross Profits (as defined below) from such sales. GEL is responsible for all product transportation scheduling; we are responsible for entering into contracts with customers for the purchase and sale of output produced at the Nixon Facility and handling all billing and invoicing relating to the same. All payments for the sale of output produced at the Nixon Facility are made directly to GEL as collection agent and all customers must satisfy GEL’s customer credit approval process. Subject to certain amendments and clarifications (as described below), the Joint Marketing Agreement also provides for the sharing of “Gross Profits” (defined as the total revenue from the sale of output from the Nixon Facility minus the cost of crude oil and condensate pursuant to the Crude Supply Agreement). As a result of our repayment of amounts due to Milam under the Construction and Funding Agreement in May 2014, certain aspects related to the distribution of Gross Profits under the Joint Marketing Agreement no longer apply. Key applicable provisions are as follows:
|
-
|
We are entitled to receive weekly payments to cover direct expenses in operating the Nixon Facility (the “Operations Payments”) in an amount not to exceed $750,000 per month plus the amount of any accounting fees, if incurred, not to exceed $50,000 per month. We assigned our rights to weekly payments and reimbursement of accounting fees under the Joint Marketing Agreement to LEH pursuant to the Operating Agreement. If Gross Profits are insufficient to cover Operations Payments, then GEL may: (i) reduce Operations Payments by an amount representing the difference between the Operations Payments and the Gross Profits for such monthly period, or (ii) provide the Operations Payments with such Operations Payments being considered deficit amounts owing to GEL. If Gross Profits are negative, then we are not entitled to receive Operations Payments and GEL may recoup any losses sustained by a special allocation of 80% of Gross Profits until such losses are covered in full, after which the prevailing Gross Profits allocation shall be reinstated; and
|
|
-
|
GEL is entitled to receive an administrative fee in the amount of $150,000 per month relating to the performance of its obligations under the Joint Marketing Agreement (the “Performance Fee”). GEL shall be paid 30% of the remaining Gross Profit up to $600,000 (the “Threshold Amount”) as the GEL Profit Share and we shall be paid 70% of the remaining Gross Profit as our Profit Share. Any amount of remaining Gross Profit that exceeds the Threshold Amount for such calendar month shall be paid to GEL and us in the following manner: (i) GEL shall be paid 20% of the remaining Gross Profits over the Threshold Amount as the GEL Profit Share and (ii) we shall be paid 80% of the remaining Gross Profits over the Threshold Amount as the our Profit Share. The GEL Profit Share plus the Performance Fee are collectively referred to in this Annual Report as the Joint Marketing Agreement Profit Share (the “JMA Profit Share”).
|
29
|
BLUE DOLPHIN ENERGY COMPANY
|
2015 FORM 10-K
|
Management’s Discussion and Analysis of Financial Condition and Results of Operations (Continued)
The Joint Marketing Agreement contains negative covenants that restrict our actions under certain circumstances. For example, we are prohibited from making any modifications to the Nixon Facility or entering into any contracts with third-parties that would materially affect or impair GEL’s or its affiliates’ rights under the agreements set forth above. The Joint Marketing Agreement had an initial term of three years expiring in August 2014. In accordance with the terms of the October 2013 Letter Agreement, we agreed not to terminate the Joint Marketing Agreement and GEL agreed to automatically renew the Joint Marketing Agreement at the end of the initial term for successive one year periods until August 2019, unless sooner terminated by GEL with 180 days prior written notice.
Pursuant to a Letter Agreement Regarding Subordination of GEL Transaction Documents dated in June 2015, we, among other things, assigned our rights to payments under the Crude Supply Agreement and Joint Marketing Agreement as collateral in favor of Sovereign Bank, a Texas state bank (“Sovereign”), as lender and lienholder pursuant to that certain Loan and Security Agreement between us and Sovereign dated in June 2015 in the principal amount of $25.0 million (the “Term Loan Due 2034”). See “Part II, Item 8. Financial Statements and Supplementary Data - Note (12) Long-Term Debt” of this Annual Report for further discussion related to the Term Loan Due 2034.
Results of Operations
We have two reportable business segments: (i) Refinery Operations and (ii) Pipeline Transportation. Business activities related to our Refinery Operations business segment are conducted at the Nixon Facility and represent approximately 99% of our operations. Business activities related to our Pipeline Transportation business segment are primarily conducted in the Gulf of Mexico through our pipeline assets and leasehold interests in oil and gas properties and represent less than 1% of our operations.
In this Results of Operations section, we review:
|
·
|
definitions of key financial performance measures used by management;
|
|
·
|
consolidated results, which include our Pipeline Transportation business segment;
|
|
·
|
non-GAAP financial results; and
|
|
·
|
Refinery Operations business segment results.
|
Remainder of Page Intentionally Left Blank
30
|
BLUE DOLPHIN ENERGY COMPANY
|
2015 FORM 10-K
|
Management’s Discussion and Analysis of Financial Condition and Results of Operations (Continued)
GLOSSARY OF SELECTED PERFORMANCE MEASURES
Management uses generally accepted accounting principles (“GAAP”) and certain non-GAAP performance measures to assess our results of operations. Certain performance measures used by management to assess our operating results and the effectiveness of our business segments are considered non-GAAP performance measures. These performance measures may differ from similar calculations used by other companies within the petroleum industry, thereby limiting their usefulness as a comparative measure.
For our refinery operations business segment, we refer to certain refinery throughput and production data in the explanation of our period over period changes in results of operations. For our consolidated results, we refer to our consolidated statements of income in the explanation of our period over period changes in results of operations.
Below are definitions of key financial performance measures used by management:
|
Adjusted Earnings Before Interest, Income Taxes and Depreciation (“EBITDA”). Reflects EBITDA excluding the JMA Profit Share.
- Refinery Operations Adjusted EBITDA. Reflects adjusted EBITDA for our refinery operations business segment.
- Total Adjusted EBITDA. Reflects adjusted EBITDA for our refinery operations and pipeline transportation business segments, as well as corporate and other.
Capacity Utilization Rate. A percentage measure that indicates the amount of available capacity being used at the Nixon Facility. The rate is calculated by dividing total refinery throughput on a bpd basis or total refinery production on a bpd basis by the total capacity of the Nixon Facility, which is currently 15,000 bpd.
Cost of Refined Products Sold. Primarily includes purchased crude oil and condensate costs, as well as transportation, freight and storage costs.
Depletion, Depreciation and Amortization. Represents property and equipment, as well as intangible assets that are depreciated or amortized based on the straight-line method over the estimated useful life of the related asset.
Downtime. Scheduled or unscheduled periods in which the Nixon Facility is not operable. Downtime may be required for a variety of reasons, including maintenance, inspection and equipment repair, voluntary regulatory compliance measures, and cessation or suspension by regulatory authorities.
Easement, Interest and Other Income. Reflects income related to:
(i) FLNG Master Easement Agreement. An easement agreement with FLNG Land II, Inc., a Delaware corporation (“FLNG”), which is recorded as land easement revenue and recognized monthly as earned, and
(ii) Grynberg Matter. A nearly two decades-old case involving Jack J. Grynberg and several defendants in the oil and gas industry, including Blue Dolphin Pipe Line Company (the “Grynberg Matter”), which was recorded as other non-recurring income.
|
EBITDA. Reflects earnings before: (i) interest income (expense), (ii) income taxes, and (iii) depreciation and amortization.
- Refinery Operations EBITDA. Reflects EBITDA for our refinery operations business segment.
- Total EBITDA. Reflects EBITDA for our refinery operations and pipeline transportation business segments, as well as corporate and other.
General and Administrative Expenses. Primarily include corporate costs, such as accounting and legal fees, office lease expenses, and administrative expenses.
Income Tax Expense. Includes federal and state taxes, as well as deferred taxes, arising from temporary differences between income for financial reporting and income tax purposes.
JMA Profit Share. Represents the GEL Profit Share plus the Performance Fee for the period pursuant to the Joint Marketing Agreement; is an indirect operating expense.
Net Income. Represents total revenue from operations less total cost of operations, total other expense, and income tax expense.
Operating Days. The number of days in a period in which the Nixon Facility operated. Downtime is excluded from operating days.
Refinery Operating Expenses. Reflect the direct operating expenses of the Nixon Facility, including direct costs of labor, maintenance materials and services, chemicals and catalysts and utilities. Represent fees paid to LEH to manage and operate the Nixon Facility pursuant to the Operating Agreement.
Refinery Operating Income. Reflects refined petroleum product sales less direct operating costs (including cost of refined products sold and refinery operating expenses) and the JMA profit share.
Revenue from Operations. Primarily consists of refined petroleum product sales, but also includes tank rental and pipeline transportation revenue. Excise and other taxes that are collected from customers and remitted to governmental authorities are not included in revenue.
Total Refinery Production. Refers to the volume processed as output through the Nixon Facility. Refinery production includes finished petroleum products, such as jet fuel, and intermediate petroleum products, such as LPG, naphtha, HOBM and AGO.
Total Refinery Throughput. Refers to the volume processed as input through the Nixon Facility. Refinery throughput includes crude oil and condensate and other feedstocks.
|
31
|
BLUE DOLPHIN ENERGY COMPANY
|
2015 FORM 10-K
|
Management’s Discussion and Analysis of Financial Condition and Results of Operations (Continued)
Consolidated Results
We have reclassified certain prior period amounts to conform to our 2015 presentation.
Current Year Compared to Prior Year.
Total Revenue from Operations. For the Current Year we had total revenue from operations of $221,732,620 compared to total revenue from operations of $388,655,123 for the Prior Year. The approximate 43% decrease in total revenue from operations was primarily the result of a significant decrease in commodity prices in the Current Year compared to the Prior Year. The majority of our revenue in the Current Year came from refined petroleum product sales, which generated revenue of $220,438,588, or more than 99% of total revenue from operations, compared to $387,304,774, or more than 99% of total revenue from operations, in the Prior Year. We recognized $1,147,568 in tank rental revenue in the Current Year compared to $1,130,149 in the Prior Year. Tank rental revenue was relatively flat between the Current Year and Prior Year.
Cost of Refined Products Sold. Cost of refined products sold was $193,216,959 for the Current Year compared to $361,399,815 for the Prior Year. The approximate 47% decrease in cost of refined products sold was primarily the result of a significant decrease in commodity prices in the Current Year compared to the Prior Year.
Refinery Operating Expenses. We recorded refinery operating expenses of $11,683,658 in the Current Year compared to $10,698,023 in the Prior Year, an increase of approximately 9%. Refinery operating expenses per barrel of throughput were $2.80 in the Current Year compared to $2.77 in the Prior Year. The increase in refinery operating expenses per barrel of throughput between the periods was a result of off-site tank leasing expense, partially off-set by an increase in total refinery throughput. See “Part II, Item 8. Financial Statements and Supplementary Data – Note (9) Accounts Payable, Related Party” of this Annual Report for additional disclosures related to the Operating Agreement.
JMA Profit Share. The JMA Profit Share was $5,820,329 and $2,362,477 for the Current Year and Prior Year, respectively. GEL became entitled to receive the JMA Profit Share in May 2014 as a result of our repayment of amounts due under the Construction and Funding Agreement. The JMA Profit Share for the Current Year represented expenses for the entire twelve month period while the JMA Profit Share for the Prior Year represented expenses for eight months out of the twelve month period.
General and Administrative Expenses. We incurred general and administrative expenses of $1,525,577 in the Current Year compared to $1,427,707 in the Prior Year. The approximate 7% increase in general and administrative expenses in the Current Year compared to the Prior Year was primarily related an increase in environmental compliance costs.
Depletion, Depreciation and Amortization. We recorded depletion, depreciation and amortization expenses of $1,647,586 in the Current Year compared to $1,570,962 in the Prior Year. The approximate 5% increase in depletion, depreciation and amortization expenses for the Current Year compared to the Prior Year primarily related to additional depreciable refinery assets that were placed in service.
Easement, Interest and Other Income. We recorded $980,266 in easement, interest and other income for the Current Year compared to $318,271 in the Prior Year. The significant increase primarily stemmed from recognition of a one-time net gain of $660,000 related to the Grynberg Matter.
Income Tax Expense. We recognized an income tax expense of $2,434,302 in the Current Year, which primarily related to deferred federal income taxes, compared to an income tax benefit of $5,587,578 in the Prior Year, which primarily related to the release of the valuation allowance on our deferred tax assets. See “Part II, Item 8. Financial Statements and Supplementary Data – Note (16) Income Taxes” for additional disclosures related to income taxes.
Net Income. For the Current Year, we reported net income of $4,403,239, or income of $0.42 per share, compared to net income of $15,758,756, or income of $1.51 per share, for the Prior Year. The $1.09 per share decrease in net income between the periods was the result of higher refinery operating expenses and an increase in the JMA profit share, which were partially offset by increases in refinery sales volumes and easement, interest and other income related to the Grynberg Matter.
32
|
BLUE DOLPHIN ENERGY COMPANY
|
2015 FORM 10-K
|
Management’s Discussion and Analysis of Financial Condition and Results of Operations (Continued)
Non-GAAP Financial Measures
Year Ended December 31, 2015 (“Current Year”) Compared to Year Ended December 31, 2014 (“Prior Year”).
Refinery Operations Adjusted EBITDA. For the Current Year, refinery operations adjusted EBITDA was $16,182,801 compared to refinery operations adjusted EBITDA of $17,424,266 for the Prior Year. This represented a decrease in refinery operations adjusted EBITDA of $1,241,465 for the Current Year compared to the Prior Year. The decrease in refinery operations adjusted EBITDA between the periods was primarily the result of lower refining margins and higher refinery operating expenses, partially offset by additional margin from increased sales volumes.
Total Adjusted EBITDA. For the Current Year, we had total adjusted EBITDA of $16,039,905 compared to total adjusted EBITDA of $16,189,571 for the Prior Year. This represented a decrease in total adjusted EBITDA of $149,666 for the Current Year compared to the Prior Year. The decrease in total adjusted EBITDA between the periods was primarily the result of lower refining margins and higher refinery operating expenses, which were partially offset by: (i) additional margin from increased sales volumes, (ii) recognition of one-time net gain of $660,000 related to the Grynberg Matter, and (iii) a partial gain resulting from recognition of the remaining $422,373 of deferred revenue associated with cancellation of a supplemental pipeline bond.
Refinery Operations EBITDA. For the Current Year, refinery operations EBITDA was $10,362,472 compared to refinery operations EBITDA of $13,821,685 for the Prior Year. This represented a decrease in refinery operations EBITDA of $3,459,213 for the Current Year compared to the Prior Year. The decrease in refinery operations EBITDA between the periods was the result of lower refining margins, higher refinery operating expenses, and a significant increase in the cost of the JMA Profit Share, which were partially offset by additional margin from increased sales volumes. The JMA Profit Share for the Current Year represented expenses for the entire twelve month period while the JMA Profit Share for the Prior Year represented expenses for eight months out of the twelve month period.
Total EBITDA. For the Current Year, we had total EBITDA of $10,219,576 compared to total EBITDA of $12,586,990 for the Prior Year. This represented a decrease in total EBITDA of $2,367,414 for the Current Year compared to the Prior Year. The decrease in total EBITDA between the periods was primarily the result of lower refining margins, higher refinery operating expenses, and a significant increase in the cost of the JMA Profit Share, which were partially offset by: (i) additional margin from increased sales volumes, (ii) recognition of one-time net gain of $660,000 related to the Grynberg Matter, and (iii) a partial gain resulting from recognition of the remaining $422,373 of deferred revenue associated with cancellation of a supplemental pipeline bond.
Refinery Operating Income. Refinery operating income totaled $9,717,642 for the Current Year compared to $11,604,355 for the Prior Year, representing a decrease of $1,886,713. The decrease in refinery operating income between the periods was primarily the result of lower refining margins, higher refinery operating expenses, and a significant increase in the cost of the JMA Profit Share, which were partially offset by additional margin from increased sales volumes. The JMA Profit Share for the Current Year represented expenses for the entire twelve month period while the JMA Profit Share for the Prior Year represented expenses for eight months out of the twelve month period.
Remainder of Page Intentionally Left Blank
33
|
BLUE DOLPHIN ENERGY COMPANY
|
2015 FORM 10-K
|
Management’s Discussion and Analysis of Financial Condition and Results of Operations (Continued)
Non-GAAP Reconciliations.
Adjusted EBITDA and EBITDA. EBITDA should be considered in conjunction with net income and other performance measures such as operating cash flows. Following is a reconciliation of adjusted EBITDA and EBITDA by business segment for the years ended December 31, 2015 and 2014:
|
Years Ended December 31, 2015
|
Years Ended December 31, 2014
|
|||||||||||||||||||||||||||||||
|
Segment
|
Segment
|
|||||||||||||||||||||||||||||||
|
Refinery
|
Pipeline
|
Corporate &
|
Refinery
|
Pipeline
|
Corporate &
|
|||||||||||||||||||||||||||
|
Operations
|
Transportation
|
Other
|
Total
|
Operations
|
Transportation
|
Other
|
Total
|
|||||||||||||||||||||||||
|
Revenue from operations
|
$ | 221,586,156 | $ | 146,464 | $ | - | $ | 221,732,620 | $ | 388,434,838 | $ | 220,200 | $ | - | $ | 388,655,038 | ||||||||||||||||
|
Less: cost of operations(1)
|
(205,403,355 | ) | (45,931 | ) | (1,215,929 | ) | (206,665,215 | ) | (371,010,572 | ) | (483,262 | ) | (1,242,466 | ) | (372,736,300 | ) | ||||||||||||||||
|
Other non-interest income(2)
|
- | 312,500 | 660,000 | 972,500 | - | 270,833 | - | 270,833 | ||||||||||||||||||||||||
|
Adjusted EBITDA
|
16,182,801 | 413,033 | (555,929 | ) | 16,039,905 | 17,424,266 | 7,771 | (1,242,466 | ) | 16,189,571 | ||||||||||||||||||||||
|
Less: JMA Profit Share(3)
|
(5,820,329 | ) | - | - | (5,820,329 | ) | (3,602,581 | ) | - | - | (3,602,581 | ) | ||||||||||||||||||||
|
EBITDA
|
$ | 10,362,472 | $ | 413,033 | $ | (555,929 | ) | $ | 10,219,576 | $ | 13,821,685 | $ | 7,771 | $ | (1,242,466 | ) | $ | 12,586,990 | ||||||||||||||
|
Depletion, depreciation and amortization
|
(1,647,586 | ) | (1,570,962 | ) | ||||||||||||||||||||||||||||
|
Interest expense, net
|
(1,734,449 | ) | (844,850 | ) | ||||||||||||||||||||||||||||
|
Income before income taxes
|
6,837,541 | 10,171,178 | ||||||||||||||||||||||||||||||
|
Income tax benefit (expense)
|
(2,434,302 | ) | 5,587,578 | |||||||||||||||||||||||||||||
|
Net income
|
$ | 4,403,239 | $ | 15,758,756 | ||||||||||||||||||||||||||||
|
(1)
|
Operation cost within the Refinery Operations and Pipeline Transportation segments includes related general, administrative, and accretion expenses. Operation cost within Corporate and Other includes general and administrative expenses associated with corporate maintenance costs, such as accounting fees, director fees, and legal expense.
|
|
(2)
|
Other non-interest income reflects FLNG easement revenue and the Grynberg Matter. See “Part II, Item 8. Financial Statements and Supplementary Data - Note (20) Commitments and Contingencies – FLNG Master Easement Agreement and Grynberg Settlement Agreement” of this Annual Report for further discussion related to FLNG and Grynberg.
|
|
(3)
|
The JMA Profit Share represents the GEL Profit Share plus the Performance Fee for the period pursuant to the Joint Marketing Agreement. See “Part II, Item 8. Financial Statements and Supplementary Data - Note (20) Commitments and Contingencies” and “Part II, Item 7. Management’s Discussion and Analysis of Financial Condition and Results of Operations – Relationship with Genesis” of this Annual Report for further discussion of the Joint Marketing Agreement.
|
Refinery Operating Income. The following table provides a reconciliation of refinery operating income to refined product sales, cost of refined products sold, refinery operating expenses, and JMA Profit Share for the periods indicated. For a reconciliation of refined petroleum product sales to total revenue from operations for our consolidated operations, see “Part II, Item 8. Financial Statements and Supplementary Data – Consolidated Statements of Income” of this Annual Report.
|
Years Ended December 31,
|
||||||||
|
2015
|
2014
|
|||||||
|
Total refined petroleum product sales
|
$ | 220,438,588 | $ | 387,304,774 | ||||
|
Less: Cost of refined petroleum products sold
|
(193,216,959 | ) | (361,399,815 | ) | ||||
|
Less: Refinery operating expenses
|
(11,683,658 | ) | (10,698,023 | ) | ||||
|
Refinery operating income before JMA Profit Share
|
15,537,971 | 15,206,936 | ||||||
|
Less: JMA Profit Share
|
(5,820,329 | ) | (3,602,581 | ) | ||||
|
Refinery operating income
|
$ | 9,717,642 | $ | 11,604,355 | ||||
|
Total refined petroleum product sales (bbls)
|
3,955,757 | 3,779,677 | ||||||
34
|
BLUE DOLPHIN ENERGY COMPANY
|
2015 FORM 10-K
|
Management’s Discussion and Analysis of Financial Condition and Results of Operations (Continued)
Refinery Operations Business Segment Results
Refinery Throughput and Production Data.
Following are refinery operational metrics for the Nixon Facility:
|
Years Ended December 31,
|
||||||||
|
2015
|
2014
|
|||||||
|
Operating Days
|
341 | 333 | ||||||
|
Downtime
|
24 | 32 | ||||||
|
Total refinery throughput
|
||||||||
|
bbls
|
4,179,952 | 3,862,351 | ||||||
|
bpd
|
12,258 | 11,599 | ||||||
|
Total refinery production
|
||||||||
|
bbls
|
4,091,203 | 3,788,710 | ||||||
|
bpd
|
11,998 | 11,378 | ||||||
|
Capacity utilization rate
|
||||||||
|
refinery throughput
|
81.7 | % | 77.3 | % | ||||
|
refinery production
|
80.0 | % | 75.9 | % | ||||
|
Note:
|
The difference between total refinery throughput (volume processed as input) and total refinery production (volume processed as output) represents refinery fuel and energy use.
|
Current Year Compared to Prior Year.
Operating Days. The Nixon Facility operated for a total of 341 days in the Current Year compared to operating for a total of 333 days in the Prior Year.
Downtime. The Nixon Facility experienced 24 days of downtime in the Current Year compared to 32 days of downtime in the Prior Year. Downtime in the Current Year related to scheduled and unscheduled maintenance. Downtime in the Prior Year primarily related to a planned maintenance turnaround and repair of an overhead accumulator.
Total Refinery Throughput. For the Current Year, the Nixon Facility processed 4,179,952 bbls, or 12,258 bpd, of crude oil and condensate compared to 3,862,351 bbls, or 11,599 bpd, of crude oil and condensate for the Prior Year. Total refinery throughput increased 317,601 bbls, or approximately 8%, for the Current Year compared to the Prior Year, which represented an increase of 659 bpd. Total refinery throughput increased as a result of: (i) less downtime in the Current Year compared to the Prior Year, (ii) debottlenecking efforts in the Current Year, and (iii) completion of refurbishment of key components of the naphtha stabilizer and depropanizer units late in the Current Year, all of which contributed to an increase in average refinery throughput for the Current Year.
Total Refinery Production. For the Current Year, the Nixon Facility produced 4,091,203 bbls, or 11,998 bpd, of refined petroleum products compared to 3,788,710 bbls, or 11,378 bpd, of refined petroleum products for the Prior Year. Total refinery production increased 302,493 bbls, or approximately 8%, for the Current Year compared to the Prior Year, which represented an increase of 620 bpd. Total refinery production increased as a result of: (i) less downtime in the Current Year compared to the Prior Year, (ii) debottlenecking efforts in the Current Year, and (iii) completion of refurbishment of key components of the naphtha stabilizer and depropanizer units late in the Current Year, all of which contributed to an increase in average refinery production for the Current Year.
35
|
BLUE DOLPHIN ENERGY COMPANY
|
2015 FORM 10-K
|
Management’s Discussion and Analysis of Financial Condition and Results of Operations (Continued)
Capacity Utilization Rate. The capacity utilization rate for refinery throughput for the Current Year was 81.7% compared to 77.3% for the Prior Year, reflecting an approximate 4% increase. The capacity utilization rate for refinery production for the Current Year was 80.0% compared to 75.9% for the Prior Year, also reflecting an approximate 4% increase. Capacity utilization rates increased as a result of: (i) less downtime in the Current Year compared to the Prior Year, (ii) debottlenecking efforts in the Current Year, and (iii) completion of the refurbishment of key components of the naphtha stabilizer and depropanizer units late in the Current Year, all of which contributed to an increase in average refinery throughput and average refinery production for the Current Year.
Refined Petroleum Product Sales Summary.
See “Part II, Item 8. Financial Statements and Supplementary Data - Note (14) Concentration of Risk” of this Annual Report for a discussion of refined petroleum product sales.
Refined Petroleum Product Economic Hedges.
The effect of economic hedges on our refined petroleum product inventories are contained within cost of operations within our refinery operations business segment. For the Current Year, our refinery operations business segment recognized a realized gain of $4,409,913 on settled transactions and a loss of $679,300 on the change in value of open contracts from December 31, 2014 to December 31, 2015. For the Prior Year, our refinery operations business segment recognized a realized gain of $3,327,921 on settled transactions and a gain of $488,950 on the change in value of open contracts from December 31, 2013 to December 31, 2014.
Liquidity and Capital Resources
Sources and Uses of Cash
We rely on cash from operations to fund our working capital requirements. At December 31, 2015 and 2014, we had cash and cash equivalents of $1,853,875 and $1,293,233, respectively. LEH manages and operates all of our properties pursuant to the Operating Agreement. For services rendered, LEH receives reimbursements and fees. Amounts previously funded by LEH and unpaid as of the consolidated balance sheet date are reflected in accounts payable, related party in our consolidated balance sheets.
In the normal course of business, we make estimates and assumptions related to amounts expensed for fees under the Operating Agreement since actual amounts can vary depending upon production volumes. We then use the cumulative catch-up method to account for revisions in estimates, which may result in prepaid expenses or accounts payable, related party on our consolidated balance sheets. At December 31, 2015, we were in a prepaid position with respect to reimbursements and fees to LEH under the Operating Agreement. Prepaid related party operating expenses to LEH totaled $624,570 and $0 at December 31, 2015 and 2014, respectively. Accounts payable, related party to LEH totaled $0 and $1,174,168 at December 31, 2015 and 2014, respectively. See “Part II, Item 8. Financial Statements and Supplementary Data – Note (9) Accounts Payable, Related Party” of this Annual Report for additional disclosures related to LEH and the Operating Agreement.
Although the price of crude oil and condensate declined from late 2014 through 2015, the number of barrels of crude oil and condensate that we processed increased year over year, capitalizing on lower average crude oil and condensate costs. Despite uncertainty in the crude oil price outlook, we believe that our business strategy will be sufficient to support our operations for the next 12 to 18 months. We are currently expanding the Nixon Facility and believe that capital and efficiency improvements will enable us to remain competitive by:
|
·
|
generating additional revenue from leasing product and crude storage to third parties;
|
|
·
|
having crude and product storage to support refinery throughput and future expansion of up to 30,000 bbls per day; and
|
|
·
|
increasing the processing capacity and complexity of the Nixon Facility.
|
36
|
BLUE DOLPHIN ENERGY COMPANY
|
2015 FORM 10-K
|
Management’s Discussion and Analysis of Financial Condition and Results of Operations (Continued)
During 2015, we secured $35.0 million in 19 year financing for the Nixon Facility expansion project. To date, we have:
|
(i)
|
completed refurbishment of the naphtha stabilizer and depropanizer units, which improve the overall quality of the naphtha that we produce and help increase the capacity utilization rate of the Nixon Facility;
|
|
(ii)
|
purchased idle refinery equipment, including, among others, a Merox unit, vacuum tower, prefrac tower unit, and LPG fractionator, which may, over time, be refurbished for use at the Nixon Facility;
|
|
(iii)
|
continued debottlenecking efforts, which improve production and efficiency;
|
|
(iv)
|
completed construction of an additional 100,000 bbls of petroleum storage tanks at the Nixon Facility; and
|
|
(v)
|
made smaller, impactful capital improvements to the Nixon Facility, including refurbishment of the wastewater system, and construction of a new parking area, new access roads, drainage, and tank firewalls.
|
We are currently constructing an additional 700,000 bbls of petroleum storage capacity at the Nixon Facility. When construction is complete, total crude oil, condensate, and refined petroleum product storage capacity at the Nixon Facility will exceed 1,000,000 bbls.
Execution of our business strategy depends on several factors, including our future performance, levels of accounts receivable, inventories, accounts payable, capital expenditures, adequate access to credit, and the financial flexibility to attract long-term capital on satisfactory terms. These factors may be impacted by general economic, political, financial, competitive, and other factors beyond our control. There can be no assurance that our business strategy will achieve the anticipated outcomes. In the event our business strategy is unsuccessful, we may experience a significant and material adverse effect on our operations, liquidity, and financial condition. See “Part I, Item 1A. Risk Factors” of this Annual Report for risk factors related to working capital, liquidity and Nixon Facility downtime.
Cash Flow
Our cash flow from operations for the periods indicated was as follows:
|
Years Ended December 31,
|
||||||||
|
2015
|
2014
|
|||||||
|
Cash flow from operations
|
||||||||
|
Adjusted income from operations
|
$ | 9,798,849 | $ | 11,425,857 | ||||
|
Change in assets and current liabilities
|
(1,872,322 | ) | (3,566,552 | ) | ||||
|
Total cash flow from operations
|
7,926,527 | 7,859,305 | ||||||
|
Cash inflows (outflows)
|
||||||||
|
Proceeds from issuance of long-term debt
|
35,000,000 | - | ||||||
|
Payments on long term debt
|
(9,881,612 | ) | (6,226,521 | ) | ||||
|
Change in restricted cash for investing activities
|
(17,360,475 | ) | - | |||||
|
Capital expenditures
|
(12,244,658 | ) | (1,720,156 | ) | ||||
|
Proceeds from notes payable
|
3,000,000 | 2,000,000 | ||||||
|
Payments on notes payble
|
(3,000,000 | ) | (372,986 | ) | ||||
|
Change in debt issue costs, net
|
(2,456,352 | ) | - | |||||
|
Change in restricted cash for financing activities
|
(422,788 | ) | (681,126 | ) | ||||
|
Total cash outflows
|
(7,365,885 | ) | (7,000,789 | ) | ||||
|
Total change in cash flows
|
$ | 560,642 | $ | 858,516 | ||||
37
|
BLUE DOLPHIN ENERGY COMPANY
|
2015 FORM 10-K
|
Management’s Discussion and Analysis of Financial Condition and Results of Operations (Continued)
For the Current Year, we experienced positive flow from operations of $7,926,527 compared to positive cash flow from operations of $7,859,305 for the Prior Year, reflecting a nominal increase of $67,222.
Working Capital
At December 31, 2015, we had working capital of $2,887,939 consisting of $23,116,587 in total current assets and $20,228,648 in total current liabilities. Comparatively, at December 31, 2014, we had a working capital deficit of $3,200,991, consisting of $14,682,657 in total current assets and $17,883,648 in total current liabilities. As of December 31, 2015, we recognized approximately $3.6 million of deferred tax assets that we expect to use over the next twelve months as current rather than long-term. The $6,088,930 improvement in working capital between the periods primarily related to the change in our deferred tax assets, as well as increases in restricted cash and inventory and a decrease in accounts payable, related party.
Capital Spending
Capital expenditures in the Current Year totaled $12,244,658 compared to $1,720,156 in the Prior Year. Capital spending primarily related to investments in the Nixon Facility. During 2015, we completed refurbishment of the naphtha stabilizer and depropanizer units, purchased idle refinery equipment, continued debottlenecking efforts, and continued commercial development of the Nixon Facility, including constructing additional petroleum storage tanks, refurbishing the wastewater system, and constructing a new parking area, new access roads, drainage, and tank firewalls. We are funding capital expenditures at the Nixon Facility primarily through borrowings.
See “Part II, Item 8. Financial Statements and Supplementary Data – Note (12) Long-Term Debt” of this Annual Report for additional disclosures related to borrowings for capital spending.
Indebtedness
The principal balance outstanding on our short and long-term debt obligations was as follows:
|
December 31,
|
||||||||
|
2015
|
2014
|
|||||||
|
Long-term debt
|
||||||||
|
First Term Loan Due 2034
|
$ | 24,643,081 | $ | - | ||||
|
Second Term Loan Due 2034
|
10,000,000 | - | ||||||
|
Notre Dame Debt
|
1,300,000 | 1,300,000 | ||||||
|
Term Loan Due 2017
|
924,969 | 1,638,898 | ||||||
|
Capital Leases
|
304,618 | 466,401 | ||||||
|
Refinery Note
|
- | 8,648,980 | ||||||
| $ | 37,172,668 | $ | 12,054,279 | |||||
See “Part II, Item 8. Financial Statements and Supplementary Data – Note (12) Long-Term Debt” of this Annual Report for additional disclosures related to long-term debt obligations.
38
|
BLUE DOLPHIN ENERGY COMPANY
|
2015 FORM 10-K
|
Management’s Discussion and Analysis of Financial Condition and Results of Operations (Continued)
Critical Accounting Policies
Long-Lived Assets
Refinery and Facilities. Additions to refinery and facilities assets are capitalized. Expenditures for repairs and maintenance are included as operating expenses under the Operating Agreement and covered by LEH. Management expects to continue making improvements to the Nixon Facility based on technological advances.
We record refinery and facilities at cost less any adjustments for depreciation or impairment. Adjustment of the asset and the related accumulated depreciation accounts are made for the refinery and facilities asset’s retirement and disposal, with the resulting gain or loss included in the consolidated statements of income. For financial reporting purposes, depreciation of refinery and facilities assets is computed using the straight-line method using an estimated useful life of 25 years beginning when the refinery and facilities assets are placed in service. We did not record any impairment of our refinery and facilities assets for the years ended December 31, 2015 and 2014.
Pipelines and Facilities Assets. We record pipelines and facilities at cost less any adjustments for depreciation or impairment. Depreciation is computed using the straight-line method over estimated useful lives ranging from 10 to 22 years. In accordance with Financial Accounting Standards Board (“FASB”) Accounting Standards Codification (“ASC”) guidance on accounting for the impairment or disposal of long-lived assets, assets are grouped and evaluated for impairment based on the ability to identify separate cash flows generated therefrom.
Construction in Progress. Construction in progress expenditures, which relate to construction and refurbishment activities at the Nixon Facility, are capitalized as incurred. Depreciation begins once the asset is placed in service.
Revenue Recognition
We sell jet fuel in nearby markets, and our intermediate products, including LPG, naphtha, HOBM, and AGO, to wholesalers and nearby refineries for further blending and processing. Revenue from refined petroleum product sales is recognized when title passes. Title passage occurs when refined petroleum products are sold or delivered in accordance with the terms of the respective sales agreements. Revenue is recognized when sales prices are fixed or determinable and collectability is reasonably assured.
Customers assume the risk of loss when title is transferred. Transportation, shipping and handling costs incurred are included in cost of refined products sold. Excise and other taxes that are collected from customers and remitted to governmental authorities are not included in revenue.
Tank rental fees are invoiced monthly in accordance with the terms of the related lease agreement and recognized in revenue as earned. Land easement revenue is recognized monthly as earned and included in other income.
Revenue from our pipeline operations is derived from fee-based contracts and is typically based on transportation fees per unit of volume transported multiplied by the volume delivered. Revenue is recognized when volumes have been physically delivered for the customer through the pipeline.
Asset Retirement Obligations
FASB ASC guidance related to AROs requires that a liability for the discounted fair value of an ARO be recorded in the period in which it is incurred and the corresponding cost capitalized by increasing the carrying amount of the related long-lived asset. The liability is accreted towards its future value each period, and the capitalized cost is depreciated over the useful life of the related asset. If the liability is settled for an amount other than the recorded amount, a gain or loss is recognized.
39
|
BLUE DOLPHIN ENERGY COMPANY
|
2015 FORM 10-K
|
Management’s Discussion and Analysis of Financial Condition and Results of Operations (Continued)
Management has concluded that there is no legal or contractual obligation to dismantle or remove the refinery and facilities assets. Further, management believes that these assets have indeterminate lives under FASB ASC guidance for estimating AROs because dates or ranges of dates upon which we would retire these assets cannot reasonably be estimated at this time. When a legal or contractual obligation to dismantle or remove the refinery and facility assets arises and a date or range of dates can reasonably be estimated for the retirement of these assets, we will estimate the cost of performing the retirement activities and record a liability for the fair value of that cost using present value techniques.
We recorded an ARO liability related to future asset retirement costs associated with dismantling, relocating or disposing of our offshore platform, pipeline systems and related onshore facilities, as well as plugging and abandoning wells and restoring land and sea beds. We developed these cost estimates for each of our assets based upon regulatory requirements, structural makeup, water depth, reservoir characteristics, reservoir depth, equipment demand, current retirement procedures, and construction and engineering consultations. Because these costs typically extend many years into the future, estimating future costs are difficult and require management to make judgments that are subject to future revisions based upon numerous factors, including changing technology, political, and regulatory environments. We review our assumptions and estimates of future abandonment costs on an annual basis.
Income Taxes
We account for income taxes under FASB ASC guidance related to income taxes, which requires recognition of income taxes based on amounts payable with respect to the current year and the effects of deferred taxes for the expected future tax consequences of events that have been included in our financial statements or tax returns. Under this method, deferred tax assets and liabilities are determined based on the differences between the financial accounting and tax basis of assets and liabilities, as well as for operating losses and tax credit carryforwards using enacted tax rates in effect for the year in which the differences are expected to reverse.
As of each reporting date, management considers new evidence, both positive and negative, to determine the realizability of deferred tax assets. Management considers whether it is more likely than not that some portion or all of the deferred tax assets will be realized, which is dependent upon the generation of future taxable income prior to the expiration of any NOL carryforwards. When management determines that it is more likely than not that a tax benefit will not be realized, a valuation allowance is recorded to reduce deferred tax assets.
In assessing the realizability of deferred tax assets, management considers whether it is more likely than not that some portion or all of the deferred tax assets will be realized. The ultimate realization of deferred tax assets is dependent upon the generation of future taxable income prior to the expiration of any NOL carryforwards.
The guidance also prescribes a recognition threshold and measurement attribute for the financial statement recognition and measurement of a tax position taken or expected to be taken in a tax return, as well as guidance on derecognition, classification, interest and penalties, accounting in interim periods, disclosures, and transition.
See “Part II, Item 8. Financial Statements and Supplementary Data - Note (16) Income Taxes” of this Annual Report for further information related to income taxes.
Recently Adopted Accounting Guidance
The guidance issued by the FASB during the year ended December 31, 2015 is not expected to have a material effect on our consolidated financial statements.
40
|
BLUE DOLPHIN ENERGY COMPANY
|
2015 FORM 10-K
|
ITEM 7A. QUANTITATIVE AND QUALITATIVE DISCLOSURES ABOUT MARKET RISK
Commodity Price Risk
Crude oil refining is primarily a margin-based business where both crude oil and refined petroleum products are commodities with prices that can fluctuate independently for short periods due to supply, demand, transportation and other factors. The spread between the cost of our feedstocks and the sales price of refined petroleum products is the primary factor affecting our operations, liquidity and financial condition. Our crude oil and condensate acquisition costs and refined petroleum products sales prices depend on numerous factors beyond our control. These factors include the supply of and demand for crude oil, gasoline, and other refined petroleum products. Supply and demand for these products depend, among other things, on changes in domestic and foreign economies; weather conditions; domestic and foreign political affairs; production levels; availability of imports and exports; marketing of competitive fuels; and government regulation.
Under our inventory risk management policy, Genesis may, but is not required to, use derivative instruments as certain of our refined petroleum product inventories exceed certain thresholds in an effort to reduce our commodity price risk. However, Genesis’ execution of the inventory risk management plan is outside of our control. Accordingly, there could be situations in which Genesis fails to execute on the plan or executes on the plan in a manner that causes significant losses to us, all of which are beyond our control. In the event that our inventory risk management system fails and/or is implemented poorly or not at all, we could experience a material and negative adverse effect on our operations, liquidity and financial condition.
At December 31, 2015, we performed a sensitivity analysis to determine the impact of an increase in the market price of commodity contracts for our economic hedges. Based on this sensitivity analysis, we determined that an increase of $1.00 per barrel in commodity contracts held at December 31, 2015 would increase unrealized loss by approximately $235,000.
Interest Rate Risk
We are exposed to interest rate volatility with regard to existing variable rate debt that is tied to movements in the U.S. Prime Rate. At December 31, 2015, we had $35,568,050 of variable interest debt with a weighted average interest rate at year end of approximately 6.25%. At December 31, 2015, we performed a sensitivity analysis to determine the impact of an increase in interest rates. Based on this sensitivity analysis, we determined that an increase of 1% in our average floating interest rates at December 31, 2015 would increase interest expense by approximately $355,681 per year.
Remainder of Page Intentionally Left Blank
41
|
BLUE DOLPHIN ENERGY COMPANY
|
2015 FORM 10-K
|
ITEM 8. FINANCIAL STATEMENTS AND SUPPLEMENTARY DATA
| Report of Independent Registered Public Accounting Firm | 43 | |
| Consolidated Balance Sheets | 44 | |
| Consolidated Statements of Income | 45 | |
| Consolidated Statements of Stockholders’ Equity | 46 | |
|
Consolidated Statements of Cash Flows
|
47 | |
| Notes to Consolidated Financial Statements | 48 |
Remainder of Page Intentionally Left Blank
42
|
BLUE DOLPHIN ENERGY COMPANY
|
2015 FORM 10-K
|
Report of Independent Registered Public Accounting Firm
The Board of Directors and
Stockholders of Blue Dolphin Energy Company
We have audited the accompanying consolidated balance sheets of Blue Dolphin Energy Company and its subsidiaries (the “Company”) as of December 31, 2015 and 2014, and the related consolidated statements of income, stockholders’ equity and cash flows for the years then ended. These consolidated financial statements are the responsibility of the Company’s management. Our responsibility is to express an opinion on these consolidated financial statements based on our audits.
We conducted our audits in accordance with the standards of the Public Company Accounting Oversight Board (United States). Those standards require that we plan and perform the audit to obtain reasonable assurance about whether the consolidated financial statements are free of material misstatement. The Company is not required to have, nor were we engaged to perform, an audit of its internal control over financial reporting. Our audit included consideration of internal control over financial reporting as a basis for designing audit procedures that are appropriate in the circumstances, but not for the purpose of expressing an opinion on the effectiveness of the Company’s internal control over financial reporting. Accordingly, we express no such opinion. An audit includes examining, on a test basis, evidence supporting the amounts and disclosures in the consolidated financial statements. An audit also includes assessing the accounting principles used and significant estimates made by management, as well as evaluating the overall consolidated financial statement presentation. We believe that our audits provide a reasonable basis for our opinion.
In our opinion, the consolidated financial statements referred to above present fairly, in all material respects, the financial position of Blue Dolphin Energy Company and its subsidiaries as of December 31, 2015 and 2014, and the consolidated results of their operations and their cash flows for the years then ended, in conformity with accounting principles generally accepted in the United States of America.
/s/ UHY LLP
UHY LLP
Sterling Heights, Michigan
March 30, 2016
43
|
BLUE DOLPHIN ENERGY COMPANY
|
2015 FORM 10-K
|
Consolidated Balance Sheets
|
December 31,
|
||||||||
|
2015
|
2014
|
|||||||
|
ASSETS
|
||||||||
|
CURRENT ASSETS
|
||||||||
|
Cash and cash equivalents
|
$ | 1,853,875 | $ | 1,293,233 | ||||
|
Restricted cash
|
3,175,299 | 1,008,514 | ||||||
|
Accounts receivable, net
|
5,457,245 | 8,340,303 | ||||||
|
Prepaid expenses and other current assets
|
939,690 | 771,458 | ||||||
|
Deposits
|
395,414 | 68,498 | ||||||
|
Inventory
|
7,808,318 | 3,200,651 | ||||||
|
Deferred tax assets, current portion, net
|
3,486,746 | - | ||||||
|
Total current assets
|
23,116,587 | 14,682,657 | ||||||
|
Total property and equipment, net
|
48,841,812 | 37,371,075 | ||||||
|
Restricted cash, noncurrent
|
15,616,478 | - | ||||||
|
Surety bonds
|
1,022,000 | 1,642,000 | ||||||
|
Debt issue costs, net
|
2,391,482 | 479,737 | ||||||
|
Trade name
|
303,346 | 303,346 | ||||||
|
Deferred tax assets, net
|
120,491 | 5,928,342 | ||||||
|
Total long-term assets
|
68,295,609 | 45,724,500 | ||||||
|
TOTAL ASSETS
|
$ | 91,412,196 | $ | 60,407,157 | ||||
|
LIABILITIES AND STOCKHOLDERS' EQUITY
|
||||||||
|
CURRENT LIABILITIES
|
||||||||
|
Accounts payable
|
$ | 14,882,714 | $ | 12,370,179 | ||||
|
Accounts payable, related party
|
300,000 | 1,174,168 | ||||||
|
Asset retirement obligations, current portion
|
38,644 | 85,846 | ||||||
|
Accrued expenses and other current liabilities
|
2,990,891 | 2,783,704 | ||||||
|
Interest payable, current portion
|
81,467 | 56,039 | ||||||
|
Long-term debt, current portion
|
1,934,932 | 1,245,476 | ||||||
|
Deferred tax liabilities, net
|
- | 168,236 | ||||||
|
Total current liabilities
|
20,228,648 | 17,883,648 | ||||||
|
Long-term liabilities:
|
||||||||
|
Asset retirement obligations, net of current portion
|
1,947,220 | 1,780,924 | ||||||
|
Deferred revenues and expenses
|
125,085 | 691,525 | ||||||
|
Long-term debt, net of current portion
|
35,237,736 | 10,808,803 | ||||||
|
Long-term interest payable, net of current portion
|
1,482,801 | 1,274,789 | ||||||
|
Total long-term liabilities
|
38,792,842 | 14,556,041 | ||||||
|
TOTAL LIABILITIES
|
59,021,490 | 32,439,689 | ||||||
|
Commitments and contingencies (Note 20)
|
||||||||
|
STOCKHOLDERS' EQUITY
|
||||||||
|
Common stock ($0.01 par value, 20,000,000 shares authorized; 10,603,802 and
|
||||||||
|
10,599,444 shares issued at December 31, 2015 and December 31, 2014, respectively)
|
106,038 | 105,995 | ||||||
|
Additional paid-in capital
|
36,738,737 | 36,718,781 | ||||||
|
Accumulated deficit
|
(3,654,069 | ) | (8,057,308 | ) | ||||
|
Treasury stock, 150,000 shares at cost
|
(800,000 | ) | (800,000 | ) | ||||
|
Total stockholders' equity
|
32,390,706 | 27,967,468 | ||||||
|
TOTAL LIABILITIES AND STOCKHOLDERS' EQUITY
|
$ | 91,412,196 | $ | 60,407,157 | ||||
See accompanying notes to consolidated financial statements.
44
|
BLUE DOLPHIN ENERGY COMPANY
|
2015 FORM 10-K
|
Consolidated Statements of Income
|
Years Ended December 31,
|
||||||||
|
2015
|
2014
|
|||||||
|
REVENUE FROM OPERATIONS
|
||||||||
|
Refined petroleum product sales
|
$ | 220,438,588 | $ | 387,304,774 | ||||
|
Tank rental revenue
|
1,147,568 | 1,130,149 | ||||||
|
Pipeline operations
|
146,464 | 220,200 | ||||||
|
Total revenue from operations
|
221,732,620 | 388,655,123 | ||||||
|
COST OF OPERATIONS
|
||||||||
|
Cost of refined products sold
|
193,216,959 | 360,159,711 | ||||||
|
Refinery operating expenses
|
11,683,658 | 10,698,023 | ||||||
|
Joint Marketing Agreement profit share
|
5,820,329 | 3,602,581 | ||||||
|
Pipeline operating expenses
|
(142,250 | ) | 208,037 | |||||
|
Lease operating expenses
|
30,023 | 26,428 | ||||||
|
General and administrative expenses
|
1,525,577 | 1,427,707 | ||||||
|
Depletion, depreciation and amortization
|
1,647,586 | 1,570,962 | ||||||
|
Bad debt expense
|
139,874 | - | ||||||
|
Accretion expense
|
211,375 | 211,995 | ||||||
|
Total cost of operations
|
214,133,131 | 377,905,444 | ||||||
|
Income from operations
|
7,599,489 | 10,749,679 | ||||||
|
OTHER INCOME (EXPENSE)
|
||||||||
|
Easement, interest and other income
|
980,266 | 318,271 | ||||||
|
Interest and other expense
|
(1,742,214 | ) | (892,372 | ) | ||||
|
Loss on disposal of property and equipment
|
- | (4,400 | ) | |||||
|
Total other expense
|
(761,948 | ) | (578,501 | ) | ||||
|
Income before income taxes
|
6,837,541 | 10,171,178 | ||||||
|
Income tax benefit (expense)
|
(2,434,302 | ) | 5,587,578 | |||||
|
Net income
|
$ | 4,403,239 | $ | 15,758,756 | ||||
|
Income per common share
|
||||||||
|
Basic
|
$ | 0.42 | $ | 1.51 | ||||
|
Diluted
|
$ | 0.42 | $ | 1.51 | ||||
|
Weighted average number of common shares outstanding:
|
||||||||
|
Basic
|
10,451,832 | 10,441,464 | ||||||
|
Diluted
|
10,451,832 | 10,441,464 | ||||||
See accompanying notes to consolidated financial statements.
45
|
BLUE DOLPHIN ENERGY COMPANY
|
2015 FORM 10-K
|
Consolidated Statements of Stockholders’ Equity
|
Common Stock
|
||||||||||||||||||||||||||||
|
Additional
|
Total
|
|||||||||||||||||||||||||||
|
Paid-In
|
Accumulated
|
Treasury Stock
|
Stockholders’
|
|||||||||||||||||||||||||
|
Shares Issued
|
Par Value
|
Capital
|
Deficit
|
Shares
|
Cost
|
Equity
|
||||||||||||||||||||||
|
Balance at December 31, 2013
|
10,580,973 | $ | 105,810 | $ | 36,623,965 | $ | (23,816,064 | ) | (150,000 | ) | $ | (800,000 | ) | $ | 12,113,711 | |||||||||||||
|
Common stock issued for services
|
18,471 | 185 | 94,816 | - | - | - | 95,001 | |||||||||||||||||||||
|
Net income
|
- | - | - | 15,758,756 | - | - | 15,758,756 | |||||||||||||||||||||
|
Balance at December 31, 2014
|
10,599,444 | $ | 105,995 | $ | 36,718,781 | $ | (8,057,308 | ) | (150,000 | ) | $ | (800,000 | ) | $ | 27,967,468 | |||||||||||||
|
Common stock issued for services
|
4,358 | 43 | 19,956 | - | - | - | 19,999 | |||||||||||||||||||||
|
Net income
|
- | - | - | 4,403,239 | - | - | 4,403,239 | |||||||||||||||||||||
|
Balance at December 31, 2015
|
10,603,802 | $ | 106,038 | $ | 36,738,737 | $ | (3,654,069 | ) | (150,000 | ) | $ | (800,000 | ) | $ | 32,390,706 | |||||||||||||
See accompanying notes to consolidated financial statements.
Remainder of Page Intentionally Left Blank
46
|
BLUE DOLPHIN ENERGY COMPANY
|
2015 FORM 10-K
|
Consolidated Statements of Cash Flows
|
Years Ended December 31,
|
||||||||
|
2015
|
2014
|
|||||||
|
OPERATING ACTIVITIES
|
||||||||
|
Net income
|
$ | 4,403,239 | $ | 15,758,756 | ||||
|
Adjustments to reconcile net income to net cash
|
||||||||
|
provided by (used in) operating activities:
|
||||||||
|
Depletion, depreciation and amortization
|
1,647,586 | 1,570,962 | ||||||
|
Unrealized loss (gain) on derivatives
|
679,300 | (488,950 | ) | |||||
|
Deferred taxes
|
2,152,869 | (5,760,106 | ) | |||||
|
Amortization of debt issue costs
|
544,607 | 33,799 | ||||||
|
Accretion expense
|
211,375 | 211,995 | ||||||
|
Common stock issued for services
|
19,999 | 95,001 | ||||||
|
Bad debt expense
|
139,874 | - | ||||||
|
Loss on disposal of assets
|
- | 4,400 | ||||||
|
Changes in operating assets and liabilities
|
||||||||
|
Accounts receivable
|
2,883,058 | 5,146,803 | ||||||
|
Prepaid expenses and other current assets
|
(168,232 | ) | (437,775 | ) | ||||
|
Deposits and other assets
|
293,084 | (505,838 | ) | |||||
|
Inventory
|
(4,607,667 | ) | 1,485,748 | |||||
|
Accounts payable, accrued expenses and other liabilities
|
601,603 | (6,770,318 | ) | |||||
|
Accounts payable, related party
|
(874,168 | ) | (2,485,172 | ) | ||||
|
Net cash provided by operating activities
|
7,926,527 | 7,859,305 | ||||||
|
INVESTING ACTIVITIES
|
||||||||
|
Capital expenditures
|
(12,244,658 | ) | (1,720,156 | ) | ||||
|
Change in restricted cash for investing activities
|
(17,360,475 | ) | - | |||||
|
Net cash used in investing activities
|
(29,605,133 | ) | (1,720,156 | ) | ||||
|
FINANCING ACTIVITIES
|
||||||||
|
Proceeds from issuance of debt
|
35,000,000 | - | ||||||
|
Payments on long-term debt
|
(9,881,612 | ) | (6,226,521 | ) | ||||
|
Proceeds from notes payable
|
3,000,000 | 2,000,000 | ||||||
|
Payments on notes payable
|
(3,000,000 | ) | (372,986 | ) | ||||
|
Change in debt issue costs, net
|
(2,456,352 | ) | - | |||||
|
Change in restricted cash for financing activities
|
(422,788 | ) | (681,126 | ) | ||||
|
Net cash provided by (used in) financing activities
|
22,239,248 | (5,280,633 | ) | |||||
|
Net increase in cash and cash equivalents
|
560,642 | 858,516 | ||||||
|
CASH AND CASH EQUIVALENTS AT BEGINNING OF PERIOD
|
1,293,233 | 434,717 | ||||||
|
CASH AND CASH EQUIVALENTS AT END OF PERIOD
|
$ | 1,853,875 | $ | 1,293,233 | ||||
|
Supplemental Information:
|
||||||||
|
Non-cash operating activities
|
||||||||
|
Surety bond funded by seller of pipeline interest
|
$ | - | $ | 850,000 | ||||
|
Non-cash investing and financing activities:
|
||||||||
|
New asset retirement obligations
|
$ | - | $ | 300,980 | ||||
|
Financing of capital expenditures via capital lease
|
$ | - | $ | 536,635 | ||||
|
Financing of capital expenditures via accounts payable
|
$ | 873,665 | $ | - | ||||
|
Interest paid
|
$ | 1,608,808 | $ | 1,369,197 | ||||
|
Income taxes paid
|
$ | 139,500 | $ | 231,552 | ||||
See accompanying notes to consolidated financial statements.
47
|
BLUE DOLPHIN ENERGY COMPANY
|
2015 FORM 10-K
|
|
Notes to Consolidated Financial Statements
|
|
|
(1)
|
Organization
|
Nature of Operations. We are primarily an independent refiner and marketer of petroleum products. Our primary asset is a 15,000 bpd crude oil and condensate processing facility that is located in Nixon, Texas (the “Nixon Facility”). As part of our refinery business segment, we conduct petroleum storage and terminaling operations under third-party lease agreements at the Nixon Facility. We also own and operate pipeline assets and have leasehold interests in oil and gas properties. See “Note (4) Business Segment Information” of this Annual Report for further discussion of our business segments.
Structure and Management. We were formed as a Delaware corporation in 1986. We are currently controlled by Lazarus Energy Holdings, LLC (“LEH”), which owns approximately 81% of our common stock, par value $0.01 per share (the “Common Stock). LEH manages and operates all of our properties pursuant to an Operating Agreement (the “Operating Agreement”). Jonathan P. Carroll is Chairman of the Board of Directors (the “Board”), Chief Executive Officer and President of Blue Dolphin, as well as a majority owner of LEH. See “Note (9) Accounts Payable, Related Party,” “Note (12) Long-Term Debt,” and “Note (20) Commitments and Contingencies – Financing Agreements” of this Annual Report for additional disclosures related to the Operating Agreement, Jonathan P. Carroll, and LEH.
Our operations are conducted through the following operating subsidiaries:
|
·
|
Lazarus Energy, LLC, a Delaware limited liability company (“LE”);
|
|
·
|
Lazarus Refining & Marketing, LLC, a Delaware limited liability company (“LRM”);
|
|
·
|
Blue Dolphin Pipe Line Company, a Delaware corporation;
|
|
·
|
Blue Dolphin Petroleum Company, a Delaware corporation; and
|
|
·
|
Blue Dolphin Services Co., a Texas corporation.
|
See "Part II, Item 7. Management’s Discussion and Analysis of Financial Condition and Results of Operations – Owned and Leased Assets” of this Annual Report for additional information regarding our operating subsidiaries.
|
(2)
|
Basis of Presentation
|
We have prepared our audited consolidated financial statements in accordance with U.S. generally accepted accounting principles (“GAAP”), as codified by the Financial Accounting Standards Board (the “FASB”) in its Accounting Standards Codification (“ASC”), and pursuant to the rules and regulations of the Securities and Exchange Commission (the “SEC”). Our consolidated financial statements include Blue Dolphin and its subsidiaries. Significant intercompany transactions have been eliminated in the consolidation.
|
(3)
|
Significant Accounting Policies
|
The summary of significant accounting policies of Blue Dolphin is presented to assist in understanding our consolidated financial statements. Our consolidated financial statements and accompanying notes are representations of management who is responsible for its integrity and objectivity. These accounting policies conform to GAAP and have been consistently applied in the preparation of our consolidated financial statements.
48
|
BLUE DOLPHIN ENERGY COMPANY
|
2015 FORM 10-K
|
Notes to Consolidated Financial Statements (Continued)
Use of Estimates. We have made a number of estimates and assumptions related to the reporting of our consolidated assets and liabilities and to the disclosure of contingent assets and liabilities to prepare these consolidated financial statements in conformity with GAAP. While we believe our current estimates are reasonable and appropriate, actual results could differ from those estimated.
Cash and Cash Equivalents. Cash and cash equivalents represent liquid investments with an original maturity of three months or less. Cash balances are maintained in depository and overnight investment accounts with financial institutions that, at times, may exceed insured deposit limits. We monitor the financial condition of the financial institutions and have experienced no losses associated with these accounts. Cash and cash equivalents totaled $1,853,875 and $1,293,233 at December 31, 2015 and 2014, respectively.
Restricted Cash. Restricted cash, current totaled $3,175,299 and $1,008,514 at December 31, 2015 and 2014, respectively. Restricted cash, noncurrent totaled $15,616,478 and $0 at December 31, 2015 and 2014, respectively. Restricted cash, current primarily represents: (i) a construction contingency account under which Sovereign Bank, a Texas state bank (“Sovereign”) will fund contingencies and (ii) a payment reserve account held by Sovereign as security for payments under a loan agreement. Restricted cash, noncurrent represents a disbursement account under which Sovereign will make payments for construction related expenses to build new petroleum storage tanks. See “Note (12) Long-Term Debt” of this Annual Report for additional disclosures related to loan agreements with Sovereign.
Accounts Receivable and Allowance for Doubtful Accounts. Accounts receivable are customer obligations due under normal trade terms. The allowance for doubtful accounts represents our estimate of the amount of probable credit losses existing in our accounts receivable. We have a limited number of customers with individually large amounts due on any given date. Any unanticipated change in any one of these customers’ credit worthiness or other matters affecting the collectability of amounts due from such customers could have a material adverse effect on our results of operations in the period in which such changes or events occur. We regularly review all of our aged accounts receivable for collectability and establish an allowance for individual customer balances as necessary. Allowance for doubtful accounts totaled $139,868 and $0 at December 31, 2015 and 2014, respectively.
Inventory. The nature of our business requires us to maintain inventory, which primarily consists of refined petroleum products and chemicals. Inventory reflected for crude oil and condensate is nominal and represents line fill. Our overall inventory is valued at lower of cost or market with costs being determined by the average cost method. If the market value of our refined petroleum product inventories declines to an amount less than our average cost, we record a write-down of inventory and an associated adjustment to cost of refined products sold. See “Note (6) Inventory” of this Annual Report for additional disclosures related to our inventory.
Derivatives. We are exposed to commodity prices and other market risks including gains and losses on certain financial assets as a result of our inventory risk management policy. Under our inventory risk management policy, Genesis Energy, LLC (“Genesis”) may, but is not required to, use commodity futures contracts to mitigate the change in value for certain of our refined petroleum product inventories subject to market price fluctuations. The physical inventory volumes are not exchanged and these contracts are net settled with cash.
Although these commodity futures contracts are not subject to hedge accounting treatment under FASB ASC guidance, we record the fair value of these Genesis hedges in our consolidated balance sheet each financial reporting period because of contractual arrangements with Genesis under which we are effectively exposed to the potential gains or losses. We recognize all commodity hedge positions as either current assets or current liabilities in our consolidated balance sheets and those instruments are measured at fair value. Changes in the fair value from financial reporting period to financial reporting period are recognized in our consolidated statements of income. Net gains or losses associated with these transactions are recognized within cost of refined products sold in our consolidated statements of income using mark-to-market accounting.
See “Note (18) Fair Value Measurement” and “Note (19) Inventory Risk Management” of this Annual Report for additional disclosures related to derivatives.
49
|
BLUE DOLPHIN ENERGY COMPANY
|
2015 FORM 10-K
|
Notes to Consolidated Financial Statements (Continued)
Property and Equipment.
Refinery and Facilities. Additions to refinery and facilities assets are capitalized. Expenditures for repairs and maintenance are expensed as incurred and are included as operating expenses under the Operating Agreement. Management expects to continue making improvements to the Nixon Facility based on technological advances.
We record refinery and facilities at cost less any adjustments for depreciation or impairment. Adjustment of the asset and the related accumulated depreciation accounts are made for the refinery and facilities asset’s retirement and disposal, with the resulting gain or loss included in the consolidated statements of income. For financial reporting purposes, depreciation of refinery and facilities assets is computed using the straight-line method using an estimated useful life of 25 years beginning when the refinery and facilities assets are placed in service. We did not record any impairment of our refinery and facilities assets for the years ended December 31, 2015 and 2014.
Pipelines and Facilities. We record pipelines and facilities at cost less any adjustments for depreciation or impairment. Depreciation is computed using the straight-line method over estimated useful lives ranging from 10 to 22 years. In accordance with FASB ASC guidance on accounting for the impairment or disposal of long-lived assets, we periodically evaluate our long-lived assets for impairment. Additionally, we evaluate our long-lived assets when events or circumstances indicate that the carrying value of these assets may not be recoverable.
Oil and Gas Properties. We account for our oil and gas properties using the full-cost method of accounting, whereby all costs associated with acquisition, exploration and development of oil and gas properties, including directly related internal costs, are capitalized on a cost center basis. Amortization of such costs and estimated future development costs are determined using the unit-of-production method. Our oil and gas properties had no production during the years ended December 31, 2015 and 2014. All leases associated with our oil and gas properties have expired, and our oil and gas properties were fully impaired at December 31, 2012.
Construction in Progress. Construction in progress expenditures, which relate to construction and refurbishment activities at the Nixon Facility, are capitalized as incurred. Depreciation begins once the asset is placed in service.
See “Note (7) Property, Plant and Equipment, Net” of this Annual Report for additional disclosures related to our refinery and facilities assets, oil and gas properties, pipelines and facilities assets, and construction in progress.
Intangibles – Other. We have an intangible asset consisting of the Blue Dolphin trade name in the amount of $303,346. We have determined our trade name to have an indefinite useful life. We account for other intangible assets under FASB ASC guidance related to intangibles, goodwill, and other. Under the guidance, we test intangible assets with indefinite lives annually for impairment. Management performed its regular annual impairment testing of trade name in the fourth quarter of 2015. Upon completion of that testing, we determined that no impairment was necessary as of December 31, 2015.
Debt Issue Costs. We have debt issue costs related to certain refinery and facilities assets debt. Debt issue costs are capitalized and amortized over the term of the related debt using the straight-line method, which approximates the effective interest method. When a loan is paid in full, any unamortized financing costs are removed from the related asset accounts and expensed as interest expense. See “Note (8) Debt Issue Costs” of this Annual Report for additional disclosures related to debt issue costs.
Revenue Recognition.
Refined Petroleum Products Revenue. We sell jet fuel in nearby markets, and our intermediate products, including liquefied petroleum gas, naphtha, HOBM, and atmospheric gas oil (“AGO”), to wholesalers and nearby refineries for further blending and processing. Revenue from refined petroleum products sales is recognized when title passes. Title passage occurs when refined petroleum products are sold or delivered in accordance with the terms of the respective sales agreements. Revenue is recognized when sales prices are fixed or determinable and collectability is reasonably assured.
50
|
BLUE DOLPHIN ENERGY COMPANY
|
2015 FORM 10-K
|
Notes to Consolidated Financial Statements (Continued)
Customers assume the risk of loss when title is transferred. Transportation, shipping, and handling costs incurred are included in cost of refined products sold. Excise and other taxes that are collected from customers and remitted to governmental authorities are not included in revenue.
Tank Rental Revenue. Tank rental fees are invoiced monthly in accordance with the terms of the related lease agreement and recognized in revenue as earned.
Easement Revenue. Land easement revenue is recognized monthly as earned and is included in other income.
Pipeline Transportation Revenue. Revenue from our pipeline operations is derived from fee-based contracts and is typically based on transportation fees per unit of volume transported multiplied by the volume delivered. Revenue is recognized when volumes have been physically delivered for the customer through the pipeline.
Deferred Revenue. In February 2014, we entered into an Asset Sale Agreement (the “Purchase Agreement”) with WBI Energy Midstream, LLC, a Colorado limited liability company (“WBI”), whereby we reacquired WBI’s 1/6th interest in the Blue Dolphin Pipeline System, the Galveston Area Block 350 Pipeline, and the Omega Pipeline (the “Pipeline Assets”) effective in October 2013. Prior to the Purchase Agreement, we owned approximately 83% of the Pipeline Assets. Pursuant to the Purchase Agreement, WBI paid us $100,000 in cash, and a surety company $850,000 in cash as collateral for supplemental pipeline bonds for our benefit in exchange for the payment and discharge of any and all payables, claims, and obligations related to the Pipeline Assets.
We recorded the amount received for our benefit for the supplemental pipeline bonds as deferred revenue. The deferred revenue is being recognized on a straight-line basis through December 31, 2018, the expected retirement date of the assets that the supplemental pipeline bonds secure. In December 2014, we completed work to abandon-in-place the pipeline associated with Right-of-Way Number OCS-G 08606. In November 2015, the Bureau of Environmental Management released $645,000 in cash collateral backing this supplemental pipeline bond. The remaining $422,373 of deferred revenue associated with this supplemental pipeline bond was recognized as a reduction of pipeline operating expense. See “Part I, Governmental Regulation -- Offshore Safety and Environmental Oversight – Decommissioning Requirements” for a discussion related to supplemental pipeline bonds.
Income Taxes. We account for income taxes under FASB ASC guidance related to income taxes, which requires recognition of income taxes based on amounts payable with respect to the current year and the effects of deferred taxes for the expected future tax consequences of events that have been included in our financial statements or tax returns. Under this method, deferred tax assets and liabilities are determined based on the differences between the financial accounting and tax basis of assets and liabilities, as well as for operating losses and tax credit carryforwards using enacted tax rates in effect for the year in which the differences are expected to reverse.
As of each reporting date, management considers new evidence, both positive and negative, to determine the realizability of deferred tax assets. Management considers whether it is more likely than not that some portion or all of the deferred tax assets will be realized, which is dependent upon the generation of future taxable income prior to the expiration of any net operating loss (“NOL”) carryforwards. When management determines that it is more likely than not that a tax benefit will not be realized, a valuation allowance is recorded to reduce deferred tax assets.
The guidance also prescribes a recognition threshold and measurement attribute for the financial statement recognition and measurement of a tax position taken or expected to be taken in a tax return, as well as guidance on derecognition, classification, interest and penalties, accounting in interim periods, disclosures, and transition.
See “Note (16) Income Taxes” of this Annual Report for further information related to income taxes.
Impairment or Disposal of Long-Lived Assets. In accordance with FASB ASC guidance on accounting for the impairment or disposal of long-lived assets, we periodically evaluate our long-lived assets for impairment. Additionally, we evaluate our long-lived assets when events or circumstances indicate that the carrying value of these assets may not be recoverable. The carrying value is not recoverable if it exceeds the sum of the undiscounted cash flows expected to result from the use and eventual disposition of the asset or group of assets. If the carrying value exceeds the sum of the undiscounted cash flows, an impairment loss equal to the amount by which the carrying value exceeds the fair value of the asset or group of assets is recognized. Significant management judgment is required in the forecasting of future operating results that are used in the preparation of projected cash flows and, should different conditions prevail or judgments be made, material impairment charges could be necessary.
51
|
BLUE DOLPHIN ENERGY COMPANY
|
2015 FORM 10-K
|
Notes to Consolidated Financial Statements (Continued)
Asset Retirement Obligations. FASB ASC guidance related to asset retirement obligations (“AROs”) requires that a liability for the discounted fair value of an ARO be recorded in the period in which it is incurred and the corresponding cost capitalized by increasing the carrying amount of the related long-lived asset. The liability is accreted towards its future value each period, and the capitalized cost is depreciated over the useful life of the related asset. If the liability is settled for an amount other than the recorded amount, a gain or loss is recognized.
Management has concluded that there is no legal or contractual obligation to dismantle or remove the refinery and facilities assets. Further, management believes that these assets have indeterminate lives under FASB ASC guidance for estimating AROs because dates or ranges of dates upon which we would retire these assets cannot reasonably be estimated at this time. When a legal or contractual obligation to dismantle or remove the refinery and facilities assets arises and a date or range of dates can reasonably be estimated for the retirement of these assets, we will estimate the cost of performing the retirement activities and record a liability for the fair value of that cost using present value techniques.
We recorded an ARO liability related to future asset retirement costs associated with dismantling, relocating, or disposing of our offshore platform, pipeline systems, and related onshore facilities, as well as for plugging and abandoning wells and restoring land and sea beds. We developed these cost estimates for each of our assets based upon regulatory requirements, structural makeup, water depth, reservoir characteristics, reservoir depth, equipment demand, current retirement procedures, and construction and engineering consultations. Because these costs typically extend many years into the future, estimating future costs are difficult and require management to make judgments that are subject to future revisions based upon numerous factors, including changing technology, political, and regulatory environments. We review our assumptions and estimates of future abandonment costs on an annual basis.
See “Note (11) Asset Retirement Obligations” of this Annual Report for additional information related to our AROs.
Computation of Earnings Per Share. We apply the provisions of FASB ASC guidance for computing earnings per share (“EPS”). The guidance requires the presentation of basic EPS, which excludes dilution and is computed by dividing net income available to common stockholders by the weighted-average number of shares of common stock outstanding for the period. The guidance requires dual presentation of basic EPS and diluted EPS on the face of our consolidated statements of income and requires a reconciliation of the numerators and denominators of basic EPS and diluted EPS. Diluted EPS is computed by dividing net income available to common stockholders by the diluted weighted average number of common shares outstanding, which includes the potential dilution that could occur if securities or other contracts to issue shares of common stock were converted to common stock that then shared in the earnings of the entity.
The number of shares related to options, warrants, restricted stock, and similar instruments included in diluted EPS is based on the “Treasury Stock Method” prescribed in FASB ASC guidance for computation of EPS. This method assumes theoretical repurchase of shares using proceeds of the respective stock option or warrant exercised, and, for restricted stock, the amount of compensation cost attributed to future services that has not yet been recognized and the amount of any current and deferred tax benefit that would be credited to additional paid-in-capital upon the vesting of the restricted stock, at a price equal to the issuer’s average stock price during the related earnings period. Accordingly, the number of shares includable in the calculation of EPS in respect of the stock options, warrants, restricted stock, and similar instruments is dependent on this average stock price and will increase as the average stock price increases. See “Note (17) Earnings Per Share” for additional information related to EPS.
Stock-Based Compensation. In accordance with FASB ASC guidance for stock-based compensation, share-based payments to personnel, including grants of restricted stock units, are measured at fair value as of the date of grant and are expensed in our consolidated statements of income over the service period (generally the vesting period).
Treasury Stock. We account for treasury stock under the cost method. When treasury stock is re-issued, the net change in share price subsequent to acquisition of the treasury stock is recognized as a component of additional paid-in-capital in our consolidated balance sheets. See “Note (13) Treasury Stock” of this Annual Report for additional disclosures related to treasury stock.
52
|
BLUE DOLPHIN ENERGY COMPANY
|
2015 FORM 10-K
|
Notes to Consolidated Financial Statements (Continued)
Reclassification. We have reclassified certain insignificant prior period amounts related to our tank rental revenue to conform to our 2015 presentation.
New Pronouncements Issued But Not Yet Effective. FASB issues an Accounting Standards Update (“ASU”) to communicate changes to the FASB ASC, including changes to non-authoritative SEC content. The following are recently issued, but not yet effective, accounting standards that may have an effect on our consolidated financial position, results of operations, or cash flows:
Income Taxes (Topic 740) (“ASU 2015-17”). In November 2015, FASB issued ASU 2015-17, which simplifies the presentation of deferred income taxes by requiring that deferred tax liabilities and assets be classified as noncurrent. Current GAAP requires deferred tax liabilities and assets to be separated into current and noncurrent. ASU 2015-17 is effective for financial statements issued for annual periods beginning after December 15, 2016, and interim periods within those annual periods. Earlier application is permitted as of the beginning of an interim or annual reporting period, and may be applied either prospectively to all deferred tax liabilities and assets or retrospectively to all periods presented. We anticipate utilizing the majority of our current deferred tax assets prior to the effective date of ASU 2015-17. We do not anticipate adoption of this guidance to have a material effect on our consolidated balance sheets.
Revenue from Contracts with Customers (“ASU 2014-09”). In May 2014, FASB issued ASU 2014-09, which outlines a new, single comprehensive model for entities to use in accounting for revenue arising from contracts with customers and supersedes most current revenue recognition guidance, including industry-specific guidance. This new revenue recognition model provides a five-step analysis in determining when and how revenue is recognized. The new model will require revenue recognition to depict the transfer of promised goods or services to customers in an amount that reflects the consideration a company expects to receive in exchange for those goods or services.
In August 2015, FASB issued Revenue from Contracts with Customers (Topic 606): Deferral of the Effective Date, which defers the effective date of ASU 2014-09 for all entities by one year. The effective date for public business entities is annual reporting periods beginning after December 15, 2017. Public business entities would apply the new revenue standard to interim reporting periods after December 15, 2017. As such, for a public business entity with a calendar year-end, ASU 2014-09 would be effective on January 1, 2018, for both its interim and annual reporting periods. This represents a one-year deferral from the original effective date. The new effective date guidance allows early adoption for all entities as of the original effective date (December 15, 2016). We are evaluating the impact that adoption of this guidance will have on the determination or reporting of our financial results.
Disclosure of Uncertainties about an Entity’s Ability to Continue as a Going Concern (“ASU 2014-15”). In August 2014, FASB issued ASU 2014-15, which requires management to perform interim and annual assessments of an entity’s ability to continue as a going concern for a one year period subsequent to the date of the financial statements. An entity must provide certain disclosures if conditions or events raise substantial doubt about the entity’s ability to continue as a going concern. The guidance is effective for all entities for the first annual period ending after December 15, 2016 and interim periods thereafter, with early adoption permitted. We do not anticipate adoption of this guidance to have a material effect on our consolidated financial statements.
Inventory (Topic 330): Simplifying the Measurement of Inventory (“ASU 2015-11”). In July 2015, FASB issued ASU 2015-11. Current guidance requires an entity to measure inventory at the lower of cost or market. Market could be replacement cost, net realizable value, or net realizable value less an approximately normal profit margin. Under ASU 2015-11, an entity should measure inventory at the lower of cost or net realizable value. Net realizable value is the estimated selling price in the ordinary course of business, less reasonably predictable costs of completion, disposal, and transportation. Amendments under ASU 2015-11 more closely align the measurement of inventory in GAAP with the measurement of inventory in International Financial Reporting Standards. For public business entities, ASU 2015-11 is effective for fiscal years beginning after December 15, 2016, including interim periods within those fiscal years. ASU 2015-11 should be applied prospectively with earlier application permitted as of the beginning of an interim or annual reporting period. We do not anticipate adoption of this guidance to have a material effect on our consolidated financial statements.
53
|
BLUE DOLPHIN ENERGY COMPANY
|
2015 FORM 10-K
|
Notes to Consolidated Financial Statements (Continued)
Interest – Imputation of Interest: Simplifying the Presentation of Debt Issuance Costs ("ASU 2015-03"). In April 2015, FASB issued ASU 2015-03, which requires debt issue costs related to a recognized debt liability to be presented in the balance sheet as a direct deduction from the carrying value of that debt liability, consistent with debt discounts. The recognition and measurement guidance for debt issue costs are not affected by ASU 2015-03. The amendments in this ASU are effective retrospectively for fiscal years, and interim periods within those years, beginning after December 15, 2015. Early adoption is permitted. We plan to adopt this guidance beginning in the first quarter of 2016. Upon adoption, we anticipate reclassifying approximately $2.4 million of debt issue costs, net from long-term assets and reflecting this amount as a direct deduction from the carrying value of long-term debt.
Presentation and Subsequent Measurement of Debt Issuance Costs Associated with Line-of-Credit Arrangements (“ASU 2015-15”). In August 2015, FASB issued ASU 2015-15, which amends ASU 2015-03 by clarifying the presentation and subsequent measurement of debt issuance costs associated with lines of credit. These costs may be presented as an asset and amortized ratably over the term of the line of credit arrangement, regardless of whether there are outstanding borrowings on the arrangement. The effective date will be the first quarter of fiscal year 2016 and will be applied retrospectively. We do not anticipate adoption of this guidance to have a material effect on our consolidated financial statements.
Leases (Topic 842) (“ASU 2016-02”). In February 2016, FASB issued ASU 2016-02. This guidance increases transparency and comparability among organizations by recognizing lease assets and lease liabilities on the balance sheet and disclosing key information about leasing arrangements. For a public business entity, the amendments in ASU 2016-02 are effective for fiscal years beginning after December 15, 2018, including interim periods within those fiscal years. Early application is permitted. We are evaluating the impact that adoption of this guidance will have on our consolidated balance sheets.
Other new pronouncements issued but not effective until after December 31, 2015 are not expected to have a material impact on our financial position, results of operations or liquidity.
Remainder of Page Intentionally Left Blank
54
|
BLUE DOLPHIN ENERGY COMPANY
|
2015 FORM 10-K
|
Notes to Consolidated Financial Statements (Continued)
|
(4)
|
Business Segment Information
|
We have two reportable business segments: (i) Refinery Operations and (ii) Pipeline Transportation. Business activities related to our Refinery Operations business segment are conducted at the Nixon Facility. Business activities related to our Pipeline Transportation business segment are primarily conducted in the Gulf of Mexico through our Pipeline Assets and leasehold interests in oil and gas properties.
Business segment information for the years ended December 31, 2015 and 2014 (and at December 31, 2015 and 2014), was as follows:
|
Year Ended December 31, 2015
|
Year Ended December 31, 2014
|
|||||||||||||||||||||||||||||||
|
Segment
|
Segment
|
|||||||||||||||||||||||||||||||
|
Refinery
|
Pipeline
|
Corporate &
|
Refinery
|
Pipeline
|
Corporate &
|
|||||||||||||||||||||||||||
|
Operations
|
Transportation
|
Other
|
Total
|
Operations
|
Transportation
|
Other
|
Total
|
|||||||||||||||||||||||||
|
Revenue from operations
|
$ | 221,586,156 | $ | 146,464 | $ | - | $ | 221,732,620 | $ | 388,434,838 | $ | 220,200 | $ | - | $ | 388,655,038 | ||||||||||||||||
|
Less: cost of operations(1)
|
(205,403,355 | ) | (45,931 | ) | (1,215,929 | ) | (206,665,215 | ) | (371,010,572 | ) | (483,262 | ) | (1,242,466 | ) | (372,736,300 | ) | ||||||||||||||||
|
Other non-interest income(2)
|
- | 312,500 | 660,000 | 972,500 | - | 270,833 | - | 270,833 | ||||||||||||||||||||||||
|
Adjusted EBITDA
|
16,182,801 | 413,033 | (555,929 | ) | 16,039,905 | 17,424,266 | 7,771 | (1,242,466 | ) | 16,189,571 | ||||||||||||||||||||||
|
Less: JMA Profit Share(3)
|
(5,820,329 | ) | - | - | (5,820,329 | ) | (3,602,581 | ) | - | - | (3,602,581 | ) | ||||||||||||||||||||
|
EBITDA
|
$ | 10,362,472 | $ | 413,033 | $ | (555,929 | ) | $ | 13,821,685 | $ | 7,771 | $ | (1,242,466 | ) | ||||||||||||||||||
|
Depletion, depreciation and amortization
|
(1,647,586 | ) | (1,570,962 | ) | ||||||||||||||||||||||||||||
|
Interest expense, net
|
(1,734,449 | ) | (844,850 | ) | ||||||||||||||||||||||||||||
|
Income before income taxes
|
6,837,541 | 10,171,178 | ||||||||||||||||||||||||||||||
|
Income tax benefit (expense)
|
(2,434,302 | ) | 5,587,578 | |||||||||||||||||||||||||||||
|
Net income
|
$ | 4,403,239 | $ | 15,758,756 | ||||||||||||||||||||||||||||
|
Capital expenditures
|
$ | 12,244,658 | $ | - | $ | - | $ | 12,244,658 | $ | 1,720,156 | $ | - | $ | - | $ | 1,720,156 | ||||||||||||||||
|
Identifiable assets
|
$ | 84,996,560 | $ | 2,338,107 | $ | 4,077,529 | $ | 91,412,196 | $ | 50,950,050 | $ | 3,028,719 | $ | 6,428,388 | $ | 60,407,157 | ||||||||||||||||
|
(1)
|
Operation cost within the Refinery Operations and Pipeline Transportation segments includes related general, administrative, and accretion expenses. Operation cost within Corporate and Other includes general and administrative expenses associated with corporate maintenance costs, such as accounting fees, director fees, and legal expense.
|
|
(2)
|
Other non-interest income reflects FLNG easement revenue and the Grynberg Matter. See “Note (20) Commitments and Contingencies – FLNG Master Easement Agreement and Grynberg Settlement Agreement” of this Annual Report for further discussion related to FLNG and Grynberg.
|
|
(3)
|
The JMA Profit Share represents the GEL Profit Share plus the Performance Fee for the period pursuant to the Joint Marketing Agreement. See “Part II, Item 7. Management’s Discussion and Analysis of Financial Condition and Results of Operations – Relationship with Genesis” and “Note (20) Commitments and Contingencies” of this Annual Report for further discussion of the Joint Marketing Agreement.
|
55
|
BLUE DOLPHIN ENERGY COMPANY
|
2015 FORM 10-K
|
Notes to Consolidated Financial Statements (Continued)
|
(5)
|
Prepaid Expenses and Other Current Assets
|
Prepaid expenses and other current assets consisted of the following:
|
December 31,
|
||||||||
|
2015
|
2014
|
|||||||
|
Prepaid related party operating expenses
|
$ | 624,570 | $ | - | ||||
|
Prepaid insurance
|
315,120 | 156,558 | ||||||
|
Unrealized hedging gains
|
- | 495,900 | ||||||
|
Prepaid professional fees
|
- | 104,000 | ||||||
|
Prepaid listing fees
|
- | 15,000 | ||||||
| $ | 939,690 | $ | 771,458 | |||||
|
(6)
|
Inventory
|
Inventory consisted of the following:
|
December 31,
|
||||||||
|
2015
|
2014
|
|||||||
|
HOBM
|
$ | 5,007,576 | $ | 124,176 | ||||
|
Jet fuel
|
2,045,784 | 2,631,546 | ||||||
|
Naphtha
|
309,850 | 194,688 | ||||||
|
AGO
|
278,278 | 224,007 | ||||||
|
Chemicals
|
122,777 | - | ||||||
|
Crude oil and condensate
|
19,041 | 19,041 | ||||||
|
Propane
|
17,860 | - | ||||||
|
LPG mix
|
7,152 | 7,193 | ||||||
| $ | 7,808,318 | $ | 3,200,651 | |||||
Remainder of Page Intentionally Left Blank
56
|
BLUE DOLPHIN ENERGY COMPANY
|
2015 FORM 10-K
|
Notes to Consolidated Financial Statements (Continued)
|
(7)
|
Property, Plant and Equipment, Net
|
Property, plant and equipment, net, consisted of the following:
|
December 31,
|
||||||||
|
2015
|
2014
|
|||||||
|
Refinery and facilities
|
$ | 40,195,928 | $ | 36,462,451 | ||||
|
Pipelines and facilities
|
2,127,207 | 2,127,207 | ||||||
|
Onshore separation and handling facilities
|
325,435 | 325,435 | ||||||
|
Land
|
602,938 | 602,938 | ||||||
|
Other property and equipment
|
644,795 | 597,064 | ||||||
| 43,896,303 | 40,115,095 | |||||||
|
Less: Accumulated depletion, depreciation, and amortization
|
(6,234,161 | ) | (4,586,575 | ) | ||||
| 37,662,142 | 35,528,520 | |||||||
|
Construction in progress
|
11,179,670 | 1,842,555 | ||||||
| $ | 48,841,812 | $ | 37,371,075 | |||||
We capitalize interest cost incurred on funds used to construct property, plant, and equipment. The capitalized interest is recorded as part of the asset to which it relates and is amortized over the asset’s useful life. Interest cost capitalized was $556,032 and $0 at December 31, 2015 and 2014, respectively.
|
(8)
|
Debt Issue Costs
|
Debt issuance costs are capitalized and amortized over the terms of the underlying loan using the effective-interest method. Debt issue costs totaled $2,441,218 and $690,980 at December 31, 2015 and 2014, respectively. Debt issue costs, net of accumulated amortization, totaled $2,391,482 and $479,737 at December 31, 2015 and 2014, respectively. Debt issue costs at December 31, 2015 related to loan agreements with Sovereign. Debt issue costs at December 31, 2014 related to a loan agreement with American First National Bank.
Accumulated amortization totaled $49,736 and $211,244 at December 31, 2015 and 2014, respectively. Amortization expense, which is included in interest expense, was $544,607 and $33,799 for the years ended December 31, 2015 and 2014, respectively. Amortization expense for the year ended December 31, 2015 included $456,287 related to writing off debt issue costs associated with the refinance of debt owed to American First National Bank.
See “Note (12) Long-Term Debt” of this Annual Report for additional disclosures related to the loan agreements with Sovereign and American First National Bank.
Remainder of Page Intentionally Left Blank
57
|
BLUE DOLPHIN ENERGY COMPANY
|
2015 FORM 10-K
|
Notes to Consolidated Financial Statements (Continued)
|
(9)
|
Accounts Payable, Related Party
|
Accounts payable, related party totaled $300,000 and $1,174,168 at December 31, 2015 and 2014, respectively. Accounts payable, related party consisted of reimbursements and fees under the Operating Agreement and off-site storage tank leasing expense.
Operating Agreement. LEH manages and operates all of our properties pursuant to the Operating Agreement. LEH, our controlling shareholder, owns approximately 81% of our Common Stock. Jonathan Carroll, Chairman of the Board, Chief Executive Officer, and President of Blue Dolphin, is the majority owner of LEH. For services rendered, LEH receives reimbursements and fees as follows:
|
·
|
Reimbursements. For management and operation of all properties excluding the Nixon Facility, LEH is reimbursed at cost for all reasonable expenses incurred while performing the services. Unsettled reimbursements to LEH are reflected within either prepaid expenses or accounts payable, related party in our consolidated balance sheets. Amounts reimbursed to LEH are reflected in the appropriate asset or expense accounts in our consolidated statements of income.
|
|
·
|
Fees. For management and operation of the Nixon Facility, LEH receives fees: (i) in the form of weekly payments from GEL TEX Marketing, LLC (“GEL”) not to exceed $750,000 per month, (ii) $0.25 for each barrel processed at the Nixon Facility up to a maximum quantity of 10,000 barrels per day determined on a monthly basis, and (iii) $2.50 for each barrel processed at the Nixon Facility in excess of 10,000 barrels per day determined on a monthly basis. In the normal course of business, we make estimates and assumptions related to amounts expensed for fees since actual amounts can vary depending upon production volumes. We then use the cumulative catch-up method to account for revisions in estimates, which may result in prepaid expenses or accounts payable, related party on our consolidated balance sheets. Amounts expensed as fees are reflected as refinery operating expenses in our consolidated statements of income.
|
At December 31, 2015, we were in a prepaid position with respect to reimbursements and fees to LEH under the Operating Agreement. Prepaid related party operating expenses to LEH totaled $624,570 and $0 at December 31, 2015 and 2014, respectively. Accounts payable, related party to LEH totaled $0 and $1,174,168 at December 31, 2015 and 2014, respectively.
For the years ended December 31, 2015 and 2014, refinery operating expenses totaled $11,683,658 (approximately $2.80 per barrel of throughput) and $10,698,023 (approximately $2.77 per barrel of throughput), respectively.
The Operating Agreement expires upon the earliest to occur of: (a) the date of the termination of the Joint Marketing Agreement pursuant to its terms, (b) August 2018, or (c) upon written notice of either party to the Operating Agreement of a material breach of the Operating Agreement by the other party.
Short-Term Tank Lease Agreement. Pursuant to a Tank Lease Agreement, we lease an off-site storage tank from Ingleside Crude, LLC (“Ingleside”). The Tank Lease Agreement had an initial term of 30 days and automatically renews for 30 day periods. The parties may terminate the Tank Lease Agreement upon 30 days written notice. Ingleside is a related party of LEH and Jonathan Carroll. Accounts payable, related party to Ingleside totaled $300,000 and $0 at December 31, 2015 and 2014, respectively.
58
|
BLUE DOLPHIN ENERGY COMPANY
|
2015 FORM 10-K
|
Notes to Consolidated Financial Statements (Continued)
|
(10)
|
Accrued Expenses and Other Current Liabilities
|
Accrued expenses and other current liabilities consisted of the following:
|
December 31,
|
||||||||
|
2015
|
2014
|
|||||||
|
Excise and income taxes payable
|
$ | 1,290,101 | $ | 1,228,411 | ||||
|
Unearned revenue
|
781,859 | 252,500 | ||||||
|
Genesis JMA Profit Share payable
|
388,364 | 521,739 | ||||||
|
Unrealized hedging loss
|
183,400 | - | ||||||
|
Other payable
|
157,714 | 149,962 | ||||||
|
Insurance
|
103,024 | 96,092 | ||||||
|
Board of director fees payable
|
86,429 | 345,000 | ||||||
|
Transportation and inspection
|
- | 190,000 | ||||||
| $ | 2,990,891 | $ | 2,783,704 | |||||
|
(11)
|
Asset Retirement Obligations
|
Refinery and Facilities. Management has concluded that there is no legal or contractual obligation to dismantle or remove the refinery and facilities assets. Management believes that the refinery and facilities assets have indeterminate lives under FASB ASC guidance for estimating AROs because dates or ranges of dates upon which we would retire these assets cannot reasonably be estimated at this time. When a legal or contractual obligation to dismantle or remove the refinery and facilities assets arises and a date or range of dates can reasonably be estimated for the retirement of these assets, we will estimate the cost of performing the retirement activities and record a liability for the fair value of that cost using present value techniques.
Pipelines and Facilities and Oil and Gas Properties. We have AROs associated with the dismantlement and abandonment in place of our pipelines and facilities assets, as well as the plugging and abandonment of our oil and gas properties. We recorded a discounted liability for the fair value of an ARO with a corresponding increase to the carrying value of the related long-lived asset at the time the asset was installed or placed in service. We amortize the amount added to property and equipment and recognize accretion expense in connection with the discounted liability over the remaining life of the asset.
Plugging and abandonment costs for oil and gas properties and pipelines are recorded as information becomes available to substantiate actual and/or probable costs. Liabilities settled represents amounts paid for plugging and abandonment costs against the asset’s ARO liability. Abandonment expense represents amounts paid for plugging and abandonment costs that exceed the asset’s ARO liability. Liabilities settled and abandonment expense are recorded during the period incurred. For the years ended December 31, 2015 and 2014, we recognized $92,330 and $243,866, respectively, in liabilities settled. For the years ended December 31, 2015 and 2014, we did not incur any abandonment expense related to our oil and gas properties.
59
|
BLUE DOLPHIN ENERGY COMPANY
|
2015 FORM 10-K
|
Notes to Consolidated Financial Statements (Continued)
AROs on a roll-forward basis were as follow:
|
December 31,
|
||||||||
|
2015
|
2014
|
|||||||
|
Asset retirement obligations, at the beginning of the period
|
$ | 1,866,770 | $ | 1,597,661 | ||||
|
New asset retirement obligations and adjustments
|
49 | 300,980 | ||||||
|
Liabilities settled
|
(92,330 | ) | (243,866 | ) | ||||
|
Accretion expense
|
211,375 | 211,995 | ||||||
| 1,985,864 | 1,866,770 | |||||||
|
Less: current portion of asset retirement obligations
|
(38,644 | ) | (85,846 | ) | ||||
|
Long-term asset retirement obligations, at the end of the period
|
$ | 1,947,220 | $ | 1,780,924 | ||||
The WBI transaction resulted in a $300,980 increase in our AROs related to the Pipeline Assets, which represents the fair value of the liability, and increased accretion expense throughout the remaining useful life of certain of the Pipeline Assets. For additional information related to the WBI Transaction, see “Note (3) Significant Accounting Policies – Revenue Recognition – Deferred Revenue” and “Note (20) Commitments and Contingencies – Supplemental Pipeline Bonds” of this Annual Report.
|
(12)
|
Long-Term Debt
|
Long-term debt consisted of the following:
|
December 31,
|
||||||||
|
2015
|
2014
|
|||||||
|
First Term Loan Due 2034
|
$ | 24,643,081 | $ | - | ||||
|
Second Term Loan Due 2034
|
10,000,000 | - | ||||||
|
Notre Dame Debt
|
1,300,000 | 1,300,000 | ||||||
|
Term Loan Due 2017
|
924,969 | 1,638,898 | ||||||
|
Capital Leases
|
304,618 | 466,401 | ||||||
|
Refinery Note
|
- | 8,648,980 | ||||||
| 37,172,668 | 12,054,279 | |||||||
|
Less: current portion of long-term debt
|
(1,934,932 | ) | (1,245,476 | ) | ||||
| $ | 35,237,736 | $ | 10,808,803 | |||||
At December 31, 2015, our expected future long-term debt payments were as follow:
|
Years Ending December 31,
|
||||
|
2016
|
$ | 1,934,932 | ||
|
2017
|
2,711,664 | |||
|
2018
|
1,180,953 | |||
|
2019
|
1,235,627 | |||
|
2020
|
1,309,735 | |||
|
Subsequent to 2020
|
28,799,757 | |||
| $ | 37,172,668 | |||
60
|
BLUE DOLPHIN ENERGY COMPANY
|
2015 FORM 10-K
|
Notes to Consolidated Financial Statements (Continued)
First Term Loan Due 2034. We entered into a Loan and Security Agreement with Sovereign in June 2015, as administrative agent and lender pursuant to a term loan in the principal amount of $25.0 million (the “First Term Loan Due 2034”). The First Term Loan Due 2034 matures in June 2034, has current monthly payments of principal and interest of $185,289, and accrues interest at a rate based on the Wall Street Journal Prime Rate plus 2.75%. Pursuant to a construction rider in the First Term Loan Due 2034, proceeds available for use were placed in a disbursement account whereby Sovereign makes payments for construction related expenses. Amounts held in the disbursement account are reflected as restricted cash and restricted cash, noncurrent in our consolidated balance sheets. The principal balance outstanding on the First Term Loan Due 2034 was $24,643,081 and $0 at December 31, 2015 and 2014, respectively. Interest was accrued on the First Term Loan Due 2034 in the amount of $34,883 and $0 at December 31, 2015 and 2014, respectively.
As a condition of the First Term Loan Due 2034, Jonathan P. Carroll was required to guarantee repayment of funds borrowed and interest accrued under the loan. For his personal guarantee, we entered into a Guaranty Fee Agreement with Jonathan P. Carroll whereby he receives a fee equal to 2.00% per annum, paid monthly, of the outstanding principal balance owed under the First Term Loan Due 2034. For the year ended December 31, 2015, guaranty fees related to the First Term Loan Due 2034 totaled $265,518. There were no guaranty fees paid in 2014 related to the First Term Loan Due 2034. Guaranty fees are recognized monthly as incurred and are included in interest and other expense in our consolidated statements of operations. LEH, LRM and Blue Dolphin also guaranteed the First Term Loan Due 2034. See “Note (9) Accounts Payable, Related Party” of this Annual Report for additional disclosures related to LEH.
Proceeds of the First Term Loan Due 2034 were used to refinance approximately $8.5 million of debt owed to American First National Bank under the Refinery Note. Remaining proceeds are being used primarily to construct new petroleum storage tanks. The First Term Loan Due 2034 is secured by: (i) a first lien on all Nixon Facility business assets (excluding accounts receivable and inventory), (ii) assignment of all Nixon Facility contracts, permits, and licenses, (iii) absolute assignment of Nixon Facility rents and leases, including tank rental income, (iv) a $1.0 million payment reserve account held by Sovereign, and (v) a pledge of $5.0 million of a life insurance policy on Jonathan P. Carroll. The First Term Loan Due 2034 contains representations and warranties, affirmative, restrictive, and financial covenants, as well as events of default which are customary for credit facilities of this type.
Second Term Loan Due 2034. We entered into a Loan and Security Agreement with Sovereign in December 2015, as administrative agent and lender pursuant to a term loan in the principal amount of $10.0 million (the “Second Term Loan Due 2034”). The Second Term Loan Due 2034 matures in December 2034, has current monthly payments of principal and interest of $74,111, and accrues interest at a rate based on the Wall Street Journal Prime Rate plus 2.75%. Pursuant to a construction rider in the Second Term Loan Due 2034, proceeds available for use were placed in a disbursement account whereby Sovereign makes payments for construction related expenses. Amounts held in the disbursement account are reflected as restricted cash and restricted cash, noncurrent in our consolidated balance sheets. The principal balance outstanding on the Second Term Loan Due 2034 was $10,000,000 and $0 at December 31, 2015 and 2014, respectively. Interest was accrued on the Second Term Loan Due 2034 in the amount of $39,194 and $0 at December 31, 2015 and 2014, respectively.
As a condition of the Second Term Loan Due 2034, Jonathan P. Carroll was required to guarantee repayment of funds borrowed and interest accrued under the loan. For his personal guarantee, we entered into a Guaranty Fee Agreement with Jonathan P. Carroll whereby he receives a fee equal to 2.00% per annum, paid monthly, of the outstanding principal balance owed under the Second Term Loan Due 2034. For the year ended December 31, 2015, guaranty fees related to the Second Term Loan Due 2034 totaled $16,667. There were no guaranty fees paid in 2014 related to the Second Term Loan Due 2034. Guaranty fees are recognized monthly as incurred and are included in interest and other expense in our consolidated statements of operations. LEH, LE and Blue Dolphin also guaranteed the Second Term Loan Due 2034. See “Note (9) Accounts Payable, Related Party” of this Annual Report for additional disclosures related to LEH.
Proceeds of the Second Term Loan Due 2034 were used to refinance a $3.0 million bridge loan to Sovereign (see “Term Loan Due 2016” below). Remaining proceeds are being used primarily to construct additional new petroleum storage tanks at the Nixon Facility. The Second Term Loan Due 2034 is secured by: (i) a second priority lien on the rights of LE in the Nixon Facility and the other collateral of LE pursuant to a security agreement; (ii) a first priority lien on the real property interests of LRM; (iii) a first priority lien on all of LRM’s fixtures, furniture, machinery and equipment; (iv) a first priority lien on all of LRM’s contractual rights, general intangibles and instruments, except with respect to LRM’s rights in its leases of Tanks 62, 63, and 80, with respect to which Sovereign will have a second priority lien in such leases subordinate to a prior lien granted by LRM to Sovereign to secure obligations of LRM under the Term Loan Due 2017; and (v) all other collateral as described in the security documents. The Second Term Loan Due 2034 contains representations and warranties, affirmative, restrictive, and financial covenants, as well as events of default which are customary for credit facilities of this type.
61
|
BLUE DOLPHIN ENERGY COMPANY
|
2015 FORM 10-K
|
Notes to Consolidated Financial Statements (Continued)
Term Loan Due 2016. We entered into a Loan and Security Agreement with Sovereign as lender in June 2015, for a term note in the principal amount of $3.0 million (the “Term Loan Due 2016”). The Term Loan Due 2016 was amended on November 10, 2015, pursuant to a Loan Modification Agreement (the “November Loan Modification Agreement”). Under the November Loan Modification Agreement, the due date was extended to November 2016. The Term Loan Due 2016 accrued interest at the greater of the Wall Street Journal Prime Rate plus 2.75% or 6.00%. All amounts due and outstanding under the Term Loan Due 2016 were repaid in December 2015. The Term Loan Due 2016 required payment of interest with full payment of the outstanding principal due at maturity. The principal balance outstanding on the Term Loan Due 2016 was $0 at December 31, 2015 and 2014. Interest was accrued on the Term Loan Due 2016 in the amount of $0 at December 31, 2015 and 2014.
As a condition of the Term Loan Due 2016, Jonathan P. Carroll was required to guarantee repayment of funds borrowed and interest accrued under the loan. For his personal guarantee, we entered into a Guaranty Fee Agreement with Jonathan P. Carroll whereby he received a fee equal to 2.00% per annum, paid monthly, of the outstanding principal balance owed under the Term Loan Due 2016. For the years ended December 31, 2015 and 2014, guaranty fees related to the Term Loan Due 2016 totaled $26,500. There were no guaranty fees paid in 2014 related to the Term Loan Due 2016. Guaranty fees are recognized monthly as incurred and are included in interest and other expense in our consolidated statements of operations.
Notre Dame Debt. We entered into a loan with Notre Dame Investors, Inc. as evidenced by a Promissory Note in the original principal amount of $8.0 million, which is currently held by John Kissick (the “Notre Dame Debt”). The Notre Dame Debt matures in January 2017, and accrues interest at a rate of 16.00%. The principal balance outstanding on the Notre Dame Debt was $1,300,000 at December 31, 2015 and 2014. Interest was accrued on the Notre Dame Debt in the amount of $1,482,801 and $1,274,789 at December 31, 2015 and 2014, respectively.
The Notre Dame Debt is secured by a Deed of Trust, Security Agreement and Financing Statements (the “Subordinated Deed of Trust”), which encumbers the Nixon Facility and general assets of LE. There are no financial maintenance covenants associated with the Notre Dame Debt. Pursuant to a Subordination Agreement dated in June 2015, the holder of the Notre Dame Debt agreed to subordinate its interest and liens on the Nixon Facility and general assets of LE first in favor of Sovereign as holder of the First Term Loan Due 2034 and second in favor of GEL. See “Note (20) Commitments and Contingencies” of this Annual Report for additional disclosures related to the Genesis Agreements.
Term Loan Due 2017. We entered into a Loan and Security Agreement with Sovereign in May 2014, for a term loan facility in the principal amount of $2.0 million (the “Term Loan Due 2017”). The Term Loan Due 2017 was amended in March 2015, pursuant to a Loan Modification Agreement (the “March Loan Modification Agreement”). Under the March Loan Modification Agreement, the interest rate was modified to be the greater of the Wall Street Journal Prime Rate plus 2.75% or 6.00%, and the due date was extended to March 2017. Pursuant to the March Loan Modification Agreement, the monthly payment due under the Term Loan Due 2017 is $61,665 plus interest. The principal balance outstanding on the Term Loan Due 2017 was $924,969 and $1,638,898 at December 31, 2015 and 2014, respectively. Interest was accrued on the Term Loan Due 2017 in the amount of $4,779 and $8,470 at December 31, 2015 and 2014, respectively.
As a condition of the Term Loan Due 2017, Jonathan P. Carroll was required to guarantee repayment of funds borrowed and interest accrued under the loan. For his personal guarantee, we entered into a Guaranty Fee Agreement with Jonathan P. Carroll whereby he receives a fee equal to 2.00% per annum, paid monthly, of the outstanding principal balance owed under the Term Loan Due 2017. For the year ended December 31, 2015, guaranty fees related to the Term Loan Due 2017 totaled $11,439. There were no guaranty fees paid in 2014 related to the Term Loan Due 2017. Guaranty fees are recognized monthly as incurred and are included in interest and other expense in our consolidated statements of operations.
62
|
BLUE DOLPHIN ENERGY COMPANY
|
2015 FORM 10-K
|
Notes to Consolidated Financial Statements (Continued)
The proceeds of the Term Loan Due 2017 were used primarily to finance costs associated with refurbishment of the Nixon Facility’s naphtha stabilizer and depropanizer units. The Term Loan Due 2017 is: (i) subject to a financial maintenance covenant pertaining to debt service coverage ratio and (ii) secured by the assignment of certain leases of LRM and assets of LEH. See “Note (9) Accounts Payable, Related Party” of this Annual Report for additional disclosures related to LEH.
Capital Leases. We entered into a 36 month “build-to-suit” capital lease in August 2014, for the purchase of new boiler equipment for the Nixon Facility. The equipment was delivered in December 2014 and the cost was added to construction in progress. Once placed in service, the equipment will be reclassified to refinery and facilities and depreciation will begin. The capital lease requires a quarterly payment in the amount of $44,258. Capital lease obligations totaled $304,618 and $466,401 at December 31, 2015 and 2014, respectively. Interest was accrued on capital leases in the amount of $2,612 and $0 at December 31, 2015 and 2014, respectively.
The following is a summary of equipment held under long-term capital leases:
|
December 31,
|
||||||||
|
2015
|
2014
|
|||||||
|
Boiler equipment
|
$ | 538,598 | $ | 538,598 | ||||
|
Less: accumulated depreciation
|
- | - | ||||||
| $ | 538,598 | $ | 538,598 | |||||
At December 31, 2015, future minimum lease commitments under non-cancelable capital leases were as follow:
|
Years Ending December 31,
|
||||
|
2016
|
$ | 177,031 | ||
|
2017
|
138,625 | |||
| 315,656 | ||||
|
Less: amount representing interest
|
(11,038 | ) | ||
|
Present value of minimum lease payments
|
$ | 304,618 | ||
At December 31, 2015, the present value of minimum lease payments due within one year was $168,739.
Refinery Note. We entered into a Loan Agreement with First International Bank in September 2008, in the principal amount of $10.0 million (the “Refinery Note”). The Refinery Note was subsequently acquired by American First National Bank. All amounts due and outstanding under the Refinery Note were repaid in June 2015. The Refinery Note had a maturity date of October 2028 and accrued interest at a rate based on the U.S. Prime Rate plus 2.25%. The principal balance outstanding on the Refinery Note was $0 and $8,648,980 at December 31, 2015 and 2014, respectively. Interest was accrued on the Refinery Note in the amount of $0 and $47,569 at December 31, 2014, respectively.
|
(13)
|
Treasury Stock
|
At December 31, 2015 and 2014, we had 150,000 shares of treasury stock.
|
(14)
|
Concentration of Risk
|
Bank Accounts. Financial instruments that potentially subject us to concentrations of risk consist primarily of cash, trade receivables and payables. We maintain our cash balances at financial institutions located in Houston, Texas. In the U.S., the Federal Deposit Insurance Corporation (the “FDIC”) insures certain financial products up to a maximum of $250,000 per depositor. We had cash balances in excess of the FDIC insurance limit per depositor in the amount of $19,594,883 and $1,113,977 at December 31, 2015 and 2014, respectively.
63
|
BLUE DOLPHIN ENERGY COMPANY
|
2015 FORM 10-K
|
Notes to Consolidated Financial Statements (Continued)
Key Supplier. Under the Crude Oil and Supply Throughput Services Agreement dated in August 2011 (the “Crude Supply Agreement”), GEL is our exclusive supplier of crude oil and condensate. We have the ability to purchase crude oil and condensate from other suppliers with the prior consent of GEL. The initial term was to expire in August 2014. However, in October 2013, we entered into a Letter Agreement Regarding Certain Advances and Related Agreements with GEL and Milam Services, Inc. (“Milam”) (the “October 2013 Letter Agreement”), effective in October 2013. In accordance with the terms of the October 2013 Letter Agreement, we agreed not to terminate the Crude Supply Agreement and GEL agreed to automatically renew the Crude Supply Agreement at the end of the initial term for successive one year periods until August 2019, unless sooner terminated by GEL with 180 days prior written notice.
Significant Customers. We routinely assess the financial strength of our customers and have not experienced significant write-downs in our accounts receivable balances. As a result, we believe that our accounts receivable credit risk exposure is limited. For the year ended December, 2015, we had three customers that accounted for approximately 56% of our refined petroleum products sales. These three customers represented approximately $3.0 million in accounts receivable at December 31, 2015. For the year ended December 31, 2014, we had five customers that accounted for approximately 89% of our refined petroleum products sales. These five customers represented approximately $6.4 million in accounts receivable at December 31, 2014.
Refined Petroleum Product Sales. All of our refined petroleum products are currently sold in the U.S. The following table summarizes total refined petroleum product sales by distillation (from light to heavy):
|
Years Ended December 31,
|
||||||||||||||||
|
2015
|
2014
|
|||||||||||||||
|
LPG mix
|
$ | 1,253,826 | 0.6 | % | $ | 705,664 | 0.2 | % | ||||||||
|
Naphtha
|
48,410,299 | 22.0 | % | 89,700,423 | 23.2 | % | ||||||||||
|
Jet fuel
|
67,085,047 | 30.4 | % | 88,479,458 | 22.8 | % | ||||||||||
|
NRLM
|
- | 0.0 | % | 62,729,476 | 16.2 | % | ||||||||||
|
HOBM
|
46,936,751 | 21.3 | % | 49,662,414 | 12.8 | % | ||||||||||
|
Reduced Crude
|
3,838,273 | 1.7 | % | - | 0.0 | % | ||||||||||
|
AGO
|
52,914,392 | 24.0 | % | 96,027,339 | 24.8 | % | ||||||||||
| $ | 220,438,588 | 100.0 | % | $ | 387,304,774 | 100.0 | % | |||||||||
We no longer produce transportation-related diesel fuel products. In May 2014, we ceased production of NRLM, a transportation-related diesel fuel product. In June 2014, we began producing HOBM, a non-transportation lubricant blend product. The shift in product slate from NRLM to HOBM was the result of the Environmental Protection Agency’s (the “EPA’s”) phased-in requirements for small refineries to reduce the sulfur content in transportation-related diesel fuel, such as NRLM, to a maximum of 15 ppm sulfur by June 1, 2014. “Topping units,” like the Nixon Facility, typically lack a desulfurization process unit to lower sulfur content levels within the range required by the EPA’s recently implemented fuel quality standards, and integration of such a unit generally requires additional permitting and significant capital upgrades. We can produce and sell a low sulfur diesel as a feedstock to other refineries and blenders in the U.S. and as a finished petroleum product to other countries.
|
(15)
|
Leases
|
Our company headquarters is located in downtown Houston, Texas. We lease 13,878 square feet of office space, 7,389 square feet of which is used and paid for by LEH. The office lease has a 10 year term expiring in 2017, includes free rent periods and escalating rent payment provisions, and requires payment of a portion of related actual operating expenses. Rent expense is recognized on a straight-line basis. For the years ended December 31, 2015 and 2014, rent expense totaled $142,604 and $98,876, respectively.
64
|
BLUE DOLPHIN ENERGY COMPANY
|
2015 FORM 10-K
|
Notes to Consolidated Financial Statements (Continued)
At December 31, 2015, future minimum lease commitments that were non-cancelable under our office lease were as follow:
|
Years Ending December 31,
|
||||
|
2016
|
$ | 129,417 | ||
|
2017
|
125,182 | |||
| $ | 254,599 | |||
|
(16)
|
Income Taxes
|
Income Tax Benefit (Expense). Our income tax benefit (expense) consisted of the following:
|
Years Ended December 31,
|
||||||||
|
2015
|
2014
|
|||||||
|
Current:
|
||||||||
|
Federal
|
$ | (111,566 | ) | $ | (64,258 | ) | ||
|
State
|
(169,867 | ) | (108,270 | ) | ||||
|
Deferred:
|
||||||||
|
Federal
|
(2,152,869 | ) | 5,760,106 | |||||
| $ | (2,434,302 | ) | $ | 5,587,578 | ||||
The state of Texas has a Texas margins tax (“TMT”), which is a form of business tax imposed on gross margin. Although TMT is imposed on an entity’s gross margin rather than on its net income, certain aspects of TMT make it similar to an income tax.
Effective Tax Rate. Our effective tax rate in 2015 and 2014 was as follows:
|
2015
|
2014
|
|||||||
|
Expected tax rate
|
34.00 | % | 34.00 | % | ||||
|
Permanent differences
|
0.00 | % | 0.00 | % | ||||
|
State tax
|
1.64 | % | 1.06 | % | ||||
|
Federal tax
|
0.01 | % | 0.63 | % | ||||
|
Change in valuation allowance
|
0.00 | % | (90.63 | %) | ||||
| 35.65 | % | (54.94 | %) | |||||
Deferred Income Taxes. Deferred income tax balances reflect the effects of temporary differences between the carrying amounts of assets and liabilities and their tax bases, as well as from NOL carryforwards. We state those balances at the enacted tax rates we expect will be in effect when taxes are actually paid. NOL carryforwards and deferred tax assets represent amounts available to reduce future taxable income.
NOL Carryforwards. Under Section 382 of the Internal Revenue Code of 1986, as amended (“IRC Section 382”), a corporation that undergoes an “ownership change” is subject to limitations on its use of pre-change NOL carryforwards to offset future taxable income. Within the meaning of IRC Section 382, an “ownership change” occurs when the aggregate stock ownership of certain stockholders (generally 5% shareholders, applying certain look-through rules) increases by more than 50 percentage points over such stockholders' lowest percentage ownership during the testing period (generally three years). For income tax purposes, we experienced ownership changes in 2005, in connection with a series of private placements, and in 2012, as a result of a reverse acquisition, that limit the use of pre-change NOL carryforwards to offset future taxable income. In general, the annual use limitation equals the aggregate value of common stock at the time of the ownership change multiplied by a specified tax-exempt interest rate. The 2012 ownership change will subject approximately $18.8 million in NOL carryforwards that were generated prior to the ownership change to an annual use limitation of $638,196 per year. Unused portions of the annual use limitation amount may be used in subsequent years. As a result of the annual use limitation, approximately $6.7 million in NOL carryforwards that were generated prior to the 2012 ownership change will expire unused. NOL carryforwards that were generated after the 2012 ownership change are not subject to an annual use limitation under IRC Section 382 and may be used in addition to available amounts of NOL carryforwards generated prior to the ownership change.
65
|
BLUE DOLPHIN ENERGY COMPANY
|
2015 FORM 10-K
|
Notes to Consolidated Financial Statements (Continued)
NOL carryforwards that remained available for future use were as follow (amounts shown are net of NOLs that will expire unused as a result of the IRC Section 382 limitation):
|
Net Operating Loss Carryforward
|
Total
|
|||||||||||
|
Pre-Ownership NOL
|
Post-Ownership NOL
|
Net Operating Loss Carryforward
|
||||||||||
|
Balance at December 31, 2013
|
$ | 12,087,459 | $ | 11,909,225 | $ | 23,996,684 | ||||||
|
Net operating losses
|
- | 236,564 | 236,564 | |||||||||
|
Net operating loss carryforwards utilized
|
(1,320,547 | ) | - | (1,320,547 | ) | |||||||
|
Balance at December 31, 2014
|
10,766,912 | 12,145,789 | 22,912,701 | |||||||||
|
Net operating loss carryforwards utilized
|
(1,152,463 | ) | (2,528,848 | ) | (3,681,311 | ) | ||||||
| - | ||||||||||||
|
Balance at December 31, 2015
|
$ | 9,614,449 | $ | 9,616,941 | $ | 19,231,390 | ||||||
Deferred Tax Assets and Liabilities. At December 31, 2015 and 2014, approximately $3.6 million and $5.8 million, respectively, of net deferred tax assets remained available for future use. Significant components of deferred tax assets and liabilities were as follow:
|
December 31,
|
||||||||
|
2015
|
2014
|
|||||||
|
Deferred tax assets:
|
||||||||
|
Net operating loss and capital loss carryforwards
|
$ | 8,815,794 | $ | 10,067,144 | ||||
|
Start-up costs (Nixon Facility)
|
1,510,699 | 1,648,036 | ||||||
|
Asset retirement obligations liability/deferred revenue
|
717,723 | 869,821 | ||||||
|
Unrealized hedges
|
62,356 | - | ||||||
|
AMT credit and other
|
302,086 | 85,467 | ||||||
|
Total deferred tax assets
|
11,408,658 | 12,670,468 | ||||||
|
Deferred tax liabilities:
|
||||||||
|
Fair market value adjustments
|
(46,116 | ) | (46,116 | ) | ||||
|
Unrealized hedges
|
- | (168,606 | ) | |||||
|
Basis differences in property and equipment
|
(5,484,983 | ) | (4,425,318 | ) | ||||
|
Total deferred tax liabilities
|
(5,531,099 | ) | (4,640,040 | ) | ||||
|
Deferred tax assets, net
|
5,877,559 | 8,030,428 | ||||||
|
Valuation allowance
|
(2,270,322 | ) | (2,270,322 | ) | ||||
| $ | 3,607,237 | $ | 5,760,106 | |||||
66
|
BLUE DOLPHIN ENERGY COMPANY
|
2015 FORM 10-K
|
Notes to Consolidated Financial Statements (Continued)
Deferred tax assets (liabilities) on a current and noncurrent basis were as follow:
|
December 31,
|
||||||||
|
2015
|
2014
|
|||||||
|
Current deferred tax assets
|
$ | 3,486,746 | $ | (168,237 | ) | |||
|
Noncurrent deferred tax assets, net
|
2,390,813 | 8,198,665 | ||||||
|
Deferred tax assets, net
|
5,877,559 | 8,030,428 | ||||||
|
Valuation allowance
|
(2,270,322 | ) | (2,270,322 | ) | ||||
| $ | 3,607,237 | $ | 5,760,106 | |||||
Valuation Allowance. As of each reporting date, management considers new evidence, both positive and negative, that could impact management’s view with regard to future realization of deferred tax assets. As of December 31, 2015 and 2014, management determined that sufficient positive evidence existed to conclude that it was more likely than not that net deferred tax assets of approximately $3.6 million and $5.8 million, respectively, were realizable, and as a result, reflected a valuation allowance accordingly.
Uncertain Tax Positions. We have adopted the provisions of the FASB ASC guidance on accounting for uncertainty in income taxes. The guidance clarifies the accounting for uncertainty in income taxes recognized in an enterprise’s financial statements. The guidance also prescribes a recognition threshold and measurement attribute for the financial statement recognition and measurement of a tax position taken or expected to be taken in a tax return. The standard also provides guidance on de-recognition, classification, interest and penalties, accounting in interim periods, disclosure and transition.
As part of this guidance, we record income tax related interest and penalties, if applicable, as a component of the provision for income tax benefit (expense). However, there were no amounts recognized relating to interest and penalties in the consolidated statements of income for the years ended December 31, 2015 and 2014. Furthermore, none of our federal and state income tax returns are currently under examination by the Internal Revenue Service (“IRS”) or state authorities. As of December 31, 2015, calendar years 2012 and later remain subject to examination by the IRS and fiscal years 2011 and later remain subject to examination by the state of Texas. We believe there are no uncertain tax positions for both federal and state income taxes.
|
(17)
|
Earnings Per Share
|
The following table provides reconciliation between basic and diluted income per share:
|
Years Ended December 31,
|
||||||||
|
2015
|
2014
|
|||||||
|
Net income
|
$ | 4,403,239 | $ | 15,758,756 | ||||
|
Basic and diluted income per share
|
$ | 0.42 | $ | 1.51 | ||||
|
Basic and Diluted
|
||||||||
|
Weighted average number of shares of common stock
|
||||||||
|
outstanding and potential dilutive shares of common stock
|
10,451,832 | 10,441,464 | ||||||
Diluted EPS is computed by dividing net income available to common stockholders by the weighted average number of shares of common stock outstanding. Diluted EPS for the years ended December, 2015 and 2014 was the same as basic EPS as there were no stock options or other dilutive instruments outstanding.
67
|
BLUE DOLPHIN ENERGY COMPANY
|
2015 FORM 10-K
|
Notes to Consolidated Financial Statements (Continued)
|
(18)
|
Fair Value Measurement
|
We have determined the fair value of certain assets and liabilities through the application of fair value measurements and disclosures, which establish a framework for measuring fair value. We are subject to gains or losses on certain financial assets based on our various agreements and understandings with Genesis. Pursuant to these agreements and understandings, Genesis may execute the purchase and sale of certain financial instruments for the purpose of economically hedging certain commodity price risks associated with our refined petroleum products and, over time, this program may also include mitigating certain risks associated with the purchase of crude oil and condensate. These financial instruments are direct contractual obligations of Genesis and not us. However, under our agreement with Genesis, we financially benefit from any gains and financially bear any losses associated with the purchase and/or sale of such financial instruments by Genesis. Because such instruments represent embedded derivatives for the purpose of financial reporting, we account for such embedded derivatives in our financial records by utilizing the market approach when measuring fair value of our financial instruments (typically in current assets and/or liabilities, as discussed below). The market approach uses prices and other relevant information generated by such market transactions executed on our behalf involving identical or comparable assets or liabilities.
Generally accepted accounting principles establish a framework for measuring the fair value. That framework provides a fair value hierarchy that prioritizes the inputs to valuation techniques used to measure fair value. The hierarchy gives the highest priority to unadjusted quoted prices in active markets for identical assets or liabilities (Level 1 measurements) and the lowest priority to unobservable inputs (Level 3 measurements). The fair value hierarchy consists of the following three levels:
|
Level 1
|
Inputs are quoted prices (unadjusted) in active markets for identical assets or liabilities.
|
|
Level 2
|
Inputs are quoted prices for similar assets or liabilities in an active market, quoted prices for identical or similar assets or liabilities in markets that are not active, inputs other than quoted prices that are observable and market-corroborated inputs, which are derived principally from or corroborated by observable market data.
|
|
Level 3
|
Inputs are derived from valuation techniques in which one or more significant inputs or value drivers are unobservable and cannot be corroborated by market data or other entity-specific inputs.
|
The carrying amounts of accounts receivable, accounts payable, and accrued liabilities approximated their fair values at December 31, 2015 and 2014 due to their short-term maturities. The fair value of our short and long-term debt at December 31, 2015 and 2014 was $37,172,668 and $12,054,279, respectively. The fair value of our debt was determined using a Level 3 hierarchy.
Remainder of Page Intentionally Left Blank
68
|
BLUE DOLPHIN ENERGY COMPANY
|
2015 FORM 10-K
|
Notes to Consolidated Financial Statements (Continued)
The following table represents our assets and liabilities measured at fair value on a recurring basis as of December 31, 2015 and 2014 and the basis for the measurement:
|
Fair Value Measurement at December 31, 2015 Using
|
||||||||||||||||
|
Financial assets (liabilities):
|
Carrying Value at December 31, 2015
|
Quoted Prices in Active Markets for Identical Assets or Liabilities
(Level 1)
|
Significant Other Observable Inputs (Level 2)
|
Significant Unobservable Inputs (Level 3)
|
||||||||||||
|
Commodity contracts
|
$ | (183,400 | ) | $ | (183,400 | ) | $ | - | $ | - | ||||||
|
Fair Value Measurement at December 31, 2014 Using
|
||||||||||||||||
|
Financial assets (liabilities):
|
Carrying Value at December 31, 2014
|
Quoted Prices in Active Markets for Identical Assets or Liabilities
(Level 1)
|
Significant Other Observable Inputs (Level 2)
|
Significant Unobservable Inputs (Level 3)
|
||||||||||||
|
Commodity contracts
|
$ | 495,900 | $ | 495,900 | $ | - | $ | - | ||||||||
Carrying amounts of commodity contracts executed by Genesis are reflected as other current assets or other current liabilities in our consolidated balance sheets.
|
(19)
|
Inventory Risk Management
|
Under our inventory risk management policy, Genesis may, but is not required to, use commodity futures contracts to mitigate the change in value for certain of our refined petroleum product inventories subject to market price fluctuations in our inventory. The physical inventory volumes are not exchanged, and these contracts are net settled by Genesis with cash.
The fair value of these contracts is reflected in our consolidated balance sheets and the related net gain or loss is recorded within cost of refined products sold in our consolidated statements of income. Quoted prices for identical assets or liabilities in active markets (Level 1) are considered to determine the fair values for the purpose of marking to market the financial instruments at each period end.
Commodity transactions are executed by Genesis to minimize transaction costs, monitor consolidated net exposures, and allow for increased responsiveness to changes in market factors. Genesis may, but is not required to, initiate an economic hedge on our refined petroleum products when our inventory levels exceed targeted levels (currently 1.5 days production). Although the decision to enter into a futures contract is made solely by Genesis, Genesis typically confers with management as part of Genesis’ decision making process.
Due to mark-to-market accounting during the term of the commodity contracts, significant unrealized non-cash net gains and losses could be recorded in our results of operations. Additionally, Genesis may be required to collateralize any mark-to-market losses on outstanding commodity contracts.
69
|
BLUE DOLPHIN ENERGY COMPANY
|
2015 FORM 10-K
|
Notes to Consolidated Financial Statements (Continued)
As of December 31, 2015, we had the following obligations based on futures contracts of refined petroleum products and crude oil that were entered into as economic hedges through Genesis. The information presents the notional volume of open commodity instruments by type and year of maturity (volumes in barrels):
|
Notional Contract Volumes by Year of Maturity
|
||||||||||||
|
Inventory positions (futures):
|
2015
|
2016
|
2017
|
|||||||||
|
Refined petroleum products and crude oil -
|
||||||||||||
|
net short positions
|
235,000 | - | - | |||||||||
The following table provides the location and fair value amounts of derivative instruments that are reported in our consolidated balance sheets at December 31, 2015 and 2014:
|
Fair Value
|
||||||||||
|
December 31,
|
||||||||||
|
Asset Derivatives
|
Balance Sheets Location
|
2015
|
2014
|
|||||||
|
|
||||||||||
|
Commodity contracts
|
Prepaid expenses and other current
assets (accrued expenses and other |
$ | (183,400 | ) | $ | 495,900 | ||||
The following table provides the effect of derivative instruments in our consolidated statements of income for the years ended December 31, 2015 and 2014:
| Gain (Loss) Recognized | ||||||||||
|
Years Ended December 31,
|
||||||||||
|
Derivatives
|
Statements of Operations Location
|
2015
|
2014
|
|||||||
|
Commodity contracts
|
Cost of refined products sold
|
$ | 3,730,613 | $ | 3,816,871 | |||||
|
(20)
|
Commitments and Contingencies
|
Operating Agreement. See “Note (9) Accounts Payable, Related Party” of this Annual Report for additional disclosures related to the Operating Agreement.
Genesis Agreements. We were previously subject to three agreements with Genesis and its affiliates. Under the Construction and Funding Agreement, Milam committed funding for the Nixon Facility’s start-up refurbishment. Payments under the Construction and Funding Agreement began in the first quarter of 2012, when the Nixon Facility was placed in service. As a result of our repayment of amounts due to Milam under the Construction and Funding Agreement in May 2014, we now receive up to 80% of the Gross Profits as our Profit Share under the Joint Marketing Agreement, which is described below. Our relationship with Genesis and its affiliates is currently governed by two agreements, as follows:
Crude Supply Agreement. Under the Crude Supply Agreement, GEL is our exclusive supplier of crude oil and condensate. We have the ability to purchase crude oil and condensate from other suppliers with the prior consent of GEL. GEL supplies crude oil and condensate to us at cost plus freight expense and any costs associated with GEL’s hedging. All crude oil and condensate supplied to us pursuant to the Crude Supply Agreement is paid for pursuant to the terms of the Joint Marketing Agreement as described above. In addition, GEL has a first right of refusal to use three petroleum storage tanks at the Nixon Facility during the term of the Crude Supply Agreement. Subject to certain termination rights, the Crude Supply Agreement had an initial term of three years expiring in August 2014. In accordance with the terms of the October 2013 Letter Agreement, we agreed not to terminate the Crude Supply Agreement and GEL agreed to automatically renew the Crude Supply Agreement at the end of the initial term for successive one year periods until August 2019, unless sooner terminated by GEL with 180 days prior written notice; and
70
|
BLUE DOLPHIN ENERGY COMPANY
|
2015 FORM 10-K
|
Notes to Consolidated Financial Statements (Continued)
Joint Marketing Agreement. Under the Joint Marketing Agreement, we, together with GEL, jointly market and sell the output produced at the Nixon Facility and share the Gross Profits (as defined below) from such sales. GEL is responsible for all product transportation scheduling; we are responsible for entering into contracts with customers for the purchase and sale of output produced at the Nixon Facility and handling all billing and invoicing relating to the same. All payments for the sale of output produced at the Nixon Facility are made directly to GEL as collection agent and all customers must satisfy GEL’s customer credit approval process. Subject to certain amendments and clarifications (as described below), the Joint Marketing Agreement also provides for the sharing of “Gross Profits” (defined as the total revenue from the sale of output from the Nixon Facility minus the cost of crude oil and condensate pursuant to the Crude Supply Agreement). As a result of our repayment of amounts due to Milam under the Construction and Funding Agreement in May 2014, certain aspects related to the distribution of Gross Profits under the Joint Marketing Agreement no longer apply. Key applicable provisions are as follows:
|
-
|
We are entitled to receive weekly payments to cover direct expenses in operating the Nixon Facility (the “Operations Payments”) in an amount not to exceed $750,000 per month plus the amount of any accounting fees, if incurred, not to exceed $50,000 per month. We assigned our rights to weekly payments and reimbursement of accounting fees under the Joint Marketing Agreement to LEH pursuant to the Operating Agreement. If Gross Profits are insufficient to cover Operations Payments, then GEL may: (i) reduce Operations Payments by an amount representing the difference between the Operations Payments and the Gross Profits for such monthly period, or (ii) provide the Operations Payments with such Operations Payments being considered deficit amounts owing to GEL. If Gross Profits are negative, then we are not entitled to receive Operations Payments and GEL may recoup any losses sustained by a special allocation of 80% of Gross Profits until such losses are covered in full, after which the prevailing Gross Profits allocation shall be reinstated; and
|
|
-
|
GEL is entitled to receive an administrative fee in the amount of $150,000 per month relating to the performance of its obligations under the Joint Marketing Agreement (the “Performance Fee”). GEL shall be paid 30% of the remaining Gross Profit up to $600,000 (the “Threshold Amount”) as the GEL Profit Share and we shall be paid 70% of the remaining Gross Profit as our Profit Share. Any amount of remaining Gross Profit that exceeds the Threshold Amount for such calendar month shall be paid to GEL and us in the following manner: (i) GEL shall be paid 20% of the remaining Gross Profits over the Threshold Amount as the GEL Profit Share and (ii) we shall be paid 80% of the remaining Gross Profits over the Threshold Amount as the our Profit Share. The GEL Profit Share plus the Performance Fee are collectively referred to in this Annual Report as the Joint Marketing Agreement Profit Share (the “JMA Profit Share”).
|
The Joint Marketing Agreement contains negative covenants that restrict our actions under certain circumstances. For example, we are prohibited from making any modifications to the Nixon Facility or entering into any contracts with third-parties that would materially affect or impair GEL’s or its affiliates’ rights under the agreements set forth above. The Joint Marketing Agreement had an initial term of three years expiring in August 2014. In accordance with the terms of the October 2013 Letter Agreement, we agreed not to terminate the Joint Marketing Agreement and GEL agreed to automatically renew the Joint Marketing Agreement at the end of the initial term for successive one year periods until August 2019, unless sooner terminated by GEL with 180 days prior written notice.
Pursuant to a Letter Agreement Regarding Subordination of GEL Transaction Documents dated in June 2015, we, among other things, assigned our rights to payments under the Crude Supply Agreement and Joint Marketing Agreement as collateral in favor of Sovereign Bank, a Texas state bank (“Sovereign”), as lender and lienholder pursuant to that certain Loan and Security Agreement between us and Sovereign dated in June 2015 in the principal amount of $25.0 million (the “Term Loan Due 2034”). See “Part II, Item 8. Financial Statements and Supplementary Data - Note (12) Long-Term Debt” of this Annual Report for further discussion related to the Term Loan Due 2034.
FLNG Master Easement Agreement. Pursuant to a Master Easement Agreement dated in December 2013, we provide FLNG Land II, Inc., a Delaware corporation (“FLNG”) with: (i) uninterrupted pedestrian and vehicular ingress and egress to and from State Highway 332, across certain of our property to certain property of FLNG (the “Access Easement”) and (ii) a pipeline easement and right of way across certain of our property to certain property owned by FLNG (the “Pipeline Easement” and together with the Access Easement, the “Easements”). Under the agreement, FLNG will make payments to us in the amount of $500,000 in October of each year through 2019. Thereafter, FLNG will make payments to us in the amount of $10,000 in October of each year for so long as FLNG desires to use the Access Easement.
71
|
BLUE DOLPHIN ENERGY COMPANY
|
2015 FORM 10-K
|
Notes to Consolidated Financial Statements (Continued)
Supplemental Pipeline Bonds. In order to cover the various obligations of lessees and rights-of-way holders operating in federal waters of the Gulf of Mexico, the Bureau of Ocean Energy Management (the “BOEM”) generally requires that lessees and rights-of-way holders demonstrate financial strength and reliability according to regulations or post bonds or other acceptable assurances that such obligations will be satisfied, unless the BOEM exempts the lessee or rights-of-way holder from such financial assurance requirements. Such obligations include the cost of plugging and abandoning wells and decommissioning and removing platforms and pipelines at the end of production or service activities. Once plugging and abandonment work has been completed, the collateral backing the financial assurance is released by the BOEM.
In August 2014, the BOEM issued an Advanced Notice of Proposed Rulemaking outlining proposed changes to financial assurance requirements in order to modernize financial assurance and risk management and better address potential costs and liabilities of offshore energy development. Part of the Advanced Notice of Proposed Rulemaking includes the BOEM revising its supplemental bonding procedures by shifting from the current “waiver” model for self-insurance to a credit based model. Following a public comment period, the BOEM plans to publish a revised notice to lessees in 2016 that will outline new financial assurance requirements.
In August 2015, we received a letter from the BOEM requiring additional supplemental bonds or acceptable financial assurance of approximately $4.2 million for existing pipeline rights-of-way. We are currently working with the BOEM to develop a tailored plan to address the financial assurance requirements. There can be no assurance that the BOEM will accept a reduced amount of supplemental financial assurance or not require additional supplemental pipeline bonds related to our existing pipeline rights-of-way.
At December 31, 2015, we maintained approximately $0.9 million in credit and cash-backed rights-of-way bonds issued to the BOEM. At December 31, 2014, we maintained approximately $1.6 million in credit and cash-backed rights-of-way bonds issued to the BOEM. In December 2014, we completed work to abandon-in-place the pipeline associated with Right-of-Way Number OCS-G 08606. As a result, in November 2015, the BOEM released approximately $0.7 million in cash collateral backing this supplemental pipeline bond.
Financing Agreements. See “Note (12) Long-Term Debt” of this Annual Report for additional disclosures related to financing agreements.
Grynberg Settlement Agreement. New developments in a nearly two decades-old case involving Jack J. Grynberg and several defendants in the oil and gas industry, including Blue Dolphin Pipe Line Company (the “Grynberg Matter”), resulted in a final Mutual Release Agreement and Withdrawal of All Qui Tam Claims (the “Grynberg Settlement Agreement”) dated October 2015. The Grynberg Settlement Agreement provided for a settlement in the amount of $725,073 (the “Settlement Amount”). The Settlement Amount represented 50% of a $1,371,723 November 2006 summary judgment in our favor plus 1.5% interest. We received the Settlement Amount in October 2015. Based on management’s assessment, we recognized a net gain of $660,000 in other income from the Grynberg Matter (the Settlement Amount less additional legal fees of approximately $65,000).
Nixon Facility Expansion. We have made and continue to make capital and efficiency improvements to the Nixon Facility. As a result, we have incurred and will continue to incur capital expenditures related to these improvements, which include, among other things, facility and land improvements and construction of additional petroleum storage tanks.
Legal Matters. From time to time we are subject to various lawsuits, claims, mechanics liens, and administrative proceedings that arise out of the normal course of business. Management does not believe that liens, if any, will have a material adverse effect on our results of operations.
Health, Safety and Environmental Matters. All of our operations and properties are subject to extensive federal, state, and local environmental, health, and safety regulations governing, among other things, the generation, storage, handling, use and transportation of petroleum and hazardous substances; the emission and discharge of materials into the environment; waste management; characteristics and composition of jet fuel and other products; and the monitoring, reporting and control of greenhouse gas emissions. Our operations also require numerous permits and authorizations under various environmental, health, and safety laws and regulations. Failure to obtain and comply with these permits or environmental, health, or safety laws generally could result in fines, penalties or other sanctions, or a revocation of our permits.
72
|
BLUE DOLPHIN ENERGY COMPANY
|
2015 FORM 10-K
|
ITEM 9. CHANGES IN AND DISAGREEMENTS WITH ACCOUNTANTS ON ACCOUNTING AND FINANCIAL DISCLOSURE
None.
ITEM 9A. CONTROLS AND PROCEDURES
Disclosure Controls and Procedures
Disclosure controls and procedures are controls and other procedures that are designed to ensure that information required to be disclosed by us in the reports we file or submit under the Securities Exchange Act of 1934, as amended (the “Exchange Act”) is recorded, processed, summarized and reported within the time periods specified by SEC rules and forms. Disclosure controls and procedures include, without limitation, controls and procedures designed to ensure that information required to be disclosed by us in the reports we file or submit under the Exchange Act is accumulated and communicated to management, including the Chief Executive Officer (principal executive officer) and the Chief Financial Officer (principal financial officer), as appropriate to allow timely decisions regarding required disclosure. Under the supervision of, and with the participation of our management, including our Chief Executive Officer (principal executive officer) and Chief Financial Officer (principal financial officer), we conducted an evaluation of the effectiveness of our disclosure controls and procedures, as defined in Rules 13a-15(e) and 15d-15(e) under the Exchange Act, as of the end of the period covered by this Annual Report. Based on our evaluation, our Chief Executive Officer (principal executive officer) and Chief Financial Officer (principal financial officer) concluded that our disclosure controls and procedures were effective as of the end of the period covered by this report to ensure that information required to be disclosed by us in reports that we file or submit under the Exchange Act, are recorded, processed, summarized and reported within the time periods specified in the SEC’s rules and forms.
Management’s Report on Internal Control over Financial Reporting
Management’s Responsibility. Management is responsible for establishing and maintaining adequate internal control over financial reporting, as such term is defined in Rules 13a-15(f) and 15d-15(f) under the Exchange Act. A company’s internal control over financial reporting is a process designed to provide reasonable assurance regarding the reliability of financial reporting and the preparation of financial statements for external purposes in accordance with generally accepted accounting principles in the United States.
Because of its inherent limitations, internal control over financial reporting may not prevent or detect misstatements. Also, projections of any evaluation of effectiveness to future periods are subject to the risk that controls may become inadequate because of changes in conditions, or that the degree of compliance with the policies or procedures may deteriorate.
Management’s Assessment. Management, under the supervision and with the participation of our Chief Executive Officer (principal executive officer) and Chief Financial Officer (principal financial officer), assessed the effectiveness of our internal controls over financial reporting as of December 31, 2015. In making this assessment, management used the criteria set forth by the Committee of Sponsoring Organizations of the Treadway Commission in Internal Control —Integrated Framework (1992). In connection with such evaluation, management concluded that our internal controls over financial reporting was effective as of December 31, 2015.
Changes in Internal Control over Financial Reporting. During 2015, we took a number of steps to fully remediate previously identified material weakness related to a lack of formally documented accounting policies and procedures. Specifically, we:
|
·
|
developed and implemented a monthly accounting close checklist;
|
|
·
|
instituted a formal process to ensure manual journal entries are reviewed and approved by someone other than the preparer;
|
|
·
|
developed a written capitalization policy for fixed assets and reviewed the policy with our external tax consultant;
|
73
|
BLUE DOLPHIN ENERGY COMPANY
|
2015 FORM 10-K
|
|
·
|
created a framework to document our internal controls, developed a plan for current year testing, and completed phase one testing of our internal controls framework; and
|
|
·
|
reported internal control testing results to the Audit Committee of the Board.
|
Exemption from Management's Report on Internal Control over Financial Reporting. This Annual Report does not include an attestation report of our registered public accounting firm regarding internal control over financial reporting. Management’s report was not subject to attestation by our registered public accounting firm pursuant to rules of the SEC that permit us to provide only management’s report in this Annual Report.
ITEM 9B. OTHER INFORMATION
None.
Remainder of Page Intentionally Left Blank
74
|
BLUE DOLPHIN ENERGY COMPANY
|
2015 FORM 10-K
|
PART III
ITEM 10. DIRECTORS, EXECUTIVE OFFICERS AND CORPORATE GOVERNANCE
Structure and Management
We are currently controlled by Lazarus Energy Holdings, LLC (“LEH”), which owns approximately 81% of our Common Stock. LEH manages and operates all of our properties pursuant to an Operating Agreement. Jonathan P. Carroll is Chairman of the Board, Chief Executive Officer and President of Blue Dolphin, as well as a majority owner of LEH. Under the Operating Agreement, LEH provides us with personnel, among other services, in capacities equivalent to Chief Executive Officer and Chief Financial Officer.
Board Composition
The amended and restated bylaws of Blue Dolphin provide that the Board shall consist of five members, with the precise number to be determined from time to time by the Board, except that no decrease in the number shall have the effect of shortening the term of an incumbent director. The Board currently has five directors, each serving until the next annual meeting of stockholders to be held by Blue Dolphin. The following sets forth, as of March 30, 2016, each director’s name, age, principal occupation and directorships during the past five (5) years, as well as their relevant knowledge and experience that led to their appointment to the Board:
|
Name, Age
Principal Occupation and Directorships During Past 5 Years
|
Knowledge and Experience
|
|
|
Jonathan P. Carroll, 54
Blue Dolphin Energy Company
Chairman of the Board (since 2014)
Chief Executive Officer, President,
Assistant Treasurer and Secretary (since 2012)
Lazarus Energy Holdings, LLC (“LEH”)
Majority Owner and President (since 2006)
LEH owns approximately 81% of our outstanding Common Stock.
Mr. Carroll has served on Blue Dolphin’s Board since 2014. He is currently Chairman of the Board. Since 2004, he has served on the Board of Trustees of the Salient Fund Group, and has served on the compliance, audit and nominating committees of several of Salient’s private and public closed-end and mutual funds. Mr. Carroll previously served on the Board of Directors of the General Partner of LRR Energy, L.P. (NYSE: LRE) from January 2014 until its merger with Vanguard Natural Resources, LLC in October 2015.
|
Mr. Carroll earned a Bachelor of Arts degree in Human Biology and a Bachelor of Arts degree in Economics from Stanford University, and he completed a Directed Reading in Economics at Oxford University. Based on his educational and professional experiences, Mr. Carroll possesses particular knowledge and experience in business management, finance and business development that strengthen the Board’s collective qualifications, skills and experience.
|
|
Ryan A. Bailey, 40
Children’s Health System of Texas
Head of Investments (since 2014)
The Meadows Foundation
Investment Officer/Interim Chief Investment Officer (2006 to 2014)
Mr. Bailey was appointed to Blue Dolphin’s Board in November 2015. He is currently a member of the Audit and Compensation Committees, as well as a member of the Special Committee on MLP Conversion. He also serves as an advisor and mentor to Texas Wall Street Women and Chartered Alternative Investment Analysis Association (Dallas Chapter) -- non-profit member organizations.
|
Mr. Bailey earned a Bachelor of Arts in Economics from Yale University and completed a graduate course in tax planning from the Yale School of Management. He holds professional credentialing as a Chartered Financial Analysist (CFA), Financial Risk Manager (FRM), Chartered Alternative Investment Analyst (CAIA) and Chartered Market Technician (CMT). Based on his educational and professional experiences, Mr. Bailey possesses particular knowledge and experience in finance, financial analysis and modeling, investment management, risk assessment and strategic planning that strengthen the Board’s collective qualifications, skills and experience.
|
75
|
BLUE DOLPHIN ENERGY COMPANY
|
2015 FORM 10-K
|
|
Name, Age
Principal Occupation and Directorships During Past 5 Years
|
Knowledge and Experience
|
|
|
Amitav Misra, 38
Cardinal Advisors
Founding Partner (since 2014)
Taxa, Inc.
President, Director and Chief Operating Officer (2011 to 2012)
Private Investment Partnership
Partner (2007 to 2011)
Mr. Misra has served on Blue Dolphin’s Board since 2014. He is currently a member of the Audit and Compensation Committees, as well as a member of the Special Committee on MLP Conversion. Mr. Misra serves as an advisor to several start-up companies and as a mentor to SURGE Accelerator.
|
Mr. Misra earned a Bachelor of Arts in Economics from Stanford University. He holds Series 63 (Uniform Securities Agent State Law) and Series 79 (Investment Banking Representative) securities licenses. Mr. Misra possesses particular knowledge and experience in economics, business development, private equity, and strategic planning that strengthen the Board’s collective qualifications, skills and experience.
|
|
|
Christopher T. Morris, 54
Tatum (a Randstad Company)
New York Managing Partner (since 2013)
MPact Partners LLC
President (2011 to 2013)
Freddie Mac
Vice President (various divisions) (2000 to 2010)
Mr. Morris has served on Blue Dolphin’s Board since 2012; he is currently Chairman of the Audit and Compensation Committees, as well as Chairman of the Special Committee on MLP Conversion.
|
Mr. Morris earned a Bachelor of Arts in Economics from Stanford University and a Masters in Business Administration from the Harvard Business School. Based on his educational and professional experiences, Mr. Morris possesses particular knowledge and experience in business management, finance, strategic planning and business development that strengthen the Board’s collective qualifications, skills and experience.
|
|
|
Herbert N. Whitney, 75
Wildcat Consulting, LLC
Founder and President (since 2006)
Mr. Whitney has served on Blue Dolphin’s Board since 2012. He previously served on the Board of Directors of Blackwater Midstream Corporation, the Advisory Board of Sheetz, Inc., as Chairman of the Board of Directors of Colonial Pipeline Company, and as Chairman of the Executive Committee of the Association of Oil Pipelines.
|
Mr. Whitney has more than 40 years of experience in pipeline operations, crude oil supply, product supply, distribution and trading, as well as marine operations and logistics having served as the President of CITGO Pipeline Company and in various general manager positions at CITGO Petroleum Corporation. He earned his Bachelor of Science in Civil Engineering from Kansas State University. Based on his educational and professional experiences, he possesses extensive knowledge in the supply and distribution of crude oil and petroleum products, which strengthens the Board’s collective qualifications, skills and expertise.
|
Remainder of Page Intentionally Left Blank
76
|
BLUE DOLPHIN ENERGY COMPANY
|
2015 FORM 10-K
|
Executive Officers
The following sets forth, as of March 30, 2016, the name and age of each executive officer, as well as their principal occupation during the past five (5) years:
|
Name
|
Position
|
Since
|
Age
|
|||
|
Jonathan P. Carroll
|
Chief Executive Officer, President, Assistant Treasurer, and Secretary
|
2014
|
54
|
|||
|
Tommy L. Byrd
|
Chief Financial Officer
|
2015
|
58
|
|||
|
Treasurer and Assistant Secretary
|
2012
|
Jonathan P. Carroll was appointed Chairman of the Board of Blue Dolphin in 2014, and he was appointed Chief Executive Officer, President, Assistant Treasurer and Secretary of Blue Dolphin in 2012. He is also majority owner and President of LEH. LEH owns approximately 81% of Blue Dolphin’s Common Stock. Before founding LEH, Mr. Carroll was a private investor focused on direct debt and equity investments, primarily in distressed assets. Since 2004, he has served on the Board of Trustees of Salient Fund Group, and has served on the compliance, audit and nominating committees of several of Salient’s private and public closed-end and mutual funds. Mr. Carroll previously served on the Board of Directors of the General Partner of LRR Energy, L.P. (NYSE: LRE) from January 2014 until its merger with Vanguard Natural Resources, LLC in October 2015. He earned a Bachelor of Arts degree in Human Biology and a Bachelor of Arts degree in Economics from Stanford University, and he completed a Directed Reading in Economics at Oxford University.
Tommy L. Byrd was appointed Chief Financial Officer of Blue Dolphin in November 2015 having previously served as Interim Chief Financial Officer from 2012 through November 2015 and as Controller from 2011 to 2012. Mr. Byrd also serves as Treasurer and Assistant Secretary of Blue Dolphin, positions for which he was appointed in 2012. He earned a Bachelor of Business Administration in Accounting from Stephen F. Austin State University. Mr. Byrd has extensive financial management, accounting and internal audit experience in the energy industry.
Family Relationships between Directors and Officers
As of March 30, 2016, there were no family relationships between any of our directors or executive officers.
Committees and Meetings of the Board
Board
The Board consists of Messrs. Carroll, Bailey, Misra, Morris and Whitney with Mr. Carroll serving as Chairman. During 2015, the Board held two (2) regular meetings. Each director attended at least 75% of the total number of meetings of the Board and committees on which he served. The Board has two standing committees, the Audit Committee and the Compensation Committee. In February 2013, the Board formed a Special Committee of the Board to oversee a potential conversion of Blue Dolphin from a Delaware “C” corporation to a Delaware MLP.
Audit Committee
The Audit Committee consists of Messrs. Morris, Bailey, and Misra with Mr. Morris serving as Chairman. During 2015, the Audit Committee met four (4) times. The Board has affirmatively determined that all members of the Audit Committee are independent and that Messrs. Morris and Bailey qualify as Audit Committee Financial Experts. The Audit Committee's duties include overseeing financial reporting and internal control functions. The Audit Committee’s written charter is available on our corporate website (http://www.blue-dolphin-energy.com).
77
|
BLUE DOLPHIN ENERGY COMPANY
|
2015 FORM 10-K
|
Compensation Committee
The Compensation Committee consists of Messrs. Morris, Bailey, and Misra with Mr. Morris serving as Chairman. During 2015, the Compensation Committee did not meet. The Board has affirmatively determined that all members of the Compensation Committee are independent. The Compensation Committee’s duties include setting and overseeing our compensation policies, as well as reviewing and recommending to the Board for its approval all compensation for the Chief Executive Officer, other senior executives, and directors. The Compensation Committee’s written charter is available on our corporate website (http://www.blue-dolphin-energy.com).
Master Limited Partnership ("MLP") Conversion Special Committee
The MLP Conversion Special Committee consists of Messrs. Morris, Bailey, and Misra with Mr. Morris serving as Chairman. The MLP Conversion Special Committee did not meet during 2015. The Board has affirmatively determined that all current members of the MLP Conversion Special Committee are independent. The MLP Conversion Special Committee was formed by the Board in February 2013 to begin a strategic review of the feasibility of optimizing stockholder value by converting Blue Dolphin from a publicly traded “C” corporation to a publicly traded MLP. Upon completion of its review, the MLP Conversion Special Committee will make a recommendation to the Board. There can be no assurance that the MLP Conversion Special Committee’s review will result in the proposal for or subsequent completion of a corporate reorganization of Blue Dolphin.
Nominating Committee
Given the size of the Board, the Board adopted a “Board Nomination Procedures” policy in lieu of appointing a standing nominating committee. The policy is used by independent members of the Board when choosing nominees to stand for election. The Board will consider for possible nomination qualified nominees recommended by stockholders. As addressed in the “Board Nomination Procedures” policy, the manner in which independent directors evaluate nominees for director as recommended by a stockholder is the same as that for nominees received from other sources.
The Board endeavors to nominate qualified directors that will make important contributions to the Board and to Blue Dolphin. The Board generally requires that nominees be persons of sound ethical character, be able to represent all stockholders fairly, have demonstrated professional achievements, have meaningful experience, and have a general appreciation of the major business issues facing Blue Dolphin. The Board also considers issues of diversity and background in its selection process, recognizing that it is desirable for its membership to have differences in viewpoints, professional experiences, educational backgrounds, skills, race, gender, age and national origin.
Corporate Governance
Leadership Structure
Blue Dolphin is led by Jonathan P. Carroll, who has served as Chairman of the Board since 2014 and as our Chief Executive Officer and President since 2012. Having a single leader is commonly utilized by other public companies in the U.S., and we believe it is effective for Blue Dolphin as well. This leadership structure demonstrates to our personnel, customers and stockholders that we are under strong leadership, with a single person setting the tone and having primary responsibility for managing our operations, and eliminates the potential for confusion or duplication of efforts. We do not believe that appointing an independent Board chairman, or a permanent lead director, would improve the performance of the Board.
Risk Oversight
Our Board is actively involved in overseeing Blue Dolphin’s risk management. Presentations by management to the Board include consideration of the challenges and risks to our business, and the Board and management actively engage in discussion on these topics. Furthermore, the two standing Board committees provide appropriate risk oversight. The Audit Committee oversees the accounting and financial reporting processes, as well as compliance, internal control, legal and risk matters. The Compensation Committee oversees compensation policies, including the approval of compensation for directors and management. We believe that the processes established to report and monitor systems for material risks applicable to us are appropriate and effective.
78
|
BLUE DOLPHIN ENERGY COMPANY
|
2015 FORM 10-K
|
Code of Ethics and Code of Conduct
In compliance with the Sarbanes-Oxley Act of 2002, the Board adopted a code of ethics policy in 2003 and a code of conduct policy in 2005. The Audit Committee established procedures to enable anyone who has a concern about our conduct, policies, accounting, internal controls over financial reporting, and/or auditing matters to communicate that concern directly to the Chairman of the Audit Committee. The code of ethics and code of conduct policies are available to any stockholder, without charge, upon written request to Blue Dolphin Energy Company, Attention: Audit Committee Chairman, 801 Travis Street, Suite 2100, Houston, Texas 77002. Our code of ethics and code of conduct policies are available on our website (http://www.blue-dolphin-energy.com). Any amendments or waivers to provisions of our code of ethics and code of conduct policies will be incorporated in revised policies as posted on our website.
Communicating with Directors
As the Board does not receive a large volume of correspondence from stockholders, there is no formal process by which stockholders can communicate directly with the Board at this time. Instead, any stockholder who desires to contact the Board or specific members of the Board may do so by writing to: Blue Dolphin Energy Company, Attention: Secretary for the Board, 801 Travis Street, Suite 2100, Houston, Texas 77002. Currently, all communications addressed in such manner are sent directly to the indicated directors. In the future, if the Board adopts a formal process for determining how communications are to be relayed to directors, that process will be disclosed on Form 8-K as filed with the SEC.
ITEM 11. EXECUTIVE COMPENSATION
Executive Compensation Policy and Procedures
LEH manages and operates all of our properties pursuant to an Operating Agreement (the “Operating Agreement”). Under the Operating Agreement, LEH provides us with personnel, among other services, in capacities equivalent to Chief Executive Officer and Chief Financial Officer. All Blue Dolphin personnel work for and are paid directly by LEH. Blue Dolphin is billed at cost by LEH for certain personnel associated with Blue Dolphin Pipe Line Company, a wholly owned subsidiary of Blue Dolphin.
Compensation for Named Executives
Pursuant to the Operating Agreement, compensation paid to our principal executive officer, principal financial officer, and the most highly compensated executive officers other than the principal executive officer and principal financial officer whose annual salary exceeded $100,000 in the fiscal year ended December 31, 2015 (collectively, the “Named Executive Officers”) for services rendered to Blue Dolphin follows:
SUMMARY COMPENSATION TABLE
|
Name and Principal Position
|
Year
|
Salary
|
Option Awards
|
Total
|
|||||||||
|
Jonathan P. Carroll
|
|||||||||||||
|
Chief Executive Officer and President
|
2015
|
$ | - | $ | - | $ | - | ||||||
|
2014
|
$ | - | $ | - | $ | - | |||||||
|
Tommy L. Byrd(1)
|
|||||||||||||
|
Chief Financial Officer
|
2015
|
$ | 100,000 | $ | - | $ | 100,000 | ||||||
|
2014
|
$ | 100,000 | $ | - | $ | 100,000 | |||||||
|
(1)
|
A portion of Mr. Byrd’s compensation is billed to Blue Dolphin at cost pursuant to the Operating Agreement.
|
79
|
BLUE DOLPHIN ENERGY COMPANY
|
2015 FORM 10-K
|
Compensation Risk Assessment
LEH’s approach to compensation practices and policies applicable for executive and non-executive personnel throughout our organization is consistent with the base pay market median for each position. LEH believes its practices and policies in this regard are not reasonably likely to have a materials adverse effect on us.
Outstanding Equity Awards
None.
Director Compensation Policy and Procedures
Under the Operating Agreement, LEH provides us with personnel, among other services, in capacities equivalent to Chief Executive Officer and Chief Financial Officer. As a result, we do not have any directors that are also personnel of Blue Dolphin. The Compensation Committee reviews and recommends to the Board for its approval all compensation for the directors.
Compensation for Non-Employee Directors
The annual retainer payable to non-employee directors serving on the Board is $40,000 per year. Payments are made in Common Stock and cash on a quarterly rotating basis. Non-employee directors are entitled to receive Blue Dolphin Common Stock with a fair value of $10,000 for services rendered in the first and third quarters of each year. The number of shares of Common Stock issued is determined by the closing price of Blue Dolphin’s Common Stock on the last trading day in the respective quarterly period. The shares of Common Stock are restricted pursuant to applicable securities holding periods for affiliates. Non-employee directors are also entitled to receive cash payments in the amount of $10,000 for services rendered in the second and fourth quarters of each year.
In addition to fees earned for serving as a member of the Board, non-employee directors also receive fees for serving on the Audit Committee and the MLP Conversion Special Committee. The chairman of the Audit Committee and the MLP Conversion Special Committee receives an additional annual retainer of $5,000 in cash in the second and fourth quarters of each year. Members of the Audit Committee and the MLP Conversion Special Committee receive an additional annual retainer of $2,500 in cash in the second and fourth quarters of each year. Non-employee directors serving on the Compensation Committee do not receive additional compensation. Non-employee directors are reimbursed for reasonable out-of-pocket expenses related to in-person meeting attendance.
Remainder of Page Intentionally Left Blank
80
|
BLUE DOLPHIN ENERGY COMPANY
|
2015 FORM 10-K
|
The following table sets forth fees earned by non-employee directors:
| Years Ended December 31, | ||||||||||||||||
|
2015
|
2014
|
|||||||||||||||
|
Name
|
Payable in FMV Common Stock Awards(1)
|
Payable in Cash
|
Payable in FMV Common Stock Awards(1)
|
Payable in Cash
|
||||||||||||
|
Christopher T. Morris(1)
|
$ | 20,000 | $ | 28,750 | $ | 22,500 | $ | 33,929 | ||||||||
|
Amitav Misra(1)
|
20,000 | 24,375 | 10,000 | 15,714 | ||||||||||||
|
Ryan A. Bailey (1)
|
- | 10,625 | - | - | ||||||||||||
|
Herbert N. Whitney(1)
|
- | - | 12,500 | 8,929 | ||||||||||||
|
John N. Goodpasture (2)
|
- | - | 12,500 | 13,214 | ||||||||||||
|
A. Haag Sherman (2)
|
- | - | 12,500 | 15,357 | ||||||||||||
|
Ivar Siem (2)
|
- | - | 25,000 | 17,857 | ||||||||||||
| $ | 40,000 | $ | 63,750 | $ | 95,000 | $ | 105,000 | |||||||||
|
(1)
|
At December 31, 2015, Messrs. Bailey, Misra, Morris and Whitney had total restricted awards of Common Stock outstanding of 0, 3,792, 12,051 and 9,683 shares, respectively. At December 31, 2014, Messrs. Misra, Morris and Whitney had total restricted awards of Common Stock outstanding of 1,613, 9,872 and 9,683 shares, respectively.
|
|
(2)
|
Messrs. Goodpasture, Sherman and Siem resigned from the Board effective June 4, 2014. At June 4, 2014, Messrs. Goodpasture, Sherman and Siem had total restricted awards of Common Stock outstanding of 37,067, 9,683 and 93,040 shares, respectively.
|
|
ITEM 12.
|
SECURITY OWNERSHIP OF CERTAIN BENEFICIAL OWNERS AND MANAGEMENT AND RELATED STOCKHOLDER MATTERS
|
Security Ownership of Certain Beneficial Owners
The table below sets forth information with respect to persons or groups known to us to be the beneficial owners of more than five percent (5%) of our common stock as of the December 31, 2015. Unless otherwise indicated, each named party has sole voting and positive power with respect to such shares.
|
Title of Class
|
Name of Beneficial Owner
|
Amount and Nature of Beneficial Ownership
|
Percent of Class(1)
|
||||||
|
Common Stock
|
Lazarus Energy Holdings, LLC
|
8,426,456 | 80.6 | % | |||||
|
(1)
|
Based upon 10,453,802 shares of Common Stock outstanding (10,603,802 shares of Common Stock issued less 150,000 shares of Common Stock held in treasury as of December 31, 2015.)
|
81
|
BLUE DOLPHIN ENERGY COMPANY
|
2015 FORM 10-K
|
Security Ownership of Management
The table below sets forth information as of December 31, 2015 with respect to: (i) directors, (ii) executive officers and (iii) directors and executive officers as a group beneficially owning our common stock. Unless otherwise indicated, each of the following persons has sole voting and dispositive power with respect to such shares.
|
Title of Class
|
Name of Beneficial Owner
|
Amount and Nature of Beneficial Ownership
|
Percent of Class(1)
|
|||||||
|
Common Stock
|
Jonathan P. Carroll(2)
|
8,428,214 | 80.6 | % | ||||||
|
Common Stock
|
Christopher T. Morris
|
12,051 | * | |||||||
|
Common Stock
|
Herbert N. Whitney
|
9,683 | * | |||||||
|
Common Stock
|
Amitav Misra
|
3,792 | * | |||||||
|
Common Stock
|
Tommy L. Byrd
|
--- | --- | |||||||
|
Common Stock
|
Ryan A. Bailey
|
--- | --- | |||||||
|
Directors/Nominees and Executive Officers as a Group (6 Persons)
|
8,453,740 | 80.9 | % | |||||||
|
(1)
|
Based upon 10,453,802 shares of Common Stock outstanding (10,603,802 shares of Common Stock issued less 150,000 shares of Common Stock held in treasury as of December 31, 2015). At December 31, 2015, there were no options outstanding, no options exercisable or no shares of common stock reserved for issuance under the 2000 Stock Incentive Plan.
|
|
(2)
|
Includes 8,426,456 shares issued to Lazarus Energy Holdings, LLC (“LEH”). Mr. Carroll is the majority owner of LEH.
|
|
*
|
Less than 1%.
|
Section 16(a) Beneficial Ownership Reporting Compliance
Section 16(a) of the Exchange Act requires our directors, executive officers and stockholders who own more than ten percent (10%) of our Common Stock to file reports of stock ownership and changes in ownership with the SEC and to furnish us with copies of all such reports as filed. Based solely on a review of the copies of the Section 16(a) reports furnished to us, we are unaware of any late filings made during 2015.
Equity Compensation Plan Information
None.
ITEM 13. CERTAIN RELATIONSHIPS AND RELATED TRANSACTIONS, AND DIRECTOR INDEPENDENCE
Related Party Transactions
LEH, our controlling shareholder, owns approximately 81% of our Common Stock. Jonathan Carroll, Chairman of the Board, Chief Executive Officer, and President of Blue Dolphin, is the majority owner of LEH. For services rendered, LEH receives reimbursements and fees under the Operating Agreement as follows:
|
·
|
Reimbursements. For management and operation of all properties excluding the Nixon Facility, LEH is reimbursed at cost for all reasonable expenses incurred while performing the services. Unsettled reimbursements to LEH are reflected within either prepaid expenses or accounts payable, related party in our consolidated balance sheets. Amounts reimbursed to LEH are reflected in the appropriate asset or expense accounts in our consolidated statements of income.
|
82
|
BLUE DOLPHIN ENERGY COMPANY
|
2015 FORM 10-K
|
|
·
|
Fees. For management and operation of the Nixon Facility, LEH receives fees: (i) in the form of weekly payments from GEL TEX Marketing, LLC (“GEL”) not to exceed $750,000 per month, (ii) $0.25 for each barrel processed at the Nixon Facility up to a maximum quantity of 10,000 barrels per day determined on a monthly basis, and (iii) $2.50 for each barrel processed at the Nixon Facility in excess of 10,000 barrels per day determined on a monthly basis. In the normal course of business, we make estimates and assumptions related to amounts expensed for fees since actual amounts can vary depending upon production volumes. We then use the cumulative catch-up method to account for revisions in estimates, which may result in prepaid expenses or accounts payable, related party on our consolidated balance sheets. Amounts expensed as fees are reflected as refinery operating expenses in our consolidated statements of income.
|
At December 31, 2015, we were in a prepaid position with respect to reimbursements and fees to LEH under the Operating Agreement. Prepaid related party operating expenses to LEH totaled $624,570 and $0 at December 31, 2015 and 2014, respectively. Accounts payable, related party to LEH totaled $0 and $1,174,168 at December 31, 2015 and 2014, respectively.
For the years ended December 31, 2015 and 2014, refinery operating expenses totaled $11,683,658 (approximately $2.80 per barrel of throughput) and $10,698,023 (approximately $2.77 per barrel of throughput), respectively.
The Operating Agreement expires upon the earliest to occur of: (a) the date of the termination of the Joint Marketing Agreement pursuant to its terms, (b) August 2018, or (c) upon written notice of either party to the Operating Agreement of a material breach of the Operating Agreement by the other party.
We lease an off-site storage tank from Ingleside Crude, LLC (“Ingleside”) pursuant to a short-term Tank Lease Agreement. The Tank Lease Agreement had an initial term of 30 days and automatically renews for 30 day periods. The parties may terminate the Tank Lease Agreement upon 30 days written notice. Ingleside is a related party of LEH and Jonathan Carroll. Accounts payable, related party to Ingleside totaled $300,000 and $0 at December 31, 2015 and 2014, respectively.
Director Independence
The Board has affirmatively determined that each of its members, with the exception of Messrs. Carroll and Whitney are independent and have no material relationship with us (either directly or indirectly or as a stockholder or officer of an organization that has a relationship with us), and that all members of the Audit Committee, Compensation Committee, and Master Limited Partnership ("MLP") Conversion Special Committee are independent, pursuant to NASDAQ Listing and SEC rules. Mr. Whitney serves as a consultant to LEH.
ITEM 14. PRINCIPAL ACCOUNTING FEES AND SERVICES
Fees paid to UHY by us were as follow:
| Years Ended December 31, | ||||||||
|
2015
|
2014
|
|||||||
|
Audit fees
|
$ | 176,660 | $ | 192,860 | ||||
|
Audit-related fees
|
- | - | ||||||
|
Tax fees
|
- | - | ||||||
| $ | 176,660 | $ | 192,860 | |||||
Audit fees for 2015 and 2014 related to the audit of our consolidated financial statements and the review of our quarterly reports that are filed with the SEC. The Audit Committee must pre-approve all audit and non-audit services provided to us by our independent registered public accounting firm.
83
|
BLUE DOLPHIN ENERGY COMPANY
|
2015 FORM 10-K
|
PART IV
ITEM 15. EXHIBITS, FINANCIAL STATEMENT SCHEDULES
Exhibits and Financial Statement Schedules
Following is a list of documents filed as part of this Annual Report:
|
·
|
consolidated balance sheets, consolidated statements of income, consolidated statements of shareholders’ equity, and consolidated statements of cash flows, which appear in “Part II, Item 8. Financial Statements and Supplementary Data” of this Annual Report; and
|
|
·
|
exhibits as listed in the exhibit index of this Annual Report, which is incorporated herein by reference.
|
Exhibits Index
|
No.
|
Description
|
|
3.1
|
Amended and Restated Certificate of Incorporation of Blue Dolphin (incorporated by reference to Exhibit 3.1 filed with Blue Dolphin’s Form 8-K on June 2, 2009, Commission File No. 000-15905)
|
|
3.2
|
Amended and Restated By-Laws of Blue Dolphin (incorporated by reference to Exhibit 3.1 filed with Blue Dolphin’s Form 8-K on December 26, 2007, Commission File No. 000-15905)
|
|
4.1
|
Specimen Stock Certificate (incorporated by reference to exhibits filed with Blue Dolphin’s Form 10-K on March 30, 1990, Commission File No. 000-15905)
|
|
4.2
|
Form of Promissory Note issued pursuant to the Note and Warrant Purchase Agreement dated September 8, 2004 (incorporated by reference to Exhibit 4.1 filed with Blue Dolphin’s Form 8-K on September 14, 2004, Commission File No. 000-15905)
|
|
4.3
|
Promissory Note of Lazarus Louisiana Refinery II, LLC, payable to Blue Dolphin dated July 31, 2009 (incorporated by reference to Exhibit 10.1 filed with Blue Dolphin’s Form 8-K on August 6, 2009, Commission File No. 000-15905)
|
|
10.1
|
Blue Dolphin 2000 Stock Incentive Plan (incorporated by reference to Appendix 1 filed with Blue Dolphin’s Proxy Statement on Form DEF 14A on April 20, 2000, Commission File No. 000-15905) *
|
|
10.2
|
First Amendment to the Blue Dolphin 2000 Stock Incentive Plan (incorporated by reference to Appendix B filed with Blue Dolphin’s Proxy Statement on Form DEF 14A on April 16, 2003, Commission File No. 000-15905) *
|
|
10.3
|
Second Amendment to the Blue Dolphin 2000 Stock Incentive Plan (incorporated by reference to Appendix A filed with Blue Dolphin’s Proxy Statement on Form DEF 14A on April 27, 2006, Commission File No. 000-15905) *
|
|
10.4
|
Fourth Amendment to the Blue Dolphin 2000 Stock Incentive Plan (incorporated by reference to Exhibit B filed with Blue Dolphin’s Proxy Statement on Form DEFA on December 28, 2011, Commission File No. 000-15905) *
|
|
10.5
|
Sale of American Resources Offshore, Inc. Common Stock Agreement between Blue Dolphin Exploration Co. and Ivar Siem, dated September 8, 2004 (incorporated by reference to Exhibit 10.4 filed with Blue Dolphin’s Form 8-K on September 14, 2004, Commission File No. 000-15905)
|
|
10.6
|
Purchase and Sale Agreement by and between Blue Dolphin Pipe Line Company and MCNIC, dated February 1, 2002 (incorporated by reference to Exhibit 10.20 filed with Blue Dolphin’s Form 10-KSB on March 21, 2003, Commission File No. 000-15905)
|
84
|
BLUE DOLPHIN ENERGY COMPANY
|
2015 FORM 10-K
|
|
10.7
|
Purchase and Sale Agreement by and between Blue Dolphin, WBI Pipeline & Storage Group, Inc. and SemGas LP, dated October 29, 2004 (incorporated by reference to Exhibit 10.1 filed with Blue Dolphin’s Form 8-K on November 3, 2004, Commission File No. 000-15905)
|
|
10.8
|
Amendment to the Asset Purchase Agreement by and among MCNIC Offshore Pipeline and Processing Company and Blue Dolphin Pipe Line Company dated February 28, 2005 (incorporated by reference to Exhibit 10.1 filed with Blue Dolphin’s Form 8-K on March 3, 2005, Commission File No. 000-15905)
|
|
10.9
|
Asset Sale Agreement by and among WBI Energy Midstream, LLC and Blue Dolphin Pipeline Company dated February 5, 2014 (incorporated by reference to Exhibit 10.9 filed with Blue Dolphin’s Form 10-K on March 31, 2015, Commission File No. 000-15905)
|
|
10.10
|
Placement Agency Agreement by and between Blue Dolphin and Starlight Investments, LLC dated May 27, 2005 (incorporated by reference to Exhibit 10.9 filed with Blue Dolphin’s Form 10-KSB on March 30, 2006, Commission File No. 000-15905)
|
|
10.11
|
Form of Stock Purchase Agreement between Blue Dolphin and Osler Holdings Limited, Gilbo Invest AS, Spencer Energy AS, Spencer Finance Corp., Hudson Bay Fund, LP, Don Fogel and SIBEX Capital Fund, Inc. dated March 8, 2006 (incorporated by reference to Exhibit 10.10 filed with Blue Dolphin’s Form 10-KSB on March 30, 2006, Commission File No. 000-15905)
|
|
10.12
|
Loan and Option Agreement by and among Lazarus Energy Holdings, LLC, Lazarus Louisiana Refinery II, LLC, Lazarus Energy, LLC, Lazarus Environmental, LLC, and Blue Dolphin dated July 31, 2009 (incorporated by reference to Exhibit 10.2 filed with Blue Dolphin’s Form 8-K on August 6, 2009, Commission File No. 000-15905)
|
|
10.13
|
Sale and Purchase Agreement by and among Blue Dolphin Exploration Company, Blue Sky Langsa Limited and Blue Sky Energy and Power Inc. dated July 21, 2010 (incorporated by reference to Exhibit 10.1 filed with Blue Dolphin’s Form 8-K on July 21, 2010, Commission File No. 000-15905)
|
|
10.14
|
Option Agreement by and among Blue Dolphin Exploration Company, Blue Sky Langsa Limited and Blue Sky Energy and Power Inc. dated July 21, 2010 (incorporated by reference to Exhibit 10.2 filed with Blue Dolphin’s Form 8-K on July 21, 2010, Commission File No. 000-15905)
|
|
10.15
|
Sale and Purchase Agreement by and among Blue Dolphin Exploration Company and Blue Sky Langsa Limited dated November 6, 2012 (incorporated by reference to Exhibit 10.1 filed with Blue Dolphin’s Form 8-K on November 13, 2012, Commission File No. 000-15905)
|
|
|
|
|
10.16
|
Escrow Agreement by and among Blue Dolphin Exploration Company, Blue Sky Langsa Limited and Doherty & Doherty, LLC dated November 6, 2012 (incorporated by reference to Exhibit 10.2 filed with Blue Dolphin’s Form 8-K on November 13, 2012, Commission File No. 000-15905)
|
|
10.17
|
Assignment Agreement by and among Blue Dolphin Exploration Company and Blue Sky Langsa Limited dated November 6, 2012 (incorporated by reference to Exhibit 10.3 filed with Blue Dolphin’s Form 8-K on November 13, 2012, Commission File No. 000-15905)
|
|
10.18
|
Asset Purchase Agreement by and among Sunoco Partners Marketing & Terminals L.P. and Blue Dolphin Pipe Line Company and Bitter Creek Pipelines, LLC dated August 3, 2011 (incorporated by reference to Exhibit 10.15 filed with Blue Dolphin’s Form 10-K on March 30, 2011, Commission File No. 000-15905)
|
|
10.19
|
Master Easement Agreement effective as of December 11, 2013 by and between Blue Dolphin Pipe Line Company and FLNG Land, II, Inc. (incorporated by reference to Exhibit 10.1 filed with Blue Dolphin’s Form 8-K on November 5, 2014, Commission File No. 000-15905)
|
|
10.20
|
Letter of Intent effective as of December 11, 2013 by and between Blue Dolphin Pipe Line Company and Freeport LNG Expansion, L.P (incorporated by reference to Exhibit 10.2 filed with Blue Dolphin’s Form 8-K on November 5, 2014, Commission File No. 000-15905)
|
85
|
BLUE DOLPHIN ENERGY COMPANY
|
2015 FORM 10-K
|
|
10.21
|
Purchase and Sale Agreement dated July 12, 2011 by and among Blue Dolphin, Lazarus Energy Holdings, LLC, Lazarus Louisiana Refinery II, LLC, Lazarus Texas Refinery II, LLC, Lazarus Environmental, LLC, Lazarus Energy, LLC and Lazarus Energy Development, LLC (incorporated by reference to Exhibit 10.1 filed with Blue Dolphin’s Form 8-K on July 22, 2011, Commission File No. 000-15905)
|
|
10.22
|
Management Agreement by and between Lazarus Energy Holdings, LLC, Lazarus Energy, LLC and Blue Dolphin effective as of February 15, 2012 (incorporated by reference to Exhibit 10.2 filed with Amendment No. 1 to Blue Dolphin’s Form 8-K on March 14, 2012, Commission File No. 000-15905)
|
|
10.23
|
Amendment No. 1 to Management Agreement dated May 12, 2014 by and among Lazarus Energy Holdings, LLC, Blue Dolphin and Lazarus Energy, LLC (incorporated by reference to Exhibit 10.1 filed with Blue Dolphin’s Form 8-K on May 16, 2014, Commission File No. 000-15905)
|
|
10.24
|
Crude Oil Supply and Throughput Services Agreement by and between GEL Tex Marketing, LLC and Lazarus Energy, LLC dated as of August 12, 2011 (incorporated by reference to Exhibit 10.1 filed with Blue Dolphin’s Form 10-Q on June 30, 2012, Commission File No. 000-15905)
|
|
10.25
|
Construction and Funding Contract by and between Lazarus Energy, LLC dated as of August 12, 2011 (incorporated by reference to Exhibit 10.2 filed with Blue Dolphin’s Form 10-Q on June 30, 2012, Commission File No. 000-15905)
|
|
10.26
|
Joint Marketing Agreement by and between GEL Tex Marketing, LLC and Lazarus Energy, LLC dated as of August 12, 2011 (incorporated by reference to Exhibit 10.3 filed with Blue Dolphin’s Form 10-Q on June 30, 2012, Commission File No. 000-15905)
|
|
10.27
|
Letter Agreement dated September 12, 2011 between GEL Tex Marketing, LLC, Milam Services, Inc., 1st International Bank, Lazarus Energy LLC and Lazarus Energy Holdings LLC (incorporated by reference to Exhibit 10.4 filed with Blue Dolphin’s Form 10-Q on March 31, 2012, Commission File No. 000-15905)
|
|
10.28
|
Acknowledgment Letter between Lazarus Energy, LLC and GEL Tex Marketing, LLC dated June 1, 2012 (incorporated by reference to Exhibit 10.4 filed with Blue Dolphin’s Form 10-Q on June 30, 2012, Commission File No. 000-15905)
|
|
10.29
|
Letter Agreement between Lazarus Energy, LLC and GEL Tex Marketing, LLC dated June 25, 2012 (incorporated by reference to Exhibit 10.5 filed with Blue Dolphin’s Form 10-Q on June 30, 2012, Commission File No. 000-15905)
|
|
10.30
|
Letter Agreement between Lazarus Energy, LLC and GEL Tex Marketing, LLC dated July 30, 2012 (incorporated by reference to Exhibit 10.6 filed with Blue Dolphin’s Form 10-Q on June 30, 2012, Commission File No. 000-15905)
|
|
10.31
|
Letter Agreement between Lazarus Energy, LLC and GEL Tex Marketing, LLC dated August 1, 2012 (incorporated by reference to Exhibit 10.7 filed with Blue Dolphin’s Form 10-Q on June 30, 2012, Commission File No. 000-15905)
|
|
10.32
|
Letter Agreement dated June 10, 2012 between Lazarus Energy Holdings, LLC and Blue Dolphin Energy Company (incorporated by reference to Exhibit 10.1 filed with Blue Dolphin’s Form 8-K on June 14, 2012, Commission File No. 000-15905)
|
|
10.33
|
Letter Agreement dated December 20, 2012 between Lazarus Energy, LLC, GEL Tex Marketing, LLC and Milam Services, Inc. (incorporated by reference to Exhibit 10.35 filed with Blue Dolphin’s Form 10-K on March 30, 2013, Commission File No. 000-15905)
|
|
10.34
|
Letter Agreement between Lazarus Energy, LLC, GEL TEX Marketing, LLC and Milam Services, Inc. dated February 21, 2013 (incorporated by reference to Exhibit 10.1 filed with Blue Dolphin’s Form 10-Q on August 14, 2013, Commission File No. 000-15905)
|
86
|
BLUE DOLPHIN ENERGY COMPANY
|
2015 FORM 10-K
|
|
10.35
|
Letter Agreement between Lazarus Energy, LLC, GEL TEX Marketing, LLC and Milam Services, Inc. dated February 21, 2013 (incorporated by reference to Exhibit 10.2 filed with Blue Dolphin’s Form 10-Q on May 15, 2013, Commission File No. 000-15905)
|
|
10.36
|
Letter Agreement Regarding Certain Advances and Related Agreement between Lazarus Energy, LLC, GEL TEX Marketing, LLC, and Milam Services, Inc., effective October 24, 2013 (incorporated by reference to Exhibit 10.2 filed in connection with Blue Dolphin’s Form 10-Q on November 14, 2013, Commission File No. 000-15905)
|
|
10.37
|
Loan Agreement dated September 29, 2008 among 1st International Bank as Lender, Lazarus Energy LLC as Borrower and Jonathan Pitts Carroll, Sr. and Lazarus Energy Holdings LLC as Guarantors (incorporated by reference to Exhibit 10.1 filed with Blue Dolphin’s Form 10-Q on March 31, 2012, Commission File No. 000-15905)
|
|
10.38
|
Forbearance Agreement dated August 12, 2011 by and among 1st International Bank, Lazarus Energy LLC, Jonathan P. Carroll, Gina L. Carroll, Lazarus Energy Holdings, LLC, GEL Tex Marketing, LLC and Milam Services, Inc. (incorporated by reference to Exhibit 10.5 filed with Blue Dolphin’s Form 10-Q on March 31, 2012, Commission File No. 000-15905)
|
|
10.39
|
Letter from American First National Bank to Lazarus Energy, LLC dated as of December 13, 2012 (incorporated by reference to Exhibit 10.2 filed with Blue Dolphin’s Form 10-Q on August 14, 2013, Commission File No. 000-15905)
|
|
10.40
|
Note Modification Agreement effective June 1, 2013 by and between Lazarus Energy, LLC, Jonathan P. Carroll, Gina L. Carroll, Lazarus Energy Holdings, LLC, GEL TEX Marketing, LLC, Milam Services, Inc. and American First National Bank (incorporated by reference to Exhibit 10.1 filed with Blue Dolphin’s Form 10-Q on August 14, 2013, Commission File No. 000-15905)
|
|
10.41
|
Letter from American First National Bank to Lazarus Energy, LLC dated as of July 24, 2013 (incorporated by reference to Exhibit 10.3 filed with Blue Dolphin’s Form 10-Q on August 14, 2013, Commission File No. 000-15905)
|
|
10.42
|
Promissory Note between Lazarus Energy LLC as maker and Notre Dame Investors Inc. as Payee in the Principal Amount of $8,000,000 dated June 1, 2006 (incorporated by reference to Exhibit 10.6 filed with Blue Dolphin’s Form 10-Q on March 31, 2012, Commission File No. 000-15905)
|
|
10.43
|
Subordination Agreement effective August 21, 2008 by Notre Dame Investors, Inc. in favor of First International Bank (incorporated by reference to Exhibit 10.2 filed with Blue Dolphin’s Form 10-Q on March 31, 2012, Commission File No. 000-15905)
|
|
10.44
|
Intercreditor and Subordination Agreement dated September 29, 2008 by and between Notre Dame Investors, Inc., Richard Oberlin, Lazarus Energy LLC and First International Bank (incorporated by reference to Exhibit 10.3 filed with Blue Dolphin’s Form 10-Q on March 31, 2012, Commission File No. 000-15905)
|
|
10.45
|
Intercreditor and Subordination Agreement dated August 12, 2011 by and among John H. Kissick, Lazarus Energy LLC and Milam Services, Inc. (incorporated by reference to Exhibit 10.7 filed with Blue Dolphin’s Form 10-Q on March 31, 2012, Commission File No. 000-15905)
|
|
10.46
|
First Amendment to Promissory Note by and between Lazarus Energy, LLC and John H. Kissick effective as of July 1, 2013 (incorporated by reference to Exhibit 10.1 filed with Blue Dolphin’s Form 10-Q on November 14, 2013, Commission File No. 000-15905)
|
|
10.47
|
Second Amendment to Promissory Note by and between Lazarus Energy, LLC and John H. Kissick effective as of October 1, 2014 (incorporated by reference to Exhibit 10.48 filed with Blue Dolphin’s Form 10-K on March 31, 2015, Commission File No. 000-15905)
|
87
|
BLUE DOLPHIN ENERGY COMPANY
|
2015 FORM 10-K
|
|
10.48
|
Loan and Security Agreement dated March 2, 2014 by and between Lazarus Refining & Marketing, LLC and Sovereign Bank (incorporated by reference to Exhibit 10.1 filed with Blue Dolphin’s Form 8-K on May 8, 2014, Commission File No. 000-15905)
|
|
10.49
|
Deed of Trust, Security Agreement, Assignment of Leases, Assignment of Rents, and Financing Statement dated May 2, 2014 (incorporated by reference to Exhibit 10.2 filed with Blue Dolphin’s Form 8-K on May 8, 2014, Commission File No. 000-15905)
|
|
10.50
|
Guaranty Agreement dated May 2, 2014 by Jonathan P. Carroll and Ingleside Crude LLC for the benefit of Sovereign Bank (incorporated by reference to Exhibit 10.3 filed with Blue Dolphin’s Form 8-K on May 8, 2014, Commission File No. 000-15905)
|
|
10.51
|
Pledge Agreement dated May 2, 2014 between Sovereign Bank and Lazarus Energy Holdings, LLC. (incorporated by reference to Exhibit 10.4 filed with Blue Dolphin’s Form 8-K on May 8, 2014, Commission File No. 000-15905)
|
|
10.52
|
Promissory Note payable to Sovereign Bank dated May 2, 2014 (incorporated by reference to Exhibit 10.5 filed with Blue Dolphin’s Form 8-K on May 8, 2014, Commission File No. 000-15905)
|
|
10.53
|
Collateral Assignment dated May 2, 2014 by Lazarus Refining & Marketing, LLC for the benefit of Sovereign Bank (incorporated by reference to Exhibit 10.6 filed with Blue Dolphin’s Form 8-K on May 8, 2014, Commission File No. 000-15905)
|
|
10.54
|
Collateral Assignment dated May 2, 2014 by Lazarus Refining & Marketing, LLC for the benefit of Sovereign Bank (incorporated by reference to Exhibit 10.7 filed with Blue Dolphin’s Form 8-K on May 8, 2014, Commission File No. 000-15905)
|
|
10.55
|
Loan Modification Agreement dated March 25, 2015, by and between Lazarus Refining & Marketing, LLC, and Sovereign Bank (incorporated by reference to Exhibit 10.1 filed with Blue Dolphin’s Form 8-K on March 31, 2015, Commission File No. 000-15905)
|
|
10.56
|
Asset Sale Agreement by and among WBI Energy Midstream, LLC and Blue Dolphin Pipeline Company dated February 5, 2014 (incorporated by reference to Exhibit 10.9 filed with Blue Dolphin’s Form 10-K on March 31, 2015, Commission File No. 000-15905)
|
|
10.57
|
Second Amendment to Promissory Note by and between Lazarus Energy, LLC and John H. Kissick effective as of October 1, 2014 (incorporated by reference to Exhibit 10.48 filed with Blue Dolphin’s Form 10-K on March 31, 2015, Commission File No. 000-15905)
|
|
10.58
|
Loan Agreement among Sovereign Bank, Lazarus Energy, LLC and Jonathan Pitts Carroll, Sr., Blue Dolphin Energy Company, Lazarus Refining & Marketing, LLC, and Lazarus Energy Holdings dated June 22, 2015 (incorporated by reference to Exhibit 10.1 filed with Blue Dolphin’s Form 8-K on June 26, 2015, Commission File No. 000-15905)
|
|
10.59
|
Promissory Note between Lazarus Energy, LLC and Sovereign Bank for the principal sum of $25,000,000 dated June 22, 2015 (incorporated by reference to Exhibit 10.2 filed with Blue Dolphin’s Form 8-K on June 26, 2015, Commission File No. 000-15905)
|
|
10.60
|
Security Agreement of Lazarus Energy, LLC in favor of Sovereign Bank dated June 22, 2015 (incorporated by reference to Exhibit 10.3 filed with Blue Dolphin’s Form 8-K on June 26, 2015, Commission File No. 000-15905)
|
|
10.61
|
Deed of Trust, Mortgage, Security Agreement, Assignment of Leases and Rents, Financing Statement and Fixture Filing for Lazarus Energy, LLC dated June 22, 2015 (incorporated by reference to Exhibit 10.4 filed with Blue Dolphin’s Form 8-K on June 26, 2015, Commission File No. 000-15905)
|
88
|
BLUE DOLPHIN ENERGY COMPANY
|
2015 FORM 10-K
|
|
10.62
|
Security Agreement of Lazarus Energy, LLC for the benefit of Lazarus Refining & Marketing, LLC dated June 22, 2015 (incorporated by reference to Exhibit 10.5 filed with Blue Dolphin’s Form 8-K on June 26, 2015, Commission File No. 000-15905)
|
|
10.63
|
Loan and Security Agreement between Sovereign Bank and Lazarus Refining & Marketing, LLC dated June 22, 2015 (incorporated by reference to Exhibit 10.6 filed with Blue Dolphin’s Form 8-K on June 26, 2015, Commission File No. 000-15905)
|
|
10.64
|
Promissory Note between Lazarus Refining & Marketing, LLC and Sovereign Bank for the principal sum of $3,000,000 dated June 22, 2015 (incorporated by reference to Exhibit 10.7 filed with Blue Dolphin’s Form 8-K on June 26, 2015, Commission File No. 000-15905)
|
|
10.65
|
Pledge Agreement by Lazarus Refining & Marketing, LLC in favor of Sovereign Bank dated June 22, 2015 (incorporated by reference to Exhibit 10.8 filed with Blue Dolphin’s Form 8-K on June 26, 2015, Commission File No. 000-15905)
|
|
10.66
|
Collateral Assignment executed by Blue Dolphin Pipe Line Company for the benefit of Sovereign Bank dated June 22, 2015.(incorporated by reference to Exhibit 10.9 filed with Blue Dolphin’s Form 8-K on June 26, 2015, Commission File No. 000-15905)
|
|
10.67
|
Guaranty Agreement by Jonathan Pitts Carroll, Sr., Blue Dolphin Energy Company, Lazarus Energy, LLC and Sovereign Bank dated June 22, 2015 (incorporated by reference to Exhibit 10.10 filed with Blue Dolphin’s Form 8-K on June 26, 2015, Commission File No. 000-15905)
|
|
10.68
|
Guaranty Fee Agreement between Jonathan P. Carroll and Lazarus Energy, LLC dated June 22, 2015 (incorporated by reference to Exhibit 10.11 filed with Blue Dolphin’s Form 8-K on June 26, 2015, Commission File No. 000-15905)
|
|
10.69
|
Guaranty Fee Agreement between Jonathan P. Carroll and Lazarus Refining & Marketing, LLC dated June 22, 2015 (incorporated by reference to Exhibit 10.12 filed with Blue Dolphin’s Form 8-K on June 26, 2015, Commission File No. 000-15905)
|
|
10.70
|
Amendment No. 2. to Operating Agreement by and between Lazarus Energy Holdings, LLC, Blue Dolphin, and Lazarus Energy, LLC effective as of June 1, 2015 (incorporated by reference to Exhibit 10.1 filed with Blue Dolphin’s Form 10-Q on August 14, 2015, Commission File No. 000-15905)
|
|
10.71
|
Loan Agreement among Sovereign Bank, Lazarus Refining & Marketing, LLC, Jonathan Pitts Carroll, Sr., Blue Dolphin Energy Company, Lazarus Energy, LLC, and Lazarus Energy Holdings dated December 4, 2015 (incorporated by reference to Exhibit 10.1 filed with Blue Dolphin’s Form 8-K on December 10, 2015, Commission File No. 000-15905)
|
|
10.72
|
Promissory Note between Lazarus Refining & Marketing, LLC and Sovereign Bank for the principal sum of $10,000,000 dated December 4, 2015 (incorporated by reference to Exhibit 10.2 filed with Blue Dolphin’s Form 8-K on December 10, 2015, Commission File No. 000-15905)
|
|
10.73
|
Security Agreement of Lazarus Refining & Marketing, LLC in favor of Sovereign Bank dated December 4, 2015 (incorporated by reference to Exhibit 10.3 filed with Blue Dolphin’s Form 8-K on December 10, 2015, Commission File No. 000-15905)
|
|
10.74
|
Deed of Trust, Mortgage, Security Agreement, Assignment of Leases and Rents, Financing Statement and Fixture Filing for Lazarus Refining & Marketing, LLC dated December 4, 2015 (incorporated by reference to Exhibit 10.4 filed with Blue Dolphin’s Form 8-K on December 10, 2015, Commission File No. 000-15905)
|
|
10.75
|
Construction Rider to Loan Agreement dated December 4, 2015 (incorporated by reference to Exhibit 10.5 filed with Blue Dolphin’s Form 8-K on December 10, 2015, Commission File No. 000-15905)
|
89
|
BLUE DOLPHIN ENERGY COMPANY
|
2015 FORM 10-K
|
|
10.76
|
Absolute Assignment of Leases and Rents dated December 4, 2015 (incorporated by reference to Exhibit 10.6 filed with Blue Dolphin’s Form 8-K on December 10, 2015, Commission File No. 000-15905)
|
|
10.77
|
Indemnification Agreement dated December 4, 2015 (incorporated by reference to Exhibit 10.7 filed with Blue Dolphin’s Form 8-K on December 10, 2015, Commission File No. 000-15905)
|
|
10.78
|
Pledge Agreement by Lazarus Energy Holdings, LLC in favor of Sovereign Bank dated December 4, 2015 (incorporated by reference to Exhibit 10.8 filed with Blue Dolphin’s Form 8-K on December 10, 2015, Commission File No. 000-15905)
|
|
10.79
|
Collateral Assignment of Key Agreements dated December 4, 2015 (incorporated by reference to Exhibit 10.9 filed with Blue Dolphin’s Form 8-K on December 10, 2015, Commission File No. 000-15905)
|
|
10.80
|
First Amendment to Lazarus Energy, LLC Loan Agreement and Loan Documents dated December 4, 2015 (incorporated by reference to Exhibit 10.10 filed with Blue Dolphin’s Form 8-K on December 10, 2015, Commission File No. 000-15905)
|
|
10.81
|
First Amendment to Lazarus Energy, LLC Deed of Trust, Mortgage, Security Agreement, Assignment of Leases and Rents, Financing Statement and Fixture Filing dated December 4, 2015 (incorporated by reference to Exhibit 10.11 filed with Blue Dolphin’s Form 8-K on December 10, 2015, Commission File No. 000-15905)
|
|
10.82
|
Guaranty Fee Agreement between Jonathan P. Carroll and Lazarus Refining & Marketing, LLC dated December 4, 2015 (incorporated by reference to Exhibit 10.12 filed with Blue Dolphin’s Form 8-K on December 10, 2015, Commission File No. 000-15905)
|
|
14.1
|
Code of Ethics applicable to the Chairman, Chief Executive Officer and Senior Financial Officer (incorporated by reference to Exhibit 14.1 filed with Blue Dolphin’s Form 10-KSB on March 25, 2005, Commission File No. 000-15905)
|
|
21.1
|
List of Subsidiaries of Blue Dolphin **
|
|
23.1
|
Consent of UHY LLP **
|
|
31.1
|
Jonathan P. Carroll Certification Pursuant to 18 U.S.C. Section 1350, as adopted pursuant to section 302 of the Sarbanes-Oxley Act of 2002 **
|
|
31.2
|
Tommy L. Byrd Certification Pursuant to 18 U.S.C. Section 1350, as adopted pursuant to section 302 of the Sarbanes-Oxley Act of 2002 **
|
|
32.1
|
Jonathan P. Carroll Certification Pursuant to 18 U.S.C. Section 1350, as adopted pursuant to section 906 of the Sarbanes-Oxley Act of 2002 **
|
|
32.2
|
Tommy L. Byrd Certification Pursuant to 18 U.S.C. Section 1350, as adopted pursuant to section 906 of the Sarbanes-Oxley Act of 2002 **
|
|
99.1
|
Amended and Restated Audit Committee Charter adopted by the Board of Directors of Blue Dolphin on November 4, 2015 (incorporated by reference to Appendix A filed with Blue Dolphin’s Proxy Statement on Form DEF 14A on November 18, 2015, Commission File No. 000-15905)
|
|
99.2
|
Compensation Committee Charter adopted by the Board of Directors of Blue Dolphin on November 4, 2015 (incorporated by reference to Appendix B filed with Blue Dolphin’s Proxy Statement on Form DEF 14A on November 18, 2015, Commission File No. 000-15905)
|
90
|
BLUE DOLPHIN ENERGY COMPANY
|
2015 FORM 10-K
|
|
101.INS
|
XBRL Instance Document **
|
|
101.SCH
|
XBRL Taxonomy Schema Document **
|
|
101.CAL
|
XBRL Calculation Linkbase Document **
|
|
101.LAB
|
XBRL Label Linkbase Document **
|
|
101.PRE
|
XBRL Presentation Linkbase Document **
|
|
101.DEF
|
XBRL Definition Linkbase Document **
|
_______________
* Management Compensation Plan
** Filed herewith
Remainder of Page intentionally Left Blank
91
|
BLUE DOLPHIN ENERGY COMPANY
|
2015 FORM 10-K
|
SIGNATURES
Pursuant to the requirements of Section 13 or 15(d) of the Securities Exchange Act of 1934, the registrant has duly caused this Annual Report to be signed on its behalf by the undersigned, thereunto duly authorized.
|
BLUE DOLPHIN ENERGY COMPANY
|
|||
|
(Registrant)
|
|||
|
March 30, 2016
|
By:
|
/s/ JONATHAN P. CARROLL
|
|
|
Jonathan P. Carroll
Chief Executive Officer, President,
Assistant Treasurer and Secretary
(Principal Executive Officer)
|
|||
Pursuant to the requirements of the Securities Exchange Act of 1934, this Annual Report has been signed below by the following persons on behalf of the registrant and in the capacities and on the dates indicated.
|
Signature
|
Title
|
Date
|
||
|
/s/ JONATHAN P. CARROLL
|
||||
|
Jonathan P. Carroll
|
Chairman of the Board, Chief Executive Officer, President, Assistant Treasurer and Secretary (Principal Executive Officer)
|
March 30, 2016
|
||
|
/s/ TOMMY L. BYRD
|
||||
|
Tommy L. Byrd
|
Chief Financial Officer, Treasurer and Assistant Secretary (Principal Financial Officer)
|
March 30, 2016
|
||
|
/s/ RYAN A. BAILEY
|
||||
|
Ryan A. Bailey
|
Director
|
March 30, 2016
|
||
|
/s/ AMITAV MISRA
|
||||
|
Amitav Misra
|
Director
|
March 30, 2016
|
||
|
/s/ CHRISTOPHER T. MORRIS
|
||||
|
Christopher T. Morris
|
Director
|
March 30, 2016
|
||
|
/s/ HERBERT N. WHITNEY
|
Director
|
March 30, 2016
|
||
|
Herbert N. Whitney
|
92