Attached files
| file | filename |
|---|---|
| EX-32.1 - EXHIBIT 32.1 - Fresh Market, Inc. | ex321q42015.htm |
| EX-32.2 - EXHIBIT 32.2 - Fresh Market, Inc. | ex322q42015.htm |
| EX-31.1 - EXHIBIT 31.1 - Fresh Market, Inc. | ex311q42015.htm |
| EX-31.2 - EXHIBIT 31.2 - Fresh Market, Inc. | ex312q42015.htm |
| EX-23.1 - EXHIBIT 23.1 - Fresh Market, Inc. | ex231q42015.htm |
| EX-10.32 - EXHIBIT 10.32 - Fresh Market, Inc. | ex1032q42015.htm |
| EX-10.30 - EXHIBIT 10.30 - Fresh Market, Inc. | ex1030q42015.htm |
| EX-10.31 - EXHIBIT 10.31 - Fresh Market, Inc. | ex1031q42015.htm |
UNITED STATES
SECURITIES AND EXCHANGE COMMISSION
Washington, D.C. 20549
FORM 10-K
x | ANNUAL REPORT PURSUANT TO SECTION 13 OR 15(d) OF THE SECURITIES EXCHANGE ACT OF 1934 |
For the fiscal year ended January 31, 2016
OR
¨ | TRANSITION REPORT PURSUANT TO SECTION 13 OR 15(d) OF THE SECURITIES EXCHANGE ACT OF 1934 |
For the transition period from to
Commission file number: 1-34940

THE FRESH MARKET, INC.
(Exact name of registrant as specified in its charter)
Delaware | 56-1311233 |
(State or other jurisdiction of incorporation or organization) | (I.R.S. Employer Identification No.) |
628 Green Valley Road Greensboro, NC | 27408 |
(Address of principal executive offices) | (Zip Code) |
(336) 272-1338
(Registrant’s telephone number, including area code)
Securities registered pursuant to Section 12(b) of the Act:
Title of each class | Name of each exchange on which registered | |||
Common stock, par value $0.01 per share | The NASDAQ Stock Market LLC | |||
(NASDAQ Global Select Market) | ||||
Securities registered pursuant to Section 12(g) of the Act: None
Indicate by check mark if the registrant is a well-known seasoned issuer, as defined in Rule 405 of the Securities Act. Yes x No ¨
Indicate by check mark if the registrant is not required to file reports pursuant to Section 13 or Section 15(d) of the Act. Yes ¨ No x
Indicate by check mark whether the registrant (1) has filed all reports required to be filed by Section 13 or 15(d) of the Securities Exchange Act of 1934 during the preceding 12 months (or for such shorter period that the registrant was required to file such reports), and (2) has been subject to such filing requirements for the past 90 days. Yes x No ¨
Indicate by check mark whether the registrant has submitted electronically and posted on its corporate Web site, if any, every Interactive Data File required to be submitted and posted pursuant to Rule 405 of Regulation S-T (§232.405 of this chapter) during the preceding 12 months (or for such shorter period that the registrant was required to submit and post such files). Yes x No ¨
Indicate by check mark if disclosure of delinquent filers pursuant to Item 405 of Regulation S-K (§229.405 of this chapter) is not contained herein, and will not be contained, to the best of the registrant’s knowledge, in definitive proxy or information statements incorporated by reference in Part III of this Form 10-K or any amendment to this Form 10-K. x
Indicate by check mark whether the registrant is a large accelerated filer, an accelerated filer, a non-accelerated filer, or a smaller reporting company. See the definitions of “large accelerated filer,” “accelerated filer” and “smaller reporting company” in Rule 12b-2 of the Exchange Act. (Check one):
Large accelerated filer | x | Accelerated filer | ¨ |
Non-accelerated filer | ¨ (Do not check if a smaller reporting company) | Smaller reporting company | ¨ |
Indicate by check mark whether the registrant is a shell company (as defined in Rule 12b-2 of the Act). Yes ¨ No x
Aggregate market value of the registrant’s common stock held by non-affiliates as of July 26, 2015, based upon the closing sales price of the common stock on such date reported on the NASDAQ Global Select Market, was approximately $1,509,000,000.
The number of shares of the registrant’s common stock, $0.01 par value, outstanding as of March 14, 2016 was 47,019,217 shares.
DOCUMENTS INCORPORATED BY REFERENCE
Portions of the registrant’s definitive proxy statement to be filed with the Securities and Exchange Commission in connection with its 2016 Annual Meeting of Stockholders are incorporated by reference in Part III of this Form 10-K to the extent described herein.
Cautionary Note Regarding Forward-Looking Statements
This Form 10-K and our 2015 Annual Report to Stockholders contain forward-looking statements in addition to historical information. We use words such as “anticipate,” “believe,” “could,” “estimate,” “expect,” “forecast,” “intend,” “looking forward,” “may,” “plan,” “potential,” “project,” “should,” “target,” “will” and “would” or any variations of these words or other words with similar meanings to identify such forward-looking statements. All statements that address activities, events or developments that we intend, expect or believe may occur in the future are forward-looking statements within the meaning of Section 27A of the Securities Act of 1933, as amended, and Section 21E of the Securities Exchange Act of 1934, as amended. These “forward-looking statements” may relate to such matters as our industry, business strategy, goals and expectations concerning our market position, future operations, future performance or results, margins, profitability, capital expenditures, liquidity and capital resources, interest rates and other financial and operating information and the outcome of contingencies such as legal and administrative proceedings.
Our forward-looking statements contained in this Form 10-K are based on management’s current expectations and are subject to uncertainty and changes in circumstances. We cannot guarantee that the results and other expectations expressed, anticipated or implied in any forward-looking statement will be realized. The following are some of the factors that could cause actual future results to differ materially from those expressed in any forward-looking statements: accounting entries and adjustments at the close of a fiscal quarter; unexpected expenses and risks associated with our business; our ability to remain competitive in the areas of merchandise quality, price, breadth of selection, customer service and convenience; the effective management of our merchandise buying and inventory levels; the quality and safety of food products and other items that we may sell; our ability to anticipate and/or react to changes in customer demand; changes in economic and financial conditions, including U.S. fiscal and monetary policy, and the resulting impact on consumer confidence; other changes in consumer confidence and spending; unexpected consumer responses to promotional programs; unusual, unpredictable and/or severe weather conditions, including their effect on our supply chain and our store operations; the effectiveness of our logistics and supply chain model, including the ability of our third-party logistics providers to meet our product demands and restocking needs on a cost competitive basis; the execution and management of our store growth, including the availability and cost of acceptable real estate locations for new store openings, the capital that we utilize in connection with new store development and the anticipated time between lease execution and store opening; the mix of our new store openings as between build to suit sites and second-generation, as-is sites and as between existing markets and newer markets; the actions of third parties involved in our store growth activities, including property owners, landlords, property managers, contractors, subcontractors, government agencies, and current tenants who occupy one or more of our proposed new store locations, all of whom may be impacted by their financial condition, their lenders, their activities outside of those focused on our new store growth and other tenants, customers and business partners of theirs; impairment of recorded goodwill and other long-lived assets; global economies and credit and financial markets; our ability to maintain the security of electronic and other confidential and/or personal information; serious disruptions and catastrophic events; competition; personnel recruitment and retention; acquisitions and divestitures, including the ability to integrate successfully any such acquisitions; information systems and technology; commodity, energy, fuel and other cost increases; compliance with laws, regulations and orders; changes in laws and regulations; outcomes of litigation and proceedings and the availability of insurance, indemnification and other third-party coverage of any losses suffered in connection therewith; tax matters; numerous other matters of national, regional and global scale, including those of a political, economic, business, and competitive nature; risks associated with the transaction contemplated by the Agreement and Plan of Merger dated March 11, 2016 (“Merger Agreement”), including: (i) uncertainties as to the timing of the tender offer and the merger; (ii) the risk that the offer or the merger may not be completed in a timely manner or at all; (iii) uncertainties as to the percentage of our stockholders tendering their shares in the offer; (iv) the possibility that competing offers or acquisition proposals will be made; (v) the possibility that any or all of the various conditions to the consummation of the offer or the merger may not be satisfied or waived, including the failure to receive any required regulatory approvals from any applicable governmental entities (or any conditions, limitations or restrictions placed on such approvals); (vi) the occurrence of any event, change or other circumstance that could give rise to the termination of the Merger Agreement, including in circumstances which would require the Company to pay a termination fee or other expenses; (vii) risks regarding the failure to obtain the necessary financing to complete the transactions contemplated by the Merger Agreement; (viii) risks related to the debt financing arrangements entered into in connection with the Merger Agreement; (ix) the effect of the announcement or pendency of the transactions contemplated by the Merger Agreement on our ability to retain and hire key personnel, our ability to maintain relationships with our customers, suppliers and others with whom we do business, or our operating results and business generally; (x) risks related to diverting management’s attention from our ongoing business operations; (xi) the risk that stockholder litigation in connection with the transactions contemplated by the Merger Agreement may result in significant costs of defense, indemnification and liability; and other factors, many of which are beyond our control. Should one or more of these risks or uncertainties materialize, or should any of our assumptions prove
incorrect, our actual results may vary in material respects from those projected in these forward-looking statements. You should bear this in mind as you consider forward-looking statements.
Any forward-looking statement made by us in this Form 10-K speaks only as of the date hereof. Factors or events that could cause our actual results to differ may emerge from time to time, and it is not possible for us to predict all of them. We undertake no obligation to publicly update or revise any forward-looking statement, whether as a result of new information, future developments or otherwise, except as may be required by any applicable securities laws. You are advised, however, to consult any further disclosures we may make in our future reports to the Securities and Exchange Commission, on our website, or otherwise.
The Fresh Market, Inc.
Annual Report on Form 10-K
For the Fiscal Year Ended January 31, 2016
Table of Contents
PART I | ||
Item 1. | Business | |
Item 1A. | Risk Factors | |
Item 1B. | Unresolved Staff Comments | |
Item 2. | Properties | |
Item 3. | Legal Proceedings | |
Item 4. | Mine Safety Disclosures | |
PART II | ||
Item 5. | Market for Registrant’s Common Equity, Related Stockholder Matters and Issuer Purchases of Equity Securities | |
Item 6. | Selected Financial Data | |
Item 7. | Management’s Discussion and Analysis of Financial Condition and Results of Operations | |
Item 7A. | Quantitative and Qualitative Disclosures About Market Risk | |
Item 8. | Financial Statements and Supplementary Data | |
Item 9. | Changes in and Disagreements With Accountants on Accounting and Financial Disclosure | |
Item 9A. | Controls and Procedures | |
Item 9B. | Other Information | |
PART III | ||
Item 10. | Directors, Executive Officers and Corporate Governance | |
Item 11. | Executive Compensation | |
Item 12. | Security Ownership of Certain Beneficial Owners and Management and Related Stockholder Matters | |
Item 13. | Certain Relationships and Related Transactions, and Director Independence | |
Item 14. | Principal Accountant Fees and Services | |
PART IV | ||
Item 15. | Exhibits and Financial Statement Schedules | |
SIGNATURES | ||
PART I
Item 1. Business.
General
The Fresh Market is a specialty grocery retailer focused on creating an extraordinary food shopping experience for our customers. Since opening our first store in 1982, we have offered high-quality food products, with an emphasis on fresh, premium perishables and an uncompromising commitment to customer service. We seek to provide an attractive, convenient shopping environment while offering our customers a compelling price-value combination. As of January 31, 2016, we operated 184 stores in 27 states across the United States.
On March 11, 2016, we entered into an Agreement and Plan of Merger (the “Merger Agreement”) with Pomegranate Holdings, Inc., a Delaware corporation (“Parent”), and Pomegranate Merger Sub, Inc., a Delaware corporation and a wholly owned subsidiary of Parent (“Merger Sub”). The Merger Agreement provides for the acquisition of the Company by Parent in a two-step all cash transaction, consisting of a tender offer, followed by a subsequent back-end merger (the “Merger”).
History
The Fresh Market opened its first store in Greensboro, North Carolina in 1982. In the 1980s and early 1990s, the Company expanded its presence throughout the southeastern United States, where the majority of our stores are still located. In addition, we continue to introduce our stores into new markets and have entered the Midwest, Northeast, Plains states, and Texas.
Throughout The Fresh Market’s history, we have been characterized by a culture of continuous growth and an innovative approach to perishable product offerings. As the Company has grown, we have implemented numerous organizational, technological and procedural improvements to better standardize our systems and processes and contribute to our ability to scale our operations. At the same time, we have fostered a spirit of innovation that encourages our management to continually challenge and enhance our product offerings and services.
Company Strengths
Outstanding food quality, store environment and customer service. We are dedicated to delivering a superior shopping experience that exceeds our customers’ expectations by offering fresh, premium products and providing a high level of customer service. Our high-quality food offerings are the result of our careful selection of distinct products based on a range of attributes such as taste, color, size, grade, marbling, growing conditions, origins and freshness. Additionally, our stores are designed to delight our customers’ senses with an aesthetically pleasing environment. Elements of this environment include colorful product presentations, accent lighting, music and various aromas including flowers, coffee and fresh baked goods. Additionally, we strive to engender employee pride and enthusiasm, reflecting our belief that a motivated, knowledgeable staff and a service-oriented, engaging shopping experience foster a strong relationship with our customers, generate favorable word-of-mouth publicity and drive sales.
Highly-profitable smaller-box format. Since our founding, we have exclusively operated a smaller-box format, which has proven to be highly profitable. Our stores average approximately 21,000 square feet and carry an edited assortment of approximately 10,000 to 11,000 SKUs at any one time, while many conventional supermarkets are approximately 40,000 to 60,000 square feet in size and carry an average of 45,000 SKUs. Within this smaller-box format, we focus on higher-margin food categories. Further, we believe our format facilitates interaction among our store managers, customers and staff, enhancing the customers’ shopping experience. Our disciplined focus on this format leads to more consistent execution across our store base, which we believe allows us to generate higher operating margins than conventional supermarkets. Additionally, the smaller-box format is adaptable to different retail sites and configurations.
Scalable operations and replicable store model. We believe that our infrastructure, including our management systems and distribution network, enables us to replicate our profitable store format and differentiated shopping experience. We expect this infrastructure to be capable of supporting continued expansion. We believe our standardized systems and processes, which rely on refined tools for procurement, inventory management, store operations and employee hiring, training and scheduling, are scalable to meet our expansion goals. We currently outsource substantially all of our logistics functions to third-
1
party distributors and vendors whom we expect to have sufficient capacity to accommodate our anticipated growth. Additionally, each of our stores utilizes standard product display fixtures with flexible arrangement and design options that enable us to successfully replicate our customers’ shopping experience in stores of various sizes and dimensions. Our store management mobility tracking system allows us to efficiently deploy staff across our stores and place experienced managers in each of our new stores, helping provide a consistent shopping experience at each of our stores.
Experienced management team with proven track record. Our executive management team has extensive experience in our industry and employs an analytical, data-driven approach to decision-making that is designed to encourage innovation and stimulate continuous improvement throughout the organization. Our CEO has over 35 years of experience in the food retail industry, and leads an executive management team with an average of over 20 years of retail industry experience. They are complemented by merchandising and operations management with an average of over 30 years of food retail experience.
Food retail is a large and competitive industry and our business involves numerous risks and uncertainties. These risks include the possibility that our competitors may be more successful than us in attracting customers. Some of these competitors have been in business longer or may have greater financial resources than us, which may give them a competitive advantage in sourcing, promoting and selling products. In addition, achieving our store growth and margin improvement objectives will be subject to a number of important challenges. For a more complete description of these challenges and the other risks associated with an investment in our common stock, see “Item 1A. Risk Factors.”
Growth Strategy
Expand our store base. We intend to continue to expand our store base in existing markets with an emphasis on market densification and to penetrate new markets over a longer-term horizon. Our real estate development team and supporting functions continuously look to improve our capability to identify new sites and forecast the sales performance of those sites. We employ a detailed, analytical process to identify target markets or sales potential by geographic regions. We target locations based on demographic characteristics including income and education levels, drive times, competition and population density, as well as other key characteristics including convenience for customers, visibility, access, signage and parking availability. We generally visit a potential location multiple times to perform on-site diligence and interview potential customers. We supplement our in-house efforts by leveraging the expertise of our extensive regional broker network. Our real estate committee, which includes several members of senior management, approves all new stores.
Our recent growth is summarized below:
Year Ended | |||||||||
January 31, 2016 | January 25, 2015 | January 26, 2014 | |||||||
Stores at beginning of fiscal year | 169 | 151 | 129 | ||||||
Stores opened | 18 | 22 | 22 | ||||||
Store closures | (3 | ) | (4 | ) | — | ||||
Stores at end of fiscal year | 184 | 169 | 151 | ||||||
Refreshes and remodels | 8 | — | 3 | ||||||
Total gross square footage | 3,900,000 | 3,580,000 | 3,200,000 | ||||||
Year-over-year change | 9 | % | 12 | % | 18 | % | |||
When developing a new store site, we generally target a store size of approximately 17,000 to 24,000 gross square feet and first year sales of approximately $7 million to $12 million. The sales levels often vary due to size of market, brand awareness, and local competition. Our target net investment to open a new store ranges from approximately $3 million to $5 million depending on the approach we take to developing the applicable new store site and the tenant improvement allowances paid by the developer. For example, we may enter into a “build-to-suit” lease, in which the owner develops a store site to our specifications prior to us occupying the premises. Alternatively, we may enter into a lease “as-is” for existing structures, in which we take the premises in its current state and self-develop it. Occasionally, we enter into a lease for, or acquire, land and then build the entire structure. In this case, depending on the site work and scope of the project, the net investment excluding cost of land is typically $5.5 million to $8.5 million per store, although some transaction structures or specific properties may be substantially higher, depending upon the total developable square footage and complexity of the project.
Also, we may incur lease inducement costs or similar prepayments in connection with acquiring or entering into new leases. These lease inducement costs and similar prepayments are not included as part of our net investment costs and are amortized to rent expense over the primary lease term.
2
In most cases, our operating model generally targets a cash flow contribution of 8% to 10% or greater of sales in the first year of operations, increasing to the low- to mid-teens by the fifth year of operation. In addition, our investment criteria and internal rate of return thresholds remain consistent across store site types. In most cases, we target a payback period of less than four years. When entering new markets, we may consider the new store site to be an investment with a lower return and choose to develop it in order to test our operating model, build credibility with the real estate community and provide a platform for future growth. We believe this approach allows us to better learn whether any refinements to our concept are required and obtain future real estate sites at lower costs before expanding further in the market.
Drive comparable store sales. We aim to increase our comparable store sales by generating growth in the number and average size of customer transactions at our existing stores. The key elements of our strategy to increase the number of customer transactions at our existing stores include:
• | improving our value perception with consumers by reinvesting in service, merchandising, and price; |
• | providing a greater number of solutions for more eating occasions; |
• | curating an assortment of distinctive, high-quality product offerings and communicating their attributes and suggestions for cooking with them to generate new and repeat visits to our stores; |
• | generating customer loyalty by providing differentiated and creative product offerings in response to customer needs and preferences and our focus on customer service; and |
• | refreshing or remodeling older stores to enhance the look and feel of the stores. |
The key elements of our strategy to increase the amount our customers spend when they visit our stores include:
• | introducing new and innovative products, including products offered under our private-label brands, to accommodate our customers’ evolving preferences; |
• | utilizing in-store cross-merchandising and extending categories to provide ready to serve offerings; |
• | communicating and offering various promotional activities; |
• | investing in the price to quality relationship on certain select products; |
• | utilizing in-store signage to tell the stories behind our product offerings and what makes them unique |
• | enhancing our product offering displays to make purchasing more convenient. |
Achieve above-average operating margins. We intend to continue to achieve above-average operating margins through scale efficiencies and leverage of our fixed cost base. Specifically, we believe our anticipated store growth will permit us to benefit from economies of scale in sourcing products and allow us to leverage our buying costs, supply chain costs, and occupancy costs as a percentage of sales. We plan to invest in pricing and other initiatives to increase sales and market share, which may have the effect of lowering margins. In addition to our continued expansion, as we refine and improve our various ordering, tracking and product allocation systems, we expect to benefit from additional operating margin improvement opportunities by increasing sales and reducing inventory shrinkage. We also believe that we can make profitable enhancements to our merchandise offerings by optimizing the breadth of our assortment and refining our promotions to make them more effective. We have identified significant opportunities to improve labor efficiencies while improving the experience for our customers and employees. Finally, we believe that as we grow revenues and the store base, we will be able to leverage our existing infrastructure and corporate overhead with continued cost discipline to gradually provide funding to improve our customer service and marketing capabilities.
Industry Overview and Competition
The U.S. food retail industry encompasses store formats ranging from small neighborhood and specialty grocery shops and convenience stores to large supermarkets and club stores. The supermarket format represents the largest segment of the food retail industry. This format, of which we are a part, includes conventional, warehouse, supercenter, limited assortment, military commissaries and natural/gourmet foods. We do not believe, however, that we neatly fit into any of these categories.
3
Our competition varies and includes national conventional supermarkets such as Kroger, regional conventional supermarkets such as Harris Teeter, Giant and Publix, national superstores such as Wal-Mart and Target, alternative food retailers such as Whole Foods Market, Trader Joe’s and Sprouts Farmers Market, and local conventional supermarkets, natural foods stores, smaller specialty stores and farmers’ markets. Each of these stores competes with us on the basis of product selection and quality, customer service, store format, location and price, or a combination of these factors. We believe our commitment to high-quality perishable offerings at competitive prices and our focus on customer service differentiate us in this marketplace.
Competition in our industry has increased in recent years. Conventional supermarkets and superstores have improved their perishable and premium offerings while expanding and improving their store base with newer and larger stores, increasing the range of shopping alternatives available to customers. Other specialty retailers have also continued their expansion, including into our core markets in the southeastern United States where competition in the past had been less intense. We have seen an increase in pricing pressure on our products and a decline in comparable store sales as competition has strengthened.
Products
We have a significant focus on perishable product categories, which include meat, seafood, produce, deli, bakery, floral, sushi and prepared foods. Our non-perishable product categories consist of traditional grocery, frozen and dairy products as well as bulk foods, coffee and candy, beer and wine. We emphasize fresh items that are distinct and of premium quality as compared to our conventional competitors. The following is a breakdown of our perishable and non-perishable sales mix:
Year Ended | |||||||||
January 31, 2016 | January 25, 2015 | January 26, 2014 | |||||||
Perishable | 65.7 | % | 65.5 | % | 65.4 | % | |||
Non-perishable | 34.3 | % | 34.5 | % | 34.6 | % | |||
Our in-house merchants actively seek high-quality products from a wide range of sources. Our product selection includes:
• | Meat. Our meat department offers our customers a unique Old World butcher shop experience set apart by its flexibility, quality and service. Our professional meat cutters are available during all hours of operation to answer customers’ questions, offer cooking tips and provide custom cuts of meat. Our offerings include steaks that are expertly trimmed and aged for 14 to 21 days to provide restaurant-quality taste and tenderness, fresh turkeys year-round and ground beef that is ground daily in-store from steak trimmings and whole roasts. All of our chicken and turkey are Antibiotic-Free and are fed a vegetarian-only diet with no animal by-products, which results in exceptionally moist, flavorful and tender meat. |
• | Seafood. We offer our customers a distinctive selection of fresh seafood and choose our suppliers based on the quality of their offerings and production methods. Our stores receive deliveries of fresh seafood up to six times a week, demonstrating our dedication to freshness. One of the distinguishing characteristics of the department is the prepared or “value-added” seafood selections. Additionally, we have partnered with the New England Aquarium to develop an Environmentally Sustainable Seafood Policy that shapes product sourcing decisions and inspires us to continuously improve the environmental responsibility of the items we sell in our seafood department. This commitment recognizes the increasing importance of sustainability in being able to provide our customers with the highest quality seafood they expect from us for many years to come. |
• | Produce. We offer our customers a “farmers’ market” experience focused on freshness, variety and abundant displays. We also pride ourselves on offering our customers the “best eating” varieties year-round, and offer a mix of conventional, certified organic and local produce throughout the year depending on quality and availability. Our commitment to local and regional products is brought to life throughout our produce department, where we recognize that some of the best products in the world are right in the backyards of our stores. Through our Local 100 program we define local products as those produced within 100 miles of our store. The Regional 300 program brings products sourced within 300 miles of a store. |
4
• | Grocery and Dairy. We carefully select our grocery and dairy products to provide hard-to-find and premium-quality offerings to our customers. We have a growing line of distinctive private-label dairy and non-traditional grocery products that address the wants and needs of our food-savvy shoppers and we employ these products as a vehicle for building and supporting our brand. |
• | Prepared Foods. We have an inviting prepared foods department with a unique selection of quality products. Our prepared foods operations are focused on simplicity of execution, often relying on standardized recipes and instructions provided to the stores to maintain consistency in quality and food safety across the stores while maintaining a homemade, fresh look and great taste. |
• | Deli. Our European-style delicatessen features a broad assortment of high-quality deli meats and typically offers more than 200 varieties of imported and domestic cheeses. |
• | Bakery. We utilize a combination of in-store and third-party bakeries to produce our baked goods. The presence of daily in-store baking enhances the shopping experience and reinforces the freshness and value provided in each store. The open layout of our bakery contributes to our aesthetically-pleasing store environment. |
• | Bulk Foods, Coffee and Candy. A number of products are offered in bulk format including nuts, dried fruits, snack mixes, coffee and candy. We take pride in the quality and selection we provide, including nut varieties that we believe are larger than those offered by many conventional supermarkets. |
• | Beer and Wine. We believe that wine enhances our customers’ food experience. We offer a carefully selected assortment of highly-ranked wines at affordable prices, everyday wines and wine from local vintners, as well as our own private-label wines. We also offer beers from local, domestic and foreign brewers. Beer and wine sales are subject to applicable law and may not be available in every store. |
• | Floral and Gifts. Lively, elegant floral displays greet our customers when they enter the store. In order to offer our customers attractive seasonal flowers at peak blooming, we regularly vary the selection of our floral offerings, which include our top-selling roses, orchids and tulips. Our gift selection includes candles, cookbooks, kitchen items and seasonal and holiday gift baskets. |
Our ability to identify, source, merchandise and market differentiated products is critical to our success. We carefully select new products based on a variety of attributes including taste, color, size, grade, marbling, growing conditions, origins and freshness. Our centralized merchandising team rotates, updates and re-evaluates our existing merchandise offerings and regularly tests new products in our stores to excite our customers and to better understand customer preferences.
Pricing Strategy
Our pricing strategy is designed to maintain our commitment to provide premium products at reasonable prices while also attracting customers to our stores based on the variety and quality of our products and a differentiated shopping experience.
Our pricing decisions are driven by the limited direct overlap between our product offerings and the products offered by most conventional supermarkets. Where our products are directly comparable to those offered by our competitors, such as grocery and dairy staples, beer and wine, we aim to price them competitively, and where our products are recognizably distinct from those offered by our competitors, such as our produce, meat and seafood, we aim to price them commensurate with the quality of our products.
To ensure our prices are competitive, we are implementing new technology to collect more prices in the market with greater frequency. We are also implementing new tools to better manage our prices.
Stores
Our stores are organized around distinct departments with engaging merchandise displays that reinforce our emphasis on freshness and service and are designed to evoke a “neighborhood grocer” feel. The careful design of our stores creates a warm, inviting atmosphere that evokes a simple elegance, with colorful product presentations, accent lighting and music. The aroma of flowers, coffee and fresh baked goods permeates the stores and other amenities, such as free coffee daily, product
5
sampling and cut-to-order meats, enhance the shopping experience for our customers. The Fresh Market store atmosphere is meant to encourage the customer to slow down, interact with employees and enjoy the shopping experience.
Each of our stores uses standardized product display fixtures with flexible arrangement and design options that enable us to accommodate each store’s distinct shape, size and layout. Each of our discrete departments, such as deli, bakery, seafood and meat, has several well-developed merchandising and display alternatives to optimize the available space. We position our full-service departments adjacent to each other to provide a “market feel” and foster interaction between employees and customers. This further reinforces our ability to successfully replicate our customers’ shopping experience and retain the charm of a “neighborhood grocer.”
Store Staffing and Operations
Our typical store is staffed with approximately 70-80 full- and part-time employees including a store manager, two to three assistant store managers and five department heads. The store management team is responsible for all aspects of store execution, including managing inventory and cash, maintaining a clean and engaging store environment, hiring, training and supervising our store employees, and managing store profitability. Importantly, we encourage our employees, especially our store managers, to engage regularly with our customers. To promote interaction between staff and customers, our store managers are typically positioned on our selling floor, near our service counters.
Our corporate operations team is responsible for developing labor targets, work methods, store support and management tools. They also facilitate the sharing of best practices and implementation of new merchandising initiatives. In addition, we employ a dedicated new store opening team, including a new store operations manager, which is exclusively focused on the new store opening process. We believe this allows us to seamlessly open new stores while our field management team can focus on continuing to improve the performance of our existing stores.
Our stores are generally open seven days a week from 8:00 am to 9:00 pm each day. Certain stores may open at 7:00 am or close at 10:00 pm.
Training and Development
We believe that our success and our growth are dependent upon hiring, training, retaining, developing and promoting qualified and enthusiastic employees who share our passion for delivering an extraordinary food shopping experience. We maintain a significant and growing resource library of training materials that facilitates the identification and exchange of expertise across all of our operations. Nearly all of our store managers and district managers are promoted from within, and we actively track and encourage mobility to ensure a sufficient pipeline of store managers and assistant store managers.
We provide our store management a number of analytical tools and training programs designed specifically to support the demands of operating a small-box, perishables-focused format. These tools include order review systems, production tools and labor scheduling programs, all of which ensure that we maintain high in-stock levels, minimize shrink and match staffing levels to sales volume and mix. In addition, we provide hands-on training and educational programs to our store employees and assistant managers.
We believe this comprehensive support allows our store management and employees to optimize the operating performance of our stores while fostering a “neighborhood grocer” feel for our customers.
Sourcing and Distribution
We source our products from over 1,000 vendors and suppliers. Our in-house merchants source only those products that meet our high specifications for quality, and we maintain strict control over which products are sold in our stores.
Our current distribution strategy is to capitalize on the capabilities of third-party logistics providers and, as such, we do not own warehouses, distribution facilities or transportation equipment. We currently outsource substantially all of our logistics functions to third-party distributors and vendors.
We believe that our distribution strategy enables us to:
• | focus on our core competency of in-store food retail rather than logistics; and |
• | capture scale efficiencies and increase negotiating power with both our suppliers and our distributors. |
6
With our logistics arrangements we seek to increase our efficiency, generate higher margins and achieve better returns. As a result, we are willing to switch logistics providers or consider new strategies from time to time when appropriate.
Since 2007, Burris Logistics has been our primary logistics provider, and has managed inventory replenishment, warehouse operations and transportation for all of our stores. Burris Logistics warehoused and distributed products that accounted for approximately 58% of the merchandise we purchased during fiscal 2015. The term of our agreement with Burris Logistics, as amended, extends into August, 2017 for one distribution center that serves our stores and February, 2018 for the remaining facility. We expect that Burris Logistics will have sufficient capacity to accommodate our anticipated growth through the short term and that we have various alternatives, including Burris Logistics, that we are pursuing at this time to support medium and long-term growth.
We also have certain direct to store vendors that distribute across all our stores, as well as individual, store-managed relationships with local vendors.
Marketing and Advertising
We believe that the distinct and superior food shopping experience we offer our customers, along with our careful curation of premium tasting products, has been a major driver of our comparable store sales growth in the past. Historically, we have relied on favorable word-of-mouth publicity to drive sales growth rather than traditional advertising activities, such as weekly newspaper circulars. In fiscal 2015, our marketing expense was 0.4% of annual revenues. We do, however, see a significant opportunity to proactively broaden awareness of our unique offering, re-engage with infrequent customers, and deepen relationships with existing customers. As a result, our marketing and advertising strategy is focused on the development of our customer engagement while communicating the story of our unique product offerings.
We spend most of our marketing budgets on in-store merchandising-related activities, including promotional signage and events, such as cooking demonstrations, product promotions, samplings and other seasonal events. We use in-store signage and a weekly electronic newsletter named “Fresh Ideas” to highlight promotions, new products, recipes and differentiated aspects of our products.
To supplement our in-store signage and word-of-mouth publicity, we use targeted marketing activities to drive awareness, customer engagement and loyalty. These activities include focused media buys in prioritized markets (e.g., to support grand openings), public relations strategies, personalized marketing in the form of email and direct mail, social media dialogue, and local community engagement through partnerships, sponsorships and charitable donations. In fiscal 2015, we started to test a new email receipt system for customers, which will allow us to deliver more targeted offers based on customer behavior.
We collect customer feedback through a dedicated customer loyalty team, monitoring and responding to social media dialogue, and frequent customer satisfaction studies, including a receipt-based customer satisfaction survey in which we analyze a significant number of responses each year.
Intellectual Property
We believe that our intellectual property has substantially contributed to the success of our business. In particular, our trademarks, including our registered The Fresh Market, Experience the Food and TFM trademarks, are valuable assets that reinforce our customers’ favorable perception of our stores. In addition to our trademarks, we believe that our trade dress, which includes the design, arrangement, color scheme and other physical characteristics of our stores and product displays, is a large part of the “neighborhood grocer” atmosphere we create in our stores and enables customers to distinguish our stores and products from those of our competitors.
From time to time, third parties have used names similar to ours, have applied to register trademarks similar to ours and, we believe, have infringed or misappropriated our intellectual property rights. Third parties have also, from time to time, opposed our trademarks and challenged our intellectual property rights. We respond to these actions on a case-by-case basis. The outcomes of these actions have included both negotiated out-of-court settlements as well as litigation.
In the ordinary course of our business, we evaluate the branding of our stores and products and how they are perceived by our customers. As part of this evaluation, we regularly develop new marks and explore using existing marks in new ways. Whether or not our The Fresh Market trademark rights are challenged in the future, we may decide (1) to continue to use The Fresh Market name and related design, (2) to use our other existing trademarks on a wider or different basis or (3) to develop new trademarks, which could also incorporate The Fresh Market name. If we undertake such an effort, we cannot assure you
7
that it would be successful in strengthening our brand or improving our brand recognition or image to our customers. However, we believe that the strength of our business is driven by the distinct and superior food shopping experience we offer our customers. We therefore believe that we will be able to expand our business and pursue our growth strategy even if The Fresh Market trademark and related design mark are impaired.
Regulatory
Our stores are subject to various local, state, federal and international laws, regulations and administrative practices affecting our business. We must comply with provisions regulating health and sanitation standards, food handling and labeling, weights and measures, non-discrimination, wages and hours, licensing for the sale of food, licensing for beer and wine or other alcoholic beverages, and many other regulations and ordinances. The manufacturing, processing, formulating, packaging, labeling and advertising of products are subject to regulation by various federal agencies, including the Food and Drug Administration, the Federal Trade Commission, the United States Department of Agriculture, the United States Consumer Product Safety Commission and the United States Environmental Protection Agency, as well as various state and local agencies.
Insurance
We use a combination of insurance and self-insurance to provide for potential liability for workers’ compensation, automobile and general liability, product liability, directors’ and officers’ liability, employee health care benefits, and other risks, including casualty and property risks. Changes in legal trends and interpretations, variability in inflation rates, changes in the nature and method of claims settlement, benefit level changes due to changes in applicable laws, insolvency of insurance carriers, and changes in discount rates could all affect ultimate settlements of claims. We evaluate our insurance requirements on an ongoing basis to ensure we maintain adequate levels of coverage.
Employees
As of January 31, 2016, we employed approximately 12,600 people, consisting of approximately 8,000 full-time employees and approximately 4,600 part-time employees, none of whom are subject to a collective bargaining agreement. We believe our employee relations are good.
Seasonality
The food retail industry and our sales are affected by seasonality. Our average weekly sales fluctuate during the year and are usually highest in the fourth quarter when customers make holiday purchases.
Inflation
While inflation may impact our sales and cost of goods sold, we believe the effects of inflation on our fiscal 2015 results of operations and financial condition were not material. We cannot assure you, however, that our results of operations and financial condition will not be materially impacted by inflation in the future.
Note on Terminology
References to “we,” “our,” “us,” “The Fresh Market” and the “Company” used throughout this document refer to The Fresh Market, Inc. and its subsidiaries.
Available Information
Our Annual Report on Form 10-K, Quarterly Reports on Form 10-Q, Current Reports on Form 8-K and our annual proxy statement, and any amendments to these reports, and filings under Sections 13 and 16 of the Securities Exchange Act of 1934, as amended (the “Exchange Act”), are available on our website at www.thefreshmarket.com, as soon as reasonably practicable after we file these reports electronically with, or furnish them to, the Securities and Exchange Commission (the “SEC”). Except as otherwise stated in these reports, the information contained on our website or available by hyperlink from our website is not incorporated into this Annual Report on Form 10-K or other documents we file with, or furnish to, the SEC.
8
Item 1A. Risk Factors.
Our business, financial condition and results of operations can be impacted by a number of risk factors, any one of which could cause our actual results to vary materially from recent results or from our anticipated future results. Any of these risks could materially and adversely affect our business, financial condition and results of operations, which in turn could materially and adversely affect the price of our common stock or other securities.
There are a number of risks and uncertainties associated with the proposed merger.
On March 11, 2016, we entered into an Agreement and Plan of Merger (the “Merger Agreement”) with Pomegranate Holdings, Inc., a Delaware corporation (“Parent”), and Pomegranate Merger Sub, Inc., a Delaware corporation and a wholly owned subsidiary of Parent. The Merger Agreement provides for our acquisition by Parent in a two-step all cash transaction, consisting of a tender offer (the “Offer”), followed by a subsequent back-end merger (the “Merger”). The proposed Merger is subject to various risks and uncertainties, including the following:
• | Uncertainties as to the timing of the Offer and the Merger; |
• | The risk that the Offer or the Merger may not be completed in a timely manner or at all; |
• | Uncertainties as to the percentage of our stockholders tendering their shares in the Offer; |
• | The possibility that competing offers or acquisition proposals will be made; |
• | The possibility that any or all of the various conditions to the consummation of the Offer or the Merger may not be satisfied or waived, including the failure to receive any required regulatory approvals from any applicable governmental entities (or any conditions, limitations or restrictions placed on such approvals); |
• | The occurrence of any event, change or other circumstance that could give rise to the termination of the Merger Agreement, including in circumstances which would require us to pay a termination fee or other expenses; |
• | Risks regarding the failure to obtain the necessary financing to complete the transactions contemplated by the Merger Agreement; |
• | Risks related to the debt financing arrangements entered into in connection with the Merger Agreement; |
• | The effect of the announcement or pendency of the transactions contemplated by the Merger Agreement on our ability to retain and hire key personnel, our ability to maintain relationships with our customers, suppliers and others with whom we do business, or our operating results and business generally; |
• | Risks related to diverting management’s attention from our ongoing business operations; and |
• | The risk that stockholder litigation in connection with the transactions contemplated by the Merger Agreement may result in significant costs of defense, indemnification and liability. |
If the Merger is not consummated for any reason, our stockholders will not receive the consideration that Parent has agreed to pay upon the consummation of the Merger, and the price of our common stock may decline to the extent that its current market price reflects an assumption that the Merger will be consummated. Such decline may be significant.
We face intense competition in our industry, and our failure to compete successfully may have an adverse effect on our profitability and operating results.
Food retail is a large and competitive industry. Our competition varies and includes national, regional and local conventional supermarkets, national superstores, alternative food retailers, natural foods stores, smaller specialty stores, and farmers’ markets. Each of these stores competes with us on the basis of product selection and quality, customer service, store format, location and price, or a combination of these factors. Some of these competitors may have been in business longer or may have greater financial or marketing resources than we do and may be able to devote greater resources to sourcing,
9
promoting and selling their products. We have seen an increase in pricing pressure on our products and, due to overall competition from traditional supermarkets as well as other specialty retail stores, we may face continued pricing pressure on our products, which could have a material negative impact on our gross margin.
Some competitors are aggressively expanding their number of stores or their product offerings, including within our core markets in the southeastern United States where competition in the past had been less intense. In their new or remodeled stores, our competitors often increase the space allocated to perishable food and specialty food categories, which are our core categories, and are lowering the prices of many of those items. If these competitors are able to offer perishable and specialty products comparable to those we sell, while also offering a wide range of traditional grocery and non-food items that we do not sell, customers may reduce the number of trips they make to our stores. In addition, if competitors offer lower prices than we do, and we do not make competitive price changes in response, consumers may perceive us as a higher-priced merchant and shop us only on “special occasions,” or not at all. Increased competition in proximity to our existing or future stores also may make obtaining suitable sites for new stores and employee retention more difficult and could raise our occupancy costs and our cost of hiring and retaining qualified employees.
As competition intensifies or competitors open stores within close proximity to our stores, our results of operations may be negatively impacted through a loss of sales, reduction in margin from competitive price changes and greater operating costs, including increased marketing expense. Our response, or failure to respond effectively, to these competitive actions could adversely affect our profitability and operating results. Further, any attempt by a competitor to copy or mimic our smaller-box format or operating model could materially impact our business, results of operations and financial condition by causing a decrease in our market share and our sales and operating results.
Failure to effectively execute or to realize the anticipated benefits of our announced strategic and financial review could have an adverse effect on our financial condition, results of operations, and cash flows.
On October 20, 2015, we announced that we and our Board of Directors are conducting a strategic and financial review of our business. In conjunction with the strategic and financial review, we have developed a long-term plan and identified certain strategic actions and initiatives to increase customer transactions and engagement, including pricing, customer service, marketing, and shrink reduction initiatives. The cost associated with these initiatives may have an impact on our results of operations before any benefits are realized, and the effort involved in implementing such initiatives may affect other areas of the business. There is no guarantee that we will be able to effectively implement these initiatives on the anticipated timeline or at all, or that the initiatives will have the intended effect. The inability to successfully implement these initiatives, or failure to do so as timely as we anticipate, could impact or may harm our business and could have an adverse effect on our financial condition, results of operations, and cash flows.
Our inability to improve levels of comparable store sales growth could have a material adverse effect on our business, financial condition and results of operations and cause our stock price to decline.
We may not be able to improve the levels of comparable store sales growth that we have experienced in the past. In addition, our overall comparable store sales have fluctuated in the past and will likely fluctuate in the future. In fiscal 2015, our comparable store sales declined. A variety of factors affect comparable store sales, including consumer preferences, buying trends and spending levels, competition, economic conditions, product pricing and availability, in-store merchandising-related activities, consumer perceptions of our stores, the frequency with which consumers visit our stores, and our ability to source and distribute products efficiently. In addition, many specialty retailers have been unable to sustain high levels of comparable store sales growth during and after periods of substantial expansion. These factors may cause our comparable store sales results to be materially lower than in past periods, which could have a material adverse effect on our business, financial condition and results of operations and result in a decline in the price of our common stock.
We may not be able to successfully implement our growth strategy on a timely basis or at all. Additionally, new stores may place a greater burden on our existing resources and adversely affect our existing business.
Our continued growth depends, in large part, on our ability to open new stores and to operate those stores successfully. Successful implementation of this strategy depends upon, among other things:
• | the identification of suitable and available sites for store locations, including sites in new markets; |
• | the negotiation of acceptable lease terms for store sites; |
10
• | the ability to continue to attract customers to our stores largely through favorable word-of-mouth publicity, supplemented by targeted marketing activities; |
• | the hiring, training and retention of skilled store personnel; |
• | the identification and relocation of experienced store management personnel; |
• | the effective management of inventory to meet the needs of our stores on a timely basis; |
• | the availability of sufficient levels of cash flow or necessary financing to support our expansion; and |
• | the ability to successfully address competitive merchandising, distribution and other challenges encountered in connection with expansion into new geographic areas and markets. |
Although we have modified our real estate process, to include greater emphasis on existing markets, we may not be able to identify suitable and available sites to support our growth strategy. The sites that are identified may not produce the levels of sales we predict or that are necessary for a new store to operate profitably. Further, new store openings in markets where we have existing stores may result in reduced sales volumes at our existing stores in those markets.
We, or our third-party vendors, may not be able to adapt our distribution, management information and other operating systems to adequately supply products to new stores at competitive prices so that we can operate the stores in a successful and profitable manner. We rely significantly on favorable word-of-mouth publicity to drive sales and we cannot assure you that we will continue to grow through new store openings or through favorable word-of-mouth publicity in the future. Additionally, store expansion over time into geographic areas in which we currently do not operate may place increased demands on our operational, managerial and administrative resources. These increased demands could cause us to operate our existing business less effectively, which in turn could cause deterioration in the financial performance of our existing stores. If we experience a decline in performance, or new stores or new markets do not meet our expectations, we may slow or discontinue store openings, or we may decide to close individual stores or exit a market, as we did in exiting the California market in March 2015. In the past fifteen years, we have closed nine stores before the expiration of their primary lease terms, three of which were closed during fiscal 2015 and four of which were closed during fiscal 2014, and all of which were in new markets outside our historical footprint. If we fail to successfully implement our growth strategy, including by opening new stores, our financial condition and operating results may be adversely affected.
Our new store base, or stores opened or acquired in the future, may negatively impact our financial results in the short term and may not achieve sales and operating levels consistent with our mature store base on a timely basis or at all.
We have actively pursued new store growth and plan to continue doing so in the future. Our growth continues to depend, in part, on our ability to open and operate new stores successfully. New stores may not achieve sustained sales and operating levels consistent with our mature store base on a timely basis or at all. This may have an adverse effect on our financial condition and operating results. In addition, if we acquire stores in the future, we may not be able to successfully integrate those stores into our existing store base and those stores may not be as profitable as our existing stores. We cannot assure you that our new store openings will be successful or result in greater sales and profitability for the Company. New stores build their sales volume and their customer base over time and, as a result, generally have lower gross margin rates and higher operating expenses, as a percentage of net sales, than our more mature stores. New store openings may negatively impact our financial results in the short term due to the effect of pre-opening and applicable store management relocation costs and lower sales and contribution to overall profitability. In addition, our comparative results from one fiscal period to another may be impacted by the relative timing of new store openings within those fiscal periods. Any failure to successfully open and operate new stores in the time frames and at the costs estimated by us could adversely affect our financial condition and operating results and result in a decline of the price of our common stock.
Another factor is our success in developing stores in new markets over time. There are inherent risks in opening new stores, especially in new markets, including the lack of experience, logistical support, and brand awareness. Some of our new stores may be located in areas where we have little or no brand recognition in local markets. Those markets may have different competitive and market conditions, consumer tastes and discretionary spending patterns than our existing markets, as well as higher costs of entry, which may cause our new stores to be less successful than stores in existing markets. These factors may result in lower than anticipated sales and cash flow for stores in new markets along with higher pre-opening costs. In the event
11
that stores in new markets do not achieve the sales that we expect, we may expend additional resources through advertising, promotions or service offerings in order to improve sales performance. Further, if expected sales are not achieved and our efforts to increase sales and store profitability do not succeed, we may be forced to take an impairment charge, if future undiscounted cash flows expected to be generated by an asset group do not exceed the carrying value of that asset group, or close the underperforming store.
Our inability to maintain or increase our operating margins could adversely affect our results of operations and the price of our stock.
We may not be able to maintain or increase our operating margins. If we are unable to successfully manage the potential difficulties associated with store growth, we may not be able to capture the scale efficiencies that we expect from expansion. If we are not able to capture scale efficiencies, improve our systems, continue our cost discipline and enhance our merchandise offerings, we may not be able to achieve our goals with respect to operating margins. In addition, if we do not adequately refine and improve our various ordering, tracking and allocation systems, we may not be able to increase sales and reduce inventory shrinkage. As a result, our operating margins may stagnate or decline, which could adversely affect the price of our stock. Further, strategic pricing changes or promotions may reduce operating margins if we are unsuccessful in increasing customer transactions and overall sales.
We are substantially dependent on a few key third-party vendors to provide logistical services for our stores, including services related to inventory replenishment and the storage and transportation of many of our products. A disruption in these relationships or a key distribution center, or a failure to renew or replace existing contractual relationships, may have a negative effect on our results of operations and financial condition.
We currently rely upon independent third-party service providers for all product shipments to our stores. In particular, we rely on one third-party service provider, Burris Logistics, to provide key services related to inventory management, warehousing and transportation, and, as a result, much of the product is stored at warehouses maintained by Burris Logistics. See “Item 1. Business-Sourcing and Distribution.” Products sourced and distributed through Burris Logistics accounted for approximately 58% of the merchandise we purchased during fiscal 2015.
The provisions of our current agreement with Burris Logistics that relate to the distribution center that handles the majority of the products that are sourced for and distributed to us by Burris Logistics expire in August, 2017. We are pursuing multiple possible distribution arrangements, including renewing or extending our agreement with Burris Logistics. If we do not put alternative arrangements into place by August, 2017, we may not be able to renew or extend our agreement with Burris Logistics on favorable terms or at all. Although we have not experienced significant difficulty in our inventory management, warehousing and transportation to date with Burris Logistics, interruptions could occur as a result of the expiration of the current agreement or for other reasons in the future, including risks associated with a transition to a new provider. Further, although we expect that Burris Logistics, and our other key vendors, will have sufficient capacity to accommodate our anticipated growth, they may not have the resources to do so. Any significant disruptions in our relationship with Burris Logistics to service our stores prior to the end of the current term of our agreement, or significant disruptions in our relationships with our other key vendors, including due to their inability to accommodate our growth, would make it difficult for us to continue to operate our existing business or pursue our growth plans until we execute replacement agreements or develop and implement self-distribution processes. In addition, if our vendors fail to comply with transportation or other laws and regulations, or face allegations of non-compliance, their operations may be disrupted.
While we believe that other third-party service providers could provide similar services on reasonable terms, they are limited in number and we cannot assure you that we would be able to find a replacement distributor on a timely basis or that such distributor would be able to fulfill our demands on commercially reasonable terms, which could have a material adverse effect on our results of operations and financial condition. We also believe that other distribution strategies may be available, but any such strategies could require significant time to implement, and there is no assurance that such strategies would result in cost savings or adequate service levels. In addition, labor shortages in the transportation industry, long-term disruptions to the national and international transportation infrastructure, reduction in capacity and industry-specific regulations such as hours-of-service rules that lead to delays or interruptions of deliveries could negatively affect our business.
Economic conditions that impact consumer spending could materially affect our business.
Ongoing economic uncertainty continues to negatively affect consumer confidence and discretionary spending. Our results of operations may be materially affected by changes in overall economic conditions that impact consumer confidence
12
and spending, including discretionary spending. This risk may be exacerbated if customers choose lower-cost alternatives to our product offerings in response to economic conditions, or if consumers perceive our stores as destinations for special occasions rather than regular shopping. Future economic conditions affecting disposable consumer income such as employment levels, business conditions, changes in housing market conditions, the availability of consumer credit, interest rates, tax rates, and fuel and energy costs, could reduce consumer spending or cause consumers to shift their spending to lower-priced competitors. In addition, inflation or deflation can impact our business. Food deflation could reduce sales growth and earnings, while food inflation, combined with reduced consumer spending, could reduce gross profit margins. As a result, our results of operations could be materially adversely affected.
Our business could be harmed by a failure of our information technology, administrative or outsourcing systems, including a security breach.
We rely on our information technology, administrative and outsourcing systems to effectively manage our business data, communications, supply chain, order entry and fulfillment and other business processes, such as our financial and reporting systems. The failure of our information technology, administrative or outsourcing systems to perform as we anticipate could disrupt our business and result in transaction errors, processing inefficiencies and the loss of sales and customers, causing our business to suffer. In addition, our information technology, administrative and outsourcing systems may be vulnerable to damage or interruption from circumstances beyond our control, including fire, natural disasters, systems failures, viruses and other malware, security breaches, including breaches of our transaction processing or other systems that could result in the compromise of confidential or sensitive customer, employee or Company data, and usage errors or other actions by an employee. Further, we process a large number of credit and debit card transactions each year. We may also collect and store personal information relating to our employees and customers. Such cardholder and personal information may be processed or stored by third parties, and we rely on those third parties to protect the security of such information in their possession or control. Third parties may also have access to our secured systems for business purposes. A security breach, whether of our systems or those of key third parties, may compromise the security of such systems, credit and debit card transactions, or personal information, as well as confidential or sensitive corporate information, and may continue undetected for a period of time, increasing the potential impact on such data. Due to the evolving nature of cyber security threats, the scope and impact of any incident cannot be predicted. While we actively manage information technology security risks within our control to protect against data security breaches, there can be no assurance that such breaches will not occur, be detected in a timely manner or be covered by insurance. Any such breach, damage or interruption could have a material adverse effect on our business, result in the disclosure of confidential, sensitive, or proprietary business information, cause us to face significant fines, customer notice obligations or costly litigation, harm our reputation with our customers, reduce customers’ willingness to use credit and debit cards in our stores, require us to expend significant time and expense developing, maintaining or upgrading our information technology, administrative or outsourcing systems or prevent us from paying our suppliers or employees, receiving payments from our customers or performing other information technology, administrative or outsourcing services on a timely basis. Data security breaches are increasing in frequency and sophistication and breaches suffered by well-known companies and institutions have attracted a substantial amount of media attention, prompting new federal and state laws and legislative proposals addressing data privacy and security, as well as increased data protection obligations imposed on merchants by credit card issuers. As a result, we may become subject to more extensive requirements to protect the financial and personal information that we handle, and incur significant compliance costs.
We may be unable to protect or maintain our intellectual property, including The Fresh Market trademark, which could result in customer confusion and adversely affect our business.
We believe that our intellectual property has substantially contributed to the success of our business. In particular, our trademarks, including our registered The Fresh Market, Experience the Food and TFM trademarks, are valuable assets that reinforce our customers’ favorable perception of our stores.
From time to time, third parties have used names similar to ours, have applied to register trademarks similar to ours and, we believe, have infringed or misappropriated our intellectual property rights. If we are unable to prevent third parties from using such names and trademarks, the value of our registered trademarks may be diluted and customer confusion may result. Third parties have also, from time to time, opposed our trademarks and challenged our intellectual property rights. We respond to these actions on a case-by-case basis. The outcomes of these actions have included both negotiated out-of-court settlements and litigation.
In the ordinary course of our business, we evaluate the branding of our stores and products and how they are perceived by our customers. As part of this evaluation, we regularly develop new marks and explore using existing marks in new ways.
13
Whether or not our The Fresh Market trademark rights are challenged in the future, we may decide (1) to continue to use The Fresh Market name and related design, (2) to use our other existing trademarks on a wider or different basis or (3) to develop new trademarks, which could also incorporate The Fresh Market name. If we undertake such an effort, we cannot assure you that it would be successful in strengthening our brand or improving our brand recognition or image to our customers. However, we believe that the strength of our business is driven by the distinct and superior food shopping experience we offer our customers. We therefore believe that we will be able to expand our business and pursue our growth strategy even if The Fresh Market trademark and related design mark are impaired.
Our success depends on our ability to identify, source and market new products that meet our high standards and customer preferences and our ability to offer our customers an aesthetically pleasing shopping environment.
Our success depends on our ability to identify, source and market new products that both meet our standards for quality and appeal to customers’ preferences. Consumer preferences may change rapidly and without warning. A change in consumer preferences away from our offerings could have a material adverse effect on our business. A small number of our employees, including our in-house merchants, are primarily responsible for both sourcing products that meet our high specifications and identifying and responding to changing customer preferences. Failure to source and market such products, or to accurately forecast changing customer preferences, could lead to a decrease in the number of customer transactions at our stores and a decrease in the amount customers spend when they visit our stores. In addition, the sourcing of our products is dependent, in part, on our relationships with our vendors. If we are unable to maintain these relationships we may not be able to continue to source products at competitive prices that both meet our standards and appeal to our customers. We also attempt to create a pleasant and appealing shopping experience. If we are not successful in creating a pleasant and appealing shopping experience we may lose customers to our competitors. If we do not succeed in maintaining good relationships with our vendors and in introducing and sourcing new products that consumers want to buy, or if we are unable to provide a pleasant and appealing shopping environment or maintain our level of customer service, our sales, operating margins and market share may decrease, resulting in reduced profitability.
Our stores rely heavily on sales of perishable products, and ordering errors or product supply disruptions may have an adverse effect on our profitability and operating results.
We have a significant focus on perishable products. Sales of perishable products accounted for approximately two-thirds of our total sales in fiscal 2015. We rely on various suppliers and vendors to provide and deliver our perishable product inventory on a continuous basis. We could suffer significant product inventory losses in the event of the loss of a major supplier or vendor, disruption of our distribution network, extended power outages, natural disasters or other catastrophic occurrences. We have implemented certain systems to ensure our ordering is in line with demand. We cannot assure you, however, that our ordering systems will always work efficiently, in particular in connection with the opening of new stores, which have no, or a limited, ordering history. If we were to over-order, we could suffer inventory losses, which would negatively impact our operating results, while under-ordering could leave us unable to meet consumer demand.
Increased commodity prices may impact profitability.
Many of our products include inputs such as wheat, corn, oils, milk, sugar, cocoa and other commodities. Commodity prices worldwide may fluctuate widely. While commodity prices do not typically represent the substantial majority of our product costs, any increase in commodity prices may cause our vendors to seek price increases from us (including, for example, prices for proteins and the ingredients for prepared foods). Although we typically are able to resist vendor efforts to increase costs to us, we may be unable to continue to do so, either in whole or in part. In the event we are unable to resist our vendors’ requests to obtain price increases, we may in turn consider raising our prices, and our customers may resist any such price increases. Our profitability may be impacted through increased costs to us which may impact gross margins or through reduced revenue as a result of a decline in the number and average size of customer transactions.
The current geographic concentration of our stores creates an exposure to local economies, regional downturns or severe weather or catastrophic occurrences that may materially adversely affect our financial condition and results of operations.
As of January 31, 2016, we operated 42 stores in Florida, making Florida our largest market and representing approximately 23% of our total stores. We also have store concentration in North Carolina, Virginia and Georgia, operating 22 stores, 14 stores, and 14 stores in those states, respectively. As a result, our business is currently more susceptible to regional conditions than the operations of more geographically diversified competitors, and we are vulnerable to economic downturns in
14
those regions. Any unforeseen events or circumstances that negatively affect these areas could materially adversely affect our revenues and profitability. These factors include, among other things, changes in demographics and population.
Severe weather conditions and other catastrophic occurrences in areas in which we have stores or from which we obtain products may materially adversely affect our results of operations. Such conditions may result in physical damage to our stores, loss of inventory, closure of one or more of our stores, inadequate work force in our markets, temporary disruption in the supply of products, delays in the delivery of goods to our stores and a reduction in the availability of products in our stores. Any of these factors may disrupt our businesses and materially adversely affect our financial condition and results of operations.
We have significant lease obligations, which may require us to continue paying rent for store locations that we no longer operate.
All of our stores are leased and we are subject to risks associated with our current and future real estate leases for our stores. Our costs could increase because of changes in the real estate markets, entry into new, higher cost markets and supply or demand for real estate sites. We generally cannot cancel our leases, so if we decide to close or relocate a location, we may nonetheless be committed to perform our obligations under the applicable lease, including paying the base rent for the remaining lease term, and we may not be able to find acceptable assignees or sublessees for such locations. As each lease expires, we may fail to negotiate renewals, either on commercially acceptable terms or any terms at all and we may not be able to find replacement locations that will provide for the same success as current store locations.
Our high level of fixed lease obligations could adversely affect our financial performance.
Our high level of fixed lease obligations will require us to use a portion of cash generated by our operations to satisfy these obligations, and could adversely impact our ability to obtain future financing, if required, to support our growth or other operational investments. We will require substantial cash flows from operations to make our payments under our leases, which generally provide for periodic increases in rent. If we are not able to make the required payments under the leases, the owners of the relevant properties may, among other things, repossess those assets, which could adversely affect our ability to conduct our operations. In addition, our failure to make payments under certain leases could trigger defaults under agreements governing our indebtedness, which could cause the counterparties under those agreements to accelerate the obligations due thereunder.
Future consumer, employment or other litigation could adversely affect our financial condition and results of operation.
Our retail operations are characterized by transactions involving a wide array of product selections, including prepared food. These operations carry a higher exposure to consumer litigation risk when compared to the operations of companies operating in many other industries. Consequently, we have been, are, and may in the future become a party to individual personal injury, products liability and other legal actions in the ordinary course of our business. While these actions are generally routine in nature, incidental to the operation of our business and immaterial in scope, if our assessment of any action or actions should prove inaccurate, our financial condition and results of operations could be adversely affected.
Additionally, we are occasionally exposed to industry-wide or class-action claims arising from the products we carry or industry-specific business practices. Products that we sell may carry claims, whether stated or implied, as to their origin, ingredients or health benefits, including, by way of example, the use of terms such as “natural.” The use of these terms may not be subject to uniform standards. The resulting uncertainty has led to consumer confusion, distrust and legal challenges. Plaintiffs have commenced legal actions, including class actions, against a number of food companies, asserting claims for alleged false, misleading and deceptive advertising and labeling, including claims related to genetically modified ingredients. Should we become subject to similar claims, consumers may avoid purchasing products from us or seek alternatives, even if the basis for the claim is unfounded. Adverse publicity about these matters may discourage consumers from buying our products. Due to the nature of class action litigation, the cost of defending against any such claims could be significant. Any loss of confidence on the part of consumers in the truthfulness of our labeling or ingredient claims would be difficult and costly to overcome and may significantly reduce our brand value. Any of these events could adversely affect our reputation and brand and decrease our sales, which would have a material adverse effect on our business, financial condition and results of operations.
We also have been, are, and may in the future become subject to claims for discrimination, harassment, wages and hours, and other federal and or/state employment matters, including claims that may be brought on behalf of a putative class of employees. For example, we are party to a lawsuit that was filed against us in U.S. District Court in Connecticut alleging that
15
the manner in which we previously implemented and applied the fluctuating workweek method for calculating overtime due to our department managers violated the federal Fair Labor Standards Act. Certain claims asserted in such lawsuits, if resolved against us, could give rise to substantial damages. Our defense costs and any resulting damage awards or settlement amounts are not covered by insurance. Thus, an unfavorable outcome or settlement of one or more of these lawsuits could have a material adverse effect on our financial position, liquidity and results of operations in a particular period or periods.
We have recorded store asset impairment charges in the past and we may be required to recognize impairment charges in the future.
Pursuant to U.S. generally accepted accounting principles (“U.S. GAAP”), we are required to recognize an impairment charge when circumstances indicate that the carrying value of long-lived assets may not be recoverable. Our judgment regarding the existence of circumstances that indicate an asset’s carrying value may not be recoverable, and therefore potentially impaired, is based on several factors, including a decision to close a store or negative or declining operating cash flows. If a determination is made that the asset’s carrying value is not recoverable over its estimated useful life, the asset is written down to estimated fair value, if lower. We recognized impairment charges related to under-performing stores of approximately $5.6 million, $9.0 million and $26.8 million in fiscal 2015, 2014 and 2013, respectively. Our cash flow projections look several years into the future and include assumptions concerning variables such as the potential impact of operational changes, competitive factors, inflation and the economy. Our estimate of fair value used in calculating an impairment loss is based on market values, if available, or our estimated future cash flow projections discounted to their present value. If these estimates or projections change, we may be required to record impairment charges on certain of these assets, which would negatively impact our results.
Changes in accounting standards and estimates could materially impact our results of operations.
Generally accepted accounting principles and related accounting pronouncements, implementation guidelines and interpretations for many aspects of our business, such as accounting for inventories, impairment of long-lived assets, insurance reserves, closed store reserves, leases, unclaimed property laws, income taxes and share-based compensation, are highly complex and involve subjective judgments. Changes in these rules or their interpretation or changes in underlying estimates, assumptions or judgments by our management could significantly change our reported or expected earnings.
Also, new accounting guidance may require systems and other changes that could increase our operating costs or change our financial statements. Implementing future accounting guidance related to leases and other areas may be impacted by the newly issued accounting pronouncements and standards.
Risks associated with insurance plan claims and actuarial estimates could increase future expenses.
We use a combination of insurance and self-insurance to provide for potential liability for workers’ compensation, automobile and general liability, product liability, director and officers’ liability, employee health care benefits, and other risks, including casualty and property risks. The liability for these claims has been determined using actuarial estimates of the aggregate liability for claims incurred and an estimate of incurred but not reported claims, on an undiscounted basis. Any actuarial projection of losses is subject to a high degree of variability. Changes in legal trends and interpretations, variability in inflation rates, changes in the nature and method of claims settlement, benefit level changes due to changes in applicable laws, insolvency of insurance carriers and changes in discount rates could all affect the level of reserves required and could cause material future expense to maintain reserves at appropriate levels.
Health care reform could adversely affect our business.
Our expenses relating to employee health benefits are significant. The Affordable Care Act requires employers to provide employees with insurance coverage that meets minimum eligibility and coverage requirements or face penalties. The legislation includes provisions that impact the number of individuals with insurance coverage, the types of coverage and the level of health benefits that are required and the amount of payment health care providers will receive. Our compliance with such provisions may increase our employee healthcare-related costs and therefore our operating expenses.
Energy costs are a significant component of our operating expenses and increasing energy costs, unless offset by more efficient usage or other operational responses, may impact our profitability.
We utilize natural gas, water, sewer and electricity in our stores and our third-party logistics providers use gasoline and diesel fuel in the trucks that deliver products to our stores. Increases in energy costs, whether driven by increased demand,
16
decreased or disrupted supply or an anticipation of any such events will increase the costs of operating our stores and may increase the costs of our products. We may not be able to recover such rising costs, should they occur, through increased prices charged to our customers, and any increased prices may exacerbate the risk of customers choosing lower-cost alternatives. In addition, if we are unsuccessful in attempts to protect against increases in energy costs through energy contracts, improved energy procurement, improved efficiency and other operational improvements, the overall costs of operating our stores will increase, which would impact our profitability.
Products we sell could cause unexpected side effects, illness, injury or death that could result in their discontinuance or expose us to lawsuits, either of which could result in unexpected costs and damage to our reputation.
There is increasing governmental scrutiny of and public awareness regarding food safety. Unexpected side effects, illness, injury or death caused by products we sell, whether food or non-food, could result in the discontinuance of sales of these products or prevent us from achieving market acceptance of the affected products. Such side effects, illnesses, injuries and death could also expose us to product liability or negligence lawsuits. In particular, the sale of food products entails an inherent risk of product liability claims, product recalls and the resulting negative publicity. Food products containing contaminants or allergens could be inadvertently manufactured, prepared or distributed by us and, if processing at the consumer level does not eliminate them, these contaminants or allergens could result in illness or death. We cannot assure you that product liability claims will not be asserted against us or that we will not be obligated to perform product recalls in the future, whether on food or other products. Any such claims, recalls or adverse publicity with respect to our private-label products may have an even greater negative effect on our sales and operating results, in addition to generating adverse publicity for our private-label brand.
Any claims brought against us may exceed our existing or future insurance policy coverage or limits, or not be covered by any rights to indemnity or contribution we have against others. Our insurance carriers may contest their coverage obligations. Any judgment against us that is in excess of our available insurance coverage would have to be paid from our cash reserves, which would reduce our capital resources. Further, we may not have sufficient capital resources to pay a judgment, in which case our creditors could levy against our assets. The real or perceived sale of contaminated or harmful products would cause negative publicity regarding the Company, or our brand or products, which could in turn harm our reputation and net sales, and could have a material adverse effect on our business, results of operations or financial condition.
We may experience negative effects to our reputation from real or perceived quality or health issues with our food products, which could have an adverse effect on our operating results.
We believe customers count on us to provide them with fresh, high-quality food products. Concerns regarding the quality or safety of our food products or our food supply chain could cause consumers to avoid purchasing certain products from us, or to seek alternative sources of food, even if the basis for the concern is unfounded, has been addressed or is outside of our control. Adverse publicity about these concerns, whether or not ultimately based on fact, and whether or not involving products sold at our stores, could discourage consumers from buying our products which could have an adverse effect on our reputation, brand and operating results.
Any lost confidence on the part of our customers would be difficult and costly to reestablish. Any such adverse effect could be exacerbated by our position in the market as a purveyor of fresh, high-quality food products and could significantly reduce our brand value. Issues regarding the safety of any food items sold by us, regardless of the cause, could have a substantial and adverse effect on our sales and operating results.
If we fail to maintain our reputation and the value of our brand, our sales may decline.
We believe our continued success depends on our ability to maintain and grow the value of The Fresh Market brand. Maintaining, promoting and positioning our brand and reputation will depend largely on the success of our marketing and merchandising efforts and our ability to provide a consistent, high-quality customer experience. Brand value is based in large part on perceptions of subjective qualities, and even isolated incidents can erode trust and confidence, particularly if they result in adverse publicity, governmental investigations or litigation. Our brand could be adversely affected if we fail to achieve these objectives, or if our public image or reputation were to be tarnished by negative publicity.
The occurrence of a widespread health epidemic could materially adversely affect our financial condition and results of operations.
Our business may be severely impacted by a widespread regional, national or global health epidemic, such as pandemic flu. Such an epidemic could materially adversely affect our business by disrupting production and delivery of
17
products to our stores, by impacting our ability to appropriately staff our stores and by causing customers to avoid public gathering places, such as our stores, or otherwise change their shopping behaviors.
If we are unable to attract, train and retain employees, we may not be able to grow or successfully operate our business.
The food retail industry is labor intensive, and our success depends in part upon our ability to attract, train and retain a sufficient number of employees who understand and appreciate our culture, are mobile in order to support our growth, and are able to represent our brand effectively and establish credibility with our business partners and consumers. Our strategy of offering high quality services and assistance for our customers requires a highly trained and engaged workforce. The turnover rate in the retail industry is relatively high, and there is an ongoing need to recruit and train new employees in existing stores while also staffing new stores. Our ability to meet our labor needs, while controlling wage and labor-related costs, is subject to numerous external factors, including the availability of a sufficient number of qualified persons in the workforce in the markets in which we are located, unemployment levels within those markets, unionization of the available workforce, prevailing wage rates, changing demographics, health and other insurance costs and changes in employment legislation. Factors that affect our ability to maintain sufficient numbers of qualified employees include employee morale, our reputation, competition from other employers and our ability to offer appropriate compensation packages.
Increasingly, our wage and labor-related costs are potentially affected by federal, state, and local legislative or administrative actions. The U.S. Department of Labor has proposed regulations, expected to take effect during 2016, that would more than double the existing salary threshold for exempt status under the Fair Labor Standards Act (“FLSA”) and may, in addition, revise the requirements relating to the types of duties that exempt employees must perform. The effect of these changes, if they become effective, would be to raise the salary levels for certain positions at our stores, or to expand the number of employees who are entitled to overtime compensation under the FLSA. If we reduce labor hours in response, customer service in our stores may suffer. Furthermore, various movements have sought to increase retail employee wages, with some effect on minimum wage rates in certain localities, which may also cause wage rates above the minimum to increase in those markets. In the event of increasing wage rates, if we fail to increase our wages competitively, the quality of our workforce could decline, causing our customer service to suffer, while increasing our wages could cause our earnings to decrease. If we are unable to hire and retain employees capable of meeting our business needs and expectations, our business and brand image and our ability to pursue growth opportunities may be impaired. Any failure to meet our staffing needs or any material increase in turnover rates of our employees may adversely affect our business, results of operations and financial condition.
Union attempts to organize our employees could negatively affect our business.
None of our employees are currently subject to a collective bargaining agreement. As we continue to grow and enter different regions, unions may attempt to organize all or part of our employee base at certain stores or within certain regions. Responding to such organization attempts may distract management and employees and may have a negative financial impact on individual stores, or on our business as a whole.
Various aspects of our business are subject to federal, state and local laws and regulations. Our compliance with these laws and regulations may require additional capital expenditures and could materially adversely affect our ability to conduct our business as planned.
We are subject to federal, state and local laws and regulations relating to matters such as product labeling, weights and measures, zoning, land use, environmental protection, workplace safety, food safety, public health, and alcoholic beverage sales. States in which we operate and several local jurisdictions regulate the licensing of supermarkets and the sale of alcoholic beverages. In addition, certain local regulations may limit our ability to sell alcoholic beverages at certain times. We are also subject to laws governing our relationship with employees, including minimum wage requirements, overtime, working conditions, benefits such as paid sick leave, immigration, disabled access and work permit requirements. Federal and state regulatory agencies may impose additional regulations that raise the cost of operating our business or cause us to make changes to our operations. Such regulations may include, but are not limited to, the U.S. Department of Labor’s proposed changes to the standards for exempt status under the Fair Labor Standards Act, the U.S. Food and Drug Administration’s rulemaking regarding menu labeling and the various rules promulgated under the Food Safety Modernization Act, and the U.S. Department of Agriculture’s rulemaking on recordkeeping related to raw beef products ground in stores. In addition, state or local legislatures have passed or may pass laws regarding the labeling of products made with genetically modified organisms and other laws that would impact our operations, including but not limited to increasing the costs associated with our supply chain, packaging and labeling, employee compensation and benefits, and store operations. Compliance with new laws in these areas, or with new or stricter interpretations of existing requirements, could reduce the revenue and profitability of our stores and could otherwise
18
materially adversely affect our business, financial condition or results of operations. Such changes in applicable law also may cause us to alter the types of products or services that we offer, or affect our ability to profitably operate stores in certain jurisdictions. Further, our new store openings could be delayed or prevented or our existing stores could be impacted by difficulties or failures in our ability to obtain or maintain required approvals or licenses. Our stores are subject to unscheduled inspections on a regular basis, which, if violations are found, could result in the assessment of fines, suspension of one or more needed licenses and, in the case of repeated “critical” violations, closure of the store until a re-inspection demonstrates that we have remediated the problem. We cannot predict the nature of future laws, regulations, interpretations or applications, or determine what effect either additional government regulations or administrative orders, when and if promulgated, or disparate federal, state and local regulatory schemes would have on our business in the future.
The terms of our revolving credit facility may restrict our current and future operations, which could adversely affect our ability to respond to changes in our business and to manage our operations.
Our revolving credit facility contains, and any additional debt financing we may incur would likely contain, covenants that restrict our operations, including limitations on our ability to grant liens, incur additional debt, pay dividends, redeem our common stock, make certain investments and engage in certain merger, consolidation or asset sale transactions. A failure by us to comply with the covenants or financial ratios contained in our revolving credit facility could result in an event of default, which could adversely affect our ability to respond to changes in our business and manage our operations. Upon the occurrence of an event of default, the lenders could elect to declare all amounts outstanding to be due and payable and exercise other remedies as set forth in our revolving credit facility. If the indebtedness under our revolving credit facility were to be accelerated, our future financial condition could be materially adversely affected.
We will require significant capital to fund our expanding business, which may not be available to us on satisfactory terms or at all.
To support our expanding business and pursue our growth strategy, we will utilize significant amounts of cash generated by our operations to pay our lease obligations, build out new store space, purchase inventory, pay personnel, further invest in our infrastructure and facilities, and pay for the costs associated with operating as a public company. We primarily depend on cash flow from operations and borrowings under our revolving credit facility to fund our business and growth plans. If our business does not generate sufficient cash flow from operations to fund these activities, and sufficient funds are not otherwise available to us under our revolving credit facility, we may need additional equity or debt financing. If such financing is not available to us, or is not available to us on satisfactory terms, our ability to operate and expand our business or to respond to competitive pressures would be limited and we could be required to delay, significantly curtail or eliminate planned store openings or operations or other elements of our growth strategy.
We may incur additional indebtedness in the future which could adversely affect our financial health and our ability to react to changes to our business.
We may incur additional indebtedness in the future. Any increase in the amount of our indebtedness could require us to divert funds identified for other purposes for debt service and impair our liquidity position. If we cannot generate sufficient cash flow from operations to service our debt, we may need to refinance our debt, dispose of assets or issue equity to obtain necessary funds. We do not know whether we will be able to take any of such actions on a timely basis, on terms satisfactory to us or at all. Our level of indebtedness has important consequences to you and your investment in our common stock.
For example, our level of indebtedness may:
• | require us to use a substantial portion of our cash flow from operations to pay interest and principal on our debt, which would reduce the funds available to us for working capital, capital expenditures, including new store growth, relocations, remodels, and refreshes, and other general corporate purposes; |
• | limit our ability to pay future dividends; |
• | limit our ability to obtain additional financing for working capital, capital expenditures, expansion plans and other investments, which may limit our ability to implement our business strategy; |
• | heighten our vulnerability to downturns in our business, the food retail industry or in the general economy and limit our flexibility in planning for, or reacting to, changes in our business and the food retail industry; or |
19
• | prevent us from taking advantage of business opportunities as they arise or successfully carrying out our plans to expand our store base and product offerings. |
We cannot assure you that our business will generate sufficient cash flow from operations or that future borrowings will be available to us in amounts sufficient to enable us to make payments on our indebtedness or to fund our operations.
A failure of our internal control over financial reporting could materially impact our business or stock price.
Our management is responsible for establishing and maintaining adequate internal control over financial reporting. An internal control system, no matter how well designed and operated, can provide only reasonable, not absolute, assurance that the objectives of the control system are met. Further, the design of a control system must reflect the fact that there are resource constraints, and the benefits of controls must be considered relative to their costs. Because of the inherent limitations in all internal control systems, internal control over financial reporting may not prevent or detect misstatements.
Any failure to maintain an effective system of internal control over financial reporting could limit our ability to report our financial results accurately and timely or to detect and prevent fraud, and could expose us to litigation or adversely affect the market price of our common stock. Our management concluded that its internal control over financial reporting was effective as of January 31, 2016. See “Item 9A. Controls and Procedures — Management’s Annual Report on Internal Control Over Financial Reporting.”
Prior to our initial public offering, we were treated as an S-corporation under Subchapter S of the Internal Revenue Code, and claims of taxing authorities related to our prior status as an S-corporation could harm us.
Prior to November 2010, we were treated as an S-corporation. If the unaudited, open tax years in which we were an S-corporation are audited by the Internal Revenue Service, and we are determined not to have qualified for, or to have violated, our S-corporation status, we will be obligated to pay back taxes, interest and penalties, and we do not have the right to reclaim tax distributions we have made to our stockholders during those periods. These amounts could include taxes on all of our taxable income while we were an S-corporation. Any such claims could result in additional costs to us and could have a material adverse effect on our results of operations and financial condition.
We have entered into a tax indemnification agreement with certain stockholders and could become obligated to make payments to them for any additional federal, state or local income taxes assessed against them for fiscal periods prior to the initial public offering.
Prior to November 2010, we were treated as an S-corporation. In the event of an adjustment to our reported taxable income for a period or periods prior to termination of our S-corporation status, our stockholders at that time could be liable for additional income taxes for those prior periods. Pursuant to a tax indemnification agreement into which we entered with certain stockholders, we agreed that upon filing any tax return (amended or otherwise), or in the event of any restatement of our taxable income, in each case for any period during which we were an S-corporation, we will make a payment to each stockholder on a pro rata basis in an amount sufficient so that the stockholder with the highest incremental estimated tax liability (calculated as if the stockholder would be taxable on its allocable share of our taxable income at the highest applicable federal, state and local tax rates and taking into account all amounts we previously distributed in respect of taxes for the relevant period) receives a payment equal to its incremental tax liability. Depending on the respective tax rates of such stockholders, the aggregate amount that we would be required to pay to the stockholders may be greater than the total amount of additional income taxes assessed. We also agreed to indemnify the stockholders for any interest, penalties, losses, costs or expenses (including reasonable attorneys’ fees) arising out of any claim under the agreement.
Item 1B. Unresolved Staff Comments.
None.
20
Item 2. Properties.
Our corporate headquarters are located in Greensboro, North Carolina and, as of January 31, 2016, we operated 184 stores in 27 states. In fiscal years 2015 and 2014 we increased our store base by 15 and 18 stores, respectively. The following store list shows the number of stores operated in each state as of January 31, 2016:
Total Number of | Total Number of | |||||
State | Stores | State | Stores | |||
Alabama | 7 | Missouri | 1 | |||
Arkansas | 2 | New Hampshire | 1 | |||
Connecticut | 3 | New Jersey | 3 | |||
Florida | 42 | New York | 5 | |||
Georgia | 14 | North Carolina | 22 | |||
Illinois | 9 | Ohio | 6 | |||
Indiana | 5 | Oklahoma | 1 | |||
Iowa | 2 | Pennsylvania | 5 | |||
Kansas | 2 | South Carolina | 8 | |||
Kentucky | 3 | Tennessee | 8 | |||
Louisiana | 5 | Texas | 8 | |||
Maryland | 4 | Virginia | 14 | |||
Massachusetts | 1 | Wisconsin | 2 | |||
Mississippi | 1 | |||||
Total | 184 | |||||
We currently lease all of our stores as well as our corporate headquarters. Our typical lease has a primary term of 10 to 15 years, with multiple options to renew that extend the term of our control. We do not believe that any individual store property is material to our financial condition or results of operation. Additionally, we lease certain buildings under capital lease agreements, and in other instances we have leased buildings in which we are considered the owner of the building for accounting purposes.
Of the leases for our stores, one expires in fiscal 2016, eight expire in fiscal 2017 and the balance expire at varying terms thereafter. We control options to renew and extend the terms of each of the store leases scheduled to expire in fiscal 2016 and fiscal 2017.
In addition to new store openings, we occasionally refresh or remodel and relocate existing stores to improve operating performance. Despite the relative youth of much of our store base, we continuously consider whether any of our stores need to be refreshed, remodeled or relocated. We generally relocate stores to improve site characteristics or if customer demographics in the area have changed. We plan to refresh or remodel approximately 8 to 12 stores in fiscal 2016.
Item 3. Legal Proceedings.
In the ordinary course of our business, we are subject to lawsuits, investigations and claims, including, but not limited to, intellectual property disputes, contractual disputes, premises claims and employment, environmental, health, product liability and safety matters. Although we cannot predict with certainty the ultimate resolution of any lawsuits, investigations and claims asserted against us, we do not believe any currently pending legal proceeding to which we are a party will have a material adverse effect on our business, prospects, financial condition, cash flows or results of operations, except for the proceedings described in the immediately succeeding paragraph, which could have a material adverse effect on us.
We are party to a lawsuit that was filed against us in U.S. District Court in Connecticut alleging that the manner in which we implemented and applied the fluctuating workweek method for calculating overtime due to our department managers violated the federal Fair Labor Standards Act. The complaint purports to state a collective action on behalf of a class of department managers in stores in states in which we previously used the fluctuating workweek method of compensation. We
21
believe that the plaintiff’s claims are without merit and intend to vigorously defend ourselves in this proceeding. At this time, we cannot predict how the Court will rule on the merits of the claim and/or the scope of the potential loss in the event of an adverse outcome. Should we ultimately be found liable in this matter, our liability could have a material adverse effect on our results of operations for the period or periods in which it is incurred.
Item 4. Mine Safety Disclosures.
Not applicable.
22
PART II
Item 5. Market for Registrant’s Common Equity, Related Stockholder Matters and Issuer Purchases of Equity Securities.
Our common stock has been quoted on the NASDAQ Global Select Market under the symbol “TFM” since November 5, 2010, subsequent to our initial public offering. Prior to that date, there was no public market for our common stock. The following table shows the high and low sale prices per share of our common stock as reported on the NASDAQ Global Select Market for each quarter during the fiscal years ended January 31, 2016 and January 25, 2015:
High | Low | |||||||
Fiscal year ended January 25, 2015 | ||||||||
January 27, 2014 to April 27, 2014 | $ | 36.83 | $ | 31.79 | ||||
April 28, 2014 to July 27, 2014 | $ | 37.41 | $ | 28.70 | ||||
July 28, 2014 to October 26, 2014 | $ | 36.94 | $ | 29.47 | ||||
October 27, 2014 to January 25, 2015 | $ | 41.76 | $ | 34.06 | ||||
Fiscal year ended January 31, 2016 | ||||||||
January 26, 2015 to April 26, 2015 | $ | 42.09 | $ | 35.51 | ||||
April 27, 2015 to July 26, 2015 | $ | 38.72 | $ | 30.97 | ||||
July 27, 2015 to October 25, 2015 | $ | 31.71 | $ | 18.70 | ||||
October 26, 2015 to January 31, 2016 | $ | 26.47 | $ | 17.81 | ||||
As of January 31, 2016, we had approximately 9 holders of record of our common stock. We believe that the number of beneficial owners of our common stock is substantially greater than the number of record holders because a large portion of our common stock is held of record in broker ‘‘street names.’’
We did not declare or pay any dividends during fiscal 2015 and 2014. We currently expect to retain future earnings, if any, for use in the operation and expansion of our business and do not anticipate paying any cash dividends on our common stock for the foreseeable future. The declaration and payment of future dividends to holders of our common stock will be at the discretion of our Board of Directors and will depend upon many factors, including our financial condition, earnings, legal requirements, restrictions in our debt agreements (as described under “Liquidity and Capital Resources” in Item 7 of this report) and other factors our Board of Directors deems relevant.
Purchases of Equity Securities
The following table provides information about repurchases of our common stock during the three-month period ended January 31, 2016:
Total | Approximate | |||||||||||
Number of | Dollar Value | |||||||||||
Shares | of Shares | |||||||||||
Total | Average | Purchased | that May Yet | |||||||||
Number | Price | as Part of a | be | |||||||||
of Shares | Paid Per | Publicly | Purchased | |||||||||
Purchased | Share | Announced | under the | |||||||||
Period | (1) | ($) | Program | Program | ||||||||
October 26, 2015 through November 25, 2015 | — | — | — | 162,380 | ||||||||
November 26, 2015 through December 26, 2015 | — | — | — | 162,380 | ||||||||
December 27, 2015 through January 31, 2016 | — | — | — | 162,380 | ||||||||
23
(1) | In August 2015, our Board of Directors authorized us to repurchase up to $200.0 million of our common stock. During the fourth quarter of fiscal 2015, we did not repurchase shares of common stock on the open market. There is no expiration date governing the period over which we can repurchase shares. |
Performance Graph
This graphic comparison assumes the investment of $100 in The Fresh Market, Inc. common stock, $100 in the NASDAQ Composite Index, and $100 in the S&P Food Retail Index, all at January 30, 2011. The resulting cumulative total return assumes that dividends, if any, were reinvested.
The comparisons shown in the graph below are based on historical data. We caution that the stock price performance showing in the graph below is not necessarily indicative of, nor is it intended to forecast, the potential future performance of our common stock. Information used in the graph was obtained from the NASDAQ Stock Market website, a source believed to be reliable, but we are not responsible for any errors or omissions in such information.
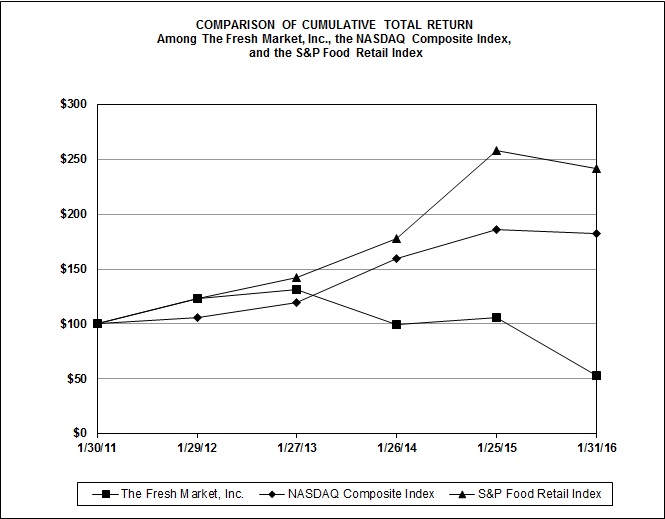
Item 6. Selected Financial Data.
The following tables set forth our selected historical financial and other data.
The historical consolidated balance sheet data as of January 31, 2016, and January 25, 2015, and the historical consolidated statements of income data for the fiscal years ended January 31, 2016, January 25, 2015 and January 26, 2014, have been derived from our audited consolidated financial statements, which are included in “Item 15. Exhibits and Financial Statement Schedules” of this Form 10-K. The historical consolidated balance sheet data as of January 26, 2014, January 27, 2013 and January 29, 2012 and the historical consolidated statements of income data for the years ended January 27, 2013 and January 29, 2012, have been derived from our audited consolidated financial statements, which are in our previously filed Annual Reports on Form 10-K.
You should read the selected historical financial and other data in conjunction with the information included in “Item 7. Management’s Discussion and Analysis of Financial Condition and Results of Operations” and our audited consolidated
24
financial statements and related notes which are included elsewhere in this Form 10-K. Our historical results set forth below are not necessarily indicative of results to be expected for any future period.
Year Ended | ||||||||||||||||||||
January 31, 2016 (1) | January 25, 2015 | January 26, 2014 | January 27, 2013 | January 29, 2012 | ||||||||||||||||
(53 weeks) | (52 weeks) | (52 weeks) | (52 weeks) | (52 weeks) | ||||||||||||||||
(dollars in thousands, except share and per share amounts) | ||||||||||||||||||||
Consolidated Statements of Income Data: | ||||||||||||||||||||
Sales | $ | 1,857,033 | $ | 1,753,166 | $ | 1,511,657 | $ | 1,329,131 | $ | 1,108,035 | ||||||||||
Cost of goods sold | 1,224,790 | 1,158,546 | 996,301 | 877,433 | 741,184 | |||||||||||||||
Gross profit | 632,243 | 594,620 | 515,356 | 451,698 | 366,851 | |||||||||||||||
Selling, general and administrative expenses (2) (3) | 441,659 | 406,452 | 349,813 | 303,495 | 247,047 | |||||||||||||||
Impairments and store closure costs (4) | 13,431 | 22,589 | 27,505 | 976 | 437 | |||||||||||||||
Depreciation | 68,658 | 61,966 | 54,657 | 45,741 | 36,485 | |||||||||||||||
Income from operations | 108,495 | 103,613 | 83,381 | 101,486 | 82,882 | |||||||||||||||
Other expenses (income): | ||||||||||||||||||||
Interest expense | 4,047 | 4,375 | 3,783 | 1,498 | 1,858 | |||||||||||||||
Other income, net | — | — | — | — | (2 | ) | ||||||||||||||
Income before provision for income taxes | 104,448 | 99,238 | 79,598 | 99,988 | 81,026 | |||||||||||||||
Tax provision | 38,950 | 36,213 | 28,791 | 35,855 | 29,631 | |||||||||||||||
Net income | $ | 65,498 | $ | 63,025 | $ | 50,807 | $ | 64,133 | $ | 51,395 | ||||||||||
Net income per share: | ||||||||||||||||||||
Basic | $ | 1.37 | $ | 1.30 | $ | 1.05 | $ | 1.33 | $ | 1.07 | ||||||||||
Diluted | $ | 1.36 | $ | 1.30 | $ | 1.05 | $ | 1.33 | $ | 1.07 | ||||||||||
Shares used in computation of net income per share: | ||||||||||||||||||||
Basic | 47,956,724 | 48,298,653 | 48,206,879 | 48,076,675 | 48,002,273 | |||||||||||||||
Diluted | 48,103,344 | 48,475,735 | 48,394,338 | 48,294,299 | 48,137,519 | |||||||||||||||
Year Ended | |||||||||||||||||||
January 31, 2016 (1) | January 25, 2015 | January 26, 2014 | January 27, 2013 | January 29, 2012 | |||||||||||||||
(53 weeks) | (52 weeks) | (52 weeks) | (52 weeks) | (52 weeks) | |||||||||||||||
(dollars in thousands, except share and per share amounts) | |||||||||||||||||||
Other Operating Data (unaudited): | |||||||||||||||||||
Number of stores at end of period | 184 | 169 | 151 | 129 | 113 | ||||||||||||||
Comparable store sales change (5) | (2.5 | )% | 2.9 | % | 3.2 | % | 5.7 | % | 5.4 | % | |||||||||
Gross square footage at end of period (in thousands) | 3,901 | 3,580 | 3,200 | 2,714 | 2,383 | ||||||||||||||
Average comparable store size (gross square feet) (6) | 21,134 | 21,085 | 21,123 | 21,192 | 21,256 | ||||||||||||||
Comparable store sales per gross square foot during period (6) | $ | 509 | $ | 533 | $ | 535 | $ | 524 | $ | 501 | |||||||||
Balance Sheet Data (end of period): | |||||||||||||||||||
Total assets (7) | $ | 582,118 | $ | 536,523 | $ | 466,361 | $ | 381,585 | $ | 318,895 | |||||||||
Total long-term obligations | $ | 32,285 | $ | 33,337 | $ | 50,769 | $ | 44,088 | $ | 64,000 | |||||||||
Total stockholders’ equity | $ | 363,171 | $ | 328,787 | $ | 256,265 | $ | 197,859 | $ | 126,916 | |||||||||
(1) | The impact of the 53rd week for the year ended January 31, 2016 included in sales, gross profit and selling, general and administrative expenses was $34.3 million, $21.5 million and $7.3 million, respectively. Refer to the table included in the |
25
section titled “Non-GAAP Adjusted Financial Results” for a reconciliation of adjusted financial results to GAAP financial results.
(2) | Selling, general and administrative expenses included $3.4 million and $2.1 million of leadership change related costs for the years ended January 31, 2016 and January 25, 2015, respectively. |
(3) | Selling, general and administrative expenses included $2.2 million in strategic and financial review charges for the year ended January 31, 2016. |
(4) | Impairments and store closure costs for the year ended January 31, 2016 included $7.1 million in store closure and exit costs primarily related to the stores closed in fiscal 2015 and $5.6 million in impairment charges for those store related assets. Impairments and store closure costs for the year ended January 25, 2015 included $13.0 million in store closure and exit costs for stores closed in fiscal 2014 and $9.0 million in impairment charges for certain store related assets. Impairments and store closure costs for the year ended January 26, 2014 included $26.8 million in impairment charges related to certain real estate and store related assets. There was also an additional store closure charge of $0.2 million to adjust the reserve for a previously closed store for the year ended January 26, 2014. |
(5) | Our practice is to include sales from a store in comparable store sales beginning on the first day of the 16th full month following the store’s opening. We believe that comparability is achieved approximately 15 months after opening. When a store that is included in comparable store sales is remodeled or relocated, we continue to consider sales from that store to be comparable store sales. When a store is closed, it is removed from comparable store sales in the period it is closed. Comparable store sales for fiscal year 2015 are calculated on a 52-week basis. There may be variations in the way that our competitors calculate comparable or “same store” sales. As a result, data in this Form 10-K regarding our comparable store sales may not be comparable to similar data made available by our competitors. |
(6) | Average comparable store size and comparable store sales per gross square foot are calculated using the gross square footage and sales for stores included within our comparable store base for each month during the given period. |
(7) | The total assets for the years ended January 25, 2015, January 26, 2014, January 27, 2013 and January 29, 2012 have been adjusted for the reclassification of deferred tax assets and liabilities as noncurrent deferred tax assets in connection with the early adoption of ASU 2015-17, Income Taxes (Topic 740). For a more detailed description of our deferred taxes, see Note 2, Summary of Significant Accounting Policies - Recent Accounting Pronouncements, to our consolidated financial statements found elsewhere in this Form 10-K. |
Item 7. Management’s Discussion and Analysis of Financial Condition and Results of Operations.
This management’s discussion and analysis of financial condition and results of operations contains forward-looking statements that involve risks and uncertainties. See “Cautionary Note Regarding Forward-Looking Statements” for a discussion of the uncertainties, risks and assumptions associated with those statements. You should read the following discussion in conjunction with “Item 6. Selected Financial Data” and our audited consolidated financial statements and related notes which are included elsewhere in this Form 10-K. Our actual results may differ materially from those discussed in the forward-looking statements as a result of various factors, including but not limited to those described under “Cautionary Note Regarding Forward-Looking Statements” and “Item 1A. Risk Factors” and included in other portions of this Form 10-K.
We report our results of operations on a 52- or 53-week fiscal year ending on the last Sunday in January. The year ended January 31, 2016 was a 53-week fiscal year while the years ended January 25, 2015 and January 26, 2014 were 52-week years.
Unless otherwise noted, our financial results have been presented on a GAAP basis. In limited instances, we have presented our financial results on a GAAP and non-GAAP (adjusted) basis, which is described in the section entitled “Non-GAAP Adjusted Financial Results.”
Overview
The Fresh Market is a specialty grocery retailer focused on creating an extraordinary food shopping experience for our customers. Since opening our first store in 1982, we have offered high-quality food products, with an emphasis on fresh, premium perishables and an uncompromising commitment to customer service. We seek to provide an attractive, convenient
26
shopping environment while offering our customers a compelling price-value combination. As of January 31, 2016, we operated 184 stores in 27 states across the United States.
We believe several key differentiating elements of our business have enabled us to execute our strategy profitably. Within our smaller-box format, we focus on higher-margin food categories and strive to deliver a more personal level of service and a more enjoyable shopping experience. Further, our smaller-box format is adaptable to different retail sites and configurations. Additionally, we believe our disciplined, comprehensive approach to planning and merchandising and the support we provide our stores allow us to deliver a consistent shopping experience.
Highlights from our financial results are as follows:
• | Sales increased 5.9%, or $103.9 million, to $1.86 billion for fiscal 2015, compared to fiscal 2014 |
• | Net income increased 3.9%, or $2.5 million, to $65.5 million for fiscal 2015, compared to fiscal 2014 |
• | Diluted earnings per share for fiscal 2015 increased to $1.36, compared to diluted earnings per share of $1.30 for fiscal 2014 |
Adjusted net income was $73.6 million, or $1.53 per share on a diluted basis for fiscal 2015, compared to $78.0 million, or $1.61 per share on a diluted basis for fiscal 2014. Adjusted net income is a non-GAAP financial measure. Refer to the table included in the section titled “Non-GAAP Adjusted Financial Results” for a reconciliation of adjusted financial results to GAAP financial results.
Outlook
We intend to continue our focus on profitable growth by expanding our store base, driving comparable store sales and improving operating effectiveness over time. Consistent with our history of growth, we intend to continue to fill in our store base in existing markets and penetrate new markets when suitable opportunities can be found. We opened 18 new stores in fiscal 2015 and believe there is a significant opportunity to continue to increase our number of stores. In addition, if attractive opportunities arise, we may use lease inducement payments to acquire leases as a way to expand our store base and penetrate new markets. Our results of operations have been, and may continue to be, affected by the cost, timing and number of new store openings, because new stores generally have different performance profiles and greater variability in sales volumes than our mature stores, and because the overall revenue contributed by new stores may vary from period to period based on the relative timing of new store openings within each period.
Our current and long-term growth strategy is to: (1) expand market presence through opening new stores and enhancing penetration into existing and adjacent markets, (2) enhance financial performance through comparable store sales growth supported by pricing, customer service and marketing initiatives, and (3) enhance operating margin through strategic product sourcing and shrink reduction initiatives, while controlling operating costs by focusing on opportunities for continuous improvement and reduction of waste in all our processes. Given our ability to target communities of different sizes, we believe that there is ample opportunity for new store growth in existing and new markets.
We aim to increase our comparable store sales by generating growth in the number and size of customer transactions. Key elements of our strategy include investments in pricing, targeted marketing activities to increase brand awareness, customer engagement and loyalty, offering new and differentiated products, and continuing to provide a distinctive in-store experience. We also intend to grow profits through scale efficiencies, improved systems, continued cost discipline and enhancements to our merchandise offerings. We expect store growth will permit us to benefit from economies of scale in sourcing products and will allow us to leverage our existing infrastructure for scale efficiencies.
We believe that we are well-positioned to capitalize on evolving consumer preferences and other trends currently shaping the food retail industry. These trends include: a growing emphasis on customer convenience and the shopping experience; an expanding number of eating and snacking occasions among consumers beyond the traditional breakfast, lunch, and dinner; an increasing consumer focus on wellness, fresh and quality offerings as well as food attributes such as organic, non-GMO, and gluten-free offerings; an increasing consumer interest in locally-grown products including regionally and locally sourced food; and an improving perception of private-label product quality.
We expect continued sales growth in fiscal 2016. The magnitude of expected growth could vary significantly due to overall economic and competitive conditions, and due to volatility in the supply and costs of commodities such as meat, seafood, cheese and produce. The Company expects that the development and maturation of new stores will also drive future
27
sales growth. We anticipate opening an additional 12 to 18 new stores by the end of fiscal 2016, in addition to refreshing or remodeling 8 to 12 stores during the same period.
How We Assess the Performance of Our Business
In assessing our performance, we consider a variety of performance and financial measures. The key measures that we assess to evaluate the performance of our business are set forth below:
Sales
Our sales comprise gross sales net of coupons, commissions and discounts.
The food retail industry and our sales are affected by general economic conditions and seasonality, as well as the factors, discussed below, that affect our comparable store sales. Consumer purchases of specialty food products are particularly sensitive to a number of factors that influence the levels of consumer spending, including economic conditions, the level of disposable consumer income, consumer debt, interest rates and consumer confidence. In addition, our business is seasonal and, as a result, our average weekly sales fluctuate during the year and are usually highest in the fourth quarter when customers make holiday purchases.
Comparable Store Sales
Our practice is to include sales from a store in comparable store sales beginning on the first day of the 16 full month following the store’s opening. We believe that comparability is achieved approximately 15 months after opening. When a store that is included in comparable store sales is remodeled or relocated, we continue to consider sales from that store to be comparable store sales. When a store is closed, it is removed from comparable store sales in the period it is closed. There may be variations in the way that our competitors calculate comparable or “same store” sales. As a result, data in this Form 10-K regarding our comparable store sales may not be comparable to similar data made available by our competitors.
Various factors may affect comparable store sales, including:
• | overall economic trends and conditions, including general price levels in the economy; |
• | consumer confidence, preferences and buying trends; |
• | our competition, including competitor store openings or closings near our stores; |
• | our competitors expanding their offerings of premium/perishable products; |
• | the pricing of our products, including the effects of inflation, deflation and our promotional activities which we evaluate and adjust in the ordinary course of our business; |
• | the number of customer transactions at our stores; |
• | our ability to provide an assortment of distinctive, high-quality product offerings to generate new and repeat visits to our stores; |
• | the level of customer service that we provide in our stores; |
• | our in-store merchandising-related activities; |
• | our ability to source products efficiently; |
• | our opening of new stores in the vicinity of our existing stores; |
• | the number of stores we open, remodel, relocate or refresh in any period; and |
• | severe or unfavorable weather conditions. |
28
We expect that a significant percentage of our sales growth will continue to come from new stores not included in comparable store sales. Accordingly, comparable store sales is only one measure we use to assess our performance.
Gross Profit
Gross profit is equal to our sales minus our cost of goods sold. Gross margin measures gross profit as a percentage of our sales. Cost of goods sold is directly correlated with sales and includes the direct costs of purchased merchandise, distribution and supply chain costs, buying costs, store supplies and store occupancy costs. Store occupancy costs include rent, common area maintenance, real estate taxes, personal property taxes, insurance, licenses and utilities. Cost of goods sold is exclusive of depreciation, which is reported separately. The components of our cost of goods sold may not be identical to those of our competitors. As a result, data in this Form 10-K regarding our gross profit and gross margin rate may not be comparable to similar data made available by our competitors.
Gross margin rates are driven by economies of scale from our store base, inventory shrinkage as a percentage of sales, productivity through process and merchandising programs, promotional activities, and pricing on select items. Changes in the mix of products sold may also impact our gross margin rate.
Selling, General and Administrative Expenses
Selling, general and administrative expenses include certain retail store and corporate costs, including compensation (both cash and share-based), pre-opening expenses, marketing and advertising, and other corporate administrative costs. Share-based compensation expenses include those arising from grants made under The Fresh Market, Inc. 2010 Omnibus Incentive Compensation Plan. Pre-opening expenses are costs associated with the opening of new stores, including costs associated with store labor, travel, recruiting, relocating and training personnel and other miscellaneous costs. Pre-opening costs are expensed as incurred.
Labor and corporate administrative costs generally decrease as a percentage of sales as a result of an increase in our comparable store sales. Accordingly, selling, general and administrative expenses as a percentage of sales are usually higher in lower volume quarters and lower in higher-volume quarters. Store-level compensation costs are generally the largest component of our selling, general and administrative expenses. The components of our selling, general and administrative expenses may not be identical to those of our competitors. As a result, data in this Form 10-K regarding our selling, general and administrative expenses may not be comparable to similar data made available by our competitors. We expect that our selling, general and administrative expenses will increase in future periods due to our continuing store growth.
Impairments and Store Closure Costs
We evaluate long-lived assets for impairment whenever events or changes in circumstances indicate the carrying value of an asset may not be recoverable. Factors we consider important which could trigger an impairment review include a decision to close a store or negative or declining operating cash flows. The carrying value is not recoverable if it exceeds the undiscounted cash flows resulting from the use of the asset and its eventual disposition. Our estimates of future cash flows attributable to our long-lived assets require significant judgment based on our historical and anticipated results and are subject to many factors. A decline in sales or other factors could expose us to future impairment charges that could be material.
We record a reserve for future lease obligations associated with stores that have closed or unopened leased locations that we decide not to pursue. The fair value of the lease liability is estimated using a discount rate to calculate the present value of the remaining noncancelable lease payments at the cease use date for the store, net of an estimate of subtenant income. Our expectations of potential subtenant income are based on various factors, including our knowledge of the geographical area in which the closed store property is located, the remaining lease term and existing conditions. We also seek advice from local brokers and agents, commercial market value analysts, and third-party fair value reports to develop our assumptions. Changes in market and economic conditions could cause us to change our assumptions and may require adjustments to the reserves.
Income from Operations
Income from operations consists of gross profit minus selling, general and administrative expenses, impairments and store closure costs and depreciation.
29
Income Taxes
We must make certain estimates and judgments in determining income tax expense for financial statement purposes. The amount of taxes currently payable or refundable is accrued, and deferred tax assets and liabilities are recognized for the estimated future tax consequences attributable to differences between the financial statement carrying amounts of existing assets and liabilities and their respective tax bases. Deferred tax assets are also recognized for realizable loss and tax credit carryforwards. Deferred tax assets and liabilities are measured using enacted tax rates in effect for the year in which those temporary differences are expected to be recovered or settled. The effect on deferred tax assets and liabilities of a change in income tax rates is recognized in our financial statements in the period that includes the enactment date.
Consolidated Results of Operations
The following tables summarizes key components of our results of operations for the periods indicated as a percentage of sales.
Year Ended | ||||||||
January 31, 2016 | January 25, 2015 | January 26, 2014 | ||||||
(53 weeks) | (52 weeks) | (52 weeks) | ||||||
Consolidated Statements of Income Data: | ||||||||
Sales | 100.0 | % | 100.0 | % | 100.0 | % | ||
Cost of goods sold | 66.0 | % | 66.1 | % | 65.9 | % | ||
Gross profit | 34.0 | % | 33.9 | % | 34.1 | % | ||
Selling, general and administrative expenses (1) | 23.8 | % | 23.2 | % | 23.1 | % | ||
Impairments and store closure costs | 0.7 | % | 1.3 | % | 1.8 | % | ||
Depreciation | 3.7 | % | 3.5 | % | 3.6 | % | ||
Income from operations | 5.8 | % | 5.9 | % | 5.5 | % | ||
Interest expense | 0.2 | % | 0.2 | % | 0.3 | % | ||
Income before provision for income taxes | 5.6 | % | 5.7 | % | 5.3 | % | ||
Tax provision | 2.1 | % | 2.1 | % | 1.9 | % | ||
Net income (2) | 3.5 | % | 3.6 | % | 3.4 | % | ||
(1) | Selling, general and administrative expenses included 30 basis points of leadership change related costs and strategic and financial review charges for the year ended January 31, 2016 and 10 basis points of leadership change related costs for the year ended January 25, 2015. |
(2) | Net income was positively impacted by 10 basis points for the 53rd week during the year ended January 31, 2016. Refer to the table included in the section titled “Non-GAAP Adjusted Financial Results” for a reconciliation of adjusted financial results excluding the 53rd week and other adjusted items to GAAP financial results. |
Percentage totals in the above table may not equal the sum of the components due to rounding.
Year Ended January 31, 2016 Compared to the Year Ended January 25, 2015
Sales
Sales increased 5.9%, or $103.9 million, to $1.86 billion for the year ended January 31, 2016, as compared to the year ended January 25, 2015. The increase in sales was primarily attributable to sales from new stores that were opened during the year ended January 31, 2016, increased sales from stores that were open during a portion of the year ended January 25, 2015, and approximately $34.3 million of sales attributable to the 53rd week included in fiscal 2015. These increases were partially offset by a decrease in comparable store sales. There were 157 comparable stores and 27 non-comparable stores open at January 31, 2016.
30
Year Ended | |||||
January 31, 2016 | January 25, 2015 | ||||
Percentage change in comparable store sales | (2.5 | )% | 2.9 | % | |
Percentage change in number of transactions | (2.3 | )% | 2.8 | % | |
Percentage change in average customer transaction size | (0.2 | )% | 0.1 | % | |
Average customer transaction size | $31.69 | $31.77 | |||
Gross Profit
Gross profit increased 6.3%, or $37.6 million, to $632.2 million for the year ended January 31, 2016, as compared to the year ended January 25, 2015. The amount of the increase in gross profit attributable to increased sales was $35.2 million, with an additional $2.4 million increase attributable to the change in gross margin rate. Included in the gross profit increase was $12.8 million attributable to the 53rd week in fiscal 2015. Our cost of goods sold increased by $66.2 million for the year ended January 31, 2016, as compared to the year ended January 25, 2015, which was primarily attributable to a $60.2 million increase in merchandise product costs, a $7.5 million increase in store occupancy costs and a $0.5 million increase in buying costs, offset by decreases in supply expense of $0.8 million and LIFO expense of $1.2 million. Included in those increases were a total of $21.5 million in expenses attributable to the 53rd week in fiscal 2015. Gross margin rate increased 10 basis points to 34.0% for the year ended January 31, 2016 from 33.9% for the year ended January 25, 2015.
Selling, General and Administrative Expenses
Selling, general and administrative expenses increased 8.7%, or $35.2 million, to $441.7 million for the year ended January 31, 2016, as compared to the year ended January 25, 2015. The increase in selling, general and administrative expenses was primarily attributable to an increase in the number of stores in operation during the year ended January 31, 2016, as compared to the year ended January 25, 2015, which led to higher overall store-level compensation expenses as well as other costs to operate our stores. With more stores in operation during the year ended January 31, 2016, our store salary and benefit expenses increased $20.3 million and other store operating expenses increased $7.3 million, compared to the year ended January 25, 2015. In addition, corporate general and administrative expenses increased $6.3 million for the year ended January 31, 2016, as compared to the year ended January 25, 2015, which included charges of $3.4 million related to leadership changes in fiscal 2015 and $2.2 million related to the strategic and financial review of the Company. The increase in selling, general and administrative expenses was partially offset by a decrease in pre-opening expenses of $0.8 million for the year ended January 31, 2016, as compared to the year ended January 25, 2015. Included in those increases were a total of $7.3 million in selling, general and administrative expenses attributable to the 53rd week in fiscal 2015.
As a percentage of sales, selling, general and administrative expenses for the year ended January 31, 2016 were 23.8%, or 60 basis points higher, than the selling, general and administrative expenses for the year ended January 25, 2015. The increase in selling, general and administrative expenses as a percentage of sales was primarily due to increased store labor expenses on lower comparable store sales, along with leadership change charges of 20 basis points and investments in marketing and store productivity programs, partially offset by lower incentive compensation expense.
Impairments and Store Closure Costs
Impairments and store closure costs for the year ended January 31, 2016 were $13.4 million, as compared to $22.6 million for the year ended January 25, 2015. Impairments and store closure costs for the year ended January 31, 2016 were primarily comprised of $7.1 million in store closure and exit costs for the stores closed in fiscal 2015 and $5.6 million in impairment charges for certain store related assets. Impairments and store closure costs for the year ended January 25, 2015 were primarily comprised of $13.0 million in store closure and exit costs for the stores closed in fiscal 2014 and $9.0 million in impairment charges for certain store related assets. The remaining charges for the years ended January 31, 2016 and January 25, 2015 relate to ongoing expenses associated with closed stores.
Depreciation Expense
Depreciation increased 10.8%, or $6.7 million, to $68.7 million for the year ended January 31, 2016, as compared to the year ended January 25, 2015, principally due to store unit growth and additional depreciation related to stores that were remodeled and refreshed during fiscal 2015. Depreciation expense as a percentage of sales increased by 20 basis points to 3.7% for the year ended January 31, 2016, compared to 3.5% for the year ended January 25, 2015.
31
Income from Operations
For the year ended January 31, 2016, operating income increased $4.9 million, to $108.5 million, from $103.6 million for the year ended January 25, 2015. Included in those increases were a total of $5.5 million attributable to the 53rd week in fiscal 2015. For the year ended January 31, 2016, we recognized charges of approximately $18.9 million associated with impairments for certain store related assets, store closure and exit costs primarily related to the stores closed in fiscal 2015, charges related to changes in leadership, and charges related to the strategic and financial review of the Company. For the year ended January 25, 2015, we recognized charges of approximately $24.5 million associated with impairments for certain real estate and store related assets, store closure and exit costs primarily related to the stores closed in fiscal 2014, and charges related to leadership changes. Excluding these items, adjusted operating income was $121.9 million for the year ended January 31, 2016, a decrease of 4.9%, from adjusted operating income of $128.1 million for the year ended January 25, 2015. Adjusted operating income is a non-GAAP financial measure. Refer to the table included in the section titled “Non-GAAP Adjusted Financial Results” for a reconciliation of adjusted financial results excluding the 53rd week and other adjusted items to GAAP financial results.
Income from operations as a percentage of sales for the year ended January 31, 2016 decreased to 5.8% from 5.9% for the year ended January 25, 2015. The decrease in our income from operations as a percentage of sales for the year ended January 31, 2016, compared to the year ended January 25, 2015, was primarily due to an increase in selling, general and administrative expenses and depreciation partially offset by a decrease in impairments and store closure costs. Adjusted income from operations as a percentage of sales decreased by 60 basis points to 6.7% for the year ended January 31, 2016, compared to 7.3% for the year ended January 25, 2015. Adjusted income from operations is a non-GAAP financial measure. Refer to the table included in the section titled “Non-GAAP Adjusted Financial Results” for a reconciliation of adjusted financial results excluding the 53rd week and other adjusted items to GAAP financial results.
Interest Expense
Interest expense decreased 7.5%, or $0.4 million, to $4.0 million for the year ended January 31, 2016, as compared to $4.4 million for the year ended January 25, 2015.
Income Tax Expense
Our effective income tax rate increased to 37.3% for the year ended January 31, 2016 from 36.5% for the year ended January 25, 2015 primarily due to a decrease in the enhanced charitable food contribution deduction. We have limited the amount of enhanced deduction taken for the year ended January 31, 2016 in order to utilize the charitable contribution carryforwards that were generated in prior years due to the charitable contribution deduction limitation imposed by the Internal Revenue Service.
Net Income
Net income increased 3.9%, or $2.5 million, to $65.5 million for the year ended January 31, 2016, from $63.0 million for the year ended January 25, 2015. Net income growth included the benefit of $3.4 million in connection with the 53rd week in fiscal 2015. Net income was affected by pre-tax charges of $18.9 million associated with impairments for certain store related assets, store closure and exit costs primarily related to the stores closed in fiscal 2015, charges related to changes in leadership, and charges related to the strategic and financial review of the Company for the year ended January 31, 2016, compared to pre-tax charges of $24.5 million associated with impairments for certain real estate and store related assets, store closure and exit costs primarily related to the stores closed in fiscal 2014, and costs associated with leadership changes for the year ended January 25, 2015. Adjusted net income decreased 5.6%, or $4.4 million, to $73.6 million, for the year ended January 31, 2016, compared to adjusted net income of $78.0 million for the year ended January 25, 2015. Adjusted net income is a non-GAAP financial measure. Refer to the table included in the section titled “Non-GAAP Adjusted Financial Results” for a reconciliation of adjusted financial results excluding the 53rd week and other adjusted items to GAAP financial results.
Net income as a percentage of sales for the year ended January 31, 2016 decreased to 3.5% from 3.6% for the year ended January 25, 2015. Adjusted net income as a percentage of sales decreased by 50 basis points to 4.0% for the year ended January 31, 2016, compared to 4.5% for the year ended January 25, 2015. Adjusted net income as a percentage of sales is a non-GAAP financial measure. Refer to the table included in the section titled “Non-GAAP Adjusted Financial Results” for a reconciliation of adjusted financial results excluding the 53rd week and other adjusted items to GAAP financial results.
32
Year Ended January 25, 2015 Compared to the Year Ended January 26, 2014
Sales
Sales increased 16.0%, or $241.5 million, to $1.75 billion for the year ended January 25, 2015, as compared to the year ended January 26, 2014. The increase in sales for the year ended January 25, 2015 was primarily attributable to sales from 22 new stores that were not open during the year ended January 26, 2014, increased sales from 19 stores that were only open during a portion of the year ended January 26, 2014 and an overall increase in comparable store sales. There were 140 comparable stores and 29 non-comparable stores open at January 25, 2015.
Year Ended | |||||
January 25, 2015 | January 26, 2014 | ||||
Percentage change in comparable store sales | 2.9 | % | 3.2 | % | |
Percentage change in number of transactions | 2.8 | % | 1.7 | % | |
Percentage change in average customer transaction size | 0.1 | % | 1.5 | % | |
Average customer transaction size | $31.90 | $31.86 | |||
Gross Profit
Gross profit increased 15.4%, or $79.3 million, to $594.6 million for the year ended January 25, 2015, as compared to the year ended January 26, 2014. The amount of the increase in gross profit attributable to increased sales was $82.3 million and was partially offset by a $3.0 million decrease in gross profit attributable to a decrease in the gross margin rate. Our cost of goods sold increased by $162.2 million for the year ended January 25, 2015, as compared to the year ended January 26, 2014, which was primarily attributable to a $145.0 million increase in merchandise product costs, a $12.6 million increase in store occupancy costs, a $3.2 million increase in supply expense, and a $1.0 million increase in LIFO expense. Gross margin rate decreased 20 basis points to 33.9% for the year ended January 25, 2015 from 34.1% for the year ended January 26, 2014. The reduction in our gross margin rate was primarily driven by a decrease in merchandise margins due to our decision to absorb cost inflation for certain product categories.
Selling, General and Administrative Expenses
Selling, general and administrative expenses increased 16.2%, or $56.6 million, to $406.5 million for the year ended January 25, 2015, as compared to the year ended January 26, 2014. The increase in selling, general and administrative expenses was primarily attributable to an increase in the number of stores in operation and an increase in customer traffic during the year ended January 25, 2015, as compared to the year ended January 26, 2014, which led to higher overall store-level compensation expenses as well as other costs to operate our stores. With more stores in operation during the year ended January 25, 2015, our store salary and benefit expenses increased $39.5 million and other store operating expenses increased $9.6 million, compared to the year ended January 26, 2014. In addition, corporate general and administrative expenses increased $8.4 million for the year ended January 25, 2015, as compared to the year ended January 26, 2014, which included charges of $2.1 million related to the announced leadership change in fiscal 2014. The increase in selling, general and administrative expenses was partially offset by a decrease in pre-opening expenses of $0.4 million for the year ended January 25, 2015, as compared to the year ended January 26, 2014.
As a percentage of sales, selling, general and administrative expenses for the year ended January 25, 2015 were 23.2%, or 10 basis points higher, than the selling, general and administrative expenses for the year ended January 26, 2014. The increase in selling, general and administrative expenses as a percentage of sales was primarily related to the 10 basis point increase associated with the leadership change for the year ended January 25, 2015.
Impairments and Store Closure Costs
Impairments and store closure costs for the year ended January 25, 2015 were $22.6 million, as compared to $27.5 million for the year ended January 26, 2014. Impairments and store closure costs for the year ended January 25, 2015 were
33
primarily comprised of approximately $13.0 million in store closure and exit costs for the stores closed in fiscal 2014 and approximately $9.0 million in impairment charges for certain store related assets. Impairments and store closure costs for the year ended January 26, 2014 were primarily comprised of $26.8 million in impairment charges and $0.2 million for an adjustment to the reserve related to a previously closed store. The remaining charges for the years ended January 25, 2015 and January 26, 2014 relate to ongoing expenses associated with closed stores.
Depreciation Expense
Depreciation increased 13.4%, or $7.3 million, to $62.0 million for the year ended January 25, 2015, as compared to the year ended January 26, 2014, principally due to store unit growth and the recognition of depreciation expense for certain store locations, which are recorded as capital and financing lease assets. Depreciation expense as a percentage of sales decreased by 10 basis points to 3.5% for the year ended January 25, 2015, compared to 3.6% for the year ended January 26, 2014.
Income from Operations
For the year ended January 25, 2015, operating income increased $20.2 million, to $103.6 million, from $83.4 million for the year ended January 26, 2014. For the year ended January 25, 2015, we recognized charges of approximately $24.5 million associated with store closure and exit costs, impairments of certain store related assets and charges related to a change in leadership. For the year ended January 26, 2014, we recognized charges of approximately $27.6 million associated with impairments for certain real estate and store related assets. Excluding these items, adjusted operating income was $128.1 million for the year ended January 25, 2015, an increase of 15.5%, from adjusted operating income of $111.0 million for the year ended January 26, 2014. Adjusted operating income is a non-GAAP financial measure. Refer to the table included in the section titled “Non-GAAP Adjusted Financial Results” for a reconciliation of adjusted financial results to GAAP financial results.
Income from operations as a percentage of sales for the year ended January 25, 2015 increased to 5.9% from 5.5% for the year ended January 26, 2014. The increase in our income from operations as a percentage of sales for the year ended January 25, 2015, compared to the year ended January 26, 2014, was primarily due to a decrease in impairment charges, partially offset by a decrease in the gross margin rate, as described above. Adjusted income from operations as a percentage of sales remained flat at 7.3% for the years ended January 25, 2015 and January 26, 2014. Adjusted income from operations is a non-GAAP financial measure. Refer to the table included in the section titled “Non-GAAP Adjusted Financial Results” for a reconciliation of adjusted financial results to GAAP financial results.
Interest Expense
Interest expense increased 15.6%, or $0.6 million, to $4.4 million for the year ended January 25, 2015, as compared to $3.8 million for the year ended January 26, 2014. The increase was primarily attributable to an increase in interest expense related to capital and financing lease obligations, partially offset by a decrease in interest expense associated with the lower debt balance for the year ended January 25, 2015, compared to the year ended January 26, 2014.
Income Tax Expense
The effective income tax rate for the year ended January 25, 2015 was 36.5% as compared to 36.2% for the year ended January 26, 2014.
Net Income
Net income increased 24.0%, or $12.2 million, to $63.0 million for the year ended January 25, 2015, from $50.8 million for the year ended January 26, 2014. Net income was negatively affected by pre-tax charges of $24.5 million associated with store closure and exit costs related to the stores closed in fiscal 2014, impairment charges for certain store related assets, and costs associated with the leadership change for the year ended January 25, 2015, compared to pre-tax charges of $27.6 million associated with impairments for certain real estate and store related assets for the year ended January 26, 2014. Adjusted net income increased 15.4%, or $10.4 million, to $78.0 million, for the year ended January 25, 2015, compared to adjusted net income of $67.6 million for the year ended January 26, 2014. Adjusted net income is a non-GAAP financial measure. Refer to the table included in the below section titled “Non-GAAP Adjusted Financial Results” for a reconciliation of adjusted financial results to GAAP financial results.
34
Net income as a percentage of sales for the year ended January 25, 2015 increased to 3.6% from 3.4% for the year ended January 26, 2014. Adjusted net income as a percentage of sales remained flat at 4.5% for the years ended January 25, 2015 and January 26, 2014. Adjusted net income as a percentage of sales is a non-GAAP financial measure. Refer to the table included in the section titled “Non-GAAP Adjusted Financial Results” for a reconciliation of adjusted financial results to GAAP financial results.
Non-GAAP Adjusted Financial Results
In addition to presenting our financial results in conformity with GAAP in this Form 10-K, we are also presenting results on an “adjusted” basis in order to exclude the impact of the items shown in the tables below for the years ended January 31, 2016, January 25, 2015 and January 26, 2014. Except where the context otherwise requires, the use of the term “adjusted” or “as adjusted” with reference to the financial results discussed in this management’s discussion and analysis refers to the adjusted results described in this section. These adjusted financial results are non-GAAP financial measures. These measures are not in accordance with, or an alternative to, GAAP and are reconciled to the Company’s most recent GAAP financial statements. The Company’s management believes that these non-GAAP financial measures provide useful information to management, analysts and investors regarding certain additional financial and business trends relating to the Company’s results of operations and financial condition. In addition, the Company’s management uses these measures to review the Company’s financial results and evaluate its business operations. We believe that the presentation of adjusted financial results facilitates an understanding of our operations without the impact associated with the charges referenced in the tables below and the effects of the 53rd week. Non-GAAP financial measures should not be considered in isolation from, or as a substitute for, financial information prepared in accordance with GAAP.
For the 53 Weeks Ended January 31, 2016 | |||||||||||||||||||||||||||||||
(amounts in thousands, except share and per share amounts) | |||||||||||||||||||||||||||||||
As Reported | Impairments and Store Closure Costs(1) | Leadership Charges (2) | Strategic and Financial Review (3) | Income Tax (4) | Subtotal As Adjusted | 53rd Week (5) | As Adjusted | ||||||||||||||||||||||||
Gross profit | 632,243 | (5 | ) | — | — | — | 632,238 | (12,777 | ) | 619,461 | |||||||||||||||||||||
Impairments and store closure costs | 13,431 | (12,716 | ) | — | — | — | 715 | — | 715 | ||||||||||||||||||||||
Income from operations | 108,495 | 13,289 | 3,420 | 2,178 | — | 127,382 | (5,489 | ) | 121,893 | ||||||||||||||||||||||
Income before provision for income taxes | 104,448 | 13,289 | 3,420 | 2,178 | — | 123,335 | (5,480 | ) | 117,855 | ||||||||||||||||||||||
Tax provision | 38,950 | 4,955 | 1,275 | 812 | 284 | 46,276 | (2,056 | ) | 44,220 | ||||||||||||||||||||||
Net income | $ | 65,498 | $ | 8,334 | $ | 2,145 | $ | 1,366 | $ | (284 | ) | $ | 77,059 | $ | (3,424 | ) | $ | 73,635 | |||||||||||||
Net income per share: | |||||||||||||||||||||||||||||||
Basic | $ | 1.37 | $ | 0.17 | $ | 0.04 | $ | 0.03 | $ | (0.01 | ) | $ | 1.61 | $ | (0.07 | ) | $ | 1.54 | |||||||||||||
Diluted | $ | 1.36 | $ | 0.17 | $ | 0.04 | $ | 0.03 | $ | (0.01 | ) | $ | 1.60 | $ | (0.07 | ) | $ | 1.53 | |||||||||||||
(1) We incurred pre-tax charges of $13.3 million in connection with impairments and store closure and exit activities. Included in these charges are $5.6 million for impairment charges and $7.7 million in store closure and exit activities. Store closure and exit activities include the recognition of certain lease liabilities, severance, gain on disposal of assets and other exit costs as well as the liquidation of inventory.
(2) We incurred pre-tax charges of $3.4 million associated with leadership changes.
(3) We incurred pre-tax charges of $2.2 million associated with our strategic and financial review of the Company.
(4) The income tax provision adjustment represents the change in the tax rate as a result of excluding the impact of the items listed above.
(5) The 53rd week captures the impact of the additional week in fiscal 2015.
35
For the 52 Weeks Ended January 25, 2015 | |||||||||||||||||||
(amounts in thousands, except share and per share amounts) | |||||||||||||||||||
As Reported | Impairments and Store Closure Costs (1) | Leadership Charges (2) | Income Tax (3) | As Adjusted | |||||||||||||||
Gross profit | 594,620 | 337 | — | — | 594,957 | ||||||||||||||
Impairments and store closure costs | 22,589 | (22,010 | ) | — | — | 579 | |||||||||||||
Income from operations | 103,613 | 22,428 | 2,077 | — | 128,118 | ||||||||||||||
Income before provision for income taxes | 99,238 | 22,428 | 2,077 | — | 123,743 | ||||||||||||||
Tax provision | 36,213 | 8,184 | 758 | 575 | 45,730 | ||||||||||||||
Net income | $ | 63,025 | $ | 14,244 | $ | 1,319 | $ | (575 | ) | $ | 78,013 | ||||||||
Net income per share: | |||||||||||||||||||
Basic | 1.30 | 0.29 | 0.03 | (0.01 | ) | 1.62 | |||||||||||||
Diluted | 1.30 | 0.29 | 0.03 | (0.01 | ) | 1.61 | |||||||||||||
(1) We incurred pre-tax charges of $22.4 million in connection with impairments and store closure and exit activities. Included in these charges are $9.0 million for impairment charges and $13.5 million in store closure and exit activities. Store closure and exit activities include the recognition of certain lease liabilities, severance, write-down and loss on disposal of assets and other exit costs as well as the liquidation of inventory.
(2) We incurred pre-tax charges of $2.1 million associated with leadership changes.
(3) The income tax provision adjustment represents the change in the tax rate as a result of excluding the impact of the items listed above.
For the 52 Weeks Ended January 26, 2014 | |||||||||||||||
(amounts in thousands, except share and per share amounts) | |||||||||||||||
As Reported | Impairments and Store Closure Costs (1) | Income Tax (2) | As Adjusted | ||||||||||||
Gross profit | 515,356 | — | — | 515,356 | |||||||||||
Impairments and store closure costs | 27,505 | (27,048 | ) | — | 457 | ||||||||||
Income from operations | 83,381 | 27,553 | — | 110,934 | |||||||||||
Income before provision for income taxes | 79,598 | 27,553 | — | 107,151 | |||||||||||
Tax provision | 28,791 | 9,966 | 771 | 39,528 | |||||||||||
Net income | $ | 50,807 | $ | 17,587 | $ | (771 | ) | $ | 67,623 | ||||||
Net income per share: | |||||||||||||||
Basic | $ | 1.05 | $ | 0.36 | $ | (0.02 | ) | $ | 1.40 | ||||||
Diluted | $ | 1.05 | $ | 0.36 | $ | (0.02 | ) | $ | 1.40 | ||||||
36
(1) We incurred pre-tax charges of $27.6 million in connection with impairments of certain real estate and store related assets. Of these charges, $0.5 million was related to the write-off of capitalized expenses for real estate sites prior to leasing them.
(2) The income tax provision adjustment represents the change in the tax rate as a result of excluding the impact of the items listed above.
The net income per share totals in the above tables may not equal the sum of the components due to rounding.
Liquidity and Capital Resources
Our primary sources of liquidity are cash on hand and cash generated from operations. Our primary uses of cash are purchases of inventory, operating expenses, capital expenditures primarily for opening new stores and relocating, remodeling and refreshing existing stores, repurchases of common stock, debt service and corporate taxes. We believe that the cash on hand and cash generated from operations, together with the borrowing availability under our revolving credit facility, will be sufficient to meet our working capital needs for at least the next 12 months, including investments made, and expenses incurred, in connection with opening new stores and relocating, remodeling and refreshing existing stores and other investments, such as information technology and projects to improve operational efficiencies. Our working capital position benefits from the fact that we generally collect cash from sales to customers the same day or, in the case of credit or debit card transactions, within a few business days of the related sale.
At January 31, 2016, we had $60.8 million in cash and cash equivalents and $147.6 million in borrowing availability under our revolving credit facility. Our revolving credit facility is discussed under “—Financing Activities” and “—Revolving Credit Facility” below.
While we believe we have sufficient liquidity and capital resources to meet our current operating requirements and expansion plans, we may elect to pursue additional expansion opportunities within the next year which could require additional debt or equity financing. If we are unable to secure additional financing at favorable terms in order to pursue such additional expansion opportunities, our ability to pursue such opportunities could be materially adversely affected.
A summary of our operating, investing and financing activities is shown in the following table:
Year Ended | ||||||||||||
January 31, 2016 | January 25, 2015 | January 26, 2014 | ||||||||||
(53 weeks) | (52 weeks) | (52 weeks) | ||||||||||
(in thousands) | ||||||||||||
Net cash provided by operating activities | $ | 146,521 | $ | 143,025 | $ | 140,372 | ||||||
Net cash used in investing activities | (96,922 | ) | (82,178 | ) | (122,247 | ) | ||||||
Net cash used in financing activities | (37,242 | ) | (24,106 | ) | (15,117 | ) | ||||||
Net increase in cash and cash equivalents | $ | 12,357 | $ | 36,741 | $ | 3,008 | ||||||
37
Operating Activities
Cash provided by operating activities consists primarily of net income adjusted for non-cash items, including depreciation and amortization, realized losses on disposal of property and equipment, impairment charges, assignment of capital leases, share-based compensation, changes in deferred taxes, and the effect of changes in assets and liabilities.
Year Ended | ||||||||||||
January 31, 2016 | January 25, 2015 | January 26, 2014 | ||||||||||
(53 weeks) | (52 weeks) | (52 weeks) | ||||||||||
(in thousands) | ||||||||||||
Net income | $ | 65,498 | $ | 63,025 | $ | 50,807 | ||||||
Adjustments to reconcile net income to net cash provided by operating activities: | ||||||||||||
Depreciation and amortization | 68,844 | 62,163 | 54,878 | |||||||||
Loss on disposals of property and equipment | 10 | 2,006 | 311 | |||||||||
Impairment of property and equipment | 5,595 | 8,961 | 26,828 | |||||||||
Gain on assignment of capital lease | — | (1,508 | ) | — | ||||||||
Share-based compensation | 4,936 | 7,533 | 5,239 | |||||||||
Excess tax benefit from share-based compensation | (106 | ) | (324 | ) | (569 | ) | ||||||
Deferred income taxes | (7,676 | ) | (16,230 | ) | (11,519 | ) | ||||||
Changes in assets and liabilities | 9,420 | 17,399 | 14,397 | |||||||||
Net cash provided by operating activities | $ | 146,521 | $ | 143,025 | $ | 140,372 | ||||||
Net cash provided by operating activities increased 2.4%, or $3.5 million, to $146.5 million for the year ended January 31, 2016, compared to $143.0 million for the year ended January 25, 2015, primarily attributable to improvements in the use of working capital.
Net cash provided by operating activities increased 1.9%, or $2.7 million, to $143.0 million for the year ended January 25, 2015, compared to $140.4 million for the year ended January 26, 2014, primarily attributable to higher net income and improved working capital.
Investing Activities
Cash used in investing activities consists primarily of capital expenditures for opening new stores and relocating, remodeling and refreshing existing stores, as well as investments in information technology and merchandising enhancements.
Year Ended | ||||||||||||
January 31, 2016 | January 25, 2015 | January 26, 2014 | ||||||||||
(53 weeks) | (52 weeks) | (52 weeks) | ||||||||||
(in thousands) | ||||||||||||
Purchases of property and equipment | $ | (97,691 | ) | $ | (90,182 | ) | $ | (122,366 | ) | |||
Proceeds from sale of property and equipment | 769 | 8,004 | 119 | |||||||||
Net cash used in investing activities | $ | (96,922 | ) | $ | (82,178 | ) | $ | (122,247 | ) | |||
Capital expenditures increased $7.5 million to $97.7 million for the year ended January 31, 2016, as compared to $90.2 million for the year ended January 25, 2015. The increase in capital expenditures was primarily related to an increase in the number of stores remodeled and refreshed for the year ended January 31, 2016. Capital expenditures related to real estate activities were 84.8% and 83.5% of the total capital expenditures for the years ended January 31, 2016 and January 25, 2015, respectively. During the year ended January 31, 2016, we opened 18 new stores and remodeled and refreshed eight stores.
38
Capital expenditures decreased $32.2 million to $90.2 million for the year ended January 25, 2015, as compared to $122.4 million for the year ended January 26, 2014. The decrease in capital expenditures was primarily related to a reduced average cost of new store construction and a decrease in the number of stores remodeled and under construction for the year ended January 25, 2015. Capital expenditures related to real estate activities were 83.5% and 91.8% of the total capital expenditures for the years ended January 25, 2015 and January 26, 2014, respectively. During the year ended January 25, 2015, we opened 22 new stores. In November 2014, we received proceeds of $7.9 million from a land and building sale-leaseback transaction.
We plan to spend approximately $90.0 million to $120.0 million on capital expenditures during fiscal 2016, primarily related to real estate investments as we plan to refresh or remodel 8 to 12 stores and construct and open 12 to 18 new stores in fiscal 2016.
Financing Activities
Cash used in financing activities consists principally of borrowings and payments under our revolving credit facility and payments made under the stock repurchase program.
Year Ended | ||||||||||||
January 31, 2016 | January 25, 2015 | January 26, 2014 | ||||||||||
(53 weeks) | (52 weeks) | (52 weeks) | ||||||||||
(in thousands) | ||||||||||||
Borrowings on revolving credit facility | $ | — | $ | 138,233 | $ | 513,621 | ||||||
Payments made on revolving credit facility | — | (162,933 | ) | (530,921 | ) | |||||||
Payments made for debt issuance costs | — | (534 | ) | — | ||||||||
Payments made on capital and financing lease obligations | (1,191 | ) | (836 | ) | (177 | ) | ||||||
Proceeds from issuance of common stock pursuant to employee stock purchase plan | 164 | 170 | 226 | |||||||||
Excess tax benefit from share-based compensation | 106 | 324 | 569 | |||||||||
Payments made on withholding tax for restricted stock vesting | (1,350 | ) | (468 | ) | (494 | ) | ||||||
Proceeds from exercise of share-based compensation awards | 2,649 | 1,938 | 2,059 | |||||||||
Payments made to repurchase common stock | (37,620 | ) | — | — | ||||||||
Net cash used in financing activities | $ | (37,242 | ) | $ | (24,106 | ) | $ | (15,117 | ) | |||
Net cash used in financing activities during the year ended January 31, 2016 increased $13.1 million, to $37.2 million, from the year ended January 25, 2015, mostly due to payments to repurchase common stock. We had no debt or related payments on our revolving credit facility balance for the year ended January 31, 2016, compared to net payments of $24.7 million for the year ended January 25, 2015.
Net cash used in financing activities during the year ended January 25, 2015 increased $9.0 million, to $24.1 million, from the year ended January 26, 2014, mostly due to an increase in net payments on our revolving credit facility. We reduced our credit facility balance by $24.7 million for the year ended January 25, 2015, compared to $17.3 million for the year ended January 26, 2014.
Revolving Credit Facility
On June 12, 2014, we entered into an unsecured revolving credit agreement with Bank of America, N.A., as Administrative Agent, Swing Line Lender and Letter of Credit Issuer, and the several lenders party thereto (the “2014 Credit Agreement”). The 2014 Credit Agreement refinanced and replaced a senior unsecured revolving credit facility, which was terminated upon our entering into the 2014 Credit Agreement.
The 2014 Credit Agreement matures June 12, 2019 and is available to provide support for working capital, capital
39
expenditures and other general corporate purposes, including permitted acquisitions and issuance of letters of credit. While we currently have no material domestic subsidiaries, other entities will guarantee our obligations under the 2014 Credit Agreement if and when they become our material domestic subsidiaries during the term of the 2014 Credit Agreement.
The 2014 Credit Agreement provides for total borrowings of up to $175 million. Under the terms of the 2014 Credit Agreement, we are entitled to request an increase in the size of the facility by an amount not exceeding $100 million in the aggregate. If the existing lenders elect not to provide the full amount of a requested increase, or in lieu of accepting offers from existing lenders to increase their commitments, we may designate one or more other lenders to become a party to the 2014 Credit Agreement, subject to the approval of the Administrative Agent. The 2014 Credit Agreement includes a letter of credit sublimit of $60 million and a swing line sublimit of $15 million.
At our option, revolving loans under the 2014 Credit Agreement bear interest at (i) the London Interbank Offered Rate (“LIBOR”) plus an applicable margin that ranges from 0.90% to 2.00%, (ii) the Eurodollar rate plus an applicable margin that ranges from 0.90% to 2.00%, or (iii) the base rate plus an applicable margin that ranges from 0% to 1.00%, where the base rate is defined as the greatest of: (a) the federal funds rate plus 0.50%, (b) Bank of America’s prime rate, and (c) the Eurodollar rate plus 1.00%. As of January 31, 2016, there were no outstanding borrowings under the 2014 Credit Agreement.
The commitment fee calculated on the unused portions of the 2014 Credit Agreement ranges from 0.125% to 0.250% per annum.
The 2014 Credit Agreement contains a number of affirmative and restrictive covenants, including limitations on our ability to grant liens, incur additional debt, pay dividends, redeem our common stock, make certain investments and engage in certain merger, consolidation or asset sale transactions.
In addition, the 2014 Credit Agreement provides that we are required to maintain the following financial ratios:
• | a consolidated maximum leverage ratio as of the end of any fiscal quarter of not more than 4.25 to 1.00, based upon the ratio of (i) Adjusted Funded Debt (as defined in the 2014 Credit Agreement) minus certain cash and cash equivalents in excess of $5.0 million as of the end of each fiscal quarter to (ii) Consolidated EBITDAR (as defined in the 2014 Credit Agreement) for the period consisting of the four fiscal quarters then ending; and |
• | a consolidated fixed charge coverage ratio as of the end of each fiscal quarter of not less than 1.70 to 1.00, based upon the ratio of (i) Consolidated EBITDAR less cash taxes paid and dividends and other distributions made in respect of capital stock, in each case, over the period consisting of the four fiscal quarters then ending to (ii) the sum of cash interest, lease, rent and scheduled principal payments on Funded Debt (as defined in the 2014 Credit Agreement), in each case, over the period consisting of the four fiscal quarters then ending. |
The 2014 Credit Agreement contains customary events of default. If an Event of Default (as defined in the 2014 Credit Agreement) occurs and is continuing, on the terms and subject to the conditions set forth in the 2014 Credit Agreement, amounts outstanding under the 2014 Credit Agreement may be accelerated and may become or be declared immediately due and payable.
We were in compliance with all debt covenants under the 2014 Credit Agreement as of January 31, 2016.
40
Contractual Obligations
The following table summarizes our contractual obligations, as of January 31, 2016.
Payments Due by Period | ||||||||||||||||||||
(in thousands) | ||||||||||||||||||||
Less than | More than | |||||||||||||||||||
Contractual obligations | Total | 1 year | 1 - 3 years | 3 - 5 years | 5 years | |||||||||||||||
Estimated interest on long-term debt obligations (1) | $ | 2,635 | $ | 774 | $ | 1,548 | $ | 313 | $ | — | ||||||||||
Operating lease obligations (2) | 561,773 | 66,373 | 133,091 | 120,276 | 242,033 | |||||||||||||||
Capital and financing lease obligations, including principal and interest payments (3) | 63,594 | 5,137 | 10,274 | 10,372 | 37,811 | |||||||||||||||
Purchase obligations (4) | 11,021 | 11,021 | — | — | — | |||||||||||||||
Contractual obligations for construction-related activities | 8,701 | 8,701 | — | — | — | |||||||||||||||
$ | 647,724 | $ | 92,006 | $ | 144,913 | $ | 130,961 | $ | 279,844 | |||||||||||
(1) | There were no outstanding balances under the 2014 Credit Agreement as of January 31, 2016. For purposes of this table, we estimated interest expense (including letter of credit and commitment fees on the unused balances) to be paid during the remaining term of the 2014 Credit Agreement using the applicable rate for letters of credit and unused commitment fees as of January 31, 2016. Our actual cash payments for interest and related fees under the 2014 Credit Agreement will fluctuate as the outstanding balance changes with our cash needs and the one-month LIBOR rate fluctuates. For a more detailed description of the interest requirement for our long-term debt, see Note 3, Long-Term Debt, to our consolidated financial statements found elsewhere in this Form 10-K. |
(2) | Represents the minimum lease payments due under our operating leases, excluding common area maintenance, insurance and taxes related to our operating lease obligations, which combined represented approximately $17.0 million for the year ended January 31, 2016. For a more detailed description of our operating leases, see Note 6, Leases, to our consolidated financial statements found elsewhere in this Form 10-K. |
(3) | Represents the payments due under our capital and financing lease obligations. We do not record rent expense for these capital and financing lease obligations, but rather rental payments are recognized as a reduction of the capital and financing lease obligations and interest expense. |
(4) | Purchase obligations include agreements to purchase goods and services made in the normal course of business that are enforceable and legally binding on us. Our purchase obligations consist predominantly of contracts to purchase certain inventory items. This amount does not include any payment obligations with respect to products on hand at our logistics providers as we do not typically take title or have any obligation to pay for products purchased by our logistics providers until we receive the products at our store locations. Although we occasionally have obligations to purchase any inventory on-hand in the event a contract with a logistics provider is terminated, we also generally enter into arrangements with any subsequent logistics provider or distributor pursuant to which the subsequent logistics provider or distributor purchases the inventory on-hand at the former logistics provider or distributor or we deplete the inventory on-hand at the former logistics provider or distributor as the termination date approaches. |
We periodically make other commitments and become subject to other contractual obligations that we believe to be routine in nature and incidental to the operation of our business. We believe that such routine commitments and contractual obligations do not have a material impact on our business, financial condition or results of operations.
41
Off-Balance Sheet Arrangements
Our off-balance sheet arrangements at January 31, 2016 consist of outstanding standby letters of credit discussed in Note 3, Long-Term Debt, to our consolidated financial statements found elsewhere in this Form 10-K and of operating leases. We have no other off-balance sheet arrangements that have had, or are reasonably likely to have, a material current or future effect on our consolidated financial statements or changes in financial condition, revenues or expenses, results of operations, liquidity, capital expenditures or capital resources.
Stock Repurchase Program
In August 2015, our Board of Directors authorized a $200.0 million stock repurchase program. The primary source of funds for stock repurchases are cash flows from operations net of investing activities. Repurchases under the program are made through open market transactions at prevailing market prices, with block trades permitted from time to time and in the discretion of our management and as market conditions allow. The timing of the repurchases and the actual amount repurchased depends on a variety of factors, including the amount of cash flow available for repurchases, the market price for our shares and general market and economic conditions.
During the year ended January 31, 2016, we acquired 1,616,237 shares of our outstanding common stock for $37.6 million, including applicable commissions, under the stock repurchase program.
Critical Accounting Policies
In presenting our consolidated financial statements in conformity with U.S. generally accepted accounting principles, or GAAP, we are required to make estimates and assumptions that affect the reported amounts of assets, liabilities, revenues, costs and expenses and related disclosures.
Some of the estimates and assumptions that we are required to make relate to matters that are inherently uncertain as they pertain to future events. We base these estimates and assumptions on historical experience or on various other factors that we believe to be reasonable and appropriate under the circumstances. On an ongoing basis, we reconsider and evaluate our estimates and assumptions. Actual results may differ significantly from these estimates. Future results may differ from our estimates under different assumptions or conditions.
We believe that the critical accounting policies listed below involve our more significant judgments, assumptions and estimates and, therefore, could have the greatest potential impact on our consolidated financial statements.
For further information on our critical and other significant accounting policies, see the notes to our consolidated financial statements included elsewhere in this Form 10-K.
Leases
The most significant estimates used by management in accounting for leases and the impact of these estimates are as follows:
Expected lease term - Our expected lease term includes both contractual lease periods and cancelable option periods where failure to exercise such options would result in an economic penalty. The expected lease term is used in determining whether the lease is accounted for as an operating lease or a capital lease. A lease is considered a capital lease if the lease term exceeds 75% of the leased asset’s useful life. The expected lease term is also used in determining the depreciable life of the asset. An increase in the expected lease term will increase the probability that a lease may be considered a capital lease and will generally result in higher interest and depreciation expense for a leased property recorded on our balance sheet.
Incremental borrowing rate - The incremental borrowing rate is primarily used in determining whether the lease is accounted for as an operating lease or a capital lease. A lease is considered a capital lease if the net present value of the minimum lease payments is greater than 90% of the fair market value of the property. An increase in the incremental borrowing rate decreases the net present value of the minimum lease payments and reduces the probability that a lease will be considered a capital lease. For leases which are recorded on our balance sheet with a related capital lease, the incremental borrowing rate is also used in allocating our rental payments between interest expense and a reduction of the outstanding obligation. If our calculation of the net present value of minimum lease payments is greater than the
42
fair value of the leased asset, the incremental borrowing rate is adjusted so the net present value of the minimum lease payments does not exceed the fair value of the leased asset.
Fair market value of leased asset - The fair market value of leased retail property is generally estimated based on comparable market data as provided by third-party sources. Fair market value is used in determining whether the lease is accounted for as an operating lease or a capital lease. A lease is considered a capital lease if the net present value of the minimum lease payments equals or exceeds 90% of the fair market value of the property. A higher fair market value reduces the likelihood that a lease will be considered a capital lease.
Accounting owner - With certain leases, we are involved with the construction of the building and we are considered the owner of the building for accounting purposes. We capitalize the amount of total project costs incurred during the construction period as “Construction in progress.” At the completion of the construction project, we evaluate whether the transfer to the landlord meets the requirements for sale-leaseback accounting treatment. A sale and leaseback of the asset is deemed to occur when construction of the asset is complete and the lease term begins and the relevant sale-leaseback accounting criteria are met. Any gain or loss from the transaction is deferred and amortized as rent expense on a straight-line basis over the term of the lease. If we do not pass the criteria for sale-leaseback accounting, we record a financing lease asset as a building, which is included in the “Property and equipment, net” line item and a corresponding financing obligation in the “Capital and financing lease obligations” line item on our Consolidated Balance Sheets. We allocate each lease payment between a reduction of the lease obligation and interest expense using the effective interest method.
Inventories
Our inventories are stated at the lower of cost or market. Predominantly all of our inventories are valued using the last-in, first-out, or LIFO method, whereby the costs of the first items purchased remain in inventory and are used to value ending inventory. We use the link chain method for computing dollar value LIFO, whereby the base year values of beginning and ending inventories are determined using cumulative price indexes published by the Bureau of Labor Statistics. Valuing inventory using LIFO requires management to select from different available methods. Using a different method could result in a change in our estimate of the LIFO value of our inventory and that difference could be materially different.
We determine the current cost of our inventories using the first-in, first-out, or FIFO method. The FIFO value of inventories includes cost of goods and freight, net of vendor rebates and discounts. The excess of the current cost of inventories over the LIFO value, or the LIFO reserve, was approximately $7.6 million at January 31, 2016 and $7.7 million at January 25, 2015.
Impairment of Long-Lived Assets
We assess our long-lived assets, principally property and equipment, for possible impairment whenever events or changes in circumstances indicate the carrying value of a long-lived asset or group of assets may not be recoverable. Impairment evaluations for individual stores take into consideration a store’s operating cash flows, the period of time the store has been open, and management’s expectations of operating performance. Recoverability is measured by a comparison of the carrying amount of the assets to the future undiscounted cash flows expected to be generated by the assets. If impairment is indicated, a loss is recognized for any excess of the carrying value over the estimated fair value of the asset.
Our judgment regarding the existence of circumstances that indicate an asset’s carrying value may not be recoverable, and therefore potentially impaired, is based on several factors, including a decision to close a store or negative operating cash flows. Determining whether impairment exists requires that we use estimates and assumptions of projected cash flows and operating results for the asset or assets being assessed. Our cash flow projections look several years into the future and include assumptions concerning variables such as the potential impact of operational changes, competitive factors, inflation and the economy. Our estimate of fair value used in calculating an impairment loss is based on market values, if available, or our estimated future cash flow projections discounted to their present value, which are considered Level 3 inputs. Using different assumptions could result in a change in our estimates of cash flows and fair value and those differences could produce materially different results.
43
Closed Store Reserves
We record a reserve for future lease obligations associated with stores that are no longer being utilized in our current operations. The fair value of the closed store liability is estimated using a discount rate to calculate the present value of the remaining noncancelable lease payments at the cease use date for the store, net of an estimate of subtenant income. Lease payments for operating leases included in our closed store reserve are expected to be paid over the remaining terms of the respective leases.
Our assumptions about future cash payments to be made as part of the lease agreements are based on the terms contained in the lease agreement. In determining the fair value of the liability, we offset the future lease payments with an estimate of the amount of subtenant income that could be reasonably obtained for the store properties. Our expectations of potential subtenant income are based on variable factors, including our knowledge of the geographical area in which the closed property is located and existing economic conditions. We also seek advice from local brokers and agents, commercial market value analysts, and third party fair value reports to develop our assumptions. While we believe our current estimates of reserves for closed properties are adequate, it is possible that market and economic conditions could cause us to change our assumptions and may require additional reserves. We review our estimates used in determining the closed store reserve on a quarterly basis and record adjustments, if necessary, in the period in which the change becomes known.
Insurance Reserves
We use a combination of insurance and self-insurance to provide for potential liability for workers’ compensation, automobile and general liability, product liability, directors’ and officers’ liability, employee health care benefits, and other risks, including casualty and property risks. Liabilities associated with the risks that are retained by us are estimated, in part, by considering historical claims experience, demographic factors, severity factors and other actuarial assumptions. While we believe that our assumptions are appropriate, the estimated accruals for these liabilities could be significantly affected if future occurrences and claims differ from these assumptions and historical trends.
Because of the significance of the judgments and estimation processes, it is likely that materially different amounts could be recorded if we used different assumptions or if the underlying circumstances were to change. A 10% change in our insurance liabilities at January 31, 2016 would have affected our annual operating income by approximately $2.5 million.
Income Taxes
We must make certain estimates and judgments in determining income tax expense for financial statement purposes. The amount of taxes currently payable or refundable is accrued, and deferred tax assets and liabilities are recognized for the estimated future tax consequences attributable to differences between the financial statement carrying amounts of existing assets and liabilities and their respective tax bases. Deferred tax assets are also recognized for realizable loss and tax credit carryforwards. Deferred tax assets and liabilities are measured using enacted tax rates in effect for the fiscal year in which those temporary differences are expected to be recovered or settled. The effect on deferred tax assets and liabilities for a change in income tax rates is recognized in income in the period that includes the enactment date.
We apply the provisions of the authoritative guidance on accounting for uncertainty in income taxes that was issued by the Financial Accounting Standards Board, or FASB. Pursuant to this guidance, we may recognize the tax benefit from an uncertain tax position only if it is more likely than not that the tax position will be sustained on examination by the taxing authorities based on the technical merits of the position. The tax benefits recognized in the consolidated financial statements from such a position should be measured based on the largest benefit that has a greater than 50% likelihood of being realized upon ultimate settlement. The authoritative guidance also addresses other items related to uncertainty in income taxes, including derecognition, measurement, classification, interest and penalties, accounting in interim periods, disclosure and transition.
Share-based Compensation – 2010 Omnibus Incentive Compensation Plan
We grant options to purchase common stock under The Fresh Market, Inc. 2010 Omnibus Incentive Compensation Plan, which was adopted and approved by the Board of Directors during 2010. The 2010 Omnibus Incentive Compensation Plan provides for the grant of options intended to qualify as incentive stock options, nonqualified stock options (“NSOs”), stock appreciation rights, restricted stock awards, restricted stock units, performance compensation awards, cash incentive awards, deferred share units and other equity-based and equity-related awards.
44
In accordance with ASC 718, Compensation–Stock Compensation, the fair value of each NSO award is estimated on the grant date using the Black-Scholes option-pricing model which requires the input of certain assumptions, including the expected life of the share-based award, stock price volatility, dividend yield and interest rate. Because there is limited history for our common stock, the expected life and volatility are based on historical data of publicly traded companies with characteristics similar to ours, such as plan design, industry, stage of life cycle and size, which we consider as part of a peer group that we use for the purposes of the Black-Scholes option-pricing model. Expected life is based on the average expected term of a peer group as disclosed in their publicly available financial statements. Volatility is calculated by taking the weighted-average of the historical volatilities of the peer group. Since our initial public offering we have not declared dividends and we do not plan to pay any dividends in the future. The risk-free rate for periods in the expected life of the option is based on the U.S. Treasury constant maturities in effect at the time of the grant.
We recognize the estimated fair value of performance-based awards as share-based compensation expense over the performance period based upon our determination of whether it is probable that the performance targets will be achieved. We assess the probability of achieving the performance targets at the end of each reporting period. Cumulative adjustments, if any, are recorded quarterly to reflect subsequent changes in the estimated outcome of performance-related conditions. The fair value of the performance-based awards is based on the fair market value of our common stock on the date of grant.
Recent Accounting Pronouncements
In November 2015, the Financial Accounting Standards Board (“FASB”) issued Accounting Standards Update (“ASU”) No. 2015-17, Income Taxes (Topic 740): Balance Sheet Classification of Deferred Taxes. Effective for public business entities for financial statements issued for annual periods beginning after December 15, 2016 and interim periods therein, this standard will require that deferred tax liabilities and assets to be classified as noncurrent. Early adoption is permitted as of the beginning of an interim or annual reporting period and can be applied either prospectively to all deferred tax assets and liabilities or retrospectively to all periods presented. We elected to early adopt this standard on a retrospective basis at January 31, 2016. The adoption of this standard resulted in reclassification of $6,957 current deferred tax assets and $929 noncurrent deferred tax liabilities to noncurrent deferred tax assets at January 25, 2015.
In February 2016, the FASB issued ASU No. 2016-02, Leases (Topic 840), to increase transparency and comparability among organizations by recognizing lease assets and lease liabilities on the balance sheet and disclosing key information about leasing arrangements. The amendments in this standard are effective for fiscal years beginning after December 15, 2018, including interim periods within those fiscal years, for a public entity. Early adoption of the amendments in this standard is permitted for all entities and it requires that the leases are recognized and measured at the beginning of the earliest period presented using a modified retrospective approach. We are currently in the process of evaluating the effect this guidance will have on our consolidated financial statements and related disclosures.
Disclaimer on Forward-Looking Statements
Except for the historical information contained herein, the matters discussed in this analysis are forward-looking statements that involve risks and uncertainties, including, but not limited to, general business conditions, the timely development and successful opening and operation of new stores, the integration of acquired stores, the impact of competition and changes in government regulation. For a discussion of these and other risks and uncertainties that may affect our business, see “Cautionary Note Regarding Forward-Looking Statements” and “Item 1A. Risk Factors.” We do not undertake any obligation to update forward-looking statements.
Item 7A. Quantitative and Qualitative Disclosures About Market Risk.
We are exposed to interest rate changes of our long-term debt. We do not use financial instruments for trading or other speculative purposes.
Interest Rate Risk
Our principal exposure to market risk relates to changes in interest rates on borrowings under our revolving credit facility. Our revolving credit facility carries floating interest rates that are tied to LIBOR, Eurodollar, the federal funds rate or the base rate, and therefore, our statements of income and our cash flows will be exposed to changes in interest rates to the extent that we do not have effective hedging arrangements in place. We do not use derivative financial instruments for speculative or trading purposes; however, this does not preclude our adoption of specific hedging strategies in the future.
45
Item 8. Financial Statements and Supplementary Data.
Our consolidated financial statements and related notes begin on page F-1, which are included in this Form 10-K.
Item 9. Changes in and Disagreements with Accountants on Accounting and Financial Disclosure.
There are no changes in accountants or disagreements with accountants on accounting principles and financial disclosures required to be disclosed in this Item.
Item 9A. Controls and Procedures.
Conclusion Regarding Disclosure Controls and Procedures
We maintain disclosure controls and procedures designed to provide reasonable assurance to achieve the objective that information in our Exchange Act reports is recorded, processed, summarized and reported within the time periods specified and pursuant to the regulations of the SEC. Disclosure controls and procedures, as defined in Rule 13a-15(e) and Rule 15d-15(e) under the Exchange Act, include controls and procedures designed to ensure the information required to be disclosed by the Company in the reports it files or submits under the Exchange Act is accumulated and communicated to our management, including the President and Chief Executive Officer and the Executive Vice President and Chief Financial Officer, as appropriate, to allow timely decisions regarding required disclosure. It should be noted that our system of controls and procedures, however well designed and operated, can provide only reasonable, and not absolute, assurance that the objectives of the system are met.
As required by Rule 13a-15(b) under the Exchange Act, we carried out an evaluation, under the supervision and with participation of our management, including the President and Chief Executive Officer and the Executive Vice President and Chief Financial Officer, of the effectiveness of the design and operation of our disclosure controls and procedures as of January 31, 2016, the end of the period covered by this report.
Based on the evaluation, our President and Chief Executive Officer and our Executive Vice President and Chief Financial Officer have concluded that our disclosure controls and procedures were effective at a reasonable assurance level as of January 31, 2016.
Management’s Annual Report on Internal Control Over Financial Reporting
Management is responsible for establishing and maintaining adequate internal control over financial reporting, as defined in Exchange Act Rule 13a-15(f). Internal control over financial reporting is designed to provide reasonable assurance regarding the reliability of financial reporting and preparation of consolidated financial statements for external purposes in accordance with U.S. generally accepted accounting principles. Our internal control over financial reporting includes those policies and procedures that:
(i) | pertain to the maintenance of records that, in a reasonable detail, accurately and fairly reflect the dispositions of our transactions and assets; |
(ii) | provide reasonable assurance that transactions are recorded as necessary to permit preparation of consolidated financial statements in accordance with generally accepted accounting principles, and that our receipts and expenditures are being made only in accordance with authorizations of our management and directors; and |
(iii) | provide reasonable assurance regarding prevention or timely detection of unauthorized acquisitions, use or disposition of our assets that could have a material adverse effect on the consolidated financial statements. |
Because of its inherent limitations, internal control over financial reporting may not prevent or detect misstatements. Also, projections of any evaluation of effectiveness to future periods are subject to the risk that controls may become inadequate because of changes in conditions, or that the degree of compliance with the policies or procedures may deteriorate.
We have assessed the effectiveness of our internal control over financial reporting as of January 31, 2016 using the criteria established in Internal Control—Integrated Framework (2013) issued by the Committee of Sponsoring Organizations of the Treadway Commission (“COSO”).
Based on our assessment of the design and related testing of the internal control over financial reporting, management has concluded that, as of January 31, 2016, we have maintained effective internal control over financial reporting based on the criteria set forth in the COSO framework.
46
Our independent auditors, Ernst & Young LLP, a registered public accounting firm, are appointed by the Audit Committee of our Board of Directors. Ernst & Young LLP has audited and reported on our consolidated financial statements and our internal control over financial reporting. The reports of the independent auditors are contained in this Annual Report.
The effectiveness of our internal control over financial reporting has been audited by our independent auditor, Ernst & Young LLP, a registered public accounting firm, as stated in their report at page F-2 herein.
Changes in Internal Control Over Financial Reporting
There has been no change during the quarter ended January 31, 2016 in the Company’s internal control over financial reporting that was identified in connection with the evaluation required by Exchange Act Rule 13a-15(d) which has materially affected, or is reasonably likely to materially affect, the Company’s internal control over financial reporting.
As noted above, management has concluded that our disclosure controls and procedures were effective as of January 31, 2016.
Item 9B. Other Information
Not applicable.
47
PART III
Item 10. Directors, Executive Officers and Corporate Governance.
The Company will file with the SEC a definitive proxy statement for our 2016 annual meeting of stockholders (the “Proxy Statement”) no later than 120 days after the close of its fiscal year ended January 31, 2016. The information required by this Item and not given in this Item will appear under the headings “Election of Directors,” “Corporate Governance,” “Executive Officers,” and “Section 16(a) Beneficial Ownership Reporting Compliance,” in the Proxy Statement, which sections are incorporated in this Item by reference.
We have adopted a written code of conduct, which is intended to qualify as a “code of ethics” within the meaning of Item 406 of Regulation S-K of the Exchange Act, which we refer to as our Code of Ethics for Financial and Executive Officers (the “Code”). The Code applies to our principal executive officer, principal financial officer, principal accounting officer and persons performing similar functions. The Code is available on our website at www.thefreshmarket.com. We will disclose information pertaining to amendments or waivers to provisions of the Code that apply to our principal executive officer, principal financial officer, principal accounting officer or persons performing similar functions and that relate to the elements of the Code enumerated in the SEC rules and regulations by posting this information on our website at www.thefreshmarket.com. The information on our website is not a part of this Form 10-K and is not incorporated by reference in this report or any of our other filings with the SEC.
Item 11. Executive Compensation.
The information required by this Item will appear under the headings “Compensation Discussion and Analysis,” “Executive Compensation Tables,” “Compensation Committee Interlocks and Insider Participation,” “Compensation Committee Report” and “Director Compensation” in the Proxy Statement, which sections are incorporated in this Item by reference.
Item 12. Security Ownership of Certain Beneficial Owners and Management and Related Stockholder Matters.
The information required by this Item will appear under the headings “Security Ownership of Certain Beneficial Owners and Management” and “Equity Compensation Plan Information” in the Proxy Statement, which sections are incorporated in this Item by reference.
Item 13. Certain Relationships and Related Transactions, and Director Independence.
The information required by this Item will appear under the headings “Corporate Governance-Policy for Review of Related Person Transactions,” “Corporate Governance-Related Person Transactions” and “Corporate Governance-Director Independence” in the Proxy Statement, which sections are incorporated in this Item by reference.
Item 14. Principal Accountant Fees and Services.
The information required by this Item will appear under the heading “Ratification of the Appointment of Independent Registered Public Accounting Firm” in the Proxy Statement, which section is incorporated in this Item by reference.
48
PART IV
Item 15. Exhibits and Financial Statement Schedules.
(a) The following documents are filed as part of this report:
(1) Financial Statements: See Item 8. Financial Statements and Supplementary Data.
(2) Financial Statement Schedules: No schedules are required.
(3) Exhibits are incorporated herein by reference or are filed with this report as indicated below.
(b) Exhibits
Exhibit Number | Description | |
3.1 | Certificate of Incorporation of The Fresh Market, Inc. (incorporated by reference to Exhibit 3.1 to Form 10-K filed March 22, 2011 (File No. 001-34940)) | |
3.2 | Amended and Restated Bylaws of The Fresh Market, Inc. (incorporated by reference to Exhibit 3.2 to Form 10-K filed March 22, 2011 (File No. 001-34940)) | |
4.1 | Specimen Common Stock Certificate (incorporated by reference to Exhibit 4.1 to Form S-1/A filed June 23, 2010 (File No. 333-166473)) | |
4.2 | Registration Rights Agreement (incorporated by reference to Exhibit 4.2 to Form 10-K filed March 22, 2011 (File No. 001-34940)) | |
10.1+ | Supply and Service Agreement, dated as of January 26, 2007, by and between The Fresh Market, Inc. and Burris Logistics (incorporated by reference to Exhibit 10.1 to Form S-1 filed May 3, 2010 (File No. 333-166473)) | |
10.2+ | Renewal Agreement, dated as of October 28, 2011, by and between The Fresh Market, Inc. and Burris Logistics (incorporated by reference to Exhibit 10.2 to Form 10-Q filed December 8, 2011 (File No. 333-166473)) | |
10.3+ | Letter Agreement, dated May 4, 2012, between The Fresh Market, Inc. and Burris Logistics (incorporated by reference to Exhibit 10.1 to Form 10-Q filed June 7, 2012 (File No. 001-34940)) | |
10.4 | Second Renewal Agreement, dated as of March 4, 2015, by and between The Fresh Market, Inc. and Burris Logistics (incorporated by reference to Exhibit 10.1 to Form 10-Q filed May 28, 2015 (File No. 001-34940)) | |
10.5 | Credit Agreement, dated as of June 12, 2014, among The Fresh Market, Inc., as borrower, Bank of America, N.A., as administrative agent, swing line lender and letter of credit issuer, and the other lenders party thereto (incorporated by reference to Exhibit 10.1 to Form 10-Q filed September 4, 2014 (File No. 001-34940)) | |
10.6 | First Amendment to Credit Agreement, dated March 13, 2015, among The Fresh Market, Inc., as borrower, Bank of America, N.A., as administrative agent, swing line lender and letter of credit issuer, and the other lenders party thereto (incorporated by reference to Exhibit 10.7 to Form 10-K filed March 23, 2015 (File No. 001-34940)) | |
10.7 | Tax Indemnification Agreement (incorporated by reference to Exhibit 10.5 to Form 10-K filed March 22, 2011 (File No. 001-34940)) | |
10.8* | The Fresh Market Deferred Compensation Plan Amended and Restated Effective March 1, 2010 (incorporated by reference to Exhibit 10.8 to Form S-1/A filed June 4, 2010 (File No. 333-166473)) | |
10.9* | The Fresh Market, Inc. 2010 Omnibus Incentive Compensation Plan (incorporated by reference to Exhibit 10.10 to Form 10-K filed March 22, 2011 (File No. 001-34940)) | |
10.10* | The Fresh Market, Inc. Employee Stock Purchase Plan, incorporated by reference to Exhibit 10.11 to Form 10-K filed March 22, 2011 (File No. 001-34940)) | |
10.11* | The Fresh Market, Inc. Severance Plan (incorporated by reference to Exhibit 10.12 to Form S-1/A filed October 19, 2010 (File No. 333-166473)) | |
10.12* | Form of Employment Agreement (incorporated by reference to Exhibit 10.13 to Form S-1/A filed October 19, 2010 (File No. 333-166473)) | |
10.13* | Employment Offer Letter for Richard A. Anicetti dated August 31, 2015 (incorporated by reference to Form 8-K filed September 4, 2015 (File No. 001-34940)) | |
49
10.14* | Terms of Employment of Jeffrey C. Ackerman (incorporated by reference to Exhibit 10.1 to Form 10-Q filed September 6, 2013 (File No. 001-34940)) | |
10.15* | Terms of Employment of Randall A. Young (incorporated by reference to Exhibit 10.1 to Form 10-Q filed November 26, 2013 (File No. 001-34940)) | |
10.16* | Form of Option Award Agreement used for awards, if any, granted prior to January 29, 2012 (incorporated by reference to Exhibit 10.14 to Form S-1/A filed October 19, 2010 (File No. 333-166473)) | |
10.17* | Form of Restricted Stock Award Agreement for Non-Employee Directors (incorporated by reference to Exhibit 10.17 to Form S-1/A filed October 19, 2010 (File No. 333-166473)) | |
10.18* | Form of Deferred Stock Unit Award Agreement for Non-Employee Directors under The Fresh Market, Inc. 2010 Omnibus Incentive Compensation Plan (incorporated by reference to Exhibit 10.16 to Form 10-K filed March 27, 2013 (File No. 001-34940)) | |
10.19* | Form of Restricted Stock Unit Award Agreement for Non-Employee Directors under The Fresh Market, Inc. 2010 Omnibus Incentive Compensation Plan (incorporated by reference to Exhibit 10.2 to Form 10-Q filed May 28, 2015 (File No. 001-34940)) | |
10.20* | Form of Director Indemnification Agreement (incorporated by reference to Exhibit 10.20 to Form S-1/A filed October 19, 2010 (File No. 333-166473)) | |
10.21* | Form of Performance Share Unit Award Agreement under The Fresh Market, Inc. 2010 Omnibus Incentive Compensation Plan (incorporated by reference to Exhibit 10.1 to Form 8-K filed March 20, 2013 (File No. 001-34940)) | |
10.22* | Form of Option Award Agreement under The Fresh Market, Inc. 2010 Omnibus Incentive Compensation Plan (incorporated by reference to Exhibit 10.2 to Form 8-K filed March 21, 2012 (File No. 001-34940)) | |
10.23* | Form of Restricted Stock Award Agreement under The Fresh Market, Inc. 2010 Omnibus Incentive Compensation Plan (incorporated by reference to Exhibit 10.3 to Form 8-K filed March 21, 2012 (File No. 001-34940)) | |
10.24* | Form of Restricted Stock Unit Award Agreement under The Fresh Market, Inc. 2010 Omnibus Incentive Compensation Plan (incorporated by reference to Exhibit 10.4 to Form 8-K filed March 21, 2012 (File No. 001-34940)) | |
10.25* | Form of The Fresh Market, Inc. Annual Incentive Compensation Program for Executive Officers for fiscal years prior to fiscal 2015 (incorporated by reference to Exhibit 10.1 to Form 8-K filed March 26, 2014 (File No. 001-34940)) | |
10.26* | Form of The Fresh Market, Inc. Annual Incentive Compensation Program for Executive Officers for fiscal years 2015 and later (incorporated by reference to Exhibit 10.1 to Form 8-K filed March 19, 2015 (File No. 001-34940)) | |
10.27* | Form of Retention Bonus Award Agreement (incorporated by reference to Exhibit 10.1 to Form 8-K filed January 16, 2015 (File No. 001-34940)) | |
10.28* | Separation Agreement, dated January 26, 2015, by and between Craig Carlock and The Fresh Market, Inc. (incorporated by reference to Exhibit 10.1 to Form 8-K filed January 29, 2015 (File No. 001-34940)) | |
10.29* | Restricted Stock Unit Award Agreement under The Fresh Market, Inc. 2010 Omnibus Incentive Compensation Plan, dated September 1, 2015, by and between Sean Crane and The Fresh Market, Inc. (incorporated by reference to Exhibit 10.2 to Form 10-Q filed December 1, 2015 (File No. 001-34940)) | |
10.30* | Form of Restricted Stock Unit Award Agreement under The Fresh Market, Inc. 2010 Omnibus Incentive Compensation Plan (1) | |
10.31* | Employment Offer Letter for Pamela K. Kohn dated January 5, 2016 (1) | |
10.32* | Employment Agreement dated January 6, 2016, by and between Pamela K. Kohn and The Fresh Market, Inc. (1) | |
23.1 | Consent of Ernst & Young LLP (1) | |
31.1 | Certification Statement of Chief Executive Officer pursuant to Section 302 of the Sarbanes-Oxley Act of 2002 (1) | |
31.2 | Certification Statement of Chief Financial Officer pursuant to Section 302 of the Sarbanes-Oxley Act of 2002 (1) | |
32.1 | Certification Statement of Chief Executive Officer pursuant to Section 906 of the Sarbanes-Oxley Act of 2002 (1) | |
50
32.2 | Certification Statement of Chief Financial Officer pursuant to Section 906 of the Sarbanes-Oxley Act of 2002 (1) | |
101 | The following financial information from The Fresh Market, Inc.’s Annual Report on Form 10-K, for the period ended January 31, 2016 formatted in eXtensible Business Reporting Language: (i) Consolidated Balance Sheets, (ii) Consolidated Statements of Comprehensive Income, (iii) Consolidated Statements of Stockholders’ Equity, (iv) Consolidated Statements of Cash Flows, and (v) Notes to Consolidated Financial Statements (1) (2) | |
+ | Confidential treatment has been granted for certain portions which are omitted in the copy of the exhibit electronically filed with the SEC. | |
* | Indicates a management contract or compensatory plan or arrangement. | |
(1) | Filed herewith. |
(2) | Pursuant to Rule 406T of Regulation S-T, the Interactive Data Files hereto are deemed not filed or part of a registration statement or prospectus for purposes of Sections 11 or 12 of the Securities Act of 1933, as amended, are deemed not filed for purposes of Section 18 of the Exchange Act, and otherwise are not subject to liability under those sections. |
51
SIGNATURES
Pursuant to the requirements of Section 13 or 15(d) of the Securities Exchange Act of 1934, the registrant has duly caused this report to be signed on its behalf by the undersigned thereunto duly authorized.
THE FRESH MARKET, INC.
By: | /s/ Jeffrey C. Ackerman | |
Jeffrey C. Ackerman | ||
Executive Vice President and Chief Financial Officer | ||
Dated: March 23, 2016 | (Principal Financial Officer) | |
Pursuant to the requirements of the Securities Exchange Act of 1934, this report has been signed below by the following persons on behalf of the registrant and in the capacities indicated on March 23, 2016.
52
Name | Title | ||||
/s/ Richard A. Anicetti | |||||
Richard A. Anicetti | President and Chief Executive Officer | ||||
(Principal Executive Officer) | |||||
/s/ Jeffrey C. Ackerman | |||||
Jeffrey C. Ackerman | Executive Vice President and Chief Financial Officer | ||||
(Principal Financial Officer) | |||||
/s/ Jeffrey B. Short | |||||
Jeffrey B. Short | Vice President and Controller | ||||
(Principal Accounting Officer) | |||||
/s/ Ray Berry | |||||
Ray Berry | Chairman of the Board | ||||
/s/ Michael D. Casey | |||||
Michael D. Casey | Director | ||||
/s/ Jeffrey Naylor | |||||
Jeffrey Naylor | Director | ||||
/s/ Richard Noll | |||||
Richard Noll | Director | ||||
/s/ Bob Sasser | |||||
Bob Sasser | Director | ||||
/s/ Robert K. Shearer | |||||
Robert K. Shearer | Director | ||||
/s/ Steven Tanger | |||||
Steven Tanger | Director | ||||
/s/ Jane Thompson | |||||
Jane Thompson | Director | ||||
/s/ Michael Tucci | |||||
Michael Tucci | Director | ||||
53
The Fresh Market, Inc.
Consolidated Financial Statements
For the Years Ended January 31, 2016, January 25, 2015, and January 26, 2014
Index to Consolidated Financial Statements
Report of Independent Registered Public Accounting Firm on Internal Control Over Financial Reporting | F-2 |
Report of Independent Registered Public Accounting Firm | F-3 |
Consolidated Balance Sheets as of January 31, 2016 and January 25, 2015 | F-4 |
Consolidated Statements of Comprehensive Income for the years ended January 31, 2016, January 25, 2015, and January 26, 2014 | F-5 |
Consolidated Statements of Stockholders’ Equity for the years ended January 31, 2016, January 25, 2015, and January 26, 2014 | F-6 |
Consolidated Statements of Cash Flows for the years ended January 31, 2016, January 25, 2015, and January 26, 2014 | F-7 |
Notes to Consolidated Financial Statements | F-8 |
F-1
Report of Independent Registered Public Accounting Firm on Internal Control Over Financial Reporting
The Board of Directors and Stockholders of
The Fresh Market, Inc.
We have audited The Fresh Market, Inc’s. internal control over financial reporting as of January 31, 2016, based on criteria established in Internal Control—Integrated Framework issued by the Committee of Sponsoring Organizations of the Treadway Commission (2013 framework) (the COSO criteria). The Fresh Market, Inc.’s management is responsible for maintaining effective internal control over financial reporting, and for its assessment of the effectiveness of internal control over financial reporting included in the accompanying Management’s Annual Report on Internal Control Over Financial Reporting. Our responsibility is to express an opinion on the Company’s internal control over financial reporting based on our audit.
We conducted our audit in accordance with the standards of the Public Company Accounting Oversight Board (United States). Those standards require that we plan and perform the audit to obtain reasonable assurance about whether effective internal control over financial reporting was maintained in all material respects. Our audit included obtaining an understanding of internal control over financial reporting, assessing the risk that a material weakness exists, testing and evaluating the design and operating effectiveness of internal control based on the assessed risk, and performing such other procedures as we considered necessary in the circumstances. We believe that our audit provides a reasonable basis for our opinion.
A company’s internal control over financial reporting is a process designed to provide reasonable assurance regarding the reliability of financial reporting and the preparation of financial statements for external purposes in accordance with generally accepted accounting principles. A company’s internal control over financial reporting includes those policies and procedures that (1) pertain to the maintenance of records that, in reasonable detail, accurately and fairly reflect the transactions and dispositions of the assets of the company; (2) provide reasonable assurance that transactions are recorded as necessary to permit preparation of financial statements in accordance with generally accepted accounting principles, and that receipts and expenditures of the company are being made only in accordance with authorizations of management and directors of the company; and (3) provide reasonable assurance regarding prevention or timely detection of unauthorized acquisition, use, or disposition of the company’s assets that could have a material effect on the financial statements.
Because of its inherent limitations, internal control over financial reporting may not prevent or detect misstatements. Also, projections of any evaluation of effectiveness to future periods are subject to the risk that controls may become inadequate because of changes in conditions, or that the degree of compliance with the policies or procedures may deteriorate.
In our opinion, The Fresh Market, Inc. maintained, in all material respects, effective internal control over financial reporting as of January 31, 2016, based on the COSO criteria.
We also have audited, in accordance with the standards of the Public Company Accounting Oversight Board (United States), the consolidated balance sheets of The Fresh Market, Inc. as of January 31, 2016 and January 25, 2015, and the related consolidated statements of comprehensive income, stockholders’ equity, and cash flows for each of the three years in the period ended January 31, 2016 of The Fresh Market, Inc. and our report dated March 23, 2016 expressed an unqualified opinion thereon.
/s/ Ernst & Young LLP
Charlotte, North Carolina
March 23, 2016
F-2
Report of Independent Registered Public Accounting Firm
The Board of Directors and Stockholders of
The Fresh Market, Inc.
We have audited the accompanying consolidated balance sheets of The Fresh Market, Inc. as of January 31, 2016 and January 25, 2015, and the related consolidated statements of comprehensive income, stockholders’ equity, and cash flows for each of the three years in the period ended January 31, 2016. These financial statements are the responsibility of the Company’s management. Our responsibility is to express an opinion on these financial statements based on our audits.
We conducted our audits in accordance with the standards of the Public Company Accounting Oversight Board (United States). Those standards require that we plan and perform the audit to obtain reasonable assurance about whether the financial statements are free of material misstatement. An audit includes examining, on a test basis, evidence supporting the amounts and disclosures in the financial statements. An audit also includes assessing the accounting principles used and significant estimates made by management, as well as evaluating the overall financial statement presentation. We believe that our audits provide a reasonable basis for our opinion.
In our opinion, the financial statements referred to above present fairly, in all material respects, the consolidated financial position of The Fresh Market, Inc. at January 31, 2016 and January 25, 2015, and the consolidated results of its operations and its cash flows for each of the three years in the period ended January 31, 2016, in conformity with U.S. generally accepted accounting principles.
We also have audited, in accordance with the standards of the Public Company Accounting Oversight Board (United States), The Fresh Market, Inc’s. internal control over financial reporting as of January 31, 2016, based on criteria established in Internal Control - Integrated Framework issued by the Committee of Sponsoring Organizations of the Treadway Commission (2013 framework) and our report dated March 23, 2016 expressed an unqualified opinion thereon.
/s/ Ernst & Young LLP
Charlotte, North Carolina
March 23, 2016
F-3
The Fresh Market, Inc. Consolidated Balance Sheets (In thousands, except share amounts) | |||||||
January 31, 2016 | January 25, 2015 | ||||||
Assets | |||||||
Current assets: | |||||||
Cash and cash equivalents | $ | 60,843 | $ | 48,486 | |||
Accounts receivable | 10,015 | 12,442 | |||||
Inventories | 65,166 | 61,237 | |||||
Prepaid expenses and other current assets | 10,730 | 4,633 | |||||
Income tax benefit | — | 622 | |||||
Total current assets | 146,754 | 127,420 | |||||
Property and equipment, net | 413,069 | 392,194 | |||||
Deferred income taxes | 15,156 | 7,480 | |||||
Other assets | 7,139 | 9,429 | |||||
Total assets | $ | 582,118 | $ | 536,523 | |||
Liabilities and stockholders’ equity | |||||||
Current liabilities: | |||||||
Accounts payable | $ | 49,289 | $ | 45,592 | |||
Accrued liabilities | 82,763 | 74,641 | |||||
Total current liabilities | 132,052 | 120,233 | |||||
Capital and financing lease obligations | 32,285 | 33,337 | |||||
Closed store reserves | 7,496 | 10,187 | |||||
Deferred rent | 14,826 | 13,797 | |||||
Deferred lease incentives | 16,993 | 14,117 | |||||
Other liabilities | 15,295 | 16,065 | |||||
Total noncurrent liabilities | 86,895 | 87,503 | |||||
Commitments and contingencies (Notes 3, 6 and 15) | |||||||
Stockholders’ equity: | |||||||
Preferred stock – $0.01 par value; 40,000,000 shares authorized, none issued | — | — | |||||
Common stock – $0.01 par value; 200,000,000 shares authorized, 46,953,681 and 48,392,201 shares issued and outstanding as of January 31, 2016 and January 25, 2015, respectively | 468 | 483 | |||||
Additional paid-in capital | 129,031 | 122,526 | |||||
Retained earnings | 233,672 | 205,778 | |||||
Total stockholders’ equity | 363,171 | 328,787 | |||||
Total liabilities and stockholders’ equity | $ | 582,118 | $ | 536,523 | |||
See accompanying notes to consolidated financial statements. | |||||||
F-4
The Fresh Market, Inc.
Consolidated Statements of Comprehensive Income
(In thousands, except share and per share amounts)
Year Ended | |||||||||||
January 31, 2016 | January 25, 2015 | January 26, 2014 | |||||||||
(53 weeks) | (52 weeks) | (52 weeks) | |||||||||
Sales | $ | 1,857,033 | $ | 1,753,166 | $ | 1,511,657 | |||||
Cost of goods sold (exclusive of depreciation shown separately) | 1,224,790 | 1,158,546 | 996,301 | ||||||||
Gross profit | 632,243 | 594,620 | 515,356 | ||||||||
Operating expenses: | |||||||||||
Selling, general and administrative expenses | 441,659 | 406,452 | 349,813 | ||||||||
Impairments and store closure costs | 13,431 | 22,589 | 27,505 | ||||||||
Depreciation | 68,658 | 61,966 | 54,657 | ||||||||
Income from operations | 108,495 | 103,613 | 83,381 | ||||||||
Other expenses (income): | |||||||||||
Interest expense | 4,047 | 4,375 | 3,783 | ||||||||
Income before provision for income taxes | 104,448 | 99,238 | 79,598 | ||||||||
Tax provision | 38,950 | 36,213 | 28,791 | ||||||||
Net income and comprehensive income | $ | 65,498 | $ | 63,025 | $ | 50,807 | |||||
Net income per share: | |||||||||||
Basic | $ | 1.37 | $ | 1.30 | $ | 1.05 | |||||
Diluted | $ | 1.36 | $ | 1.30 | $ | 1.05 | |||||
Weighted average common shares outstanding: | |||||||||||
Basic | 47,956,724 | 48,298,653 | 48,206,879 | ||||||||
Diluted | 48,103,344 | 48,475,735 | 48,394,338 | ||||||||
See accompanying notes to consolidated financial statements.
F-5
The Fresh Market, Inc. Consolidated Statements of Stockholders’ Equity (In thousands, except share amounts | ||||||||||||||||||
Common Stock, $0.01 par value | ||||||||||||||||||
Common Shares Outstanding | Common Stock | Additional Paid-in Capital | Retained Earnings | Total Stockholders’ Equity | ||||||||||||||
As of January 27, 2013 | 48,144,620 | $ | 482 | $ | 105,431 | $ | 91,946 | $ | 197,859 | |||||||||
Exercise of share-based awards | 84,453 | 1 | 2,058 | — | 2,059 | |||||||||||||
Issuance of common stock pursuant to restricted stock units | 19,203 | — | — | — | — | |||||||||||||
Issuance of common stock pursuant to employee stock purchase plan | 5,290 | — | 226 | — | 226 | |||||||||||||
Vesting of restricted stock awards, non-employee directors | 7,238 | — | — | — | — | |||||||||||||
Withholding tax on restricted stock unit vesting | — | — | (494 | ) | — | (494 | ) | |||||||||||
Share-based compensation | — | — | 5,239 | — | 5,239 | |||||||||||||
Tax benefit related to exercise of share-based awards | — | — | 569 | — | 569 | |||||||||||||
Net income | — | — | — | 50,807 | 50,807 | |||||||||||||
As of January 26, 2014 | 48,260,804 | $ | 483 | $ | 113,029 | $ | 142,753 | $ | 256,265 | |||||||||
Exercise of share-based awards | 88,108 | — | 1,938 | — | 1,938 | |||||||||||||
Issuance of common stock pursuant to restricted stock units | 22,729 | — | — | — | — | |||||||||||||
Issuance of common stock pursuant to employee stock purchase plan | 5,056 | — | 170 | — | 170 | |||||||||||||
Vesting of restricted stock awards, non-employee directors | 11,374 | — | — | — | — | |||||||||||||
Vesting of executive restricted stock awards | 4,130 | — | — | — | — | |||||||||||||
Withholding tax on restricted stock vesting | — | — | (468 | ) | — | (468 | ) | |||||||||||
Share-based compensation | — | — | 7,533 | — | 7,533 | |||||||||||||
Tax benefit related to exercise of share-based awards | — | — | 324 | — | 324 | |||||||||||||
Net income | — | — | — | 63,025 | 63,025 | |||||||||||||
As of January 25, 2015 | 48,392,201 | $ | 483 | $ | 122,526 | $ | 205,778 | $ | 328,787 | |||||||||
Exercise of share-based awards | 114,571 | 1 | 2,649 | — | 2,650 | |||||||||||||
Issuance of common stock pursuant to restricted stock units | 43,764 | — | — | — | — | |||||||||||||
Issuance of common stock pursuant to employee stock purchase plan | 6,223 | — | 164 | — | 164 | |||||||||||||
Vesting of restricted stock awards, non-employee directors | 11,218 | — | — | — | — | |||||||||||||
Vesting of executive restricted stock awards | 1,941 | — | — | — | — | |||||||||||||
Withholding tax on restricted stock vesting | — | — | (1,350 | ) | — | (1,350 | ) | |||||||||||
Share-based compensation | — | — | 4,936 | — | 4,936 | |||||||||||||
Tax benefit related to exercise of share-based awards | — | — | 106 | — | 106 | |||||||||||||
Repurchase of common stock | (1,616,237 | ) | (16 | ) | — | (37,604 | ) | (37,620 | ) | |||||||||
Net income | — | — | — | 65,498 | 65,498 | |||||||||||||
As of January 31, 2016 | 46,953,681 | $ | 468 | $ | 129,031 | $ | 233,672 | $ | 363,171 | |||||||||
See accompanying notes to consolidated financial statements.
F-6
The Fresh Market, Inc.
Consolidated Statements of Cash Flows
(In thousands)
Year Ended | |||||||||||
January 31, 2016 | January 25, 2015 | January 26, 2014 | |||||||||
Operating activities | |||||||||||
Net income | $ | 65,498 | $ | 63,025 | $ | 50,807 | |||||
Adjustments to reconcile net income to net cash provided by operating activities: | |||||||||||
Depreciation and amortization | 68,844 | 62,163 | 54,878 | ||||||||
Loss on disposals of property and equipment | 10 | 2,006 | 311 | ||||||||
Impairment of property and equipment | 5,595 | 8,961 | 26,828 | ||||||||
Gain on assignment of capital lease | — | (1,508 | ) | — | |||||||
Share-based compensation | 4,936 | 7,533 | 5,239 | ||||||||
Excess tax benefits from share-based compensation | (106 | ) | (324 | ) | (569 | ) | |||||
Deferred income taxes | (7,676 | ) | (16,230 | ) | (11,519 | ) | |||||
Change in assets and liabilities: | |||||||||||
Accounts receivable | 2,427 | (1,344 | ) | (4,268 | ) | ||||||
Inventories | (3,929 | ) | (5,581 | ) | (11,671 | ) | |||||
Prepaid expenses and other assets | (3,989 | ) | (1,003 | ) | 351 | ||||||
Income tax benefit | 622 | 1,070 | — | ||||||||
Accounts payable | 3,697 | (1,350 | ) | 11,308 | |||||||
Closed store reserves | 519 | 9,487 | (170 | ) | |||||||
Accrued and other liabilities | 10,073 | 16,120 | 18,847 | ||||||||
Net cash provided by operating activities | 146,521 | 143,025 | 140,372 | ||||||||
Investing activities | |||||||||||
Purchases of property and equipment | (97,691 | ) | (90,182 | ) | (122,366 | ) | |||||
Proceeds from sale of property and equipment | 769 | 8,004 | 119 | ||||||||
Net cash used in investing activities | (96,922 | ) | (82,178 | ) | (122,247 | ) | |||||
Financing activities | |||||||||||
Borrowings on revolving credit facility | — | 138,233 | 513,621 | ||||||||
Payments made on revolving credit facility | — | (162,933 | ) | (530,921 | ) | ||||||
Payments made for debt issuance costs | — | (534 | ) | — | |||||||
Payments made on capital and financing lease obligations | (1,191 | ) | (836 | ) | (177 | ) | |||||
Proceeds from issuance of common stock pursuant to employee stock purchase plan | 164 | 170 | 226 | ||||||||
Excess tax benefit from share-based compensation | 106 | 324 | 569 | ||||||||
Payments made on withholding tax for restricted stock vesting | (1,350 | ) | (468 | ) | (494 | ) | |||||
Proceeds from exercise of share-based compensation awards | 2,649 | 1,938 | 2,059 | ||||||||
Payments made to repurchase common stock | (37,620 | ) | — | — | |||||||
Net cash used in financing activities | (37,242 | ) | (24,106 | ) | (15,117 | ) | |||||
Net increase in cash and cash equivalents | 12,357 | 36,741 | 3,008 | ||||||||
Cash and cash equivalents at beginning of period | 48,486 | 11,745 | 8,737 | ||||||||
Cash and cash equivalents at end of period | $ | 60,843 | $ | 48,486 | $ | 11,745 | |||||
Supplemental disclosures of cash flow information: | |||||||||||
Cash paid during the period for interest | $ | 3,808 | $ | 4,188 | $ | 2,483 | |||||
Cash paid during the period for taxes | $ | 44,239 | $ | 51,332 | $ | 47,609 | |||||
Non-cash investing and financing activities: | |||||||||||
Property and equipment acquired through capital and financing lease obligations | $ | 51 | $ | 9,644 | $ | 40,511 | |||||
See accompanying notes to consolidated financial statements.
F-7
The Fresh Market, Inc.
Notes to Consolidated Financial Statements
(In thousands, except share and per share data)
1. Description of Business
The Fresh Market, Inc., a Delaware corporation, and its consolidated subsidiaries (collectively “The Fresh Market” or the “Company”), is a specialty grocery retailer focused on creating an extraordinary food shopping experience for its customers. Since opening its first store in 1982, the Company has offered high-quality food products, with an emphasis on fresh, premium perishables and an uncompromising commitment to customer service. The Company seeks to provide an attractive, convenient shopping environment while offering its customers a compelling price-value combination.
2. Summary of Significant Accounting Policies
Definition of Fiscal Year
The Company reports its results of operations on a 52- or 53-week fiscal year ending on the last Sunday in January. The year ended January 31, 2016 was a 53-week fiscal year while the years ended January 25, 2015 and January 26, 2014 were 52-week years.
Principles of Consolidation
The accompanying consolidated financial statements have been prepared in accordance with U.S. generally accepted accounting principles (“U.S. GAAP”). The Company’s wholly-owned subsidiaries are consolidated and all intercompany accounts and transactions are eliminated upon consolidation.
Use of Estimates
The preparation of financial statements in conformity with U.S. GAAP requires management to make estimates and assumptions that affect the reported amounts of assets and liabilities and disclosure of contingent assets and liabilities at the date of the financial statements and the reported amounts of revenues and expenses during the reporting period. Actual results could differ from those estimates.
Reclassifications
In certain instances, amounts previously reported in the consolidated financial statements have been reclassified to conform to current year presentation. The reclassifications have no effect on net income or stockholders’ equity as previously reported. The Company has adjusted its Consolidated Balance Sheets for the year ended January 25, 2015 for the reclassification of various deferred tax assets and liabilities as noncurrent deferred tax assets in connection with the early adoption of ASU 2015-17, Income Taxes (Topic 740). For a more detailed description of its deferred taxes, see Note 2, Summary of Significant Accounting Policies - Recent Accounting Pronouncements, to our consolidated financial statements.
Reportable Segments
The Company has determined that it has one reportable segment. The Company’s revenues come from the sale of items at its specialty food stores, which are located in 27 states in the United States. The Company’s primary focus is on perishable categories, which include meat, seafood, produce, deli, bakery, floral, sushi and prepared foods. Non-perishable categories consist of traditional grocery, frozen and dairy products as well as bulk, coffee and candy, and beer and wine. The following is a summary of the percentages for the sales of perishable and non-perishable items:
Year Ended | |||||
January 31, 2016 | January 25, 2015 | January 26, 2014 | |||
Perishable | 65.7% | 65.5% | 65.4% | ||
Non-perishable | 34.3% | 34.5% | 34.6% | ||
F-8
The Fresh Market, Inc.
Notes to the Consolidated Financial Statements (continued)
2. Summary of Significant Accounting Policies (continued)
Cash and Cash Equivalents
Cash and cash equivalents include cash on hand, cash on deposit with banks and credit and debit card sales transactions which settle within a few business days of the reporting date.
Accounts Receivable
Accounts receivable consist primarily of receivables from lessors for tenant improvement allowances, from vendors for certain promotional programs and other miscellaneous receivables and are presented net of an allowance for estimated uncollectible amounts of $76 and $159 at January 31, 2016 and January 25, 2015, respectively.
Inventories
The Company’s inventories are stated at the lower of cost or market. For approximately 97% and 96% of the Company’s inventories at January 31, 2016 and January 25, 2015, respectively, cost was valued using the last-in, first-out, or LIFO method. This method results in a better matching of the Company’s costs and revenues. Under the LIFO method, the cost assigned to items sold is based on the cost of the most recent items purchased. As a result, the costs of the first items purchased remain in inventory and are used to value ending inventory. The excess of the current cost of inventories over the LIFO value, or the LIFO reserve, was $7,577 and $7,743 at January 31, 2016 and January 25, 2015, respectively.
If the first-in, first-out, or FIFO method had been used for all inventories, the carrying value of inventories would have been $72,743 and $68,980 at January 31, 2016 and January 25, 2015, respectively. The FIFO value of inventories includes cost of goods and freight, net of vendor rebates and discounts.
Property and Equipment
Except for capital and financing lease assets, property and equipment is stated at cost. Depreciation is provided using the straight-line method over the following estimated useful lives:
Buildings | 30 years | |
Leasehold and land improvements | 10 - 15 years | |
Store fixtures and equipment | 3 - 10 years | |
Office furniture, fixtures and equipment | 5 - 10 years | |
Automobiles | 5 years | |
Software | 3 years | |
Depreciation of leasehold and land improvements is recognized over the shorter of the estimated useful life of the asset or the term of the lease. The term of the lease includes renewal options for additional periods if the exercise of the renewal is considered to be reasonably assured.
Capital and financing lease assets in the amount of $46,557 and $46,506 are incorporated with buildings, which is included in the “Property and equipment, net” line item on the accompanying Consolidated Balance Sheets as of January 31, 2016 and January 25, 2015, respectively. Accumulated depreciation related to capital and financing lease assets as of January 31, 2016 and January 25, 2015 was $6,532 and $3,972, respectively. Capital leases are recorded at the lesser of the net present value of the minimum lease payments or fair value. Financing lease assets are recorded at fair value. Depreciation on capital and financing lease assets is recognized over the lesser of the asset’s lease term or economic life of the property and is included in the “Depreciation” line item on the accompanying Consolidated Statements of Comprehensive Income during the years ended January 31, 2016, January 25, 2015 and January 26, 2014, respectively.
When property and equipment is sold or retired, the cost and accumulated depreciation are removed from the accounts and the resulting gain or loss is recognized in the “Selling, general and administrative expenses” line item on the accompanying Consolidated Statements of Comprehensive Income. Expenditures for maintenance and repairs are charged to expense as incurred.
Interest costs incurred on borrowed funds during the period of construction of capital assets are capitalized as a component of the cost of those assets. Interest costs of $131, $336 and $464 were capitalized during the years ended January 31, 2016, January 25, 2015 and January 26, 2014, respectively.
F-9
The Fresh Market, Inc.
Notes to the Consolidated Financial Statements (continued)
2. Summary of Significant Accounting Policies (continued)
Impairment of Long-Lived Assets
The Company assesses its long-lived assets, principally leasehold and land improvements, store fixtures and equipment, as well as capital and financing lease assets for possible impairment whenever events or changes in circumstances, such as declining or negative operating cash flows or an unplanned change in the manner in which the Company intends to utilize its long-lived assets, indicate the carrying value of an asset or asset group may not be recoverable. When assessing whether impairment exists, the Company aggregates long-lived assets at the individual store level, which the Company considers to be the lowest level for which independent identifiable cash flows are available. Impairment evaluations for individual stores take into consideration a store’s historical and projected operating cash flows, the period of time the store has been open, and the operating performance in the related market. Recoverability is evaluated by comparing the carrying amount of the asset group to the future undiscounted cash flows expected to be generated by the asset group. If the carrying value of the asset group is greater than the future undiscounted cash flows, an impairment exists and must be measured and a loss is recognized for any excess of the carrying value over the estimated fair value of the asset group. The fair value is estimated based on discounted future cash flows and/or market values of the long-lived assets. As part of its analysis, the Company may acquire third-party fair value reports, which provide independent estimates of the fair values of certain long-lived assets.
Store Closure Costs
The Company recognizes a charge and related reserve for future operating lease payments associated with retail stores that are no longer being utilized in its current operations. The reserve is calculated using the present value of the remaining noncancelable lease payments after the cease use date less an estimate of subtenant income. If subtenant income is expected to be higher than the current lease payments, no reserve is recorded. Lease payments included in the closed store reserve are expected to be paid over the remaining terms of the respective leases, which range from approximately seven to thirteen years. The Company’s assumptions about subtenant income are based on its experience and knowledge of the area in which the closed property is located, guidance received from local brokers and agents, commercial market value analysts, and existing economic conditions. As part of its analysis, the Company may acquire third-party fair value reports, which provide independent estimates of the fair values of similar rental properties. Adjustments to the closed store reserve relate primarily to changes in subtenant income and other assumptions differing from original estimates, as well as reductions to the reserve resulting from periodic lease payments. Adjustments are recorded for changes in estimates in the period in which the change becomes known.
Revenue Recognition
Revenue is recognized at the point of sale, net of coupons and discounts. Sales taxes are not included in revenue. As of January 31, 2016, the Company operated 184 stores in 27 states.
Gift Cards
A wholly-owned subsidiary of the Company sells Company gift cards to customers. There are no administrative fees on unused gift cards and the gift cards do not have an expiration date. Gift card sales are recorded as a liability to unearned gift card revenue when sold and are recognized as revenue when either the gift card is redeemed or the likelihood of the gift card being redeemed is remote (“gift card breakage”). The Company’s gift card breakage rate is based upon historical redemption patterns and it recognizes breakage revenue utilizing the redemption recognition method.
Cost of Goods Sold
Cost of goods sold consists of the cost of inventory sold during the period, including the direct costs of purchased merchandise, distribution and supply chain costs, buying costs, a LIFO adjustment, supplies and store occupancy costs. Store occupancy costs include rent, common area maintenance, real estate taxes, personal property taxes, insurance, licenses and utilities related to the stores used in the Company’s operations. Rebates and discounts from vendors are recorded as the related purchases are made and are recognized as a reduction to cost of goods sold as the related inventory is sold.
Selling, General and Administrative Expenses
Selling, general and administrative expenses include certain retail store and corporate costs, including compensation (both cash and share-based), pre-opening expenses, marketing and advertising and other direct store and corporate administrative costs. Pre-opening expenses are costs associated with the opening of new stores including costs associated with store labor, travel, recruiting, relocating and training personnel and other miscellaneous costs. Pre-opening costs and costs incurred for producing and communicating advertising are expensed when incurred. Advertising costs totaled $8,027, $5,788, and $4,263 for the years ended January 31, 2016, January 25, 2015 and January 26, 2014, respectively.
F-10
The Fresh Market, Inc.
Notes to the Consolidated Financial Statements (continued)
2. Summary of Significant Accounting Policies (continued)
Leases
For leases classified as operating leases, the lease agreements generally include rent holidays and rent escalation provisions and may include contingent rent provisions for percentage of sales in excess of specified levels. The Company recognizes rent holidays, including the time period during which the Company has control of the property prior to the opening of the store, as well as escalating rent provisions, as deferred rent expense and amortizes these balances on a straight-line basis over the term of the lease. For lease agreements that require the payment of contingent rents based on a percentage of sales above stipulated minimums, the Company begins accruing an estimate for contingent rent expense when it is determined that it is probable the specified levels of sales in excess of the stipulated minimums will be reached during the year. Reimbursement from a landlord for tenant improvements is classified as an incentive and included in the “Deferred lease incentives” line item on the accompanying Consolidated Balance Sheets. The deferred rent credit is amortized as a reduction to rent expense on a straight-line basis over the term of the lease.
For leases that are classified as capital leases, the capital lease asset is recorded as a building, which is included in the “Property and equipment, net” line item and a corresponding amount is recorded as a capital lease obligation in the “Capital and financing lease obligations” line item on the accompanying Consolidated Balance Sheets at an amount equal to the lesser of the net present value of minimum lease payments to be made over the lease term or the fair value of the property being leased. The Company allocates each lease payment between a reduction of the lease obligation and interest expense using the effective interest method.
With certain leases, the Company is involved with the construction of the building and the Company is considered the owner of the building for accounting purposes. The Company capitalizes the amount of total project costs incurred during the construction period as construction in progress. At the completion of the construction project, the Company evaluates whether the transfer to the landlord meets the requirements for sale-leaseback accounting treatment. A sale and leaseback of the asset is deemed to occur when construction of the asset is complete and the lease term begins and the relevant sale-leaseback accounting criteria are met. Any gain or loss from the transaction is deferred and amortized as rent expense on a straight-line basis over the term of the lease. If the lease does not meet the criteria for sale-leaseback accounting, the Company records the financing lease asset as a building, which is included in the “Property and equipment, net” line item, and a corresponding financing obligation in the “Capital and financing lease obligations” line item on its Consolidated Balance Sheets. The Company allocates each lease payment between a reduction of the lease obligation and interest expense using the effective interest method.
During the year ended January 25, 2015, the Company entered into a sale-leaseback transaction involving one of its store locations. The store is being leased from the buyer-lessor over an initial lease term of 15 years and is classified as an operating lease. The Company determined it retained the lease rights to the property and preserved the benefits and risks incident to ownership, and thus the $212 gain which resulted from the net $7,855 transaction proceeds was deferred and is being amortized as a reduction to rent expense over the 15-year initial lease term.
Share-based Compensation
The Company grants options to purchase common stock under The Fresh Market, Inc. 2010 Omnibus Incentive Compensation Plan (“2010 Omnibus Incentive Compensation Plan”), which was adopted and approved by the Board of Directors and the Company’s stockholders in 2010 and reapproved by the Company’s stockholders in 2012. The 2010 Omnibus Incentive Compensation Plan provides for the grant of options intended to qualify as incentive stock options, nonqualified stock options, stock appreciation rights, restricted stock awards (“RSAs”), restricted stock units (“RSUs”), performance compensation awards, cash incentive awards, deferred share units and other equity-based and equity-related awards.
In accordance with ASC 718, Compensation-Stock Compensation, the fair value of each option award is estimated on the grant date using the Black-Scholes option-pricing model. This model requires the input of certain assumptions, including the expected life of the share-based award, stock price volatility, dividend yield and interest rate. Because there is limited history for the Company’s common stock, the expected life and volatility assumptions are based on historical data from similar entities, which comprise the Company’s “peer group.” The Company’s assessment of its peer group includes considerations such as the subject companies’ plan characteristics and principal populations as well as industry, stage of life cycle, size and financial leverage. Since the Company’s initial public offering, it has not declared dividends and it does not plan to pay any dividends in the future. The risk-free rate for periods in the contractual life of the option is based on the U.S. Treasury constant maturities in effect at the time of the grant.
The fair value of RSUs and RSAs is based on the closing price of the Company’s common stock on the date of grant. The RSU awards are based on a graded or cliff vesting schedule over the requisite service period and the Company recognizes compensation expense on a straight-line basis for RSUs and RSAs net of estimated forfeitures. RSAs and RSUs issued to
F-11
The Fresh Market, Inc.
Notes to the Consolidated Financial Statements (continued)
2. Summary of Significant Accounting Policies (continued)
independent directors vest pursuant to the 2010 Omnibus Incentive Compensation Plan at the earlier of one year or the next annual meeting of stockholders.
Executive RSAs are comprised of two types: RSAs that are subject to three-year cliff-based vesting, and RSAs that vest in annual 25% increments over a four-year period beginning on the grant date. Upon vesting, the risk of forfeiture and restrictions on transferability lapse. The Company recognizes the related compensation expense on a straight-line basis, net of estimated forfeitures, over the required service period.
The Company recognizes the estimated fair value of performance-based awards as share-based compensation expense over the performance period based upon its determination of whether it is probable that the performance targets will be achieved. The Company assesses the probability of achieving the performance targets at each reporting period. Cumulative adjustments, if any, are recorded to reflect subsequent changes in the estimated outcome of performance-related conditions. The fair value of the performance-based awards is based on the fair market value of the Company’s common stock on the date of grant.
Income Taxes
The Company must make certain estimates and judgments in determining income tax expense for financial statement purposes. The amount of taxes currently payable or refundable is accrued, and deferred tax assets and liabilities are recognized for the estimated future tax consequences attributable to differences between the financial statement carrying amounts of existing assets and liabilities and their respective tax bases. Deferred tax assets are also recognized for realizable loss and tax credit carryforwards. Deferred tax assets and liabilities are measured using enacted tax rates in effect for the year in which those temporary differences are expected to be recovered or settled. The effect on deferred tax assets and liabilities for a change in tax rates is recognized in income in the period that includes the enactment date.
The Company applies the provisions of the authoritative guidance on accounting for uncertainty in income taxes that was issued by the Financial Accounting Standards Board (“FASB”). Pursuant to this guidance, the Company may recognize the tax benefit from an uncertain tax position only if it is more likely than not that the tax position will be sustained on examination by the taxing authorities based on the technical merits of the position. The tax benefits recognized in the consolidated financial statements from such a position should be measured based on the largest benefit that has a greater than 50% likelihood of being realized upon ultimate settlement. The authoritative guidance also addresses other items related to uncertainty in income taxes, including derecognition, measurement, classification, interest and penalties, accounting in interim periods, disclosure and transition.
The Company applies the provisions of ASC 740-10, Accounting for Uncertainty in Income Taxes, an interpretation of FASB Statement No. 109 (“ASC 740-10”), which prescribes a recognition threshold and measurement attribute for the financial statement recognition and measurement of a tax position taken or expected to be taken in a tax return. Additionally, ASC 740-10 provides guidance on derecognition, classification, interest and penalties, accounting in interim periods, disclosure, and transition.
Recent Accounting Pronouncements
In February 2016, the Financial Accounting Standards Board (“FASB”) issued Accounting Standards Update (“ASU”) No. 2016-02, Leases (Topic 840), to increase transparency and comparability among organizations by recognizing lease assets and lease liabilities on the balance sheet and disclosing key information about leasing arrangements. The amendments in this standard are effective for fiscal years beginning after December 15, 2018, including interim periods within those fiscal years, for a public entity. Early adoption of the amendments in this standard is permitted for all entities and the Company must recognize and measure leases at the beginning of the earliest period presented using a modified retrospective approach. The Company is currently in the process of evaluating the effect this guidance will have on its consolidated financial statements and related disclosures.
In November 2015, the FASB issued ASU No. 2015-17, Income Taxes (Topic 740): Balance Sheet Classification of Deferred Taxes. Effective for public business entities for financial statements issued for annual periods beginning after December 15, 2016 and interim periods therein, this standard will require that deferred tax liabilities and assets be classified as noncurrent. Early adoption is permitted as of the beginning of an interim or annual reporting period and can be applied either prospectively to all deferred tax assets and liabilities or retrospectively to all periods presented. The Company has elected to early adopt this standard on a retrospective basis at January 31, 2016. The adoption of this standard resulted in reclassification of $6,957 current deferred tax assets and $929 noncurrent deferred tax liabilities to noncurrent deferred tax assets at January 25, 2015.
F-12
The Fresh Market, Inc.
Notes to the Consolidated Financial Statements (continued)
2. Summary of Significant Accounting Policies (continued)
In July 2015, the FASB issued ASU No. 2015-11 (Topic 330), Inventory: Simplifying the Measurement of Inventory. The amendments require an entity to measure in scope inventory at the lower of cost and net realizable value. The amendments do not apply to inventory that is measured using the last-in, first-out (LIFO) or the retail inventory method. ASU No. 2015-11 is effective for fiscal years, and interim periods within those fiscal years, beginning after December 15, 2016. Early adoption is permitted. The Company does not expect the adoption of this guidance to have a material impact on its consolidated financial statements and related disclosures.
In April 2015, the FASB issued ASU No. 2015-05 (Subtopic 350-40), Customer’s Accounting for Fees Paid in a Cloud Computing Arrangement, which provides guidance to customers about whether a cloud computing arrangement includes a software license. If a cloud computing arrangement includes a software license, then the customer should account for the software license element of the arrangement consistent with the acquisition of other software licenses. If a cloud computing arrangement does not include a software license, then the customer should account for the arrangement as a service contract. ASU No. 2015-05 is effective for fiscal years, and interim periods within those fiscal years, beginning after December 15, 2015. Early adoption is permitted. The Company does not expect the adoption of this guidance to have a material impact on its consolidated financial statements and related disclosures.
In April 2015, the FASB issued ASU No. 2015-03 (Subtopic 835-30), Simplifying the Presentation of Debt Issuance Costs, which requires that debt issuance costs related to a recognized debt liability be presented in the balance sheet as a direct deduction from the carrying amount of that debt liability and the amortization of debt issuance costs is reported as interest expense. In August 2015, the FASB issued FASB ASU No. 2015-15, Interest-Imputation of Interest (Subtopic 835-30): Presentation and Subsequent Measurement of Debt Issuance Costs Associated with Line-of-Credit Arrangements. ASU 2015-15 clarifies that the Securities and Exchange Commission (“SEC”) staff would not object to an entity deferring and presenting debt issuance costs as an asset and subsequently amortizing the deferred debt issuance costs ratably over the term of the line-of-credit arrangement, regardless of whether there are any outstanding borrowings on the line-of-credit arrangement. Both ASU 2015-03 and ASU 2015-15 are effective for fiscal years beginning after December 15, 2015, including interim periods within those fiscal years. Early adoption is permitted. The Company does not expect the adoption of this guidance to have a material impact on its consolidated financial statements and related disclosures.
In May 2014, the FASB issued ASU No. 2014-09 (Topic 606), Revenue from Contracts with Customers, which amended the existing accounting standards for revenue recognition. ASU No. 2014-09 establishes principles for recognizing revenue upon the transfer of promised goods or services to customers, in an amount that reflects the consideration expected to be received in exchange for those goods or services. In August 2015, the FASB issued ASU No. 2015-14, Revenue from Contracts with Customers Deferral of the Effective Date, which deferred the effective date of the new revenue recognition standard by one year; as a result, public entities would apply the new revenue standard to annual reporting periods, and interim periods within those annual reporting periods, beginning after December 31, 2017. Early adoption is permitted for all entities only as of annual reporting periods, and interim periods within those annual reporting periods, beginning after December 15, 2016. The guidance allows for the amendment to be applied either retrospectively to each prior reporting period presented or retrospectively as a
cumulative-effect adjustment as of the date of adoption. The Company is currently in the process of evaluating the effect this guidance will have on its consolidated financial statements and related disclosures.
3. Long-Term Debt
The Company had no outstanding borrowings as of January 31, 2016 or January 25, 2015.
On June 12, 2014, the Company entered into an unsecured revolving credit agreement with Bank of America, N.A., as Administrative Agent, Swing Line Lender and Letter of Credit Issuer, and the several lenders party thereto (the “2014 Credit Agreement”), which refinanced and replaced the Company’s then existing senior unsecured revolving credit facility.
The 2014 Credit Agreement matures June 12, 2019 and is available to provide support for working capital, capital expenditures and other general corporate purposes, including permitted acquisitions and issuance of letters of credit. While the Company currently has no material domestic subsidiaries, other entities will guarantee its obligations under the 2014 Credit Agreement if and when they become material domestic subsidiaries of the Company during the term of the 2014 Credit Agreement.
The 2014 Credit Agreement provides for total borrowings of up to $175,000. Under the terms of the 2014 Credit Agreement, the Company is entitled to request an increase in the size of the facility by an amount not exceeding $100,000 in
the aggregate. If the existing lenders elect not to provide the full amount of a requested increase, or in lieu of accepting offers
F-13
The Fresh Market, Inc.
Notes to Consolidated Financial Statements - (continued)
3. Long-Term Debt (continued)
from existing lenders to increase their commitments, the Company may designate one or more other lenders to become a party to the 2014 Credit Agreement, subject to the approval of the Administrative Agent. The 2014 Credit Agreement includes a letter of credit sublimit of $60,000, of which $27,416 was outstanding at January 31, 2016, and $25,434 was outstanding at January 25, 2015. The beneficiaries of these letters of credit are the Company’s workers’ compensation and general liability insurance carriers. The 2014 Credit Agreement also includes a swing line sublimit of $15,000.
At the Company’s option, revolving loans under the 2014 Credit Agreement bear interest at (i) the London Interbank Offered Rate (“LIBOR”) plus an applicable margin that ranges from 0.90% to 2.00%, (ii) the Eurodollar rate plus an applicable margin that ranges from 0.90% to 2.00%, or (iii) the base rate plus an applicable margin that ranges from 0% to 1.00%, where the base rate is defined as the greatest of: (a) the federal funds rate plus 0.50%, (b) Bank of America’s prime rate, and (c) the Eurodollar rate plus 1.00%.
The commitment fee calculated on the unused portions of the 2014 Credit Agreement ranges from 0.125% to 0.250% per annum.
The 2014 Credit Agreement contains a number of affirmative and restrictive covenants, including limitations on the Company’s ability to grant liens, incur additional debt, pay dividends, redeem its common stock, make certain investments and engage in certain merger, consolidation or asset sale transactions.
4. Fair Value Measurements
ASC 820, Fair Value Measurements, requires fair value measurements be classified and disclosed in one of the following pricing categories:
• | Level 1 - Quoted prices in active markets for identical assets or liabilities as of the reporting date. |
• | Level 2 - Observable inputs other than quoted prices in active markets included for identical assets and liabilities. |
• | Level 3 - Unobservable inputs in which there is little or no market data available, which require the reporting entity to develop its own assumptions. |
The carrying amounts of cash and cash equivalents, accounts receivable, restricted cash, accounts payable, accrued liabilities and other accrued expenses approximate fair value because of their short maturity.
Non-Recurring Fair Value Measurements
During the years ended January 31, 2016 and January 25, 2015, the Company recorded $3,811 and $14,498 of lease obligation costs as a nonrecurring fair value measurement, respectively. These lease obligation costs are included in the “Accrued liabilities” and “Closed store reserves” line items of the accompanying Consolidated Balance Sheets. The lease obligations were estimated based on the present value of the minimum lease payments less an estimate of sublease income, which is a Level 2 fair value measurement.
During the year ended January 31, 2016, the Company recorded impairment charges of $5,595 to write-down the carrying value of certain fixed assets to their estimated fair value of $1,000. These charges were measured initially during the thirteen weeks ended April 26, 2015. The amount of the impairment was based on actual sale prices for similar equipment obtained from third-party dealers of such equipment. Quoted prices in active markets for similar equipment are considered a Level 2 input in the fair value measurement. The impairment is included in the “Impairments and store closure costs” line item on the Consolidated Statements of Comprehensive Income.
During the years ended January 25, 2015 and January 26, 2014, the Company recorded impairment charges of $8,961 and $26,828 to write down certain real estate and other store related assets to their estimated fair value of $10,872 and $21,682, respectively. These charges were based, in part, on estimates that used Level 3 inputs within the fair value hierarchy. The fair value of real estate was primarily based on a market approach and the fair value for non-real estate assets, such as leasehold improvements and fixtures, was based on a cost approach, both of which included assistance from analysis by third party specialists. The market approach is a valuation method which estimates fair value based on market transactions and sales of comparable assets. Inputs used in the market approach include comparable sales transaction data, market rents and capitalization rates for the related assets. The cost approach is a valuation method which estimates the price that would be received to sell the store related assets in an orderly transaction between market participants at the measurement date. Inputs used in the cost approach primarily include current costs trend factors, which are meant to adjust the historical price of an asset
F-14
The Fresh Market, Inc.
Notes to the Consolidated Financial Statements (continued)
4. Fair Value Measurements (continued)
to a current price by capturing all inflationary forces on the subject asset, and functional and economic obsolescence factors, which are based on the expected life and expected use of the asset. Additionally, the assessment of the fair value for certain real estate assets during the year ended January 25, 2015, utilized a discounted cash flow approach. The primary inputs for the discounted cash flow approach include projected cash flows expected to be generated by the assets and a discount rate.
The following tables show the fair value of the Company’s long-lived assets that have been adjusted to fair value on a non-recurring basis which had a significant impact on the Company’s results of operations for the years ended January 31, 2016, January 25, 2015 and January 26, 2014.
Carrying Value | Fair Value Measurement | Impairment | |||||||||||||||
For the Year Ended | Prior to Impairment | Level 1 | Level 2 | Level 3 | Charge Recognized | ||||||||||||
(in thousands) | |||||||||||||||||
January 31, 2016 | $ | 6,595 | $ | — | $ | 1,000 | $ | — | $ | 5,595 | |||||||
January 25, 2015 | $ | 19,833 | $ | — | $ | — | $ | 10,872 | $ | 8,961 | |||||||
January 26, 2014 | $ | 48,510 | $ | — | $ | — | $ | 21,682 | $ | 26,828 | |||||||
5. Impairments and Store Closure Costs
Impairments
During the years ended January 31, 2016, January 25, 2015 and January 26, 2014, the Company concluded the long-lived assets related to certain stores were impaired. As a result, impairment charges of $5,595, $8,961 and $26,828 were recognized to write down the carrying value of the assets to fair value for the years ended January 31, 2016, January 25, 2015 and January 26, 2014, respectively. Refer to Note 4 for a discussion of the methods and inputs used to estimate the fair value of those asset groups.
Store Closure Costs
The Company closed three stores and four stores during the years ended January 31, 2016 and January 25, 2015, respectively.
Store closure and exit costs for the years ended January 31, 2016, January 25, 2015, and January 26, 2014 were as follows:
Year Ended | |||||||||||
January 31, 2016 | January 25, 2015 | January 26, 2014 | |||||||||
Lease obligation costs | $ | 6,453 | $ | 11,223 | $ | 653 | |||||
Gain on assignment of capital lease | — | (1,508 | ) | — | |||||||
Employee and severance costs | 773 | 768 | — | ||||||||
(Gain) loss on write-down and disposal of assets | (7 | ) | 1,896 | — | |||||||
Other costs | 617 | 1,249 | 24 | ||||||||
Total store closure and exit costs | $ | 7,836 | $ | 13,628 | $ | 677 | |||||
F-15
The Fresh Market, Inc.
Notes to the Consolidated Financial Statements (continued)
5. Impairments and Store Closure Costs (continued)
Store closure and exit costs include lease obligation costs related to closed stores, which represent the present value of the remaining non-cancelable lease payments required under operating leases for the closed stores, less an estimate of subtenant income, employee severance costs, write-down and (gain) loss on disposal of assets, other costs associated with exiting the stores, and other costs. The Company recorded a gain on the assignment of a capital lease for one of the stores closed during the year ended January 25, 2015.
Closed Store Reserves
Activity for the closed store reserve during the years ended January 31, 2016, January 25, 2015, and January 26, 2014 was as follows:
Year Ended | |||||||||||
January 31, 2016 | January 25, 2015 | January 26, 2014 | |||||||||
Beginning balance | $ | 11,299 | $ | 1,812 | $ | 1,982 | |||||
Additions and adjustments | 3,899 | 14,498 | 656 | ||||||||
Payments | (3,379 | ) | (5,011 | ) | (826 | ) | |||||
Ending balance | $ | 11,819 | $ | 11,299 | $ | 1,812 | |||||
6. Leases
The Company leases the majority of its retail store locations, its administrative offices, and certain equipment, under noncancelable operating lease agreements that expire from 2016 to 2032. The store location leases generally have an initial term ranging from 10 to 15 years and contain renewal options ranging from 15 to 30 years with increased rental rates during the option periods.
The Company leases certain retail store locations under capital and financing lease agreements that expire from 2023 to 2035. The store locations have initial lease terms that range from 10 to 15 years and contain renewal options ranging from 15 to 25 years.
The Company does not receive a material amount of sublease rents from subtenants in its leased properties.
F-16
The Fresh Market, Inc.
Notes to the Consolidated Financial Statements (continued)
6. Leases (continued)
Future minimum lease commitments for the Company’s capital and financing lease obligations and operating lease commitments having initial or remaining terms in excess of one year are as follows:
Capital and Financing Lease Obligations | Operating Leases | |||||||
2016 | $ | 5,137 | $ | 66,374 | ||||
2017 | 5,137 | 67,961 | ||||||
2018 | 5,137 | 65,130 | ||||||
2019 | 5,173 | 62,002 | ||||||
2020 | 5,199 | 58,274 | ||||||
Thereafter | 37,811 | 242,032 | ||||||
Total lease commitment | 63,594 | $ | 561,773 | |||||
Non-cash gain on future disposition of property | 1,486 | |||||||
Less amount representing interest, 10.9% weighted average interest rate | (31,280 | ) | ||||||
Present value of obligations under capital and financing lease obligations | 33,800 | |||||||
Less current portion | (1,515 | ) | ||||||
Noncurrent capital and financing lease obligations | $ | 32,285 | ||||||
Total rent expense, net of subtenant lease income, for the years ended January 31, 2016, January 25, 2015, and January 26, 2014 was as follows:
Year Ended | ||||||||||||
January 31, 2016 | January 25, 2015 | January 26, 2014 | ||||||||||
Minimum rentals | $ | 53,617 | $ | 48,603 | $ | 43,047 | ||||||
Contingent rentals | 203 | 519 | 434 | |||||||||
$ | 53,820 | $ | 49,122 | $ | 43,481 | |||||||
The Company also incurs other lease-related expenses such as real estate taxes, insurance and maintenance that are generally based on the Company’s pro-rata share of the total square footage of the property being leased. Except for capital and financing leases, the Company’s store lease expenses are recorded in the “Cost of goods sold” line item on the accompanying Consolidated Statements of Comprehensive Income. Lease expenses related to the Company’s corporate offices are recorded in the “Selling, general and administrative expenses” line item on the Consolidated Statements of Comprehensive Income. Additionally, lease expenses related to closed stores are recorded in the “Impairments and store closure costs” line item on the Consolidated Statements of Comprehensive Income.
F-17
The Fresh Market, Inc.
Notes to the Consolidated Financial Statements (continued)
7. Employee Benefits
Accrued Compensated Absences
The Company provides its employees with paid annual leave that may be used for any purpose. As of January 2016, the Company revised its paid annual leave policy. Paid annual leave is earned and accrued throughout the year at a rate based on eligible employees’ years of service as of January 1, less an estimate for forfeitures. Employees have the right to carryforward 80 hours of unused balances to future years, except where the carryforward cannot be limited by law.
Under the policy in effect prior to January 2016, paid annual leave was fully earned and awarded on January 1 of each year (or, if later, the employee’s first day worked during such year) to eligible employees of the Company. The previous policy did not provide for a carryforward of unused balances to future years, except where required by law. The Company accrued the value of the annual leave to be awarded on January 1 of the following year, less an estimate for forfeitures, ratably over the year.
The Company had $7,350 and $7,312 accrued for paid annual leave as of January 31, 2016 and January 25, 2015, respectively.
Deferred Compensation Plan
The Company has a deferred compensation plan for eligible employees. Under the terms of the plan, eligible employees may defer up to 80% of their base salary and 100% of their annual bonus on a pre-tax basis. The Company will make matching contributions to the eligible employees’ accounts, up to defined maximums, to compensate for matching contributions that would have been made to the eligible employees’ 401(k) plan accounts had the eligible employees not participated in the deferred compensation plan. The deferred compensation plan also permits the Company to make discretionary contributions to eligible employees’ accounts. Deferred amounts will be distributed in a lump sum in the event of death, termination of employment before age 55 and five years of employment, or termination of employment within two years following a change in control. In the event of termination of employment after age 55 and five years of employment, the eligible employees may elect distributions in a lump sum or by installment payments. Participants may also elect to defer amounts to in-service distribution accounts for distribution at specified dates. Distributions may also be made in the event of unforeseeable emergency.
The liability related to the deferred compensation plan was $3,903 and $4,289 as of January 31, 2016 and January 25, 2015, respectively. The Company recognized compensation expense related to the plan of $52, $55, and $45 for the years ended January 31, 2016, January 25, 2015, and January 26, 2014, respectively.
Employee Savings and Profit Sharing Plan
The Company sponsors an employee savings and profit sharing plan which is a defined contribution retirement plan subject to Section 401(k) of the Internal Revenue Code. The plan is voluntary and is available to all eligible full-time employees after 60 days of service. Prior to January 1, 2014, the plan was available to all eligible full-time employees after one year of service. The Company may, in its discretion, provide a matching contribution up to defined maximums. The expense recorded for the Company’s match to the 401(k) plan was $1,312, $1,200, and $1,022 for the years ended January 31, 2016, January 25, 2015, and January 26, 2014, respectively.
Long-Term Cash Incentive Program
During fiscal year 2012 through fiscal year 2014 the Company made grants under The Fresh Market, Inc. Long-Term Cash Incentive Program for Select Employees (the “Program”), in which the Company’s executive officers do not participate. The purpose of the Program is to provide incentives and reward employees for achieving specified performance goals over a given performance period.
The Program awards cash bonuses to participants based upon the Company’s achievement of specified performance goals encompassing a three-year fiscal performance period. At each reporting period, the Company assesses the probability of achieving the performance goals required for payment of the target amounts for the performance period. These awards are expensed over the respective vesting period on a straight-line basis. Cumulative adjustments, if any, are recorded quarterly to reflect subsequent changes in the estimated outcome of performance-related conditions.
Each participant receives a percentage of the applicable target amount for the performance period based on achievement of the performance goals and formulas. The Program’s award payouts will vary based on the achievement of the performance goals and can range from 33% to 150% for awards granted in fiscal 2012 and 2013 and 33% to 170% for awards granted in
F-18
The Fresh Market, Inc.
Notes to the Consolidated Financial Statements (continued)
7. Employee Benefits (continued)
fiscal 2014. Each participant is entitled to a minimum of one-third of the total grant amount, which is paid in three annual payments over the three-year vesting period. At the end of the three-year period, the participant is eligible for a final payout, based upon the Company’s specific measurement criteria, if the threshold for the applicable performance goal is reached and the participant is employed by the Company at the end of the performance period. For the year ended January 31, 2016 the Company recognized a net benefit of $25, which includes a cumulative adjustment and assumes the minimum level of payout for all years. For the years ended January 25, 2015 and January 26, 2014, the Company recorded expense for the Program of $782 and $57, respectively. The expense for the year ended January 26, 2014 includes an adjustment that reflected a decrease in the estimated cumulative payout amount based on the probability of achieving the performance criteria.
8. Income Taxes
The income tax provision consisted of the following:
Year Ended | ||||||||||||
January 31, 2016 | January 25, 2015 | January 26, 2014 | ||||||||||
Current: | ||||||||||||
Federal | $ | 40,476 | $ | 45,263 | $ | 32,852 | ||||||
State | 6,150 | 7,180 | 7,458 | |||||||||
Total current | 46,626 | 52,443 | 40,310 | |||||||||
Deferred: | ||||||||||||
Federal | (7,444 | ) | (15,314 | ) | (10,175 | ) | ||||||
State | (232 | ) | (916 | ) | (1,344 | ) | ||||||
Total deferred | (7,676 | ) | (16,230 | ) | (11,519 | ) | ||||||
Total income tax provision | $ | 38,950 | $ | 36,213 | $ | 28,791 | ||||||
A reconciliation of the statutory federal income tax rate of 35% and the Company’s effective tax rate is as follows:
Year Ended | |||||||||
January 31, 2016 | January 25, 2015 | January 26, 2014 | |||||||
Statutory federal rate | 35.00 | % | 35.00 | % | 35.00 | % | |||
State income taxes | 3.61 | % | 3.78 | % | 4.36 | % | |||
Enhanced charitable food contribution | (1.01 | )% | (2.12 | )% | (2.64 | )% | |||
Other | (0.31 | )% | (0.17 | )% | (0.55 | )% | |||
Effective tax rate | 37.29 | % | 36.49 | % | 36.17 | % | |||
F-19
The Fresh Market, Inc.
Notes to the Consolidated Financial Statements (continued)
8. Income Taxes (continued)
The major components of the Company’s deferred tax assets and liabilities at January 31, 2016 and January 25, 2015 are as follows:
Year Ended | ||||||||
January 31, 2016 | January 25, 2015 | |||||||
Deferred Tax Assets: | ||||||||
Accrued compensation | $ | 3,669 | $ | 4,395 | ||||
Accrued expenses | 20,210 | 17,869 | ||||||
Deferred and share-based compensation | 6,704 | 6,598 | ||||||
Excess charitable contributions | 8,607 | 10,745 | ||||||
Capital and financing lease obligations | 17,137 | 17,732 | ||||||
Other | 30 | 61 | ||||||
Total deferred tax assets | 56,357 | 57,400 | ||||||
Deferred Tax Liabilities: | ||||||||
Depreciation | (38,780 | ) | (47,088 | ) | ||||
Inventories | (1,638 | ) | (2,076 | ) | ||||
Prepaid expenses | (783 | ) | (756 | ) | ||||
Total deferred tax liabilities | (41,201 | ) | (49,920 | ) | ||||
Net deferred tax asset | $ | 15,156 | $ | 7,480 | ||||
As of January 31, 2016, the Company had no net operating loss carryforwards for U.S. or state income taxes. The Company has charitable contribution carryforwards, which are subject to a 5-year carryforward limitation, which will begin to expire during the year ending January 29, 2017.
As of January 31, 2016 and January 25, 2015, the Company had no accrued interest or penalties related to uncertain tax positions. There were no unrecognized tax benefits that would affect the Company’s effective tax rate if recognized. The Company does not expect its unrecognized tax benefits to change significantly in the next 12 months. The Company’s policy for recording interest and penalties associated with uncertain tax positions is to record such items as a component of income taxes.
The Company files income tax returns in the U.S. Federal jurisdiction and in various state jurisdictions. The statute of limitation remains open for U.S. and certain state income tax examinations for tax years 2011 through 2015.
9. Stockholders’ Equity
Stock Repurchase Program
In August 2015, the Company’s Board of Directors authorized a $200,000 stock repurchase program. The primary source of funds for stock repurchases is the cash flows from operations net of investing activities. Repurchases under the program are made through open market transactions at prevailing market prices, with block trades permitted from time to time and in the discretion of the Company’s management and as the market conditions allow. The timing of the repurchases and the actual amount repurchased depends on a variety of factors, including the amount of cash flow available for repurchases, the market price of the Company’s shares and general market and economic conditions.
During the year ended January 31, 2016, the Company acquired 1,616,237 shares of its outstanding common stock for $37,620, including applicable commissions, under the stock repurchase program. There is no expiration date governing the period over which the Company can repurchase shares. The Company recognizes the cost of stock repurchases in excess of par value as a reduction to retained earnings.
F-20
The Fresh Market, Inc.
Notes to the Consolidated Financial Statements (continued)
10. Share-based Compensation
The Company grants share-based awards under the 2010 Omnibus Incentive Compensation Plan. At January 31, 2016, January 25, 2015, and January 26, 2014, approximately 1,300,000, 1,900,000, and 2,200,000 shares of the Company’s common stock, respectively, were available for share-based awards.
The share-based awards vest according to their terms as more specifically described below. In the event of a change of control as defined in the 2010 Omnibus Incentive Compensation Plan, the share-based awards would immediately vest except to the extent otherwise provided in the award agreements.
Stock Options
Options are granted at an option price equal to the closing price of the Company’s common stock on the grant date and vest in 25% annual increments on each of the first four anniversaries of the grant date. Options expire ten years from the grant date. The Company uses the Black-Scholes option pricing model to estimate the fair value of stock options at the grant date.
During the year ended January 31, 2016 , the Company granted an executive officer non-qualified options to purchase 500,000 shares of the Company’s common stock. These options are subject to cliff vesting and become fully exercisable on the third anniversary date of employment.
Share-based compensation expense related to stock options recognized under the 2010 Omnibus Incentive Compensation Plan during the years ended January 31, 2016, January 25, 2015, and January 26, 2014, totaled $2,153, $3,329, and $2,917, respectively, and is recorded in the “Selling, general and administrative expenses” line item on the accompanying Consolidated Statements of Comprehensive Income.
The following table summarizes option activity under the 2010 Omnibus Incentive Compensation Plan (in thousands, except per share amounts and contractual lives in years):
Weighted | |||||||||||||
Number | Weighted | Average | Aggregate | ||||||||||
of Options | Average | Remaining | Intrinsic | ||||||||||
Outstanding | Exercise Price | Contractual Life | Value | ||||||||||
Outstanding options at January 27, 2013 | 760 | $ | 30.87 | ||||||||||
Granted | 141 | 43.10 | |||||||||||
Exercised | (85 | ) | 24.38 | ||||||||||
Expired | (2 | ) | 41.41 | ||||||||||
Forfeited | (50 | ) | 32.05 | ||||||||||
Outstanding options at January 26, 2014 | 764 | $ | 33.74 | ||||||||||
Granted | 246 | 32.71 | |||||||||||
Exercised | (88 | ) | 22.00 | ||||||||||
Expired | (1 | ) | 42.93 | ||||||||||
Forfeited | (33 | ) | 35.28 | ||||||||||
Outstanding options at January 25, 2015 | 888 | $ | 34.55 | ||||||||||
Granted | 683 | 25.93 | |||||||||||
Exercised | (114 | ) | 23.13 | ||||||||||
Expired | (105 | ) | 43.64 | ||||||||||
Forfeited | (88 | ) | 38.40 | ||||||||||
Outstanding options at January 31, 2016 | 1,264 | $ | 29.90 | 8.0 | $ | — | |||||||
Vested/expected to vest at January 31, 2016 | 1,244 | $ | 30.00 | 9.1 | $ | — | |||||||
Exercisable options at January 31, 2016 | 425 | $ | 33.94 | 5.9 | $ | — | |||||||
The weighted average grant date fair value of options granted for the years ended January 31, 2016, January 25, 2015, and January 26, 2014 was $8.23, $10.49 and $16.23, respectively. The aggregate intrinsic value of stock options exercised was
F-21
The Fresh Market, Inc.
Notes to the Consolidated Financial Statements (continued)
10. Share-based Compensation (continued)
$1,904 and $1,523 for the years ended January 31, 2016 and January 25, 2015, respectively. The total fair value of options vested was $5,629 and $4,645 for the years ended January 31, 2016 and January 25, 2015, respectively. As of January 31, 2016, January 25, 2015, and January 26, 2014, there were approximately 1,264,000, 888,000, and 764,000 shares of nonvested stock options outstanding and $5,320, $3,214, and $4,866 of unrecognized share-based compensation expense. The Company anticipates this expense to be recognized over a weighted average period of 2.5 years.
The fair value of the stock option grants have been estimated at the date of grant using the Black-Scholes option pricing model with the following weighted average assumptions.
2015 | 2014 | 2013 | ||||||||||
Risk-free interest rate | 1.55 | % | 1.63 | % | 0.82 | % | ||||||
Expected life, in years | 5.47 | 4.83 | 5.00 | |||||||||
Expected volatility | 31.68 | % | 34.18 | % | 42.29 | % | ||||||
Dividend yield | — | % | — | % | — | % | ||||||
Weighted average exercise price | $ | 25.93 | $ | 32.71 | $ | 43.10 | ||||||
The risk-free interest rate is based on the U.S. Treasury constant maturities on the date of the grant for the time period equal to the expected term of the options granted. Expected volatility was calculated on the basis of the average volatilities of similar entities and considered characteristics such as industry, stage of life cycle, size, financial leverage and comparable programs and participant pools. The Company determined the use of historical volatility for similar entities represents a more accurate calculation of option fair value. Expected life is calculated in a like manner and is based upon the industry, stage of life cycle, size, financial leverage and comparable programs and participant pools. The assumptions used to calculate the fair value of options granted are evaluated and revised for new awards, as necessary, to reflect market conditions and experience.
The Company recognizes compensation expense on a straight line basis over the vesting period for all share-based awards net of estimated forfeitures.
Restricted Stock Units for Non-Employee Directors
The Company grants RSUs to its non-employee directors. RSUs vest at the earlier of one year from the date of grant or the next annual meeting of stockholders. The fair value of the RSUs is equal to the closing price of the Company’s common stock on the grant date.
The Company recorded $537 of share-based compensation expense related to outstanding RSUs for non-employee directors for the year ended January 31, 2016. Share-based compensation expense is recorded in the “Selling, general and administrative expenses” line item on the accompanying Consolidated Statements of Comprehensive Income.
The following activity has occurred under the Company’s existing restricted stock unit for non-employee directors plan:
Weighted | |||||||
Average | |||||||
Restricted Stock Units | Grant Date | ||||||
(in thousands) | Fair Value | ||||||
Balance at January 25, 2015 | — | $ | — | ||||
Granted | 25 | 32.51 | |||||
Vested | — | — | |||||
Forfeited | — | — | |||||
Outstanding awards at January 31, 2016 | 25 | $ | 32.51 | ||||
Expected to vest at January 31, 2016 | 25 | $ | 32.51 | ||||
As of January 31, 2016, total remaining unearned compensation cost related to nonvested RSUs was approximately $272, which will be amortized over the weighted-average remaining service period of approximately 0.3 years.
F-22
The Fresh Market, Inc.
Notes to the Consolidated Financial Statements (continued)
10. Share-based Compensation (continued)
Restricted Stock Units
The RSUs vest in 25% annual increments on each of the first four anniversaries of the grant date and the fair value is equal to the closing price of the Company’s common stock on the grant date. Additionally, the Company grants RSUs to certain employees, which are subject to cliff vesting of up to three years.
The Company recorded $2,639, $1,640, and $1,129 of share-based compensation expense related to these awards for the years ended January 31, 2016, January 25, 2015, and January 26, 2014, respectively, which is recorded in the “Selling, general and administrative expenses” line item on the accompanying Consolidated Statements of Comprehensive Income.
The following activity has occurred under the Company’s existing restricted stock unit plan:
Weighted | |||||||
Average | |||||||
Restricted Stock Units | Grant Date | ||||||
(in thousands) | Fair Value | ||||||
Balance at January 27, 2013 | 73 | $ | 30.10 | ||||
Granted | 30 | 43.32 | |||||
Vested | (30 | ) | 26.98 | ||||
Forfeited | (3 | ) | 25.47 | ||||
Balance at January 26, 2014 | 70 | $ | 37.26 | ||||
Granted | 76 | 33.04 | |||||
Vested | (40 | ) | 31.30 | ||||
Forfeited | (9 | ) | 35.52 | ||||
Balance at January 25, 2015 | 97 | $ | 36.90 | ||||
Granted | 208 | 30.24 | |||||
Vested | (66 | ) | 28.17 | ||||
Forfeited | (29 | ) | 38.08 | ||||
Outstanding awards at January 31, 2016 | 210 | $ | 32.87 | ||||
Expected to vest at January 31, 2016 | 205 | $ | 32.93 | ||||
As of January 31, 2016 and January 25, 2015, total remaining unearned compensation cost related to nonvested RSUs was approximately $4,814 and $2,410, respectively, which will be amortized over the weighted-average remaining service period of approximately 3.1 years.
Restricted Stock Awards for Non-Employee Directors
The Company granted RSAs to its non-employee directors during the years ended January 25, 2015 and January 26, 2014. RSAs vest at the earlier of one year from the date of grant or the next annual meeting of stockholders. The fair value of the RSAs is equal to the closing price of the Company’s common stock on the grant date.
The Company recorded $138, $481, and $438 of share-based compensation expense related to outstanding RSAs for non-employee directors for the years ended January 31, 2016, January 25, 2015, and January 26, 2014, respectively. Share-based compensation expense is recorded in the “Selling, general and administrative expenses” line item on the accompanying Consolidated Statements of Comprehensive Income.
F-23
The Fresh Market, Inc.
Notes to the Consolidated Financial Statements (continued)
10. Share-based Compensation (continued)
The following activity has occurred under the Company’s existing restricted stock award plan for non-employee directors:
Weighted | |||||||
Average | |||||||
Restricted Stock Awards | Grant Date | ||||||
(in thousands) | Fair Value | ||||||
Balance at January 27, 2013 | 7 | $ | 58.00 | ||||
Granted | 10 | 49.07 | |||||
Vested | (7 | ) | 58.00 | ||||
Forfeited | — | — | |||||
Balance at January 26, 2014 | 10 | $ | 49.07 | ||||
Granted | 14 | 33.43 | |||||
Vested | (13 | ) | 48.22 | ||||
Forfeited | — | — | |||||
Balance at January 25, 2015 | 11 | $ | 32.95 | ||||
Granted | — | — | |||||
Vested | (11 | ) | 32.95 | ||||
Forfeited | — | — | |||||
Outstanding awards at January 31, 2016 | — | $ | — | ||||
Expected to vest at January 31, 2016 | — | $ | — | ||||
As of January 31, 2016 and January 25, 2015, total remaining unearned compensation cost related to nonvested RSAs was $0 and $127, respectively, which will be amortized over the weighted-average remaining service period of approximately 0.0 years.
Executive Restricted Stock Awards
The Company grants RSAs to its executive officers, which are comprised of two types of RSAs under the 2010 Omnibus Incentive Compensation Plan: RSAs that are subject to three-year cliff-based vesting, and RSAs that vest in annual 25% increments over a four-year period beginning on the grant date.
The Company recorded a net benefit related to the executive RSAs of $192 primarily due to the forfeiture of executive restricted stock awards in connection with certain leadership changes for the year ended January 31, 2016 and share-based compensation expense of $1,715 and $977 for the years ended January 25, 2015 and January 26, 2014, respectively, which is recorded in the “Selling, general and administrative expenses” line item on the accompanying Consolidated Statements of Comprehensive Income.
F-24
The Fresh Market, Inc.
Notes to the Consolidated Financial Statements (continued)
10. Share-based Compensation (continued)
The following activity has occurred under the Company’s existing executive restricted stock award plan:
Weighted | |||||||
Average | |||||||
Restricted Stock Awards | Grant Date | ||||||
(in thousands) | Fair Value | ||||||
Balance at January 27, 2013 | — | $ | — | ||||
Granted | 92 | 43.42 | |||||
Vested | |||||||
Forfeited | |||||||
Balance at January 26, 2014 | 92 | $ | 43.42 | ||||
Granted | — | — | |||||
Vested | (34 | ) | 40.56 | ||||
Forfeited | (2 | ) | 42.65 | ||||
Balance at January 25, 2015 | 56 | $ | 43.86 | ||||
Granted | — | — | |||||
Vested | (3 | ) | 43.84 | ||||
Forfeited | (10 | ) | 42.65 | ||||
Outstanding awards at January 31, 2016 | 43 | $ | 44.15 | ||||
Expected to vest at January 31, 2016 | 43 | $ | 44.15 | ||||
As of January 31, 2016 and January 25, 2015, total remaining unearned compensation cost related to nonvested RSAs was $248 and $1,115, respectively, which will be amortized over the weighted-average remaining service period of approximately 0.8 years.
Performance Share Awards
The Performance Share Award Agreement, approved by the Board of Directors in March 2012, provides for the issuance of performance shares (“Performance Shares”) under the 2010 Omnibus Incentive Compensation Plan to executive officers and certain other members of the Company’s management team based upon an established performance goal.
F-25
The Fresh Market, Inc.
Notes to the Consolidated Financial Statements (continued)
10. Share-based Compensation (continued)
The following activity has occurred under the Company’s existing performance share awards plan:
Weighted | |||||||
Average | |||||||
Performance Share Awards | Grant Date | ||||||
(in thousands) | Fair Value | ||||||
Balance at January 27, 2013 | 34 | $ | 47.31 | ||||
Granted | — | — | |||||
Vested | — | — | |||||
Forfeited | (4 | ) | 47.17 | ||||
Balance at January 26, 2014 | 30 | $ | 47.32 | ||||
Granted | — | — | |||||
Vested | — | — | |||||
Forfeited | (9 | ) | 47.17 | ||||
Balance at January 25, 2015 | 21 | $ | 47.39 | ||||
Granted | — | — | |||||
Vested | — | — | |||||
Forfeited | (21 | ) | 47.39 | ||||
Outstanding awards at January 31, 2016 | — | $ | — | ||||
The Company did not grant any Performance Shares during the years ended January 31, 2016, January 25, 2015 or January 26, 2014. Based on the expected level of achievement of the performance condition, the Company did not recognize share-based compensation expense related to the Performance Shares for the years ended January 31, 2016 and January 25, 2015, and it recognized a reduction to share-based compensation expense of approximately $272 for the year ended January 26, 2014, as the likelihood of meeting the performance condition was no longer probable. Share-based compensation expense is recorded in the “Selling, general and administrative expenses” line item on the accompanying Consolidated Statements of Comprehensive Income.
In March 2015, the Company forfeited the performance share awards granted at March 2012, since it did not achieve the minimum performance levels stated in the agreement.
Performance Share Units
In March 2013, the Company adopted a Performance Share Unit Award Agreement under the 2010 Omnibus Incentive Compensation Plan. During the year ended January 25, 2015, the Company awarded approximately 46,000 performance share units (“PSUs”) to its executive officers and certain other members of the Company’s management team based upon an established performance goal. The PSUs are subject to performance conditions and time-based cliff vesting on the last day of the performance period, as defined below, and settle in shares of the Company’s common stock upon vesting. The fair value of the PSUs is equal to the closing price of the Company’s common stock on the grant date.
The performance goal is a specified cumulative three-year earnings per share amount for the fiscal 2013 through 2015 performance period. The actual number of PSUs which vest for each participant is set at a minimum threshold of 0% of the participant’s target number of PSUs and could increase to up to 170% of the target based upon performance results. Actual performance against the performance goal will be measured at the end of the performance period and approved by the Compensation Committee. Expense is recorded over the required performance period, subject to management’s assessment of the expected performance outcome.
F-26
The Fresh Market, Inc.
Notes to the Consolidated Financial Statements (continued)
10. Share-based Compensation (continued)
The following activity has occurred under the Company’s existing performance share units plan:
Weighted | |||||||
Average | |||||||
Performance Share Units | Grant Date | ||||||
(in thousands) | Fair Value | ||||||
Balance at January 27, 2013 | — | $ | — | ||||
Granted | 30 | 43.12 | |||||
Vested | — | — | |||||
Forfeited | — | — | |||||
Balance at January 26, 2014 | 30 | $ | 43.12 | ||||
Granted | 46 | 32.57 | |||||
Vested | — | — | |||||
Forfeited | (18 | ) | 37.00 | ||||
Balance at January 25, 2015 | 58 | $ | 36.71 | ||||
Granted | — | — | |||||
Vested | — | — | |||||
Forfeited | (29 | ) | 40.82 | ||||
Outstanding awards at January 31, 2016 | 29 | $ | 32.74 | ||||
During the year ended January 31, 2016, the Company recognized a net benefit of $339 in connection with PSUs as it determined that the minimum level of achievement to meet the performance goal was not probable, and as a result, the total cumulative expense recognized for the performance share units was reversed. The Company recognized share-based compensation expense related to PSUs of $339 for the year ended January 25, 2015 and did not recognize share-based compensation related to PSUs for the year ended January 26, 2014.
As of January 31, 2016, the Company forfeited the PSUs granted during the year ending January 26, 2014, since it did not achieve the minimum performance levels stated in the agreement.
11. Earnings per Share
The computation of basic earnings per share is based on the number of weighted-average common shares outstanding during the period. The computation of diluted earnings per share includes the dilutive effect of common stock equivalents consisting of incremental common shares deemed outstanding from the assumed exercise of stock options, RSUs and RSAs. The Company excluded the dilutive effect of its PSUs since the related performance conditions had not been satisfied for the year ended January 31, 2016.
F-27
The Fresh Market, Inc.
Notes to the Consolidated Financial Statements (continued)
11. Earnings per Share (continued)
A reconciliation of the numerators and denominators of the basic and diluted earnings per share calculations follows (in thousands, except share and per share amounts):
Year Ended | |||||||||||
January 31, 2016 | January 25, 2015 | January 26, 2014 | |||||||||
Net income available to common stockholders (numerator for basic and diluted earnings per share) | $ | 65,498 | $ | 63,025 | $ | 50,807 | |||||
Weighted average common shares outstanding (denominator for basic earnings per share) | 47,957 | 48,299 | 48,207 | ||||||||
Potential common shares outstanding: | |||||||||||
Incremental shares from share-based awards | 146 | 177 | 187 | ||||||||
Weighted average common shares outstanding and potential additional common shares outstanding (denominator for diluted earnings per share) | 48,103 | 48,476 | 48,394 | ||||||||
Net income per share: | |||||||||||
Basic | $ | 1.37 | $ | 1.30 | $ | 1.05 | |||||
Diluted | $ | 1.36 | $ | 1.30 | $ | 1.05 | |||||
For the years ended January 31, 2016, January 25, 2015, and January 26, 2014 there were approximately 765,000, 615,000, and 340,000 shares, respectively, excluded from the computation of diluted weighted average common shares outstanding because such shares are considered anti-dilutive.
12. Insurance Reserves
The Company has insurance policies for general liability, medical and workers’ compensation benefits that contain significant deductibles. The cost of these insurance claims up to the deductibles is accrued based on actual claims reported plus loss development factors. These estimates are based on historical information along with certain assumptions about future events, and are subject to change as additional information becomes available. The Company had $24,672 and $21,802 accrued related to these claims at January 31, 2016 and January 25, 2015, respectively. Insurance reserves is recorded to the “Accrued liabilities” and “Other liabilities” line items on the accompanying Consolidated Balance Sheets.
F-28
The Fresh Market, Inc.
Notes to the Consolidated Financial Statements (continued)
13. Supplementary Balance Sheet Information
The following reflects supplementary balance sheet information for the Company’s property and equipment, net at January 31, 2016 and January 25, 2015:
January 31, 2016 | January 25, 2015 | |||||||
Buildings | $ | 65,729 | $ | 65,658 | ||||
Store fixtures and equipment | 410,924 | 364,711 | ||||||
Leasehold improvements | 280,953 | 242,966 | ||||||
Office furniture, fixtures and equipment | 16,766 | 13,692 | ||||||
Automobiles | 1,168 | 1,315 | ||||||
Construction in progress | 21,366 | 31,341 | ||||||
Total property and equipment | 796,906 | 719,683 | ||||||
Accumulated depreciation | (383,837 | ) | (327,489 | ) | ||||
Total property and equipment, net | $ | 413,069 | $ | 392,194 | ||||
The following reflects supplementary balance sheet information for the Company’s accrued liabilities at January 31, 2016 and January 25, 2015:
January 31, 2016 | January 25, 2015 | |||||||
Accrued compensation and benefits | $ | 32,386 | $ | 31,698 | ||||
Accrued occupancy costs | 8,023 | 8,569 | ||||||
Accrued construction and maintenance costs | 9,122 | 11,030 | ||||||
Other accrued liabilities | 33,232 | 23,344 | ||||||
Total accrued liabilities | $ | 82,763 | $ | 74,641 | ||||
14. Related-Party Transactions
Tax Indemnification Agreement
In connection with its initial public offering, the Company entered into a tax indemnification agreement with the Company’s stockholders prior to the offering. Pursuant to this agreement, the Company agreed that upon filing any tax return (amended or otherwise), or in the event of any restatement of the Company’s taxable income, in each case for any period during which the Company was an S-corporation, it will make a payment to each stockholder on a pro rata basis in an amount sufficient so that the stockholder with the highest incremental estimated tax liability (calculated as if the stockholder would be taxable on its allocable share of the Company’s taxable income at the highest applicable federal, state and local tax rates and taking into account all amounts the Company previously distributed in respect of taxes for the relevant period) receives a payment equal to its incremental tax liability. The Company also agreed to indemnify the stockholders for any interest, penalties, losses, costs or expenses (including reasonable attorneys’ fees) arising out of any claim under the agreement.
Real Estate Leases
During the year ended January 26, 2014, an entity affiliated with a former officer and director of the Company, who is a family member of a member of the Company’s Board of Directors as of January 31, 2016, acquired a shopping center in which the Company leases a retail store location. Lease expense related to the store since the date of such acquisition was $325, $284, and $132 for the years ended January 31, 2016, January 25, 2015 and January 26, 2014, respectively.
F-29
The Fresh Market, Inc.
Notes to the Consolidated Financial Statements (continued)
15. Commitments and Contingencies
Litigation
From time to time, the Company is involved in various legal proceedings in the normal course of business, including labor and employment, premises, personal injury, product liability and general liability claims, and claims related to commercial and leasing matters. In the opinion of management, the resolution of currently pending matters, other than those described or referred to in the following paragraphs, will not have a material adverse effect on the Company’s financial condition or results of operations. However, because of the nature and inherent uncertainties of litigation, the Company cannot predict with certainty the ultimate resolution of these actions and, should the outcome of these actions be unfavorable, the Company’s business, financial position, results of operations or cash flows could be materially and adversely affected.
The Company reviews the status of its legal proceedings and records a provision for a liability when it is considered probable that both a liability has been incurred and the amount of the loss can be reasonably estimated. This review is updated periodically as additional information becomes available. If either or both of the criteria are not met, the Company reassesses whether there is at least a reasonable possibility that a loss, or additional losses, may be incurred. If there is a reasonable possibility that a loss may be incurred, the Company discloses the estimate of the amount of the loss or range of losses, that the amount is not material, or that an estimate of loss cannot be made. The Company expenses its legal fees as incurred.
In assessing potential loss contingencies, the Company considers a number of factors, including those listed in the FASB’s Accounting Standards Codification 450-20, Contingencies - Loss Contingencies, regarding assessing the probability of a loss and assessing whether a loss is reasonably estimable. Litigation can be expensive and disruptive to normal business operations. Moreover, the results of litigation are difficult to predict and the Company’s view of these matters may change as the litigation and events unfold over time. An unfavorable outcome in any legal matter, if material, could have a material adverse effect on the Company’s results of operations in the period in which the unfavorable outcome occurs and potentially in future periods.
The Company is party to a lawsuit that was filed against it in U.S. District Court in Connecticut alleging that the manner in which the Company implemented and applied the fluctuating workweek method for calculating overtime due to the Company’s department managers violated the federal Fair Labor Standards Act. The complaint purports to state a collective action on behalf of a class of department managers in stores in states in which the Company previously used the fluctuating workweek method of compensation. The Company believes that the plaintiff’s claims are without merit and intends to vigorously defend itself in this proceeding. At this time, the Company cannot predict how the Court will rule on the merits of the claim, and/or the scope of the potential loss in the event of an adverse outcome. Should the Company ultimately be found liable in this matter, its liability could have a material adverse effect on its results of operations for the period or periods in which it is incurred.
16. Select Quarterly Financial Data (unaudited)
The following is a summary of unaudited financial data regarding the Company’s quarterly results of operations. Quarter to quarter comparisons of results of operations have been and may be materially impacted by the timing of new store openings. The Company believes that the following information reflects all normal recurring adjustments necessary for a fair presentation
of the information for the periods presented. The operating results for any quarter are not necessarily indicative of results for any future period.
Year Ended January 31, 2016 | ||||||||||||||||
First | Second | Third | Fourth | |||||||||||||
Quarter (1) | Quarter (2) | Quarter (3) | Quarter (4) | |||||||||||||
Sales | $ | 462,041 | $ | 442,095 | $ | 433,124 | $ | 519,773 | ||||||||
Gross profit | $ | 160,558 | $ | 148,997 | $ | 144,018 | $ | 178,670 | ||||||||
Income from operations | $ | 25,133 | $ | 28,502 | $ | 16,684 | $ | 38,176 | ||||||||
Net income | $ | 15,166 | $ | 17,472 | $ | 9,991 | $ | 22,869 | ||||||||
Net income per share: | ||||||||||||||||
Basic and diluted (5) | $ | 0.31 | $ | 0.36 | $ | 0.21 | $ | 0.49 | ||||||||
F-30
The Fresh Market, Inc.
Notes to the Consolidated Financial Statements (continued)
16. Select Quarterly Financial Data (unaudited) (continued)
(1) | The Company recognized $5,644 in impairment charges related to certain store related assets and $8,948 in store closure and exit costs during the thirteen weeks ended April 26, 2015 with $8,382 associated with the recognition of certain lease liabilities, severance and other exit costs. The Company also incurred charges of $566 related to the liquidation of inventory and other costs associated with the store closure activities and $356 of charges related to changes in leadership. |
(2) | The Company recorded an immaterial reduction to the previously recognized impairment charges of $49, and a benefit of $78 associated with store closure and exit costs offset by charges of $59 for changes in leadership during the thirteen weeks ended July 26, 2015. |
(3) | The Company recognized $84 of charges associated with store closure and exit costs, $1,599 in charges related to changes in leadership, and $144 in charges related to the strategic and financial review of the Company during the thirteen weeks ended October 25, 2015. |
(4) | The Company recognized a net benefit of $1,259 during the fourteen weeks ended ended January 31, 2016, primarily relating to the termination of a lease for one of the closed stores, offset by $1,406 in charges related to leadership changes and $2,034 in charges related to the strategic and financial review of the Company. |
(5) | The net income per share totals may not equal the sum of the components due to rounding. |
Year Ended January 25, 2015 | ||||||||||||||||
First | Second | Third | Fourth | |||||||||||||
Quarter (1) | Quarter (2) | Quarter (3) | Quarter (4) | |||||||||||||
Sales | $ | 431,002 | $ | 422,227 | $ | 419,450 | $ | 480,487 | ||||||||
Gross profit | $ | 148,166 | $ | 143,715 | $ | 138,075 | $ | 164,664 | ||||||||
Income from operations | $ | 27,577 | $ | 19,126 | $ | 24,328 | $ | 32,582 | ||||||||
Net income | $ | 16,571 | $ | 11,390 | $ | 14,884 | $ | 20,180 | ||||||||
Net income per share: | ||||||||||||||||
Basic and diluted (5) | $ | 0.34 | $ | 0.24 | $ | 0.31 | $ | 0.42 | ||||||||
(1) | The Company recognized $7,018 in store closure and exit costs during the thirteen weeks ended April 27, 2014 with $6,600 associated with the recognition of certain lease liabilities, severance, loss on disposal of assets and other exit costs. The Company also incurred charges of $418 related to the liquidation of inventory. |
(2) | The Company recognized $9,771 in store closure and exit costs during the thirteen weeks ended July 27, 2014. |
(3) | The Company recognized a net benefit of $2,905 during the thirteen weeks ended October 26, 2014, related to a gain on the assignment of a capital lease for one of the stores closed in fiscal 2014 and changes in estimates related to its lease commitments for closed stores. |
(4) | The Company recognized $8,961 in impairment charges related to certain store related assets, offset by a net reduction in previously closed store expense of $418, and $2,077 in charges related to its leadership change during the thirteen weeks ended January 25, 2015. |
(5) | The net income per share totals may not equal the sum of the components due to rounding. |
17. Subsequent Event
On March 11, 2016, the Company entered into a definitive agreement with Pomegranate Holdings, Inc. and Pomegranate Merger Sub, Inc., affiliates of Apollo Global Management, LLC, to acquire the Company for approximately $1,360,000. The transaction is expected to close in the second quarter of 2016.
F-31