Attached files
| file | filename |
|---|---|
| EX-10.16 - SUMMARY OF OUTSIDE DIRECTOR COMPENSATION - KOHLS Corp | exhibit1016201510-k.htm |
| EX-12.1 - RATIO OF EARNINGS TO FIXED CHARGES - KOHLS Corp | exhibit121201510-k.htm |
| EX-23.1 - CONSENT OF ERNST & YOUNG LLP - KOHLS Corp | exhibit231201510-k.htm |
| EX-31.1 - SECTION 302 CERTIFICATION OF CEO - KOHLS Corp | exhibit311201510-k.htm |
| EX-31.2 - SECTION 302 CERTIFICATION OF CFO - KOHLS Corp | exhibit312201510-k.htm |
| EX-32.2 - SECTION 906 CERTIFICATION OF CFO - KOHLS Corp | ex322201510-k.htm |
| EX-10.22 - EMPLOYMENT AGREEMENT - KOHLS Corp | exhibit1022201510-k.htm |
| EX-32.1 - SECTION 906 CERTIFICATION OF CEO - KOHLS Corp | ex321201510-k.htm |
UNITED STATES
SECURITIES AND EXCHANGE COMMISSION
Washington, D.C. 20549
FORM 10-K
(Mark One)
ý | Annual Report Pursuant to Section 13 or 15(d) of the Securities Exchange Act of 1934 |
For the fiscal year ended January 30, 2016 | |
or
¨ | Transition Report Pursuant to Section 13 or 15(d) of the Securities Exchange Act of 1934 |
For the Transition period from ____________ to ___________ | |
Commission file number 1-11084

KOHL’S CORPORATION
(Exact name of registrant as specified in its charter)
Wisconsin | 39-1630919 | |
(State or other jurisdiction of incorporation or organization) | (I.R.S. Employer Identification No.) | |
N56 W17000 Ridgewood Drive, Menomonee Falls, Wisconsin | 53051 | |
(Address of principal executive offices) | (Zip Code) | |
Registrant’s telephone number, including area code (262) 703-7000
Securities registered pursuant to Section 12(b) of the Act:
Title of each class | Name of each exchange on which registered | |
Common Stock, $.01 Par Value | New York Stock Exchange | |
Securities registered pursuant to Section 12(g) of the Act: | None | |
Indicate by check mark if the registrant is a well-known seasoned issuer, as defined in Rule 405 of the Securities Act. Yes X No .
Indicate by check mark if the registrant is not required to file reports pursuant to Section 13 or Section 15(d) of the Act. Yes No X .
Indicate by check mark whether the registrant (1) has filed all reports required to be filed by Section 13 or 15(d) of the Securities Exchange Act of 1934 during the preceding 12 months (or for such shorter period that the registrant was required to file such reports), and (2) has been subject to such filing requirements for the past 90 days. Yes X No .
Indicate by check mark whether the registrant has submitted electronically and posted on its corporate Website, if any, every Interactive Data File required to be submitted and posted pursuant to Rule 405 of Regulations S-T (232.405 of this chapter) during the preceding 12 months (or for such shorter period that the registrant was required to submit and post such files). Yes X No .
Indicate by check mark if disclosure of delinquent filers pursuant to Item 405 of Regulation S-K is not contained herein, and will not be contained, to the best of registrant’s knowledge, in definitive proxy or information statements incorporated by reference in Part III of this Form 10-K or any amendment to this Form 10-K. X .
Indicate by check mark whether the registrant is a large accelerated filer, an accelerated filer, a non-accelerated filer or a smaller reporting company. See definitions of “large accelerated filer,” “accelerated filer” and “smaller reporting company” in Rule 12b-2 of the Exchange Act. (Check one):
Large accelerated filer X Accelerated filer Non-accelerated filer (Do not check if a smaller reporting company) Smaller reporting company
Indicate by check mark whether the registrant is a shell company (as defined in Rule 12b-2 of the Exchange Act). Yes No X .
At July 31, 2015, the aggregate market value of the voting stock of the Registrant held by stockholders who were not affiliates of the Registrant was approximately $12.0 billion (based upon the closing price of Registrant’s Common Stock on the New York Stock Exchange on such date). At March 9, 2016, the Registrant had outstanding an aggregate of 185,168,909 shares of its Common Stock.
Documents Incorporated by Reference:
Portions of the Proxy Statement for the Registrant’s Annual Meeting of Shareholders to be held on May 11, 2016 are incorporated into Parts II and III.
KOHL’S CORPORATION
INDEX
Item 1. | ||
Item 1A. | ||
Item 1B. | ||
Item 2. | ||
Item 3. | ||
Item 4. | ||
Item 5. | ||
Item 6. | ||
Item 7. | ||
Item 7A. | ||
Item 8. | ||
Item 9. | ||
Item 9A. | ||
Item 9B. | ||
Item 10. | ||
Item 11. | ||
Item 12. | ||
Item 13. | ||
Item 14. | ||
Item 15. | ||
F-1 | ||
PART I
Item 1. Business
Kohl’s Corporation (the “Company” or “Kohl’s”) was organized in 1988 and is a Wisconsin corporation. As of January 30, 2016, we operated 1,164 department stores in 49 states and an E-Commerce website (www.Kohls.com). We sell moderately-priced private label, exclusive and national brand apparel, footwear, accessories, beauty and home products. Our stores generally carry consistent merchandise with assortment differences attributable to local preferences. Our website includes merchandise which is available in our stores, as well as merchandise which is available only on-line.
Our merchandise mix includes both national brands and private and exclusive brands which are available only at Kohl's. National brands generally have higher selling prices, but lower gross margins, than private and exclusive brands. Most of our private brands are well-known established brands such as Apt. 9, Croft & Barrow, Jumping Beans, SO and Sonoma Goods for Life. Despite having lower selling prices, private brands generally have higher gross margins than exclusive and national brands. Exclusive brands are developed and marketed through agreements with nationally-recognized brands. Examples of our exclusive brands include Food Network, Jennifer Lopez, Marc Anthony, Rock & Republic and Simply Vera Vera Wang. Exclusive brands have selling prices which are generally lower than national brands, but higher than private brands. Their gross margins are generally higher than national brands, but lower than private brands.
As reflected in the chart below, our merchandise mix by line of business has remained generally consistent over the last three years. | As reflected in the chart below, we have increased our emphasis on national brands in recent years as we believe they drive customer traffic. |
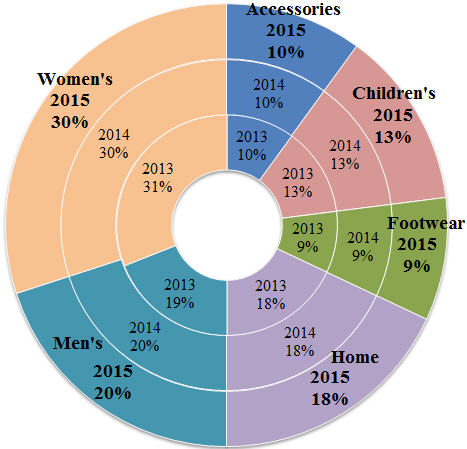 | 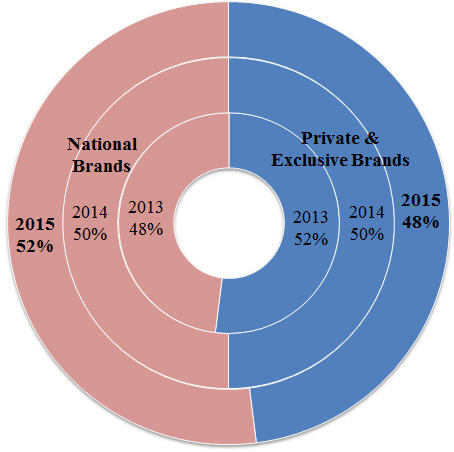 | |||
Our fiscal year ends on the Saturday closest to January 31st each year. Unless otherwise stated, references to years in this report relate to fiscal years rather than to calendar years. The following fiscal periods are presented in this report.
Fiscal Year | Ended | Number of Weeks | |
2015 | January 30, 2016 | 52 | |
2014 | January 31, 2015 | 52 | |
2013 | February 1, 2014 | 52 | |
For discussion of our financial results, see Item 7, "Management's Discussion and Analysis of Financial Condition and Results of Operations."
Distribution
We receive substantially all of our store merchandise at our nine retail distribution centers. A small amount of our merchandise is delivered directly to the stores by vendors or their distributors. The retail distribution centers, which are strategically located throughout the United States, ship merchandise to each store by contract carrier several times a week. On-line sales may be picked up in our stores or are shipped from a Kohl’s fulfillment center, retail distribution center or store; by a third-party fulfillment center; or directly by a third-party vendor.
3
See Item 2, “Properties,” for additional information about our distribution centers.
Employees
As of January 30, 2016, we employed approximately 140,000 associates, including approximately 32,000 full-time and 108,000 part-time associates. The number of associates varies during the year, peaking during the back-to-school and holiday seasons. None of our associates are represented by a collective bargaining unit. We believe our relations with our associates are very good.
Competition
The retail industry is highly competitive. Management considers style, quality and price to be the most significant competitive factors in the industry. Merchandise mix, brands, service, loyalty programs, credit availability, and customer experience and convenience are also key competitive factors. Our primary competitors are traditional department stores, upscale mass merchandisers, off-price retailers, specialty stores, internet and catalog businesses and other forms of retail commerce. Our specific competitors vary from market to market.
Merchandise Vendors
We purchase merchandise from numerous domestic and foreign suppliers. All business partners must meet certain requirements in order to do business with us. These Terms of Engagement include provisions regarding laws and regulations, employment practices, ethical standards, environmental and legal requirements, communication, monitoring/compliance, record keeping, subcontracting and corrective action. Our expectation is that all business partners will comply with these Terms of Engagement and quickly remediate any deficiencies, if noted, in order to maintain our business relationship.
Approximately 30% of the merchandise we sell is sourced through a third-party purchasing agent. None of our vendors individually accounted for more than 5% of our net purchases during 2015. We have no significant long-term purchase commitments or arrangements with any of our suppliers, and believe that we are not dependent on any one supplier. We believe we have good working relationships with our suppliers.
Seasonality
Our business, like that of most retailers, is subject to seasonal influences. The majority of our sales and income are typically realized during the second half of each fiscal year. The back-to-school season extends from August through September and represents approximately 15% of our annual sales. Approximately 30% of our annual sales occur during the holiday season in the months of November and December. Because of the seasonality of our business, results for any quarter are not necessarily indicative of the results that may be achieved for the fiscal year.
Trademarks and Service Marks
The name “Kohl’s” is a registered service mark of one of our wholly-owned subsidiaries. We consider this mark and the accompanying name recognition to be valuable to our business. This subsidiary has over 190 additional registered trademarks, trade names and service marks, most of which are used in connection with our private label program.
Available Information
Our corporate website is www.KohlsCorporation.com. Through the “Investors” portion of this website, we make available, free of charge, our proxy statements, Annual Reports on Form 10-K, Quarterly Reports on Form 10-Q, Current Reports on Form 8-K, SEC Forms 3, 4 and 5 and any amendments to those reports as soon as reasonably practicable after such material has been filed with, or furnished to, the Securities and Exchange Commission (“SEC”).
The following have also been posted on our website, under the caption “Investors”:
• | Committee charters of our Board of Directors’ Audit Committee, Compensation Committee and Governance & Nominating Committee |
• | Corporate Governance Guidelines |
• | Code of Ethics |
Our Corporate Social Responsibility report can be found on our corporate website under the caption "Corporate Responsibility" and sub-heading "Sustainability".
4
Any amendment to or waiver from the provisions of the Code of Ethics that is applicable to our Chief Executive Officer, Chief Financial Officer or other key finance associates will be disclosed on the “Corporate Governance” portion of the website.
Information contained on our website is not part of this Annual Report on Form 10-K. Paper copies of any of the materials listed above will be provided without charge to any shareholder submitting a written request to our Investor Relations Department at N56 W17000 Ridgewood Drive, Menomonee Falls, Wisconsin 53051 or via e-mail to Investor.Relations@Kohls.com.
Item 1A. Risk Factors
Forward-Looking Statements
This Form 10-K contains “forward-looking statements” made within the meaning of the Private Securities Litigation Reform Act of 1995. Words such as "believes," "anticipates," "plans," "may," "intends," "will," "should," "expects" and similar expressions are intended to identify forward-looking statements. Forward-looking statements also include comments about our future sales or financial performance and our plans, performance and other objectives, expectations or intentions, such as statements regarding our liquidity, debt service requirements, planned capital expenditures, future store initiatives, adequacy of capital resources and reserves and statements contained in the "2016 Outlook" section of "Management's Discussion and Analysis of Financial Condition and Results of Operations". There are a number of important factors that could cause our results to differ materially from those indicated by the forward-looking statements including, among others, those risk factors described below. Forward-looking statements relate to the date made, and we undertake no obligation to update them.
Our sales, gross margin and operating results could be negatively impacted by a number of factors including, but not limited to those described below. Many of these risk factors are outside of our control. If we are not successful in managing these risks, they could have a negative impact on our sales, gross margin and/or operating results.
•Declines in general economic conditions, consumer spending levels and other conditions could lead to reduced consumer demand for our merchandise.
Consumer spending habits, including spending for the merchandise that we sell, are affected by many factors including prevailing economic conditions, levels of employment, salaries and wage rates, prevailing interest rates, housing costs, energy and fuel costs, income tax rates and policies, consumer confidence, consumer perception of economic conditions, and the consumer’s disposable income, credit availability and debt levels. The moderate income consumer, which is our core customer, is especially sensitive to these factors. A continued or incremental slowdown in the U.S. economy and the uncertain economic outlook could continue to adversely affect consumer spending habits. As all of our stores are located in the United States, we are especially susceptible to deteriorations in the U.S. economy.
Consumer confidence is also affected by the domestic and international political situation. The outbreak or escalation of war, or the occurrence of terrorist acts or other hostilities in or affecting the United States, could lead to a decrease in spending by consumers.
•Actions by our competitors.
The retail industry is highly competitive. We compete for customers, associates, locations, merchandise, services and other important aspects of our business with many other local, regional and national retailers. Those competitors include traditional department stores, upscale mass merchandisers, off-price retailers, specialty stores, internet and catalog businesses and other forms of retail commerce.
We consider style, quality and price to be the most significant competitive factors in our industry. The continuing migration and evolution of retailing to on-line and mobile channels has increased our challenges in differentiating ourselves from other retailers especially as it relates to national brands. In particular, consumers are able to quickly and conveniently comparison shop with digital tools, which can lead to decisions based solely on price. Unanticipated changes in the pricing and other practices of our competitors may adversely affect our performance.
5
•Our inability to offer merchandise that resonates with existing customers and helps to attract new customers and failure to successfully manage our inventory levels.
Our business is dependent on our ability to anticipate fluctuations in consumer demand for a wide variety of merchandise. Failure to accurately predict constantly changing consumer tastes, preferences, spending patterns and other lifestyle decisions could create inventory imbalances and adversely affect our performance and long-term relationships with our customers. Additionally, failure to accurately predict changing consumer tastes may result in excess inventory, which could result in additional markdowns and adversely affect our operating results.
•We may be unable to source merchandise in a timely and cost-effective manner.
Approximately 30% of the merchandise we sell is sourced through a third-party purchasing agent. The remaining merchandise is sourced from a wide variety of domestic and international vendors. Our ability to find qualified vendors and access products in a timely and efficient manner is a significant challenge which is typically even more difficult for goods sourced outside the United States, substantially all of which is shipped by ocean to ports in the United States. Political or financial instability, trade restrictions, tariffs, currency exchange rates, transport capacity and costs, work stoppages, port strikes, port congestion and delays and other factors relating to foreign trade are beyond our control and could adversely impact our performance.
Increases in the price of merchandise, raw materials, fuel and labor or their reduced availability could increase our cost of merchandise sold. The price and availability of raw materials may fluctuate substantially, depending on a variety of factors, including demand, weather, supply conditions, transportation costs, energy prices, work stoppages, government regulation and government policy, economic climates, market speculation and other unpredictable factors. An inability to mitigate these cost increases, unless sufficiently offset with our pricing actions, might cause a decrease in our profitability. Any related pricing actions might cause a decline in our sales volume. Additionally, a decrease in the availability of raw materials could impair our ability to meet our production or purchasing requirements in a timely manner. Both the increased cost and lower availability of merchandise, raw materials, fuel and labor may also have an adverse impact on our cash and working capital needs as well as those of our suppliers.
If any of our significant vendors were to become subject to bankruptcy, receivership or similar proceedings, we may be unable to arrange for alternate or replacement contracts, transactions or business relationships on terms as favorable as current terms, which could adversely affect our sales and operating results.
• | Failure of our vendors to adhere to our Terms of Engagement and applicable laws. |
A substantial portion of our merchandise is received from vendors and factories outside of the United States. We require all of our suppliers to comply with all applicable local and national laws and regulations and our Terms of Engagement for Kohl's Business Partners. These Terms of Engagement include provisions regarding laws and regulations, employment practices, ethical standards, environmental and legal requirements, communication, monitoring/compliance, record keeping, subcontracting and corrective action. From time to time, suppliers may not be in compliance with these standards or applicable laws. Significant or continuing noncompliance with such standards and laws by one or more suppliers could have a negative impact on our reputation and our results of operations.
•Ineffective marketing.
We believe that differentiating Kohl's in the marketplace is critical to our success. We design our marketing and loyalty programs to increase awareness of our brands and to build personalized connections with our customers. We believe these programs will strengthen customer loyalty, increase the number and frequency of customers that shop our stores and website and increase our sales. If our marketing and loyalty programs are not successful, our sales and operating results could be adversely affected.
6
•Damage to the reputation of the Kohl's brand or our private and exclusive brands.
We believe the Kohl's brand name and many of our private and exclusive brand names are powerful sales and marketing tools. We devote significant resources to promoting and protecting them. We develop and promote private and exclusive brands that have generated national recognition. In some cases, the brands or the marketing of such brands are tied to or affiliated with well-known individuals. Damage to the reputations (whether or not justified) of the Kohl’s brand, our private and exclusive brand names or any affiliated individuals, could arise from product failures; concerns about human rights, working conditions and other labor rights and conditions where merchandise is produced; perceptions of our pricing and return policies; litigation; vendor violations of our Terms of Engagement; or various other forms of adverse publicity, especially in social media outlets. Damage to our reputation may generate negative customer sentiment, potentially resulting in a reduction in sales, earnings, and shareholder value.
•Product safety concerns.
If our merchandise offerings do not meet applicable safety standards or our customers' expectations regarding safety, we could experience lost sales, experience increased costs and/or be exposed to legal and reputational risk. Events that give rise to actual, potential or perceived product safety concerns could expose us to government enforcement action and/or private litigation. Reputational damage caused by real or perceived product safety concerns, could have a negative impact on our sales and operating results.
•Disruptions in our information systems or an inability to adequately maintain and update those systems.
The efficient operation of our business is dependent on our information systems. In particular, we rely on our information systems to effectively manage sales, distribution, and merchandise planning and allocation functions. We also generate sales though the operations of our Kohls.com website. We frequently make investments that will help maintain and update our existing information systems. The potential problems and interruptions associated with implementing technology initiatives or the failure of our information systems to perform as designed could disrupt our business and harm sales and profitability.
•Weather conditions could adversely affect consumer shopping patterns.
A significant portion of our business is apparel and is subject to weather conditions. As a result, our operating results may be adversely affected by severe or unexpected weather conditions. Frequent or unusually heavy snow, ice or rain storms; natural disasters such as earthquakes, tornadoes, floods and hurricanes; or extended periods of unseasonable temperatures could adversely affect our performance by affecting consumer shopping patterns, diminishing demand for seasonal merchandise and/or causing physical damage to our properties.
•Inability to successfully execute a profitable omni-channel strategy.
Our business has evolved from an in-store only shopping experience to an omni-channel experience which includes in-store, on-line, mobile, social media and/or other interactions. We strive to offer a desirable omni-channel shopping experience for our customers and use social media as a way to interact with our customers and enhance their shopping experiences.
Customer expectations about the methods by which they purchase and receive products or services are also evolving. Customers are increasingly using technology and mobile devices to rapidly compare products and prices and to purchase products. Once products are purchased, customers are seeking alternate options for delivery of those products. We must continually anticipate and adapt to these changes in the purchasing process. Our ability to compete with other retailers and to meet our customer expectations may suffer if we are unable to provide relevant customer-facing technology. Our ability to compete may also suffer if Kohl’s, our suppliers, or our third-party shipping and delivery vendors are unable to effectively and efficiently fulfill and deliver orders, especially during the holiday season when sales volumes are especially high. Consequently, our results of operations could be adversely affected.
Our omni-channel business currently generates a lower operating margin than we have historically reported when we were primarily a store-only retailer. This profitability variance is due to a variety of factors including, but not limited to, an increase in the volume of lower margin merchandise, especially home products; costs to ship merchandise to our customers; and investments to provide the infrastructure necessary to expand our omni-channel strategy. There has been rapid growth in penetration of these less profitable omni-channel sales. There can be no assurances that future profitability will return to historical levels.
7
Our revenues, operating results and cash requirements are affected by the seasonal nature of our business.
Our business is subject to seasonal influences, with a major portion of sales and income historically realized during the second half of the fiscal year, which includes the back-to-school and holiday seasons.
If we do not properly stock or restock popular products, particularly during the back-to-school and holiday seasons, we may fail to meet customer demand, which could affect our revenue and our future growth. If we overstock products, we may be required to take significant inventory markdowns or write-offs, which could reduce profitability.
We may experience an increase in costs associated with shipping on-line orders due to complimentary upgrades, split shipments, and additional long-zone shipments necessary to ensure timely delivery for the holiday season. If too many customers access our website within a short period of time, we may experience system interruptions that make our website unavailable or prevent us from efficiently fulfilling orders, which may reduce the volume of goods we sell and the attractiveness of our products and services. Also, third-party delivery, direct ship vendors and customer service co-sourcers may be unable to deliver merchandise on a timely basis.
This seasonality causes our operating results and cash needs to vary considerably from quarter to quarter. Additionally, any decrease in sales or profitability during the second half of the fiscal year could have a disproportionately adverse effect on our results of operations.
Our inability to raise additional capital and maintain bank credit on favorable terms could adversely affect our business and financial condition.
We have historically relied on the public debt markets to raise capital to partially fund our operations and growth. We have also historically maintained lines of credit with financial institutions. Changes in the credit and capital markets, including market disruptions, limited liquidity and interest rate fluctuations, may increase the cost of financing or restrict our access to these potential sources of future liquidity. Our continued access to these liquidity sources on favorable terms depends on multiple factors, including our operating performance and maintaining strong debt ratings. If our credit ratings fall below desirable levels, our ability to access the debt markets and our cost of funds for new debt issuances could be adversely impacted. Additionally, if unfavorable capital market conditions exist if and when we were to seek additional financing, we may not be able to raise sufficient capital on favorable terms and on a timely basis (if at all). If our access to capital was to become significantly constrained or our cost of capital was to increase significantly, our financial condition, results of operations and cash flows could be adversely affected.
Inefficient or ineffective allocation of capital could adversely affect our operating results and/or shareholder value.
Our goal is to invest capital to maximize our overall long-term returns. This includes spending on inventory, capital projects and expenses, managing debt levels, and periodically returning value to our shareholders through share repurchases and dividends. To a large degree, capital efficiency reflects how well we manage our other key risks. The actions taken to address other specific risks may affect how well we manage the more general risk of capital efficiency. If we do not properly allocate our capital to maximize returns, we may fail to produce optimal financial results and we may experience a reduction in shareholder value.
Changes in our credit card operations could adversely affect our sales and/or profitability.
Our credit card operations facilitate merchandise sales and generate additional revenue from fees related to extending credit. The proprietary Kohl's credit card accounts are owned by an unrelated third-party, but we share in the net risk-adjusted revenue of the portfolio, which is defined as the sum of finance charges, late fees and other revenue less write-offs of uncollectible accounts. Changes in funding costs related to interest rate fluctuations will be shared similar to the revenue if interest rates exceed defined amounts. Though management currently believes that increases in funding costs will be largely offset by increases in finance charge revenue, increases in funding costs could adversely impact the profitability of this program.
Changes in credit card use, payment patterns and default rates may also result from a variety of economic, legal, social and other factors that we cannot control or predict with certainty. Changes that adversely impact our ability to extend credit and collect payments could negatively affect our results.
8
An inability to attract and retain quality associates could result in higher payroll costs and adversely affect our operating results.
Our performance is dependent on attracting and retaining a large number of quality associates. Many of those associates are in entry level or part-time positions with historically high rates of turnover. Many of our strategic initiatives require that we hire and/or develop associates with appropriate experience. Our staffing needs are especially high during the holiday season. Competition for these associates is intense. We cannot be sure that we will be able to attract and retain a sufficient number of qualified personnel in future periods.
Our ability to meet our labor needs while controlling costs is subject to external factors such as unemployment levels, prevailing wage rates, minimum wage legislation, actions by our competitors in compensation levels and changing demographics. Competitive and regulatory pressures have already significantly increased our labor costs. Further changes that adversely impact our ability to attract and retain quality associates could adversely affect our performance and/or profitability. In addition, changes in federal and state laws relating to employee benefits, including, but not limited to, sick time, paid time off, leave of absence, wage-and-hour, overtime, meal-and-break time and joint/co-employment could cause us to incur additional costs, which could negatively impact our profitability.
Regulatory and litigation developments could adversely affect our business operations and financial performance.
Various aspects of our operations are subject to federal, state or local laws, rules and regulations, any of which may change from time to time. The costs and other effects of new or changed legal requirements cannot be determined with certainty. For example, new legislation or regulations may result in increased costs directly for our compliance or indirectly to the extent such requirements increase prices of goods and services, reduce the availability of raw materials or further restrict our ability to extend credit to our customers.
We continually monitor the state and federal legal/regulatory environment for developments that may impact us. Failure to detect changes and comply with such laws and regulations may result in an erosion of our reputation, disruption of business and/or loss of associate morale. Additionally, we are regularly involved in various litigation matters that arise out of the conduct of our business. Litigation or regulatory developments could adversely affect our business operations and financial performance.
Unauthorized disclosure of sensitive or confidential customer, associate or company information could severely damage our reputation, expose us to risks of litigation and liability, disrupt our operations and harm our business.
As part of our normal course of business, we collect, process and retain sensitive and confidential customer, associate and company information. The protection of this data is extremely important to us, our associates and our customers. Despite the considerable security measures we have in place, our facilities and systems, and those of our third-party service providers, may be vulnerable to security breaches, acts of vandalism, computer viruses, misplaced or lost data, programming and/or human errors, or other similar events. Any security breach involving the misappropriation, loss or other unauthorized disclosure of confidential information, whether by us or our vendors, could disrupt our operations, damage our reputation and customers' willingness to shop in our stores or on our website, violate applicable laws, regulations, orders and agreements, and subject us to additional costs and liabilities which could be material.
Item 1B. Unresolved Staff Comments
Not applicable
Item 2. Properties
Stores
As of January 30, 2016, we operated 1,164 stores with 83.8 million selling square feet in 49 states. Our typical, or “prototype,” store has approximately 88,000 gross square feet of retail space and serves trade areas of 150,000 to 200,000 people. Most “small” stores are 55,000 to 68,000 gross square feet and serve trade areas of 100,000 to 150,000 people.
Our typical store lease has an initial term of 20-25 years and four to eight renewal options for consecutive five-year extension terms. Substantially all of our leases provide for a minimum annual rent that is fixed or adjusts to set levels during the lease term, including renewals. Approximately one-fourth of the leases provide for additional rent based on a percentage of sales over designated levels.
9
The following tables summarize key information about our stores as of January 30, 2016:
Number of Stores by State | Number of Stores by State | |||||
Mid-Atlantic Region: | South Central Region: | |||||
Delaware | 5 | Arkansas | 8 | |||
Maryland | 23 | Kansas | 12 | |||
Pennsylvania | 50 | Louisiana | 9 | |||
Virginia | 30 | Missouri | 27 | |||
West Virginia | 7 | Oklahoma | 11 | |||
Total Mid-Atlantic | 115 | Texas | 84 | |||
Midwest Region: | Total South Central | 151 | ||||
Illinois | 66 | Southeast Region: | ||||
Indiana | 39 | Alabama | 14 | |||
Iowa | 18 | Florida | 53 | |||
Michigan | 45 | Georgia | 35 | |||
Minnesota | 26 | Kentucky | 17 | |||
Nebraska | 7 | Mississippi | 5 | |||
North Dakota | 4 | North Carolina | 31 | |||
Ohio | 58 | South Carolina | 16 | |||
South Dakota | 3 | Tennessee | 20 | |||
Wisconsin | 40 | Total Southeast | 191 | |||
Total Midwest | 306 | West Region: | ||||
Northeast Region: | Alaska | 1 | ||||
Connecticut | 22 | Arizona | 26 | |||
Maine | 5 | California | 125 | |||
Massachusetts | 25 | Colorado | 24 | |||
New Hampshire | 11 | Idaho | 5 | |||
New Jersey | 38 | Montana | 3 | |||
New York | 51 | Nevada | 12 | |||
Rhode Island | 3 | New Mexico | 5 | |||
Vermont | 1 | Oregon | 11 | |||
Total Northeast | 156 | Utah | 12 | |||
Washington | 19 | |||||
Wyoming | 2 | |||||
Total West | 245 | |||||
Total Kohl’s | 1,164 | |||||
Number of Stores by | ||||||||||||
Store Type | Location | Ownership | ||||||||||
Prototype | 986 | Strip centers | 782 | Owned | 414 | |||||||
Small | 178 | Community & regional malls | 85 | Leased | 510 | |||||||
1,164 | Freestanding | 297 | Ground leased | 240 | ||||||||
1,164 | 1,164 | |||||||||||
10
Distribution Centers
The following table summarizes key information about each of our distribution centers.
Year Opened | Square Footage | |||
Store distribution centers: | ||||
Findlay, Ohio | 1994 | 780,000 | ||
Winchester, Virginia | 1997 | 420,000 | ||
Blue Springs, Missouri | 1999 | 540,000 | ||
Corsicana, Texas | 2001 | 540,000 | ||
Mamakating, New York | 2002 | 605,000 | ||
San Bernardino, California | 2002 | 575,000 | ||
Macon, Georgia | 2005 | 560,000 | ||
Patterson, California | 2006 | 360,000 | ||
Ottawa, Illinois | 2008 | 328,000 | ||
On-line fulfillment centers: | ||||
Monroe, Ohio | 2001 | 1,200,000 | ||
San Bernardino, California | 2010 | 970,000 | ||
Edgewood, Maryland | 2011 | 1,450,000 | ||
DeSoto, Texas | 2012 | 1,200,000 | ||
We own all of the distribution centers except Corsicana, Texas, which is leased.
Corporate Facilities
We own our corporate headquarters in Menomonee Falls, Wisconsin. We also own or lease additional buildings and office space which are used by various corporate departments, including our credit operations.
Item 3. Legal Proceedings
We are not currently a party to any material legal proceedings, but are subject to certain legal proceedings and claims from time to time that arise out of the conduct of our business.
Item 4. Mine Safety Disclosures
Not applicable
11
PART II
Item 5. Market for Registrant’s Common Equity, Related Stockholder Matters and Issuer Purchases of Equity Securities
(a) Market information
Our Common Stock has been traded on the New York Stock Exchange ("NYSE") since May 19, 1992, under the symbol “KSS.” The prices in the table set forth below indicate the high and low sales prices of our Common Stock per the New York Stock Exchange Composite Price History and our quarterly cash dividends per common share for each quarter in 2015 and 2014.
2015 | 2014 | ||||||||||||||||
High | Low | Dividend | High | Low | Dividend | ||||||||||||
Fourth Quarter | $50.86 | $42.85 | $0.45 | $61.54 | $54.95 | $0.39 | |||||||||||
Third Quarter | 61.60 | 44.06 | 0.45 | 62.50 | 53.74 | 0.39 | |||||||||||
Second Quarter | 74.51 | 61.17 | 0.45 | 55.89 | 51.00 | 0.39 | |||||||||||
First Quarter | 79.07 | 61.44 | 0.45 | 57.89 | 49.09 | 0.39 | |||||||||||
On February 24, 2016, our Board of Directors approved an 11% increase in our dividend to $0.50 per common share which will be paid on March 23, 2016 to shareholders of record as of March 9, 2016. In 2015, we paid aggregate cash dividends of $349 million.
(b) Holders
As of March 9, 2016, there were approximately 4,100 record holders of our Common Stock.
(c) Securities Authorized For Issuance Under Equity Compensation Plans
See the information provided in the “Equity Compensation Plan Information” section of the Proxy Statement for our May 11, 2016 Annual Meeting of Shareholders, which information is incorporated herein by reference.
12
(d) Performance Graph
The graph below compares our cumulative five-year shareholder return to that of the Standard & Poor’s 500 Index and a Peer Group Index that is consistent with the retail peer group used in the Compensation Discussion & Analysis section of our Proxy Statement for our May 11, 2016 Annual Meeting of Shareholders. The Peer Group Index was calculated by Capital IQ, a Standard & Poor’s business and includes Bed, Bath & Beyond Inc.; The Gap, Inc.; J.C. Penney Company, Inc.; Limited Brands, Inc.; Macy’s, Inc.; Nordstrom, Inc.; Ross Stores, Inc.; Sears Holding Corporation; Target Corporation; and The TJX Companies, Inc. The Peer Group Index is weighted by the market capitalization of each component company at the beginning of each period. The graph assumes an investment of $100 on January 29, 2011 and reinvestment of dividends. The calculations exclude trading commissions and taxes.
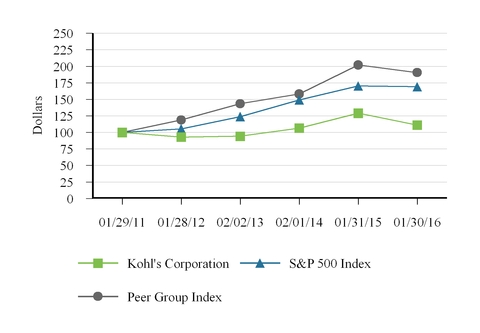
Company / Index | Jan 29, 2011 | Jan 28, 2012 | Feb 2, 2013 | Feb 1, 2014 | Jan 31, 2015 | Jan 30, 2016 | |||||||||||
Kohl’s Corporation | $100.00 | $93.05 | $94.23 | $106.55 | $129.22 | $111.10 | |||||||||||
S&P 500 Index | 100.00 | 105.33 | 123.87 | 149.02 | 170.22 | 169.09 | |||||||||||
Peer Group Index | 100.00 | 118.84 | 143.36 | 158.29 | 202.09 | 190.58 | |||||||||||
(e) Recent Sales of Unregistered Securities; Use of Proceeds from Registered Securities
We did not sell any equity securities during 2015 which were not registered under the Securities Act.
(f) Purchases of Equity Securities by the Issuer and Affiliated Purchasers
In 2012, our Board of Directors authorized the repurchase of $3.5 billion of our shares of common stock. Purchases under the repurchase program may be made in the open market, through block trades and other negotiated transactions. We expect to execute the share repurchase program primarily in open market transactions, subject to market conditions. There is no fixed termination date for the repurchase program, and the program may be suspended, discontinued or accelerated at any time.
13
The following table contains information for shares repurchased and shares acquired from employees in lieu of amounts required to satisfy minimum tax withholding requirements upon the vesting of the employees’ restricted stock during the three fiscal months ended January 30, 2016:
Period | Total Number of Shares Purchased During Period | Average Price Paid Per Share | Total Number of Shares Purchased as Part of Publicly Announced Plans or Programs | Approximate Dollar Value of Shares that May Yet Be Purchased Under the Plans or Programs | |||||||||
(Dollars in Millions) | |||||||||||||
November 1 – November 28, 2015 | 1,232,778 | $45.75 | 1,231,525 | $799 | |||||||||
November 29, 2015 – January 2, 2016 | 1,847,094 | 46.94 | 1,845,092 | 712 | |||||||||
January 3 – January 30, 2016 | 1,442,582 | 48.64 | 1,416,962 | 643 | |||||||||
Total | 4,522,454 | $47.16 | 4,493,579 | $643 | |||||||||
14
Item 6. Selected Consolidated Financial Data
The selected consolidated financial data presented below should be read in conjunction with our consolidated financial statements and related notes included elsewhere in this document.
2015 | 2014 | 2013 | 2012 (d) | 2011 | |||||||||||||||
(Dollars in Millions, Except per Share and per Square Foot Data) | |||||||||||||||||||
Statements of Income Data: | |||||||||||||||||||
Net sales | $ | 19,204 | $ | 19,023 | $ | 19,031 | $ | 19,279 | $ | 18,804 | |||||||||
Cost of merchandise sold | 12,265 | 12,098 | 12,087 | 12,289 | 11,625 | ||||||||||||||
Gross margin | 6,939 | 6,925 | 6,944 | 6,990 | 7,179 | ||||||||||||||
Selling, general and administrative expenses | 4,452 | 4,350 | 4,313 | 4,267 | 4,243 | ||||||||||||||
Depreciation and amortization | 934 | 886 | 889 | 833 | 778 | ||||||||||||||
Operating income | 1,553 | 1,689 | 1,742 | 1,890 | 2,158 | ||||||||||||||
Interest expense, net | 327 | 340 | 338 | 329 | 299 | ||||||||||||||
Loss on extinguishment of debt | 169 | — | — | — | — | ||||||||||||||
Income before income taxes | 1,057 | 1,349 | 1,404 | 1,561 | 1,859 | ||||||||||||||
Provision for income taxes | 384 | 482 | 515 | 575 | 692 | ||||||||||||||
Net income | $ | 673 | $ | 867 | $ | 889 | $ | 986 | $ | 1,167 | |||||||||
Basic earnings per share | $ | 3.48 | $ | 4.28 | $ | 4.08 | $ | 4.19 | $ | 4.33 | |||||||||
Diluted earnings per share | $ | 3.46 | $ | 4.24 | $ | 4.05 | $ | 4.17 | $ | 4.30 | |||||||||
Dividends per share | $ | 1.80 | $ | 1.56 | $ | 1.40 | $ | 1.28 | $ | 1.00 | |||||||||
Operating and Other Data: | |||||||||||||||||||
Net sales growth | 1.0 | % | 0.0 | % | (1.3 | )% | 2.5 | % | 2.2 | % | |||||||||
Comparable sales growth (a) | 0.7 | % | (0.3 | )% | (1.2 | )% | 0.3 | % | 0.5 | % | |||||||||
Net sales per selling square foot (b) | $ | 228 | $ | 226 | $ | 227 | $ | 231 | $ | 232 | |||||||||
As a percent of sales: | |||||||||||||||||||
Gross margin | 36.1 | % | 36.4 | % | 36.5 | % | 36.3 | % | 38.2 | % | |||||||||
Operating income | 8.1 | % | 8.9 | % | 9.2 | % | 9.8 | % | 11.5 | % | |||||||||
Return on average shareholders’ equity (c) | 11.8 | % | 14.7 | % | 14.8 | % | 15.8 | % | 16.4 | % | |||||||||
Excluding loss on extinguishment of debt: | |||||||||||||||||||
Net income | $ | 781 | $ | 867 | $ | 889 | $ | 986 | $ | 1,167 | |||||||||
Diluted earnings per share | $ | 4.01 | $ | 4.24 | $ | 4.05 | $ | 4.17 | $ | 4.30 | |||||||||
Return on average shareholders' equity (c) | 13.5 | % | 14.7 | % | 14.8 | % | 15.8 | % | 16.4 | % | |||||||||
Total square feet of selling space (in thousands) | $ | 83,810 | $ | 83,750 | $ | 83,671 | $ | 83,098 | $ | 82,226 | |||||||||
Number of stores (end of period) | 1,164 | 1,162 | 1,158 | 1,146 | 1,127 | ||||||||||||||
Working capital | $ | 2,362 | $ | 2,721 | $ | 2,412 | $ | 2,061 | $ | 2,111 | |||||||||
Total assets | $ | 13,606 | $ | 14,333 | $ | 14,228 | $ | 13,761 | $ | 14,021 | |||||||||
Long-term debt | $ | 2,792 | $ | 2,780 | $ | 2,777 | $ | 2,478 | $ | 2,128 | |||||||||
Capital lease and financing obligations | $ | 1,916 | 1,968 | $ | 2,069 | $ | 2,061 | $ | 2,103 | ||||||||||
Shareholders’ equity | $ | 5,491 | $ | 5,991 | $ | 5,978 | $ | 6,048 | $ | 6,508 | |||||||||
Cash flow from operations | $ | 1,474 | $ | 2,024 | $ | 1,884 | $ | 1,265 | $ | 2,139 | |||||||||
Capital expenditures | $ | 690 | $ | 682 | $ | 643 | $ | 785 | $ | 927 | |||||||||
(a) | Comparable sales include sales for stores (including relocated or remodeled stores) which were open throughout both the full current and prior year periods. We also include omni-channel sales in our comparable sales. Adjustments for omni-channel sales that have been shipped, but not yet received by the customer are included in net sales, but are not included in our comparable sales. Fiscal 2013 comparable sales growth compares the 52 weeks ended February 1, 2014 to the 52 weeks ended February 2, 2013. Fiscal 2012 comparable sales growth compares the 52 weeks ended January 26, 2013 to the 52 weeks ended January 28, 2012. |
(b) | Net sales per selling square foot includes omni-channel sales and stores open for the full current period. 2012 excludes the impact of the 53rd week. |
(c) | Average shareholders’ equity is based on a 5-quarter average. |
(d) | Fiscal 2012 was a 53-week year. During the 53rd week, total sales were $169 million; selling, general and administrative expenses were approximately $30 million; interest was approximately $2 million; net income was approximately $15 million and diluted earnings per share was approximately $0.06. |
15
Item 7. Management’s Discussion and Analysis of Financial Condition and Results of Operations
Executive Summary
As of January 30, 2016, we operated 1,164 family-focused, value-oriented department stores and a website (www.Kohls.com) that sell moderately-priced private label, exclusive and national brand apparel, footwear, accessories, beauty and home products. Our stores generally carry a consistent merchandise assortment with some differences attributable to regional preferences. Our website includes merchandise which is available in our stores, as well as merchandise which is available only on-line.
In 2014, we introduced a multi-year strategic framework which we refer to as "the Greatness Agenda". It is built on five pillars - amazing product, incredible savings, easy experience, personalized connections and winning teams. All of the Greatness Agenda initiatives are designed to increase sales, primarily by increasing the number of customers that shop at our stores and on-line.
As a retailer, product is the core of our business. During 2015, we increased our emphasis on national brands as we believe they drive customer traffic. Driven by strong sales in Nike, Skechers, Levi’s and Carters, national brand sales increased 6.2% and represented 52% of our sales in 2015. Active and wellness merchandise sales were also stronger than the company average in both national brands and our own private and exclusive brands.
During 2015, we expanded our localization assortment strategy which tailors product mix to the specific customer preferences at each of our stores. Approximately 40% of our sales were tailored by store at the end of 2015. We plan to have unique store assortments in 90% of our stores by the end of 2016.
In addition to offering amazing product, we must offer an easy and desirable shopping experience for customers both in our stores and from their digital devices. During 2015, we launched new mobile and tablet platforms which improved the digital shopping experience. We also launched buy on-line and pick-up in store (“BOPUS”) in all stores. In addition to offering a convenient shopping option for our customers, BOPUS is driving incremental sales. Customers picking up BOPUS orders have made additional in-store purchases of approximately 25% of their original order.
In 2016, we plan to make several updates to our store formats and omni-channel strategy. In the first half of the year, we intend to pilot seven new small format stores which will help inform both future store size and rationalization, and identify omni-channel opportunities. We also plan to test two more clearance stores, which are operated as Off-Aisle stores, and 12 FILA outlet stores.
We believe our personalized connections and incredible savings strategies will increase sales by strengthening the loyalty of existing customers and attracting new customers. Key to the success of these initiatives are understanding our customers and ensuring they get the most from every dollar that they spend at Kohl’s. We believe our Yes2You loyalty program will continue to drive both strategies. In 2015, approximately 65% of our sales were attributed to Yes2You members. Yes2You members consistently shop more frequently and spend more than customers who are not enrolled in the program.
To execute our Greatness Agenda vision, we rely on winning teams of engaged, talented, results-oriented and empowered management and employees. During 2015, we rounded out our leadership team by hiring Sona Chawla as our Chief Operating Officer.
We believe that the strategic framework of the Greatness Agenda is working. We are making progress towards our goal of being the most engaging retailer in America, but realize that it will take additional time to fully implement our initiatives and achieve the goals we initially established.
In 2015, comparable sales increased 0.7%; an improvement over the sales declines that we reported prior to launching the Greatness Agenda. Gross margin as a percentage of sales decreased approximately 30 basis points from 36.4% in 2014 to 36.1% in 2015. Gross margin was especially challenging in the fourth quarter due to a very competitive holiday season and deeper discounts on cold-weather apparel which did not sell due to unseasonably warm weather. Selling, general and administrative expenses increased 2% in 2015. Expenses were again well-managed against the sales increases. Excluding the loss on extinguishment of debt, our net income was $781 million and our diluted earnings per share decreased 5% to $4.01.
See "Results of Operations" and "Liquidity and Capital Resources" for additional details about our financial results, how we define comparable sales, and the loss on extinguishment of debt.
16
2016 Outlook
Our current expectations for 2016 are as follows:
Total sales | Decrease (0.5%) - Increase 0.5% |
Comparable sales | Increase 0 - 1% |
Gross margin as a percent of sales | Increase 0 - 20 bps |
Selling, general and administrative expenses | Increase 1 - 2% |
Depreciation | $940 million |
Interest | $310 million |
Effective tax rate | 37% |
Earnings per diluted share | $4.05 - $4.25 |
Capital expenditures | $825 million |
Share repurchases: | |
Total repurchases | $600 million |
Cost per share | $50 |
We continue to explore ways to enhance shareholder value through the optimization of our existing store portfolio. In 2016, we intend to close 18 underperforming stores, representing less than one percent of total sales. We announced the specific locations in March. The closures are expected to generate annual SG&A savings of approximately $45 million and annual depreciation savings of approximately $10 million. We currently expect to incur approximately $150 - $170 million in charges as a result of these planned closures and the organizational realignment at our corporate offices which were announced in February. We estimate that approximately $55 - $65 million of the charges will be recorded in the first quarter of 2016, with the remainder recorded in the second quarter.
Results of Operations
Net Sales
As our omni-channel strategy continues to mature, it is increasingly difficult to distinguish between a "store" sale and an "on-line" sale. Below is a list of some omni-channel examples:
• | Stores increase on-line sales by providing customers opportunities to view, touch and/or try on physical merchandise before ordering on-line. |
• | On-line purchases can easily be returned in our stores. |
• | Kohl's Cash coupons and Yes2You rewards can be earned and redeemed on-line or in store regardless of where they were earned. |
• | In-store customers can order from on-line kiosks in our stores. |
• | Order on-line and pick-up in store is available in all stores. |
• | Customers who utilize our mobile app while in the store may receive mobile coupons to use when they check out. |
• | On-line orders may be shipped from a dedicated on-line fulfillment center, a store, a retail distribution center, direct ship vendors or any combination of the above. |
Because we do not have a clear distinction between "store" sales and "on-line" sales, we do not separately report on-line sales.
Comparable sales include sales for stores (including relocated or remodeled stores) which were open during both the current and prior year periods. We also include omni-channel sales in our comparable sales. Adjustments for omni-channel sales that have been shipped, but not yet been received by the customer are included in net sales, but are not included in our comparable sales.
17
The following table summarizes net sales:
2015 | 2014 | 2013 | |||||||||
Net sales (in Millions) | $ | 19,204 | $ | 19,023 | $ | 19,031 | |||||
Increase (decrease) in sales: | |||||||||||
Total | 1.0 | % | 0.0 | % | (1.3 | )% | |||||
Comparable | 0.7 | % | (0.3 | )% | (1.2 | )% | |||||
Net sales per selling square foot (a) | $ | 228 | $ | 226 | $ | 227 | |||||
(a) Net sales per selling square foot includes on-line sales and stores open for the full current period.
Drivers of the changes in comparable sales were as follows:
2015 | 2014 | ||||
Selling price per unit | 1.3 | % | 2.8 | % | |
Units per transaction | (0.4 | )% | (1.7 | )% | |
Average transaction value | 0.9 | % | 1.1 | % | |
Number of transactions | (0.2 | )% | (1.4 | )% | |
Comparable sales | 0.7 | % | (0.3 | )% | |
The increases in selling price per unit were a combination of increased penetration and selling prices in our national brand portfolio. The changes in units per transaction reflect customer reaction to the price changes. Generally, customers purchase more items as prices decrease and fewer items as prices increase. Transactions decreased in both periods, however trends have improved since the launch of the Greatness Agenda.
From a regional perspective, including on-line originated sales, the West, Southeast, and Midwest outperformed the Company average in 2015. The South Central, Mid-Atlantic and Northeast underperformed the Company average.
By line of business, Footwear and Home outperformed the Company average in 2015. Men's and Women's were consistent with the Company average while Children's and Accessories both underperformed the Company average.
Net sales per selling square foot (which includes omni-channel sales and stores open for the full current period), increased 0.9% to $228 in 2015, which is consistent with the increase in comparable sales.
Net sales for 2014 were generally consistent with 2013 net sales. From a line of business perspective, Children's, Footwear, and Men's reported sales increases. Accessories was slightly above the Company average. Home and Women's both underperformed the Company average. From a regional perspective, including on-line originated sales, the West, Southeast, and Midwest reported higher sales, which were offset by sales decreases in the Northeast, Mid-Atlantic, and South Central regions.
Gross margin
2015 | 2014 | 2013 | |||||||||
(Dollars in Millions) | |||||||||||
Gross margin | $ | 6,939 | $ | 6,925 | $ | 6,944 | |||||
As a percent of net sales | 36.1 | % | 36.4 | % | 36.5 | % | |||||
Gross margin includes the total cost of products sold, including product development costs, net of vendor payments other than reimbursement of specific, incremental and identifiable costs; inventory shrink; markdowns; freight expenses associated with moving merchandise from our vendors to our distribution centers; shipping and handling expenses of omni-channel sales; and terms cash discount. Our gross margin may not be comparable with that of other retailers because we include distribution center and buying costs in selling, general and administrative expenses while other retailers may include these expenses in cost of merchandise sold.
18
Gross margin as a percentage of sales decreased approximately 30 basis points from 36.4% in 2014 to 36.1% in 2015. The decrease was due to an increase in shipping costs resulting from growth in on-line originated sales, partially offset by an increase in our merchandise margin.
Gross margin as a percentage of sales decreased approximately 10 basis points from 36.5% in 2013 to 36.4% in 2014. Higher merchandise margin was more than offset by an increase in shipping costs, which was in line with our omni-channel business growth.
Selling, general and administrative expenses
2015 | 2014 | 2013 | |||||||||
(Dollars in Millions) | |||||||||||
Selling, general, and administrative expenses ("SG&A") | $ | 4,452 | $ | 4,350 | $ | 4,313 | |||||
As a percent of net sales | 23.2 | % | 22.9 | % | 22.7 | % | |||||
SG&A expenses include compensation and benefit costs (including stores, headquarters, buying and merchandising and distribution centers); occupancy and operating costs of our retail, distribution and corporate facilities; freight expenses associated with moving merchandise from our distribution centers to our retail stores and among distribution and retail facilities; marketing expenses, offset by vendor payments for reimbursement of specific, incremental and identifiable costs; net revenues from our Kohl’s credit card operations; and other administrative revenues and expenses. We do not include depreciation and amortization in SG&A. The classification of these expenses varies across the retail industry.
The following table summarizes the changes in SG&A by expense type:
2015 | 2014 | ||||||
(Dollars in Millions) | |||||||
Store expenses | $ | 77 | $ | (4 | ) | ||
Corporate expenses | 58 | 34 | |||||
Distribution costs | (3 | ) | 10 | ||||
Marketing costs, excluding credit card operations | (4 | ) | 21 | ||||
Net revenues from credit card operations | (26 | ) | (24 | ) | |||
Total increase | $ | 102 | $ | 37 | |||
Many of our expenses, including store payroll and distribution costs, are variable in nature. These costs generally increase as sales increase and decrease as sales decrease. We measure both the change in these variable expenses and the expense as a percent of sales. If the expense as a percent of sales decreased from the prior year, the expense "leveraged" and indicates that the expense was well-managed or effectively generated additional sales. If the expense as a percent of sales increased over the prior year, the expense "deleveraged" and indicates that sales growth was less than expense growth. SG&A as a percent of sales increased, or "deleveraged," by approximately 30 basis points in 2015.
The increase in store expenses are primarily attributable to higher store payroll due to on-going wage pressure and omni-channel support of ship-from-store and buy on-line, pick-up in store operations. Property taxes and common area maintenance also increased.
Corporate expense increased over 2014 due to technology and infrastructure investments related to our omni-channel strategy and other various corporate costs.
Distribution costs, which exclude payroll related to on-line originated orders that were shipped from our stores, were $278 million for 2015, $281 million for 2014 and $271 million for 2013. Distribution costs decreased in 2015 due to lower store distribution costs and were partially offset by higher fulfillment costs related to our growing on-line business, particularly in the fourth quarter.
Marketing costs decreased in 2015 as we decreased our spending in newspaper inserts and direct mail through optimized circulation and shifted spending to digital media.
19
Revenues from our credit card operations were $456 million in 2015, $430 million in 2014 and $406 million in 2013. The increases in net revenues from credit card operations are due to higher finance charge revenues and late fees, partially offset by higher bad debt expense, all which were the result of growth in the portfolio. Additionally, lower marketing spend was partially offset by increased servicing costs.
SG&A for 2014 increased $37 million, or 1%, over 2013. As a percentage of sales, SG&A increased, or "deleveraged", by approximately 20 basis points in 2014. The increase in SG&A was due primarily to higher distribution costs, increased marketing, and investments in technology and infrastructure related to our on-line business, offset by higher credit card revenue.
Other Expenses
2015 | 2014 | 2013 | |||||||||
(Dollars in Millions) | |||||||||||
Depreciation and amortization | $ | 934 | $ | 886 | $ | 889 | |||||
Interest expense, net | 327 | 340 | 338 | ||||||||
Loss on extinguishment of debt | 169 | — | — | ||||||||
Provision for income taxes | 384 | 482 | 515 | ||||||||
Effective tax rate | 36.3 | % | 35.7 | % | 36.7 | % | |||||
Depreciation and amortization was higher in 2015 than 2014, as higher information technology ("IT") amortization was partially offset by lower store depreciation due to maturing of our stores. Depreciation and amortization was consistent in 2014 and 2013, as lower store depreciation was only partially offset by higher IT amortization.
Net interest expense decreased $13 million, or 4%, in 2015 as a result of refinancing our debt at lower interest rates during 2015. Net interest expense increased $2 million, or 1%, in 2014 due to higher outstanding long-term debt following the September 2013 debt issuance.
During 2015, we completed a cash tender offer and redemption for $1,085 million of senior unsecured debt. We recognized a $169 million loss on extinguishment of debt which included a $163 million bond tender premium paid to holders of the debt and a $6 million non-cash write-off of deferred financing costs and original issue discounts associated with the extinguished debt.
Changes in our effective tax were primarily due to favorable state audit settlements during 2014.
Inflation
Although we expect that our operations will be influenced by general economic conditions, including food, fuel and energy prices, and by costs to source our merchandise, we do not believe that inflation has had a material effect on our results of operations. However, there can be no assurance that our business will not be impacted by such factors in the future.
Liquidity and Capital Resources
The following table presents the primary cash requirements and sources of funds.
Cash Requirements | Sources of Funds | |
• Operational needs, including salaries, rent, taxes and other costs of running our business • Capital expenditures • Inventory (seasonal and new store) • Share repurchases • Dividend payments | • Cash flow from operations • Short-term trade credit, in the form of extended payment terms • Line of credit under our revolving credit facility | |
Our working capital and inventory levels typically build throughout the fall, peaking during the November and December holiday selling season.
20
The following table includes cash balances and changes.
2015 | 2014 | 2013 | |||||||||
(Dollars in Millions) | |||||||||||
Cash and cash equivalents | $ | 707 | $ | 1,407 | $ | 971 | |||||
Net cash provided by (used in): | |||||||||||
Operating activities | $ | 1,474 | $ | 2,024 | $ | 1,884 | |||||
Investing activities | (681 | ) | (593 | ) | (623 | ) | |||||
Financing activities | (1,493 | ) | (995 | ) | (827 | ) | |||||
Free Cash Flow (a) | $ | 671 | $ | 1,234 | $ | 1,127 | |||||
(a) See the Free Cash Flow discussion later in this Liquidity and Capital Resources section for additional discussion of this non-GAAP financial measure.
Operating activities
Cash provided by operations decreased $550 million, or 27%, in 2015 to $1.5 billion.
Merchandise inventory increased $224 million in 2015 to $4.0 billion. Inventory per store increased 5.7% and units per store increased 5% over 2014. The increases are primarily in national brands.
Accounts payable as a percent of inventory was 31.0% at January 30, 2016, compared to 39.6% at January 31, 2015. Almost half of the decrease was due to the anniversary of the port strike in 2014. Lower year-over-year January receipts and higher inventory levels also contributed to the decrease.
Cash provided by operations increased $140 million to $2.0 billion in 2014. The increase was primarily due to decreased inventory spending in 2014.
Investing activities
Net cash used in investing activities increased $88 million to $681 million in 2015.
Capital expenditures of $690 million in 2015 were generally consistent with 2014 as higher IT spending in 2015 was offset by the purchase and build out of a call center in Texas in 2014.
The following table summarizes expected and actual capital expenditures by major category as a percentage of total capital expenditures:
2016 Estimate | 2015 | 2014 | 2013 | ||||||||
Information technology | 45 | % | 45 | % | 45 | % | 45 | % | |||
Store strategies | 30 | 36 | 33 | 31 | |||||||
Base capital | 25 | 20 | 22 | 24 | |||||||
Total | 100 | % | 100 | % | 100 | % | 100 | % | |||
We expect total capital expenditures of approximately $825 million in fiscal 2016. The actual amount of our future capital expenditures will depend on the number and timing of new stores and refreshes; expansion and renovations to distribution centers; the mix of owned, leased or acquired stores; and IT and corporate spending. We do not anticipate that our capital expenditures will be limited by any restrictive covenants in our financing agreements.
Capital expenditures totaled $682 million in 2014, a $39 million increase over 2013. The increase in capital spending is primarily due to the expansion of our corporate campus, increased IT spending and the purchase and build out of a call center in Texas, partially offset by decreased new store spending.
Proceeds from sales of investments in auction rate securities were $82 million in 2014. All of our auction rate securities were sold in 2014. Despite the non-liquid nature of these investments following market conditions that arose in 2008, we were able to sell substantially all of our investments at par.
21
Financing activities
Our financing activities used cash of $1.5 billion in 2015 and $1.0 billion in 2014. The increase was primarily due to greater share repurchases and premium paid on redemption of debt.
We repurchased 17 million shares of our common stock for $1.0 billion in 2015 and 12 million shares for $677 million in 2014. Share repurchases are discretionary in nature. The timing and amount of repurchases is based upon available cash balances, our stock price and other factors.
During 2015, we completed a cash tender offer and redemption for $1.1 billion of our higher coupon senior unsecured debt. We recognized a $169 million loss on extinguishment of debt which included a $163 million bond tender premium paid to holders of the debt and a $6 million non-cash write-off of deferred financing costs and original issue discounts associated with the extinguished debt.
In July 2015, we issued $650 million of 4.25% notes due in July 2025 and $450 million of 5.55% notes due in July 2045. Both notes include semi-annual, interest-only payments beginning January 17, 2016. Proceeds of the issuances and cash on hand were used to pay the principal, premium and accrued interest of the acquired and redeemed debt.
On July 1, 2015, we entered into an Amended and Restated Credit Agreement with various lenders which provides for $1.0 billion senior unsecured five-year revolving credit facility that will mature in June 2020. Among other things, the agreement includes a maximum leverage ratio financial covenant (which is consistent with the ratio under our prior credit agreement) and restrictions on liens and subsidiary indebtedness.
As of January 30, 2016, our credit ratings were as follows:
Moody’s | Standard & Poor’s | Fitch | |||
Long-term debt | Baa1 | BBB | BBB+ | ||
Though we have no current intentions to do so, we may again seek to retire or purchase our outstanding debt through open market cash purchases, privately negotiated transactions or otherwise. Such repurchases, if any, will depend on prevailing market conditions, our liquidity requirements, contractual restrictions and other factors. The amounts involved could be material.
During 2015, we paid cash dividends of $349 million as detailed in the following table:
First Quarter | Second Quarter | Third Quarter | Fourth Quarter | ||||
Declaration date | February 25 | May 13 | August 11 | November 11 | |||
Record date | March 11 | June 10 | September 9 | December 9 | |||
Payment date | March 25 | June 24 | September 23 | December 23 | |||
Amount per common share | $0.45 | $0.45 | $0.45 | $0.45 | |||
On February 24, 2016, our Board of Directors approved an 11% increase in our dividend to $0.50 per common share which will be paid on March 23, 2016 to shareholders of record as of March 9, 2016.
22
Key financial ratios
The following ratios provide additional measures of our liquidity, return on investments, and capital structure.
2015 | 2014 | 2013 | |||
Liquidity Ratios: | (Dollars in Millions) | ||||
Working capital | $2,362 | $2,721 | $2,412 | ||
Current ratio | 1.87 | 1.95 | 1.87 | ||
Free cash flow (a) | $671 | $1,234 | $1,127 | ||
Return on Investment Ratios: | |||||
Ratio of earnings to fixed charges | 3.1 | 3.6 | 3.7 | ||
Return on assets | 4.7% | 6.1% | 6.3% | ||
Return on gross investment (a) | 14.5% | 15.2% | 15.5% | ||
Capital Structure Ratios: | |||||
Debt/capitalization | 46.3% | 44.3% | 44.8% | ||
Adjusted Debt to EBITDAR (a) | 2.52 | 2.45 | 2.42 | ||
(a) Non-GAAP financial measure
Liquidity ratios
Liquidity measures our ability to meet short-term cash needs. In 2015, working capital decreased $359 million and our current ratio decreased 8 basis points from year-end 2014 due to a decrease in cash, which was partially offset by an increase in inventory and decrease in accounts payable. In 2014, working capital increased $309 million and our current ratio increased 8 basis points over year-end 2013 due to an increase in cash, which was partially offset by a decrease in inventory and increase in accounts payable.
We generated $671 million of free cash flow for 2015; a decrease of $563 million from 2014. As discussed above, the decrease is primarily the result of a decrease in cash provided by operating activities in 2015. Free cash flow is a non-GAAP financial measure which we define as net cash provided by operating activities and proceeds from financing obligations (which generally represent landlord reimbursements of construction costs) less capital expenditures and capital lease and financing obligation payments. Free cash flow should be evaluated in addition to, and not considered a substitute for, other financial measures such as net income and cash flow provided by operations. We believe that free cash flow represents our ability to generate additional cash flow from our business operations. See the key financial ratio calculations section above.
Return on investment ratios
Lower earnings, including the loss on extinguishment of debt, caused decreases in all three of our return on investment ratios - ratio of earnings to fixed charges, return on assets and return on gross investment ("ROI"). See Exhibit 12.1 to this Annual Report on Form 10-K for the calculation of our ratio of earnings to fixed charges and the key financial ratio calculations below for the return on assets and ROI calculations.
We believe that ROI is a useful financial measure in evaluating our operating performance. When analyzed in conjunction with our net earnings and total assets and compared with return on assets, it provides investors with a useful tool to evaluate our ongoing operations and our management of assets from period to period. ROI is a non-GAAP financial measure which we define as earnings before interest, taxes, depreciation, amortization and rent (“EBITDAR”) divided by average gross investment. Our ROI calculation may not be comparable to similarly-titled measures reported by other companies. ROI should be evaluated in addition to, and not considered a substitute for, other financial measures such as return on assets.
Capital structure ratios
Our debt agreements contain various covenants including limitations on additional indebtedness and a maximum permitted debt ratio. As of January 30, 2016, we were in compliance with all debt covenants and expect to remain in compliance during 2016. See the key financial ratio calculations section below for our debt covenant calculation.
Our debt/capitalization ratio was 46.3% at year-end 2015 and 44.3% at year-end 2014. The increase is primarily due to treasury stock purchases in 2015.
23
Our Adjusted Debt to EBITDAR ratio was 2.52 for 2015, 2.45 for 2014, and 2.42 for 2013. The increases are primarily due to lower EBITDAR. Adjusted Debt to EBITDAR is a non-GAAP financial measure which we define as our adjusted outstanding debt balance divided by EBITDAR. We believe that our debt levels are best analyzed using this measure. Our current goals are to maintain an Adjusted Debt to EBITDAR ratio of approximately 2.25, to manage debt levels to maintain a BBB+ investment-grade credit rating and to operate with an efficient capital structure for our size, growth plans and industry. We are currently exceeding our target goal to take advantage of a favorable, low interest rate debt environment. We expect to manage our business and debt levels to get our overall ratio back to our target goal over the next several years. We currently have no plans for new debt in 2016. Our Adjusted Debt to EBITDAR calculation may not be comparable to similarly-titled measures reported by other companies. Adjusted Debt to EBITDAR should be evaluated in addition to, and not considered a substitute for, other financial measures such as debt/capitalization. See the key financial ratio calculations section below for our Adjusted Debt to EBITDAR calculation.
Key financial ratio calculations
The following table reconciles net cash provided by operating activities (a GAAP measure) to free cash flow (a non-GAAP measure).
2015 | 2014 | 2013 | |||||||||
(Dollars in Millions) | |||||||||||
Net cash provided by operating activities | $ | 1,474 | $ | 2,024 | $ | 1,884 | |||||
Acquisition of property and equipment | (690 | ) | (682 | ) | (643 | ) | |||||
Capital lease and financing obligation payments | (114 | ) | (114 | ) | (115 | ) | |||||
Proceeds from financing obligations | 1 | 6 | 1 | ||||||||
Free cash flow | $ | 671 | $ | 1,234 | $ | 1,127 | |||||
The following table includes our ROI and return on assets (the most comparable GAAP measure) calculations:
2015 | 2014 | 2013 | |||||||||
(Dollars in Millions) | |||||||||||
Operating income | $ | 1,553 | $ | 1,689 | $ | 1,742 | |||||
Depreciation and amortization | 934 | 886 | 889 | ||||||||
Rent expense | 279 | 277 | 270 | ||||||||
EBITDAR | $ | 2,766 | $ | 2,852 | $ | 2,901 | |||||
Average: (a) | |||||||||||
Total assets | $ | 14,288 | $ | 14,286 | $ | 14,196 | |||||
Cash equivalents and long-term investments (b) | (703 | ) | (647 | ) | (382 | ) | |||||
Other assets | (40 | ) | (32 | ) | (46 | ) | |||||
Accumulated depreciation and amortization | 6,203 | 5,743 | 5,457 | ||||||||
Accounts payable | (1,623 | ) | (1,624 | ) | (1,556 | ) | |||||
Accrued liabilities | (1,175 | ) | (1,119 | ) | (1,082 | ) | |||||
Other long-term liabilities | (556 | ) | (551 | ) | (536 | ) | |||||
Capitalized rent (c) | 2,672 | 2,667 | 2,625 | ||||||||
Gross Investment (“AGI”) | $ | 19,066 | $ | 18,723 | $ | 18,676 | |||||
Return on Assets (“ROA”) (d) | 4.7 | % | 6.1 | % | 6.3 | % | |||||
Return on Gross Investment (“ROI”) (e) | 14.5 | % | 15.2 | % | 15.5 | % | |||||
(a) Represents average of 5 most recent quarter end balances
(b) Represents excess cash not required for operations
(c) Represents 10 times store rent and 5 times equipment/other rent
(d) Net income divided by average total assets
(e) EBITDAR divided by Gross Investment
24
The following table includes our debt ratio calculation, as defined by our debt agreements, as of January 30, 2016:
(Dollars in Millions) | |||
Included Indebtedness | |||
Total debt | $ | 4,731 | |
Permitted exclusions | (5 | ) | |
Subtotal | 4,726 | ||
Rent x 8 | 2,232 | ||
Included Indebtedness | $ | 6,958 | |
Adjusted Debt Compliance EBITDAR | |||
Net income | $ | 673 | |
Loss on debt extinguishment | 169 | ||
Rent expense | 279 | ||
Depreciation and amortization | 934 | ||
Net interest | 327 | ||
Provision for income taxes | 384 | ||
EBITDAR | 2,766 | ||
Stock based compensation | 48 | ||
Other non-cash revenues and expenses | 8 | ||
Adjusted Debt Compliance EBITDAR | $ | 2,822 | |
Debt Ratio (a) | 2.47 | ||
Maximum permitted Debt Ratio | 3.75 | ||
(a) Included Indebtedness divided by Adjusted Debt Compliance EBITDAR
The following table includes our Adjusted Debt to EBITDAR and debt/capitalization (a comparable GAAP measure) calculations:
2015 | 2014 | 2013 | |||||||||
(Dollars in Millions) | |||||||||||
Total Debt (net of discount) | $ | 4,726 | $ | 4,761 | $ | 4,861 | |||||
Rent x 8 | 2,232 | 2,216 | 2,160 | ||||||||
Adjusted Debt | $ | 6,958 | $ | 6,977 | $ | 7,021 | |||||
Total Equity | $ | 5,491 | $ | 5,991 | $ | 5,978 | |||||
EBITDAR per above | $ | 2,766 | $ | 2,852 | $ | 2,901 | |||||
Debt/capitalization (a) | 46.3 | % | 44.3 | % | 44.8 | % | |||||
Adjusted Debt to EBITDAR (b) | 2.52 | 2.45 | 2.42 | ||||||||
(a) Total debt divided by total debt and total equity
(b) Adjusted debt divided by EBITDAR
25
Contractual Obligations
Our contractual obligations as of January 30, 2016 were as follows:
Maturing in: | |||||||||||||||||||
Total | 2016 | 2017 and 2018 | 2019 and 2020 | 2021 and after | |||||||||||||||
(Dollars in Millions) | |||||||||||||||||||
Recorded contractual obligations: | |||||||||||||||||||
Long-term debt | $ | 2,815 | $ | — | $ | — | $ | — | $ | 2,815 | |||||||||
Capital lease and financing obligations | 1,460 | 118 | 230 | 197 | 915 | ||||||||||||||
4,275 | 118 | 230 | 197 | 3,730 | |||||||||||||||
Unrecorded contractual obligations: | |||||||||||||||||||
Interest payments: | |||||||||||||||||||
Long-term debt | 1,848 | 132 | 269 | 258 | 1,189 | ||||||||||||||
Capital lease and financing obligations | 2,509 | 175 | 323 | 287 | 1,724 | ||||||||||||||
Operating leases (a) | 5,627 | 244 | 491 | 484 | 4,408 | ||||||||||||||
Purchase obligations (b) | 4,681 | 4,681 | — | — | — | ||||||||||||||
Other (c) | 1,030 | 313 | 291 | 170 | 256 | ||||||||||||||
15,695 | 5,545 | 1,374 | 1,199 | 7,577 | |||||||||||||||
Total | $ | 19,970 | $ | 5,663 | $ | 1,604 | $ | 1,396 | $ | 11,307 | |||||||||
(a) Our leases typically require that we pay real estate taxes, insurance and maintenance costs in addition to the minimum rental payments included in the table above. Such costs vary from period to period and totaled $179 million for 2015 and $175 million for both 2014 and 2013. The lease term includes cancelable option periods where failure to exercise such options would result in an economic penalty.
(b) Purchase obligations consist mainly of purchase orders for merchandise. Amounts committed under open purchase orders for merchandise are cancelable without penalty prior to a date that precedes the vendors’ scheduled shipment date.
(c) Other includes royalties, legally binding minimum lease and interest payments for stores opening in 2016 or later, as well as payments associated with technology and marketing agreements.
We have not included $162 million of long-term liabilities for unrecognized tax benefits and the related interest and penalties in the contractual obligations table because we are not able to reasonably estimate the timing of cash settlements. It is reasonably possible that such tax positions may change within the next 12 months, primarily as a result of ongoing audits. While it is possible that one or more of these audits may be resolved in the next year, it is not anticipated that payment of any such amounts in future periods will materially affect liquidity and cash flows.
Off-Balance Sheet Arrangements
We have not provided any financial guarantees as of year-end 2015.
We have not created, and are not party to, any special-purpose or off-balance sheet entities for the purpose of raising capital, incurring debt or operating our business. We do not have any arrangements or relationships with entities that are not consolidated into the financial statements that are reasonably likely to materially affect our financial condition, liquidity, results of operations or capital resources.
Critical Accounting Policies and Estimates
The preparation of financial statements in conformity with accounting principles generally accepted in the United States requires us to make estimates and assumptions that affect the reported amounts. A discussion of the more significant estimates follows. Management has discussed the development, selection and disclosure of these estimates and assumptions with the Audit Committee of our Board of Directors.
26
Retail Inventory Method and Inventory Valuation
We value our inventory at the lower of cost or market with cost determined on the first-in, first-out (“FIFO”) basis using the retail inventory method (“RIM”). Under RIM, the valuation of inventories at cost and the resulting gross margins are calculated by applying a cost-to-retail ratio to the retail value of the inventories. Inherent in the retail inventory method are certain management estimates that may affect the ending inventory valuation as well as gross margin.
The use of RIM will generally result in inventories being valued at the lower of cost or market as permanent markdowns are taken as a reduction of the retail value of inventories. Management estimates the need for an additional markdown reserve based on a review of historical clearance markdowns, current business trends, expected vendor funding and discontinued merchandise categories.
We also record a reserve for estimated inventory shrink between the last physical inventory count and the balance sheet date. Shrink is the difference between the recorded amount of inventory and the physical inventory. Shrink may occur due to theft, loss, inaccurate records for the receipt of inventory or deterioration of goods, among other things. We generally perform an annual physical inventory count at the majority of our stores and distribution centers. The shrink reserve is based on sales and actual shrink results from previous inventories.
We did not make any material changes in the methodologies used to value our inventory or to estimate the markdown and shrink reserves during 2015, 2014 or 2013. We believe that we have sufficient current and historical knowledge to record reasonable estimates for our inventory reserves. Though historical reserves have approximated actual markdowns and shrink adjustments, it is possible that future results could differ from current recorded reserves.
We routinely record permanent markdowns for potentially obsolete merchandise, and, therefore, did not have a markdown reserve as of January 30, 2016. Changes in the assumptions used to estimate our markdown reserve requirement would not have had a material impact on our financial statements. A 10 basis point change in estimated inventory shrink would also have had an immaterial impact on our financial statements.
Vendor Allowances
We receive allowances from many of our merchandise vendors. These allowances often are reimbursements for markdowns that we have taken in order to sell the merchandise and/or to support the gross margins earned in connection with the sales of merchandise. The allowances generally relate to sold inventory or permanent markdowns and, accordingly, are reflected as reductions to cost of merchandise sold. Allowances related to merchandise that has not yet been sold are recorded in inventory.
We also receive vendor allowances which represent reimbursements of costs (primarily marketing) that we have incurred to promote the vendors’ merchandise. These allowances are netted against marketing or the other related costs as the costs are incurred. Marketing allowances in excess of costs incurred are recorded as a reduction of merchandise costs.
Most of our vendor allowance agreements are supported by signed contracts which are binding, but informal in nature. The terms of these arrangements vary significantly from vendor to vendor and are influenced by, among other things, the type of merchandise to be supported. Vendor allowances will fluctuate based on the amount of promotional and clearance markdowns necessary to liquidate the inventory as well as marketing and other reimbursed costs.
Insurance Reserve Estimates
We use a combination of insurance and self-insurance for a number of risks.
We retain the initial risk of $500,000 per occurrence in workers’ compensation claims and $250,000 per occurrence in general liability claims. We record reserves for workers’ compensation and general liability claims which include the total amounts that we expect to pay for a fully developed loss and related expenses, such as fees paid to attorneys, experts and investigators. The fully developed loss includes amounts for both reported claims and incurred, but not reported losses.
We use a third-party actuary to estimate the liabilities associated with these risks. The actuary considers historical claims experience, demographic and severity factors and actuarial assumptions to estimate the liabilities associated with these risks. As of January 30, 2016, estimated liabilities for workers’ compensation and general liability claims were approximately $45 million.
27
A change in claims frequency and severity of claims from historical experience as well as changes in state statutes and the mix of states in which we operate could result in a change to the required reserve levels. Changes in actuarial assumptions could also have an impact on estimated reserves. Historically, our actuarial estimates have not been materially different from actual results.
We are fully self-insured for employee-related health care benefits, a portion of which is paid by our associates. We use a third-party actuary to estimate the liability for incurred, but not reported, health care claims. This estimate uses historical claims information as well as estimated health care trends. As of January 30, 2016, we had recorded approximately $13 million for medical, pharmacy and dental claims which were incurred in 2015 and expected to be paid in 2016. Historically, our actuarial estimates have not been materially different from actual results.
Impairment of Assets
As of January 30, 2016, our investment in buildings and improvements, before accumulated depreciation, was $10 billion. We review these buildings and improvements for impairment when an event or changes in circumstances, such as decisions to close a store or significant operating losses, indicate the carrying value of the asset may not be recoverable.
For operating stores, a potential impairment has occurred if the fair value of a specific store is less than the net carrying amount of the assets. If required, we would record an impairment loss equal to the amount by which the carrying amount of the asset exceeds its fair value.
Identifying impaired assets and quantifying the related impairment loss, if any, requires significant estimates by management. The most significant of these estimates is the cash flow expected to result from the use and eventual disposition of the asset. When determining the stream of projected future cash flows associated with an individual store, management estimates future store performance including sales growth rates, gross margin and controllable expenses, such as store payroll and occupancy expense. Projected cash flows must be estimated for future periods throughout the remaining life of the property, which may be as many as 40 years in the future. The accuracy of these estimates will be impacted by a number of factors including general economic conditions, changes in competitive landscape and our ability to effectively manage the operations of the store.
We have not historically experienced any significant impairment of long-lived assets. Additionally, impairment of an individual building and related improvements, net of accumulated depreciation, would not generally be material to our financial results.
Income Taxes
We regularly evaluate the likelihood of realizing the benefit for income tax positions we have taken in various federal and state filings by considering all relevant facts, circumstances and information available to us. If we believe it is more likely than not that our position will be sustained, we recognize a benefit at the largest amount which we believe is cumulatively greater than 50% likely to be realized. Our unrecognized tax benefit, excluding accrued interest and penalties, was $139 million as of January 30, 2016.
Unrecognized tax benefits require significant management judgment regarding applicable statutes and their related interpretation, the status of various income tax audits and our particular facts and circumstances. Also, as audits are completed or statutes of limitations lapse, it may be necessary to record adjustments to our taxes payable, deferred tax assets, tax reserves or income tax expense. Although we believe we have adequately reserved for our uncertain tax positions, no assurance can be given that the final tax outcome of these matters will not be different.
Leases
As of January 30, 2016, 750 of our 1,164 retail stores were subject to either a ground or building lease. Accounting for leased properties requires compliance with technical accounting rules and significant judgment by management. Application of these accounting rules and assumptions made by management will determine whether we are considered the owner for accounting purposes or whether the lease is accounted for as a capital or operating lease in accordance with ASC No. 840, “Leases.”
If we are considered the owner for accounting purposes or the lease is considered a capital lease, we record the property and a related financing or capital lease obligation on our balance sheet. The asset is then depreciated over its expected lease term. Rent payments for these properties are recognized as interest expense and a reduction of the financing or capital lease obligation.
28
If the lease is considered an operating lease, it is not recorded on our balance sheet and rent expense is recognized on a straight-line basis over the expected lease term.
The most significant estimates used by management in accounting for property leases and the impact of these estimates are as follows:
• | Expected lease term—Our expected lease term includes both contractual lease periods and cancelable option periods where failure to exercise such options would result in an economic penalty. The expected lease term is used in determining whether the lease is accounted for as an operating lease or a capital lease. A lease is considered a capital lease if the lease term exceeds 75% of the leased asset’s useful life. The expected lease term is also used in determining the depreciable life of the asset or the straight-line rent recognition period. Increasing the expected lease term will increase the probability that a lease will be considered a capital lease and will generally result in higher rent expense for an operating lease and higher interest and depreciation expenses for a leased property recorded on our balance sheet. |
• | Incremental borrowing rate—We estimate our incremental borrowing rate using treasury rates for debt with maturities comparable to the expected lease term and our credit spread. The incremental borrowing rate is primarily used in determining whether the lease is accounted for as an operating lease or a capital lease. A lease is considered a capital lease if the net present value of the lease payments is greater than 90% of the fair market value of the property. Increasing the incremental borrowing rate decreases the net present value of the lease payments and reduces the probability that a lease will be considered a capital lease. For leases which are recorded on our balance sheet with a related capital lease or financing obligation, the incremental borrowing rate is also used in allocating our rental payments between interest expense and a reduction of the outstanding obligation. |
• | Fair market value of leased asset—The fair market value of leased retail property is generally estimated based on comparable market data as provided by third-party appraisers or consideration received from the landlord. Fair market value is used in determining whether the lease is accounted for as an operating lease or a capital lease. A lease is considered a capital lease if the net present value of the lease payments is greater than 90% of the fair market value of the property. Increasing the fair market value reduces the probability that a lease will be considered a capital lease. Fair market value is also used in determining the amount of property and related financing obligation to be recognized on our balance sheet for certain leased properties which are considered owned for accounting purposes. |
Item 7A. Quantitative and Qualitative Disclosures About Market Risk
All of our long-term debt at year-end 2015 is at fixed interest rates and, therefore, is not affected by changes in interest rates. When our long-term debt instruments mature, we may refinance them at then existing market interest rates, which may be more or less than interest rates on the maturing debt.
We share in the net risk-adjusted revenue of the Kohl’s credit card portfolio as defined by the sum of finance charges, late fees and other revenue less write-offs of uncollectible accounts. We also share the costs of funding the outstanding receivables if interest rates were to exceed defined rates. As a result, our share of profits from the credit card portfolio may be negatively impacted by increases in interest rates. The reduced profitability, if any, will be impacted by various factors, including our ability to pass higher funding costs on to the credit card holders and the outstanding receivable balance, and cannot be reasonably estimated at this time.
Item 8. Financial Statements and Supplementary Data
The financial statements are included in this report beginning on page F-3.
Item 9. Changes In and Disagreements with Accountants on Accounting and Financial Disclosures
None
29
Item 9A. Controls and Procedures
(a) Evaluation of Disclosure Controls and Procedures
Under the supervision and with the participation of our management, including our Chief Executive Officer and Chief Financial Officer, we carried out an evaluation of the effectiveness of the design and operation of our disclosure controls and procedures (the “Evaluation”) at a reasonable assurance level as of the last day of the period covered by this Report.
Based upon the Evaluation, our Chief Executive Officer and Chief Financial Officer have concluded that our disclosure controls and procedures are effective at the reasonable assurance level. "Disclosure controls and procedures" is defined by Rule 13a-15(e) of the Securities Exchange Act of 1934 (the "Exchange Act") as controls and other procedures that are designed to ensure that information required to be disclosed in the reports that we file or submit under the Exchange Act is recorded, processed, summarized and reported within the time periods specified by the SEC's rules and forms. Disclosure controls and procedures include, without limitation, controls and procedures designed to ensure that information required to be disclosed in the reports that we file or submit under the Exchange Act is accumulated and communicated to our management, including our Chief Executive Officer and Chief Financial Officer, to allow timely decisions regarding required disclosures.
It should be noted that the design of any system of controls is based in part upon certain assumptions about the likelihood of future events, and there can be no assurance that any design will succeed in achieving our stated goals under all potential future conditions, regardless of how remote.
(b) Management’s Annual Report on Internal Control over Financial Reporting
Our management is responsible for establishing and maintaining adequate internal control over financial reporting. Our internal control system was designed to provide reasonable assurance to our management and Board of Directors regarding the preparation and fair presentation of our published financial statements.
All internal control systems, no matter how well designed, have inherent limitations. Therefore, even those systems determined to be effective can provide only reasonable assurance with respect to financial statement preparation and presentation.
Our management assessed the effectiveness of our internal control over financing reporting as of January 30, 2016. In making this assessment, management used the criteria set forth by the Committee of Sponsoring Organizations of the Treadway Commission (“COSO”) in Internal Control—Integrated Framework (2013 Framework). Based on this assessment, our management has concluded that as of January 30, 2016, our internal control over financial reporting was effective based on those criteria.
Ernst & Young LLP, an independent registered public accounting firm, has audited the Consolidated Financial Statements included in this Annual Report on Form 10-K and, as part of its audit, has issued an attestation report, included herein, on the effectiveness of our internal control over financial reporting.
(c) Changes in Internal Control Over Financial Reporting
During the last fiscal quarter, there were no changes in our internal controls that have materially affected or are reasonably likely to materially affect such controls, including any corrective actions with regard to significant deficiencies and material weaknesses.
30
Report of Independent Registered Public Accounting Firm
The Board of Directors and Shareholders of Kohl's Corporation
We have audited Kohl’s Corporation’s internal control over financial reporting as of January 30, 2016, based on criteria established in Internal Control-Integrated Framework issued by the Committee of Sponsoring Organizations of the Treadway Commission (2013 Framework) (the COSO criteria). Kohl’s Corporation’s management is responsible for maintaining effective internal control over financial reporting, and for its assessment of the effectiveness of internal control over financial reporting included in the accompanying Management’s Annual Report on Internal Control over Financial Reporting. Our responsibility is to express an opinion on the company’s internal control over financial reporting based on our audit.
We conducted our audit in accordance with the standards of the Public Company Accounting Oversight Board (United States). Those standards require that we plan and perform the audit to obtain reasonable assurance about whether effective internal control over financial reporting was maintained in all material respects. Our audit included obtaining an understanding of internal control over financial reporting, assessing the risk that a material weakness exists, testing and evaluating the design and operating effectiveness of internal control based on the assessed risk, and performing such other procedures as we considered necessary in the circumstances. We believe that our audit provides a reasonable basis for our opinion.
A company’s internal control over financial reporting is a process designed to provide reasonable assurance regarding the reliability of financial reporting and the preparation of financial statements for external purposes in accordance with generally accepted accounting principles. A company’s internal control over financial reporting includes those policies and procedures that (1) pertain to the maintenance of records that, in reasonable detail, accurately and fairly reflect the transactions and dispositions of the assets of the company; (2) provide reasonable assurance that transactions are recorded as necessary to permit preparation of financial statements in accordance with generally accepted accounting principles, and that receipts and expenditures of the company are being made only in accordance with authorizations of management and directors of the company; and (3) provide reasonable assurance regarding prevention or timely detection of unauthorized acquisition, use, or disposition of the company’s assets that could have a material effect on the financial statements.
Because of its inherent limitations, internal control over financial reporting may not prevent or detect misstatements. Also, projections of any evaluation of effectiveness to future periods are subject to the risk that controls may become inadequate because of changes in conditions, or that the degree of compliance with the policies or procedures may deteriorate.
In our opinion, Kohl’s Corporation maintained, in all material respects, effective internal control over financial reporting as of January 30, 2016, based on the COSO criteria.
We also have audited, in accordance with the standards of the Public Company Accounting Oversight Board (United States), the consolidated balance sheets of Kohl’s Corporation as of January 30, 2016 and January 31, 2015, and the related consolidated statements of income, comprehensive income, changes in shareholders’ equity, and cash flows for each of the three years in the period ended January 30, 2016 of Kohl’s Corporation and our report dated March 18, 2016 expressed an unqualified opinion thereon.
/s/ Ernst & Young LLP
Milwaukee, Wisconsin
March 18, 2016
31
Item 9B. Other Information
None
PART III
Item 10. Directors, Executive Officers and Corporate Governance
For information with respect to our Directors, the Board of Directors’ committees and our written code of ethics, see the applicable portions of the “Questions and Answers About our Board of Directors and Corporate Governance Matters” and “Item One: Election of Directors” sections of the Proxy Statement for our May 11, 2016 Annual Meeting of Shareholders (“our 2016 Proxy”), which information is incorporated herein by reference. For information with respect to Section 16 reports, see the information provided in the “Section 16(a) Beneficial Ownership Reporting Compliance” section of our 2016 Proxy, which information is incorporated herein by reference.
Our executive officers as of January 30, 2016 were as follows:
Name | Age | Position | |
Kevin Mansell | 63 | Chairman, Chief Executive Officer and President | |
Sona Chawla | 48 | Chief Operating Officer | |
Michelle Gass | 47 | Chief Merchandising and Customer Officer | |
Wesley S. McDonald | 53 | Chief Financial Officer | |
Richard D. Schepp | 55 | Chief Administrative Officer | |
Mr. Mansell is responsible for Kohl’s strategic direction, long-term growth and profitability. He has served as Chairman since September 2009, Chief Executive Officer since August 2008 and President and Director since February 1999. Mr. Mansell began his retail career in 1975.
Ms. Chawla joined Kohl's in November 2015 as Chief Operating Officer and is responsible for Kohl's full omni-channel operations. She oversees all store operations, logistics and supply chain network, information and digital technology, omni-channel strategy, planning and operations, and store construction and design. Previously, she had served with Walgreens as President of Digital and Chief Marketing Officer from February 2014 to November 2015 and President, E-commerce from January 2011 to February 2014. From August 2012 to November 2015, she served as a director of Express Inc., a specialty retail apparel chain. Ms. Chawla began her retail and digital career in 2000.
Ms. Gass joined Kohl's in June 2013 as Chief Customer Officer and was named Chief Merchandising and Customer Officer in June 2015. She is responsible for all of Kohl's merchandising, planning and allocation, and product development functions as well as the company's overall customer engagement strategy, including marketing, public relations, social media and philanthropic efforts. Previously, she had served as President, Starbucks Europe, Middle East and Africa. Ms. Gass began her retail career in 1991. She is currently a director of Cigna Corporation, a global health service company.
Mr. McDonald was promoted to the principal officer position of Chief Financial Officer in June 2015 and is responsible for financial planning and analysis, investor relations, financial reporting, accounting operations, tax, treasury, non-merchandise purchasing, credit and capital investment. Previously, he had served as Senior Executive Vice President, Chief Financial Officer since December 2010. Mr. McDonald began his retail career in 1988.
Mr. Schepp was promoted to the principal officer position of Chief Administrative Officer in June 2015 and is responsible for Kohl's human resources, legal, risk management and compliance, real estate and business development functions. He previously served as Senior Executive Vice President, Human Resources, General Counsel and Secretary from April 2013 to June 2015, Senior Executive Vice President General Counsel and Secretary from May 2011 to April 2013 and Executive Vice President, General Counsel and Secretary from August 2001 to May 2011. Mr. Schepp began his retail career in 1992.
32
Members of our Board of Directors as of January 30, 2016 were as follows:
Kevin Mansell Chairman, President, Chief Executive Officer, Kohl’s Corporation | |
Peter Boneparth (b) (c) Former Senior Advisor, Irving Place Capital Partners Former President and Chief Executive Officer, Jones Apparel Group | |
Steven A. Burd (b) (c) Founder and Chief Executive Officer, Burd Health LLC Former Chairman, Chief Executive Officer and President, Safeway Inc. | |
Dale E. Jones (b) (c) Chief Executive Officer and President, Diversified Search | |
Jonas Prising (c) Chairman and Chief Executive Officer, ManpowerGroup | |
John E. Schlifske (a) (c) Chairman and Chief Executive Officer, Northwestern Mutual Life Insurance Company |
Frank V. Sica (b)* (c) Managing Partner, Tailwind Capital |
Stephanie A. Streeter (a) (c)* Former Chief Executive Officer and Director, Libbey, Inc. |
Nina G. Vaca (a) (c) Chairman and Chief Executive Officer, Pinnacle Technical Resources, Inc. |
Stephen E. Watson (a)* (c) Former President, Chief Executive Officer, Gander Mountain, L.L.C. Former Chairman, Chief Executive Officer, and President, Department Store Division, Dayton-Hudson Corporation |
(a) Audit Committee member
(b) Compensation Committee member
(c) Governance & Nominating Committee member
* Denotes Chair
Item 11. Executive Compensation
See the information provided in the applicable portions of the “Questions and Answers About our Board of Directors and Corporate Governance Matters” and “Item One: Election of Directors” sections of our 2016 Proxy, including the "Compensation Committee Report" and "Compensation Discussion & Analysis", which information is incorporated herein by reference.
Item 12. Security Ownership of Certain Beneficial Owners and Management and Related Stockholder Matters
See the information provided in the “Security Ownership of Certain Beneficial Owners, Directors and Management” and “Equity Compensation Plan Information” sections of our 2016 Proxy, which information is incorporated herein by reference.
Item 13. Certain Relationships and Related Transactions, and Director Independence
See the information provided in the “Independence Determinations & Related Person Transactions” section of our 2016 Proxy, which information is incorporated herein by reference.
Item 14. Principal Accountant Fees and Services
See the information provided in the “Fees Paid to Ernst & Young” section of our 2016 Proxy, which information is incorporated herein by reference.
33
PART IV
Item 15. Exhibits and Financial Statement Schedules
(a) Documents filed as part of this report:
1. Consolidated Financial Statements:
See “Index to Consolidated Financial Statements” on page F-1, the Report of Independent Registered Public Accounting Firm on page F-2 and the Consolidated Financial Statements beginning on page F-3, all of which are incorporated herein by reference.
2. Financial Statement Schedule:
All schedules have been omitted as they are not applicable.
3. Exhibits:
See “Exhibit Index” of this Form 10-K, which is incorporated herein by reference.
34
Signatures
Pursuant to the requirements of Section 13 or 15 (d) of the Securities Exchange Act of 1934, the Registrant has duly caused this report to be signed on its behalf by the undersigned, thereunto duly authorized.
Kohl’s Corporation | ||
By: | /S/ KEVIN MANSELL | |
Kevin Mansell | ||
Chairman, Chief Executive Officer, President and Director | ||
(Principal Executive Officer) | ||
/S/ WESLEY S. MCDONALD | ||
Wesley S. McDonald | ||
Chief Financial Officer | ||
(Principal Financial and Accounting Officer) | ||
Dated: March 18, 2016
Pursuant to the requirements of the Securities Exchange Act of 1934, this report has been signed below by the following persons on behalf of the Registrant and in the capacities and on the date indicated above:
/S/ KEVIN MANSELL Kevin Mansell Chairman, President, Chief Executive Officer and Director (Principal Executive Officer) | ||
/S/ PETER BONEPARTH Peter Boneparth Director | /S/ JONAS PRISING Jonas Prising Director | |
/S/ STEVEN A. BURD Steven A. Burd Director | /S/ STEPHANIE A. STREETER Stephanie A. Streeter Director | |
/S/ DALE E. JONES Dale E. Jones Director | /S/ NINA G. VACA Nina G. Vaca Director | |
/S/ JOHN E. SCHLIFSKE John E. Schlifske Director | /S/ STEPHEN E. WATSON Stephen E. Watson Director | |
/S/ FRANK V. SICA Frank V. Sica Director | ||
35
Exhibit Index
Exhibit Number | Description | |
3.1 | Amended and Restated Articles of Incorporation of the Company, incorporated herein by reference to Exhibit 3.1 of the Company’s Current Report on Form 8-K filed on May 16, 2011. | |
3.2 | Amended and Restated Bylaws of the Company, incorporated herein by reference to Exhibit 3.1 of the Company’s Current Report on Form 8-K filed on November 13, 2015. | |
4.1 | Amended and Restated Credit Agreement dated as of July 1, 2015 by and among the Company, the Lenders party thereto, Bank of America, N.A., as Administrative Agent, an Issuing Bank and a Swing Line Lender, U.S. Bank National Association and Wells Fargo Bank, National Association, as Issuing Banks, Swing Line Lenders and Syndication Agents, Morgan Stanley Senior Funding, Inc., as Documentation Agent, and Merrill Lynch, Pierce, Fenner & Smith Incorporated, U.S. Bank National Association and Wells Fargo Securities, LLC, as Joint Lead Arrangers and Bookrunners, incorporated by reference to Exhibit 4.1 of the Company's Current Report on Form 8-K filed on July 2, 2015. | |
4.2 | Certain other long-term debt is described in Note 2 of the Notes to Consolidated Financial Statements. The Company agrees to furnish to the Commission, upon request, copies of any instruments defining the rights of holders of any such long-term debt described in Note 2 and not filed herewith. | |
10.1(a) | Private Label Credit Card Program Agreement dated as of August 11, 2010 by and between Kohl’s Department Stores, Inc. and Capital One, National Association, incorporated herein by reference to Exhibit 10.1 of the Company’s Quarterly Report on Form 10-Q for the fiscal quarter ended July 31, 2010. | |
10.1(b) | Amendment to Private Label Credit Card Program Agreement dated as of May 13, 2014 by and between Kohl's Department Stores, Inc. and Capital One, National Association, incorporated herein by reference to Exhibit 10.2 of the Company's Quarterly Report on Form 10-Q for the fiscal quarter ended May 3, 2014. | |
10.2 | Amended and Restated Executive Deferred Compensation Plan, incorporated herein by reference to Exhibit 10.1 of the Company’s Annual Report on Form 10-K for the fiscal year ended February 1, 2003.* | |
10.3 | Kohl’s Corporation 2005 Deferred Compensation Plan, as amended and restated effective January 1, 2005, incorporated herein by reference to Exhibit 10.4 of the Company’s Annual Report on Form 10-K for the fiscal year ended January 28, 2006.* | |
10.4 | Summary of Executive Medical Plan, incorporated herein by reference to Exhibit 10.6 of the Company’s Annual Report on Form 10-K for the fiscal year ended January 29, 2005.* | |
10.5 | Summary of Executive Life and Accidental Death and Dismemberment Plans, incorporated herein by reference to Exhibit 10.7 of the Company’s Annual Report on Form 10-K for the fiscal year ended January 29, 2005.* | |
10.6 | Kohl’s Corporation Annual Incentive Plan, incorporated herein by reference to Annex B to the Proxy Statement on Schedule 14A filed on March 21, 2011 in connection with the Company’s 2011 Annual Meeting of Shareholders.* | |
10.7 | 1994 Long-Term Compensation Plan, incorporated herein by reference to Exhibit 10.15 of the Company’s Quarterly Report on Form 10-Q for the fiscal quarter ended May 4, 1996.* | |
10.8 | 1997 Stock Option Plan for Outside Directors, incorporated herein by reference to Exhibit 4.4 of the Company’s registration statement on Form S-8 (File No. 333-26409), filed on May 2, 1997.* | |
10.9 | Amended and Restated 2003 Long-Term Compensation Plan, incorporated herein by reference to the Company’s Quarterly Report on Form 10-Q for the fiscal quarter ended August 2, 2008.* | |
36
Exhibit Number | Description | |
10.10 | Kohl’s Corporation 2010 Long Term Compensation Plan, incorporated herein by reference to Annex A to the Proxy Statement on Schedule 14A filed on March 26, 2010 in connection with the Company’s 2010 Annual Meeting.* | |
10.11 | Form of Executive Performance Share Agreement pursuant to the Kohl’s Corporation 2010 Long Term Compensation Plan, incorporated herein by reference to Exhibit 99.1 of the Company’s Current Report on Form 8-K filed on January 15, 2014.* | |
10.12 | Form of Executive Stock Option Agreement pursuant to the Kohl's Corporation 2010 Long Term Compensation Plan, incorporated herein by reference to Exhibit 10.1 of the Company's Quarterly Report on Form 10-Q for the fiscal quarter ended May 1, 2010.* | |
10.13(a) | Form of Executive Restricted Stock Agreement pursuant to the Kohl’s Corporation 2010 Long Term Compensation Plan (5-year vesting), incorporated herein by reference to Exhibit 10.2 of the Company’s Quarterly Report on Form 10-Q for the fiscal quarter ended May 1, 2010.* | |
10.13(b) | Form of Executive Restricted Stock Agreement pursuant to the Kohl’s Corporation 2010 Long Term Compensation Plan (4-year vesting), incorporated herein by reference to Exhibit 99.2 of the Company’s Current Report on Form 8-K filed on January 15, 2014.* | |
10.13(c) | Form of Executive Restricted Stock Agreement pursuant to the Kohl’s Corporation 2010 Long Term Compensation Plan (2-year vesting), incorporated herein by reference to Exhibit 10.4 of the Company’s Quarterly Report on Form 10-Q for the fiscal quarter ended May 3, 2014.* | |
10.14 | Form of Outside Director Stock Option Agreement pursuant to the Kohl’s Corporation 2010 Long Term Compensation Plan, incorporated herein by reference to Exhibit 10.3 of the Company’s Quarterly Report on Form 10-Q for the fiscal quarter ended May 1, 2010.* | |
10.15 | Form of Outside Director Restricted Stock Agreement pursuant to the Kohl’s Corporation 2010 Long Term Compensation Plan, incorporated herein by reference to Exhibit 10.4 of the Company’s Quarterly Report on Form 10-Q for the fiscal quarter ended May 1, 2010.* | |
10.16 | Summary of Outside Director Compensation.* | |
10.17 | Amended and Restated Employment Agreement between Kohl’s Corporation and Kohl’s Department Stores, Inc. and Kevin Mansell dated as of November 14, 2014, incorporated herein by reference to Exhibit 99.1 of the Company’s Current Report on Form 8-K filed on November 14, 2014.* | |
10.18 | Amended and Restated Employment Agreement between Kohl’s Department Stores, Inc. and Kohl’s Corporation and Michelle Gass effective as of June 10, 2015, incorporated by reference to Exhibit 10.1 of the Company's Current Report on Form 8-K filed on June 12, 2015.* | |
10.19 | Amended and Restated Employment Agreement between Kohl’s Department Stores, Inc. and Kohl’s Corporation and Wesley S. McDonald effective as of June 10, 2015, incorporated by reference to Exhibit 10.2 of the Company's Current Report on Form 8-K filed on June 12, 2015.* | |
10.20 | Amended and Restated Employment Agreement between Kohl’s Department Stores, Inc. and Kohl’s Corporation and Richard D. Schepp effective as of June 10, 2015, incorporated by reference to Exhibit 10.3 of the Company's Current Report on Form 8-K filed on June 12, 2015.* | |
10.21(a) | Amended and Restated Employment Agreement dated as of April 1, 2012 by and between Kohl's Corporation and Kohl's Department Stores, Inc. and Kenneth G. Bonning, incorporated by reference to Exhibit 10.22 of the Company's Annual Report on Form 10-K for the fiscal year ended January 31, 2015.* | |
37
Exhibit Number | Description | |
10.21(b) | Agreement dated as of April 17, 2015 by and between Ken Bonning and Kohl's Department Stores Inc. incorporated by reference to Exhibit 10.1 of the Company's Quarterly Report on Form 10-Q for the fiscal quarter ended May 2, 2015.* | |
10.22 | Employment Agreement dated as of November 16, 2015 by and between Kohl's Department Stores, Inc., Kohl's Corporation and Sona Chawla.* | |
12.1 | Ratio of Earnings to Fixed Charges. | |
21.1 | Subsidiaries of the Registrant, incorporated by reference to Exhibit 21.1 of the Company's Annual Report on Form 10-K for the fiscal year ended January 31, 2015. | |
23.1 | Consent of Ernst & Young LLP. | |
31.1 | Certification of the Chief Executive Officer pursuant to Section 302 of the Sarbanes-Oxley Act of 2002. | |
31.2 | Certification of the Chief Financial Officer pursuant to Section 302 of the Sarbanes-Oxley Act of 2002. | |
32.1 | Certification of the Chief Executive Officer pursuant to 18 U.S.C. Section 1350, as adopted pursuant to Section 906 of the Sarbanes-Oxley Act of 2002. | |
32.2 | Certification of the Chief Financial Officer pursuant to 18 U.S.C. Section 1350, as adopted pursuant to Section 906 of the Sarbanes-Oxley Act of 2002. | |
101.INS | XBRL Instance Document | |
101.SCH | XBRL Taxonomy Extension Schema | |
101.CAL | XBRL Taxonomy Extension Calculation Linkbase | |
101.DEF | XBRL Taxonomy Extension Definition Linkbase | |
101.LAB | XBRL Taxonomy Extension Label Linkbase | |
101.PRE | XBRL Taxonomy Extension Presentation Linkbase | |
* | A management contract or compensatory plan or arrangement. | |
38
Index to Consolidated Financial Statements
Page | |
Consolidated Financial Statements | |
F-2 | |
F-3 | |
F-4 | |
F-4 | |
F-5 | |
F-6 | |
F-7 | |
F-7 | |
F-14 | |
F-15 | |
F-15 | |
F-16 | |
F-17 | |
F-20 | |
F-20 | |
F-20 | |
Schedules have been omitted as they are not applicable.
F-1
Report of Independent Registered Public Accounting Firm
The Board of Directors and Shareholders of Kohl's Corporation
We have audited the accompanying consolidated balance sheets of Kohl’s Corporation (the Company) as of January 30, 2016 and January 31, 2015, and the related consolidated statements of income, comprehensive income, changes in shareholders’ equity, and cash flows for each of the three years in the period ended January 30, 2016. These financial statements are the responsibility of the Company’s management. Our responsibility is to express an opinion on these financial statements based on our audits.
We conducted our audits in accordance with the standards of the Public Company Accounting Oversight Board (United States). Those standards require that we plan and perform the audit to obtain reasonable assurance about whether the financial statements are free of material misstatement. An audit includes examining, on a test basis, evidence supporting the amounts and disclosures in the financial statements. An audit also includes assessing the accounting principles used and significant estimates made by management, as well as evaluating the overall financial statement presentation. We believe that our audits provide a reasonable basis for our opinion.
In our opinion, the financial statements referred to above present fairly, in all material respects, the consolidated financial position of Kohl’s Corporation at January 30, 2016 and January 31, 2015, and the consolidated results of its operations and its cash flows for each of the three years in the period ended January 30, 2016, in conformity with U.S. generally accepted accounting principles.
We also have audited, in accordance with the standards of the Public Company Accounting Oversight Board (United States), Kohl’s Corporation’s internal control over financial reporting as of January 30, 2016, based on criteria established in Internal Control-Integrated Framework issued by the Committee of Sponsoring Organizations of the Treadway Commission (2013 Framework) and our report dated March 18, 2016 expressed an unqualified opinion thereon.
/s/ Ernst & Young LLP
Milwaukee, Wisconsin
March 18, 2016
F-2
KOHL’S CORPORATION
CONSOLIDATED BALANCE SHEETS
(Dollars in Millions)
January 30, 2016 | January 31, 2015 | ||||||
Assets | |||||||
Current assets: | |||||||
Cash and cash equivalents | $ | 707 | $ | 1,407 | |||
Merchandise inventories | 4,038 | 3,814 | |||||
Other | 331 | 359 | |||||
Total current assets | 5,076 | 5,580 | |||||
Property and equipment, net | 8,308 | 8,515 | |||||
Other assets | 222 | 238 | |||||
Total assets | $ | 13,606 | $ | 14,333 | |||
Liabilities and Shareholders’ Equity | |||||||
Current liabilities: | |||||||
Accounts payable | $ | 1,251 | $ | 1,511 | |||
Accrued liabilities | 1,206 | 1,160 | |||||
Income taxes payable | 130 | 78 | |||||
Current portion of capital lease and financing obligations | 127 | 110 | |||||
Total current liabilities | 2,714 | 2,859 | |||||
Long-term debt | 2,792 | 2,780 | |||||
Capital lease and financing obligations | 1,789 | 1,858 | |||||
Deferred income taxes | 257 | 298 | |||||
Other long-term liabilities | 563 | 547 | |||||
Shareholders’ equity: | |||||||
Common stock - 370 and 367 million shares issued | 4 | 4 | |||||
Paid-in capital | 2,944 | 2,743 | |||||
Treasury stock, at cost, 184 and 166 million shares | (9,769 | ) | (8,744 | ) | |||
Accumulated other comprehensive loss | (17 | ) | (20 | ) | |||
Retained earnings | 12,329 | 12,008 | |||||
Total shareholders’ equity | 5,491 | 5,991 | |||||
Total liabilities and shareholders’ equity | $ | 13,606 | $ | 14,333 | |||
See accompanying Notes to Consolidated Financial Statements
F-3
KOHL’S CORPORATION
CONSOLIDATED STATEMENTS OF INCOME
(Dollars in Millions, Except per Share Data)
2015 | 2014 | 2013 | |||||||||
Net sales | $ | 19,204 | $ | 19,023 | $ | 19,031 | |||||
Cost of merchandise sold | 12,265 | 12,098 | 12,087 | ||||||||
Gross margin | 6,939 | 6,925 | 6,944 | ||||||||
Operating expenses: | |||||||||||
Selling, general and administrative | 4,452 | 4,350 | 4,313 | ||||||||
Depreciation and amortization | 934 | 886 | 889 | ||||||||
Operating income | 1,553 | 1,689 | 1,742 | ||||||||
Interest expense, net | 327 | 340 | 338 | ||||||||
Loss on extinguishment of debt | 169 | — | — | ||||||||
Income before income taxes | 1,057 | 1,349 | 1,404 | ||||||||
Provision for income taxes | 384 | 482 | 515 | ||||||||
Net income | $ | 673 | $ | 867 | $ | 889 | |||||
Net income per share: | |||||||||||
Basic | $ | 3.48 | $ | 4.28 | $ | 4.08 | |||||
Diluted | $ | 3.46 | $ | 4.24 | $ | 4.05 | |||||
Dividends declared and paid per share | $ | 1.80 | $ | 1.56 | $ | 1.40 | |||||
See accompanying Notes to Consolidated Financial Statements
KOHL’S CORPORATION
CONSOLIDATED STATEMENTS OF COMPREHENSIVE INCOME
(Dollars in Millions)
2015 | 2014 | 2013 | |||||||||
Net income | $ | 673 | $ | 867 | $ | 889 | |||||
Other comprehensive income, net of tax: | |||||||||||
Reclassification adjustment for interest expense on interest rate derivatives included in net income | 3 | 3 | 3 | ||||||||
Unrealized gains on investments | — | 11 | 8 | ||||||||
Other comprehensive income | 3 | 14 | 11 | ||||||||
Comprehensive income | $ | 676 | $ | 881 | $ | 900 | |||||
See accompanying Notes to Consolidated Financial Statements
F-4
KOHL’S CORPORATION
CONSOLIDATED STATEMENTS OF CHANGES IN SHAREHOLDERS’ EQUITY
(Dollars in Millions, Except per Share Data)
Common Stock | Paid-In | Treasury Stock | Accumulated Other Comprehensive | Retained | |||||||||||||||||||||||||||
Shares | Amount | Capital | Shares | Amount | Loss | Earnings | Total | ||||||||||||||||||||||||
Balance at February 2, 2013 | 360 | $ | 4 | $ | 2,454 | (138 | ) | $ | (7,243 | ) | $ | (45 | ) | $ | 10,878 | $ | 6,048 | ||||||||||||||
Comprehensive income | — | — | — | — | — | 11 | 889 | 900 | |||||||||||||||||||||||
Stock options and awards, net of tax | 4 | — | 144 | — | (13 | ) | — | — | 131 | ||||||||||||||||||||||
Dividends paid ($1.40 per common share) | — | — | — | — | 3 | — | (305 | ) | (302 | ) | |||||||||||||||||||||
Treasury stock purchases | — | — | — | (15 | ) | (799 | ) | — | — | (799 | ) | ||||||||||||||||||||
Balance at February 1, 2014 | 364 | 4 | 2,598 | (153 | ) | (8,052 | ) | (34 | ) | 11,462 | 5,978 | ||||||||||||||||||||
Comprehensive income | — | — | — | — | — | 14 | 867 | 881 | |||||||||||||||||||||||
Stock options and awards, net of tax | 3 | — | 145 | (1 | ) | (19 | ) | — | — | 126 | |||||||||||||||||||||
Dividends paid ($1.56 per common share) | — | — | — | — | 4 | — | (321 | ) | (317 | ) | |||||||||||||||||||||
Treasury stock purchases | — | — | — | (12 | ) | (677 | ) | — | — | (677 | ) | ||||||||||||||||||||
Balance at January 31, 2015 | 367 | 4 | 2,743 | (166 | ) | (8,744 | ) | (20 | ) | 12,008 | 5,991 | ||||||||||||||||||||
Comprehensive income | — | — | — | — | — | 3 | 673 | 676 | |||||||||||||||||||||||
Stock options and awards, net of tax | 3 | — | 201 | (1 | ) | (27 | ) | — | — | 174 | |||||||||||||||||||||
Dividends paid ($1.80 per common share) | — | — | — | — | 3 | — | (352 | ) | (349 | ) | |||||||||||||||||||||
Treasury stock purchases | — | — | — | (17 | ) | (1,001 | ) | — | — | (1,001 | ) | ||||||||||||||||||||
Balance at January 30, 2016 | 370 | $ | 4 | $ | 2,944 | (184 | ) | $ | (9,769 | ) | $ | (17 | ) | $ | 12,329 | $ | 5,491 | ||||||||||||||
See accompanying Notes to Consolidated Financial Statements
F-5
KOHL’S CORPORATION
CONSOLIDATED STATEMENTS OF CASH FLOWS
(Dollars in Millions)
2015 | 2014 | 2013 | |||||||||
Operating activities | |||||||||||
Net income | $ | 673 | $ | 867 | $ | 889 | |||||
Adjustments to reconcile net income to net cash provided by operating activities: | |||||||||||
Depreciation and amortization | 934 | 886 | 889 | ||||||||
Share-based compensation | 48 | 48 | 55 | ||||||||
Excess tax benefits from share-based compensation | (10 | ) | (3 | ) | (3 | ) | |||||
Deferred income taxes | (38 | ) | 49 | (4 | ) | ||||||
Other non-cash expenses, net | 24 | 31 | 43 | ||||||||
Loss on extinguishment of debt | 169 | — | — | ||||||||
Changes in operating assets and liabilities: | |||||||||||
Merchandise inventories | (215 | ) | 68 | (116 | ) | ||||||
Other current and long-term assets | 43 | (30 | ) | (7 | ) | ||||||
Accounts payable | (260 | ) | 146 | 58 | |||||||
Accrued and other long-term liabilities | 53 | 30 | 142 | ||||||||
Income taxes | 53 | (68 | ) | (62 | ) | ||||||
Net cash provided by operating activities | 1,474 | 2,024 | 1,884 | ||||||||
Investing activities | |||||||||||
Acquisition of property and equipment | (690 | ) | (682 | ) | (643 | ) | |||||
Sales of investments in auction rate securities | — | 82 | 1 | ||||||||
Other | 9 | 7 | 19 | ||||||||
Net cash used in investing activities | (681 | ) | (593 | ) | (623 | ) | |||||
Financing activities | |||||||||||
Treasury stock purchases | (1,001 | ) | (677 | ) | (799 | ) | |||||
Shares withheld for taxes on vested restricted shares | (27 | ) | (19 | ) | (13 | ) | |||||
Dividends paid | (349 | ) | (317 | ) | (302 | ) | |||||
Proceeds from issuance of debt | 1,098 | — | 300 | ||||||||
Deferred financing costs | (10 | ) | — | (4 | ) | ||||||
Reduction of long-term borrowings | (1,085 | ) | — | — | |||||||
Premium paid on redemption of debt | (163 | ) | — | — | |||||||
Capital lease and financing obligation payments | (114 | ) | (114 | ) | (115 | ) | |||||
Proceeds from stock option exercises | 147 | 123 | 102 | ||||||||
Excess tax benefits from share-based compensation | 10 | 3 | 3 | ||||||||
Proceeds from financing obligations | 1 | 6 | 1 | ||||||||
Net cash used in financing activities | (1,493 | ) | (995 | ) | (827 | ) | |||||
Net (decrease) increase in cash and cash equivalents | (700 | ) | 436 | 434 | |||||||
Cash and cash equivalents at beginning of period | 1,407 | 971 | 537 | ||||||||
Cash and cash equivalents at end of period | $ | 707 | $ | 1,407 | $ | 971 | |||||
Supplemental information: | |||||||||||
Interest paid, net of capitalized interest | $ | 318 | $ | 329 | $ | 326 | |||||
Income taxes paid | 372 | 502 | 561 | ||||||||
Non-Cash Investing and Financing Activities | |||||||||||
Property and equipment acquired through capital lease and financing obligations | $ | 63 | $ | 41 | $ | 121 | |||||
See accompanying Notes to Consolidated Financial Statements
F-6
1. Business and Summary of Accounting Policies
Business
As of January 30, 2016, we operated 1,164 department stores in 49 states and a website (www.Kohls.com) that sell moderately-priced private label, exclusive and national brand apparel, footwear, accessories, beauty and home products. Our stores generally carry consistent merchandise with assortment differences attributable to local preferences. Our website includes merchandise which is available in our stores, as well as merchandise which is available only on-line.
Our authorized capital stock consists of 800 million shares of $0.01 par value common stock and 10 million shares of $0.01 par value preferred stock.
Consolidation
The consolidated financial statements include the accounts of Kohl’s Corporation and its subsidiaries including Kohl’s Department Stores, Inc., its primary operating company. All intercompany accounts and transactions have been eliminated.
Accounting Period
Our fiscal year ends on the Saturday closest to January 31st each year. Unless otherwise stated, references to years in this report relate to fiscal years rather than to calendar years. The following fiscal periods are presented in this report.
Fiscal year | Ended | Number of Weeks | |
2015 | January 30, 2016 | 52 | |
2014 | January 31, 2015 | 52 | |
2013 | February 1, 2014 | 52 | |
Use of Estimates
The preparation of consolidated financial statements in conformity with accounting principles generally accepted in the United States requires management to make estimates and assumptions that affect the amounts reported in the consolidated financial statements and accompanying notes. Actual results could differ from those estimates.
Cash and Cash Equivalents
In addition to money market investments, cash equivalents include commercial paper and certificates of deposit with original maturities of three months or less. We carry these investments at cost which approximates fair value.
Also included in cash and cash equivalents are amounts due from credit card transactions with settlement terms of less than five days. Credit and debit card receivables included within cash were $92 million at January 30, 2016 and $95 million at January 31, 2015.
Merchandise Inventories
Merchandise inventories are valued at the lower of cost or market with cost determined on the first-in, first-out (“FIFO”) basis using the retail inventory method (“RIM”). Under RIM, the valuation of inventory at cost and the resulting gross margins are calculated by applying a cost-to-retail ratio to the retail value inventory. RIM is an averaging method that has been widely used in the retail industry due to its practicality. The use of RIM will result in inventory being valued at the lower of cost or market since permanent markdowns are currently taken as a reduction of the retail value of inventory. We would record an additional reserve if the future estimated selling price is less than cost.
F-7
1. Business and Summary of Accounting Policies (continued)
Property and Equipment
Property and equipment consist of the following:
Jan 30, 2016 | Jan 31, 2015 | ||||||
(Dollars in Millions) | |||||||
Land | $ | 1,110 | $ | 1,103 | |||
Buildings and improvements: | |||||||
Owned | 7,999 | 7,844 | |||||
Leased | 1,848 | 1,848 | |||||
Fixtures and equipment | 1,804 | 2,032 | |||||
Computer hardware and software | 1,590 | 1,368 | |||||
Construction in progress | 167 | 210 | |||||
Total property and equipment, at cost | 14,518 | 14,405 | |||||
Less accumulated depreciation | (6,210 | ) | (5,890 | ) | |||
Property and equipment, net | $ | 8,308 | $ | 8,515 | |||
Construction in progress includes buildings, building improvements, and computer hardware and software which is not ready for its intended use.
Property and equipment is recorded at cost, less accumulated depreciation. Depreciation is calculated using the straight-line method over the estimated useful lives of the assets. Leased property and improvements to leased property are amortized on a straight-line basis over the term of the lease or useful life of the asset, whichever is less.
The annual provisions for depreciation and amortization generally use the following ranges of useful lives:
Buildings and improvements | 5-40 years |
Store fixtures and equipment | 3-15 years |
Computer hardware and software | 3-8 years |
Long-Lived Assets
All property and equipment and other long-lived assets are reviewed for potential impairment when events or changes in circumstances indicate that the asset’s carrying value may not be recoverable. If such indicators are present, it is determined whether the sum of the estimated undiscounted future cash flows attributable to such assets is less than the carrying value of the assets. A potential impairment has occurred if projected future undiscounted cash flows are less than the carrying value of the assets. No material impairments were recorded in 2015, 2014, or 2013 as a result of the tests performed.
F-8
1. Business and Summary of Accounting Policies (continued)
Accrued Liabilities
Accrued liabilities consist of the following:
Jan 30, 2016 | Jan 31, 2015 | ||||||
(Dollars in Millions) | |||||||
Gift cards and merchandise return cards | $ | 323 | $ | 307 | |||
Payroll and related fringe benefits | 117 | 135 | |||||
Sales, property and use taxes | 184 | 185 | |||||
Credit card liabilities | 88 | 106 | |||||
Marketing | 77 | 63 | |||||
Accrued capital | 64 | 73 | |||||
Shipping and other distribution costs | 79 | 27 | |||||
Other | 274 | 264 | |||||
Accrued liabilities | $ | 1,206 | $ | 1,160 | |||
Self-Insurance
We use a combination of insurance and self-insurance for a number of risks. Liabilities associated with workers’ compensation, general liability, and employee-related health care benefits losses include estimates of both reported losses and losses incurred but not yet reported. We use a third-party actuary, which considers historical claims experience, demographic factors, severity factors and other actuarial assumptions, to estimate the liabilities associated with these risks. Total estimated liabilities for workers’ compensation, general liability and employee-related health benefits were approximately $58 million at January 30, 2016 and $53 million at January 31, 2015. Although these amounts are actuarially determined based on analysis of historical trends, the amounts that we will ultimately disburse could differ from these estimates.
Our self insurance exposure for property losses differs based on the type of claim. For catastrophic claims like earthquakes, floods and windstorms, depending on the location, we are self insured for 2-5% of the insurance claim. For other standard claims like fire and building damages, we are self insured for the first $250,000 of property loss claims.
Treasury Stock
We account for repurchases of common stock and shares withheld in lieu of taxes when restricted stock vests using the cost method with common stock in treasury classified in the Consolidated Balance Sheets as a reduction of shareholders’ equity.
Accumulated Other Comprehensive Loss and Other Comprehensive Income
Accumulated other comprehensive loss consists of the following:
Loss on Interest Rate Derivatives | Unrealized Losses on Investments | Accumulated Other Comprehensive Loss | |||||||||
(Dollars in Millions) | |||||||||||
Balance at February 1, 2014 | $ | (23 | ) | $ | (11 | ) | $ | (34 | ) | ||
Other comprehensive income | 3 | 11 | 14 | ||||||||
Balance at January 31, 2015 | (20 | ) | — | (20 | ) | ||||||
Other comprehensive income | 3 | — | 3 | ||||||||
Balance at January 30, 2016 | $ | (17 | ) | $ | — | $ | (17 | ) | |||
F-9
1. Business and Summary of Accounting Policies (continued)
The tax effects of each component of other comprehensive income are as follows:
2015 | 2014 | 2013 | |||||||||
(Dollars in Millions) | |||||||||||
Interest rate derivatives: | |||||||||||
Before-tax amounts | $ | 5 | $ | 5 | $ | 5 | |||||
Tax expense | (2 | ) | (2 | ) | (2 | ) | |||||
After-tax amounts | 3 | 3 | 3 | ||||||||
Unrealized gains on investments: | |||||||||||
Before-tax amounts | — | 18 | 12 | ||||||||
Tax expense | — | (7 | ) | (4 | ) | ||||||
After-tax amounts | — | 11 | 8 | ||||||||
Other comprehensive income | $ | 3 | $ | 14 | $ | 11 | |||||
Revenue Recognition
Revenue from the sale of merchandise at our stores is recognized at the time of sale, net of any returns. Sales of merchandise shipped to our customers are recorded based on estimated receipt of merchandise by the customer. Net sales do not include sales tax as we are considered a pass-through conduit for collecting and remitting sales taxes.
Revenue from Kohl's gift card sales is recognized when the gift card is redeemed. Gift card breakage revenue is based on historical redemption patterns and represents the balance of gift cards for which we believe the likelihood of redemption by a customer is remote.
Cost of Merchandise Sold and Selling, General and Administrative Expenses
The following table illustrates the primary costs classified in Cost of Merchandise Sold and Selling, General and Administrative Expenses:
Cost of Merchandise Sold | Selling, General and Administrative Expenses | |
• Total cost of products sold including product development costs, net of vendor payments other than reimbursement of specific, incremental and identifiable costs • Inventory shrink • Markdowns • Freight expenses associated with moving merchandise from our vendors to our distribution centers • Shipping and handling expenses of omni-channel sales • Terms cash discount | • Compensation and benefit costs including: • Stores • Corporate headquarters, including buying and merchandising • Distribution centers • Occupancy and operating costs of our retail, distribution and corporate facilities • Net revenues from the Kohl’s credit card program • Freight expenses associated with moving merchandise from our distribution centers to our retail stores and between distribution and retail facilities • Marketing expenses, offset by vendor payments for reimbursement of specific, incremental and identifiable costs • Other administrative revenues and expenses | |
The classification of these expenses varies across the retail industry.
F-10
1. Business and Summary of Accounting Policies (continued)
Vendor Allowances
We receive consideration for a variety of vendor-sponsored programs, such as markdown allowances, volume rebates and promotion and marketing support. The vendor consideration is recorded as earned either as a reduction of inventory costs or Selling, General and Administrative (“SG&A”) expenses based on the application of Accounting Standards Codification (“ASC”) No. 605, Subtopic 50, “Customer Payments and Incentives.” Promotional and marketing allowances are intended to offset our marketing costs to promote vendors’ merchandise. Markdown allowances and volume rebates are recorded as a reduction of inventory costs.
Loyalty Program
We maintain a customer loyalty program in which customers earn points based on their spending and other promotional activities. Upon accumulating certain point levels, customers receive rewards to apply to future purchases. We accrue the cost of anticipated redemptions related to the program when the points are earned at the initial purchase. The costs of the program are recorded in cost of merchandise sold.
Fair Value
ASC No. 820, “Fair Value Measurements and Disclosures,” requires fair value measurements be classified and disclosed in one of the following pricing categories:
Level 1: | Financial instruments with unadjusted, quoted prices listed on active market exchanges. | |
Level 2: | Financial instruments lacking unadjusted, quoted prices from active market exchanges, including over-the-counter traded financial instruments. The prices for the financial instruments are determined using prices for recently traded financial instruments with similar underlying terms as well as directly or indirectly observable inputs, such as interest rates and yield curves that are observable at commonly quoted intervals. | |
Level 3: | Financial instruments that are not actively traded on a market exchange. This category includes situations where there is little, if any, market activity for the financial instrument. The prices are determined using significant unobservable inputs or valuation techniques. | |
We carry our current assets and liabilities at cost, which approximate fair value.
Leases
We lease certain property and equipment used in our operations.
We are often involved extensively in the construction of leased stores. In many cases, we are responsible for construction cost over runs or non-standard tenant improvements (e.g. roof or HVAC systems). As a result of this involvement, we are deemed the “owner” for accounting purposes during the construction period, so are required to capitalize the construction costs on our Balance Sheet. Upon completion of the project, we perform a sale-leaseback analysis pursuant to ASC No. 840, “Leases,” to determine if we can remove the assets from our Balance Sheet. In many of our leases, we are reimbursed a portion of the construction costs via adjusted rental payments and/or cash payments or have terms which fix the rental payments for a significant percentage of the leased asset’s economic life. These items generally are considered “continuing involvement” which precludes us from derecognizing the assets from our Balance Sheet when construction is complete. In conjunction with these leases, we also record financing obligations equal to the cash proceeds or fair market value of the assets received from the landlord. At the end of the lease term, including exercise of any renewal options, the net remaining financing obligation over the net carrying value of the fixed asset will be recognized as a non-cash gain on sale of the property. We do not report rent expense for the properties which are owned for accounting purposes. Rather, rental payments under the lease are recognized as a reduction of the financing obligation and interest expense.
Some of our property and equipment is held under capital leases. These assets are included in property and equipment and depreciated over the term of the lease. We do not report rent expense for capital leases. Rather, rental payments under the lease are recognized as a reduction of the capital lease obligation and interest expense.
F-11
1. Business and Summary of Accounting Policies (continued)
All other leases are considered operating leases in accordance with ASC No. 840. Assets subject to an operating lease and the related lease payments are not recorded on our balance sheet. Rent expense is recognized on a straight-line basis over the expected lease term.
The lease term for all types of leases begins on the date we become legally obligated for the rent payments or we take possession of the building or land, whichever is earlier. The lease term includes cancelable option periods where failure to exercise such options would result in an economic penalty. Failure to exercise such options would result in the recognition of accelerated depreciation expense of the related assets.
Marketing
Marketing costs, which include primarily digital, direct mail, newspaper inserts, television, and radio broadcast, are expensed when the marketing is first seen. Marketing costs, net of related vendor allowances, were as follows:
2015 | 2014 | 2013 | |||||||||
(Dollars in Millions) | |||||||||||
Gross marketing costs | $ | 1,171 | $ | 1,189 | $ | 1,185 | |||||
Vendor allowances | (160 | ) | (165 | ) | (172 | ) | |||||
Net marketing costs | $ | 1,011 | $ | 1,024 | $ | 1,013 | |||||
Net marketing costs as a percent of net sales | 5.3 | % | 5.4 | % | 5.3 | % | |||||
Income Taxes
Income taxes are accounted for under the asset and liability method. Under this method, deferred tax assets and liabilities are recorded based on differences between the amounts of assets and liabilities recognized for financial reporting purposes and such amounts recognized for income tax purposes. Deferred tax assets and liabilities are calculated using the enacted tax rates and laws that are expected to be in effect when the differences are expected to reverse. We establish valuation allowances for deferred tax assets when we believe it is more likely than not that the asset will not be realizable for tax purposes.
We recognize interest and penalty expense related to unrecognized tax benefits in our provision for income tax expense.
Net Income Per Share
Basic net income per share is net income divided by the average number of common shares outstanding during the period. Diluted net income per share includes incremental shares assumed for stock options, nonvested stock and performance share units.
The information required to compute basic and diluted net income per share is as follows:
2015 | 2014 | 2013 | |||||||||
(Dollars in Millions, Except per Share Data) | |||||||||||
Numerator—net income | $ | 673 | $ | 867 | $ | 889 | |||||
Denominator—weighted average shares | |||||||||||
Basic | 193 | 203 | 218 | ||||||||
Impact of dilutive employee stock options (a) | 2 | 1 | 2 | ||||||||
Diluted | 195 | 204 | 220 | ||||||||
Net income per share: | |||||||||||
Basic | $ | 3.48 | $ | 4.28 | $ | 4.08 | |||||
Diluted | $ | 3.46 | $ | 4.24 | $ | 4.05 | |||||
(a) Excludes 1 million share-based awards for 2015, 3 million share-based awards for 2014 and 10 million share-based awards for 2013 as the impact of such awards was antidilutive.
F-12
1. Business and Summary of Accounting Policies (continued)
Share-Based Awards
Stock-based compensation expense is generally recognized on a straight-line basis over the vesting period based on the fair value of awards which are expected to vest. The fair value of all share-based awards is estimated on the date of grant.
Recent Accounting Pronouncements
In May 2014, the Financial Accounting Standards Board ("FASB") issued Accounting Standards Update ("ASU") No. 2014-09, "Revenue from Contracts with Customers (Topic 606)", which supersedes the revenue recognition requirements in ASC No. 605, Revenue Recognition. In August 2015, the FASB issued ASU 2015-14, "Revenue from Contracts with Customers (Topic 606): Deferral of the Effective Date", which defers the effective date of ASU 2014-09 for all entities by one year. The original ASU is based on the principle that revenue is recognized to depict the transfer of goods or services to customers in an amount that reflects the consideration to which the entity expects to be entitled in exchange for those goods or services. This ASU is effective in the first quarter of 2018. It will change the way we account for sales returns, our loyalty program and certain promotional programs. Based on current estimates, we do not expect this ASU to have a material impact on our financial statements and, therefore, we expect to use the modified retrospective method to adopt the standard.
In February 2016, the FASB issued ASU No. 2016-02, "Leases (Topic 842)". The core principle of the standard is that a lessee should recognize the assets and liabilities that arise from leases. A lessee should recognize in its statement of financial position a liability to make lease payments (the lease liability) and a right-of-use asset representing its right to use the underlying asset for the lease term. We will be required to adopt the new standard in the first quarter of 2019. We are currently evaluating the impact this new standard will have on our financial statements.
During 2015, we adopted ASU No. 2015-03, "Simplifying the Presentation of Debt Issuance Costs (Subtopic 835-30)" which requires us to present debt issuance costs on the balance sheet as a direct deduction from the related debt liability rather than as an asset. We also adopted ASU No. 2015-17, "Balance Sheet Classification of Deferred Taxes (Topic 740)" which requires us to present deferred tax liabilities and assets as noncurrent in our balance sheet and corrected the presentation of certain other tax assets and liabilities.
A summary of reclassifications is as follows:
Prior Classification | Current Classification | 2015 | 2014 | |||||||||
(Dollars in Millions) | ||||||||||||
Debt issuance costs | Other current and long-term assets | Long-term debt | $ | 18 | $ | 13 | ||||||
Deferred taxes | Current deferred tax asset | Long-term deferred tax liability | $ | 97 | $ | 84 | ||||||
Deferred taxes | Current deferred tax asset | Other long-term assets | $ | 27 | $ | 32 | ||||||
Deferred taxes | Other long-term liabilities | Long-term deferred tax liability | $ | 30 | $ | 15 | ||||||
F-13
2. Debt
Long-term debt consists of the following unsecured senior debt:
January 30, 2016 | Outstanding January 31, 2015 | ||||||||||||
Maturity | Effective Rate | Coupon Rate | Outstanding | ||||||||||
(Dollars in Millions) | |||||||||||||
2021 | 4.81 | % | 4.00 | % | $ | 650 | $ | 650 | |||||
2023 | 3.25 | % | 3.25 | % | 350 | 350 | |||||||
2023 | 4.78 | % | 4.75 | % | 300 | 300 | |||||||
2025 | 4.25 | % | 4.25 | % | 650 | — | |||||||
2029 | 7.36 | % | 7.25 | % | 99 | 200 | |||||||
2033 | 6.05 | % | 6.00 | % | 166 | 300 | |||||||
2037 | 6.89 | % | 6.88 | % | 150 | 350 | |||||||
2045 | 5.57 | % | 5.55 | % | 450 | — | |||||||
2017 | n/a | n/a | — | 650 | |||||||||
4.88 | % | 2,815 | 2,800 | ||||||||||
Unamortized debt discount | (5 | ) | (7 | ) | |||||||||
Deferred financing costs | (18 | ) | (13 | ) | |||||||||
Long-term debt | $ | 2,792 | $ | 2,780 | |||||||||
Based on quoted market prices (Level 1 per ASC No. 820, "Fair Value Measurements and Disclosures"), the estimated fair value of our long-term debt was $2.8 billion at January 30, 2016 and $3.1 billion at January 31, 2015.
During 2015, we completed a cash tender offer and redemption for $1,085 million of senior unsecured debt. We recognized a $169 million loss on extinguishment of debt which included a $163 million bond tender premium paid to holders of the debt and a $6 million non-cash write-off of deferred financing costs and original issue discounts associated with the extinguished debt.
In July 2015, we issued $650 million of 4.25% notes due in July 2025 and $450 million of 5.55% notes due in July 2045. Both notes include semi-annual, interest-only payments which began January 17, 2016. Proceeds of the issuances and cash on hand were used to pay the principal, premium and accrued interest of the debt which was settled in July and August 2015.
In July 2015, we entered into an Amended and Restated Credit Agreement with various lenders which provides for a $1.0 billion senior unsecured five-year revolving credit facility that will mature in June 2020. Among other things, the agreement includes a maximum leverage ratio financial covenant (which is consistent with the ratio under our prior credit agreement) and restrictions on liens and subsidiary indebtedness. As of January 30, 2016 and January 31, 2015, there were no outstanding balances on the revolving credit facility. We borrowed $400 million during the third quarter of 2015 with an effective interest rate of 1.27% and repaid the entire balance in the fourth quarter.
Our various debt agreements contain covenants including limitations on additional indebtedness and certain financial tests. As of January 30, 2016, we were in compliance with all covenants of the various debt agreements.
We also have outstanding trade letters of credit and stand-by letters of credit totaling approximately $35 million at January 30, 2016, issued under uncommitted lines with two banks.
F-14
3. Lease Commitments
Rent expense charged to operations was $279 million for 2015, $277 million for 2014, and $270 million for 2013. In addition to rent payments, we are often required to pay real estate taxes, insurance and maintenance costs on leased properties. These items are not included in the future minimum lease payments listed below. Many store leases include multiple renewal options, exercisable at our option, that generally range from four to eight additional five-year periods.
Future minimum lease payments at January 30, 2016 were as follows:
Capital Lease and Financing Obligations | Operating Leases | ||||||
(Dollars in Millions) | |||||||
Fiscal year: | |||||||
2016 | $ | 293 | $ | 244 | |||
2017 | 286 | 245 | |||||
2018 | 267 | 246 | |||||
2019 | 249 | 244 | |||||
2020 | 235 | 240 | |||||
Thereafter | 2,639 | 4,408 | |||||
3,969 | $ | 5,627 | |||||
Non-cash gain on future sale of property | 456 | ||||||
Amount representing interest | (2,509 | ) | |||||
Present value of lease payments | $ | 1,916 | |||||
4. Benefit Plans
We have a defined contribution savings plan covering all full-time and certain part-time associates. Participants in this plan may invest up to 100% of their base compensation, subject to certain statutory limits. We match 100% of the first 5% of each participant’s contribution, subject to certain statutory limits.
We also offer a non-qualified deferred compensation plan to a group of executives which provides for pre-tax compensation deferrals up to 100% of salary and/or bonus. Deferrals and credited investment returns are 100% vested.
The total costs for these benefit plans were $49 million for 2015, $43 million for 2014, and $49 million for 2013.
F-15
5. Income Taxes
Deferred income taxes consist of the following:
Jan 30, 2016 | Jan 31, 2015 | ||||||
(Dollars in Millions) | |||||||
Deferred tax liabilities: | |||||||
Property and equipment | $ | 1,319 | $ | 1,385 | |||
Deferred tax assets: | |||||||
Merchandise inventories | 24 | 24 | |||||
Accrued and other liabilities, including stock-based compensation | 151 | 168 | |||||
Capital lease and financing obligations | 752 | 773 | |||||
Accrued step rent liability | 106 | 100 | |||||
Unrealized loss on interest rate swap | 11 | 13 | |||||
Federal benefit on state tax reserves | 45 | 41 | |||||
1,089 | 1,119 | ||||||
Net deferred tax liability | $ | 230 | $ | 266 | |||
Deferred tax assets included in other long-term assets totaled $27 million as of January 30, 2016 and $32 million as of January 31, 2015.
The components of the provision for income taxes were as follows:
2015 | 2014 | 2013 | |||||||||
(Dollars in Millions) | |||||||||||
Current federal | $ | 397 | $ | 400 | $ | 473 | |||||
Current state | 34 | 36 | 45 | ||||||||
Deferred federal | (35 | ) | 48 | 6 | |||||||
Deferred state | (12 | ) | (2 | ) | (9 | ) | |||||
$ | 384 | $ | 482 | $ | 515 | ||||||
The provision for income taxes differs from the amount that would be provided by applying the statutory U.S. corporate tax rate due to the following items:
2015 | 2014 | 2013 | ||||||
Provision at statutory rate | 35.0 | % | 35.0 | % | 35.0 | % | ||
State income taxes, net of federal tax benefit | 2.1 | 1.3 | 2.2 | |||||
Tax-exempt interest income | — | — | (0.2 | ) | ||||
Other federal tax credits | (0.8 | ) | (0.6 | ) | (0.3 | ) | ||
Provision for income taxes | 36.3 | % | 35.7 | % | 36.7 | % | ||
We have analyzed filing positions in all of the federal and state jurisdictions where we are required to file income tax returns, as well as all open tax years in these jurisdictions. The only federal returns subject to examination are for the 2009 through 2015 tax years. State returns subject to examination vary depending upon the state. Generally, the 2012 through 2015 tax years are subject to state examination. The earliest open period is 2004. Certain states have proposed adjustments which we are currently appealing. If we do not prevail on our appeals, we do not anticipate that the adjustments would result in a material change in our financial position.
F-16
5. Income Taxes (continued)
A reconciliation of the beginning and ending gross amount of unrecognized tax benefits is as follows:
2015 | 2014 | ||||||
(Dollars in Millions) | |||||||
Balance at beginning of year | $ | 123 | $ | 125 | |||
Increases due to: | |||||||
Tax positions taken in prior years | 16 | — | |||||
Tax positions taken in current year | 19 | 21 | |||||
Decreases due to: | |||||||
Tax positions taken in prior years | (6 | ) | (16 | ) | |||
Settlements with taxing authorities | (10 | ) | (2 | ) | |||
Lapse of applicable statute of limitations | (3 | ) | (5 | ) | |||
Balance at end of year | $ | 139 | $ | 123 | |||
Not included in the unrecognized tax benefits reconciliation above are gross unrecognized accrued interest and penalties of $23 million at both January 30, 2016 and January 31, 2015. We had no interest and penalty expense for 2015, $2 million for 2014, and $3 million for 2013.
Our total unrecognized tax benefits that, if recognized, would affect our effective tax rate were $101 million as of January 30, 2016 and $89 million as of January 31, 2015. It is reasonably possible that our unrecognized tax positions may change within the next 12 months, primarily as a result of ongoing audits. While it is possible that one or more of these examinations may be resolved in the next year, it is not anticipated that a significant impact to the unrecognized tax benefit balance will occur.
We have both payables and receivables for current income taxes recorded on our balance sheet. Receivables included in other current assets totaled $26 million as of January 30, 2016 and $25 million as of January 31, 2015.
6. Stock-Based Compensation
We currently grant share-based compensation pursuant to the Kohl’s Corporation 2010 Long-Term Compensation Plan, which provides for the granting of various forms of equity-based awards, including nonvested stock, performance share units and options to purchase shares of our common stock, to officers, key employees and directors. As of January 30, 2016, there were 18.5 million shares authorized and 11.2 million shares available for grant under the 2010 Long-Term Compensation Plan. Options and nonvested stock that are surrendered or terminated without issuance of shares are available for future grants.
Annual grants are typically made in the first quarter of the fiscal year. Grants to newly-hired and promoted employees and other discretionary grants are made periodically throughout the remainder of the year. We also have outstanding options which were granted under previous compensation plans.
Stock options
The majority of stock options granted to employees typically vest in five equal annual installments. Outstanding options granted to employees after 2005 have a term of seven years. Outstanding options granted to employees prior to 2006 have a term of up to 15 years. Outstanding options granted to directors have a term of 10 years.
F-17
6. Stock-Based Compensation (continued)
All stock options have an exercise price equal to the fair market value of the common stock on the date of grant. The fair value of each option award was estimated using a Black-Scholes option valuation model. The weighted average fair value of options granted in 2014 was $12.23 and in 2013 was $10.68.
The following table summarizes our stock option activity:
2015 | 2014 | 2013 | ||||||||||||||||||
Shares | Weighted Average Exercise Price | Shares | Weighted Average Exercise Price | Shares | Weighted Average Exercise Price | |||||||||||||||
(Shares in Thousands) | ||||||||||||||||||||
Balance at beginning of year | 6,211 | $ | 52.95 | 11,375 | $ | 56.05 | 15,212 | $ | 53.96 | |||||||||||
Granted | — | — | 186 | 54.69 | 575 | 47.86 | ||||||||||||||
Exercised | (2,815 | ) | 52.79 | (2,647 | ) | 46.87 | (2,494 | ) | 41.02 | |||||||||||
Forfeited/expired | (320 | ) | 57.36 | (2,703 | ) | 72.21 | (1,918 | ) | 56.59 | |||||||||||
Balance at end of year | 3,076 | $ | 52.65 | 6,211 | $ | 52.95 | 11,375 | $ | 56.05 | |||||||||||
The intrinsic value of options exercised represents the excess of our stock price at the time the option was exercised over the exercise price and was $52 million in 2015 and $30 million in both 2014 and 2013.
Additional information related to stock options outstanding and exercisable at January 30, 2016, segregated by exercise price range, is summarized below:
Stock Options Outstanding | Stock Options Exercisable | ||||||||||||||||||
Range of Exercise Prices | Shares | Weighted Average Remaining Contractual Life (in years) | Weighted Average Exercise Price | Shares | Weighted Average Remaining Contractual Life (in years) | Weighted Average Exercise Price | |||||||||||||
(Shares in Thousands) | |||||||||||||||||||
$ 36.13 – $ 46.00 | 272 | 1.7 | $ | 42.75 | 219 | 1.2 | $ | 42.30 | |||||||||||
$ 46.01 – $ 49.00 | 759 | 3.4 | 47.76 | 385 | 3.6 | 47.84 | |||||||||||||
$ 49.01 – $ 51.00 | 439 | 2.6 | 50.07 | 339 | 2.3 | 50.08 | |||||||||||||
$ 51.01 – $ 55.00 | 749 | 2.8 | 52.73 | 447 | 2.3 | 52.87 | |||||||||||||
$ 55.01 – $ 65.00 | 525 | 2.0 | 57.32 | 454 | 1.6 | 57.46 | |||||||||||||
$ 65.01 – $ 77.62 | 332 | 1.0 | 67.75 | 332 | 1.0 | 67.75 | |||||||||||||
3,076 | 2.5 | $ | 52.65 | 2,176 | 2.1 | $ | 53.71 | ||||||||||||
Intrinsic value (in thousands) | $ | 3,450 | $ | 2,393 | |||||||||||||||
The intrinsic value of outstanding and exercisable stock options represents the excess of our closing stock price on January 30, 2016 ($49.75) over the exercise price multiplied by the applicable number of stock options.
Nonvested stock awards
We have also awarded shares of nonvested common stock to eligible key employees and to our Board of Directors. Substantially all awards have restriction periods tied primarily to employment and/or service. Employee awards generally vest over five years. Director awards vest over the term to which the director was elected, generally one year. In lieu of cash dividends, nonvested stock awards are granted restricted stock equivalents which vest consistently with the underlying nonvested stock awards.
The fair value of nonvested stock awards is the closing price of our common stock on the date of grant. We may acquire shares from employees in lieu of amounts required to satisfy minimum tax withholding requirements upon the vesting of the employee’s unvested stock award. Such shares are then designated as treasury shares.
F-18
6. Stock-Based Compensation (continued)
The following table summarizes nonvested stock activity, including restricted stock equivalents issued in lieu of cash dividends:
2015 | 2014 | 2013 | ||||||||||||||||||
Shares | Weighted Average Grant Date Fair Value | Shares | Weighted Average Grant Date Fair Value | Shares | Weighted Average Grant Date Fair Value | |||||||||||||||
(Shares in Thousands) | ||||||||||||||||||||
Balance at beginning of year | 2,431 | $ | 52.29 | 2,653 | $ | 50.56 | 2,323 | $ | 50.47 | |||||||||||
Granted | 955 | 65.02 | 910 | 56.13 | 1,189 | 49.22 | ||||||||||||||
Vested | (957 | ) | 52.61 | (818 | ) | 50.69 | (706 | ) | 48.00 | |||||||||||
Forfeited | (218 | ) | 55.16 | (314 | ) | 51.47 | (153 | ) | 50.48 | |||||||||||
Balance at end of year | 2,211 | $ | 57.37 | 2,431 | $ | 52.29 | 2,653 | $ | 50.56 | |||||||||||
The aggregate fair value of awards at the time of vesting was $50 million in 2015, $41 million in 2014 and $34 million in 2013.
Performance share units
Kohl's grants performance-based restricted stock units ("performance share units") to certain executives. The performance measurement period for these performance share units is three fiscal years. The fair market value of the grants are determined using a Monte-Carlo valuation on the date of grant.
The actual number of shares which will be earned at the end of the three-year vesting periods will vary based on our cumulative financial performance over the vesting periods. The number of performance share units earned will be modified up or down based on Kohl’s Relative Total Shareholder Return against a defined peer group during the vesting periods. The payouts, if earned, will be settled in Kohl's common stock after the end of each multi-year performance periods.
The following table summarizes performance share unit activity by year of grant:
2015 | 2014 | 2013 | |||
Units outstanding (at Target) | 160,000 | 14,000 | 170,000 | ||
Weighted average Monte-Carlo valuation at grant date | $78.82 | $62.39 | $57.37 | ||
Performance period | 2015-2017 | 2014-2016 | 2014-2016 | ||
Other required disclosures
Stock-based compensation expense is included in Selling, General and Administrative expense in our Consolidated Statements of Income. Such expense totaled $48 million for both 2015 and 2014 and $55 million for 2013. At January 30, 2016, we had approximately $93 million of unrecognized share-based compensation expense, which is expected to be recognized over a weighted-average period of 2 years.
F-19
7. Contingencies
At any time, we may be subject to investigations, legal proceedings, or claims related to the on-going operation of our business, including claims both by and against us. Such proceedings typically involve claims related to various forms of liability, contract disputes, allegations of violations of laws or regulations or other actions brought by us or others including our employees, consumers, competitors, suppliers or governmental agencies. We routinely assess the likelihood of any adverse outcomes related to these matters on a case by case basis, as well as the potential ranges of losses and fees. We establish accruals for our potential exposure, as appropriate, for significant claims against us when losses become probable and reasonably estimable. Where we are able to reasonably estimate a range of potential losses relating to significant matters, we record the amount within that range that constitutes our best estimate. We also disclose the nature of and range of loss for claims against us when losses are reasonably possible and material. These accruals and disclosures are determined based on the facts and circumstances related to the individual cases and require estimates and judgments regarding the interpretation of facts and laws, as well as the effectiveness of strategies or other factors beyond our control.
8. Quarterly Financial Information (Unaudited)
2015 | |||||||||||||||
First | Second | Third | Fourth | ||||||||||||
(Dollars in Millions, Except per Share Data) | |||||||||||||||
Net sales | $ | 4,123 | $ | 4,267 | $ | 4,427 | $ | 6,387 | |||||||
Gross margin | $ | 1,523 | $ | 1,662 | $ | 1,643 | $ | 2,112 | |||||||
Selling, general and administrative expenses | $ | 1,016 | $ | 1,005 | $ | 1,099 | $ | 1,332 | |||||||
Loss on extinguishment of debt | $ | — | $ | 131 | $ | 38 | $ | — | |||||||
Net income | $ | 127 | $ | 130 | $ | 120 | $ | 296 | |||||||
Basic shares | 200 | 196 | 191 | 187 | |||||||||||
Basic net income per share | $ | 0.64 | $ | 0.66 | $ | 0.63 | $ | 1.58 | |||||||
Diluted shares | 202 | 197 | 192 | 187 | |||||||||||
Diluted net income per share | $ | 0.63 | $ | 0.66 | $ | 0.63 | $ | 1.58 | |||||||
2014 | |||||||||||||||
First | Second | Third | Fourth | ||||||||||||
(Dollars in Millions, Except per Share Data) | |||||||||||||||
Net sales | $ | 4,070 | $ | 4,242 | $ | 4,374 | $ | 6,337 | |||||||
Gross margin | $ | 1,496 | $ | 1,654 | $ | 1,628 | $ | 2,147 | |||||||
Selling, general and administrative | $ | 1,000 | $ | 981 | $ | 1,097 | $ | 1,272 | |||||||
Net income | $ | 125 | $ | 232 | $ | 142 | $ | 369 | |||||||
Basic shares | 206 | 204 | 202 | 199 | |||||||||||
Basic net income per share | $ | 0.60 | $ | 1.14 | $ | 0.70 | $ | 1.85 | |||||||
Diluted shares | 208 | 205 | 203 | 201 | |||||||||||
Diluted net income per share | $ | 0.60 | $ | 1.13 | $ | 0.70 | $ | 1.83 | |||||||
Due to changes in stock prices during the year and timing of share repurchases and issuances, the sum of quarterly net income per share may not equal the annual net income per share.
9. Subsequent Events
On February 25, 2016, we announced plans to close 18 underperforming stores in fiscal 2016. We announced the specific locations in March 2016. We currently expect to incur $150 to $170 million in charges as a result of these planned closures and the organizational realignment at our corporate offices which were announced in February 2016. We estimate that approximately $55-$65 million of the charges will be recorded in the first quarter of 2016, with the remainder recorded in the second quarter of 2016.
F-20