Attached files
| file | filename |
|---|---|
| EX-32.2 - Eco-Stim Energy Solutions, Inc. | ex32-2.htm |
| EX-32.1 - Eco-Stim Energy Solutions, Inc. | ex32-1.htm |
| EX-31.2 - Eco-Stim Energy Solutions, Inc. | ex31-2.htm |
| EX-31.1 - Eco-Stim Energy Solutions, Inc. | ex31-1.htm |
| EX-23.1 - Eco-Stim Energy Solutions, Inc. | ex23-1.htm |
UNITED STATES
SECURITIES AND EXCHANGE COMMISSION
Washington, D.C. 20549
FORM 10-K
(Mark One)
[X] ANNUAL REPORT PURSUANT TO SECTION 13 OR 15(d) OF THE SECURITIES EXCHANGE ACT OF 1934
For the Fiscal Year ended December 31, 2015
or
[ ] TRANSITION REPORT PURSUANT TO SECTION 13 OR 15(d) OF THE SECURITIES EXCHANGE ACT OF 1934
For the transition period from to
Commission File Number: 001-36273
ECO-STIM ENERGY SOLUTIONS, INC.
(Exact name of registrant as specified in its charter)
| Nevada | 31104 | 20-8203420 | ||
| (State
or other jurisdiction of incorporation or organization) |
(Commission File Number) |
(IRS
Employer Identification Number) |
| 2930 W. Sam Houston Pkwy N., Suite 275, Houston TX | 77043 | |
| (Address of principal executive offices) | (Zip Code) |
281-531-7200
(Registrant’s telephone number, including area code)
Securities registered pursuant to Section 12(b) of the Act:
| Title of each class | Name of each exchange on which registered | |
| Common Stock, par value $0.001 per share | The NASDAQ Stock Market LLC |
Securities registered pursuant to Section 12(g) of the Act: NONE
Indicate by check mark if the registrant is a well-known seasoned issuer, as defined in Rule 405 of the Securities Act. Yes [ ] No [X]
Indicate by check mark if the registrant is not required to file reports pursuant to Section 13 or Section 15(d) of the Act. Yes [ ] No [X]
Indicate by check mark whether the registrant (1) has filed all reports required to be filed by Section 13 or 15(d) of the Securities Exchange Act of 1934 during the preceding 12 months (or for such shorter period that the registrant was required to file such reports), and (2) has been subject to such filing requirements for the past 90 days. Yes [X] No [ ]
Indicate by check mark whether the registrant has submitted electronically and posted on its corporate Web site, if any, every Interactive Data File required to be submitted and posted pursuant to Rule 405 of Regulation S-T (§232.405 of this chapter) during the preceding 12 months (or for such shorter period that the registrant was required to submit and post such files). Yes [X] No [ ]
Indicate by check mark if disclosure of delinquent filers pursuant to Item 405 of Regulation S-K (§229.405 of this chapter) is not contained herein, and will not be contained, to the best of registrant’s knowledge, in definitive proxy or information statements incorporated by reference in Part III of this Form 10-K or any amendment to this Form 10-K. [ ]
Indicate by check mark whether the registrant is a large accelerated filer, an accelerated filer, a non-accelerated filer, or a smaller reporting company. See definition of “accelerated filer and large accelerated filer” in Rule 12b-2 of the Exchange Act. (Check one):
| Large accelerated filer | [ ] | Accelerated filer [ ] |
| Non-accelerated filer | [ ] (Do not check if a smaller reporting company) | Smaller reporting company [X] |
Indicate by check mark whether the registrant is a shell company (as defined in Rule 12b-2 of the Act). Yes [ ] No [X]
As of June 30, 2015, the last business day of the registrant’s most recently completed second fiscal quarter, the aggregate market value of the voting and non-voting common equity held by non-affiliates of the registrant, computed by reference to the closing price of that date, was $16,258,924. This aggregate value is computed at $5.50 per share, the last sale price of the common stock on June 30, 2015. All executive officers and directors of the registrant and all stockholders who owned 5 percent or more of the outstanding common stock at that time have been deemed, solely for the purpose of the foregoing calculation, to be “affiliates” of the registrant.
The registrant had 13,576,139 shares of common stock outstanding at March 16, 2016.
Documents Incorporated by Reference: None
CAUTIONARY STATEMENTS REGARDING FORWARD-LOOKING STATEMENTS
This Annual Report on Form 10-K (this “Form 10-K”) contains “forward-looking statements” within the meaning of Section 27A of the Securities Act of 1993, as amended (the “Securities Act”), and Section 21E of the Securities Exchange Act of 1934, as amended (the “Exchange Act”). All statements, other than statements of historical facts, included in this Form 10-K that address activities, events or developments that we expect, project, believe or anticipate will or may occur in the future are forward-looking statements. These forward-looking statements are based on management’s current belief, based on currently available information, as to the outcome and timing of future events. Forward-looking statements may include statements that relate to, among other things, our:
| ● | future financial and operating performance and results; | |
| ● | business strategy and budgets; | |
| ● | technology; | |
| ● | financial strategy; | |
| ● | amount, nature and timing of capital expenditures; | |
| ● | competition and government regulations; | |
| ● | operating costs and other expenses; | |
| ● | cash flow and anticipated liquidity; | |
| ● | property and equipment acquisitions and sales; and | |
| ● | plans, forecasts, objectives, expectations and intentions. |
All statements, other than statements of historical fact included in this Form 10-K, regarding our strategy, future operations, financial position, estimated revenues and losses, projected costs, prospects, plans and objectives of management are forward-looking statements. When used in this Form 10-K, the words “could,” “believe,” “anticipate,” “intend,” “estimate,” “expect,” “project” and similar expressions are intended to identify forward-looking statements, although not all forward-looking statements contain such identifying words. These forward-looking statements are based on our current expectations and assumptions about future events and are based on currently available information as to the outcome and timing of future events.
Forward-looking statements involve known and unknown risks, uncertainties and other factors that may cause our actual results, performance or achievements to be materially different from the anticipated future results or financial condition expressed or implied by the forward-looking statements. These risks, uncertainties and other factors include but are not limited to:
| ● | the cyclical nature of the oil and natural gas industry; | |
| ● | the potential for our oil-company customers to backward-integrate by starting their own well service operations; | |
| ● | the potential for excess capacity in the oil and natural gas service industry; | |
| ● | dependence on the spending and drilling activity by the onshore oil and natural gas industry; | |
| ● | competition within the oil and natural gas service industry; |
| ● | concentration of our customer base and fulfillment of existing customer contracts; | |
| ● | our ability to maintain pricing and obtain contracts; | |
| ● | deterioration of the credit markets; | |
| ● | our ability to raise additional capital to fund future and committed capital expenditures; | |
| ● | increased vulnerability to adverse economic conditions due to indebtedness; | |
| ● | our limited operating history on which investors may evaluate our business and prospects; | |
| ● | our ability to obtain raw materials and specialized equipment; | |
| ● | technological developments or enhancements; | |
| ● | asset impairment and other charges; | |
| ● | our ability to identify, make and integrate acquisitions; | |
| ● | ACM Emerging Markets Master Fund I, L.P. (together with Albright Capital Management LLC, collectively “ACM”) and management control over stockholder voting; | |
| ● | loss of key executives; | |
| ● | the ability to employ skilled and qualified workers; | |
| ● | work stoppages and other labor matters; | |
| ● | hazards inherent to the oil and natural gas industry; | |
| ● | inadequacy of insurance coverage for certain losses or liabilities; | |
| ● | delays in obtaining required permits; | |
| ● | ability to import equipment or spare parts into Argentina on a timely basis; | |
| ● | regulations affecting the oil and natural gas industry; | |
| ● | legislation and regulatory initiatives relating to well stimulation; | |
| ● | future legislative and regulatory developments; | |
| ● | foreign currency exchange rate fluctuations; | |
| ● | effects of climate change; | |
| ● | volatility of economic conditions in Argentina; | |
| ● | market acceptance of turbine pressure pumping technology; | |
| ● | the profitability for our customers of shale oil and gas as commodity prices decrease; | |
| ● | risks of doing business in Argentina and the United States; and | |
| ● | costs and liabilities associated with environmental, occupational health and safety laws, including any changes in the interpretation or enforcement thereof. |
We believe that it is important to communicate our expectations of future performance to our investors. However, events may occur in the future that we are unable to accurately predict, or over which we have no control. We caution you against putting undue reliance on forward-looking statements or projecting any future results based on such statements. When considering our forward-looking statements, you should keep in mind the cautionary statements in this Form 10-K, which provide examples of risks, uncertainties and events that may cause our actual results to differ materially from those contained in any forward-looking statement.
All subsequent written and oral forward-looking statements attributable to us or any person acting on our behalf are expressly qualified in their entirety by the cautionary statements contained or referred to in this section and any other cautionary statements that may accompany such forward-looking statements. Except as otherwise required by applicable law, we disclaim any duty to update any forward-looking statements, all of which are expressly qualified by the statements in this section, to reflect events or circumstances after the date of this Form 10-K.
You should not place undue reliance on forward-looking statements. Each forward-looking statement speaks only as of the date of the particular statement.
TABLE OF CONTENTS
| i |
Except when the context otherwise requires or where otherwise indicated, throughout this Annual Report on From 10-K, we use the terms “Eco-Stim,” “EcoStim,” “Company,” “we,” “us” and “our” to refer to Eco-Stim Energy Solutions, Inc.
Our Company
We are a technology-driven independent oilfield services company providing well stimulation, coiled tubing and field management services to the upstream oil and gas industry. We are focused on reducing the ecological impact and improving the economic performance of the well stimulation process. We have assembled proven technologies and processes that have the ability to (1) reduce the surface footprint, (2) reduce emissions, and (3) conserve fuel and water during the stimulation process. We will focus on bringing these technologies and processes to the most active shale resource basins outside of North America using our technology to differentiate our service offerings. Our management team has extensive international industry experience. Our first operation is in Argentina, home to the Vaca Muerta, the world’s third-largest shale resource basin as measured by technically recoverable reserves. We also intend to pursue other markets that meet our investment criteria, which may include Colombia and North America as well as other markets where we believe we can offer clear strategic advantages and achieve acceptable financial returns. We may also explore opportunistic acquisitions and/or joint ventures with established companies in target markets.
Our management team has extensive experience in operating well stimulation fleets, coiled tubing units and other downhole completion equipment, as well as providing “sweet spot” analysis in shale resource basins using geophysical predictive modeling combined with real-time feedback from down-hole diagnostic tools. We expect to leverage our management’s experience and historical local relationships in undersupplied markets to pursue profitable long-term contracts or to actively participate in the spot market. We expect to compete for business with a limited number of other service companies based on technical capability, quality of equipment, local experience and existing relationships rather than solely on price. We also believe that we benefit from our association with our largest investors, which are dedicated to the emerging markets and have many established relationships in countries in which we are currently operating and in countries in which we are evaluating opportunities.
2015 was our first full year of operations. Our first pressure pumping fleet commenced operations in the Neuquén province of Argentina in December 2014. This equipment consists of a conventional pressure pumping fleet and various pieces of complementary equipment. We began providing coiled tubing in February, 2015. Furthermore, we have successfully performed field management services for Yacimientos Petroliferos Fiscales S.A. (“YPF”) in Argentina and expect to continue expanding this service offering. These services, which we believe have improved our customers’ understanding of their unconventional reservoir performance, have enhanced our established local relationships while differentiating us from our pressure pumping competitors.
In line with our strategy to pursue technologies with ecological and economic benefits, we are in the process of deploying half of our 54,000 hydraulic horsepower (“HHP”) of the latest generation turbine powered pressure pumping units (“TPUs”) that we purchased in October 2014. Each of these TPUs consists of a high-pressure hydraulic pump, a turbine engine, a gearbox, electrical and hydraulic assemblies, and skids. The TPUs are compliant with the stringent Tier 4 emission standards of the U.S. Environmental Protection Agency (“EPA”) even when run on diesel fuel. We believe these TPUs provide numerous advantages over traditional diesel-powered pumping equipment, including: (1) the ability to operate on 100% natural gas; liquefied natural gas (“LNG”); compressed natural gas (“CNG”) or when necessary on diesel fuel; (2) significantly lower emissions; (3) a 50% smaller operating footprint; and (4) lower fuel and operating costs.
The TPUs were introduced to several North American unconventional shale resource basins in 2011 and established a proven track record with several large independent oil and gas companies, as well as at least one super-major oil and gas company. Using the TPUs and our recently acquired complementary equipment, we expect to assemble a full pressure pumping fleet at a significantly discounted capital cost to a conventional pressure pumping fleet. The complementary equipment consists of a proprietary control system, data vans and blenders. We expect the resulting TPU well stimulation fleet to generate attractive returns while demonstrating our operating capabilities to our prospective international customers.
| 1 |
Our Markets
The “shale revolution” has transformed the economics of oil and gas production in the U.S., reversing 40 years of declining crude oil production and dramatically increasing natural gas supply, a trend with far-reaching implications. The U.S.’s extraordinary success with unconventional resources has prompted many to consider whether other countries with similar unconventional resources could also attain commercial success in developing those resources.
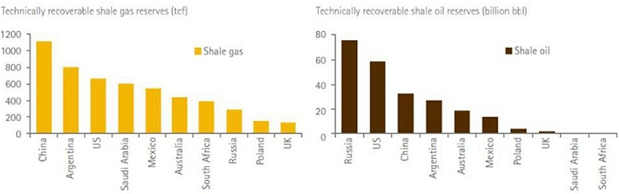
According to the U.S. Energy Information Administration (“EIA”), approximately 80% of global shale resources lie outside the U.S. and more than half of the shale oil is concentrated in Russia, China, Argentina and Libya, while more than half of the shale gas outside the U.S. is concentrated in China, Argentina, Algeria, Canada and Mexico. As one of the top-five countries in the world with technically recoverable shale resources, we believe that Argentina is well-positioned to attract significant new investment in unconventional development. It is also our belief that Argentina represents the country most likely to replicate the success of North American shale basins utilizing proven advanced well stimulation techniques.
We believe the experience of North America during the last ten years provides a model for what is likely to occur in emerging unconventional shale basins such as Argentina. According to Baker Hughes Incorporated (“Baker Hughes”) and management estimates, the drilling rig count in the Eagle Ford shale increased from four rigs and one well stimulation fleet in 2008 to approximately 265 drilling rigs and 87 well stimulation fleets in 2012, a ratio of one well stimulation fleet to every three drilling rigs. The increase in unconventional drilling in the U.S. has had a dramatic impact on domestic oil and natural gas production and has positioned the U.S. to significantly reduce its dependence on foreign energy sources. In addition, efficiencies were developed in the drilling techniques which made the drilling rigs and drilling process more efficient, increased the need for well stimulation fleets and resulted in a significant increase in domestic oil and gas production. This increase in production in 2013, 2014 and 2015 resulted in an oversupply of oil and gas in the global markets which in turn significantly contributed to the dramatic fall in commodity prices. This decrease in commodity prices, particularly the price of oil, has significantly reduced drilling and completion activity in all of North American shale basins. For example, in March 2016, the Eagle Ford shale play in Texas had only 52 drilling rigs operating.
By comparison, we expect the combination of excellent, high-quality liquid-rich shale (comparable to the Eagle Ford in the U.S.), manageable logistics/costs, and improving regulatory framework from a supportive, motivated government to drive a similar increase in Argentina’s shale production. According to Baker Hughes, there were 107 drilling rigs operating in Argentina in April 2015. Based on announcements from several major drilling contractors, there are in excess of 20 shale capable drilling rigs which have arrived in Argentina over the last 18 months to participate in the development of shale resources. YPF has indicated that it is running 11 rigs in its Vaca Muerta field as of March 4, 2016. This is down from 17 rigs in 2015. We are projecting the shale drilling rig count in Argentina to increase in the coming years in a similar manner to the Eagle Ford play in Texas, albeit at a slower rate, thus implying a significant increase in the related demand for well stimulation equipment. In addition, in the Eagle Ford play, the number of days necessary to drill an unconventional horizontal well has been reduced from 100 days in 2007 to less than 10 days in 2016. This implies that more well stimulation crews may be required for each active drilling rig.
We believe that there are approximately five large unconventional well stimulation fleets currently in Argentina capable of completing large multi stage pressure-pumping jobs. If the experience in the Eagle Ford is indicative of what can be expected in Argentina, this would imply a significant increase in demand for the Company’s services in Argentina over the next several years.
| 2 |
Market Segmentation
We have been actively conducting well stimulation work in Argentina since December 2014. Based on our experience in the country, we believe the well stimulation market is segmented into three sub-markets consisting of the conventional, tight gas and unconventional segments. The conventional market consists of projects where the completion work can be addressed with 10,000 HHP or less; the tight gas market generally consists of projects requiring a minimum of 16,000 HHP; and the unconventional market generally requires a minimum of 22,000 HHP. For 2015, these sub-markets represent approximately 33%, 32% and 35%, respectively of the overall well stimulation market.
While our well stimulation work to date has primarily been focused on the conventional market, we have now taken delivery of 11,250 HHP of new pumping equipment. Further, in order to meet the requirements and participate in the bidding process on the rapidly growing unconventional activity, in the second quarter of 2016, we intend to bring in six TPU trailers, with each trailer having 4,500 HHP, representing 27,000 HHP. This equipment will be packaged together with our existing equipment and our new equipment when necessary to form a comprehensive unconventional spread with redundancy as required to minimize operational downtime. We intend to have approximately 50,000 HHP in Argentina by the end of the second quarter of 2016.
Our Services
Pressure Pumping
Our customers utilize our pressure pumping services to enhance the production of oil and natural gas from formations with low permeability, which restricts the natural flow of hydrocarbons. The technique of well stimulation consists of pumping a fluid into a cased well at sufficient pressure to create new channels in the rock, which can increase the extraction rates and the ultimate recovery of the hydrocarbons. Our equipment is contracted by oil and gas producers to provide this pressure-pumping service, which is referred to as a well stimulation fleet. We offer a state-of-the-art pumping fleet, including well-stimulation pumps, nitrogen pumping units and cranes, in both trailer-mounted and skid-mounted configurations. We expect to have the capability of providing a variety of pressure-pumping services, including work-over pumping, well injection, and wireline pump downs.
A portion of our pressure pumping equipment consists of our TPUs, which are powered by remanufactured turbine engines previously used in military applications. Each turbine engine generates approximately 4,000 horsepower and therefore when operating at 2,000 HHP, the engine is running at approximately 50% of its capacity. As a result, these turbine engines have a reputation for reliability and durability. They also weigh approximately 1,200 pounds (as compared to a typical reciprocating engine of comparable horsepower, which generally weighs approximately 12,000 pounds). The weight differential allows for better use of space on a trailer and more efficient operations. We believe the TPUs are more cost effective to operate and maintain than conventional diesel-powered equipment when run on natural gas. Prior field operations with our current TPUs have demonstrated compliance with emission standards for nitrogen oxides (“NOx”) and carbon monoxide under the EPA’s Tier 4 standards that regulate emissions from certain off-road diesel engines. Turbine engines also have significantly lower methane leakage compared to reciprocating engines.
The following table compares our TPUs to conventional diesel-powered pressure pumping equipment.
| Turbine-Powered | Conventional Diesel-Powered | |||
| Multi-Fuel Capability | Natural gas produced onsite (“Field Gas”), LNG, CNG, diesel, or a blend of diesel and natural gas (“Bi-fuel”) | Diesel or Bi-fuel | ||
| Emissions (using diesel) | Lower than typical diesel emissions: have met Tier 4 standards for NOx and carbon monoxide | Requires catalytic converter to meet Tier 4 standards (reduces HP, additional cost) | ||
| Horsepower (“HHP”) per trailer | 4,500 HHP (2 pumps) | 2,250 HHP (1 pump) | ||
| Major Engine Repair | Generally onsite repair or exchange | Shop |
| 3 |
Coiled Tubing
Our customers utilize our coiled tubing services to perform various functions associated with well-servicing operations and to facilitate completion of horizontal wells. Coiled tubing services involve the insertion of steel tubing into a well to convey materials and/or equipment to perform various applications as part of a new completion or the servicing of existing wells, including wellbore maintenance, nitrogen services, thru-tubing services, and formation stimulation using acid and other chemicals. Coiled tubing has become a preferred method of well completion, workover and maintenance projects due to speed, ability to handle heavy-duty jobs across a wide spectrum of pressure environments, safety and ability to perform services without having to shut-in a well. Our coiled tubing capabilities cover a wide range of applications for horizontal completion, work-over and well-maintenance projects.
Field Management
We recognize that energy companies are under intense pressure to increase reserves at reduced finding costs while simultaneously coming under heightened environmental scrutiny. We have taken steps to create an innovative methodology for reducing costs, improving efficiencies and increasing resource recovery rates, which incorporates geophysics, geology and geomechanical properties and various downhole diagnostics tools, including fiber optic acoustic and temperature measurements as well as downhole pressure gauges. Our suite of advanced but fully commercialized technologies can be combined to provide both highly efficient predictive models to our customers and downhole diagnostic measurements to confirm the accuracy of those predictions while providing a full suite of other information about well integrity, stimulation results, production flow properties and long term monitoring well production characteristics.
Our proprietary technologies are used to reduce the number of stages required to optimize production, which can result in a substantial reduction of the environmental footprint and costs of completing a well. Based on many predictive models executed in several North American shale basins, we believe that the best and most productive stages often occur in brittle and naturedly fracture rock formations (“micro-fracture swarms”). These micro-fracture swarms are too small to detect with 3D seismic, but their location can be inferred using a proven attribute analysis combined with core analysis and well diagnostic information. We believe that stimulation efforts in these areas tend to be more effective and frequently result in a better stimulation effort, which in turn produces more hydrocarbons. We also have the capability to monitor the cementing and stimulation operation and the ongoing production results in real time over the life of the well, measuring the type and quantity of inflow from each stimulation stage. This data allows our customers to confirm and refine the predictability of our Geo-Predict® technology and related field services. Once the Geo-Predict® technology and our services are demonstrated to be accurate and reliable in a given area, it then offers compelling opportunities to lower production costs while simultaneously reducing the environmental impact as a result of completing fewer, better targeted stages with less horsepower and less water. In cases where the fiber optic diagnostic system is permanently installed in a well, we believe the information provided allows for proactive management of the well’s performance over the life of the well, including the ability to actively shut off zones with unwanted water flow.
Growth Strategy
Our objective is to be one of the most effective, efficient, and environmentally responsible well stimulation and completions service providers in the world. We intend to prioritize risk management and specialize in the high-end well stimulation market, while seeking to achieve strong operating margins and increased market share generating long-term shareholder value. We intend to build upon our competitive strengths to grow our business and continuously increase our revenues and operating income by executing the following strategies:
| 4 |
Bring best practices and established technologies to capitalize on growth opportunities in the development of international unconventional resource basins.
Our management team recognizes the importance of product and service differentiation and believes we have secured key technologies that will allow our service offerings to compete directly with larger and more established oilfield service companies currently operating in both the North American and international markets. These technologies include certain proprietary geophysical, geological and geomechanical predictive tools and specialized down-hole diagnostic tools, which we believe will ultimately allow for the targeting of “sweet spots.” We believe this targeting enables us to either reduce the number of stimulation stages executed in each well without sacrificing production or increase the production by optimizing the placement of the stages. In addition, we believe with proper real-time diagnostics data, we will be able to detect changes in strain and stress directly attributable to the well stimulation process thus allowing changes to the treatment as necessary on each stage.
We believe our Company is positioned for growth based on a sound business plan, responsible corporate governance, experienced personnel and growing demand for environmental protection during oil and gas production. We recognize that well stimulation now faces intense environmental scrutiny and we have taken steps to ensure that our operations offer the most environmentally friendly solutions available in the industry. These techniques combine a number of processes and technologies in a manner that allows for a significant reduction in emissions, water usage and horsepower, while optimizing the number and placement of stimulation stages. In many well completion operations, we believe the following tools or process enhancements will improve the overall economics:
| ● | Predictive geophysical tools, which allow for the identification of “sweet spots” and efficient stimulation stage placement and treatment; | |
| ● | Sliding sleeve-based perforating and well stimulation system (65% less HHP); | |
| ● | Temporary or permanent fiber optic recording system to measure the performance of each stage and well integrity and to track the stimulation process; and | |
| ● | Empirical diagnostic data gathered to improve and build confidence in the predictions (goal is fewer stages with same or better production). |
Leverage established local relationships in international markets.
We have assembled a team of industry professionals with significant international experience in oilfield services, including key executives with a particular emphasis on the well stimulation business. We are currently conducting operations in Argentina, where our management and operational team have long-standing relationships with customers and energy professionals. We also intend to pursue other markets where our management team has similar relationships so long as those markets meet our investment criteria.
Key ranking criteria for international shale market opportunities.
We evaluate six distinct characteristics in determining the viability of potential new markets for our services:
| ● | Regional geology. The quality and complexity of the rock, the presence of data about the resources it contains, and the ability to adapt existing technologies to local rock characteristics. | |
| ● | Pace of activity. Established energy activity with the prospect of growth in high-volume drilling and well stimulation operations. | |
| ● | Demand for hydrocarbons. Sufficient local demand or, alternatively, established oil and gas distribution networks that can transport resources to consuming markets, either locally or through export. | |
| ● | Land access and operability. Developed infrastructure such as roads, rail, housing, fuel, pipelines, water availability, and a strong oil and gas workforce. | |
| ● | Local relationships. Established and long-standing relationships with local customers and energy professionals, as well as trusted advisors with an understanding of local laws, business process, tax issues and customary business practice. | |
| ● | Business environment. Positive and viable business environment. Manageable local regulations, taxes, security, culture and customary ethics practices. Positive views from the local community and activist organizations. |
| 5 |
We believe that it is important to consider each of these factors in addition to fiscal support and the estimated size of the resource base when assessing the viability of unconventional development. Markets that are promising in one category may pose obstacles to investment in other categories. The more factors that are favorable in each prospective location, the more likely that location will qualify as a viable investment opportunity. This process led to our decision to enter the Argentine market as our initial operations focus.
Proactively manage international risk.
Operating in international markets requires us to take on additional risk. We plan to conduct a formal risk assessment whenever considering our entry into new markets. As such, we have established internal controls intended to protect ourselves from foreign market risks, including but not limited to foreign currency exchange, tax, political and economic risks.
Our executive team’s assessment includes an understanding of local laws, regulations, cultures and ethics prior to entering any new market. Additionally, we may seek partners with local relationships and knowledge to reduce risk and to tailor our approach to the specific market. Because emerging markets inherently have rapidly changing risk profiles, we intend to conduct a thorough risk assessment not only prior to entering a new market, but also periodically while conducting operations to identify and address necessary changes.
In connection with these assessments, we believe that we benefit from our association with our largest investors, who are dedicated to Argentina and other emerging markets. We believe that they are incentivized to actively support our growth strategy and provide us with their extensive experience in pursuing successful investments in emerging markets.
Competitive Strengths
We believe our significant competitive strengths are as follows:
Ability to identify proven technologies that have high margin applications in international shale basins.
Our management team recognizes the importance of product and service differentiation. We believe that we have identified several key technologies (as well as securing partners with key technologies) that will allow emerging international shale basins to be developed in a cost effective and more ecological manner.
We have assembled a suite of technologies and methodologies designed to generate the empirical data needed to ultimately reduce stages and improve the estimated ultimate recovery. This process starts with our proprietary Geo-Predict® software and interpretation tools, which quickly and cost effectively predicts both stimulation hazards and potential “sweet spots” using proven seismic processing and interpretation techniques as well as describing geological and geomechanical properties (step 1 in the diagram below). This enables the operator to assess the locations of zones in the formation where well stimulation is most likely to be effective, potentially reducing the number of stages that must be stimulated, and the associated cost. The wells are then stimulated according to the customer’s plan (step 2 in the diagram below). Our advanced fiber optic measurement tools or, if more applicable, standard production logging tools can then measure the accuracy of each prediction, by identifying stage-by-stage flow properties on a real-time basis (in the case of fiber optics) (step 3 in the diagram below). The final step in the process involves using the stage-by-stage flow-property data to update the predictive model generated using Geo-Predict® (steps 4 and 5 in the diagram below). After developing sufficient data in a new area, and correlating the best production zones to identifiable markers in the sub-surface model, our Geo-Iteration® process allows our customers to target with confidence those zones which consistently yield strong production results.
| 6 |
The following diagram depicts an overview of our technology platform.

Further, we have secured strategic arrangements with some of the stronger unconventional technology companies currently participating in the development of unconventional shale basins in North America. These include specialized “green” chemical fluid providers, down-hole fiber optic recording systems, specialized software and modeling techniques and down-hole sliding-sleeve completion tools. These technologies (both controlled by us and available to us through partnerships or alliances) allow us to present a broad consortium of products and services to our international customers. In addition, we can bring unique value through our TPUs referred to below.
Differentiated turbine-powered equipment.
Our TPUs have multiple benefits over conventional diesel-powered well stimulation equipment, including:
| ● | Greater fuel flexibility. Our TPUs can operate on field gas, LNG, CNG or diesel, whereas conventional fracturing equipment can generally operate on only diesel or a combination of diesel and natural gas. We believe our ability to operate our TPUs with various types of fuels, particularly natural gas, will provide significant value for our customers through, among other things, potential cost savings and ease of compliance with increasingly difficult emissions standards. Based on our extensive due diligence and field analysis, we believe that a gas-fired turbine powered pressure pumping crew operating in the U.S. market can save approximately $7 million per year in diesel fuel cost in situations where natural gas is purchased at market prices and diesel costs remain at their five year average of $3.50 per gallon. With lower prices for diesel as a result of the current oil price decline, the savings are reduced proportionately. In other situations, where natural gas is otherwise being flared, the annual potential savings are much greater. In the international markets where diesel fuel can be 2-3 times more expensive than in the U.S., we estimate that this equipment could potentially save a customer $10-12 million per year on fuel for a single pressure pumping fleet. | |
| ● | Lower emissions. Our TPUs, even when running on diesel fuel, produce lower emissions than conventional diesel-powered fracturing equipment and currently are 60% below the Tier 4 standards for NOx and carbon monoxide gas emissions. Also, the methane release from turbine powered engines is almost non-existent as compared to releases from even the best diesel or Bi-fuel engine. Finally, the opportunity to use field gas enables our customers to reduce their “flaring” of natural gas, a source of “greenhouse gas” (“GHG”) emissions and a waste of a valuable resource that is subject to increasing regulatory scrutiny in the U.S. and elsewhere. | |
| ● | Smaller footprint. Our TPUs are uniquely outfitted with twin triplex pumps capable of generating 4,500 total HHP from each trailer, whereas conventional configurations allow for only a single diesel-powered pump (1,800-2,500 total HHP) on a trailer, thus substantially reducing footprint. | |
| ● | Easier major engine repair or replacement. Because our turbine engines are much smaller and lighter than conventional diesel engines, we have the option to repair or replace turbine engines onsite, whereas a repair or replacement of a diesel engine generally requires transporting such engine to a repair shop. We have identified an Argentina based maintenance company to provide repair and maintenance services in country. |
| 7 |
Highly experienced leadership team that have successfully built, operated, and sold other oilfield service companies.
Members of our executive leadership team bring an approximate average of 25 years of experience in the energy sector, and maintain long-standing relationships with many leading public and private exploration and production companies in the U.S. and in international markets.
Our management and operational team have extensive industry experience providing field management and well stimulation services to exploration and production companies in both international and domestic markets. We believe that we are well-staffed to execute our business plan in active shale and unconventional oil and natural gas basins located outside the U.S. We plan to utilize our strategic relationships to develop oilfield service business opportunities initially in Latin America, with a particular focus in Argentina, Mexico and Colombia. Members of our management team have been involved with establishing oil-service businesses (including geophysical, offshore drilling, and well-stimulation) in Algeria, Argentina, Australia, Brazil, Canada, China, Colombia, Egypt, Indonesia, Iraq, Kazakhstan, Malaysia, Mexico, Mozambique, Nigeria, Norway, Oman, Peru, Saudi Arabia, Turkey, UAE, the U.K. and the U.S.
Industry leading strategic partners with international experience.
We believe that we benefit from our association with our largest investors, who are dedicated to Argentina and other emerging markets, which currently have four representatives serving as members of our Board. Based on their ownership interests in us, we believe that our latest investors are incentivized to actively support our growth strategy and provide us with their extensive experience in pursuing successful investments in emerging markets.
Customers
Our customers consist primarily of international oil and gas exploration and production companies including national oil companies, local privately-held exploration and production companies and, on occasion, other service companies that have contractual obligations to provide well stimulation and completion services. Demand for our services depends primarily upon the capital spending of oil and gas companies and the level of drilling activity in international markets. To date, substantially all our revenue generated is attributable to a few customers, including YPF and several smaller local exploration and production companies.
Competition
We operate in a highly competitive environment. Our competitors include Schlumberger, Halliburton, Weatherford, Baker Hughes, Calfrac Well Services, San Antonio International and other oilfield service companies. We compete with these companies in our current markets. We believe that in the future we will face increased competition from these competitors as our Company and these competitors expand their operations. At this time, we believe that there are insufficient services being offered locally in Argentina to service a major unconventional field, but there can be no assurance that additional competitors will not enter markets served or proposed to be served by us. Most of the entities against which we compete, or may compete, are larger and have greater financial resources than our Company. No assurance can be given that increased competition will not have an adverse effect on our Company.
| 8 |
Suppliers and Raw Materials
We are acquiring well stimulation fleets from well-established manufacturers of such equipment in order to assure we operate reliable and high-performing fleets with the capability to meet the most demanding pressure and flow rate requirements in the field. We have purchased equipment from Stewart & Stevenson Manufacturing Technologies LLC, one of the most highly-regarded manufacturers of well stimulation equipment in the U.S., and a local Argentine manufacturer, which we believe to be currently the only significant manufacturer of such equipment in Argentina although other manufacturers have begun to establish operations in recent months. We have also purchased 12 trailers with 24 TPUs from a private company. This equipment was originally manufactured by Turbine Powered Technology, LLC located in Abbeville, Louisiana. This equipment has been thoroughly upgraded including new control systems to enhance performance as compared with prior operational capabilities.
We intend to purchase or lease well stimulation equipment to grow our business outside the U.S. as demand for our services in these markets increases. In addition, we have and may continue to pursue opportunities to acquire well stimulation and coiled tubing assets or businesses currently operating in the U.S., with the goal of eventually relocating such assets to faster-growing or higher-margin international markets. We believe that well stimulation and coiled tubing equipment may be available from time to time at favorable prices given the volatility of commodity prices in the U.S.
Environmental Regulation
Our operations and the operations of our customers are subject to increasingly stringent laws and regulations relating to importation and use of hazardous materials, radioactive materials and explosives and to environmental protection, including laws and regulations governing air emissions, well stimulation and pressure pumping, water use and discharges, wetlands or land use practices, waste management, and the release of hazardous substances into the environment. We incur, and expect to continue to incur, capital and operating costs to comply with environmental laws and regulations. The technical requirements of these laws and regulations are becoming increasingly complex, stringent and expensive to implement. In addition, these laws may provide for “strict liability” for remediation costs, damages to natural resources or threats to public health and safety. Strict liability can render a party liable for damages without regard to negligence or fault on the part of the party. Failure to comply with these laws and regulations may result in the assessment of administrative, civil and criminal penalties, the imposition of remedial obligations and the issuance of orders enjoining some or all of our customers’ operations in affected areas.
Current or future legislation, regulations and enforcement initiatives may curtail production and demand for hydrocarbons such as oil and natural gas in areas of the world where our customers operate and thus adversely affect future demand for our services, which may in turn adversely affect future results of operations.
Well Stimulation
Many national, provincial, and local governments and agencies have adopted laws and regulations or are evaluating proposed legislation and regulations that are focused on the extraction of shale gas or oil using well stimulation, which is part of the well stimulation services we provide to our customers. Well stimulation is a treatment routinely performed on oil and gas wells in low-permeability reservoirs. Specially engineered fluids are pumped at high pressure and rate into the reservoir interval to be treated, causing cracks in the target formation. Proppant, such as sand of a particular size, is mixed with the treatment fluid to keep the cracks open when the treatment is complete. In response to concerns related to potential impacts to the environment and natural resources from well stimulation, governmental authorities have issued new rules and regulations governing the practice, and are also pursuing studies related to its potential effects. Also, some national, state, and local governments have adopted bans or other measures restricting well stimulation activities. For example, the Province of Neuquén in Argentina, where we operate, has approved a set of rules regarding the extraction of shale oil and gas. These rules require, amongst other things, that operators performing well stimulation obtain permits prior to commencing drilling activities and file reports with the provincial government regarding the chemicals used in the well stimulation process and an analysis of the flowback water returning to the surface. In certain regions, the indigenous people have voiced their opposition to the increased shale development although to date these protests have been peaceful and have yet to disrupt activity in a meaningful way. In addition, several other provinces and local governments have voted to ban well stimulation within their borders, and some groups continue to advocate for a national ban on well stimulation in Argentina.
| 9 |
Future well stimulation-related legislation or regulations that further restrict or prohibit such activities could lead to operational delays and increased costs for our operations or the operations of our customers. Any adverse impacts on the operations of our customers could in turn reduce demand for our services. If such additional legislation or regulations are enacted, it could adversely affect our financial condition, results of operations and cash flows.
Climate Change
International, national, and state governments and agencies are currently evaluating and promulgating legislation and regulations that are focused on restricting emissions commonly referred to as GHG emissions in response to concerns that GHGs contribute to climate change. For example, in the U.S., the EPA has taken steps to regulate GHGs as pollutants under the federal Clean Air Act. The EPA’s “Mandatory Reporting of Greenhouse Gases” rule established in 2010 provided a comprehensive national scheme of regulations that require monitoring and reporting of GHG emissions, including emissions from the oil and gas industry. The U.S. has also taken steps to regulate emissions of methane from the oil and natural gas sector. The Company believes its TPU’s emit significantly less methane than the more commonly used diesel engines and therefore as regulations tighten, these TPU’s will provide a low cost competitive advantage.
International developments focused on restricting the emission of carbon dioxide and other gases include the Paris and the Copenhagen Accords (the latter is an internationally-applied protocol which has been ratified by several countries in Latin America and is a continuation of the Kyoto Protocol) and the European Union’s Emission Trading System. Argentina, Brazil, and Mexico have all committed to reducing GHG emissions, either through the deployment of renewable energy sources or through the use of a cap and trade program. Such programs place a cap on GHG emissions at certain sources and require those sources to purchase allowances for emissions above their cap. In addition, in October 2015, Argentina announced an unconditional target to reduce GHG emissions including those emissions resulting from land use, land use change and forestry activities, by 15% below current emissions by 2030. The adoption of legislation or regulatory programs to reduce emissions of GHGs could require us or our customers to incur increased operating costs, such as costs to purchase and operate emissions control systems, to acquire emissions allowances or comply with new regulatory or reporting requirements. In addition, current or future legislation, regulations and developments may curtail production and demand for hydrocarbons such as oil and natural gas in areas of the world where our customers operate and thus adversely affect future demand for our services, which may in turn adversely affect future results of operations.
Finally, it should be noted that some scientists have concluded that increasing concentrations of GHGs in the Earth’s atmosphere may produce climate changes that have significant physical effects, such as increased frequency and severity of storms, floods and other climatic events; if any such effects were to occur, they could have an adverse effect on our operations and the operations of our customers.
Employees
As of December 31, 2015, we have 84 employees, 79 of which are full-time employees, and 5 consultants.
Intellectual Property
We have registered or filed for registration with the United States Patent and Trademark Office for the following trademarks: Geo-Predict® and Geo-Iteration®. We have not filed any applications for the registration of our trademarks in foreign jurisdictions, but may do so in the future as we deem necessary to protect our business.
| 10 |
Legal Proceedings
We are not a party to, and none of our property is the subject of, any pending legal proceedings. To our knowledge, no governmental authority is contemplating any such proceedings.
Operating Risk and Insurance
We maintain insurance coverage of types and amounts that we believe to be customary and reasonable for companies of our size and with similar operations. In accordance with industry practice, however, we do not maintain insurance coverage against all of the operating risks to which our business is exposed. Therefore, there is a risk our insurance program may not be sufficient to cover any particular loss or all losses. Currently, our insurance program includes, among other things, general liability, umbrella liability, sudden and accidental pollution, personal property, vehicle, workers’ compensation, and employer’s liability coverage. Our insurance includes various limits and deductibles or retentions, which must be met prior to or in conjunction with recovery.
Recent Developments
Equity Offering
On February 19, 2015, the Company sold 1,051,376 shares of common stock at a price of $5.75 per share for gross proceeds to the Company of $6,045,412. The Company used a portion of the net proceeds from the offering to finance capital expenditures, for working capital and for general corporate purposes and expects to use the remainder of the proceeds for additional capital expenditures and working capital.
On July 15, 2015, the Company sold 6,164,690 shares of common stock at a price of $4.75 per share for gross proceeds to the Company of $29,282,278. The Company used the net proceeds from the offering to finance capital expenditures, fund working capital and for general corporate purposes.
Corporate History
Vision Global Solutions, Inc. (“Vision”) was formed as a Nevada corporation on January 7, 2005. On December 11, 2013, Vision acquired FracRock International, Inc., a privately held Delaware corporation (“FRI”), which resulted in a change of control of the Company. Pursuant to that certain Agreement and Plan of Reorganization dated as of September 18, 2013, by and among Vision, FRI Merger Sub, Inc., a newly formed wholly owned Delaware subsidiary of Eco-Stim (“MergerCo”), and FRI, MergerCo merged with and into FRI, with FRI surviving the merger as a wholly owned subsidiary of the Company, which was re-named Eco-Stim Energy Solutions, Inc. (the “Merger”). On May 5, 2014, FRI merged with and into Eco-Stim, with Eco-Stim surviving the Merger.
Frac Rock International, Inc., a predecessor of our Company, was incorporated as a British Virgin Island company (“FRIBVI”) on December 30, 2011. On October 4, 2013, FRIBVI merged with and into FRI pursuant to an Amended and Restated Agreement and Plan of Merger.
Corporate Information
We are a Nevada corporation. Our principal executive offices are located at 2930 W. Sam Houston Pkwy N., Suite 275 Houston, Texas 77043, and our main telephone number at that address is (281) 531-7200. Our website is available at www.ecostim-es.com. Information contained on or available through our website is not part of or incorporated by reference into this Form 10-K or any other report we may file with the Securities and Exchange Commission (the “SEC”).
We file our reports, proxy statements and other information with the SEC. You can read and copy these reports, proxy statements and other information concerning Eco-Stim at the SEC’s Public Reference Room at 100 F Street, N.E., Washington, D.C. 20549, on official business days during the hours of 10 a.m. to 3 p.m. Please call the SEC at 1-800-SEC-0330 for further information about the operation of the SEC’s Public Reference Room. The SEC also maintains an internet site that contains all reports, proxy statements and other information that we file electronically with the SEC. The address of that website is http://www.sec.gov.
| 11 |
INDUSTRY
Industry Overview
The pressure pumping industry provides well stimulation services to oil and natural gas companies. Well stimulation involves pumping a fluid down a perforated well casing, sliding sleeve or tubing under high pressure to cause the underground formation to crack, allowing the oil or natural gas to flow more freely. A propping agent is suspended in the fracturing fluid and props open the cracks caused by the well stimulation process in the underground formation. Proppants generally consist of sand, bauxite, resin-coated sand or ceramic particles.
We believe the two main factors influencing demand for well stimulation services are (1) the level of horizontal drilling activity by oil and natural gas companies, and (2) the stimulation requirements of the well being drilled, including the number of fracturing stages and the type and volume of fluids, chemicals and proppant pumped per stage. When drilling a horizontal well, the operator drills vertically into the formation and “steers” the drill string to create a horizontal section of the wellbore inside the target formation, which is referred to as a “lateral.” This lateral is divided into “stages,” which are isolated zones that focus the high-pressure fluid and proppant being pumped into the well into distinct portions of the wellbore and surrounding formation.
Over the last decade, technological advancements in horizontal drilling and multi-stage well stimulation have brought about a shift from the development of conventional oil and natural gas resources to the exploitation of the vast resource potential available across many of North America’s unconventional resource basins. These unconventional resources are characterized by shale formations spanning large areas, which in most cases require some form of stimulation to produce commercial amounts of hydrocarbons. These advanced completion techniques have allowed oil and natural gas producers to extract hydrocarbons from both conventional and unconventional resources that were previously thought to be uneconomic, resulting in significant increases in unconventional drilling activity. Moreover, operators are now also revisiting long-producing properties and redeveloping them using horizontal directed drilling that allows for longer horizontal laterals and more stages in stimulating the wells.
Longer laterals have resulted in operators increasing the number of stages per well, which has enhanced production rates while improving well economics. The total number of stages performed has steadily risen in recent years. However beginning in late 2014, as a result of the significant decline in drilling activity resulting from the low commodity prices, the number of well completions and stages has declined significantly resulting in an excess supply of equipment and service providers in the U.S. and Canada.
According to the EIA, approximately 80% of global shale resources lie outside the U.S. and more than half of the oil shale is concentrated in Russia, China, Argentina and Libya, while more than half of the shale gas outside the U.S. is concentrated in China, Argentina, Algeria, Canada and Mexico as illustrated in the following exhibit:
| 12 |
Selected Estimated Technically Recoverable Shale Oil and Shale Gas Resources

Source: EIA
Shale development activity has progressed at a modest pace in many international regions due to several critical factors, including relatively poorly understood geology, prohibitive well costs, lack of government incentives and pipeline infrastructure, and various other environmental and social considerations. Given the variation across the world’s shale in both geology and above-ground conditions, the extent to which global resources will prove to be economically recoverable is not clear. The market impact of shale resources outside the U.S. will depend on each country’s respective geology, infrastructure and other local factors.
According to the EIA, Argentina ranks in the top tier of unconventional shale opportunities outside of the U.S.
Size of Potential Resources
Source: EIA
Though many locations around the world that have both a wealth of unconventional resources and regimes that support investment, actual unconventional activity varies widely. We believe significant commercial success outside the North American market has only been achieved in Argentina and China.
Of those countries with substantial shale potential, Argentina’s improving regulatory framework and favorable geological fundamentals has shown the most significant promise. In a recent report, the EIA/Advanced Resources International, Inc. listed Argentina as possessing the world’s third-largest shale potential, with technically recoverable resources of 27 billion barrels of oil equivalent of shale oil and 802 trillion cubic feet of shale natural gas. Despite the challenging macro-political situation of the country, the attractiveness of below-ground fundamentals has been enough to spark a wave of investments. More specifically, the high-quality liquids-rich Vaca Muerta in the Neuquén Basin has been identified as one of the most promising areas in Argentina’s shale formations in terms of both size and hydrocarbon quality, including areas that are more “oily,” thus presenting better economics. By itself, Vaca Muerta represents approximately 40% of the country’s total estimated shale gas resources and approximately 60% of its total estimated shale oil.
| 13 |
The map below illustrates the identified shale basins within the country of Argentina.
Argentina’s Shale Basins
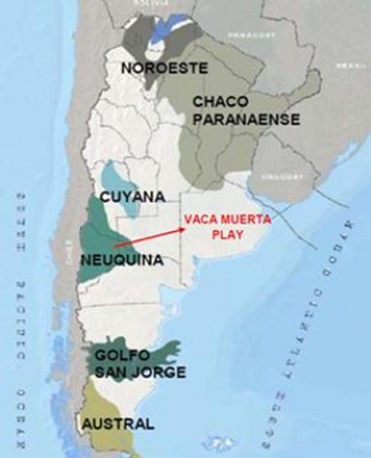
Source: YPF
Neuquén is an established basin with significant conventional oil and gas production and existing infrastructure, including roads, pipelines and railways. There is also an existing oil and gas workforce in Neuquén; however, the new technologies associated with developing unconventional resources will require new training of the workforce. In addition, the prevalence and power of unions across all aspects of the operation—from transport to fracturing services—are likely to contribute to the cost and complexity of developments.
Heavily regulated, Argentina has traditionally been a challenging environment for foreign investment. Energy sector policies have limited the industry’s attractiveness to private investors while shielding Argentina consumers from rising prices. Consequently, domestic demand for energy has grown rapidly while production of both petroleum and other liquids and natural gas has declined – leading Argentina to depend increasingly upon energy imports. In order to ensure that domestic demand is met, crude oil is subject to export taxes and restrictions on export volumes, which limit the profits that companies are able to generate from selling Argentine production abroad.
The support for the development of Argentina’s resource basins is now considered of national interest. Since 2009, Argentina has begun to import energy from outside the country. The need to purchase energy from outside the country has continued to accelerate for the past five years culminating with an import of over 32.5 million cubic meters per day of natural gas and LNG by 2014, according to a Platts report dated December 3, 2014. This situation has created a significant trade imbalance and has put pressure on the local currency as Argentina’s dollar reserves have dwindled significantly over the past few years. We believe this situation is unsustainable and will further support the development of the Vaca Muerta shale resource as well as other resource basins in the country.
| 14 |
With production falling significantly and imports increasing over the last five years, the Argentine government has committed to developing its unconventional resources by offering attractive investment incentives to the energy sector. For example, Argentina initiated a new oil and gas promotion regime in 2013 that includes exemptions from the export tax for up to 20% of production after five years from the start of each project with a total five-year investment over $1 billion. In October 2014, the government passed a new hydrocarbon law which reduced the minimum five-year investment to $250 million. In addition, the maximum royalty due to the provincial government was capped at 12% while the holding period for concessions was extended to as much as 35 years. Lastly, according to YPF, the new petroleum law sets the price of new natural gas production at $7.50 per mmbtu and $67.50 per barrel for light sweet crude while setting the price for heavy oil at $34 per barrel. The government has also passed laws to eliminate the customs duties on drilling equipment under certain circumstances, which we believe is an effort to reduce obstacles to the development of the shale resources in the country.
One of the more significant developments recently is the industry shift that started in late 2015 from vertical unconventional wells to horizontal unconventional wells as operators have concluded that horizontal wells tend to produce significantly better than vertical wells. In 2015, the industry began to see cost reductions through more efficient operations. In this early phase of horizontal well development, understanding of the Vaca Muerta formation requires a focus on appropriate shale play analogues such as the Eagle Ford play in the U.S. As new data becomes available, close work between the different disciplines is critical. Technological integration, as well as an understanding of local variability within an area of interest, will play a key role in the identification of the sweet spots and the cost-efficient de-risking of the play. Technologies to better understand the reservoir characteristics, rock properties, strains and stresses within the formation as well as helping to identify optimal well placement, depth, orientation and high probability production zones will be critical to reducing costs and improving recovery rates.
Recent Industry Trends
We believe the following principal trends are positively correlated to increasing demand for our services while facilitating implementation of our business strategy:
Ongoing, sustained development of existing and emerging unconventional resource basins.
We believe the continued development of unconventional resource basins will be in the national interest of the countries in which those basins are located. We expect the long-term capital for their development will be provided in part by the participation of large exploration and production companies that have made, and continue to make, significant capital commitments through joint ventures and direct investments in North American and international unconventional basins. In particular, nationally owned oil and gas companies are focused on growing oil and gas production in the local communities in which they operate. We believe that these companies are less likely to materially alter their drilling programs in response to short-term commodity price fluctuations given their focus on national interests in securing long-term supplies of oil and gas.
Increased focus on international development of unconventional resources.
Unconventional resources, specifically shale gas, tight gas, shale oil and tight oil, have revolutionized the energy landscape in North America and made a significant impact on global commodity prices, using new technologies such as horizontal drilling and well stimulation to access previously unavailable resources. Oil and natural gas companies have begun to apply the knowledge gained through the extensive development of unconventional resource basins in North America to international resource basins, including in Latin America. With an improving regulatory framework and favorable geological fundamentals, we believe Argentina is well-positioned to exploit its oil and natural gas resources. Chevron Corp., Royal Dutch Shell Plc, Dow Chemical, Total S.A., ExxonMobil Corporation and YPF among others have announced development plans in the region, including joint ventures with several billion dollars in commitments. For example, between 2011 and 2014, YPF has increased the number of drilling rigs in use from 25 to 74 while their upstream spending has increased from $2.2 billion to $6.1 billion during the same time frame. In 2015, capital expenditures for YPF was relatively flat with 2014 levels and based on recent public communication, spending in 2016 is expected to be reduced by 20-25%. Further, most of the 2016 capital expenditure reduction is concentrated in conventional wells producing heavy crude which is exported outside of Argentina at international prices. With the low international prices, many of these reservoirs are not economic to produce. Further, because of the shift from vertical wells to horizontal wells, the rig count has been reduced from a peak of 112 drilling rigs in July 2015 to approximately 62 drilling rigs in February 2016. Many of those rig shut downs occurred in the Southern provinces of Argentina where oil is exported as mentioned above; however, many of the rigs previously drilling vertical wells do not have the capability to drill horizontal wells and therefore they have been stacked until activity resumes. Lastly, YPF indicated that they are utilizing 11 drilling rigs in the Vaca Muerta as compared to 17 rigs in 2015. Despite the reduction in drilling rigs, the horizontal wells typical are completed with more than 3 times the number of completion stages as compared with the vertical wells and therefore even though fewer wells will be drilled, the overall number of completion stages are expected to increase in 2016 as compared to 2015.
| 15 |
Constrained supply of well stimulation fleets in emerging markets.
While North America holds an estimated 10% of worldwide shale reserves, it has about 69% of global pressure pumping capacity. The supply of well stimulation fleets, proppants, replacement and repair parts and other products has not kept up with the increased demand in many emerging international shale basins where horizontal drilling is expanding. Many established service companies lack a local presence in emerging markets, while some local service companies lack the requisite expertise. As a result, we believe there are insufficient oilfield services presently being offered on the necessary scale in Argentina and other emerging markets to meet anticipated growth in drilling activities, considering the vast unconventional resource potential that exists.
Increasing awareness for more efficient and economical solutions to develop shale resources.
Well stimulation now faces intense environmental scrutiny, particularly in international markets, that may require well stimulation operations to offer certain ecological protection during oil and gas production. As a result, there has been enhanced interest in technologies allowing for the use of natural gas as fuel, a significant reduction in surface footprint of operations, and overall reduction in the use of fuel, water and horsepower, while optimizing the number and placement of stages.
An investment in our common stock involves a number of risks. You should carefully consider the risks described in “Risk Factors,” in addition to the other information contained in this Form 10-K, including “Management’s Discussion and Analysis of Financial Condition and Results of Operations” and our consolidated financial statements and related notes, before investing in our common stock. These risks could materially affect our business, financial condition and results of operations, and cause the trading price of our common stock to decline. You could lose part or all of your investment. You should bear in mind, in reviewing this Form 10-K, that past experience is no indication of future performance. You should read the section titled “Cautionary Statements Regarding Forward-Looking Statements” for a discussion of what types of statements are forward-looking statements, as well as the significance of such statements in the context of this Form 10-K.
Risks Related to Our Business
We have limited operating history and only minimum revenues.
We have a limited operating history and, accordingly, we are subject to substantial risks inherent in the commencement of a new business enterprise. We are a technology-driven independent oilfield service company providing well stimulation, coiled tubing and field management services to the upstream oil and gas industry with a focus on improving the ecological and economic aspects of the process. Our primary focus will be on the most active shale and unconventional oil and natural gas basins outside the U.S., and we have commenced operations in Argentina. To date, we have only generated minimal revenue from our consulting and field management operations. There can be no assurance that we will be able to successfully generate additional revenues, or attain operating profitability. Additionally, we have a very limited business history that investors can analyze to aid them in making an informed judgment as to the merits of an investment in our Company. Any investment in our Company should be considered a high-risk investment because the investor will be placing funds at risk in our Company with unforeseen costs, expenses, competition, and other problems to which new ventures are often subjected. Investors should not invest in our Company unless they can afford to lose their entire investment. As we are early in the revenue-generation process, our prospects must be considered in light of the risks, expenses, and difficulties encountered in establishing a new business in a highly competitive industry.
| 16 |
We have limited sources of liquidity.
We require substantial capital to pursue our operating strategy. As we have limited internal sources of liquidity, we will continue to rely on external sources for liquidity for the foreseeable future.
We participate in a capital-intensive industry, and we may have capital needs for which our internally generated cash flows and other sources of liquidity may not be adequate.
We have substantial future capital requirements, including the need to fund growth through acquisition of additional equipment and assets, working capital and capital expenditures and debt service obligations. Since December 2013, our operation and growth has been funded primarily by proceeds from various equity and debt offerings and more recently by cash flows from operations. Our ability to fund future operations and our planned and committed 2016 capital expenditures will depend upon our future operating performance and, more broadly, on the availability of equity and debt financing. The availability of financing will be affected by prevailing economic conditions, market conditions in the exploration and production industry and financial, business and other factors, many of which are beyond our control. If we are unable to generate sufficient cash flows or to obtain additional capital on favorable terms or at all, we may be unable to continue growing our business or to sustain or increase our current level of profitability. Our inability to grow our business may adversely impact our ability to sustain or improve our profits. Moreover, if we cannot generate sufficient cash flows or otherwise secure sufficient liquidity to support our capital requirements, we may not be able to meet our payment obligations, which could have a material adverse effect on our results of operations or liquidity.
We may not be able to fulfill, renew or replace our existing agreements on attractive terms or at all, which could adversely impact our results of operations, financial condition and cash flows.
We can provide no assurance that we will be able to successfully fulfill, renew or replace our existing agreements with new agreements on or prior to their expiration on terms satisfactory to us or the operator or that we will be able to continue to provide services under those existing agreements without service interruption. We are dependent on entering into additional service agreements to grow our business. If we are not able to either renew or enter into additional service agreements, our results of operations, financial condition and cash flows could be adversely impacted.
We may be unable to maintain pricing on our core services.
Pressures stemming from fluctuating market conditions and oil and natural gas prices are making it increasingly difficult to maintain the pricing on our core services during the last quarter of 2015. We have faced, and will likely continue to face, pricing pressure from the competitors during 2016. If we are unable to maintain pricing on our core services, our financial results will be negatively impacted.
The activity level of our customers, spending for our products and services, and payment patterns may be impacted by low commodity prices and any deterioration in the credit markets.
Many of our potential customers finance their activities through cash flow from operations, the incurrence of debt or the issuance of equity. Beginning in late 2014 and continuing throughout 2015, there was a significant decline in the international prices of oil and gas, resulting in reduced cash flow from our customers’ operations and a severe reduction in their access to the equity and credit markets. We expect these effects of low prices will continue to be felt through at least the first half of 2016. Additionally, during 2015 many of our potential customers’ equity values substantially declined. The combination of a reduction of cash flow resulting from declines in commodity prices, a reduction in borrowing bases under reserve-based credit facilities and the lack of availability of debt or equity financing may result in a significant reduction in our potential customers’ spending for our products and services.
| 17 |
In addition, the same factors that may lead to a reduction in our potential customers’ spending also may increase the exposure to the risks of nonpayment and nonperformance by the customers. A significant reduction in our customers’ liquidity may result in a decrease in their ability to pay or otherwise perform their obligations to us. Any increase in nonpayment or nonperformance by our customers, either as a result of recent changes in financial and economic conditions or otherwise, could have an adverse impact on the operating results and adversely affect the liquidity.
In addition to the foregoing, because YPF is controlled by the Argentine state, its capital spending and other policies may be subject to political influence, particularly from the Secretary of Energy. For example, we believe the recent departure of YPF’s chief executive officer, may be related to the appointment of a new Secretary of Energy.
Because we rely on a limited number of customers for the well stimulation services, the change in ownership and management of any such customer may adversely affect our business, financial condition and results of operations.
Our customers may choose to integrate their operations vertically by purchasing and operating their own well stimulation fleet, expanding the amount of well stimulation equipment they currently own or using alternative technologies for enhancing oil and gas production.
Our customers may choose to integrate their operations vertically by purchasing and operating their own well stimulation fleets in lieu of using our well stimulation services. In addition, there are other technologies available for the artificial enhancement of oil and natural gas production and our customers may elect to use these alternative technologies instead of the well stimulation services we provide. Such vertical integration, increases in vertical integration or use of alternative technologies could result in decreased demand for our well stimulation services, which may have a material adverse effect on our business, results of operations and financial condition.
Our customer base is concentrated within the oil and natural gas production industry, and loss of a significant customer or the existing customer contracts could cause our revenue to decline substantially and adversely affect our business.
Our business is and will be highly dependent on existing agreements and the relationships with potential customers and technology partners. Revenues from these potential customers and revenues from joint ventures are expected to represent a substantial portion of our total future revenues. A reduction in business from any of these arrangements resulting from reduced demand for their own products and services, a work stoppage, sourcing of products from other suppliers or other factors could materially impact our business, financial condition and results of operations. In addition, the inability of suppliers to timely deliver the required equipment for the new well stimulation fleets could have a material adverse impact on our ability to perform under the existing agreements. We expect that we will continue to derive a significant portion of our revenue from a relatively small number of customers in the future. Our existing agreements do not obligate any of those prospective customers to use our products and services. In addition, the existing agreements contain provisions whereby the customers may terminate the agreement in the event we are unable to perform under the terms of the contract or make adjustments to service and/or materials fees payable thereunder based on changing market conditions. The existing agreements are also subject to termination by customers under certain circumstances, and any such termination could have a material adverse effect on our business.
We may have difficulty managing growth in our business, which could adversely affect our financial condition and results of operations.
We do not have highly sophisticated systems to forecast our future revenue or profitability and therefore could experience difficulty in managing our growth and associated working capital needs.
| 18 |
Our ability to operate successfully depends on the availability of water.
Well stimulation, and pressure pumping more generally, can require a significant supply of water, and water supply and quality are important requirements to our operations. We intend to meet our water requirements from sources on or near the well sites, but there is no assurance that we will be able to obtain a sufficient supply of water from sources in these areas, some of which are prone to drought.
Any indebtedness we incur could restrict our operations and make us more vulnerable to adverse economic conditions.
We anticipate securing growth capital through lease financing or other long-term financing arrangements. Our expected future needs for financing for equipment acquisition and working capital may adversely affect operations and limit our growth, and we may have difficulty making debt service payments on our indebtedness as such payments become due.
Covenants in our debt agreements restrict our business in many ways.
We and ACM Emerging Markets Master Fund I, L.P. are parties to a Convertible Note Facility Agreement dated as of May 28, 2015, (the “Note Agreement”). The Note Agreement contains restrictive covenants. These covenants include, but are not limited to, requirements to reserve shares issuable for payment of the outstanding balance on the convertible note, maintain specific account balances, and comply with the operating budget. Additionally, the covenants include, but are not limited to, restrictions on incurring certain types of additional debt, engaging in transactions with affiliates, selling assets, making unapproved capital expenditures and entering into certain lease agreements.
A breach of any of these covenants could result in a default under our note facility. Upon the occurrence of an event of default under our convertible note facility, ACM may accelerate payment under the Note Agreement in accordance with its terms. If we were unable to repay those amounts, ACM could proceed against the collateral granted to them to secure that indebtedness.
We have pledged a significant portion of our and our subsidiaries’ assets as collateral under our note facility. If ACM accelerates the repayment of borrowings under our note facility, we cannot assure you that we will have sufficient assets to repay indebtedness under such facilities and our other indebtedness.
We may not be able to provide services that meet the specific needs of oil and natural gas exploration and production companies at competitive prices.
The markets in which we operate are highly competitive and have relatively few barriers to entry, and the competitive environment has intensified as recent mergers among exploration and production companies have reduced the number of available customers. The principal competitive factors in the markets in which we operate are product and service quality and availability, responsiveness, experience, technology, equipment quality, reputation for safety and price. We compete with large national and multi-national companies that have longer operating histories, greater financial, technical and other resources and greater name recognition than we do. Our initial well stimulation fleet currently does not have sufficient HHP to enable us to participate in unconventional jobs as well as larger well stimulation jobs. See Part I – Item 1 – “Business—Market Segmentation.”
The inability to control the inherent risks of acquiring and integrating businesses in the future could adversely affect our operations.
If we choose to grow our business through acquisitions or mergers, it is possible that companies acquired or merged into our Company may have internal control weaknesses or risks that were not identified prior to such acquisitions or mergers and such weaknesses or risks could adversely affect us and our operations.
| 19 |
Our business depends upon our ability to obtain specialized equipment from suppliers and key raw materials on a timely basis.
If our current suppliers are unable to provide the necessary raw materials (including, for example, proppant and chemicals) or finished products (such as the new equipment) or otherwise fail to deliver products timely and in quantities required, any resulting delays in the provision of services could have a material adverse effect on our business, financial condition, results of operations and cash flows. During the past few years, our industry faced sporadic proppant shortages associated with pressure pumping operations, requiring work stoppages that adversely impacted the operating results of several competitors.
The Chairman of the Board allocates part of his time to other companies.
Mr. Bjarte Bruheim, the chairman of the Board, is also a member of the board of directors of other companies. Mr. Bruheim allocates his time between the affairs of Eco-Stim and the affairs of these other companies. This situation presents the potential for a conflict of interest for Mr. Bruheim in determining the respective percentages of his time to be devoted to the affairs of Eco-Stim and the affairs of others. In addition, if the affairs of these other companies require him to devote more substantial amounts of his time to the affairs of the other companies in the future, it could limit his ability to devote sufficient time to our affairs and could have a negative impact on our business.
Unexpected equipment malfunctions, catastrophic events and scheduled maintenance may lead to decreased revenue and reduce our cash flows.
Our performance is primarily dependent upon the efficient and uninterrupted operation of our sole pressure pumping fleet, which commenced operation in Argentina in December 2014, and our sole coiled tubing equipment, which commenced operation in Argentina in February 2015. If our operation of such core equipment experiences unanticipated disruption due to an accident, mechanical failure or other unforeseen event such as a fire, explosion, violent weather conditions or unexpected operational difficulties, or if we have to schedule a temporary shutdown to perform maintenance on any of our core equipment, our ability to provide timely services to our customers could be negatively affected, which could have a material adverse effect on our business, financial condition, results of operations and cash flows. For example, in March and April 2015, our coiled tubing equipment experienced downtime as a result of maintenance and operational start-up issues.
Our inability to make satisfactory alternative arrangements in the event of an interruption in supply of certain key raw materials could harm our business, results of operations and financial condition.
We currently anticipate sourcing materials, such as guar gum, from one supplier. Given the limited number of suppliers of such key raw materials, we may not always be able to make alternative arrangements should our suppliers fail to timely deliver these key raw materials. Any resulting delays in the provision of services could have a material adverse effect on our business, financial condition, results of operations and cash flows.
We may not be successful in implementing technology development and enhancements.
The market for our services and products is characterized by continual technological developments to provide better and more reliable performance and services. If we are not able to design, develop and produce commercially competitive products and to implement commercially competitive services in a timely manner in response to changes in technology, our business and revenues could be materially and adversely affected and the value of our intellectual property may be reduced. Likewise, if our proprietary technologies, equipment and facilities, or work processes become obsolete, we may no longer be competitive, and our business and revenues could be materially and adversely affected.
| 20 |
We depend on the services of key executives, the loss of whom could materially harm our business.
The management of our Company is important to our success because they have been instrumental in setting our strategic direction, operating the business, identifying, recruiting and training key personnel, and identifying expansion opportunities. Losing the services of any of these individuals could adversely affect our business until a suitable replacement could be found. We do not maintain key man life insurance on any of our management. As a result, we are not insured against any losses resulting from the death of our key employees.
We may be unable to employ a sufficient number of skilled and qualified workers.
The delivery of our services and products requires personnel with specialized skills and experience who can perform physically demanding work. As a result of the volatility of the oilfield service industry and the demanding nature of the work, workers may choose to pursue employment in fields that offer a more desirable work environment at wage rates that are competitive. The demand for skilled workers is high and the supply is limited.
We may be adversely impacted by work stoppages or other labor matters.
The petroleum and oil-service industries in Argentina, where we operate, and other countries are unionized, and it is likely that we may experience work stoppages or other labor disruptions from time to time. As of December 31, 2015, approximately 85% of our Argentine employees were represented by unions and they are working under the conditions stated in their collective bargaining agreements. No assurance can be given that the collective bargaining agreements will be successfully extended or renegotiated as they expire from time to time. If any collective bargaining agreement is not extended or renegotiated, if disputes with our unions arise, or if our unionized workers engage in a strike or other work stoppage or interruption, we could experience a significant disruption of, or inefficiencies in, our operations or incur higher labor costs, which could have a material adverse impact on our combined results of operations and financial condition by disrupting our ability to perform well stimulation or pressure pumping and other services for the customers under our service contracts. Moreover, unionization efforts have been made from time to time within the industry, with varying degrees of success. Any such unionization could increase our costs or limit our flexibility.
If we become subject to warranty and similar claims, they could be time-consuming and costly to defend.
Errors, defects or other performance problems in the products that we sell or services that we offer could result in our customers seeking damages from us for losses associated with these errors, defects or other performance problems.
Our business involves certain operating risks and our insurance coverage or proceeds, if any, may not be adequate to cover all losses or liabilities that we might incur in our operations.
The technical complexities of our operations are such that we are exposed to a wide range of significant health, safety and environmental risks. Our services involve production-related activities, radioactive materials, explosives and other equipment and services that are deployed in challenging exploration, development and production environments. An accident involving our services or equipment, or a failure of a product, could cause personal injury, loss of life, damage to or destruction of property, equipment or the environment, or suspension of operations. Our insurance policies may not protect us against liability for some kinds of events, including events involving pollution, or against losses resulting from business interruption. Moreover, we may not be able to maintain insurance at levels of risk coverage or policy limits that we deem adequate. Any damages caused by our services or products that are not covered by insurance, or are in excess of policy limits or are subject to substantial deductibles, could adversely affect our financial condition, results of operations and cash flows.
A terrorist attack or armed conflict could harm our business.
Geopolitical and terrorism risks continue to grow in a number of key countries where we do business. Geopolitical and terrorism risks could lead to, among other things, a loss of our investment in the country, impairment of the safety of our employees and impairment of our ability to conduct our operations.
| 21 |
Our ability to use our net operating loss carryforwards and certain other tax attributes may be limited.
Under Section 382 of the Internal Revenue Code of 1986, as amended, if a corporation undergoes an “ownership change,” generally defined as a greater than 50% change (by value) in its equity ownership over a three-year period, the corporation’s ability to use its pre-change net operating loss carryforwards, (“NOLs”), and other pre-change tax attributes to offset its post-change income or taxes may be limited. We may have previously experienced, and may in the future experience, one or more “ownership changes,” including in connection with this public offering. As a result, if we earn net taxable income, our ability to use our pre-change NOL carryforwards to offset U.S. federal taxable income may be subject to limitations, which could potentially result in increased future tax liability to us.
Risks Related to Our Operations in Argentina and Other Foreign Jurisdictions
Our business is largely dependent upon economic conditions in Argentina.
Substantially all of our initial operations and customers are located in Argentina, and, as a result, our business is to a large extent dependent upon economic conditions prevailing in Argentina. The Argentine economy has experienced significant volatility in past decades, including numerous periods of low or negative growth and high and variable levels of inflation and devaluation. Argentina’s gross domestic product grew at an average annual real rate of approximately 0.8% in 2012, recovering to 2.9% in 2013. For 2014, the National Statistics Institute (Instituto Nacional de Estadística y Censos, or INDEC), which is the only institution in Argentina with the statutory power to produce official nationwide statistics, has reported a 0.5% growth in real gross domestic product. GDP growth rated recovered to 2.3% in July 2015, the most recent period for which INDEC has published data. No assurances can be given that the rate of growth experienced over past years will be achieved in subsequent years or that the economy will not contract. If economic conditions in Argentina were to slow, or contract, or if the Argentine government’s measures to attract or retain foreign investment and international financing in the future are unsuccessful, such developments could adversely affect Argentina’s economic growth and in turn affect our financial condition and results of operations.
Argentine economic results are dependent on a variety of factors, including (but not limited to) the following:
| ● | international demand for Argentina’s principal exports; | |
| ● | international prices for Argentina’s principal commodity exports; | |
| ● | stability and competitiveness of the Argentine Peso against foreign currencies; | |
| ● | levels of consumer consumption and foreign and domestic investment and financing; and | |
| ● | the rate of inflation. |
In recent years, Argentina has confronted inflationary pressure. According to inflation data published by INDEC, from 2010 to 2014, the Argentine consumer price index increased 10.9%, 9.5%, 10.8%, 10.9% and 23.9%, respectively; the wholesale price index increased 14.5%, 12.7%, 13.1%, 14.8% and 28.3%, respectively. According to INDEC, inflation was 29.60% as of January, 2016, the most recent month for which it has published data. However, certain private sector analysts usually quoted by the government opposition, based on methodologies being questioned by the Argentine government on the basis of the lack of technical support, believe that actual inflation is significantly higher than that reflected in INDEC reports. Increased rates of inflation in Argentina could increase our cost of operation, and may negatively impact our results of operations and financial condition. There can be no assurance that inflation rates will not be higher in the future.
In addition, Argentina’s economy is vulnerable to adverse developments affecting its principal trading partners. A significant decline in the economic growth of any of Argentina’s major trading partners, such as Brazil, China or the U.S., could have a material adverse impact on Argentina’s balance of trade and adversely affect Argentina’s economic growth and may consequently adversely affect our financial condition and results of operations.
| 22 |
In 2005, Argentina restructured a substantial portion of its bond indebtedness and settled all of its debt with the International Monetary Fund. Additionally, in June 2010, Argentina completed the renegotiation of approximately 67% of defaulted bonds that were not swapped in 2005. As a result of the 2005 and 2010 debt swaps, approximately 91% of the country’s bond indebtedness on which Argentina defaulted in 2002 has now been restructured. However, certain “holdout” creditors did not agree to the restructuring, and commenced litigation in the U.S. in an effort to prevent payment under the terms of the restructuring.
On November 21, 2012, the United States District Court for the Southern District of New York entered an injunction preventing Argentina from making payments on the restructured bonds, and ordered Argentina to make a deposit of USD $1,330 million related to the claims of the holdout creditors, which order was appealed by the country. Argentina’s appeal was denied by the Second Circuit Court of Appeals, and on June 16, 2014 the Supreme Court of the United States refused to hear Argentina’s appeal from that denial. As a result, Argentina has run the risk of defaulting on its restructured debt.
In November, 2015, Argentina elected a new President, Mauricio Macri, on a platform that included making renewed efforts to settle with the “holdout” creditors. On December 10, 2015, Mr. Macri was sworn in as Argentina’s new President. On February 29, 2016, the Macri government reached an agreement to pay $4.65 billion to settle the claims with creditors, subject to a few conditions including the passage of enabling legislation in Argentina.
The Argentine Peso has been subject to significant devaluation in the past and may be subject to significant fluctuations in the future, consequently affecting our financial condition and results of operations (see additionally Part I – Item 1A. Risk Factors – “We may be exposed to fluctuations in foreign exchange rates.”). President Macri moved quickly in December 2015 after taking office to lift currency controls. This was effective at removing the large spread that previously existed between the so-called “blue market” rate of approximately 14 to 1 and the official exchange rate of 9 to 1. Since currency controls were repealed, the Argentine Peso has traded between 13.5 and 15.7 and we believe is currently reasonably stable.
Moreover, this move was accompanied by a liberalization of capital controls, which we expect to improve the investment climate in Argentina by making it easier for our Company and our customers to repatriate future earnings in Argentina.
The Argentinian government has fixed oil and gas prices for domestic producers. Any decrease or removal of the fixed price could result in a corresponding reduction in our customers’ drilling activities, which could adversely impact our results of operations, financial condition and cash flows.
For 2016, the new Argentinian government has fixed the price of new natural gas production at $7.50 per mmbtu and $67.50 per barrel for light sweet crude while setting the price for heavy oil at $34 per barrel. We have no assurance that the government will not lower these fixed prices in the future or remove them altogether. If the fixed prices were reduced or removed, our customers may drill less, which could have a corresponding effect on the demand for our products or services.
Certain risks are inherent in any investment in a company operating in an emerging market such as Argentina.
Argentina is an emerging market economy, and investing in emerging markets generally carries risks. These risks include political, social and economic instability that may affect Argentina’s economic results which can stem from many factors, including the following:
| ● | high interest rates; | |
| ● | abrupt changes in currency values; | |
| ● | high levels of inflation; | |
| ● | exchange controls; | |
| ● | wage and price controls; | |
| ● | regulations to import equipment and other necessities relevant for operations; | |
| ● | changes in governmental economic or tax policies; and | |
| ● | political and social tensions. |
| 23 |
Any of these factors may adversely affect our financial condition and results of operation.
The Argentine economy has been adversely affected by economic developments in other markets.
Financial and securities markets in Argentina, and also the Argentine economy, are influenced by economic and market conditions in other markets worldwide. Considering the current international turmoil, Argentina’s economy remains vulnerable to external shocks, including those relating to or similar to the global economic crisis that began in 2008 and the recent uncertainties surrounding European sovereign debt. Although economic conditions vary from country to country, investors’ perceptions of events occurring in one country may substantially affect capital flows into and investments in securities from issuers in other countries, including Argentina.
Consequently, there can be no assurance that the Argentine financial system and securities markets will not continue to be adversely affected by events in developed countries’ economies or events in other emerging markets, which could in turn, adversely affect the Argentine economy and, as a consequence, the Company’s results of operations and financial condition.
The implementation of new export duties, other taxes and import regulations could adversely affect our results.
In 2012, the Argentine government adopted an import procedure pursuant to which local authorities must pre-approve any import of products and services to Argentina as a precondition to allow importers access to the foreign exchange market for the payment of such imported products and services.
We cannot assure you that these taxes and import regulations will not continue or be increased in the future or that other new taxes or import regulations will not be imposed.
We may be exposed to fluctuations in foreign exchange rates.
Our results of operations are exposed to currency fluctuation and any devaluation of the Argentine Peso against the U.S. dollar and other hard currencies may adversely affect our business and results of operations. The value of the Argentine Peso has fluctuated significantly in the past and may do so in the future. We are unable to predict whether, and to what extent, the value of the Argentine Peso may further depreciate or appreciate against the U.S. dollar and how any such fluctuations would affect our business.
We are subject to exchange and capital controls.
In the past, Argentina imposed exchange controls and transfer restrictions substantially limiting the ability of companies to retain foreign currency or make payments abroad. Although the Macri government lifted exchange controls and liberalized capital controls as described above, there can be no assurances regarding future modifications to exchange and capital controls. Exchange and capital controls could adversely affect our financial condition or results of operations and our ability to meet our foreign currency obligations and execute our financing plans.
| 24 |
Operating internationally subjects us to significant risks and regulations inherent in operating in foreign countries.
We plan to conduct operations in a number of countries. Our international operations will be subject to a number of risks inherent to any business operating in foreign countries, and especially those with emerging markets, including the following risks, among others:
| ● | government instability, which can cause investment in capital projects by our potential clients to be withdrawn or delayed, reducing or eliminating the viability of some markets for our services; | |
| ● | potential expropriation, seizure, nationalization or detention of assets, such as the nationalization of Repsol S.A.’s interest in YPF; | |
| ● | difficulty in repatriating foreign currency received in excess of local currency requirements; | |
| ● | foreign currency exchange rate fluctuations, import/export tariffs and quotas; | |
| ● | civil uprisings, riots and war, which can make it unsafe to continue operations, adversely affect both budgets and schedules and expose us to losses; | |
| ● | availability of suitable personnel and equipment, which can be affected by government policy, or changes in policy that limit the importation of qualified crewmembers or specialized equipment in areas where local resources are insufficient; | |
| ● | decrees, laws, regulations, interpretation and court decisions under legal systems, which are not always fully developed and which may be retroactively applied and cause us to incur unanticipated and/or unrecoverable costs as well as delays which may result in real or opportunity costs; and | |
| ● | terrorist attacks, including kidnappings of our personnel. |
We cannot predict the nature and the likelihood of any such events. However, if any of these or other similar events should occur, it could have a material adverse effect on our financial condition and results of operation.
Certain of the equipment that we use in certain foreign countries may require prior U.S. government approval in the form of an export license and may otherwise be subject to tariffs and import/export restrictions. The delay in obtaining required governmental approvals could affect our ability to timely commence a project, and the failure to comply with all such controls could result in fines and other penalties.
We may be subject to taxation in many foreign jurisdictions and the final determination of our tax liabilities involves the interpretation of the statutes and requirements of taxing authorities worldwide. Our tax returns will be subject to routine examination by taxing authorities, and these examinations may result in assessments of additional taxes, penalties and/or interest.
Our overall success as an international company depends, in part, upon our ability to succeed in differing economic, social and political conditions. We may not continue to succeed in developing and implementing policies and strategies that are effective in each location where we do business, which could negatively affect our profitability.
Our international operations involve the use of foreign currencies, which subjects us to exchange rate fluctuations, difficulty in repatriating foreign currencies and other currency risks.
We and our foreign subsidiaries from time to time will hold foreign currencies. Exchange rate fluctuations will subject us to currency risk as well as to other risks sometimes associated with international operations. In the future, we could experience fluctuations in financial results from our operations outside the U.S., and there can be no assurance that payments received in foreign currencies can be repatriated to the U.S. or that we will be able, contractually or otherwise, to reduce the currency risks associated with our international operations.
| 25 |
We could be adversely affected by violations of the U.S. Foreign Corrupt Practices Act and similar foreign anti-bribery laws.
The United States Foreign Corrupt Practices Act (the “FCPA”) and similar worldwide anti-bribery laws generally prohibit companies and their intermediaries from making, offering or authorizing improper payments to non-U.S. government officials for the purpose of obtaining or retaining business. We do business and may do additional business in the future in countries or regions where strict compliance with anti-bribery laws may conflict with local customs and practices.
As a company subject to compliance with the FCPA, our business may suffer and we may be subject to competitive disadvantages because our efforts to comply with U.S. laws could restrict our ability to do business in foreign markets relative to our competitors who are not subject to U.S. law. Additionally, our business plan involves establishing close relationships with stakeholders in certain foreign markets. Any determination that we or foreign shareholders, directors, or officers partners have violated the FCPA may adversely affect our business and operations.
Violations of anti-bribery laws (either due to our acts or our inadvertence) may result in criminal and civil sanctions and could subject us to other liabilities in the U.S. and elsewhere. Even allegations of such violations could disrupt our business and result in a material adverse effect on our business and operations.
Risks Related to the Oil and Natural Gas Industry
We may face intense competition in our industry and in the markets where we operate.
The industry in which we compete is highly competitive, and most of our potential competitors will have greater financial resources than we do. Our ability to renew or replace existing contracts with our customers at rates sufficient to maintain current revenue and cash flows could be adversely affected by the activities of our competitors and our customers. If our competitors substantially increase the resources they devote to the development and marketing of competitive services or substantially decrease the prices at which they offer their services, we may be unable to compete effectively. Some of these competitors may expand or construct newer, more powerful or more flexible well stimulation fleets that would create additional competition for us. Furthermore, recent reduction in drilling activity in markets such as North America may drive other oilfield services companies to relocate their equipment to the regions in which we operate or intend to operate. Such increase in supply relative to demand could negatively impact pricing and utilization of our services. All of these competitive pressures could have a material adverse effect on our business, results of operations and financial condition. There can be no assurance that additional competitors will not enter markets served or proposed to be served by us, that we will be able to compete successfully, or that we will have adequate funds to compete.
Because the oil and natural gas industry is cyclical, our operating results may fluctuate.
Oil and natural gas prices are volatile. Fluctuations in such prices may result in a decrease in the expenditure levels of oil and natural gas companies, which in turn may adversely affect us. For example, the substantial and extended decrease in commodity prices which started in 2014 and has continued through today has severely reduced most of our customer’s profitability, particularly those with activities outside of Argentina. This situation may continue or worsen and could adversely affect our business, financial condition and results of operations.
Regulatory compliance costs and restrictions, as well as delays in obtaining permits by the customers for their operations, such as for well stimulation and pressure pumping, or by us for our operations, could impair our business.
Our operations and the operations of the customers are subject to or impacted by a wide array of regulations in the jurisdictions in which the operations are located. As a result of changes in regulations and laws relating to the oil and natural gas industry, including well stimulation, our operations or the operations of our customers could be disrupted or curtailed by governmental authorities. The high cost of compliance with applicable regulations may cause customers to discontinue or limit their operations, and may discourage companies from continuing development activities. As a result, demand for our services could be substantially affected by regulations adversely impacting the oil and natural gas industry.
| 26 |
Demand for the majority of our services is substantially dependent on the levels of expenditures by the oil and gas industry. A substantial or an extended decline in oil and gas prices could result in lower expenditures by the oil and gas industry, which could have a material adverse effect on our financial condition, results of operations and cash flows.
Demand for the majority of our services depends substantially on the level of expenditures by the oil and gas industry for the exploration, development and production of oil and natural gas reserves. These expenditures are generally dependent on the industry’s view of future oil and natural gas prices and are sensitive to the industry’s view of future economic growth and the resulting impact on demand for oil and natural gas. Declines, as well as anticipated declines, in oil and gas prices could also result in project modifications, delays or cancellations, general business disruptions, and delays in payment of, or nonpayment of, amounts that are owed to us. These effects could have a material adverse effect on our financial condition, results of operations and cash flows.
The prices for oil and natural gas have historically been volatile and can be affected by a variety of factors, including:
| ● | worldwide and regional economic conditions impacting the global supply and demand for oil, natural gas and natural gas liquids; | |
| ● | the price and quantity of foreign imports; | |
| ● | political and economic conditions in or affecting other producing areas, including the Middle East, Africa, South America and Russia; | |
| ● | the ability of members of the Organization of the Petroleum Exporting Countries to agree to and maintain oil price and production controls; | |
| ● | the level of global exploration and production activity; | |
| ● | the level of global inventories; | |
| ● | prevailing prices on local price indexes in the areas in which we operate; | |
| ● | the proximity, capacity, cost and availability of gathering and transportation facilities; | |
| ● | localized and global supply and demand fundamentals and transportation availability; | |
| ● | the cost of exploring for, developing, producing and transporting reserves; | |
| ● | weather conditions and other natural disasters; | |
| ● | technological advances affecting energy consumption; | |
| ● | the price and availability of alternative fuels; | |
| ● | expectations about future commodity prices; and | |
| ● | domestic, local and foreign governmental regulation and taxes. |
The oil and gas industry has historically experienced periodic downturns, which have been characterized by diminished demand for oilfield services and downward pressure on the prices we charge. The prices of crude oil, domestic natural gas and NGLs have declined substantially since June 2014. The price of West Texas Intermediate crude oil has decreased from over $100.00 per barrel in the middle of June 2014 to below $30.00 per barrel in January and February 2016. In recent months, Henry Hub spot prices for natural gas declined below $1.80 per Mcf in December 2015 compared to more than $4.40 per Mcf in January 2014. The current downturn in the oil and gas industry has resulted in a reduction in demand for oilfield services and could adversely affect our financial condition, results of operations and cash flows.
| 27 |
Our operations are subject to hazards and environmental risks inherent in the oil and natural gas industry.
We are a provider of well stimulation and pressure pumping services, a process involving the injection of fluids—typically consisting mostly of water and also including several chemical additives—as well as sand in order to create fractures extending from the well bore through the rock formation to enable oil or natural gas to move more easily through the rock pores to a production well. In addition, we provide a range of services to onshore oil and natural gas exploration and production operations, consisting of, among other things, coiled tubing services. Risks inherent to our industry create the potential for significant losses associated with damage to the environment or natural resources, such as the potential for contamination of drinking water resources.
New technology may cause us to become less competitive.
The oilfield services industry is subject to the introduction of new drilling and completion techniques and services using new technologies, some of which may be subject to patent protection. If competitors and others use or develop new technologies in the future that are more efficient or productive than ours, we may lose market share or be placed at a competitive disadvantage.
The industry is affected by excess equipment inventory levels.
Because of the long-life nature of oilfield service equipment and the lag between when a decision to build additional equipment is made and when the equipment is placed into service, the inventory of oilfield service equipment in the industry does not always correlate with the level of demand for service equipment.
Current and potential legislative, regulatory and enforcement initiatives could materially increase our operating costs and/or adversely affect our competitive position.
Our operations and the operations of our customers are subject to increasingly stringent laws and regulations relating to importation and use of hazardous materials, radioactive materials and explosives and to environmental protection, including laws and regulations governing air emissions, well stimulation and pressure pumping, water use and discharges, wetlands or land use practices, waste management, and the release of hazardous substances into the environment. We incur, and expect to continue to incur, capital and operating costs to comply with environmental laws and regulations. The technical requirements of these laws and regulations are becoming increasingly complex, stringent and expensive to implement. In addition, these laws may provide for “strict liability” for remediation costs, damages to natural resources or threats to public health and safety. Strict liability can render a party liable for damages without regard to negligence or fault on the part of the party. Failure to comply with these laws and regulations may result in the assessment of administrative, civil and criminal penalties, the imposition of remedial obligations and the issuance of orders enjoining some or all of our or our customers’ operations in affected areas.
Current or future legislation, regulations and development may curtail production and demand for hydrocarbons such as oil and natural gas in areas of the world where our customers operate and thus adversely affect future demand for our services, which may in turn adversely affect future results of operations.
Compliance with governmental regulations may impact our or our customers’ operations and may adversely affect our business and operating results.
Our operations are dependent on our customers’ decisions to develop and produce oil and natural gas reserves and on the regulatory environment in which our customers and we operate. The ability to produce oil and natural gas can be affected by the number and productivity of new wells drilled and completed, as well as the rate of production and resulting depletion of existing wells. Advanced technologies, such as horizontal drilling and well stimulation and pressure pumping, improve total recovery, but they also result in a more rapid production decline and may become subject to more stringent regulations in the future.
| 28 |
Access to prospects is also important to our customers and such access may be limited because host governments do not allow access to the reserves or because another oil and natural gas exploration company owns the rights to develop the prospect. Government regulations and the costs incurred by oil and natural gas exploration companies to conform to and comply with government regulations may also limit the quantity of oil and natural gas that may be economically produced. This could lead our customers to curtail their operations and result in a decrease in demand for our services, which in turn could adversely affect our financial position and results of operations.
Any of these factors could affect the supply of oil and natural gas and could have a material adverse effect on our results of operations.
Legislative and regulatory initiatives relating to well stimulation could result in increased costs and additional operating restrictions or delays for our operations or the operations of our customers.
Many national, provincial, and local governments and agencies have adopted laws and regulations or are evaluating proposed legislation and regulations that are focused on the extraction of shale gas or oil using well stimulation, which is part of the overall services we provide to our customers. Well stimulation is a treatment routinely performed on oil and gas wells in low-permeability reservoirs. Specially engineered fluids are pumped at high pressure and rate into the reservoir interval to be treated, causing cracks in the target formation. Proppant, such as sand of a particular size, is mixed with the treatment fluid to keep the cracks open when the treatment is complete. In response to concerns related to potential impacts to the environment and natural resources from well stimulation, governmental authorities have issued new rules and regulations governing the practice, and are also pursuing studies related to its potential effects. Also, some national, state, and local governments have adopted bans or other measures restricting well stimulation activities. For example, the Province of Neuquén in Argentina, where we operate, has approved a set of rules regarding the extraction of shale oil and gas. These rules require, amongst other things, that operators performing well stimulation obtain permits prior to commencing drilling activities and file reports with the provincial government regarding the chemicals used in the well stimulation process and an analysis of the flowback water returning to the surface. In certain regions, the indigenous people have voiced their opposition to the increased shale development although to date these protests have been peaceful and have yet to disrupt activity in a meaningful way. In addition, several other provinces and local governments have voted to ban well stimulation within their borders, and some groups continue to advocate for a national ban on well stimulation in Argentina.
Future well stimulation-related legislation or regulations that further restrict or prohibit such activities could lead to operational delays and increased costs for our operations or the operations of our customers. Any adverse impacts on the operations of our customers could in turn reduce demand for our services. If such additional legislation or regulations are enacted and implemented, it could adversely affect our financial condition, results of operations and cash flows.
Compliance with climate change legislation or initiatives could negatively impact our business.
International, national, and state governments and agencies are currently evaluating and promulgating legislation and regulations that are focused on restricting emissions commonly referred to as GHG emissions in response to concerns that GHGs contribute to climate change. For example, in the U.S., the EPA has taken steps to regulate GHGs as pollutants under the federal Clean Air Act. The EPA’s “Mandatory Reporting of Greenhouse Gases” rule established in 2010 provided a comprehensive national scheme of regulations that require monitoring and reporting of GHG emissions, including emissions from the oil and gas industry. The U.S. has also taken steps to regulate emissions of methane from the oil and natural gas sector. The Company believes its TPU’s emit significantly less methane than the more commonly used diesel engines and therefore as regulations tighten, these TPU’s will provide a low cost competitive advantage.
| 29 |
International developments focused on restricting the emission of carbon dioxide and other gases include the United Nations Framework Convention on Climate Change, also known as the “Copenhagen Accord” (an internationally applied protocol, which has been ratified by several countries in Latin America and is a continuation of the Kyoto Protocol) and the European Union’s Emission Trading System. In December 2015 the Paris Agreement, an agreement within the framework of the Copenhagen Accord governing greenhouse gases emissions measures from 2020, was adopted by consensus, but the Paris Agreement has not entered into force as of the date of this Annual Report.
Argentina, Brazil, and Mexico have all committed to reducing GHG emissions, either through the deployment of renewable energy sources or through the use of a cap and trade program. Such programs place a cap on GHG emissions at certain sources and require those sources to purchase allowances for emissions above their cap. The adoption of legislation or regulatory programs to reduce emissions of GHGs could require us or our customers to incur increased operating costs, such as costs to purchase and operate emissions control systems, to acquire emissions allowances or comply with new regulatory or reporting requirements. In addition, in October 2015, Argentina announced an unconditional target to reduce GHG emissions including those emissions resulting from land use, land use change and forestry activities, by 15% below current emissions by 2030. Current or future legislation, regulations and developments may curtail production and demand for hydrocarbons such as oil and natural gas in areas of the world where our customers operate and thus adversely affect future demand for our services, which may in turn adversely affect future results of operations.
The effects of climate change or severe weather could adversely affect our operations.
Variation from normal weather patterns, such as cooler or warmer summers and winters, can have a significant impact on demand for the oil and gas produced by our customers. Adverse weather conditions, such as hurricanes or prolonged periods of drought, may interrupt or curtail our operations, or our customers’ operations, cause supply disruptions and result in a loss of revenue and damage to our equipment and facilities, which may or may not be insured. Extreme winter conditions may interrupt or curtail our operations, or our customers’ operations, in those areas and result in a loss of revenue. In addition, it should be noted that some scientists have concluded that increasing concentrations of GHGs in the Earth’s atmosphere may produce climate changes that have significant physical effects, such as increased frequency and severity of storms, droughts and floods and other climatic events. If any such effects were to occur, they could have an adverse effect on our financial condition and results of operations.
Risks Related to Ownership of Our Common Stock
We have incurred, and expect to continue to incur, increased costs and risks as a result of being a public company.
As a public company, we are required to comply with most, but not all, of the Sarbanes-Oxley Act of 2002 (“SOX”), as well as rules and regulations implemented by the SEC. Changes in the laws and regulations affecting public companies, including the provisions of SOX and rules adopted by the SEC, have resulted in, and will continue to result in, increased costs to us as we respond to these requirements. Given the risks inherent in the design and operation of internal controls over financial reporting, the effectiveness of our internal controls over financial reporting is uncertain. If our internal controls are not designed or operating effectively, we may not be able to issue an evaluation of our internal control over financial reporting as required or we or our independent registered public accounting firm may determine that our internal control over financial reporting was not effective. In addition, our registered public accounting firm may either disclaim an opinion as it relates to management’s assessment of the effectiveness of our internal controls or may issue an adverse opinion on the effectiveness of our internal controls over financial reporting. Investors may lose confidence in the reliability of our financial statements, which could cause the market price of our common stock to decline and which could affect our ability to run our business as we otherwise would like to. New rules could also make it more difficult or more costly for us to obtain certain types of insurance, including directors’ and officers’ liability insurance, and we may be forced to accept reduced policy limits and coverage or incur substantially higher costs to obtain the coverage that is the same or similar to our current coverage. The impact of these events could also make it more difficult for us to attract and retain qualified persons to serve on our Board, our Board committees, and as executive officers. We cannot predict or estimate the total amount of the costs we may incur or the timing of such costs to comply with these rules and regulations.
| 30 |
Compliance with Section 404 of the SOX will continue to strain our limited financial and management resources.
We incur significant legal, accounting and other expenses in connection with our status as a reporting public company. SOX and rules subsequently implemented by the SEC have imposed various new requirements on public companies, including requiring changes in corporate governance practices. As such, our management and other personnel need to devote a substantial amount of time to these compliance initiatives. Moreover, these rules and regulations have increased our legal and financial compliance costs and made some activities more time-consuming and costly. In addition, SOX requires, among other things, that we maintain effective internal controls for financial reporting and disclosure of controls and procedures. Our testing may reveal deficiencies in our internal controls over financial reporting that are deemed to be material weaknesses. Our compliance with Section 404 of SOX requires that we incur substantial accounting expense and expend significant management efforts. We may need to hire additional accounting and financial staff with appropriate public company experience and technical accounting knowledge. Moreover, if we are not able to comply with the requirements of Section 404 of SOX in a timely manner, or if we or our independent registered public accounting firm identifies deficiencies in our internal controls over financial reporting that are deemed to be material weaknesses, the market price of our stock could decline, and we could be subject to sanctions or investigations by the SEC or other regulatory authorities, which would require additional financial and management resources.
We do not intend to pay cash dividends on our common stock in the foreseeable future, and therefore only appreciation of the price of our common stock will provide a return to our stockholders.
We currently anticipate that we will retain all future earnings, if any, to finance the growth and development of our business. We do not intend to pay cash dividends in the foreseeable future. Any payment of cash dividends will depend upon our financial condition, capital requirements, earnings and other factors deemed relevant by our Board. In addition, the terms of the Note Agreement restrict our ability to pay dividends and make other distributions. As a result, only appreciation of the price of our common stock, which may not occur, will provide a return to our stockholders.
We currently have a sporadic, illiquid, volatile market for our common stock, and the market for our common stock may remain sporadic, illiquid, and volatile in the future.
We currently have a highly sporadic, illiquid and volatile market for our common stock, which market is anticipated to remain sporadic, illiquid and volatile in the future and will likely be subject to wide fluctuations in response to several factors, including, but not limited to:
| ● | actual or anticipated variations in our results of operations; | |
| ● | our ability or inability to generate revenues; | |
| ● | the number of shares in our public float; | |
| ● | increased competition; and | |
| ● | conditions and trends in the market for oil and gas and down-hole services. |
Furthermore, our stock price may be impacted by factors that are unrelated or disproportionate to our operating performance. These market fluctuations, as well as general economic, political and market conditions, such as recessions, interest rates or international currency fluctuations may adversely affect the market price of our common stock. Shareholders and potential investors in our common stock should exercise caution before making an investment in our Company, and should not rely on the publicly quoted or traded stock prices in determining our common stock value, but should instead determine the value of our common stock based on the information contained in our public reports, industry information, and those business valuation methods commonly used to value private companies.
| 31 |
ACM may have significant influence over us, including influence over decisions that require stockholder approval, which could limit your ability to influence the outcome of key transactions, including a change of control.
The Note Agreement allows us to issue to ACM the Convertible Note with a maximum aggregate principal amount of $22 million, convertible into our common stock at a price of $6.00 per share. We have drawn down the full amount of the commitments available under our note facility. If ACM elected to convert all of the principal on the Convertible Note, it would hold approximately 31% of our outstanding common stock on a fully diluted basis. In addition, pursuant to a stockholder rights agreement (the “Stockholder Rights Agreement”) entered into by and among the Company, ACM and certain management stockholders (the “Management Stockholders”), ACM currently has the right to nominate at least one individual for election to the Board for so long as ACM beneficially owns greater than 10% of our issued and outstanding common stock (calculated on a fully diluted basis), and currently has the right to nominate up to a total of three individuals to the Board as a result of the full exercise of its option to purchase an aggregate of 1,333,333 shares of our common stock at a price of $6.00 per share (the “Option”) in accordance with a Securities Purchase Option Agreement entered into on May 28, 2014 between the Company and ACM (the “Option Agreement”). As a result, ACM has influence over our decisions to certain corporate actions including those specified in the Stockholder Rights Agreement.
Moreover, ACM has a contractual right to maintain its percentage ownership in our Company. Specifically, under the terms of the Stockholder Rights Agreement, for so long as ACM beneficially owns more than 15% of our issued and outstanding common stock (calculated on a fully diluted basis), ACM, subject to certain exclusions, has a preemptive right to purchase up to 40% of any new securities we propose to issue or sell. As a result, ACM’s preemptive right will apply to any securities we issue during an underwritten public offering. Therefore, while other holders of our stock would risk suffering a reduction in percentage ownership in connection with a new issuance of securities by us, ACM would, through this preemptive right, have the opportunity to avoid a reduction in percentage ownership. As long as ACM continues to hold a significant portion of our outstanding common stock, it will have the ability to influence the vote in any election of directors and over decisions that require stockholder approval. Please read Part III – Item 13 – “Certain Relationships and Related Party Transactions, and Director Independence.”
Item 1B. Unresolved Staff Comments
Not applicable.
Properties
Our principal executive offices are located at 2930 W. Sam Houston Parkway North, Suite 275, Houston, Texas 77043, where we lease 6,577 square feet of general office space pursuant to a lease agreement expiring on September 30, 2017.
We own or lease facilities and administrative offices throughout the geographic regions in which we operate. As of December 31, 2015, we owned or leased the following principal properties:
| 32 |
| Location | Type of Facility | Size | Leased or Owned | Monthly Lease (Approx.) | Expiration of Lease | Primary Use | ||||||||||
| 2930 W. Sam Houston Pkwy N., Suite 275, Houston, TX | Corporate Office | 6,577 sq. ft. building space | Leased | $ | 17,312 | September 30, 2017 | Administrative Office | |||||||||
| 1600 Brittmoore Rd Houston, TX | Warehouse | 13,125 sq. ft. building space | Leased | $ | 7,875 | December 31, 2016 | US Operations | |||||||||
| Uruguay 1134 Buenos Aires, Argentina | Administrative Offices | 1,900 sq. ft. building space | Leased | $ | 4,500 | September 30, 2017 | Administrative Office | |||||||||
| Leloir 451 Neuquén, Argentina | Administrative Offices | 1,990 sq. ft. building space | Leased | $ | 4,500 | June 30, 2017 | Neuquén Operations | |||||||||
| Ing. Huergo 3,530 Neuquén, Argentina | Warehouse/Land | 6,500 sq. ft. building space/54,000 sq. ft. land use | Leased | $ | 13,000 | June 30, 2016 | Argentina Operations | |||||||||
| Plottier, Argentina | Land | 12 acres | Owned | N/A | — | Future Neuquén Operations | ||||||||||
| Calle No12 Neuquén, Argentina | Warehouse | 3,500 sq. ft. building | Leased | $ | 6,900 | August 31, 2017 | Argentina Operations | |||||||||
We are not a party to, and none of our property is the subject of, any pending material legal proceedings. To our knowledge, no governmental authority is contemplating any such proceedings.
Item 4. Mine Safety Disclosures
Not applicable.
| 33 |
Item 5. Market for Registrant’s Common Equity, Related Stockholder Matters and Issuer Purchases of Equity Securities
Market Information
Our common stock is currently listed on the NASDAQ Capital Market under the symbol “ESES.” Prior to April 10, 2015, our common stock was quoted in the over-the-counter bulletin board (or OTCBB) and the OTCQB marketplace operated by the OTC Market Group, Inc. The reported high and low last sale prices for our common stock are shown below for the periods indicated. The quotations reflect inter-dealer prices, without retail mark-up, markdown or commission, and may not represent actual transactions. On March 16, 2016, the last reported sale price of our common stock was $2.25 per share.
| High | Low | ||||||||
| 2014 | |||||||||
| First quarter ended March 31, 2014 | $ | 15.00 | (1) | $ | 4.80 | ||||
| Second quarter ended June 30, 2014 | $ | 7.75 | $ | 6.50 | |||||
| Third quarter ended September 30, 2014 | $ | 16.00 | (2) | $ | 6.00 | ||||
| Fourth quarter ended December 31, 2014 | $ | 7.04 | $ | 4.30 | |||||
| 2015 | |||||||||
| First quarter ended March 31, 2015 | $ | 6.50 | $ | 4.31 | |||||
| Second quarter ended June 30, 2015 | $ | 8.39 | $ | 5.18 | |||||
| Third quarter ended September 30, 2015 | $ | 6.79 | $ | 2.99 | |||||
| Fourth quarter ended December 31, 2015 | $ | 5.45 | $ | 1.88 | |||||
(1) Volume of shares traded at high price for the quarter was 2,339 shares.
(2) Volume of shares traded at high price for the quarter was 400 shares.
Holders
As of March 16, 2016 we had approximately 667 record holders of our common stock.
Dividend Policy
We currently intend to retain future earnings, if any, for use in the operation and expansion of our business and, therefore, do not anticipate paying any cash dividends in the foreseeable future following this offering. However, our Board, in its discretion, may authorize the payment of dividends in the future. Any decision to pay future dividends will depend upon various factors, including our results of operations, financial condition, capital requirements and investment opportunities. In addition, the Note Agreement contain terms and covenants that restrict our ability to make distributions to our stockholders.
Securities Authorized for Issuance under Equity Compensation Plans
The Company has two stock incentive plans, the 2013 Stock Incentive Plan (the “2013 Plan”) and the 2015 Stock Incentive Plan (the “2015 Plan”), which provide for the granting of stock-based incentive awards, including incentive stock options, non-qualified stock options and restricted stock, to employees, consultants and members of the Company’s board of directors (the “Board”). The 2013 Plan was adopted in 2012 and amended in 2013 and authorizes 1,000,000 shares to be issued. The 2015 Plan, f/k/a “the 2014 Stock Incentive Plan,” was adopted in 2014; in 2015 it was amended and 500,000 additional shares were authorized, resulting in a maximum of 1,000,000 shares being authorized for issuance. Both the 2013 Plan and the 2015 Plan have been approved by the shareholders of the Company.
| 34 |
For additional information regarding the Stock Incentive Plans, as of December 31, 2015, please see Part II – Item 8 – Financial Statements and Supplemental Data – Notes to consolidated financial statements – Note 14 – Stock-Based Compensation of this Form 10-K.
| Equity Compensation Plan Information | ||||||||||||
| Plan category | Number of securities to be
issued upon exercise of outstanding options, and restricted stock (a) | Weighted-average exercise
price of outstanding options, and restricted stock (b) | Number of securities remaining
available for future issuance under equity compensation plans (excluding securities reflected in column (a)) (c) | |||||||||
| Equity compensation plans approved by security holders | 1,136,839 | $ | 5.52 | 713,328 | ||||||||
| Equity compensation plans not approved by security holders | — | — | — | |||||||||
| Total | 1,136,839 | $ | 5.52 | 713,328 | ||||||||
| 35 |
Recent Sales of Unregistered Securities; Use of Proceeds from Registered Securities
The following table discloses purchases of shares of the Company’s common stock made by us or on our behalf during the fourth quarter of 2015.
| Period | Total Number of Shares Purchased | Average Price Paid per Share | Total Number of Shares Purchased as Part of Publicly Announced Plans or Programs (2) | Approximate Dollar Value of Shares that May Yet Be Purchased Under the Plans or Programs | ||||||||||||
| December 2015 | 6,939 | (1) | $ | 2.95 | 6,939 | $ | 4,979,498 | |||||||||
| Total | 6,939 | (1) | $ | 2.95 | 6,939 | $ | 4,979,498 |
(1) All shares were purchased pursuant to the publicly announced stock repurchase program described in footnote 2 below.
(2) On December 15, 2015, the board of directors authorized the Company to repurchase, from time to time during the period from December 16, 2015 through December 16, 2017, up to $5 million in shares of its outstanding common stock.
Item 6. Selected Financial Data
Not applicable.
| 36 |
Item 7. Management’s Discussion and Analysis of Financial Condition and Results of Operations
The following discussion and analysis of our financial condition and results of operations should be read in conjunction with our condensed consolidated financial statements and the related notes thereto included in this Form 10-K. This section contains forward-looking statements that involve risks and uncertainties. Our actual results may differ materially from those discussed in any forward-looking statement because of various factors, including those described in the section titled “Cautionary Statements Regarding Forward-Looking Statements” above.
This section contains forward-looking statements that involve risks and uncertainties. Our actual results may differ materially from those discussed in any forward-looking statement because of various factors, including those described in the section titled “Cautionary Statements Regarding Forward-Looking Statements” in this Form 10-K.
Overview
We are a technology-driven independent oilfield services company providing well stimulation, coiled tubing and field management services to the upstream oil and gas industry. We are focused on reducing the ecological impact and improving the economic performance of the well stimulation process. We have assembled proven technologies and processes that have the ability to (1) reduce the surface footprint, (2) reduce emissions and (3) conserve fuel and water during the stimulation process. We will focus on bringing these technologies and processes to the most active shale resource basins outside of the United States, using our technology to differentiate our service offerings. Our management team has extensive international industry experience. Our first operation is in the Vaca Muerta basin in Argentina, the world’s third-largest shale resource basin as measured by technically recoverable reserves. However, we also intend to pursue other markets where we believe we can offer clear strategic advantages and achieve acceptable financial returns. We may also explore opportunistic acquisitions and/or joint ventures with established companies in target markets.
Our management team has extensive experience in operating well stimulation fleets, coiled tubing units and other downhole completion equipment, as well as providing “sweet spot” analysis in shale resource basins using geophysical predictive modeling. We expect to leverage our management’s experience and historical local relationships in undersupplied markets to pursue profitable long-term contracts. We expect to compete for business with a limited number of other service companies based on technical capability, quality of equipment, local experience and existing relationships rather than solely on price. We also believe that we benefit from our association with our largest investors, which give us strategic advantages into the emerging markets and Argentina.
Results of Operations
During 2015, the Company continued its well stimulation operation and began coiled tubing operations. The Company has a strong team of operational personnel and local management that completed 82 stimulation stages and 18 coiled tubing jobs for the year.
| Years Ended December 31, | ||||||||||||
| 2015 | 2014 | $ Change | ||||||||||
| Revenues | $ | 13,755,140 | $ | 834,482 | $ | 12,920,658 | ||||||
| Operating cost and expenses: | ||||||||||||
| Cost of services | 14,527,201 | 4,303,784 | 10,223,417 | |||||||||
| Selling, general and administrative expenses | 7,011,765 | 5,727,146 | 1,284,619 | |||||||||
| Research and development | 979,893 | — | 979,893 | |||||||||
| Depreciation and amortization expense | 3,414,452 | 473,359 | 2,941,093 | |||||||||
| Total operating costs and expenses | 25,933,311 | 10,504,289 | 15,429,022 | |||||||||
| Operating loss | (12,178,171 | ) | (9,669,807 | ) | (2,508,364 | ) | ||||||
| Other income (expense): | ||||||||||||
| Gain on sale of trading securities | 5,091,387 | 4,723,815 | 367,572 | |||||||||
| Interest expense | (4,007,974 | ) | (2,013,024 | ) | (1,994,950 | ) | ||||||
| Other expense | (1,955,679 | ) | (183,366 | ) | (1,772,313 | ) | ||||||
| Total other income (expense) | (872,266 | ) | 2,527,425 | (3,399,691 | ) | |||||||
| Provision for income taxes | (344,314 | ) | — | (344,314 | ) | |||||||
| Net loss | $ | (13,394,751 | ) | $ | (7,142,382 | ) | $ | (6,252,369 | ) | |||
| 37 |
For the Years Ended December 31, 2015 and 2014
Revenue for the year ended December 31, 2015 increased $12,920,658 to $13,755,140 from $834,482 for the year ended December 31, 2014. This increase was primarily due to the limited activity of our well stimulation and coiled tubing operations in Argentina in the 2014 period as compared to the full year activity for 2015.
Costs of services increased $10,223,417 to $14,527,201 for the year ended December 31, 2015 compared to $4,303,784 for the year ended December 31, 2014. This increase was primarily due to higher activity levels related to the full year operations of our well stimulation and coiled tubing operations in Argentina, hiring additional personnel and preparing for our second well stimulation crew and the costs associated with the short term rental of equipment required to complete larger jobs for our customers while the Company awaits delivery of new well stimulation equipment.
Our selling, general, and administrative expenses increased $1,284,619 to $7,011,765 for the year ended December 31, 2015 compared to $5,727,146 for the year ended December 31, 2014. This increase is a result of: additional labor and benefits cost of $550,537 related to expanding our corporate structure and administrative staff in Argentina, internal controls, SEC compliance; increased office lease cost for Houston and Argentina of $255,379; higher marketing cost as a result of branding the Company and participating in industry expositions in Argentina for $101,090; additional costs associated with stock compensation of $94,351 for options and restricted stock granted in 2015; higher property and stamp tax costs of $75,492; higher insurance costs of $58,647; and higher other administrative cost of $149,123.
Research and development for the year ended December 31, 2015 was $979,893. The Company did not have any research and development cost in prior years. Research and development includes the cost associated with research activities of fiber optics technology and the development of our TPU technology.
Net other expense increased $3,399,691 to $872,266 for the year ended December 31, 2015 compared to net other income of $2,527,425 for the year ended December 31, 2014. Gain on sale of trading securities increased $367,572 to $5,091,387 primarily as a result of gains on the sale of trading securities for the year ended December 31, 2015 compared to $4,723,815 for the year ended December 31, 2014. These gains relate to the capitalization of our subsidiary in Argentina, whereby we purchased and sold Argentine bonds in order to take advantage of the favorable spread in exchange rates between the U.S. Dollar and Argentine Peso. Other expense increased $1,772,313 to $1,955,679 for the year ended December 31, 2015 compared to $183,366 for the year ended December 31, 2014, mainly related to the devaluation in December as the new President of Argentina removed currency controls for an increase of $1,631,185 and bank fees and transactional tax for an increase of $141,127. The Company effectively managed the expected devaluation using the bond market which resulted in a net impact on other income of $3,411,064 for the year. Interest expense increased $1,994,950 to $4,007,974 for the year ended December 31, 2015 compared to $2,013,024 for the year ended December 31, 2014. This increase was primarily due to interest expense related to various borrowings incurred by the Company during 2014 as discussed in Part II – Item 8 – Financial Statements and Supplemental Data – Notes to consolidated financial statements – Note 9 – “Debt”.
Liquidity and Capital Resources
Our primary sources of liquidity to date have been proceeds from various equity and debt offerings. We completed a public offering during the first quarter of 2015 and a second offering on July 15, 2015 as discussed in Part II – Item 8 – Financial Statements and Supplemental Data – Notes to consolidate financial statements – Note 11 – “Equity Offering”.
| 38 |
We continually monitor potential capital sources, including equity and debt financings, in order to meet our planned capital expenditures and liquidity requirements. The successful execution of our growth strategy depends on our ability to raise capital as needed to, among other things, finance the purchase of additional equipment. If we are unable to obtain additional capital on favorable terms or at all, we may be unable to sustain or increase our current level of growth in the future. The availability of equity and debt financing will be affected by prevailing economic conditions in our industry and financial, business and other factors, many of which are beyond our control.
Capital Requirements
The energy services business is capital intensive, requiring significant investment to expand, upgrade and maintain equipment. Our primary uses of capital have been the acquisition of equipment, working capital to finance the start of our operations and general administrative expenses.
Going forward, we expect our capital requirements to consist primarily of:
| ● | growth capital expenditures, such as those to acquire additional equipment and other assets to grow our business; and | |
| ● | maintenance capital expenditures, which are capital expenditures made to extend the useful life of our assets. |
Additionally, we continually monitor new advances in well stimulation equipment and down-hole technology as well as technologies that may complement our business and opportunities to acquire additional equipment to meet our customers’ needs. Our ability to make any significant acquisition for cash would likely require us to obtain additional equity or debt financing, which may not be available to us on favorable terms or at all.
Our ability to fund operations, and to fund planned and committed 2016 capital expenditures will depend upon our future operating performance, and more broadly, on the availability of equity and debt financing, which will be affected by prevailing economic conditions, market conditions in the exploration and production industry and financial, business and other factors, many of which are beyond our control.
Our ability to acquire equipment could require us to obtain additional equity or debt financing, which may not be available to us on favorable terms or at all.
We intend to incur approximately $3 million in capital expenditures during the first half of 2016 and will incur additional capital expenditures on a discretionary basis as necessary to meet customer demands and subject to satisfactory financing.
Sources and Uses of Cash
Net cash used in operating activities was $18,615,159 for the year ended December 31, 2015 and $11,552,968 for the year ended December 31, 2014. The increase was primarily due to working capital costs associated with the first full year of our well stimulation and coiled tubing operations including non-recurring operational start-up costs and SG&A costs.
Net cash used in investing activities was $7,020,081 for the year ended December 31, 2015 and $20,611,602 for the year ended December 31, 2014. This decrease is primarily associated with lower purchases of equipment compared to 2014 of $10,502,414 and higher net proceeds related to the purchase and sale of Argentinian Bonds to capitalize the operations of $3,089,107.
Net cash provided by financing activities was $30,364,173 for the year ended December 31, 2015 and $34,886,004 for the year ended December 31, 2014.
| 39 |
The following table summarizes our cash flows for the years ended December 31, 2015 and 2014:
| Years Ended December 31, | ||||||||
| 2015 | 2014 | |||||||
| Financing Activities | ||||||||
| Proceeds from sale of common stock | 35,329,038 | 10,302,400 | ||||||
| Sale of common stock issuance cost | (3,099,919 | ) | (476,738 | ) | ||||
| Proceeds from convertible debt | — | 22,000,000 | ||||||
| Convertible debt cost | — | (741,449 | ) | |||||
| Proceeds from notes payable | 400,000 | 4,295,002 | ||||||
| Payments on notes payable | (1,647,246 | ) | (224,281 | ) | ||||
| Payments on capital lease | (597,406 | ) | (268,930 | ) | ||||
| Purchase of treasury stock | (20,294 | ) | — | |||||
| Net cash provided by financing activities | 30,364,173 | 34,886,004 | ||||||
On December 15, 2015, the board of directors authorized the Company to repurchase, from time to time from December 16, 2015 through December 16, 2017, up to $5 million in shares of its outstanding common stock. As of December 31, 2015 the Company had purchased 6,939 shares at a cost of $20,294 under the buy-back program.
We had a net increase in cash and cash equivalents of $4,728,933 for the year ended December 31, 2015, compared to a net increase in cash and cash equivalents of $2,721,434 during the year ended December 31, 2014 primarily resulting from our financing activities funding.
We do not generate positive cash flow at this time. Further, while we believe we will begin generating positive cash flow from operations in 2016, our liquidity provided by our existing cash and cash equivalents may not be sufficient to fund our full capital expenditure plan. Our current capital commitments may require us to obtain additional equity or debt financing, which may not be available to us on favorable terms or at all.
Impact of Inflation on Operations
Management is of the opinion that inflation has not had a significant impact on our business to date. We purchase our equipment and materials from suppliers who provide competitive prices, and employ skilled workers from competitive labor markets. If inflation in the general economy increases, our costs for equipment, materials and labor could increase as well. Also, increases in activity in oilfields can cause upward wage pressures in the labor markets from which we hire employees as well as increases in the costs of certain materials and key equipment components used to provide services to our customers.
Industry Trends and Outlook
We face many challenges and risks in the industry in which we operate. Although many factors contributing to these risks are beyond our ability to control, we continuously monitor these risks and have taken steps to mitigate them to the extent practicable. In addition, while we believe that we are well positioned to capitalize on available growth opportunities, we may not be able to achieve our business objectives and, consequently, our results of operations may be adversely affected. Please read this section in connection with the factors described in the sections titled “Cautionary Statements Regarding Forward-Looking Statements” and Part I – Item 1A. “Risk Factors” for additional information about the known material risks that we face.
Our business depends on the capital spending programs of our customers. Revenue from our well stimulation, coiled tubing and field management segments are expected to be generated by providing services to oil and natural gas exploration and production companies throughout Argentina. Demand for our services is a function of our customers’ willingness to make operating and capital expenditures to explore for, develop and produce hydrocarbons in these areas, which in turn is affected by current and expected levels of oil and natural gas prices. Although domestic Argentine operators remain somewhat protected by local price controls above international prices, the market is still impacted by the global pricing environment. The energy services industry have historically tended to delay capital equipment projects, including maintenance and upgrades, during industry downturns.
| 40 |
On November 21, 2012, the United States District Court for the Southern District of New York issued an injunction preventing Argentina from making payments on the restructured bonds, and ordered Argentina to make a deposit of $1.3 billion related to the claims of the holdout creditors, which order was appealed by the country. Argentina’s appeal was denied by the Second Circuit Court of Appeals, and on June 16, 2014 the Supreme Court of the United States refused to hear Argentina’s appeal from that denial. As a result, Argentina fell into technical default on its restructured debt and was forced to place the interest payments into escrow until the matter could be resolved.
On February 29, 2016, the Macri government reached an agreement to pay $4.65 billion to settle the claims with creditors, subject to a few conditions including the passage of enabling legislation in Argentina.
The oil and gas industry has traditionally been volatile, is highly sensitive to a combination of long-term and cyclical trends, including the domestic and international supply and demand for oil and natural gas, current and expected future prices for oil and natural gas and the perceived stability and sustainability of those prices, production depletion rates and the resultant levels of cash flows generated and allocated by exploration and production companies to their drilling and workover budget, as well as domestic and international economic conditions, political instability in oil producing countries and merger, acquisition and divestiture activity among exploration and production companies. The volatility of the oil and gas industry, and the consequent impact on exploration and production activity could adversely impact the level of drilling and workover activity by our customers. This volatility affects the demand for our services and our ability to negotiate pricing at levels generating desirable margins, especially in our well stimulation business.
Assets and Liabilities
Total assets were $62,900,299 as of December 31, 2015, compared to $42,050,425 as of December 31, 2014, an increase of $20,849,874. This is primarily due to funds raised during the year to finance our continuing operations, the purchase of additional equipment to prepare the second and third well stimulation fleet assets and support equipment.
Total liabilities were $32,139,409 as of December 31, 2015, compared to $34,069,206 as of December 31, 2014, a decrease of $1,929,797. This is primarily related to loan repayments on the turbine-powered pressure pumping units and further payments on the capital lease for the coiled tubing unit.
Total shareholders’ equity was $30,760,890 as of December 31, 2015, compared to $7,981,219 as of December 31, 2014, an increase of $22,779,671. This is primarily due to the funds raised during the first and third quarters of 2015, offset by our net loss, due in large part to costs associated with the startup of our operations in Argentina.
Critical Accounting Policies
The preparation of consolidated financial statements in conformity with generally accepted accounting principles (“GAAP”) requires management to select appropriate accounting principles from those available, to apply those principles consistently and to make reasonable estimates and assumptions that affect revenues and associated costs as well as reported amounts of assets and liabilities, and related disclosure of contingent assets and liabilities. Certain accounting policies involve judgments and uncertainties. We evaluate estimates and assumptions on a regular basis. We base our respective estimates on historical experience and various other assumptions that we believe to be reasonable under the circumstances, the results of which form the basis for making judgments about the carrying values of assets and liabilities that are not readily apparent from other sources. Actual results may differ from the estimates and assumptions used in preparation of our consolidated financial statements. We consider the following policies to be the most critical to understanding the judgments that are involved and the uncertainties that could impact our results of operations, financial condition and cash flows.
Pursuant to the Jumpstart Our Business Startups Act of 2012 (the “JOBS Act”), we are reporting in accordance with certain reduced public company reporting requirements permitted by this act. As a result, our financial statements may not be comparable to companies that are not emerging growth companies or elect to avail themselves of this provision.
| 41 |
We believe the following critical accounting policies involve significant areas of management’s judgments and estimates in the preparation of its consolidated financial statements.
Property and Equipment. Fixed asset additions are recorded at cost less accumulated depreciation. Cost of units manufactured consists of products, components, labor and overhead. Expenditures for renewals and betterments that extend the lives of the assets are capitalized. An allocable amount of interest on borrowings is capitalized for self-constructed assets and equipment during their construction period. Amounts spent for maintenance and repairs are charged against operations as incurred. Costs of fixed assets are depreciated on a straight-line basis over the estimated useful lives of the related assets which range from one year and half to seven years for service equipment. Leasehold improvements will be depreciated over the lesser of the estimated useful life of the improvement or the remaining lease term. Management is responsible for reviewing the carrying value of property and equipment for impairment whenever events and circumstances indicate that the carrying value of an asset may not be recoverable from estimated future cash flows expected to result from its use and eventual disposition. In cases where undiscounted expected future cash flows are less than the carrying value, an impairment loss is recognized equal to the amount by which the carrying value exceeds the fair value of assets. When making this assessment, the following factors are considered: current operating results, trends and prospects, as well as the effects of obsolescence, demand, competition and other economic factors.
Capital Lease Obligations. The Company leases certain equipment under lease agreements. The Company evaluates each lease to determine its appropriate classification as an operating or capital lease for financial reporting purposes. Any lease that does not meet the criteria for a capital lease is accounted for as an operating lease. The assets and liabilities under capital leases are recorded at the lower of the present value of the minimum lease payments or the fair market value of the related assets. Assets under capital leases are amortized using the straight-line method over the initial lease term. Amortization of assets under capital leases is included in depreciation expense.
Revenue Recognition. Revenues are recognized as services are completed and collectability is reasonably assured. With respect to hydraulic fracturing services, we expect to recognize revenue and invoice our customers upon the completion of each fracturing stage. In our industry, it is not uncommon for a service provider to complete multiple fracturing stages per day during the course of a job.
Stock-Based Payments. We account for stock incentive awards issued to employees and non-employees in accordance with Financial Accounting Standards Board Accounting Standards Codification Topic 718, Stock Compensation. Accordingly, employee stock-based compensation is measured at the grant date, based on the fair value of the award, and is recognized as an expense over the requisite service period, or upon the occurrence of certain vesting events. Additionally, stock-based awards to non-employees are expensed over the period in which the related services are rendered. The grant-date fair value of awards is estimated using the Black-Scholes option-pricing model, which requires the use of highly subjective assumptions such as the estimated market value of our stock, expected term of the award, expected volatility and the risk-free interest rate. Since some of our share options were not publicly traded at the time of issuance and have not been traded privately, the value of the shares is estimated based on significant unobservable inputs, primarily consisting of the estimated value of the start-up activities completed as of the grant date, as well as other inputs that are estimated based on similar entities with publicly traded securities. We continue to use judgment in evaluating the expected term, volatility and forfeiture rate related to our stock-based compensation on a prospective basis and incorporate these factors into our option-pricing model. Each of these inputs is subjective and generally requires significant management judgment. If, in the future, we determine that another method for calculating the fair value of our unit-based awards is more reasonable, or if another method for calculating these input assumptions is prescribed by authoritative guidance, and, therefore, should be used to estimate expected volatility or expected term, the fair value calculated for our employee unit-based awards could change significantly. Higher volatility and longer expected terms generally result in an increase to stock-based compensation expense determined at the date of grant.
Income Taxes. We account for income taxes using the asset and liability method. Deferred tax assets and liabilities are recognized for the future tax consequences attributable to differences between the financial statement carrying amounts of existing assets and liabilities and their respective tax basis and operating loss and tax credit carryforwards. Deferred tax assets and liabilities are measured using enacted tax rates expected to apply to taxable income in the years in which those temporary differences are expected to be recovered or settled. The effect on deferred tax assets and liabilities of a change in tax rates is recognized in income in the period that includes the enactment date.
| 42 |
Our tax filings for various periods are subject to audit by the tax authorities in most jurisdictions where we conduct business. These audits may result in assessments of additional taxes that are resolved with the authorities or through the courts. We believe these assessments may occasionally be based on erroneous and even arbitrary interpretations of local tax law. Resolution of these situations inevitably includes some degree of uncertainty; accordingly, we provide taxes only for the amounts we believe will ultimately result from these proceedings. The resulting change to our tax liability, if any, is dependent on numerous factors including, among others, the amount and nature of additional taxes potentially asserted by local tax authorities; the willingness of local tax authorities to negotiate a fair settlement through an administrative process; the impartiality of the local courts; the number of countries in which we do business; and the potential for changes in the tax paid to one country to either produce, or fail to produce, an offsetting tax change in other countries. The potential exists that the tax resulting from the resolution of current and potential future tax controversies may differ materially from the amount accrued.
Valuation Allowance for Deferred Tax Assets. We record a valuation allowance to reduce the carrying value of our deferred tax assets when it is more likely than not that a portion or all of the deferred tax assets will expire before realization of the benefit or future deductibility is not probable. The ultimate realization of the deferred tax assets depends on the ability to generate sufficient taxable income of the appropriate character and in the related jurisdiction in the future. In evaluating our ability to recover our deferred tax assets, we consider the available positive and negative evidence, including our past operating results, the existence of cumulative losses in the most recent years and our forecast of future taxable income. In estimating future taxable income, we develop assumptions, including the amount of future pretax operating income, the reversal of temporary differences and the implementation of feasible and prudent tax planning strategies. These assumptions require significant judgment.
Recent Accounting Pronouncements
See Part II, Item 8, “Financial Statements and Supplementary Data – Note 2 – Basis of Presentation and Significant Accounting Policies.”
Item 7A. Quantitative and Qualitative Disclosures About Market Risk
We are exposed to certain market risks as part of our ongoing business operations, including risks from changes in foreign currency exchange rates and commodities that could impact our financial position, results of operations and cash flows. We manage our exposure to these risks through regular operating and financing activities.
Foreign Currency Risk
As of December 31, 2015, we conduct operations in Argentina. The functional currency for our Argentina operations is the U.S. dollar. We and our foreign subsidiaries from time to time will hold foreign currencies. Exchange rate fluctuations will subject us to foreign currency risk. In the future, we could experience fluctuations in financial results from our operations outside the U.S., and there can be no assurance that payments received in foreign currencies can be repatriated to the U.S. or that we will be able, contractually or otherwise, to reduce the foreign currency risks associated with our international operations.
Commodity Price Risk
Our revenues, profitability and future rate of growth significantly depend upon the market prices of oil and natural gas. Lower prices may also reduce the amount of oil and gas that can economically be produced.
| 43 |
Item 8. Financial Statements and Supplemental Data
| 44 |
REPORT OF INDEPENDENT REGISTERED PUBLIC ACCOUNTING FIRM
To the Board of Directors and Stockholders of Eco-Stim Energy Solutions, Inc.
We have audited the accompanying consolidated balance sheets of Eco-Stim Energy Solutions, Inc. (the “Company”), as of December 31, 2015 and 2014, and the related consolidated statements of operations, cash flows, changes in stockholders’ equity, and comprehensive loss for the years then ended. The Company’s management is responsible for these consolidated financial statements. Our responsibility is to express an opinion on these consolidated financial statements based on our audits.
We conducted our audits in accordance with the standards of the Public Company Accounting Oversight Board (United States). Those standards require that we plan and perform the audit to obtain reasonable assurance about whether the financial statements are free of material misstatement. The Company is not required to have, nor were we engaged to perform, an audit of its internal control over financial reporting. Our audit included consideration of internal control over financial reporting as a basis for designing audit procedures that are appropriate in the circumstances, but not for the purpose of expressing an opinion on the effectiveness of the Company’s internal control over financial reporting. Accordingly, we express no such opinion. An audit also includes examining, on a test basis, evidence supporting the amounts and disclosures in the consolidated financial statements, assessing the accounting principles used and significant estimates made by management, as well as evaluating the overall consolidated financial statement presentation. We believe that our audits provide a reasonable basis for our opinion.
In our opinion, the consolidated financial statements referred to above present fairly, in all material respects, the financial position of the Company, as of December 31, 2015 and 2014, and the results of their operations and their cash flows for the years then ended, in conformity with accounting principles generally accepted in the United States of America.
| /s/ Whitley Penn LLP | |
| Dallas, Texas | |
| March 17, 2016 |
| F-1 |
ECO-STIM ENERGY SOLUTIONS, INC.
| December 31, | ||||||||
| 2015 | 2014 | |||||||
| Assets | ||||||||
| Current assets: | ||||||||
| Cash and cash equivalents | $ | 11,742,489 | $ | 7,013,556 | ||||
| Accounts receivable | 8,155,264 | 264,192 | ||||||
| Marketable securities | — | 1,360,767 | ||||||
| Inventory | 1,546,463 | 1,619,778 | ||||||
| Prepaids | 3,328,265 | 2,496,805 | ||||||
| Other assets | 234,010 | 409,388 | ||||||
| Total current assets | 25,006,491 | 13,164,486 | ||||||
| Property, plant and equipment, net | 37,142,578 | 27,949,347 | ||||||
| Other non-current assets | 751,230 | 936,592 | ||||||
| Total assets | $ | 62,900,299 | $ | 42,050,425 | ||||
| Liabilities and stockholders’ equity | ||||||||
| Current liabilities: | ||||||||
| Accounts payable | $ | 1,112,812 | $ | 1,947,371 | ||||
| Accrued expenses | 3,843,497 | 3,164,250 | ||||||
| Short-term notes payable | — | 158,036 | ||||||
| Current portion of long term notes payable | 3,010,790 | 475,000 | ||||||
| Current portion of capital lease payable | 686,624 | 597,406 | ||||||
| Total current liabilities | 8,653,723 | 6,342,063 | ||||||
| Non-current liabilities: | ||||||||
| Long-term notes payable | 22,000,000 | 25,625,000 | ||||||
| Long-term capital lease payable | 1,485,686 | 2,102,143 | ||||||
| Total non-current liabilities | 23,485,686 | 27,727,143 | ||||||
| Stockholders’ equity | ||||||||
| Preferred stock, $0.001 par value, 50,000,000 shares authorized, none issued | — | — | ||||||
| Common stock, $0.001 par value, 200,000,000 shares authorized, 13,572,989 issued and 13,566,050 outstanding at December 31, 2015 and 5,709,523 issued and outstanding at December 31, 2014 | 13,572 | 5,709 | ||||||
| Additional paid-in capital | 57,302,953 | 21,116,100 | ||||||
| Treasury stock, at cost; 6,939 common shares at December 31, 2015 | (20,294 | ) | — | |||||
| Accumulated deficit | (26,535,341 | ) | (13,140,590 | ) | ||||
| Total stockholders’ equity | 30,760,890 | 7,981,219 | ||||||
| Total liabilities and stockholders’ equity | $ | 62,900,299 | $ | 42,050,425 | ||||
See accompanying notes to consolidated financial statements.
| F-2 |
ECO-STIM ENERGY SOLUTIONS, INC.
CONSOLIDATED STATEMENTS OF OPERATIONS
| Years Ended December 31, | ||||||||
| 2015 | 2014 | |||||||
| Revenues | $ | 13,755,140 | $ | 834,482 | ||||
| Operating cost and expenses: | ||||||||
| Cost of services | 14,527,201 | 4,303,784 | ||||||
| Selling, general, and administrative expenses | 7,011,765 | 5,727,146 | ||||||
| Research and development | 979,893 | — | ||||||
| Depreciation and amortization expense | 3,414,452 | 473,359 | ||||||
| Total operating costs and expenses | 25,933, 311 | 10,504,289 | ||||||
| Operating loss | (12,178,171 | ) | (9,669,807 | ) | ||||
| Other income (expense): | ||||||||
| Gain on sale of trading securities | 5,091,387 | 4,723,815 | ||||||
| Interest expense | (4,007,974 | ) | (2,013,024 | ) | ||||
| Other expense | (1,955,679 | ) | (183,366 | ) | ||||
| Total other income (expense) | (872,266 | ) | 2,527,425 | |||||
| Provision for income taxes | (344,314 | ) | — | |||||
| Net loss | $ | (13,394,751 | ) | $ | (7,142,382 | ) | ||
| Basic and diluted loss per share | $ | (1.35 | ) | $ | (1.48 | ) | ||
| Weighted average number of common shares outstanding-basic and diluted | 9,888,191 | 4,812,656 | ||||||
See accompanying notes to consolidated financial statements.
| F-3 |
ECO-STIM ENERGY SOLUTIONS, INC.
CONSOLIDATED STATEMENTS OF CASH FLOWS
| Years Ended December 31, | ||||||||
| 2015 | 2014 | |||||||
| Operating activities | ||||||||
| Net loss | $ | (13,394,751 | ) | $ | (7,142,382 | ) | ||
| Depreciation and amortization | 3,414,452 | 473,359 | ||||||
| Amortization of debt discount and loan origination cost | 255,535 | 210,906 | ||||||
| Stock based compensation | 1,480,435 | 1,252,061 | ||||||
| Gain on the sale of trading securities | (5,091,387 | ) | (4,723,815 | ) | ||||
| Foreign currency gain | — | (25,749 | ) | |||||
| Changes in operating assets and liabilities: | ||||||||
| Accounts receivable | (7,891,072 | ) | (264,192 | ) | ||||
| Inventory | (184,732 | ) | (1,619,778 | ) | ||||
| Prepaids and other assets | (860,538 | ) | (2,300,638 | ) | ||||
| Accounts payable and accrued expenses | 3,656,899 | 2,587,260 | ||||||
| Net cash used in operating activities | (18,615,159 | ) | (11,552,968 | ) | ||||
| Investing activities | ||||||||
| Purchases of equipment | (13,472,236 | ) | (23,974,650 | ) | ||||
| Proceeds from sale of trading securities | 19,435,956 | 12,861,075 | ||||||
| Purchase of trading securities | (12,983,801 | ) | (9,498,027 | ) | ||||
| Net cash used in investing activities | (7,020,081 | ) | (20,611,602 | ) | ||||
| Financing activities | ||||||||
| Proceeds from sale of common stock | 35,329,038 | 10,302,400 | ||||||
| Sale of common stock issuance cost | (3,099,919 | ) | (476,738 | ) | ||||
| Proceeds from convertible debt | — | 22,000,000 | ||||||
| Convertible debt cost | — | (741,449 | ) | |||||
| Proceeds from notes payable | 400,000 | 4,295,002 | ||||||
| Payments on notes payable | (1,647,246 | ) | (224,281 | ) | ||||
| Payments on capital lease | (597,406 | ) | (268,930 | ) | ||||
| Purchase of treasury stock | (20,294 | ) | — | |||||
| Net cash provided by financing activities | 30,364,173 | 34,886,004 | ||||||
| Net increase in cash and cash equivalents | 4,728,933 | 2,721,434 | ||||||
| Cash and cash equivalents, beginning of period | 7,013,556 | 4,292,122 | ||||||
| Cash and cash equivalents, end of period | $ | 11,742,489 | $ | 7,013,556 | ||||
| Supplemental disclosure of cash flow information | ||||||||
| Cash paid during the year for interest | $ | 3,104,129 | $ | 990,358 | ||||
| Cash paid during the year for income taxes | $ | 252,725 | $ | 193,948 | ||||
| Non-cash transactions | ||||||||
| Fixed asset additions in accrued expenses | $ | 139,607 | $ | 1,793,912 | ||||
| Interest converted to common stock | $ | 2,485,162 | $ | — | ||||
| Prepaids amortized to settle capital lease obligations | $ | — | $ | 250,851 | ||||
See accompanying notes to consolidated financial statements.
| F-4 |
ECO-STIM ENERGY SOLUTIONS, INC.
CONSOLIDATED
STATEMENTS OF CHANGES IN
STOCKHOLDERS’ EQUITY
YEARS ENDED DECEMBER 31, 2015 AND 2014
| Common Stock | Additional Paid-in | Treasury | Accumulated Other Comprehensive | Accumulated | ||||||||||||||||||||||||
| Shares | Amount | Capital | Stock | Income | Deficit | Total | ||||||||||||||||||||||
| Balance at December 31, 2013 | 3,985,206 | $ | 3,985 | $ | 10,007,490 | $ | — | $ | 25,749 | $ | (5,998,208 | ) | $ | 4,039,016 | ||||||||||||||
| Exercise of stock options | 3,500 | 3 | 312 | — | — | — | 315 | |||||||||||||||||||||
| Private equity placement, net | 1,717,067 | 1,717 | 9,823,630 | — | — | — | 9,825,347 | |||||||||||||||||||||
| Option issued in conjunction with debt | — | — | 32,611 | — | — | — | 32,611 | |||||||||||||||||||||
| Stock based compensation | 3,750 | 4 | 1,252,057 | — | — | — | 1,252,061 | |||||||||||||||||||||
| Foreign currency cumulative translation adjustment | — | — | — | — | (25,749 | ) | — | (25,749 | ) | |||||||||||||||||||
| Net loss | — | — | — | — | — | (7,142,382 | ) | (7,142,382 | ) | |||||||||||||||||||
| Balance at December 31, 2014 | 5,709,523 | $ | 5,709 | $ | 21,116,100 | $ | — | $ | — | $ | (13,140,590 | ) | $ | 7,981,219 | ||||||||||||||
| Sale of common stock, net | 7,216,066 | 7,217 | 32,221,902 | — | — | — | 32,229,119 | |||||||||||||||||||||
| Interest converted to common stock | 523,192 | 522 | 2,484,640 | 2,485,162 | ||||||||||||||||||||||||
| Treasury stock | (6,939 | ) | — | — | (20,294 | ) | — | — | (20,294 | ) | ||||||||||||||||||
| Stock based compensation | 124,208 | 124 | 1,480,311 | — | — | — | 1,480,435 | |||||||||||||||||||||
| Net loss | — | — | — | — | — | (13,394,751 | ) | (13,394,751 | ) | |||||||||||||||||||
| Balance at December 31, 2015 | 13,566,050 | $ | 13,572 | $ | 57,302,953 | $ | (20,294 | ) | $ | — | $ | (26,535,341 | ) | $ | 30,760,890 | |||||||||||||
See accompanying notes to consolidated financial statements.
| F-5 |
ECO-STIM ENERGY SOLUTIONS, INC.
CONSOLIDATED STATEMENTS OF COMPREHENSIVE LOSS
| Years Ended December 31, | ||||||||
| 2015 | 2014 | |||||||
| Net loss | $ | (13,394,751 | ) | $ | (7,142,382 | ) | ||
| Other comprehensive loss: | ||||||||
| Foreign currency cumulative translation adjustment | — | (25,749 | ) | |||||
| Other comprehensive loss | — | (25,749 | ) | |||||
| Comprehensive loss for the year | $ | (13,394,751 | ) | $ | (7,168,131 | ) | ||
See accompanying notes to consolidated financial statements.
| F-6 |
ECO-STIM ENERGY SOLUTIONS, INC.
NOTES
TO CONSOLIDATED FINANCIAL STATEMENTS
December 31, 2015 and 2014
| 1. | Nature of Business |
Eco-Stim Energy Solutions, Inc. (the “Company,” “Eco-Stim,” “we” or “us”) is a technology-driven independent oilfield services company providing well stimulation, coiled tubing and field management services to the upstream oil and gas industry. We are focused on reducing the ecological impact and improving the economic performance of the well stimulation process. We have assembled technologies and processes that have the ability to (1) reduce the surface footprint, (2) reduce emissions, and (3) conserve fuel and water during the stimulation process. The Company will focus on the most active shale resource basins outside of the United States, using our technology to differentiate our service offerings. Our management team has extensive international industry experience. Our first operation is in Argentina, home to the Vaca Muerta, the world’s third-largest shale resource basin as measured by technically recoverable reserves. The Company may also explore opportunistic acquisitions and/or joint ventures with established companies in target markets.
| 2. | Basis of Presentation and Significant Accounting Policies |
The consolidated financial statements have been prepared in accordance with accounting principles generally accepted in the United States (“U.S. GAAP”).
Principles of Consolidation
We consolidate all wholly-owned subsidiaries, controlled joint ventures and variable interest entities where the Company has determined it is the primary beneficiary. All material intercompany accounts and transactions have been eliminated in consolidation.
Use of Estimates
The preparation of financial statements in conformity with U.S. GAAP requires management to make estimates and assumptions that affect the reported amounts of assets and liabilities and disclosure of contingent assets and liabilities at the date of the financial statements, and the reported amounts of revenue and expenses during the reporting period. Estimates are used in, but are not limited to, determining the following: allowance for doubtful accounts, recoverability of long-lived assets and intangibles, useful lives used in depreciation and amortization, income taxes and stock-based compensation. The accounting estimates used in the preparation of the consolidated financial statements may change as new events occur, as more experience is acquired, as additional information is obtained and as the Company’s operating environment changes.
Cash and Cash Equivalents
The Company considers all highly liquid investments with a maturity of three months or less when purchased to be cash equivalents. The Company maintains deposits in several financial institutions, which may at times exceed amounts covered by insurance provided by the U.S. Federal Deposit Insurance Corporation (“FDIC”).
Revenue Recognition
The Company’s revenue is heavily dependent on two major customers. All revenue is recognized when persuasive evidence of an arrangement exists, delivery has occurred, the price is fixed or determinable, and collection is reasonably assured as follows:
| F-7 |
Well Stimulation Revenue
The Company provides well stimulation services based on contractual arrangements, such as term contracts and pricing agreements, or on a spot market basis. Revenue will be recognized and customers will be invoiced upon the completion of each job, which can consist of one or more stimulation stages.
Under term pricing agreement arrangements, customers commit to targeted utilization levels at agreed-upon pricing, but without termination penalties or obligations to pay for services not used by the customer. In addition, the agreed-upon pricing is typically subject to periodic review.
Spot market basis arrangements are based on an agreed-upon hourly spot market rate. The Company also charges fees for setup and mobilization of equipment depending on the job, additional equipment used on the job, if any, and materials that are consumed during the well stimulation process. Generally, these fees and other charges vary depending on the equipment and personnel required for the job and market conditions in the region in which the services are performed.
The Company also generates revenues from chemicals and proppants that are consumed while performing well stimulation services.
Coiled Tubing Revenue
The Company began providing coiled tubing and other well stimulation services in early 2015. Jobs for these services are typically short term in nature, lasting anywhere from a few hours to multiple days. Revenue is recognized upon completion of each job based upon a completed field ticket. The Company charges the customer for mobilization, services performed, personnel on the job, equipment used on the job, and miscellaneous consumables at agreed-upon spot market rates.
Field Management Revenue
The Company enters into arrangements to provide field management services. Field management revenue relates primarily to geophysical predictions and production monitoring, utilizing down-hole diagnostics tools. Revenue is recognized and customers are invoiced upon the completion of each job. The service invoices are for a set amount, which includes charges for the mobilization of the equipment to the location, the service performed, the personnel on the job, additional equipment used on the job, consumables used throughout the course of the service, and processing and interpretation of data acquired via down-hole diagnostic tools.
Fair Value of Financial Instruments
The Company’s financial instruments consist of cash and cash equivalents, accounts receivable, other assets, accounts payable, accrued expenses, capital lease obligations and notes payable. The recorded values of cash and cash equivalents, accounts receivable, other assets, accounts payable, and accrued expenses approximate their fair values based on their short-term nature. The carrying value of capital lease obligations and notes payable approximate their fair value, and the interest rates approximate market rates.
Functional and Presentation Currency
Items included in the financial statements of each of the Company’s entities are measured using the currency of the primary economic environment in which the entity operates (the “functional currency”). The functional currency for the Norwegian and Argentine subsidiaries is the U.S. Dollar. The consolidated financial statements are presented in U.S. Dollars, which is the Company’s presentation currency.
Marketable Securities
Investments in marketable securities are classified as trading, available-for-sale or held-to-maturity. Our marketable equity investments are classified as trading and their cost basis is determined by the specific identification method. Realized and unrealized gains and losses on trading securities are included in net income.
| F-8 |
During 2015 and 2014, the Company purchased and sold Argentine bonds to capitalize its subsidiary in Argentina. This resulted in a realized gain on the sale of trading securities of $5,091,387 and $4,361,448, respectively and unrealized gain on the sale of trading securities of $0 and $362,367, respectively. This gain was primarily due to the Company taking advantage of the favorable spread in exchange rates between the U.S. Dollar and Argentine Peso.
Net Loss per Common Share
For the years ended December 31, 2015 and 2014, the weighted average shares outstanding excluded certain stock options and potential shares from convertible debt of 4,253,381 and 4,004,214, respectively, from the calculation of diluted earnings per share because these shares would be anti-dilutive. Anti-dilutive warrants of 100,000 for each of the years ended December 31, 2015 and 2014 were also excluded from the calculation.
Reclassifications
Certain prior year amounts have been reclassified to conform to the 2015 presentation.
Accounts Receivable
Accounts receivable are stated at amounts management expects to collect from outstanding balances. Management provides for probable uncollectible amounts through a charge to earnings and a credit to a valuation allowance based on its assessment of the current status of individual accounts. Balances still outstanding after management has used reasonable collection efforts are written off through a charge to the valuation allowance and a credit to accounts receivable. At December 31, 2015 and 2014, the Company did not have an allowance for doubtful accounts.
Unbilled Accounts Receivable
The asset “unbilled receivables” represents revenues we have recognized in excess of amounts billed on services completed but not yet invoiced. We typically invoice our clients upon having a completed signed ticket and all necessary documentation required from our customer. Our unbilled receivables totaled $5,768,401 at December 31, 2015, and $0 at December 31, 2014 and is included in accounts receivable in the accompanying consolidated balance sheets.
Prepaids
Prepaid expenses are primarily comprised of Argentinian value added tax and prepaid insurance. The prepaid value added tax will be reduced as the Company continues to invoice customers in Argentina.
Inventory
Inventories are stated at the lower of cost or market (net realizable value) using the average method and appropriate consideration is given to deterioration, obsolescence and other factors in evaluating net realizable value.
Property, Plant and Equipment
Property, Plant and Equipment (“PPE”) is stated at historical cost less depreciation. Historical cost includes expenditures that are directly attributable to the acquisition of the items.
Depreciation is computed using the straight-line method over the estimated useful lives of the assets for financial reporting purposes. Expenditures for major renewals and betterments that extend the useful lives are capitalized. Expenditures for normal maintenance and repairs are expensed as incurred. The cost of assets sold or abandoned and the related accumulated depreciation are eliminated from the accounts and any gains or losses are reflected in the accompanying consolidated statements of operations for the respective period.
| F-9 |
The estimated useful lives of our major classes of PPE are as follows:
| Major Classes of PPE | Estimated Useful Lives | |
| Machinery and equipment | 2-7 years | |
| Vehicles | 5 years | |
| Leasehold improvements | 5 years (or the life of the lease) | |
| Furniture and office equipment | 3-5 years |
Leases
The Company leases certain equipment under lease agreements. The Company evaluates each lease to determine its appropriate classification as an operating or capital lease for financial reporting purposes. Any lease that does not meet the criteria for a capital lease is accounted for as an operating lease. The assets and liabilities under capital leases are recorded at the lower of the present value of the minimum lease payments or the fair market value of the related assets. Assets under capital leases are amortized using the straight-line method over the lease term. Amortization of assets under capital leases is included in depreciation expense.
Stock-Based Compensation
The Company accounts for its stock options, warrants, and restricted stock grants under the fair value recognition provisions of the Financial Accounting Standards Board (“FASB”) Accounting Standards Codification (“ASC”) Topic 718. The Company currently uses the straight-line amortization method for recognizing stock option and restricted stock compensation costs. The measurement and recognition of compensation expense for all share-based payment awards made to our employees, directors or outside service providers are based on the estimated fair value of the awards on the grant dates. The grant date fair value is estimated using either an option-pricing model which is consistent with the terms of the award or a market observed price, if such a price exists. Such cost is recognized over the period during which an employee, director or outside service provider is required to provide service in exchange for the award, i.e., “the requisite service period” (which is usually the vesting period). The Company also estimates the number of instruments that will ultimately be earned, rather than accounting for forfeitures as they occur.
Impairment of Long-Lived Assets
The Company reviews its long-lived assets for impairment when changes in circumstances indicate that the carrying amount of an asset may not be recoverable. ASC Topic 360 requires the Company to review long-lived assets for impairment whenever events or changes in circumstances indicate the carrying amount of an asset or group of assets may not be recoverable. The impairment review includes a comparison of future cash flows expected to be generated by the asset or group of assets with their associated carrying value. If the carrying value of the asset or group of assets exceeds expected cash flows (undiscounted and without interest charges), an impairment loss is recognized to the extent that the carrying value exceeds the fair value. If estimated future cash flows are not achieved with respect to long-lived assets, additional write-downs may be required.
Major Customers and Concentration of Credit Risk.
The majority of the Company’s business is conducted with major and independent oil and gas companies in Argentina. The Company evaluates the financial strength of its customers and provides allowances for probable credit losses when deemed necessary. The Company derives a large amount of revenue from a small number of major and independent oil and gas companies. At December 31, 2015 the company had a concentration of receivables with one customer.
We derive a significant portion of our revenue from a limited number of major clients. For the year ended December 31, 2015, two major customers accounted for approximately 96.2% of our services revenue, and we derived 86.5% of our services revenue from three major customers for the year ended December 31, 2014. Our accounts receivable, at December 31, 2015 and 2014 were concentrated, with one major customer representing 87.3% and 100% respectively. YPF represents our largest customer.
The Company places its cash and cash equivalents with high credit quality financial institutions.
| F-10 |
Income Taxes
Deferred income taxes are determined using the asset and liability method in accordance with ASC Topic 740. Deferred tax assets and liabilities are recognized for the future tax consequences attributable to differences between the financial statement carrying amounts of existing assets and liabilities and their respective tax bases. Deferred income taxes are measured using enacted tax rates expected to apply to taxable income in years in which such temporary differences are expected to be recovered or settled. The effect of a change in tax rates on deferred income taxes is recognized in the consolidated statement of operations of the period that includes the enactment date. In addition, a valuation allowance is established to reduce any deferred tax asset for which it is determined that it is more likely than not that some portion of the deferred tax asset will not be realized.
The Company is subject to U.S. federal and foreign income taxes along with state income taxes in Texas. When tax returns are filed, it is highly certain that some positions taken would be sustained upon examination by the taxing authorities, while others are subject to uncertainty about the merits of the position taken or the amount of the position that would be ultimately sustained. The benefit of a tax position is recognized in the financial statements in the period during which, based on all available evidence, management believes it is more likely than not that the position will be sustained upon examination, including the resolution of appeals or litigation processes, if any. Tax positions taken are not offset or aggregated with other positions. Tax positions that meet the more-likely-than-not recognition threshold are measured as the largest amount of tax benefit that is more than 50% likely of being realized upon settlement with the applicable taxing authority. The portion of the benefits associated with tax positions taken that exceeds the amount measured as described above is reflected as a liability for unrecognized tax benefits in the accompanying consolidated balance sheets along with any associated interest and penalties that would be payable to the taxing authorities upon examination.
Recent Accounting Pronouncements
The recent accounting standards that have been issued or proposed by the Financial Accounting Standards Board (“FASB”) or other standards-setting bodies that do not require adoption until a future date are not expected to have a material impact on the consolidated financial statements upon adoption.
In May 2014, the FASB issued ASU No. 2014-09, Revenue from Contracts with Customers, which requires us to recognize the amount of revenue to which we expect to be entitled for the transfer of promised goods or services to customers. The ASU will replace most existing revenue recognition guidance in U.S. GAAP when it becomes effective. The new standard is effective on January 1, 2018. Early application is not permitted. The standard permits the use of either the retrospective or cumulative effect transition method. We are evaluating the effect ASU 2014-09 will have on our consolidated financial statements and related disclosures. We have not yet selected a transition method nor has the effect of the standard on our ongoing financial reporting been determined.
In February 2015, the FASB issued ASU 2015-02, Consolidation (Topic 810): Amendments to the Consolidation Analysis, which amends the guidelines for determining whether certain legal entities should be consolidated and reduces the number of consolidation models. The new standard is effective for annual and interim periods in fiscal years beginning after December 15, 2015. Early adoption is permitted. We do not expect the impact of our pending adoption to have a material effect on our Consolidated Financial Statements.
In April 2015, the FASB issued ASU 2015-03, “Simplifying the Presentation of Debt Issuance Costs,” which amends the current presentation of debt issuance costs in the financial statements. ASU 2015-03 requires that debt issuance costs related to a recognized debt liability be presented in the balance sheet as a direct deduction from the carrying amount of that debt liability, consistent with debt discounts, instead of as an asset. The amendments are to be applied retrospectively and are effective for public business entities for fiscal years, and for interim periods within those fiscal years, beginning after December 15, 2015, but early adoption is permitted. The adoption of the new guidance will impact the Company’s consolidated balance sheet presentation accordingly.
| F-11 |
In July 2015, the FASB issued ASU 2015-11, Inventory (Topic 330): Simplifying the Measurement of Inventory, which requires inventory not measured using either the last in, first out (LIFO) or the retail inventory method to be measured at the lower of cost and net realizable value. Net realizable value is the estimated selling price in the ordinary course of business, less reasonably predictable cost of completion, disposal, and transportation. The new standard will be effective for us beginning with the first quarter of 2017, and will be applied prospectively. Early adoption is permitted. We do not expect the impact of our pending adoption to have a material effect on our Consolidated Financial Statements.
In November 2015, the Financial Accounting Standards Board (“FASB”) issued ASU 2015-17, Income Taxes (Topic 740): Balance Sheet Classification of Deferred Taxes, which eliminates the current requirement to present deferred tax liabilities and assets as current and noncurrent in a classified balance sheet. Instead, all deferred tax assets and liabilities will be required to be classified as noncurrent. The new standard will be effective for us beginning with the first quarter of 2017. Early adoption is permitted. We are evaluating the impact that this new standard will have on our Consolidated Financial Statements.
On February 25, 2016, the FASB issued Accounting Standards Update (ASU) 2016-02 Leases (Topic 842), which requires an entity to recognize assets and liabilities arising from a lease for both financing and operating leases. The ASU will also require new qualitative and quantitative disclosures to help investors and other financial statement users better understand the amount, timing, and uncertainty of cash flows arising from leases. ASU 2016-02 is effective for fiscal years beginning after December 15, 2018, with early adoption permitted. The Company is currently evaluating the effect this standard will have on its Consolidated Financial Statements.
| 3. | Accounts Receivable |
Accounts receivable by category were as follows:
| December 31, 2015 | December 31, 2014 | |||||||
| Billed | $ | 2,386,863 | $ | 264,192 | ||||
| Unbilled | 5,768,401 | — | ||||||
| Total accounts receivable | $ | 8,155,264 | $ | 264,192 | ||||
| 4. | Inventory |
Inventories by category were as follows:
| December 31, 2015 | December 31, 2014 | |||||||
| Raw materials | $ | 739,107 | $ | 697,439 | ||||
| Spare parts | 807,356 | 922,339 | ||||||
| Total inventories | $ | 1,546,463 | $ | 1,619,778 | ||||
| 5. | Prepaid |
Prepaid by category were as follows:
| December 31, 2015 | December 31, 2014 | |||||||
| Prepaid insurance | $ | 209,331 | $ | 206,623 | ||||
| Prepaid value added tax | 2,519,496 | 1,798,213 | ||||||
| Prepaid other taxes | 510,002 | 380,047 | ||||||
| Prepaid other vendors | 89,436 | 111,922 | ||||||
| Total prepaid | $ | 3,328,265 | $ | 2,496,805 | ||||
The Company will use the prepaid value added tax as it continues to invoice customers in Argentina.
| F-12 |
| 6. | Other Assets |
| December 31, 2015 | December 31, 2014 | |||||||
| Other current assets: | ||||||||
| Deferred charges – debt insurance cost | $ | 185,362 | $ | 185,362 | ||||
| Exclusivity rights | — | 208,333 | ||||||
| Other current assets | 48,648 | 15,693 | ||||||
| Total other current assets | $ | 234,010 | $ | 409,388 | ||||
| December 31, 2015 | December 31, 2014 | |||||||
| Other non-current assets: | ||||||||
| Long term deposits | $ | 488,633 | $ | 488,633 | ||||
| Deferred charges – debt issuance costs | 262,597 | 447,959 | ||||||
| Total other non-current assets | $ | 751,230 | $ | 936,592 | ||||
| 7. | Property, Plant and Equipment |
Property, plant and equipment consists of the following:
| December 31, 2015 | December 31, 2014 | |||||||
| Land | $ | 600,000 | $ | 600,000 | ||||
| Leasehold improvement | 616,259 | 12,811 | ||||||
| Computer hardware & software | 478,655 | 127,312 | ||||||
| Furniture & fixtures | 129,995 | 97,424 | ||||||
| Machinery & equipment | 15,667,894 | 12,386,109 | ||||||
| Machinery & equipment under construction | 22,944,025 | 14,655,857 | ||||||
| Work in progress | 100,151 | 259,744 | ||||||
| Property and equipment | 40,536,979 | 28,139,257 | ||||||
| Less accumulated depreciation | (3,394,401 | ) | (189,910 | ) | ||||
| Property and equipment, net | $ | 37,142,578 | $ | 27,949,347 | ||||
| 8. | Accrued Expenses |
Accrued expenses consists of the following:
| December 31, 2015 | December 31, 2014 | |||||||
| Accrued salaries | $ | 140,288 | $ | 269,220 | ||||
| Accrued accounts payable trade expenses | 976,155 | 870,544 | ||||||
| Accrued bonuses | 426,994 | 525,000 | ||||||
| Accrued vacation | 346,374 | 184,061 | ||||||
| Accrued interest | 1,953,686 | 1,315,425 | ||||||
| Total accrued expenses | $ | 3,843,497 | $ | 3,164,250 | ||||
| 9. | Debt |
Short-Term Note
The Company finances certain insurance premiums with a short term note that had a balance at December 31, 2015 and 2014, of $0 and $158,036, respectively. At December 31, 2015 there were no insurance premium financing outstanding. The note accrued interest at a rate of 5.87% per annum with monthly payments of approximately $20,000 through September 2015.
| F-13 |
Long-Term Convertible Notes Payable
On May 28, 2014 (the “Closing Date”), the Company entered into a Convertible Note Facility Agreement (the “Note Agreement”) with ACM Emerging Markets Master Fund I, L.P. (“ACM”). The proceeds from the Note Agreement have been used primarily for capital expenditures, certain working capital needs and approved operating budget expenses.
The Note Agreement allowed the Company to issue ACM a multiple draw secured promissory note with a maximum aggregate principal amount of $22 million, convertible into the common stock of the Company (the “Common Stock”) at a price of $6.00 per share at the option of ACM. The outstanding debt under the facility is convertible immediately and accrues interest at 14% per annum with interest payments due annually in arrears. The debt can be prepaid in full under certain conditions after the first anniversary of the Closing Date and matures on the date that is four years following the Closing Date.
As of December 31, 2015, the Company has drawn down the full $22 million available under the Note Agreement, which was primarily used for capital expenditures, certain working capital needs and approved operating budget expenses. The balance for accrued interest at December 31, 2015 was $1,831,123.
On May 28, 2015, the Company entered into an amendment with ACM. ACM and the Company agreed to give ACM the ability to have the $2,485,162 interest payment, which was due on May 28, 2015 (the “Deferred Interest”), paid in the form of shares of the Company’s common stock upon the consummation of a future equity offering, should one occur. On July 15, 2015, the Company issued 523,192 shares of unregistered common stock at a price of $4.75 per share to ACM as payment for the deferred interest.
All obligations under the Note Agreement are secured by liens on substantially all of the assets of the Company and have subsidiary guarantees and pledges of the capital stock of the subsidiary guarantors subject to certain terms and exceptions. From time to time, management has obtained amendments and waivers to the agreement to accommodate and adapt to the changing business environment. Management believes that the Company will be in compliance with the amended covenants, but there can be no assurance that the Company will achieve such compliance. Failure to comply with these covenants could result in an event of default which, if not cured or waived, would have a material adverse effect on us. The Company was in compliance with all covenants after considering waivers and amendments under its debt instruments as of December 31, 2015. During the past year, the Company has paid fees of $220,000 related to obtaining such amendments and waivers, which amount was recorded as additional financial charges.
On October 10, 2014, the Company entered into an equipment purchase agreement for the TPUs equipment and related spare parts for a total purchase price of approximately $6,500,000, of which $4,100,000 has been financed. The total amount financed, including any accrued interest, was to become due and payable on April 1, 2015. On March 12, 2015, the Company amended the agreement to add a blender, two data vans and a manifold at an increased cost of $400,000, and amended the due date of the final payment to March 31, 2016. The amended agreement provides for monthly installment payments of $50,000 beginning in May 2015. On February 11, 2016, the agreement was further amended to reduce the monthly installments to $25,000 and to defer the payment of the final $1 million of the purchase price until December 15, 2016. The note accrues interest at a rate of 9% per annum from April 1, 2015 until maturity on December 15, 2016. As of December 31, 2015, the Company had a balance of $3,010,790 and accrued interest of $94,764.
The following is a summary of approximate scheduled long-term notes payable maturities by year:
| 2016 | $ | 3,010,790 | |||
| 2017 | — | ||||
| 2018 | 22,000,000 | ||||
| Total notes payable | $ | 25,010,790 |
| F-14 |
| 10. | Deferred Debt Costs |
The Company capitalizes certain costs in connection with obtaining its financings, such as lender’s fees and related attorney fees. These costs are amortized to interest expense using the straight-line method.
Deferred debt costs were approximately $447,959 and $633,321 net of accumulated amortization of $293,490 and $108,128 for the years ended December 31, 2015 and 2014, respectively. Presented as other assets of $185,362 and other non-current assets of $262,597.
| 11. | Equity Offerings |
On July 14, 2014 ACM exercised the Option (as referenced in “Note 9 – Debt”), resulting in net proceeds of $7,708,874 after deducting $291,126 in transaction related expenses.
On July 24, 2014, the Company sold 383,733 shares of its Common Stock in a private placement to 17 accredited investors resulting in net proceeds of $2,116,473.
On February 19, 2015, the Company sold 1,051,376 registered securities of common stock at a price of $5.75 per share for gross proceeds to the Company of $6,045,412. The Company used a portion of the net proceeds from the offering to finance capital expenditures, for working capital and for general corporate purposes and expects to use the remainder of the proceeds for additional capital expenditures and working capital.
On July 15, 2015, the Company sold 6,164,690 registered securities of common stock at a price of $4.75 per share for gross proceeds to the Company of $29,282,278. The Company will use the net proceeds from the offering to finance capital expenditures, fund working capital and for general corporate purposes.
| 12. | Stockholders’ Equity |
Common Stock
At December 31, 2015 and 2014 the Company had authorized 200,000,000 shares of common stock, of which 13,566,050 and 5,709,523 were outstanding with a par value of $13,566 and $5,709, respectively.
Preferred Stock
At December 31, 2015 and 2014, the Company had authorized 50,000,000 shares of preferred stock, of which there were 0 shares of preferred stock outstanding.
Treasury Stock
On December 15, 2015, the board of directors authorized the Company to repurchase, from time to time during the period from December 16, 2015 through December 16, 2017, up to $5 million in shares of its outstanding common stock. As of December 31, 2015 the Company had purchased 6,939 shares at a cost of $20,294 under the buy-back program.
Warrants
In the fourth quarter of 2013, the Company executed a sale-leaseback transaction with a related party that included an inducement payment of 100,000 common stock warrants. The exercise price per share of the common stock under the agreement is $7. The agreement expires five years after the date of issuance. The warrants can be exercised on a one for one basis starting July 1, 2014. See Note 16-Related Parties for additional information.
| F-15 |
| 13. | Employee Benefit Plan |
The Company adopted a safe harbor defined contribution 401(k) plan effective January 1, 2012, covering all Company employees of the US headquarters. Under the plan the company contributes 5% towards the employee 401k. The contribution is fully vested at the time of contribution. The Company’s contributions for the years ended December 31, 2015 and 2014, were $100,518 and $71,561 respectively.
| 14. | Stock-Based Compensation |
The Company has two stock incentive plans, the 2013 Stock Incentive Plan (the “2013 Plan”) and the 2015 Stock Incentive Plan (the “2015 Plan”), for the granting of stock-based incentive awards, including incentive stock options, non-qualified stock options and restricted stock, to employees, consultants and members of the Company’s board of directors (the “Board”). The 2013 Plan was adopted in 2012 and amended in 2013 and authorizes 1,000,000 shares to be issued under the 2013 Plan. The 2015 Plan, f/k/a “the 2014 Stock Incentive Plan,” was adopted in 2014; in 2015 it was amended and 500,000 additional shares were authorized, resulting in a maximum of 1,000,000 shares being authorized for issue under the modified 2015 Plan. Both the 2013 Plan and the 2015 Plan have been approved by the shareholders of the Company. As of December 31, 2015, 48,328 shares were available for grant under the 2013 Plan and 665,000 shares were available for grant under the 2015 Plan.
The Black-Scholes option valuation model was developed for use in estimating the fair value of traded options, which have no vesting restrictions and are fully transferable. In addition, option valuation models require the input of highly subjective assumptions including the expected stock price volatility. Because changes in the subjective input assumptions can materially affect the fair value estimate, in management’s opinion, the existing models do not necessarily provide a reliable single measure of the fair value of its employee stock options and restricted stock. The expected life of awards granted represents the period of time that they are expected to be outstanding. The Company determined the initial expected life based on a simplified method in accordance with the FASB Accounting Standards Codification Topic 718, giving consideration to the contractual terms, vesting schedules, and pre-vesting and post-vesting forfeitures.
The Company recorded $1,480,435 and $1,252,061 for 2015 and 2014, respectively, of stock-based compensation, which is included in selling, general, and administrative expense and cost of sales in the accompanying consolidated statement of operations. Total unamortized stock-based compensation expense at December 31, 2015 was $1,382,711 compared to $2,597,029 at December 31, 2014, and will be fully expensed through 2019.
Stock Options
Options granted vest over a period of two to four years, subject to the optionee’s continued employment or service, and an option granted under the Plans may have an expiration date not longer than ten years following the date of grant. The Plans specify that the per share exercise price of an incentive stock option may not be less than 110% of the fair market value of the Company’s common stock on the date of grant, and the per share exercise price of a non-qualified stock option may not be less than the fair market value of the Company’s common stock on the date of grant. The Company’s general practice has been to grant options with a per share exercise price equal to the fair market value of the Company’s common stock on the date of grant.
A summary of the Company’s stock option activity for the years ended December 31, 2015 and 2014, is presented below:
| Awards | Shares | Weighted Average Exercise Price | Weighted Average Remaining Contractual Term | ||||||||||
| Options outstanding at December 31, 2013 | 557,301 | $ | 5.32 | 9.56 | |||||||||
| Granted | 138,000 | 6.07 | |||||||||||
| Exercised | (3,500 | ) | 0.09 | ||||||||||
| Forfeited | (22,504 | ) | 3.33 | ||||||||||
| Options outstanding at December 31, 2014 | 669,297 | $ | 5.55 | 8.79 | |||||||||
| Granted | 230,000 | 4.89 | |||||||||||
| Exercised | (4,083 | ) | 0.33 | ||||||||||
| Forfeited | — | 0.00 | |||||||||||
| Options outstanding at December 31, 2015 | 895,214 | $ | 5.40 | 8.28 | |||||||||
| Options exercisable at December 31, 2015 | 586,714 | $ | 5.52 | 7.69 | |||||||||
| F-16 |
As of December 31, 2015, the range of exercise prices for outstanding options was $0.33 – $7.00.
The following table presents the assumptions used in determining the fair value of option awards for the year ended December 31, 2015 and 2014:
| 2015 | 2014 | |||||||
| Weighted average grant date fair value per share of awards granted | 1.13 | 2.40 | ||||||
| Significant fair value assumptions: | ||||||||
| Expected term (in years) | 5.75 | 5.75 | ||||||
| Volatility | 41.32 | % | 45.79 | % | ||||
| Risk-free interest rate | 1.53 | % | 1.62 | % | ||||
| Expected dividends | — | — | ||||||
Restricted Stock
A summary of award activity under the Plan for the years ended December 31, 2015 and 2014 is presented below:
| Shares | Weighted Average Grant Date Fair Value | ||||||||
| Non-vested at December 31, 2013 | |||||||||
| Granted | 365,500 | 5.52 | |||||||
| Vested | (3,750 | ) | |||||||
| Non-vested at December 31, 2014 | 361,750 | ||||||||
| Granted | — | ||||||||
| Vested | (120,125 | ) | |||||||
| Non-vested at December 31, 2015 | 241,625 | ||||||||
The weighted average grant date fair value of awards of restricted stock is based on the market price of the Company’s common stock on the date of the grant.
| 15. | Commitments and Contingencies |
Capital Lease Obligations
In the fourth quarter of 2013, the Company purchased and upgraded equipment from non-related third parties, investing approximately $3.5 million. In December 2013, the Company sold the equipment to a related party leasing company, Impact Engineering, AS. Simultaneously, the equipment package was leased back to the Company as a capital lease for a 60-month period with payments beginning in February of 2014. The Company agreed to prepay one year of payments in the amount of approximately $1.0 million and maintain a balance of no less than six months of prepayments until the final six months of the lease.
These prepayments were made prior to December 31, 2013. Further lease payments are $81,439 per month and commenced on July 1, 2014. The final six months of prepaid is shown as other non-current assets in the consolidated balance sheets with a balance of $488,633.
| F-17 |
The minimum present value of the lease payments is $2.9 million with terms of sixty months and implied interest of 14%. The next five years of lease payments are:
| Capital Lease Payments | ||||
| 2016 | $ | 977,267 | ||
| 2017 | 977,267 | |||
| 2018 | 977,267 | |||
| Total future payments | 2,931,801 | |||
| Less debt discount due to warrants | (210,502 | ) | ||
| Less amount representing interest | (548,989 | ) | ||
| 2,172,310 | ||||
| Less current portion of capital lease obligations | (686,624 | ) | ||
| Capital lease obligations, excluding current installments | $ | 1,485,686 | ||
Operating Leases
During the third quarter of 2014, the Company and EcoStim Argentina each entered into separate three-year office space leases. The leases each have a term of three years. The company also has leased a warehouse facility in Neuquén for our Argentina operations and a warehouse in Houston for maintenance and security of our TPU equipment. The combined future minimum lease payments as of December 31, 2015 are as follows:
| Operating Leases | |||||
| 2016 | 474,879 | ||||
| 2017 | 280,548 | ||||
| Thereafter | — | ||||
| Total | 755,427 | ||||
| 16. | Related Party Transactions |
In the fourth quarter of 2013, the Company purchased and upgraded equipment, from non-related third parties, for approximately $3.5 million. In December 2013, the Company sold the equipment to a third party leasing company controlled by two of its directors. Simultaneously, the equipment package was leased back to the Company, as a capital lease for a 60-month period with payments beginning in February 2014. The Company agreed to prepay one year of payments in the amount of approximately $1.0 million and maintain a balance of no less than six months of prepayments until the final six months of the lease. These prepayments were made prior to December 31, 2013. Further lease payments are approximately $81,000 per month and commenced on February 1, 2014
In connection with the sale lease back transaction, the Company issued 100,000 common stock warrants to the related party leasing company. The warrants were issued as an inducement payment and can be exercised on a one for one basis for common stock starting July 1, 2014. The exercise price is $7.00 with an expiration date of five years after the initial exercise date of July 1, 2014.
The estimated fair value of the warrants at issuance was approximately $0.4 million and was calculated using the Black Scholes method with the following weighted average assumptions being used:
| Volatility | 75 | % | ||
| Expected lives years | 5.75 | |||
| Expected dividend yield | — | |||
| Risk free rates | 1.75 | % |
| F-18 |
| 17. | Income Taxes |
The components of the expense for income taxes are as follows for the years ended December 31, 2015 and 2014:
| For the year ended December 31, | ||||||||
| 2015 | 2014 | |||||||
| Current: | $ | — | $ | — | ||||
| Federal | — | — | ||||||
| State | — | — | ||||||
| Foreign | 344,314 | — | ||||||
| Total | $ | 344,314 | $ | — | ||||
| Deferred: | $ | — | $ | — | ||||
| Federal | — | — | ||||||
| State | — | — | ||||||
| Foreign | — | — | ||||||
| Total | $ | — | $ | — | ||||
| Total income tax provision | $ | 344,314 | $ | — | ||||
The effective tax rate (as a percentage of income before taxes) is reconciled to the U.S. federal statutory rate as follows as of December 31, 2015 and 2014, respectively:
| For the year ended December 31, | ||||||||
| 2015 | 2014 | |||||||
| Income tax benefit at the applicable federal rate (34%) | $ | (4,437,149 | ) | $ | (2,428,410 | ) | ||
| Permanent difference | (1,451,681 | ) | (1,348,502 | ) | ||||
| Change in valuation allowance | 6,316,695 | 3,814,700 | ||||||
| Deferred true-up | (397,232 | ) | (7,396 | ) | ||||
| Effect of rate change | 21,596 | — | ||||||
| Foreign rate differential | (52,229 | ) | (30,392 | ) | ||||
| Withholding tax | 344,314 | — | ||||||
| Income tax expense (benefit) | $ | 344,314 | $ | — | ||||
The tax effects of the temporary differences between financial statement income and taxable income are recognized as a deferred tax asset and liabilities. Significant components of the deferred tax asset and liability as of December 31, 2015 and 2014 respectively are:
| As of December 31, | ||||||||
| 2015 | 2014 | |||||||
| Deferred assets | ||||||||
| Stock-based compensation | $ | 422,766 | $ | 203,736 | ||||
| Accrued vacation | 46,605 | 85,719 | ||||||
| Accrued bonus | 145,178 | 178,500 | ||||||
| Withholding tax | 86,079 | — | ||||||
| Other accruals | 1,205,098 | 196,984 | ||||||
| Intangible assets | 77,454 | 19,573 | ||||||
| Net operating loss carryforwards | 9,911,122 | 4,372,659 | ||||||
| Total deferred tax assets | $ | 11,894,302 | $ | 5,057,171 | ||||
| Deferred liability | ||||||||
| Prepaids | (1,641 | ) | (69,232 | ) | ||||
| Property, plant and equipment | (606,220 | ) | (18,191 | ) | ||||
| Total deferred tax liabilities | $ | (607,861 | ) | $ | (87,423 | ) | ||
| Net deferred tax asset | 11,286,441 | 4,969,748 | ||||||
| Valuation allowance | (11,286,441 | ) | (4,969,748 | ) | ||||
| Total net deferred tax assets | $ | — | $ | — | ||||
The Company has established a valuation allowance to fully reserve the net deferred tax asset due to the uncertainty of the timing and amounts of future taxable income. At December 31, 2015 the Company has a federal net operating loss carry forward of $16,886,789 and a foreign tax loss carry forward of $12,669,851, both of which have been fully reserved.
| F-19 |
The loss carryforwards expire as follows:
| Expiration year | Amount | ||||
| 2016 | $ | — | |||
| 2017 | — | ||||
| 2018 | 179,117 | ||||
| 2019 | 3,774,222 | ||||
| 2020 and forward | 25,603,301 | ||||
| Total | $ | 29,556,640 | |||
The Company records accrued interest and penalties related to unrecognized tax benefits in general and administrative expense. No amounts of interest expense and penalties have been accrued or recognized related to unrecognized tax benefits since inception. We are currently subject to a three-year statute of limitations by major tax jurisdictions.
| 18. | Fair Value Measurement |
GAAP defines fair value as the price that would be received to sell an asset or paid to transfer a liability in an orderly transaction between market participants at the measurement date and establishes a three-tier hierarchy that is used to identify assets and liabilities measured at fair value. The hierarchy focuses on the inputs used to measure fair value and requires that the lowest level input be used. The three levels defined are as follows:
| ● | Level 1 — observable inputs that are based upon quoted market prices for identical assets or liabilities within active markets. | |
| ● | Level 2 — observable inputs other than Level 1 that are based upon quoted market prices for similar assets or liabilities, based upon quoted prices within inactive markets, or inputs other than quoted market prices that are observable through market data for substantially the full term of the asset or liability. | |
| ● | Level 3 — inputs that are unobservable for the particular asset or liability due to little or no market activity and are significant to the fair value of the asset or liability. These inputs reflect assumptions that market participants would use when valuing the particular asset or liability. |
The following table summarizes the Company’s financial assets and financial liabilities measured at fair value at December 31, 2014:
| Fair Value Measurements | Level 1 | Level 2 | Level 3 | Total | ||||||||||||
| Argentina Bonds | $ | 1,360,767 | $ | — | $ | — | $ | 1,360,767 | ||||||||
| $ | 1,360,767 | $ | — | $ | — | $ | 1,360,767 | |||||||||
At December 31, 2015 there were no financial assets and financial liabilities measured at fair value.
| 19. | Quarterly Financial Data (unaudited) |
Summarized quarterly financial data for the years ended December 31, 2015 and 2014 are presented below.
| Quarter Ended | ||||||||||||||||
| March 2015 | June 2015 | September 2015 | December 2015 | |||||||||||||
| Revenue | $ | 2,891,693 | $ | 3,985,419 | $ | 4,381,371 | $ | 2,496,657 | ||||||||
| Operating loss | 2,832,529 | 2,939,679 | 3,041,908 | 3,364,055 | ||||||||||||
| Loss before income taxes | 3,662,944 | 3,539,947 | 2,681,784 | 3,165,762 | ||||||||||||
| Net loss | 3,662,944 | 3,539,947 | 2,681,784 | 3,510,076 | ||||||||||||
| Basic and diluted loss per share | $ | 0.59 | $ | 0.52 | $ | 0.21 | $ | 0.26 | ||||||||
| Quarter Ended | ||||||||||||||||
| March 2014 | June 2014 | September 2014 | December 2014 | |||||||||||||
| Revenue | $ | 483,345 | $ | 73,951 | $ | 88,106 | $ | 189,080 | ||||||||
| Operating loss | 1,687,730 | 1,682,333 | 2,662,400 | 3,637,344 | ||||||||||||
| Loss before income taxes | 1,823,431 | 2,010,949 | 258,907 | 3,049,095 | ||||||||||||
| Net loss | 1,823,431 | 2,010,949 | 258,907 | 3,049,095 | ||||||||||||
| Basic and diluted Loss per share | $ | 0.46 | $ | 0.50 | $ | 0.05 | $ | 0.53 | ||||||||
| 20. | Subsequent Events |
On February 12, 2016, the Company amended its TPU agreement as referenced in “Note 9 – Debt.” to obtain release to export six (6) of the well stimulation pump trailers, the blender, data vans, manifold and sufficient inventory spare parts in exchange for a payment of $1,500,000 at execution, $500,000 on April 1, 2016 and the remaining balance of approximately $1 million due in payments of $25,000 beginning May 1, 2016, and one final payment of the unpaid balance due on December 15, 2016.
| F-20 |
Item 9. Changes In and Disagreements With Accountants on Accounting and Financial Disclosure
None.
Item 9A. Controls and Procedures
Evaluation of disclosure controls and procedures
We maintain disclosure controls and procedures, as defined in Rules 13a-15(e) and 15d-15(e) of the Exchange Act consisting of controls and other procedures designed to give reasonable assurance that information we are required to disclose in the reports we file or submit under the Exchange Act is recorded, processed, summarized and reported within the time periods specified in the SEC’s rules and forms and that such information is accumulated and communicated to management, including our chief executive officer and our chief financial officer, to allow timely decisions regarding such required disclosure. Based on their evaluation as of the end of the period covered by this Form 10-K, our Chief Executive Officer and Chief Financial Officer have concluded that our disclosure controls and procedures, as defined in Rules 13a-15 and 15d-15 under the Exchange Act, were effective as of December 31, 2015.
Management’s Annual Report on Internal Control over Financial Reporting
Management is responsible for establishing and maintaining adequate internal control over financial reporting. The Company’s internal control over financial reporting is a process designed under the supervision of its Chief Executive Officer and Chief Financial Officer to provide reasonable assurance regarding the reliability of financial reporting and the preparation of the Company’s financial statements for external purposes in accordance with generally accepted accounting principles. As of December 31, 2015, management, including the Company’s Chief Executive Officer and Chief Financial Officer, assessed the effectiveness of its internal control over financial reporting, based on criteria established in the updated 2013 Internal Control — Integrated Framework created by the Committee of Sponsoring Organizations of the Treadway Commission (COSO). Based on their assessment, management determined that the Company maintained effective internal control over financial reporting as of December 31, 2015. Because of its inherent limitations, internal control over financial reporting may not prevent or detect misstatements. Also, projections of any evaluation of effectiveness to future periods are subject to the risk that controls may become inadequate because of changes in conditions, or that the degree of compliance with the policies or procedures may deteriorate.
Changes in Internal Control over Financial Reporting
There have been no changes in our system of internal control over financial reporting (as such term is defined in Rules 13a-15(f) and 15d-15(f) under the Exchange Act) during the quarter ended December 31, 2015 that have materially affected, or are reasonably likely to materially affect, the Company’s internal control over financial reporting.
None.
| 45 |
Item 10. Directors, Executive Officers and Corporate Governance Directors and Executive Officers
All of our directors have been elected to serve until our next annual meeting of shareholders or until their earlier resignation, removal or death. Biographical information regarding our executive officers and directors is as follows:
| Name | Age | Position | ||
| Bjarte Bruheim | 60 | Executive Chairman | ||
| Jon Christopher Boswell | 54 | Director, President and Chief Executive Officer | ||
| Donald Stoltz | 38 | Director | ||
| Carlos A. Fernandez | 58 | Director, Executive Vice President-Global Business Development and General Manager-Latin America | ||
| Leonel Narea | 53 | Director | ||
| Christopher Krummel | 47 | Director | ||
| Ahmad Al-Sati | 42 | Director | ||
| Lap Wai Chan | 49 | Director | ||
| Bobby Chapman | 59 | Chief Operating Officer | ||
| Alexander Nickolatos | 38 | Chief Financial Officer and Assistant Secretary | ||
| Craig Murrin | 62 | Secretary and General Counsel |
Bjarte Bruheim. Mr. Bruheim has served as Director and the Chairman of the Board of Directors of our Company and its predecessors since December 2011. He has over 30 years of international management experience and is also a serial entrepreneur. He has spent the majority of his career introducing technologies that reduce risk and improve efficiencies in the oil and gas business. Such companies include oilfield services companies such as Petroleum Geo-Services ASA (“PGS”) which he co-founded in 1991, Electromagnetic Geoservices ASA (“EMGS”) where he was an early venture investor and Executive Chairman starting in 2004 and became Chief Executive Officer in January 2015 serving until August 2015, Geo-Texture Technologies, Inc. (“Geo-Texture”), which he co-founded in 2005, and ODIM ASA (“ODIM”) which he worked to turn around and later sell. PGS and EMGS remain public companies and are leaders in their industry while ODIM was sold to Rolls Royce and the intellectual property of Geo-Texture was sold to Eco-Stim. In addition to the oilfield service companies, Mr. Bruheim was a co-founder in Spinnaker Exploration Company using PGS technology, an early venture investor in Spring Energy using EMGS technology and co-founder of a small exploration and production company operating in the Eagle Ford field in Texas using Geo-Texture technology. Spinnaker was later sold to Statoil for approximately $2.5 billion, Spring Energy was sold to Tullow Oil and the small exploration and production company in the Eagle Ford play was sold to Chesapeake. Mr. Bruheim has been involved at the board level in value creation for many energy and energy service related companies. He started his career as an executive with WesternGeco, now Schlumberger, after graduating with a master’s degree in Physics and Electronics from the Norwegian University of Science & Technology in Trondheim, Norway.
Jon Christopher Boswell. Mr. Boswell has served as President and Chief Executive Officer and a Director of our Company and its predecessors, FRI and FRIBVI, since December 2011. Prior to FRI, from 2009 to 2011, Mr. Boswell served as Chief Financial Officer for NEOS GeoSolutions, a Silicon Valley backed oilfield technology company (“NEOS”). Prior to NEOS, from August 2003 to January 2009, he served as Chief Financial Officer for Particle Drilling Technologies, an oilfield services and technology company (“Particle”). Subsequent to Mr. Boswell’s departure from Particle in January 2009 as a result of disagreements with the chief executive officer regarding the strategic direction of the company, the remaining management of the company elected to restructure the company and Particle filed for bankruptcy protection in May 2009. Particle secured financing and emerged successfully from bankruptcy on August 28, 2009. Prior to Particle, he served as Senior Vice President and Chief Financial Officer of PGS from December 1995 until October 2002. PGS grew from a small enterprise in 1994 when Mr. Boswell joined the company to a $1 billion annual revenue enterprise with a peak enterprise value of $6 billion. In all, during his tenure as CFO at PGS, Mr. Boswell directed financings for over $3 billion of capital expenditures to facilitate PGS’ growth. Additionally during 1995, Mr. Boswell and other senior executives at PGS developed the concept to create a unique oil and gas company using a non-exclusive license in PGS’ seismic data library as seed capital. This company became Spinnaker Exploration Company, which was then sold to Statoil for approximately $2.5 billion. Mr. Boswell began his career at Arthur Andersen & Co. and later served in management positions with PriceWaterhouse, LLP in Houston, Texas. Mr. Boswell is a 1985 graduate of the University of Texas at Austin.
| 46 |
Carlos A. Fernandez. Mr. Fernandez has served as a member of the Board of our Company and its predecessors since December 2011. Mr. Fernandez has 35 years of experience in the oil and gas industry and over 30 years of experience in various executive management and sales positions. From January 2010 to present, he has worked as General Manager – Latin America for NEOS. From April 2006 to November 2009, he served as Senior Vice President Business Development for 3D-Geo. While at 3D-Geo, Mr. Fernandez led the formation of the Kaleidoscope seismic imaging project, a partnership among Repsol, 3D-Geo, Stanford University, IBM, and the Barcelona Supercomputing Center. From 1996 to March 2006, he served as General Manager – Latin America for Paradigm Geophysical. From 1990 to 1995, Mr. Fernandez served as President of Petroleum Information Argentina. From 1979 through 1990, he held various leadership positions with seismic technology and computing companies such as Silicon Graphics. Mr. Fernandez received his degree in geophysics with honors from the National University of La Plata in Argentina. Mr. Fernandez has taught at the University for more than 10 years, contributing to the education of a significant number of geophysicists, currently working in the oil and gas industry in Latin America and around the world.
Christopher Krummel. Mr. Krummel joined our Board in January 2014. Mr. Krummel currently provides advisory services to American Industrial Partners LLC (“AIP”), and other companies focused on the global energy industry. He most recently served as the Chief Financial Officer and Vice President for EnTrans International LLC, a portfolio company of AIP. Prior to September of 2014, he served as Vice President, Controller and Chief Accounting Officer for Cameron International Corporation (“Cameron”), where he was responsible for all accounting functions, including consolidated financial reporting and SEC filings. He started at Cameron in October 2007, and previously served as Chief Financial Officer for Enventure Global Technology, a private equity backed startup. Prior to Enventure, he held financial leadership roles with Petroleum Geo-Services ASA and PriceWaterhouse LLP. He holds a BSBA in accounting from Creighton University and an MBA from The Wharton School of the University of Pennsylvania. In addition to our Board, Mr. Krummel is a director of Rebuilding Together Houston.
Ahmad Al-Sati. Mr. Al-Sati is a Managing Director of Albright, and was designated by ACM to serve on our Board in May 2014, pursuant to the Stockholder Rights Agreement. Mr. Al-Sati is an investor and restructuring professional with over 12 years of direct experience in private equity, lending transactions and other special situations in almost 20 different jurisdictions in Africa, Europe, Asia and the Americas. Prior to joining Albright in September 2012, Al-Sati was a Managing Director at Plainfield Asset Management where, most recently, he was responsible for the firm’s energy and international portfolios in industries that included consumer products, specialty finance, building products, steel, E&P cleantech and energy. Mr. Al-Sati was also Chairman of two renewable energy companies in Peru and Greece. Mr. Al-Sati began his career as an attorney with Schulte Roth & Zabel LLP, representing hedge funds and private equity firms in privately negotiated transactions. In 2003, Mr. Al-Sati joined MatlinPatterson Global Advisers LLC (“MatlinPatterson”). At MatlinPatterson, he was initially responsible for the transactional legal work, private debt trading and tax structuring and worked on a variety of private equity transactions during his time there. Mr. Al-Sati received a BA, with honors, double majoring in Economics and History from Wesleyan University in 1995, a J.D. from Columbia Law School in 2000 and an M.B.A. from the Stern School of Business in 2008.
Lap Wai Chan. Mr. Chan was designated by ACM to serve on our Board in July 2014, pursuant to the Stockholder Rights Agreement. Mr. Chan has been actively investing for over 20 years, including investment experience in Asia, Latin America, North America and Oceana. Mr. Chan joined Albright in 2011. Prior to joining Albright in 2011, Mr. Chan was the Managing Partner and international portfolio manager for MatlinPatterson Global Opportunities Funds from inception to September 2009. Prior to July 2002, Mr. Chan was a Managing Director at Credit Suisse’s Distressed Group in Hong Kong, which he established in 1997. Mr. Chan began his career at ING Barings Ltd (“ING”), most recently as Director of Asian Special Investments for ING Barings Securities (HK) Ltd, in Hong Kong from 1995 to 1997. From 1993 to 1995, he focused on South American emerging markets finance as head of EMG sales in the Tokyo office of ING, and from 1987 to 1993 he served as Vice President of EMG corporate finance, sales and trading in ING’s New York office. Mr. Chan obtained a BA with Honors from the University of Chicago in 1987. Until May 2014, Mr. Chan served as an independent board member and Chairman of the special committee of Harbinger Group Inc. He currently works exclusively with Albright on emerging markets transactions.
| 47 |
Donald Stoltz. Mr. Stoltz was elected to our Board on March 7, 2016 to fill the vacancy created by the resignation of Mr. Romestrand. Mr. Stoltz is Partner and head of trading of Bienville Argentina Opportunities Fund LP (“Bienville”), which is currently the holder of over 10% of the Company’s outstanding shares. Mr. Stoltz has over 16 years of experience in trading derivatives, portfolio risk management, operations and investing in public and private companies. Mr. Stoltz began his career at JPMorgan Chase in August 1999, where he worked in diverse roles such as equity derivative trading, institutional sales, interest rate swaps and foreign exchange trading until February 2009. Following JPMorgan, Mr. Stoltz was a proprietary trader at First New York Securities from February until May 2009, when he joined Bienville. Mr. Stoltz’s board experience includes two of Bienville Argentina Opportunity Fund, LP’s portfolio companies, Eco-Stim Energy Solutions and TGLT SA. Mr. Stoltz is chairman of the investment committee at Temple B’nai Jeshurun in Short Hills, NJ. He graduated with a BS in management from Pennsylvania State University in 1999.
Leonel Narea. Mr. Narea was elected to our Board on March 7, 2016 to fill the vacancy created by the resignation of Mr. Yonemoto. Mr. Narea has over 25 years of experience as an emerging markets investment banker and investment management professional. His experience in emerging markets investment banking has focused on Latin America where he has completed transactions and assignments in corporate advisory, capital markets, restructurings, structured finance and private placements for corporations and governments. Mr. Narea served as a Managing Director, Investment Banking with GMP Securities from August 2014 until February 2016. From May 2013 until June 2014, he was an Investment Officer with Wells Fargo and prior to that, he was a Managing Director with Austral Capital Partners, an emerging markets advisory boutique from July 2010 to April 2013. From January 2004 to June 2010 he was a Managing Director with UBS AG and from 2000 to 2003 he was a Director and Investment Committee member for RBS Group and RBS Asset Management focused on emerging markets fixed income and alternative investments. From 1990 until 2000, Mr. Narea was a Managing Director with ING Group – ING Barings, New York in emerging markets investment banking and debt capital markets where he was Head of Debt Capital Markets – Latin America. He earned a B.A. degree in Political Science and Economics from Fordham University in New York.
Bobby Chapman. Mr. Chapman was appointed our Chief Operating Officer in December 2013. Mr. Chapman started his career with Halliburton, where he was involved in drilling and completions operations, sales, engineering, and management in offshore Gulf of Mexico and broad US land operations as well as assignments internationally offshore West Africa. His experience includes high pressure / high temperature well cementing, stimulation engineering (matrix acidizing and well stimulation ) as well as completion design including complex, extended reach, deep water well completion designs. He was author of several SPE technical papers on the use of high perm well stimulation techniques and processes. In 1998, Mr. Chapman joined Weatherford International where he spent seven years working in management positions involving all types of artificial lift and general business planning. He was responsible for the organic startup of Weatherford’s well stimulation business. Later after leaving Weatherford, he started Liberty Pressure Pumping (“Liberty”), a startup business focused on well stimulation of unconventional resources. He was involved in all phases of the business including strategic planning, financial planning, equipment design, sales, engineering and management. Liberty’s niche was supplying well stimulation operations to the Barnett Shale but later expanding to other unconventional basins in the United States. In 2007, Liberty was sold to Trican Well Service (“Trican”) for in excess of $200 million. Mr. Chapman was retained by Trican to serve as President of the United States region. He resigned from Trican in September 2012. During this time Trican grew to add several operating regions and also expanded product line offerings to include cementing services and coil-tubing services. Mr. Chapman is a 1979 graduate of Louisiana State University with a B.S. degree in Petroleum Engineering.
Alexander Nickolatos. Mr. Nickolatos became our Chief Financial Officer in December 2013 and was appointed in July 2014 as our Assistant Secretary. Prior to being appointed our Chief Financial Officer, Mr. Nickolatos has served as Controller of the Company’s predecessors, FRI and FRIBVI, since July 2012. From March, 2006 until June 2012, Mr. Nickolatos served as the Director of Financial Planning and Analysis at NEOS. During his time at NEOS, he also served as Controller and Treasurer, and oversaw oil and gas accounting and finance operations in over seven countries, including Argentina. In conjunction with this role, he helped to raise and manage over $500 million from private investors, including Bill Gates, Kleiner Perkins, and Goldman Sachs. He was instrumental in implementing the company’s subsidiary exploration activities in Argentina, eventually forming an assignment of two concessions to ExxonMobil. Prior to joining NEOS, he worked for Arthur Andersen and PricewaterhouseCoopers. Mr. Nickolatos is a Certified Public Accountant, and holds a BBA degree, summa cum laude, from Walla Walla University.
| 48 |
Craig Murrin. Mr. Murrin joined us in April 2014 and was elected Secretary and General Counsel and designated as our Compliance Officer in May 2014. He served as an attorney for SandRidge Energy Offshore, LLC (formerly “Dynamic Offshore Resources”) from February 2009 until February 2014. He was Vice President, Secretary and General Counsel of Global Geophysical Services, Inc. (“GGS”) from May 2005, when it commenced business, until October 2008. He helped GGS raise over USD 100 million in private equity and USD 180 million of secured debt, establish an international operating company in the Cayman Islands, establish an FCPA compliance program, and enter the geophysical service business in Algeria, Argentina, Georgia, India, Oman and Peru. He was Vice President-Legal of various subsidiaries of PGS from 1997 until 2003 and served as its chief compliance officer from 2000 to 2003, helping it to enter the geophysical service business in Kazakhstan, Mexico and Saudi Arabia. From 1988 to 1995 he served as Senior Counsel and Assistant Secretary of The Western Company of North America, where he helped it enter the pressure-pumping and offshore drilling businesses in Argentina, Brazil, Colombia, China, Hungary, Indonesia, Malaysia, Nigeria and Russia. He obtained his law degree from Stanford University, where he served on the Law Review. He served on the council of the international section of the Houston Bar Association from 2003 through 2009.
There are no family relationships between any of the executive officers and directors.
Section 16(a) Beneficial Ownership Reporting Compliance
Under Section 16(a) of the Exchange Act, directors, officers and beneficial owners of 10 percent or more of our common stock (“Reporting Persons”) are required to report to the SEC on a timely basis the initiation of their status as a Reporting Person and any changes with respect to their beneficial ownership of our common units. Based solely on a review of Forms 3, 4 and 5 (and any amendments thereto) furnished to us, we have concluded that no Reporting Persons were delinquent with respect to their reporting obligations, as set forth in Section 16(a) of the Exchange Act, except one report on Form 4 relating to the vesting of restricted stocks on January 11, 2015 was filed late by each of Mr. Alexander Nickolatos and Mr. Carlos Fernandez on November 16, 2015.
Director Qualifications and Board Leadership Structure
Mr. Bruheim has significant operational experience in the oilfield services industry and brings both a practical understanding of the industry as well as hands-on experience at building companies in this sector. He currently serves on several other boards of directors and as Chief Executive Officer of companies operating in our industry and brings experience with young growing companies to our Board, which adds significant value. Mr. Boswell also has a track record as an executive officer in this industry and has been part of starting and building multiple companies with this oilfield service sector. He also brings a strong financial background to our Board. Mr. Fernandez has significant experience at starting and growing oilfield service companies with a particular emphasis on the Latin American market and specifically in Argentina. His experience at navigating cross border business agreements and relationships is of particular value to our Board. Mr. Krummel has significant financial experience in the industry with previous roles as Chief Financial Officer and Chief Accounting Officer with public companies where he was responsible for all accounting functions, including consolidated financial reporting and SEC filings. Mr. Al-Sati is an investor and restructuring professional with over 12 years of direct experience in private equity, lending transactions and other special situations in almost 20 different jurisdictions in Africa, Europe, Asia and the Americas. Mr. Chan has extensive investment experience, including investment experience in Asia, Latin America, North America and Oceana. His experience in and understanding of emerging markets transactions in an international context should add significant value to our Board. Mr. Stoltz has experience in trading derivatives, portfolio risk management, interest rate swaps and foreign exchange trading. Mr. Narea has completed transactions and assignments in corporate advisory, capital markets, restructurings, structured finance and private placements for corporations and governments in Latin America.
| 49 |
Committees of the Board of Directors
The Board has three standing committees: the Audit Committee, the Compensation Committee and the Nominating Committee.
Audit Committee
Mr. Christopher Krummel has served as chairman of the Audit Committee since January 2014, and Mr. Bjarte Bruheim is also currently a member of the Audit Committee. Mr. Jogeir Romestrand served as a member of the Audit Committee until he resigned from our Board on March 7, 2016. On March 7, 2016, our Board, based on the Nominating Committee’s recommendation, appointed Mr. Leonel Narea to serve as a member of the Audit Committee, filling the vacancy created by the resignation of Mr. Romestrand from the Board. As required by the rules of the SEC and listing standards of the NASDAQ, the Audit Committee consists solely of independent directors. In addition, our Board has determined that Mr. Krummel qualifies as an “audit committee financial expert,” as defined in Item 407(d)(5)(ii) of Regulation S-K.
The Audit Committee oversees, reviews, acts on and reports on various auditing and accounting matters to the Company’s Board, including:
| ● | overseeing the accounting and financial reporting processes of the Company and audits of the Company’s financial statements; | |
| ● | overseeing the quality, integrity and reliability of the financial statements and other financial information the Company provides to any governmental body or the public; | |
| ● | overseeing the Company’s compliance with legal and regulatory requirements; | |
| ● | overseeing the independent auditors’ qualifications, independence and performance; | |
| ● | overseeing the Company’s systems of internal controls regarding finance, accounting, legal compliance and ethics that management and the Board have established; and | |
| ● | providing an open avenue of communication among the independent auditors, financial and senior management, and the Board, always emphasizing that the independent auditors are accountable to the Audit Committee. |
The Company has an Audit Committee Charter defining the committee’s primary duties, which is available on the Company’s website at www.ecostim-es.com in the “Corporate Governance” subsection in the “Investors” section. The Audit Committee held 10 meetings during the fiscal year ended December 31, 2015.
Compensation Committee
Mr. Christopher Krummel has served as chairman of the Compensation Committee since March 2015, and Mr. Ahmad Al-Sati is also a current member of the Compensation Committee. On March 7, 2015, our Board appointed Mr. Donald Stoltz to serve as an additional member of the Compensation Committee. Our Board has determined that all members of the Compensation Committee meet the non-employee director definition of Rule 16b-3 promulgated under Section 16 of the Securities Exchange Act of 1934, as amended (the “Exchange Act”), the outside director definition of Section 162(m) of the Internal Revenue Code of 1986, as amended, and the independence standards of the applicable NASDAQ Stock Market Rules.
The Compensation Committee assists our Board in carrying out its responsibilities with respect to (i) employee compensation, benefit plans, and employee stock programs and (ii) matters relating to the compensation of persons serving as senior management and the Chief Executive Officer of the Company. The Compensation Committee determines and approves the total compensation of the Chief Executive Officer and senior management based on its evaluation of the performance the Chief Executive Officer and senior management in light of certain goals and objectives as well as input from the Nominating Committee, and with respect to senior management, the Compensation Committee also considers input from the Chief Executive Officer. The Compensation Committee has broad delegating authority, including the authority to delegate to subcommittees as it deems appropriate, to delegate to one or more executive officers to approve equity compensation awards under established equity compensation plans of the Company to employees and officers of the Company other than those subject to Section 16 of the Exchange Act and to delegate any non-discretionary administrative authority under Company compensation and benefit plans consistent with any limitations specified in the applicable plans.
| 50 |
The Company has a Compensation Committee Charter defining the committee’s primary duties, which is available on the Company’s website at www.ecostim-es.com in the “Corporate Governance” subsection in the “Investors” section. The Compensation Committee held two meetings during the fiscal year ended December 31, 2015.
Nominating Committee
Mr. Jogeir Romestrand has served as chairman of the Nominating Committee since March 2015, and Mr. Bjarte Bruheim and Mr. John Yonemoto served as members of the Nominating Committee until Mr. Romestrand and Mr. Yonemoto resigned from our Board on March 7, 2016. Mr. Bjarte Bruheim became the chairman of the Nominating Committee on March 7, 2016. On March 7, 2016, our Board appointed Mr. Ahmad Al-Sati and Mr. Stoltz to serve as members of the Nominating Committee, filling the vacancies created by the resignation of Jogeir Romestrand and John Yonemoto from the Board.
The Nominating Committee identifies, evaluates and nominates qualified candidates for appointment or election to the Company’s Board. In identifying, evaluating and recommending director nominees to the Board, the Nominating Committee identifies persons who possess the integrity, leadership skills and competency required to direct and oversee the Company’s management in the best interests of its shareholders, customers, employees, communities it serves and other affected parties. A candidate must be willing to regularly attend Board meetings and if applicable, committee meetings, to participate in Board development programs, to develop a strong understanding of the Company, its businesses and its requirements, to contribute his or her time and knowledge to the Company and to be prepared to exercise his or her duties with skill and care. While the Board does not have a formal policy on diversity, in selecting nominees, the Nominating Committee seeks to have a Board that represents a diverse range of perspectives and experience relevant to the Company.
The Company has a Nominating Committee Charter defining the committee’s primary duties, which is available on the Company’s website at www.ecostim-es.com in the “Corporate Governance” subsection in the “Investors” section. The functions of the Nominating Committee, which are discussed in detail in its charter, include (i) developing a pool of potential directorial candidates for consideration in the event of a vacancy on the Board, (ii) screening directorial candidates in accordance with certain guidelines and criteria set forth in its charter and (iii) recommending nominees to the Board. The Nominating Committee held three meetings during the fiscal year ended December 31, 2015.
The Nominating Committee seeks recommendations from our existing directors to identify potential candidates to fill vacancies on our Board. The Nominating Committee will also consider nominee recommendations properly submitted by stockholders in accordance with the procedures outlined in our bylaws, on the same basis as candidates recommended by the Board and other sources. For stockholder nominations of directors for the Annual Meeting, nominations must be made in writing and delivered to the Secretary of the Company at 2930 W. Sam Houston Pkwy N., Suite 275, Houston, Texas 77043. Nominations must be received by the Secretary of the Company no later than the earlier of the close of business on the tenth (10th) day following the day on which such notice of the date of the Annual Meeting was mailed or such public disclosure was made, whichever first occurs, or (b) two (2) days prior to the date of the Annual Meeting.
| 51 |
Item 11. Executive Compensation
We are currently considered a “smaller reporting company” for purposes of the SEC’s executive compensation and other disclosure rules. In accordance with such rules, we are required to provide a Summary Compensation Table and an Outstanding Equity Awards at Fiscal Year End Table, as well as limited narrative disclosures.
Summary Compensation Table
The following table summarizes, with respect to each of our named executive officers, information relating to all compensation earned for services rendered to us in all capacities in the last two completed fiscal years.
| Name and principal position | Year | Salary ($) | Bonus ($) | Stock Awards ($) (2) | Option Awards ($) (3) | Non-Equity Incentive Plan Compensation ($) | Nonqualified Deferred Compensation Earnings ($) | All Other Compensation ($) (4) | Total ($) | |||||||||||||||||||||||||||
| Jon Christopher Boswell – | 2015 | 200,000 | 96,000 | — | — | 25,250 | 321,250 | |||||||||||||||||||||||||||||
| Chief Executive Officer | 2014 | 200,000 | — | 188,000 | 46,266 | — | — | 16,000 | 450,266 | |||||||||||||||||||||||||||
| Bobby Chapman – | 2015 | 200,000 | 43,000 | — | — | — | 24,150 | 267,150 | ||||||||||||||||||||||||||||
| Chief Operating Officer | 2014 | 200,000 | — | 223,000 | — | — | — | 16,000 | 439,000 | |||||||||||||||||||||||||||
| Carlos Fernandez – | 2015 | 200,000 | 90,000 | — | — | — | 12,054 | 302,054 | ||||||||||||||||||||||||||||
| Executive Vice President- Corporate Business Development and General Manager Latin America (1) | 2014 | 166,000 | — | 819,000 | — | — | — | 985,000 | ||||||||||||||||||||||||||||
| Alexander Nickolatos – | 2015 | 200,000 | 85,000 | — | — | — | 25,250 | 310,250 | ||||||||||||||||||||||||||||
| Chief Financial Officer and Assistant Secretary | 2014 | 200,000 | — | 437,500 | — | — | — | 10,000 | 647,500 | |||||||||||||||||||||||||||
| (1) | Mr. Fernandez was appointed our Executive Vice President-Corporate Business Development and General Manager Latin America on July 9, 2014. The compensation reported for Mr. Fernandez for 2014 reflects compensation earned by him as a consultant of our Company prior to July 1, 2014 and compensation earned by him as an employee of our Company after July 1, 2014. |
| (2) | The amounts in this column reflect the aggregate grant date fair value of all stock awards calculated in accordance with FASB ASC Topic 718. See Part II – Item 8 – Financial Statements and Supplemental Data –Notes to consolidated financial data – Note 14 – Stock-Based Compensation” for additional information regarding the assumptions used to calculate the grant date fair value of the stock awards. The stock awards granted to Messrs. Boswell, Chapman, Fernandez and Nickolatos in 2014 were awards of restricted stock under our 2013 Stock Incentive Plan. We did not grant any stock awards to our named executive officers in 2015. |
| (3) | The amount in this column reflects the aggregate grant date fair value of all option awards calculated in accordance with FASB ASC Topic 718. See Part II – Item 8 – Financial Statements and Supplemental Data – Notes to consolidated financial data – Note 14 – Stock-Based Compensation” for additional information regarding the assumptions used to calculate the fair value of the option awards. We did not grant any option awards to our named executive officers in 2015. |
| (4) | Amounts reported in the “All Other Compensation” column consist of (a) with respect to all named executive officers, employer matching contributions to our tax-qualified Section 401(k) retirement savings plan and (b) with respect to Messrs. Boswell, Chapman and Nickolatos, a monthly car allowance. |
Narrative Disclosure to Summary Compensation Table
Employment Agreements. We have entered into employment agreements with each of our named executive officers. The following summary details the material terms of the employment agreements:
| 52 |
Jon Christopher Boswell. Mr. Boswell’s employment agreement provides for a term of employment through November 24, 2015, with a renewal provision that automatically extends the term of Mr. Boswell’s employment for an additional year unless either party provides written notice of non-renewal. We currently pay Mr. Boswell a base salary of $200,000 per year. Mr. Boswell is also eligible to receive a $1,000.00 monthly car allowance and a discretionary bonus to be determined by the Board, within its sole discretion, up to a maximum of 100% of his base salary. The employment agreement also contains severance provisions, which are discussed below under “Additional Narrative Disclosure—Potential Payments Upon Termination or a Change in Control”. The employment agreement provides that during the term of the agreement and for twelve (12) months or six (6) months, respectively, after the termination of Mr. Boswell’s employment (for whatever reason), Mr. Boswell will not compete with us or solicit our customers or our employees. The employment agreement also provides for the nondisclosure of any confidential information relating to us by Mr. Boswell.
Bobby Chapman Mr. Chapman’s employment agreement, as amended on October 8, 2015, provides for a term of employment through November 3, 2016, with a renewal provision that automatically extends the term of Mr. Chapman’s employment for an additional year unless either party provides written notice of non-renewal. As of January 1, 2016, we pay Mr. Chapman a base salary of $150,000 per year. As of January 1, 2016, Mr. Chapman is also eligible to receive a $1,000.00 monthly car allowance and a discretionary bonus to be determined by the Board, within its sole discretion, up to a maximum of 50% of his base salary. The employment agreement also contains severance provisions, which are discussed below under “Additional Narrative Disclosure—Potential Payments Upon Termination or a Change in Control”. The employment agreement provides that during the term of the agreement and for twelve (12) months or six (6) months, respectively, after the termination of Mr. Chapman’s employment (for whatever reason), Mr. Chapman will not compete with us or solicit our customers or our employees. The employment agreement also provides for the non-disclosure of any confidential information relating to us by Mr. Chapman.
Carlos Fernandez. Mr. Fernandez’s employment agreement provides for a term of employment through June 30, 2016, with a renewal provision that automatically extends the term of Fernandez’s employment for an additional year unless either party provides written notice of non-renewal. Pursuant to the employment agreement, we pay Mr. Fernandez a base salary of $200,000 per year for his service as the Executive Vice President-Corporate Business Development and General Manager Latin America. Mr. Fernandez is also eligible to receive a discretionary bonus to be determined by the Board, within its sole discretion, up to a maximum of 50% of his base salary. The Company will also grant Mr. Fernandez options to purchase 75,000 shares of our common stock, at a price of $6.00 per share, vesting in four equal semi-annual installments over two years. The employment agreement also contains severance provisions, which are discussed below under “Additional Narrative Disclosure –Potential Payments Upon Termination or a Change in Control.” The employment agreement provides that during the term of the agreement and for six (6) months after the termination of Mr. Fernandez’s employment (for whatever reason), Mr. Fernandez will not compete with us or solicit our customers or our employees. The employment agreement also provides for the non-disclosure of our confidential information by Mr. Fernandez.
Alexander Nickolatos. Mr. Nickolatos’ employment agreement provides for an original term of employment that ended on June 30, 2014, which term has automatically extended for an additional year in accordance with a renewal provision that automatically extends the term of Mr. Nickolatos’ employment for an additional year unless either party provides written notice of non-renewal. We currently pay Mr. Nickolatos a base salary of $200,000 per year. Mr. Nickolatos is also eligible to receive a $1,000.00 monthly car allowance and a discretionary bonus to be determined by the Board, within its sole discretion, up to a maximum of 50% of his base salary. The employment agreement also contains severance provisions, which are discussed below under “Additional Narrative Disclosure –Potential Payments Upon Termination or a Change in Control”. The employment agreement also provides that during the term of the agreement and for six (6) months after the termination of Mr. Nickolatos’ employment (for whatever reason), Mr. Nickolatos will not compete with us or solicit our customers or our employees. The employment agreement also provides for the non-disclosure of our confidential information by Mr. Nickolatos.
| 53 |
Outstanding Equity Awards at 2015 Fiscal Year End
The following table presents, for each named executive officer, information regarding outstanding option awards and stock awards held as of December 31, 2015.
| OPTION AWARDS | STOCK AWARDS | |||||||||||||||||||||||||
| Number of Securities Underlying Unexercised Options Exercisable | Number of Securities Underlying Unexercised Options Unexercisable | Equity Incentive Plan Awards: Number of Securities Underlying Unexercised Unearned Options | Option Exercise Price ($) | Option Expiration Date | Number of Shares of Stock That Have Not Vested (2) | Market Value of Shares of Stock That Have Not Vested ($) (3) | ||||||||||||||||||||
| Jon Christopher Boswell | 30,048 | — | — | 3.33 | 28-Aug-22 | |||||||||||||||||||||
| 125,000 | — | 6.00 | 24-Oct-23 | |||||||||||||||||||||||
| 4,250 | 12,750 | (1) | — | 6.00 | 11-Jul-24 | 27,750 | 86,858 | |||||||||||||||||||
| Bobby Chapman | 100,000 | — | — | 6.00 | 4-Nov-23 | 30,000 | 93,900 | |||||||||||||||||||
| Carlos Fernandez | 22,318 | — | — | 3.33 | 28-Aug-22 | 90,000 | 281,700 | |||||||||||||||||||
| 10,000 | — | — | 6.00 | 24-Oct-23 | ||||||||||||||||||||||
| Alexander Nickolatos | 4,083 | — | — | 0.33 | 1-Jul-22 | |||||||||||||||||||||
| 5,015 | — | — | 3.33 | 28-Aug-22 | ||||||||||||||||||||||
| 25,000 | — | — | 6.00 | 24-Oct-23 | 53,750 | 168,238 | ||||||||||||||||||||
| (1) | These options held by our named executive officers previously vested as to 25 percent of each award on July 11, 2015 and the remaining 75 percent of each award will become vested and exercisable in three equal annual installments on July 11, 2016, July 11, 2017 and July 11, 2018 so long as the named executive officer remains employed by us on each such date. |
| (2) | Includes (a) awards of restricted stock held by our named executive officers that previously vested as to 25 percent of each award on July 11, 2015 and consist of the following number of remaining shares that will become vested in three remaining equal annual installments on July 11, 2016, July 11, 2017 and July 11, 2018 so long as the named executive officer remains employed by us on each such date: (i) Mr. Boswell – 12,750, (ii) Mr. Chapman – 22,500, (iii) Mr. Fernandez – 30,000 and (iv) Mr. Nickolatos – 22,500; (b) awards of restricted stock held by our named executive officers that previously vested as to 25 percent of each award on December 1, 2015 and consist of the following number of remaining shares that will become vested in three remaining equal annual installments on December 1, 2016, December 1, 2017 and December 1, 2018 so long as the named executive officer remains employed by us on each such date: (i) Mr. Boswell – 15,000, (ii) Mr. Chapman – 7,500, (iii) Mr. Fernandez – 22,500 and (iv) Mr. Nickolatos – 18,750; and (c) awards of restricted stock held by our named executive officers that previously vested as to 50 percent of each award on January 11, 2015 and July 11, 2015 and consist of the following number of remaining shares that have become or will become vested in two remaining equal semi-annual installments on January 11, 2016 and July 11, 2016 so long as the named executive officer remains employed by us on each such date: (i) Mr. Fernandez – 37,500 and (ii) Mr. Nickolatos – 12,500. |
| (3) | The amounts in this column reflect the closing price of our common stock on December 31, 2015 (the last trading day of fiscal year 2015), which was $3.13, multiplied by the number of outstanding shares of restricted stock. |
Additional Narrative Disclosure
Retirement Benefits
As of December 31, 2015, we maintain a tax-qualified Section 401(k) retirement savings plan. This plan provides for employee contributions, employer matching contributions (5% of salary), and a discretionary profit sharing contribution. Our named executive officers are eligible to participate in our tax-qualified Section 401(k) retirement savings plan on the same basis as other employees who satisfy the plan’s eligibility requirements, including requirements relating to age and length of service. No discretionary profit sharing contributions were made during 2014 or 2015. Under this plan, participants may elect to make pre-tax contributions not to exceed the applicable statutory limitation, which was $18,000 for 2015. All employer contributions vest immediately.
| 54 |
Potential Payments Upon Termination or a Change in Control
The employment agreements with Messrs. Boswell, Chapman, Fernandez and Nickolatos contain severance provisions, as described below.
Mr. Boswell. If we terminate Mr. Boswell’s employment without “cause” (as such term is defined in his employment agreement), or if Mr. Boswell terminates his employment with us for “good reason” (as such term is defined in his employment agreement), then Mr. Boswell is entitled to (a) his base salary accrued to the date of his termination and any unreimbursed business expenses, (b) an amount equal to the greater of the compensation required for the remaining term of this employment agreement or two years of base salary, and (c) full vesting of all unvested restricted stock or stock options outstanding. Payment of items (b) and (c) is contingent upon the execution of a release by Mr. Boswell on a form provided by us.
If Mr. Boswell’s employment with us is terminated due to his becoming disabled, Mr. Boswell is entitled to (a) his base salary accrued to the date of his termination, any unreimbursed business expenses and unpaid bonus from the prior year, and (b) full vesting of all unvested restricted stock outstanding. If Mr. Boswell’s employment is terminated as a result of his death, we are required to pay his estate his base salary and accrued through the date of his death, and any unpaid bonus from the prior year and reimburse his estate for any unreimbursed business expenses. Mr. Boswell’s estate will also become fully vested in all unvested restricted stock outstanding.
If Mr. Boswell’s employment with us is terminated for “cause,” or if Mr. Boswell terminates his employment with us voluntarily, Mr. Boswell is entitled to his base salary accrued to the date of his termination and any unreimbursed business expenses. If we or Mr. Boswell elect to not renew the Employment Agreement at the end of its term, then Mr. Boswell is entitled to (a) his base salary accrued to the date of his termination and any unreimbursed business expenses, (b) an amount equal to the greater of the compensation required for the remaining term of this employment agreement or two years of base salary, and (c) full vesting of all unvested restricted stock and stock options outstanding.
Mr. Chapman. If we terminate Mr. Chapman’s employment without “cause” (as such term is defined in his employment agreement), or if Mr. Chapman terminates his employment with us for “good reason” (as such term is defined in his employment agreement), then Mr. Chapman is entitled to (a) his base salary accrued to the date of his termination and any unreimbursed business expenses, (b) an amount equal to the greater of the compensation required for the remaining term of this employment agreement or one year of base salary, and (c) full vesting of all unvested restricted stock or stock options outstanding. Payment of items (b) and (c) is contingent upon the execution of a release by Mr. Chapman on a form provided by us. If Mr. Chapman’s employment with us is terminated due to his becoming disabled, Mr. Chapman is entitled to (a) his base salary accrued to the date of his termination, any unreimbursed business expenses and unpaid bonus from the prior year, and (b) full vesting of all unvested restricted stock outstanding.
If Mr. Chapman’s employment is terminated as a result of his death, we are required to pay his estate his base salary accrued through the date of his death, and any unpaid bonus from the prior year and reimburse his estate for any unreimbursed business expenses. Mr. Chapman’s estate will also become fully vested in all unvested restricted stock outstanding.
If Mr. Chapman’s employment with us is terminated for “cause,” or if Mr. Chapman terminates his employment with us voluntarily, Mr. Chapman is entitled to his base salary accrued to the date of his termination and any unreimbursed business expenses. If we or Mr. Chapman elect to not renew the employment agreement at the end of its term, then Mr. Chapman is entitled to (a) his base salary accrued to the date of his termination and any unreimbursed business expenses, (b) an amount equal to the greater of the compensation required for the remaining term of this employment agreement or one year of base salary, and (c) full vesting of all unvested restricted stock and stock options outstanding.
Mr. Fernandez. If we terminate Mr. Fernandez’s employment without “cause” (as such term is defined in his employment agreement), or if Mr. Fernandez terminates his employment with us for “good reason” (as such term is defined in his employment agreement), then Mr. Fernandez is entitled to (a) his base salary accrued to the date of his termination and any unreimbursed business expenses, (b) an amount equal to the greater of the compensation required for the remaining term of this employment agreement or one year of base salary, and (c) full vesting of all unvested restricted stock or stock options outstanding. Payment of items (b) and (c) is contingent upon the execution of a release by Mr. Fernandez on a form provided by us.
| 55 |
If Mr. Fernandez’s employment with us is terminated due to his becoming disabled, Mr. Fernandez is entitled to (a) his base salary accrued to the date of his termination, any unreimbursed business expenses and unpaid bonus from the prior year, and (b) full vesting of all unvested restricted stock outstanding. If Mr. Fernandez’s employment is terminated as a result of his death, we are required to pay his estate his base salary accrued through the date of his death, and any unpaid bonus from the prior year and reimburse his estate for any unreimbursed business expenses. Mr. Fernandez’s estate will also become fully vested in all unvested restricted stock outstanding.
If Mr. Fernandez’s employment with us is terminated for “cause,” or if Mr. Fernandez terminates his employment with us voluntarily, Mr. Fernandez is entitled to his base salary accrued to the date of his termination and any unreimbursed business expenses. If we or Mr. Fernandez elect to not renew the employment agreement at the end of its term, then Mr. Fernandez is entitled to (a) his base salary accrued to the date of his termination and any unreimbursed business expenses, (b) an amount equal to the greater of the compensation required for the remaining term of this employment agreement or one year of base salary, and (c) full vesting of all unvested restricted stock and stock options outstanding.
Mr. Nickolatos. If we terminate Mr. Nickolatos’ employment without “cause” (as such term is defined in his employment agreement), or if Mr. Nickolatos terminates his employment with us for “good reason” (as such term is defined in his employment agreement), then Mr. Nickolatos is entitled to (a) his base salary accrued to the date of his termination and any unreimbursed business expenses, (b) an amount equal to the greater of the compensation required for the remaining term of this employment agreement or one year of base salary, and (c) full vesting of all unvested restricted stock or stock options outstanding. Payment of items (b) and (c) is contingent upon the execution of a release by Mr. Nickolatos on a form provided by us.
If Mr. Nickolatos’ employment with us is terminated due to his becoming disabled, Mr. Nickolatos is entitled to (a) his base salary accrued to the date of his termination, any unreimbursed business expenses and unpaid bonus, and (b) full vesting of all unvested restricted stock outstanding. If Mr. Nickolatos’ employment is terminated as a result of his death, we are required to pay his estate his base salary accrued through the date of his death and reimburse his estate for any unreimbursed business expenses and unpaid bonus. Mr. Nickolatos’ estate will also become fully vested in all unvested restricted stock outstanding.
If Mr. Nickolatos’ employment with us is terminated for “cause,” or if Mr. Nickolatos terminates his employment with us voluntarily, Mr. Nickolatos is entitled to his base salary accrued to the date of his termination and any unreimbursed business expenses. If we or Mr. Nickolatos elect to not renew the employment agreement at the end of its term, then Mr. Nickolatos is entitled to (a) his base salary accrued to the date of his termination and any unreimbursed business expenses, (b) an amount equal to the greater of the compensation required for the remaining term of this employment agreement or one year of base salary, and (c) full vesting of all unvested restricted stock and stock options outstanding.
Director Compensation
We historically have not had a formal compensation package for non-employee members of our Board for their service as directors. At the time of this report, we do not anticipate establishing a formal compensation package for our non-employee directors. However, we may decide to grant an award of stock options to our non-employee directors from time to time.
In January 2014, Mr. Krummel received a grant of options to purchase 10,000 shares of our common stock at a price of $7.00 per share, vesting in four equal semi-annual installments over two years. As of December 31, 2015, the aforementioned options granted to Mr. Krummel were 75 percent exercisable.
In September, 2015, Mr. Bruheim was granted options to purchase 45,833 shares of our common stock, Mr. Krummel was granted options to purchase 47,500 shares of our common stock, Mr. Romestrand was granted options to purchase 41,667 shares of our common stock and each of Messrs. Al-Sati, Yonemoto and Lap Wai Chan was granted options to purchase 15,000 shares of our common stock, in each case, at a price of $4.75 per share and vesting in four equal semi-annual installments over two years. As of December 31, 2015, all of the options described in the preceding sentence were outstanding and fully unexercisable.
| 56 |
Other than the foregoing options, our non-employee directors currently do not receive any compensation specifically for their services as a director; however the Company does reimburse these directors for any travel or other business expenses related to their service as a director.
| Name | Fee: Earned or Paid in Cash ($) | Stock Awards ($) | Option Awards ($)(1)(2) | Non-Equity Incentive Plan Compensation ($) | Nonqualified Deferred Compensation Earnings ($) | All Other Compensation ($) | Total ($) | |||||||||||||||||||||
| Bjarte Bruheim | — | — | 45,833 | — | — | — | 45,833 | |||||||||||||||||||||
| Jogeir Romestrand | — | — | 41,667 | — | — | — | 41,667 | |||||||||||||||||||||
| Christopher Krummel | — | — | 47,500 | — | — | — | 47,500 | |||||||||||||||||||||
| John Yonemoto | — | — | 15,000 | — | — | — | 15,000 | |||||||||||||||||||||
| Ahmad Al-Sati | — | — | 15,000 | — | — | — | 15,000 | |||||||||||||||||||||
| Lap Wai Chan | — | — | 15,000 | — | — | — | 15,000 | |||||||||||||||||||||
| (1) | The amount in this disclosure reflects the aggregate grant date fair value of all option awards calculated in accordance with FASB ASC Topic 718. Our non-employee directors were granted an option to purchase the following shares of our common stock in 2015: (i) Mr. Bruheim—45,833; (ii) Mr. Romestrand—41,667; (iii) Mr. Krummel—47,500; (iv) Mr. Yonemoto—15,000; (v) Mr. Al-Sati—15,000; and (vi) Mr. Chan—15,000. The options vest in four equal semi-annual installments on March 18, 2016, September 18, 2016, March 18, 2017 and September 18, 2017.
|
| (2) | As of December 31, 2015, each of our non-employee directors held the following aggregate number of options to purchase our common stock: (i) Mr. Bruheim—143,151; (ii) Mr. Romestrand—51,667; (iii) Mr. Krummel—58,812; (iv) Mr. Yonemoto—15,000; (v) Mr. Al-Sati—15,000; and (vi) Mr. Chan—15,000. |
| 57 |
Item 12. Security Ownership of Certain Beneficial Owners and Management and Related Stockholder Matters
At March 16, 2016, we had 13,576,139 shares of our common stock issued and outstanding. The following table sets forth information regarding the beneficial ownership of our common stock as of March 16, 2016 by:
| ● | each person known by us to be the beneficial owner of more than 5% of our common stock; | |
| ● | each of our directors; | |
| ● | each of our named executive officers; and | |
| ● | our named executive officers and directors as a group. |
Unless otherwise indicated, the business address of each person listed is in care of 2930 W. Sam Houston Pkwy N., Suite 275, Houston, TX 77043. The percentages in the table are computed using a denominator consisting of 13,576,139 shares of outstanding common stock plus the number of shares of common stock issuable upon the exercise of all outstanding options, warrants, rights or conversion privileges held by a holder which are exercisable within 60 days of March 16, 2016. Except as otherwise indicated, the persons listed below have sole voting and investment power with respect to all shares of our common stock owned by them, except to the extent that power may be shared with a spouse.
| Name and Address of Beneficial Owner (1) | Number
of Shares | Percentage
of Class (2) | ||||||
| 5% Stockholders: | ||||||||
| ACM Emerging Markets Master Fund I, L.P. | 5,697,103 | (3) | 33.04 | % | ||||
| Bienville Argentina Opportunities Master Fund, LP | 2,397,388 | (4) | 17.66 | % | ||||
| Hayman Capital Master Fund, LP. | 2,130,000 | (5) | 15.69 | % | ||||
| Gilder Gagnon Howe & Co | 1,162,064 | (6) | 8.56 | % | ||||
| Directors and Executive Officers: | ||||||||
| Bjarte Bruheim | 634,415 | (7) | 4.64 | % | ||||
| Chairman of the Board | ||||||||
| Jon Christopher Boswell | 429,486 | (8) | 3.13 | % | ||||
| Director, President and Chief Executive Officer | ||||||||
| Carlos Fernandez | 216,061 | (9) | 1.59 | % | ||||
| Director, Executive Vice President-Corporate Business Development and General Manager Latin America | ||||||||
| Bobby Chapman | 137,000 | (10) | 1.00 | % | ||||
| Chief Operating Officer | ||||||||
| Alexander Nickolatos | 117,598 | (11) | * | |||||
| Chief Financial Officer and Assistant Secretary | ||||||||
| Christopher Krummel | 34,950 | (12) | * | |||||
| Director | ||||||||
| Ahmad Al-Sati | 3,750 | (13) | * | |||||
| Director | ||||||||
| Leonel Narea | — | * | ||||||
| Director | ||||||||
| Lap Wai Chan | 3,750 | (14) | * | |||||
| Director | ||||||||
| Donald Stoltz | — | * | ||||||
| Director | ||||||||
| Total | 12,963,565 | 86.48 | % | |||||
| All officers and directors as a group | 1,577,010 | 11.53 | % | |||||
* indicates less than 1%.
| (1) | Unless otherwise specified the address of each stockholder is 2930 West Sam Houston Parkway North, Suite 275, Houston, Texas 77043. |
| 58 |
| (2) | For each stockholder, this percentage is determined by assuming the named stockholder exercises all options which the stockholder has the right to acquire within 60 days of April 29, 2016, but that no other person exercises any options. |
| (3) | Includes 3,666,666 shares of common stock issuable upon conversion of the Convertible Note. Voting and dispositive power over the securities owned by ACM is held by John Yonemoto, Gregory B. Bowes, Pieter Wernink, Serdar Saginda, James O’Brien and Michael Warren, who serve on the Investment Committee of Albright Capital Management LLC, the general partner of ACM. The business address of ACM is 1101 New York Avenue, NW, Suite 900, Washington, D.C. 20005. |
| (4) | Based solely on Form 4 filed with the SEC by Bienville Argentina Opportunities Master Fund, LP (“Bienville”), Bienville Capital Management, LLC and BAOF GP, LLC on February 29, 2016. The business address of Bienville is 89 Nexus Way, Camana Bay, Grand Cayman KY1-9007, Cayman Islands. |
| (5) | Based solely on Form 13G filed with the SEC by J Kyle Bass, Hayman Investments LLC, and Hayman Capital Management LP on February 16, 2016. The business address of each of J Kyle Bass, Hayman Investments LLC, and Hayman Capital Management is 2101 Cedar Springs Road, Suite 1400, Dallas, Texas 75201. |
| (6) | Based solely on Schedule 13G filed with the SEC on February 12, 2016 by Gilder Gagnon Howe & Co (“GGHC”), the securities owned by GGHC include 1,070,742 shares held in customer accounts over which partners and/or employees of GGHC have discretionary authority to dispose of or direct the disposition of the shares, 15,692 shares held in the account of the profit sharing plan of GGHC, and 75,630 shares held in accounts owned by the partners of GGHC and their families. The business address of GGHC is 3 Columbus Circle, 26th Floor, New York, NY 10019. |
| (7) | Includes 108,776 shares of common stock issuable upon exercise of options that are vested or will vest within 60 days of March 16, 2016. |
| (8) | Includes 159,298 shares of common stock issuable upon exercise of options that are vested or will vest within 60 days of March 16, 2016 and 9,250 shares of restricted stock that are vested or will vest within 60 days of March 16, 2016. |
| (9) | Includes 32,318 shares of common stock issuable upon exercise of options that are vested or will vest within 60 days of March 16, 2016 and 73,750 shares of restricted stock that are vested or will vest within 60 days of March 16, 2016. |
| (10) | Includes 100,000 shares of common stock issuable upon exercise of options that are vested or will vest within 60 days of March 16, 2016 and 10,000 shares of restricted stock that are vested or will vest within 60 days of March 16, 2016. |
| (11) | Includes 34,098 shares of common stock issuable upon exercise of options that are vested or will vest within 60 days of March 16, 2016 and 32,500 shares of restricted stock that are vested or will vest within 60 days of March 16, 2016. |
| (12) | Includes 23,187 shares of common stock issuable upon exercise of options that are vested or will vest within 60 days of March 16, 2016. |
| (13) | Includes 3,750 shares of common stock issuable upon exercise of options that are vested or will vest within 60 days of March 16, 2016. |
| (14) | Includes 3,750 shares of common stock issuable upon exercise of options that are vested or will vest within 60 days of March 16, 2016 |
| 59 |
Item 13. Certain Relationships and Related Transactions, and Director Independence
CERTAIN RELATIONSHIPS AND RELATED PARTY TRANSACTIONS
The following is a description of transactions since January 1, 2014 to which we have been a party, in which the amount involved exceeded or will exceed the lesser of $120,000 or 1% of the average of our total assets at year-end for the last two years, and in which any of our executive officers, directors or holders of more than 5% of our common stock, or an affiliate or immediate family member thereof, had or will have a direct or indirect material interest, other than compensation arrangements, which are described in the section above titled “Executive Compensation.”
Transactions with Our Directors, Executive Officers and Affiliates
On July 1, 2014, we entered into an employment agreement with Mr. Fernandez pursuant to which we pay Mr. Fernandez a base salary of $200,000 per year for his service as our Executive Vice President-Corporate Business Development and General Manager Latin America. Mr. Fernandez is also eligible to receive a discretionary bonus to be determined by our Board, within its sole discretion, up to a maximum of 50% of his base salary.
We previously maintained a consulting agreement with Mr. Fernandez that was terminated July 1, 2014. The former consulting agreement with Mr. Fernandez’s provided for a term that commenced on September 1, 2012 and continued until its termination. Pursuant to the consulting agreement, Mr. Fernandez provided services to us as an independent consultant with respect to our sales, marketing and business development in Latin America. Mr. Fernandez was paid $10,000 a month for his services. The consulting agreement also contained covenants restricting Mr. Fernandez’s disclosure of any confidential information relating to us.
In December 2013, we sold equipment to a third party leasing company controlled by two of our directors. Simultaneously, the equipment package was leased back to a subsidiary controlled by the Company, as a capital lease for a 60-month period with payments beginning in July 2014. We agreed to prepay six months in advance along with an initial deposit of six months of payments in the amount of approximately $1.0 million and maintain a balance of no less than six months of prepayments until the final six months of the lease. These prepayments were made prior to December 31, 2013. Further lease payments are approximately $81,000 per month and commenced on February 1, 2014.
On May 28, 2014, we entered into the Note Agreement with ACM. The proceeds from the Note Agreement were used for expenditures incurred in accordance with an approved operating budget. The Note Agreement allows us to issue ACM a multiple draw secured promissory note with a maximum aggregate principal amount of $22 million, convertible into our common stock at a price of $6.00 per share. The unpaid principal amount of the note bears an interest rate of 14% per annum and matures on the date that is four years following the closing date. In connection with and as a condition precedent for the closing of the Note Agreement, we entered into the Option Agreement with ACM. Pursuant to the Option Agreement, ACM has the Option, in ACM’s sole discretion, to purchase an aggregate of 1,333,333 shares of our common stock, at a price of $6.00 per share. ACM exercised the Option on July 14, 2014 to purchase 1,333,333 shares of our common stock for an aggregate purchase price of $8,000,000.
In connection with and as a condition precedent for the closing of the Note Agreement, we entered into the Stockholder Rights Agreement with ACM and the Management Stockholders, including our Chief Executive Officer, our Chief Financial Officer, our Chief Operating Officer, our Secretary and General Counsel, our Vice Presidents of Marketing, our Vice President of Sales, and a member of our Board. Pursuant to the Stockholder Rights Agreement, ACM currently has the right to nominate three individuals for election to our Board. The Stockholder Rights Agreement calls for ACM and the Management Stockholders to mutually agree on a slate of five or six individuals to be nominated for election to the Board within one year after the closing date. The Stockholder Rights Agreement requires the number of individuals nominated by ACM be proportionate to ACM’s percentage of beneficial ownership of our issued and outstanding common stock (calculated on a fully diluted basis from time to time). Additionally, pursuant to the Stockholder Rights Agreement, certain members of our management have agreed not to transfer any equity securities of the Company owned by them, subject to certain limited exceptions, so long as ACM beneficially owns, in the aggregate, at least 15% of our issued and outstanding common stock; provided, however, that if such management members receive a bona fide offer from a prospective purchaser and desire to accept such offer, ACM shall have a right of first refusal to acquire such securities. Moreover, under the Stockholder Rights Agreement, for so long as ACM beneficially owns more than 15% of our issued and outstanding common stock (calculated on a fully diluted basis), ACM, subject to certain limited exceptions, has a preemptive right to purchase up to 40% of any new securities we propose to issue or sell. As a result, ACM’s preemptive right will apply to any securities we issue during an underwritten public offering on terms and conditions (including pricing terms) substantially similar to those offered by the underwriters.
| 60 |
On May 28, 2015, the Company entered into an amendment with ACM. ACM and the Company agreed to give ACM the ability to have the $2,485,162 interest payment, which was due on May 28, 2015 (the “Deferred Interest”), paid in the form of shares of the Company’s common stock upon the consummation of a future equity offering, should one occur. On July 15, 2015, the Company issued 523,192 shares of unregistered common stock at a price of $4.75 per share to ACM as payment for the deferred interest.
On November 9, 2015, EcoStim, Inc. (“EcoStim”), a Texas corporation and wholly-owned subsidiary of the Company, entered into a First Amendment to Employment Agreement (the “First Amendment”) to that certain Employment Agreement dated November 4, 2013, by and between EcoStim f/k/a FracRock, Inc. and Bobby Chapman, the Company’s Chief Operating Officer (together with the First Amendment, the “Employment Agreement”). The First Amendment, among other things, (1) amended the term of Mr. Chapman’s employment, which, as amended, commenced on November 9, 2015 and will expire on November 3, 2016; provided, however, that the term will automatically renew each November 4, beginning on November 4, 2016, for an additional 12-month term unless either party provides written notice of non-renewal; (2) reduced Mr. Chapman’s base salary, effective January 1, 2016, from $200,000 per year to $150,000 per year; (3) increased the monthly car allowance payable to Mr. Chapman from $500 per month to $1,000 per month; and (4) provided that EcoStim will reimburse Mr. Chapman up to $500.00 per month for payment of office rental in Longview, Texas.
Director Independence
The members of the Audit Committee, namely Messrs. Krummel, Bruheim and Narea, the members of the Nominating Committee, namely Messrs. Bruheim, Stoltz and Al-Sati and the three members of the Compensation Committee, namely Messrs., Krummel, Al-Sati and Stoltz, have been determined to be independent under the applicable NASDAQ Stock Market Rules and rules of the SEC. For a discussion of independence standards applicable to our Board and factors considered by our Board in making its independence determinations, please refer to “Committees of the Board of Directors” included under Part III, Item 10 of this Form 10-K.
| 61 |
Item 14. Principal Accounting Fees and Services
The following table presents fees for professional audit services performed by Whitley Penn LLP for the audit of our annual financial statements for the fiscal year ended December 31, 2015 and 2014.
| 2015 | 2014 | |||||||
| Audit Fees (1) | $ | 243,327 | $ | 127,210 | ||||
| Audit-Related Fees | — | — | ||||||
| Tax Fees | — | — | ||||||
| All Other Fees | — | — | ||||||
| Total Fees | $ | 243,327 | $ | 127,210 | ||||
| (1) | Audit fees include professional services rendered for (i) the audit of our annual financial statements for the fiscal years ended December 31, 2015 and 2014, (ii) the reviews of the financial statements included in our quarterly reports on Form 10-Q for such years and (iii) the reviews of the S-1 filed during 2014 and 2015. |
Pre-Approval Policies
It is the policy of our Board that all services to be provided by our independent registered public accounting firm, including audit services and permitted audit-related and non-audit services, must be pre-approved by our Board. Our Board pre-approved all services, audit and non-audit, provided to us by Whitley Penn LLP for 2014 and 2015.
| 62 |
Item 15. Exhibits, Financial Statement Schedules
| (a) | Exhibits. |
| 2.1 | Agreement and Plan of Reorganization dated September 18, 2013 by and between Vision Global Solutions, Inc., FRI MergerSub, Inc. and FracRock International Inc. (incorporated by reference to our Schedule 14A filed on October 22, 2013) | |
| 3.1 | Amended and Restated Articles of Incorporation (incorporated by reference to our Current Report on Form 8-K filed on November 26, 2013). | |
| 3.2 | Amended and Restated Bylaws (incorporated by reference to our Current Report on Form 8-K filed on June 4, 2014). | |
| 3.3 | Certificate of Merger by and between FRI Merger Sub, Inc. and FracRock International, Inc. (incorporated by reference to our Annual Report on Form 10-K filed on March 28, 2014). | |
| 4.1 | Registration Rights Agreement, dated as of May 28, 2014, by and among Eco-Stim Energy Solutions, Inc. and the parties named therein (incorporated by reference to our Current Report on Form 8-K filed on June 4, 2014). | |
| 4.2 | Stockholder Rights Agreement, dated as of May 28, 2014, by and among Eco-Stim Energy Solutions, Inc. and the parties named therein (incorporated by reference to our Current Report on Form 8-K filed on June 4, 2014). | |
| 10.1 | Employment Agreement dated November 25, 2013 by and between FracRock, Inc. and J. Christopher Boswell (incorporated by reference to our Annual Report on Form 10-K filed on March 28, 2014). | |
| 10.2 | Employment Agreement dated November 4, 2013 by and between FracRock, Inc. and Bobby Chapman (incorporated by reference to our Annual Report on Form 10-K filed on March 28, 2014). | |
10.3 |
First Amendment to Employment Agreement date October 8, 2015 by and between EcoStim, Inc., and Bobby Chapman (incorporated by reference to our Current Report on Form 8-K filed on November 12, 2015). | |
| 10.4 | Employment Agreement dated July 1, 2012 by and between Frac Rock International, Inc., predecessor-by-merger to FracRock International, Inc. and Alexander Nickolatos (incorporated by reference to our Annual Report on Form 10-K filed on March 28, 2014). | |
| 10.5 | Form Stock Option Agreement under Stock Incentive Plan (incorporated by reference to our Annual Report on Form 10-K filed on March 28, 2014). | |
| 10.6 | Form Restricted Stock Agreement under Stock Incentive Plan (incorporated by reference to our Annual Report on Form 10-K filed on March 28, 2014). | |
| 10.7 | 2013 Stock Incentive Plan assumed in connection with the Merger (incorporated by reference to our Annual Report on Form 10-K filed on March 28, 2014). |
| 63 |
| 10.8 | Coiled Tubing Asset Package Lease Agreement dated December 21, 2013 by and between Impact Engineering, A.S. and Tango Rock S.A. (incorporated by reference to our Annual Report on Form 10-K filed on March 28, 2014). | |
| 10.9† | Purchase Order dated January 8, 2014 by and between Eco-Stim Energy Solutions, Inc. and Stewart & Stevenson Manufacturing Technologies LLC (incorporated by reference to our Annual Report on Form 10-K filed on March 28, 2014). | |
| 10.10 | Common Stock Purchase Warrant dated December 31, 2013 issued by Eco-Stim Energy Solutions, Inc. to Impact Engineering, A.S. (incorporated by reference to our Annual Report on Form 10-K filed on March 28, 2014). | |
| 10.11 | Consulting Agreement dated September 1, 2012 by and between Frac Rock International, Inc., predecessor-by-merger to FracRock International, Inc., and Carlos A. Fernandez (incorporated by reference to our Annual Report on Form 10-K filed on March 28, 2014). | |
| 10.12 | Convertible Note Facility Agreement dated as of May 28, 2014, by and between Eco-Stim Energy Solutions, Inc. and ACM Emerging Markets Master Fund I, L.P. (incorporated by reference to our Current Report on Form 8-K filed on June 4, 2014). | |
10.13 |
First Amendment to the Convertible Note Facility Agreement dated as of May 28, 2015, by and between Eco-Stim Energy Solutions, Inc. and ACM Emerging Markets Master Fund I, L.P. (incorporated by reference to our Current Report on Form 8-K filed on May 29, 2015). | |
| 10.14 | Securities Purchase Option Agreement, dated as of May 28, 2014, by and among Eco-Stim Energy Solutions, Inc. and ACM Emerging Markets Master Fund I, L.P. (incorporated by reference to our Current Report on Form 8-K filed on June 4, 2014). | |
| 10.15 | Assignment and Assumption Agreement dated as of May 28, 2014, by and between Eco-Stim Energy Solutions, Inc. and Viking Rock AS (incorporated by reference to our Current Report on Form 8-K filed on June 4, 2014). | |
| 10.16 | Exclusive Sales Agreement dated as of April 30, 2014, by and between Eco-Stim Energy Solutions, Inc. and Fotech Oil & Gas Solutions Limited (incorporated by reference to our Quarterly Report on Form 10-Q filed on August 12, 2014). | |
| 10.17 | Employment Agreement, dated as of July 1, 2014, by and between Eco-Stim Energy Solutions, Inc. and Carlos A. Fernandez (incorporated by reference to our Quarterly Report on Form 10-Q filed on November 12, 2014). | |
| 10.18 | Purchase Order, dated as of July 31, 2014, by and between Viking Rock AS and Feadar S.A. (incorporated by reference to our Quarterly Report on Form 10-Q filed on November 12, 2014). | |
| 10.19 | 2015 Stock Incentive Plan (incorporated by reference to our Proxy Statement on Definitive Schedule 14A filed on June 2, 2015). | |
| 14.0 | Code of Business Conduct and Ethics (incorporated by reference to our Registration Statement on Form S-1 filed on November 14, 2014). | |
| 21.1 | Subsidiaries of the registrant (incorporated by reference to our Registration Statement on Form S-1 filed on July 25, 2014). | |
| 23.1* | Consent of Independent Registered Public Accounting Firm (Whitley Penn LLP.) | |
| 31.1* | Rule 13(a)-14(a) Certification of the Chief Executive Officer. | |
| 31.2* | Rule 13(a)-14(a) Certification of the Chief Financial Officer. | |
| 32.1* | Section 1350 Certification of the Chief Executive Officer. | |
| 32.2* | Section 1350 Certification of the Chief Financial Officer. |
| * | Filed herewith. |
| † | Confidential treatment has been requested for portions of this exhibit. The omitted information has been filed separately with the SEC pursuant to our application for confidential treatment. |
| 64 |
Pursuant to the requirements of Section 13 or 15(d) the Securities Exchange Act of 1934, the registrant has duly caused this report to be signed on its behalf by the undersigned, thereunto duly authorized.
| Date: March 17, 2016 | ECO-STIM ENERGY SOLUTIONS, INC. | |
| By: | /s/ Jon Christopher Boswell | |
| Jon Christopher Boswell | ||
| President and Chief Executive Officer | ||
| By: | /s/ Alexander Nickolatos | |
| Alexander Nickolatos | ||
| Chief Financial Officer and Assistant Secretary | ||
Pursuant to the requirements of the Securities Exchange Act of 1934, this report has been signed below by the following persons on behalf of the registrant and in the capacities and on the dates indicated.
| Name | Title | Date | ||
| /s/ Jon Christopher Boswell | ||||
| Jon Christopher Boswell | Director, President and Chief Executive Officer | March 17, 2016 | ||
| /s/ Alexander Nickolatos | ||||
| Alexander Nickolatos | Chief Financial Officer and Assistant Secretary | March 17, 2016 | ||
| /s/ Bjarte Bruheim | ||||
| Bjarte Bruheim | Executive Chairman | March 17, 2016 | ||
| /s/ Bobby Chapman | ||||
| Bobby Chapman | Chief Operating Officer | March 17, 2016 | ||
| /s/ Donald Stoltz | ||||
| Donald Stoltz | Director | March 17, 2016 | ||
| /s/ Leonel Narea | ||||
| Leonel Narea | Director | March 17, 2016 | ||
| /s/ Ahmad Al-Sati | ||||
| Ahmad Al-Sati | Director | March 17, 2016 | ||
| /s/ Lap Chan | ||||
| Lap Chan | Director | March 17, 2016 | ||
| /s/ Carlos A. Fernandez | ||||
| Carlos A. Fernandez | Director, Executive Vice President - Global Business Development and General Manager - Latin America | March 17, 2016 | ||
| /s/ Christopher Krummel | ||||
| Christopher Krummel | Director | March 17, 2016 |
| 65 |