Attached files
| file | filename |
|---|---|
| EX-32.1 - EXHIBIT 32.1 - SAJAN INC | v433134_ex32-1.htm |
| EX-32.2 - EXHIBIT 32.2 - SAJAN INC | v433134_ex32-2.htm |
| EX-23.1 - EXHIBIT 23.1 - SAJAN INC | v433134_ex23-1.htm |
| EX-31.2 - EXHIBIT 31.2 - SAJAN INC | v433134_ex31-2.htm |
| EX-23.2 - EXHIBIT 23.2 - SAJAN INC | v433134_ex23-2.htm |
| EX-31.1 - EXHIBIT 31.1 - SAJAN INC | v433134_ex31-1.htm |
| EX-21.1 - EXHIBIT 21.1 - SAJAN INC | v433134_ex21-1.htm |
UNITED STATES SECURITIES AND EXCHANGE COMMISSION
WASHINGTON, D.C. 20549
FORM 10-K
(Mark One)
| x | ANNUAL REPORT PURSUANT TO SECTION 13 OR 15(d) OF THE SECURITIES EXCHANGE ACT OF 1934 |
For the fiscal year ended December 31, 2015
or
| ¨ | TRANSITION REPORT PURSUANT TO SECTION 13 OR 15(d) OF THE SECURITIES EXCHANGE ACT OF 1934 |
For the transition period from _______________________ to ___________________
Commission File Number: 000-51560
Sajan, Inc.
(Exact name of registrant as specified in its charter)
| Delaware | 41-1881957 |
| (State of incorporation) | (I.R.S. Employer Identification No.) |
| 625 Whitetail Blvd., River Falls, Wisconsin | 54022 |
| (Address of principal executive offices) | (Zip Code) |
Registrant’s telephone number, including area code: (715) 426-9505
| Securities registered pursuant to Section 12(b) of the Act: | ||
| Title of Each Class | Name of Each Exchange on which Registered | |
| Common Stock, $0.01 par value per share | The NASDAQ Stock Market LLC | |
Securities registered pursuant to Section 12(g) of the Act:
None
Indicate by check mark if the registrant is a well-known seasoned issuer, as defined in Rule 405 of the Securities Act. ¨ Yes x No
Indicate by check mark if the registrant is not required to file reports pursuant to Section 13 or Section 15(d) of the Act. ¨ Yes x No
Indicate by check mark whether the registrant (1) has filed all reports required to be filed by Section 13 or 15(d) of the Securities Exchange Act of 1934 during the preceding 12 months (or for such shorter period that the registrant was required to file such reports), and (2) has been subject to the filing requirements for the past 90 days.
x Yes ¨ No
Indicate by check mark whether the registrant has submitted electronically and posted on its corporate website, if any, every Interactive Data File required to be submitted and posted pursuant to Rule 405 of Regulation S-T (§232.405 of this chapter) during the preceding 12 months (or for such shorter period that the registrant was required to submit and post such files). x Yes ¨ No
Indicate by check mark if disclosure of delinquent filers pursuant to Item 405 of Regulation S-K is not contained herein, and will not be contained, to the best of registrant’s knowledge, in definitive proxy or information statements incorporated by reference in Part III of this Form 10-K or any amendment to this Form 10-K. ¨
Indicate by check mark whether the registrant is a large accelerated filer, an accelerated filer, a non-accelerated filer or a smaller reporting company. See definition of “accelerated filer,” “large accelerated filer” and “smaller reporting company” in Rule 12b-2 of the Exchange Act. (Check one):
| Large accelerated filer ¨ | Accelerated filer ¨ | Non-accelerated filer ¨ | Smaller reporting company x |
Indicate by check mark whether the registrant is a shell company (as defined in Rule 12b-2 of the Act).
¨ Yes x No
The aggregate market value of the outstanding common stock, other than shares held by persons who may be deemed affiliates of the registrant, as of June 30, 2015 was approximately $18,164,564 based on the closing sales price of $5.29 per share as reported on the NASDAQ Capital Market.
As of March 8, 2016, there were 4,782,743 shares of our common stock, $0.01 par value per share, outstanding.
DOCUMENTS INCORPORATED IN PART BY REFERENCE
Portions of our definitive proxy statement relating to our 2016 Annual Meeting of Stockholders is incorporated by reference into Part III of this Annual Report on Form 10-K
2015 Annual Report on Form 10-K
Table of Contents
NOTE REGARDING REVERSE STOCK SPLIT
Effective as of 11:59 p.m. on June 16, 2014, we amended our Certificate of Incorporation to effect a combination of our outstanding common stock at a ratio of one-for-four (the “Reverse Stock Split”). No fractional shares were issued as a result of the Reverse Stock Split, but instead stockholders received cash in lieu of any fractional shares to which they would otherwise have been entitled, based upon the last sale price of our common stock on June 16, 2014, as reported on the OTCQB Marketplace. All historical share and per share amounts have been adjusted to reflect the Reverse Stock Split. All stock options and warrants outstanding were appropriately adjusted to give effect to the Reverse Stock Split.
CAUTIONARY NOTICE REGARDING FORWARD-LOOKING STATEMENTS
Forward-Looking Statements
This Annual Report on Form 10-K contains forward-looking statements within the meaning of Section 27A of the Securities Act of 1933, as amended, and Section 21E of the Securities Exchange Act of 1934, as amended. Forward-looking statements reflect the current view about future events. When used in this Annual Report on Form 10-K the words “anticipate,” “will,” “believe,” “estimate,” “expect,” “future,” “intend,” “plan” and similar expressions or the negative of these terms as they relate to Sajan, Inc. (the “Company,” “Sajan,” “we,” “us” or “our”), its subsidiaries or its management identify forward-looking statements. Our forward-looking statements in this report generally relate to: our expectations regarding customer demand, market growth rates and conditions, pricing, our competitive position and strategic opportunities; our expectations regarding our expenses; our beliefs regarding the benefits of our technology and our ability to adapt to changing industry conditions; expectations regarding international sales; our intent with respect to intellectual property protection and research and development activities; our intent to grow organically and through acquisitions; our expectations regarding staffing to support revenue growth; our intent to retain earnings to fund development; our expected growth initiatives; our expectations regarding our deferred tax assets; and our expectations with respect to cash flows and adequacy of capital resources, including with respect to our credit facility. Forward-looking statements are based on information available at the time the statements are made and involve known and unknown risks, uncertainties and other factors that may cause our results, levels of activity, performance or achievements to be materially different from the information expressed or implied by the forward-looking statements. Such statements reflect the current view of our management with respect to future events and are subject to risks, uncertainties, assumptions and other factors (including the risks contained in the section entitled “Risk Factors” of this Annual Report on Form 10-K) relating to the Company’s industry, its operations and results of operations, and any businesses that may be acquired by it. These factors include:
| · | our rate of growth in the global multilingual content delivery industry; | |
| · | our ability to effectively manage our growth; | |
| · | lack of acceptance of any existing or new solutions we offer; | |
| · | our ability to continue increasing the number of our customers or the revenues we derive from our recurring revenue customers; | |
| · | economic weakness and constrained globalization spending by businesses operating in international markets; | |
| · | our ability to effectively develop new solutions that compete effectively with the solutions that our current and future competitors offer; | |
| · | risk of increased regulation of the Internet and taxes imposed on business conducted via the Internet; | |
| · | our ability to identify attractive acquisition opportunities, successfully negotiate acquisition terms and effectively integrate any acquired companies or businesses; |
- 2 -
| · | availability of capital on acceptable terms to finance our operations and growth; | |
| · | risks of conducting international commerce, including foreign currency exchange rate fluctuations, changes in government policies or regulations, longer payment cycles, trade restrictions, economic or political instability in foreign countries where we may increase our business and reduced protection of our intellectual property; | |
| · | our ability to add sales and marketing, research and development or other key personnel who are able to successfully sell or develop our solutions; and | |
| · |
other risk factors included under “Risk Factors” in this Annual Report on Form 10–K.
|
Should one or more of these risks or uncertainties materialize, or should the underlying assumptions prove incorrect, actual results may differ significantly from those anticipated, believed, estimated, expected, intended or planned. Although our management believes that the expectations reflected in the forward-looking statements are reasonable, it cannot guarantee future results, levels of activity, performance or achievements. Except as required by applicable law, including the securities laws of the United States, Sajan does not intend to update any of the forward-looking statements to conform these statements to actual results.
Sajan is a leading provider of language translation solutions. According to research completed by Common Sense Advisory (“CSA”), we were ranked as having the 8th highest revenue out of approximately 4,000 North American translation service providers in 2014. Our customers sell products into global markets and use our solutions to translate sales and marketing materials, packaging, user manuals, technical support and training documents, product manuals, instructions, warnings, and other product information into numerous languages. We combine our internally developed proprietary technology and high quality translation services to provide language translation solutions that are fast, reliable, and user-friendly. By utilizing an integrated technology and service-based approach to language translation, we offer comprehensive solutions that allow customers to rely upon a single provider to meet all of their language translation needs. Our cloud-based technology delivers a secure online solution that can be offered on a modular basis, which makes it attractive in both small business settings and large enterprise environments. Sajan provides language translation services and technology solutions to companies located throughout the world, particularly in the technology, consumer products, medical and life sciences, financial services, manufacturing, and retail industries. We are located in River Falls, Wisconsin and have wholly-owned subsidiaries in Ireland (“Sajan Software”), Spain (“Sajan Spain”) and Singapore (“Sajan Singapore”).
Products and Services
Sajan delivers translated content to its customers for use on their websites and in their software products, training and instruction manuals, marketing materials, legal documents, as well as for many other uses. Our solution does not alter the customer’s content, but creates value for the customer by delivering that content translated in multiple languages. By combining advanced technology, innovative processes and a pronounced commitment to quality, our solutions are built to deliver translated content that meets customers’ quality expectations in a faster timeframe and at a lower overall cost than comparable translation solutions.
Our language translation solution incorporates innovative technology that serves as a single platform to meet the needs of the smallest user to the largest enterprise customer. Our solution is cloud-based and requires no installed software, thus enabling customers to access all of our translation lifecycle components via an internet browser. We combine both language translation services and our own proprietary technology to give customers a single source solution to meet all of their translation needs. We integrate people, processes and data into a service and technology solution that produces measurable value in the form of lower costs, faster turnarounds, improved business process automation, higher quality, integrated version control and an audit trail.
Transplicity is the brand name of Sajan’s unique technology solution. Launched in March 2013, Transplicity provides a high degree of automation from start to finish and delivers complete personalization and flexibility to our customers, all from a complete cloud solution. The Transplicity platform not only incorporates modernized technological capabilities, but also provides a fully personalizable user interface aimed at enhancing customer use and interaction.
- 3 -
Sajan released SiteSyncÔ in late 2014. SiteSync is a technology component that automates global website translation and ongoing management. Simply, it pulls in content from a source language website and, by integrating into Transplicity, it performs the translation of all content. Once published, as source content changes, SiteSync detects this and automatically begins the translation process. This solution results in faster updates to website content and a lower total cost of ownership for any company managing multilingual websites.
We employ a “widget” approach to the work surface of Transplicity’s customer portal. In the context of computing, widgets are discrete applications that can be installed on a website or other user work space that perform specific functions. This approach allows customers to build a customized experience by selecting the features of our product that they wish to employ as visible components on their user interface, and enables a degree of personalization not previously found in the market. Users can quickly modify the functional widgets they use on the work surface. This personalization enables customers to modify the visual theme of the website itself, which allows broad enterprise adoption and branding for a specific company. The personalized widget approach also allows us to provide for additional functions and add them to the existing Transplicity platform on either an enterprise or customized basis.
At the core of Transplicity is Sajan’s patented Translation Data Repository. Data storage in the language translation industry is often referred to as Translation Memory (“TM”). TM is intended to reuse previously translated content and is an effective technology used by many in the industry. However, Transplicity differentiates us from our competitors by contextually indexing all data against an information architecture established for each customer, effectively learning how each customer uses language in its business. Multilingual data managed in Transplicity is used in an operational sense, meaning it is used for each new customer translation project, but Transplicity also serves as a central storage repository for multilingual content that is used for such customer’s future translation projects. The data storage technology also provides confidential separation of customer data, serving as an enterprise solution for high volume multilingual content producers.
As the contextualized database of multilingual content is increased for a customer, more content can be reused from one translation project to the next, and the benefit of reuse to the customer results in cost savings. Content reuse, and in particular contextualized content reuse, directly reduces the amount our customers must pay for translation, because Sajan charges a substantially reduced rate to the customer for translated words generated from the system. As such, our content reuse feature encourages customer retention by providing greater and greater value as a customer continues to use our solution over time. Transplicity also improves the contextual accuracy of translation for a particular customer over time. In addition, reducing the number of words requiring human translation results in faster project cycle times, which we believe is becoming more and more important to global companies in today’s market.
With such a robust and flexible technology solution serving as the base for all language translation, Sajan will continue to expand the solution by adding new value-add widgets meant to enhance the customer’s experience and establish a subscription revenue stream.
The image below illustrates one example of the high-level language translation process:
- 4 -
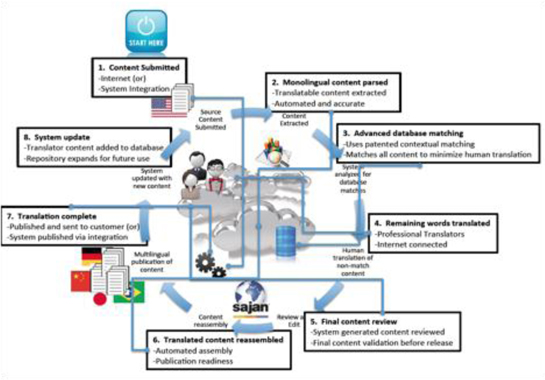
In Step 1, customer content is submitted to us over our secure Internet portal. In Step 2, Transplicity automatically parses or separates content from its aesthetic formatting. This enables us to isolate the monolingual content so that, during Step 3, the maximum amount of accurate reuse can be achieved. During Step 3, we use our patented technology to reproduce previously translated content in the desired target languages and minimize the amount of manual translation that a Professional Translator will have to do. As described above, this creates a substantially better cost model and accelerates the translation process. Further, our patented contextual reuse technology, in most cases, will yield better matching when compared to industry offerings. The remaining steps in the process rely on automation, the efficient management of data and the integration of the Professional Translators into the project. In Steps 4 and 5, Professional Translators translate the content that was not translated through database matching and then review the translated content, including the system-generated content, as a whole. In Steps 6 and 7, the translated content is reassembled by Transplicity and then sent to the customer in publish-ready format. Finally, in Step 8, the content translated by the Professional Translators is added to the database to improve future reuse capabilities. Through these steps, Sajan has turned the process of translation into a data management opportunity and designed a start-to-finish workflow to maximize automation. Content is returned to the customer in the same format, now translated, as originally submitted in the source language. This helps the customer by eliminating the need to understand appropriate language or word breaks. It is a turn-key approach.
Upon successful delivery to the customer we have accomplished the following: first, and most importantly, the customer has obtained their translated content in publish-ready format; second, the new translated data has been added to our central TM repository in the cloud, which will enhance the reuse opportunities in connection with that customer’s future content; and third, because the entire process has been managed from start to finish in one cloud-based system, the customer gains transparency and real-time access to information, while also receiving full business intelligence from process detail to linguistic evaluation. This business intelligence allows customers to track patterns and trends of the many individual users of the system to make more informed decisions about their approach to translation. In addition, linguistic quality can be systematically managed to standards set by the customer, thus allowing better management of the human translators involved in the process.
While technology serves as a value-add component to our solution, we also provide our customers with a broad array of supporting solutions for clients. We can provide customers with expert-level consultation. As an example of these consultation services, Sajan provides customers facing large translation challenges with a Localization Assessment, which involves a deep assessment of the presence or absence of all people, processes and technologies relating to the global translation needs of a given customer. Knowing the desired end goal of the customer, Sajan’s consulting professionals are able to develop a data-driven implementation plan for the customer’s localization efforts. Often return-on-investment formulas are included to address the business case for implementing these changes. Other examples of our services include machine translation solutions, multilingual search engine optimization, linguistic quality assessment, internationalization assessments, and interpretation.
- 5 -
We also believe that over time, the market will continue to move towards more technology solutions as language demands increase and greater efficiency is required. Our experience has been that high quality translation service has been offered on the service model and not on a subscription software model. To address this gap in the market, we will continue to expand our technology capabilities in parallel with our core solution offering as we advance forward. In that regard, our March 2013 launch of Transplicity was the first of what we expect to be a multi-phase release. While the goal of the first phase was to enhance both performance and customer experience in the context of the translation service model, the later phases of the release will offer similar widget-based features and technology components to customers that may prefer to be end-user licensees of Transplicity on a subscription software model. This will differentiate us from currently-available solutions by giving customers the ability to blend the technology and service aspects of the solution as they see fit. By comparison, the few technology-only solution options in the market today are not paired with the availability of services that we offer. The combination of Sajan’s unique technology, expert language skills and customer first philosophy positions us well for future growth in an opportune market.
Market Description
Language is often a barrier in global commerce. The demand for effective language translation continues to grow. The industry has historically been very service-centric, but, as is the case in many service industries, price pressures and other market demands impose the need for innovation and new solution paradigms.
Language translation services, although often treated like a commodity service, have historically been expensive and labor intensive and, as a result, scalability is difficult for the rapidly growing global company. Human translators can typically translate 2,500 words per day on average, although this varies based on the complexity of the subject matter. This creates constraints on the available supply of translation services and, when positioned against growing demand, provides translation technology innovators with an advantage. As a result of the rising demand for translation services and the looming shortage of human translators worldwide, we expect the pricing environment for Language Service Providers (“LSPs”) to be favorable in the coming years.
The market has two distinct components to it. The largest market segment is the LSP component, which consists of companies that provide translation services. The second market component is the technology segment, which consists of companies that develop software to automate the translation process. As measured by industry revenue, the technology segment is currently a substantially smaller part of the total language translation market opportunity.
In theory, the language translation service market should shrink if technology offers improved content reuse. To compete effectively, language translation companies need to obtain translation in an accurate, timely, and cost effective manner. With advances in content management and the growth of the Internet, providers also need to integrate their multilingual content with other enterprise systems to establish a cohesive single repository of global content.
Content is no longer monolingual content; it is multilingual. Industry and general business analysts have indicated that a more integrated solution, often referred to as the Global Content Lifecycle, will be required to be successful in the future for both global enterprises and for the LSPs that support them. As a result, language translation is no longer likely to be treated as an afterthought in the globalization process, but rather as an integral part of an enterprise system. Further, as the annual spending by multinational companies for language translation solutions accelerates over the next several years, we believe a more technology-based solution will be required to keep pace with the rate of growth in the amount of content and increasingly sophisticated content management solutions.
Global website management is an aggressive and expanding area of the market. Often, a website is the first element of a global expansion strategy. There are a few ways to translate websites effectively. For those customers who manage their monolingual web content in a Content Management System (“CMS”), Transplicity can directly connect to automate the flow of content which requires translation.
- 6 -
Alternatively, if a customer does not use a CMS a very effective solution would be Sajan’s SiteSync. SiteSync requires no CMS and, as mentioned in the Product and Services section above, can make the process very easy and efficient for customers adding global websites.
Market Size
Research completed by Common Sense Advisory (“CSA”) confirms that the language translation market continues to grow. According to CSA’s research, the worldwide cost of global multilingual content delivery in 2014 was $37 billion and is expected to reach $50 billion by 2019.
The LSP network is extremely fragmented. Approximately two-thirds of the total provider universe employs fewer than five employees. The market consists largely of traditional LSPs, meaning that these language service providers are very good at providing language translation service, but do not necessarily offer technological solutions, which are becoming more and more vital.
The top 100 providers based on revenue accounted for 15% of the total market opportunity at December 31, 2014. In the latest CSA survey, based on 2014 revenue, Sajan is ranked as the 32nd largest provider in the world and 8th largest in North America.
LSPs with a worldwide presence also have a distinct advantage in their ability to provide 24/7 services to their international customers. According to CSA’s market research, the breakdown of 2014 language services revenue by geographical region is as follows:
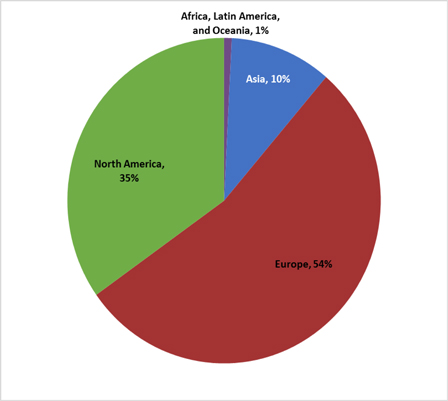
The ability of a traditional LSP to compete is growing more challenging. While demand for the service is forecasted to be rising, the buyers currently are demanding that providers hold or reduce prices. Without technological differentiation, traditional LSPs will continue to operate at a severe disadvantage in their ability to manage the cost of their delivered service. Just as importantly they will be challenged to integrate their solutions with content management systems and other enterprise class business systems used by their customers.
- 7 -
Competition
The global multilingual content delivery market is highly competitive and highly fragmented with numerous existing competitors. We believe the principal competitive factors in providing language translation solutions consist of the ability to provide a comprehensive solution to customers, infrastructure that supports cost effective and high quality delivery to customers, project management expertise, quality, speed of service delivery and corporate reputation. We believe that Sajan competes favorably with respect to these factors and that we have developed a strong reputation in our industry.
Categorically speaking, the LSP component is much larger than the technology provider component. As noted previously, we believe that the technology component will rise in coming years as demand rises and the language service model strains as it grows. The competitive market is made up of LSPs who emphasize primarily a service solution, Language Technology providers who offer a variety of tools ranging from workflow automation, project management and database applications and lastly, those companies, like Sajan, that provide a blend of both.
As previously stated, the top 100 providers accounted for approximately 15% of the total market opportunity at December 31, 2014. The level of fragmentation and small concentration of larger providers gives some insight into the broader market’s ability to innovate. In most cases, this larger by quantity, smaller by revenue market segment does not produce the revenue and profit for adequate investment in technology or other forms of innovation. In the face of rising demand, we believe this lack of investment in technology will prove to be a long-term challenge and foster further market consolidation.
We believe that only a very small number of the largest LSPs, such as SDL, Transperfect and Lionbridge, provide legitimate full featured technology offerings and the breadth of solutions to meet the larger, more complex buyer.
Pure technology companies such as XTM International, MemoQ, Across and Smartling provide both the end customer and other LSPs a variety of technology solutions. A challenge that each of these companies face is that many buyers require more than a tool to address one particular area of the process. Two things weigh on this: (1) a technology solution must be broad enough to address an enterprise customer’s needs, and (2) the market for the technology is limited to those customers that have the staff to consider language translation as a core company competency.
We believe that Sajan is well positioned and is unique when compared to those companies noted above. Sajan offers a complete solution and our Transplicity platform spans the full spectrum of business processes. Recent solution additions such as SiteSync have furthered strengthened Sajan’s overall technology solution. This means that customers will not have to adapt or integrate disparate technologies. Sajan’s patented contextual indexing technology enables Sajan to perform in a superior manner by providing customers with reuse of words, speed and quality.
Marketing and Sales
Substantially all of our revenues have been generated through our internal direct sales force and the efforts of our senior management team. As of December 31, 2015, we had 7 marketing professionals, 14 direct sales professionals in the United States and Europe, and 4 employees in our professional service group.
Our sales force has developed valuable customer relationships. Our sales approach involves planning for a customer organization’s unique ongoing requirements, including future versions of products and ongoing support, maintenance and training related to both technology products and content. We believe that tailoring our solutions to the customer’s preference results in gaining a larger portion of their language translation business.
Customers
All of our customers sell products outside the United States and require content such as warnings, instructions, directions, and other information to be translated into a number of languages. Although our services fit the needs of businesses of all sizes, our customers are predominantly Fortune 1000 companies in the technology, medical, industrial, and manufacturing sectors. Most of our customers are located in the United States. We anticipate that the percentage of our customers located outside of the United States will increase as we expand our sales efforts and as Sajan hires additional sales personnel.
- 8 -
Major Customers
We derive a significant portion of our revenues from a limited number of large customers. In 2015 and 2014, we had one customer, IBM, that accounted for 8% and 12% of our revenues, respectively. On a combined basis, 53% of our revenue in 2015 and 54% of our revenue in 2014 came from our ten largest customers.
Geographic Areas of Operations
We generate revenues worldwide. In 2015, 76% of our revenues were generated within the United States and 24% were generated internationally. Currently, no foreign country accounts for more than 10% of our revenue.
Intellectual Property
The development, utilization, and protection of technology are an important component of our overall operating strategy. We have a patent from the U.S. Patent and Trademark Office covering aspects of our Transplicity solution which expires in 2021. We have not filed any applications for patent protection in any country other than the United States. As a result, we do not and will not have the right to enforce our rights under our United States patent in any foreign country or to prevent others in foreign countries from utilizing our proprietary technology covered by that patent. We may apply for patent protection on our future technology developments to the extent we believe such protection is available and economically warranted. Despite these efforts, others could independently develop technology that is similar to our technology or offer or sell products or services in foreign countries that use our technology.
We have registered and use domain names sajan.com, authoringcoach.com, and sajansoftware.com. We use, or intend to use, and claim rights to various trade names and trademarks to identify our language translation services and products. We have obtained a registered U.S. mark for the Sajan logo. We also use and claim rights to the “Sajan™”, “GCMS™”, “Transplicity™”, “SiteSync™”, “X-Content Integration™”, “TMate™”, and “Authoring Coach™” marks.
We intend to protect our intellectual property to the extent such protection is warranted. In addition to efforts to obtain patent and trademark rights, we rely on a combination of trade secret, license, and non-disclosure and other contractual agreements and copyright laws to protect our intellectual property rights. Existing trade secret and copyright laws afford us only limited protection. We enter into confidentiality agreements with our employees and contractors, and limit access to and distribution of our proprietary information. These arrangements may not be adequate to deter misappropriation of our proprietary information and we may not be able to detect unauthorized use and take appropriate steps to enforce our intellectual property rights.
Research and Development
Our research and development occurs at our offices in River Falls, Wisconsin and Dublin, Ireland. We spent $1,688,000 in 2015 and $1,671,000 in 2014 on research and development. Research and development expenses consist primarily of wages and benefits for product strategy and development personnel. We have focused our research and development efforts on the industrialization of the Transplicity platform and its component modules for use by the various participants involved in the content globalization process. Functional development has focused on improving ease of use, functionality, scalability and efficiency of Translation Memory processing.
Employees
As of December 31, 2015, we had 142 full-time employees. Our employees include software development engineers, project managers and language specialists, as well as sales and marketing, quality assurance and administrative team members. We have 89 employees in our River Falls, Wisconsin office, 5 employees that work from their home offices in the United States, 30 employees in our Dublin, Ireland office, 2 employees that work from their home offices in France, 1 employee that works from their home office in the Netherlands, 12 employees in our Madrid, Spain office and 3 employees in our Singapore office. None of our employees are covered by a collective bargaining agreement. We consider our relationship with our employees to be good. In addition, we utilize the services of approximately 3,500 human translators, all of whom are either independent contractors or who work for single language vendors or multiple language vendors, and we utilize consultants to perform short-term project-based services, which is a more cost-effective strategy than hiring additional full-time employees.
- 9 -
Corporate Background
Sajan is a Delaware corporation originally incorporated as MathStar, Inc. in June 2005. On February 23, 2010, MathStar, Inc. completed its business combination with Sajan, Inc., a Minnesota corporation, in accordance with the terms of an Agreement and Plan of Merger, dated January 8, 2010. On February 26, 2010, MathStar, Inc. changed its name to Sajan, Inc.
You should consider the following risk factors, in addition to the other information presented or incorporated by reference into this Annual Report on Form 10-K, in evaluating our business and your investment in us.
Investing in the Company’s common stock involves a high degree of risk. Investors and potential investors should carefully consider the following risk factors, together with all of the other information included in this report, before making investment decisions about shares of our common stock. The risks and uncertainties described below are not the only risks and uncertainties facing the Company in the future. Additional risks and uncertainties not presently known or that are currently considered to be immaterial may also materially and adversely affect the Company’s business operations or the stock price of the Company’s common stock. If any of the following risks or uncertainties occurs, the Company’s business, financial condition, operating results and future growth prospects could materially suffer. In that event, the trading price of our securities could decline, and you may lose all or part of your investment.
Our past results may not be indicative of future results, and, therefore, we may be unable to achieve continued growth.
Our revenues in 2015 totaled $29,688,000 and grew 5% compared to our revenues in 2014. Increasing revenues by growing our business operations is a key component of our strategy. These expansion plans have placed and may continue to place significant demands on our management, operational and financial resources. You should not consider our 2015 revenue growth as indicative of our future performance. In future periods, we may not have any revenue growth, or our revenues could decline.
We have incurred operating losses in the past and may incur operating losses in the future.
We had income from operations of $209,000 in 2015, $270,000 in 2014 and $256,000 in 2013. We reported a loss from operations in 2012 of $957,000. Additionally, we reported losses from operations of $423,000 in 2011 and $3,050,000 in 2010. Despite the improved results since 2013, throughout most of our history we have experienced net losses and negative cash flows from operations. We expect our operating expenses to increase in the future as we expand our operations. Furthermore, as a public company, we incur significant legal, accounting and other expenses. If our revenues do not grow to offset these increasing expenses, we may not be profitable. Additionally, we cannot assure you that we will be able to maintain any profitability that we do achieve.
Our continued growth could strain our personnel resources and infrastructure, and if we are unable to implement appropriate controls and procedures to manage our growth, we will not be able to implement our business plan successfully.
We grew our revenues by 5% in 2015 and 18% in 2014. To the extent that we are able to sustain such growth, it will place a significant strain on our management, administrative, operational and financial infrastructure. Our success will depend in part upon the ability of our senior management to manage this growth effectively. To do so, we must continue to hire, train and manage new employees as needed. If our new hires perform poorly, or if we are unsuccessful in hiring, training, managing and integrating these new employees, or if we are not successful in retaining our existing employees, our business would be harmed. To manage the expected growth of our operations and personnel, we will need to continue to improve our operational, financial and management controls and our reporting systems and procedures. The additional headcount we are adding will increase our cost base, which will make it more difficult for us to offset any future revenue shortfalls by reducing expenses in the short term. If we fail to successfully manage our growth, we will be unable to execute our business plan.
- 10 -
We may need additional financing in the future, which may not be available, and any such financing would likely dilute our existing stockholders.
We have a $3,000,000 credit facility with Silicon Valley Bank, which is scheduled to expire on March 28, 2017. We may require additional financing in the future, which could be sought from a number of sources, including, but not limited to, additional sales of equity or debt securities or loans from banks or other financial institutions. There can be no certainty that any such financing will be available to us or, if available, on terms favorable to us. If additional funds are raised by the issuance of our equity securities, such as through the issuance of stock, convertible securities, or the issuance and exercise of warrants, then the ownership interests of our existing stockholders will be diluted. If we raise additional funds by issuing debt or other instruments, we may become subject to certain operational limitations, and such securities may have rights senior to those of our common stock. If adequate funds are not available on acceptable terms, we may be unable to fund our operations or the expansion of our business. Our failure to obtain any necessary financing in a timely manner and on favorable terms could have a material adverse effect on our business strategy and on our financial performance and stock price, and could require us to delay or abandon our growth strategy.
We do not have long-term contracts with our customers who provide us with recurring revenue, and our success will depend on our ability to maintain a high level of customer satisfaction and a strong reputation in the global multilingual content delivery industry.
Our contracts with our customers who provide us with recurring revenue typically allow the customer to cancel the contract for any reason with 30 days’ prior notice to us. Our continued success therefore depends significantly on our ability to meet or exceed the expectations of these customers because most of such customers do not make long-term commitments to use our solutions. In addition, if our reputation in the global multilingual content delivery industry is harmed or diminished for any reason, this may cause our recurring revenue customers to terminate their relationships with us on short notice and seek alternative globalization and translation solutions. If a significant number of recurring revenue customers terminate their relationships with us, our business, results of operations and financial condition would be adversely affected in a short period of time.
We rely on a limited number of customers, and the loss of or reduction in revenue from a major customer could negatively affect our business, financial condition and operations.
We derive a significant portion of our revenues from a limited number of large customers. In 2015 and 2014, we had one customer, IBM, that accounted for 8% and 12% of our revenue, respectively. On a combined basis, 53% of our revenue in 2015 and 54% of our revenue in 2014 came from our ten largest customers. The loss of any major customer or a significant reduction in a large customer’s use of our language translation solutions could materially reduce our revenue and cash flow and adversely affect our business, financial condition and operations.
Continued global economic weakness and uncertainty could adversely affect our revenue, lengthen our sales cycle and make it difficult for us to forecast operating results accurately.
Our revenues depend significantly on general economic conditions and the health of large companies that sell products internationally. Economic weakness and constrained globalization spending may result in slower growth or reductions in our revenue in 2016. We have experienced, and may experience in the future, reduced spending in our business due to the current financial turmoil affecting the U.S. and global economy and other macroeconomic factors affecting spending behavior. Uncertainty about future economic conditions makes it difficult for us to forecast operating results and to make decisions about future investments. In addition, economic conditions or uncertainty may cause current and potential customers to reduce or delay globalization expenditures, including purchases of our solutions. Our sales cycle may lengthen if purchasing decisions are delayed as a result of uncertain information technology or contracted development budgets or if contract negotiations become more protracted or difficult as customers institute additional internal approvals for globalization and information technology purchases. Delays or reductions in globalization and information technology spending could have a material adverse effect on demand for our software and services, and consequently on our business, financial condition and results of operations.
- 11 -
If we are unable to attract new customers or sell additional solutions, or if our customers do not increase their use of our solutions, our revenue growth and profitability will be adversely affected.
To increase our revenues and maintain profitability, we must regularly add new customers and sell additional solutions, and our customers must increase their use of our solutions that they currently utilize. We intend to grow our business by hiring additional inside sales personnel and increasing our marketing activities. If we are unable to hire or retain quality sales personnel, convert customer prospects into paying customers, or ensure the effectiveness of our marketing programs, or if our existing or new customers do not perceive our solutions to be of sufficiently high value and quality, we might not be able to increase revenues, and our operating results will be adversely affected. In addition, if we fail to sell our new solutions to existing or new customers, we will not generate anticipated revenues from these solutions, our operating results will suffer and we might be unable to grow our revenues or achieve or maintain profitability.
Our strategy includes pursuing acquisitions, and our potential inability to successfully integrate newly-acquired companies, businesses or technologies may adversely affect our financial results.
We believe part of our growth will be driven by acquisitions of other companies or their businesses or technologies. We have in the past and may in the future expend funds and resources on uncompleted acquisitions. If we complete other acquisitions, we face many risks commonly encountered with growth through acquisitions, including:
| · | incurring significantly higher than anticipated capital expenditures and operating expenses; |
| · | failing to assimilate the operations and personnel of the acquired company or business; |
| · | loss of customers that were obtained in the acquisition; |
| · | disrupting our ongoing business; |
| · | dissipating our management resources; |
| · | failing to maintain uniform standards, controls and policies; and |
| · | impairing relationships with employees and customers as a result of changes in management. |
Fully integrating other acquired companies, businesses or technologies into our operations may take a significant amount of time. We cannot assure you that we will be successful in overcoming these risks or any other problems encountered with acquisitions. To the extent we do not successfully avoid or overcome the risks or problems related to any acquisitions, our results of operations and financial condition could be adversely affected. Future acquisitions also could impact our financial position and capital needs, and could cause substantial fluctuations in our quarterly and yearly results of operations. In addition, future acquisitions could include significant goodwill and intangible assets, which may result in future amortization or impairment charges that would reduce our stated earnings.
Our inability to adapt to rapid technological change could impair our ability to remain competitive.
The global multilingual content delivery industry in which we compete is characterized by rapid technological change, introductions of new products and evolving industry standards. Our ability to attract new customers and increase revenues from customers will depend in significant part on our ability to anticipate industry standards and to continue to enhance existing solutions or introduce or acquire new solutions on a timely basis to keep pace with technological developments. The success of any enhancement or new solution depends on several factors, including the timely completion, introduction and market acceptance of any enhancement to our solution. Any new solution we develop or acquire might not be introduced in a timely or cost-effective manner and might not achieve the broad market acceptance necessary to generate significant revenues. If any of our competitors implements new technologies before we are able to implement them, those competitors may be able to provide more effective solutions than ours at lower prices. Any delay or failure in the introduction of new or enhanced solutions could adversely affect our business, results of operations and financial condition.
- 12 -
If our solutions are not accepted by the market, our business will not grow and we will not be profitable.
Our market is intensely competitive, and we expect competition to increase in the future from established competitors, consolidations and new market entrants. Competitors’ solutions may in the future perform better or faster, offer better features, or be offered at lower prices than our solutions, including Transplicity, our translation management system, or embody new technologies, which could render our existing solutions obsolete or less attractive to customers. In addition, our competitors have existing relationships with many of the companies that are in our target market. These existing relationships will make it difficult for us to convince such prospective customers to choose our solutions, even if our solutions are competitive with or superior to those of our competitors. In addition, our proposed technology solution approaches translation from a subscription software model, rather than a services model, which is a model that potential customers have not been receptive to in the past and may not be receptive to in the future. If our solutions do not gain broad market acceptance and maintain that acceptance, our business, results of operations and financial condition will be adversely affected.
Our business may be harmed by defects or errors in the services we provide to customers.
Many of the services we provide are critical to the business operations of our customers. While we maintain general liability insurance, including coverage for errors and omissions, defects or errors in the services we provide could interrupt our customers’ abilities to provide products and services to their customers, resulting in delayed or lost revenue. This could damage our reputation through negative publicity, make it difficult to attract new and retain existing customers, and cause customers to terminate our contracts and seek damages. We may incur additional costs to correct errors or defects. There can be no assurance that our general liability and errors and omissions insurance coverage will be available in amounts sufficient to cover one or more large claims, or that the insurer will not disclaim coverage as to any future claims.
An interruption or failure of our information technology and communications systems could impair our ability to effectively provide our services, which could damage our reputation and business.
The provision of our services depends on the continuing operation of our information technology and communications systems. Any damage to or failure of our systems could result in interruptions in our services. Interruptions in our services could reduce our revenues and profits, and the Sajan brand could be damaged if people believe our system is unreliable. Our systems are vulnerable to damage or interruption from terrorist attacks, floods, tornados, fires, power loss, telecommunications failures, cyber security breaches, and computer viruses or attempts to harm our systems. Our data centers may be subject to break-ins, sabotage and intentional acts of vandalism, and to other potential disruptions. Some of our systems may not be fully redundant, and our disaster recovery planning may not be able to account for all eventualities. The occurrence of a natural disaster, a decision to close a facility we are using without adequate notice for financial reasons, or other unanticipated problems at our data centers could result in lengthy interruptions in our services. Any unscheduled interruption in our service will put a burden on the entire organization and would result in an immediate loss of revenue. If we experience frequent or persistent system failures on our web site, our reputation and the Sajan brand could be permanently harmed. The steps required to increase the reliability and redundancy of our systems are expensive, will reduce our operating margins, and may not be successful in reducing the frequency or duration of unscheduled downtime.
The intellectual property of our customers may be damaged, misappropriated, stolen, or lost while in our possession, subjecting us to litigation and other adverse consequences.
In the course of providing globalization and language translation services to our customers, we take possession of or are granted access to certain intellectual property of our customers. If such intellectual property is damaged, misappropriated, stolen, or lost, we could suffer, among other consequences:
| · | claims under indemnification provisions in customer agreements or other liability for damages; |
| · | delayed or lost revenue due to adverse customer reaction; |
| · | negative publicity; and |
| · | litigation that could be costly and time consuming. |
Any adverse impact attributable to any of the foregoing factors would have a material adverse effect on our business and revenues.
- 13 -
We rely on third parties for key aspects of the process of providing services to our customers, and any failure or interruption in the services provided by these third parties could harm our ability to operate our business and damage our reputation.
We rely on third-party vendors, including data center and bandwidth providers, and we also rely on third parties for key aspects of the process of providing language translation services to our customers. Our revenues and margins are subject to our ability to continue to maintain satisfactory relationships with freelance linguists, who are in high demand worldwide for specific languages. Any disruption in the network access or co-location services provided by these third-party providers or any failure of these third-party providers and freelance linguists to handle current or higher volumes of use could significantly harm our business. Any financial or other difficulties the providers face may have negative effects on our business, the nature and extent of which cannot be predicted. We exercise little control over these third party vendors, which increases our vulnerability to problems with the services they provide. We also license technology and related databases from third parties to facilitate aspects of our translation processes and our data center and connectivity operations including, among others, Internet traffic management and search services. Any errors, failures, interruptions or delays experienced in connection with these third-party technologies and information services could negatively impact our relationships with customers and adversely affect the Sajan brand, and could expose us to liabilities to third parties.
Evolving regulation of the Internet may increase our expenditures related to compliance efforts, which may adversely affect our financial condition.
As Internet commerce continues to evolve, increasing regulation by federal, state or foreign agencies becomes more likely. We are particularly sensitive to these risks because the Internet is a critical component of our on-demand business model. In addition, taxation of services provided over the Internet or other charges imposed by government agencies or by private organizations for accessing the Internet may be imposed. Any regulation imposing greater fees for Internet use or restricting information exchange over the Internet could result in a decline in the use of the Internet and the viability of Internet-based services, which could harm our business.
We depend on intellectual property rights to protect proprietary technologies, although we may not be able to successfully protect these rights.
We rely on our proprietary technology to enhance our software and service offerings. We use a combination of patent, trademark, trade secret and copyright law in addition to contractual restrictions to protect our technology. Although we have received a patent from the U.S. Patent and Trademark Office covering certain aspects of our technology, there can be no assurance that this patent will adequately protect our technology or provide us with a competitive advantage. We may apply for patent protection on our future technology developments to the extent we believe such protection is available and economically warranted. However, there is no assurance that we will file additional applications for patent protection in the United States or in other countries, that any application that we may file will result in an issued patent, or that any issued patent will provide us with a competitive advantage. We have not filed any applications for patent protection in any country other than the United States. As a result, we do not have the right to enforce our rights under any United States patent, if issued, in any foreign country, or to prevent others in foreign countries from utilizing the proprietary technology covered by our patents. Despite our efforts, there can be no assurance that others will not independently develop technology that is similar to our technology or offer or sell products or services in foreign countries that utilize our technology. The development by others of technology that is similar to our technology, or the sale of products or services in foreign countries that incorporate our technology, would harm our competitive position and have a material adverse effect on our business, results of operations and financial condition.
We may be involved in disputes from time to time relating to our intellectual property and the intellectual property of third parties.
We may become parties to disputes from time to time over rights and obligations concerning intellectual property, and we may not prevail in these disputes. Third parties may raise claims against us alleging infringement or violation of the intellectual property of that third party. Some third party intellectual property rights may be extremely broad, and it may not be possible for us to conduct our operations in such a way as to avoid violating those intellectual property rights. Any such intellectual property claim could subject us to costly litigation and impose a significant strain on our financial resources and management personnel regardless of whether such claim has merit. Our liability insurance, if any, may not cover potential claims of this type adequately or at all, and we may be required to alter products or pay monetary damages or license fees to third parties, which could have a material adverse effect on our financial condition and results of operations.
- 14 -
The markets in which we operate are highly competitive, and our failure to compete successfully would make it difficult for us to add and retain customers and would reduce or impede the growth of our business.
The markets for global multilingual content delivery software and services are increasingly competitive and global. We expect competition to increase in the future both from existing competitors and new companies that may enter our markets. In addition to our existing competitors, we may face competition in the future from companies that do not currently offer globalization or translation services. We may also face competition from internal globalization departments of Fortune 1000 and large emerging companies. Technology companies, information technology services companies, business process outsourcing companies, web consulting firms, technical support call centers, hosting companies and content management providers may choose to broaden their range of services to include globalization or language translation as they expand their operations internationally. Increased competition could result in pricing pressure, reduced sales, lower margins or the failure of our solutions to achieve or maintain broad market acceptance. New or established competitors may offer solutions that are superior to or lower in price than ours. We may not have sufficient resources to continue the investments in all areas of software development and marketing needed to maintain our competitive position. In addition, some of our competitors are better capitalized than us, which may provide them with an advantage in developing, marketing or servicing new solutions. Increased competition could reduce our market share, revenues and operating margins, increase our costs of operations and otherwise adversely affect our business.
If we fail to retain our Chief Executive Officer and other key personnel, our business would be harmed and we might not be able to implement our business plan successfully.
Given the complex nature of the technology on which our business is based and the speed with which such technology advances, our future success is dependent, in large part, upon our ability to attract and retain highly qualified managerial, technical and sales personnel. In particular, Shannon Zimmerman, our President and Chief Executive Officer, is critical to the management of our business and operations. Competition for talented personnel is intense, and we cannot be certain that we can retain our managerial, technical and sales personnel or that we can attract, assimilate or retain such personnel in the future. Our inability to attract and retain such personnel could have an adverse effect on our business, results of operations and financial condition.
Because our long-term success depends, in part, on our ability to expand the sales of our solutions to customers located outside of the United States, our business will be susceptible to risks associated with international operations.
We have limited experience operating in foreign jurisdictions. In 2009, we opened Sajan Software in Dublin, Ireland, in 2010 we opened Sajan Spain, and in 2011 we opened Sajan Singapore. Our inexperience in operating our business outside of North America increases the risk that our current and any future international expansion efforts will not be successful. Conducting international operations subjects us to risks that, generally, we have not faced in the United States, including:
| · | fluctuations in currency exchange rates; |
| · | unexpected changes in foreign regulatory requirements; |
| · | longer accounts receivable payment cycles and difficulties in collecting accounts receivable; |
| · | difficulties in managing and staffing international operations; |
| · | potentially adverse tax consequences, including the complexities of foreign value-added tax systems and restrictions on the repatriation of earnings; |
| · | the burdens of complying with a wide variety of foreign laws and different legal standards, including laws and regulations related to privacy; |
| · | increased financial accounting and reporting burdens and complexities; |
| · | political, social and economic instability abroad, and terrorist attacks and security concerns in general; and |
| · | reduced or varied protection for intellectual property rights in some countries. |
- 15 -
The occurrence of any one of these risks could negatively affect our international business and, consequently, our results of operations generally. Additionally, operating in international markets also requires significant management attention and financial resources. We cannot be certain that the investment and additional resources required in establishing, acquiring, operating or integrating operations in other countries will produce desired levels of revenues or profitability.
Compliance with public company regulatory requirements, including those relating to our internal control over financial reporting, have and will likely continue to result in significant expenses and, if we are unable to maintain effective internal control over financial reporting in the future, investors may lose confidence in the accuracy and completeness of our financial reports and the market price of our common stock may be negatively affected.
As a public reporting company, we are subject to the Sarbanes-Oxley Act of 2002 as well as to the information and reporting requirements of the Securities Exchange Act of 1934, as amended, and other federal securities laws. As a result, we incur significant legal, accounting, and other expenses, including costs associated with our public company reporting requirements and corporate governance requirements. As an example of public reporting company requirements, we evaluate the effectiveness of disclosure controls and procedures and of our internal control over financing reporting in order to allow management to report on such controls. In addition, any updates to our finance and accounting systems, procedures and controls, which may be required as a result of our ongoing analysis of internal controls, or results of testing by our independent auditor, may require significant time and expense. As a company with limited accounting resources, a significant amount of management’s time and attention has been and will continue to be diverted from our business to ensure compliance with these regulatory requirements. This diversion of management’s time and attention may have a material adverse effect on our business, financial condition and results of operations.
Management works to continuously monitor and improve its internal controls over financial reporting. Although we have never had a significant deficiency or material weakness, in the event significant deficiencies or material weaknesses are identified in our internal control over financial reporting that we cannot remediate in a timely manner, investors and others may lose confidence in the reliability of our financial statements and the trading price of our common stock and ability to obtain any necessary equity or debt financing could suffer. This would likely have an adverse effect on the trading price of our common stock and our ability to secure any necessary additional equity or debt financing, and could result in the delisting of our common stock from the NASDAQ Capital Market, which would severely limit the liquidity of our common stock.
An active trading market in our common stock may not develop or be adequately maintained, and our common stock may be subject to volatile price and volume fluctuations.
An active trading market in our common stock may not develop or be adequately maintained. Although our shares are listed on the NASDAQ Capital Market, the overall market for securities in recent years has experienced extreme price and volume fluctuations that have particularly affected the market prices of many smaller companies. These fluctuations have been extremely volatile and are often unrelated or disproportionate to operating performance. Consequently, you may not be able to sell our common stock at prices equal to or greater than the price you paid for your shares. In addition to the factors discussed elsewhere in this section, many factors, most of which are outside of our control, could cause the market price of our common stock to decrease significantly, including variations in our quarterly operating results; decreases in market valuations of similar companies; the failure of securities analysts to cover our common stock or changes in financial estimates by analysts who cover us, our competitors or our industry; and fluctuations in stock market prices and volumes. These broad market fluctuations could result in extreme fluctuations in the price of our common stock, which could cause a decline in the value of our common stock.
- 16 -
We may be unable to continue to list our securities on the NASDAQ Capital Market, which could limit investors’ ability to make transactions in our securities and subject stockholders to additional trading restrictions.
Up until September 4, 2014, our common stock was quoted on the OTCQB Marketplace. Since September 4, 2014, our common stock has been listed on the NASDAQ Capital Market. However, there can be no assurance, that we will continue to meet the continued listing requirements of the NASDAQ Capital Market. If we do not meet such requirements, our securities may be re-quoted on the OTCQB Marketplace after delisting from the NASDAQ Capital Market.
If we are unable to cause our securities to continue to be listed on the Nasdaq Capital Market, we and our stockholders could face significant material adverse consequences, including:
| · |
a limited availability of market quotations for our securities; |
| · |
a determination that our common stock is a “penny stock,” which will require brokers trading in our common stock to adhere to more stringent rules, possibly resulting in a reduced level of trading activity in the secondary trading market for our common stock; |
| · |
a limited amount of news and analyst coverage; and |
| · | a decreased ability to issue additional securities or obtain additional financing in the future. |
Current members of our management own a significant percentage of the outstanding shares of our common stock, which could limit other stockholders’ influence on corporate matters.
Shannon Zimmerman, who is a director and executive officer, and Angela Zimmerman, who is a director, collectively own approximately 27% of the outstanding shares of our common stock. Accordingly, these individuals are able to exert substantial influence over our affairs, including the election and removal of directors and all other matters requiring stockholder approval, including any future merger, consolidation or sale of our company. This concentrated control could discourage others from initiating any potential merger, takeover, or other change-of-control transactions that may otherwise be beneficial to our stockholders. Furthermore, this concentrated control will limit the practical effect of the stockholders’ participation in our corporate matters, through stockholder votes and otherwise. As a result, the return on investment in our common stock through the sale of shares could be adversely affected.
ITEM 1B. UNRESOLVED STAFF COMMENTS
None.
Our primary operations are based in River Falls, Wisconsin, which is located approximately 30 miles east of Minneapolis, Minnesota. We lease approximately 20,000 square feet of office space from River Valley Business Center, LLC (“RVBC”) under three leases, which expire in January 2017. Rent for these facilities was $344,000 in 2015. RVBC is a “related person” as defined in Item 404 of Regulation S-K promulgated by the SEC because it is controlled by Shannon Zimmerman, who is a director and executive officer of the Company, and Angela Zimmerman, who is a director of the Company.
Sajan Software leases approximately 3,300 square feet of office space in Dublin, Ireland. Sajan Spain leases approximately 3,600 square feet of office space in Madrid, Spain. Sajan Singapore leases approximately 600 square feet of space in Singapore, Singapore. In 2015, combined rents for these facilities were $126,000. We believe all of our facilities are suitable and adequate for current operating needs.
We may be subject to legal actions, proceedings and claims in the ordinary course of business. As of the date of this report, management is not aware of any undisclosed actual or threatened litigation that would have a material adverse effect on our financial condition or results of operations.
| ITEM 4. | MINE SAFETY DISCLOSURES |
Not applicable.
- 17 -
| ITEM 5. | MARKET FOR REGISTRANT’S COMMON EQUITY, RELATED STOCKHOLDER MATTERS AND ISSUER PURCHASES OF EQUITY SECURITIES |
Since September 4, 2014, our common stock has been listed on the NASDAQ Capital Market under the symbol “SAJA”. The last reported sales price for our common stock on March 8, 2016 was $3.27.
Prior to September 4, 2014, our common stock was quoted on the OTCQB Marketplace under the symbol “SAJA”.
The following table shows the high and low sale prices (for all dates subsequent to the Reverse Stock Split) and high and low bid prices (for all dates prior to the Reverse Stock Split) for our common stock for the 2015 and 2014 fiscal quarters. The high and low bid prices reported on the OTCQB Marketplace reflect inter-dealer prices, without retail mark-up, mark-down or commission and may not necessarily reflect actual transactions.
On June 16, 2014, we implemented a 1-for-4 Reverse Stock Split. Share and per share information below for periods prior to June 16, 2014 have been adjusted to reflect the impact of the Reverse Stock Split.
| Market Price (high/low) | ||||||||
| For the Fiscal Year | 2015 | 2014 | ||||||
| First Quarter | $ 5.21 – 6.40 | $ 4.48 – 7.00 | ||||||
| Second Quarter | $ 4.80 – 6.26 | $ 5.16 – 6.80 | ||||||
| Third Quarter | $ 4.01 – 6.56 | $ 3.00 – 6.50 | ||||||
| Fourth Quarter | $ 3.34 – 5.04 | $ 5.01 – 7.04 | ||||||
As of March 8, 2016, we had approximately 145 record holders of our common stock, including the nominee of Depository Trust Company which held 3,310,530 shares as the nominee for street name holders.
Dividend Policy
Holders of our common stock are entitled to receive such dividends as are declared by our board of directors out of funds legally available for the payment of dividends. We presently intend to retain any earnings to fund the development of our business and the agreement governing our credit facility restricts our ability to pay dividends. Accordingly, we do not anticipate paying any dividends on our common stock for the foreseeable future. Any future determination as to declaration and payment of dividends will be made at the discretion of our Board of Directors.
Sales of Unregistered Securities
None.
Purchases of Equity Securities by the Company
None.
Equity Compensation Plan Information
See Part III, Item 12, “Security Ownership of Certain Beneficial Owners and Management and Related Stockholder Matters.”
| ITEM 6. | SELECTED FINANCIAL DATA |
As a smaller reporting company, we are not required to provide disclosure pursuant to this item.
- 18 -
|
|
MANAGEMENT’S DISCUSSION AND ANALYSIS OF FINANCIAL CONDITION AND RESULTS OF OPERATIONS |
The following discussion should be read in conjunction with the financial statements and related notes that appear elsewhere in this Annual Report on Form 10-K. This discussion contains forward-looking statements that involve significant uncertainties. Our actual results could differ materially from those anticipated in these forward-looking statements as a result of various factors, including those discussed in “Risk Factors” elsewhere in this report. For further information, see the section titled “Cautionary Notice Regarding Forward-Looking Statements” above.
Discussion of Critical Accounting Policies and Estimates
Discussion of the financial condition and results of our operations is based upon our consolidated financial statements, which have been prepared in accordance with United States generally accepted accounting principles (“GAAP”). The preparation of these consolidated financial statements requires management to make estimates and assumptions that affect the reported amounts of assets, liabilities, revenues, costs and expenses, and related disclosures. On an ongoing basis, we evaluate our estimates and judgments, including those discussed below. These estimates are based on historical experience and on various other assumptions that are believed to be reasonable under the circumstances. The results of our analysis form the basis for making assumptions about the carrying values of assets and liabilities that are not readily apparent from other sources. Actual results may differ from these estimates under different assumptions or conditions, and the impact of such differences may be material to the consolidated financial statements.
Management believes the following critical accounting policies involve significant judgments and estimates in the preparation of our consolidated financial statements. (Also see Note 2 to our Consolidated Financial Statements included in Part II, Item 8 of this Report, which provides further information on and discussion of our significant accounting policies and the use of estimates)
Revenue Recognition
We derive revenue primarily from language translation services and professional consulting services. Services include content analysis, translation memory and retrieval, language translation, account management, graphic design services, technical consulting and professional services. Services associated with translation of content are generally billed on a “per word” basis. The price charged per word per language varies depending upon the language, the availability of translator resources and the extent to which our proprietary search algorithm has been applied to reuse prior translation work. In some cases we may generate revenue by allowing customers to utilize our operating system, for which we will also receive revenue on a per word basis similar to our services business model based upon the number of words processed through our Transplicity software platform. Professional services, including technical consulting and project management, are billed on a per hour rate basis.
We consider revenue earned and realizable at the time services are performed and amounts are earned. Revenue for translation services is recognized on a standard “per word” basis at the time the translation is completed. Revenue for professional services is recognized when the services have been completed in accordance with the statement of work.
Revenues recognized in excess of billings are recorded as unbilled services. Billings in excess of revenues recognized and customer prepayments for services are recorded as customer prepayments to the extent cash has been received.
Capitalized Software Development Costs
We capitalize software development costs incurred during the application development stage related to new software or major enhancements to the functionality of existing software that is developed solely to meet our internal operational needs. Costs capitalized include external direct costs of materials and services and internal payroll and payroll-related costs. Any costs during the preliminary project stage or related to training or maintenance are expensed as incurred. Capitalization ceases when the software project is substantially complete and ready for its intended use. The capitalization and ongoing assessment of recoverability of development costs requires considerable judgment by management with respect to certain external factors, including, but not limited to, technological and economic feasibility, and estimated economic life. When the projects are ready for their intended use, we amortize such costs over their estimated useful lives of three years.
- 19 -
Stock-Based Compensation
We measure and recognize compensation expense for all stock-based compensation at fair value. Our determination of the fair value of share-based compensation awards on the date of grant using an option-pricing model is affected by our stock price as well as assumptions regarding a number of variables. These variables include, but are not limited to, expected stock price volatility and actual and projected stock option exercise behaviors and forfeitures. An option’s expected term is the estimated period between the grant date and the exercise date of the option. As the expected term increases, the fair value of the option and the compensation cost will also increase. The expected-term assumption is generally calculated using historical stock option exercise data; however, we do not have historical exercise data to develop such an assumption. As a result, we determine the expected term assumption using the simplified expected-term calculation as provided in SEC Staff Accounting Bulletin 107. The risk-free rates for the expected terms of the stock options are based on the U.S. Treasury yield curve in effect at the time of grant.
Income Taxes
Current income taxes are recorded based on statutory obligations for the current operating period for the various countries in which we have operations. Deferred taxes are provided on an asset and liability method whereby deferred tax assets are recognized for deductible temporary differences, and deferred tax liabilities are recognized for taxable temporary differences. Deferred tax assets are reduced by a valuation allowance when we believe it is more likely than not that some portion or all of the deferred tax assets will not be realized.
We have net operating losses available to offset future income for federal and state reporting purposes of $28.2 million and $2.9 million, respectively. These carry forwards expire in various calendar years from 2016 through 2030. We are also subject to Alternative Minimum Tax (AMT), which only allows for the utilization of existing NOL carry forwards to offset 90% of AMT taxable income.
Cost of Revenue
Cost of revenue consists of two components: amounts paid to outside translators and compensation paid to our internal operations staff. Outside translator costs are highly variable based upon the amount of translation services revenue. We work with freelance linguists and single language and multiple language vendors who complete the actual language translation, and they are paid on a per word basis. Internal compensation costs are based on the global operations staff located in our Wisconsin, Ireland, Spain, and Singapore locations, who are responsible for project and process management, quality control, operational integration, vendor management and production operations. These costs tend to be less variable than translator costs. In the near term, our cost of revenue may be affected by a number of factors including the mix of customers, the mix of language translated, staff levels and the extent of new customer implementations in a given quarter. Over the long term, we expect cost of revenue will grow in absolute dollars, as we expect to continue to grow our revenue, but decrease as a percentage of revenue due to economies of scale, more efficient sourcing and operational efficiencies from ongoing utilization of our Transplicity platform.
Related Party Transactions
Shannon Zimmerman, who is a director and an executive officer, and Angela Zimmerman, who is currently a director and, prior to June 8, 2015, was an executive officer, collectively own approximately 27% of the outstanding shares of the Company’s common stock. See Note 8 to the Consolidated Financial Statements included in Part II, Item 8 of this Report for a description of the transactions between the Zimmermans and the Company.
Results of Operations – Year Ended December 31, 2015 Compared to Year Ended December 31, 2014
The major components of revenue, cost of revenue, operating expenses, other income, and income taxes are discussed below.
- 20 -
| (amounts in thousands) | Years Ended December 31, | |||||||||||
| Item | 2015 | 2014 | % Change (Year-Over- Year) | |||||||||
| Revenue | $ | 29,688 | $ | 28,348 | 5 | % | ||||||
| Operating expenses: | ||||||||||||
| Cost of revenue | 18,269 | 17,203 | 6 | % | ||||||||
| Sales and marketing | 3,664 | 3,440 | 7 | % | ||||||||
| Research and development | 1,688 | 1,671 | 1 | % | ||||||||
| General and administrative | 4,971 | 4,803 | 4 | % | ||||||||
| Depreciation and amortization | 887 | 961 | (8 | )% | ||||||||
| Other income (expense) | ||||||||||||
| Interest expense | 49 | 84 | (42 | )% | ||||||||
| Foreign currency income (expense) | (5 | ) | 1 | 600 | % | |||||||
| Income tax expense | 13 | 36 | (64 | )% | ||||||||
| Net income | $ | 142 | $ | 151 | (6 | )% | ||||||
Revenues
Revenue in 2015 increased $1,340,000, or 5%, compared to 2014. The increase was a result of a combination of factors including increased revenue from new 2015 clients, increased revenue from our Global Life Science Services customers, and increased revenue from four of 2014’s top ten customers. Offsetting these increases were declines in six of 2014’s top ten customers. For five of these customers, these declines were principally due to customer delays in translation spending. We also experienced a 24% decrease in revenue from our largest international customer, IBM, who comprised 8% of our total revenue in 2015 compared to 12% in 2014. This decline was expected and was due to a worldwide reduction in translation spending at IBM. Excluding the impact of IBM, our total revenue grew by 9% in 2015. During 2015, our revenue from customers in the United States grew by 8% while revenue from our international customers declined by 4%, principally due to the revenue decline from IBM.
Operating expenses
Cost of Revenue. Cost of revenue increased 6% in 2015 compared to 2014. As a percentage of revenue, cost of revenue was 62% in 2015 compared to 61% in 2014. Outside translator costs were 47% of revenue in both 2015 and 2014. Compensation costs for our internal operations personnel were 15% of revenue in 2015 compared to 14% in 2014. The increase in percentage was due to hiring additional staff to support our anticipated revenue growth. Although this had an adverse financial impact on 2015, we believe these additions position us well for expected revenue growth in 2016.
Sales and Marketing. Sales and marketing expense in 2015 increased $224,000, or 7%, compared to 2014. As a percentage of revenue, sales and marketing expense was 12% in both 2015 and 2014. The increase in dollars is a result of investments made in strategic sales initiatives, including sales tools and additions of staff.
Research and Development. Research and development expense increased $17,000 in 2015, or 1%, compared to 2014. As a percentage of revenue, research and development expense was 6% in both 2015 and 2014. The slight increase in dollars was a combination of additions to our development staff offset by the currency impact of the strong U.S. dollar compared to the Euro.
General and Administrative. General and administrative expense in 2015 increased $168,000, or 4%, compared to 2014. The increase was due to several factors including recruitment costs to hire a new Chief Operating Officer, the addition of a Vice President of Global Life Science Services, an increase in professional fees, and an increase in license fees. These increases were partially offset by decreases in the amount of incentive compensation under our Short Term Incentive Plan, and the currency impact of the strong U.S. dollar compared to the Euro. As a percentage of revenue, general and administrative expense was 17% in both 2015 and 2014.
- 21 -
Depreciation and Amortization. Depreciation and amortization expense in 2015 decreased $74,000, or 8%, compared to 2014. The decrease was a result of certain of our intangible assets becoming fully amortized during 2015.
Interest Expense
Interest expense in 2015 decreased $35,000 compared to 2014. The decline was due to the payoff of our note payable to related parties, which occurred during the third quarter, and to lower capital lease obligation balances.
Income Taxes
Income tax expense in 2015 was $13,000 compared to $36,000 in 2014. The decrease in taxes is due to services performed in China no longer requiring the withholding of taxes.
Net Income
Net income in 2015 was $142,000 compared to $151,000 in 2014, a decrease of 6%. The decline, despite the 5% increase in revenue, was due principally to the increase in cost of revenue that resulted primarily from increased operations personnel that were added in 2015 to support anticipated revenue growth.
Non-GAAP Financial Measure – Adjusted EBITDA
| Years ended December 31, | ||||||||
| (amounts in thousands) | 2015 | 2014 | ||||||
| Net income | $ | 142 | $ | 151 | ||||
| Interest expense | 49 | 84 | ||||||
| Income tax expense | 13 | 36 | ||||||
| Depreciation and amortization | 887 | 961 | ||||||
| Stock-based compensation | 296 | 289 | ||||||
| Adjusted EBITDA | $ | 1,387 | $ | 1,521 | ||||
We calculate Adjusted EBITDA by taking net income calculated in accordance with GAAP and adding interest expense, income taxes, depreciation and amortization, and stock-based compensation. We believe that this non-GAAP measure of financial results provides useful information to management and investors regarding certain financial and business trends relating to our financial condition and results of operations. Our management uses this non-GAAP measure to compare our performance to that of prior periods for trend analyses and for budgeting and planning purposes. This measure is also used in financial reports prepared for management and our Board of Directors. We believe that the use of this non-GAAP financial measure provides an additional tool for investors to use in evaluating ongoing operating results and trends and in comparing our financial measures with other companies, many of which present similar non-GAAP financial measures to investors.
Our management does not consider this non-GAAP measure in isolation or as an alternative to financial measures determined in accordance with GAAP. The principal limitation of this non-GAAP financial measure is that it excludes significant expenses and income that are required by GAAP to be recorded in our consolidated financial statements. In addition, it is subject to inherent limitations as it reflects the exercise of judgments by management about which expenses and income are excluded or included in determining this non-GAAP financial measure. In order to compensate for these limitations, management presents this non-GAAP financial measure in connection with GAAP results. We urge investors to review the reconciliation of our non-GAAP financial measures to the comparable GAAP financial measures and not to rely on any single financial measure to evaluate our business.
- 22 -
Liquidity and Capital Resources
Summary cash flow data is as follows:
| Years Ended December 31, | ||||||||
| (amounts in thousands) | 2015 | 2014 | ||||||
| Cash flows provided by (used in): | ||||||||
| Operating activities | $ | 455 | $ | 1,192 | ||||
| Investing activities | (515 | ) | (328 | ) | ||||
| Financing activities | (832 | ) | 2,523 | |||||
| Net (decrease) increase in cash | (892 | ) | 3,387 | |||||
| Effect of exchange rate changes in cash | (43 | ) | (89 | ) | ||||
| Cash and equivalents, beginning of year | 4,662 | 1,364 | ||||||
| Cash and equivalents, end of year | $ | 3,727 | $ | 4,662 | ||||
Net Cash Provided by Operating Activities
Net cash generated in 2015 and 2014 was due to our Adjusted EBITDA (see explanation of Adjusted EBITDA above) and to changes in our operating assets and liabilities. The decrease in the net cash generated in 2015 compared to 2014 was primarily due to an increase in our accounts receivable of $1,033,000 offset by a decrease of our unbilled services of $378,000.
Net Cash Used in Investing Activities
Net cash used in investing activities in both periods relates principally to the purchase of software and equipment for the business.
Net Cash (Used in) Provided by Financing Activities
The significant items impacting net cash used in financing activities in 2015 included the scheduled $750,000 payment in full on our note payable to a related party, which was made in the third quarter, and $93,000 of payments made on capital lease obligations. As of December 31, 2015, we have no further capital lease obligations. Net cash provided by financing activities in 2014 consisted of proceeds of $2,708,000 from an equity offering, offset by principal payments on our capital lease obligations of $185,000.
Sources of Capital
In 2015 our principal source of liquidity was our cash and cash equivalents and our funds generated from the operations of the business. As described in Note 9 to the Consolidated Financial Statements included in Part II, Item 8 of this Report, we also have a credit facility with Silicon Valley Bank which allows us to borrow up to the lesser of $3,000,000 or 85% of our outstanding eligible accounts receivable. As of December 31, 2015, the credit facility did not have an outstanding balance. We were in compliance with all covenants of the credit facility as of December 31, 2015. In 2014, our principal source of liquidity was funds generated from the operations of the business and the net proceeds from our equity offering. On September 9, 2014 we completed a follow-on equity offering of 700,000 shares of common stock at a price of $5.00 per share to the public. Total net proceeds of the offering were $2,708,000 after deducting underwriting discounts and commissions and other offering expenses.
Uses of Capital
Our primary uses of capital in 2015 were to fund our operations and working capital needs and to make investments in equipment and software development projects. We intend to utilize our cash on hand and cash generated from operations to support our business, including investing in software development, ongoing sales and marketing activities both domestically and internationally, enhancing our translation management system, and where appropriate, acquiring businesses, technologies and products that may add to our operations and client base. We currently have no current understandings, commitments or arrangements in place for such acquisitions.
- 23 -
We believe that our existing capital resources, including cash and cash equivalents, operating cash flows, and the availability of cash under our line of credit, will be sufficient to meet our working capital, investment in technology, and capital expenditure requirements for at least the next 12 months.
If required, additional financing may not be available on terms that are favorable to us, if at all. If we raise additional funds through the issuance of equity securities, the percentage ownership of our stockholders will be reduced and these securities might have rights, preferences and privileges senior to those of our current stockholders or we may be subject to covenants that restrict how we conduct our business. No assurance can be given that additional financing will be available or that, if available, such financing can be obtained on terms favorable to our stockholders and us.
Off-Balance Sheet Arrangements
The Company had no off-balance sheet arrangements as of December 31, 2015.
| ITEM 7A. | QUANTITATIVE AND QUALITATIVE DISCLOSUORES ABOUT MARKET RISK |
As a small reporting company, we are not required to provide disclosure pursuant to this item.
- 24 -
| ITEM 8. | FINANCIAL STATEMENTS AND SUPPLEMENTARY DATA |
REPORT OF INDEPENDENT REGISTERED PUBLIC ACCOUNTING FIRM
Board of Directors and Stockholders
Sajan, Inc. and Subsidaries
We have audited the accompanying consolidated balance sheet of Sajan, Inc. (a Delaware corporation) and subsidiaries (the “Company”) as of December 31, 2015, and the related consolidated statement of comprehensive income, stockholders’ equity, and cash flows for the year ended December 31, 2015. These financial statements are the responsibility of the Company’s management. Our responsibility is to express an opinion on these financial statements based on our audit.
We conducted our audit in accordance with the standards of the Public Company Accounting Oversight Board (United States). Those standards require that we plan and perform the audit to obtain reasonable assurance about whether the financial statements are free of material misstatement. We were not engaged to perform an audit of the Company’s internal control over financial reporting. Our audit included consideration of internal control over financial reporting as a basis for designing audit procedures that are appropriate in the circumstances, but not for the purpose of expressing an opinion on the effectiveness of the Company’s internal control over financial reporting. Accordingly, we express no such opinion. An audit also includes examining, on a test basis, evidence supporting the amounts and disclosures in the financial statements, assessing the accounting principles used and significant estimates made by management, as well as evaluating the overall financial statement presentation. We believe that our audit provides a reasonable basis for our opinion.
In our opinion, the consolidated financial statements referred to above present fairly, in all material respects, the financial position of Sajan, Inc. and subsidiaries as of December 31, 2015, and the results of their operations and their cash flows for the year ended December 31, 2015 in conformity with accounting principles generally accepted in the United States of America.
/s/ GRANT THORNTON LLP
Minneapolis, Minnesota
March 16, 2016
- 25 -
REPORT OF INDEPENDENT REGISTERED PUBLIC ACCOUNTING FIRM
To the Stockholders, Audit Committee and Board of Directors
Sajan, Inc. and Subsidiaries
River Falls, WI
We have audited the accompanying consolidated balance sheet of Sajan, Inc. and Subsidiaries as of December 31, 2014, and the related consolidated statement of comprehensive income, stockholders' equity and cash flows for the year then ended. These consolidated financial statements are the responsibility of the company's management. Our responsibility is to express an opinion on these consolidated financial statements based on our audits.
We conducted our audit in accordance with the standards of the Public Company Accounting Oversight Board (United States). Those standards require that we plan and perform the audit to obtain reasonable assurance about whether the consolidated financial statements are free of material misstatement. The company is not required to have, nor were we engaged to perform, an audit of its internal control over financial reporting. Our audits included consideration of its internal control over financial reporting as a basis for designing audit procedures that are appropriate in the circumstances, but not for the purpose of expressing an opinion on the effectiveness of the company’s internal control over financial reporting. Accordingly, we express no such opinion. An audit includes examining, on a test basis, evidence supporting the amounts and disclosures in the consolidated financial statements. An audit also includes assessing the accounting principles used and significant estimates made by management as well as evaluating the overall consolidated financial statement presentation. We believe that our audits provide a reasonable basis for our opinion.
In our opinion, the consolidated financial statements referred to above present fairly, in all material respects, the financial position of Sajan, Inc. and Subsidiaries as of December 31, 2014 and the results of their operations and cash flows for the year then ended, in conformity with U.S. generally accepted accounting principles.
/s/ Baker Tilly Virchow Krause, LLP
Minneapolis, Minnesota
March 23, 2015
- 26 -
CONSOLIDATED BALANCE SHEETS
Amounts in thousands except per share data
| December 31, | ||||||||
| 2015 | 2014 | |||||||
| Assets | ||||||||
| Current assets: | ||||||||
| Cash and cash equivalents | $ | 3,727 | $ | 4,662 | ||||
| Accounts receivable, net | 5,032 | 3,999 | ||||||
| Unbilled services | 646 | 1,024 | ||||||
| Prepaid expenses and other current assets | 684 | 550 | ||||||
| Total current assets | 10,089 | 10,235 | ||||||
| Property and equipment, net | 642 | 711 | ||||||
| Other assets: | ||||||||
| Capitalized software development costs, net | 43 | 213 | ||||||
| Intangible assets, net | 114 | 256 | ||||||
| Other assets | 24 | 22 | ||||||
| Total other assets | 181 | 491 | ||||||
| Total assets | $ | 10,912 | $ | 11,437 | ||||
| Liabilities and Stockholders’ Equity | ||||||||
| Current liabilities: | ||||||||
| Accounts payable | $ | 3,297 | $ | 3,076 | ||||
| Customer prepayments | 831 | 966 | ||||||
| Accrued compensation and benefits | 704 | 789 | ||||||
| Accrued liabilities | 131 | 128 | ||||||
| Accrued interest – related party | - | 81 | ||||||
| Note payable – related party | - | 750 | ||||||
| Current portion of capital lease obligations | - | 93 | ||||||
| Total current liabilities | 4,963 | 5,883 | ||||||
| Total liabilities | 4,963 | 5,883 | ||||||
| Commitments and contingencies | ||||||||
| Stockholders’ equity: | ||||||||
| Preferred stock, $.01 par value, 10,000 shares authorized and no shares issued outstanding | - | - | ||||||
| Common stock, $.01 par value, 35,000 shares authorized; 4,783 and 4,773 issued and outstanding, respectively | 48 | 48 | ||||||
| Additional paid-in capital | 10,634 | 10,327 | ||||||
| Accumulated other comprehensive loss | (335 | ) | (281 | ) | ||||
| Accumulated deficit | (4,398 | ) | (4,540 | ) | ||||
| Total stockholders’ equity | 5,949 | 5,554 | ||||||
| Total liabilities and stockholders’ equity | $ | 10,912 | $ | 11,437 | ||||
See notes to consolidated financial statements.
- 27 -
CONSOLIDATED STATEMENTS OF COMPREHENSIVE INCOME
Amounts in thousands except per share data
| Years Ended December 31, | ||||||||
| 2015 | 2014 | |||||||
| Revenue from translation and consulting services | $ | 29,688 | $ | 28,348 | ||||
| Operating expenses: | ||||||||
| Cost of revenue (exclusive of depreciation and amortization) | 18,269 | 17,203 | ||||||
| Sales and marketing | 3,664 | 3,440 | ||||||
| Research and development | 1,688 | 1,671 | ||||||
| General and administrative | 4,971 | 4,803 | ||||||
| Depreciation and amortization | 887 | 961 | ||||||
| Total operating expenses | 29,479 | 28,078 | ||||||
| Income from operations | 209 | 270 | ||||||
| Other income (expense): | ||||||||
| Interest expense | (49 | ) | (84 | ) | ||||
| Foreign currency transaction (loss) gain | (5 | ) | 1 | |||||
| Total other expense | (54 | ) | (83 | ) | ||||
| Income before income taxes | 155 | 187 | ||||||
| Income tax expense | 13 | 36 | ||||||
| Net income | 142 | 151 | ||||||
| Effect of foreign currency translation adjustments | (54 | ) | (92 | ) | ||||
| Comprehensive income | $ | 88 | $ | 59 | ||||
| Income per common share – basic | $ | 0.03 | $ | 0.04 | ||||
| Income per common share – diluted | $ | 0.03 | $ | 0.03 | ||||
| Weighted average shares outstanding – basic | 4,780 | 4,283 | ||||||
| Weighted average shares outstanding – diluted | 4,836 | 4,374 | ||||||
See notes to consolidated financial statements.
- 28 -
CONSOLIDATED STATEMENTS OF STOCKHOLDERS’ EQUITY
For the years ended December 31, 2015 and 2014
Amounts in thousands
| Accumulated | ||||||||||||||||||||||||
| Additional | other | Total | ||||||||||||||||||||||
| Common | Common | paid-in | comprehensive | Accumulated | stockholders' | |||||||||||||||||||
| shares | stock | capital | loss | deficit | equity | |||||||||||||||||||
| Balances at December 31, 2013 | 4,067 | 41 | 7,337 | (189 | ) | (4,691 | ) | 2,498 | ||||||||||||||||
| Comprehensive income | (92 | ) | 151 | 59 | ||||||||||||||||||||
| Net proceeds from issuance of stock | 700 | 7 | 2,701 | 2,708 | ||||||||||||||||||||
| Exercise of warrants | 6 | |||||||||||||||||||||||
| Stock-based compensation | 289 | 289 | ||||||||||||||||||||||
| Balances at December 31, 2014 | 4,773 | 48 | 10,327 | (281 | ) | (4,540 | ) | 5,554 | ||||||||||||||||
| Comprehensive income | (54 | ) | 142 | 88 | ||||||||||||||||||||
| Exercise of stock options and warrants | 10 | 11 | 11 | |||||||||||||||||||||
| Stock-based compensation | 296 | 296 | ||||||||||||||||||||||
| Balances at December 31, 2015 | 4,783 | $ | 48 | $ | 10,634 | $ | (335 | ) | $ | (4,398 | ) | $ | 5,949 | |||||||||||
See notes to consolidated financial statements.
- 29 -
CONSOLIDATED STATEMENTS OF CASH FLOWS
Amounts in thousands
| Years ended December 31, | ||||||||
| 2015 | 2014 | |||||||
| Cash flows from operating activities: | ||||||||
| Net income | $ | 142 | $ | 151 | ||||
| Adjustments to reconcile net income to net cash from operating activities: | ||||||||
| Amortization | 392 | 424 | ||||||
| Depreciation | 495 | 537 | ||||||
| Stock-based compensation expense | 296 | 289 | ||||||
| Changes in operating assets and liabilities: | ||||||||
| Accounts receivable | (1,033 | ) | (189 | ) | ||||
| Unbilled services | 378 | 173 | ||||||
| Prepaid expenses and other current assets | (138 | ) | (124 | ) | ||||
| Accounts payable | 221 | 521 | ||||||
| Customer prepayments | (135 | ) | (457 | ) | ||||
| Accrued interest – related party | (81 | ) | (30 | ) | ||||
| Accrued compensation and benefits | (85 | ) | (59 | ) | ||||
| Other | 3 | (44 | ) | |||||
| Net cash provided by operating activities | 455 | 1,192 | ||||||
| Cash flows from investing activities: | ||||||||
| Purchases of property and equipment | (435 | ) | (274 | ) | ||||
| Payments on long term licenses | (80 | ) | (54 | ) | ||||
| Net cash used in investing activities | (515 | ) | (328 | ) | ||||
| Cash flows from financing activities: | ||||||||
| Net proceeds from issuance of stock | 11 | 2,708 | ||||||
| Payments on capital lease obligation | (93 | ) | (185 | ) | ||||
| Payoff of note payable – related party | (750 | ) | - | |||||
| Net cash (used in) provided by financing activities | (832 | ) | 2,523 | |||||
| Net (decrease) increase in cash and cash equivalents | (892 | ) | 3,387 | |||||
| Effect of exchange rate changes on cash and cash equivalents | (43 | ) | (89 | ) | ||||
| Cash and cash equivalents – beginning of year | 4,662 | 1,364 | ||||||
| Cash and cash equivalents – end of year | $ | 3,727 | $ | 4,662 | ||||
| Cash paid for interest including loan fees | $ | 131 | $ | 94 | ||||
| Cash paid for taxes | $ | 12 | $ | 36 | ||||
See notes to consolidated financial statements.
- 30 -
Notes to Consolidated Financial Statements
Amounts in thousands except per share data
| 1. | Nature of Business |
Sajan, Inc. (the “Company” or “Sajan”), a Delaware corporation, provides language translation services and technology solutions to companies located throughout the world, particularly in the technology, consumer products, medical and life sciences, financial services, manufacturing, government, and retail industries that are selling products into global markets. The Company is located in River Falls, Wisconsin and has active, wholly-owned subsidiaries in the following countries:
| · | Ireland – Sajan Software Ltd. |
| · | Spain – Sajan Spain S.L.A. |
| · | Singapore – Sajan Singapore Pte. Ltd. |
| 2. | Summary of Significant Accounting Policies |
Principles of Consolidation
The accompanying consolidated financial statements include the accounts of Sajan and its wholly-owned subsidiaries. All significant intercompany accounts and transactions have been eliminated in the consolidated financial statements.
Cash and Cash Equivalents
The Company considers all highly liquid investments with an original maturity of three months or less at the date of purchase to be cash equivalents.
The Company maintains its cash and cash equivalents in bank deposits which, at times, may exceed federally insured limits. The Company has not experienced any losses in such accounts.
Fair Value of Financial Instruments
The carrying amounts of the Company’s financial instruments, which include cash equivalents, accounts receivable, and accounts payable, approximate their fair values due to their short maturities and/or market-consistent interest rates.
Accounts Receivable
The Company extends unsecured credit to customers in the normal course of business. The Company provides an allowance for doubtful accounts when appropriate, the amount of which is based upon a review of outstanding receivables, historical collection information, and existing economic conditions on an individual customer basis. Standard accounts receivable are due 30 days after issuance of an invoice. Receivables are written off only after all collection attempts have failed, and are based on individual credit evaluation and specific circumstances of the customer. Accounts receivable have been reduced by an allowance for uncollectible accounts of $30 at December 31, 2015 and 2014. Management believes all accounts receivables in excess of the allowance are fully collectible. The Company does not accrue interest on accounts receivable.
Reverse Stock Split
At our 2014 Annual Meeting of Stockholders held on June 12, 2014, our stockholders approved a proposal granting our Board of Directors authority to effect a reverse stock split. On June 12, 2014 the Board approved a reverse stock split at a ratio of 1-for-4 and the reverse split was effective at 11:59 p.m. on June 16, 2014. The reverse stock split did not result in a reduction in the number of authorized shares of common stock. The accompanying financial statements and footnotes have been adjusted retroactively to reflect the reverse stock split.
- 31 -
Income Per Common Share
Basic earnings per share is computed by dividing net income by the weighted average number of common shares outstanding.
Diluted earnings per share is computed based on the weighted average number of common shares outstanding adjusted by the number of additional shares that would have been outstanding had the potentially dilutive common shares been issued.
In 2015, options to purchase 139 shares were excluded from the diluted weighted average share outstanding calculation because the inclusion of these shares would have been anti-dilutive. In 2014, options to purchase 46 shares were excluded from the diluted weighted average share outstanding calculation because the inclusion of these shares would have been anti-dilutive.
A reconciliation of the denominator in the basic and diluted income per share is as follows:
| Year Ended | Year Ended | |||||||
| December 31, 2015 | December 31, 2014 | |||||||
| Net income | $ | 142 | $ | 151 | ||||
| Weighted average common shares outstanding – basic | 4,780 | 4,283 | ||||||
| Income per common share – basic | $ | 0.03 | $ | 0.04 | ||||
| Weighted average common shares outstanding – diluted | 4,836 | 4,374 | ||||||
| Income per common share – diluted | $ | 0.03 | $ | 0.03 | ||||
Property and Equipment
Property and equipment are recorded at cost and depreciated over their estimated useful lives, initially determined to be two to twenty one years, using the straight-line method. Upon retirement or sale, the cost of assets disposed of and the related accumulated depreciation are removed from the accounts, and any resulting gain or loss is included in operating results. Repairs and maintenance costs are expensed as incurred.
Long-lived Assets
The Company annually reviews its long-lived assets for events or changes in circumstances that may indicate that their carrying amount may not be recoverable or exceeds their fair value. The carrying amount of a long-lived asset is not recoverable if it exceeds the sum of the undiscounted cash flows expected to result from the use and eventual disposition of the asset. An impairment loss shall be measured as the amount by which the carrying amount of a long-lived asset exceeds its fair value. Fair value is defined as the price that would be received to sell an asset or paid to transfer a liability in an orderly transaction between market participants at the measurement date. The Company's long-lived assets, which include equipment, capitalized software, intangibles and patents, are subject to depreciation or amortization. Intangible assets are amortized over their expected useful lives of 4 to 15 years and their weighted average remaining life is 2 years. There was no impairment for the years ended December 31, 2015 and 2014.
Capitalized Software Development Costs
The Company capitalizes software development costs incurred during the application development stage related to new software or major enhancements to the functionality of existing software that is developed solely to meet the entity’s internal operational needs and when no substantive plans exist or are being developed to market the software externally. Costs capitalized include external direct costs of materials and services and internal payroll and payroll-related costs. Any costs during the preliminary project stage or related to training or maintenance are expensed as incurred. Capitalization ceases when the software project is substantially complete and ready for its intended use. The capitalization and ongoing assessment of recoverability of development costs requires considerable judgment by management with respect to certain external factors, including, but not limited to, technological and economic feasibility, and estimated economic life. When the projects are ready for their intended use, the Company amortizes such costs over their estimated useful lives of three years.
- 32 -
Stock-Based Compensation
The Company measures and recognizes compensation expense for all stock-based compensation at fair value. The Company recognizes stock-based compensation costs on a straight-line basis over the requisite service period of the award, which is generally the option vesting term. Options generally vest over a term of four years and have a contractual life of 10 years. Total stock-based compensation expense was $296 in 2015 and $289 in 2014. As of December 31, 2015, there was a total of $469 unrecognized compensation cost related to non-vested share-based compensation arrangements granted under the Company’s 2004 Amended and Restated Long-Term Incentive Plan and the Company’s 2014 Equity Incentive Plan. That cost is expected to be recognized over a weighted-average period of three years. This is an estimate based on options currently outstanding, and therefore this projected expense could be higher in the future.
The Company’s determination of fair value of share-based compensation awards on the date of grant using an option-pricing model is affected by the Company’s stock price as well as assumptions regarding a number of variables. These variables include, but are not limited to the Company’s expected stock price volatility, and actual and projected stock option exercise behaviors and forfeitures. An option’s expected term is the estimated period between the grant date and the exercise date of the option. As the expected term increases, the fair value of the option and the compensation cost will also increase.
The Company calculates expected volatility for stock options and awards using its own stock price. Management expects and estimates substantially all directors and employee stock options will vest, and therefore the forfeiture rate used is zero. The risk-free rates for the expected terms of the stock options are based on the U.S. Treasury yield curve in effect at the time of grant.
In determining the compensation cost of the options granted during 2015 and 2014, the fair value of each option grant has been estimated on the date of grant using the Black-Scholes option pricing model, and the weighted average assumptions used in these calculations are summarized as follows:
| 2015 | 2014 | |||||||
| Risk-free interest rate | 1.5 | % | 1.4 | % | ||||
| Expected life of options granted | 7 years | 6 years | ||||||
| Expected volatility | 85 | % | 80 | % | ||||
| Expected dividend yield | 0 | % | 0 | % | ||||
Using the Black-Scholes option pricing model, management has determined that the options issued in 2015 and 2014 have a weighted-average grant date fair value of $4.38 and $4.25 per share, respectively.
Revenue Recognition
The Company derives revenues primarily from language translation services and professional consulting services.
Translation services utilize the Company’s proprietary translation management system – Transplicity – to provide a solution for all of the customer’s language translation requirements. Services include content analysis, translation memory and retrieval, language translation, account management, graphic design services, technical consulting and professional services. Services associated with translation of content are generally billed on a “per word” basis. Professional services, including technical consulting and project management, are billed on a per hour basis.
The Company considers revenue earned and realizable at the time services are performed and amounts are earned. The Company considers amounts to be earned when (1) persuasive evidence of an arrangement has been obtained; (2) services are delivered; (3) the fee is fixed or determinable; and (4) collectability is reasonably assured. Determination of criteria (3) and (4) is based on management’s judgments regarding the fixed nature of the fee charged for services rendered and products delivered and the collectability of those fees. The Company recognizes revenue for translation services on a standard “per word” basis at the time the translation is completed. The Company recognizes revenue for professional services when the services have been completed in accordance with the statement of work.
- 33 -
The Company’s agreements with its customers may provide the customer with a limited time period following delivery of the project for the customer to identify any non-conformities to the pre-defined project specifications. The Company has the opportunity to correct these items. Historically, errors in project deliverables have been minimal and accordingly, revenue is recognized as services are performed.
Revenues recognized in excess of billings are recorded as unbilled services. Billings in excess of revenues recognized and customer prepayment for services are recorded as customer prepayments to the extent cash has been received.
Cost of Revenue
Cost of revenue consists primarily of expenses incurred for translation services provided by third parties as well as salaries and associated employee benefits for personnel related to client projects.
Research and Development
Research and development expenses primarily represent costs incurred for development of enhancements and maintenance to the Company’s operating software system and include costs incurred during the preliminary project stage of development or related to training or maintenance activities. Research and development expenses consist primarily of salaries and related costs of software engineers, and fees paid to third party consultants. All research and development expenses are expensed as incurred.
Foreign Currency Translation
For operations in local currency environments, assets and liabilities are translated at year-end exchange rates with cumulative translation adjustments included as a component of shareholders’ equity. Income and expense items are translated at average foreign exchange rates prevailing during the year. For operations in which the U.S. dollar is not considered the functional currency, certain financial statements amounts are re-measured at historical exchange rates, with all other asset and liability amounts translated at year-end exchange rates. These re-measured adjustments are reflected in the results of operations. Gains and losses from foreign currency transactions are included in the Consolidated Statements of Comprehensive Income.
Income Taxes
Current income taxes are recorded based on statutory obligations for the current operating period for the various countries in which the Company has operations.
Deferred taxes are provided on an asset and liability method whereby deferred tax assets are recognized for deductible temporary differences, and deferred tax liabilities are recognized for taxable temporary differences. Temporary differences are the differences between the reported amounts of assets and liabilities and their tax basis. Deferred tax assets are reduced by a valuation allowance when, in the opinion of management, it is more likely than not that some portion or all of the deferred tax assets will not be realized. Deferred tax assets and liabilities are adjusted for the effects of changes in tax laws and rates on the date of enactment.
Use of Estimates
The preparation of financial statements in conformity with generally accepted accounting principles requires management to make estimates and assumptions that affect the reported amounts of assets and liabilities and disclosure of contingent assets and liabilities at the date of the financial statements and the reported amounts of revenues and expenses during the reporting period. Management bases its estimates on historical experience and on various other assumptions that are believed to be reasonable under the circumstances. Actual results could differ from those estimates.
- 34 -
New Accounting Pronouncements
Revenue from Contracts with Customers. In May 2014, the Financial Accounting Standards Board (“FASB”) issued guidance creating Accounting Standards Codification (“ASC”) Section 606, “Revenue from Contracts with Customers”. The new section will replace Section 605, “Revenue Recognition” and will create modifications to various other revenue accounting standards for specialized transactions and industries. Along with a concurrently issued International Financial Reporting Standards, ASC Section 606 is intended to conform revenue accounting principles and address the previously differing treatment between United States practice and that of much of the rest of the world. The section is also intended to enhance disclosures related to disaggregated revenue information.
In April 2015, FASB issued an Accounting Standards Update that defers the effective date of ASC Section 606 by one year. As updated, ASC Section 606 is effective for annual reporting periods beginning on or after December 15, 2017, and interim periods within those annual periods. The Company will adopt the new provisions of this accounting standard at the beginning of fiscal year 2018. FASB does permit the adoption of the new revenue standard early, but not before the original effective date for annual periods beginning after December 15, 2016. The Company will further study the implications of this statement in order to evaluate the expected impact on the consolidated financial statements.
In November 2015, the FASB issued ASU 2015-17, Balance Sheet Classification of Deferred Taxes (Topic 740), which amends the guidance requiring companies to separate deferred income tax liabilities and assets into current and non-current amounts in a classified statement of financial position. ASU 2015-17 simplifies the presentation of deferred income taxes, such that deferred tax liabilities and assets be classified as non-current in a classified statement of financial position. The new standard will be effective beginning in the first quarter of 2018. Early adoption is permitted. The Company early adopted ASU 2015-17 effective December 31, 2015. The adoption of ASU 2015-17 did not have an impact on the Company’s consolidated balance sheet due to the full valuation allowance against the net deferred tax assets as of December 31, 2015 and 2014.
In February 2016, the FASB issued ASU 2016-02, Leases (Topic 842) which supersedes FASB ASC Topic 840, Leases (Topic 840) and provides principles for the recognition, measurement, presentation and disclosure of leases for both lessees and lessors. The new standard requires lessees to apply a dual approach, classifying leases as either finance or operating leases based on the principle of whether or not the lease is effectively a financed purchase by the lessee. This classification will determine whether lease expense is recognized based on an effective interest method or on a straight-line basis over the term of the lease, respectively. A lessee is also required to record a right-of-use asset and a lease liability for all leases with a term of greater than twelve months regardless of classification. Leases with a term of twelve months or less will be accounted for similar to existing guidance for operating leases. The standard is effective for annual and interim periods beginning after December 15, 2018, with early adoption permitted upon issuance. The Company is currently evaluating the method of adoption and the impact of adopting ASU 2016-02 on its results of operations, cash flows and financial position.
| 3. | Concentrations of Credit Risk |
Financial instruments that potentially subject the Company to concentrations of credit risk consist principally of cash and cash equivalents and accounts receivable.
Cash concentration – The Company places its cash at financial institutions with balances that, at times, may exceed federally insured limits. The Company evaluates the creditworthiness of these financial institutions in determining the risk associated with these deposits. The Company has not experienced any losses on such accounts.
Accounts receivable concentration – Concentrations of credit risk with respect to trade accounts receivable are limited due to the dispersion of customers across different industries and geographic regions. At December 31, 2015 and 2014, one customer, IBM, accounted for approximately 12% and 16% of accounts receivable, respectively.
Revenue concentration – In 2015, the Company had no customers that accounted for 10% or more of net revenues. In 2014, the Company had one customer, IBM, that accounted for 12% of net revenues.
- 35 -
| 4. | Segment Information and Major Customers |
The Company views its operations and manages its business as one reportable segment, providing language translation solutions to a variety of companies, primarily in its targeted vertical markets. Factors used to identify the Company’s single operating segment include the financial information available for evaluation by the chief operating decision makers in making decisions about how to allocate resources and assess performance. The Company markets its products and services through its headquarters in the United States and its wholly-owned subsidiaries operating in Ireland, Spain and Singapore.
Net sales per geographic region, based on the billing location of the end customer, are summarized below.
| Years Ended December 31, | ||||||||||||||||
| 2015 | 2014 | |||||||||||||||
| Revenue | Percent | Revenue | Percent | |||||||||||||
| United States | $ | 22,668 | 76 | % | $ | 21,054 | 74 | % | ||||||||
| Asia | 925 | 3 | % | 972 | 3 | % | ||||||||||
| Europe | 4,690 | 16 | % | 5,246 | 19 | % | ||||||||||
| Other International | 1,405 | 5 | % | 1,076 | 4 | % | ||||||||||
| Total Sales | $ | 29,688 | 100.0 | % | $ | 28,348 | 100.0 | % | ||||||||
No foreign country accounted for 10% or more of consolidated revenue in 2015 or 2014.
| 5. | Property and Equipment |
Property and equipment consisted of the following as of December 31:
| 2015 | 2014 | |||||||
| Furniture, equipment, and software | $ | 2,348 | $ | 1,984 | ||||
| Leasehold improvements | 452 | 401 | ||||||
| Total | 2,800 | 2,385 | ||||||
| Less accumulated depreciation | (2,158 | ) | (1,674 | ) | ||||
| Property and equipment, net | $ | 642 | $ | 711 | ||||
Depreciation expense was $495 in 2015 and $537 in 2014.
| 6. | Capitalized Software Development Costs |
Capitalized software development costs consist of the following as of December 31:
| 2015 | 2014 | |||||||
| Capitalized software development costs | $ | 543 | $ | 543 | ||||
| Less accumulated amortization | (500 | ) | (330 | ) | ||||
| Capitalized software development costs, net | $ | 43 | $ | 213 | ||||
Capitalized software amortization expense was $170 in 2015 and $180 in 2014. Amortization expense for capitalized software costs is expected to be $43 in 2016. No costs were capitalized in 2015 or 2014. In 2014, $203 of fully amortized capitalized development costs were written off due to the software no longer being in use.
| 7. | Intangible Assets |
Intangible assets consist of the following as of December 31:
| 2015 | 2014 | |||||||
| Customer lists acquired | $ | 784 | $ | 784 | ||||
| Patents and licenses | 327 | 247 | ||||||
| Total | 1,111 | 1,031 | ||||||
| Less accumulated amortization | (997 | ) | (775 | ) | ||||
| Intangible assets, net | $ | 114 | $ | 256 | ||||
- 36 -
Amortization of intangible assets was $222 in 2015 and $244 in 2014. Estimated amortization expense of intangible assets for the years ending December 31, 2016, 2017, 2018, 2019 and thereafter is $53, $53, $53, $40 and $11, respectively.
| 8. | Related Party Transactions |
Note Payable
The Company previously had a note payable in the amount of $750, plus accrued interest thereon, to Shannon and Angela Zimmerman. Shannon Zimmerman is currently, and prior to June 8, 2015 Angela Zimmerman was an executive officer of the Company. Each is a director of the Company and a beneficial owner of the Company's outstanding voting common stock. The note had a maturity date of August 23, 2015, and carried an interest rate of 8%. On August 20, 2015, the note payable, including accrued interest of $8, was paid in full. Accrued interest was $81 as of December 31, 2014. Interest expense on the note payable was $43 in 2015 and $60 in 2014.
Lease
Sajan leases its office space under three non-cancelable operating leases from River Valley Business Center, LLC (“RVBC”), a limited liability company that is owned by Shannon and Angela Zimmerman. The space consists of approximately 20,000 square feet and is leased pursuant to three agreements. These lease agreements require the Company to pay a minimum monthly rental plus certain operating expenses and expire in January 2017. Payment of rent under these leases is secured by goods, chattels, fixtures and personal property of the Company. Rent expense was $344 in both 2015 and 2014.
| 9. | Credit Facility |
In March 2012, the Company entered into a one-year revolving working capital line of credit with Silicon Valley Bank (“SVB”). In March 2013, the line of credit was replaced with a new credit facility (as amended from time to time, the “Credit Facility”) with SVB, which consisted of a two-year revolving working capital line of credit. On March 26, 2015, the maturity date of the Credit Facility was extended an additional two years to March 28, 2017 and the line of credit was increased up to a principal amount equal to the lesser of (a) $3,000 or (b) 85% of the aggregate amount of Sajan’s outstanding eligible accounts receivable, subject to customary limitations and exceptions. Any unpaid principal amount borrowed under the Credit Facility accrues interest at a floating rate per annum equal to (a) 1.0% above the “prime rate” published from time to time in the money rates section of the Wall Street Journal (the “Prime Rate”) when the Company’s liquidity ratio is greater than or equal to 1.75 to 1.0 and (b) 2.25% above the Prime Rate when the Company’s liquidity ratio is less than 1.75 to 1.0. The interest rate floor is set at 4.0% per annum. The unused line of credit accrues interest at a rate of 0.1875% per annum on the average unused portion. There was no outstanding balance as of December 31, 2015 and 2014 under the Credit Facility.
The Credit Facility is governed by the terms of an Amended and Restated Loan and Security Agreement, dated as of March 28, 2013, entered into by and between Sajan and SVB, as amended on March 26, 2015 and May 5, 2015 (as amended, the “A&R Loan Agreement”). The A&R Loan Agreement contains several financial and customary affirmative and negative covenants, including requiring Sajan to maintain a consolidated minimum tangible net worth of at least $2,500, increasing as of the last day of each fiscal quarter by an amount equal to 25% of the sum of (i) net income for such quarter, (ii) any increase in the principal amount of outstanding subordinated debt during such quarter, and (iii) the net amount of proceeds received by Sajan in such quarter from the sale or issuance of equity securities. It also contains customary events of default, which, if triggered, permit SVB to exercise customary remedies such as acceleration of all then-outstanding obligations arising under the A&R Loan Agreement, to terminate its obligations to lend under the Credit Facility, to apply a default rate of interest to such outstanding obligations, and to exercise customary remedies under the Uniform Commercial Code. The Company was in compliance with all covenants of the Credit Facility as of December 31, 2015.
The Credit Facility is secured by all of Sajan’s domestic assets except for intellectual property (which the Company has agreed not to pledge to others), and the pledge of the Company’s equity interests in its foreign subsidiaries that are controlled foreign corporations (as defined in the Internal Revenue Code). The obligations under the A&R Loan Agreement are guaranteed on an unsecured basis by certain of Sajan’s subsidiaries.
- 37 -
| 10. | Options and Warrants |
2014 Equity Incentive Plan
On June 12, 2014 our stockholders approved the 2014 Equity Incentive Plan (“2014 Plan”) as a replacement for the 2004 Amended and Restated Long Term Incentive Plan (“2004 Plan”). No further awards can be issued under the 2004 Plan. The 2014 Plan allows our Board of Directors, or a committee of the Board, to grant awards to our employees (including our named executive officers), directors, or consultants of the Company and its affiliates. The awards may take the form of incentive stock options, non-qualified stock options, restricted stock awards, restricted stock units, performance awards and stock appreciation rights. A total of 375 shares were reserved for issuance under the 2014 Plan. As of December 31, 2015 there are 270 shares of Company common stock available for issuance under the 2014 Plan.
As of December 31, 2015, there were a total of 410 options outstanding with a weighted average exercise price of $4.92 per share. Additionally, there were 21 warrants outstanding with a weighted average exercise price of $2.44 per share.
The following table summarizes stock option activity for options granted under and outside of the 2014 Plan and the 2004 Plan for 2014 and 2015:
| Weighted- | ||||||||||||||||
| Average | ||||||||||||||||
| Weighted- | Remaining | |||||||||||||||
| Average | Weighted- | Contractual | ||||||||||||||
| Number of | Exercise | Average | Term | |||||||||||||
| Stock Options | Price | Fair Value | (Years) | |||||||||||||
| Balance at December 31, 2013 | 373 | $ | 4.96 | $ | 3.68 | 8.1 | ||||||||||
| Granted | 59 | 5.40 | 4.25 | |||||||||||||
| Exercised | - | - | - | |||||||||||||
| Cancelled | (18 | ) | 4.22 | 2.89 | ||||||||||||
| Balance at December 31, 2014 | 414 | $ | 5.15 | $ | 3.79 | 7.5 | ||||||||||
| Granted | 48 | 5.81 | 4.38 | |||||||||||||
| Exercised | (26 | ) | 4.05 | 4.15 | ||||||||||||
| Cancelled | (26 | ) | 11.37 | 7.16 | ||||||||||||
| Balance at December 31, 2015 | 410 | $ | 4.92 | $ | 3.63 | 7.1 | ||||||||||
| Exercisable at December 31, 2014 | 223 | $ | 5.35 | $ | 3.88 | 6.4 | ||||||||||
| Exercisable at December 31, 2015 | 268 | $ | 4.92 | $ | 3.63 | 7.0 | ||||||||||
| Vested during 2015 | 89 | $ | 4.83 | $ | 3.52 | |||||||||||
| Nonvested at December 31, 2015 | 142 | $ | 5.25 | $ | 4.03 | 8.44 | ||||||||||
The aggregate fair value of options that vested in 2015 and 2014 was $314 and $276, respectively.
- 38 -
Intrinsic value as of December 31, 2015 is based on the fair value price of $3.75 per share, which was the closing price of the stock on December 31, 2015. The intrinsic value of options outstanding and exercisable during 2015 is $22 and $21. Intrinsic value as of December 31, 2014 is based on the fair value price of $5.65 per share, which was the closing price of the stock on December 31, 2014. The intrinsic value of options outstanding and exercisable during 2014 is $532 and $321. The intrinsic value of options exercised was $42 for the year ending December 31, 2015.
The following table summarizes activity for warrants outstanding for 2015 and 2014:
| Weighted- | ||||||||||||||||
| Average | ||||||||||||||||
| Weighted- | Remaining | |||||||||||||||
| Average | Weighted- | Contractual | ||||||||||||||
| Exercise | Average | Term | ||||||||||||||
| Warrants | Price | Fair Value | (Years) | |||||||||||||
| Balance at December 31, 2013 | 44 | $ | 8.68 | $ | 1.28 | 3.2 | ||||||||||
| Exercised | (10 | ) | 2.44 | 2.44 | ||||||||||||
| Expired | (13 | ) | 124.25 | - | ||||||||||||
| Balance at December 31, 2014 | 21 | $ | 2.44 | $ | 3.56 | 1.8 | ||||||||||
| Exercised, Granted, Expired | - | - | - | |||||||||||||
| Balance at December 31, 2015 | 21 | $ | 2.44 | $ | 1.31 | 1 | ||||||||||
| Exercisable at December 31, 2015 | 21 | $ | 2.44 | $ | 1.31 | 1 | ||||||||||
| 11. | Income Taxes |
Earnings before income taxes consists of the following:
| 2015 | 2014 | |||||||
| Sources of income (loss) before income taxes: | ||||||||
| United States | $ | (55 | ) | $ | 795 | |||
| Foreign | 210 | (608 | ) | |||||
| Total | $ | 155 | $ | 187 | ||||
- 39 -
The following is a reconciliation of the federal statutory income tax rate to income tax expense for 2015 and 2014:
| 2015 | 2014 | |||||||
| Federal Income tax at the statutory rate | $ | 51 | $ | 66 | ||||
| State income tax net of federal benefit | 9 | 9 | ||||||
| Foreign taxes | 4 | 36 | ||||||
| Non-deductible expenses | 98 | 104 | ||||||
| Deferred adjustments | 263 | -66 | ||||||
| Valuation allowance | (412 | ) | (113 | ) | ||||
| Income tax expense | $ | 13 | $ | 36 | ||||
The Company is subject to Alternative Minimum Tax (AMT), which only allows for the utilization of existing NOL carry forwards to offset 90% of AMT taxable income.
Deferred income tax assets and liabilities are recognized for the differences between the financial statement and income tax reporting basis of assets and liabilities based on currently enacted rates and laws. These differences include depreciation, net operating loss carry forwards, capital loss carry forwards, allowance for accounts receivable, stock options and warrants, prepaid expenses, capitalized software costs, cash to accrual conversion, and accrued liabilities.
Net deferred tax assets consist of the following as of December 31:
| 2015 | 2014 | |||||||
| Deferred tax assets: | ||||||||
| Accounts payable and other liabilities | $ | 137 | $ | 230 | ||||
| Depreciation and amortization | 223 | 379 | ||||||
| Net operating loss and credit carry forwards | 10,713 | 11047 | ||||||
| Other | 52 | 71 | ||||||
| Valuation allowance | (11,109 | ) | (11,521 | ) | ||||
| 16 | 206 | |||||||
| Deferred tax liabilities: | ||||||||
| Nondeductible acquired intangibles | - | (121 | ) | |||||
| Capitalized software development costs | (16 | ) | (85 | ) | ||||
| Net deferred tax asset | $ | (16 | ) | $ | (206 | ) | ||
The provision for income taxes charged to operations consists of the following for the years ended December 31:
| 2015 | 2014 | |||||||
| Current - Domestic | $ | 9 | $ | 5 | ||||
| Current - Foreign | 4 | 31 | ||||||
| Deferred - US | - | - | ||||||
| Total | $ | 13 | $ | 36 | ||||
The cumulative net operating loss available to offset future income for federal and state reporting purposes was $28,197 and $2,921, respectively, as of December 31, 2015. Available research and development and foreign tax credit carry forwards at December 31, 2015 were $749. The difference between the amount of net operating loss carry forward available for federal and state purposes is due to the fact that a substantial portion of the operating losses were generated in states in which the Company does not have ongoing operations. The Company's federal and state net operating loss carry forwards expire in various calendar years from 2016 through 2030 and the tax credit carry forwards expire in calendar years 2020 through 2028.
- 40 -
The net deferred tax assets have a valuation allowance to reserve against those deferred tax assets that the Company believes it is more likely than not that it will be unable to fully utilize the deferred tax benefits. In the event that the Company determines that a valuation allowance is no longer required, any benefits realized from the use of the NOLs and credits acquired will reduce its deferred income tax expense.
In assessing the recovery of the deferred tax assets, management considers whether it is more likely than not that a portion or all of the deferred tax assets will not be realized. The ultimate realization of deferred tax assets is dependent upon the generation of future taxable income in the periods in which those temporary differences become deductible. Management considers the scheduled reversals of future deferred tax liabilities, projected future taxable income, and tax planning strategies in making this assessment. As such, the Company has recorded a valuation allowance to offset all of its deferred tax assets.
The Company files a consolidated U.S. federal tax return. Management performed an assessment of its open returns to determine whether it is likely that interest and penalties would be assessed by taxing authorities on any underpayment of income taxes. No such underpayments of taxes for open years were noted. If such amounts were noted, the related amount would be accrued and classified as a component of income tax expenses on the consolidated statements of comprehensive income. The Company is currently open to audit under the statute of limitations by the Internal Revenue Service and the appropriate foreign and state income authorities from 2009 to 2015, due to the net operating loss carrying forwards from those years.
| 12. | 401(k) Defined Contribution Plan |
The Company has a retirement savings plan pursuant to section 401(k) of the Internal Revenue Code (the Code), whereby eligible employees may contribute a portion of their earnings, not to exceed annual amounts allowed under the Code. In addition, the Company may also make contributions at the discretion of the Board of Directors. The Company provided matching contributions to employees totaling $219 and $201 for the years ended December 31, 2015 and 2014, respectively.
| 13. | Commitments and Contingencies |
Capital Leases
The Company had three finance/lease agreements with IBM Credit for the purchase of computer equipment and related software. The agreements all had initial terms of 24 months and expired at various times in 2015. Payments on the capital lease obligations, including interest was $93, in 2015.
Operating Leases
The Company leases its office buildings and certain office equipment under non-cancellable operating leases. Total rent expense under these operating leases, including amounts paid to a related party, was $476 in 2015 and $470 in 2014.
Future minimum lease payments under non-cancellable operating leases as of December 31, 2015 are as follows:
| Year Ending | ||||
| 2016 | $ | 460 | ||
| 2017 | 53 | |||
| Total | $ | 513 |
- 41 -
Severance Agreements
The Company has employment agreements with two officers, which provide for severance payments of one year’s annual salary for those officers if employment is terminated by the Company without cause.
Legal Proceedings
In the ordinary course of business, the Company is subject to legal proceedings and claims. As of the date of this report, management is not aware of any undisclosed actual or threatened litigation that would have a material adverse effect on the Company’s financial condition or results of operations. The Company expenses legal costs during the period incurred.
ITEM 9. CHANGES IN AND DISAGREEMENTS WITH ACCOUNTANTS ON ACCOUNTING AND FINANCIAL DISCLOSURE
None.
ITEM 9A. CONTROLS AND PROCEDURES
DISCLOSURE CONTROLS AND PROCEDURES
This Report includes the certifications of our Chief Executive Officer and our Chief Financial Officer required by Rule 13a-14 of the Securities Exchange Act of 1934 (the “Exchange Act”). See Exhibits 31.1 and 31.2 to this Report. This Item 9A includes information concerning the controls and control evaluations referred to in such certifications.
EVALUATION OF DISCLOSURE CONTROLS AND PROCEDURES
As required by Rule 13a-15(b) under the Exchange Act, our management carried out an evaluation, with the participation of our Chief Executive Officer and our Chief Financial Officer, of the effectiveness of the design and operation of our disclosure controls and procedures (as defined in Rule 13a-15(e) of the Exchange Act), as of the period covered by this report. Disclosure controls and procedures are defined as controls and other procedures that are designed to ensure that information required to be disclosed by us in reports filed with the SEC under the Exchange Act is recorded, processed, summarized and reported within the time periods specified in the SEC’s rules and forms. Disclosure controls and procedures include, without limitation, controls and procedures designed to ensure that information required to be disclosed by us in reports filed under the Exchange Act is accumulated and communicated to our management, including our principal executive and principal financial officers, or person performing similar functions, as appropriate to allow timely decisions regarding required disclosure. Based upon their evaluation, our management (including our Chief Executive Officer and our Chief Financial Officer) concluded that our disclosure controls and procedures were effective as of December 31, 2015.
MANAGEMENT’S REPORT ON INTERNAL CONTROL OVER FINANCIAL REPORTING
Our management is responsible for establishing and maintaining adequate internal control over financial reporting. Internal control over financial reporting is a set of processes designed by, or under the supervision of, a company’s principal executive and principal financial officers to provide reasonable assurance regarding the reliability of financial reporting and the preparation of financial statements for external purposes in accordance with GAAP and includes those policies and procedures that:
| · | pertain to the maintenance of records that in reasonable detail accurately and fairly reflect our transactions and dispositions of our assets, |
| · | provide reasonable assurance our transactions are recorded as necessary to permit preparation of our financial statements in accordance with GAAP, and that receipts and expenditures are being made only in accordance with authorizations of our management and directors, and |
| · | provide reasonable assurance regarding prevention or timely detection of unauthorized acquisition, use or disposition of our assets that could have a material effect on the financial statements. |
Because of its inherent limitations, internal control over financial reporting may not prevent or detect misstatements. It should be noted that any system of internal control, however well designed and operated, can provide only reasonable, and not absolute, assurance that the objectives of the system will be met. Also, projections of any evaluation of effectiveness to future periods are subject to the risk that controls may become inadequate because of changes in conditions, or that the degree of compliance with the policies or procedures may deteriorate.
- 42 -
Under the supervision and with the participation of management, including its principal executive officer and principal financial officer, Sajan’s management assessed the design and operating effectiveness of internal control over financial reporting as of December 31, 2015 based on the 1992 framework set forth in Internal Control—Integrated Framework issued by the Committee of Sponsoring Organizations of the Treadway Commission. Management has compared our internal controls implemented under the COSO 1992 framework to the newly issued COSO 2013 framework and determined based on our business no material gaps exist in internal control. Based on this assessment, management believes that, as of December 31, 2015, Sajan’s internal control over financial reporting is effective based on these criteria.
Grant Thornton LLP, an independent registered public accounting firm, is not required to issue, and thus has not issued, an attestation report on Sajan’s internal control over financial reporting as of December 31, 2015.
CHANGES IN INTERNAL CONTROL OVER FINANCIAL REPORTING
There were no changes in our internal controls over financial reporting identified in connection with the evaluation required by paragraph (d) of Rule 13a-15 or Rule 15d-15 under the Exchange Act that occurred during the Company’s fourth fiscal quarter that have materially affected, or are reasonably likely to materially affect, such controls.
None.
ITEM 10. DIRECTORS, EXECUTIVE OFFICERS, AND CORPORATE GOVERNANCE.
The information required by Item 10 is incorporated by reference to the sections entitled “Election of Directors,” “Executive Officers,” “Corporate Governance,” “Meetings and Committees of the Board of Directors,” “Qualifications of Candidates for Election to the Board,” “Stockholder Recommendations for Directors,” “Stockholder Communications with the Board of Directors,” and “Section 16(a) Beneficial Ownership Reporting Compliance” in our definitive proxy statement relating to our 2016 Annual Meeting of Stockholders.
ITEM 11. EXECUTIVE COMPENSATION.
The information required by Item 11 is incorporated by reference to the sections entitled “Executive Compensation” and “Director Compensation” in our definitive proxy statement relating to our 2016 Annual Meeting of Stockholders.
ITEM 12. SECURITY OWNERSHIP OF CERTAIN BENEFICIAL OWNERS AND MANAGEMENT AND RELATED STOCKHOLDER MATTERS.
The information required by Item 12 is incorporated by reference to the sections entitled “Beneficial Ownership of Common Stock” and “Securities Authorized for Issuance Under Equity Compensation Plans” in our definitive proxy statement relating to our 2016 Annual Meeting of Stockholders.
ITEM 13. CERTAIN RELATIONSHIPS AND RELATED TRANSACTIONS, AND DIRECTOR INDEPENDENCE.
The information required by Item 13 is incorporated by reference to the sections entitled “Corporate Governance” and “Certain Relationships and Related Transactions” in our definitive proxy statement relating to our 2016 Annual Meeting of Stockholders.
- 43 -
ITEM 14. PRINCIPAL ACCOUNTING FEES AND SERVICES.
The information required by Item 14 is incorporated by reference to the section entitled “Audit and Non-Audit Services and Fees Billed to Company by Independent Registered Public Accounting Firm,” included in the proposal to ratify the appointment of our independent registered public accounting firm in our definitive proxy statement relating to our 2016 Annual Meeting of Stockholders.
ITEM 15. EXHIBITS, FINANCIAL STATEMENT SCHEDULES
FINANCIAL STATEMENTS
FINANCIAL STATEMENT SCHEDULES
None.
EXHIBITS
See Exhibit Index to Form 10-K immediately following the signature page hereto, which is incorporated herein by reference.
- 44 -
Pursuant to the requirements of Section 13 or 15(d) of the Securities Exchange Act of 1934, the registrant has duly caused this report to be signed on its behalf by the undersigned, thereunto duly authorized.
| Date: March 16, 2016 | /s/ Shannon Zimmerman | ||
| Shannon Zimmerman, Director, Chairman, Chief Executive Officer, and President (Principal Executive Officer) |
|||
| Date: March 16, 2016 | /s/ Thomas Skiba | ||
| Thomas Skiba, Chief Financial Officer (Principal Financial Officer and Principal Accounting Officer) |
- 45 -
POWER OF ATTORNEY
Each person whose signature appears below constitutes SHANNON ZIMMERMAN and THOMAS SKIBA, as his or her true and lawful attorney-in-fact and agent, each acting alone, with full power of substitution and resubstitution, for him or her and in his or her name, place and stead, in any and all capacities, to sign any or all amendments to this Annual Report on Form 10-K and to file the same, with all exhibits thereto, and other documents in connection therewith, with the Securities and Exchange Commission, granting unto said attorney-in-fact and agent, full power and authority to do and perform each and every act and thing requisite and necessary to be done in and about the premises, as fully to all intents and purposes as he or she might or could do in person, hereby ratifying and confirming all said attorney-in-fact and agent, or his substitute or substitutes, may lawfully do or cause to be done by virtue thereof.
Pursuant to the requirements of the Securities Exchange Act of 1934, this report has been signed below by the following persons on behalf of the registrant and in the capacities and on the dates indicated.
| Date: March 16, 2016 | /s/ Shannon Zimmerman | |
| Shannon Zimmerman, Director, Chairman, Chief Executive Officer, and President (Principal Executive Officer) | ||
| Date: March 16, 2016 | /s/ Angela Zimmerman | |
| Angela (Angel) Zimmerman, Director | ||
| Date: March 16, 2016 | /s/ Thomas Skiba | |
| Thomas Skiba, Chief Financial Officer (Principal Financial Officer and Principal Accounting Officer) | ||
| Date: March 16, 2016 | /s/ Michael W. Rogers | |
| Michael W. Rogers, Director | ||
| Date: March 16, 2016 | /s/ Benno G. Sand | |
| Benno G. Sand, Director | ||
| Date: March 16, 2016 | /s/ Benjamin Allen | |
| Benjamin Allen, Director |
EXHIBIT INDEX
SAJAN, INC.
ANNUAL REPORT FOR THE YEAR ENDED DECEMBER 31, 2015
| Exhibit No. | Description | |
| 2.1 | Agreement and Plan of Merger, dated January 8, 2010, among MathStar, Inc., Sajan, Inc., Garuda Acquisition, LLC, and Thomas Magne (incorporated by reference to Exhibit 2.1 to the Company’s Current Report on Form 8-K filed with the Securities and Exchange Commission (“SEC”) on January 11, 2010). | |
| 3.1 | Certificate of Incorporation of the Company as amended through June 16, 2014 (incorporated by reference to Exhibit 3.1 to the Company’s Quarterly Report on Form 10-Q filed with the SEC on July 23, 2014). | |
| 3.2 | Bylaws of the Company (incorporated by reference to Exhibit 3.2 to the Company’s Registration Statement on Form S-1 filed with the SEC on August 3, 2005, Registration No. 333-127164 (“Registration Statement”)). | |
| 4.1 | Form of Common Stock certificate of the Company (incorporated by reference to Exhibit 4.1 to the Company’s Quarterly Report on Form 10-Q filed with the SEC on July 23, 2014). | |
| 4.2 | Tax Benefit Preservation Plan and Rights Agreement, dated as of February 25, 2010, between the Company and Wells Fargo Shareowner Services, a division of Wells Fargo Bank, National Association, as Rights Agent, together with the following exhibits thereto: Exhibit A - Form of Certificate of Designation of Series A Preferred Stock of the Company; Exhibit B — Form of Right Certificate; Exhibit C — Summary of Rights to Purchase Shares of Preferred Stock of the Company (incorporated by reference to Exhibit 4.1 to the Company’s Current Report on Form 8-K filed with the SEC on February 25, 2010). | |
| 4.3 | Amendment No. 1 to Tax Benefit Preservation Plan and Rights Agreement by and between Sajan, Inc. and Wells Fargo Bank, N.A., as Rights Agent (incorporated by reference to Exhibit 4.2 to the Company’s Amendment No. 1 to Registration Statement on Form 8-A, dated and filed May 1, 2014, SEC File No. 000-51360). | |
| 10.1* | The Company’s 2004 Amended and Restated Long-Term Incentive Plan (incorporated by reference to Exhibit 10.1 to the Company’s Current Report on Form 8-K filed with the SEC on May 17, 2007). | |
| 10.2* | Form of Incentive Stock Option Agreement (incorporated by reference to Exhibit 10.2 to the Company’s Current Report on Form 8-K filed with the SEC on February 24, 2010). | |
| 10.3* | Form of Non-Statutory Stock Option Agreement for non-employee directors (incorporated by reference to Exhibit 10.5 to the Company’s Current Report on Form 8-K filed with the SEC on February 24, 2010). | |
| 10.4* | Form of Common Stock Purchase Warrant (incorporated by reference to Exhibit 10.6 to the Company’s Current Report on Form 8-K filed with the SEC on February 24, 2010). | |
| 10.5* | Employment Agreement, dated May 19, 2006, and as amended on February 1, 2010, between Sajan, Inc. and Angela Zimmerman (incorporated by reference to Exhibit 10.8 to the Company’s Current Report on Form 8-K filed with the SEC on February 24, 2010). | |
| 10.6* | Employment Agreement, dated May 19, 2006, and as amended on February 1, 2010, between Sajan, Inc. and Shannon Zimmerman (incorporated by reference to Exhibit 10.8 to the Company’s Current Report on Form 8-K filed with the SEC on February 24, 2010). |
|
10.7 |
Standard Office Lease Agreement (No. 1) between Sajan, Inc. and River Valley Business Center, LLC, dated February 1, 2010 (incorporated by reference to Exhibit 10.12 to the Company’s Current Report on Form 8-K filed with the SEC on February 24, 2010). | |
| 10.8 | Standard Office Lease Agreement (No. 2) between Sajan, Inc. and River Valley Business Center, LLC, dated February 1, 2010 (incorporated by reference to Exhibit 10.13 to the Company’s Current Report on Form 8-K filed with the SEC on February 24, 2010). | |
| 10.9 | Standard Office Lease Agreement (No. 3) between Sajan, Inc. and River Valley Business Center, LLC, effective February 28, 2012 (incorporated by reference to Exhibit 10.10 to the Company’s Annual Report on Form 10-K for the fiscal year ended December 31, 2011). | |
| 10.10 | Promissory Note, dated February 23, 2010, in the original principal amount of $1,000,000 issued by the Company to Shannon and Angel Zimmerman (incorporated by reference to Exhibit 10.14 to the Company’s Current Report on Form 8-K filed with the SEC on February 24, 2010). | |
| 10.11 | Form of Indemnification Agreement between the Company and its officers and directors (incorporated by reference to Exhibit 10.2 to the Company’s Quarterly Report on Form 10-Q for the fiscal quarter ended September 30, 2010). | |
| 10.12 | Amendment to Promissory Note dated February 22, 2011 (incorporated by reference to Exhibit 10.1 to the Company’s Current Report on Form 8-K filed with the SEC on February 24, 2011). | |
| 10.13 | Second Amendment, dated March 26, 2012, to Promissory Note dated February 23, 2010 (incorporated by reference to Exhibit 10.17 to the Company’s Annual Report on Form 10-K for the fiscal year ended December 31, 2011). | |
| 10.14 | Amended and Restated Loan and Security Agreement dated March 28, 2013, by and among Sajan, Inc. and Silicon Valley Bank (incorporated by reference to Exhibit 10.17 to the Company’s Annual Report on Form 10-K for the year ended December 31, 2012 filed with the SEC on March 29, 2013). | |
| 10.15 | Subordination Agreement dated March 28, 2013, by and among Sajan, Inc., Angel and Shannon Zimmerman and Silicon Valley Bank (incorporated by reference to Exhibit 10.18 to the Company’s Annual Report on Form 10-K for the year ended December 31, 2012 filed with the SEC on March 29, 2013). | |
| 10.16 | Third Amendment, dated March 21, 2013, to Promissory Note dated February 23, 2010 (incorporated by reference to Exhibit 10.19 to the Company’s Annual Report on Form 10-K for the year ended December 31, 2012 filed with the SEC on March 29, 2013). | |
| 10.17* | Employment Agreement, between the Company and Tom Skiba, dated August 29, 2013 (incorporated by reference to Exhibit 10.1 to the Company’s Current Report on Form 8-K filed with the SEC on August 29, 2013). | |
| 10.18* | Sajan Short-Term Incentive Plan (incorporated by reference to Exhibit 10.1 to the Company’s Current Report on Form 8-K filed with the SEC on April 1, 2014). | |
| 10.19* | Sajan, Inc. 2014 Equity Incentive Plan (incorporated by reference to Exhibit 10.1 to the Company’s Current Report on Form 8-K filed with the SEC on June 16, 2014). | |
| 10.20* | Sajan, Inc. Incentive Stock Option Agreement (incorporated by reference to Exhibit 10.2 to the Company’s Current Report on Form 8-K filed with the SEC on June 16, 2014). | |
| 10.21* | Sajan, Inc. Nonqualified Stock Option Agreement (incorporated by reference to Exhibit 10.3 to the Company’s Current Report on Form 8-K filed with the SEC on June 16, 2014). |
|
10.22* |
Sajan, Inc. Restricted Stock Agreement (incorporated by reference to Exhibit 10.4 to the Company’s Current Report on Form 8-K filed with the SEC on June 16, 2014). | |
| 10.23* | Sajan, Inc. Restricted Stock Unit Agreement (incorporated by reference to Exhibit 10.5 to the Company’s Current Report on Form 8-K filed with the SEC on June 16, 2014). | |
| 10.24* | First Amendment to Employment Agreement, between the Company and Thomas P. Skiba, dated March 9, 2015 (incorporated by reference to Exhibit 10.1 to the Company’s Current Report on Form 8-K filed with the SEC on March 10, 2015). | |
| 10.25 | First Amendment to Amended and Restated Loan and Security Agreement dated March 26, 2015, by and between Sajan, Inc. and Silicon Valley Bank (incorporated by reference to Exhibit 10.1 to the Company’s Current Report on Form 8-K filed with the SEC on March 31, 2015). | |
| 10.26 | Second Amendment to Amended and Restated Loan and Security Agreement dated May 5, 2015, by and between Sajan, Inc. and Silicon Valley Bank (incorporated by reference to Exhibit 10.1 to the Company’s Quarterly Report on Form 10-Q for the fiscal quarter ended June 30, 2015 filed with the SEC on August 6, 2015). | |
| 10.27* | Offer Letter between Sajan, Inc. and Paul Rome dated May 14, 2015 (incorporated by reference to Exhibit 10.1 to the Company’s Current Report on Form 8-K filed with the SEC on May 20, 2015). | |
| 21.1 | Subsidiaries of Sajan, Inc. (filed herewith). | |
| 23.1 | Consent from Grant Thornton LLP (filed herewith). | |
| 23.2 | Consent from Baker Tilly Virchow Krause, LLP (filed herewith). | |
| 24.1 | Power of Attorney (included on signature page). | |
| 31.1 | Certification of principal executive officer pursuant to Rule 13a-14(a)/15d-14(a) (filed herewith). | |
| 31.2 | Certification of principal financial officer pursuant to Rule 13a-14(a)/15d-14(a) (filed herewith). | |
| 32.1 | Certification of principal executive officer pursuant to 18 U.S.C. 1350, as adopted pursuant to Section 906 of the Sarbanes-Oxley Act of 2002 (filed herewith). | |
| 32.2 | Certification of principal financial officer pursuant to 18 U.S.C. 1350, as adopted pursuant to Section 906 of the Sarbanes-Oxley Act of 2002 (filed herewith). | |
| 101 | The following financial statements from the Company’s Annual Report on Form 10-K for the year ended December 31, 2015, formatted in Extensible Business Reporting Language (XBRL): (i) the Consolidated Balance Sheets, (ii) the Consolidated Statements of Comprehensive Income, (iii) the Consolidated Statements of Cash Flows, (iv) the Consolidated Statements of Stockholders’ Equity, and (v) the Notes to the Consolidated Financial Statements. | |
| * | Indicates a management contract or compensatory plan or arrangement. |