Attached files
| file | filename |
|---|---|
| EX-10.7 - EX-10.7 - Hortonworks, Inc. | d78327dex107.htm |
| EX-31.2 - EX-31.2 - Hortonworks, Inc. | d78327dex312.htm |
| EX-31.1 - EX-31.1 - Hortonworks, Inc. | d78327dex311.htm |
| EX-21.1 - EX-21.1 - Hortonworks, Inc. | d78327dex211.htm |
| EX-23.1 - EX-23.1 - Hortonworks, Inc. | d78327dex231.htm |
| EX-32.1 - EX-32.1 - Hortonworks, Inc. | d78327dex321.htm |
Table of Contents
UNITED STATES
SECURITIES AND EXCHANGE COMMISSION
Washington, D.C. 20549
FORM 10-K
(Mark One)
| x | ANNUAL REPORT PURSUANT TO SECTION 13 OR 15(d) OF THE SECURITIES EXCHANGE ACT OF 1934 |
For the fiscal year ended December 31, 2015
OR
| ¨ | TRANSITION REPORT PURSUANT TO SECTION 13 OR 15(d) OF THE SECURITIES EXCHANGE ACT OF 1934 |
FOR THE TRANSITION PERIOD FROM TO
Commission File Number 001-36780
Hortonworks, Inc.
(Exact name of Registrant as specified in its Charter)
| Delaware | 37-1634325 | |
| (State or other jurisdiction of incorporation or organization) |
(I.R.S. Employer Identification No.) | |
| 5470 Great America Parkway Santa Clara, CA |
95054 | |
| (Address of principal executive offices) | (Zip Code) | |
Registrant’s telephone number, including area code: (408) 916-4121
Securities registered pursuant to Section 12(b) of the Act:
| Title of each class |
Name of each exchange on which registered | |
| Common Stock, Par Value $0.0001 Per Share | The NASDAQ Stock Market LLC |
Securities registered pursuant to Section 12(g) of the Act: None
Indicate by check mark if the Registrant is a well-known seasoned issuer, as defined in Rule 405 of the Securities Act. YES ¨ NO x
Indicate by check mark if the Registrant is not required to file reports pursuant to Section 13 or 15(d) of the Act. YES ¨ NO x
Indicate by check mark whether the Registrant: (1) has filed all reports required to be filed by Section 13 or 15(d) of the Securities Exchange Act of 1934 during the preceding 12 months (or for such shorter period that the Registrant was required to file such reports), and (2) has been subject to such filing requirements for the past 90 days. YES x NO ¨
Indicate by check mark whether the Registrant has submitted electronically and posted on its corporate Web site, if any, every Interactive Data File required to be submitted and posted pursuant to Rule 405 of Regulation S-T (§232.405 of this chapter) during the preceding 12 months (or for such shorter period that the Registrant was required to submit and post such files). YES x NO ¨
Indicate by check mark if disclosure of delinquent filers pursuant to Item 405 of Regulation S-K (§229.405) is not contained herein, and will not be contained, to the best of Registrant’s knowledge, in definitive proxy or information statements incorporated by reference in Part III of this Form 10-K or any amendment to this Form 10-K. ¨
Indicate by check mark whether the Registrant is a large accelerated filer, an accelerated filer, a non-accelerated filer, or a smaller reporting company. See the definition of “large accelerated filer”, “accelerated filer”, and “smaller reporting company” in Rule 12b-2 of the Exchange Act. (Check one):
| Large accelerated filer |
¨ |
Accelerated filer |
x | |||
| Non-accelerated filer |
¨ (Do not check if a small reporting company) |
Small reporting company |
¨ | |||
Indicate by check mark whether the Registrant is a shell company (as defined in Rule 12b-2 of the Exchange Act). YES ¨ NO x
As of June 30, 2015, the last business day of the Registrant’s most recently completed second fiscal quarter, the aggregate market value of the voting and non-voting stock held by non-affiliates of the Registrant, based on the closing sales price for the Registrant’s common stock, as reported on the NASDAQ Global Select Market was approximately $671.9 million.
The number of shares of Registrant’s common stock outstanding as of March 4, 2016 was 56,615,440.
DOCUMENTS INCORPORATED BY REFERENCE
Portions of the registrant’s definitive proxy statement for the registrant’s 2016 Annual Meeting of Stockholders are incorporated herein by reference to the extent stated herein. Such definitive proxy statement will be filed with the Securities and Exchange Commission within 120 days of registrant’s fiscal year ended December 31, 2015.
Table of Contents
| Page | ||||||
| Item 1. |
1 | |||||
| Item 1A. |
14 | |||||
| Item 1B. |
36 | |||||
| Item 2. |
36 | |||||
| Item 3. |
36 | |||||
| Item 4. |
36 | |||||
| Item 5. |
37 | |||||
| Item 6. |
40 | |||||
| Item 7. |
Management’s Discussion and Analysis of Financial Condition and Results of Operations |
43 | ||||
| Item 7A. |
67 | |||||
| Item 8. |
67 | |||||
| Item 9. |
Changes in and Disagreements with Accountants on Accounting and Financial Disclosure |
109 | ||||
| Item 9A. |
109 | |||||
| Item 9B. |
110 | |||||
| Item 10. |
111 | |||||
| Item 11. |
111 | |||||
| Item 12. |
Security Ownership of Certain Beneficial Owners and Management and Related Stockholder Matters |
111 | ||||
| Item 13. |
Certain Relationships and Related Transactions, and Director Independence |
111 | ||||
| Item 14. |
111 | |||||
| Item 15. |
112 | |||||
i
Table of Contents
SPECIAL NOTE REGARDING FORWARD-LOOKING STATEMENTS
This Annual Report on Form 10-K contains forward-looking statements within the meaning of Section 27A of the Securities Act of 1933, as amended (the “Securities Act”), and Section 21E of the Securities Exchange Act of 1934, as amended (the “Exchange Act”), which statements involve substantial risks and uncertainties. Forward-looking statements generally relate to future events or our future financial or operating performance. In some cases, you can identify forward-looking statements because they contain words such as “may,” “will,” “should,” “expects,” “plans,” “anticipates,” “could,” “intends,” “target,” “projects,” “contemplates,” “believes,” “estimates,” “predicts,” “potential” or “continue” or the negative of these words or other similar terms or expressions that concern our expectations, strategy, plans or intentions. Forward-looking statements contained in this Annual Report on Form 10-K include, but are not limited to, statements about:
| • | our future financial performance, including our revenue, cost of revenue, gross profit or gross margin, operating expenses, ability to generate positive cash flow and ability to achieve and maintain profitability; |
| • | the sufficiency of our cash and cash equivalents to meet our liquidity needs; |
| • | our ability to increase the number of support subscription customers; |
| • | our ability to renew and expand existing customer deployments; |
| • | our ability to optimize the pricing for our support subscription offerings; |
| • | the growth in the usage and acceptance of the Hadoop framework; |
| • | our ability to innovate and develop the various open source projects that will enhance the capabilities of the Hortonworks Data Platform (“HDP” ™) and Hortonworks DataFlow Platform (“HDF” ™); |
| • | our ability to provide superior support subscription offerings and professional services; |
| • | our ability to successfully expand in our existing markets and into new domestic and international markets; |
| • | our ability to effectively manage our growth and future expenses; |
| • | our ability to maintain, protect and enhance our intellectual property; |
| • | worldwide economic conditions and their impact on corporate and enterprise spending; |
| • | our ability to comply with modified or new laws and regulations applying to our business, including copyright and privacy regulation; and |
| • | the attraction and retention of qualified employees and key personnel. |
We caution you that the foregoing list may not contain all of the forward-looking statements made in this Annual Report on Form 10-K.
You should not rely upon forward-looking statements as predictions of future events. We have based the forward-looking statements contained in this Annual Report on Form 10-K primarily on our current expectations and projections about future events and trends that we believe may affect our business, financial condition, results of operations and prospects. The outcome of the events described in these forward-looking statements is subject to risks, uncertainties and other factors described in “Risk Factors” and elsewhere in this Annual Report on Form 10-K. Moreover, we operate in a very competitive and rapidly changing environment. New risks and uncertainties emerge from time to time, and it is not possible for us to predict all risks and uncertainties that could have an impact on the forward-looking statements contained in this Annual Report on Form 10-K. We cannot assure you that the results, events and circumstances reflected in the forward-looking statements will be achieved or occur, and actual results, events, or circumstances could differ materially from those described in the forward-looking statements.
The forward-looking statements made in this Annual Report on Form 10-K relate only to events as of the date on which the statements are made. We undertake no obligation to update any forward-looking statements made in this Annual Report on Form 10-K to reflect events or circumstances after the date of this Annual Report on Form 10-K or to reflect new information or the occurrence of unanticipated events, except as required by law. We may not actually achieve the plans, intentions, or expectations disclosed in our forward-looking statements and you should not place undue reliance on our forward-looking statements. Our forward-looking statements do not reflect the potential impact of any future acquisitions, mergers, dispositions, joint ventures or investments we may make.
Unless the context requires otherwise, we are referring to Hortonworks, Inc. and its consolidated subsidiaries when we use the terms “Hortonworks,” the “Company,” “we,” “our” or “us.”
ii
Table of Contents
Company Overview
Our mission is to power the future of data and accelerate business transformations for our customers by developing, distributing and supporting a new class of data management software solutions built on open source technology. Hortonworks® customers use our enterprise-scale “Connected Data Platforms” to build transformational data applications fueled by actionable intelligence from information that flows over a network, such as the internet or corporate networks, or Data in Motion, and information that is stored in digital form in a file system, database or other storage medium, or Data at Rest.
Our Data at Rest solution, the Hortonworks Data Platform (“HDP”), is an enterprise-scale data management platform built entirely on open source software including Apache Hadoop. HDP combines computer servers with local storage and open source software technology to create a reliable distributed compute and storage platform for large data sets that is secure and scalable up to petabytes of data within thousands of servers or nodes. At the core of HDP is the next generation computing and resource management framework called Yet Another Resource Negotiator (“YARN”), which enables a centralized data architecture for batch, interactive and real-time workloads to be executed simultaneously on a single cluster and data set with the comprehensive security, governance and operational services enterprise customers require. HDP integrates with existing data center technologies to support best-of-breed data architectures and enables our customers to collect, store, process and analyze increasing amounts of existing and new data types in a way that augments rather than replaces their existing data center infrastructures.
Our Data in Motion solution, the Hortonworks DataFlow Platform (“HDF”), is an enterprise-scale data ingest platform built entirely on open source software including Apache NiFi. HDF is complementary to HDP and accelerates the flow of Data in Motion into HDP to support full fidelity analytics. HDF is a real-time, integrated, secure and adaptive platform capable of ingesting any type of Data in Motion—from traditional data sources to new data types such as sensor and machine data, server log data, clickstream data, geo-location data, social and sentiment data and other data generated by documents and other file types. HDF enables customers to collect, conduct and curate their Data in Motion in order to gain real-time business insights and actionable intelligence.
We employ a differentiated strategic approach in that we are committed to continuously driving innovation and market adoption of Apache Hadoop, Apache NiFi and associated open source technologies within the Apache Software Foundation open source ecosystem. We do this by sharing all of our product development with the open source community in order to further advance open source technology development and functionality. This is ultimately consumed by enterprise customers of all types and sizes. We support the open source community and directly employ a large number of core committers to various Apache projects, including Apache Hadoop and Apache NiFi. A committer is an individual who is able to modify the source code of a particular open source project and then “commit” those changes to the central repository. We believe that keeping our business model free from architecture design conflicts that could limit the ultimate success of our customers in leveraging the benefits of open source technology at scale is a significant competitive advantage. We have been recognized as a leader in Apache Hadoop by Forrester Research, Inc. based on the strength of our offerings and our differentiated strategy.
We were founded in 2011. During 2012 we launched HDP. During 2015 we launched HDF. We sell support subscriptions and professional services offerings for both of these platforms. As of December 31, 2015, we had over 800 support subscription customers (which we generally define as an entity with an active support subscription) across a broad array of company sizes and industries. We have strategic relationships with EMC Corporation (“EMC”), Hewlett Packard Enterprise Company (“Hewlett Packard Enterprise”), Hitachi Data Systems Corporation (“Hitachi Data Systems”), Microsoft Corporation (“Microsoft”), Pivotal Software, Inc., (“Pivotal”), Rackspace Hosting, Inc., Red Hat, Inc. (“Red Hat”), SAP AG (“SAP”), Teradata Corporation
1
Table of Contents
(“Teradata”) and Yahoo! Inc. (“Yahoo!”), focused on integrated development, marketing and support strategies to maximize the success of our solutions. Consistent with our open source approach, we generally make our software platforms (HDP and HDF) available free of charge and derive the predominant amount of our revenue from customer fees for our support subscription offerings and professional services.
We have achieved significant growth in recent periods. Our revenue was $121.9 million and $46.0 million for the years ended December 31, 2015 and 2014, respectively. Effective May 1, 2013, we changed our fiscal year end from April 30 to December 31. Our revenue was $17.9 million and $4.8 million for the eight months ended December 31, 2013 and 2012, respectively, and $11.0 million and $1.6 million for the years ended April 30, 2013 and 2012, respectively. Our gross billings were $165.9 million and $87.1 million for the years ended December 31, 2015 and 2014, respectively, $29.4 million and $9.7 million for the eight months ended December 31, 2013 and 2012, respectively, and $17.6 million and $11.8 million for the years ended April 30, 2013 and 2012 respectively. We experienced net losses of $179.1 million and $177.4 million for the years ended December 31, 2015 and 2014, respectively, $46.2 million and $19.7 million for the eight months ended December 31, 2013 and 2012, respectively, and $36.6 million and $11.5 million for the years ended April 30, 2013 and 2012, respectively. See “Selected Consolidated Financial Data—Key Metric—Gross Billings” for more information and a reconciliation of gross billings to total revenue, the most directly comparable financial measure under generally accepted accounting principles (“GAAP”) in the United States and an explanation of why management uses this non-GAAP financial measure.
Hortonworks, Inc. was incorporated in Delaware in April 2011. Our principal executive offices are located at 5470 Great America Parkway, Santa Clara, California 95054, and our telephone number is (408) 916-4121. Our website address is www.hortonworks.com. Information contained on or that can be accessed through our website does not constitute part of this Annual Report on Form 10-K and inclusions of our website address in this Annual Report on Form 10-K are inactive textual references only.
Industry Background
Major technology innovations such as social media, mobile and cloud computing, new web-based applications, such as Software-as-a-Service (“SaaS”), and the emergence of the Internet of Anything, in which devices with sensors and actuators transmit increasing amounts of data automatically, have created an always-on, constantly connected society that is putting increasing pressure on enterprise data center infrastructure. The increase in volume, velocity and variety from this new “Internet of Anything” data in combination with traditional enterprise applications and data systems is creating significant challenges to enterprise data management resources and is disrupting the way enterprises design their data infrastructure.
Enterprises are not only inundated with increasing amounts of data but also struggle with managing more types of data that are less easily managed by traditional data center architectures. Historically, enterprises focused primarily on managing data from dedicated and disparate data center systems, including enterprise resource planning and customer relationship management systems. To store and process these types of data, enterprises were able to utilize relational database management systems optimized for analyzing preselected, structured data stored within isolated silos.
Today, the variety of Internet of Anything data, including new data types such as sensor and machine data, server log data, clickstream data, geo-location data, social and sentiment data and other data generated by documents and other file types, is fueling the exponential growth in the aggregate amount of data that has the potential to be captured and managed by the enterprise to drive business value. Collecting, storing, processing and analyzing these massive quantities of new context-rich Internet of Anything data sources requires new tools.
As a result of the limitations within traditional data center architectures, enterprise customers require new technologies to cost-effectively collect, store, process and analyze this vast amount of data in its original context-rich form in order to find patterns and actionable insights that enable them to capitalize on opportunities, avoid
2
Table of Contents
operational issues and enable more informed decisions. Enterprises must upgrade their data center architectures to harness large volumes of data under management in order to easily leverage existing data sources and explore new data sources in innovative ways.
Hadoop was originally developed in the early 2000s. Partnering with the Apache Hadoop community, Yahoo! led major innovations in the technology to help tackle big data challenges and operate its business at scale. The traditional Hadoop offering (i.e., Hadoop Version 1.x) was largely a batch system that enabled users to manage data at scale, but required siloed computing clusters by application with pre-selected data sets, thus limiting accessibility, interoperability and overall value. Incremental attempts to improve traditional Hadoop focused on bolting on data warehousing and analytics functionality as well as basic levels of security and operations management, which were available through a mix of separate open source projects or commercially available software. This innovation demonstrated the early promise of Hadoop in enabling enterprises to address their big data requirements, but traditional Hadoop still lacked the breadth of functionality and resiliency that would enable it to be deployed more broadly by enterprises in production use cases.
To improve on this early functionality, Hortonworks engineers created the initial architecture for YARN and developed the technology for it within the Apache Hadoop community, leading to the release of YARN in October 2013. This technology advancement transformed Hadoop (i.e., Hadoop Version 2.x) into a platform that allows for multiple ways of interacting with data, including interactive structured query language (“SQL”) processing, in-memory analytic processing, real-time stream processing and online data processing, along with its traditional batch data processing. YARN represented a significant innovation in that it eliminated the need to silo data sets and reduces total cost of ownership by enabling a single cluster of servers to store a wide range of shared data sets on which mixed workloads spanning batch, interactive and real-time use cases can simultaneously process with predictable service levels. YARN is designed to serve as a common data operating system that enables the Hadoop ecosystem to natively integrate applications and leverage existing technologies and skills while extending consistent security, governance and operations across the platform. With these capabilities, YARN as a cornerstone technology embedded within Hadoop 2.X, facilitates mainstream Hadoop adoption by enterprises of all types and sizes for production use cases at scale.
Our Opportunity
Enterprises are facing an increasing need to adopt big data strategies that will help them modernize their data center architectures, control costs and transform their businesses to succeed in an increasingly digital world. Inherent in this shift is a move from the post-transaction, reactive analysis of subsets of data to a new model of pre-transaction, proactive insights across a comprehensive and integrated data architecture capable of managing both Data in Motion and Data at Rest. We believe that enterprises that successfully adopt a big data strategy will succeed, whereas enterprises that fail or are slow to implement a modern data architecture will struggle to sustain competitive advantages.
We believe that the new class of enterprise-scale data management solutions must meet certain requirements to create and accelerate widespread market adoption and enable the modern data architecture. We believe this set of requirements include:
| • | capability to centrally manage new and existing data types; |
| • | ability to run multiple applications simultaneously on a common data architecture; |
| • | high availability, manageability, security and data governance; |
| • | interoperability with new and existing data center infrastructure investments; |
| • | stability and dependability; |
| • | scalability and affordability; |
3
Table of Contents
| • | ability to analyze all available data for rich historical insights; |
| • | ability to analyze real-time streams of data for immediate actionable insights; |
| • | ability to securely capture and mediate multi-directional data flows within and outside the data center; |
| • | ability to enable predictive analytic applications based on an open approach to actionable intelligence; and |
| • | deployment flexibility that spans on-premises and in the cloud. |
We believe that only by adopting a solution that addresses all of these needs, will enterprises be able to solve their increasing data management requirements. We believe our enterprise-scale Connected Data Platforms, comprised of HDP for Data at Rest and HDF for Data in Motion, address these needs and are fundamental to driving this architectural shift and to turn what was traditionally viewed as a cost center into a revenue generator by enabling new business applications that harness the power of big data. According to an Allied Market Research report published in March 2014, the global Hadoop market spanning hardware, software and services is expected to grow from $2.0 billion in 2013 to $50.2 billion by 2020, representing a compound annual growth rate, or CAGR, of 58 percent.
Our Solutions
We are a leading provider and distributor of a new class of enterprise-scale data management software platforms that are enabling a re-platforming of data center architectures to harness the power of big data for the enterprise. We provide support subscription offerings and related professional services for our enterprise-scale Connected Data Platforms—HDP and HDF—which are designed to manage the needs of Data in Motion and Data at Rest, respectively. Our solutions provide the following benefits:
| • | Maximizes data access to drive business transformations. Our solutions integrate all data types into “data lakes” that allow our customers to increase the scope and quality of their data management. Our solutions break down traditional data silos and allow enterprises to collect, store, process and analyze all of their data in native formats, or schema-on-read, and enable the combination of multiple context-rich data types to solve the limitations of the traditional data structures. |
| • | Common data operating system that powers big data applications. HDP leverages the benefits of YARN as a common data operating system capable of simultaneously running interactive SQL processing, in-memory analytic processing, real-time stream processing, online data processing and batch data processing workloads in a way that is natively integrated within Hadoop. Our solutions also enable new and existing third-party applications to integrate seamlessly with YARN and Hadoop. |
| • | Purpose-built for the enterprise. We engineer and certify HDP and HDF with a focus on extending their core technologies with the robust data services required by enterprise customers such as high availability, governance, security, provisioning, management and performance monitoring. |
| • | Rigorously tested and hardened for deployment at scale. Our strategic relationships with leading cloud-scale companies enable us to test and certify HDP and HDF in the most demanding production environments, assuring high quality and resilient releases at scale. We deliver value to support subscription customers by reducing implementation risk, accelerating time-to-value and helping support subscription customers scale more rapidly. |
| • | Enables best-of-breed data center architectures. We designed HDP and HDF to be fully open and integrated with new and existing investments in data center infrastructure. Our solutions are designed to renovate legacy data architectures in order to drive cost and capability improvements by working with new big data technologies that are complementary to Hadoop. |
| • | Compelling return on investment. Our solutions enable our customers to modernize their data architectures and optimize their investments supporting big data strategies. For example, the annual |
4
Table of Contents
| cost of managing a raw terabyte of data with HDP using commodity hardware can be 10 to 100 times less expensive than using high-end storage arrays. |
| • | Real-time, predictive and interactive analytics. Our solutions enable our customers to move from post-transaction, reactive analysis limited to subsets of data stored in silos to a world of pre-transaction, interactive insights across all data with the potential to enhance competitive advantages and transform businesses. |
| • | Enables modern data applications. Our solutions empower our customers to innovate new modern data applications, such as real-time cyber security applications or integration of complex physical machinery with networked sensors and software (“Industrial Internet of Things”) applications that drive transformational outcomes based on trusted actionable intelligence derived from Data in Motion and Data at Rest. |
| • | Superior deployment flexibility. Our focus on deep integration with existing data center technologies enables the leaders in the data center industry to easily adapt and extend their platforms. We are differentiated in our ability to natively support deployments on premises across both Linux and Windows, within hardware appliances and across public and private cloud platforms simultaneously. |
We are committed to serving the Apache Software Foundation open source ecosystem and to sharing all of our product developments with the open source community. We support the open source community and employ a large number of core committers to various Apache projects, including Apache Hadoop and Apache NiFi. This commitment allows us to drive the innovation of the core open source technologies within HDP and HDF, define a roadmap for the future, ensure predictable and reliable enterprise quality releases and provide comprehensive, enterprise-class support.
Products and Services
HDP and HDF are enterprise-scale Connected Data Platforms that provide modern data applications with actionable intelligence from Data in Motion and Data at Rest, respectively. They leverage 100 percent open source components, drive enterprise readiness requirements and empower the adoption of brand new innovations that come out of the Apache Software Foundation and key Apache projects.
5
Table of Contents
Products
Our product offerings include the following:
| • | Hortonworks Data Platform is an enterprise scale data management platform built entirely on open source technology, including Apache Hadoop, that enables organizations to adopt a modern data architecture. With YARN as its architectural center, HDP provides a platform for multi-workload data processing across an array of processing methods, from batch through interactive to real-time, supported by key capabilities required of an enterprise data platform, spanning data governance, security and operations. HDP integrates with and augments existing best-of-breed data center systems and tools and is the only open Enterprise Hadoop platform that provides deployment choice from cloud, an appliance, or on premises across both Windows and Linux. We released Version 2.3 of HDP in July 2015, and typically release several upgrades per year to include new functionality and new projects. |
While Apache Hadoop, through the Hadoop Distributed Filesystem (“HDFS”), YARN and MapReduce, provides the foundational capabilities for managing and accessing data at scale, the scope of the platform has expanded to incorporate a range of Apache projects that are required components of an open Enterprise Hadoop platform. HDP’s comprehensive set of capabilities is aligned to the following five functional areas: Data Management, Data Access, Data Governance and Integration, Security, and Operations.
| • | Data Management. The core components of HDP are YARN and HDFS. YARN is the architectural center of Hadoop that enables customers to process data simultaneously in multiple ways. YARN provides the resource management and pluggable architecture for enabling a wide variety of data access methods. HDFS provides the scalable, fault-tolerant, cost-efficient storage for big data. |
| • | Data Access. YARN provides the foundation for a versatile range of processing engines that empower customers to interact with the same data in multiple ways simultaneously. This means applications can interact with the data in the best way: from batch to interactive SQL, in-memory data processing, real-time streaming, or low latency access with NoSQL. Additionally, Hortonworks partners offer a range of certified data access engines as part of our YARN Ready program. |
| • | Data Governance and Integration. HDP extends data access and management with powerful tools for data governance and integration, which provide a reliable, repeatable, and simple framework for managing the flow of data into and out of the Hadoop platform. This control structure, along with a set of tooling to ease and automate the application of schema or metadata on sources is critical for successful integration of Hadoop into the modern data architecture. |
| • | Security. Security is woven-in and integrated into HDP in multiple layers. Comprehensive features spanning administration, authentication, authorization, accountability and data protection are in place so that customers can secure HDP across these key areas. HDP also ensures customers can integrate with and extend their current security solutions to provide a single, consistent, secure umbrella over their modern data architecture. |
| • | Operations. Operations teams deploy, monitor and manage a Hadoop cluster within their broader enterprise data ecosystem. HDP delivers a comprehensive set of operational capabilities that provide both visibilities into the health of the cluster as well as tooling to automate deployment, manage configuration and optimize performance across all data access methods. |
| • | Hortonworks Sandbox is a personal, portable and free to use Hadoop environment designed to provide the easiest way to get started with HDP. Hortonworks’ Sandbox includes HDP in an easy-to-use form and comes packaged with dozens of interactive Hadoop tutorials from us, our partners and the broader Hadoop community that are all designed to provide the fastest path to value with Enterprise Hadoop. The tutorials we provide are built on the experience gained from training thousands of people |
6
Table of Contents
| in our Hortonworks University Training classes. Users are able to leverage the Hortonworks Sandbox as a way to prove the concept of their initial use cases before engaging with us around professional services and support subscription offerings. |
| • | Hortonworks DataFlow, powered by Apache NiFi, is a new platform offering introduced in 2015 that came as a result of the acquisition of Onyara, Inc. (“Onyara”), the creator of and key contributor to Apache NiFi. HDF makes it easier to automate and secure Internet of Anything data flows and to collect, conduct and curate real-time business insights and actions derived from Data in Motion, including sensors, machines, geolocation devices, clicks, server logs and social feeds. HDF simplifies and accelerates the flow of Data in Motion into HDP for rich analytics, and the combined use of these complementary offerings provides a holistic set of solutions to manage and find value in the increasing volume of streaming Internet of Anything data. |
Development
We embrace an open source software development model that uses the collective input, resources and knowledge of a global community of contributors collaborating primarily within the Apache Software Foundation open source community on developing, maintaining and enhancing Apache Hadoop. We employ the largest number of active Apache Software Foundation committers, as defined by the Apache Software Foundation, and Project Management Committee (“PMC”) members of any company for the Enterprise Hadoop projects within HDP, including Apache Hadoop, Apache Hive, Apache Pig, Apache Tez, Apache Calcite, Apache HBase, Apache Phoenix, Apache Accumulo, Apache Storm, Apache Spark, Apache Kafka, Apache Slider, Apache Ambari, Apache Ranger, Apache Knox, Apache Atlas, Apache Falcon, Apache Oozie, Apache Sqoop, Apache Flume and Apache Zookeeper. The number of active committers and active PMC members that are employed by us and focused on the Apache Hadoop project individually as well in total across all of the Apache projects listed above is twice or more of the total of the next largest employer of such committers. These employees enable us to drive innovation, define a roadmap for the future of Enterprise Hadoop, ensure predictable and reliable enterprise quality releases and provide comprehensive, enterprise-class support.
We believe that we benefit from this open source development model because we are able to offer our software more quickly and with lower development cost than is typical of many software vendors who use a proprietary model to develop their products. Our open source development model also benefits our support subscription customers and partners, who are able to take advantage of the quality and value of open source software that we help to define, develop, integrate, test, certify, deliver, maintain, enhance and support. Our research and development expenses were $66.6 million and $37.8 million for the years ended December 31, 2015 and 2014, respectively, $14.6 million and $6.8 million for the eight months ended December 31, 2013 and 2012, respectively, and $12.1 million and $6.9 million for the years ended April 30, 2013 and 2012, respectively.
Licensing
The HDP and HDF software platforms are primarily provided under the Apache open source license in order to provide recipients with broad rights to use, copy, modify and redistribute the software. These broad rights provide the transparency into our software platforms that enables our end users, including our customers and partners, to provide informed suggestions, changes and enhancements to the software based on their use cases and business needs. Consistent with our open source approach, we generally make the HDP and HDF software platforms available free of charge and derive the predominant amount of our revenue from customer fees from support subscription offerings and professional services.
Support Subscriptions
We provide support primarily under annual or multi-year subscriptions. A support subscription generally entitles a customer to a specified scope of support, as well as security updates, fixes, functionality enhancements and
7
Table of Contents
upgrades to the technology and new versions of the software, if and when available, and compatibility with an ecosystem of certified hardware and software applications. Our support subscriptions are typically non-cancelable and paid for in advance, and are generally consistent among our customers. On occasion, we may sell a premium subscription agreement that provides a customer with development input and the opportunity to work more closely with our developers.
Support subscription offerings for the HDP and HDF software platforms are designed to assist our customers throughout the entire lifecycle: from development and proof-of-concept, to quality assurance and testing, to production and deployment. Both offerings provide support incidents with up to 24x7, one-hour response available from us or select independent software vendor and original equipment manufacturer (“OEM”) partners. Support subscriptions for HDP and HDF include but are not limited to remote troubleshooting, advanced knowledgebase, online self-paced training courses, access to upgrades, updates and patches, diagnosis of installation and configuration issues, diagnosis of cluster management and performance issues, diagnosis of data loading, processing and query issues, as well as application development advice and compatibility with an ecosystem of certified hardware and software applications.
In June 2015, we enriched our support subscriptions for HDP with the introduction of Hortonworks’ SmartSense™ offering, a proactive and intelligent support service for enhancing cluster utilization and health. The SmartSense offering proactively monitors machine data from Hadoop clusters, identifies potential issues and recommends specific solutions and actions. It enhances the value of existing HDP support subscriptions by enabling faster support case resolution along with proactive cluster configuration and optimization via an intelligent stream of cluster analytics and data-driven recommendations.
Professional Services
We offer a range of professional services that are designed to help our customers derive additional value from deploying the HDP and HDF software platforms.
| • | Training. We provide scenario-based Enterprise Hadoop training classes for developers, system administrators and data analysts available in classroom, corporate on-site and online settings, along with examinations that enable individuals to establish themselves as Certified Hadoop Professionals. Our training classes help populate customers with skilled professionals who often serve as internal experts and open source advocates, increasing opportunities for successful adoption and use of our software platforms. |
| • | Consulting. We also provide the services of experienced consultants, principally in connection with our technology offerings, to assist with the needs of our customers such as deployment assessments, implementations, upgrade planning, platform migrations, solution integration and application development. By providing consulting services, directly and with our certified system integrator partners, we facilitate adoption of our software platforms. |
Sales and Marketing
Our sales and marketing teams work together to drive market awareness, build a strong sales pipeline and cultivate customer relationships to drive revenue growth.
Our sales organization consists of a direct sales team and reseller partners who work in collaboration with our direct sales team to identify new sales prospects, sell our support subscriptions and professional services and provide post-sale support. Our direct field sales organization is responsible for targeting enterprise and government accounts globally. Our direct inside sales organization is responsible for targeting medium-size and smaller organizations. Our business development team works with our direct field sales organization to manage the collaboration between our direct field sales team and our strategic and reseller partners. We believe this
8
Table of Contents
direct-touch sales approach allows us to leverage the benefits of the channel as well as maintain face-to-face interaction with our customers, including key enterprise accounts. We expect to continue to grow our sales headcount in all markets, particularly in countries where we currently do not have a direct sales presence.
Our sales organization is supported by sales engineers with deep technical domain expertise who are responsible for pre-sales technical support, solutions engineering for our customers, proof of concept work and technical training for our channel partners. Our sales engineers also act as liaisons between our customers and our marketing and product development organizations.
Our marketing is focused on building our brand reputation and the market awareness of our platforms for Data in Motion and Data at Rest, our role in leading the definition and innovation related to enabling modern data applications that rely on our platforms, driving customer demand and a strong sales pipeline, and working with our partners around the globe. Our marketing team consists of corporate marketing and communications, product marketing, partner marketing, field marketing and lead development personnel. Marketing activities include demand generation, advertising, managing our corporate website and partner portal, social media and audience engagement, trade shows and conferences, press and analyst relations, customer references and customer awareness. We are also actively engaged in driving global thought leadership programs through our website, blogs, media and the annual Hadoop Summit conferences that we have hosted and managed both in the United States and Europe since 2012.
Customers
Our support subscription customer base has grown to over 800 support subscription customers as of December 31, 2015 from 332 support subscription customers as of December 31, 2014. Our support subscription customer count consists of organizations that have purchased support subscriptions offerings; we exclude users of Hortonworks Sandbox from our support subscription customer count because we do not have support subscription arrangements with, and do not generate revenue from, users of Hortonworks Sandbox. In situations where there are multiple support subscription contracts with multiple subsidiaries or divisions, universities or governmental organizations of a single entity, the entity is counted once. We provide products and services to support subscription customers of varying sizes, including enterprises, educational institutions and government agencies. Our current support subscription customer base spans numerous vertical markets, including online services, education, financial services, government, healthcare/pharmaceuticals, industrials/manufacturing, media/entertainment, oil/gas, retail/ecommerce, technology and telecommunications. See Note 13 to our consolidated financial statements for a summary of revenue by geographic area.
Strategic Relationships
To facilitate the widespread deployment of the HDP and HDF software platforms, we have focused on cultivating broad support for our technologies from the providers of enterprise software, infrastructure and systems integrator services critical to enterprises. We have strategic relationships and reseller arrangements with third parties whereby our support subscriptions are bundled with such third parties’ products and services.
We have established strategic relationships with Hewlett Packard Enterprise, Microsoft, Red Hat and Teradata that involve tightly integrated development, marketing and support strategies to maximize the success of our solutions.
We have established a strategic relationship with Pivotal that includes joint engineering to extend the enterprise capabilities of Apache Hadoop and YARN with Pivotal technologies like HAWQ and GemFire, certification of Pivotal’s Big Data Suite on HDP and a support agreement covering Pivotal HD 3.0.
9
Table of Contents
We have established a strategic relationship with a joint engineering commitment with Hitachi Data Systems to promote and support Enterprise Hadoop. Through this partnership, Hitachi Data Systems also resells the HDP offering to its enterprise customer base.
We have established a strategic relationship with a joint engineering commitment with EMC to promote and support Enterprise Hadoop. Through this partnership, EMC also resells the HDP offering to its enterprise customer base via their Technology Connect Partner Program as a Select Partner.
We have established a strategic industry association, ODPi, with other leading technology companies in the big data sector. This industry association is aimed at speeding Hadoop adoption through ecosystem interoperability rooted in open source. As ecosystem and solution providers create value from Hadoop through the ODPi’s ongoing efforts, enterprise customers will see the benefits of increased choice with more big data applications and solutions running atop a common core of Hadoop.
Hewlett Packard Enterprise, one of our stockholders and the employer of our director Martin Fink, resells HDP support subscription offerings, whereby Hewlett Packard Enterprise may perform level one and two support and deliver professional services to its end-user customers. We receive a net percentage of the gross dollars collected from Hewlett Packard Enterprise’s end-user customers related to such support and professional services, which customers Hewlett Packard Enterprise bills directly. Revenue from Hewlett Packard Enterprise accounted for less than 1 percent of our total revenue for the years ended December 31, 2015 and 2014, for the eight months ended December 31, 2013 and for the year ended April 30, 2013. For the eight months ended December 31, 2012 and year ended April 30, 2012, there was no revenue from Hewlett Packard Enterprise.
Microsoft sells a Microsoft-branded offering of HDP called HDInsights to its end-user customers. We receive fixed and variable fees for providing enablement and support subscription offerings to Microsoft. Revenue from Microsoft accounted for approximately 8 percent and 22 percent of our total revenue for the years ended December 31, 2015 and 2014, respectively, 38 percent of our total revenue for the eight months ended December 31, 2013 and 55 percent of our total revenue for the year ended April 30, 2013. For the eight months ended December 31, 2012 and year ended April 30, 2012, there was no revenue from Microsoft.
We and Red Hat, the employer of our director Paul Cormier, work together through our research and development organizations to build a reference architecture for HDP performance on Red Hat’s Enterprise Linux offerings.
Teradata sells HDP support subscription offerings, whereby Teradata typically performs level one support for its end-user customers. We generally receive a fixed percentage from Teradata per customer transaction based on the amount that Teradata bills to its end-user customers. Revenue from Teradata accounted for approximately 2 percent and 4 percent of our total revenue for the years ended December 31, 2015 and 2014, respectively, 4 percent of our total revenue for the eight months ended December 31, 2013 and 4 percent of our total revenue for the year ended April 30, 2013. For the eight months ended December 31, 2012 and year ended April 30, 2012, there was no revenue from Teradata.
Further, leading enterprise software and infrastructure vendors with solutions that run on or with the HDP offering include Amazon.com, Inc., BMC Software, Inc., Cisco Systems, Inc., Datastax, Inc. (“DataStax”), EMC, Google, Inc., Hewlett Packard Enterprise, International Business Machines Corp. (“IBM”), Informatica Corporation, LucidWorks, Inc., MarkLogic Corporation, MicroStrategy Inc., NetApp, Inc., Pivotal, SAP, SAS Institute Inc., Splunk Inc., Symantec Corporation, Tableau Software, Inc., Talend Inc., Tibco Software Inc. and VMware, Inc.
10
Table of Contents
Competition
Within the Enterprise Hadoop market, we compete against a variety of large software and infrastructure vendors, smaller specialized companies and custom development efforts. Our principal competitors in this market include pure play Hadoop distribution vendors such as Cloudera Inc. and MapR Technologies, Inc., enterprise software and infrastructure vendors that offer Hadoop distributions such as IBM and Oracle Corporation (“Oracle”), as well as cloud computing vendors that offer big data processing services such as Amazon.com.
Within the broader big data market, an Enterprise Hadoop solution may compete for workloads against traditional data warehouse solutions from large vendors such as Teradata, Oracle, Microsoft, IBM, Hewlett Packard Enterprise, SAP and EMC, and non-relational NoSQL databases from pure play vendors such as MongoDB, Inc. (“MongoDB”) and DataStax. Because Enterprise Hadoop is commonly integrated with traditional data warehouses, such as our partnerships with Teradata and Hewlett Packard Enterprise, and NoSQL databases, such as our partnership with DataStax, this category of vendors and solutions comprises a set of key partners who may compete with us in certain instances while partnering with us in others.
We believe the principal competitive factors in the Enterprise Hadoop and big data markets for our solution are as follows:
| • | name and reputation of the vendor or competitive offering; |
| • | ability to adapt development, sales, marketing and support to the open source software model; |
| • | product price, performance, scalability, reliability, functionality and ease of use; |
| • | value of support subscription offerings and quality of support and professional services; |
| • | strategic alliances with major enterprise software and infrastructure providers; |
| • | availability of third-party solutions that are integrated with and compatible with the technology; |
| • | number of Global 2000 reference accounts; |
| • | ability to provide a credible and actionable roadmap for the technology; |
| • | ability to quickly diagnose software issues and provide patches and other solutions; and |
| • | strength of the vendor’s relationships and reputation in the open source community. |
We believe that we generally compete favorably on the basis of the foregoing factors. Because we employ a significant number of Hadoop core committers and innovators, we are able to innovate the core open source technology, help define a roadmap for the future, provide predictable and reliable, enterprise-quality releases and offer comprehensive support to our support subscription customers and deeply integrated solutions with our partners.
The traditional barriers to entry that are found in the proprietary software model do not characterize the open source software model. For example, the financial and legal barriers to creating a new Hadoop distribution are relatively low because the software components typically included in Hadoop distributions are publicly available under open source licenses that permit copying, modification and redistribution. While anyone can use, copy, modify and redistribute the HDP offering, they are not permitted to refer to the product using the trademarked “Hortonworks” name or other proprietary marks unless they have a formal business relationship with us that allows such references.
Some of our actual and potential competitors have advantages over us, such as longer operating histories, significantly greater financial, technical, marketing or other resources, stronger brand and business user recognition, larger intellectual property portfolios and broader global distribution and presence. In addition, our industry is evolving rapidly and is becoming increasingly competitive. Larger and more established companies
11
Table of Contents
may focus on operational intelligence and could directly compete with us. Smaller companies could also launch new products and services that we do not offer and that could gain market acceptance quickly.
Intellectual Property
Our offerings, including HDP, HDF and Hortonworks Sandbox, are built from software components licensed to the general public under the Apache Software License and similar open source licenses. We obtain many components from software developed and released by contributors to independent open source software development projects primarily at the Apache Software Foundation. Open source licenses grant licensees broad permissions to use, copy, modify and redistribute these offerings. As a result, open source development and licensing practices can limit the value of our software copyright assets. Consequently, our trademarks may represent our most valuable intellectual property with respect to these products. As a result, we actively pursue registration of our trademarks, logos, service marks and domain names in the United States and in other countries. The duration of our trademarks registered in the United States generally lasts as long as we use them in commerce and timely file all documents required by the United States Patent and Trademark Office to maintain such registrations.
Hortonworks SmartSense™ is an optional proactive support service available with our support subscriptions offerings that contains proprietary intellectual property. SmartSense monitors Hortonworks platforms in order to proactively find performance and configuration issues and provide recommendations to help avoid potential future issues. We actively pursue registration of our patents and trademarks for this proactive support service in the U.S. and in other countries. We also make available intellectual property via our Hortonworks Community Connection online community and our Partnerworks program and rely on copyright laws to protect such intellectual property.
We rely on a combination of trade secret, copyright, patent and trademark laws, a variety of contractual arrangements, such as license agreements, assignment agreements, confidentiality and non-disclosure agreements, and confidentiality procedures and technical measures to gain rights to and protect the intellectual property used in our business.
We also rely on certain intellectual property rights that we license from third parties, including under certain open source licenses. Though such third-party technologies may not continue to be available to us on commercially reasonable terms, we believe that alternative technologies would be available to us.
Our policy is to require employees and independent contractors to sign agreements assigning to us any inventions, trade secrets, works of authorship, developments and other processes generated by them on our behalf and agreeing to protect our confidential information, and all of our key employees and contractors have done so. We also control and monitor access to, and distribution of, our proprietary information.
For a discussion of the risk factors relating to intellectual property that we believe could impact our actual and expected results, see “Risk Factors” in this Annual Report on Form 10-K.
Our Strategy
We intend to continue to grow our business by focusing on the following strategies:
| • | continue to innovate and extend the enterprise data platform capabilities of our solutions; |
| • | establish Hortonworks as the trusted enterprise Hadoop platform provider and our enterprise-scale Connected Data Platforms (HDP and HDF) as the industry standard for the modern enterprise data architecture; |
12
Table of Contents
| • | continue to support and foster growth in the Apache Software Foundation and Hadoop ecosystems; |
| • | focus on renewing and expanding existing customer deployments; |
| • | grow our sales force directly and indirectly through our reseller and OEM partners; |
| • | grow our customer base across new vertical markets and geographies; |
| • | pursue selective acquisitions to further enhance and build out the critical components of our enterprise-scale Connected Data Platforms (HDP and HDF); and |
| • | continue international expansion. |
Employees
As of December 31, 2015, we had approximately 850 full-time employees, including approximately 680 employees in the United States and approximately 170 employees internationally. None of our employees is represented by a labor union with respect to his or her employment with us. We have not experienced any work stoppages, and we consider our relations with our employees to be good.
Geographic Information
For a description of our revenue by geographic location, see Note 13 of the Notes to our Consolidated Financial Statements included elsewhere in this Annual Report on Form 10-K.
Facilities
Our corporate headquarters, which includes research and development, sales, marketing, business operations and executive offices, is located in Santa Clara, California. It consists of over 92,000 square feet of space under a lease that expires in September 2019.
Additional Information
Our website is located at http://hortonworks.com, and our investor relations website is located at http://investors.hortonworks.com/. Copies of our Annual Reports on Form 10-K, Quarterly Reports on Form 10-Q, Current Reports on Form 8-K and amendments to these reports filed or furnished pursuant to Section 13(a) or 15(d) of the Securities Exchange Act of 1934, as amended (the “Exchange Act”), are available, free of charge, on our investor relations website as soon as reasonably practicable after we file such material electronically with or furnish it to the Securities and Exchange Commission (“SEC”). The SEC also maintains a website that contains our SEC filings. The address of the site is www.sec.gov. Further, a copy of this Annual Report on Form 10-K is located at the SEC’s Public Reference Room at 100 F Street, NE, Washington, D.C. 20549. Information on the operation of the Public Reference Room can be obtained by calling the SEC at 1-800-SEC-0330.
We webcast our earnings calls and certain events we participate in or host with members of the investment community on our investor relations website. Additionally, we provide notifications of news or announcements regarding our financial performance, including SEC filings, investor events, press and earnings releases and blogs as part of our investor relations website. Hortonworks has used, and intends to continue to use, our investor relations website as well as the Twitter account @hortonworks and the Facebook page www.facebook.com/hortonworks, as a means of disclosing material non-public information and for complying with its disclosure obligations under Regulation FD. Further corporate governance information, including governance guidelines, board committee charters, and code of business conduct and ethics, is also available on our investor relations website under the heading “Corporate Governance.” The contents of our websites are not intended to be incorporated by reference into this Annual Report on Form 10-K or in any other report or document we file with the SEC, and any references to our websites are intended to be inactive textual references only.
13
Table of Contents
Investing in our common stock involves a high degree of risk. You should carefully consider the risks and uncertainties described below, together with all of the other information in this report and in our other public filings, before making a decision to invest in our common stock. If any of the risks actually occur, our business, financial condition, results of operations and prospects could be harmed. In that event, the trading price of our common stock could decline, and you could lose part or all of your investment.
Risks Related to Our Business
We have a history of losses, and we may not become profitable in the future.
We have incurred net losses since our inception, including net losses of $179.1 million and $177.4 million in the years ended December 31, 2015 and 2014, respectively, $46.2 million and $19.7 million in the eight months ended December 31, 2013 and 2012, respectively, and $36.6 million and $11.5 million in the years ended April 30, 2013 and 2012, respectively. As a result, we had an accumulated deficit of $450.9 million at December 31, 2015. These losses and our accumulated deficit includes the accounting for the Yahoo! preferred stock warrant (the “2011 Yahoo! Warrant”) described in “Management’s Discussion and Analysis of Financial Condition and Results of Operations.” It is difficult for us to predict our future results of operations since the market for our solutions is rapidly evolving and has not yet reached widespread adoption. We may not achieve sufficient revenue to attain and maintain profitability. We expect our operating expenses to increase over the next several years as we hire additional personnel, particularly in sales and marketing, expand and improve the effectiveness of our distribution channels, and continue to invest in the development of the HDP and HDF offerings. In addition, as we grow and as a result of being a public company, we will incur additional significant legal, accounting and other expenses that we did not incur as a private company. As a result of these increased expenses, we will have to generate and sustain increased revenue to be profitable in future periods. Any failure by us to sustain or increase profitability on a consistent basis could cause the value of our common stock to decline.
We have a limited operating history, which makes it difficult to predict our future results of operations.
We were incorporated in 2011 and introduced our first solution in 2012. As a result of our limited operating history, our ability to forecast our future results of operations is limited and subject to a number of uncertainties, including our ability to plan for and model future growth. Our historical revenue growth has been inconsistent, has benefited from transactions with related parties and should not be considered indicative of our future performance. Further, in future periods, our revenue growth could slow or our revenue could decline for a number of reasons, including slowing demand for our support subscription offerings and our professional services, increasing competition, a decrease in the growth of our overall market, or our failure, for any reason, to continue to capitalize on growth opportunities. We have also encountered and will encounter risks and uncertainties frequently experienced by growing companies in rapidly changing industries, such as the risks and uncertainties described herein. If our assumptions regarding these risks and uncertainties and our future revenue growth (each of which we use to plan our business) are incorrect or change, or if we do not address these risks successfully, our operating and financial results could differ materially from our expectations and our business could suffer.
We do not have an adequate history with our support subscription offerings or pricing models to accurately predict the long-term rate of support subscription customer renewals or adoption or the impact these renewals and adoption will have on our revenue or results of operations.
We have limited experience with respect to determining the optimal prices for our support subscription offerings. As the market for open source distributed data platforms matures, or as competitors introduce new products or services that compete with ours, we may be unable to attract new support subscription customers at the same price or based on the same pricing model as we have used historically. Moreover, large support subscription
14
Table of Contents
customers, which are the focus of our sales efforts, may demand greater price concessions. As a result, in the future, we may be required to reduce our prices, which could harm our revenue, gross margins, financial position and cash flows. Furthermore, while the terms of our support subscription agreements limit the number of supported nodes or the size of supported data sets, such limitations may be improperly circumvented or otherwise bypassed by certain users.
We expect to derive a significant portion of our revenue from renewals of existing support subscription agreements. As a result, customers renewing and expanding their support subscription relationships with us will be critical to our business. Our support subscription customers have no obligation to renew their support subscriptions after the expiration of the initial support subscription period and may renew for fewer elements of our support subscription offerings or on different pricing terms. We have limited historical data with respect to support subscription customer renewals, including those support subscription arrangements which also allow the customer the ability to potentially impact the direction and development of the underlying open source solution, and to date, the majority of our support subscription agreements have not reached the end of their original term, so we cannot accurately predict support subscription customer renewals. Our support subscription customers’ renewals may decline or fluctuate as a result of a number of factors, including their dissatisfaction with our pricing or our product offerings and their ability to continue their operations and spending levels. If our support subscription customers do not renew their support subscriptions on similar pricing terms, our revenue may decline and our business could suffer. In addition, over time the average term of our contracts could change based on renewals or for other reasons.
Because we derive substantially all of our revenue and cash flows from supporting HDP and services and training related to it, failure of these offerings or our new product offerings to satisfy customer requirements or to achieve increased market acceptance would harm our business, results of operations, financial condition and growth prospects.
We derive and expect to continue to derive substantially all of our revenue and cash flows from customer fees for support subscription offerings and professional services in support of HDP. As such, the market acceptance of HDP is critical to our continued success. Demand for HDP is affected by a number of factors beyond our control, including market acceptance of open source distributed data platforms by referenceable accounts for existing and new use cases, the continued enhancement of HDP to incorporate features and functionality desired by our support subscription customers, the timing of development and release of new products by our competitors, technological change and growth or contraction in our market. We expect the proliferation of unstructured data to lead to an increase in the data storage and processing demands of our customers, and HDP may not be able to perform to meet those demands. If we are unable to continue to meet support subscription customer requirements or to achieve more widespread market acceptance of HDP, our business, results of operations, financial condition and growth prospects will be harmed. We launched HDF in September 2015 and general availability of HDF only commenced towards the end of the third fiscal quarter of 2015. As such, we cannot predict how quickly customer subscriptions will increase, to what degree this new product offering will satisfy customer requirements or the rate at which market acceptance will occur.
Our success is highly dependent on our ability to penetrate the existing market for open source distributed data platforms and data ingest platforms as well as the growth and expansion of the market for open source distributed data platforms and data ingest platforms.
The market for Hadoop and open source distributed data platforms and the market for NiFi and open source data ingest platforms are relatively new, rapidly evolving and unproven. Our future success will depend in large part on Hadoop’s ability to penetrate the existing market for open source distributed data platforms, as well as the continued growth and expansion of the market for open source distributed data platforms, and it will also depend on NiFi’s ability to penetrate the existing market for open source data ingest platforms as well as the continued growth and expansion of the market for open source data ingest platforms. It is difficult to predict support subscription customer adoption and renewals, support subscription customer demand for our offerings, the size,
15
Table of Contents
growth rate and expansion of these markets, the entry of competitive products or the success of existing competitive products. Our ability to penetrate the existing markets for open source distributed data platforms and data ingest platforms and any expansion of such markets depends on a number of factors, including the cost, performance and perceived value associated with our offerings, as well as support subscription customers’ willingness to adopt an alternative approach to data collection, storage and processing. Furthermore, many potential support subscription customers have made significant investments in legacy data collection, storage and processing software and may be unwilling to invest in new solutions. If the markets for open source distributed data platforms or data ingest platforms fail to grow or expand or decrease in size, or if we do not succeed in further penetrating such markets, our business would be harmed.
If we are unable to maintain successful relationships with our partners, our business, results of operations and financial condition could be harmed.
In addition to our direct sales force and our website, we use strategic partners, such as distribution partners and resellers, to sell our support subscription offerings and our professional services. We expect that sales through partners will continue to grow as a proportion of our revenue for the foreseeable future.
Our agreements with our partners are generally non-exclusive, meaning our partners may offer customers the products and services of several different companies, including products and services that compete with ours, or may themselves be or become competitors. If our partners do not effectively market and sell our support subscription offerings and our professional services, choose to use greater efforts to market and sell their own products and services or those of our competitors, or fail to meet the needs of our customers, our ability to grow our business and sell our support subscription offerings and our professional services may be harmed. Our partners may cease marketing our support subscription offerings or professional services with limited or no notice and with little or no penalty. The loss of a substantial number of our partners, our possible inability to replace them, or the failure to recruit additional partners could harm our results of operations.
Our ability to achieve revenue growth in the future will depend in part on our success in maintaining successful relationships with our partners, and in helping our partners enhance their ability to independently sell our support subscription offerings and deliver professional services. If we are unable to maintain our relationships with these partners, or otherwise develop and expand our indirect distribution channel, our business, results of operations, financial condition or cash flows could be harmed.
If we are unable to effectively compete, our business and operating results could be harmed.
We face substantial competition from Hadoop distribution vendors such as Cloudera, Inc. and MapR Technologies, Inc., as well as enterprise software and infrastructure vendors that offer Hadoop distributions such as International Business Machines Corporation and Oracle Corporation. Further, other established system providers not currently focused on Hadoop, including traditional data warehouse solution providers such as Teradata, SAP and EMC, or open source distributed data platform providers, including non-relational NoSQL database providers such as MongoDB and DataStax may expand their products and services to compete with us. Additionally, some potential customers may elect to implement and self-support Hadoop deployments internally, thus not purchasing a support subscription from us. Some of the companies that compete with us, or that may compete with us in the future, have greater name recognition, substantially greater financial, technical, marketing and other resources, the ability to devote greater resources to the promotion, sale and support of their solutions, more extensive customer bases and broader customer relationships and longer operating histories than we have.
We expect competition to increase as other companies continue to evolve their offerings and as new companies enter our market. Increased competition is likely to result in pricing pressures on our support subscription offerings and our professional services, which could negatively impact our gross margins. If we are unable to effectively compete, our revenue could decline and our business, operating results and financial condition could be adversely affected.
16
Table of Contents
The competitive position of our product offerings depends in part on their ability to operate with third-party products and services, including those of our partners, and, if we are not successful in maintaining and expanding the compatibility of HDP and HDF with such products and services, our business will suffer.
The competitive position of HDP and HDF depends in part on their ability to operate with products and services of third parties, including software companies that offer applications designed for various business intelligence applications, software services and infrastructure, and it must be continuously modified and enhanced to adapt to changes in hardware, software, networking, browser and database technologies. In the future, one or more technology companies, whether our partners or otherwise, may choose not to support the operation of their software, software services and infrastructure with HDP or HDF, or our offerings may not support the capabilities needed to operate with such software, software services and infrastructure. In addition, to the extent that a third party were to develop software or services that compete with ours, that provider may choose not to support HDP or HDF. We intend to facilitate the compatibility of our product platforms with various third party software, software services and infrastructure offerings by maintaining and expanding our business and technical relationships. If we are not successful in achieving this goal, our business, financial condition and results of operations may suffer.
If open source software programmers, many of whom we do not employ, do not continue to develop and enhance open source technologies, we may be unable to develop new technologies, adequately enhance our existing technologies or meet customer requirements for innovation, quality and price.
We rely to a significant degree on a number of independent open source software programmers, or Hadoop committers and contributors, to develop and enhance Apache Hadoop and its related technologies. Additionally, members of the corresponding Apache Software Foundation PMCs, many of whom are not employed by us, are primarily responsible for the oversight and evolution of the codebases of Hadoop and its related technologies. If the Hadoop committers and contributors fail to adequately further develop and enhance open source technologies, or if the PMCs fail to oversee and guide the evolution of Hadoop-related technologies in the manner that we believe is appropriate to maximize the market potential of our offerings, then we would have to rely on other parties, or we would need to expend additional resources, to develop and enhance our offerings. We cannot predict whether further developments and enhancements to these technologies would be available from reliable alternative sources. In either event, our development expenses could be increased and our technology release and upgrade schedules could be delayed. Delays in developing, completing or delivering new or enhanced offerings could cause our offerings to be less competitive, impair customer acceptance of our offerings and result in delayed or reduced revenue for our offerings.
Our subscription-based business model may encounter customer resistance or we may experience a decline in the demand for our offerings.
We provide our support subscription offerings primarily under annual or multi-year subscriptions. A support subscription generally entitles a support subscription customer to a specified scope of support, as well as security updates, fixes, functionality enhancements and upgrades to the technology and new versions of the software, if and when available, and compatibility with an ecosystem of certified hardware and software applications. We may encounter support subscription customer resistance to this distribution model or support subscription customers may fail to honor the terms of our support subscription agreements. To the extent we are unsuccessful in promoting or defending this distribution model, our business, financial condition, results of operations and cash flows could be harmed.
Demand for our offerings may fluctuate based on numerous factors, including the spending levels and growth of our current and prospective support subscription customers, and general economic conditions. In addition, our support subscription customers generally undertake a significant evaluation process that may result in a prolonged sales cycle. We spend substantial time, effort and money on our sales efforts, including developing and implementing appropriate go-to-market strategies and training our sales force and ecosystem partners in order to effectively market new solutions, without any assurance that our efforts will produce any sales. The
17
Table of Contents
purchase of our offerings may be discretionary and can involve significant expenditures. If our current and prospective support subscription customers cut costs, then they may significantly reduce their enterprise software expenditures.
As technologies and the marketplace for our offerings change, our subscription-based business model may no longer meet the needs of our support subscription customers. Consequently, we may need to develop new and appropriate marketing and pricing strategies for our solutions. If we are unable to adapt our business model to changes in the marketplace or if demand for our solutions declines, our business, financial condition, results of operations and cash flows could be harmed.
If we are unable to expand sales to existing customers, our growth could be slower than we expect and our business and results of operations may be harmed.
Our future growth depends in part upon expanding sales of our support subscription offerings and our professional services to our existing customers. If our existing customers do not purchase additional or incremental support subscription offerings and professional services, our revenue may grow more slowly than expected, may not grow at all or may decline. Additionally, increasing incremental sales to our current customer base requires increasingly sophisticated and costly sales efforts. There can be no assurance that our efforts will result in increased sales to existing customers and additional revenue. If our efforts to expand sales to our existing customers are not successful, our business and operating results would be harmed.
Revenue from our largest customers has accounted for a significant percentage of our revenue, and the loss of one or more of our significant customers would harm our business.
A significant portion of our revenue has been concentrated among a relatively small number of large customers. The revenue from our three largest customers as a group accounted for approximately 17 percent and 43 percent of our total revenue for the years ended December 31, 2015 and 2014, respectively, 51 percent and 78 percent of our total revenue for the eight months ended December 31, 2013 and 2012, respectively, and 71 percent and 86 percent of our total revenue for the years ended April 30, 2013 and 2012, respectively. While we expect that the revenue from our largest customers will continue to decrease over time as a percentage of our total revenue as we generate more revenue from other customers, we expect that revenue from a relatively small group of customers will continue to account for a significant portion of our revenue, at least in the near term. Our customer agreements generally do not contain long-term commitments from our customers, and our customers may be able to terminate their agreements with us prior to expiration of the term.
We may not be able to continue our relationships with any of our largest customers on the same or more favorable terms in future periods or our relationships may not continue beyond the terms of our existing contracts with them. Our revenue and operating results would suffer if, among other things, any of our largest customers were to renegotiate, terminate, renew on less favorable terms or fail to renew their agreements with us.
Our future results of operations may fluctuate significantly, and our recent results of operations may not be a good indication of our future performance.
Our revenue and results of operations could vary significantly from period to period as a result of various factors, many of which are outside of our control. At the beginning of each quarter, we do not know the number of new support subscriptions that we will enter into during the quarter. In addition, the contract value of our support subscriptions varies substantially among customers, and a single, large support subscription in a given period could distort our results of operations. Comparing our revenue and results of operations on a period-to-period basis may not be meaningful, and you should not rely on our past results as an indication of our future performance.
We may not be able to accurately predict our future revenue or results of operations on a quarterly or longer-term basis. We base our current and future expense levels on our operating plans and sales forecasts, and our operating
18
Table of Contents
costs are expected to be relatively fixed in the short-term. As a result, we may not be able to reduce our costs sufficiently to compensate for an unexpected shortfall in billings or revenue, and even a small shortfall in revenue in a quarter could harm our financial results for that quarter and cause our financial results to fall short of analyst expectations, which could cause the market price of our common stock to decline substantially.
In addition to other risk factors described in this “Risk Factors” section, factors that may cause our results of operations to fluctuate from quarter to quarter include:
| • | the timing of new customer contracts for support subscription offerings and professional services, and the extent to which we earn additional revenue from existing customers as they expand their deployment of the HDP and the HDF offerings; |
| • | the renewals of our support subscription arrangements with our customers; |
| • | changes in the competitive dynamics of our market; |
| • | customers delaying purchasing decisions in anticipation of new software or software enhancements; |
| • | the timing of satisfying revenue recognition criteria and our ability to obtain vendor-specific objective evidence of fair value (“VSOE”), for our support subscription offerings; |
| • | our ability to control costs, including our operating expenses; |
| • | the proportion of revenue attributable to larger transactions as opposed to smaller transactions and the impact that a change in such proportion may have on the overall average selling price of our support subscription offerings; |
| • | the proportion of revenue attributable to support subscription offerings and professional services, which may impact our gross margins and operating income; |
| • | the reduction or elimination of support of the Apache Hadoop Project or the Apache NiFi Project by the Apache Software Foundation, migration of Hadoop technology or NiFi technology to an organization other than the Apache Software Foundation, or any other actions taken by the Apache Software Foundation or the Apache Hadoop Project or the Apache NiFi Project that may impact our business model; |
| • | changes in customers’ budgets and in the timing of their purchasing decisions; |
| • | the collectability of receivables from customers and resellers, which may be hindered or delayed if these customers or resellers experience financial distress; and |
| • | general economic conditions, both domestically and internationally, as well as economic conditions specifically affecting industries in which our customers participate. |
Many of these factors are outside of our control, and the variability and unpredictability of such factors could result in our failing to meet or exceed our financial expectations for a given period. We believe that quarter-to-quarter comparisons of our revenue, results of operations and cash flows may not necessarily be indicative of our future performance.
Our sales cycle is long and unpredictable, particularly with respect to large support subscription customers, and our sales efforts require considerable time and expense.
Our results of operations may fluctuate, in part, because of the resource-intensive nature of our sales efforts, the length and variability of the sales cycle of our support subscription offerings and the difficulty in making short-term adjustments to our operating expenses. Our results of operations depend in part on sales to large support subscription customers and increasing sales to existing customers. The length of our sales cycle, from initial evaluation to payment for our support subscription offerings is generally six to nine months, but can vary substantially from customer to customer. Our sales cycle can extend to more than a year for some customers. It is
19
Table of Contents
difficult to predict exactly when, or even if, we will make a sale to a potential customer or if we can increase sales to our existing customers. As a result, large individual sales have, in some cases, occurred in quarters subsequent to those we anticipated, or have not occurred at all. The loss or delay of one or more large transactions in a quarter could impact our results of operations for that quarter and any future quarters for which revenue from that transaction is lost or delayed. As a result of these factors, it is difficult for us to forecast our revenue accurately in any quarter. Because a substantial proportion of our expenses are relatively fixed in the short term, our results of operations will suffer if revenue falls below our expectations in a particular quarter, which could cause the price of our common stock to decline.
We have experienced rapid growth in recent periods. If we fail to manage our growth effectively, we may be unable to execute our business plan or maintain high levels of service and our financial results could be negatively impacted.
We have increased our number of full-time employees to approximately 850 as of December 31, 2015 from approximately 600 at December 31, 2014 and have increased our revenue to $121.9 million in the year ended December 31, 2015 from $46.0 million in the year ended December 31, 2014. Our recent growth and expansion has placed, and our anticipated growth may continue to place, a significant strain on our managerial, administrative, operational, financial and other resources. We intend to continue to expand our overall business, customer base, headcount and operations. Continued growth increases the challenges involved in:
| • | recruiting, training and retaining sufficient skilled technical, marketing, sales and management personnel; |
| • | preserving our culture, values and entrepreneurial environment; |
| • | developing and improving our internal administrative infrastructure, particularly our financial, operational, compliance, recordkeeping, communications and other internal systems; |
| • | managing our international operations and the risks associated therewith; |
| • | maintaining high levels of satisfaction with our solutions among our customers; and |
| • | effectively managing expenses related to any future growth. |
If we fail to manage our growth effectively, our business, results of operations and financial condition could suffer.
Our future success depends in large part on the growth of the market for big data applications, and an increase in the desire to ingest, store and process big data, and we cannot be sure that the market for big data applications will grow as expected or, even if such growth occurs, that our business will grow at similar rates, or at all.
Our ability to increase the adoption of HDP and HDF, increase sales of support subscription offerings and professional services and grow our business depends on the increased adoption of big data services and applications by enterprises. While we believe that big data services and applications can offer a compelling value proposition to many enterprises, the broad adoption of big data applications and services also presents challenges to enterprises, including developing the internal expertise and infrastructure to manage big data applications and services effectively, coordinating multiple data sources, defining a big data strategy that delivers an appropriate return on investment and implementing an information technology infrastructure and architecture that enables the efficient deployment of big data solutions. Accordingly, our expectations regarding the potential for future growth in the market for big data applications and services, and the third-party growth estimates for this market in this Annual Report on Form 10-K, are subject to significant uncertainty. If the market for big data applications and services does not grow as expected, our business prospects may be adversely affected. Even if the market for big data applications and services increases, we cannot be sure that our business will grow at a similar rate, or at all.
20
Table of Contents
Because of the characteristics of open source software, there are few technological barriers to entry into the open source market by new competitors and it may be relatively easy for competitors, some of which may have greater resources than we have, to enter our markets and compete with us.
One of the characteristics of open source software is that anyone may modify and redistribute the existing open source software and use it to compete in the marketplace. Such competition can develop without the degree of overhead and lead time required by traditional proprietary software companies. It is possible for competitors with greater resources than ours to develop their own open source software, including software based on one or more components of Hadoop, NiFi, HDP or HDF, potentially reducing the demand for our solutions and putting price pressure on our support subscription offerings and our professional services. We cannot guarantee that we will be able to compete successfully against current and future competitors or that competitive pressure or the availability of new open source software will not result in price reductions, reduced operating margins and loss of market share, any one of which could harm our business, financial condition, results of operations and cash flows.
Our software development and licensing model could be negatively impacted if the Apache License, Version 2.0 is not enforceable or is modified so as to become incompatible with other open source licenses.
HDP and HDF have been provided under the Apache License 2.0. This license states that any work of authorship licensed under it, and any derivative work thereof, may be reproduced and distributed provided that certain conditions are met. It is possible that a court would hold this license to be unenforceable or that someone could assert a claim for proprietary rights in a program developed and distributed under it. Any ruling by a court that this license is not enforceable, or that open source components of HDP or HDF may not be reproduced or distributed, may negatively impact our distribution or development of all or a portion of HDP and HDF. In addition, at some time in the future it is possible that Apache Hadoop or Apache NiFi may be distributed under a different license or the Apache License 2.0 may be modified, which could, among other consequences, negatively impact our continuing development or distribution of the software code subject to the new or modified license. Further, full utilization of HDP and HDF may depend on applications and services from various third parties, and in the future these applications or services may not be available to our customers on commercially reasonable terms, or at all, which could harm our business.
We do not currently have vendor-specific objective evidence of fair value for support subscription offerings, and we may offer certain contractual provisions to our customers that result in delayed recognition of revenue under GAAP, which could cause our results of operations to fluctuate significantly from period-to-period in ways that do not correlate with our underlying business performance.
In the course of our selling efforts, we typically enter into sales arrangements pursuant to which we provide support subscription offerings and professional services. We refer to each individual product or service as an “element” of the overall sales arrangement. These arrangements typically require us to deliver particular elements in a future period. We apply software revenue recognition rules under United States generally accepted accounting principles (“GAAP”). In certain cases, when we enter into more than one contract with a single customer, the group of contracts may be so closely related that they are viewed under GAAP as one multiple-element arrangement for purposes of determining the appropriate amount and timing of revenue recognition. As we discuss further in “Management’s Discussion and Analysis of Financial Condition and Results of Operations—Critical Accounting Policies and Estimates—Revenue Recognition,” because we do not have VSOE for our support subscription offerings, and because we may offer certain contractual provisions to our customers, such as delivery of support subscription offerings and professional services, or specified functionality, or because multiple contracts signed in different periods may be viewed as giving rise to multiple elements of a single arrangement, we may be required under GAAP to defer revenue to future periods. Typically, for arrangements providing for support subscription offerings and professional services, we have recognized as revenue the entire arrangement fee ratably over the support subscription period, although the appropriate timing of revenue recognition must be evaluated on an arrangement-by-arrangement basis and may differ from arrangement to arrangement. If we are unexpectedly required to defer revenue to future periods for a significant portion of our
21
Table of Contents
sales, our revenue and overall operating results for a particular period could fall below our expectations or those of securities analysts and investors, resulting in a decline in our stock price.
Because we recognize revenue from subscriptions for our services over the term of the subscription, downturns or upturns in sales may not be immediately reflected in our results of operations.
We generally recognize subscription revenue from support subscription customers ratably over the term of their subscription agreements, which are generally 12 months, with some support subscription customers having subscription agreements with longer terms. As a result, much of the revenue we report in each quarter is derived from deferred revenue from subscription agreements entered into during previous quarters. Consequently, a decline in the value of new support subscription agreements entered into within any one quarter, will not necessarily be fully reflected in the revenue we record for that quarter and will harm our revenue in future quarters. In addition, we may be unable to adjust our cost structure to reflect this reduced revenue. Accordingly, the effect of significant downturns in sales and market acceptance of our services may not be fully reflected in our results of operations until future periods. Our subscription model also makes it difficult for us to rapidly increase our revenue through additional sales in any period, as revenue from new support subscription customers are recognized over the applicable subscription term.
Any failure to offer high-quality support subscription offerings may harm our relationships with our support subscription customers and results of operations.
Once HDP and HDF are deployed, our support subscription customers depend on our software support organization to resolve technical issues relating to the deployment. We may be unable to respond quickly enough to accommodate short-term increases in support subscription customer demand for support subscription offerings. We also may be unable to modify the format of our support subscription offerings to compete with changes in offerings provided by our competitors. Increased support subscription customer demand for our support subscription offerings, without corresponding revenue, could increase costs and harm our results of operations. In addition, our sales process is highly dependent on our business reputation and on positive references from our existing support subscription customers. Any failure to maintain high-quality support subscription offerings, or a market perception that we do not maintain high-quality support subscription offerings, could harm our reputation, our ability to sell our support subscription offerings to existing and prospective support subscription customers and our results of operations.
If we fail to comply with our customer contracts, our business could be harmed.
Any failure by us to comply with the specific provisions in our customer contracts could result in the imposition of various penalties, which may include termination of contracts, forfeiture of profits and suspension of payments. Further, any negative publicity related to our customer contracts or any proceedings surrounding them, regardless of its accuracy, may damage our business and affect our ability to compete for new contracts. If our customer contracts are terminated, or if our ability to compete for new contracts is adversely affected, our business, financial condition, results of operations and cash flows could be harmed.
HDP or HDF may contain defects that may be costly to correct, delay market acceptance of our solutions and expose us to claims and litigation.
Despite our testing procedures, errors, including security vulnerabilities or incompatibilities with third-party software and hardware, have been and may continue to be found in HDP or HDF after deployment. This risk is increased by the fact that much of the code in HDP and HDF are developed by independent parties over whom we may not exercise supervision or control. If errors are discovered, we may have to make significant expenditures of capital and devote significant technical resources to analyze, correct, eliminate or manage them, and we may not be able to successfully do so in a timely manner, or at all. Errors and failures in HDP or HDF could result in a loss of, or delay in, market acceptance of our enterprise technologies, loss of existing or
22
Table of Contents
potential customers and delayed or lost revenue and could damage our reputation and our ability to convince enterprise users of the benefits of HDP, the HDF Platform and our other offerings.
In addition, errors in HDP or HDF could cause system failures, loss of data or other adverse effects for our customers who may assert warranty and other claims for substantial damages against us. Although our agreements with our customers often contain provisions that seek to limit our exposure to such claims, it is possible that these provisions may not be effective or enforceable under the laws of some jurisdictions. While we seek to insure against these types of claims, our insurance policies may not adequately limit our exposure to such claims. These claims, even if unsuccessful, could be costly and time consuming to defend and could harm our business, financial condition, results of operations and cash flows.
Incorrect or improper implementation or use of HDP or HDF could result in customer dissatisfaction and harm our business, results of operations, financial condition and growth prospects.
HDP and HDF are deployed in a wide variety of technology environments, including in large-scale, complex technology environments, and we believe our future success will depend at least in part on our ability to support such deployments. Hadoop and NiFi are technically very complicated, and it is not easy to maximize the value of our offerings without proper implementation and training. We often must assist our customers in achieving successful implementations for large, complex deployments. If our customers are unable to implement HDP or HDF successfully, or in a timely manner, customer perceptions of our company and our offerings may be impaired, our reputation and brand may suffer, and customers may choose not to renew their subscriptions or increase their purchases of our support subscription offerings or professional services.
Our customers and partners may need training in the proper use of and the variety of benefits that can be derived from HDP or HDF to maximize their potential. HDP or HDF may perform inadequately if they are not implemented or used correctly or as intended. The incorrect or improper implementation or use of our product offerings, our failure to train customers on how to efficiently and effectively use HDP or HDF, or our failure to provide effective support subscription offerings or professional services to our customers, may result in negative publicity or legal claims against us. Also, as we continue to expand our customer base, any failure by us to properly provide these services will likely result in lost opportunities for follow-on sales of our support subscription offerings and professional services.
Interruptions or performance problems associated with our technology and infrastructure may harm our business and results of operations.
Our website and internal technology infrastructure may experience performance issues due to a variety of factors, including infrastructure changes, human or software errors, website or third-party hosting disruptions or capacity constraints due to a number of potential causes, including technical failures, natural disasters or fraud or security attacks. If our security is compromised, our website is unavailable or our users are unable to download our tools or order support subscription offerings or professional services within a reasonable amount of time or at all, our business could be harmed. We expect to continue to make significant investments to maintain and improve website performance and to enable rapid releases of new features and applications for HDP and HDF. To the extent that we do not effectively upgrade our systems as needed and continually develop our technology and network architecture to accommodate actual and anticipated changes in technology, our business and results of operations may be harmed.
In addition, we rely on SaaS technologies from third parties in order to operate critical functions of our business, including financial management services from NetSuite Inc., customer relationship management services from salesforce.com, inc. and lead generation management services from Marketo, Inc. If these services become unavailable due to extended outages or interruptions or because they are no longer available on commercially reasonable terms or prices, our expenses could increase, our ability to manage our finances could be interrupted, our processes for managing sales of our support subscription offerings and professional services and supporting
23
Table of Contents
our customers could be impaired, and our ability to generate and manage sales leads could be weakened until equivalent services, if available, are identified, obtained and implemented, all of which could harm our business and results of operations.
We depend on our executive officers and other key employees, and the loss of one or more of these employees or an inability to attract and retain highly skilled employees could harm our business.
Our success depends largely upon the continued services of our executive officers and other key employees, including many Hadoop committers. We rely on our leadership team in the areas of research and development, operations, security, marketing, sales, support and general and administrative functions, and on individual contributors in our research and development. From time to time, there may be changes in our executive management team resulting from the hiring or departure of executives, which could disrupt our business. We do not have employment agreements with our executive officers or other key personnel that require them to continue to work for us for any specified period and, therefore, they could terminate their employment with us at any time. The loss of one or more of our key employees or executive officers could harm our business.
In addition, to execute our growth plan, we must attract and retain highly qualified personnel. Competition for such personnel in the San Francisco Bay Area, where our headquarters is located, and in other locations where we maintain offices, is intense, especially for engineers experienced in designing and developing software and Apache Hadoop applications and experienced sales professionals. The Apache Hadoop Project relies on Hadoop committers for the project’s technical management. While we currently employ a large number of Hadoop core committers and innovators, one becomes a committer by invitation only. As a result, the market to hire such individuals is very competitive. If our employees who are Hadoop core committers terminate their employment with us, we could lose our ability to innovate the core open source technology, define the roadmap for the future of Hadoop, distribute predictable and reliable enterprise quality releases, and provide comprehensive support to our customers. We have, from time to time, experienced, and we expect to continue to experience, difficulty in hiring and retaining employees with appropriate qualifications. Many of the companies with which we compete for experienced personnel have greater resources than we have. If we hire employees from competitors or other companies, their former employers may attempt to assert that these employees or we have breached legal obligations, resulting in a diversion of our time and resources. In addition, job candidates and existing employees often consider the value of the equity awards they receive in connection with their employment. If the perceived value of our equity awards declines, it may harm our ability to recruit and retain highly skilled employees. If we fail to attract new personnel or fail to retain and motivate our current personnel, our business and future growth prospects could be harmed.
If we do not effectively expand and train our sales force, we may be unable to add new customers or increase sales to our existing customers and our business will be harmed.
We continue to be substantially dependent on our sales force to obtain new customers and to drive additional use cases among our existing customers. We believe that there is significant competition for sales personnel, including enterprise sales representatives and sales engineers and professional services employees, with the skills and technical knowledge that we require. In particular, there is significant demand for sales engineers with Hadoop expertise. Our ability to achieve significant revenue growth will depend, in large part, on our success in recruiting, training and retaining sufficient numbers of sales personnel to support our growth. New hires require significant training and may take significant time before they achieve full productivity. Our recent hires and planned hires may not become productive as quickly as we expect, and we may be unable to hire or retain sufficient numbers of qualified individuals in the markets where we do business or plan to do business. In addition, as we continue to grow rapidly, a large percentage of our sales force will have relatively little experience working with us, our support subscription offerings and our business model. If we are unable to hire and train sufficient numbers of effective sales personnel, or our sales personnel are not successful in obtaining new customers or increasing sales to our existing customer base, our business will be harmed.
24
Table of Contents
If we are not successful in expanding our international business, we may incur additional losses and our revenue growth could be harmed.
Our future results depend, in part, on our ability to expand into international markets. We also have a number of distributor and reseller relationships for our support subscription offerings and professional services in international markets. Our ability to expand internationally will depend upon our ability to deliver functionality and foreign language translations that reflect the needs of the international clients that we target. Our ability to expand internationally involves various risks, including the need to invest significant resources in such expansion, and the possibility that returns on such investments will not be achieved in the near future or at all in these less familiar competitive environments. We may also choose to conduct our international business through strategic alliances. If we are unable to identify strategic alliance partners or negotiate favorable alliance terms, our international growth may be harmed. In addition, we have incurred and may continue to incur significant expenses in advance of generating material revenue as we attempt to establish our presence in particular international markets.
Expanding our business internationally will also require significant attention from our management and will require us to add additional management and other resources in these markets. Our ability to expand our business, attract talented employees and enter into strategic alliances in an increasing number of international markets requires considerable management attention and resources and is subject to the particular challenges of supporting a rapidly growing business in an environment of multiple languages, cultures, customs, legal systems, alternative dispute systems, regulatory systems, commercial infrastructures and technology infrastructure. If we are unable to grow our international operations in a timely manner, we may incur additional losses and our revenue growth could be harmed.
As we expand internationally, our business will become more susceptible to risks associated with international operations.
We principally sell our offerings through sales personnel in the United States, Australia, Brazil, Canada, France, Germany, India, Ireland, Japan, South Korea, the Netherlands, Sweden and the United Kingdom and currently have operations in the United States, Hungary, India, Ireland and the United Kingdom. We also have development teams in Budapest, Hungary, Bangalore, India and Kiev, Ukraine and a number of distributor and reseller relationships for our support subscription offerings and our professional services in other international markets. Conducting international operations subjects us to risks that we have not generally faced in the United States. These risks include:
| • | fluctuations in currency exchange rates; |
| • | unexpected changes in foreign regulatory requirements; |
| • | potentially different pricing environments and longer sales cycles; |
| • | difficulties in managing the staffing of international operations; |
| • | potentially adverse tax consequences, including the complexities of foreign value-added tax systems, restrictions on the repatriation of earnings and changes in tax rates; |
| • | dependence on strategic alliance partners to increase client acquisition; |
| • | the burdens of complying with a wide variety of foreign laws and different legal standards; |
| • | increased financial accounting and reporting burdens and complexities; |
| • | political, social and economic instability abroad, particularly with our development team in Ukraine; |
| • | laws and business practices favoring local competitors; |
| • | terrorist attacks and security concerns in general; and |
| • | reduced or varied protection for intellectual property rights in some countries. |
25
Table of Contents
The occurrence of any one of these risks could harm our international business and, consequently, our results of operations. Additionally, operating in international markets requires significant management attention and financial resources. We cannot be certain that the investment and additional resources required to operate in other countries will produce desired levels of revenue or profitability.
We have made strategic acquisitions in the past and intend to do so in the future. If we are unable to find suitable acquisitions or partners, or to achieve expected benefits from such acquisitions or partnerships, our business, financial condition, results of operations and prospects could be harmed.
As part of our ongoing business strategy to expand our suite of solutions and acquire new technology, from time to time we engage in discussions with third parties regarding, and enter into agreements relating to, possible acquisitions, strategic alliances and joint ventures. For example, in May 2014, we acquired new technology, know-how and solutions through our acquisition of XA Secure, a data security company, in April 2015, we acquired SequenceIQ, kft (“SequenceIQ”), an open source provider of rapid deployment tools for Hadoop, located in Budapest, Hungary, and in August 2015, we acquired Onyara, a key contributor to Apache NiFi. There may be significant competition for acquisition targets in our industry, or we may not be able to identify suitable acquisition candidates, negotiate attractive terms for acquisitions or complete acquisitions on expected timelines, or at all. If we are unable to complete strategic acquisitions or do not realize the expected benefits of the acquisitions we do complete, our business, financial condition, results of operations and prospects could be harmed.
Even if we are able to complete acquisitions or enter into alliances and joint ventures that we believe will be successful, such transactions are inherently risky. Significant risks associated with these transactions, include:
| • | failing to achieve anticipated synergies, including with respect to complementary software or services; |
| • | losing key employees of the acquired businesses; |
| • | integration and restructuring costs, both one-time and ongoing; |
| • | maintaining sufficient controls, policies and procedures, including around integration and accounting for acquisition-related expenses; |
| • | diversion of management’s attention from ongoing business operations; |
| • | establishing new informational, operational and financial systems to meet the needs of our business; |
| • | our inability to maintain the key business relationships and the reputations of the businesses we acquire; |
| • | uncertainty of entry into markets in which we have limited or no prior experience and in which competitors have stronger market positions; |
| • | our dependence on unfamiliar affiliates and partners of the companies we acquire; |
| • | insufficient revenue to offset our increased expenses associated with acquisitions; |
| • | potentially incurring accounting charges as we transition an acquired company to our open source business model; |
| • | our responsibility for the liabilities of the businesses we acquire; and |
| • | unanticipated and unknown liabilities. |
If we are not successful in completing acquisitions in the future or do not realize the expected benefits of the acquisitions we do complete, we may be required to reevaluate our acquisition strategy. We also may incur substantial expenses and devote significant management time and resources in seeking to complete acquisitions, some of which may ultimately not be consummated or not result in expected benefits. The occurrence of any of these acquisition-related risks could harm our business, financial condition, results of operations and prospects.
26
Table of Contents
Our continued success depends on our ability to maintain and enhance strong brands.
We believe that the brand identities that we have developed have contributed significantly to the success of our business. We also believe that maintaining and enhancing our brands is important to expanding our customer base and attracting talented employees. In order to maintain and enhance our brands, we may be required to make further investments that may not be successful. Maintaining our brands will depend in part on our ability to remain a leader in open source technology and our ability to continue to provide high-quality offerings. If we fail to promote and maintain our brands, or if we incur excessive costs in doing so, our business, financial condition, results of operations and cash flows may be harmed.
Our efforts to protect our intellectual property rights may not be adequate to prevent third parties from misappropriating our intellectual property rights in our know-how, software and trademarks.
We have developed proprietary methodologies, know-how and software related to software development, testing and quality assurance. Failure to adequately protect and defend our intellectual property rights in these areas may diminish the value of HDP and HDF or our other technologies, impair our ability to compete effectively and harm our business.
In addition, the protective steps we have taken in the past may be inadequate to protect and deter misappropriation of our trademark rights. We may be unable to detect the unauthorized use of, or take appropriate steps to enforce, our trademark rights in a timely manner. We have registered trademarks in Australia, Canada, the European Community, Switzerland, the United Kingdom, the United States, and have trademark applications pending in various other international jurisdictions. Effective trademark protection may not be available in every country in which we offer or intend to distribute our solutions. We may be unable to prevent third parties from acquiring domain names that are similar to, infringe upon, or diminish the value of our trademarks and other proprietary rights. Failure to adequately protect our trademark rights could damage or even destroy one or more of our brands and impair our ability to compete effectively. Furthermore, defending or enforcing our trademark rights could result in the expenditure of significant financial and managerial resources.
We may be subject to intellectual property rights claims by third parties, which are extremely costly to defend, could require us to pay significant damages and could limit our ability to use certain technologies.
Companies in the software and technology industries, including some of our current and potential competitors, own large numbers of patents, copyrights, trademarks and trade secrets and frequently enter into litigation based on allegations of infringement or other violations of intellectual property rights. In addition, many of these companies can dedicate substantially greater resources to enforce their intellectual property rights, and to defend claims that may be brought against them, than we can. We have received, and we and the Apache Hadoop Project and the Apache NiFi Project may in the future receive, notices that claim we have misappropriated, misused, or infringed other parties’ intellectual property rights, and, to the extent Hadoop or NiFi gains greater market visibility, we the Apache Hadoop Project and the Apache NiFi Project, as applicable, face a higher risk of being the subject of intellectual property infringement claims.
Any intellectual property infringement claims, with or without merit, could be very time-consuming, could be expensive to settle or litigate and could divert our management’s attention and other resources. These claims could also subject us to significant liability for damages, potentially including treble damages if we are found to have willfully infringed patents or copyrights. These claims could also result in our having to stop using technology found to be in violation of a third party’s rights. We might be required to seek a license for the intellectual property, which may not be available on reasonable terms or at all. Even if a license were available, we could be required to pay significant royalties, which would increase our operating expenses. As a result, we may be required to develop alternative non-infringing technology, which could require significant effort and expense. Any of these results would harm our business, results of operations, financial condition and cash flows.
27
Table of Contents
Federal, state, foreign government and industry regulations, as well as self-regulation related to privacy and data security concerns pose the threat of lawsuits and other liability.
We collect and utilize demographic and other information, including personally identifiable information, from and about users (such as customers, potential customers and others). Such information may be collected when users visit our website or elect to use our support tools, or when users provide personal information to us in many contexts such as when signing up for certain services, registering for seminars, participating in a survey, connecting with other users and Hadoop and NiFi experts in our forums, participating in Hortonworks University classes, participating in polls or signing up to receive e-mail newsletters.
Within the United States, various federal and state laws and regulations govern the collection, use, retention, sharing and security of the data we receive from and about users. Outside of the United States, various jurisdictions actively regulate and enforce laws regarding the collection, retention, transfer and use (including loss and unauthorized access) of data and personal information. Privacy advocates and government bodies have increasingly scrutinized the ways in which companies link personal identities and data associated with particular users or devices with data collected through the internet, and we expect such scrutiny to continue to increase. Loss, retention or misuse of certain information and alleged violations of laws and regulations relating to privacy and data security, and any relevant claims, may expose us to potential liability and may require us to expend significant resources on data security and in responding to and defending such allegations and claims.
Security and privacy breaches may hurt our business.
Any security breach, unauthorized access, unauthorized usage, virus or similar breach or disruption could result in the loss of confidential information, damage to our reputation, early termination of our contracts, litigation, regulatory investigations or other liabilities. If our, our customers’ or our partners’ security measures are breached as a result of third-party action, employee error, malfeasance or otherwise and, as a result, someone obtains unauthorized access to data, our reputation will be damaged, our business may suffer and we could incur significant liability.
Techniques used to obtain unauthorized access or to sabotage systems change frequently and generally are not recognized until launched against a target. As a result, we may be unable to anticipate these techniques or to implement adequate preventative measures. If an actual or perceived security breach occurs, the market perception of our security measures could be harmed and we could lose sales and customers. Any significant violations of data privacy could result in the loss of business, litigation and regulatory investigations and penalties that could damage our reputation and adversely impact our results of operations and financial condition. Moreover, if a high-profile security breach occurs with respect to another Hadoop or NiFi provider, our customers and potential customers may lose trust in the security of Hadoop- or NiFi-based solutions generally, which could adversely impact our ability to retain existing customers or attract new ones.
Prolonged economic uncertainties or downturns could harm our business.
Current or future economic downturns could harm our business and results of operations. Negative conditions in the general economy both in the United States and abroad, including conditions resulting from financial and credit market fluctuations and terrorist attacks in the United States, Europe or elsewhere, could cause a decrease in corporate spending on enterprise software in general and slow down the rate of growth of our business.
General worldwide economic conditions have experienced, and in the future may experience, a significant downturn. These conditions make it extremely difficult for our customers and us to forecast and plan future business activities accurately, and they could cause our customers to reevaluate their decision to purchase our offerings, which could delay and lengthen our sales cycles or result in cancellations of planned purchases. Furthermore, during challenging economic times our customers may face issues in gaining timely access to sufficient credit, which could impair their ability to make timely payments to us. If that were to occur, we may be required to increase our allowance for doubtful accounts, which would harm our results of operations.
28
Table of Contents
We have a significant number of customers in the business services, advertising, financial services, government, healthcare and pharmaceuticals, high technology, manufacturing, media and entertainment, oil and gas, online services, retail and telecommunications industries. A substantial downturn in any of these industries may cause firms to react to worsening conditions by reducing their capital expenditures in general or by specifically reducing their spending on information technology. Customers in these industries may delay or cancel information technology projects or seek to lower their costs by renegotiating vendor contracts. To the extent purchases of our offerings are perceived by customers and potential customers to be discretionary, our revenue may be disproportionately affected by delays or reductions in general information technology spending. Also, support subscription customers may choose to develop or utilize in-house self-support capabilities as an alternative to purchasing our support subscription offerings or professional services. Moreover, competitors may respond to market conditions by lowering prices of support subscription offerings. In addition, the increased pace of consolidation in certain industries may result in reduced overall spending on our support subscription offerings or professional services.
We cannot predict the timing, strength or duration of any economic slowdown, instability or recovery, generally or within any particular industry. If the economic conditions of the general economy or industries in which we operate worsen from present levels, our business, results of operations, financial condition and cash flows could be harmed.
We may require additional capital to support business growth, and this capital might not be available on acceptable terms, if at all.
We intend to continue to make investments to support our business growth and may require additional funds to respond to business challenges, including the need to develop new features or otherwise enhance HDP, HDF or our other technologies, improve our operating infrastructure or acquire complementary businesses and technologies. Accordingly, we may need to engage in equity or debt financings to secure additional funds. If we raise additional funds through future issuances of equity or convertible debt securities, our existing stockholders could suffer significant dilution, and any new equity securities we issue could have rights, preferences and privileges superior to those of holders of our common stock. Any debt financing that we may secure in the future could involve restrictive covenants relating to our capital raising activities and other financial and operational matters, which may make it more difficult for us to obtain additional capital and to pursue business opportunities, including potential acquisitions. We may not be able to obtain additional financing on terms that are favorable to us, if at all. If we are unable to obtain adequate financing or financing on terms that are satisfactory to us when we require it, our ability to continue to support our business growth and to respond to business challenges could be significantly impaired, and our business may be harmed.
If our goodwill or amortizable intangible assets become impaired, we may be required to record a significant charge to earnings.
Under GAAP, we review our amortizable intangible assets for impairment when events or changes in circumstances indicate the carrying value may not be recoverable. Goodwill is required to be tested for impairment at least annually. Factors that may be considered a change in circumstances indicating that the carrying value of our goodwill or amortizable intangible assets may not be recoverable include a decline in stock price and market capitalization, reduced future cash flow estimates and slower growth rates in our industry. We may be required to record a significant charge to earnings in our financial statements during the period in which any impairment of our goodwill or amortizable intangible assets is determined, which could harm our results of operations.
Our ability to use our net operating losses to offset future taxable income may be subject to certain limitations.
As of December 31, 2015, we had federal, state and foreign tax net operating loss carryforwards (“NOLs”) of $253.0 million, $223.1 million and $1.2 million, respectively, due to prior period losses. In general, under
29
Table of Contents
Section 382 of the Internal Revenue Code of 1986, as amended, or the Code, a corporation that undergoes an “ownership change” is subject to limitations on its ability to utilize its NOLs to offset future taxable income. Our existing NOLs may be subject to limitations arising from previous ownership changes, including in connection with our initial public offering, concurrent private placement or follow-on offering, and if we undergo an ownership change in the future, our ability to utilize NOLs could be further limited by Section 382 of the Code. Future changes in our stock ownership, some of which are outside of our control, could result in an ownership change under Section 382 of the Code. Furthermore, our ability to utilize NOLs of companies that we may acquire in the future may be subject to limitations. There is also a risk that, due to regulatory changes, such as suspensions on the use of NOLs, or other unforeseen reasons, our existing NOLs could expire or otherwise be unavailable to offset future income tax liabilities. For these reasons, we may not be able to realize a tax benefit from the use of our NOLs, whether or not we attain profitability.
We have business and customer relationships with certain entities who are stockholders or affiliated with our directors, or both, and conflicts of interest may arise because of such relationships.
Some of our customers and other business partners are affiliated with certain of our directors or hold shares of our capital stock, or both. For example, we have entered into strategic relationships and/or customer relationships with Yahoo!, Red Hat and Hewlett Packard Enterprise. Our directors Jay Rossiter, Paul Cormier and Martin Fink are employees of Yahoo!, Red Hat and Hewlett Packard Enterprise, respectively, and Yahoo! and Hewlett Packard Enterprise are stockholders. We believe that the transactions and agreements that we have entered into with related parties are on terms that are at least as favorable as could reasonably have been obtained at such time from third parties. However, these relationships could create, or appear to create, potential conflicts of interest when our Board of Directors is faced with decisions that could have different implications for us and these other parties or their affiliates. In addition, conflicts of interest may arise between us and these other parties and their affiliates. The appearance of conflicts, even if such conflicts do not materialize, might adversely affect the public’s perception of us, as well as our relationship with other companies and our ability to enter into new relationships in the future, including with competitors of such related parties, which could harm our business and results of operations.
Catastrophic events may disrupt our business.
Our corporate headquarters are located in Santa Clara, California and we utilize data centers that are located in North America. Additionally, we rely on our network and third-party infrastructure and enterprise applications, internal technology systems and our website for our development, marketing, operational support, hosted services and sales activities. The west coast of the United States contains active earthquake zones. In the event of a major earthquake, hurricane, or catastrophic event such as fire, power loss, telecommunications failure, cyber-attack, war, or terrorist attack, we may be unable to continue our operations and may endure system interruptions, reputational harm, delays in our application development, extended interruptions in HDP and HDF, breaches of data security and loss of critical data, all of which could harm our future results of operations.
If we fail to maintain an effective system of internal controls, we may not be able to accurately or timely report our financial results or prevent fraud.
Section 404 of the Sarbanes-Oxley Act of 2002 (the “Sarbanes Oxley Act”) requires, among other things, that we maintain effective internal control over financial reporting and disclosure controls and procedures. In particular, we must perform system and process evaluation and testing of our internal control over financial reporting to allow management to report on the effectiveness of our internal control over financial reporting. A report of our management is included under Item 9A. “Controls and Procedures” of this Annual Report on Form 10-K. During its evaluation of the effectiveness of internal control over financial reporting as of December 31, 2015, management identified a material weakness related to the control surrounding the recognition of revenue and deferred revenue for a subset of non-standard license transactions where post-contract support renewal rates were stated upon commencement of the arrangement. Our findings are related to the design effectiveness of this control. Each of the aforementioned transactions originated prior to our establishment and formalization of
30
Table of Contents
Section 404 internal controls in July 2015. A secondary review of these specific agreements was not performed at a sufficiently detailed level to detect errors in recognition of revenue and deferred revenue related to these arrangements. With the oversight of management and our Audit Committee, we initiated actions to address the root causes of the material weakness identified. There can be no assurance that such actions will be sufficient to remedy the material weakness identified or that additional or other control deficiencies will not be identified in the future. If we continue to experience a material weakness in our internal controls or fail to maintain or implement required new or improved controls, such circumstances could cause us to fail to meet our periodic reporting obligations or result in material misstatements in our financial statements, or adversely affect the results of periodic management evaluations and annual auditor attestation reports. Each of the foregoing results could cause stockholders to lose confidence in our reported financial information and lead to a decline in our stock price. See Item 9A. “Controls and Procedures” for more information.
Risks Related to Ownership of Our Common Stock
Our stock price has been, and may continue to be, volatile or may decline regardless of our operating performance resulting in substantial losses for our stockholders.
The trading price of our common stock has been, and may continue to be, volatile and could fluctuate widely regardless of our operating performance. The market price of our common stock may fluctuate significantly in response to numerous factors, many of which are beyond our control, including:
| • | actual or anticipated fluctuations in our results of operations; |
| • | the financial projections we may provide to the public, any changes in these projections or our failure to meet these projections; |
| • | failure of securities analysts to initiate or maintain coverage of our company, changes in financial estimates and publication of other news by any securities analysts who follow our company, or our failure to meet these estimates or the expectations of investors; |
| • | ratings changes by any securities analysts who follow our company; |
| • | announcements by us or our competitors of significant technical innovations, acquisitions, strategic partnerships, joint ventures, or capital commitments; |
| • | changes in operating performance and stock market valuations of other technology companies generally, or those in our industry in particular; |
| • | price and volume fluctuations in the overall stock market from time to time, including as a result of trends in the economy as a whole; |
| • | changes in accounting standards, policies, guidelines, interpretations or principles; |
| • | actual or anticipated developments in our business or our competitors’ businesses or the competitive landscape generally; |
| • | developments or disputes concerning our intellectual property or our offerings, or third-party proprietary rights; |
| • | announced or completed acquisitions of businesses or technologies by us or our competitors; |
| • | new laws or regulations or new interpretations of existing laws, or regulations applicable to our business; |
| • | any major change in our Board of Directors or management; |
| • | sales of shares of our common stock by us or our stockholders; |
| • | lawsuits threatened or filed against us; and |
| • | other events or factors, including those resulting from war, incidents of terrorism, or responses to these events. |
31
Table of Contents
In addition, the stock markets have experienced extreme price and volume fluctuations that have affected and continue to affect the market prices of equity securities of many technology companies. Stock prices of many technology companies have fluctuated in a manner unrelated or disproportionate to the operating performance of those companies. In particular, the trading price of our common stock has fluctuated significantly in recent periods. In the past, stockholders have instituted securities class action litigation following periods of market volatility, and a securities class action litigation was recently instituted against us, which we believe was triggered by the recent fluctuations of the trading price of our common stock. This securities litigation and any other securities litigation we may become involved in may subject us to substantial costs, may divert resources and the attention of management from operating our business and may harm our business, results of operations, financial condition and cash flows.
Our directors, officers and principal stockholders beneficially own a significant percentage of our stock and will be able to exert significant control over matters subject to stockholder approval.
As of March 4, 2016, our directors, officers, five percent or greater stockholders, and their respective affiliates beneficially owned in the aggregate approximately 41 percent of our outstanding voting stock. These stockholders may be able to determine all matters requiring stockholder approval. For example, these stockholders will be able to control elections of directors, amendments of our organizational documents, and approval of any merger, sale of assets, or other major corporate transaction. This may prevent or discourage unsolicited acquisition proposals or offers for our common stock that you may feel are in your best interest as one of our stockholders.
Anti-takeover provisions in our charter documents and under Delaware law could make an acquisition of our company more difficult, limit attempts by our stockholders to replace or remove our current management and limit the market price of our common stock.
Provisions in our amended and restated certificate of incorporation and bylaws may have the effect of delaying or preventing a change of control or changes in our management. Our amended and restated certificate of incorporation and bylaws include provisions that:
| • | authorize our Board of Directors to issue, without further action by the stockholders, shares of undesignated preferred stock with terms, rights and preferences determined by our Board of Directors that may be senior to our common stock; |
| • | require that any action to be taken by our stockholders be effected at a duly called annual or special meeting and not by written consent; |
| • | specify that special meetings of our stockholders can be called only by our Board of Directors, the Chair of our Board of Directors, or our Chief Executive Officer; |
| • | establish an advance notice procedure for stockholder proposals to be brought before an annual meeting, including proposed nominations of persons for election to our Board of Directors; |
| • | establish that our Board of Directors is divided into three classes, Class I, Class II and Class III, with each class serving three-year staggered terms; |
| • | prohibit cumulative voting in the election of directors; |
| • | provide that our directors may be removed only for cause; |
| • | provide that vacancies on our Board of Directors may be filled only by a majority of directors then in office, even though less than a quorum; and |
| • | require the approval of our Board of Directors or the holders of at least seventy-five percent of our outstanding shares of capital stock to amend our bylaws and certain provisions of our certificate of incorporation. |
32
Table of Contents
These provisions may frustrate or prevent any attempts by our stockholders to replace or remove our current management by making it more difficult for stockholders to replace members of our Board of Directors, which is responsible for appointing the members of our management. In addition, because we are incorporated in Delaware, we are governed by the provisions of Section 203 of the Delaware General Corporation Law, which generally prohibits a Delaware corporation from engaging in any of a broad range of business combinations with any “interested” stockholder for a period of three years following the date on which the stockholder became an “interested” stockholder. Any delay or prevention of a change of control transaction or changes in our management could cause the market price of our common stock to decline.
We are an “emerging growth company” and we cannot be certain if the reduced disclosure requirements applicable to emerging growth companies will make our common stock less attractive to investors.
We are an “emerging growth company,” as defined in the federal securities laws, and we are taking advantage of certain exemptions from various reporting requirements that are applicable to other public companies that are not “emerging growth companies” including, but not limited to, not being required to comply with the auditor attestation requirements of Section 404 of the Sarbanes-Oxley Act of 2002 (“Sarbanes-Oxley Act”), reduced disclosure obligations regarding executive compensation in our periodic reports and proxy statements, and exemptions from the requirements of holding a nonbinding advisory vote on executive compensation and stockholder approval of any golden parachute payments not previously approved. For as long as we continue to be an emerging growth company, we intend to take advantage of certain of these exemptions. We cannot predict if investors will find our common stock less attractive because we may rely on these exemptions. If some investors find our common stock less attractive as a result, there may be a less active trading market for our common stock and our stock price may be more volatile.
Section 107 of the JOBS Act provides that an “emerging growth company” can take advantage of an extended transition period for complying with new or revised accounting standards. However, we chose to “opt out” of such extended transition period, and as a result, we will comply with new or revised accounting standards on the relevant dates adoption of such standards is required for non-emerging growth companies. Our decision to opt out of the extended transition period for complying with new or revised accounting standards is irrevocable.
We will remain an “emerging growth company” until the earliest of: (i) the last day of the fiscal year following the five-year anniversary of the completion of our initial public offering; (ii) the end of the fiscal year in which we have more than $1.0 billion in annual revenue; (iii) the end of the fiscal year in which we qualify as a “large accelerated filer”, with at least $700 million of equity securities held by non-affiliates as of the end of the second quarter of such fiscal year; and (iv) the date on which we have, during the previous three-year period, issued more than $1.0 billion in non-convertible debt securities.
The requirements of being a public company may strain our resources, divert management’s attention, and affect our ability to attract and retain executive management and qualified board members.
As a public company, we are subject to the reporting requirements of the Exchange Act, the Sarbanes-Oxley Act, the Dodd-Frank Wall Street Reform and Consumer Protection Act of 2010, the listing requirements of the exchanges and other markets upon which our common stock is listed, and other applicable securities rules and regulations.
Compliance with these rules and regulations will continue to increase our legal and financial compliance costs, make some activities more difficult, time-consuming, or costly, and increase demand on our systems and resources, particularly after we are no longer an “emerging growth company.” The Exchange Act requires, among other things, that we file annual, quarterly and current reports with respect to our business and results of operations. The Sarbanes-Oxley Act requires, among other things, that we maintain effective disclosure controls and procedures and internal control over financial reporting. In order to maintain and, if required, improve our disclosure controls and procedures and internal control over financial reporting to meet this standard, significant
33
Table of Contents
resources and management oversight may be required. We are required to disclose changes made in our internal control and procedures on a quarterly basis and we are required to furnish a report by management on, among other things, the effectiveness of our internal control over financial reporting. However, our independent registered public accounting firm will not be required to formally audit and attest to the effectiveness of our internal control over financial reporting pursuant to Section 404 until the date we are no longer an “emerging growth company.” As a result of the complexity involved in complying with the rules and regulations applicable to public companies, our management’s attention may be diverted from other business concerns, which could harm our business and results of operations. Although we have already hired additional employees to assist us in complying with these requirements, we may need to hire more employees in the future or engage outside consultants, which will increase our operating expenses. As we continue to grow rapidly, both organically and through strategic acquisitions, we expect to enhance our disclosure controls and procedures and internal control over financial reporting, however, we cannot guarantee the adequacy of these enhancements, including integration and accounting for acquisition-related expenses.
In addition, changing laws, regulations and standards relating to corporate governance and public disclosure are creating uncertainty for public companies, increasing legal and financial compliance costs, and making some activities more time-consuming. These laws, regulations and standards are subject to varying interpretations, in many cases due to their lack of specificity, and, as a result, their application in practice may evolve over time as new guidance is provided by regulatory and governing bodies. This could result in continuing uncertainty regarding compliance matters and higher costs necessitated by ongoing revisions to disclosure and governance practices. We intend to invest substantial resources to comply with evolving laws, regulations and standards, and this investment may result in increased general and administrative expenses and a diversion of management’s time and attention from business operations to compliance activities. If our efforts to comply with new laws, regulations and standards differ from the activities intended by regulatory or governing bodies due to ambiguities related to their application and practice, regulatory authorities may initiate legal proceedings against us and our business may be harmed.
Being a public company and these new rules and regulations will continue to make it more expensive for us to obtain director and officer liability insurance, and in the future we may be required to accept reduced coverage or incur substantially higher costs to obtain coverage. These factors could also make it more difficult for us to attract and retain qualified members of our Board of Directors, particularly to serve on our audit committee and compensation committee, and qualified executive officers.
As a result of disclosure of information in our filings with the SEC, our business and financial condition has become more visible, which we believe may result in threatened or actual litigation, including by competitors and other third parties. If such claims are successful, our business and results of operations could be harmed, and even if the claims do not result in litigation or are resolved in our favor, these claims, and the time and resources necessary to resolve them, could divert the resources of our management and harm our business and results of operations.
We do not intend to pay dividends on our common stock so any returns will be limited to changes in the value of our common stock.
We have never declared or paid any cash dividends on our common stock. We currently anticipate that we will retain future earnings for the development, operation and expansion of our business, and do not anticipate declaring or paying any cash dividends for the foreseeable future. Any return to stockholders will therefore be limited to the increase, if any, of our stock price, which may never occur.
If securities or industry analysts do not publish research or publish inaccurate or unfavorable research about our business, our stock price and trading volume could decline.
The trading market for our common stock depends in part on the research and reports that securities or industry analysts publish about us or our business. If few securities analysts cover us, or if industry analysts cease
34
Table of Contents
coverage of us, the trading price for our common stock would be negatively affected. If one or more of the analysts who cover us downgrade our common stock or publish inaccurate or unfavorable research about our business, our common stock price would likely decline. If one or more of these analysts cease coverage of us or fail to publish reports on us regularly, demand for our common stock could decrease, which might cause our common stock price and trading volume to decline.
Substantial future sales of our common stock in the public market could cause our stock price to fall.
Additional sales of our common stock in the public market, or the perception that these sales could occur, could cause the market price of our common stock to decline. As of December 31, 2015, we had 46,537,976 shares of common stock outstanding, which excludes any shares of common stock issuable upon exercise of warrants and options outstanding as of such date. As of February 1, 2016, the date of the final prospectus of our follow-on public offering, 3,752,288 shares of our common stock were subject to lock-up agreements entered into in connection with our follow-on public offering restricting the transfer of such shares for 75 days after February 1, 2016, subject to certain exceptions (including sales pursuant to existing sales plans adopted pursuant to Rule 10b5-1 under the Exchange Act). Subject to certain limitations, these shares will become eligible for sale upon expiration of the lock-up agreements. In addition, as of December 31, 2015, there were outstanding options and warrants to purchase 15,278,855 shares of our common stock that, if exercised, will result in these additional shares becoming available for sale upon expiration of the lock-up agreements. Sales by these stockholders, option holders or warrant holders of a substantial number of shares could significantly reduce the market price of our common stock. Moreover, some holders of shares of our common stock have rights, subject to certain conditions, to require us to file registration statements covering the shares they currently hold, or to include these shares in registration statements that we might file for ourselves or other stockholders.
Additionally, the shares of common stock subject to outstanding options and restricted stock unit awards under our equity incentive plans and the shares reserved for future issuance under our equity incentive plans will become eligible for sale in the public market in the future, subject to certain legal and contractual limitations.
Our charter documents designate the Court of Chancery of the State of Delaware as the sole and exclusive forum for certain types of actions and proceedings that may be initiated by our stockholders, which could limit our stockholders’ ability to obtain a favorable judicial forum for disputes with us or our directors, officers, or other employees.
Our amended and restated certificate of incorporation and bylaws provide that, unless we consent in writing to the selection of an alternative forum, the Court of Chancery of the State of Delaware shall be the sole and exclusive forum for (i) any derivative action or proceeding brought on our behalf, (ii) any action asserting a claim of breach of a fiduciary duty owed by any of our directors, officers or other employees to us or our stockholders, (iii) any action asserting a claim arising pursuant to any provision of the Delaware General Corporation Law, our amended and restated certificate of incorporation or our bylaws, or (iv) any action asserting a claim against us governed by the internal affairs doctrine. Any person or entity purchasing or otherwise acquiring any interest in shares of our capital stock shall be deemed to have notice of and consented to the provisions of our amended and restated certificate of incorporation described above. This choice of forum provision may limit a stockholder’s ability to bring a claim in a judicial forum that it finds favorable for disputes with us or our directors, officers, or other employees, which may discourage such lawsuits against us and our directors, officers and other employees. Alternatively, if a court were to find these provisions of our amended and restated certificate of incorporation inapplicable to, or unenforceable in respect of, one or more of the specified types of actions or proceedings, we may incur additional costs associated with resolving such matters in other jurisdictions, which could harm our business, financial condition, or results of operations.
35
Table of Contents
Item 1B. Unresolved Staff Comments.
None.
We lease office facilities around the world totaling approximately 149,000 square feet, including over 92,000 square feet of space for our corporate headquarters, which includes research and development, sales, marketing, business operations and executive offices, in Santa Clara, California pursuant to a lease that expires in September 2019. We believe that our facilities are adequate to meet our needs for the immediate future, and that, should it be needed, suitable additional space will be available to accommodate expansion of our operations.
From time to time, we are involved in legal proceedings and subject to claims arising in the ordinary course of our business. Although the results of litigation and claims cannot be predicted with certainty, we currently believe that the final outcome of these ordinary course matters will not have a material adverse effect on our business, operating results, financial condition or cash flows. Regardless of the outcome, litigation can have an adverse impact on us because of defense and settlement costs, diversion of management resources and other factors.
On February 29, 2016, the Company, Robert G. Bearden and Scott J. Davidson were sued in a putative class action lawsuit, captioned William Monachelli v. Hortonworks, Inc., et al., Case No. 3:16-cv-00980, filed in the United Stated District Court for the Northern District of California by a purported stockholder of the Company, in connection with our January 15, 2016 announcement of our follow-on offering. The Monachelli lawsuit alleges that the Company and Messrs. Bearden and Davidson violated federal securities laws by misrepresenting and/or omitting information pertaining to the Company’s capital requirements. The lawsuit seeks unspecified damages and attorneys’ fees and costs.
Although the ultimate outcome of litigation cannot be predicted with certainty, we believe that this lawsuit is without merit and we intend to defend against the action vigorously. We believe that any liability resulting from the litigation will not have a material adverse effect on our business, financial condition or results of operations.
Item 4. Mine Safety Disclosures.
Not applicable.
36
Table of Contents
Item 5. Market for Registrant’s Common Equity, Related Stockholder Matters and Issuer Purchases of Equity Securities.
Market Information for Common Stock
Our common stock has been listed on the NASDAQ Global Select Market under the symbol “HDP” since December 12, 2014. Prior to that date, there was no public trading market for our common stock. The following table sets forth for the periods indicated the intra-day high and low sales prices per share of our common stock as reported on the NASDAQ Global Select Market:
| High | Low | |||||||
| Fiscal 2014 |
||||||||
| Fourth quarter (from December 12, 2014) |
$ | 28.92 | $ | 21.38 | ||||
| Fiscal 2015 |
||||||||
| First quarter |
$ | 29.83 | $ | 19.60 | ||||
| Second quarter |
$ | 28.20 | $ | 19.50 | ||||
| Third quarter |
$ | 28.91 | $ | 20.91 | ||||
| Fourth quarter |
$ | 22.82 | $ | 15.75 | ||||
Holders of Record
As of March 4, 2016, we had 74 holders of record of our common stock. The actual number of stockholders is greater than this number of stockholders of record, and includes stockholders who are beneficial owners, but whose shares are held in street name by brokers, trusts and other nominees.
Dividend Policy
We have never declared or paid any cash dividends on our capital stock. We currently intend to retain any future earnings and do not expect to pay any dividends in the foreseeable future. Any future determination to declare cash dividends will be made at the discretion of our Board of Directors, subject to applicable laws, and will depend on a number of factors, including our financial condition, results of operations, capital requirements, contractual restrictions, general business conditions and other factors that our Board of Directors may deem relevant.
Equity Compensation Plan Information
See Item 12, “Security Ownership of Certain Beneficial Owners and Management and Related Stockholder Matters” for information regarding securities authorized for issuance.
Use of Proceeds
The Registration Statement on Form S-1 (File No. 333-200044) for our initial public offering of our common stock was declared effective by the SEC on December 11, 2014. The Registration Statement on Form S-1 registered an aggregate of 7,187,500 shares of our common stock, including 937,500 shares registered to cover an option to purchase additional shares that we granted to the underwriters of our initial public offering. On December 17, 2014, we closed our initial public offering and sold 7,187,500 shares of our common stock at a public offering price of $16.00 per share for an aggregate offering price of $115.0 million. Upon completion of the sale of the shares of our common stock referenced in the precedent sentence, our initial public offering terminated. There has been no material change in the planned use of proceeds from our initial public offering as described in our final prospectus filed with the SEC on December 12, 2014 pursuant to Rule 424(b)(4).
37
Table of Contents
The underwriters of our initial public offering were Goldman, Sachs & Co., Credit Suisse Securities (USA) LLC, RBC Capital Markets, LLC, Pacific Crest Securities LLC, Wells Fargo Securities, LLC and Blackstone Advisory Partners L.P. We paid to the underwriters of our initial public offering an underwriting discount totaling $8.1 million. In addition, we incurred expenses of approximately $5.1 million which, when added to the underwriting discount, amount to total expenses of approximately $13.2 million. Thus, the net offering proceeds, including the concurrent private placement, after deducting underwriting discounts and offering expenses, were approximately $109.6 million. No payments were made to our directors or officers or their associates, holders of 10 percent or more of any class of our equity securities or any affiliates.
The Registration Statement on Form S-3 (File No. 333-209015) for our follow-on public offering of our common stock was declared effective by the SEC on February 1, 2016. The Registration Statement on Form S-3 registered an aggregate of 9,688,750 shares of our common stock, including 1,263,750 shares registered to cover an option to purchase additional shares that we granted to the underwriters of our follow-on public offering. On February 2, 2016, we closed our follow-on public offering and sold 9,688,750 shares of our common stock at a public offering price of $9.50 per share, for an aggregate offering price of approximately $92.0 million. There has been no material change in the planned use of proceeds from our follow-on public offering as described in our final prospectus filed with the SEC on February 2, 2016 pursuant to Rule 424(b)(4).
The underwriters of our follow-on public offering were Goldman, Sachs & Co., Credit Suisse Securities (USA) LLC, RBC Capital Markets, LLC, Pacific Crest Securities, a division of KeyBanc Capital Markets Inc., Wells Fargo Securities, LLC and PJT Partners LP. We paid to the underwriters of our follow-on public offering an underwriting discount totaling approximately $3.2 million. In addition, we incurred expenses of approximately $1.1 million which, when added to the underwriting discount, amount to total expenses of approximately $4.3 million. Thus, the net offering proceeds, after deducting underwriting discounts and offering expenses, were approximately $87.7 million. No payments were made to our directors or officers or their associates, holders of 10 percent or more of any class of our equity securities or any affiliates.
38
Table of Contents
Stock Performance Graph
This performance graph shall not be deemed “soliciting material” or to be “filed” with the SEC for purposes of Section 18 of the Exchange Act, or otherwise subject to the liabilities under that Section, and shall not be deemed to be incorporated by reference into any of our filings under the Securities Act.
The following graph shows the cumulative total return to our stockholders during the period from December 12, 2014 (the date our common stock commenced trading on the NASDAQ Global Select Market) through December 31, 2015, in comparison to the NASDAQ Composite Index and the NASDAQ-100 Technology Sector Index. All values assume a $100 initial investment and data for the NASDAQ Composite Index and the NASDAQ-100 Technology Sector Index assume reinvestment of dividends. Such returns are based on historical results and are not intended to suggest future performance.
COMPARISON OF CUMULATIVE TOTAL RETURN
Among Hortonworks, Inc., the NASDAQ Composite Index and the NASDAQ-100 Technology Sector Index
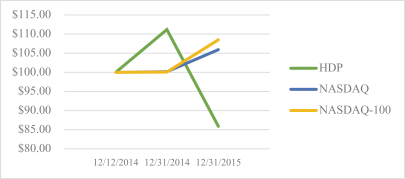
Recent Sales of Unregistered Securities
Shares Issued in Connection with Acquisitions
In August 2015, we issued approximately 1.6 million shares of our common stock in connection with our acquisition of Onyara. Of these shares, 1.1 million shares were allocated to purchase consideration. The remaining 0.5 million were considered post-combination remuneration which will be recorded as stock-based compensation expense over the vesting period of up to three years.
In April 2015, we issued 163,685 restricted stock units (“RSUs”) in connection with our acquisition of SequenceIQ. Of the total RSUs issued, 49,102 vested at closing and the remaining 114,583 RSUs vest over a period of up to three years. The vesting of the additional RSUs is contingent upon the continued employment of the selling shareholders that were retained as employees.
In May 2014, we issued an aggregate of 132,508 shares of our common stock in connection with our acquisition of XA Secure and as consideration to individuals and entities who were former service providers and/or stockholders of XA Secure.
Purchases of Equity Securities by the Issuer and Affiliated Purchasers
There were no repurchases of equity securities by us during the fourth quarter of 2015. We have no publicly announced plan or program for the purchase of shares.
39
Table of Contents
Item 6. Selected Financial Data.
The following selected consolidated statement of operations data for the years ended December 31, 2015 and 2014, the eight months ended December 31, 2013 and the years ended April 30, 2013 and 2012 and the consolidated balance sheet data as of December 31, 2015, December 31, 2014, December 31, 2013, April 30, 2013 and April 30, 2012 have been derived from our audited consolidated financial statements included elsewhere in this Annual Report on Form 10-K. The selected consolidated statement of operations data for the eight months ended December 31, 2012 are derived from our unaudited comparative transition period consolidated financial statements included elsewhere in this Annual Report on Form 10-K. The unaudited comparative transition period consolidated financial statements reflect, in the opinion of management, all adjustments, of a normal, recurring nature that are necessary for the fair presentation of the consolidated financial statements. Our historical results are not necessarily indicative of the results that may be expected in the future, and the results for the year ended December 31, 2015 are not necessarily indicative of results to be expected for any other period. The following selected financial and other data should be read in conjunction with “Management’s Discussion and Analysis of Financial Condition and Results of Operations” and our consolidated financial statements and related notes included elsewhere in this Annual Report on Form 10-K.
| Years Ended December 31, |
Eight Months Ended December 31, |
Years Ended April 30, |
||||||||||||||||||||||
| 2015 | 2014 | 2013 | 2012 | 2013 | 2012 | |||||||||||||||||||
| (In thousands, except share and per share amounts) | ||||||||||||||||||||||||
| Consolidated Statements of Income Data: |
||||||||||||||||||||||||
| Total support subscription and professional services revenue(1) |
$ | 121,944 | $ | 46,048 | $ | 17,865 | $ | 4,778 | $ | 10,998 | $ | 1,646 | ||||||||||||
| Total cost of revenue(1)(2) |
55,171 | 80,879 | 13,710 | 5,933 | 10,933 | 1,395 | ||||||||||||||||||
| Total operating expenses(2) |
246,366 | 138,668 | 50,346 | 18,658 | 36,855 | 11,854 | ||||||||||||||||||
| Loss from operations |
(179,593 | ) | (173,499 | ) | (46,191 | ) | (19,813 | ) | (36,790 | ) | (11,603 | ) | ||||||||||||
| Other income (expense), net(3) |
908 | (4,977 | ) | 23 | 110 | 163 | 83 | |||||||||||||||||
| Income tax expense (benefit) |
432 | (1,111 | ) | 45 | 8 | 11 | 1 | |||||||||||||||||
| Net loss |
$ | (179,117 | ) | $ | (177,365 | ) | $ | (46,213 | ) | $ | (19,711 | ) | $ | (36,638 | ) | $ | (11,521 | ) | ||||||
|
|
|
|
|
|
|
|
|
|
|
|
|
|||||||||||||
| Net loss per share of common stock, basic and diluted(4) |
$ | (4.13 | ) | $ | (24.16 | ) | $ | (18.18 | ) | $ | (16.96 | ) | $ | (30.29 | ) | $ | (74.30 | ) | ||||||
|
|
|
|
|
|
|
|
|
|
|
|
|
|||||||||||||
| Weighted average shares used in computing net loss per share of common stock, basic and diluted(4) |
43,318,044 | 7,341,465 | 2,541,800 | 1,161,880 | 1,209,750 | 155,052 | ||||||||||||||||||
|
|
|
|
|
|
|
|
|
|
|
|
|
|||||||||||||
40
Table of Contents
| (1) | Total support subscription and professional services revenue includes contra-revenue as follows (in thousands): |
| Years Ended December 31, |
Eight Months Ended December 31, |
|||||||||||
| 2015 | 2014 | 2013 | ||||||||||
| Gross support subscription and professional services revenue: |
||||||||||||
| Support subscription |
$ | 77,793 | $ | 31,519 | $ | 11,782 | ||||||
| Professional services |
44,216 | 20,616 | 6,465 | |||||||||
|
|
|
|
|
|
|
|||||||
| Total gross support subscription and professional services revenue |
122,009 | 52,135 | 18,247 | |||||||||
|
|
|
|
|
|
|
|||||||
| Contra-support subscription and professional services revenue: |
||||||||||||
| Support subscription |
(65 | ) | (5,961 | ) | (367 | ) | ||||||
| Professional services |
— | (126 | ) | (15 | ) | |||||||
|
|
|
|
|
|
|
|||||||
| Total contra-support subscription and professional services revenue |
(65 | ) | (6,087 | ) | (382 | ) | ||||||
|
|
|
|
|
|
|
|||||||
| Support subscription and professional services revenue: |
||||||||||||
| Support subscription |
77,728 | 25,558 | 11,415 | |||||||||
| Professional services |
44,216 | 20,490 | 6,450 | |||||||||
|
|
|
|
|
|
|
|||||||
| Total support subscription and professional services revenue |
121,944 | 46,048 | 17,865 | |||||||||
|
|
|
|
|
|
|
|||||||
| Cost of revenue excluding 2011 Yahoo! Warrant adjustment: |
||||||||||||
| Cost of support subscription |
13,705 | 5,289 | 3,720 | |||||||||
| Cost of professional services |
41,466 | 27,637 | 9,990 | |||||||||
|
|
|
|
|
|
|
|||||||
| Total cost of revenue excluding 2011 Yahoo! Warrant adjustment |
55,171 | 32,926 | 13,710 | |||||||||
|
|
|
|
|
|
|
|||||||
| Cost of revenue adjustment for 2011 Yahoo! Warrant: |
||||||||||||
| Cost of support subscription |
— | 47,398 | — | |||||||||
| Cost of professional services |
— | 555 | — | |||||||||
|
|
|
|
|
|
|
|||||||
| Total cost of revenue adjustment for 2011 Yahoo! Warrant |
— | 47,953 | — | |||||||||
|
|
|
|
|
|
|
|||||||
| Cost of revenue: |
||||||||||||
| Cost of support subscription |
13,705 | 52,687 | 3,720 | |||||||||
| Cost of professional services |
41,466 | 28,192 | 9,990 | |||||||||
|
|
|
|
|
|
|
|||||||
| Total cost of revenue |
$ | 55,171 | $ | 80,879 | $ | 13,710 | ||||||
|
|
|
|
|
|
|
|||||||
| (2) | Stock-based compensation expense was allocated as follows (in thousands): |
| Years Ended December 31, |
Eight Months Ended December 31, |
Years Ended April 30, |
||||||||||||||||||||||
| 2015 | 2014 | 2013 | 2012 | 2013 | 2012 | |||||||||||||||||||
| Cost of revenue |
$ | 2,702 | $ | 580 | $ | 132 | $ | 44 | $ | 45 | $ | 14 | ||||||||||||
| Research and development |
15,193 | 2,257 | 468 | 140 | 244 | 140 | ||||||||||||||||||
| Sales and marketing |
11,688 | 1,881 | 321 | 110 | 234 | 18 | ||||||||||||||||||
| General and administrative |
11,356 | 4,314 | 406 | 122 | 239 | 150 | ||||||||||||||||||
|
|
|
|
|
|
|
|
|
|
|
|
|
|||||||||||||
| Total stock-based compensation expense |
$ | 40,939 | $ | 9,032 | $ | 1,327 | $ | 416 | $ | 762 | $ | 322 | ||||||||||||
|
|
|
|
|
|
|
|
|
|
|
|
|
|||||||||||||
41
Table of Contents
| (3) | Other income (expense), net for the year ended December 31, 2014 includes $5.4 million in expense related to the vesting of the 2011 Yahoo! Warrant. See Note 9 to our consolidated financial statements for additional information on the 2011 Yahoo! Warrant. |
| (4) | See Note 11 to our consolidated financial statements for an explanation of the method used to calculate basic and diluted net loss per share attributable to common stockholders and the weighted average number of shares used in the computation of the per share amounts. |
| As of December 31, | As of April 30, | |||||||||||||||||||
| 2015 | 2014 | 2013 | 2013 | 2012 | ||||||||||||||||
| (In thousands) | ||||||||||||||||||||
| Consolidated Balance Sheet Data: |
||||||||||||||||||||
| Cash and cash equivalents and short-term investments |
$ | 94,301 | $ | 204,465 | $ | 38,509 | $ | 17,883 | $ | 51,350 | ||||||||||
| Working capital |
29,044 | 167,480 | 22,582 | 14,102 | 50,493 | |||||||||||||||
| Property and equipment, net |
15,422 | 11,182 | 1,093 | 1,050 | 381 | |||||||||||||||
| Long-term investments |
2,592 | — | — | 1,011 | 1,011 | |||||||||||||||
| Total assets |
212,019 | 256,039 | 54,443 | 29,279 | 55,029 | |||||||||||||||
| Capital lease obligations |
348 | 441 | — | — | — | |||||||||||||||
| Total deferred revenue |
106,779 | 62,923 | 27,928 | 16,730 | 10,148 | |||||||||||||||
| Total stockholders’ equity (deficit) |
67,591 | 167,070 | (90,440 | ) | (46,415 | ) | (10,623 | ) | ||||||||||||
Key Metric—Gross Billings
We have included gross billings, a non-GAAP financial measure, because it is a key measure used by our Board of Directors and management to monitor our near term cash flows and manage our business. Gross billings is calculated as total non-GAAP revenue plus the change in deferred revenue for the same period. We primarily employ a subscription based business model for support services and in more instances customers purchase both a support subscription and professional services engagements at the same time. Since we have not yet established VSOE of fair value for our support subscriptions, we recognize most of our revenue ratably over the period beginning when both the support subscription and professional services have commenced. The accounting treatment for our agreements coupled with the lack of VSOE causes the recognition of our revenue to be delayed and creates significant deferred revenue balances.
We have provided a reconciliation between total revenue, the most directly comparable GAAP financial measure, and gross billings in the table below. We believe gross billings provides useful information to investors and others in understanding and evaluating our operating results in the same manner as our Board of Directors and management.
| Years Ended December 31, |
Eight Months Ended December 31, |
Years Ended April 30, |
||||||||||||||||||||||
| 2015 | 2014 | 2013 | 2012 | 2013 | 2012 | |||||||||||||||||||
| (in thousands) | ||||||||||||||||||||||||
| Gross billings: |
||||||||||||||||||||||||
| Total revenue |
$ | 121,944 | $ | 46,048 | $ | 17,865 | $ | 4,778 | $ | 10,998 | $ | 1,646 | ||||||||||||
| Contra revenue |
65 | 6,087 | 382 | — | — | — | ||||||||||||||||||
|
|
|
|
|
|
|
|
|
|
|
|
|
|||||||||||||
| Total non-GAAP revenue |
122,009 | 52,135 | 18,247 | 4,778 | 10,998 | 1,646 | ||||||||||||||||||
| Total deferred revenue, end of period |
106,779 | 62,923 | 27,928 | 15,096 | 16,730 | 10,148 | ||||||||||||||||||
| Less: Total deferred revenue, beginning of period |
(62,923 | ) | (27,928 | ) | (16,730 | ) | (10,148 | ) | (10,148 | ) | — | |||||||||||||
|
|
|
|
|
|
|
|
|
|
|
|
|
|||||||||||||
| Total change in deferred revenue |
43,856 | 34,995 | 11,198 | 4,948 | 6,582 | 10,148 | ||||||||||||||||||
|
|
|
|
|
|
|
|
|
|
|
|
|
|||||||||||||
| Gross billings |
$ | 165,865 | $ | 87,130 | $ | 29,445 | $ | 9,726 | $ | 17,580 | $ | 11,794 | ||||||||||||
|
|
|
|
|
|
|
|
|
|
|
|
|
|||||||||||||
42
Table of Contents
Item 7. Management’s Discussion and Analysis of Financial Condition and Results of Operations.
The following discussion and analysis of our financial condition and results of operations should be read together with “Selected Consolidated Financial Data” and the consolidated financial statements and related notes included elsewhere in this annual report. This discussion contains forward-looking statements based upon current expectations that involve risks and uncertainties. Our actual results may differ materially from those anticipated in these forward-looking statements as a result of various factors, including those discussed in “Risk Factors” and in other parts of this annual report.
Overview
We seek to advance the market adoption of Hadoop and provide enterprises with a new data management solution that enables them to harness the power of big data to transform their businesses through more effective and efficient management of their valuable data assets. A Hadoop cluster combines commodity servers with local storage and an open source software distribution to create a reliable distributed compute and storage platform for large data sets scalable up to petabytes with thousands of servers or nodes. We have two solutions in the market today to address the needs of enterprises for their data: Hortonworks Data Platform (“HDP”) and Hortonworks DataFlow Platform (“HDF”). HDP is an enterprise-scale data management platform built entirely on open source technology including Apache Hadoop. At its core is the next generation computing and resource management framework called YARN, which uniquely enables a centralized data architecture for batch, interactive and real-time workloads to be executed simultaneously on a single cluster and dataset while extending consistent security, governance and operation across the platform. HDF is complementary to HDP, and makes it easy to automate and secure data flows that collect, conduct and curate real-time business insights and actions derived from sensors, machines, geolocation devices, clicks, logs and social feeds. Our approach is differentiated in that we are committed to serving the Apache Software Foundation open source ecosystem and to sharing all of our product developments with the open source community. We distribute the HDP and HDF software under the Apache open source license in order to provide broad rights for recipients of the software to use, copy, modify and redistribute the software. Consistent with our open source approach, we generally make HDP and HDF available free of charge.
We generate revenue predominately by selling support subscription offerings and professional services. Our support subscription agreements are typically annual arrangements. On occasion, we sell engineering services as well as a premium subscription agreement that provides a customer with development input and the opportunity to work more closely with our developers. We price our support subscription offerings based on the number of servers in a cluster, or nodes, data under management and/or the scope of support provided. Accordingly, our support subscription revenue varies depending on the scale of our customers’ deployments and the scope of the support agreement. Professional services revenue is derived from consulting services engagements and training services. Our consulting services are provided primarily on a time and materials basis, and to a lesser extent, a fixed fee basis, and training services are priced based on attendance. The growth of our total revenue is dependent upon (i) new customer acquisition, (ii) expansion of sales within our existing customers, (iii) the annual renewal of our support subscription agreements by our existing support subscription customers and (iv) professional services fees from consulting and training. Our revenue is subject to fluctuations based upon our success at addressing these factors but may also be impacted by the revenue recognition requirements of our multiple-element customer arrangements. Our early growth strategy has been aimed at acquiring customers for our support subscription offerings via a direct sales force and delivering consulting services. As we grow our business, our longer-term strategy will be to expand our partner network and leverage our partners to deliver a larger proportion of professional services to our customers on our behalf. The implementation of this strategy is expected to result in an increase in upfront costs in order to establish and further cultivate such strategic partnerships, but we expect that it will increase gross margins in the long term as the percentage of our revenue derived from professional services, which has a lower gross margin than our support subscriptions, decreases.
Our ability to successfully implement these strategies is subject to challenges, risks and uncertainties and our net losses have been increasing year over year. In our efforts to achieve profitability, we have placed and will
43
Table of Contents
continue to place an emphasis on investing within our support subscription sales efforts to try to drive increased revenue in both support subscriptions and professional services. If these support subscription sales efforts are not successful, due to unsuccessful execution by us, increased competition in our markets, or other factors, we will find it difficult to add new support subscription customers, and our revenue will not grow as quickly as we would like, and may decline. In addition, our longer-term strategy of leveraging our partners to provide an increasing proportion of professional services to our customers presents certain challenges. This strategy requires us to make upfront expenditures and devote time and attention to cultivating relationships. If we are unable to identify and engage suitable partners that are able to provide such services, or if our partners are unable to provide professional services at the quality level that our customers expect, we may not be able to achieve this transition as quickly as we would like, or at all. We expect that our ability to successfully implement this strategy will have a material impact on whether we can achieve profitability, due to the difference in gross margins on our support subscriptions versus our professional services. If the percentage of our total revenue that comes from professional services does not decrease over time as we expect, or we are not able to establish vendor-specific objective evidence (“VSOE”) for professional services revenue, then our ability to achieve profitability will be negatively impacted.
We have had a few agreements with, and equity issuances to, certain of our early, large customers that have had a significant impact on our historical results and that will continue to impact our reported GAAP results at least through the current fiscal quarter. These transactions were:
| • | In July 2011, we issued a warrant to purchase 6,500,000 shares of Series A preferred stock at an exercise price of $0.005 per share (which was convertible into 3,250,000 shares of common stock) to Yahoo! Inc. (“Yahoo!”), a related party. The warrant was issued in connection with our Series A financing and the transactions contemplated thereby, including commercial agreements with Yahoo! providing for support subscription offerings and certain rights to technology. The warrant expires nine years from the date of issuance and became exercisable for common stock upon the consummation of our initial public offering (“IPO”) in December 2014. As the warrant was issued to a customer, the vesting of the warrant upon the consummation of our IPO resulted in an immediate $4.0 million reduction in revenue, which was the cumulative revenue from Yahoo! since our inception. The $48.0 million difference between the fair value as of the date of our IPO of the warrant of $52.0 million and the reduction in revenue was recognized in cost of revenue during the fourth quarter of the year ended December 31, 2014. The $52.0 million fair value of the warrant was recognized in additional paid-in capital in our consolidated balance sheet. |
| • | In February 2012, we entered into a multi-year agreement with Teradata Corporation, at that time a related party, whereby we were to provide development, support, training and other professional services to Teradata and Teradata’s end-user customers. In April 2012, Teradata made a non-refundable $9.5 million prepayment that was to be credited for amounts owed relating to end-user support and professional services provided under the agreement through December 2016. In June 2015, we entered into an amendment to this prior agreement with Teradata and received a second prepayment of $1.5 million in August 2015 as consideration for support subscription offerings and professional services expected to be performed by us through December 2017. As of December 31, 2015, $4.9 million of the $11.0 million total prepayment made by Teradata remained in deferred revenue. As of February 2, 2016, Teradata was no longer a Hortonworks’ shareholder. |
| • | In July 2012, we entered into a multi-year subscription arrangement with Microsoft Corporation (“Microsoft”) as a customer and partner in order to enable and support HDP on Windows Server and the Azure Cloud platform by providing development, support, training and other professional services. The arrangement consisted of an initial co-engineering effort with Microsoft, which was completed in October 2013, followed primarily by ongoing enablement and support subscription offerings. In June 2015, we renewed this multi-year subscription arrangement with Microsoft in order to continue enablement and support of HDP on Windows Server and the Azure Cloud platform as well as HDP for Linux. Microsoft contributed significantly to our early revenue (8 percent and 22 percent of total |
44
Table of Contents
| revenue for the years ended December 31, 2015 and 2014, respectively, 38 percent and 58 percent of total revenue for the eight months ended December 31, 2013 and 2012, respectively, and 55 percent and 27 percent of total revenue for the years ended April 30, 2013 and 2012, respectively). We expect the revenue from Microsoft to continue to decrease as a percentage of our total revenue in the future as we generate more revenue from other customers. |
| • | In September 2013, we entered into a commercial agreement and common stock purchase agreement with AT&T Inc. (“AT&T”) covering the sale and issuance of 390,269 shares of our common stock to an affiliate of AT&T at a per share price of $0.0002. The shares were fully vested as of January 30, 2014. As a result of the issuance of shares to a customer at below fair value, we recorded contra-revenue in the amount of $2.0 million for the year ended December 31, 2014 and $0.4 million for the eight months ended December 31, 2013. |
| • | In June 2014, we issued a warrant to purchase up to 1.0 percent of our shares of common stock outstanding at the issuance date at an exercise price of $8.46 per share to Yahoo!, a related party. The warrant was issued to Yahoo! in exchange for the amendment of certain rights held by Yahoo! under the Investors’ Rights Agreement to approve certain corporate transactions involving Hortonworks. The warrant expires nine years from the date of issuance and became exercisable upon the consummation of our IPO at which point the number of shares issuable under the warrant was fixed, and the fair value of the award on the IPO date was reclassified to equity. As of December 31, 2015, the warrant is exercisable for 476,368 shares of our common stock. The combined value of the initial measurement and the change in the fair value of this warrant of $5.4 million was recorded as other expense in our consolidated statement of operations for the year ended December 31, 2014. As of December 31, 2014, this amount is also recorded as additional paid-in capital in our consolidated balance sheet. |
| • | In December 2014, we entered into a stock purchase agreement with Passport Capital, pursuant to which funds affiliated with Passport Capital purchased 486,486 shares of our common stock at $16.00 per share in the concurrent private placement that closed immediately subsequent to the closing of our IPO. |
| • | In February 2016, we completed a follow-on public offering of an aggregate of 9,688,750 shares of our common stock, including 1,263,750 additional shares sold pursuant to the full exercise of the option by the underwriters to purchase additional shares, at a public offering price of $9.50 per share. Our net proceeds were approximately $87.7 million after deducting underwriting discounts and commissions and estimated offering expenses. |
We have achieved significant growth in recent periods. Our revenue was $121.9 million and $46.0 million for the years ended December 31, 2015 and 2014, respectively, $17.9 million and $4.8 million for the eight months ended December 31, 2013 and 2012, respectively, and $11.0 million and $1.6 million for the years ended April 30, 2013, respectively. Our gross billings were $165.9 million and $87.1 million for the years ended December 31, 2015 and 2014, respectively, $29.4 million and $9.7 million for the eight months ended December 31, 2013 and 2012, respectively, and $17.6 million and $11.8 million for the years ended April 30, 2013 and 2012, respectively. We incurred net losses of $179.1 million and $177.4 million for the years ended December 31, 2015 and 2014, respectively, $46.2 million and $19.7 million for the eight months ended December 31, 2013 and 2012, respectively, and $36.6 million and $11.5 million for the years ended April 30, 2013 and 2012, respectively. See “Selected Financial Data—Key Metric—Gross Billings” for more information and a reconciliation of gross billings to total revenue, the most directly comparable GAAP financial measure, and an explanation of why management uses this non-GAAP financial measure.
Change in Fiscal Year
We changed our fiscal year end from April 30 to December 31, commencing with our fiscal year ended December 31, 2013.
45
Table of Contents
Key Factors Affecting Our Performance
Support Subscription Customers. Growth of our revenue from our support subscription offerings is driven by agreements with new support subscription customers, renewals of existing support subscription agreements and increased revenue from existing support subscription customers who are expanding their usage of HDP and HDF. The number of agreements with new support subscription customers signed may vary from period to period for several reasons, including the length of our sales cycle, the effectiveness of our sales and marketing efforts and overall adoption rates of Hadoop-based solutions. The contract value of our support subscriptions with individual support subscription customers varies substantially among customers, and our results of operations may fluctuate from period to period depending on the timing and composition of particular large support subscriptions including premium subscription agreements that provide a customer with development input and the opportunity to work more closely with our developers. Our results of operations may also fluctuate, in part, due to the resource-intensive nature of our sales efforts, the length and variability of the sales cycle of our support subscription offerings and the difficulty in making short-term adjustments to our operating expenses. The length of our sales cycle from initial evaluation to payment for our support subscription offerings is generally six to nine months, but can extend to one year or more for some customers. In addition, as our professional services engagements frequently relate to initial new support subscription customer deployments of HDP and HDF, growth in our professional services revenue is driven primarily by adding new support subscription customers and the associated sales of engagements relating to customer deployment.
Additional Sales to Existing Support Subscription Customers. Our existing support subscription customers continue to represent a large opportunity for us to expand our revenue base. Growth of our revenue from existing support subscription customers typically comes when customers increase the scale of their existing deployment of HDP as well as complement their deployment with HDF. We price our support subscription offerings based on the number of nodes, data under management and/or the scope of support services provided. Accordingly, our revenue from our support subscription offerings varies but primarily depends upon the scale of our support subscription customers’ deployments and the breadth and scope of their support agreement.
Investing for Growth. We will continue to focus on long-term growth. We believe that our market opportunities (HDP and HDF) are large and underpenetrated, and we will continue to invest significantly in sales and marketing to grow our customer base, expand within existing support subscription customers and grow internationally to drive additional revenue. We also expect to invest in research and development to enhance HDP, HDF, Apache Hadoop and other key Apache Open Source projects including Apache NiFi. To enable our growth, we plan to further invest in other operational and administrative functions including, but not limited to, our customer support organization that provides the basis for customer retention and further expansion. We expect to continue to use the proceeds from our IPO, the concurrent private placement and our follow-on public offering to fund these growth strategies and do not expect to be profitable in the near future. We also intend to leverage business partners for the delivery of professional services. We believe that our sales and marketing, research and development and general and administrative costs will decrease as a percentage of revenue in the long term as we are able to reach economies of scale and achieve process improvements and other operational efficiencies. With this increased operating leverage, we expect our gross and operating margins to increase in the long term.
Revenue Recognition Policies. We typically enter into sales arrangements pursuant to which we provide both support subscription offerings and professional services. On occasion, we sell engineering services as well as a premium subscription offering which allows a higher level of access and development input. Pursuant to software revenue recognition rules under GAAP, for arrangements providing both support subscription offerings and professional services, we typically recognize as revenue the entire arrangement fee ratably over the subscription period once the support subscription and professional services have commenced. The appropriate timing of revenue recognition must be evaluated on an arrangement-by-arrangement basis. The costs associated with our support subscription and professional services revenue are expensed as we incur the delivery costs. However, in many cases, the related revenue is deferred and recognized ratably over a later period. Thus, during times of rapid customer growth and accompanying delivery of professional services, our gross margin is expected to be negatively impacted.
46
Table of Contents
Key Business Metrics
We review a number of metrics, including the following key metrics, to evaluate our business, measure our performance, identify trends affecting our business, formulate business plans and make strategic decisions. These key business metrics include the following:
Dollar-Based Net Expansion Rate. We believe that our ability to retain our customers and expand their support subscription revenue over time will be an indicator of the stability of our revenue base and the long-term value of our customer relationships. Maintaining customer relationships allows us to sustain and increase revenue to the extent customers maintain or increase the number of nodes, data under management and/or the scope of the support subscription agreements. To date, only a small percentage of our customer agreements have reached the end of their original terms and, as a result, we have not observed a large enough sample of renewals to derive meaningful conclusions. We calculate dollar-based net expansion rate as of a given date as the aggregate annualized subscription contract value as of that date from those customers that were also customers as of the date 12 months prior, divided by the aggregate annualized subscription contract value from all customers as of the date 12 months prior. We calculate annualized support subscription contract value for each support subscription customer as the total subscription contract value as of the reporting date divided by the number of years for which the support subscription customer is under contract as of such date. We report the trailing four-quarter average dollar-based net expansion rate as of each period end. The dollar-based net expansion rate as of December 31, 2015 and 2014 was 159 percent and 144 percent, respectively.
Total subscription contract value for a support subscription customer account is a legal and contractual determination calculated as of a given date by aggregating the subscription fees that we expect to receive for each support subscription, assuming no changes to the subscription. The total subscription contract value is not determined by reference to historical or future revenue, deferred revenue or any other GAAP financial measure over any period. It is forward-looking and contractually derived as of the date of determination, and the period over which any associated revenue is recognized is affected by our revenue recognition policies under GAAP.
Total Support Subscription Customers. We believe total support subscription customers is a key indicator of our market penetration, growth and future revenue. In order to grow our customer base, we have aggressively invested in and intend to continue to invest in our direct sales team, as well as to pursue additional partnerships within our indirect sales channel. We generally define a support subscription customer as an entity with an active support subscription as of the measurement date. In situations where there are multiple contracts with multiple subsidiaries or divisions, universities, or governmental organizations of a single entity, the entity is counted once. Our total support subscription customer count was over 800 and 332 as of December 31, 2015 and 2014, respectively.
Components of Results of Operations
Revenue
We generate revenue primarily under multiple-element arrangements that include support subscription offerings combined with consulting and/or training services. On occasion, we sell engineering services as well as a premium subscription offering which allows a higher level of access and development input. We have not yet established VSOE of fair value, for our support subscriptions. Accordingly, for our multiple-element arrangements, we generally recognize revenue on a ratable basis over the period beginning when both the support subscription and professional services have commenced, and ending at the conclusion of the support subscription or professional services period, whichever is longer.
Cost of Revenue
Cost of support subscription revenue consists primarily of personnel costs (including salaries, benefit and stock-based compensation expense) for employees, including support engineers, associated with our support
47
Table of Contents
subscription offerings mainly related to technology support and allocated shared costs. Cost of professional services revenue consists primarily of personnel costs (including salaries, benefits and stock-based compensation expense) for employees and fees to subcontractors associated with our professional service contracts, travel costs and allocated shared costs.
We allocate shared costs such as rent, information technology and employee benefits to all departments based on headcount. As such, allocated shared costs are reflected in cost of revenue and each operating expense category. Cost of revenue for support subscription and professional services is expensed as incurred.
Operating Expenses
Sales and Marketing. Sales and marketing expenses consist primarily of personnel costs (including salaries, benefits and stock-based compensation expense) for our sales and marketing employees. In addition, sales and marketing expenses include the cost of advertising, online marketing, promotional events, corporate communications, product marketing and other brand-building activities, plus allocated shared costs. We expect our sales and marketing expenses to continue to increase for the foreseeable future as we continue to invest in our selling and marketing activities, building brand awareness, attracting new customers and sponsor additional marketing events. However, we expect our sales and marketing expenses to decrease as a percentage of our total revenue over the long term.
Research and Development. Research and development expenses consist primarily of personnel costs (including salaries, benefits and stock-based compensation expense) for our research and development employees, costs associated with subcontractors and equipment lease expenses, plus allocated shared costs. Our research and development expenses include costs for development related to the distribution of our solutions, including security updates, fixes, functionality enhancements, upgrades to the technology and new versions of the software, quality assurance personnel, technical documentation personnel and at times expenses related to engineering resources for our subscription and professional services offerings. We expect to continue to focus our research and development efforts on enhancing and adding new features and functionality to our offerings. As a result, we expect our research and development expenses to continue to increase for the foreseeable future. However, we expect our research and development expenses to decrease as a percentage of our total revenue over the long term.
General and Administrative. General and administrative expenses consist primarily of personnel costs (including salaries, benefits and stock-based compensation expense) for our executive, finance, human resources, IT and other administrative employees. In addition, general and administrative expenses include fees for third-party professional services, including consulting, legal and accounting services and other corporate expenses and allocated overhead. We expect our general and administrative expenses to continue to increase for the foreseeable future as we continue to invest in the growth of our business. However, we expect our general and administrative expenses to decrease as a percentage of our total revenue over the long term.
48
Table of Contents
Results of Operations
The following table sets forth selected consolidated statements of operations data for each of the periods indicated:
| Years Ended December 31, |
Eight Months Ended December 31, |
Years Ended April 30, |
||||||||||||||||||||||
| 2015 | 2014 | 2013 | 2012 | 2013 | 2012 | |||||||||||||||||||
| (in thousands) | ||||||||||||||||||||||||
| Support subscription and professional services revenue: |
||||||||||||||||||||||||
| Support subscription (including contra-revenue of $65 and $5,961 for the years ended December 31, 2015 and 2014, respectively) |
$ | 77,728 | $ | 25,558 | $ | 11,415 | $ | 3,643 | $ | 7,739 | $ | 1,276 | ||||||||||||
| Professional services (including contra-revenue of $126 for the year ended December 31, 2014) |
44,216 | 20,490 | 6,450 | 1,135 | 3,259 | 370 | ||||||||||||||||||
|
|
|
|
|
|
|
|
|
|
|
|
|
|||||||||||||
| Total support subscription and professional services revenue |
121,944 | 46,048 | 17,865 | 4,778 | 10,998 | 1,646 | ||||||||||||||||||
| Cost of revenue: |
||||||||||||||||||||||||
| Support subscription |
13,705 | 52,687 | 3,720 | 2,880 | 5,071 | 421 | ||||||||||||||||||
| Professional services |
41,466 | 28,192 | 9,990 | 3,053 | 5,862 | 974 | ||||||||||||||||||
|
|
|
|
|
|
|
|
|
|
|
|
|
|||||||||||||
| Total cost of revenue |
55,171 | 80,879 | 13,710 | 5,933 | 10,933 | 1,395 | ||||||||||||||||||
|
|
|
|
|
|
|
|
|
|
|
|
|
|||||||||||||
| Gross profit (loss) |
66,773 | (34,831 | ) | 4,155 | (1,155 | ) | 65 | 251 | ||||||||||||||||
| Operating expenses: |
||||||||||||||||||||||||
| Sales and marketing |
133,052 | 70,695 | 21,357 | 8,403 | 17,187 | 2,589 | ||||||||||||||||||
| Research and development |
66,645 | 37,771 | 14,621 | 6,768 | 12,070 | 6,881 | ||||||||||||||||||
| General and administrative |
46,669 | 26,231 | 14,368 | 3,487 | 7,598 | 2,384 | ||||||||||||||||||
| Contribution of acquired technology to the Apache Software Foundation |
— | 3,971 | — | — | — | — | ||||||||||||||||||
|
|
|
|
|
|
|
|
|
|
|
|
|
|||||||||||||
| Total operating expenses |
246,366 | 138,668 | 50,346 | 18,658 | 36,855 | 11,854 | ||||||||||||||||||
|
|
|
|
|
|
|
|
|
|
|
|
|
|||||||||||||
| Loss from operations |
(179,593 | ) | (173,499 | ) | (46,191 | ) | (19,813 | ) | (36,790 | ) | (11,603 | ) | ||||||||||||
| Other income (expense), net |
908 | (4,977 | ) | 23 | 110 | 163 | 83 | |||||||||||||||||
|
|
|
|
|
|
|
|
|
|
|
|
|
|||||||||||||
| Loss before income tax |
(178,685 | ) | (178,476 | ) | (46,168 | ) | (19,703 | ) | (36,627 | ) | (11,520 | ) | ||||||||||||
| Income tax expense (benefit) |
432 | (1,111 | ) | 45 | 8 | 11 | 1 | |||||||||||||||||
|
|
|
|
|
|
|
|
|
|
|
|
|
|||||||||||||
| Net loss |
$ | (179,117 | ) | $ | (177,365 | ) | $ | (46,213 | ) | $ | (19,711 | ) | $ | (36,638 | ) | $ | (11,521 | ) | ||||||
|
|
|
|
|
|
|
|
|
|
|
|
|
|||||||||||||
49
Table of Contents
Comparison of the Years Ended December 31, 2015 and 2014 and Eight Months Ended December 31, 2013
Revenue
| Years Ended December 31, |
Eight Months Ended December 31, |
2015-2014 | 2015-2014 | 2014-2013 | 2014-2013 | Four Months(*) |
||||||||||||||||||||||||||
| 2015 | 2014 | 2013 | $ Change | % Change | $ Change | % Change | 2014 | |||||||||||||||||||||||||
| (in thousands) | (in thousands) |
(in thousands) |
||||||||||||||||||||||||||||||
| Gross support subscription and professional services revenue: |
||||||||||||||||||||||||||||||||
| Support subscription |
$ | 77,793 | $ | 31,519 | $ | 11,782 | $ | 46,274 | 147 | % | $ | 19,737 | 168 | % | $ | 10,506 | ||||||||||||||||
| Professional services |
44,216 | 20,616 | 6,465 | 23,600 | 114 | 14,151 | 219 | 6,872 | ||||||||||||||||||||||||
|
|
|
|
|
|
|
|
|
|
|
|||||||||||||||||||||||
| Total gross support subscription and professional services revenue |
122,009 | 52,135 | 18,247 | 69,874 | 134 | 33,888 | 186 | |||||||||||||||||||||||||
|
|
|
|
|
|
|
|
|
|
|
|||||||||||||||||||||||
| Contra-support subscription and professional services revenue: |
||||||||||||||||||||||||||||||||
| Support subscription |
(65 | ) | (5,961 | ) | (367 | ) | 5,896 | 99 | (5,594 | ) | (1524 | ) | ||||||||||||||||||||
| Professional services |
— | (126 | ) | (15 | ) | 126 | 100 | (111 | ) | (740 | ) | |||||||||||||||||||||
|
|
|
|
|
|
|
|
|
|
|
|||||||||||||||||||||||
| Total contra-support subscription and professional services revenue |
(65 | ) | (6,087 | ) | (382 | ) | 6,022 | 99 | (5,705 | ) | (1493 | ) | ||||||||||||||||||||
|
|
|
|
|
|
|
|
|
|
|
|||||||||||||||||||||||
| Support subscription and professional services revenue: |
||||||||||||||||||||||||||||||||
| Support subscription |
77,728 | 25,558 | 11,415 | 52,170 | 204 | 14,143 | 124 | |||||||||||||||||||||||||
| Professional services |
44,216 | 20,490 | 6,450 | 23,726 | 116 | 14,040 | 218 | |||||||||||||||||||||||||
|
|
|
|
|
|
|
|
|
|
|
|||||||||||||||||||||||
| Total support subscription and professional services revenue |
$ | 121,944 | $ | 46,048 | $ | 17,865 | $ | 75,896 | 165 | $ | 28,183 | 158 | ||||||||||||||||||||
|
|
|
|
|
|
|
|
|
|
|
|||||||||||||||||||||||
| (*) | The gross support subscription and professional services revenue attributable to the four-month period difference was calculated by dividing the gross support subscription and professional services revenue amounts for the year ended December 31, 2014 by twelve to derive the respective monthly revenue amounts and multiplying the resulting monthly amounts by four. |
Support subscription revenue for the year ended December 31, 2015 increased $52.2 million or 204 percent, compared to the same period in 2014. The increase was primarily due to the significant growth in our support subscription customer base as well as sales of additional support subscriptions to our existing customers. Additionally, the year ended December 31, 2014 included contra-support subscription revenue of $4.0 million and $2.0 million for the impact of the 2011 Yahoo! Warrant and the issuance of equity to an affiliate of AT&T, respectively.
Support subscription revenue for the year ended December 31, 2014 increased by $14.1 million or 124 percent, compared to the eight months ended December 31, 2013. This increase includes a $5.6 million net contra-support subscription revenue adjustment period over period, related to the 2011 Yahoo! Warrant of $4.0 million and the issuance of equity to an affiliate of AT&T of $2.0 million for the year ended December 31, 2014. This was offset by the contra-support subscription revenue impact of the issuance of equity to an affiliate of AT&T of $0.4 million for the eight months ended December 31, 2013. Excluding the $5.6 million net contra-support subscription revenue impact of the 2011 Yahoo! Warrant and equity issued to an affiliate of AT&T, gross support subscription revenue increased by $19.7 million for the year ended December 31, 2014 compared to the eight months ended December 31, 2013. Of the $19.7 million increase, approximately $10.5 million is attributable to the extra four months of support subscription revenue during the year ended December 31, 2014
50
Table of Contents
compared to the eight months ended December 31, 2013. The remaining increase of $9.2 million is due to the significant growth in our support subscription customer base as well as sales of additional support subscriptions to our existing customers.
Professional services revenue increased $23.7 million or 116 percent, for the year ended December 31, 2015 compared to the same period in 2014. The increase was primarily due to the significant growth in our support subscription customer base and associated sales of additional professional services to our existing customers.
Professional services revenue increased $14.0 million or 218 percent, for the year ended December 31, 2014 compared to the eight months ended December 31, 2013. Excluding the $0.1 million net contra-professional services revenue impact of the 2011 Yahoo! Warrant and equity issued to an affiliate of AT&T, gross professional services revenue increased by $14.2 million for the year ended December 31, 2014 compared to the eight months ended December 31, 2013. Of the $14.2 million increase, approximately $6.9 million is attributable to the extra four months of professional services revenue during the year ended December 31, 2014 compared to the eight months ended December 31, 2013. The remaining increase of $7.3 million is due to the significant growth in our support subscription customer base and sales of additional professional services to our existing customers. While the percentage of total revenue from professional services for the year ended December 31, 2014 on a GAAP basis was approximately 44 percent of total revenue, the percentage of total revenue from professional services before contra-revenue adjustments for the same period was approximately 39 percent, which is more in line with prior periods. See “Selected Financial Data” for further discussion of such contra-revenue adjustments.
Cost of Revenue
| Years Ended December 31, |
Eight Months Ended December 31, |
2015-2014 | 2015-2014 | 2014-2013 | 2014-2013 | Four Months(*) |
||||||||||||||||||||||||||
| 2015 | 2014 | 2013 | $ Change | % Change | $ Change | % Change | 2014 | |||||||||||||||||||||||||
| (in thousands) | (in thousands) |
(in thousands) |
||||||||||||||||||||||||||||||
| Gross cost of revenue: |
||||||||||||||||||||||||||||||||
| Cost of support subscription |
$ | 13,705 | $ | 5,289 | $ | 3,720 | $ | 8,416 | 159 | % | $ | 1,569 | 42 | % | $ | 1,763 | ||||||||||||||||
| Cost of professional services |
41,466 | 27,637 | 9,990 | 13,829 | 50 | 17,647 | 177 | 9,212 | ||||||||||||||||||||||||
|
|
|
|
|
|
|
|
|
|
|
|||||||||||||||||||||||
| Total gross cost of revenue |
55,171 | 32,926 | 13,710 | 22,245 | 68 | 19,216 | 140 | |||||||||||||||||||||||||
| Cost of revenue adjustment for 2011 Yahoo! Warrant: |
||||||||||||||||||||||||||||||||
| Cost of support subscription |
— | 47,398 | — | (47,398 | ) | (100 | ) | 47,398 | 100 | |||||||||||||||||||||||
| Cost of professional services |
— | 555 | — | (555 | ) | (100 | ) | 555 | 100 | |||||||||||||||||||||||
|
|
|
|
|
|
|
|
|
|
|
|||||||||||||||||||||||
| Total cost of revenue adjustment for 2011 Yahoo! Warrant |
— | 47,953 | — | (47,953 | ) | (100 | ) | 47,953 | 100 | |||||||||||||||||||||||
| Cost of revenue: |
||||||||||||||||||||||||||||||||
| Cost of support subscription |
13,705 | 52,687 | 3,720 | (38,982 | ) | (74 | ) | 48,967 | 1316 | |||||||||||||||||||||||
| Cost of professional services |
41,466 | 28,192 | 9,990 | 13,274 | 47 | 18,202 | 182 | |||||||||||||||||||||||||
|
|
|
|
|
|
|
|
|
|
|
|||||||||||||||||||||||
| Total cost of revenue |
$ | 55,171 | $ | 80,879 | $ | 13,710 | $ | (25,708 | ) | (32 | ) | $ | 67,169 | 490 | ||||||||||||||||||
|
|
|
|
|
|
|
|
|
|
|
|||||||||||||||||||||||
| (*) | The gross cost of support subscription and professional services revenue attributable to the four-month period difference was calculated by dividing the gross cost of support subscription and professional services revenue amounts for the year ended December 31, 2014 by twelve to derive the respective monthly cost of revenue amounts and multiplying the resulting monthly amounts by four. |
51
Table of Contents
Cost of support subscription revenue decreased $39.0 million for the year ended December 31, 2015 compared to the same period in 2014. The decrease was primarily attributable to the $47.4 million expense related to the vesting of the 2011 Yahoo! Warrant upon our IPO in December 2014, for which there was no similar expense in 2015. Excluding the impact of the $47.4 million expense related to the vesting of the 2011 Yahoo! Warrant, cost of support subscription revenue increased by approximately $8.4 million. This increase was attributed to a $6.5 million increase in employee-related expenses, which includes $0.8 million in stock-based compensation expense, as a result of an increase in headcount to support new customer growth, as well as an increase in equipment and software, travel and rent expense of $1.1 million.
Cost of support subscription revenue increased $49.0 million for the year ended December 31, 2014 compared to the eight months ended December 31, 2013. This increase includes a $47.4 million expense related to the vesting of the 2011 Yahoo! Warrant upon our IPO in December 2014. This was offset by a $2.5 million decrease in the cost of support subscription revenue allocation for the eight months ended December 31, 2013 related to joint engineering efforts with Microsoft to develop HDP for Windows, resulting in a net $44.9 million increase. The remaining $4.1 million increase was partially attributable to the extra four months of cost of support subscription revenue of approximately $1.8 million during the year ended December 31, 2014 as compared to the eight months ended December 31, 2013, after excluding the impact of the $47.4 million charge related to the vesting of the 2011 Yahoo! Warrant. The remaining increase of $2.3 million was primarily due to a $1.8 million increase in employee-related expenses related to our increased headcount.
Cost of professional services revenue increased $13.3 million for the year ended December 31, 2015 compared to the same period in 2014. The increase was primarily attributable to a $11.4 million increase in employee-related expenses, which includes $1.3 million in stock-based compensation expense, as a result of an increase in headcount, as well as an increase in travel expenses of $1.3 million.
Cost of professional services revenue increased $18.2 million for the year ended December 31, 2014 compared to the eight months ended December 31, 2013. This increase includes a $0.6 million expense related to the vesting of the 2011 Yahoo! Warrant upon our IPO in December 2014. Of the increase, approximately $9.2 million was attributable to the extra four months of cost of professional services revenue during the year ended December 31, 2014 as compared to the eight months ended December 31, 2013. The remaining increase of $8.4 million was primarily due to increased contract labor costs of $3.8 million and increased employee-related expenses of $3.3 million related to our increased headcount. In addition, travel costs, rent expense and equipment costs increased by $1.2 million.
Sales and Marketing
| Years Ended December 31, |
Eight Months Ended December 31, |
2015-2014 | 2015-2014 | 2014-2013 | 2014-2013 | Four Months(*) |
||||||||||||||||||||||||||
| 2015 | 2014 | 2013 | $ Change | % Change | $ Change | % Change | 2014 | |||||||||||||||||||||||||
| (in thousands) | (in thousands) |
(in thousands) |
||||||||||||||||||||||||||||||
| Sales and marketing |
$ | 133,052 | $ | 70,695 | $ | 21,357 | $ | 62,357 | 88 | % | $ | 49,338 | 231 | % | $ | 23,565 | ||||||||||||||||
|
|
|
|
|
|
|
|
|
|
|
|
|
|
|
|
|
|||||||||||||||||
| (*) | The sales and marketing expenses attributable to the four-month period difference was calculated by dividing the sales and marketing expenses for the year ended December 31, 2014 by twelve to derive the monthly sales and marketing expense amount and multiplying the resulting monthly amount by four. |
Sales and marketing expenses increased $62.4 million for the year ended December 31, 2015 compared to the same period in 2014. The increase was primarily attributable to an increase in employee-related expenses of $47.8 million, which includes $9.8 million in stock-based compensation expense, as a result of an increase in headcount. In addition, expenses related to marketing events increased $3.9 million, travel expenses increased $5.0 million due to increased headcount to support the growth in our business and equipment and software expenses increased by $2.0 million.
52
Table of Contents
Sales and marketing expenses increased $49.3 million in the year ended December 31, 2014 compared to the eight months ended December 31, 2013. Approximately $23.6 million of the increase is attributable to the extra four months of sales and marketing expenses during the year ended December 31, 2014 as compared to the eight months ended December 31, 2013. The remaining increase of $25.8 million was primarily due to an increase in employee-related expenses of $19.4 million, which includes $0.9 million in stock-based compensation expense, related to our increased headcount and an increase in marketing expenses of $2.6 million. In addition, travel, rent and equipment expenses increased by $3.0 million in order to support our growth.
Research and Development
| Years Ended December 31, |
Eight Months Ended December 31, |
2015-2014 | 2015-2014 | 2014-2013 | 2014-2013 | Four Months(*) |
||||||||||||||||||||||||||
| 2015 | 2014 | 2013 | $ Change | % Change | $ Change | % Change | 2014 | |||||||||||||||||||||||||
| (in thousands) | (in thousands) |
(in thousands) |
||||||||||||||||||||||||||||||
| Research and development |
$ | 66,645 | $ | 37,771 | $ | 14,621 | $ | 28,874 | 76 | % | $ | 23,150 | 158 | % | $ | 12,590 | ||||||||||||||||
|
|
|
|
|
|
|
|
|
|
|
|
|
|
|
|
|
|||||||||||||||||
| (*) | The research and development expenses attributable to the four-month period difference was calculated by dividing the research and development expenses for the year ended December 31, 2014 by twelve to derive the monthly research and development expense amount and multiplying the resulting monthly amount by four. |
Research and development expenses increased $28.9 million for the year ended December 31, 2015 compared to the same period in 2014. The increase was primarily attributable to an increase in employee-related expenses of $24.9 million, which includes $12.9 million in stock-based compensation expense, due to an increase in headcount, as well as an increase in equipment and software expenses of $1.2 million.
Research and development expenses increased $23.2 million for the year ended December 31, 2014 compared to the eight months ended December 31, 2013. Of the increase, $2.5 million was due to the 2013 allocation to cost of sales of expenses incurred under the Microsoft agreement to build a Hadoop solution for Windows which today is known as HDInsight. The remaining $20.7 million increase was partially attributable to the extra four months of research and development expenses of approximately $12.6 million during the year ended December 31, 2014 as compared to the eight months ended December 31, 2013. The remaining increase of $8.0 million was primarily due to employee-related expenses of $6.8 million, which includes $1.0 million in stock-based compensation expense, related to our increased headcount and increases in equipment, rent and travel expenses of $0.9 million.
General and Administrative
| Years Ended December 31, |
Eight Months Ended December 31, |
2015-2014 | 2015-2014 | 2014-2013 | 2014-2013 | Four Months(*) |
||||||||||||||||||||||||||
| 2015 | 2014 | 2013 | $ Change | % Change | $ Change | % Change | 2014 | |||||||||||||||||||||||||
| (in thousands) | (in thousands) |
(in thousands) |
||||||||||||||||||||||||||||||
| General and administrative |
$ | 46,669 | $ | 26,231 | $ | 14,368 | $ | 20,438 | 78 | % | $ | 11,863 | 83 | % | $ | 8,744 | ||||||||||||||||
|
|
|
|
|
|
|
|
|
|
|
|
|
|
|
|
|
|||||||||||||||||
| (*) | The general and administrative expenses attributable to the four-month period difference was calculated by dividing the general and administrative expenses for the year ended December 31, 2014 by twelve to derive the monthly general and administrative expense amount and multiplying the resulting monthly amount by four. |
53
Table of Contents
General and administrative expenses increased $20.4 million for the year ended December 31, 2015 compared to the same period in 2014. The increase was primarily attributable to an increase in employee-related expenses of $15.0 million, which includes $7.0 million in stock-based compensation expense, due to an increase in headcount, as well as an increase in outside services expense of $2.5 million due to the acquisitions of SequenceIQ and Onyara and equipment and software expenses of $1.8 million.
General and administrative expenses increased $11.9 million in the year ended December 31, 2014 compared to the eight months ended December 31, 2013. Approximately $8.7 million of the increase is attributable to the extra four months of general and administrative during the year ended December 31, 2014 as compared to the eight months ended December 31, 2013. The remaining increase was primarily due to an increase in employee-related expenses of $8.0 million, which includes $2.5 million in stock-based compensation expense, due to our increased headcount and increases in travel, rent and equipment expenses of $1.0 million. This increase was partially offset by a legal settlement of $6.0 million, which was recorded during the eight months ended December 31, 2013.
Contribution of Acquired Technology to the Apache Software Foundation
| Years Ended December 31, |
Eight Months Ended December 31, |
2015-2014 | 2015-2014 | 2014-2013 | 2014-2013 | |||||||||||||||||||||||
| 2015 | 2014 | 2013 | $ Change | % Change | $ Change | % Change | ||||||||||||||||||||||
| (in thousands) | (in thousands) |
|||||||||||||||||||||||||||
| Contribution of acquired technology to the Apache Software Foundation |
$ | — | $ | 3,971 | $ | — | $ | (3,971 | ) | (100 | )% | $ | 3,971 | 100 | % | |||||||||||||
|
|
|
|
|
|
|
|
|
|
|
|
|
|
|
|||||||||||||||
Operating expenses for the contribution of acquired technology to the Apache Software Foundation were nil in the year ended December 31, 2015 compared to $4.0 million for the year ended December 31, 2014. On August 13, 2014, we contributed the developed technology acquired in the XA Secure acquisition to the Apache Software Foundation. As a result, we recognized a $4.0 million expense upon contribution, for which there was no similar expense in 2015.
Operating expenses for the contribution of acquired technology to the Apache Software Foundation were $4.0 million for the year ended December 31, 2014 compared to nil for the eight months ended December 31, 2013. On August 13, 2014, we contributed the developed technology acquired in the XA Secure acquisition to the Apache Software Foundation. As a result, we recognized a $4.0 million expense upon contribution, which was equal to the carrying value of the developed technology.
Comparison of the Eight Months Ended December 31, 2013 and 2012
Revenue
| Eight Months Ended December 31, |
||||||||||||||||
| 2013 | 2012 | $ Change | % Change | |||||||||||||
| (in thousands) | ||||||||||||||||
| Support subscription revenue |
$ | 11,415 | $ | 3,643 | $ | 7,772 | 213 | % | ||||||||
| Professional services revenue |
6,450 | 1,135 | 5,315 | 468 | ||||||||||||
|
|
|
|
|
|
|
|||||||||||
| Total support subscription and professional services revenue |
$ | 17,865 | $ | 4,778 | $ | 13,087 | 274 | |||||||||
|
|
|
|
|
|
|
|||||||||||
54
Table of Contents
Support subscription revenue increased $7.8 million in the eight months ended December 31, 2013 compared to the same period in 2012. The increase was primarily due to an increase in revenue of $3.8 million from the July 2012 Microsoft contract, under which we began recognizing revenue on a ratable basis in October 2012, and $1.1 million of net revenue ($1.5 million of gross revenue offset by $0.4 million of contra-revenue for the shares issued to an affiliate of AT&T, as described above) related to the AT&T contract, under which we began recognizing revenue on a ratable basis in October 2013. The remaining increase was due to the growth of our customer base as well as sales of additional subscriptions to our existing customers.
Professional services revenue increased $5.3 million in the eight months ended December 31, 2013 compared to the same period in 2012. The increase was primarily due to the growth of our customer base as well as sales of additional services to our existing customers.
Cost of Revenue
| Eight Months Ended December 31, |
||||||||||||||||
| 2013 | 2012 | $ Change | % Change | |||||||||||||
| (in thousands) | ||||||||||||||||
| Cost of support subscription revenue |
$ | 3,720 | $ | 2,880 | $ | 840 | 29 | % | ||||||||
| Cost of professional services revenue |
9,990 | 3,053 | 6,937 | 227 | ||||||||||||
|
|
|
|
|
|
|
|||||||||||
| Total cost of revenue |
$ | 13,710 | $ | 5,933 | $ | 7,777 | 131 | |||||||||
|
|
|
|
|
|
|
|||||||||||
Cost of support subscription revenue increased $0.8 million in the eight months ended December 31, 2013 compared to the same period in 2012. The increase was due to increased headcount to support the growth of our customer base as well an increase of $0.3 million in costs for the development of the HDInsight with and for Microsoft.
Cost of professional services revenue increased $6.9 million in the eight months ended December 31, 2013 compared to the same period in 2012. The increase was primarily due to a $4.2 million increase in employee-related expenses due to our increased headcount. In addition, subcontractor costs increased by $1.6 million and travel costs increased by $0.9 million to support the increase in professional services revenue.
Sales and Marketing
| Eight Months Ended December 31, |
||||||||||||||||
| 2013 | 2012 | $ Change | % Change | |||||||||||||
| (in thousands) | ||||||||||||||||
| Sales and marketing |
$ | 21,357 | $ | 8,403 | $ | 12,954 | 154 | % | ||||||||
|
|
|
|
|
|
|
|||||||||||
Sales and marketing expenses increased $13.0 million in the eight months ended December 31, 2013 compared to the same period in 2012. The increase was primarily due to a $9.8 million increase in employee-related expenses due to our increased headcount. In addition, travel costs increased by $1.3 million due to the increase in headcount and costs related to marketing events increased by $1.1 million.
Research and Development
| Eight Months Ended December 31, |
||||||||||||||||
| 2013 | 2012 | $ Change | % Change | |||||||||||||
| (in thousands) | ||||||||||||||||
| Research and development |
$ | 14,621 | $ | 6,768 | $ | 7,853 | 116 | % | ||||||||
|
|
|
|
|
|
|
|
|
|||||||||
55
Table of Contents
Research and development expenses increased $7.9 million in the eight months ended December 31, 2013 compared to the same period in 2012. The increase was primarily due to a $5.9 million increase in employee-related expenses due to our increased headcount. In addition, subcontractor costs increased by $1.1 million and equipment costs increased by $0.8 million.
General and Administrative
| Eight Months Ended December 31, |
||||||||||||||||
| 2013 | 2012 | $ Change | % Change | |||||||||||||
| (in thousands) | ||||||||||||||||
| General and administrative |
$ | 14,368 | $ | 3,487 | $ | 10,881 | 312 | % | ||||||||
|
|
|
|
|
|
|
|
|
|||||||||
General and administrative expenses increased $10.9 million in the eight months ended December 31, 2013 compared to the same period in 2012. The increase was primarily due to a $6.0 million legal settlement and a $1.6 million increase in employee-related expenses due to our increased headcount. In addition, legal fees increased by $1.7 million primarily related to our legal proceedings and third-party consultant costs increased by $1.0 million as we continued to build out our general and administrative infrastructure.
Comparison of the Years Ended April 30, 2013 and 2012
Revenue
| Years Ended April 30, | ||||||||||||||||
| 2013 | 2012 | $ Change | % Change | |||||||||||||
| (in thousands) | ||||||||||||||||
| Support subscription revenue |
$ | 7,739 | $ | 1,276 | $ | 6,463 | 507 | % | ||||||||
| Professional services revenue |
3,259 | 370 | 2,889 | 781 | ||||||||||||
|
|
|
|
|
|
|
|||||||||||
| Total support subscription and professional services revenue |
$ | 10,998 | $ | 1,646 | $ | 9,352 | 568 | |||||||||
|
|
|
|
|
|
|
|||||||||||
Support subscription revenue increased $6.5 million in the year ended April 30, 2013 compared to the corresponding period in the prior year. The increase was primarily due to an increase in revenue of $7.1 million from Microsoft as we began recognizing revenue under the July 2012 Microsoft contract on a ratable basis in October 2012 and the growth of our customer base.
Professional services revenue increased $2.9 million in the year ended April 30, 2013 compared to the corresponding period in the prior year as we provided increased professional services following the general availability of the HDInsight in late 2012 as well as the growth of our customer base.
Cost of Revenue
| Years Ended April 30, | ||||||||||||||||
| 2013 | 2012 | $ Change | % Change | |||||||||||||
| (in thousands) | ||||||||||||||||
| Cost of support subscription revenue |
$ | 5,071 | $ | 421 | $ | 4,650 | 1105 | % | ||||||||
| Cost of professional services revenue |
5,862 | 974 | 4,888 | 502 | ||||||||||||
|
|
|
|
|
|
|
|||||||||||
| Total cost of revenue |
$ | 10,933 | $ | 1,395 | $ | 9,538 | 684 | |||||||||
|
|
|
|
|
|
|
|||||||||||
56
Table of Contents
Cost of support subscription revenue increased $4.7 million in the year ended April 30, 2013 compared to the corresponding period in the prior year. The increase was due to an additional $3.9 million in costs for the development of the HDInsight with and for Microsoft as well as a $0.8 million increase due to employee headcount growth.
Cost of professional services revenue increased $4.9 million in the year ended April 30, 2013 compared to the corresponding period in the prior year. The increase was primarily due to a $3.6 million increase in employee- related expenses due to our increased headcount and an increase in travel costs of $0.6 million.
Sales and Marketing
| Years Ended April 30, | ||||||||||||||||
| 2013 | 2012 | $ Change | % Change | |||||||||||||
| (in thousands) | ||||||||||||||||
| Sales and marketing |
$ | 17,187 | $ | 2,589 | $ | 14,598 | 564 | % | ||||||||
|
|
|
|
|
|
|
|
|
|||||||||
Sales and marketing expenses increased $14.6 million in the year ended April 30, 2013 compared to the corresponding period in the prior year. The increase was primarily due to a $10.6 million increase in employee-related expenses due to our increased sales and marketing headcount. In addition, travel costs increased by $1.2 million, tradeshow costs increased by $0.8 million, advertising and promotion costs increased by $0.6 million, subscription software and web hosting costs increased by $0.4 million due to our increased marketing efforts and headcount growth.
Research and Development
| Years Ended April 30, | ||||||||||||||||
| 2013 | 2012 | $ Change | % Change | |||||||||||||
| (in thousands) | ||||||||||||||||
| Research and development |
$ | 12,070 | $ | 6,881 | $ | 5,189 | 75 | % | ||||||||
|
|
|
|
|
|
|
|
|
|||||||||
Research and development expenses increased $5.2 million in the year ended April 30, 2013 compared to the corresponding period in the prior year. The increase was primarily due to a $6.9 million increase in employee-related expenses due to our increased headcount and a $0.6 million increase in subcontractor costs. Additionally, there were increases in equipment, travel and rent expenses of $1.3 million. These increases were offset by a $3.9 million increase in allocation from research and development costs to cost of support subscription revenue related to employees who were supporting the joint engineering efforts with Microsoft to develop the HDInsight.
General and Administrative
| Years Ended April 30, | ||||||||||||||||
| 2013 | 2012 | $ Change | % Change | |||||||||||||
| (in thousands) | ||||||||||||||||
| General and administrative |
$ | 7,598 | $ | 2,384 | $ | 5,214 | 219 | % | ||||||||
|
|
|
|
|
|
|
|
|
|||||||||
General and administrative expenses increased $5.2 million in the year ended April 30, 2013 compared to the corresponding period in the prior year. The increase resulted from an increase in employee related expenses of $1.9 million, legal fees of $2.1 million primarily related to our legal proceedings and third-party consultant costs of $0.6 million.
57
Table of Contents
Quarterly Operating Results
The following unaudited quarterly statements of operations data for each of the eight quarters in the period ended December 31, 2015 have been prepared on a basis consistent with our annual audited consolidated financial statements and include, in our opinion, all normal recurring adjustments necessary for the fair statement of the financial information contained in those statements. Our historical results are not necessarily indicative of the results that may be expected in the future and the results in the periods presented are not necessarily indicative of results to be expected for any other period. The following quarterly financial data should be read in conjunction with our audited consolidated financial statements and the related notes included elsewhere in this annual report.
| Three Months Ended, | ||||||||||||||||||||||||||||||||
| Dec. 31, 2015 |
Sep. 30, 2015 |
Jun. 30, 2015 |
Mar. 31, 2015 |
Dec. 31, 2014 |
Sep. 30, 2014 |
Jun. 30, 2014 |
Mar. 31, 2014 |
|||||||||||||||||||||||||
| (In thousands) | ||||||||||||||||||||||||||||||||
| Support subscription and professional services revenue: |
||||||||||||||||||||||||||||||||
| Support subscription (includes contra-revenue of $65 for the three months ended September 30, 2015, $4,000 for the three months ended December 31, 2014 and $1,961 for the three months ended March 31, 2014)(*) |
$ | 25,555 | $ | 20,947 | $ | 18,082 | $ | 13,144 | $ | 6,368 | $ | 8,136 | $ | 6,765 | $ | 4,289 | ||||||||||||||||
| Professional services (includes contra-revenue of $47 for the three months ended December 31, 2014 and $79 for the three months ended March 31, 2014) |
11,866 | 11,303 | 11,874 | 9,173 | 6,292 | 4,628 | 5,322 | 4,248 | ||||||||||||||||||||||||
|
|
|
|
|
|
|
|
|
|
|
|
|
|
|
|
|
|||||||||||||||||
| Total support subscription and professional services revenue |
37,421 | 32,250 | 29,956 | 22,317 | 12,660 | 12,764 | 12,087 | 8,537 | ||||||||||||||||||||||||
| Cost of revenue: |
||||||||||||||||||||||||||||||||
| Support subscription |
4,491 | 3,629 | 3,036 | 2,549 | 49,812 | 1,511 | 775 | 589 | ||||||||||||||||||||||||
| Professional services |
11,206 | 11,171 | 10,178 | 8,911 | 9,067 | 8,024 | 5,790 | 5,311 | ||||||||||||||||||||||||
|
|
|
|
|
|
|
|
|
|
|
|
|
|
|
|
|
|||||||||||||||||
| Total cost of revenue |
15,697 | 14,800 | 13,214 | 11,460 | 58,879 | 9,535 | 6,565 | 5,900 | ||||||||||||||||||||||||
|
|
|
|
|
|
|
|
|
|
|
|
|
|
|
|
|
|||||||||||||||||
| Gross profit (loss) |
21,724 | 17,450 | 16,742 | 10,857 | (46,219 | ) | 3,229 | 5,522 | 2,637 | |||||||||||||||||||||||
| Operating expenses: |
||||||||||||||||||||||||||||||||
| Sales and marketing |
37,969 | 34,017 | 33,309 | 27,757 | 26,142 | 19,491 | 14,869 | 10,193 | ||||||||||||||||||||||||
| Research and development |
20,407 | 16,382 | 14,876 | 14,980 | 11,501 | 10,111 | 8,366 | 7,793 | ||||||||||||||||||||||||
| General and administrative |
13,901 | 12,297 | 11,419 | 9,052 | 8,597 | 7,025 | 5,676 | 4,933 | ||||||||||||||||||||||||
| Contribution of acquired technology to the Apache Software Foundation |
— | — | — | — | — | 3,971 | — | — | ||||||||||||||||||||||||
|
|
|
|
|
|
|
|
|
|
|
|
|
|
|
|
|
|||||||||||||||||
| Total operating expenses |
72,277 | 62,696 | 59,604 | 51,789 | 46,240 | 40,598 | 28,911 | 22,919 | ||||||||||||||||||||||||
|
|
|
|
|
|
|
|
|
|
|
|
|
|
|
|
|
|||||||||||||||||
| Loss from operations |
(50,553 | ) | (45,246 | ) | (42,862 | ) | (40,932 | ) | (92,459 | ) | (37,369 | ) | (23,389 | ) | (20,282 | ) | ||||||||||||||||
| Other income (expense) |
422 | 88 | (28 | ) | 426 | 1,911 | (2,099 | ) | (4,819 | ) | 30 | |||||||||||||||||||||
|
|
|
|
|
|
|
|
|
|
|
|
|
|
|
|
|
|||||||||||||||||
| Loss before income tax |
(50,131 | ) | (45,158 | ) | (42,890 | ) | (40,506 | ) | (90,548 | ) | (39,468 | ) | (28,208 | ) | (20,252 | ) | ||||||||||||||||
| Income tax expense (benefit) |
103 | 135 | 110 | 84 | 85 | 34 | (1,251 | ) | 21 | |||||||||||||||||||||||
|
|
|
|
|
|
|
|
|
|
|
|
|
|
|
|
|
|||||||||||||||||
| Net loss |
$ | (50,234 | ) | $ | (45,293 | ) | $ | (43,000 | ) | $ | (40,590 | ) | $ | (90,633 | ) | $ | (39,502 | ) | $ | (26,957 | ) | $ | (20,273 | ) | ||||||||
|
|
|
|
|
|
|
|
|
|
|
|
|
|
|
|
|
|||||||||||||||||
| Other financial and operational metrics: |
||||||||||||||||||||||||||||||||
| Net loss per share of common stock, basic and diluted |
$ | (1.11 | ) | $ | (1.03 | ) | $ | (1.01 | ) | $ | (0.98 | ) | $ | (5.38 | ) | $ | (8.98 | ) | $ | (6.47 | ) | $ | (5.25 | ) | ||||||||
|
|
|
|
|
|
|
|
|
|
|
|
|
|
|
|
|
|||||||||||||||||
| Gross billings |
$ | 52,129 | $ | 43,788 | $ | 41,847 | $ | 28,101 | $ | 31,910 | $ | 21,501 | $ | 19,579 | $ | 14,140 | ||||||||||||||||
|
|
|
|
|
|
|
|
|
|
|
|
|
|
|
|
|
|||||||||||||||||
58
Table of Contents
| (*) | During the fourth quarter of the year ended December 31, 2015, we recorded an immaterial adjustment related to the recognition of revenue and deferred revenue in the prior quarters of 2015. See reconciliation of prior periods for adjustments related to the recognition of revenue: |
| Three Months Ended, | ||||||||||||
| Sep. 30, 2015 |
Jun. 30, 2015 |
Mar. 31, 2015 |
||||||||||
| (in thousands) | ||||||||||||
| Previously filed support subscription and professional services revenue: |
||||||||||||
| Support subscription |
$ | 21,748 | $ | 18,811 | $ | 13,575 | ||||||
| Professional services |
11,303 | 11,874 | 9,198 | |||||||||
|
|
|
|
|
|
|
|||||||
| Total previously filed support subscription and professional services revenue |
33,051 | 30,685 | 22,773 | |||||||||
|
|
|
|
|
|
|
|||||||
| Adjustments to subscription and professional services revenue: |
||||||||||||
| Support subscription |
(801 | ) | (729 | ) | (431 | ) | ||||||
| Professional services |
— | — | (25 | ) | ||||||||
|
|
|
|
|
|
|
|||||||
| Total adjustments to subscription and professional services revenue |
(801 | ) | (729 | ) | (456 | ) | ||||||
|
|
|
|
|
|
|
|||||||
| Adjusted support subscription and professional services revenue: |
||||||||||||
| Support subscription |
20,947 | 18,082 | 13,144 | |||||||||
| Professional services |
11,303 | 11,874 | 9,173 | |||||||||
|
|
|
|
|
|
|
|||||||
| Total adjusted support subscription and professional services revenue |
$ | 32,250 | $ | 29,956 | $ | 22,317 | ||||||
|
|
|
|
|
|
|
|||||||
Quarterly Trends in Revenue
Our quarterly revenue increased sequentially for seven of the eight quarters presented, primarily due to the increase in support subscription customers each quarter as well as additional sales of support subscription and professional services to our existing customers. Revenue for the quarter ended December 31, 2014 decreased sequentially due to contra revenue of $4.0 million related to the vesting of the 2011 Yahoo! Warrant upon our IPO in December 2014. Excluding the impact of the 2011 Yahoo! Warrant, revenue for the quarter ended December 31, 2014 would have increased by $3.9 million compared to the prior quarters. In fiscal 2015, support subscription revenue from Microsoft comprised of $2.5 million in each quarter for the three months ended December 31, 2015, June 30, 2015 and March 31, 2015 and $1.9 million for the three months ended September 30, 2015. In fiscal 2014, support subscription revenue from Microsoft comprised of $2.5 million in each quarter for the three months ended December 31, 2014, September 30, 2014, June 30, 2014 and March 31, 2014.
Quarterly Operating Expenses Trends
Operating expenses are primarily driven by headcount and headcount-related expenses, including stock-based compensation expense and sales and marketing initiatives. Our quarterly operating expenses generally increased sequentially for the eight quarters presented, primarily due to increase in headcount to support our growth. The three months ended September 30, 2014 included a $4.0 million expense for the contribution of the developed technology from the XA Secure acquisition to the Apache Software Foundation. Refer to Note 4 in the notes to our consolidated financial statements for further discussion regarding the expense from the XA Secure acquisition.
Quarterly Gross Billings
We have included gross billings, a non-GAAP financial measure, in this annual report because it is a key measure used by our Board of Directors and management to monitor our near term cash flows and manage our
59
Table of Contents
business. Gross billings is calculated as our total non-GAAP revenue plus the change in deferred revenue for the same period. We primarily employ a subscription based business model for support services and in most instances customers purchase both a support subscription and professional services engagements at the same time. Since we have not yet established vendor-specific objective evidence of fair value for our support subscriptions, we recognize most of our revenue ratably over the period beginning when both the support subscription and professional services have commenced. The accounting treatment for our agreements coupled with the lack of VSOE causes our revenue to be delayed and creates significant deferred revenue balances.
We have provided a reconciliation between total revenue, the most directly comparable GAAP financial measure, and gross billings in the table below. We believe gross billings provides useful information to investors and others in understanding and evaluating our operating results in the same manner as our Board of Directors and management.
| Three Months Ended, | ||||||||||||||||||||||||||||||||
| Dec. 31, 2015 |
Sep. 30, 2015 |
Jun. 30, 2015 |
Mar. 31, 2015 |
Dec. 31, 2014 |
Sep. 30, 2014 |
Jun. 30, 2014 |
Mar. 31, 2014 |
|||||||||||||||||||||||||
| (in thousands) | ||||||||||||||||||||||||||||||||
| Gross billings: |
||||||||||||||||||||||||||||||||
| Total revenue |
$ | 37,421 | $ | 32,250 | $ | 29,956 | $ | 22,317 | $ | 12,660 | $ | 12,764 | $ | 12,087 | $ | 8,537 | ||||||||||||||||
| Contra revenue |
— | 65 | — | — | 4,047 | — | — | 2,040 | ||||||||||||||||||||||||
|
|
|
|
|
|
|
|
|
|
|
|
|
|
|
|
|
|||||||||||||||||
| Total non-GAAP revenue |
37,421 | 32,315 | 29,956 | 22,317 | 16,707 | 12,764 | 12,087 | 10,577 | ||||||||||||||||||||||||
| Total deferred revenue, end of period |
106,779 | 92,071 | 80,598 | 68,707 | 62,923 | 47,720 | 38,983 | 31,491 | ||||||||||||||||||||||||
| Less: Total deferred revenue, beginning of period |
(92,071 | ) | (80,598 | ) | (68,707 | ) | (62,923 | ) | (47,720 | ) | (38,983 | ) | (31,491 | ) | (27,928 | ) | ||||||||||||||||
|
|
|
|
|
|
|
|
|
|
|
|
|
|
|
|
|
|||||||||||||||||
| Total change in deferred revenue |
14,708 | 11,473 | 11,891 | 5,784 | 15,203 | 8,737 | 7,492 | 3,563 | ||||||||||||||||||||||||
|
|
|
|
|
|
|
|
|
|
|
|
|
|
|
|
|
|||||||||||||||||
| Gross billings |
$ | 52,129 | $ | 43,788 | $ | 41,847 | $ | 28,101 | $ | 31,910 | $ | 21,501 | $ | 19,579 | $ | 14,140 | ||||||||||||||||
|
|
|
|
|
|
|
|
|
|
|
|
|
|
|
|
|
|||||||||||||||||
Liquidity and Capital Resources
As of December 31, 2015, our principal sources of liquidity were cash and cash equivalents and investments totaling $96.9 million compared to $204.5 million at December 31, 2014 which were held for working capital purposes. Our cash equivalents are comprised primarily of money market funds and short-term investments are comprised primarily of commercial paper, corporate notes and bonds and certificates of deposit.
The following table summarizes our cash flows for the periods indicated:
| Years Ended December 31, |
Eight Months Ended December 31, |
Years Ended April 30, |
||||||||||||||||||||||
| 2015 | 2014 | 2013 | 2012 | 2013 | 2012 | |||||||||||||||||||
| (in thousands) | ||||||||||||||||||||||||
| Cash used in operating activities |
$ | (99,336 | ) | $ | (87,864 | ) | $ | (29,833 | ) | $ | (15,236 | ) | $ | (31,968 | ) | $ | (853 | ) | ||||||
| Cash (used in) provided by investing activities |
(2,970 | ) | (72,798 | ) | (3,863 | ) | 6,979 | 13,152 | (25,602 | ) | ||||||||||||||
| Cash provided by financing activities |
9,412 | 264,442 | 50,302 | 43 | 121 | 53,848 | ||||||||||||||||||
To date, we have financed our operations primarily through private placements of preferred stock, our IPO, the concurrent private placement of our common stock, our follow-on public offering and cash flow from operations. We believe that our existing cash and cash equivalents balance, together with cash generated from sales of our support subscriptions and professional services to customers, the $109.6 million (net of issuance costs) raised in our IPO and the concurrent private placement in December 2014 and the $87.7 million (net of issuance costs) raised in our follow-on public offering in February 2016, will be sufficient to meet our working capital and capital expenditure requirements for the next 12 months.
60
Table of Contents
Our expected future capital requirements may depend on many factors including customer retention and expansion, the timing and extent of spending on platform development efforts, the expansion of sales, marketing and product management activities and ongoing investments to support the growth of our business in the United States and internationally. We may in the future enter into arrangements to acquire or invest in complementary businesses, services and technologies and intellectual property rights. We may be required to seek additional equity or debt financing in order to meet these future capital requirements. In the event that additional financing is required from outside sources, we may not be able to raise it on terms that are acceptable to us or at all. If we are unable to raise additional capital when desired, our business, results of operations and financial condition would be adversely affected.
Operating Activities
Our largest source of operating cash inflows is from sales of our support subscriptions and professional services. Our primary uses of cash from operating activities are for personnel costs, which are allocated across cost of sales, sales and marketing, research and development and general and administrative costs.
Operating activities for the year ended December 31, 2015 used $99.3 million of cash compared to $87.9 million for the same period of 2014. The increase was primarily driven by our net loss of $179.1 million for the year ended December 31, 2015 compared to a net loss of $177.4 million for the same period of 2014. In addition, accounts receivable increased by $21.6 million during the year ended December 31, 2015, which was primarily attributable to the overall increase in billings. These factors were partially offset by increases in deferred revenue of $44.4 million due to the increase in our support subscription customer base coupled with our ratable revenue recognition as a result of our lack of VSOE of fair value for support subscription revenue and in accrued expenses and other current liabilities of $6.2 million primarily related to an increase in acquisition-related expenses and ESPP contributions.
Operating activities for the year ended December 31, 2014 used $87.9 million of cash compared to $29.8 million for the eight months ended December 31, 2013. The increase was primarily driven by our net loss of $177.4 million, adjusted for the non-cash charges of $54.0 million associated with equity instruments issued to Yahoo! and an affiliate of AT&T, and other non-cash items, for the year ended December 31, 2014 compared to a net loss of $46.2 million for the eight months ended December 31, 2013. In addition, accounts receivable increased by $20.2 million during the year ended December 31, 2014 based on the timing of payments received from customers and the significant growth of our support subscription customer base. These factors were partially offset by an increase in deferred revenue of $35.0 million for the year ended December 31, 2014 due to the increase in our support subscription customer base coupled with our ratable revenue recognition as a result of our lack of VSOE for support subscription revenue.
Operating activities for the eight months ended December 31, 2013 used $29.8 million of cash compared to $15.2 million for the eight months ended December 31, 2012. The increase was primarily driven by our net loss of $46.2 million for the eight months ended December 31, 2013 compared to a net loss of $19.7 million for the eight months ended December 31, 2012. Additionally, accounts receivable increased by $5.7 million during the eight months ended December 31, 2013 based on the timing of payments received from customers and the significant growth of our subscription customer base. These factors were partially offset by an increase in deferred revenue of $11.2 million for the eight months ended December 31, 2013 due to the increase in our support subscription customer base compared to the prior period coupled with our ratable revenue recognition as a result of our lack of VSOE for support subscription revenue.
Operating activities for the year ended April 30, 2013 used $32.0 million of cash compared to $0.9 million for the year ended April 30, 2012. The increase was primarily driven by our net loss of $36.6 million for the year ended April 30, 2013 compared to a net loss of $11.5 million for the year ended April 30, 2012. In addition, accounts receivable increased by $5.9 million for the year ended April 30, 2013 based on the timing of payments received from customers and the significant growth of our support subscription customer base compared to the
61
Table of Contents
prior year. These factors were partially offset by an increase in deferred revenue of $6.6 million for the year ended April 30, 2013 due to the increase in our support subscription customer base compared to the prior period coupled with our ratable revenue recognition as a result of our lack of VSOE for support subscription revenue.
Investing Activities
Investing activities for the year ended December 31, 2015 used $3.0 million of cash compared to the $72.8 million of cash used in investing activities for the same period of 2014. The decrease in cash used was primarily driven by an increase in cash provided from the maturity of investments of $94.9 million compared to the prior period. This increase was partially offset by an increase in cash used for purchases of investments and property and equipment of $15.9 million and $6.6 million, respectively, and the issuance of the promissory note receivable of $2.5 million compared to the prior period.
Investing activities for the year ended December 31, 2014 used $72.8 million of cash compared to $3.9 million for the eight months ended December 31, 2013. The increase in cash used was primarily driven by an increase in purchases of investments of $74.2 million for the year ended December 31, 2014 compared to the eight months ended December 31, 2013. This was partially offset by an increase in maturity of investments of $16.4 million for the year ended December 31, 2014 compared to the eight months ended December 31, 2013.
Investing activities for the eight months ended December 31, 2013 used $3.9 million of cash compared to cash provided by investing activities of $7.0 million for the eight months ended December 31, 2012. The decrease was primarily driven by an $11.3 million decrease in the maturity of short-term investments for the period ended December 31, 2013 compared to the prior period.
Investing activities for the year ended April 30, 2013 generated $13.2 million of cash compared to $25.6 million used for the year ended April 30, 2012. The increase was primarily driven by an $11.5 million decrease in investments purchased and $27.9 million in proceeds from the sale and maturity of investments compared to the prior year.
Financing Activities
Financing activities for the year ended December 31, 2015 generated $9.4 million of cash related to stock option exercises, share purchases pursuant to our employee stock purchase plan, and the vesting of early exercised stock options compared to $264.4 million for the same period in 2014. The decrease in cash provided by financing activities was primarily driven by sale of our Series D preferred stock and our IPO, including the concurrent private placement, which generated net proceeds of $149.5 million and $110.4 million, respectively, during the year ended December 31, 2014, whereas there were no similar activities during the year ended December 31, 2015.
Financing activities for the year ended December 31, 2014 generated $264.4 million of cash compared to $50.3 million for the eight months ended December 31, 2013. The increase was primarily driven by sale of our Series D preferred stock and our IPO, including the concurrent private placement, which generated net proceeds of $149.5 million and $110.4 million, respectively, during the year ended December 31, 2014.
Financing activities for the eight months ended December 31, 2013 generated $50.3 million of cash compared to $43,000 for the eight months ended December 31, 2012. The increase was primarily driven by sale of the Series C preferred stock of $49.8 million during the period ended December 31, 2013.
Financing activities for the year ended April 30, 2013 generated $0.1 million of cash compared to $53.8 million for the year ended April 30, 2012. The decrease was primarily driven by the $53.0 million issuance of preferred stock in the prior year.
62
Table of Contents
Deferred Revenue and Backlog
Our deferred revenue, which consists of billed but unrecognized revenue, was $106.8 million as of December 31, 2015.
Our total backlog, which we define as including both cancellable and non-cancellable portions of our customer agreements that we have not yet billed, was $30.9 million as of December 31, 2015. The timing of our invoices to our customers is a negotiated term and thus varies among our support subscription agreements. For multiple-year agreements, it is common for us to invoice an initial amount at contract signing followed by subsequent annual invoices. At any point in the contract term, there can be amounts that we have not yet been contractually able to invoice. Until such time as these amounts are invoiced, we do not recognize them as revenue, deferred revenue or elsewhere in our consolidated financial statements. The change in backlog that results from changes in the average non-cancelable term of our support subscription arrangements may not be an indicator of the likelihood of renewal or expected future revenue, and therefore we do not utilize backlog as a key management metric internally and do not believe that it is a meaningful measurement of our future revenue.
Contractual Obligations and Other Commitments
The following table summarizes our contractual obligations as of December 31, 2015:
| Payments Due by Period | ||||||||||||||||||||
| Contractual Obligations(1): |
Less than 1 year |
1-3 years |
3-5 years |
More than 5 years |
Total | |||||||||||||||
| (in thousands) | ||||||||||||||||||||
| Operating leases(2) |
$ | 6,380 | $ | 11,163 | $ | 2,053 | $ | 177 | $ | 19,773 | ||||||||||
| Capital lease obligations |
145 | 97 | — | — | 242 | |||||||||||||||
|
|
|
|
|
|
|
|
|
|
|
|||||||||||
| Total contractual obligations |
$ | 6,525 | $ | 11,260 | $ | 2,053 | $ | 177 | $ | 20,015 | ||||||||||
|
|
|
|
|
|
|
|
|
|
|
|||||||||||
| (1) | Due to the uncertainty as to the timing of payments related to our liabilities for unrecognized tax benefits, we have excluded estimated obligations related to uncertain tax benefits from the table above. As of December 31, 2015, we do not have a liability for uncertain tax benefits. |
| (2) | Operating leases consist of total future minimum rent payments under non-cancelable operating lease agreements. Minimum payments have not been reduced by minimum sublease rentals of $2.7 million due in the future under noncancelable subleases. |
Off-Balance Sheet Arrangements
Through December 31, 2015, we did not have any relationships with unconsolidated organizations or financial partnerships, such as structured finance or special purpose entities that would have been established for the purpose of facilitating off-balance sheet arrangements or other contractually narrow or limited purposes.
Segment Information
We operate in one reportable segment.
Critical Accounting Policies and Estimates
We prepare our consolidated financial statements in accordance with GAAP. In the preparation of these consolidated financial statements, we are required to make estimates and assumptions that affect the reported amounts of assets, liabilities, revenue, costs and expenses and related disclosures. To the extent that there are material differences between these estimates and actual results, our financial condition or operating results would be affected. We base our estimates on past experience and other assumptions that we believe are reasonable under the circumstances, and we evaluate these estimates on an ongoing basis. We refer to accounting estimates of this type as critical accounting policies and estimates, which we discuss below.
63
Table of Contents
Revenue Recognition
Apache Hadoop is a freely available open source based software platform. While it has emerged as an enabling technology for the modern data center architecture, there are limitations related to the traditional Hadoop offering that may inhibit broad adoption by enterprises. Our software development efforts are thus focused on creating open platforms by working in concert with the Apache community to develop HDP and HDF.
HDP is an enterprise-scale data management platform built entirely on open source technology including Apache Hadoop. At its core is the next generation computing and resource management framework called YARN, which uniquely enables a centralized data architecture for batch, interactive and real-time workloads to be executed simultaneously on a single cluster and dataset while extending consistent security, governance and operation across the platform. HDF is complementary to HDP, and makes it easy to automate and secure data flows that collect, conduct and curate real-time business insights and actions derived from sensors, machines, geolocation devices, clicks, logs and social feeds. Our approach is differentiated in that we are committed to serving the Apache Software Foundation open source ecosystem and to sharing all of our product developments with the open source community. We distribute HDP and HDF software under the Apache open source license in order to provide broad rights for recipients of the software to use, copy, modify and redistribute the software. Consistent with our open source approach, we generally make HDP and HDF available free of charge.
We generate the predominant amount of our revenue through support (support subscription) and consulting and training services (professional services) arrangements with our enterprise customers. We provide telephone support, security updates, bug fixes, functionality enhancements and upgrades to the technology and new versions of the software, if and when available. Our professional services provide assistance in the implementation process and training related activities.
Under our support subscription and professional services arrangements, revenue is recognized when (i) persuasive evidence of an arrangement exists; (ii) the services have been delivered; (iii) the arrangement fee is fixed or determinable; and (iv) collectability is probable.
Support Subscription Revenue
In single-element arrangements, support subscription fees are recognized on a ratable basis over the support subscription term. Our support subscription arrangements do not contain refund provisions for fees earned related to services performed.
Professional Services Revenue
Professional services revenue is derived from customer fees for consulting services engagements and training services. Our consulting services are provided primarily on a time and materials basis and, to a lesser extent, a fixed fee basis, and training services are priced based on attendance. Revenue from professional services, when such services are sold in single-element arrangements, is recognized as the services are performed.
Multiple-Element Arrangements
Our multiple-element arrangements include support subscription combined with professional services. We have not yet established VSOE for our support subscription offerings, and we recognize revenue on a ratable basis over the period beginning when both the support subscription and professional services have commenced, and ending at the conclusion of the support subscription or professional services period, whichever is longer. Under our multiple element arrangements, the support subscription element generally has the longest service period and the professional services element is performed during the earlier part of the support subscription period. On occasion, we may sell a premium subscription agreement that provides a customer with development input and the opportunity to work more closely with our developers.
64
Table of Contents
Our agreements with customers often include multiple support subscription and/or professional service elements, and these elements are sometimes included in separate contracts. We consider an entire customer arrangement to determine if separate contracts should be considered linked arrangements for the purposes of revenue recognition.
Revenue recognition requires judgment, including whether a software arrangement includes multiple elements and, if so, whether VSOE exists for those elements. A portion of revenue may be recorded as unearned due to undelivered elements. Changes to the elements in a software arrangement, the ability to identify the VSOE for those elements and the fair value of the respective elements could materially impact the amount of earned and unearned revenue in a given period.
Revenue from Strategic Relationships and Reseller Arrangements
We have strategic relationships and reseller arrangements with third parties. Under these arrangements, we are not the primary obligor for what is ultimately sold by the third parties to their end customers. The amount recognized as revenue from sale to end users represents the amount due to us from the third parties and is generally recognized on a ratable basis over the applicable services term.
Equity Instruments Issued to Customers
We have entered into warrant and share purchase agreements with certain customers. For such arrangements, the fair value of the underlying securities is recognized as contra-revenue to the extent cumulative revenue from the customer is available to offset the fair value of the security on the measurement date. If cumulative revenue from the customer is less than the fair value of the security, the excess is recorded as cost of sales. See additional discussion at Notes 9 and 15 to our consolidated financial statements for further discussion.
Stock-Based Compensation Expense
We recognize compensation costs related to stock options granted to employees based on the estimated fair value of the awards on the date of grant, net of estimated forfeitures. We estimate the grant date fair value, and the resulting stock-based compensation expense, using the Black-Scholes option-pricing model. The grant date fair value of the stock-based awards is recognized on a straight-line basis over the requisite service period, which is the vesting period of the respective awards.
The Black-Scholes option-pricing model requires the use of highly subjective and complex assumptions, including the expected term and the price volatility of the underlying stock, which determine the fair value of stock-based awards. These assumptions include:
| • | Expected term. We estimate the expected term for stock options using the simplified method due to the limited historical exercise activity for us. The simplified method calculates the expected term as the midpoint between the vesting date and the contractual expiration date of the award. |
| • | Expected volatility. Due to the limited history of our common stock, the expected volatility was derived from the average historical stock volatilities of several unrelated public companies within our industry that we consider to be comparable to our business over a period equivalent to the expected term of the stock option grants. |
| • | Risk-free interest rate. The risk-free interest rate is based on the United States Treasury yield curve in effect at the time of grant for the expected term of the stock-based award. |
| • | Expected dividend. The expected dividend is assumed to be zero as we have never paid dividends and have no current plans to pay any dividends on our common stock. |
In addition to the assumptions used in the Black-Scholes option-pricing model, we must also estimate a forfeiture rate to calculate the stock-based compensation for our awards. Our forfeiture rate is based on an
65
Table of Contents
analysis of our actual forfeitures. We will continue to evaluate the appropriateness of the forfeiture rate based on actual forfeiture experience, analysis of employee turnover and other factors. Quarterly changes in the estimated forfeiture rate can have a significant impact on our stock-based compensation expense as the cumulative effect of adjusting the rate is recognized in the period the forfeiture estimate is changed. If a revised forfeiture rate is higher than the previously estimated forfeiture rate, an adjustment is made that will result in a decrease to the stock-based compensation expense recognized in our financial statements. If a revised forfeiture rate is lower than the previously estimated forfeiture rate, an adjustment is made that will result in an increase to the stock-based compensation expense recognized in our financial statements.
We will continue to use judgment in evaluating the expected volatility, expected terms and forfeiture rates utilized for our stock-based compensation calculations on a prospective basis. As we continue to accumulate additional data related to our common stock, we may have refinements to the estimates of our expected volatility, expected terms and forfeiture rates, which could impact our future stock-based compensation expense.
Stock-based compensation expense associated with restricted stock units is based on the fair value of our common stock on the grant date, which equals the closing market price of our common stock on the grant date. For restricted stock units, we recognize compensation expense over the vesting period of the awards that are ultimately expected to vest.
Stock-based compensation expense associated with performance stock units is based on the fair value of our common stock on the grant date, which equals the closing market price of our common stock on the grant date. Performance share awards allow the recipients of such awards to earn fully vested shares of our common stock upon the achievement of pre-established performance objectives. Stock-based compensation expense associated with performance share awards is based on the fair value of our common stock on the grant date, which equals the closing market price of our common stock on the grant date, and is recognized when the performance objective is expected to be achieved. We evaluate on a quarterly basis the probability of achieving the performance criteria. The cumulative effect on current and prior periods of a change in the estimated number of performance share awards expected to be earned is recognized as compensation expense or as reduction of previously recognized compensation expense in the period of the revised estimate.
We account for the ESPP as a compensatory plan. The fair value of each purchase under our ESPP is estimated on the date of the beginning of the offering period using the Black-Scholes option pricing model, which requires the use of subjective assumptions related to the expected stock price volatility, term, risk-free interest rate and dividend yield. We recognize compensation expense over the vesting period of the awards that are ultimately expected to vest.
Loss Contingencies
We are subject to the possibility of various loss contingencies arising in the ordinary course of business. We consider the likelihood of loss or impairment of an asset, or the incurrence of a liability, as well as our ability to reasonably estimate the amount of loss, in determining loss contingencies. An estimated loss contingency is accrued when it is probable that an asset has been impaired or a liability has been incurred and the amount of loss can be reasonably estimated. If we determine that a loss is possible and the range of the loss can be reasonably determined, then we disclose the range of the possible loss. We regularly evaluate current information available to us to determine whether an accrual is required, an accrual should be adjusted or a range of possible loss should be disclosed.
Recently Issued and Adopted Accounting Pronouncements
See Note 2—“Summary of Significant Accounting Policies” in the Notes to our consolidated financial statements, which is incorporated herein by reference.
66
Table of Contents
Item 7A. Quantitative and Qualitative Disclosures About Market Risk.
Interest Rate Risk
Our primary exposure to market risk relates to interest rate changes. We had cash and cash equivalents and investments totaling $96.9 million as of December 31, 2015. Cash and cash equivalents are comprised primarily of cash deposits and money market funds. Our short-term and long-term investments are primarily comprised of treasury bills, commercial paper, certificates of deposits, corporate notes and bonds, United States government securities and our promissory note receivable. The cash and cash equivalents are held for working capital purposes. Our investments are made for capital preservation purposes. We do not enter into investments for trading or speculative purposes. Due to the predominantly short-term nature of the instruments in our portfolio, a sudden change in market interest rates would not be expected to have a material impact on our consolidated financial statements.
Our promissory note receivable was entered into with a third-party professional services provider. Our maximum exposure to credit risk is the principal amount of the note of $2.5 million plus accrued and unpaid interest. To date, we have not experienced any losses with respect to our promissory note receivable.
Item 8. Financial Statements and Supplementary Data.
67
Table of Contents
HORTONWORKS, INC.
INDEX TO CONSOLIDATED FINANCIAL STATEMENTS
| Page | ||||
| 69 | ||||
| 70 | ||||
| 71 | ||||
| 72 | ||||
| Consolidated Statements of Convertible Preferred Stock and Stockholders’ (Deficit) Equity |
73 | |||
| 74 | ||||
| 75 | ||||
68
Table of Contents
REPORT OF INDEPENDENT REGISTERED PUBLIC ACCOUNTING FIRM
To the Board of Directors and Stockholders of Hortonworks, Inc.
Santa Clara, California
We have audited the accompanying consolidated balance sheets of Hortonworks, Inc. and subsidiaries (the “Company”) as of December 31, 2015 and December 31, 2014, and the related consolidated statements of operations, comprehensive loss, convertible preferred stock and stockholders’ (deficit) equity, and cash flows for the years ended December 31, 2015 and December 31, 2014, the eight months ended December 31, 2013, and the year ended April 30, 2013. These consolidated financial statements are the responsibility of the Company’s management. Our responsibility is to express an opinion on these consolidated financial statements based on our audits.
We conducted our audits in accordance with the standards of the Public Company Accounting Oversight Board (United States). Those standards require that we plan and perform the audit to obtain reasonable assurance about whether the financial statements are free of material misstatement. The Company is not required to have, nor were we engaged to perform, an audit of its internal control over financial reporting. Our audits included consideration of internal control over financial reporting as a basis for designing audit procedures that are appropriate in the circumstances, but not for the purpose of expressing an opinion on the effectiveness of the Company’s internal control over financial reporting. Accordingly, we express no such opinion. An audit also includes examining, on a test basis, evidence supporting the amounts and disclosures in the financial statements, assessing the accounting principles used and significant estimates made by management, as well as evaluating the overall financial statement presentation. We believe that our audits provide a reasonable basis for our opinion.
In our opinion, such consolidated financial statements present fairly, in all material respects, the consolidated financial position of the Company as of December 31, 2015 and December 31, 2014, and the consolidated results of its operations and its cash flows for the years ended December 31, 2015 and December 31, 2014, the eight months ended December 31, 2013, and the year ended April 30, 2013 in accordance with accounting principles generally accepted in the United States of America.
As discussed in Note 2 to the consolidated financial statements, the Company changed its fiscal year end from April 30 to December 31.
/s/ DELOITTE & TOUCHE LLP
San Jose, California
March 15, 2016
69
Table of Contents
HORTONWORKS, INC.
(In thousands, except share and per share data)
| December 31, 2015 |
December 31, 2014 |
|||||||
| ASSETS |
||||||||
| CURRENT ASSETS: |
||||||||
| Cash and cash equivalents |
$ | 35,748 | $ | 129,084 | ||||
| Short-term investments |
58,553 | 75,381 | ||||||
| Accounts receivable, net of allowance of $20 and $440 as of December 31, 2015 and 2014, respectively |
53,913 | 32,900 | ||||||
| Prepaid expenses and other current assets |
5,276 | 3,728 | ||||||
|
|
|
|
|
|||||
| Total current assets |
153,490 | 241,093 | ||||||
| Property and equipment, net |
15,422 | 11,182 | ||||||
| Long-term investments |
2,592 | — | ||||||
| Goodwill |
34,333 | 2,119 | ||||||
| Intangible assets |
4,002 | — | ||||||
| Other non-current assets |
872 | 304 | ||||||
| Restricted cash |
1,308 | 1,341 | ||||||
|
|
|
|
|
|||||
| TOTAL ASSETS |
$ | 212,019 | $ | 256,039 | ||||
|
|
|
|
|
|||||
| LIABILITIES AND STOCKHOLDERS’ EQUITY |
||||||||
| CURRENT LIABILITIES: |
||||||||
| Accounts payable |
$ | 6,365 | $ | 7,087 | ||||
| Accrued compensation and benefits |
12,685 | 9,913 | ||||||
| Accrued expenses and other current liabilities |
14,989 | 6,333 | ||||||
| Deferred revenue |
90,407 | 50,280 | ||||||
|
|
|
|
|
|||||
| Total current liabilities |
124,446 | 73,613 | ||||||
| Long-term deferred revenue |
16,372 | 12,643 | ||||||
| Other long-term liabilities |
3,610 | 2,713 | ||||||
|
|
|
|
|
|||||
| TOTAL LIABILITIES |
144,428 | 88,969 | ||||||
|
|
|
|
|
|||||
| Commitments and contingencies (Note 7) |
||||||||
| STOCKHOLDERS’ EQUITY: |
||||||||
| Preferred stock, par value of $0.0001 per share—25,000,000 shares authorized; none issued or outstanding as of December 31, 2015 and 2014 |
— | — | ||||||
| Common stock, par value of $0.0001 per share—500,000,000 shares authorized; 45,692,391 shares issued and outstanding as of December 31, 2015 and 40,987,583 shares issued and outstanding as of December 31, 2014 |
5 | 4 | ||||||
| Additional paid-in capital |
518,986 | 439,005 | ||||||
| Accumulated other comprehensive loss |
(546 | ) | (202 | ) | ||||
| Accumulated deficit |
(450,854 | ) | (271,737 | ) | ||||
|
|
|
|
|
|||||
| TOTAL STOCKHOLDERS’ EQUITY |
67,591 | 167,070 | ||||||
|
|
|
|
|
|||||
| TOTAL LIABILITIES AND STOCKHOLDERS’ EQUITY |
$ | 212,019 | $ | 256,039 | ||||
|
|
|
|
|
|||||
See the accompanying notes to the consolidated financial statements.
70
Table of Contents
HORTONWORKS, INC.
Consolidated Statements of Operations
(In thousands, except share and per share data)
| Years Ended December 31, |
Eight Months Ended December 31, |
Years Ended April 30, | ||||||||||||||||||||||
| 2015 | 2014 | 2013 | 2012 | 2013 | 2012 | |||||||||||||||||||
| (Unaudited) | ||||||||||||||||||||||||
| Support subscription and professional services revenue: |
||||||||||||||||||||||||
| Support subscription (including contra-revenue of $65 and $5,961 for the years ended December 31, 2015 and 2014, respectively) |
$ | 77,728 | $ | 25,558 | $ | 11,415 | $ | 3,643 | $ | 7,739 | $ | 1,276 | ||||||||||||
| Professional services (including contra-revenue of $126 for the year ended December 31, 2014) |
44,216 | 20,490 | 6,450 | 1,135 | 3,259 | 370 | ||||||||||||||||||
|
|
|
|
|
|
|
|
|
|
|
|
|
|||||||||||||
| Total support subscription and professional services revenue (including $10,053, $2,835, $3,039, $718, $2,118 and $833 for the periods ended December 31, 2015, 2014, 2013 and 2012, April 30, 2013 and 2012, from related parties—Note 15) |
121,944 | 46,048 | 17,865 | 4,778 | 10,998 | 1,646 | ||||||||||||||||||
| Cost of revenue: |
||||||||||||||||||||||||
| Support subscription |
13,705 | 52,687 | 3,720 | 2,880 | 5,071 | 421 | ||||||||||||||||||
| Professional services |
41,466 | 28,192 | 9,990 | 3,053 | 5,862 | 974 | ||||||||||||||||||
|
|
|
|
|
|
|
|
|
|
|
|
|
|||||||||||||
| Total cost of revenue |
55,171 | 80,879 | 13,710 | 5,933 | 10,933 | 1,395 | ||||||||||||||||||
|
|
|
|
|
|
|
|
|
|
|
|
|
|||||||||||||
| Gross profit (loss) |
66,773 | (34,831 | ) | 4,155 | (1,155 | ) | 65 | 251 | ||||||||||||||||
| Operating expenses: |
||||||||||||||||||||||||
| Sales and marketing |
133,052 | 70,695 | 21,357 | 8,403 | 17,187 | 2,589 | ||||||||||||||||||
| Research and development |
66,645 | 37,771 | 14,621 | 6,768 | 12,070 | 6,881 | ||||||||||||||||||
| General and administrative |
46,669 | 26,231 | 14,368 | 3,487 | 7,598 | 2,384 | ||||||||||||||||||
| Contribution of acquired technology to the Apache Software Foundation |
— | 3,971 | — | — | — | — | ||||||||||||||||||
|
|
|
|
|
|
|
|
|
|
|
|
|
|||||||||||||
| Total operating expenses |
246,366 | 138,668 | 50,346 | 18,658 | 36,855 | 11,854 | ||||||||||||||||||
|
|
|
|
|
|
|
|
|
|
|
|
|
|||||||||||||
| Loss from operations |
(179,593 | ) | (173,499 | ) | (46,191 | ) | (19,813 | ) | (36,790 | ) | (11,603 | ) | ||||||||||||
| Other income (expense), net |
908 | (4,977 | ) | 23 | 110 | 163 | 83 | |||||||||||||||||
|
|
|
|
|
|
|
|
|
|
|
|
|
|||||||||||||
| Loss before income tax |
(178,685 | ) | (178,476 | ) | (46,168 | ) | (19,703 | ) | (36,627 | ) | (11,520 | ) | ||||||||||||
| Income tax expense (benefit) |
432 | (1,111 | ) | 45 | 8 | 11 | 1 | |||||||||||||||||
|
|
|
|
|
|
|
|
|
|
|
|
|
|||||||||||||
| Net loss |
$ | (179,117 | ) | $ | (177,365 | ) | $ | (46,213 | ) | $ | (19,711 | ) | $ | (36,638 | ) | $ | (11,521 | ) | ||||||
|
|
|
|
|
|
|
|
|
|
|
|
|
|||||||||||||
| Net loss per share of common stock, basic and diluted |
$ | (4.13 | ) | $ | (24.16 | ) | $ | (18.18 | ) | $ | (16.96 | ) | $ | (30.29 | ) | $ | (74.30 | ) | ||||||
|
|
|
|
|
|
|
|
|
|
|
|
|
|||||||||||||
| Weighted-average shares used in computing net loss per share of common stock, basic and diluted |
43,318,044 | 7,341,465 | 2,541,800 | 1,161,880 | 1,209,750 | 155,052 | ||||||||||||||||||
|
|
|
|
|
|
|
|
|
|
|
|
|
|||||||||||||
See the accompanying notes to the consolidated financial statements.
71
Table of Contents
HORTONWORKS, INC.
Consolidated Statements of Comprehensive Loss
(In thousands)
| Years Ended December 31, |
Eight Months Ended December 31, |
Years Ended April 30, |
||||||||||||||||||||||
| 2015 | 2014 | 2013 | 2012 | 2013 | 2012 | |||||||||||||||||||
| (Unaudited) | ||||||||||||||||||||||||
| Net loss |
$ | (179,117 | ) | $ | (177,365 | ) | $ | (46,213 | ) | $ | (19,711 | ) | $ | (36,638 | ) | $ | (11,521 | ) | ||||||
| Items of other comprehensive (loss) income: |
||||||||||||||||||||||||
| Unrealized (loss) gain on investments, net of tax of $0 for all periods presented |
1 | (63 | ) | (6 | ) | (3 | ) | (7 | ) | 12 | ||||||||||||||
| Foreign currency translation adjustment |
(345 | ) | (120 | ) | (19 | ) | — | 1 | — | |||||||||||||||
|
|
|
|
|
|
|
|
|
|
|
|
|
|||||||||||||
| Total other comprehensive (loss) income |
(344 | ) | (183 | ) | (25 | ) | (3 | ) | (6 | ) | 12 | |||||||||||||
|
|
|
|
|
|
|
|
|
|
|
|
|
|||||||||||||
| Total comprehensive loss |
$ | (179,461 | ) | $ | (177,548 | ) | $ | (46,238 | ) | $ | (19,714 | ) | $ | (36,644 | ) | $ | (11,509 | ) | ||||||
|
|
|
|
|
|
|
|
|
|
|
|
|
|||||||||||||
See the accompanying notes to the consolidated financial statements
72
Table of Contents
HORTONWORKS, INC.
Consolidated Statements of Convertible Preferred Stock and Stockholders’ (Deficit) Equity
(In thousands, except shares)
| Convertible Preferred Stock |
Common Stock | Additional Paid-In Capital |
Accumulated other comprehensive income (loss) |
Accumulated Deficit |
Total Stockholders’ (Deficit) Equity |
|||||||||||||||||||||||||||
| Shares | Amount | Shares | Amount | |||||||||||||||||||||||||||||
| Balance—April 30, 2012 |
24,882,808 | $ | 53,254 | 1,094,917 | $ | — | $ | 886 | $ | 12 | $ | (11,521 | ) | $ | (10,623 | ) | ||||||||||||||||
| Exercise of stock options and vesting of early exercised stock options |
— | — | 277,513 | — | 90 | — | — | 90 | ||||||||||||||||||||||||
| Stock-based compensation expense |
— | — | — | — | 762 | — | — | 762 | ||||||||||||||||||||||||
| Other comprehensive loss |
— | — | — | — | — | (6 | ) | — | (6 | ) | ||||||||||||||||||||||
| Net loss |
— | — | — | — | — | — | (36,638 | ) | (36,638 | ) | ||||||||||||||||||||||
|
|
|
|
|
|
|
|
|
|
|
|
|
|
|
|
|
|||||||||||||||||
| Balance—April 30, 2013 |
24,882,808 | 53,254 | 1,372,430 | — | 1,738 | 6 | (48,159 | ) | (46,415 | ) | ||||||||||||||||||||||
| Issuance of Series C convertible preferred stock, net of issuance costs of $186 |
6,708,167 | 49,813 | — | — | — | — | — | — | ||||||||||||||||||||||||
| Exercise of stock options and vesting of early exercised stock options |
— | — | 422,835 | — | 194 | — | — | 194 | ||||||||||||||||||||||||
| Stock-based compensation expense |
— | — | — | — | 1,327 | — | — | 1,327 | ||||||||||||||||||||||||
| Issuance of common stock to related party and contra-revenue adjustment (Note 15) |
— | — | 32,522 | — | 382 | — | — | 382 | ||||||||||||||||||||||||
| Principal payment on promissory notes for issuance of common stock |
— | — | 1,718,585 | — | 310 | — | — | 310 | ||||||||||||||||||||||||
| Other comprehensive loss |
— | — | — | — | — | (25 | ) | — | (25 | ) | ||||||||||||||||||||||
| Net loss |
— | — | — | — | — | — | (46,213 | ) | (46,213 | ) | ||||||||||||||||||||||
|
|
|
|
|
|
|
|
|
|
|
|
|
|
|
|
|
|||||||||||||||||
| Balance—December 31, 2013 |
31,590,975 | 103,067 | 3,546,372 | — | 3,951 | (19 | ) | (94,372 | ) | (90,440 | ) | |||||||||||||||||||||
| Issuance of Series D convertible preferred stock, net of issuance costs of $453 |
12,308,100 | 149,547 | — | — | — | — | — | — | ||||||||||||||||||||||||
| Conversion of convertible preferred stock to common stock |
(43,899,075 | ) | (252,614 | ) | 21,949,525 | 2 | 252,612 | — | — | 252,614 | ||||||||||||||||||||||
| Initial public offering and concurrent private placement, net of issuance costs of $13,180 |
7,673,986 | 1 | 109,603 | — | — | 109,604 | ||||||||||||||||||||||||||
| Exercise of stock options and vesting of early exercised stock options |
— | — | 858,174 | — | 1,492 | — | — | 1,492 | ||||||||||||||||||||||||
| Principal payment on promissory notes for issuance of common stock, net of repurchase liability for unvested shares |
— | — | 6,469,271 | 1 | 3,978 | — | — | 3,979 | ||||||||||||||||||||||||
| Reclassification of common stock warrant liability to equity |
— | — | — | — | 5,391 | — | — | 5,391 | ||||||||||||||||||||||||
| Vesting of 2011 Yahoo! Warrant and conversion into common stock warrant |
— | — | — | — | 52,000 | — | — | 52,000 | ||||||||||||||||||||||||
| Stock-based compensation expense |
— | — | — | — | 9,032 | — | — | 9,032 | ||||||||||||||||||||||||
| Issuance of common stock to related party and contra-revenue adjustment (Note 15) |
— | — | 357,747 | — | 2,040 | — | — | 2,040 | ||||||||||||||||||||||||
| Acquisition |
— | — | 132,508 | 1,815 | — | — | 1,815 | |||||||||||||||||||||||||
| Repurchase of restricted shares related to promissory notes |
— | — | — | — | (2,909 | ) | — | — | (2,909 | ) | ||||||||||||||||||||||
| Other comprehensive loss |
— | — | — | — | — | (183 | ) | — | (183 | ) | ||||||||||||||||||||||
| Net loss |
— | — | — | — | — | — | (177,365 | ) | (177,365 | ) | ||||||||||||||||||||||
|
|
|
|
|
|
|
|
|
|
|
|
|
|
|
|
|
|||||||||||||||||
| Balance—December 31, 2014 |
— | — | 40,987,583 | 4 | 439,005 | (202 | ) | (271,737 | ) | 167,070 | ||||||||||||||||||||||
| Exercise of stock options and vesting of early exercised stock options |
— | — | 3,325,707 | 1 | 7,753 | — | — | 7,754 | ||||||||||||||||||||||||
| Stock-based compensation expense |
— | — | — | — | 40,939 | — | — | 40,939 | ||||||||||||||||||||||||
| Shares issued from restricted stock unit settlement |
— | — | 56,250 | — | — | — | — | — | ||||||||||||||||||||||||
| Issuance of common stock in connection with employee stock purchase plan |
— | — | 219,600 | — | 3,776 | — | — | 3,776 | ||||||||||||||||||||||||
| Acquisitions |
— | — | 1,103,251 | — | 27,593 | — | — | 27,593 | ||||||||||||||||||||||||
| Issuance cost related to the initial public offering |
— | — | — | — | (80 | ) | — | — | (80 | ) | ||||||||||||||||||||||
| Other comprehensive loss |
— | — | — | — | — | (344 | ) | — | (344 | ) | ||||||||||||||||||||||
| Net loss |
— | — | — | — | — | — | (179,117 | ) | (179,117 | ) | ||||||||||||||||||||||
|
|
|
|
|
|
|
|
|
|
|
|
|
|
|
|
|
|||||||||||||||||
| Balance—December 31, 2015 |
— | $ | — | 45,692,391 | $ | 5 | $ | 518,986 | $ | (546 | ) | $ | (450,854 | ) | $ | 67,591 | ||||||||||||||||
|
|
|
|
|
|
|
|
|
|
|
|
|
|
|
|
|
|||||||||||||||||
See the accompanying notes to the consolidated financial statements.
73
Table of Contents
HORTONWORKS, INC.
Consolidated Statements of Cash Flows
(In thousands)
| Years Ended December 31, |
Eight Months Ended December 31, |
Years Ended April 30, |
||||||||||||||||||||||
| 2015 | 2014 | 2013 | 2012 | 2013 | 2012 | |||||||||||||||||||
| (Unaudited) | ||||||||||||||||||||||||
| CASH FLOWS FROM OPERATING ACTIVITIES: |
||||||||||||||||||||||||
| Net loss |
$ | (179,117 | ) | $ | (177,365 | ) | $ | (46,213 | ) | $ | (19,711 | ) | $ | (36,638 | ) | $ | (11,521 | ) | ||||||
| Adjustments to reconcile net loss to net cash used in operating activities: |
||||||||||||||||||||||||
| Depreciation |
4,499 | 1,204 | 505 | 215 | 419 | 96 | ||||||||||||||||||
| Amortization of premiums from investments |
949 | 921 | 209 | 394 | 464 | 170 | ||||||||||||||||||
| Amortization of intangible assets |
393 | — | — | — | — | — | ||||||||||||||||||
| Stock-based compensation expense |
40,939 | 9,032 | 1,327 | 416 | 762 | 322 | ||||||||||||||||||
| Contra-revenue adjustment related to share purchase agreement |
— | 2,040 | 382 | — | — | — | ||||||||||||||||||
| Loss on disposal of assets |
522 | 118 | 91 | 51 | 48 | — | ||||||||||||||||||
| Loss on early exit of lease |
— | 407 | — | — | — | — | ||||||||||||||||||
| Contribution of acquired technology to the Apache Software Foundation |
— | 3,971 | — | — | — | — | ||||||||||||||||||
| Deferred income tax benefit |
(140 | ) | (1,279 | ) | — | — | — | — | ||||||||||||||||
| Common stock warrant liability, including change in fair value |
— | 5,391 | — | — | — | — | ||||||||||||||||||
| Contra revenue and cost of revenue adjustment related to vesting of the 2011 Yahoo! Warrant |
— | 52,000 | — | — | — | — | ||||||||||||||||||
| Other |
14 | — | — | — | — | — | ||||||||||||||||||
| Changes in operating assets and liabilities: |
||||||||||||||||||||||||
| Accounts receivable |
(21,629 | ) | (20,188 | ) | (5,744 | ) | (2,118 | ) | (5,892 | ) | (1,075 | ) | ||||||||||||
| Prepaid expenses and other current assets |
(1,519 | ) | (2,716 | ) | 237 | (67 | ) | (442 | ) | (945 | ) | |||||||||||||
| Other assets |
(580 | ) | (282 | ) | (18 | ) | (780 | ) | (702 | ) | (266 | ) | ||||||||||||
| Accounts payable |
1,648 | 906 | 1,161 | 896 | 1,129 | 148 | ||||||||||||||||||
| Accrued expenses and other current liabilities |
6,154 | (4,287 | ) | 4,645 | (391 | ) | 1,326 | 1,412 | ||||||||||||||||
| Accrued compensation and benefits |
2,801 | 5,891 | 2,387 | 911 | 976 | 658 | ||||||||||||||||||
| Deferred revenue |
44,381 | 34,995 | 11,198 | 4,948 | 6,582 | 10,148 | ||||||||||||||||||
| Other long-term liabilities |
1,349 | 1,377 | — | — | — | — | ||||||||||||||||||
|
|
|
|
|
|
|
|
|
|
|
|
|
|||||||||||||
| Net cash used in operating activities |
(99,336 | ) | (87,864 | ) | (29,833 | ) | (15,236 | ) | (31,968 | ) | (853 | ) | ||||||||||||
|
|
|
|
|
|
|
|
|
|
|
|
|
|||||||||||||
| CASH FLOWS FROM INVESTING ACTIVITIES: |
||||||||||||||||||||||||
| Purchases of investments |
(102,631 | ) | (86,780 | ) | (12,585 | ) | (12,879 | ) | (13,672 | ) | (25,125 | ) | ||||||||||||
| Proceeds from sale of investments |
— | — | 2,161 | 2,213 | 25,728 | — | ||||||||||||||||||
| Proceeds from maturities of investments |
118,510 | 23,620 | 7,200 | 18,518 | 2,233 | — | ||||||||||||||||||
| Purchases of property and equipment |
(12,839 | ) | (6,276 | ) | (639 | ) | (873 | ) | (1,137 | ) | (477 | ) | ||||||||||||
| Acquisitions, net |
(3,541 | ) | (2,996 | ) | — | — | — | — | ||||||||||||||||
| Issuance of promissory note receivable |
(2,500 | ) | — | — | — | — | — | |||||||||||||||||
| Change in restricted cash |
31 | (366 | ) | — | — | — | — | |||||||||||||||||
|
|
|
|
|
|
|
|
|
|
|
|
|
|||||||||||||
| Net cash (used in) provided by investing activities |
(2,970 | ) | (72,798 | ) | (3,863 | ) | 6,979 | 13,152 | (25,602 | ) | ||||||||||||||
|
|
|
|
|
|
|
|
|
|
|
|
|
|||||||||||||
| CASH FLOWS FROM FINANCING ACTIVITIES: |
||||||||||||||||||||||||
| Proceeds from sale of preferred stock, net of issuance costs |
— | 149,547 | 49,813 | — | — | 53,034 | ||||||||||||||||||
| Proceeds from initial public offering and concurrent private placement, net of issuance costs |
— | 110,359 | — | — | — | — | ||||||||||||||||||
| Proceeds from issuance of common stock |
10,417 | 2,580 | 179 | 43 | 121 | 537 | ||||||||||||||||||
| Proceeds from issuance of convertible notes |
— | — | — | — | — | 220 | ||||||||||||||||||
| Proceeds from payments of principal on promissory notes |
— | 4,865 | 310 | — | — | 57 | ||||||||||||||||||
| Payments for deferred offering costs |
(835 | ) | — | — | — | — | — | |||||||||||||||||
| Repurchase of restricted shares related to promissory notes |
— | (2,909 | ) | — | — | — | — | |||||||||||||||||
| Other financing activities |
(170 | ) | — | — | — | — | — | |||||||||||||||||
|
|
|
|
|
|
|
|
|
|
|
|
|
|||||||||||||
| Net cash provided by financing activities |
9,412 | 264,442 | 50,302 | 43 | 121 | 53,848 | ||||||||||||||||||
|
|
|
|
|
|
|
|
|
|
|
|
|
|||||||||||||
| Effect of exchange rate changes on cash and cash equivalents |
(442 | ) | — | — | — | — | — | |||||||||||||||||
| Net (decrease) increase in cash and cash equivalents |
(93,336 | ) | 103,780 | 16,606 | (8,214 | ) | (18,695 | ) | 27,393 | |||||||||||||||
| Cash and cash equivalents—Beginning of period |
129,084 | 25,304 | 8,698 | 27,393 | 27,393 | — | ||||||||||||||||||
|
|
|
|
|
|
|
|
|
|
|
|
|
|||||||||||||
| Cash and cash equivalents—End of period |
$ | 35,748 | $ | 129,084 | $ | 25,304 | $ | 19,179 | $ | 8,698 | $ | 27,393 | ||||||||||||
|
|
|
|
|
|
|
|
|
|
|
|
|
|||||||||||||
| SUPPLEMENTAL DISCLOSURES OF CASH FLOW INFORMATION: |
||||||||||||||||||||||||
| Cash paid for income taxes |
$ | 330 | $ | 76 | $ | 8 | $ | 6 | $ | 6 | $ | — | ||||||||||||
|
|
|
|
|
|
|
|
|
|
|
|
|
|||||||||||||
| Cash paid for interest |
$ | 14 | $ | 7 | $ | — | $ | — | $ | — | $ | 1 | ||||||||||||
|
|
|
|
|
|
|
|
|
|
|
|
|
|||||||||||||
| SUPPLEMENTAL DISCLOSURES OF NON-CASH INVESTING AND FINANCING INFORMATION: |
||||||||||||||||||||||||
| Promissory notes canceled with respect to repurchases of restricted stock |
$ | — | $ | (301 | ) | $ | (186 | ) | $ | — | $ | — | $ | (172 | ) | |||||||||
| Conversion of promissory note to Series A convertible preferred stock |
$ | — | $ | — | $ | — | $ | — | $ | — | $ | 221 | ||||||||||||
| Fair value of shares issued in connection with acquisitions |
$ | 27,593 | $ | 1,815 | $ | — | $ | — | $ | — | $ | — | ||||||||||||
| Conversion of preferred stock to common stock upon initial public offering |
$ | — | $ | 252,614 | $ | — | $ | — | $ | — | $ | — | ||||||||||||
| Purchases of property and equipment included in accounts payable and accrued expenses and other current liabilities |
$ | 1,337 | $ | 5,026 | $ | — | $ | — | $ | — | $ | — | ||||||||||||
| Initial public offering and concurrent private placement costs included in accounts payable and accrued expenses and other current liabilities |
$ | — | $ | 756 | $ | — | $ | — | $ | — | $ | — | ||||||||||||
See the accompanying notes to the consolidated financial statements.
74
Table of Contents
HORTONWORKS, INC.
Notes to Consolidated Financial Statements
1. ORGANIZATION AND DESCRIPTION OF BUSINESS
Hortonworks, Inc. (the “Company”) was incorporated in Delaware in 2011 and is the leader in accelerating business transformations with Open Enterprise Hadoop by developing, distributing and supporting an enterprise-scale data platform built entirely on open source technology including Apache™ Hadoop®. The Company’s mission is to enable transformational business outcomes powered by a modern data architecture with Open Enterprise Hadoop at its foundation. The Company’s Open Enterprise Hadoop solutions include the Hortonworks Data Platform (“HDP”™), powered by Apache Hadoop, and the Hortonworks DataFlow Platform (“HDF”™), powered by Apache NiFi. HDP is an enterprise-scale data management platform that enables a centralized architecture for running batch, interactive and real-time applications simultaneously across shared datasets with the comprehensive security, governance and operational services enterprises require. HDF is complementary to HDP and accelerates the flow of Data in Motion from any data type into HDP for full fidelity analytics.
The Company is focused on the development, distribution and support of the Hadoop open source project and associated projects from the Apache Software Foundation (“Apache Hadoop” or “Hadoop”). Hadoop was originally developed in the early 2000s, when Yahoo! Inc. (“Yahoo!”), by partnering with the Apache Hadoop community, led major innovations in the technology to help tackle big data challenges and operate its business at scale. Hadoop and its associated projects are managed as open source software projects by the Apache Software Foundation.
Due to the increase in the volume and the variety of data, including new Internet of Things data types such as machine data, server log data, geo-location data, clickstream data, sentiment data and other data generated by documents and other file types, the Company’s solutions (HDP and HDF) have emerged as critical enablers for the modern data center architecture. The Company’s software development efforts are thus focused on creating open platforms by working in concert with the Apache community to develop HDP and HDF.
In December 2014, the Company completed its initial public offering and concurrent private placement (collectively, the “IPO”) of 7,673,986 shares of common stock (inclusive of 486,486 shares in a concurrent private placement and 937,500 shares of common stock from the full exercise of the option to purchase additional shares granted to the underwriters) at a price of $16.00 per share. The Company received net cash proceeds of $109.6 million from the sale of shares of common stock. Immediately prior to the closing of the IPO, all shares of the Company’s outstanding convertible preferred stock automatically converted into 21,949,525 shares of common stock.
2. SUMMARY OF SIGNIFICANT ACCOUNTING POLICIES
Basis of Presentation and Consolidation
The consolidated financial statements have been prepared in accordance with generally accepted accounting principles (“GAAP”) in the United States and include the accounts of the Company and its wholly owned subsidiaries. All intercompany transactions and balances have been eliminated in consolidation.
Change of Fiscal Year End
The Company changed its fiscal year end from April 30 to December 31. Unless otherwise noted, all references to “years” in this report refer to the twelve-month fiscal year, which prior to May 1, 2013 ended on April 30, and beginning with January 1, 2014 ends on December 31 of each year. These financial statements include the audited transition period of May 1, 2013 through December 31, 2013. The consolidated statement of operations, consolidated statement of comprehensive loss and consolidated statement of cash flows for the eight months ended December 31, 2012 has been presented for comparative purposes and are unaudited.
75
Table of Contents
HORTONWORKS, INC.
Notes to Consolidated Financial Statements
Out-of-Period Adjustment
During the year ended December 31, 2015, the Company recorded an out-of-period adjustment related to acquisition retention bonuses from XA Secure. The adjustment related to bonuses earned in the three quarters ended December 31, 2014 and increased total expense in the first quarter of 2015 by $3.1 million. The Company evaluated the adjustment considering both quantitative and qualitative factors and concluded the adjustment was not material to previously issued and current period financial statements.
Use of Estimates
The preparation of consolidated financial statements in conformity with United States GAAP requires management to make estimates and assumptions that affect the reported amounts of assets, liabilities, revenues, and expenses and the related disclosure of contingent assets and liabilities at the date of the consolidated financial statements, and the reported amounts of expenses during the reporting period. The Company bases its estimates and judgments on its historical experience, knowledge of current conditions, and its beliefs on what could occur in the future given available information. Estimates, assumptions and judgments are used for, but are not limited to, revenue recognition, stock-based awards and warrants, accounting for income taxes, allowance for doubtful accounts and certain accrued liabilities.
Concentration of Risk
Credit Risk
Financial instruments, which potentially subject the Company to concentration of credit risk, consist primarily of cash and cash equivalents and investments. The Company places its cash and cash equivalents with major financial institutions, which management assesses to be of high-credit quality.
The Company’s investment policies limit investments to those that are investment grade, liquid securities, and restricts placement of these investments to issuers evaluated as creditworthy.
Concentration of Revenue and Accounts Receivable
The Company generally does not require collateral or other security in support of accounts receivable. Allowances are provided for individual accounts receivable when the Company becomes aware of a customer’s inability to meet its financial obligations, such as in the case of bankruptcy, deterioration in the customer’s operating results or change in financial position. If circumstances related to customers change, estimates of the recoverability of receivables would be further adjusted. The Company also considers broad factors in evaluating the sufficiency of its allowances for doubtful accounts, including the length of time receivables are past due, significant one-time events, creditworthiness of customers and historical experience.
Significant customers are those which represent 10 percent or more of the Company’s total revenue or gross accounts receivable balance at for each respective consolidated statement of operation and consolidated balance sheet period. For the years ended December 31, 2015 and 2014, Microsoft, Inc. (“Microsoft”) accounted for less than 10 percent and approximately 22 percent of the Company’s total revenue, respectively. For the eight months ended December 31, 2013 and 2012 (unaudited), Microsoft accounted for approximately 38 percent and 58 percent of the Company’s total revenue, respectively. For the years ended April 30, 2013 and 2012, Microsoft accounted for 55 percent and 27 percent of the Company’s total revenue, respectively.
For the years ended December 31, 2015 and 2014, eight months ended December 31, 2013 and for the year ended April 30, 2013, Yahoo! accounted for less than 10 percent of the Company’s total revenue. For the eight months ended December 31, 2012 and year ended April 30, 2012, Yahoo! accounted for approximately
76
Table of Contents
HORTONWORKS, INC.
Notes to Consolidated Financial Statements
15 percent and 51 percent of the Company’s total revenue, respectively. There were no other significant customers that represent 10 percent or more of the Company’s total revenue for the periods presented.
As of both December 31, 2015 and 2014, there were no customers which represented 10 percent or more of the Company’s gross accounts receivable balance.
Cash and Cash Equivalents
Cash and cash equivalents consist of cash, money market funds, certificate of deposits and commercial paper with original maturities of three months or less at the time of purchase.
Operating cash deposits held with banks may exceed the amount of insurance provided on such deposits. Generally, these deposits may be redeemed upon demand and are maintained with financial institutions with reputable credit and therefore bear minimal credit risk. The Company seeks to mitigate its credit risk by spreading such risk across multiple counterparties and monitoring the risk profiles of these counterparties.
Investments
The Company classifies its debt securities as “trading,” “available-for-sale” or “held-to-maturity,” depending on management’s intent at the time of purchase. Unrealized losses on available-for-sale securities are charged against net earnings when a decline in fair value is determined to be other than temporary. The Company’s management reviews several factors to determine whether a loss is other than temporary, such as the length and extent of the fair value decline, the financial condition and near term prospects of the issuer, and for equity investments, the Company’s intent and ability to hold the security for a period of time sufficient to allow for any anticipated recovery in fair value. For debt securities, management also evaluates whether the Company has the intent to sell or will likely be required to sell before its anticipated recovery. Realized gains and losses are accounted for on the specific identification method.
Available-for-sale debt instruments with original maturities at the date of purchase greater than approximately three months and remaining maturities of less than one year are classified as short-term investments. Available-for-sale debt instruments with remaining maturities beyond one year are classified as long-term investments.
Fair Value Measurement
Fair value is defined as the price that would be received to sell an asset or paid to transfer a liability in the principal market (or most advantageous market, in the absence of a principal market) for the asset or liability in an orderly transaction between market participants at the measurement date. Further, entities are required to maximize the use of observable inputs and minimize the use of unobservable inputs in measuring fair value, and to utilize a three-level fair value hierarchy that prioritizes the inputs used to measure fair value. The three levels of inputs used to measure fair value are as follows:
Level 1—Quoted prices in active markets for identical assets or liabilities.
Level 2—Observable inputs other than quoted prices included within Level 1, including quoted prices for similar assets or liabilities in active markets; quoted prices for identical or similar assets or liabilities in markets that are not active; and inputs other than quoted prices that are observable or are derived principally from, or corroborated by, observable market data by correlation or other means.
77
Table of Contents
HORTONWORKS, INC.
Notes to Consolidated Financial Statements
Level 3—Unobservable inputs that are supported by little or no market activity, are significant to the fair value of the assets or liabilities, and reflect the Company’s own assumptions about the assumptions market participants would use in pricing the asset or liability developed based on the best information available in the circumstances.
Restricted Cash
Restricted cash includes collateral used to secure a credit card, and may not be used or transferred until the restriction is released by the issuing bank. Restricted cash also includes deposits made on office space, and may be refundable in full or in part at the end of the respective lease terms.
Software Development Costs
The Company develops open source software that is generally freely available on the Apache Hadoop platform. Capitalization of software development costs begins upon the establishment of technological feasibility and ceases when the product is available for general release. There is usually no passage of time between the achievement of technological feasibility and the availability of the Company’s software for general release. Accordingly, there are no capitalized software development costs for the years ended December 31, 2015 and 2014, for the eight months ended December 31, 2013 and 2012 (unaudited) and for the years ended April 30, 2013 and 2012.
Internal Use Software
The Company’s capitalized internal use software costs were not material for the years ended December 31, 2015 and 2014, for the eight months ended December 31, 2013 and 2012 (unaudited) and for the years ended April 30, 2013 and 2012.
Property and Equipment
Property and equipment are stated at cost. Depreciation is computed using a straight-line method over the estimated useful lives, determined to be two years for purchased software, two to three years for computer equipment, and five years for network and communication equipment and furniture and fixtures. Expenditures for repairs and maintenance are charged to expenses as incurred. Leasehold improvements and capital leases are amortized on a straight-line basis over the term of the lease, or the useful life of the assets, whichever is shorter.
Goodwill and Long-Lived Assets
Goodwill is tested for impairment on an annual basis and between annual tests if events or circumstances indicate that an impairment loss may have occurred. The test is based on a comparison of the reporting unit’s book value to its estimated fair market value. The annual impairment test is performed by the Company during the fourth quarter of each fiscal year using the opening balance sheet as of the first day of the fourth quarter, with any resulting impairment recorded in the fourth quarter of the fiscal year. During the year ended December 31, 2015, the Company determined that the fair value of its sole reporting unit exceeded its carrying value, and as a result, no goodwill impairment was recorded in fiscal 2015.
Long-lived assets are reviewed for impairment whenever events or changes in circumstances indicate that the carrying amount of such assets may not be recoverable. In such instances, the recoverability of assets to be held and used is measured first by a comparison of the carrying amount of an asset group to future undiscounted net cash flows expected to be generated by the asset. If such assets are considered to be impaired, an impairment
78
Table of Contents
HORTONWORKS, INC.
Notes to Consolidated Financial Statements
loss would be recognized if the carrying amount of the asset exceeds the fair value of the asset. To date, the Company believes that no such impairment has occurred.
Common Stock Warrant Liability
Warrants for common stock that did not meet the requirements for equity classification because the number of shares were variable based on future issuances of Series D preferred shares or warrants were previously classified as liabilities on the accompanying balance sheets and carried at their estimated fair value. At the end of each reporting period, any changes in fair value were recorded as a component of other expense until the consummation of the Company’s initial public offering in December 2014. Upon the consummation of the initial public offering, the warrants were reclassified to additional paid-in capital within stockholders’ equity, as the requirements for equity classification were met.
Revenue Recognition
Apache Hadoop is a freely available open source based software platform. While it has emerged as an enabling technology for the modern data center architecture, there are limitations related to the traditional Hadoop offering that may inhibit broad adoption by enterprises. The Company’s software development efforts are thus focused on creating an enterprise-grade Hadoop platform by working in concert with the Apache community to develop HDP and HDF.
HDP and HDF are available under an Apache open source license. Open source software is an alternative to proprietary software and represents a different model for the development and licensing of commercial software code than that typically used for proprietary software. Because open source software code is generally freely shared, the Company does not typically generate any direct revenue from its software development activities.
The Company generates the predominant amount of its revenue through support (support subscription) and consulting and training services (professional services) arrangements with its enterprise customers. The Company provides telephone support, security updates, bug fixes, functionality enhancements and upgrades to the technology and new versions of the software, if and when available. The Company’s professional services provide assistance in the implementation process and training related activities.
Under the Company’s support subscription and professional services arrangements, revenue is recognized when (i) persuasive evidence of an arrangement exists; (ii) the services have been delivered; (iii) the arrangement fee is fixed or determinable; and (iv) collectability is probable.
Support Subscription Revenue
In single-element arrangements, support subscription fees are recognized on a ratable basis over the support subscription term. The Company’s support subscription arrangements do not contain refund provisions for fees earned related to support services performed.
Professional Services Revenue
Professional services revenue is derived from customer fees for consulting services engagements and training services. The Company’s consulting services are provided primarily on a time and materials basis and, to a lesser extent, a fixed fee basis, and training services are priced based on attendance. Revenue from professional services, when such services are sold in single-element arrangements, is recognized as the services are performed.
79
Table of Contents
HORTONWORKS, INC.
Notes to Consolidated Financial Statements
Multiple-Element Arrangements
The Company’s multiple-element arrangements generally include support subscription combined with professional services. The Company has not yet established vendor-specific objective evidence of fair value (“VSOE”) for support subscriptions, and the Company recognizes revenue on a ratable basis over the period beginning when both the support subscription and professional services have commenced, and ending at the conclusion of the support subscription or professional services period, whichever is longer. Under the Company’s multiple element arrangements, the support subscription element generally has the longest service period and the professional services element is performed during the earlier part of the support subscription period. On occasion, the Company may sell engineering services and/or a premium subscription agreement that provides a customer with development input and the opportunity to work more closely with its developers.
The Company’s agreements with customers often include multiple support subscription and/or professional service elements, and these elements are sometimes included in separate contracts. The Company considers an entire customer arrangement to determine if separate contracts should be considered linked arrangements for the purposes of revenue recognition.
Revenue recognition requires judgment, including whether a software arrangement includes multiple elements, and if so, whether VSOE exists for those elements. A portion of revenue may be recorded as unearned due to undelivered elements. Changes to the elements in a software arrangement, the ability to identify the VSOE for those elements and the fair value of the respective elements could materially impact the amount of earned and unearned revenue in a given period.
Revenue from Strategic Relationships and Reseller Arrangements
The Company has strategic relationships and reseller arrangements with third parties (collectively “Partners”). Under these arrangements, the Company is not the primary obligor for what is ultimately sold by the Partners to their end customers. The amount recognized as revenue from sales to end users represents the amount due to the Company from the Partners and is generally recognized on a ratable basis over the applicable services term.
Equity Instruments Issued to Customers
The Company has entered into warrant and share purchase agreements with certain customers. For such arrangements, the fair value of the underlying securities is recognized as contra-revenue to the extent cumulative revenue from the customer is available to offset the fair value of the security on the measurement date. If cumulative revenue from the customer is less than the fair value of the security, the excess is recorded as cost of sales. See additional discussion at Notes 9 and 15.
Deferred Revenue
Deferred revenue consists of amounts billed to customers but not yet recognized in revenue.
As of December 31, 2015 and 2014, most of the Company’s accounts receivable represents amounts billed to customers but not yet received or recognized as revenue and are thus recorded as deferred revenue.
Accounts Receivable and Allowance for Doubtful Accounts
Accounts receivable are recorded at the invoiced amount, net of allowances for doubtful accounts. The allowance for doubtful accounts is based on the assessment of the collectability of accounts. The Company
80
Table of Contents
HORTONWORKS, INC.
Notes to Consolidated Financial Statements
regularly reviews the adequacy of the allowance for doubtful accounts by considering the age of each outstanding invoice and the collection history of each customer to determine whether a specific allowance is appropriate. Accounts receivable deemed uncollectable are charged against the allowance for doubtful accounts when identified. For all periods presented, the allowance for doubtful accounts activity was not significant.
Cost of Revenue
Cost of support subscription revenue consists primarily of personnel costs (including salaries, benefits and stock-based compensation expense) for employees, including support engineers, associated with the Company’s support subscription offerings mainly related to technology support and allocated shared costs. Cost of professional services revenue consists primarily of personnel costs (including salaries, benefits and stock-based compensation expense) for employees and fees to subcontractors associated with the Company’s professional service contracts, travel costs and allocated shared costs. Cost of revenue for support subscription and professional services is expensed as incurred.
The Company allocates shared costs such as rent, information technology and employee benefits to all departments based on headcount. As such, allocated shared costs are reflected in cost of revenue and each operating expense category. Additionally, during the year ended December 31, 2014, cost of support subscription and professional services revenue included expenses of $47.4 million and $0.6 million, respectively, related to the vesting of the 2011 Yahoo! Warrant upon the Company’s initial public offering.
Sales and Marketing Expenses
Sales and marketing expenses consist primarily of personnel costs (including salaries, benefits and stock-based compensation expense) for the Company’s sales and marketing employees. In addition, sales and marketing expense include the cost of advertising, online marketing, promotional events, corporate communications, product marketing, other brand-building activities, plus allocated shared costs. All costs of advertising, including cooperative marketing arrangements, are expensed as incurred. Advertising expense totaled, $11.1 million and $7.2 million for the years ended December 31, 2015 and 2014, respectively, $2.2 million and $1.1 million for the eight months ended December 31, 2013 and 2012 (unaudited), respectively, and $2.4 million and $0.7 million for the years ended April 30, 2013 and 2012, respectively.
Research and Development Expenses
Research and development expenses consist primarily of personnel costs (including salaries, benefits and stock-based compensation expense) for the Company’s research and development employees, costs associated with subcontractors and equipment lease expenses, plus allocated shared costs. The Company’s research and development expenses include costs for development related to the distribution of its solutions, including security updates, fixes, functionality enhancements, upgrades to the technology and new versions of the software, quality assurance personnel, technical documentation personnel and at times expenses related to engineering resources for its subscription and professional services offerings.
Stock-Based Compensation Expense
The Company recognizes compensation costs related to stock options granted to employees based on the estimated fair value of the awards on the date of grant, net of estimated forfeitures. The Company estimates the grant date fair value of option grants, and the resulting stock-based compensation expense, using the Black-Scholes option-pricing model. The grant date fair value of stock-based awards is recognized on a ratable basis over the requisite service period, which is the vesting period of the respective awards.
81
Table of Contents
HORTONWORKS, INC.
Notes to Consolidated Financial Statements
The Company accounts for stock options issued to non-employees based on the fair value of the awards determined using the Black-Scholes option-pricing model. The fair value of stock options granted to non-employees are remeasured each period as the stock options vest, and the resulting change in value, if any, is recognized in the consolidated statements of operations during the period the related services are performed.
Income Taxes
The Company accounts for income taxes using an asset and liability approach. Deferred income tax assets and liabilities are computed for differences between the financial statement and income tax basis of assets and liabilities that will result in taxable or deductible amounts in the future. Such deferred income tax asset and liability computations are based on enacted tax laws and rates applicable to periods in which the differences are expected to affect taxable income. A valuation allowance is established, when necessary, for any portion of deferred income tax assets where it is considered more likely than not that it will not be realized.
The tax effects of the Company’s income tax positions are recognized only if determined “more likely than not” to be sustained based solely on the technical merits as of the reporting date. The Company considers many factors when evaluating and estimating its tax positions and tax benefits, which may require periodic adjustments and which may not accurately anticipate actual outcomes.
Foreign Currency Translation
The impact of changes in foreign currency exchange rates resulting from the translation of foreign currency financial statements into United States dollars for financial reporting purposes is included in other comprehensive loss. Assets and liabilities are translated into United States dollars at exchange rates in effect at the balance sheet date. Income and expense items are translated at average rates for the period.
Foreign transaction gains and losses are recorded as they are realized, and such amounts have historically been insignificant.
Net Loss Per Share of Common Stock
Basic net loss per share of common stock is calculated by dividing the net loss by the weighted-average number of common shares outstanding during the period, less restricted common stock and common stock issued that is subject to repurchase, and excludes any dilutive effects of share-based awards. Diluted net loss per share of common stock is the same as basic net loss per share of common stock, because the effects of potentially dilutive securities are antidilutive.
Recently Issued Accounting Pronouncements
In May 2014, the Financial Accounting Standards Board (“FASB”), issued Accounting Standards Update (“ASU”) No. 2014-09, Revenue from Contracts with Customers (Topic 606), which requires an entity to recognize the amount of revenue to which it expects to be entitled for the transfer of promised goods or services to customers. The ASU will replace most existing revenue recognition guidance in United States GAAP when it becomes effective. In August 2015, the FASB issued ASU No. 2015-14, Revenue from Contracts with Customers (Topic 606): Deferral of Effective Date, which defers the effective date of ASU 2014-09 by one year allowing early adoption as of the original effective date January 1, 2017. The deferral results in the new revenue standard being effective for the Company January 1, 2018. The standard permits the use of either the retrospective or cumulative effect transition method. The Company is evaluating the effect that ASU 2014-09 will have on its
82
Table of Contents
HORTONWORKS, INC.
Notes to Consolidated Financial Statements
consolidated financial statements and related disclosures. The Company has not yet selected a transition method nor has it determined the effect of the standard on its ongoing financial reporting.
In November 2015, FASB issued ASU No. 2015-17 (Topic 740), Balance Sheet Classification of Deferred Taxes. ASU 2015-17 requires deferred tax liabilities and assets to be classified as noncurrent in the consolidated balance sheet. The standard will be effective for financial statements issued for annual periods beginning after December 15, 2016, and interim periods within those annual periods. Early adoption is permitted for financial statements that have not been previously issued. The ASU may be applied either prospectively to all deferred tax liabilities and assets or retrospectively to all periods presented. The Company early adopted this ASU on a prospective basis in the fourth quarter of fiscal 2015 and the adoption of this ASU does not have an impact on the Company’s consolidated financial statements and related disclosures.
In February 2016, the FASB issued ASU 2016-02, Leases which, for operating leases, requires a lessee to recognize a right-of-use asset and a lease liability, initially measured at the present value of the lease payments, in its balance sheet. The standard also requires a lessee to recognize a single lease cost, calculated so that the cost of the lease is allocated over the lease term, on a generally straight-line basis. The ASU is effective for public companies for fiscal years beginning after December 15, 2018, including interim periods within those fiscal years. Early adoption is permitted. The Company is currently evaluating the effect that the adoption of ASU 2016-02 will have on its consolidated financial statements.
3. FAIR VALUE MEASUREMENTS
The following table summarizes the investments in available-for-sale securities (in thousands):
| December 31, 2015 | ||||||||||||||||
| Gross Amortized Costs |
Gross Unrealized Gains |
Gross Unrealized Losses |
Estimated Fair Value |
|||||||||||||
| United States Treasury bills |
$ | 3,493 | $ | 6 | $ | — | $ | 3,499 | ||||||||
| United States government securities |
2,071 | — | (2 | ) | 2,069 | |||||||||||
| Certificates of deposit |
4,172 | — | (1 | ) | 4,171 | |||||||||||
| Commercial paper |
10,727 | 2 | (5 | ) | 10,724 | |||||||||||
| Corporate notes and bonds |
40,397 | — | (62 | ) | 40,335 | |||||||||||
|
|
|
|
|
|
|
|
|
|||||||||
| Total investments in available-for-sale securities |
$ | 60,860 | $ | 8 | $ | (70 | ) | $ | 60,798 | |||||||
|
|
|
|
|
|
|
|
|
|||||||||
| December 31, 2014 | ||||||||||||||||
| Gross Amortized Costs |
Gross Unrealized Gains |
Gross Unrealized Losses |
Estimated Fair Value |
|||||||||||||
| Commercial paper |
$ | 5,298 | $ | — | $ | — | $ | 5,298 | ||||||||
| Corporate bonds |
70,146 | 1 | (64 | ) | 70,083 | |||||||||||
|
|
|
|
|
|
|
|
|
|||||||||
| Total investments in available-for-sale securities |
$ | 75,444 | $ | 1 | $ | (64 | ) | $ | 75,381 | |||||||
|
|
|
|
|
|
|
|
|
|||||||||
83
Table of Contents
HORTONWORKS, INC.
Notes to Consolidated Financial Statements
The following table sets forth the fair value of the Company’s financial assets and liabilities measured on a recurring basis by level within the fair value hierarchy (in thousands):
| December 31, 2015 | ||||||||||||||||
| Level 1 | Level 2 | Level 3 | Total | |||||||||||||
| Assets |
||||||||||||||||
| Cash equivalents: |
||||||||||||||||
| Money market funds |
$ | 11,923 | $ | — | $ | — | $ | 11,923 | ||||||||
| Certificates of deposit |
— | 245 | — | 245 | ||||||||||||
| Commercial paper |
— | 2,000 | — | 2,000 | ||||||||||||
| Short-term investments: |
||||||||||||||||
| United States Treasury bills |
3,499 | — | — | 3,499 | ||||||||||||
| United States government securities |
— | 2,069 | — | 2,069 | ||||||||||||
| Certificates of deposit |
— | 3,926 | — | 3,926 | ||||||||||||
| Commercial paper |
— | 8,724 | — | 8,724 | ||||||||||||
| Corporate notes and bonds |
— | 40,335 | — | 40,335 | ||||||||||||
|
|
|
|
|
|
|
|
|
|||||||||
| Total financial assets |
$ | 15,422 | $ | 57,299 | $ | — | $ | 72,721 | ||||||||
|
|
|
|
|
|
|
|
|
|||||||||
| Liabilities |
||||||||||||||||
| Contingent consideration (Note 4) |
— | — | 1,651 | 1,651 | ||||||||||||
|
|
|
|
|
|
|
|
|
|||||||||
| Total financial liabilities |
$ | — | $ | — | $ | 1,651 | $ | 1,651 | ||||||||
|
|
|
|
|
|
|
|
|
|||||||||
| December 31, 2014 | ||||||||||||
| Level 1 | Level 2 | Total | ||||||||||
| Assets |
||||||||||||
| Cash and cash equivalents: |
||||||||||||
| Money market funds |
$ | 119,723 | $ | — | $ | 119,723 | ||||||
| Short-term investments: |
||||||||||||
| Commercial paper |
— | 5,298 | 5,298 | |||||||||
| Corporate bonds |
— | 70,083 | 70,083 | |||||||||
|
|
|
|
|
|
|
|||||||
| Total financial assets |
$ | 119,723 | $ | 75,381 | $ | 195,104 | ||||||
|
|
|
|
|
|
|
|||||||
Where applicable, the Company uses quoted market prices in active markets for identical assets to determine fair value. This pricing methodology applies to Level 1 investments, which are composed of money market funds and United States Treasury bills. If quoted prices in active markets for identical assets are not available, then the Company uses quoted prices for similar assets or inputs other than quoted prices that are observable, either directly or indirectly. These investments are included in Level 2 and consist of commercial paper, certificates of deposit, corporate notes and bonds, United States government securities and the promissory note receivable. Commercial paper is valued using market prices, if available, adjusting for accretion of the purchase price to face value at maturity.
The Company entered into a three-year, $2.5 million promissory note receivable with a third-party service provider in February 2015, which bears interest at 4 percent per annum. The promissory note receivable is valued on a non-recurring basis using observable inputs and is classified as held-to-maturity within long-term investments. The carrying amounts of accounts receivable, prepaid expenses, the promissory note receivable, accounts payable, accrued expenses and other current liabilities and accrued compensation and benefits approximate fair value.
84
Table of Contents
HORTONWORKS, INC.
Notes to Consolidated Financial Statements
In certain cases where there is limited activity or less transparency around inputs to valuation, securities are classified as Level 3 within the valuation hierarchy. Level 3 liabilities that were measured at estimated fair value on a recurring basis consisted of the contingent consideration in connection with the Company’s acquisition of SequenceIQ, kft (“SequenceIQ”) which is contingent upon the achievement of certain product milestones (see Note 4) and common stock warrant liability (see Note 9).
The Company estimated the acquisition date fair value of the contingent consideration payable of $1.6 million based on various estimates including a discount rate based on the estimated timing of achievement of product milestones, the probability of achievement and other risk factors, all of which the Company believes are appropriate and representative of market participant assumptions. As of December 31, 2015, the fair value of the contingent consideration liability was $1.7 million. The contingent consideration liability is recognized on the Company’s consolidated balance sheet within accrued expenses and other current liabilities.
The estimated fair value of the common stock warrant liability was measured using a probability weighted expected return model. Inputs used to determine estimated fair value include the estimated fair value of the underlying common stock at the measurement date, the probability and timing of various liquidity events, the exercise price per share, risk-free interest rates and expected volatility of the price of the underlying common stock.
The following table provides a summary of changes in the estimated fair value of the Company’s liabilities measured at estimated fair value using significant Level 3 inputs for the year ended December 31, 2014 (in thousands):
| Common Stock Warrant Liability |
||||
| Initial measurement on June 9, 2014 |
$ | 4,809 | ||
| Increase in fair value upon re-measurement |
582 | |||
| Reclassification to additional paid-in capital upon the initial public offering |
(5,391 | ) | ||
|
|
|
|||
| Balance at December 31, 2014 |
$ | — | ||
|
|
|
|||
The above represents a warrant to purchase 476,368 of the Company’s common stock as of December 31, 2014 (see Note 9).
A financial instrument’s categorization within the valuation hierarchy is based upon the lowest level of input that is significant to the fair value measurement. The Company’s assessment of the significance of a particular input to the fair value measurement in its entirety requires management to make judgments and consider factors specific to the asset or liability. During the years ended December 31, 2015 and 2014, the eight months ended December 31, 2013 and 2012 (unaudited), and the years ended April 30, 2013 and 2012, the Company did not make any transfers between Level 1, Level 2, or Level 3 investments. As of December 31, 2014, the Company did not have any Level 3 financial assets or liabilities.
Gross unrealized gains and losses were not material as of December 31, 2015 and 2014. Realized gains and losses were not material for years ended December 31, 2015 and 2014. There were no realized gains and losses for the eight months ended December 31, 2013 and 2012 (unaudited), and the years ended April 30, 2013 and 2012. As of December 31, 2015 and 2014, there were no securities that were in an unrealized loss position for more than 12 months.
85
Table of Contents
HORTONWORKS, INC.
Notes to Consolidated Financial Statements
4. BUSINESS COMBINATIONS
Transactions Completed in 2015
Onyara, Inc. On August 31, 2015, the Company acquired Onyara, Inc. (“Onyara”), the creator of and key contributor to Apache NiFi. The acquisition enables customers to automate and secure data flows and to collect, conduct and curate real-time business insights and actions derived from Data in Motion. As a result of the acquisition, the Company introduced HDF powered by Apache NiFi. This is intended to simplify and accelerate the flow of Data in Motion into HDP for full fidelity analytics.
The acquisition date fair value of the purchase consideration was $26.5 million, which included the following (in thousands):
| Common stock (921,643 shares at fair value of $23.76 per share) |
$ | 21,898 | ||
| Holdback of 194,259 shares of common stock for a period of 12 months for general representations and warranties |
4,616 | |||
|
|
|
|||
| Total |
$ | 26,514 | ||
|
|
|
The total purchase consideration of $26.5 million exceeded the estimated fair value of the net tangible and identifiable intangible assets and liabilities acquired. Prior to the acquisition, Apache NiFi was open sourced in November 2014 as part of the National Security Agency Technology Transfer Program. As a result, no technology was acquired and the Company recorded goodwill of $26.4 million in connection with this transaction. The goodwill is attributable to the synergies expected from combining Onyara’s operations with the Company’s operations. The goodwill is not expected to be deductible for tax purposes.
Under the terms of the agreement, all outstanding shares of Onyara’s capital stock, options to purchase Onyara capital stock and any other securities convertible into, exercisable for or exchangeable for shares of Onyara capital were cancelled in exchange for an aggregate of approximately 1.6 million shares of the Company’s common stock with a fair value of approximately $38.5 million. Of these shares, 1.1 million shares with a fair value of approximately $26.5 million were allocated to purchase consideration. The remaining 0.5 million shares with a fair value of approximately $12.0 million were considered post-combination remuneration which will be recorded as stock-based compensation expense over the vesting period of up to three years. The vesting of these restricted stock units is contingent upon continued employment. The related acquisition costs, consisting primarily of legal expenses in the amount of $0.4 million during the year ended December 31, 2015, were expensed as incurred.
The following table summarizes the allocation of the consideration paid of approximately $26.5 million to the fair values of the assets acquired and liabilities assumed at the acquisition date (in thousands):
| Goodwill |
$ | 26,429 | ||
| Cash |
180 | |||
| Tangible liabilities acquired |
(95 | ) | ||
|
|
|
|||
| Total |
$ | 26,514 | ||
|
|
|
In connection with the acquisition, the Company also issued 0.2 million restricted stock units with a fair value of approximately $5.2 million, which is being recognized as stock-based compensation expense as the restricted stock units vest over three years. The vesting of these restricted stock units is contingent upon
86
Table of Contents
HORTONWORKS, INC.
Notes to Consolidated Financial Statements
continued employment. As such, the Company will account for such payments as post-combination remuneration, to be recognized in operating expenses in the statement of operations as the services are performed.
SequenceIQ. On April 23, 2015, the Company acquired 100 percent of the voting shares of SequenceIQ, an open source provider of rapid deployment tools for Hadoop, to deliver a consistent and automated solution for launching on-demand Hadoop clusters in the cloud or to any environment that supports Docker containers. This acquisition complements the Company’s strategy of providing enterprise customers the broadest choice of consumption options for the Hortonworks Data Platform, from on-premises deployments to cloud architectures.
The acquisition of SequenceIQ was accounted for as the purchase of a business. The related acquisition costs, consisting primarily of consulting and legal expenses were not material during the year ended December 31, 2015 and were expensed as incurred.
The acquisition date fair value of the purchase consideration was $10.0 million, which included the following (in thousands):
| Cash |
$ | 3,721 | ||
| Cash holdback for a period of 15 months for general representations and warranties |
1,875 | |||
| Cash payable upon 18-month anniversary of closing date |
1,651 | |||
| Contingent consideration (Note 3) |
1,625 | |||
| Vested restricted stock units (49,102 shares at fair value of $21.97 per share) |
1,079 | |||
|
|
|
|||
| Total |
$ | 9,951 | ||
|
|
|
For further details on the Company’s fair value methodology with respect to the contingent consideration liability, see Note 3—“Fair Value Measurements.”
The Company also issued 114,583 restricted stock units to the selling shareholders that vest over a period of up to three years. The vesting of the additional restricted stock units is contingent upon the continued employment of the selling shareholders that were retained as employees. As such, the Company accounted for such payments as post-combination remuneration, to be recognized in operating expenses in the statement of operations as the services are performed.
The acquisition of SequenceIQ provided the Company with developed technology. The Company determined that the fair value of the developed technology was approximately $4.4 million using the cost approach. The cost approach reflects the amount that would be required currently (at the acquisition date) to replace the service capacity of an asset. The assumptions underlying the fair value calculation include: the labor required using a burdened overhead rate, the development period, a developer’s profit based on the operating profitability of market participants and the opportunity cost based on the estimated required return on investment over the development period using venture capital rates of return and private capital rates of return for enterprises at a similar stage of development as SequenceIQ. A deferred tax liability related to the fair value of the developed technology obtained in the acquisition was also recognized. The Company recognized goodwill of $5.8 million equal to the excess of the purchase consideration over the fair value of the assets acquired and the liabilities assumed inclusive of approximately $0.4 million related to a deferred tax liability recognized in the acquisition. The goodwill is attributable to the synergies expected from combining SequenceIQ’s operations with the Company’s operations. None of the goodwill is expected to be deductible for tax purposes.
87
Table of Contents
HORTONWORKS, INC.
Notes to Consolidated Financial Statements
The following table summarizes the allocation of the consideration paid of approximately $10.0 million to the fair values of the assets acquired and liabilities assumed at the acquisition date (in thousands):
| Tangible assets acquired, net |
$ | 191 | ||
| Developed technology |
4,395 | |||
| Goodwill |
5,785 | |||
| Deferred tax liabilities, net |
(420 | ) | ||
|
|
|
|||
| Total |
$ | 9,951 | ||
|
|
|
Intangible Assets
Intangible assets acquired in connection with the acquisition of SequenceIQ were comprised entirely of developed technology of $4.4 million. Amortization expense of the developed technology for the year ended December 31, 2015 was $0.4 million. The amortizable intangible assets have a useful life of five years. Upon contributing the developed technology to the Apache Software Foundation, an operating expense equal to the carrying value of the developed technology will be recognized within the consolidated statement of operations.
Transaction Completed in 2014
XA Secure. On May 13, 2014, the Company acquired 100 percent of the voting shares of XA Secure, a developer of data security solutions across a number of information technology platforms, for approximately $4.8 million, consisting of approximately $3.0 million in cash and the issuance of 132,508 shares of the Company’s common stock with a fair value of $13.70 per share on the acquisition date. The Company integrated the core security capabilities acquired across all Hadoop workloads. The acquisition of XA Secure was accounted for as the purchase of a business. The related acquisition costs, consisting primarily of legal expenses in the amount of $0.2 million during the year ended December 31, 2014, were expensed. These legal expenses were presented as general and administrative expenses on the consolidated statements of operations for the year ended December 31, 2014.
The acquisition of XA Secure provided the Company with developed technology. The Company determined that the fair value of the developed technology was approximately $4.0 million. The fair value of the developed technology was determined using the cost approach. The cost approach reflects the amount that would be required currently (at the acquisition date) to replace the service capacity of an asset. The assumptions underlying the fair value calculation include: the labor required using a burdened overhead rate, the development period, a developer’s profit based on the operating profitability of market participants and the opportunity cost based on the estimated required return on investment over the development period using venture capital rates of return and private capital rates of return for enterprises at a similar stage of development as XA Secure. A deferred tax liability related to the fair value of the developed technology obtained in the acquisition was also recognized. Primarily as a result of the deferred tax liability recognized in the acquisition, the Company recognized goodwill of $2.1 million equal to the excess of the purchase consideration over the fair value of the assets acquired and the liabilities assumed. The goodwill is attributable to the synergies expected from combining XA Secure’s operations with the Company’s operations. None of the goodwill is expected to be deductible for tax purposes.
Concurrently with the recognition of the deferred tax liability related to the developed technology acquired, the Company released a portion of the valuation allowance on its deferred tax asset balance and recognized a $1.3 million benefit to income tax expense. The benefit for income taxes resulted from the additional source of income arising from the deferred tax liability recognized, which offset the Company’s deferred tax assets.
88
Table of Contents
HORTONWORKS, INC.
Notes to Consolidated Financial Statements
In connection with the acquisition of XA Secure, the Company also issued 132,506 shares of restricted stock, issued 159,483 options to purchase the Company’s common stock and agreed to pay a $3.9 million cash retention bonus payable over 18 months to certain key employee-shareholders of XA Secure. The restricted shares vest over 18 months and the options vest over 48 months. All vesting provisions for the stock and options, as well as the future cash payments, are contingent upon the continued service of the key employees. Thus, the Company accounts for such payments as post-combination remuneration, to be recognized in operating expenses in the consolidated statement of operations as the services are performed.
The following table summarizes the allocation of the consideration paid of approximately $4.8 million to the fair values of the assets acquired and liabilities assumed at the acquisition date (in thousands):
| Developed technology |
$ | 3,971 | ||
| Deferred tax liabilities |
(1,279 | ) | ||
| Goodwill |
2,119 | |||
|
|
|
|||
| Total |
$ | 4,811 | ||
|
|
|
Intangible Assets
Intangible assets acquired in connection with the acquisition of XA Secure were comprised entirely of developed technology of $4.0 million. On August 13, 2014, the Company contributed the developed technology acquired in the XA Secure acquisition to the Apache Software Foundation. Upon contribution, the Company recognized an operating expense of $4.0 million, which was equal to the carrying value of the developed technology.
The Company’s business combinations completed during the years ended December 31, 2015 and 2014 did not have a material impact on the Company’s consolidated financial statements and therefore actual and pro forma disclosures have not been presented.
5. PROPERTY AND EQUIPMENT, NET
Property and equipment, net, consisted of the following (in thousands):
| December 31, 2015 |
December 31, 2014 |
|||||||
| Computer equipment |
$ | 5,856 | $ | 4,601 | ||||
| Network and communication equipment |
2,663 | 1,643 | ||||||
| Purchased software |
593 | 787 | ||||||
| Furniture and fixtures |
3,362 | 1,908 | ||||||
| Capital lease |
476 | 476 | ||||||
| Leasehold improvements |
8,204 | 4,032 | ||||||
| Assets not yet in use |
553 | — | ||||||
|
|
|
|
|
|||||
| Property and equipment, gross |
21,707 | 13,447 | ||||||
| Less: accumulated depreciation |
(6,285 | ) | (2,265 | ) | ||||
|
|
|
|
|
|||||
| Total property and equipment, net |
$ | 15,422 | $ | 11,182 | ||||
|
|
|
|
|
|||||
89
Table of Contents
HORTONWORKS, INC.
Notes to Consolidated Financial Statements
Depreciation expense for the years ended December 31, 2015 and 2014 was $4.5 million and $1.2 million, respectively, for the eight months ended December 31, 2013 and 2012 (unaudited) was $0.5 million and $0.2 million, respectively, and for the years ended April 30, 2013 and 2012 was $0.4 million and $0.1 million, respectively.
6. GOODWILL
The changes in the carrying amount of goodwill for years ended December 31, 2015 and 2014 were as follows (in thousands):
| Net balance as of January 1, 2014 |
$ | — | ||
| Acquisition |
2,119 | |||
|
|
|
|||
| Net balance as of December 31, 2014 |
$ | 2,119 | ||
| Acquisitions |
32,214 | |||
|
|
|
|||
| Net balance as of December 31, 2015 |
$ | 34,333 | ||
|
|
|
7. COMMITMENTS AND CONTINGENCIES
The Company has a number of operating lease agreements primarily involving office space and data center equipment. These leases are non-cancelable with original lease periods up to 6 years, which expire between 2016 and 2021. Lease expense is recognized on a straight-line basis over the lease term. The Company subleases some excess capacity to a subtenant under a non-cancelable operating lease.
As of December 31, 2015, future minimum lease commitments under non-cancelable leases are as follows:
| Years Ending December 31, |
Leases | |||
| (In thousands) | ||||
| 2016 |
$ | 6,380 | ||
| 2017 |
6,403 | |||
| 2018 |
4,760 | |||
| 2019 |
1,508 | |||
| 2020 |
545 | |||
| Thereafter |
177 | |||
|
|
|
|||
| Gross lease payments |
19,773 | |||
| Less: non-cancelable subtenant receipts |
(2,650 | ) | ||
|
|
|
|||
| Net lease payments |
$ | 17,123 | ||
|
|
|
|||
Rent expense incurred under operating leases for the years ended December 31, 2015 and 2014 was $8.0 million and $4.6 million, respectively, for the eight months ended December 31, 2013 and 2012 (unaudited) was $1.5 million and $0.6 million, respectively, and for the years ended April 30, 2013 and 2012 was $1.1 million and $0.3 million, respectively.
Capital Leases
The Company entered into various capital lease agreements beginning in April 2014 to obtain network equipment. As of December 31, 2015 and December 31, 2014, capital lease obligations were $0.3 million and $0.4 million, respectively. The capital lease obligations bear interest at rates of approximately 4 percent per
90
Table of Contents
HORTONWORKS, INC.
Notes to Consolidated Financial Statements
annum. The original term of the capital leases is five years. The portion of the future payments designated as principal repayment was classified as a capital lease obligation on the consolidated balance sheets. The Company is obligated to make future payments under the capital lease as of December 31, 2015 of $0.1 million for 2016 and $0.1 million for 2017. Interest expense related to the capital lease was approximately $13,000 and $7,000 for the years ended December 31, 2015 and 2014, respectively.
Property and equipment under the capital lease was $0.5 million for both December 31, 2015 and 2014. Accumulated amortization on these assets was $0.1 million and approximately $34,000 as of December 31, 2015 and 2014, respectively.
Legal Proceedings
From time to time, the Company is party to various litigation and administrative proceedings relating to claims arising from its operations in the normal course of business. Based on the information presently available, including discussion with legal counsel, management believes that resolution of these matters will not have a material effect on the Company’s business, results of operations, financial condition or cash flows.
On February 29, 2016, the Company, Robert G. Bearden and Scott J. Davidson were sued in a putative class action lawsuit, captioned William Monachelli v. Hortonworks, Inc., et al., Case No. 3:16-cv-00980, filed in the United Stated District Court for the Northern District of California by a purported stockholder of the Company, in connection with the Company’s January 15, 2016 announcement of its follow-on offering. The Monachelli lawsuit alleges that the Company and Messrs. Bearden and Davidson violated federal securities laws by misrepresenting and/or omitting information pertaining to the Company’s capital requirements. The lawsuit seeks unspecified damages and attorneys’ fees and costs.
Although the ultimate outcome of litigation cannot be predicted with certainty, the Company believes that this lawsuit is without merit and intends to defend against the action vigorously. The Company believes that any liability resulting from the litigation will not have a material adverse effect on its business, financial condition or results of operations.
8. CONVERTIBLE PREFERRED STOCK AND COMMON STOCK
Convertible Preferred Stock
Upon the closing of the Company’s initial public offering, all shares of the Company’s then-outstanding convertible preferred stock, as shown on the table below, automatically converted on a one-for-two basis into an aggregate of 21,949,525 shares of common stock.
Convertible preferred stock immediately prior to the conversion into common stock consisted of the following:
| Convertible Preferred Stock: |
Shares Authorized |
Shares Issued and Outstanding |
Net Carrying Value |
Aggregate Liquidation Preference |
||||||||||||
| (In thousands, except share data) | ||||||||||||||||
| Series A |
24,530,024 | 18,030,024 | $ | 22,654 | $ | 23,000 | ||||||||||
| Series B |
6,852,784 | 6,852,784 | 30,600 | 30,838 | ||||||||||||
| Series C |
6,708,167 | 6,708,167 | 49,813 | 50,000 | ||||||||||||
| Series D |
12,308,100 | 12,308,100 | 149,547 | 150,000 | ||||||||||||
|
|
|
|
|
|
|
|
|
|||||||||
| Total convertible preferred stock |
50,399,075 | 43,899,075 | $ | 252,614 | $ | 253,838 | ||||||||||
|
|
|
|
|
|
|
|
|
|||||||||
91
Table of Contents
HORTONWORKS, INC.
Notes to Consolidated Financial Statements
Common Stock
Each share of common stock is entitled to one vote for matters to be voted on by the stockholders of the Company. The holders of common stock are also entitled to receive dividends whenever declared by the Board of Directors from legally available funds. The Company has not paid a dividend since its inception, and has no current plans to do so.
Common Stock Reserved for Issuance
The Company had reserved shares of common stock, on an as-if converted basis, for future issuance as follows:
| December 31, 2015 |
December 31, 2014 |
December 31, 2013 |
April 30, 2013 |
|||||||||||||
| Conversion of outstanding convertible preferred stock |
— | — | 15,795,480 | 12,441,401 | ||||||||||||
| Exercise and conversion of convertible preferred stock warrants (converted into common stock warrant upon initial public offering) |
3,250,000 | 3,250,000 | 3,250,000 | 3,250,000 | ||||||||||||
| Exercise and conversion of common stock warrants |
476,368 | 476,368 | — | — | ||||||||||||
| Restricted common stock issued, net of repurchases |
— | — | 8,042,221 | 10,792,221 | ||||||||||||
| Outstanding stock options |
11,552,487 | 13,953,894 | 7,702,273 | 5,512,005 | ||||||||||||
| Unvested restricted stock and restricted stock units |
6,642,601 | 1,623,222 | — | — | ||||||||||||
| Common stock subject to repurchase |
55,603 | 1,604,728 | 235,886 | 254,303 | ||||||||||||
| Shares reserved for future option grants |
2,006,015 | 6,518,632 | 96,928 | 138,555 | ||||||||||||
|
|
|
|
|
|
|
|
|
|||||||||
| Total |
23,983,074 | 27,426,844 | 35,122,788 | 32,388,485 | ||||||||||||
|
|
|
|
|
|
|
|
|
|||||||||
9. WARRANTS
In July 2011, the Company issued a warrant to purchase 6,500,000 shares of Series A preferred stock at an exercise price of $0.005 per share. The warrant was issued to Yahoo! in connection with the Company’s Series A financing and the transactions contemplated thereby, including commercial agreements with Yahoo! providing for support subscription offerings and certain rights to technology. The ability for Yahoo! to exercise the warrant was subject to the continuation of the commercial agreement for a period of two years, which has been satisfied. The warrant expires nine years from the date of issuance. Upon consummation of the Company’s initial public offering in December 2014, the warrant automatically converted into a warrant to purchase 3,250,000 shares of common stock. As the warrant was issued to a customer, upon the occurrence of the initial public offering, the vesting of the warrant resulted in an immediate $4.0 million reduction in revenue, which was the cumulative revenue from Yahoo!. The $48.0 million difference between the fair value of the warrant of $52.0 million and the reduction in revenue was recognized in cost of revenue during the fourth quarter of 2014. The $52.0 million fair value of the warrant was recognized in additional paid-in capital. Refer to Note 15 for additional information regarding related party transactions.
On June 9, 2014, the Company issued a warrant to purchase a number of shares of common stock up to 1 percent of the sum of (i) 45,585,496, plus (ii) the number of shares of Series D preferred stock or shares of such stock issuable upon exercise of warrants to purchase such stock (on an as converted to common stock basis) issued or issuable upon exercise of warrants to purchase Series D Preferred Stock that are sold, if any, by the Company during the period commencing on June 9, 2014 and ending immediately prior to the occurrence of a corporate event at an exercise price of $8.46 per share. The warrant was issued to Yahoo! in exchange for the amendment of the rights held by Yahoo! under Section 2.11 of the Investors’ Rights Agreement to approve an
92
Table of Contents
HORTONWORKS, INC.
Notes to Consolidated Financial Statements
acquisition of Hortonworks, which removed a competitor of Yahoo! from the list of companies over which Yahoo! has such blocking rights. The warrant expires nine years from the date of issuance. The warrant vested upon the consummation of the Company’s initial public offering in December 2014. The combined value of the initial measurement and the change in the fair value of this warrant of $5.4 million is recorded as other expense in the consolidated statement of operations for the year ended December 31, 2014. Upon the initial public offering, the common stock warrant liability was reclassified to additional paid-in capital at the then current fair value of $5.4 million (see discussion in Note 3). As of December 31, 2015, the warrant was exercisable into 476,368 shares of common stock.
As of December 31, 2015, neither warrant had been exercised into shares of common stock.
10. STOCK OPTION PLANS
2011 Stock Option and Grant Plan
In June 2011, the Company adopted the Hortonworks, Inc. 2011 Stock Option and Grant Plan (the “2011 Option Plan”). The 2011 Option Plan allows for grant of incentive stock options (“ISOs”), nonstatutory stock options (“NSOs”), restricted common stock and restricted stock units to employees, officers, directors and consultants of the Company. The exercise price of an option is determined by the Board of Directors when the option is granted, and may not be less than 100 percent of the fair market value of the shares on the date of grant, provided that the exercise price of ISOs granted to a 10 percent stockholder is not less than 110 percent of the fair market value of the shares on the date of grant. ISOs granted under the 2011 Option Plan generally vest 25 percent after the completion of 12 months of service and the balance in equal monthly installments over the next 36 months of service, and expire 10 years from the date of grant. ISOs granted to a 10 percent stockholder expire five years from the date of grant. NSOs vest according to the specific option agreement, and expire 10 years from the date of grant.
In December 2014, in connection with the closing of the Company’s initial public offering, the 2011 Option Plan was terminated and shares authorized for issuance under the 2011 Option Plan were cancelled (except for those shares reserved for issuance upon exercise of outstanding stock options). As of December 31, 2014, options to purchase 13,605,044 shares of common stock were outstanding under the 2011 Option Plan pursuant to their original terms and no shares were available for future grant.
2014 Stock Option and Incentive Plan
The Company’s 2014 Stock Option and Incentive Plan (the “2014 Option Plan”) was adopted by the Company’s Board of Directors in September 2014. The 2014 Option Plan was approved by the Company’s stockholders in November 2014 and became effective immediately prior to the closing of the Company’s initial public offering. All remaining shares available in the 2011 Option Plan rolled into the 2014 Option Plan following the consummation of the initial public offering. The 2014 Option Plan allows the compensation committee to make equity-based incentive awards to the Company’s officers, employees, directors and other key persons (including consultants).
The Company has initially reserved 6,000,000 shares of the Company’s common stock for the issuance of awards under the 2014 Option Plan, and has 923,732 shares of the Company’s common stock remaining available for issuance under the Company’s 2011 Option Plan. The 2014 Option Plan provides that the number of shares reserved and available for issuance under the plan will automatically increase each January 1, beginning on January 1, 2015, by 5 percent of the outstanding number of shares of the Company’s common stock on the immediately preceding December 31 or such lesser number of shares as determined by the Company’s
93
Table of Contents
HORTONWORKS, INC.
Notes to Consolidated Financial Statements
compensation committee. This number is subject to adjustment in the event of a stock split, stock dividend or other change in the Company’s capitalization. As of December 31, 2015, options to purchase and restricted stock units to convert to a total of 6,944,156 shares of common stock were outstanding under the 2014 Option Plan pursuant to their original terms.
On January 1, 2015, the shares reserved for issuance increased by 2,136,240, resulting in total shares reserved for issuance under the 2014 Option Plan of 9,059,972. As of December 31, 2015, 2,006,015 of such shares remained available for issuance.
A summary of activity under the stock option plans and related information are as follows:
| Options Outstanding | ||||||||||||||||
| Number of Shares Underlying Outstanding Options |
Weighted- Average Exercise Price Per Share |
Weighted- Average Remaining Contractual Life (Years) |
Aggregate Intrinsic Value |
|||||||||||||
| (In thousands) | ||||||||||||||||
| Outstanding—April 30, 2012 |
2,851,865 | $ | 0.44 | 9.61 | $ | 357 | ||||||||||
| Options granted (weighted average fair value of $0.62) |
3,468,050 | 0.42 | ||||||||||||||
| Options exercised |
(363,230 | ) | 0.34 | |||||||||||||
| Options cancelled/forfeited |
(444,680 | ) | 0.69 | |||||||||||||
|
|
|
|||||||||||||||
| Outstanding—April 30, 2013 |
5,512,005 | $ | 1.01 | 9.15 | $ | 4,474 | ||||||||||
| Options granted (weighted average fair value of $2.20) |
2,986,361 | 4.76 | ||||||||||||||
| Options exercised |
(404,431 | ) | 0.44 | |||||||||||||
| Options cancelled/forfeited |
(391,662 | ) | 1.75 | |||||||||||||
|
|
|
|||||||||||||||
| Outstanding—December 31, 2013 |
7,702,273 | $ | 2.46 | 8.95 | $ | 22,990 | ||||||||||
| Options granted (weighted average fair value of $14.31) |
7,604,284 | 12.95 | ||||||||||||||
| Options exercised |
(792,548 | ) | 3.25 | |||||||||||||
| Options cancelled/forfeited |
(560,115 | ) | 4.66 | |||||||||||||
|
|
|
|||||||||||||||
| Outstanding—December 31, 2014 |
13,953,894 | $ | 8.04 | 8.80 | $ | 264,531 | ||||||||||
|
|
|
|||||||||||||||
| Options granted (weighted average fair value of $23.17) |
899,212 | 23.17 | ||||||||||||||
| Options exercised |
(2,063,264 | ) | 3.21 | |||||||||||||
| Options cancelled/forfeited |
(1,237,355 | ) | 10.64 | |||||||||||||
|
|
|
|||||||||||||||
| Outstanding—December 31, 2015 |
11,552,487 | $ | 9.80 | 7.82 | $ | 140,873 | ||||||||||
|
|
|
|
|
|
|
|
|
|||||||||
| Vested and expected to vest—December 31, 2015 |
11,009,509 | $ | 9.60 | 7.79 | $ | 136,393 | ||||||||||
|
|
|
|
|
|
|
|
|
|||||||||
| Exercisable—December 31, 2015 |
4,945,923 | $ | 6.19 | 7.23 | $ | 77,718 | ||||||||||
|
|
|
|
|
|
|
|
|
|||||||||
Aggregate intrinsic value represents the difference between the exercise price of the options to purchase common stock and the fair value of the Company’s common stock. The aggregate intrinsic value of options exercised for the years ended December 31, 2015 and 2014 was $42.9 million and $10.0 million, respectively, for the eight months ended December 31, 2013 and 2012 (unaudited) was $1.5 million and $0.2 million, respectively, and for the years ended April 30, 2013 and 2012 was $0.4 million and $0.1 million, respectively.
94
Table of Contents
HORTONWORKS, INC.
Notes to Consolidated Financial Statements
Restricted Stock
A summary of information related to restricted stock for the year ended December 31, 2015 is presented below:
| Number of Shares Issued Under the Stock Option Plans |
Number of Shares Issued Outside the Stock Option Plans |
Weighted- Average Exercise Price Per Share |
Weighted Average Grant Date Fair Value Per Share(*) |
Aggregate Intrinsic Value |
||||||||||||||||
| (In thousands) | ||||||||||||||||||||
| Unvested balance—December 31, 2014 |
672,865 | 894,107 | $ | 0.62 | $ | 13.70 | $ | 39,607 | ||||||||||||
| Granted |
— | 1,424,946 | — | $ | 23.76 | |||||||||||||||
| Vested |
(526,897 | ) | (1,675,039 | ) | $ | 0.59 | $ | 22.50 | ||||||||||||
| Canceled/forfeited |
— | — | — | — | ||||||||||||||||
|
|
|
|
|
|||||||||||||||||
| Unvested balance—December 31, 2015 |
145,968 | 644,014 | $ | 0.67 | $ | 23.76 | $ | 4,551 | ||||||||||||
|
|
|
|
|
|||||||||||||||||
| (*) | The weighted-average grant-date fair value per share relates to 132,506 and 1,424,946 shares of restricted stock paid as part of the acquisitions of XA Secure and Onyara, respectively. As of December 31, 2015, 132,506 of the XA Secure and 921,643 of the Onyara shares were vested. See Note 4—“Business Combinations” for additional information regarding this transaction. |
As of December 31, 2015, there was $50.7 million of unrecognized stock-based compensation expense related to unvested stock options and restricted stock, which is expected to be recognized over a weighted-average period of 2.49 years. The fair value of the restricted stock vested during the years ended December 31, 2015 and 2014 was $11.9 million and $6.1 million, respectively, for the eight months ended December 31, 2013 and 2012 (unaudited) was $2.1 million and approximately $13,000, respectively, and for the years ended April 30, 2013 and 2012 was $0.3 million and nil, respectively.
Restricted Stock Units
A summary of information related to restricted stock units (“RSUs”) for the year ended December 31, 2015 is presented below:
| Number of Shares Issued Under the 2014 Option Plan |
Weighted Average Grant Date Fair Value Per Share |
|||||||
| Unvested balance—December 31, 2014 |
56,250 | $ | 16.00 | |||||
| Granted |
6,088,119 | 23.35 | ||||||
| Vested |
(105,352 | ) | 21.31 | |||||
| Canceled/forfeited |
(186,398 | ) | 14.77 | |||||
|
|
|
|||||||
| Unvested balance—December 31, 2015 |
5,852,619 | $ | 23.33 | |||||
|
|
|
|||||||
As of December 31, 2015, there was $107.0 million of unrecognized stock-based compensation expense related to RSUs, which is expected to be recognized over a weighted-average period of 2.13 years. The fair value of the RSUs vested during the year ended December 31, 2015 was $2.2 million. There were no RSUs vested for the year ended December 31, 2014, for the eight months ended December 31, 2013 and 2012 (unaudited) and for the years ended April 30, 2013 and 2012.
95
Table of Contents
HORTONWORKS, INC.
Notes to Consolidated Financial Statements
Determining Fair Value for Employee Grants
The Company estimated the fair value of stock options granted using the Black-Scholes option-pricing model with weighted-average assumptions as follows:
| Years Ended December 31, |
Eight Months Ended December 31, |
Years Ended April 30, |
||||||||||||||||||||||
| 2015 | 2014 | 2013 | 2012 | 2013 | 2012 | |||||||||||||||||||
| (Unaudited) | ||||||||||||||||||||||||
| Expected term (in years) |
6.00 | 5.77 | 5.70 | 5.62 | 5.93 | 5.01 | ||||||||||||||||||
| Risk-free interest rate |
1.59 | % | 1.52 | % | 1.40 | % | 1.33 | % | 0.89 | % | 1.19 | % | ||||||||||||
| Expected volatility |
44 | % | 46 | % | 47 | % | 48 | % | 47 | % | 46 | % | ||||||||||||
| Dividend rate |
— | % | — | % | — | % | — | % | — | % | — | % | ||||||||||||
The fair value of each grant of stock options was determined using the Black-Scholes option-pricing model and assumptions discussed below. Each of these inputs is subjective and generally requires significant judgment to determine.
Fair Value of Common Stock. Historically, for all periods prior to the Company’s initial public offering, the Company estimated the fair value of common stock. The fair value of the common stock underlying the stock-based awards was determined by the Company’s Board of Directors, which considered numerous objective and subjective factors to determine the fair value of common stock at each grant date. These factors included, but were not limited to: (i) contemporaneous valuations of common stock performed by third-party specialists; (ii) the lack of marketability of the Company’s common stock; (iii) developments in the business; (iv) the prices paid in recent transactions involving the Company’s equity securities; and (v) the likelihood of achieving a liquidity event, such as an initial public offering or a merger or acquisition, given prevailing market conditions.
Since the Company’s initial public offering, it has used the market closing price of its common stock as reported on the NASDAQ Global Select Market.
Expected Term. The Company estimates the expected term for stock options using the simplified method due to limited historical exercise activity for the Company. The simplified method calculates the expected term as the mid-point between the vesting date and the contractual expiration date of the award.
Expected Volatility. Due to the limited trading history of its common stock, the expected volatility was derived from the average historical stock volatilities of several unrelated public companies within the Company’s industry that it considers to be comparable to its business over a period equivalent to the expected term of the stock option grants.
Risk-Free Interest Rate. The risk-free interest rate is based on the United States Treasury yield curve in effect at the time of grant for the expected term of the stock-based award.
Dividend Rate. The expected dividend yield is zero, as the Company does not currently pay a dividend and does not expect to do so in the foreseeable future.
Forfeiture Rate. Forfeitures are estimated based on the Company’s analysis of historical stock option forfeitures. To the extent that the forfeiture rate is different than what the Company has estimated, the compensation cost associated with unrecognized stock compensation expense will be different from Company expectations.
96
Table of Contents
HORTONWORKS, INC.
Notes to Consolidated Financial Statements
Restricted Stock Purchase Agreements
The Company entered into restricted stock purchase agreements with certain founders and employees for the issuance of restricted common stock in exchange for services. Under the terms of the restricted stock purchase agreements, the Company has the right to repurchase any unvested shares at the original issue price (ranging from $0.18 per share to $4.76 per share) in the event of termination of service. These repurchase rights lapse over the vesting term, which varies by agreement.
The restricted stock was purchased in exchange for promissory notes (“Notes”) that, prior to repayment in October 2014, accrued interest at rates ranging from 0.89 to 2.89 percent annually, with interest payable annually. The principal, along with any unpaid accrued interest, was payable upon the earlier of certain corporate transactions including an initial public offering, the termination of services, or nine to ten years from the date of the promissory notes. The Company had recourse against the restricted stock issued along with the Notes and recourse of up to 80 percent of the principal amount, and up to the full amount of accrued interest, against the individual’s personal assets.
The Company accounted for the Notes as non-recourse in their entirety because the Notes are not aligned with a corresponding percentage of the underlying shares. Accordingly, the non-recourse notes received by the Company as consideration for the issuance of the restricted stock were considered as stock options for accounting purposes as the substance is similar to the grant of an option because the employee generally will relinquish the stock in lieu of repaying the Note. Nonrefundable principal payments were recorded as a credit to additional paid-in capital for the underlying shares that were vested as of the repayment date and as a repurchase liability for the underlying shares that were unvested as of the repayment date. Nonrefundable interest was recorded as interest income.
The number of shares of restricted stock outstanding subject to the Company’s right of repurchase at prices ranging from $0.18 to $1.28 per share for the year ended December 31, 2015 was 286,679. The liability for shares subject to repurchase as of December 31, 2015 was $0.2 million, which was included in accrued expenses and other current liabilities.
These restricted stock arrangements were accounted for similarly to stock options until the Notes were repaid. During the year ended December 31, 2015, there were no restricted shares repurchased. During the year ended December 31, 2014, 528,745 restricted shares were repurchased from ten stockholders. During the eight months ended December 31, 2013, 1,031,415 restricted shares were repurchased from one stockholder. During the year ended April 30, 2013, a total of 536,458 restricted shares were repurchased from two stockholders. Because the restricted shares were accounted for as options, the Notes were not recorded in the accompanying consolidated balance sheets, the shares were excluded in the totals for common stock outstanding as December 31, 2013 and April 30 2013, and compensation cost was recognized over the requisite service period with an offsetting credit to additional paid-in capital. In October 2014, all outstanding promissory notes were repaid in full and the restricted stock that had vested became shares of common stock.
97
Table of Contents
HORTONWORKS, INC.
Notes to Consolidated Financial Statements
The fair value of the options was determined based on the Black-Scholes option pricing model using the following assumptions:
| Years Ended December 31, |
Eight Months Ended December 31, |
Years Ended April 30, |
||||||||||||||||||||||
| 2015 | 2014 | 2013 | 2012 | 2013 | 2012 | |||||||||||||||||||
| (Unaudited) | ||||||||||||||||||||||||
| Expected term (in years) |
— | 5.00 | — | 5.59 | 5.63 | 5.37 | ||||||||||||||||||
| Risk-free interest rate |
— | % | 1.58 | % | — | % | 0.78 | % | 0.81 | % | 1.50 | % | ||||||||||||
| Expected volatility |
— | % | 40 | % | — | % | 46 | % | 46 | % | 48 | % | ||||||||||||
| Dividend rate |
— | % | — | % | — | % | — | % | — | % | — | % | ||||||||||||
Periodic principal payments were recorded as a credit to additional paid-in capital for the underlying shares that were vested as of the repayment date and as a repurchase liability for the underlying shares that are unvested as of the repayment date. The shares were recorded when they vested and when principal payments were received. The following table summarizes activity for the promissory notes and related restricted stock arrangements:
| Restricted Stock |
Promissory Notes |
Weighted Average Exercise Price |
Weighted-Average Remaining Contractual Life (Years) |
|||||||||||||
| (in thousands, except for share and per share amounts) |
||||||||||||||||
| Balance—April 30, 2012 |
9,466,459 | 2,245 | 0.24 | 9.33 | ||||||||||||
| Restricted shares and promissory note issued under the 2011 Option Plan |
1,325,762 | 1,698 | 1.28 | |||||||||||||
|
|
|
|
|
|||||||||||||
| Balance—April 30, 2013 |
10,792,221 | 3,943 | 0.37 | 8.46 | ||||||||||||
| Repurchased at original issue price |
(1,031,415 | ) | (186 | ) | 0.18 | |||||||||||
| Notes paid following vesting of shares |
(1,718,585 | ) | (309 | ) | 0.18 | |||||||||||
|
|
|
|
|
|||||||||||||
| Balance—December 31, 2013 |
8,042,221 | 3,448 | 0.43 | 8.56 | ||||||||||||
| Restricted shares and promissory note issued under the 2011 Option Plan |
390,269 | 1,858 | 4.76 | |||||||||||||
| Repurchased at original issue price |
(374,435 | ) | (301 | ) | 0.80 | |||||||||||
| Repurchased at fair value |
(154,310 | ) | (140 | ) | 0.91 | |||||||||||
| Notes paid for vested and unvested shares |
(7,903,745 | ) | (4,865 | ) | 0.62 | |||||||||||
|
|
|
|
|
|||||||||||||
| Balance—December 31, 2014 |
— | — | — | — | ||||||||||||
|
|
|
|
|
|||||||||||||
| Balance—December 31, 2015 |
— | — | — | — | ||||||||||||
|
|
|
|
|
|||||||||||||
The interest amounts related to the Notes were recognized as interest income in the accompanying consolidated statements of operations because the interest portion of the Notes was full recourse. The interest income was not material for any period presented.
Restricted Stock and Stock Options Subject to Repurchase
The 2011 Option Plan allowed for the granting of options that may be exercised before the options have vested. Shares issued as a result of early exercise and shares that had not vested are deemed to be restricted stock and are subject to a vesting schedule identical to the vesting schedule of the related restricted stock and options, as well as certain other restrictions. Shares issued as a result of early exercise that have not vested are subject to
98
Table of Contents
HORTONWORKS, INC.
Notes to Consolidated Financial Statements
repurchase by the Company upon termination of the purchaser’s employment or services, at the price paid by the purchaser, and are not deemed to be issued for accounting purposes until those related shares vest. The amounts received in exchange for these shares have been recorded as a liability on the accompanying balance sheets and will be reclassified into common stock and additional paid-in-capital as the shares vest. The Company’s right to repurchase these shares generally lapses 1/48 of the original grant date per month over four years.
The number of shares of restricted stock and early exercised options to purchase common stock outstanding subject to the Company’s right of repurchase at prices ranging from $0.18 to $14.22 per share for the year ended December 31 2015 was 342,282. The liability for shares subject to repurchase as of December 31, 2015 was $0.9 million, of which $0.5 million is included in accrued expenses and other current liabilities and $0.4 million is included in other long-term liabilities.
2014 Employee Stock Purchase Plan
The Company’s Employee Stock Purchase Plan (the “ESPP”) was adopted and approved by the Company’s Board of Directors in September 2014, adopted and approved by the Company’s stockholders in November 2014, and most recently was amended in August 2015, to allow employees of certain of the Company’s non-United States subsidiaries to participate in the ESPP. The ESPP initially reserved and authorized the issuance of up to a total of 2,500,000 shares of common stock to participating employees. The ESPP provides that the number of shares reserved and available for issuance will automatically increase each January 1, beginning on January 1, 2015, by the lesser of (i) 1,000,000 shares of common stock, (ii) 1 percent of the outstanding number of shares of the Company’s common stock on the immediately preceding December 31, or (iii) such lesser number of shares as determined by the ESPP administrator. This number is subject to adjustment in the event of a stock split, stock dividend or other change in the Company’s capitalization. On January 1, 2015, the shares reserved for issuance increased by 427,248 resulting in total shares reserved for issuance under the ESPP of 2,927,248 as of December 31, 2015.
The following table summarizes the assumptions used in the Black-Scholes option-pricing model to determine fair value of the Company’s common shares to be issued under the ESPP:
| Year Ended December 31, | ||
| 2015 | ||
| Expected term (in years) |
0.5-1.0 | |
| Risk-free interest rate |
0.25%-0.40% | |
| Expected volatility |
35%-37% | |
| Dividend rate |
— % |
Each employee who is a participant in the ESPP may purchase shares by authorizing payroll deductions of up to 15 percent of his or her base compensation during an offering period. Unless the participating employee has previously withdrawn from the offering, his or her accumulated payroll deductions will be used to purchase shares on the last business day of the offering period at a price equal to 85 percent of the fair market value of the shares on the first business day or the last business day of the offering period, whichever is lower. Under applicable tax rules, an employee may purchase no more than $25,000 worth of shares of common stock, valued at the start of the purchase period, under the ESPP in any calendar year. There is no minimum holding period associated with shares purchased pursuant to this plan.
As of December 31, 2015, there was $0.5 million of unrecognized stock-based compensation expense related to the ESPP, which is expected to be recognized over a weighted-average period of 0.35 years.
99
Table of Contents
HORTONWORKS, INC.
Notes to Consolidated Financial Statements
Determining Fair Value for Non-employees
Stock-based compensation expense related to stock options and RSUs granted to non-employees is recognized as the stock options and RSUs are vested. As of December 31, 2015, the Company granted options to purchase 548,726 shares of common stock to non-employees and 105,270 RSUs with a weighted-average exercise price of $6.91 per share. As of December 31, 2015, 106,791 of these shares were outstanding with a weighted-average exercise price of $2.62 per share. As of December 31, 2014, the Company granted options to purchase 345,834 shares of common stock to non-employees and 28,125 RSUs with a weighted-average exercise price of $4.28 per share. As of December 31, 2014, 127,969 of these shares were outstanding with a weighted-average exercise price of $4.78 per share.
The Company granted non-employees options to purchase and RSUs to convert to a total of 5,124 and 230,625 shares of common stock for the years ended December 31, 2015 and 2014, respectively, 11,750 and 50,000 for the eight months ended December 31, 2013 and 2012 (unaudited), respectively, and 50,000 and 135,834 for the years ended April 30, 2013 and 2012, respectively. Compensation expense related to these options was $0.6 million and $1.2 million for the years ended December 31, 2015 and 2014, respectively, $0.1 million and $35,000 for the eight months ended December 31, 2013 and 2012 (unaudited), respectively, and $0.1 million and $2,000 for the years ended April 30, 2013 and 2012, respectively.
The Company believes that the fair value of the stock options is more reliably measurable than the fair value of services received. The fair value of the stock options granted is calculated at each reporting date using the Black-Scholes option pricing model with the following weighted-average assumptions:
| Years Ended December 31, |
Eight Months Ended December 31, |
Years Ended April 30, |
||||||||||||||||||||||
| 2015 | 2014 | 2013 | 2012 | 2013 | 2012 | |||||||||||||||||||
| (Unaudited) | ||||||||||||||||||||||||
| Expected term (in years) |
6.4 | 8.84 | 8.47 | 9.28 | 8.98 | 9.82 | ||||||||||||||||||
| Risk-free interest rate |
1.74 | % | 2.34 | % | 2.53 | % | 1.58 | % | 1.56 | % | 1.87 | % | ||||||||||||
| Expected volatility |
45 | % | 43 | % | 45 | % | 51 | % | 49 | % | 56 | % | ||||||||||||
| Dividend rate |
— | % | — | % | — | % | — | % | — | % | — | % | ||||||||||||
Stock-based Compensation Expense
Total stock-based compensation expense, including stock-based compensation expense to non-employees, by category was as follows (in thousands):
| Years Ended December 31, |
Eight Months Ended December 31, |
Years Ended April 30, |
||||||||||||||||||||||
| 2015 | 2014 | 2013 | 2012 | 2013 | 2012 | |||||||||||||||||||
| (Unaudited) | ||||||||||||||||||||||||
| Cost of revenue |
$ | 2,702 | $ | 580 | $ | 132 | $ | 44 | $ | 45 | $ | 14 | ||||||||||||
| Research and development |
15,193 | 2,257 | 468 | 140 | 244 | 140 | ||||||||||||||||||
| Sales and marketing |
11,688 | 1,881 | 321 | 110 | 234 | 18 | ||||||||||||||||||
| General and administrative |
11,356 | 4,314 | 406 | 122 | 239 | 150 | ||||||||||||||||||
|
|
|
|
|
|
|
|
|
|
|
|
|
|||||||||||||
| Total stock-based compensation expense |
$ | 40,939 | $ | 9,032 | $ | 1,327 | $ | 416 | $ | 762 | $ | 322 | ||||||||||||
|
|
|
|
|
|
|
|
|
|
|
|
|
|||||||||||||
100
Table of Contents
HORTONWORKS, INC.
Notes to Consolidated Financial Statements
11. NET LOSS PER SHARE OF COMMON STOCK
Basic net loss per share is calculated by dividing net loss by the weighted-average number of common shares outstanding during the period, less restricted common stock and common stock issued that is subject to repurchase, and excludes any dilutive effects of share based awards. Diluted net loss per share of common stock is computed giving effect to all potential dilutive common shares. As the Company had net losses for the years ended December 31, 2015 and 2014, the eight months ended December 31, 2013 and 2012 (unaudited), and the years ended April 30, 2013 and 2012, all potential common shares were determined to be anti-dilutive.
The following table sets forth the computation of basic and diluted net loss per share (in thousands, except share and per share amounts):
| Years Ended December 31, | Eight Months Ended December 31, |
Years Ended April 30, | ||||||||||||||||||||||
| 2015 | 2014 | 2013 | 2012 | 2013 | 2012 | |||||||||||||||||||
| (Unaudited) | ||||||||||||||||||||||||
| Net loss |
$ | (179,117 | ) | $ | (177,365 | ) | $ | (46,213 | ) | $ | (19,711 | ) | $ | (36,638 | ) | $ | (11,521 | ) | ||||||
|
|
|
|
|
|
|
|
|
|
|
|
|
|||||||||||||
| Weighted-average shares used in computing net loss per share of common stock |
43,318,044 | 7,341,465 | 2,541,800 | 1,161,880 | 1,209,750 | 155,052 | ||||||||||||||||||
|
|
|
|
|
|
|
|
|
|
|
|
|
|||||||||||||
| Net loss per share, basic and diluted |
$ | (4.13 | ) | $ | (24.16 | ) | $ | (18.18 | ) | $ | (16.96 | ) | $ | (30.29 | ) | $ | (74.30 | ) | ||||||
|
|
|
|
|
|
|
|
|
|
|
|
|
|||||||||||||
The following outstanding shares of common stock equivalents were excluded from the computation of diluted net loss per share of common stock for the periods presented because including them would have been anti-dilutive:
| Years Ended December 31, | Eight Months Ended December 31, |
Years Ended April 30, | ||||||||||||||||||||||
| 2015 | 2014 | 2013 | 2012 | 2013 | 2012 | |||||||||||||||||||
| (Unaudited) | ||||||||||||||||||||||||
| Convertible preferred stock (on an as if converted basis) |
— | — | 15,795,480 | 12,441,401 | 12,441,401 | 12,441,401 | ||||||||||||||||||
| Exercise and conversion of convertible preferred stock warrants (converted into common stock warrants upon initial public offering) |
3,250,000 | 3,250,000 | 3,250,000 | 3,250,000 | 3,250,000 | 3,250,000 | ||||||||||||||||||
| Exercise and conversion of common stock warrants |
476,368 | 476,368 | — | — | — | — | ||||||||||||||||||
| Restricted common stock issued, net of repurchases |
— | — | 8,042,221 | 10,667,221 | 10,792,221 | 8,284,723 | ||||||||||||||||||
| Common stock subject to repurchase |
55,603 | 1,604,728 | 235,886 | 179,532 | 254,303 | 168,593 | ||||||||||||||||||
| Outstanding stock options |
11,552,487 | 13,953,894 | 7,702,273 | 5,086,448 | 5,512,005 | 2,851,865 | ||||||||||||||||||
| Unvested restricted stock and restricted stock units |
6,642,601 | 1,623,222 | — | — | — | — | ||||||||||||||||||
|
|
|
|
|
|
|
|
|
|
|
|
|
|||||||||||||
| Total |
21,977,059 | 20,908,212 | 35,025,860 | 31,624,602 | 32,249,930 | 26,996,582 | ||||||||||||||||||
|
|
|
|
|
|
|
|
|
|
|
|
|
|||||||||||||
101
Table of Contents
HORTONWORKS, INC.
Notes to Consolidated Financial Statements
Immediately prior to the closing of the Company’s IPO in December 2014, all shares of the Company’s outstanding convertible preferred stock automatically converted into shares of common stock.
12. INCOME TAXES
The components of the provision for income taxes for the years ended December 31, 2015 and 2014, the eight months ended December 31, 2013 and 2012 (unaudited), and the years ended April 30, 2013 and 2012 are as follows (in thousands):
| Years Ended December 31, |
Eight Months Ended December 31, |
Years Ended April 30, |
||||||||||||||||||||||
| 2015 | 2014 | 2013 | 2012 | 2013 | 2012 | |||||||||||||||||||
| (Unaudited) | ||||||||||||||||||||||||
| Current: |
||||||||||||||||||||||||
| Federal |
$ | — | $ | — | $ | — | $ | — | $ | — | $ | — | ||||||||||||
| State |
58 | 18 | 6 | 4 | 6 | 1 | ||||||||||||||||||
| Foreign |
514 | 150 | 39 | 4 | 5 | — | ||||||||||||||||||
|
|
|
|
|
|
|
|
|
|
|
|
|
|||||||||||||
| Total current tax expense |
572 | 168 | 45 | 8 | 11 | 1 | ||||||||||||||||||
| Total deferred tax benefit |
(140 | ) | (1,279 | ) | — | — | — | — | ||||||||||||||||
|
|
|
|
|
|
|
|
|
|
|
|
|
|||||||||||||
| Total income tax (benefit) expense |
$ | 432 | $ | (1,111 | ) | $ | 45 | $ | 8 | $ | 11 | $ | 1 | |||||||||||
|
|
|
|
|
|
|
|
|
|
|
|
|
|||||||||||||
The components of loss before income taxes by United States and foreign jurisdictions are as follows (in thousands):
| Years Ended December 31, |
Eight Months Ended December 31, |
Years Ended April 30, |
||||||||||||||||||||||
| 2015 | 2014 | 2013 | 2012 | 2013 | 2012 | |||||||||||||||||||
| (Unaudited) | ||||||||||||||||||||||||
| United States |
$ | 137,713 | $ | 149,629 | $ | 35,539 | $ | 16,007 | $ | 29,806 | $ | 11,491 | ||||||||||||
| Foreign |
40,972 | 28,847 | 10,629 | 3,696 | 6,821 | 29 | ||||||||||||||||||
|
|
|
|
|
|
|
|
|
|
|
|
|
|||||||||||||
| Total loss before income tax |
$ | 178,685 | $ | 178,476 | $ | 46,168 | $ | 19,703 | $ | 36,627 | $ | 11,520 | ||||||||||||
|
|
|
|
|
|
|
|
|
|
|
|
|
|||||||||||||
102
Table of Contents
HORTONWORKS, INC.
Notes to Consolidated Financial Statements
Deferred income taxes reflect the net tax effects of temporary differences between the carrying amounts of assets and liabilities for financial reporting purposes and the amounts used for income tax purposes. Significant components of the Company’s deferred tax assets are as follows (in thousands):
| As of December 31, 2015 |
As of December 31, 2014 |
|||||||
| Deferred tax assets: |
||||||||
| Net operating loss carryforwards |
$ | 87,128 | $ | 48,814 | ||||
| Research and development credit |
3,971 | 2,495 | ||||||
| Warrant expense |
19,422 | 19,962 | ||||||
| Depreciation and amortization |
415 | 230 | ||||||
| Accruals and reserves |
2,125 | 1,968 | ||||||
| Deferred revenue |
5,547 | 6,601 | ||||||
| Stock-based compensation expense |
10,446 | — | ||||||
| Other |
1,244 | 1,441 | ||||||
|
|
|
|
|
|||||
| Gross deferred tax assets |
130,298 | 81,511 | ||||||
| Valuation allowance |
(130,178 | ) | (81,511 | ) | ||||
| Intangibles |
(400 | ) | — | |||||
|
|
|
|
|
|||||
| Net deferred tax liabilities |
$ | (280 | ) | $ | — | |||
|
|
|
|
|
|||||
The following is a reconciliation of the statutory federal income tax rate to the Company’s effective tax rate:
| Years Ended December 31, |
Eight Months Ended December 31, |
Years Ended April 30, |
||||||||||||||||||||||
| 2015 | 2014 | 2013 | 2012 | 2013 | 2012 | |||||||||||||||||||
| (Unaudited) | ||||||||||||||||||||||||
| Tax at federal statutory rate |
34.00 | % | 34.00 | % | 34.00 | % | 34.00 | % | 34.00 | % | 34.00 | % | ||||||||||||
| State taxes, net of federal benefit |
2.93 | 4.21 | 1.79 | 5.59 | 5.68 | 5.33 | ||||||||||||||||||
| Permanent differences and other items not individually material |
(0.26 | ) | (0.77 | ) | (0.72 | ) | (1.07 | ) | (1.86 | ) | (1.44 | ) | ||||||||||||
| Warrant expense |
— | (1.03 | ) | — | — | — | — | |||||||||||||||||
| Stock-based compensation expense |
(2.29 | ) | — | — | — | — | — | |||||||||||||||||
| Credits |
0.62 | 0.49 | 1.46 | 2.14 | 1.72 | 2.23 | ||||||||||||||||||
| Intellectual property structure charge |
— | — | — | — | — | (28.75 | ) | |||||||||||||||||
| Foreign tax differential |
(8.01 | ) | (5.58 | ) | (7.75 | ) | (6.35 | ) | (6.53 | ) | — | |||||||||||||
| Change in valuation |
(27.23 | ) | (30.70 | ) | (28.88 | ) | (34.35 | ) | (33.04 | ) | (11.38 | ) | ||||||||||||
|
|
|
|
|
|
|
|
|
|
|
|
|
|||||||||||||
| Provision for income taxes |
(0.24 | )% | 0.62 | % | (0.10 | )% | (0.04 | )% | (0.03 | )% | (0.01 | )% | ||||||||||||
|
|
|
|
|
|
|
|
|
|
|
|
|
|||||||||||||
The Company’s effective tax rate for the period ended December 31, 2015 was lower than the statutory tax rate primarily because of the valuation allowance on its United States and foreign deferred tax assets and the losses of foreign subsidiaries taxed at lower rates, partially offset by state taxes and tax credits. The losses of the foreign subsidiaries were generated primarily by the Company’s cost sharing agreement with its Netherlands operations.
The benefit for income taxes for the year ended December 31, 2014 relates primarily to the release of a valuation allowance of $1.3 million associated with nondeductible intangible assets recorded as part of the XA Secure acquisition, partially offset by state minimum income tax and income tax on the Company’s earnings in foreign jurisdictions. In connection with the acquisition of XA Secure, a deferred tax liability was established for
103
Table of Contents
HORTONWORKS, INC.
Notes to Consolidated Financial Statements
the book-tax basis differences related to the acquired developed technology. The net deferred tax liability from this acquisition creates an additional source of income to offset the Company’s deferred tax assets. As such, the impact on the acquiring Company’s deferred tax assets and liabilities caused by an acquisition are recorded in the acquiring Company’s consolidated financial statements outside of acquisition accounting. The income tax expense for the years ended December 31, 2015 and 2014, eight months ended December 31, 2013 and 2012 (unaudited), and years ended April 30, 2013 and 2012 relates to state minimum income tax and income tax on the Company’s earnings in foreign jurisdictions.
A valuation allowance is provided when it is more likely than not that the deferred tax assets will not be realized. The Company has established a valuation allowance to offset net deferred tax assets at December 31, 2015 due to the uncertainty of realizing future tax benefits from its net operating loss carryforwards and other deferred tax assets. The net valuation allowance increased by approximately $48.7 million during the year ended December 31, 2015. As of December 31, 2015, the Company had net operating loss (“NOL”) carryforwards for federal, state and foreign tax purposes of approximately $253.0 million, $223.1 million and $1.2 million, respectively. The NOL carryforwards will expire at various dates beginning in 2031 (federal), 2023 (state) and 2025 (foreign), unless previously utilized. The Company also has federal and state research and development tax credit carryforwards of approximately $3.3 million and $3.1 million, respectively. The federal tax credits will expire at various dates beginning in 2031, unless previously utilized. The state tax credits do not expire and will carry forward indefinitely until utilized.
As a result of certain realization requirements of the accounting guidance for stock-based compensation expense, the table of deferred tax assets and liabilities shown above does not include certain deferred tax assets at December 31, 2015 and 2014 that arose directly from (or the use of which was postponed by) tax deductions related to equity compensation in excess of compensation recognized for financial reporting. Approximately $30.7 million of federal net operating losses and $14.0 million of state net operating losses relate to stock-based compensation expense deductions in excess of book expense, the tax effect of which would be to credit additional-paid-in-capital if realized.
Current laws impose substantial restrictions on the utilization of net operating loss and credit carryforwards in the event of an “ownership change” within a three-year period as defined by the Internal Revenue Code Section 382. If there should be an ownership change, the Company’s ability to utilize its carryforwards could be limited.
The Company has not recorded a provision for deferred United States tax expense that could result from the remittance of foreign undistributed earnings because the Company intends to reinvest the earnings of these foreign subsidiaries indefinitely. As of December 31, 2015, the Company has incurred net losses offshore since inception and does not have current or accumulated earnings to record a provision for deferred United States tax expense that could result from the remittance of foreign undistributed earnings.
The Company adopted authoritative guidance on accounting for uncertainty in income taxes in the year ended December 31, 2011. In accordance with these provisions, the Company recorded unrecognized tax benefits for uncertain tax positions of approximately $1.6 million as of December 31, 2015 and $1.0 million as of December 31, 2014, of which none would impact the effective tax rate, if recognized, because the benefit would be offset by an increase in the valuation allowance.
The Company’s policy is to recognize interest and penalties accrued on any unrecognized tax benefits as a component of income tax expense. During the year ended December 31, 2015, the Company recognized no interest and penalties associated with unrecognized tax benefits. There are no tax positions for which it is
104
Table of Contents
HORTONWORKS, INC.
Notes to Consolidated Financial Statements
reasonably possible that the total amounts of unrecognized tax benefits will significantly increase or decrease within 12 months of the reporting date.
The Company files income tax returns in the United States federal jurisdiction, various state jurisdictions and foreign jurisdictions. The Company’s tax years for fiscal year end 2011 and forward are subject to examination by the United States tax authorities and various state tax authorities, and the Company’s tax years for fiscal year end 2013 and forward are subject to examination by various foreign tax authorities.
A reconciliation of the Company’s unrecognized tax benefits is as follows (in thousands):
| Unrecognized tax benefit |
||||
| Balance as of April 30, 2013 |
$ | 366 | ||
| Increases related to prior years’ tax positions |
6 | |||
| Increases related to current year’s tax positions |
276 | |||
|
|
|
|||
| Balance as of December 31, 2013 |
648 | |||
| Increases related to prior years’ tax positions |
— | |||
| Increases related to current year’s tax positions |
349 | |||
|
|
|
|||
| Balance as of December 31, 2014 |
997 | |||
| Increases related to prior years’ tax positions |
145 | |||
| Increases related to current year’s tax positions |
443 | |||
|
|
|
|||
| Balance as of December 31, 2015 |
$ | 1,585 | ||
|
|
|
|||
13. SEGMENT AND GEOGRAPHICAL INFORMATION
The Company’s chief operating decision maker reviews financial information on consolidated basis for the purposes of allocating resources and evaluating financial performance. The Company’s chief operating decision maker has direct reports responsible for various functions within the Company (e.g. business strategy, finance, legal, business development, products, etc.) on a consolidated basis. There are no segment managers who are held accountable for operations or operating results. The Company’s growth strategy is predicated upon the growth of the support subscription business, and the Company’s key business metrics reflect this strategy. Professional services are offered with the overall goal of securing and retaining support subscription customers and growing support subscription revenue. Accordingly, management has determined that the Company operates in one reportable segment.
The Company has international sales offices in Australia, Germany, Ireland, Japan, Netherlands, South Korea and the United Kingdom and research and development facilities in Hungary and India. The following presents revenue by country, determined by location of sales office (in thousands):
| Years Ended December 31, |
Eight Months Ended December 31, |
Years Ended April 30, |
||||||||||||||||||||||
| 2015 | 2014 | 2013 | 2012 | 2013 | 2012 | |||||||||||||||||||
| (Unaudited) | ||||||||||||||||||||||||
| United States |
$ | 108,516 | $ | 43,135 | $ | 17,517 | $ | 4,778 | $ | 10,998 | $ | 1,646 | ||||||||||||
| Rest of world |
13,428 | 2,913 | 348 | — | — | — | ||||||||||||||||||
|
|
|
|
|
|
|
|
|
|
|
|
|
|||||||||||||
| Total revenue |
$ | 121,944 | $ | 46,048 | $ | 17,865 | $ | 4,778 | $ | 10,998 | $ | 1,646 | ||||||||||||
|
|
|
|
|
|
|
|
|
|
|
|
|
|||||||||||||
The Company’s long-lived assets are primarily located in the United States and not allocated to any specific region. Therefore, geographic information is presented only for total revenue.
105
Table of Contents
HORTONWORKS, INC.
Notes to Consolidated Financial Statements
14. 401(K) PLAN
The Company has a qualified defined contribution plan under Section 401(k) of the Internal Revenue Code covering eligible employees. To date, the Company has not made any matching contributions to this plan.
15. RELATED PARTY TRANSACTIONS
In June 2011, the Company entered into a two-year commercial agreement with Yahoo!, a principal shareholder, that requires the Company to provide support subscription, and the Company issued a preferred stock warrant to Yahoo! (the “2011 Yahoo! Warrant”). The initial total contract value was $2.0 million and was being paid in quarterly installments of $250,000. In June 2013, the commercial agreement was amended to automatically renew for an additional year on an annual basis, unless otherwise terminated by either party 60 days prior to the end of the then-current renewal period. In December 2015, the commercial agreement was further amended to extend the current term until December 30, 2018, and thereafter, the commercial agreement will automatically renew for an additional year on an annual basis, unless otherwise terminated by either party 60 days prior to the end of the then-current renewal period. Refer to Note 9 for further discussion of the 2011 Yahoo! Warrant.
In February 2012, the Company entered into a development, distribution and marketing agreement with Teradata Corporation, which at that time was a significant shareholder. Under this and subsequent arrangements, the Company is providing support subscription and professional services to Teradata and certain of its end users. In April 2012, the Company received a nonrefundable prepayment of $9.5 million from Teradata as consideration for support subscription offerings and professional services expected to be performed by the Company through December 2016. In June 2015, the Company entered into an amendment to their prior agreement with Teradata and received a second prepayment of $1.5 million in August 2015 as consideration for support subscription offerings and professional services expected to be performed by the Company through December 2017. As of February 2, 2016, Teradata was no longer a Hortonworks shareholder.
In September 2013, the Company entered into a common stock purchase agreement with an affiliate of AT&T covering the sale and issuance of 390,269 shares of the Company’s stock for a nominal amount of consideration. The initial grant included restricted shares that were subject to repurchase rights by the Company. Fifty percent of the shares vested on an equal and ratable basis over an 18-month period beginning on October 1, 2013 and the remaining 50 percent of shares vested in their entirety on March 31, 2015. Concurrently, the Company also entered into a commercial agreement with AT&T to provide specified support subscription and professional services over a three-year term with a minimum annual fee of $6.0 million. Due to the lack of VSOE, this fee is being recognized ratably over the three-year term. The fair value of approximately $0.4 million related to the common shares where the repurchase right expired as of December 31, 2013 was recognized as contra-revenue. In January 2014, the Company entered into an amended stock purchase agreement with an affiliate of AT&T in which the Company relinquished its repurchase rights, at which point the fair value of the remaining shares was recognized as a reduction in revenue. The contra-revenue amount of $2.0 million was determined based on the fair value of the common stock on the date of modification of the stock purchase agreement.
In June 2014, the Company issued a warrant to purchase a number of shares of common stock in exchange for the amendment of certain rights held by Yahoo! under the Investors’ Rights Agreement to approve certain corporate transactions involving Hortonworks. The warrant became exercisable upon the consummation of the IPO at which point the fair value of the award was reclassified to equity. As of December 31, 2015, the warrant is exercisable for 476,368 shares of the Company’s common stock. The combined value of the initial measurement and the change in the fair value of this warrant of $5.4 million was recorded as other expense in the consolidated statement of operations for the year ended December 31, 2014.
106
Table of Contents
HORTONWORKS, INC.
Notes to Consolidated Financial Statements
In July 2014, the Company entered into a Series D preferred stock purchase agreement with Hewlett Packard Enterprise covering the sale and issuance of 2,051,349 shares of the Company’s stock for a total of $50.0 million. Under this and subsequent arrangements, Hewlett Packard Enterprise resells the Company’s support subscription services. The Company receives a net percentage of the gross dollars collected from Hewlett Packard Enterprise’s end-user customers related to such support and professional services. For this related party arrangement, the Company did not record contra revenue for the associated equity as the Series D preferred stock was issued at fair value.
The following table summarizes the Company’s related party transactions. See Note 8 for information regarding the terms of convertible preferred stock and common stock, Note 9 for information regarding the terms of 2011 Yahoo! Warrant and information regarding the terms of common stock warrant (in thousands, except for share amounts):
| As of and for the Years Ended December 31, | ||||||||||||||||||||||||||||||||
| 2015 | 2014 | |||||||||||||||||||||||||||||||
| Yahoo! | Teradata | AT&T | Hewlett- Packard |
Yahoo! | Teradata | AT&T | Hewlett- Packard |
|||||||||||||||||||||||||
| Shares/warrants owned by related party: |
||||||||||||||||||||||||||||||||
| Common stock |
3,845,806 | — | 15,269 | 2,051,349 | 3,845,806 | 2,895,742 | 390,269 | 2,051,349 | ||||||||||||||||||||||||
| Common stock warrants |
3,726,368 | — | — | — | 3,726,368 | — | — | — | ||||||||||||||||||||||||
| Amounts attributable to related party: |
||||||||||||||||||||||||||||||||
| Gross revenue recognized |
$ | 1,002 | $ | 2,625 | $ | 6,161 | $ | 265 | $ | 1,000 | $ | 1,611 | $ | 6,268 | $ | 43 | ||||||||||||||||
| Contra-revenue recognized |
— | — | — | — | (4,047 | ) | — | (2,040 | ) | — | ||||||||||||||||||||||
| 2011 Yahoo! Warrant |
— | — | — | — | 47,953 | — | — | — | ||||||||||||||||||||||||
| Deferred revenue |
2,398 | 5,663 | 84 | 338 | — | 6,799 | 187 | 136 | ||||||||||||||||||||||||
| Accounts receivable |
2,400 | (24 | ) | 1,500 | — | 500 | — | 1,500 | 20 | |||||||||||||||||||||||
| As of and for the Eight Months ended December 31, | ||||||||||||||||||||||||||||||||
| 2013 | 2012 (unaudited) | |||||||||||||||||||||||||||||||
| Yahoo! | Teradata | AT&T | Hewlett- Packard |
Yahoo! | Teradata | AT&T | Hewlett- Packard |
|||||||||||||||||||||||||
| Shares/warrants owned by related party: |
||||||||||||||||||||||||||||||||
| Series A preferred stock |
6,271,312 | — | — | — | 6,271,312 | — | — | — | ||||||||||||||||||||||||
| Preferred stock warrants |
6,500,000 | — | — | — | 6,500,000 | — | — | — | ||||||||||||||||||||||||
| Series B preferred stock |
— | 1,111,111 | — | — | — | 1,111,111 | — | — | ||||||||||||||||||||||||
| Series C preferred stock |
567,061 | 2,683,267 | — | — | — | — | — | — | ||||||||||||||||||||||||
| Common stock |
— | 877,193 | 390,269 | — | — | 877,193 | — | — | ||||||||||||||||||||||||
| Amounts attributable to related party: |
||||||||||||||||||||||||||||||||
| Gross revenue recognized |
$ | 667 | $ | 682 | $ | 1,988 | $ | 84 | $ | 715 | $ | 3 | $ | — | $ | — | ||||||||||||||||
| Contra-revenue recognized |
— | — | (382 | ) | — | — | — | — | — | |||||||||||||||||||||||
| Deferred revenue |
— | 8,540 | 283 | 112 | — | 9,492 | — | — | ||||||||||||||||||||||||
| Accounts receivable |
— | 116 | 1,532 | 196 | 49 | — | — | — | ||||||||||||||||||||||||
107
Table of Contents
HORTONWORKS, INC.
Notes to Consolidated Financial Statements
| As of and for the Year ended April 30, | ||||||||||||||||||||||||||||||||
| 2013 | 2012 | |||||||||||||||||||||||||||||||
| Yahoo! | Teradata | AT&T | Hewlett- Packard |
Yahoo! | Teradata | AT&T | Hewlett- Packard |
|||||||||||||||||||||||||
| Shares/warrants owned by related party: |
||||||||||||||||||||||||||||||||
| Series A preferred stock |
6,271,312 | — | — | — | 6,271,312 | — | — | — | ||||||||||||||||||||||||
| Preferred stock warrants |
6,500,000 | — | — | — | 6,500,000 | — | — | — | ||||||||||||||||||||||||
| Series B preferred stock |
— | 1,111,111 | — | — | — | 1,111,111 | — | — | ||||||||||||||||||||||||
| Common stock |
— | 877,193 | — | — | — | 877,193 | — | — | ||||||||||||||||||||||||
| Amounts attributable to related party: |
||||||||||||||||||||||||||||||||
| Gross revenue recognized |
$ | 1,049 | $ | 400 | $ | 669 | $ | — | $ | 833 | $ | — | $ | — | $ | — | ||||||||||||||||
| Deferred revenue |
167 | 9,100 | 111 | — | 167 | 9,545 | — | — | ||||||||||||||||||||||||
| Accounts receivable |
250 | 90 | 641 | — | — | 45 | — | — | ||||||||||||||||||||||||
The Company does not separately record routine cost of revenue and operating expenses on a per related party contract basis.
16. SUBSEQUENT EVENTS
Follow-On Offering
In February 2016, the Company completed a follow-on public offering of an aggregate of 9,688,750 shares of its common stock, including 1,263,750 additional shares sold pursuant to the full exercise of the option to purchase additional shares by the underwriters, at a public offering price of $9.50 per share. Net proceeds to the Company were approximately $87.7 million after deducting underwriting discounts and commissions and estimated offering expenses.
Stock Option Cancellation
On February 11, 2016, Robert Bearden, Chief Executive Officer, voluntarily cancelled a stock option to purchase 1,185,000 shares dated September 12, 2014 (the “Option”). Mr. Bearden informed the Company that he cancelled the Option to facilitate making equity grants of approximately the same number of restricted stock units to the Company’s employees without increasing the Company’s equity overhang.
108
Table of Contents
Item 9. Changes in and Disagreements with Accountants on Accounting and Financial Disclosure.
None.
Item 9A. Controls and Procedures.
Evaluation of Disclosure Controls and Procedures
Our management, with the participation of our Chief Executive Officer and our Chief Financial Officer, has evaluated the effectiveness of our disclosure controls and procedures as of the end of the period covered by this Annual Report on Form 10-K. The term “disclosure controls and procedures,” as defined in Rules 13a-15(e) and 15d-15(e) under the Securities Exchange Act of 1934 (“Exchange Act”), means controls and other procedures of a company that are designed to ensure that information required to be disclosed by a company in the reports that it files or submits under the Exchange Act is recorded, processed, summarized and reported within the time periods specified in the SEC’s rules and forms at the reasonable assurance level. Disclosure controls and procedures include, without limitation, controls and procedures designed to ensure that information required to be disclosed by a company in the reports that it files or submits under the Exchange Act is accumulated and communicated to the company’s management, including its principal executive and principal financial officers, or persons performing similar functions, as appropriate to allow timely decisions regarding required disclosure. Management recognizes that any controls and procedures, no matter how well designed and operated, can provide only reasonable assurance of achieving their objectives, and management necessarily applies its judgment in evaluating the cost-benefit relationship of possible controls and procedures. Based on such evaluation, our Chief Executive Officer and Chief Financial Officer have concluded that, as of such date, our disclosure controls and procedures were not effective at the reasonable assurance level due to a material weakness in our internal controls over financial reporting related to the recognition of revenue and deferred revenue for a subset of non-standard license transactions where renewal rates for post-contract support were stated upon commencement of the arrangement. Notwithstanding the identified material weakness, management has determined that the financial statements and other information included in this Annual Report on Form 10-K and other periodic filings present fairly in all material respects the financial position and results of operations for the periods presented in accordance with GAAP.
Management’s Annual Report on Internal Control over Financial Reporting
Our management is responsible for establishing and maintaining adequate internal control over financial reporting (as defined in Rule 13a-15(f) under the Exchange Act). Management conducted an assessment of the effectiveness of our internal control over financial reporting based on the criteria set forth in the 2013 Internal Control—Integrated Framework issued by the Committee of Sponsoring Organizations of the Treadway Commission (the “COSO”). Based on the assessment, management has concluded there was a material weakness in the design effectiveness of our internal control over financial reporting as of December 31, 2015 related to the recognition of revenue and deferred revenue for a subset of non-standard license transactions where post-contract support renewal rates were stated upon commencement of the arrangement. A material weakness is defined as a deficiency or a combination of deficiencies, in internal control over financial reporting, such that there is a reasonable possibility that a material misstatement of our annual or interim financial statements will not be prevented or detected on a timely basis.
During the year ended December 31, 2015, we determined a secondary review of specific agreements was not performed at a sufficiently detailed level. Such review would have provided oversight related to the recognition of revenue and deferred revenue for a subset of non-standard license transactions where renewal rates for post-contract support were stated upon commencement of the arrangement. Our findings are related to the design effectiveness of the control. Although the adjustments identified and recorded during the year related to the subset of non-standard license transactions were not material, we concluded the deficiency presented a reasonable possibility that a material misstatement of the consolidated financial statements would not have been prevented or detected. Accordingly, management has determined the design deficiency constitutes a material
109
Table of Contents
weakness. Given this material weakness, management concluded the Company did not maintain effective internal control over financial reporting as of December 31, 2015, based on the criteria in the 2013 Internal-Control Integrated Framework issued by the COSO.
This Annual Report on Form 10-K does not include an attestation report of our registered public accounting firm on our internal control over financial reporting due to an exemption established by the JOBS Act for “emerging growth companies.”
Material Weakness and Remediation Activities
We performed our assessment of internal control over financial reporting as of December 31, 2015. We determined our review was not performed at a sufficiently detailed level to detect errors in recognition of revenue and deferred revenue for a subset of non-standard license transactions where renewal rates for post-contract support were stated upon commencement of the arrangement. Each of the transactions originated before we established and formalized Section 404 internal controls in July 2015.
We have initiated actions to address the root causes of the material weakness identified. The following actions are planned to be implemented in 2016 relative to this type of license transaction:
| • | Deploy or utilize resources, including an evaluation of the sufficiency of our internal personnel and the use of external resources; |
| • | Enforce the tracking and monitoring of this type of transaction; |
| • | Seek senior management approval for this type of transaction; |
| • | Add management review controls related to this type of transaction; and |
| • | Enhance our review processes and procedures through expanded use of checklists for key tasks to improve effectiveness and accuracy relative to this type of transaction. |
We believe the actions described above will strengthen our internal controls over financial reporting related to the revenue recognition process for this type of license transaction, and will, once completed, address the material weakness that we identified in our internal control over financial reporting as of December 31, 2015.
Inherent Limitations of Internal Controls
Our management, including our principal executive officer and principal financial officer, does not expect that our disclosure controls and procedures or our internal controls will prevent all error and all fraud. A control system, no matter how well conceived and operated, can provide only reasonable, not absolute, assurance that the objectives of the control system are met. Because of the inherent limitations in all control systems, no evaluation of controls can provide absolute assurance that all control issues and instances of fraud, if any, within the Company have been detected. These inherent limitations include the realities that judgments in decision making can be faulty, and that breakdowns can occur because of a simple error or mistake. Additionally, controls can be circumvented by the individual acts of some persons, by collusion of two or more people, or by management override of the control. The design of any system of controls also is based in part upon certain assumptions about the likelihood of future events, and there can be no assurance that any design will succeed in achieving its stated goals under all potential future conditions. Over time, controls may become inadequate because of changes in conditions, or the degree of compliance with the policies or procedures may deteriorate. Because of the inherent limitations in a cost-effective control system, misstatements due to error or fraud may occur and not be detected.
None.
110
Table of Contents
Item 10. Directors, Executive Officers and Corporate Governance.
The information required by this item is incorporated by reference to our Proxy Statement for the 2016 Annual Meeting of Stockholders to be filed with the SEC within 120 days of the fiscal year ended December 31, 2015.
Our Board of Directors has adopted a Code of Business Conduct and Ethics applicable to all officers, directors and employees, which is available on the investor relations section of our website, which is located at http://investors.hortonworks.com. We intend to satisfy the disclosure requirement under Item 5.05 of Form 8-K regarding amendment to, or waiver from, a provision of our Code of Business Conduct and Ethics by posting such information on our website at the address and location specified above.
Item 11. Executive Compensation.
The information required by this item is incorporated by reference to our Proxy Statement for the 2016 Annual Meeting of Stockholders to be filed with the SEC within 120 days of the fiscal year ended December 31, 2015.
Item 12. Security Ownership of Certain Beneficial Owners and Management and Related Stockholder Matters.
The information required by this item is incorporated by reference to our Proxy Statement for the 2016 Annual Meeting of Stockholders to be filed with the SEC within 120 days of the fiscal year ended December 31, 2015.
Item 13. Certain Relationships and Related Transactions, and Director Independence.
The information required by this item is incorporated by reference to our Proxy Statement for the 2016 Annual Meeting of Stockholders to be filed with the SEC within 120 days of the fiscal year ended December 31, 2015.
Item 14. Principal Accounting Fees and Services.
The information required by this item is incorporated by reference to our Proxy Statement for the 2016 Annual Meeting of Stockholders to be filed with the SEC within 120 days of the fiscal year ended December 31, 2015.
111
Table of Contents
Item 15. Exhibits, Financial Statement Schedules.
The following documents are filed as part of this report:
1. Consolidated Financial Statements
See Index to Consolidated Financial Statements at Item 8 herein.
2. Consolidated financial statement Schedules.
All schedules are omitted because the required information is either not present, not present in material amounts or is presented within the consolidated financial statements included.
3. Exhibits
The documents listed in the Exhibit Index of this Annual Report on Form 10-K are incorporated by reference or are filed with this Annual Report on Form 10-K, in each case as indicated therein (numbered in accordance with Item 601 of Regulation S-K).
112
Table of Contents
SIGNATURES
Pursuant to the requirements of Section 13 or 15(d) of the Securities Exchange Act of 1934, as amended, the Registrant has duly caused this Report to be signed on its behalf by the undersigned, thereunto duly authorized.
| Company Name | ||||
| Date: March 15, 2016 | By: |
/s/ Robert Bearden | ||
| Robert Bearden, Chief Executive Officer | ||||
POWER OF ATTORNEY
KNOW ALL PERSONS BY THESE PRESENTS, that each person whose signature appears below constitutes and appoints Robert Bearden and Scott Davidson, jointly and severally, his attorney-in-fact, with the power of substitution, for him in any and all capacities, to sign any amendments to this Annual Report on Form 10-K and to file the same, with exhibits thereto and other documents in connection therewith, with the Securities and Exchange Commission, hereby ratifying and confirming all that each of said attorneys-in-fact, or his substitute or substitutes, may do or cause to be done by virtue hereof.
Pursuant to the requirements of the Securities Exchange Act of 1934, this Annual Report on Form 10-K has been signed below by the following persons on behalf of the registrant and in the capacities and on the dates indicated:
| Signature |
Title |
Date | ||
| /s/ Robert Bearden Robert Bearden |
Chief Executive Officer and Director (Principal Executive Officer) |
March 15, 2016 | ||
| /s/ Scott Davidson Scott Davidson |
Chief Financial Officer (Principal Financial Officer) |
March 15, 2016 | ||
| /s/ Scott Reasoner Scott Reasoner |
Vice President, Controller and Principal Accounting Officer (Principal Accounting Officer) |
March 15, 2016 | ||
| /s/ Paul Cormier Paul Cormier |
Director | March 15, 2016 | ||
| /s/ Peter Fenton Peter Fenton |
Director | March 15, 2016 | ||
| /s/ Martin Fink Martin Fink |
Director | March 15, 2016 | ||
| /s/ Kevin Klausmeyer Kevin Klausmeyer |
Director | March 15, 2016 | ||
| /s/ Jay Rossiter Jay Rossiter |
Director | March 15, 2016 | ||
| /s/ Michelangelo Volpi Michelangelo Volpi |
Director | March 15, 2016 | ||
113
Table of Contents
Exhibit Index
| Exhibit |
Exhibit Description |
Incorporated by Reference | ||||||||||||||
| Form |
File No. |
Exhibit |
Filing Date |
Filed | ||||||||||||
| 3.1 | Amended and Restated Certificate of Incorporation of the Registrant. | S-1 | 333-200044 | 3.2 | November 10, 2014 | |||||||||||
| 3.2 | Amended and Restated Bylaws of the Registrant. | S-1 | 333-200044 | 3.4 | November 10, 2014 | |||||||||||
| 4.1 | Form of common stock certificate of the Registrant. | S-1 | 333-200044 | 4.1 | December 1, 2014 | |||||||||||
| 4.2 | Amended and Restated Investors’ Rights Agreement by and among the Registrant and certain of its stockholders, dated July 23, 2014. | S-1 | 333-200044 | 4.2 | December 1, 2014 | |||||||||||
| 4.3 | Warrant to Purchase Shares of Series A Preferred Stock issued to Yahoo! Inc. by the Registrant, dated July 1, 2011. | S-1 | 333-200044 | 4.3 | November 10, 2014 | |||||||||||
| 4.4 | Warrant to Purchase Shares of Common Stock issued to Yahoo! Inc. by the Registrant, dated June 9, 2014. | S-1 | 333-200044 | 4.4 | November 10, 2014 | |||||||||||
| 10.1# | Form of Indemnification Agreement between the Registrant and each of its directors and executive officers. | S-1 | 333-200044 | 10.1 | November 10, 2014 | |||||||||||
| 10.2# | 2011 Stock Option and Grant Plan, as amended, and forms of agreements thereunder. | S-1 | 333-200044 | 10.2 | November 10, 2014 | |||||||||||
| 10.3# | 2014 Stock Option and Incentive Plan and forms of agreements thereunder. | S-1 | 333-200044 | 10.3 | December 1, 2014 | |||||||||||
| 10.4.1# | Employment Agreement by and between the Registrant and Robert Bearden, dated October 30, 2014. | S-1 | 333-200044 | 10.4.1 | November 10, 2014 | |||||||||||
| 10.4.2# | Employment Agreement by and between the Registrant and Scott Davidson, dated October 30, 2014. | S-1 | 333-200044 | 10.4.2 | November 10, 2014 | |||||||||||
| 10.4.3# | Form of Employment Agreement with other executive officers. | S-1 | 333-200044 | 10.4.3 | November 10, 2014 | |||||||||||
| 10.4.4# | Form of Letter Agreement re Post-Termination Option Exercise Period | 8-K | 001-36780 | 10.2 | June 19, 2015 | |||||||||||
| 10.5 | Stadium Techcenter Lease between The Landing SC, LLC, as Landlord, and the Registrant, as Tenant, dated May 19, 2014. | S-1 | 333-200044 | 10.6 | November 10, 2014 | |||||||||||
114
Table of Contents
| Exhibit |
Exhibit Description |
Incorporated by Reference | ||||||||||||||
| Form |
File No. |
Exhibit |
Filing Date |
Filed | ||||||||||||
| 10.6† | Commercial Agreement, as amended, between the Registrant and Yahoo! Inc., dated June 21, 2011. | S-1 | 333-200044 | 10.7 | November 10, 2014 | |||||||||||
| 10.7† | Amendment #3 to Commercial Agreement between the Registrant and Yahoo! Inc., dated December 29, 2015. | X | ||||||||||||||
| 10.8# | Restricted Stock Purchase Agreement by and between the Registrant and Shaun Connolly, dated December 27, 2011. | S-1 | 333-200044 | 10.9 | November 10, 2014 | |||||||||||
| 10.10# | 2014 Employee Stock Purchase Plan, as amended and restated on August 24, 2015. | 10-Q | 001-36780 | 10.1 | November 12, 2015 | |||||||||||
| 10.11# | Senior Executive Cash Incentive Bonus Plan | S-1 | 333-200044 | 10.11 | November 10, 2014 | |||||||||||
| 10.12# | Non-Employee Director Compensation Policy | S-1 | 333-200044 | 10.12 | November 10, 2014 | |||||||||||
| 10.13† | HDP for Microsoft Platforms Agreement between the Registrant and Microsoft Corporation, dated July 3, 2012. | S-1 | 333-200044 | 10.13 | November 10, 2014 | |||||||||||
| 21.1 | List of Subsidiaries. | X | ||||||||||||||
| 23.1 | Consent of Deloitte & Touche, LLP independent registered public accounting firm. | X | ||||||||||||||
| 31.1 | Certification of Chief Executive Officer pursuant to Exchange Act Rules 13a-14(a) and 15d-14(a), as adopted pursuant to Section 302 of the Sarbanes-Oxley Act of 2002. | X | ||||||||||||||
| 31.2 | Certification of Chief Financial Officer pursuant to Exchange Act Rules 13a-14(a) and 15d-14(a), as adopted pursuant to Section 302 of the Sarbanes-Oxley Act of 2002. | X | ||||||||||||||
| 32.1* | Certifications of Chief Executive Officer and Chief Financial Officer pursuant to 18 U.S.C. Section 1350, as adopted pursuant to Section 906 of the Sarbanes-Oxley Act of 2002. | X | ||||||||||||||
115
Table of Contents
| Exhibit |
Exhibit Description |
Incorporated by Reference | ||||||||||
| Form |
File No. |
Exhibit |
Filing Date |
Filed | ||||||||
| 101 | The following materials from Hortonworks, Inc.’s Annual Report on Form 10-K for the year ended December 31, 2015, formatted in XBRL (eXtensible Business Reporting Language): (i) Consolidated Balance Sheets; (ii) Consolidated Statements of Operations; (iii) Consolidated Statements of Comprehensive Loss; (iv) Consolidated Statements of Convertible Preferred Stock and Stockholders’ (Deficit) Equity; (v) Consolidated Statements of Cash Flows; and (vi) Notes to Consolidated Financial Statements. | X | ||||||||||
| # | Indicates management contract or compensatory plan, contract or agreement. |
| † | Confidential treatment requested as to certain portions of this exhibit, which portions have been omitted and submitted separately to the Securities and Exchange Commission. |
| * | The certifications attached as Exhibit 32.1 that accompany this Annual Report on Form 10-K, are not deemed filed with the Securities and Exchange Commission and are not to be incorporated by reference into any filing of Hortonworks, Inc. under the Securities Act of 1933, as amended, or the Securities Exchange Act of 1934, as amended, whether made before or after the date of this Annual Report on Form 10-K, irrespective of any general incorporation language contained in such filing. |
116