Attached files
| file | filename |
|---|---|
| EX-31.2 - EX-31.2 - FBR & Co. | fbrc-ex312_6.htm |
| EX-12.1 - EX-12.1 - FBR & Co. | fbrc-ex121_9.htm |
| EX-31.1 - EX-31.1 - FBR & Co. | fbrc-ex311_7.htm |
| EX-32.2 - EX-32.2 - FBR & Co. | fbrc-ex322_8.htm |
| EX-32.1 - EX-32.1 - FBR & Co. | fbrc-ex321_10.htm |
| EX-21.1 - EX-21.1 - FBR & Co. | fbrc-ex211_13.htm |
| EX-23.1 - EX-23.1 - FBR & Co. | fbrc-ex231_12.htm |
| EX-23.2 - EX-23.2 - FBR & Co. | fbrc-ex232_11.htm |
UNITED STATES
SECURITIES AND EXCHANGE COMMISSION
Washington, D.C. 20549
FORM 10-K
(Mark One)
|
x |
ANNUAL REPORT PURSUANT TO SECTION 13 OR 15(d) OF THE SECURITIES EXCHANGE ACT OF 1934 |
For the fiscal year ended December 31, 2015
OR
|
¨ |
TRANSITION REPORT PURSUANT TO SECTION 13 OR 15(d) OF THE SECURITIES EXCHANGE ACT OF 1934 |
For the transition period from to
Commission File Number: 001-33518
FBR & Co.
(Exact name of registrant as specified in its charter)
|
Virginia |
|
20-5164223 |
|
(State or other jurisdiction of Incorporation or organization) |
|
(I.R.S. Employer Identification No.) |
|
|
|
|
|
1300 North Seventeenth Street, Arlington, VA |
|
22209 |
|
(Address of principal executive offices) |
|
(Zip Code) |
(703) 312-9500
(Registrant’s telephone number, including area code)
Securities registered pursuant to section 12(b) of the act:
|
Title of Each Class |
|
Name of Each Exchange on which Registered |
|
Common Stock, Par Value $0.001 |
|
The NASDAQ Stock Market LLC (The NASDAQ Global Select MarketSM) |
Securities registered pursuant to section 12(g) of the act: None
Indicate by check mark if the registrant is a well-known seasoned issuer, as defined in Rule 405 of the Securities Act: Yes ¨ No x
Indicate by check mark if the registrant is not required to file reports pursuant to Section 13 or Section 15(d) of the Act: Yes ¨ No x
Indicate by check mark whether the registrant (1) has filed all reports required to be filed by Section 13 or 15(d) of the Securities Exchange Act of 1934 during the preceding 12 months (or for such shorter period that the registrant was required to file such reports), and (2) has been subject to such filing requirements for the past 90 days: Yes x No ¨
Indicate by check mark whether the registrant has submitted electronically and posted on its corporate Web site, if any, every Interactive Data File required to be submitted and posted pursuant to Rule 405 of Regulation S-T (§232.405 of this chapter) during the preceding 12 months (or for such shorter period that the registrant was required to submit and post such files). Yes x No ¨
Indicate by check mark if disclosure of delinquent filers pursuant to Item 405 of Regulation S-K (§229.405 of this chapter) is not contained herein, and will not be contained, to the best of registrant’s knowledge, in definitive proxy or information statements incorporated by reference in Part III of this Form 10-K or any amendment to this Form 10-K: x
Indicate by check mark whether the registrant is a large accelerated filer, an accelerated filer, a non-accelerated filer, or a smaller reporting company. See definitions of “large accelerated filer,” “accelerated filer” and “smaller reporting company” in Rule 12b-2 of the Exchange Act:
|
Large Accelerated Filer ¨ |
Accelerated Filer x |
Non-Accelerated Filer ¨ |
Smaller Reporting Company ¨ |
Indicate by check mark whether the registrant is a shell company (as defined in Rule 12b-2 of the Exchange Act): Yes ¨ No x
The aggregate market value of FBR & Co.’s outstanding common stock held by non-affiliates as of June 30, 2015 was approximately $161.0 million based on the closing price of the registrant’s common stock on such date as reported on The NASDAQ Stock Market LLC. In determining this figure, the registrant has excluded all shares of common stock beneficially owned by its directors and executive officers and each person who beneficially owns 10% or more of FBR & Co.’s outstanding common stock. By doing so, the registrant does not admit that such persons are affiliates within the meaning of Rule 405 of the Securities Act of 1933, as amended, or for any other purpose.
On March 1, 2016, there were 7,384,874 shares of FBR & Co. common stock outstanding.
DOCUMENTS INCORPORATED BY REFERENCE
|
Document |
|
Where Incorporated |
|
FBR & Co. 2016 Proxy Statement (to be filed with the Securities and Exchange Commission on or before April 30, 2016) |
|
Part III, Items 10, 11, 12, 13 and 14 |
|
|
|
Page |
||
|
|
1 |
|||
|
|
3 |
|||
|
|
|
|
|
|
|
PART I |
|
|
|
|
|
|
|
|
|
|
|
Item 1. |
|
|
4 |
|
|
Item 1A. |
|
|
11 |
|
|
Item 1B. |
|
|
23 |
|
|
Item 2. |
|
|
23 |
|
|
Item 3. |
|
|
23 |
|
|
Item 4. |
|
|
24 |
|
|
|
|
|
|
|
|
PART II |
|
|
|
|
|
|
|
|
|
|
|
Item 5. |
|
|
25 |
|
|
Item 6. |
|
|
26 |
|
|
Item 7. |
|
Management’s Discussion and Analysis of Financial Condition and Results of Operations |
|
28 |
|
Item 7A. |
|
|
51 |
|
|
Item 8. |
|
|
51 |
|
|
Item 9. |
|
Changes In and Disagreements with Accountants on Accounting and Financial Disclosure |
|
52 |
|
Item 9A. |
|
|
52 |
|
|
Item 9B. |
|
|
53 |
|
|
|
|
|
|
|
|
PART III |
|
|
|
|
|
|
|
|
|
|
|
Item 10. |
|
|
53 |
|
|
Item 11. |
|
|
53 |
|
|
Item 12. |
|
Security Ownership of Certain Beneficial Owners and Management and Related Shareholder Matters |
|
53 |
|
Item 13. |
|
Certain Relationships and Related Transactions, and Director Independence |
|
53 |
|
Item 14. |
|
|
53 |
|
|
|
|
|
|
|
|
PART IV |
|
|
|
|
|
|
|
|
|
|
|
Item 15. |
|
|
54 |
|
|
|
57 |
|||
|
|
F-1 |
|||
Some of the statements contained in or incorporated by reference in this Form 10-K are forward-looking statements within the meaning of Section 27A of the Securities Act of 1933, as amended (the “Securities Act”), and Section 21E of the Securities Exchange Act of 1934, as amended (the “Exchange Act”). Forward-looking statements are predictive in nature and can be identified by the use of forward-looking words such as “anticipate,” “believe,” “could,” “estimate,” “expect,” “intend,” “may,” “plan,” “goal,” “objective,” “potential,” “project,” “should,” “will” and “would” or the negative of these terms or other comparable terminology. Statements concerning projections, future performance, developments, events, revenues, expenses, earnings, run rates, and any other guidance on present or future periods constitute forward-looking statements. Such statements include, but are not limited to, those relating to the effects of growth, our principal investing activities and our current equity capital levels. Forward-looking statements involve risks and uncertainties. Although we believe the expectations reflected in the forward-looking statements are reasonable, we cannot guarantee future results, levels of activity, performance or achievement. You should not rely upon forward-looking statements as predictions of future events. You should be aware that a number of important factors could cause our actual results to differ materially from those in forward-looking statements. These factors include, but are not limited to:
|
|
· |
the risks identified under the section captioned “Risk Factors” in this Form 10-K; |
|
|
· |
volatility of the capital markets and in economic conditions generally; |
|
|
· |
substantial fluctuations in our financial results; |
|
|
· |
deterioration in the business environment in the specific sectors of the economy in which we focus or a decline in the market for securities of companies within these sectors; |
|
|
· |
our ability to retain our senior professionals; |
|
|
· |
pricing and other competitive pressures; |
|
|
· |
changes in laws and regulations and industry practices that adversely affect our business; |
|
|
· |
incurrence of losses in the future; |
|
|
· |
the singular nature of our capital markets and strategic advisory engagements; |
|
|
· |
competition among financial services firms for business and personnel; |
|
|
· |
larger and more frequent capital commitments in our trading and underwriting businesses; |
|
|
· |
limitations on our access to capital; |
|
|
· |
malfunctioning or failure in our operations and infrastructure; |
|
|
· |
our entry into new business areas, including entry through strategic investments, acquisitions and joint ventures; |
|
|
· |
failure to maintain effective internal controls; |
|
|
· |
declines in the market value and/or net asset value of our principal investments; |
|
|
· |
the loss of our exemption from registration as an investment company under the Investment Company Act of 1940, as amended (the “1940 Act”); |
|
|
· |
the overall environment for interest rates; |
|
|
· |
changes in our business strategy; and |
|
|
· |
availability, terms and deployment of capital. |
1
Forward-looking statements speak only as of the date they are made, and we undertake no duty to update any of these forward-looking statements after the date of this Form 10-K to conform prior statements to actual results or revised expectations unless otherwise required by law. New risks emerge from time to time and it is not possible for us to predict all risks, nor can we assess the impact of all factors or the effect which any factor, or combination of factors, may have on our business. Actual results may differ materially from those contained in any forward-looking statement. This Form 10-K, including the consolidated financial statements and notes thereto and the documents incorporated by reference herein, should be read for a complete understanding of our business, an investment in our company and the risks and other uncertainties associated with our business or an investment in our company.
2
FBR & Co. (“we,” “us,” “our company” or the “Company”) files annual, quarterly and current reports, proxy statements, information statements and other information with the United States Securities and Exchange Commission (the “SEC”). You may read and copy any document we file with the SEC at the SEC’s Public Reference Room at 100 F Street, NE, Washington, DC 20549. You may obtain information on the operation of the Public Reference Room by calling the SEC at 1-800-SEC-0330. The SEC maintains an internet site that contains annual, quarterly and current reports, proxy and information statements and other information regarding issuers that file electronically with the SEC. Our electronic SEC filings are available to the public at http://www.sec.gov.
Our public internet site is http://www.fbr.com. We make available free of charge through our public internet site our annual reports on Form 10-K, quarterly reports on Form 10-Q, current reports on Form 8-K and amendments to those reports filed or furnished pursuant to Section 13(a) or 15(d) of the Exchange Act as soon as reasonably practicable after we electronically file such material with, or furnish it to, the SEC. We also make available through our public internet site statements of beneficial ownership of our equity securities filed by our directors, officers, 10% or greater shareholders and others under Section 16 of the Exchange Act.
We also make available on http://www.fbr.com (i) our Corporate Governance Guidelines, (ii) Statement of Business Principles (our code of business conduct and ethics), including any waivers, if any, therefrom granted to executive officers or directors, and (iii) the charters of the Audit, Compensation, and Nominating and Corporate Governance Committees of our Board of Directors. These documents are also available in print without charge to any person who requests them by writing or telephoning:
FBR & Co.
1300 North Seventeenth Street
Arlington, Virginia 22209
(703) 312-9500
Attention: Corporate Secretary
3
PART I
Overview
FBR & Co. is a full-service investment banking and institutional brokerage firm with a deep expertise and focus on the equity capital markets. Since the founding of certain predecessor companies, we have grown from a boutique investment bank with primary expertise in financial institutions into a full-service U.S. investment bank for middle-market companies.
Through our broker-dealer operating subsidiaries we have focused our business on providing:
|
|
· |
capital raising services, including underwriting and placement of public and private equity, equity-linked and debt securities; |
|
|
· |
financial advisory services, including merger and acquisition (“M&A”) advisory, restructuring, liability management, recapitalization and strategic alternative analysis; |
|
|
· |
institutional sales and trading services focused on equities, equity-linked securities, high-yield bonds, senior debt and bank loans, as well as securities lending activities; and |
|
|
· |
differentiated securities research focused on the core issues driving performance of our covered companies and industry sectors. |
We focus our capital markets business (investment banking and institutional brokerage) in the following industry sectors—consumer, energy and natural resources, financial institutions, healthcare, industrials, insurance, real estate, and technology, media and telecommunications (“TMT”). Approximately 70% of the companies included in the S&P 500 Index conduct business in the industry sectors in which we focus. We also make principal investments, including merchant banking investments, with our own capital.
In June 2007 we became a publicly-traded company listed on The NASDAQ Global Select MarketSM (NASDAQ: FBRC). We are a Virginia corporation formed in June 2006 and headquartered in Arlington, Virginia and also have offices in Boston, Dallas, Houston, Los Angeles, New York and San Francisco. The address of our principal executive offices is 1300 North Seventeenth Street, Arlington, Virginia 22209. Our telephone number is (703) 312-9500.
Business Segments
Our business is comprised of two separate segments: capital markets, which includes investment banking, institutional brokerage and research; and principal investing. During the first quarter of 2016, based on changes in the Company’s business profile since its IPO in 2007, including significant changes in capital allocation and revenue mix that have occurred over that time, the Company will revise its segment reporting structure. Beginning with the first quarter of 2016, the Company’s investment activities will be included within its capital markets segment and not as a separate reportable segment. This change is consistent with how the Company’s chief operating decision maker evaluates performance and allocates resources.
Financial information concerning our company for the fiscal years ended December 31, 2015, 2014, and 2013, including the amount of net revenues contributed by each segment in such periods, is set forth in our consolidated financial statements and the notes thereto in Part II, Item 8, of this Form 10-K. Information with respect to our operations by business segment is set forth under the captions “Management’s Discussion and Analysis of Financial Condition and Results of Operations—Executive Overview” in Part II, Item 7, of this Form 10-K and in Note 17 to our consolidated financial statements in Part II, Item 8, of this Form 10-K.
4
Capital Markets
Our capital markets business is conducted by our investment banking, institutional brokerage and research professionals through our SEC-registered broker-dealer subsidiaries FBR Capital Markets & Co. (“FBRCM”) and MLV & Co. LLC (“MLV”), the latter of which we acquired in September 2015. These professionals provide investment banking services, including capital raising and financial advisory services, for our corporate issuer clients, and institutional brokerage services including sales, trading, research, and securities lending services to our institutional investor clients. We believe the capital markets transactions sourced by our investment banking professionals create the types of investment opportunities that our institutional brokerage clients seek, while our institutional brokerage clients provide demand for our investment banking clients’ securities offerings, thus helping to provide these corporate issuers with the ability to meet their corporate financing needs.
Investment Banking
Our investment banking professionals, backed by their industry knowledge and our strong distribution platform, seek to establish and maintain relationships with our investment banking clients and to provide them with capital raising and financial advisory services. We currently provide capital raising services through industry specific investment banking teams that focus on the energy and natural resources, financial institutions, healthcare, industrials, insurance, real estate and TMT industries. These teams work closely with our capital markets personnel in originating and executing capital markets transactions. In addition to our industry specific teams, our financial sponsors group delivers investment banking products and solutions to the private equity community and their portfolio companies, and our financial advisory group delivers a broad range of financial advisory services to our investment banking clients.
As an investment bank with an ability to raise equity in both the private and public capital markets, we are frequently involved with companies early in their formation in order to establish relationships that will provide us with ongoing revenues as these companies’ corporate finance and financial advisory needs grow. We seek to provide our investment banking clients with the financing and advisory services that they will need at all stages of their corporate lifecycle.
Capital Raising. We have developed a strong market presence as a leading underwriter of equity securities in the United States. We base our decision to underwrite an offering of a client’s securities on company and industry fundamentals, management’s track record, historical financial results, financial projections, and other factors, all supported by extensive due diligence. We offer a wide range of financial products and services designed to serve the needs of our investment banking clients, including private, initial public, follow-on, at-the-market (“ATM”), and secondary offerings of common equity, convertible debt offerings, preferred stock offerings and high-yield debt offerings.
Strategic Advisory Services. Our financial advisory practice builds on our capital markets expertise and focuses on helping our investment banking clients to assess strategic alternatives, including advice on M&A, liability management and financial restructuring, and strategic partnerships. In addition, we provide valuation advice, fairness opinions, market comparable valuation analysis and other corporate finance advice.
Institutional Brokerage and Research
Through our institutional brokerage professionals, we provide research, institutional sales and trading services, and securities lending to institutional investors such as mutual funds, insurance companies, hedge funds, banks and broker-dealers, family offices, money managers and pension and profit-sharing plans. Our ability to work across multiple securities classes with clients enhances our overall brokerage relationships with our clients. We currently operate desks that cover the trading of equity securities, convertible securities, high-yield debt securities, and loan products, and the borrowing and lending of equity and fixed income securities. We also provide stock buy-back services to corporate issuer clients.
Institutional Brokerage. We believe our institutional brokerage professionals are distinguished by their in-depth understanding of the companies and industries on which we focus. Our traders and salespeople are required to develop detailed knowledge and relationships and provide trade execution and sales and trading services to a diverse
5
institutional client base. Many of our institutional clients have been long-standing investors in transactions that our investment banking teams have brought to the capital markets and have continued a close relationship with us as they have grown in size and assets under management.
Our sales professionals work closely with our research analysts and our trading desks to provide the most up-to-date information to our institutional clients. Our sales, trading, and research professionals work together to maintain regular contact with the specialized portfolio managers and buy-side analysts of each institutional client. We make markets in U.S. exchange-listed and other securities, we trade listed and unlisted securities and loan products, and we service the trading desks of major institutions in the United States, Europe and elsewhere.
Our securities lending professionals maintain relationships with a broad group of banks and broker-dealers to facilitate the sourcing, borrowing and lending of equity and fixed income securities in a “matched book” securities lending business. We monitor the market value of the securities borrowed and loaned on a daily basis.
Research. We understand the importance of research and the role quality research plays in the institutional brokerage process, particularly for accounts that do not maintain a large in-house research team. We seek to differentiate ourselves through originality of perspective, depth of insight, and our ability to uncover industry trends. We believe our unique viewpoint has helped us develop relationships with investor clients in both our primary distribution and secondary trading businesses.
Our research analysts operate under three guiding principles: (i) to provide objective, independent analysis of securities, their issuers, and their place in the capital markets; (ii) to identify attractive investment opportunities in the capital markets; and (iii) to communicate effectively the fundamentals of these investment opportunities to potential investors. To achieve these objectives, we believe that industry specialization is necessary and, as a result, we organize our research staff along industry lines. Each industry team works together to identify and evaluate industry trends and developments. Within industry groups, analysts are further subdivided into specific areas of focus so that they can maintain and apply specific industry knowledge to each investment opportunity they research.
After initiating coverage of a company, our analysts seek to maintain a long-term relationship with that company and a long-term commitment to ensure that new developments are effectively communicated to our sales force and institutional investors. Our research team analyzes major trends, publishes original research on new areas of growth, provides fundamental, company-specific coverage and works with our institutional clients to identify and evaluate public equity investment opportunities.
Principal Investing
Our principal investing activity consists of investments in merchant banking, marketable equity securities, non-public equity securities, corporate debt investments, non-registered investment funds that are managed by third parties, and U.S. Treasury securities. Our merchant banking investments include investments in selected private transactions that our investment banking group underwrites and investments sourced by our investment banking team unrelated to an investment banking transaction. In many cases this strategy involves investing our capital alongside the capital of our institutional clients.
Accounting, Administration and Operations
Our accounting, administration and operations personnel are responsible for financial controls, internal and external financial reporting, human resources and personnel services, office operations, information technology and telecommunications systems, the processing of securities transactions, and corporate communications. With the exception of payroll processing, which is performed by an outside service bureau, and customer account processing, which is performed by our clearing brokers, most data processing functions are performed internally.
6
Compliance, Legal, and Risk Management
Our compliance, legal and risk management personnel (together with other appropriate personnel) are responsible for our compliance procedures with regard to the legal and regulatory requirements of our company and for our procedures with regard to our exposure to market, credit, operations, liquidity, regulatory, legal and reputational risk. In addition, compliance personnel test for compliance by our personnel with our policies and procedures. Our legal personnel also provide legal services throughout our company, including advice on managing legal risk. The supervisory personnel in these areas have direct access to, and meet regularly with, our executive management and with the Audit Committee of our Board of Directors to ensure their independence in performing these functions. In addition to our internal compliance, legal, and risk management personnel, we outsource particular functions to outside consultants and attorneys for their particular expertise.
Financial Information about Geographic Areas
We operate predominately in the United States. We also provide investment banking, research, and sales and trading services to selected companies in international jurisdictions. Our revenues and long lived assets attributable to foreign operations have been immaterial for the last three fiscal years.
Competition
As a full-service investment banking and institutional brokerage firm, all aspects of our business are intensely competitive. Our competitors include large, fully integrated bank holding companies, as well as traditional and other brokerage firms, investment banking firms, merchant banks, financial advisory firms and electronic trading firms. We compete with some firms nationally and with others on a product or business line basis. Many of our competitors have substantially greater capital and resources than we do and offer a broader range of financial products and services. In particular, the ability to provide bank loan financing has become an important advantage for some of our largest competitors. We believe that the principal factors that allow us to compete effectively include the strength and extent of our client relationships, our reputation and track record, the abilities of our professionals, our market focus and the relative quality and price of our services and products.
We have experienced intense price competition in some areas of our capital markets businesses, in particular, within our trading business. The ability to execute trades electronically and through other alternative trading systems, has increased the pressure on trading commissions and spreads. We believe that this trend toward alternative trading systems is likely to continue. We may experience competitive pressures in these and other areas in the future as some of our competitors seek to increase market share by reducing prices.
Competition is also intense for the recruitment and retention of qualified professionals. The performance of our business is in large part dependent on the skills, expertise and performance of our employees. Our ability to continue to compete effectively in our businesses will depend upon our continued ability to attract new professionals and retain and motivate our existing professionals.
7
Risk Management
In conducting our business, we are exposed to a range of risks including, without limitation:
|
|
· |
Market risk. Market risk is the risk that a change in the level of one or more market prices, rates, indices, or other market factors, such as market liquidity, will result in losses for a position or portfolio. |
|
|
· |
Credit risk. Credit risk is the risk of loss due to an individual customer’s or institutional counterparty’s unwillingness or inability to pay its obligations. |
|
|
· |
Operations risk. Operations risk is the risk of loss resulting from systems failure, inadequate controls, human error, fraud or unforeseen catastrophes. |
|
|
· |
Liquidity risk. Liquidity risk is the risk that we may be unable to meet our obligations as they come due because of our inability to liquidate assets or obtain funding. Liquidity risk also includes the risk of having to sell assets at a loss to generate liquid funds. |
|
|
· |
Regulatory risk. Regulatory risk is the risk of loss, including fines, penalties or restrictions in our activities, from failing to comply with federal, state or local laws, rules and regulations, including the rules and regulations of self-regulatory bodies, pertaining to financial services activities. |
|
|
· |
Legal risk. Legal risk is the risk of loss, disruption or other negative effect on our operations or condition that arises from unenforceable contracts, lawsuits, adverse judgments, or adverse governmental or regulatory proceedings, or the threat thereof. |
|
|
· |
Reputational risk. Reputational risk is the risk that negative publicity regarding our practices, whether true or not, will cause a decline in the customer base, reduce our revenues, or result in costly litigation. |
We monitor business risks, including market, credit, operations, liquidity, regulatory, legal, and reputational risk, through a number of control procedures designed to identify and evaluate the various risks to which our businesses and investments are exposed. We have established various committees to assess and manage risk associated with our investment banking, institutional brokerage and principal investing activities. We review, among other things, business and transactional risks associated with potential investment banking clients and engagements. We seek to manage the risks associated with our investment banking and principal investing activities by review and approval of transactions by the relevant committee, prior to accepting an engagement or pursuing a material investment transaction. We maintain an independent risk management function and our director of risk management employs a variety of systems and calculations to monitor daily changes in the risks associated with trading in our institutional brokerage business and principal investing activities. For additional detail regarding our control procedures designed to identify and evaluate our market and business risk, see “Quantitative and Qualitative Disclosures about Market Risk” below. Although we believe that our risk management program and our internal controls are appropriately designed to address the risks to which we are exposed, we cannot provide assurance that our risk management program or our internal controls will prevent or reduce such risks.
Insurance
We maintain insurance in types and amounts and with deductibles that management believes are appropriate for our business and customary for companies of similar size and engaged in similar businesses. However, the insurance market is volatile, and there can be no assurance that any particular coverage will be available in the future on terms acceptable to us.
Employees
As of December 31, 2015, we had 303 employees in comparison to 300 employees as of December 31, 2014. Our employees are not subject to any collective bargaining agreement and we consider our relationship with our employees to be good.
8
Regulation
Our business, as well as the financial services industry generally, is subject to extensive regulation in the United States and elsewhere. As a matter of public policy, regulatory bodies in the United States and the rest of the world are charged with safeguarding the integrity of the securities and other financial markets and with protecting the interests of customers participating in those markets. In light of current conditions in the financial markets and the economy, regulators have increased their focus on the regulation of the financial services industry. Legislation in recent years, including the Dodd-Frank Wall Street Reform and Consumer Protection Act (“Dodd-Frank”), has substantially intensified the regulation of the financial services industry. Among other things, Dodd-Frank has expanded the authority of our existing regulators, broadened reporting requirements and regulation relating to executive compensation, and expanded the standards for market participants dealing with clients and customers. In addition, conditions in the global financial markets have caused regulatory agencies to increase their examination, enforcement and rulemaking activities. This regulatory environment will likely alter certain financial industry business practices and change the competitive landscape, which may have an adverse effect on our business, financial condition and results of operation.
In the U.S., the SEC is the federal agency responsible for the administration of the federal securities laws. Each of FBRCM and MLV is registered as a broker-dealer with the SEC and the Financial Industry Regulatory Authority, Inc. (“FINRA”), a self-regulatory organization, and in all 50 states, Puerto Rico and the District of Columbia. Accordingly, FBRCM and MLV are subject to regulation and oversight by the SEC and FINRA, which is itself subject to oversight by the SEC and which adopts and enforces rules governing the conduct, and examines the activities, of its member firms, including FBRCM, MLV and their respective registered representatives. State securities regulators also have regulatory or oversight authority over both FBRCM and MLV. Our business may also be subject to regulation by non-U.S. governmental and regulatory bodies and self-regulatory authorities in other countries where we operate.
Broker-dealers are subject to regulations that cover all aspects of the securities business, including sales methods, trade practices among broker-dealers, use and safekeeping of customers’ funds and securities, capital structure, record-keeping, the financing of customers’ purchases and the conduct and qualifications of directors, officers and employees. In particular, as registered broker-dealers and members of various self-regulatory organizations, both FBRCM and MLV are subject to the SEC’s uniform net capital rule, Rule 15c3-1. Rule 15c3-1 specifies the minimum level of net capital a broker-dealer must maintain and also requires that a significant part of its assets be kept in relatively liquid form. The SEC and various self-regulatory organizations impose rules that require notification when net capital falls below certain predefined criteria, limit the ratio of subordinated debt to equity in the regulatory capital composition of a broker-dealer and constrain the ability of a broker-dealer to expand its business under certain circumstances. Additionally, the SEC’s uniform net capital rule imposes certain requirements that may have the effect of prohibiting a broker-dealer from distributing or withdrawing capital and requiring prior notice to the SEC for certain withdrawals of capital.
Compliance with regulatory net capital requirements could limit those operations that require the intensive use of capital, such as underwriting and trading activities, and also could restrict our ability to withdraw capital from FBRCM and MLV, which in turn could limit our ability to pay dividends, repay debt and redeem or repurchase shares of our outstanding capital stock. The failure of either FBRCM or MLV to maintain its minimum required net capital would require it to cease executing customer transactions until it came back into compliance, and could cause it to lose its FINRA membership, its registration with the SEC or require its liquidation. Further, the decline in FBRCM’s or MLV’s net capital below certain early warning levels, even though above minimum net capital requirements, could cause material adverse consequences to us and to FBRCM or MLV, as the case may be.
9
FBRCM and MLV also are subject to “Risk Assessment Rules” imposed by the SEC which require, among other things, that certain broker-dealers maintain and preserve certain information, describe risk management policies and procedures and report on the financial condition of certain affiliates whose financial and securities activities are reasonably likely to have a material impact on the financial and operational condition of the broker-dealer. Certain “material associated persons” (as defined in the Risk Assessment Rules) of the broker-dealer and the activities conducted by such material associated persons may also be subject to regulation by the SEC. In addition, the possibility exists that, on the basis of the information it obtains under the Risk Assessment Rules, the SEC could seek authority over our unregulated subsidiaries either directly or through its existing authority over our regulated subsidiaries.
The research areas of investment banks have been and remain the subject of increased regulatory scrutiny. The New York Stock Exchange (the “NYSE”) and FINRA have adopted rules imposing heightened restrictions on the interaction between equity research analysts and investment banking personnel at member securities firms. In addition, in 2003 and 2004, several securities firms in the U.S. reached a settlement with certain federal and state securities regulators and self-regulatory organizations to resolve investigations into their equity research analysts’ alleged conflicts of interest.
The effort to combat money laundering and terrorist financing is a priority in governmental policy with respect to financial institutions. The USA PATRIOT Act of 2001, as amended (the “PATRIOT Act”), contains anti-money laundering and financial transparency laws and mandates the implementation of various new regulations applicable to broker-dealers and other financial services companies, including standards for verifying client identification at account opening, and obligations to monitor client transactions and report suspicious activities. Through these and other provisions, the PATRIOT Act seeks to promote the identification of parties that may be involved in terrorism or money laundering. Anti-money laundering laws outside the United States contain some similar provisions. The obligation of financial institutions, including us, to identify their customers, watch for and report suspicious transactions, respond to requests for information by regulatory authorities and law enforcement agencies, and share information with other financial institutions, has required the implementation and maintenance of internal practices, procedures and controls which have increased, and may continue to increase, our costs, and any failure with respect to our programs in this area could subject us to serious regulatory consequences, including substantial fines, and potentially other liabilities.
Certain of our businesses are subject to compliance with laws and regulations of U.S. federal and state governments, non-U.S. governments, their respective agencies and/or various self-regulatory organizations or exchanges relating to the privacy of client information, and any failure to comply with these regulations could expose us to liability and/or reputational damage.
Additional legislation, changes in rules promulgated by the SEC and self-regulatory organizations or changes in the interpretation or enforcement of existing laws and rules, either in the U.S. or elsewhere, may directly affect how we operate and our financial results and condition.
Our broker-dealer businesses are also subject to regulation by various foreign governments and regulatory bodies. FBRCM and MLV are registered with and subject to regulation by a number of provincial securities regulators in Canada. Foreign regulation may govern all aspects of the investment business, including regulatory capital, sales and trading practices, conflicts of interest, research, use and safekeeping of customer funds and securities, record-keeping, margin practices and procedures, registration standards for individuals, periodic reporting and settlement procedures.
The U.S. and non-U.S. government agencies and self-regulatory organizations, as well as state securities commissions in the United States, are empowered to conduct administrative proceedings that can result in censure, fine, the issuance of cease-and-desist orders or the suspension or expulsion of a broker-dealer or its directors, officers or employees. Occasionally, we have been subject to investigations and proceedings, and sanctions have been imposed on us for infractions of various regulations relating to our activities.
10
You should carefully consider the following risks and all of the other information contained in this Form 10‑K, including the consolidated financial statements and the notes thereto included in Part II, Item 8, of this Form 10‑K. If any of the risks, uncertainties, events or developments described below occurs, our business, financial condition or results of operation could be negatively impacted. In connection with the forward-looking statements that appear in this Form 10‑K, you should also carefully review the cautionary statements included under the caption “Forward-Looking Statements.”
Risks Related to Our Business
Our businesses have been and may in the future be materially and adversely affected by financial market conditions and economic conditions generally.
As an investment bank, risk is an inherent part of our business. Our businesses are materially affected by conditions in the financial markets, particularly the equity capital markets, and economic conditions generally. Conditions in the financial markets in 2015 were marked by declines in energy prices, persistent market volatility and a challenging environment for small-cap equity capital raising. Lower levels of liquidity continue to have a negative effect on trading volumes, particularly in the equity market, which has a direct negative impact on our cash equities trading business.
Our financial performance is highly dependent on the environment in which our businesses operate. A favorable business environment is generally characterized by, among other factors, high global gross domestic product growth, stable geopolitical conditions, transparent and efficient capital markets, liquid markets with active investors, low inflation, high business and consumer confidence and strong business earnings. Slowing growth, contraction of credit, increasing energy prices, declines in business or investor confidence or risk tolerance, increases in inflation, higher unemployment, outbreaks of hostilities or other geopolitical instability, corporate, political or other scandals that reduce investor confidence in capital markets and natural disasters, among other things, can affect the global financial markets. In addition, economic or political pressures in a country or region may cause local market disruptions and currency devaluations, which may also affect markets generally. In the event of changes in market conditions, such as interest or foreign exchange rates, equity, fixed income, commodity or real estate valuations, liquidity, availability of credit or volatility, our businesses could be adversely affected in many ways.
Our investment banking revenues are directly related to the number and size of the transactions in which we participate. Any future market downturns that affect the size and number of capital raising transactions will likely have a negative impact on our investment banking business. Sustained market downturns and credit market dislocations and liquidity issues in the future would also likely lead to a further decline in the volume of secondary market trading that we execute for our institutional brokerage clients and, therefore, to a decline in the revenues we receive from commissions and spreads earned from the trades we execute for our clients. Heightened risk aversion among investors may cause them to shift their trading activity to higher quality and more liquid products, which are generally less profitable for us.
We incurred a loss in 2015 and we have incurred losses in certain prior periods; we may incur losses in the future.
We incurred a net loss for the year ended December 31, 2015 of $7.5 million and we have incurred losses in certain prior periods. We may incur losses in future periods. If we are unable to fund future losses, those losses may have a significant effect on our liquidity as well as our ability to operate.
In addition, we may incur significant expenses in connection with any expansion of our capital markets businesses or in connection with strategic acquisitions and investments. Specifically, we have invested, and will continue to invest, in our capital markets businesses, including hiring a number of senior professionals to expand our product offerings. Accordingly, we would need to increase our revenues at a rate greater than our expenses to achieve and maintain profitability. If our revenues do not increase sufficiently, or if our revenues increase but we are unable to manage our expenses, we may incur losses in future periods.
11
Our financial results may fluctuate substantially from quarter-to-quarter and year-to-year.
We have experienced, and expect to experience in the future, significant quarterly variations in our revenues and results of operations. These variations may be attributed in part to the fact that our investment banking revenues are typically earned upon the successful completion of a transaction, the timing of which is uncertain and beyond our control. In most cases, we receive little or no payment for investment banking engagements that do not result in the successful completion of a transaction. As a result, our business is highly dependent on market conditions as well as the decisions and actions of our clients and interested third parties. For example, a client’s securities offering may be delayed or terminated because of adverse market conditions, failure to obtain necessary regulatory approvals or unexpected financial or other problems in the client’s business. If the parties fail to complete an offering in which we are participating as an underwriter or placement agent, we will earn little or no revenue from the transaction. This risk may be intensified by our focus on early-stage companies in certain sectors, as the market for securities of these companies may experience significant variations in the number and size of equity offerings as well as the after-market trading volume and prices of newly issued securities, and the fact most of our investment banking revenue is generated from a relatively small number of significant transactions. Many companies initiating the process of an initial public offering or private institutional equity raise are simultaneously exploring M&A exit opportunities. Our investment banking revenues would be adversely affected in the event that an equity offering for which we are acting as an underwriter is preempted by the company’s sale. As a result of the foregoing, we are unlikely to achieve steady and predictable earnings on a quarterly basis.
We are dependent on our executive management team, and we may not be able to execute our business plan in the event that members of our executive management team are no longer available to us and we are unable to find suitable replacements for them or the members of our executive management team do not dedicate a sufficient amount of their professional time to our endeavors.
We depend on the efforts, skill, reputations and business contacts of our executive management team, and we believe that our success depends to a significant extent upon the experience of these individuals, whose continued service is not guaranteed. We have no assurance that the services of our executive management team will continue to be available to the full extent of our needs. If certain members of our executive management team leave our company or are otherwise no longer available to us or are not available to the full extent of our needs, we may not be able to replace them with suitable management and may be unable to execute our business plan.
We encounter intense competition for qualified professionals from other investment banking firms and from businesses outside the investment banking industry, such as hedge, private equity and venture capital funds, and our failure to hire qualified professionals and retain our existing professionals may materially impede the success and growth of our business.
Our people are our most valuable resource. Our ability to secure and maintain investment banking engagements and brokerage business depends upon the reputation, judgment, business generation capabilities and project execution skills of our professionals. Our professionals’ reputations and relationships with our clients are a critical element in obtaining and executing client engagements. Generally, we do not have employment or non-competition agreements with our professionals. We encounter intense competition for qualified professionals from other companies in the investment banking industry and from businesses outside the investment banking industry, such as hedge, private equity and venture capital funds. We may experience losses of investment banking, brokerage, research and other professionals and our failure to hire qualified professionals and retain our existing professionals may materially impede our success and growth. While we believe that we will continue to be able to retain and recruit qualified professionals, the departure or other loss of our key professionals who manage substantial client relationships or who possess substantial experience and expertise could impair our ability to secure or successfully complete engagements, which could materially adversely affect our business and results of operations. Any negative financial performance that results in lower compensation levels may exacerbate this risk. In challenging market conditions, as have occurred in recent years, it may be difficult to pay competitive compensation without our ratio of compensation expense to revenues becoming higher. In addition, if any of our investment bankers or members of our executive management team were to join an existing competitor or form a competing company, some of our clients could choose to use the services of that competitor instead of our services. We may not be able to prevent our key professionals or the members of our executive management team from resigning to join our competitors or from forming a competing company.
12
Our capital markets and strategic advisory engagements are singular in nature and our failure to obtain new engagements may harm our operating results.
Our investment banking clients generally retain us on a short-term, engagement-by-engagement basis in connection with specific capital markets or M&A transactions, rather than on a recurring basis under long-term contracts. As these transactions are typically singular in nature and our engagements with these clients may not recur, we must continuously seek out new engagements when our current engagements are successfully completed or are terminated. As a result, high activity levels in any period are not necessarily indicative of continued high levels of activity in any subsequent period. If we are unable to generate a substantial number of new engagements that generate fees from the successful completion of transactions, our business and results of operations would be materially and adversely affected.
We depend on relatively few industries to generate a significant percentage of our revenue, which may limit our revenues and net income and may adversely affect our operating results.
We are dependent on revenues related to securities issued by companies in specific industry sectors. The real estate, energy and natural resources, industrials, insurance, and financial institutions sectors account for the majority of our investment banking, institutional trading and research activities. Therefore, any downturn in the market for the securities of companies in these industry sectors, or factors affecting such companies, could adversely affect our operating results and financial condition. Additionally, the frequency and size of securities offerings can vary significantly from industry to industry due to economic, legislative, regulatory and political factors.
Underwriting and other capital raising transactions, strategic advisory engagements and related trading activities in the industries on which we focus represent a significant portion of our businesses. This concentration of activity exposes us to the risk of substantial declines in revenues in the event of downturns in these industries. Future downturns in the industries on which we focus could result in a decrease in the size or number of transactions we complete, which would reduce our investment banking revenues.
We also derive a significant portion of our revenues from institutional sales and trading transactions related to the securities of companies in these sectors. Our revenues from such institutional sales and trading transactions may decline when underwriting activities in these industry sectors decline, the volume of trading on the NASDAQ, the NYSE or any other securities market or exchange declines, or when industry sectors or individual companies report results below investors’ expectations.
Pricing and other competitive pressures may impair the revenues and profitability of our institutional brokerage business.
We derive a significant portion of our revenues from our institutional brokerage business. Along with other firms, we have experienced intense price competition in this business in recent years. In particular, the ability to execute trades electronically and through alternative trading systems has increased the pressure on trading commissions and spreads. We expect pricing pressures in the business to continue. We believe we may experience competitive pressures in these and other areas in the future as some of our competitors seek to obtain market share by competing on the basis of price or use their own capital to facilitate client trading activities. In addition, we face pressure from our larger competitors, which may be better able to offer a broader range of complementary products and services to clients in order to win their trading business. If we are unable to compete effectively in these areas, the revenues from our sales and trading business may decline, and our business and results of operations may be adversely affected. Our research and institutional brokerage business also may be adversely affected by changes in laws and regulations and industry practices.
Our institutional brokerage revenues may decline due to competition from alternative trading systems and lower overall volume.
Securities and futures transactions are now being conducted electronically and via other alternative, non-traditional trading systems, and it appears that the trend toward alternative trading systems will continue and probably accelerate. In addition, industry-wide trading volumes of equity securities have declined in recent years. Any dramatic increase in computer-based or other electronic trading or further declines in trading volumes may
13
adversely affect our institutional brokerage revenues. The NYSE’s adoption of its hybrid market for trading securities may increase pressure on our institutional brokerage business as customers execute more of their NYSE-related trades electronically. Even if we were to develop our own electronic trading systems, we cannot assure you that the revenues generated by these systems will yield an adequate return on our investment, particularly given the relatively lower commissions arising from electronic trades. As a result, our institutional brokerage revenues could decline in the future, which would negatively impact our cash flows and the value of our common stock.
We face strong competition from larger firms, some of which have greater resources and name recognition, which may impede our ability to grow our business.
The brokerage and investment banking industries are intensely competitive and we expect them to remain so. We compete on the basis of a number of factors, including client relationships, reputation, the abilities of our professionals, market focus and the relative quality and price of our services and products. We have experienced intense price competition in some of our businesses; in particular, discounts in large block trades and trading commissions and spreads. In addition, pricing and other competitive pressures in investment banking, including multiple book runners, co-managers and multiple financial advisors handling transactions, have continued and could adversely affect our revenues. We believe we may experience competitive pressures in these and other areas in the future as some of our competitors seek to obtain market share by competing on the basis of price.
Many of our competitors in the brokerage and investment banking industries have a broader range of products and services, greater financial and marketing resources, larger customer bases, greater name recognition, more senior professionals to serve their clients’ needs, greater global reach and more established relationships with clients than we have. These larger and better capitalized competitors may be better able to respond to changes in the brokerage and investment banking industries, to compete for skilled professionals, to finance acquisitions, to fund internal growth and to compete for market share generally.
The scale of our competitors has increased in recent years as a result of substantial consolidation among companies in the brokerage and investment banking industries. In addition, a number of large commercial banks, insurance companies and other broad-based financial services firms have established or acquired underwriting or financial advisory practices and broker-dealers or have merged with other financial institutions. These firms have the ability to offer a wider range of products than we do, which may enhance their competitive position. They also have the ability to support investment banking with commercial banking, insurance and other financial services in an effort to gain market share, which has resulted, and could further result, in competitive and pricing pressure in our businesses. In particular, the ability to provide financing has become an important advantage for some of our larger competitors and, because we do not provide such financing, we may be unable to compete as effectively for clients in a significant part of the brokerage and investment banking market. If we are unable to compete effectively with our competitors, our business, financial condition and results of operations will be adversely affected.
Larger and more frequent capital commitments in our trading and underwriting business increase the potential for us to incur significant losses.
We commit our capital to maintain trading positions in the equity, convertible securities and debt markets. We may enter into large transactions in which we commit our own capital as part of our client trading activities. The number and size of these large transactions may adversely affect our results of operations in a given period. Although, as discussed below, we take measures to manage market risk, we may also incur significant losses from our trading activities due to market fluctuations and volatility in our results of operations. To the extent that we own assets, i.e., have long positions, in any of those markets, a downturn in the value of those assets or in those markets could result in losses. Conversely, to the extent we have sold assets we do not own, i.e., have short positions, in any of those markets, an upturn in those markets could expose us to potentially large losses as we attempt to cover our short positions by acquiring assets in a rising market. Additionally, to the extent that we purchase “when issued” securities (i.e., securities that are trading but have not been issued by the issuer) from our trading clients between the pricing date and closing date of an issuer’s securities offering, we may be unable to sell those securities if an adverse event occurs between the pricing and closing date that changes the terms of such offering or securities.
We use a number of quantitative measures to manage our exposure to market risk, including inventory position limits, scenario analysis, and value at risk, or VaR. VaR is a model that quantifies potential losses using
14
historical data. Because the historical market prices used in our VaR analysis may not be an accurate measure of future market events and conditions, especially in highly stressful market environments, and because our VaR model measures the risk of a current net trading position and does not take into account future position changes arising from transaction and/or hedging activity, we could incur losses that are materially greater than our reported VaR, and our business, financial condition and results of operations could be adversely affected.
Many financial services firms commit their own capital as part of their business activities. For example, in order to win business, investment banks may commit to purchase large blocks of stock from publicly traded issuers or significant shareholders, instead of the more traditional marketed underwriting process, in which marketing is typically completed before an investment bank commits to purchase securities for resale. Additionally, standard securities underwritings require investment banks to commit large amounts of capital prior to the closing of such offerings. We have committed capital in these ways, and expect in the future that we will continue to do so from time to time. As a result, we will be subject to risk as we commit capital to facilitate primarily client-driven business and, therefore, may suffer losses even when economic and market conditions are generally favorable for others in the industry.
Limitations on our access to capital could impair our liquidity and our ability to conduct our businesses.
Liquidity, or ready access to funds, is essential to financial services firms. Failures of financial institutions have often been attributable in large part to insufficient liquidity. Liquidity is of particular importance to our trading business and perceived liquidity issues may affect our clients’ and counterparties’ willingness to engage in brokerage transactions with us. Our liquidity could be impaired due to circumstances that we may be unable to control, such as a general market disruption or an operational problem that affects our trading clients, third parties or us. Further, our ability to sell assets may be impaired if other market participants are seeking to sell similar assets at the same time. Finally, additional repurchases by us of our shares of common stock will further reduce cash available for operations and future growth.
FBRCM and MLV, both of which are U.S. registered broker-dealers, are subject to the net capital requirements of the SEC and various self-regulatory organizations of which they are members. These requirements typically specify the minimum level of net capital a broker-dealer must maintain and also mandate that a significant part of its assets be kept in relatively liquid form. Prior to our acquisition of MLV, MLV self-reported to FINRA that its regulatory net capital levels had temporarily fallen below minimum required levels. FINRA is currently engaged in an inquiry regarding the circumstances of that event. An adverse finding by FINRA may result in censure, fines, and/or other penalties. Any other failure by either FBRCM or MLV to comply with its net capital requirements could also impair our ability to conduct our core business as a brokerage firm.
Furthermore, both FBRCM and MLV are subject to laws that authorize regulatory bodies to block or reduce the flow of funds from it to FBR & Co. As a holding company, we are dependent on dividends, distributions and other payments from our subsidiaries to fund our obligations, including any debt obligations we may incur. As a result, regulatory actions could impede access to funds that we need to make payments on our obligations, including any debt obligations we may incur.
We are highly dependent on communications, information and other systems and third parties, and any systems failures, malicious attack or unauthorized access could significantly disrupt our business.
Our business is highly dependent on communications, information and other systems, including systems provided by our clearing brokers, and by and for other third parties. Any failure or interruption of our systems, the systems of our clearing brokers or third-party trading or information systems could cause delays or other problems in our securities trading activities, which could have a material adverse effect on our operating results and negatively affect the market price of our common stock. In 2015, we switched our principal clearing brokerage firm from J.P. Morgan Clearing Corp., to Merrill, Lynch, Pierce, Fenner and Smith Incorporated. In the event that our principal clearing broker was to exit the business, we would be required to enter into alternative clearing arrangements. There can be no assurance that such arrangements will be available on terms that are not materially less favorable to us, or at all. Any failure to do so could adversely affect our ability to execute transactions, service our clients and manage our exposure to risk.
15
In addition, our clearing brokers provide elements of our principal disaster recovery system. We cannot assure you that we or our clearing brokers will not suffer any systems failure or interruption, including one caused by a hurricane, earthquake, fire, other natural disaster, power or telecommunications failure, act of God, act of war, terrorist attack, pandemic or other emergency situation, or that our or our clearing brokers’ back-up procedures and capabilities in the event of any such failure or interruption will be adequate. The occurrence of any failures or interruptions could significantly harm our business.
Secure processing, storage and transmission of confidential and other information in our internal and third-party computer systems and networks also is critically important to our business. We take protective measures and endeavor to modify them as circumstances warrant. However, despite our security measures, our computer systems, software and networks may be vulnerable to unauthorized access, attack by hackers, computer viruses or other malicious code, inadvertent, erroneous or intercepted transmission of information (including by e-mail), and other events that could have an information security impact. If one or more of such events occur, this potentially could jeopardize our or our clients’ or counterparties’ confidential and other information processed and stored in, and transmitted through, our computer systems and networks, or otherwise cause interruptions or malfunctions in our, our clients’, our counterparties’ or third parties’ operations. We may be required to expend significant additional resources to modify our protective measures or to investigate and remediate vulnerabilities or other exposures, and we may be subject to litigation and financial losses that are either not insured against or not fully covered through any insurance maintained by us.
Our risk management policies and procedures may leave us exposed to unidentified or unanticipated risk, which could harm our business.
We have devoted significant resources to develop our risk management strategies and techniques and expect to continue to do so in the future. However, our risk management strategies and techniques may not be fully effective in mitigating our risk exposure in all market environments or against all types of risk, including risks that are unidentified or unanticipated.
We are exposed to the risk that third parties that owe us money, securities or other assets will not perform their obligations. These parties may default on their obligations to us due to bankruptcy, lack of liquidity, operational failure, breach of contract or other reasons. We are also subject to the risk that our rights against third parties may not be enforceable in all circumstances. Although we regularly review credit exposures to specific clients and counterparties and to specific industries and regions that we believe may present credit concerns, default risk may arise from events or circumstances that are difficult to detect or foresee. In addition, concerns about, or a default by, one institution could lead to significant liquidity problems, losses or defaults by other institutions, which in turn could adversely affect us. If any of the variety of instruments, processes and strategies we utilize to manage our exposure to various types of risk are not effective, we may incur losses.
External group hires, strategic investments or acquisitions and joint ventures may result in additional risks and uncertainties in our business.
We have grown and may continue to grow our core businesses through both internal expansion and through external group hiring, strategic investments, acquisitions or joint ventures. To the extent we make external group hires, strategic investments or acquisitions or enter into joint ventures, we face numerous risks and uncertainties, including those that may relate to financial commitments undertaken in connection with any such activity, as well as those that relate to combining or integrating the relevant people, businesses and systems, including the need to combine accounting and data processing systems and management controls and to integrate relationships with customers and business partners. In the case of joint ventures, we are subject to additional risks and uncertainties in that we may be dependent upon, and subject to liability, losses or reputational damage relating to, systems, controls and personnel that are not under our control. In addition, conflicts or disagreements between us and our joint venture partners may negatively impact our businesses.
In September 2015, we acquired MLV. MLV has been named in two putative class action lawsuits involving underwritten securities offerings in 2013 and 2014. An adverse resolution of any of these matters against us could materially affect our financial condition, operating results and liquidity. See Part I, Item 3, “Legal Proceedings” of this Form 10-K for additional information concerning litigation.
16
Our principal investments expose us to a significant risk of capital loss.
We use a portion of our own capital in a variety of principal investment activities, each of which involves risks of illiquidity, loss of principal and revaluation of assets. The companies and investment funds in which we invest may concentrate on markets which are or may be disproportionately impacted by pressures in the sectors on which they focus, and their existing business operations or investment strategy may not perform as projected. As a result, we have suffered losses in the past and we may suffer losses from our principal investment activities in the future.
Our merchant banking investments are concentrated in relatively few companies and industries and a consequence of this investment strategy is that our investment returns will be materially and adversely affected if the companies or the industries we target perform poorly. As a result, if a significant investment fails to perform as we anticipated our business, financial condition and results of operations could be more negatively affected and the magnitude of the loss could be more significant than if we had made smaller investments in more companies and industries.
Even if we make an appropriate investment decision based on the intrinsic value of an enterprise or investment fund, we cannot assure you that the market value of the investment will not decline, perhaps materially, as a result of general market conditions or changes in law. For example, an increase in interest rates, a general decline in the stock markets, or other market conditions adverse to companies or investment funds of the type in which we invest could result in a decline in the value of our investments. Additionally, the companies or investment funds in which we invest may be subject to extensive regulation by U.S. and foreign federal, state and/or local agencies. Changes in existing laws, rules or regulations, or judicial or administrative interpretations thereof, or new laws, rules or regulations could have an adverse impact on the business and industries of our investment.
Our due diligence may not reveal all of a portfolio company’s or investment fund’s liabilities and may not reveal other weaknesses in a portfolio company’s or investment fund’s business.
Before we make principal investments, whether investments in non-registered investment funds that are managed by third parties, merchant banking and other equity investments, or corporate debt investments, we assess the strength and skills the managers of the enterprise and other factors that we believe will determine the success of the investment. In making the assessment and otherwise conducting customary due diligence, we rely on the resources available to us and, in some cases, an investigation by third parties. This process is particularly important and subjective with respect to newly-organized entities because there may be little or no information publicly available about the company or investment fund. We cannot assure you that our due diligence processes will uncover all relevant facts or risks about a company or investment fund in which we make a principal investment, or that any such investment will be successful. Any unsuccessful principal investments may have a material adverse effect on our financial condition and results of operation.
In any potential principal investment, we depend on management and have limited ability to influence management of companies and/or investment funds in which we have invested.
We generally do not control the management, investment decisions or operations of the enterprises in which we make principal investments. Management of those enterprises may decide to change the nature of their assets or business plan, or management may otherwise change in a manner that is not satisfactory to us. We typically have no ability to affect these management decisions, and as noted below, may have only limited ability to dispose of these investments.
We may make principal investments that have limited liquidity, which may reduce the return on those investments to our stockholders.
The investments we make in alternative asset classes such as hedge funds are typically subject to restrictions that limit the amount and timing of redemptions. Such restrictions impair the liquidity of such investments, and these restrictions are likely to increase in periods of market volatility. For these and other reasons, we may be unable to liquidate assets at times and in amounts of our choosing, which could result in harm to our investment performance and loss of invested capital.
17
The securities of any new publicly-held or privately-held entity in which we make a merchant banking or other principal investment are likely to be restricted as to resale and may otherwise be highly illiquid. We also expect that there will be restrictions on our ability to resell the securities of any private or newly-public company that we acquire for a period of at least one year after we acquire those securities. Thereafter, a public market sale may be subject to volume limitations or dependent upon securing a registration statement for a secondary offering of the securities.
The securities of newly-public entities may trade less frequently and in smaller volume than securities of companies that are more widely held and have more established trading patterns. Sales of these securities may cause their values to fluctuate more sharply. Because we have made and expect to make our principal investments through an affiliate of FBRCM and MLV, registered broker-dealers in the U.S., our ability to invest in companies may be constrained by applicable securities laws and regulations and the rules of FINRA and similar self-regulatory organizations. Our investment and trading activities are regulated by the SEC, FINRA and other governmental authorities. As a result, the rules of the SEC, FINRA, and other governmental authorities and self-regulatory organizations may limit our ability to invest in initial public offerings as well as other offerings of companies whose securities are underwritten or privately placed by FBRCM and MLV.
Prices of the equity securities of new entities in which we make principal investments may be volatile. We may make principal investments that are significant relative to the subject company’s overall capitalization, and resales of significant amounts of these securities might adversely affect the market and the sales price for the securities.
The disposition value of our principal investments is dependent upon general and specific market conditions which could result in a decline of the value of these investments. Additionally, due to FINRA rules regarding underwriting compensation, securities we purchase in our private placements may be subject to a 180-day lockup period or longer beginning on the effective date of the issuer’s IPO or resale registration statement. Such lockup periods could affect our ability to dispose of our principal investments at opportune prices.
Our capital markets business is dependent on cash inflows to the mutual fund industry and other pooled investment vehicles, which could result in our experiencing operating losses if cash flows slow.
A slowdown or reversal of cash inflows to the mutual fund industry and other pooled investment vehicles could lead to lower capital markets revenues for us since mutual funds and other pooled investment vehicles purchase a significant portion of the securities offered in public and private offerings underwritten by FBRCM and MLV and subsequently traded in the secondary markets. Demand for new equity offerings has been driven in part by institutional investors, particularly large mutual funds and hedge funds, seeking to invest on behalf of their investors. The public may redeem mutual funds as a result of a decline in the market generally or as a result of a decline in mutual fund net asset values. To the extent that a decline in cash inflows into mutual funds reduces demand by fund managers for public or private offerings, our capital markets business and results of operations could be materially adversely affected. Moreover, a slowdown in investment activity by mutual funds may have an adverse effect on the securities markets generally. In addition, the increased prevalence of lower cost passively-managed funds that are linked to securities indices may lead to lower capital markets revenues for us since many of the securities offerings underwritten by FBRCM and MLV involve securities that are not included in any index.
Declines in the market values of our investments may adversely affect periodic reported results and credit availability, which may reduce earnings.
We make principal and merchant banking investments that are classified for accounting purposes as “available-for-sale.” Changes in the market values of those assets will be directly charged or credited to stockholders’ equity. As a result, a further decline in market value of our investment securities may further reduce our book value. Moreover, if the decline in value of an available-for-sale security is other-than-temporary, such decline will reduce earnings, as will a decline in the value of securities classified as trading for accounting purposes.
18
A decline in the market value of our assets may adversely affect us particularly in instances where we have borrowed money based on the market value of those assets. If the market value of those assets declines, the lender may require us to post additional collateral to support the loan. If we were unable to post the additional collateral, we would have to sell the assets at a time when we might not otherwise choose to do so. A reduction in credit available may reduce our earnings.
Changes in interest rates could negatively affect the value of investments we make with our capital, which could result in reduced earnings or losses.
We invest our capital from time to time in interest rate sensitive securities. “Long” investments that are sensitive to interest rate fluctuations will decline in value if long-term interest rates increase, and “short” investments that are sensitive to interest rate risk will decline in value if long-term interest rates decrease. Declines in market value may ultimately reduce earnings or result in losses to us. In addition, changes in interest rates may impact some of our fund investments and/or merchant banking investments in companies whose business models are sensitive to interest rates.
We are subject to risks associated with our securities lending business.
We have an active securities borrowed and loaned business in which we borrow securities from one party and lend them to another. As a result, market risk in our securities lending business arises when the market value of securities borrowed declines relative to the cash we post as collateral with the lender; and when the market value of securities we have loaned increases relative to the cash we have received as collateral from the borrower. Market value fluctuations in our securities lending business are measured daily and any exposure versus cash received or posted is settled daily with counterparties. In addition, credit risk from our securities lending operations arises if a lender or borrower defaults on an outstanding securities loan or borrow transaction and the cash or securities we are holding is insufficient to cover the amount they owe us for that receivable. Finally, there is systemic risk associated with the concentration of clearing and related functions in covered clearing agencies involved in securities lending activities such as the Options Clearing Corp. and the Depository Trust & Clearing Corp. The market and credit risks associated with our securities lending business have the potential of adversely impacting our business, financial condition and results of operations.
Operating risks associated with our securities lending business may result in counterparty losses, and in certain circumstances, potential financial liabilities for us.
As part of our securities lending business, we lend securities to banks and broker-dealers on behalf of certain of their clients. In these securities lending transactions, the borrower is required to provide and maintain collateral at or above regulatory minimums. Securities on loan are marked to market daily to determine if the borrower is required to pledge additional collateral. We must manage this process and are charged with mitigating the associated operational risks. Our failure to mitigate such operational risks could result in financial losses for counterparties in our securities lending business (separate from the risks of collateral investments). Additionally, in certain circumstances, we could potentially be held liable for the failure to manage any such risks.
19
If we become subject to the registration requirements of the 1940 Act as a result of our principal investing activities, our ability to operate our business as contemplated would be impaired and our operating results would be adversely affected.
The 1940 Act and the rules thereunder contain detailed parameters for the organization and operations of investment companies. Among other things, the 1940 Act and the rules thereunder limit or prohibit transactions with affiliates, impose limitations on the issuance of debt and equity securities, prohibit the issuance of stock options, and impose certain governance requirements. We intend to conduct our operations so that we will not be deemed to be an investment company under 1940 Act. However, if anything were to happen which would cause us to be deemed to be an investment company under the 1940 Act, requirements imposed by the 1940 Act, including limitations on our capital structure, ability to transact business with affiliates and ability to compensate key employees, could make it impractical for us to continue our business as currently conducted, impair the agreements and arrangements between and among us and our subsidiaries, and materially adversely affect our business, financial condition and results of operations.
We are a holding company and are dependent on our subsidiaries for funds.
Since we are a holding company, our cash flow and consequent ability to pay dividends and satisfy our obligations under securities we issue are dependent upon the earnings of our subsidiaries and the distribution of those earnings as dividends or loans or other payments by those subsidiaries to us. Our broker-dealer subsidiaries are subject to various capital adequacy requirements promulgated by regulatory and other authorities. These regulatory rules may restrict our ability to withdraw capital from our subsidiaries by dividends, loans or other payments. Additionally, our ability to participate as an equity holder in any distribution of assets of any subsidiary upon liquidation is generally subordinate to the claims of creditors of the subsidiary.
Our exposure to legal risk is significant, and damages that we may be required to pay and the reputational harm that could result from legal action against us could materially adversely affect our businesses.
We face significant legal risks in our businesses and, in recent years, the volume of claims and amount of damages sought in litigation and regulatory proceedings against financial institutions have been increasing. These risks include potential liability under securities or other laws for materially false or misleading statements made in connection with securities offerings and other transactions, potential liability for “fairness opinions” and other advice we provide to participants in strategic transactions, including liability in connection with conflicts of interest, and disputes over the terms and conditions of complex trading arrangements. We are also subject to claims arising from disputes with employees for alleged discrimination or harassment, among other things.
As a brokerage and investment banking firm, we depend to a large extent on our reputation for integrity and high-caliber professional services to attract and retain clients. As a result, if our reputation is harmed, it may be more damaging in our business than in other businesses. Moreover, our role as advisor to our clients on important underwriting or M&A transactions involves complex analysis and the exercise of professional judgment, including rendering “fairness opinions” in connection with mergers and other transactions. Therefore, our activities may subject us to the risk of significant legal liabilities to our clients and aggrieved third parties, including stockholders of our clients who could bring securities class actions against us. Our investment banking engagements typically include broad indemnities from our clients and provisions to limit our exposure to legal claims relating to our services, but these provisions may not protect us or may not be enforceable in all cases. Furthermore, there is no assurance that an investment banking client will be able to satisfy its indemnity or contribution obligations when due. As a result, we may incur significant legal and other expenses in defending against litigation and may be required to pay substantial damages for settlements and adverse judgments. Substantial legal liability or significant regulatory action against us could have a material adverse effect on our results of operations or cause us significant reputational harm, which could seriously harm our business and prospects. See Part I, Item 3, “Legal Proceedings” of this Form 10-K for additional information concerning litigation in which we are involved.
20
Risks Related to Use of Estimates and Valuations
We make various estimates that affect reported amounts and disclosures.
We make various estimates that affect reported amounts and disclosures. Broadly, those estimates are used in measuring fair value of certain financial instruments, accounting for identifiable intangible assets, establishing provisions for potential losses that may arise from litigation, regulatory proceedings and tax examinations, assessing our ability to realize deferred taxes and valuing equity-based compensation awards. Estimates are based on available information and judgment. Therefore, actual results could differ from our estimates and that difference could have a material effect on our consolidated financial statements.
See Part II, Item 7, “Management’s Discussion and Analysis of Financial Condition and Results of Operations—Critical Accounting Policies and Estimates” and Note 2 to our consolidated financial statements in Part II, Item 8, of this Form 10-K for additional information concerning our use of estimates and valuation methodologies.
Risks Related to Our Industry
Significantly expanded corporate governance and public disclosure requirements may result in fewer initial public offerings and deter existing public companies from engaging in capital market transactions which may reduce the number of investment banking opportunities available to pursue.
Highly-publicized financial scandals in recent years have led to investor concerns over the integrity of the U.S. financial markets, and have prompted the United States Congress, the SEC, the NYSE and NASDAQ to significantly expand corporate governance and public disclosure requirements. To the extent that private companies, in order to avoid becoming subject to these new requirements, decide to forgo initial public offerings, our equity underwriting business may be adversely affected. In addition, provisions of the Sarbanes-Oxley Act of 2002 and the corporate governance rules imposed by self-regulatory organizations have diverted many companies’ attention away from capital market transactions, including securities offerings and acquisition and disposition transactions. In particular, companies that are or are planning to be public are incurring significant expenses in complying with the SEC and accounting standards relating to internal control over financial reporting, and companies that disclose material weaknesses in such controls under the new standards may have greater difficulty accessing the capital markets. These factors, in addition to adopted or proposed accounting and disclosure changes, may have an adverse effect on our business.
Financial services firms have been subject to increased scrutiny over the last several years, increasing the risk of financial liability and reputational harm resulting from adverse regulatory actions.
As a participant in the financial services industry, we are subject to extensive regulation under federal and state laws in the U.S. and under the laws of other countries in which we do business. We are also regulated by a number of self-regulatory organizations. The industry has experienced increased scrutiny from a variety of regulators, including the SEC, NYSE, FINRA, and state attorneys general. Penalties and fines sought by regulatory authorities have increased substantially over the last several years. This regulatory and enforcement environment has created uncertainty with respect to a number of transactions that had historically been entered into by financial services firms and that were generally believed to be permissible and appropriate. We may be adversely affected by changes in the interpretation or enforcement of existing laws and rules by these governmental authorities and self-regulatory organizations. The specific impact of Dodd-Frank on our businesses, our clients and the markets in which we operate will depend on the manner in which the relevant agencies continue to develop and implement the required rules and the reaction of market participants to these regulatory developments over the next several years. We also may be adversely affected as a result of new or revised legislation or regulations imposed by the SEC, other United States or foreign governmental regulatory authorities or self-regulatory organizations that supervise the financial markets, including FINRA. Among other things, we could be fined, prohibited from engaging in some of our business activities or subject to limitations or conditions on our business activities. Substantial legal liability or significant regulatory action against us could have material adverse financial effects or cause significant reputational harm to us, which could seriously harm our business prospects.
21
In addition, financial services firms are subject to numerous conflicts of interests or perceived conflicts. The SEC and other federal and state regulators have increased their scrutiny of potential conflicts of interest. We have adopted various policies, controls and procedures to address or limit actual or perceived conflicts and regularly seek to review and update our policies, controls and procedures. However, appropriately dealing with conflicts of interest is complex and difficult and our reputation could be damaged if we fail, or appear to fail, to deal appropriately with conflicts of interest. Our policies and procedures to address or limit actual or perceived conflicts may also result in increased costs, additional operational personnel and increased regulatory risk. Failure to adhere to these policies and procedures may result in regulatory sanctions or client litigation. For example, the research areas of investment banks have been and remain the subject of heightened regulatory scrutiny which has led to increased restrictions on the interaction between equity research analysts and investment banking personnel at securities firms.
The effort to combat money laundering and terrorist financing is a priority in governmental policy with respect to financial institutions. The obligation of financial institutions, including ourselves, to identify their customers, watch for and report suspicious transactions, respond to requests for information by regulatory authorities and law enforcement agencies, and share information with other financial institutions, has required the implementation and maintenance of internal practices, procedures and controls which have increased, and may continue to increase, our costs. Regulators have also stepped up regulation and enforcement to catch and punish bribery or similar corrupt practices by financial institutions. Any failure with respect to our programs in this area could subject us to serious regulatory consequences, including substantial fines, and potentially other liabilities.
Employee misconduct could harm us and is difficult to detect and deter.
Our reputation is critical in maintaining our relationship with clients, investors, regulators and the general public and is a key focus in our risk management efforts. In recent years, there have been a number of highly publicized cases involving fraud, conflicts of interest or other misconduct by employees in the financial services industry, and we run the risk that employee misconduct could occur at our company. For example, misconduct by employees could involve the improper use or disclosure of confidential information, which could result in regulatory sanctions and serious reputational or financial harm. Misconduct by employees could include binding us to transactions that exceed authorized limits or present unacceptable risks, or hiding from us unauthorized or unsuccessful activities, which, in either case, may result in unknown and unmanaged risks or losses. Employee misconduct could also involve the improper use or disclosure of confidential information, which could result in regulatory sanctions and serious reputational or financial harm. It is not always possible to deter employee misconduct, and the precautions we take to detect and prevent this activity may not be effective in all cases. As a result, we could suffer significant reputational harm for any misconduct by our employees. In addition, in certain circumstances our reputation could be damaged by activities of our clients or of hedge funds or other entities in which we invest, over which we have little or no control.
The soundness and business continuity of other financial institutions and intermediaries affects us.
We face the risk of operational failure, termination or capacity constraints of any of the clearing agents, exchanges, clearing houses or other financial intermediaries that we use to facilitate our securities transactions. As a result of the consolidation over the years among clearing agents, exchanges and clearing houses, our exposure to certain financial intermediaries has increased and could affect our ability to find adequate and cost-effective alternatives should the need arise. Any failure, termination or constraint of these intermediaries could adversely affect our ability to exercise transactions, service our clients and manage our exposure to risk.
Our ability to engage in routine trading and funding transactions could be adversely affected by the actions and commercial soundness of other financial institutions. Financial services institutions are interrelated as a result of trading, clearing, funding, counterparty or other relationships. We have exposure to many different industries and counterparties, and we routinely execute transactions with counterparties in the financial industry, including brokers and dealers, commercial banks, investment banks, mutual and hedge funds and other institutional clients. As a result, defaults by, or even rumors or questions about the financial condition of, one or more financial services institutions, or the financial services industry generally, have historically led to market-wide liquidity problems and could lead to losses or defaults by us or by other institutions. Many of these transactions expose us to credit risk in the event of default of our counterparty or client. In addition, our credit risk may be exacerbated when the collateral held by us cannot be realized or is liquidated at prices not sufficient to recover the full amount of the loan or derivative
22
exposure due us. Although we have not suffered any material or significant losses as a result of the failure of any financial counterparty, any such losses in the future may materially adversely affect our results of operations.
None.
Our principal executive offices are located at Arlington Tower, 1300 North Seventeenth Street, Arlington, Virginia 22209. We carry out all aspects of our operations related to our capital markets and principal investing segments at that location. We occupy leased space on three floors of our headquarters building in Arlington, Virginia pursuant to a lease agreement that expires on December 31, 2025. We also lease office space in the following locations where we conduct certain portions of our capital markets operations: Boston, Massachusetts; Dallas, Texas; Houston, Texas; Los Angeles, California; New York, New York; and San Francisco, California. We believe that the present facilities, together with current options to extend lease terms and occupy additional space, are adequate for our current and presently projected needs.
As of December 31, 2015, except as described below, we were neither a defendant nor plaintiff in any lawsuits or arbitrations nor involved in any governmental or self-regulatory organization matters that are expected to have a material adverse effect on our financial condition, results of operations, or liquidity. We have been named as a defendant in a small number of civil lawsuits relating to our various businesses. In addition, we are subject to various reviews, examinations, investigations and other inquiries by governmental agencies and self regulatory organizations. There can be no assurance that these matters individually or in aggregate will not have a material adverse effect on our financial condition, results of operations, or liquidity in a future period. However, based on management’s review with counsel, resolution of these matters is not expected to have a material adverse effect on our financial condition, results of operations or liquidity.
Many aspects of our business involve substantial risks of liability and litigation. Underwriters, broker-dealers and investment advisers are exposed to liability under federal and state securities laws, other federal and state laws and court decisions, including decisions with respect to underwriters’ liability and limitations on indemnification, as well as with respect to the handling of customer accounts. For example, underwriters may be held liable for material misstatements or omissions of fact in a prospectus used in connection with the securities being offered and broker-dealers may be held liable for statements made by their securities analysts or other personnel. In the past, FBRCM and MLV have been named as a defendant in a small number of securities claims involving their respective investment banking clients as a result of such broker-dealer’s role as an underwriter. In these cases, the underwriting agreement provides, subject to certain conditions, that the investment banking client is required to indemnify the underwriters against certain claims or liabilities, including claims or liabilities under the Securities Act, or contribute to payments which the underwriters are required to make as a result of the litigation. There can be no assurance that such indemnification or contribution will ultimately be available to us or that an investment banking client will be able to satisfy its indemnity or contribution obligations when due.
FBRCM has been named a defendant in the putative class action lawsuit Waterford Township Police & Fire, Retirement System, vs. Regional Management Corp. et al., pending in the United States District Court for the Southern District of New York. The amended complaint, filed on November 24, 2014 (the “Amended Complaint”), names FBRCM as a co-managing underwriter of offerings in September 2013 and December 2013. Plaintiffs allege that the Registration Statement and Prospectus used in connection with these offerings were negligently prepared and, as a result, contained untrue statements of material fact and omitted to state other facts necessary to make the statements made not misleading. The Amended Complaint asserts claims against all the underwriters under Sections 11 and 12 of the Securities Act. Regional Management has agreed to indemnify all the underwriters, including FBRCM, pursuant to the operative underwriting agreement. In response to the defendants’ motions to dismiss, filed on January 23, 2015, the putative class plaintiffs filed a second amended complaint (the “Second Amended
23
Complaint”), which shall serve as the operative complaint. The underwriter defendants have moved to dismiss the Second Amended Complaint and the briefing was completed in July 2015.
In November 2015, MLV was named a defendant in two putative class action lawsuits alleging substantially identical claims against the officers and directors and underwriters of Miller Energy Resources, Inc. (“Miller”). The lawsuits, styled Goldberg v. Miller et al., and Gaynor v. Miller et al., are currently pending in the United States District Court for the Eastern District of Tennessee, and allege claims under Sections 11 and 12 of the Securities Act against nine underwriters for alleged material misrepresentations and omissions in the registration statement and prospectuses issued in connection with 6 offerings (February 13, 2013; May 8, 2013; June 28, 2013; September 26, 2013; October 17, 2013 (as to MLV only) and August 21, 2014) with an alleged aggregate offering price of approximately $151 million. The plaintiffs seek unspecified compensatory damages and reimbursement of certain costs and expenses. Although MLV is contractually entitled to be indemnified by Miller in connection with this lawsuit, Miller filed for bankruptcy in October 2015 and this likely will decrease or eliminate the value of the indemnity that MLV receives from Miller. The plaintiffs are currently seeking to remand to Tennessee state court; defendants are vigorously opposing the remand.
In accordance with applicable accounting guidance, we establish an accrued liability for litigation and regulatory matters when those matters present loss contingencies that are both probable and estimable. In such cases, there may be an exposure to loss in excess of any amounts accrued. When a loss contingency is not both probable and estimable, the Company does not establish an accrued liability. As a litigation or regulatory matter develops, management, in conjunction with counsel, evaluates on an ongoing basis whether such matter presents a loss contingency that is probable and estimable. The pending cases discussed above involving FBRCM and MLV are at a preliminary stage, and based on management’s review with counsel and present information known by management, a loss contingency for these matters was not probable and estimable as of December 31, 2015.
In certain circumstances, broker-dealers and asset managers may also be held liable by customers and clients for losses sustained on investments. In recent years, there has been an increasing incidence of litigation and actions by government agencies and self regulatory organizations involving the securities industry, including class actions that seek substantial damages. We are also subject to the risk of litigation, including litigation that may be without merit. As we intend to actively defend any such litigation, significant legal expenses could be incurred. An adverse resolution of any future litigation against us could materially affect our financial condition, operating results and liquidity.
Not applicable.
24
PART II
|
ITEM 5. |
MARKET FOR REGISTRANT’S COMMON EQUITY, RELATED STOCKHOLDER MATTERS AND ISSUER PURCHASES OF EQUITY SECURITIES. |
Price Range of Common Stock
Our common stock is listed on The NASDAQ Global Select MarketSM under the symbol “FBRC.” As of March 1, 2016, there were 7,384,874 shares of our common stock outstanding and approximately 14 holders of record. On March 1, 2016, the last sales price for our common stock on the NASDAQ Global Select Market was $18.38 per share. Such information was obtained through our registrar and transfer agent. The tables below shows the actual high and low closing sales prices for our common stock on The NASDAQ Global Select MarketSM for the periods indicated.
|
|
|
Year Ended December 31, 2015 |
|
|
Year Ended December 31, 2014 |
|
||||||||||
|
|
|
High |
|
|
Low |
|
|
High |
|
|
Low |
|
||||
|
First Quarter |
|
$ |
25.28 |
|
|
$ |
22.00 |
|
|
$ |
27.69 |
|
|
$ |
23.40 |
|
|
Second Quarter |
|
|
23.98 |
|
|
|
20.90 |
|
|
|
28.04 |
|
|
|
24.69 |
|
|
Third Quarter |
|
|
24.53 |
|
|
|
20.42 |
|
|
|
29.60 |
|
|
|
25.30 |
|
|
Fourth Quarter |
|
|
21.75 |
|
|
|
19.40 |
|
|
|
27.19 |
|
|
|
23.90 |
|
Dividends
Since January 1, 2014, our Board of Directors has declared cash dividends on our common stock as summarized in the following table.
|
Date Declared |
|
Record Date |
|
Payable Date |
|
Dividends per Share |
|
|
|
February 10, 2016 |
|
February 22, 2016 |
|
March 4, 2016 |
|
$ |
0.20 |
|
|
October 20, 2015 |
|
November 2, 2015 |
|
November 27, 2015 |
|
$ |
0.20 |
|
|
June 16, 2015 |
|
July 31, 2015 |
|
August 28, 2015 |
|
$ |
0.20 |
|
Share Repurchases
During 2015 we repurchased 1.9 million shares of our common stock in open market transactions at a weighted average share price of $23.20 per share, for a total cost of $45.2 million. The following table provides information on the Company’s share repurchases during the fourth quarter of 2015:
|
|
|
|
|
|
|
|
|
|
|
Total Number of Shares |
|
|
Maximum Number of |
|
|
||
|
|
|
|
|
|
|
|
|
|
|
Purchased as Part of |
|
|
Shares that May Yet Be |
|
|
||
|
|
|
Total Number of |
|
|
Average Price Paid |
|
|
Publicly Announced |
|
|
Purchased Under the |
|
|
||||
|
|
|
Shares Purchased |
|
|
per Share |
|
|
Plans or Programs (1) |
|
|
Plans or Programs (1) |
|
|
||||
|
October 1 to October 31, 2015 |
|
|
46,850 |
|
|
$ |
20.02 |
|
|
|
46,850 |
|
|
|
953,150 |
|
|
|
November 1 to November 30, 2015 |
|
|
210,434 |
|
|
$ |
20.43 |
|
|
|
210,434 |
|
|
|
742,716 |
|
|
|
December 1 to December 31, 2015 |
|
|
118,593 |
|
|
$ |
20.84 |
|
|
|
118,593 |
|
|
|
624,123 |
|
|
|
Total |
|
|
375,877 |
|
|
$ |
20.51 |
|
|
|
375,877 |
|
|
|
624,123 |
|
|
|
|
|
(1) |
On October 19, 2015, the Board of Directors of the Company approved an increase in the Company’s repurchase authorization to an aggregate of one million shares, of which 624,123 remain authorized for repurchase on December 31, 2015. On February 10, 2016, the Board of Directors of the Company approved a further increase in the Company’s repurchase authorization to an aggregate of one million shares. |
25
|
|
|
Year Ended December 31, |
|
|||||||||||||||||
|
|
|
2015 |
|
|
2014 |
|
|
2013 |
|
|
2012 |
|
|
2011 |
|
|||||
|
Consolidated Statements of Operations (dollars in thousands, except per share amounts): |
|
|
|
|
|
|
|
|
|
|
|
|
|
|
|
|
|
|
|
|
|
Revenues: |
|
|
|
|
|
|
|
|
|
|
|
|
|
|
|
|
|
|
|
|
|
Investment banking: |
|
|
|
|
|
|
|
|
|
|
|
|
|
|
|
|
|
|
|
|
|
Capital raising |
|
$ |
61,508 |
|
|
$ |
103,902 |
|
|
$ |
186,516 |
|
|
$ |
84,144 |
|
|
$ |
42,862 |
|
|
Advisory |
|
|
9,583 |
|
|
|
11,353 |
|
|
|
9,697 |
|
|
|
6,525 |
|
|
|
15,284 |
|
|
Institutional brokerage |
|
|
45,442 |
|
|
|
56,182 |
|
|
|
53,738 |
|
|
|
52,472 |
|
|
|
78,457 |
|
|
Net investment income (loss) |
|
|
5,433 |
|
|
|
17,774 |
|
|
|
6,920 |
|
|
|
4,906 |
|
|
|
(9,664 |
) |
|
Interest |
|
|
31,774 |
|
|
|
13,067 |
|
|
|
1,790 |
|
|
|
2,765 |
|
|
|
3,319 |
|
|
Dividends and other |
|
|
1,692 |
|
|
|
1,030 |
|
|
|
1,160 |
|
|
|
680 |
|
|
|
1,969 |
|
|
Total revenues |
|
|
155,432 |
|
|
|
203,308 |
|
|
|
259,821 |
|
|
|
151,492 |
|
|
|
132,227 |
|
|
Interest expense |
|
|
35,037 |
|
|
|
21,183 |
|
|
|
— |
|
|
|
— |
|
|
|
— |
|
|
Revenue, net of interest expense |
|
|
120,395 |
|
|
|
182,125 |
|
|
|
259,821 |
|
|
|
151,492 |
|
|
|
132,227 |
|
|
Non-interest expenses: |
|
|
|
|
|
|
|
|
|
|
|
|
|
|
|
|
|
|
|
|
|
Compensation and benefits |
|
|
77,463 |
|
|
|
103,811 |
|
|
|
144,720 |
|
|
|
82,672 |
|
|
|
99,808 |
|
|
Professional services |
|
|
13,287 |
|
|
|
13,259 |
|
|
|
12,326 |
|
|
|
12,839 |
|
|
|
11,629 |
|
|
Occupancy and equipment |
|
|
12,680 |
|
|
|
13,480 |
|
|
|
12,271 |
|
|
|
15,755 |
|
|
|
19,034 |
|
|
Communications |
|
|
10,865 |
|
|
|
11,514 |
|
|
|
11,101 |
|
|
|
12,553 |
|
|
|
16,402 |
|
|
Business development |
|
|
9,819 |
|
|
|
11,689 |
|
|
|
9,602 |
|
|
|
9,394 |
|
|
|
10,753 |
|
|
Clearing and brokerage fees |
|
|
5,328 |
|
|
|
4,757 |
|
|
|
4,922 |
|
|
|
7,490 |
|
|
|
11,928 |
|
|
Impairment of goodwill |
|
|
— |
|
|
|
— |
|
|
|
— |
|
|
|
— |
|
|
|
5,882 |
|
|
Other operating expenses |
|
|
6,711 |
|
|
|
6,255 |
|
|
|
7,609 |
|
|
|
6,861 |
|
|
|
8,119 |
|
|
Total non-interest expenses |
|
|
136,153 |
|
|
|
164,765 |
|
|
|
202,551 |
|
|
|
147,564 |
|
|
|
183,555 |
|
|
(Loss) income from continuing operations before income taxes |
|
|
(15,758 |
) |
|
|
17,360 |
|
|
|
57,270 |
|
|
|
3,928 |
|
|
|
(51,328 |
) |
|
Income tax (benefit) provision |
|
|
(8,297 |
) |
|
|
341 |
|
|
|
(27,483 |
) |
|
|
(1,078 |
) |
|
|
(243 |
) |
|
(Loss) income from continuing operations, net of taxes |
|
|
(7,461 |
) |
|
|
17,019 |
|
|
|
84,753 |
|
|
|
5,006 |
|
|
|
(51,085 |
) |
|
(Loss) income from discontinued operations, net of taxes |
|
|
— |
|
|
|
— |
|
|
|
8,159 |
|
|
|
24,685 |
|
|
|
1,436 |
|
|
Net (loss) income |
|
$ |
(7,461 |
) |
|
$ |
17,019 |
|
|
$ |
92,912 |
|
|
$ |
29,691 |
|
|
$ |
(49,649 |
) |
|
Basic (loss) income per share(1): |
|
|
|
|
|
|
|
|
|
|
|
|
|
|
|
|
|
|
|
|
|
(Loss) income from continuing operations, net of taxes |
|
$ |
(0.92 |
) |
|
$ |
1.66 |
|
|
$ |
7.09 |
|
|
$ |
0.38 |
|
|
$ |
(3.36 |
) |
|
Income from discontinued operations, net of taxes |
|
|
— |
|
|
|
— |
|
|
|
0.68 |
|
|
|
1.86 |
|
|
|
0.10 |
|
|
Basic (loss) income per share |
|
$ |
(0.92 |
) |
|
$ |
1.66 |
|
|
$ |
7.77 |
|
|
$ |
2.24 |
|
|
$ |
(3.26 |
) |
|
Diluted (loss) income per share(1): |
|
|
|
|
|
|
|
|
|
|
|
|
|
|
|
|
|
|
|
|
|
(Loss) income from continuing operations, net of taxes |
|
$ |
(0.92 |
) |
|
$ |
1.48 |
|
|
$ |
6.54 |
|
|
$ |
0.36 |
|
|
$ |
(3.36 |
) |
|
Income from discontinued operations, net of taxes |
|
|
— |
|
|
|
— |
|
|
|
0.63 |
|
|
|
1.79 |
|
|
|
0.10 |
|
|
Diluted (loss) income per share |
|
$ |
(0.92 |
) |
|
$ |
1.48 |
|
|
$ |
7.17 |
|
|
$ |
2.15 |
|
|
$ |
(3.26 |
) |
|
Weighted-average shares (in thousands): |
|
|
|
|
|
|
|
|
|
|
|
|
|
|
|
|
|
|
|
|
|
Basic(1) |
|
|
8,069 |
|
|
|
10,283 |
|
|
|
11,963 |
|
|
|
13,274 |
|
|
|
15,210 |
|
|
Diluted(1) |
|
|
8,069 |
|
|
|
11,465 |
|
|
|
12,960 |
|
|
|
13,798 |
|
|
|
15,210 |
|
|
Cash dividends declared per common share |
|
$ |
0.40 |
|
|
$ |
— |
|
|
$ |
— |
|
|
$ |
— |
|
|
$ |
— |
|
26
|
|
|
As of December 31, |
|
|||||||||||||||||
|
|
|
2015 |
|
|
2014 |
|
|
2013 |
|
|
2012 |
|
|
2011 |
|
|||||
|
Consolidated Balance Sheet Data (in thousands): |
|
|
|
|
|
|
|
|
|
|
|
|
|
|
|
|
|
|
|
|
|
Assets: |
|
|
|
|
|
|
|
|
|
|
|
|
|
|
|
|
|
|
|
|
|
Cash and cash equivalents |
|
$ |
70,067 |
|
|
$ |
108,962 |
|
|
$ |
207,973 |
|
|
$ |
174,925 |
|
|
$ |
135,792 |
|
|
Securities borrowed |
|
|
685,037 |
|
|
|
594,674 |
|
|
|
— |
|
|
|
— |
|
|
|
— |
|
|
Financial instruments owned, at fair value |
|
|
94,923 |
|
|
|
166,047 |
|
|
|
144,743 |
|
|
|
121,404 |
|
|
|
100,634 |
|
|
Other investments, at cost |
|
|
6,539 |
|
|
|
7,000 |
|
|
|
7,681 |
|
|
|
8,388 |
|
|
|
25,744 |
|
|
Due from brokers, dealers, and clearing organizations |
|
|
5,513 |
|
|
|
94,489 |
|
|
|
4,949 |
|
|
|
4,670 |
|
|
|
6,048 |
|
|
Other |
|
|
71,337 |
|
|
|
63,925 |
|
|
|
45,226 |
|
|
|
24,057 |
|
|
|
29,865 |
|
|
Total assets |
|
$ |
933,416 |
|
|
$ |
1,035,097 |
|
|
$ |
410,572 |
|
|
$ |
333,444 |
|
|
$ |
298,083 |
|
|
Liabilities: |
|
|
|
|
|
|
|
|
|
|
|
|
|
|
|
|
|
|
|
|
|
Securities loaned |
|
$ |
687,443 |
|
|
$ |
595,717 |
|
|
$ |
— |
|
|
$ |
— |
|
|
$ |
— |
|
|
Financial instruments sold, not yet purchased, at fair value |
|
|
1,934 |
|
|
|
121,310 |
|
|
|
42,241 |
|
|
|
56,929 |
|
|
|
35,496 |
|
|
Accrued compensation, accounts payable, accrued expenses and other liabilities |
|
|
33,272 |
|
|
|
57,664 |
|
|
|
68,853 |
|
|
|
32,953 |
|
|
|
31,040 |
|
|
Due to brokers, dealers, and clearing organizations |
|
|
— |
|
|
|
— |
|
|
|
8,701 |
|
|
|
3,698 |
|
|
|
6,250 |
|
|
Total liabilities |
|
|
722,649 |
|
|
|
774,691 |
|
|
|
119,795 |
|
|
|
93,580 |
|
|
|
72,786 |
|
|
Shareholders’ equity |
|
|
210,767 |
|
|
|
260,406 |
|
|
|
290,777 |
|
|
|
239,864 |
|
|
|
225,297 |
|
|
Total liabilities and shareholders’ equity |
|
$ |
933,416 |
|
|
$ |
1,035,097 |
|
|
$ |
410,572 |
|
|
$ |
333,444 |
|
|
$ |
298,083 |
|
|
|
|
Year ended December 31, |
|
|||||||||||||||||
|
|
|
2015 |
|
|
2014 |
|
|
2013 |
|
|
2012 |
|
|
2011 |
|
|||||
|
Statistical Data: |
|
|
|
|
|
|
|
|
|
|
|
|
|
|
|
|
|
|
|
|
|
Total employees(2) |
|
|
303 |
|
|
|
300 |
|
|
|
302 |
|
|
|
256 |
|
|
|
295 |
|
|
Net revenue per employee(3) |
|
$ |
404 |
|
|
$ |
609 |
|
|
$ |
952 |
|
|
$ |
591 |
|
|
$ |
362 |
|
|
Compensation and benefits expense as a percentage of net revenues |
|
|
64 |
% |
|
|
57 |
% |
|
|
56 |
% |
|
|
55 |
% |
|
|
72 |
% |
|
|
|
(1) |
On February 28, 2013, the Company affected a one-for-four reverse stock split of its issued and outstanding common stock. While this reverse stock split reduced the number of issued and outstanding common shares, and resulted in the reclassification of certain previously reported amounts in the consolidated financial statements, these changes and reclassifications had no effect on the Company’s total shareholders’ equity. |
|
(2) |
As of end of the period reported. |
|
(3) |
Based on average of employees as of the end of each quarter. |
The selected financial data set forth above has been derived from the audited consolidated financial statements of FBR & Co.
This information should be read in conjunction with Item 1, “Business,” Item 7, “Management’s Discussion and Analysis of Financial Condition and Results of Operations,” and the audited consolidated financial statements of FBR & Co and notes thereto included under Item 8, “Financial Statements and Supplementary Data,” in this Form 10‑K.
27
Overview
FBR & Co. is a full-service investment banking and institutional brokerage firm with a deep expertise and focus on the equity capital markets. Since the founding of certain predecessor companies, we have grown from a boutique investment bank with primary expertise in financial institutions into a full-service U.S. investment bank for middle-market companies.
Through our broker-dealer operating subsidiaries we have focused our business on providing:
|
|
· |
capital raising services, including underwriting and placement of public and private equity, equity-linked and debt securities; |
|
|
· |
financial advisory services, including M&A advisory, restructuring, liability management, recapitalization and strategic alternative analysis; |
|
|
· |
institutional sales and trading services focused on equities, equity-linked securities, high-yield bonds, senior debt and bank loans, as well as securities lending activities; and |
|
|
· |
differentiated securities research focused on the core issues driving performance of our covered companies and industry sectors. |
We focus our capital markets business (investment banking and institutional brokerage) in the following industry sectors—consumer, energy and natural resources, financial institutions, healthcare, industrials, insurance, real estate, and TMT. Approximately 70% of the companies included in the S&P 500 Index conduct business in the industry sectors in which we focus. We also make principal investments, including merchant banking investments, with our own capital.
In June 2007 we became a publicly-traded company listed on The NASDAQ Global Select MarketSM (NASDAQ: FBRC). We are a Virginia corporation formed in June 2006 and headquartered in Arlington, Virginia and also have offices in Boston, Dallas, Houston, Los Angeles, New York and San Francisco. The address of our principal executive offices is 1300 North Seventeenth Street, Arlington, Virginia 22209. Our telephone number is (703) 312-9500.
Our business is comprised of two separate segments: capital markets, which includes investment banking and institutional brokerage and research; and principal investing. During the first quarter of 2016, based on changes in the Company’s business profile since its IPO in 2007, including significant changes in capital allocation and revenue mix that have occurred over that time, the Company will revise its segment reporting structure. Beginning with the first quarter of 2016, the Company’s investment activities will be included within its capital markets segment and not as a separate reportable segment. This change is consistent with how the Company’s chief operating decision maker evaluates performance and allocates resources.
Business Environment
After reaching new highs in the second quarter of 2015, for the full year 2015 U.S. equity markets declined for the first time since 2008. A slowing Chinese economy, falling oil prices, along with tightening monetary conditions in the U.S. contributed to both the market decline and increased volatility in the second half of 2015. These factors also contributed to the overall decline in initial equity capital transaction volumes during 2015 compared to 2014 and to outflows from U.S. equity mutual funds of approximately $171 billion in 2015.
During 2015, for companies with market capitalizations of less than $1.5 billion, there were 127 IPOs completed in the U.S., down 35% by number from 2014 and down 25% by dollar volume. Within this decline, new issue activity was narrow with healthcare and technology making up over 50% of the IPO deal volume in 2015. Considering this concentration in 2015 activity, the decline in activity during the year in certain sectors was even more pronounced. Specifically, compared to 2014 the number of IPOs within energy was down 65% and in insurance the decline was 50%.
28
Competition in our business remains intense. Large banks continue to tie lending activity to capital markets mandates and electronic or high-frequency trading continues to capture a significant share of trading volume. Both of these dynamics put pressure on high-touch, idea-driven firms like FBR. Institutional investors continue to narrow the list of broker-dealers with whom they maintain trading relationships, leading to consolidation of smaller firms and to the need for mid-size firms to work intensely to demonstrate relevance through quality and scale of research offerings in order to grow relationships.
The U.S. equity markets have exhibited significant volatility in the first few months of 2016. Through the first two months of the year, there have been only four IPOs, three for healthcare issuers totaling $264 million and one SPAC for $500 million. The decision by the Federal Reserve to increase interest rates in December 2015 added to concerns of slowing global economic growth, and the related strengthening of the dollar exacerbated declines in dollar-denominated commodity markets. The pace of federal funds rate increases throughout 2016, the related performance of the dollar relative to major trading currencies, and the level and stability of energy prices are likely to continue to have significant influence on the direction of equity markets in the near term.
Executive Summary
For the year ended December 31, 2015, our net loss was $7.5 million compared to net income of $17.0 million in 2014 and $92.9 million in 2013. Our total revenues in 2015 were $120.4 million, our pre-tax loss was $15.8 million, and our net loss was $7.5 million. These results compare to total revenues in 2014 of $182.1 million, pre-tax income of $17.4 million, and net income of $17.0 million. Total revenues in 2013 were $259.8 million, pre-tax income was $57.3 million, and net income from continuing operations, reflecting a $27.5 million income tax benefit, was $84.8 million.
The decrease in our net results in 2015 compared to 2014 was primarily due to a $44.2 million decrease in investment banking revenue. The reduction in investment banking revenues year over year was due to the differences in the nature and size of the capital raising transactions completed in these periods. We completed four sole-managed private placements in 2015 with an average transaction size of $162 million compared to six sole-managed private placements in 2014 with an average transaction size of $206 million. The decline in investment banking revenues in 2015 also reflects the impact of equity capital markets conditions during 2015, in particular the decline in the volume of initial capital raising transactions compared to 2014. In addition to the decrease in investment banking revenue in 2015, other capital markets revenues decreased $5.7 million, and as a result of market conditions during 2015, net revenues from principal investments decreased $11.8 million.
The decrease in our net results in 2014 compared to 2013 was primarily due to an $80.9 million decrease in investment banking revenue in 2014 compared to 2013 as well as a $27.5 million tax benefit recognized in 2013 compared to a $0.3 million tax provision in 2014. The reduction in investment banking revenues in 2014 compared to 2013 reflects the differences in the nature and size of the capital raising transactions completed in these periods. Specifically, while we completed six sole-managed private placements in both 2014 and 2013, the average size of the transactions completed in 2014 was $206 million compared to $352 million in 2013.
During 2015, total non-interest expenses decreased to $136.2 million compared to $164.8 million in 2014 and $202.6 million in 2013. Total non-interest expense for 2015, included fixed expenses of $100.5 million and variable expenses of $35.7 million compared to $104.9 million and $59.8 million for 2014, respectively, and $97.6 million and $104.9 million for 2013, respectively. During 2015, non-compensation fixed expenses decreased to $41.9 million compared to $43.9 million in 2014 and $43.6 million in 2013. Our continued focus on expenses has led to predictability within those more controllable elements of our income statement and we continually look for ways to more cost-effectively support our business. The Company’s compensation-to-net revenue ratio increased to 64% in 2015 from 57% in 2014 and 56% in 2013, reflecting the impact of lower revenue generation in 2015.
In 2015, we recognized a tax benefit of $8.3 million and our effective tax rate was 52.7%. In 2014, we recognized a tax provision of $0.3 million and our effective tax rate was 2%. Our 2015 and 2014 effective tax rates differed from statutory tax rates due to our use of previously reserved tax assets related to capital loss carryforwards.
Our 2013 net income from discontinued operations reflects the change in value during the year of the contingent payment that was due from the sale of the assets related to our former mutual funds business, which was
29
received in November 2013. The increase in value during 2013 was due primarily to asset inflows to the funds and market appreciation of the funds during the period subsequent to the sale.
During 2015, we repurchased 1.9 million shares of our common stock at a weighted average price of $23.20 per share and a total cost of $45.2 million. In total, for the three years ended December 31, 2015, we have repurchased 6.7 million shares of our common stock at a weighted average price of $24.58 per share and a total cost of $164.9 million. We ended 2015 with $210.8 million of total equity, $70.1 million in cash and no debt.
The following is an analysis of our operating results by segment for the years ended December 31, 2015, 2014 and 2013.
Capital Markets
Our capital markets segment includes investment banking and institutional sales, trading and research. These business units operate as a single integrated segment to deliver capital raising, advisory and sales and trading services to corporate and institutional clients. Our investment banking and institutional brokerage businesses are focused on the consumer, energy and natural resources, financial institutions, healthcare, industrials, insurance, real estate and TMT sectors. Additionally, beginning in August 2014, we provide securities lending services to a broad group of banks and broker-dealers. These services include facilitating the sourcing, borrowing and lending of equity and fixed income securities. By their nature, our capital markets business activities are highly competitive and are subject to market conditions as well as to the conditions affecting the companies and markets in our areas of focus. As a result, our capital markets revenues and profits are subject to significant volatility from period to period.
The following table provides a summary of our results within the capital markets segment (dollars in thousands):
|
|
|
For the Year Ended December 31, |
|
|||||||||
|
|
|
2015 |
|
|
2014 |
|
|
2013 |
|
|||
|
Revenues, net of interest expense: |
|
|
|
|
|
|
|
|
|
|
|
|
|
Investment banking |
|
$ |
71,091 |
|
|
$ |
115,255 |
|
|
$ |
196,213 |
|
|
Institutional brokerage |
|
|
45,442 |
|
|
|
56,182 |
|
|
|
53,738 |
|
|
Interest |
|
|
31,745 |
|
|
|
12,945 |
|
|
|
1,050 |
|
|
Dividends and other |
|
|
1,103 |
|
|
|
549 |
|
|
|
432 |
|
|
Total revenues |
|
|
149,381 |
|
|
|
184,931 |
|
|
|
251,433 |
|
|
Interest expense |
|
|
23,877 |
|
|
|
9,505 |
|
|
|
— |
|
|
Revenues, net of interest expense |
|
|
125,504 |
|
|
|
175,426 |
|
|
|
251,433 |
|
|
Operating expenses: |
|
|
|
|
|
|
|
|
|
|
|
|
|
Variable |
|
|
35,651 |
|
|
|
59,500 |
|
|
|
103,755 |
|
|
Fixed |
|
|
98,331 |
|
|
|
102,426 |
|
|
|
96,121 |
|
|
Total(1) |
|
|
133,982 |
|
|
|
161,926 |
|
|
|
199,876 |
|
|
Pre-tax (loss) income |
|
$ |
(8,478 |
) |
|
$ |
13,500 |
|
|
$ |
51,557 |
|
|
|
|
(1) |
For the years ended December 31, 2015, 2014, and 2013, total operating expenses includes an allocation of corporate overhead costs of $21,000, $23,171, and $25,563, respectively. |
The pre-tax loss from our capital markets segment was $8.5 million in 2015 compared to pre-tax income of $13.5 million in 2014. The decrease in our pre-tax income was primarily attributable to a $44.2 million decrease in investment banking revenues in 2015 compared to 2014. The impact of the decreased revenues was offset partially by a $23.8 million decrease in variable expenses. Specifically, variable expenses, including $18.9 million of variable compensation, decreased to $35.7 million in 2015 from $59.5 million in 2014 as a result of the decrease in revenues. Our total compensation as a percentage of net revenues in this segment was 61% in 2015 compared to 58% in 2014. Fixed expenses decreased $4.1 million, or 4.0%, in 2015 largely as a result of a decrease in fixed compensation of $2.5 million.
30
Investment banking revenues decreased $44.2 million to $71.1 million during 2015 from $115.3 million during 2014. Our investment banking revenues in 2015 were generated from 51 client transactions representing $9.3 billion in transaction value. Included in those transactions and representing $39.7 million of our capital raising revenue were four sole-managed institutional private placements. Our investment banking revenues in 2014 were generated from 55 client transactions representing $11 billion in transaction value. Included in those transactions and representing $80.4 million of our capital raising revenue were six sole-managed institutional private placements. The reduction in investment banking revenues in 2015 compared to 2014 reflects the differences in the number, nature and size of the capital raising transactions completed in these periods. Specifically, we completed four sole‑managed private placements in 2015 with an average transaction size of $162 million compared to six sole‑managed private placements in 2014 with an average transaction size of $206 million.
Investment banking revenues decreased $80.9 million to $115.3 million during 2014 from $196.2 million during 2013. Our investment banking revenues in 2014 were generated from 55 client transactions representing $11 billion in transaction value. Included in those transactions and representing $80.4 million of our capital raising revenue were six sole-managed institutional private placements. Our investment banking revenues in 2013 were generated from 66 client transactions representing $16 billion in transaction value. Included in those transactions and representing $134.0 million of our capital raising revenue were six sole-managed institutional private placements. One of these private placements, representing $38.3 million of that revenue, was executed in the second quarter of 2012; however, the issuer did not receive the required regulatory approvals necessary for us to recognize this revenue until the first quarter of 2013. The reduction in investment banking revenues in 2014 compared to 2013 principally reflects the differences in the nature and size of the capital raising transactions completed in these periods. Specifically, while we completed six sole-managed private placements in both 2014 and 2013, the average size of the transactions completed in 2014 was $206 million compared to $352 million in 2013.
The following table provides detail regarding the components of our institutional brokerage revenues (dollars in thousands):
|
|
|
For the Year Ended December 31, |
|
|||||||||
|
|
|
2015 |
|
|
2014 |
|
|
2013 |
|
|||
|
Agency commissions |
|
$ |
24,000 |
|
|
$ |
30,077 |
|
|
$ |
29,503 |
|
|
Principal transactions |
|
|
18,361 |
|
|
|
22,509 |
|
|
|
21,373 |
|
|
Direct payments for equity research |
|
|
3,081 |
|
|
|
3,596 |
|
|
|
2,862 |
|
|
Total |
|
$ |
45,442 |
|
|
$ |
56,182 |
|
|
$ |
53,738 |
|
Our institutional brokerage revenues decreased $10.7 million to $45.4 million in 2015 from $56.2 million in 2014. The decrease in revenue in 2015 reflects reduced revenues from each of our equity and convertibles trading desks during the period. These decreases were primarily due to market conditions in 2015, including reductions in our trading volumes, as well as reductions in our convertible and credit trading desk positions. We significantly reduced the amount of capital committed to our convertible bond inventory over the course of 2015. The decision to make those reductions was based on management’s assessment that higher returns were available through alternative uses for that capital.
Our institutional brokerage revenues increased $2.5 million to $56.2 million in 2014 from $53.7 million in 2013. This increase in 2014 partially reflects the impact of the fourth quarter 2013 group hire of 32 institutional brokerage sales, trading and research professionals on our brokerage activities in 2014 as well as our overall increased investment in research.
As a result of our August 2014 acquisition of a securities lending business we have an active securities borrowed and loaned business in which we borrow securities from one party and lend them to another. In addition to the institutional brokerage revenues noted above, during 2015, we generated net revenue of $8.1 million from securities lending compared to $2.8 million in 2014.
31
Principal Investing
Our principal investing activity consists of investments in merchant banking, marketable equity securities, non-public equity securities, corporate debt investments, non-registered investment funds that are managed by third parties and U.S. Treasury securities. The following tables provide a summary of our results within the principal investing segment (dollars in thousands):
|
|
|
For the Year Ended December 31, |
|
|||||||||
|
|
|
2015 |
|
|
2014 |
|
|
2013 |
|
|||
|
Revenues, net of interest expense: |
|
|
|
|
|
|
|
|
|
|
|
|
|
Net investment income |
|
$ |
5,433 |
|
|
$ |
17,774 |
|
|
$ |
6,920 |
|
|
Interest |
|
|
29 |
|
|
|
122 |
|
|
|
740 |
|
|
Dividends and other |
|
|
589 |
|
|
|
481 |
|
|
|
728 |
|
|
Total revenues |
|
|
6,051 |
|
|
|
18,377 |
|
|
|
8,388 |
|
|
Interest expense |
|
|
11,160 |
|
|
|
11,678 |
|
|
|
— |
|
|
Revenues, net of interest expense |
|
|
(5,109 |
) |
|
|
6,699 |
|
|
|
8,388 |
|
|
Operating expenses: |
|
|
|
|
|
|
|
|
|
|
|
|
|
Variable |
|
|
37 |
|
|
|
316 |
|
|
|
1,179 |
|
|
Fixed |
|
|
2,134 |
|
|
|
2,523 |
|
|
|
1,496 |
|
|
Total(1) |
|
|
2,171 |
|
|
|
2,839 |
|
|
|
2,675 |
|
|
Pre-tax (loss) income |
|
$ |
(7,280 |
) |
|
$ |
3,860 |
|
|
$ |
5,713 |
|
|
|
|
(1) |
For the years ended December 31, 2015, 2014, and 2013, total operating expenses includes an allocation of corporate overhead costs of $407, $449, and $495, respectively. |
The pre-tax loss from our principal investing segment was $7.3 million in 2015 compared to pre-tax income of $3.9 million in 2014 and $5.7 million in 2013. The decreases in our pre-tax income were due to decreased investment revenues, net of interest expense. Net investment income in 2015 included $10.0 million of realized gains from short sales of U.S. Treasury securities partially offset by $4.6 million of net losses from investment funds and trading securities. Net investment income in 2014 included $10.5 million of gains from short-sales of U.S. Treasury securities and $7.3 million of net gains from investment funds and trading securities. Interest expense incurred during 2015 and 2014 was related to short U.S. Treasury securities. Net investment income in 2013 included $6.8 million of net gains from investment funds and trading securities partially offset by a $0.5 million impairment loss related to an available-for-sale investment security.
Investments
The total value of our principal investments was $87.4 million as of December 31, 2015. Of this total, $66.6 million was held in non-registered investment funds, $14.3 million was held in marketable and non-public equity securities, warrants and fixed income securities, at fair value, and $6.5 million was held in non-public investments recorded at cost. The following table provides additional detail regarding our principal investments as of December 31, 2015 (dollars in thousands):
|
|
|
Carrying Value/ Fair Value |
|
|
|
Investments, at fair value: |
|
|
|
|
|
Fixed income/credit-related hedge funds |
|
$ |
38,972 |
|
|
Multi-strategy hedge funds |
|
|
18,930 |
|
|
Private equity funds |
|
|
8,700 |
|
|
Total investment funds, at fair value |
|
|
66,602 |
|
|
Marketable and non-public equity securities and warrants, at fair value |
|
|
14,285 |
|
|
Total investments, at fair value |
|
|
80,887 |
|
|
Investments, at cost |
|
|
6,539 |
|
|
Total investments |
|
$ |
87,426 |
|
32
The Company’s December 31, 2015 investment balance of $87.4 million is down $23.6 million from the comparable balance at the end of the third quarter of 2015. This decrease is primarily the result of investment fund redemptions. We have initiated additional fund redemptions that we expect will generate approximately $43 million by the end of July 2016.
As of December 31, 2015, the $66.6 million of investment funds reflects investments in 17 non-registered investment funds that are valued at net asset value (“NAV”) as determined by the fund administrators. As a practical expedient, the Company relies on the NAV of these investments as their fair value. The NAVs that have been provided by fund administrators are derived from the fair values of the underlying investments as of the reporting date. Considering the general lack of transparency necessary to conduct an independent assessment of the fair value of the securities underlying each of the NAVs provided by the fund administrators, our quarterly reporting process includes a number of assessment processes to assist the Company in the evaluation of the information provided by fund managers and fund administrators. These assessment processes include, but are not limited to, regular review and discussion of each fund’s performance with its manager and regular evaluation of performance against applicable benchmarks.
In addition to these assets, during 2015, as part of the Company’s investing activities, the Company entered into two short sales totaling $200 million face value, of 4.625% U.S. Treasury securities maturing in November 2016. These two short sales were closed out during the third quarter of 2015. A short sale of a $75 million face value, 7.25% U.S. Treasury security, which was entered into in 2014 and included on our balance sheet at December 31, 2014, was closed out in the fourth quarter of 2015.
Discontinued Operations
The Company completed the sale of the FBR Funds, a family of mutual funds, in October 2012. Subsequent to the sale closing, the Company has had no continuing involvement in the management of these funds. As a result of this sale transaction, the Company reports the results of its former asset management operations as discontinued operations. As described below, the Company received the final proceeds from this sale in 2013, and accordingly had no activity related to discontinued operations in 2014 or 2015. The results related to our former asset management operations reflected in the consolidated statements of operations are presented in the following table (dollars in thousands):
|
|
|
For Year Ended December 31, |
|
|
|
|
|
2013 |
|
|
|
Revenues |
|
$ |
— |
|
|
Gain on sale of assets |
|
|
8,944 |
|
|
Expenses |
|
|
170 |
|
|
Income from discontinued operations before income taxes |
|
|
8,774 |
|
|
Income tax provision |
|
|
615 |
|
|
Income from discontinued operations, net of taxes |
|
$ |
8,159 |
|
During the year ended December 31, 2013, we received $19.3 million, representing our receipt of the final payment due from the sale of the FBR Funds and generated $8.2 million of net income from discontinued operations. Our 2013 net income from discontinued operations reflects the change in value during the year of the contingent payment that was due from this sale and recorded as a receivable at December 31, 2012. The increase in value during 2013 was due primarily to asset inflows to the funds and market appreciation of the funds during the period subsequent to the sale. The tax provision recognized in 2013 relates primarily to state taxes on income that could not be offset by either net operating loss or capital loss carryforwards.
33
Results of Operations
Revenues
Our revenues consist primarily of capital raising and advisory fees in investment banking; commissions resulting from securities transactions executed as agent or principal and related net trading gains and losses in institutional brokerage; interest income from securities lending; and with respect to principal investing activities, net investment income, including realized gains or losses, and dividends from merchant banking investments, earnings from investment funds, and interest income from principal investing activities.
Revenue from capital raising transactions is substantially dependent on the market for public and private offerings of equity and debt securities within the industries in which we focus our efforts. Institutional brokerage revenues from agency commissions are dependent on the level of overall market trading volume and penetration of our institutional client base by our research, sales, and trading staff. Principal brokerage transactions are dependent on these same factors and on trading volume and spreads in the securities of such companies; net trading gains and losses are dependent on the market performance of securities held, as well as our decisions as to the level of market exposure we accept in these securities. Accordingly, our revenues in these areas have fluctuated in the past, and we anticipate that they are likely to continue to fluctuate in the future, based on these factors.
In our principal investing activities, merchant banking and other investments are subject to market risk, as well as, any number of specific additional risks related to each investment. As a result, net investment income and dividends generated from these investments will vary and cannot be accurately predicted.
Investment Banking
Capital raising revenue consists of placement fees, underwriting discounts, selling concessions, management fees and reimbursed expenses associated with underwriting and placement activities of equity and debt. We act in varying capacities in our capital raising activities, which, based on the underlying economics of each transaction, determine our ultimate revenues from these activities. When we are engaged as a book-running manager of an underwriting, we generally commit greater resources, bear more risk and earn higher revenues than if engaged as a co- or lead-manager, an underwriter (syndicate member) or a broker-dealer included in the selling group.
Advisory revenue consists primarily of advisory fees and reimbursed expenses associated with such activities. Advisory fees have fluctuated in the past, and are likely to continue to fluctuate, based on the number and size of our completed transactions.
Institutional Brokerage
Institutional brokerage revenues consist of commissions resulting from securities transactions executed as agent or principal and related net trading gains and losses. Gains and losses result primarily from market price fluctuations that occur while holding positions in our trading security inventory. Revenues generated from securities transactions and related commission income and expense are recorded on the trade date. Institutional brokerage revenues also include direct payments received by the Company for equity research.
Net Investment Income
Net investment income includes net realized gains or losses on sale of equity and debt securities, unrealized gains and losses on investments designated as trading as well as any applicable impairment losses related to investments in marketable and non-public equity securities. Net investment income also includes income or loss from investment funds that we hold, reflecting changes in the net asset values of the funds.
Interest
Interest income includes amounts earned from the Company’s securities lending activities and from security positions held on our trading desk and from treasury management investments, which includes interest-bearing accounts and securities.
34
Dividends & Other Income
Dividends and other income include dividends from merchant banking and other equity investments and other miscellaneous fees generated from non-core business activities.
Expenses
Interest expense includes costs related to the Company’s securities lending activities as well as the costs associated with outstanding short sales of fixed income securities.
Compensation and benefits expense includes base salaries, payroll taxes, employee benefits, non-cash expenses associated with all stock-based awards granted to employees, and incentive compensation. Incentive compensation varies primarily based on revenue production. Salaries, payroll taxes and employee benefits are relatively fixed in nature.
Professional services expenses include legal fees, primarily associated with investment banking transactions, consulting fees, and recruiting fees. Legal fees associated with investment banking transactions are, to a large extent, variable with investment banking activity levels.
Occupancy and equipment includes rental costs for our facilities, depreciation and amortization of equipment, software and leasehold improvements and expenses. These expenses are largely fixed in nature.
Communications expenses include voice, data and internet service fees, and data processing costs. While variable in nature, these do not tend to vary with revenue.
Business development expenses include travel and entertainment expenses related to investment banking activity, costs of investor conferences, sponsorships and advertising. Expenses that are directly related to completed investment banking transactions are variable with revenue.
Clearing and brokerage fees include trade processing expenses that we pay to our clearing brokers, and execution fees that we pay to floor brokers and electronic communication networks. These expenses are almost entirely variable based on our revenue.
Other operating expenses include professional liability and property insurance, business license taxes and registration fees, board of directors’ costs, offices supplies, interest related to taxes, penalties and fees, printing and copying, charitable contributions and other miscellaneous office expenses.
35
The following table sets forth financial data related to our continuing operations as a percentage of revenues, net of interest expense:
|
|
|
For the Year Ended December 31, |
|
|||||||||
|
|
|
2015 |
|
|
2014 |
|
|
2013 |
|
|||
|
Revenues: |
|
|
|
|
|
|
|
|
|
|
|
|
|
Investment banking: |
|
|
|
|
|
|
|
|
|
|
|
|
|
Capital raising |
|
|
51.1 |
% |
|
|
57.0 |
% |
|
|
71.8 |
% |
|
Advisory |
|
|
8.0 |
% |
|
|
6.2 |
% |
|
|
3.7 |
% |
|
Subtotal |
|
|
59.1 |
% |
|
|
63.2 |
% |
|
|
75.5 |
% |
|
Institutional brokerage |
|
|
37.7 |
% |
|
|
30.8 |
% |
|
|
20.7 |
% |
|
Net investment income |
|
|
4.5 |
% |
|
|
9.8 |
% |
|
|
2.7 |
% |
|
Interest |
|
|
26.4 |
% |
|
|
7.2 |
% |
|
|
0.7 |
% |
|
Dividends and other |
|
|
1.4 |
% |
|
|
0.6 |
% |
|
|
0.4 |
% |
|
Total revenues |
|
|
129.1 |
% |
|
|
111.6 |
% |
|
|
100.0 |
% |
|
Interest expense |
|
|
29.1 |
% |
|
|
11.6 |
% |
|
|
0.0 |
% |
|
Revenues, net of interest expense |
|
|
100.0 |
% |
|
|
100.0 |
% |
|
|
100.0 |
% |
|
Non-interest expenses: |
|
|
|
|
|
|
|
|
|
|
|
|
|
Compensation and benefits |
|
|
64.3 |
% |
|
|
57.0 |
% |
|
|
55.7 |
% |
|
Professional services |
|
|
11.0 |
% |
|
|
7.3 |
% |
|
|
4.7 |
% |
|
Occupancy and equipment |
|
|
10.5 |
% |
|
|
7.4 |
% |
|
|
4.7 |
% |
|
Communications |
|
|
9.0 |
% |
|
|
6.3 |
% |
|
|
4.3 |
% |
|
Business development |
|
|
8.2 |
% |
|
|
6.4 |
% |
|
|
3.7 |
% |
|
Clearing and brokerage fees |
|
|
4.4 |
% |
|
|
2.6 |
% |
|
|
1.9 |
% |
|
Other operating expenses |
|
|
5.6 |
% |
|
|
3.5 |
% |
|
|
3.0 |
% |
|
Total non-interest expenses |
|
|
113.0 |
% |
|
|
90.5 |
% |
|
|
78.0 |
% |
|
(Loss) income before income taxes |
|
|
-13.0 |
% |
|
|
9.5 |
% |
|
|
22.0 |
% |
Comparison of the Years Ended December 31, 2015 and 2014
For the year ended December 31, 2015, our net loss was $7.5 million compared to net income of $17.0 million in 2014. This decrease in net income was primarily the result of a $49.9 million decrease in net revenues from capital markets and an $11.8 million decrease in net revenues from principal investing in 2015. The impact of these lower revenues in 2015 was partially offset by decreased expenses in 2015 compared to 2014. Our net loss for 2015 includes an $8.3 million tax benefit compared to a $0.3 million tax provision in 2014.
Our capital markets segment had a pre-tax loss of $8.5 million during 2015, compared to pre-tax income of $13.5 million during 2014. The difference in our 2015 capital markets results compared to 2014 was primarily due to a $44.2 million decrease in investment banking revenue year over year. As a result of negative returns from investment funds and losses from equity and other trading securities, our principal investing segment had a pre-tax loss of $7.3 million during 2015 compared to pre-tax income of $3.9 million in 2014.
Revenues, Net of Interest Expense
Our revenues, net of interest expense, decreased 33.9% to $120.4 million during 2015 from $182.1 million during 2014 due to the changes in revenues and interest expense discussed below.
Capital raising revenues decreased 40.8% to $61.5 million in 2015 from $103.9 million in 2014. The decrease was attributable to completing fewer and smaller sole-managed transactions in 2015. In 2015, we completed 36 client transactions, including four sole-managed institutional private placements with an average transaction size of $162 million that generated $39.7 million of revenue. In 2014, we completed 41 client transactions, including six sole-managed institutional private placements with an average transaction size of $206 million that generated $80.4 million of revenue.
36
Advisory revenues decreased 15.8% to $9.6 million in 2015 from $11.4 million in 2014 due to a decrease in revenue generated from M&A and advisory engagements. While we completed a comparable number of assignments in both years, the decrease in revenue was primarily attributable to a decrease in the level of fees earned on transactions completed in 2015 compared to 2014.
Institutional brokerage revenues decreased 19.2% to $45.4 million in 2015 from $56.2 million in 2014. The decrease in revenue in 2015 reflects reduced revenues from each of our convertibles, credit and equity trading desks during the period. These decreases were primarily due to market conditions in 2015, including reductions in our trading volumes, as well as the impact of reductions in our convertible and credit trading desk positions.
Net investment income decreased 69.7% to $5.4 million in 2015 compared to $17.8 million in 2014 as a result of losses incurred in investment funds and net losses from equity trading securities. Net investment income in 2015 includes $10.0 million of realized gains from short-sales of U.S. Treasury securities, partially offset by $4.6 million of net losses from investment funds and equity trading securities. Net investment income for 2014 includes $10.5 million of gains from short-sales of U.S. Treasury securities and $7.3 million of net gains from investment funds and trading securities.
Interest income increased $18.7 million to $31.8 million in 2015 from $13.1 million in 2014. The increase in interest income was due to our purchase of a securities lending business in August 2014. Subsequent to this acquisition, we have an active securities lending business in which we borrow securities from one party and lend them to another.
Dividends and other revenues increased $0.7 million to $1.7 million in 2015 from $1.0 million in 2014. During 2015, as a result of changes in forecasted securities lending results, the Company reduced the carrying value of its contingent consideration liability by $0.6 million. This reduction is included in dividends and other income in the consolidated statements of operations.
During 2015, we incurred total interest expense of $35.0 million, including $23.9 million related to securities lending and $11.1 million related to short-sales of U.S. Treasury securities. During 2014, we incurred $21.2 million of interest expense, including $11.7 million related to short-sales of U.S. Treasury securities, and $9.5 million related to securities lending. The increase in interest expense related to securities lending in 2015 was the result of maintaining higher average balances in 2015 compared to 2014, due primarily to the timing of our securities lending acquisition in August 2014.
Non-Interest Expenses
Total non-interest expenses decreased 17.4% to $136.2 million in 2015 from $164.8 million in 2014. This decrease was caused by the changes in non-interest expenses discussed below.
Compensation and benefits expenses decreased 25.3% to $77.5 million in 2015 from $103.8 million in 2014 primarily as a result of a $23.8 million decrease in variable compensation. The reduction in variable compensation was due to the $61.7 million reduction in revenues, net of interest expense, in 2015 compared to the prior year. This decrease was also due to a $2.5 million decrease in fixed compensation in 2015 compared to 2014 reflecting reduced stock compensation and the impact of lower average headcount in 2015 compared to 2014. As a result of the reduction in revenues during 2015 and the impact of our fixed compensation and benefits, our compensation and benefits expense as a percentage of net revenues increased to 64% in 2015 from 57% in 2014.
Professional services expenses remained flat at $13.3 million in both 2015 and 2014. During 2015, costs related to investment banking transactions decreased $0.3 million compared to 2014 reflecting the decrease in banking activity in 2015, partially offset by an increase in costs incurred in 2015 related to investment banking transactions that were not completed. This decrease was offset by a $0.3 million increase in fixed costs, reflecting the net effects of increased corporate legal costs due to our acquisition of MLV, partially offset by a decrease in recruiting fees.
37
Occupancy and equipment expenses decreased 5.9% to $12.7 million in 2015 from $13.5 million in 2014. The decrease in occupancy costs reflects the impact of the move to our new corporate headquarters in Arlington, Virginia in the fourth quarter of 2014, partially offset by increases in costs related to software maintenance and licenses, depreciation of leasehold improvements and office equipment. During 2014, the Company incurred $1.1 million of non-recurring costs related to our corporate office move, including additional rent, moving expenses and various other expenses associated with our former corporate offices.
Communications expenses decreased 5.2% to $10.9 million in 2015 from $11.5 million in 2014. The decrease in these expenses was primarily due to decreased costs related to data network and connectivity costs.
Business development expenses decreased 16.2% to $9.8 million in 2015 from $11.7 million in 2014. This decrease is primarily due to a decrease in travel costs related to business promotion and investment banking transactions.
Clearing and brokerage fees increased 10.4% to $5.3 million in 2015 from $4.8 million in 2014. Our 2015 clearing and brokerage fees reflect increased costs related to securities lending offset by a reduction in costs related to equity trading.
Other operating expenses increased 6.3% to $6.7 million in 2015 from $6.3 million in 2014. The increase in these expenses was primarily due to the recognition of $0.7 million of bad debt expenses in 2015 compared to $0.2 million in 2014.
We recognized a tax benefit of $8.3 million in 2015 compared to a tax provision of $0.3 million in 2014. The Company’s effective tax rate in 2015 was 52.7% compared to 2.0% in 2014. Our 2015 and 2014 effective tax rates differed from statutory tax rates primarily due to the Company’s use of previously reserved tax assets related to capital loss carryforwards.
Following the criteria in ASC 740, “Income Taxes” (“ASC 740”) the Company evaluates the need for a valuation allowance against its deferred tax assets on a quarterly basis assessing the positive and negative evidence to determine if it is more likely than not that some or all of the deferred tax assets will be realized. As of December 31, 2015, our net deferred assets totaled $37.8 million. Based on its assessment as of December 31, 2015, the Company determined that a valuation allowance of $0.3 million related to state capital loss carryforwards was appropriate. We will continue to assess the need for a valuation allowance at each reporting date. Realization of the Company’s deferred tax assets will be dependent on the Company’s ability to generate future taxable income. At December 31, 2014, the Company’s net deferred tax assets totaled $32.2 million and were offset by a valuation allowance of $3.5 million. This valuation allowance related to capital loss carryforwards and was determined based on the Company’s application of the guidance in ASC 740 and its conclusion that it was more likely than not that the benefits of these assets would not be realized in the future.
Comparison of the Years Ended December 31, 2014 and 2013
For the year ended December 31, 2014, our net income was $17.0 million compared to net income of $92.9 million in 2013. This decrease in net income was primarily the result of an $80.9 million decrease in investment banking revenue in 2014 compared to 2013, a tax benefit of $27.5 million recognized in 2013 compared to a $0.3 million tax provision in 2014, and an $8.2 million decrease in net income from discontinued operations. The tax benefit recognized in 2013 reflects the reversal of a significant component of the valuation allowance that had been recorded against our deferred tax assets.
Our pre-tax income from continuing operations was $17.4 million in 2014 compared to $57.3 million in 2013. The decrease in our operating results in 2014 compared to 2013 was primarily due to the $80.9 million decrease in investment banking revenue in 2014 compared to 2013.
The pre-tax income from our capital markets segment was $13.5 million in 2014 compared to $51.6 million in 2013. The decrease in these pre-tax results was primarily attributable to the decrease in investment banking revenue discussed above. The pre-tax income from our principal investing segment was $3.9 million in 2014 compared to $5.7 million in 2013. The decrease in our principal investing results was primarily attributable to the decrease in investment revenues, net of interest expense in 2014 compared to the prior year.
38
Revenues, Net of Interest Expense
Our revenues, net of interest expense, decreased 29.9% to $182.1 million during 2014 from $259.8 million during 2013 due to the changes in revenues and interest expense discussed below.
Capital raising revenues decreased 44.3% to $103.9 million in 2014 from $186.5 million in 2013. During 2014 we completed 41 client engagements including six sole-managed equity private placements that generated $80.4 million of our capital raising revenue in the period. Our revenues from public equity and debt transactions were $15.9 million in 2014. During 2013 we completed 51 client engagements including six sole-managed equity private placements that generated $134.0 million of our capital raising revenue in the period. One of these private placements, representing $38.3 million of that revenue, was executed in the second quarter of 2012; however, the issuer did not receive the required regulatory approvals necessary for us to recognize this revenue until the first quarter of 2013. Our revenues from public equity and debt transactions were $46.4 million in 2013. The reduction in investment banking revenues in 2014 compared to 2013 principally reflects the differences in the nature and size of the capital raising transactions completed in these periods. Specifically, while we completed six sole-managed private placements in both 2014 and 2013, the average size of the transactions completed in 2014 was $206 million compared to $352 million in 2013.
Advisory revenues increased 17.5% in 2014 to $11.4 million from $9.7 million in 2013 due to an increase in revenue generated from M&A engagements. While we completed a comparable number of transactions in both years, the M&A transactions completed in 2014 resulted in increased revenues due to differences in the fee arrangements on these engagements.
Institutional brokerage revenues increased 4.7% to $56.2 million in 2014 from $53.7 million in 2013. This increase was primarily a result of new client relationships and gains in market share from existing clients. The increase in revenue in 2014 reflects the impact of the fourth quarter 2013 group hire of 32 institutional brokerage sales, trading and research professionals on our brokerage activities in 2014 as well as our continued investment in research.
Net investment income increased 158.0% to $17.8 million in 2014 compared to $6.9 million in 2013. The increase was primarily due to gains from short-sales of U.S. Treasury securities during 2014. Net investment income in 2014 included $10.5 million of gains from short-sales of U.S. Treasury securities and $7.3 million of net gains from investment funds and trading securities. Our net investment income for 2013 included $6.8 million of net gains from investment funds and trading securities partially offset by a $0.5 million impairment loss related to an available-for-sale investment security.
Interest income increased $11.3 million to $13.1 million in 2014 from $1.8 million in 2013. The increase in interest income was due to our purchase of a securities lending business in August 2014.
Dividends and other revenues of $1.0 million in 2014 decreased slightly from $1.2 million in 2013. These revenues primarily included dividends generated from our investing activities.
During 2014, we incurred total interest expense of $21.2 million, including $11.7 million of interest expense related to two short-sales of $100 million face value each, 4.50% U.S. Treasury securities and one short-sale of a $75 million face value, 7.25% U.S. Treasury security that were outstanding during the year, and $9.5 million related to securities lending activities. The Company did not incur any interest expense during 2013.
Non-Interest Expenses
Total non-interest expenses decreased 18.7% to $164.8 million in 2014 from $202.6 million in 2013. This decrease was caused by the changes in non-interest expenses discussed below.
Compensation and benefits expenses decreased 28.3% to $103.8 million in 2014 from $144.7 million in 2013 as a result of a $48.0 million decrease in variable compensation. The decrease in variable compensation during 2014 was due to the decrease in investment banking revenue in 2014 compared to 2013. This decrease was partially offset
39
by a $7.1 million increase in fixed compensation during 2014. The Company’s compensation and benefits expenses were 57% of revenue, net of interest expense during 2014 compared to 56% during 2013.
Professional services expenses increased 8.1% to $13.3 million in 2014 from $12.3 million in 2013 primarily due to increased costs related to investment banking transactions. Despite the decrease in investment banking revenue, our transaction related costs increased in 2014 compared to 2013 due to an increase in costs incurred in 2014 related to investment banking transactions that were not completed.
Occupancy and equipment expenses increased 9.8% to $13.5 million in 2014 from $12.3 million in 2013. The increase in occupancy costs was primarily the result of costs related to our move to a new corporate headquarters in Arlington, Virginia in the fourth quarter of 2014. Specifically, the Company incurred $1.1 million of non-recurring costs related to this office move, such costs included additional rent, moving expenses and various other expenses associated with our former corporate offices.
Communications expenses increased 3.6% to $11.5 million in 2014 from $11.1 million in 2013. The increase in these expenses was primarily due to an increase in our average headcount in 2014 and increased costs related to market data and customer trading services.
Business development expenses increased 21.9% to $11.7 million in 2014 from $9.6 million in 2013. This increase was the result of increased travel and business promotion costs related to business development activities and investment banking transactions. Despite the decrease in investment banking revenue, our travel related costs increased in 2014 compared to 2013 due to an increase in costs incurred in 2014 related to investment banking transactions that were not completed.
Clearing and brokerage fees decreased 2.0% to $4.8 million in 2014 from $4.9 million in 2013. The decrease in these costs was due to the impact of cost reduction initiatives directed at reducing our variable transaction costs, these decreases more than offset higher activity levels in 2014.
Other operating expenses decreased 17.1% to $6.3 million in 2014 from $7.6 million in 2013. The decrease in these expenses was primarily due to costs incurred for an arbitration settlement in 2013 as well as costs incurred for other legal and regulatory matters in 2013 for which we did not incur comparable costs in 2014.
We recognized a tax provision of $0.3 million in 2014 compared to a tax benefit of $27.5 million in 2013. The tax provision in 2014 reflected the Company’s use of previously reserved tax assets related to capital loss carryforwards. As described below, our 2013 tax benefit from continuing operations reflected the reversal of a significant component of the valuation allowance that had been recorded against the Company’s deferred tax assets as well as the utilization during 2013 of net operating loss carryforwards against 2013 taxable income.
The Company’s effective tax rate in 2014 was 2.0% compared to (48.0%) in 2013. Our 2014 effective tax rate differed from statutory tax rates primarily due to the Company’s use of previously reserved tax assets related to capital loss carryforwards. Our 2013 effective tax rate differed from statutory tax rates primarily due to the effects of the valuation allowance reversal recognized in the second quarter of 2013.
As of December 31, 2012 and March 31, 2013, the Company provided a full valuation allowance against its net deferred tax assets since, based on the application of the criteria in ASC 740, it concluded that it was more likely than not that the benefits of these assets would not be realized in the future. Pursuant to the criteria in ASC 740, the Company reviews its valuation allowance on a quarterly basis assessing the positive and negative evidence to determine if it is more likely than not that some or all of the deferred tax assets will be realized. Based on its assessment as of June 30, 2013, the Company determined that the release of a significant component of this valuation allowance was appropriate. This conclusion was based on management’s consideration of various factors, including the Company’s improved operating performance, its cumulative operating results over the prior twelve quarters and the outlook regarding the Company’s prospective operating performance.
As of December 31, 2013, our net deferred tax assets totaled $49.2 million and were offset by an $18.3 million valuation allowance. The Company’s valuation allowance at December 31, 2013 related to capital loss carryforwards and net unrealized losses on investments. This valuation allowance was determined based on the
40
Company’s application of the guidance in ASC 740 and its conclusion that it was more likely than not that the benefits of these assets would not be realized in the future. At December 31, 2014, the Company’s net deferred tax assets totaled $32.2 million and were offset by a valuation allowance of $3.5 million. This valuation allowance related to capital loss carryforwards and was determined based on the Company’s application of the guidance in ASC 740 and its conclusion that it was more likely than not that the benefits of these assets would not be realized in the future.
Discontinued Operations
As described previously, we received the final proceeds from the sale of the FBR Funds in 2013, and had no activity related to discontinued operations in 2014. Income from discontinued operations, net of taxes was $8.2 million in 2013. The $8.2 million of net income from discontinued operations in 2013 represented the change in value during the year of the contingent payment that was due from the sale of assets related to our former mutual funds business in 2012 and received in 2013. The increase in value during 2013 was due primarily to asset inflows to the funds and market appreciation of the funds during the period subsequent to the sale. The tax provision recognized in 2013 related primarily to state taxes on income that could not be offset by either net operating loss or capital loss carryforwards.
Liquidity and Capital Resources
Liquidity is a measurement of our ability to meet potential cash requirements, including ongoing funding for investments, and for other general business purposes. Regulatory requirements applicable to our broker-dealer subsidiaries require minimum capital levels. The primary sources of funds for liquidity consist of existing cash balances (i.e., available liquid capital not invested in our operating businesses), proceeds from sales of securities, internally generated funds, dividends on equity securities that we own, and credit provided by margin accounts, banks, clearing brokers, and affiliates of our principal clearing broker. Potential future sources of liquidity for us include internally generated funds, borrowing capacity through margin accounts, corporate lines of credit and other credit facilities which we may enter into in the future, and future issuances of common stock, preferred stock or debt securities.
Cash Flows
As of December 31, 2015, our cash and cash equivalents totaled $70.1 million representing a net decrease of $38.9 million for the year ended December 31, 2015. The decrease is attributable to $49.2 million of cash used by financing activities, $19.6 million of cash used by operating activities partially offset by $29.9 million of cash provided by investing activities. Due to the cyclical nature of our industry and the industries in which we provide services, we maintain liquid capital to cover potential cash outflows in periods of decreased revenues and earnings.
Net cash used in our operating activities of $19.6 million during 2015 compares to $18.9 million used in operating activities during 2014. This cash used by operating activities in 2015 reflects our net operating loss for the year and a $21.1 million decrease in our accrued compensation, partially offset by a net decrease in our trading desk positions. The cash used by operating activities in 2014 reflects our net operating income for the year, offset by a decrease in our accrued compensation as well as a decrease in our net due to brokers, dealers and clearing organizations.
Net cash provided by investing activities of $29.9 million during 2015 compares to $16.0 million used in investing activities during 2014. The $29.9 million provided in 2015 reflects $41.0 million of proceeds from securities sold during 2015 and net proceeds of $13.2 million from activity related to short sales of U.S. Treasury securities offset by investments purchased during the period of $17.6 million, corporate acquisitions of $4.4 million and $2.3 million related to the purchase of furniture, equipment, software and leasehold improvements. The net cash used in investing activities in 2014 reflects investments purchased during the period, including $51.7 million of investment funds and $22.7 million of trading securities, as well as $9.5 million related to the purchase of furniture, equipment, software and leasehold improvements. These items were offset by $60.7 million of proceeds from securities sold during 2014, and net proceeds of $8.3 million from activity related to short sales of U.S. Treasury securities.
41
Net cash used in financing activities of $49.2 million during 2015 compares to net cash used in financing activities of $64.1 million during 2014. The activity primarily represents the repurchase of 2.0 million shares and 2.5 million shares of our common stock in 2015 and 2014, respectively. The 2.0 million of shares repurchased during 2015 were acquired for a total cost of $48.3 million and the 2.5 million shares repurchased during 2014 were acquired for a total cost of $65.9 million.
As of December 31, 2014, our cash and cash equivalents totaled $109.0 million representing a net decrease of $99.0 million for the year ended December 31, 2014. The decrease is attributable to $64.1 million of cash used by financing activities, $18.9 million of cash used by operating activities, and $16.0 million of cash used in investing activities.
Net cash used in our operating activities of $18.9 million during 2014 compares to $99.2 million of cash provided by operating activities during 2013. This cash used by operating activities in 2014 reflects our net operating income for the year, offset by a decrease in our accrued compensation as well as a decrease in our net due to brokers, dealers and clearing organizations. The cash provided by operating activities in 2013 reflects our net operating income for the year, a significant increase in our accrued compensation as well as an increase in our net due to brokers, dealers and clearing organizations.
Net cash used in investing activities of $16.0 million during 2014 compares to $12.3 million used in investing activities during 2013. The $16.0 million used in 2014 reflects principal investments purchased during the period, including $51.7 million of investment funds and $22.7 million of trading securities, as well as $9.5 million related the purchase of furniture, equipment, software and leasehold improvements. These items were offset by $60.7 million of proceeds from securities sold during 2014, and net proceeds of $8.3 million from activity related to short sales of U.S. Treasury securities. The net cash used in investing activities in 2013 reflects the net purchases of principal investments during the year, primarily non-registered investment funds, offset by the $19.3 million of cash received from the sale of the FBR Funds.
Net cash used in financing activities of $64.1 million during 2014 compares to net cash used in financing activities of $53.9 million during 2013. The activity primarily represents the repurchase of 2.5 million and 2.6 million shares of our common stock in 2014 and 2013, respectively. The 2.5 million of shares repurchased during 2014 were acquired for a total cost of $65.9 million and the 2.6 million shares repurchased during 2013 were acquired for a total cost of $59.4 million.
Sources of Funding
We believe that our existing cash and cash equivalents balances (totaling $70.1 million at December 31, 2015) comprised primarily of investments in money market funds investing in short-term U.S. Treasury securities, cash flows from operations, borrowing capacity, other sources of liquidity and execution of our financing strategies will be sufficient to meet our cash requirements. We have obtained, and believe we will be able to continue to obtain, short-term financing, such as margin financing and temporary subordinated financing, in amounts and at interest rates consistent with our financing objectives. We may, however, seek debt or equity financings, in public or private transactions, to provide capital for corporate purposes and/or strategic business opportunities, including possible acquisitions, joint ventures, alliances or other business arrangements which could require substantial capital outlays. Our policy is to evaluate strategic business opportunities, including acquisitions and divestitures, as they arise. There can be no assurance that we will be able to generate sufficient funds from future operations, or raise sufficient debt or equity on acceptable terms, to take advantage of investment opportunities that become available. Should our needs ever exceed these sources of liquidity, we believe that many of our investments could be sold, in most circumstances, to provide cash.
We monitor and manage our leverage and liquidity risk through various committees and processes we have established. We assess our leverage and liquidity risk based on considerations and assumptions of market factors, as well as factors specific to us, including the amount of our available liquid capital (i.e., the amount of our cash and cash equivalents not invested in our operating business). At December 31, 2015, we had no outstanding borrowings.
42
Assets and Liabilities
As of December 31, 2015, our principal assets consisted of cash and cash equivalents, financial instruments at fair value, receivables and investments carried at cost. As of December 31, 2015 and December 31, 2014, our liquid assets consisted primarily of cash and cash equivalents of $70.1 million and $109.0 million, respectively.
The decrease in our total assets to $0.9 billion as of December 31, 2015, compared to $1.0 billion as of December 31, 2014, was primarily the result of an $89.0 million decrease in due from brokers, dealers and clearing organizations, a $71.1 million decrease in financial instruments owned, at fair value, and the $38.9 million decrease in cash noted above, partially offset by a $90.4 million increase in securities borrowed.
Regarding our due from brokers, dealers and clearing organizations balances, during 2015 and 2014, as part of the Company’s investing activities, the Company entered into short-sales of U.S. Treasury Securities. Proceeds from a short-sale position, as well as related margin requirements, totaling $84.1 million, were held in a collateral account and included in due from brokers, dealers and clearing organizations on our consolidated balance sheets at December 31, 2014. In the fourth quarter of 2015, the short-sale positions were settled and the related collateral account was closed. The remainder of our due from and to brokers, dealers, and clearing organizations balances primarily represent unsettled banking and securities trades as well as cash on deposit related to securities lending.
As of December 31, 2015, our $87.4 million of investments primarily consisted of investments in non-registered investment funds, marketable equity securities, and non-public equity securities. These investments are funded in cash and are not financed with debt. We have initiated investment fund redemptions that we expect will generate approximately $43 million by the end of July 2016.
Regarding securities lending and our securities borrowed and securities loaned balances, we completed the acquisition of a securities lending business in the third quarter of 2014 and as a result of this acquisition, we have an active business in which we borrow securities from one party and lend them to another. Securities borrowed and securities loaned are recorded based upon the amount of cash advanced or received. Securities borrowed transactions facilitate the settlement process and require us to deposit cash or other collateral with the lender. With respect to securities loaned, we receive collateral in the form of cash. The amount of collateral required to be deposited for securities borrowed, or received for securities loaned, is an amount generally in excess of the market value of the applicable securities borrowed or loaned. We monitor the market value of the securities borrowed and loaned on a daily basis, with additional collateral obtained, or excess collateral recalled, when deemed appropriate.
The decrease in our total liabilities to $722.6 million as of December 31, 2015 compared to $774.7 million as of December 31, 2014 was primarily the result of a $119.4 million decrease in financial instruments sold, not yet purchased, a $21.2 million decrease in accrued compensation and benefits, and a $3.1 million decrease in accounts payable, accrued expenses and other liabilities. These decreases were partially offset by a $91.7 million increase in securities loaned.
Regulatory Capital
FBRCM and MLV, our broker-dealer subsidiaries, are registered with the SEC and are members of FINRA. As such, they are subject to the minimum net capital requirements promulgated by the SEC. As of December 31, 2015, FBRCM had total regulatory net capital of $40.9 million, which exceeded its required net capital of $2.1 million by $38.8 million. MLV had total regulatory capital of $680 thousand, which exceeded its required net capital of $250 thousand by $430 thousand. Regulatory net capital requirements increase when the broker-dealer is involved in underwriting activities based upon a percentage of the amount being underwritten.
Share Repurchases
During 2015, we repurchased 1.9 million shares of our common stock in open market or privately negotiated transactions at a weighted average share price of $23.20 per share, for a total cost of $45.2 million. As of December 31, 2015, we had a remaining authority to repurchase up to 624 thousand additional shares. On
43
February 10, 2016, the Company’s Board of Directors approved an increase in the Company’s repurchase authorization to an aggregate of 1 million shares.
We also purchase shares of our common stock from recipients of stock-based compensation awards upon the vesting of RSU and restricted stock awards, and the exercise of options to purchase stock, as recipients sell shares to meet their tax obligations. During 2015, we purchased 138 thousand shares of common stock at a weighted average share price of $22.53 per share for a total cost of $3.1 million for this purpose.
Contractual Obligations
We have contractual obligations to make future payments in connection with non-cancelable lease agreements and other contractual commitments as well as uncalled capital commitments to investment partnerships that may be called over the next two years. The following table sets forth these contractual obligations by fiscal year (dollars in thousands):
|
|
|
Payments due by period |
|
|||||||||||||||||
|
|
|
Total |
|
|
Less than 1 year |
|
|
1 - 3 years |
|
|
3 - 5 years |
|
|
More than 5 years |
|
|||||
|
Minimum rental commitments |
|
$ |
38,598 |
|
|
$ |
5,508 |
|
|
$ |
8,613 |
|
|
$ |
6,894 |
|
|
$ |
17,583 |
|
These rental commitments are for operating leases of the Company. The Company currently has no commitments associated with capital leases. The Company also has $0.2 million of uncalled capital commitments to investment partnerships that may be called over the next two years. The Company cannot currently determine when, if ever, these capital commitments will be called.
Quantitative and Qualitative Disclosures about Market Risk
Overall Risk Management
The audit committee of our board of directors has oversight of our risk management framework, and reports to the full board on a quarterly basis regarding our risk management profile. The audit committee regularly meets with our director of risk management to review our risk profile, our policies regarding market and credit risk limits and operations, and our risk tolerance levels and capital limits. Our board of directors has established risk limits applicable to our trading and investment businesses that we monitor daily. In the event risk levels approach the limits, management is required to notify the audit committee, and audit committee approval is required to make any change to the limit levels. The audit committee also regularly meets with our general counsel to discuss legal and regulatory risk issues. In addition, the compensation committee of our board of directors considers the risk associated with overall compensation and how effective our compensation policies are in linking pay to performance and aligning the interest of our executives and shareholders.
We monitor market and business risk, including credit risk, operations, liquidity, compliance, legal, and reputational risk through a number of control procedures designed to identify and evaluate the various risks to which our business and investments are exposed. We have established various committees and processes to assess and to manage risk associated with our investment banking, institutional brokerage, and principal investing activities. We review, among other things, business and transactional risks associated with potential investment banking clients and engagements as well as our capital subjected to risk through our trading activities. We seek to manage the transactional and reputational risks associated with our investment banking and principal investing activities by review and approval of transactions by our management-level commitment committee and investment committee, respectively, prior to accepting an engagement or pursuing a material investment transaction. Our management risk committee oversees our institutional brokerage and investment risk management practices, including identifying risk that could expose us to loss, approving risk limits and policies to control for those risks. As a management oversight and monitoring tool, our management risk committee has set more extensive and lower risk limits applicable to our trading activities than the board-level limits discussed above. These management risk limits cannot be exceeded without obtaining exception approval by senior management.
44
Our risk management function is designed to monitor and understand the risk profile of each of our trading areas and of our principal investing activities, to consolidate risk and liquidity monitoring company-wide, to assist in implementing effective hedging strategies, and to ensure accurate fair values of our financial instruments. In addition, the risk management function is responsible for bringing elevated-risk situations to the attention of senior management, such as the initiation of a large trading position, the granting of exceptions to position or market access limits, or significant changes in the level of our value at risk exposure.
Market Risk
Market risk is the risk that a change in the level of one or more market prices, rates, indices, or other market factors, such as market liquidity, will result in losses for a position or portfolio. Our activities as an underwriter, market maker and principal investor, as well as our activities in securities lending and as a financial intermediary in customer trading transactions, expose us to market risk.
Market risk in our securities lending business arises when the market value of securities borrowed declines relative to the cash we post as collateral with the lender; and when the market value of securities we have loaned increases relative to the cash we have received as collateral from the borrower. Market value fluctuations in our securities lending business are measured daily and any exposure versus cash received or posted is settled daily with counterparties.
We use a number of quantitative measures to manage our exposure to market risk in our trading businesses. These measures include:
Inventory position limits—we establish inventory position limits on gross and net positions, at both the trading desk and individual position level, and we monitor exposures against limits on a daily basis.
Scenario analysis—we apply stress tests and scenario analysis to estimate the potential impact on our trading revenues of highly stressful market environments in both the credit and equity markets.
Value at Risk—we utilize a statistical measure of potential trading loss, called Value at Risk (“VaR”), to estimate the potential loss from adverse market moves in an ordinary market environment. We also establish VaR limits, as appropriate.
Value at Risk. We calculate VaR for our trading businesses using a parametric model that estimates VaR from the standard deviation of portfolio returns. This approach, which captures both the linear and non-linear risks from our trading positions, requires individual positions to be expressed as individual risk factors, then the volatilities and correlations for these risk factors are calculated directly based on data from the previous twelve months. The resulting VaR is expressed over a one-day time horizon and at a 95% confidence level. A 95% confidence level implies that, on average, we anticipate that 5% of the time we may realize trading losses in excess of our VaR amount. The table below presents the Company’s 95%/one-day VaR for the year ended December 31, 2015 and 2014 (dollars in thousands):
|
95% / One-Day VaR |
|
|||||||||||||||||||||||||||||
|
For the Year Ended December 31, |
|
|||||||||||||||||||||||||||||
|
2015 |
|
|
2014 |
|
||||||||||||||||||||||||||
|
Period End |
|
|
Average |
|
|
High |
|
|
Low |
|
|
Period End |
|
|
Average |
|
|
High |
|
|
Low |
|
||||||||
|
|
|
|
|
|
|
|
|
|
|
|
|
|
|
|
|
|
|
|
|
|
|
|
|
|
|
|
|
|
|
|
|
$ |
76 |
|
|
$ |
129 |
|
|
$ |
270 |
|
|
$ |
57 |
|
|
$ |
204 |
|
|
$ |
226 |
|
|
$ |
371 |
|
|
$ |
157 |
|
45
The Company’s VaR of $76 thousand at December 31, 2015 is 0.04% of our shareholder equity as of that date and the change in period end VaR from year to year shows a decrease of $128 thousand. The low, stable level of VaR reflects the low amount of inventory held in trading businesses as well as the Company’s use of hedging transactions, whenever feasible, to reduce market risk. The chart below reflects our daily VaR over the last four quarters:
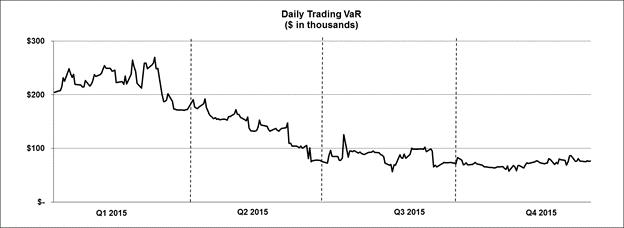
VaR is a model that quantifies potential losses using historical data. We could incur losses greater than the reported VaR because the historical market prices used may not be an accurate measure of future market events and conditions, especially in highly stressful market environments. In addition, the VaR model measures the risk of the current net trading positions and does not take into account future position changes arising from transaction and/or hedging activity. It also includes the market risk associated with financial instruments sold, not yet purchased on our trading desks. Our VaR includes positions actively managed and held by our trading desks and does not include positions associated with investment banking transactions that may be held on our trading desk in order to facilitate distribution if the underlying stock has not yet commenced trading on a national securities exchange. In most instances, these positions are held only for a short period and sold at or above our costs. Such positions totaled $7.6 million at December 31, 2015. To the extent we hold these positions on a long-term basis, they are reflected as long-term investments and risk related to these positions are discussed under the section Equity Price Risk below.
The primary method used to test the reasonableness of the VaR measure is to compare actual daily trading revenue fluctuations with the daily VaR estimate. If the lowest 5th percentile of daily trading revenues in the revenue fluctuations analysis are less than the loss predicted by the 95th percentile VaR estimate, then the VaR estimate is considered a reasonable predictor of actual trading results. In performing this comparison, the Company’s definition of trading revenues and losses includes commissions, sales credits, net interest income, and gains and losses from intraday trading in the Company’s market-making trading businesses. It does not include the activities of investments in equity that are described in detail in the section Equity Price Risk below.
46
The following table provides the actual daily trading revenue fluctuations during the year ended December 31, 2015. Over this twelve-month period, the lowest 5th percentile of all trading days is represented by the first, second and third columns from the left in the table below, which reflect the thirteen lowest days of daily trading revenue. Although not specifically shown in the table, during this thirteen-day period, the average daily trading revenues were net gains of $23 thousand and the lowest one-day revenue was a net loss of $175 thousand.

Equity Price Risk. Equity price risk represents the potential loss in value of a position due to adverse changes in the level or volatility of equity prices. We generally attempt to limit exposure to equity price risk on securities held as a result of our daily equity trading activities by limiting our intra-day and overnight inventory of trading securities to that needed to provide the appropriate level of liquidity in the securities for which we are a market maker. We also seek to manage these risks by diversifying exposures, controlling position sizes, and establishing economic hedges in related securities, principally through short sale transactions.
While it is impossible to project exactly what factors may affect the prices of equity securities and how much the effect might be, the impact of a ten percent increase and a ten percent decrease in the price of equities held by us would be as follows as of December 31, 2015. The fair value of the $10.5 million of trading equity securities held at a broker-dealer subsidiary would increase or decrease to $11.6 million and $9.5 million, respectively, and the fair value of the $20.8 million of other equity investments would increase or decrease to $22.9 million and $18.7 million, respectively.
Except to the extent that we sell our equity securities designated as available-for-sale or our cost method equity investments, or a decrease in their fair value is deemed to be other-than-temporary, an increase or decrease in the fair value of those assets will not directly affect our earnings. However, an increase or decrease in the value of trading securities held by our broker-dealer subsidiaries, investment securities designated as trading, or investment funds will directly affect our earnings.
Credit Risk. Our broker-dealer subsidiaries clear all of their securities transactions through clearing brokers on a fully disclosed basis. Pursuant to the terms of the agreements between our broker-dealer subsidiaries and the clearing brokers, the clearing brokers have the right to charge us for losses that result from a counterparty’s failure to fulfill its contractual obligations. As the right to charge us has no maximum amount and applies to all trades executed through the clearing brokers, we believe there is no maximum amount assignable to this right. At December 31, 2015 and December 31, 2014, we have recorded no liabilities with regard to this right. During the years ended December 31, 2015 and 2014, amounts paid to the clearing brokers related to these guarantees have been immaterial. In addition, we have the right to pursue collection of performance from the counterparties who do not perform under their contractual obligations. We monitor the credit standing of the clearing broker and all
47
counterparties with which we conduct business. We attempt to limit our credit spread risk by offsetting long or short positions in various related securities.
Credit risk from our securities lending operations arises if a lender or borrower defaults on an outstanding securities loan or borrow transaction and the cash or securities we are holding is insufficient to cover the amount they owe us for that receivable. We assign credit limits and collateral posting thresholds for each counterparty and these limits and thresholds are reviewed periodically.
The securities industry is subject to numerous risks, including the risk of loss associated with the underwriting, ownership, and trading of securities, and the risk of reduced revenues in periods of reduced demand for security offerings and activity in secondary trading markets. Changing economic and market trends may negatively impact the liquidity and value of our investments and the level of security offerings underwritten by us, which may adversely affect our revenues and profitability.
Our equity and debt investments include non-investment grade securities of privately held issuers with no ready markets. The concentration and illiquidity of these investments expose us to a higher degree of risk than associated with readily marketable securities.
Interest Rate Risk. Interest rate risk represents the potential loss in value of a position or portfolio from adverse changes in market interest rates. We are exposed to interest rate risk through our trading activities in convertible and fixed income securities as well as U.S. Treasury securities, however, based on our daily monitoring of this risk, we believe we currently have limited exposure to interest rate risk in these activities.
Off-Balance Sheet Arrangements
Through indemnification provisions in agreements with clearing organizations, customer activities may expose us to off-balance sheet credit risk. Financial instruments may have to be purchased or sold at prevailing market prices in the event a customer fails to settle on a trade on its original terms or in the event cash and securities in customer margin accounts are not sufficient to fully cover customer obligations. We seek to manage the risks associated with customer activities through customer screening and selection procedures as well as through requirements on customers to maintain margin collateral in compliance with various regulations and clearing organization policies.
Critical Accounting Policies and Estimates
Our financial statements are prepared in conformity with U.S. Generally Accepted Accounting Principles (“U.S. GAAP”) and follow general practices within the industry in which we operate. The preparation of our financial statements requires us to make estimates and assumptions. These estimates and assumptions affect the reported amounts of assets and liabilities at the date of the financial statements and the reported amounts of revenues and expenses during the reporting period. Although we base our estimates and assumptions on historical experience, when available, market information, and on various other factors that we believe to be reasonable under the circumstances, management exercises significant judgment in the final determination of our estimates. Actual results may differ from these estimates.
Our significant accounting policies are presented in Note 2 to our consolidated financial statements. Our most critical policies that are both very important to the portrayal of our financial condition and results of operations and require management’s most difficult, subjective or complex judgments or estimates are discussed below.
Fair Value of Financial Instruments
The Financial Accounting Standards Board’s (“FASB”) Accounting Standards Codification (“ASC”) 820 “Fair Value Measurement” (“ASC 820”) defines fair value as the price that would be received to sell an asset or paid to transfer a liability in an orderly transaction between market participants at the measurement date, not adjusted for transaction costs. ASC 820 also establishes a fair value hierarchy that prioritizes the inputs to valuation techniques
48
used to measure fair value into three broad levels giving the highest priority to quoted prices in active markets for identical assets or liabilities (Level 1) and the lowest priority to unobservable inputs (Level 3) as described below:
|
Level 1 Inputs |
— |
Unadjusted quoted prices in active markets for identical assets or liabilities that are accessible by the Company; |
|
Level 2 Inputs |
— |
Quoted prices in markets that are not active or financial instruments for which all significant inputs are observable, either directly or indirectly; |
|
Level 3 Inputs |
— |
Unobservable inputs for the asset or liability, including significant assumptions of the Company and other market participants. |
The Company determines fair values for the following assets and liabilities:
Equity securities, listed options and warrants—The Company classifies marketable equity securities and listed options within Level 1 of the fair value hierarchy because quoted market prices from an exchange are used to value these securities. Non-public equity securities, which primarily include securities where the Company acted as a placement agent in an offering of equity securities and where the Company facilitates over-the-counter trading activity for the securities, are classified within Level 3 of the fair value hierarchy. In determining the fair value of these securities, the Company considers enterprise value and analyzes various financial, performance and market factors to estimate the value, including where applicable, over-the-counter market trading activity. Non-exchange traded warrants to purchase equity securities are classified as Level 3 as a Black-Scholes valuation model is used to value these securities.
U.S. government securities, convertible and fixed income debt instruments—The Company classifies U.S. government securities, including highly liquid U.S. Treasury securities within Level 1 as quoted prices are used to value these securities. Convertible and fixed income debt instruments are classified within Level 2 of the fair value hierarchy as they are valued using quoted market prices provided by a broker or dealer, or alternative pricing services that provide reasonable levels of price transparency. The Company primarily uses price quotes from an independent broker dealer who makes markets in or is a specialist with expertise in the valuation of these financial instruments. The Company reviews broker or pricing service quotes it receives to assess the reasonableness of the values provided; such reviews include comparison to internal pricing models and, when available, prices observed for recently executed market transactions of comparable size. Based on this assessment, at each reporting date the Company will adjust price quotes it receives if such an adjustment is determined to be appropriate.
Investment Funds—The Company invests in proprietary investment funds that are valued at net asset value (“NAV”) determined by the fund administrator. The underlying securities held by these investment companies are primarily corporate and asset-backed fixed income securities and restrictions exist on the redemption of amounts invested by the Company. As a practical expedient, the Company relies on the NAV of these investments as their fair value. The NAVs that have been provided by the fund administrators are derived from the fair values of the underlying investments as of the reporting date. As a result of our adoption of Accounting Standards Update 2015-07, “Fair Value Measurement (Topic 820): Disclosures for Investments in Certain Entities That Calculate Net Asset Value per Share (or Its Equivalent),” (“ASU 2015-07”) in 2015, these investment funds are no longer categorized within the fair value hierarchy.
As of December 31, 2015, our financial instruments, at fair value, classified as Level 1, Level 2 and Level 3 were $11.0 million, $0.8 million and $16.5 million, respectively. Additionally, as of December 31, 2015, our financial instruments presented at fair value based on NAV were $66.6 million. As of December 31, 2015, financial instruments measured and reported at fair value on a recurring basis and classified within Level 3 were 1.8% of our total assets.
Securities and Principal Investments
Trading securities and investments owned by our broker-dealer subsidiaries and financial instruments sold, not yet purchased are recorded on the trade-date and carried at fair value. Realized and unrealized gains and losses from trading desk securities are reflected in institutional brokerage revenue in the consolidated statements of operations.
49
Realized and unrealized gains and losses from investment positions are reflected in net investment income in the consolidated statements of operations.
Marketable equity and debt securities held for investment purposes at non-broker-dealer subsidiaries are recorded on the trade date and designated as either available-for-sale or trading investments pursuant to ASC 320, “Investments—Debt and Equity Securities” (“ASC 320”). These investments are carried at fair value with resulting unrealized gains and losses on available-for-sale securities reflected in accumulated other comprehensive income in the consolidated balance sheets and unrealized gains and losses on trading securities reflected in net investment income in the consolidated statements of operations. Investments in equity securities of non-public companies that are held in non-broker-dealer subsidiaries are carried at cost, unless an election is made pursuant to ASC 825, “Financial Instruments” (“ASC 825”), to account for the security at fair value. Such elections are made at the date of purchase based on the Company’s assessment of the prospective liquidity of the non-public equity security.
We evaluate available-for-sale securities and investments in securities of non-public companies carried at cost for other-than-temporary impairment at least on a quarterly basis, and more frequently when economic or market concerns warrant such evaluation. The value of our investments in securities of non-public companies and marketable equity securities designated as available-for-sale can fluctuate significantly. Such values may be based on unobservable inputs, including significant assumptions by us and consideration of the liquidity and size of our position. In evaluating these investments for other-than-temporary impairment, consideration is given to (1) the length of time and the extent to which the fair value has been lower than carrying value, (2) the severity of the decline in fair value, (3) the financial condition and near-term prospects of the issuer, and (4) our intent and ability to retain our investment in the issuer for a period of time sufficient to allow for any anticipated recovery in fair value. If it is determined that an investment impairment is other-than-temporary then the amount that the fair value is below its current basis is recorded as an impairment charge and recorded through earnings in net investment income in the consolidated statement of operations.
For unrealized losses that are determined to be temporary, we continue to evaluate these at each reporting date. If we determine at a future date that an impairment of a marketable equity security is other-than-temporary, the applicable unrealized loss will be reclassified from accumulated other comprehensive income and recognized as an other-than-temporary impairment loss at the time the determination is made.
As of December 31, 2015, we held $13.8 million of investments in marketable and non-public equity securities accounted for as trading under ASC 320 or at fair value under ASC 825, and $6.5 million of non-public equity securities held in a non-broker-dealer subsidiary that are carried at cost. As of December 31, 2015, we evaluated our investments in securities of non-public companies carried at cost for other-than-temporary impairments. Based on our evaluation of these investments, we recorded an impairment loss of $0.5 million during the year ended December 31, 2015. As of December 31, 2015, we held no marketable equity securities that were classified as available-for sale.
For restricted shares, including private company shares, these investments by their nature have limited or no price transparency. Adjustments to carrying value may be based on third-party transactions evidencing a change in value and output from the Company’s valuation models and estimates of fair value. In reaching that determination, the Company may consider factors such as, but not limited to, the financial performance of the companies relative to projections, trends within sectors, underlying business models and expected exit timing and strategy.
The Company’s investments in proprietary investment funds include non-registered investment companies. As of December 31, 2015, these investments total $66.6 million and are comprised of non-registered investment companies where the underlying fund investments consist primarily of corporate and asset-backed fixed income securities. These funds record their investments in securities at fair value and report NAV to investors representing the fair value of the underlying investments held by the funds. The funds’ determination of these fair values is a matter of judgment. The Company reflects the increase/decrease in NAV (including realized and unrealized gains and losses) in net investment income in the consolidated statements of operations. The Company’s disposition of these investment funds may be subject to contractual restrictions.
Considering the general lack of transparency necessary to conduct an independent assessment of the fair value of the securities underlying each of the NAVs provided by the fund administrators, our quarterly reporting process
50
includes a number of assessment processes to assist the Company in the evaluation of the information provided by fund managers and fund administrators. These assessment processes include, but are not limited to regular review and discussion of each fund’s performance with its manager and regular evaluation of performance against applicable benchmarks.
Goodwill and Intangible Assets
The Company’s intangible assets consist of intangible assets with finite useful lives. All of these intangible assets were recognized as a result of business combinations. Goodwill is not amortized but is tested annually for impairment (during the third quarter) or more frequently if an adverse event occurs that may indicate impairment. The values of the intangible assets with finite useful lives are amortized in proportion to their expected economic benefit over their estimated useful life or straight-line if the economic benefit cannot be reliably determined. These intangible assets are periodically tested for impairment by comparing expected future gross cash flows to the asset’s carrying amount. If the expected gross cash flows are less than the carrying amount, the asset is impaired and is written-down to its fair value. As of December 31, 2015, the carrying value of goodwill and intangible assets with finite useful lives was $3.8 million and $2.4 million, respectively. These intangible assets were recognized as a result of transactions completed by the Company in the third quarter of 2014 and the third quarter of 2015 and valuations were performed relative to these assets in 2015. As of December 31, 2015, there were no significant indicators of impairment related to these assets.
Accounting for Income Taxes
Deferred tax assets and liabilities represent the differences between the financial statement and income tax bases of assets and liabilities using enacted tax rates. The measurement of net deferred tax assets is adjusted by a valuation allowance if, based on our evaluation and our consideration of the guidance in ASC 740, it is more likely than not that they will not be realized.
The Company evaluates the need for a valuation allowance against its deferred tax assets on a quarterly basis, based on the criteria in ASC 740, by assessing the positive and negative evidence to determine if it is more likely than not that some or all of the deferred tax assets will be realized. At December 31, 2015, the Company’s net deferred tax assets totaled $37.8 million and, based on its application of the guidance in ASC 740, were offset by a valuation allowance of $0.3 million. This valuation allowance related to state capital loss carryforwards. At December 31, 2014, the Company’s net deferred tax assets totaled $32.2 million and were offset by a valuation allowance of $3.5 million. This valuation allowance related to capital loss carryforwards and was determined based on the Company’s conclusion that it was more likely than not that the benefits of these assets would not be realized in the future. The Company will continue to assess the need to maintain a valuation allowance against its net deferred tax assets at each reporting date. Realization of the Company’s deferred tax assets will be dependent on the Company’s ability to generate future taxable income.
Recently Issued Accounting Pronouncements
See Note 2 Summary of Significant Accounting Policies—Recent Accounting Pronouncements included in our financial statements attached to this Form 10-K.
See Part II, Item 7, of this Form 10-K “Management’s Discussion and Analysis of Financial Condition and Results of Operations—Quantitative and Qualitative Disclosures about Market Risk.”
The information required by Part II, Item 8, of this Form 10-K appears in a subsequent section of this report. See “Index to Audited Consolidated Financial Statements of FBR & Co.” on page F-1.
51
None.
Evaluation of Disclosure Controls and Procedures
As of the end of the period covered by this report on Form 10-K, our management carried out an evaluation, with the participation of our Chief Executive Officer, Richard J. Hendrix, and our Chief Financial Officer, Bradley J. Wright, of the effectiveness of our disclosure controls and procedures (as defined under Rule 13a-15(e) of the Exchange Act pursuant to Rule 13a-15(b) of the Exchange Act. Based upon that evaluation, our Chief Executive Officer and our Chief Financial Officer concluded that our disclosure controls and procedures, as of December 31, 2015, are effective to ensure that information required to be disclosed by us in the reports that we file or submit under the Exchange Act is recorded, processed, summarized and reported, within the time periods specified in the SEC’s rules and forms, and that such information is accumulated and communicated to our management, including our Chief Executive Officer and Chief Financial Officer, as appropriate, to allow timely decisions regarding disclosure.
Management’s Annual Report on Internal Control Over Financial Reporting
The Company’s management is responsible for establishing and maintaining adequate internal control over financial reporting (as defined in Rule 13a-15(f) of the Exchange Act). The Company’s internal control over financial reporting is designed under the supervision of the firm’s Chief Executive Officer and Chief Financial Officer to provide reasonable assurance regarding the reliability of financial reporting and the preparation of the Company’s financial statements for external purposes in accordance with generally accepted accounting principles.
The Company’s internal control over financial reporting includes policies and procedures that pertain to the maintenance of records that, in reasonable detail, accurately and fairly reflect transactions and dispositions of assets; provide reasonable assurance that transactions are recorded as necessary to permit preparation of financial statements in accordance with generally accepted accounting principles, and that receipts and expenditures are being made only in accordance with authorizations of management and the directors; and provide reasonable assurance regarding prevention or timely detection of unauthorized acquisitions, use or disposition of the Company’s assets that could have a material effect on our financial statements.
Because of its inherent limitations, internal control over financial reporting may not prevent or detect misstatements. Also, projections of any evaluation of effectiveness to future periods are subject to the risk that controls may become inadequate because of changes in conditions, or that the degree of compliance with the policies and procedures may deteriorate.
As of December 31, 2015, management conducted an assessment of the effectiveness of the Company’s internal control over financial reporting based on the framework established in Internal Control—Integrated Framework (2013) issued by the Committee of Sponsoring Organizations of the Treadway Commission (COSO). Based on this assessment, management has concluded that the Company maintained effective internal control over financial reporting as of December 31, 2015.
BDO USA, LLP, an independent registered public accounting firm, audited the effectiveness of the Company’s internal control over financial reporting as of December 31, 2015, as stated in their report which appears on F-3.
Changes in Internal Control Over Financial Reporting
There has been no change in our internal control over financial reporting during the quarter ended December 31, 2015 that has materially affected, or is reasonably likely to materially affect, our company’s internal control over financial reporting.
52
None.
PART III
The information required by Part III, Item 10, of this report on Form 10-K will be provided in our 2016 Proxy Statement and is hereby incorporated by reference.
The information required by Part III, Item 11, of this report on Form 10-K will be provided in our 2016 Proxy Statement and is hereby incorporated by reference.
|
ITEM 12. |
SECURITY OWNERSHIP OF CERTAIN BENEFICIAL OWNERS AND MANAGEMENT AND RELATED SHAREHOLDER MATTERS |
The information required by Part III, Item 12, of this report on Form 10-K will be provided in our 2016 Proxy Statement and is hereby incorporated by reference.
The information required by Part III, Item 13, of this report on Form 10-K will be provided in our 2016 Proxy Statement and is hereby incorporated by reference.
The information required by Part III, Item 14, of this report on Form 10-K will be provided in our 2016 Proxy Statement and is hereby incorporated by reference.
53
PART IV
We have filed the following documents as part of this report on Form 10-K:
1. Financial Statements. The audited consolidated financial statements of FBR & Co. required by Part II, Item 8, of this report on Form 10-K, which are listed on page F-1 of this report on Form 10-K, including the notes thereto and the reports of, the independent registered public accounting firms, BDO USA, LLP and PricewaterhouseCoopers LLP, thereon.
2. Financial Statement Schedules. We have not filed any financial statement schedules as part of this report on Form 10-K because these schedules are not required or because the information required to be included in these schedules has been included in the audited consolidated financial statements of FBR & Co. or the notes thereto.
3. Exhibits. The following exhibits have been filed as part of or incorporated by reference in this report on Form 10-K:
|
Exhibit Number |
|
Description |
|
|
|
|
|
3.1 |
|
Articles of Amendment to the Amended and Restated Articles of Incorporation of the Registrant and Amended and Restated Articles of Incorporation of the Registrant, as amended (incorporated by reference to Exhibit 3.1 to the Company’s Annual Report on Form 10-K for the fiscal year ended December 31, 2012, filed on March 15, 2013). |
|
|
|
|
|
3.2 |
|
Amended and Restated Bylaws of the Registrant (incorporated by reference to Exhibit 3.1 to the Company’s Current Report on Form 8-K, filed on February 12, 2016). |
|
|
|
|
|
4.1 |
|
Form of Certificate for Common Stock (incorporated by reference to Exhibit 4.1 to the Pre-Effective Amendment No. 2 to the Company’s Registration Statement on Form S-1/A (Registration No. 333-141987), filed on May 21, 2007). |
|
|
|
|
|
10.1 |
|
2006 Long-Term Incentive Plan (as Amended and Restated Effective October 22, 2013) (incorporated by reference to Exhibit 10.1 to the Company’s Quarterly Report on Form 10-Q for the period ended September 30, 2013, which was filed with the Commission on November 8, 2013).† |
|
|
|
|
|
10.2 |
|
Form of Incentive Stock Option Agreement (incorporated by reference to Exhibit 10.2 to the Company’s Registration Statement on Form S-1 (Registration No. 333-138824), filed on November 17, 2006).† |
|
|
|
|
|
10.3 |
|
Form of Non-Qualified Stock Option Agreement (incorporated by reference to Exhibit 10.3 to the Company’s Registration Statement on Form S-1 (Registration No. 333-138824), filed on November 17, 2006).† |
|
|
|
|
|
10.4 |
|
Form of Subscription Agreement with respect to the Registrant’s Director Stock Purchase Plan (incorporated by reference to Exhibit 10.14 to Pre-Effective Amendment No. 1 to the Company’s Registration Statement on Form S-1/A (Registration No. 333-141987), filed on May 10, 2007).† |
|
|
|
|
|
10.5 |
|
2007 Employee Stock Purchase Plan, amended as of June 1, 2011 (incorporated by reference to Appendix A to the Company’s Definitive Proxy Statement on Schedule 14A, filed on May 2, 2011).† |
|
|
|
|
|
10.6 |
|
Form of resolution of the Registrant’s Board of Directors with respect to the Registrant’s Director Stock Purchase Plan (incorporated by reference to Exhibit 10.16 to Pre-Effective Amendment No. 1 to the Company’s Registration Statement on Form S-1/A (Registration No. 333-141987), filed on May 10, 2007).† |
|
|
|
|
|
10.7 |
|
Amended and Restated Employment Agreement, dated June 16, 2015, by and between the Registrant and Richard J. Hendrix (incorporated by reference to Exhibit 10.1 to the Company’s Current Report on Form 8-K, filed on June 16, 2015).† |
54
|
Exhibit Number |
|
Description |
|
|
|
|
|
10.8 |
|
Form of Stock Option Agreement (incorporated by reference to Exhibit 10.3 to the Company’s Current Report on Form 8-K, filed on August 21, 2008).† |
|
|
|
|
|
10.9 |
|
Form of Restrictive Covenant Agreement (incorporated by reference to Exhibit 10.4 to the Company’s Current Report on Form 8-K, filed on August 21, 2008).† |
|
|
|
|
|
10.10 |
|
Form of LTIP RSU Award Agreement (incorporated by reference to Exhibit 10.1 to the Company’s Current Report on Form 8-K, filed on February 16, 2010).† |
|
|
|
|
|
10.11 |
|
RSU Award Agreement, dated February 9, 2010, between the Registrant and Richard J. Hendrix (incorporated by reference to Exhibit 10.2 to the Company’s Current Report on Form 8-K, filed on February 16, 2010).† |
|
|
|
|
|
10.12 |
|
Stock Option Agreement, dated February 9, 2010, between the Registrant and Richard J. Hendrix (incorporated by reference to Exhibit 10.3 to the Company’s Current Report on Form 8-K, filed on February 16, 2010).† |
|
|
|
|
|
10.13 |
|
FBR & Co. 2016 Retention and Incentive Plan (“2016 RI Plan”) (Effective February 10, 2016) (incorporated by reference to Exhibit 10.1 to the Company’s Current Report on Form 8-K, filed on February 12, 2016).† |
|
|
|
|
|
10.14 |
|
Form of Retention and Incentive Plan Award Letter under the 2016 RI Plan (incorporated by reference to Exhibit 10.2 to the Company’s Current Report on Form 8-K, filed on February 12, 2016). † |
|
|
|
|
|
10.15 |
|
Form of RSU Award Letter under the 2016 RI Plan (incorporated by reference to Exhibit 10.3 to the Company’s Current Report on Form 8-K, filed on February 12, 2016). † |
|
|
|
|
|
10.16 |
|
2013 Performance Share Unit Program (Effective March 11, 2013) (incorporated by reference to Exhibit 10.1 to the Company’s Current Report on Form 8-K, filed on March 15, 2013).† |
|
|
|
|
|
10.17 |
|
Form of 2013 Performance Share Unit Award Letter (incorporated by reference to Exhibit 10.2 to the Company’s Current Report on Form 8-K, filed on March 15, 2013). † |
|
|
|
|
|
10.18 |
|
Form of 2013 Performance Share Unit Award Letter to Richard J. Hendrix (incorporated by reference to Exhibit 10.3 to the Company’s Current Report on Form 8-K, filed on March 15, 2013).† |
|
|
|
|
|
10.19 |
|
Form of 2014 Performance Share Unit Award Letter (incorporated by reference to Exhibit 10.2 to the Company’s Current Report on Form 8-K, filed on February 7, 2014).† |
|
|
|
|
|
10.20 |
|
Form of 2014 Performance Share Unit Award Letter to Richard J. Hendrix (incorporated by reference to Exhibit 10.1 to the Company’s Current Report on Form 8-K, filed on February 7, 2014).† |
|
|
|
|
|
10.21 |
|
Form of 2015 Performance Share Unit Award Letter (incorporated by reference to Exhibit 10.2 to the Company’s Current Report on Form 8-K, filed on February 12, 2015).† |
|
|
|
|
|
10.22 |
|
Form of 2015 Performance Share Unit Award Letter to Richard J. Hendrix (incorporated by reference to Exhibit 10.1 to the Company’s Current Report on Form 8-K, filed on February 12, 2015).† |
|
|
|
|
|
10.23 |
|
Deed of Lease, dated November 15, 2013 between FBR Capital Markets & Co., a Delaware corporation and 1300 N. 17th Street, L.P., a Delaware limited partnership (incorporated by reference to Exhibit 10.1 to the Company’s Current Report on Form 8-K, filed on November 20, 2013). |
|
|
|
|
|
10.24 |
|
Guaranty of Lease, dated November 15, 2013 between FBR & Co, a Virginia corporation and 1300 N. 17th Street, L.P., a Delaware limited partnership (incorporated by reference to Exhibit 10.2 to the Company’s Current Report on Form 8-K, filed on November 20, 2013). |
|
|
|
|
|
12.1 |
|
Computation of Ratio of Earnings to Fixed Charges.* |
|
|
|
|
|
21.1 |
|
Subsidiaries of the Registrant.* |
|
|
|
|
|
23.1 |
|
Consent of BDO USA, LLP.* |
|
|
|
|
55
|
Exhibit Number |
|
Description |
|
|
|
|
|
23.2 |
|
Consent of PricewaterhouseCoopers LLP.* |
|
|
|
|
|
31.1 |
|
Certification of Chief Executive Officer pursuant to Rule 13a-14(a)/15d-14(a), as adopted pursuant to Section 302 of the Sarbanes-Oxley Act of 2002.* |
|
|
|
|
|
31.2 |
|
Certification of Chief Financial Officer pursuant to Rule 13a-14(a)/15d-14(a), as adopted pursuant to Section 302 of the Sarbanes-Oxley Act of 2002.* |
|
|
|
|
|
32.1 |
|
Certification of Chief Executive Officer pursuant to 18 U.S.C. Section 1350, as adopted pursuant to Section 906 of the Sarbanes-Oxley Act of 2002.** |
|
|
|
|
|
32.2 |
|
Certification of Chief Financial Officer pursuant to 18 U.S.C. Section 1350, as adopted pursuant to Section 906 of the Sarbanes-Oxley Act of 2002.** |
|
|
|
|
|
101 |
|
The following financial information from the Annual Report on Form 10-K for the year ended December 31, 2015, formatted in XBRL (Extensible Business Reporting Language): (i) the Consolidated Balance Sheets, (ii) the Consolidated Statements of Operations, (iii) the Consolidated Statements of Comprehensive Income (iv) the Consolidated Statements of Changes in Shareholders’ Equity, (v) the Consolidated Statements of Cash Flows, and (vi) the Notes to the Consolidated Financial Statements. |
|
|
|
* |
Filed herewith. |
|
** |
This information is furnished and not filed for purposes of Section 11 and 12 of the Securities Act of 1933 and Section 18 of the Securities Exchange Act of 1934. |
|
† |
Management contract or compensatory plan or arrangement. |
56
Pursuant to the requirements of Section 13 or 15(d) of the Securities Exchange Act of 1934, the Registrant has duly caused this report to be signed on its behalf by the undersigned, thereunto duly authorized.
|
|
|
|
FBR & CO. |
|
|
|
|
|
|
Date: March 15, 2016 |
|
By: |
/S/ RICHARD J. HENDRIX |
|
|
|
|
Richard J. Hendrix |
|
|
|
|
Chief Executive Officer |
Pursuant to the requirements of the Securities Exchange Act of 1934, this report has been signed below by the following persons on behalf of the Registrant and in the capacities and on the dates indicated.
|
SIGNATURE |
|
TITLE |
|
DATE |
|
|
|
|
|
|
|
/S/ Richard J. HENDRIX |
|
Chief Executive Officer and Director (principal executive officer) |
|
March 15, 2016 |
|
RICHARD J. HENDRIX |
|
|||
|
|
|
|
|
|
|
/s/ Bradley J. Wright |
|
Executive Vice President, Chief Financial Officer and Chief Administrative Officer (principal financial officer) |
|
March 15, 2016 |
|
BRADLEY J. WRIGHT |
|
|||
|
|
|
|
|
|
|
/s/ Robert J. Kiernan |
|
Senior Vice President, Controller and Chief Accounting Officer (principal accounting officer) |
|
March 15, 2016 |
|
ROBERT J. KIERNAN |
|
|||
|
|
|
|
|
|
|
/s/ Dr. Reena Aggarwal |
|
Director |
|
March 15, 2016 |
|
REENA AGGARWAL |
|
|||
|
|
|
|
|
|
|
/s/ Thomas J. Hynes, Jr. |
|
Director |
|
March 15, 2016 |
|
THOMAS J. HYNES, JR. |
|
|||
|
|
|
|
|
|
|
/s/ Richard A. Kraemer |
|
Director |
|
March 15, 2016 |
|
RICHARD A. KRAEMER |
|
|||
|
|
|
|
|
|
|
/s/ Allison M. Leopold Tilley |
|
Director |
|
March 15, 2016 |
|
ALLISON M. LEOPOLD TILLEY |
|
|
||
|
|
|
|
|
|
|
/s/ Mark R. Patterson |
|
Director |
|
March 15, 2016 |
|
MARK R. PATTERSON |
|
|
||
|
|
|
|
|
|
|
/s/ Arthur J. Reimers |
|
Director |
|
March 15, 2016 |
|
ARTHUR J. REIMERS |
|
|||
|
|
|
|
|
|
|
/s/ William F. Strome |
|
Director |
|
March 15, 2016 |
|
WILLIAM F. STROME |
|
|
||
|
|
|
|
|
|
57
FBR & Co.
INDEX TO AUDITED CONSOLIDATED FINANCIAL STATEMENTS
F-1
Report of Independent Registered Public Accounting Firm
Board of Directors and Shareholders
FBR & Co.
Arlington, Virginia
We have audited the accompanying consolidated balance sheets of FBR & Co. as of December 31, 2015 and 2014 and the related consolidated statements of operations, comprehensive income, changes in shareholders’ equity, and cash flows for the years ended December 31, 2015 and 2014. These financial statements are the responsibility of the Company’s management. Our responsibility is to express an opinion on these financial statements based on our audits.
We conducted our audits in accordance with the standards of the Public Company Accounting Oversight Board (United States). Those standards require that we plan and perform the audit to obtain reasonable assurance about whether the financial statements are free of material misstatement. An audit also includes examining, on a test basis, evidence supporting the amounts and disclosures in the financial statements, assessing the accounting principles used and significant estimates made by management, as well as evaluating the overall presentation of the financial statements. We believe that our audits provide a reasonable basis for our opinion.
In our opinion, the consolidated financial statements referred to above present fairly, in all material respects, the financial position of FBR & Co. at December 31, 2015 and 2014, and the results of its operations and its cash flows for the years ended December 31, 2015 and 2014, in conformity with accounting principles generally accepted in the United States of America.
We also have audited, in accordance with the standards of the Public Company Accounting Oversight Board (United States), FBR & Co.'s internal control over financial reporting as of December 31, 2015, based on criteria established Internal Control – Integrated Framework (2013) issued by the Committee of Sponsoring Organizations of the Treadway Commission (COSO) and our report dated March 15, 2016 expressed an unqualified opinion thereon.
/S/ BDO USA, LLP
McLean, Virginia
March 15, 2016
F-2
Report of Independent Registered Public Accounting Firm
Board of Directors and Shareholders
FBR & Co.
Arlington, Virginia
We have audited FBR & Co.’s internal control over financial reporting as of December 31, 2015, based on criteria established in Internal Control – Integrated Framework (2013) issued by the Committee of Sponsoring Organizations of the Treadway Commission (the COSO criteria). FBR & Co.’s management is responsible for maintaining effective internal control over financial reporting and for its assessment of the effectiveness of internal control over financial reporting, included in the accompanying “Item 9A, Management’s Annual Report on Internal Control Over Financial Reporting”. Our responsibility is to express an opinion on the Company’s internal control over financial reporting based on our audit.
We conducted our audit in accordance with the standards of the Public Company Accounting Oversight Board (United States). Those standards require that we plan and perform the audit to obtain reasonable assurance about whether effective internal control over financial reporting was maintained in all material respects. Our audit included obtaining an understanding of internal control over financial reporting, assessing the risk that a material weakness exists, and testing and evaluating the design and operating effectiveness of internal control based on the assessed risk. Our audit also included performing such other procedures as we considered necessary in the circumstances. We believe that our audit provides a reasonable basis for our opinion.
A company’s internal control over financial reporting is a process designed to provide reasonable assurance regarding the reliability of financial reporting and the preparation of financial statements for external purposes in accordance with generally accepted accounting principles. A company’s internal control over financial reporting includes those policies and procedures that (1) pertain to the maintenance of records that, in reasonable detail, accurately and fairly reflect the transactions and dispositions of the assets of the company; (2) provide reasonable assurance that transactions are recorded as necessary to permit preparation of financial statements in accordance with generally accepted accounting principles, and that receipts and expenditures of the company are being made only in accordance with authorizations of management and directors of the company; and (3) provide reasonable assurance regarding prevention or timely detection of unauthorized acquisition, use, or disposition of the company’s assets that could have a material effect on the financial statements.
Because of its inherent limitations, internal control over financial reporting may not prevent or detect misstatements. Also, projections of any evaluation of effectiveness to future periods are subject to the risk that controls may become inadequate because of changes in conditions, or that the degree of compliance with the policies or procedures may deteriorate.
In our opinion, FBR & Co. maintained, in all material respects, effective internal control over financial reporting as of December 31, 2015, based on the COSO criteria.
We also have audited, in accordance with the standards of the Public Company Accounting Oversight Board (United States), the consolidated balance sheets of FBR & Co. as of December 31, 2015 and 2014, and the related consolidated statements of operations, comprehensive income, changes in shareholders’ equity, and cash flows for the years ended December 31, 2015 and 2014 and our report dated March 15, 2016 expressed an unqualified opinion thereon.
/S/ BDO USA, LLP
McLean, Virginia
March 15, 2016
F-3
Report of Independent Registered Public Accounting Firm
To the Board of Directors and Shareholders of FBR & Co.:
In our opinion, the consolidated statements of operations, comprehensive income, changes in shareholders’ equity, and cash flows for the year ended December 31, 2013 present fairly, in all material respects, the results of operations and cash flows of FBR & Co. and its subsidiaries for the year ended December 31, 2013, in conformity with accounting principles generally accepted in the United States of America. These financial statements are the responsibility of the Company's management. Our responsibility is to express an opinion on these financial statements based on our audit. We conducted our audit of these statements in accordance with the standards of the Public Company Accounting Oversight Board (United States). Those standards require that we plan and perform the audit to obtain reasonable assurance about whether the financial statements are free of material misstatement. An audit includes examining, on a test basis, evidence supporting the amounts and disclosures in the financial statements, assessing the accounting principles used and significant estimates made by management, and evaluating the overall financial statement presentation. We believe that our audit provides a reasonable basis for our opinion.
/s/ PricewaterhouseCoopers LLP
McLean, VA
March 14, 2014
F-4
FBR & Co.
(Dollars in thousands, except per share data)
|
|
|
December 31, |
|
|||||
|
|
|
2015 |
|
|
2014 |
|
||
|
Assets |
|
|
|
|
|
|
|
|
|
Cash and cash equivalents |
|
$ |
70,067 |
|
|
$ |
108,962 |
|
|
Receivables: |
|
|
|
|
|
|
|
|
|
Securities borrowed |
|
|
685,037 |
|
|
|
594,674 |
|
|
Due from brokers, dealers and clearing organizations |
|
|
5,513 |
|
|
|
94,489 |
|
|
Customers |
|
|
1,429 |
|
|
|
3,349 |
|
|
Other |
|
|
5,895 |
|
|
|
5,227 |
|
|
Financial instruments owned, at fair value |
|
|
94,923 |
|
|
|
166,047 |
|
|
Other investments, at cost |
|
|
6,539 |
|
|
|
7,000 |
|
|
Goodwill and intangible assets |
|
|
6,273 |
|
|
|
4,921 |
|
|
Furniture, equipment, software, and leasehold improvements, net of accumulated depreciation and amortization |
|
|
15,071 |
|
|
|
15,388 |
|
|
Deferred tax assets, net of valuation allowance |
|
|
37,497 |
|
|
|
28,648 |
|
|
Prepaid expenses and other assets |
|
|
5,172 |
|
|
|
6,392 |
|
|
Total assets |
|
$ |
933,416 |
|
|
$ |
1,035,097 |
|
|
|
|
|
|
|
|
|
|
|
|
Liabilities and Shareholders’ Equity |
|
|
|
|
|
|
|
|
|
Liabilities |
|
|
|
|
|
|
|
|
|
Securities loaned |
|
$ |
687,443 |
|
|
$ |
595,717 |
|
|
Financial instruments sold, not yet purchased, at fair value |
|
|
1,934 |
|
|
|
121,310 |
|
|
Accrued compensation and benefits |
|
|
13,325 |
|
|
|
34,571 |
|
|
Accounts payable, accrued expenses and other liabilities |
|
|
19,947 |
|
|
|
23,093 |
|
|
Total liabilities |
|
|
722,649 |
|
|
|
774,691 |
|
|
|
|
|
|
|
|
|
|
|
|
Commitments and Contingencies (Note 10) |
|
|
|
|
|
|
|
|
|
Shareholders’ equity |
|
|
|
|
|
|
|
|
|
Preferred Stock, $0.001 par value 100,000,000 authorized, none issued and outstanding |
|
|
— |
|
|
|
— |
|
|
Common stock, $0.001 par value, 75,000,000 shares authorized, 6,795,342 and 8,388,697 shares issued and outstanding, respectively |
|
|
7 |
|
|
|
8 |
|
|
Additional paid-in capital |
|
|
259,011 |
|
|
|
302,720 |
|
|
Restricted stock units |
|
|
35,929 |
|
|
|
34,353 |
|
|
Accumulated other comprehensive income, net of taxes |
|
|
— |
|
|
|
44 |
|
|
Accumulated deficit |
|
|
(84,180 |
) |
|
|
(76,719 |
) |
|
Total shareholders’ equity |
|
|
210,767 |
|
|
|
260,406 |
|
|
Total liabilities and shareholders’ equity |
|
$ |
933,416 |
|
|
$ |
1,035,097 |
|
The accompanying notes are an integral part of these consolidated financial statements.
F-5
FBR & Co.
Consolidated Statements of Operations
(Dollars in thousands except per share amounts)
|
|
|
Year Ended December 31, |
|
|||||||||
|
|
|
2015 |
|
|
2014 |
|
|
2013 |
|
|||
|
Revenues: |
|
|
|
|
|
|
|
|
|
|
|
|
|
Investment banking: |
|
|
|
|
|
|
|
|
|
|
|
|
|
Capital raising |
|
$ |
61,508 |
|
|
$ |
103,902 |
|
|
$ |
186,516 |
|
|
Advisory |
|
|
9,583 |
|
|
|
11,353 |
|
|
|
9,697 |
|
|
Institutional brokerage |
|
|
45,442 |
|
|
|
56,182 |
|
|
|
53,738 |
|
|
Net investment income |
|
|
5,433 |
|
|
|
17,774 |
|
|
|
6,920 |
|
|
Interest |
|
|
31,774 |
|
|
|
13,067 |
|
|
|
1,790 |
|
|
Dividends and other |
|
|
1,692 |
|
|
|
1,030 |
|
|
|
1,160 |
|
|
Total revenues |
|
|
155,432 |
|
|
|
203,308 |
|
|
|
259,821 |
|
|
Interest expense |
|
|
35,037 |
|
|
|
21,183 |
|
|
|
— |
|
|
Revenues, net of interest expense |
|
|
120,395 |
|
|
|
182,125 |
|
|
|
259,821 |
|
|
|
|
|
|
|
|
|
|
|
|
|
|
|
|
Non-interest expenses: |
|
|
|
|
|
|
|
|
|
|
|
|
|
Compensation and benefits |
|
|
77,463 |
|
|
|
103,811 |
|
|
|
144,720 |
|
|
Professional services |
|
|
13,287 |
|
|
|
13,259 |
|
|
|
12,326 |
|
|
Occupancy and equipment |
|
|
12,680 |
|
|
|
13,480 |
|
|
|
12,271 |
|
|
Communications |
|
|
10,865 |
|
|
|
11,514 |
|
|
|
11,101 |
|
|
Business development |
|
|
9,819 |
|
|
|
11,689 |
|
|
|
9,602 |
|
|
Clearing and brokerage fees |
|
|
5,328 |
|
|
|
4,757 |
|
|
|
4,922 |
|
|
Other operating expenses |
|
|
6,711 |
|
|
|
6,255 |
|
|
|
7,609 |
|
|
Total non-interest expenses |
|
|
136,153 |
|
|
|
164,765 |
|
|
|
202,551 |
|
|
(Loss) income from continuing operations before income taxes |
|
|
(15,758 |
) |
|
|
17,360 |
|
|
|
57,270 |
|
|
Income tax (benefit) expense |
|
|
(8,297 |
) |
|
|
341 |
|
|
|
(27,483 |
) |
|
(Loss) income from continuing operations, net of taxes |
|
|
(7,461 |
) |
|
|
17,019 |
|
|
|
84,753 |
|
|
Income from discontinued operations, net of taxes |
|
|
— |
|
|
|
— |
|
|
|
8,159 |
|
|
Net (loss) income |
|
$ |
(7,461 |
) |
|
$ |
17,019 |
|
|
$ |
92,912 |
|
|
|
|
|
|
|
|
|
|
|
|
|
|
|
|
Basic (loss) income per share: |
|
|
|
|
|
|
|
|
|
|
|
|
|
(Loss) income from continuing operations, net of taxes |
|
$ |
(0.92 |
) |
|
$ |
1.66 |
|
|
$ |
7.09 |
|
|
(Loss) income from discontinued operations, net of taxes |
|
|
— |
|
|
|
— |
|
|
|
0.68 |
|
|
Basic (loss) income per share |
|
$ |
(0.92 |
) |
|
$ |
1.66 |
|
|
$ |
7.77 |
|
|
|
|
|
|
|
|
|
|
|
|
|
|
|
|
Diluted (loss) income per share: |
|
|
|
|
|
|
|
|
|
|
|
|
|
(Loss) income from continuing operations, net of taxes |
|
$ |
(0.92 |
) |
|
$ |
1.48 |
|
|
$ |
6.54 |
|
|
(Loss) income from discontinued operations, net of taxes |
|
|
— |
|
|
|
— |
|
|
|
0.63 |
|
|
Diluted (loss) income per share |
|
$ |
(0.92 |
) |
|
$ |
1.48 |
|
|
$ |
7.17 |
|
|
Basic weighted average shares outstanding (in thousands) |
|
|
8,069 |
|
|
|
10,283 |
|
|
|
11,963 |
|
|
Diluted weighted average shares outstanding (in thousands) |
|
|
8,069 |
|
|
|
11,465 |
|
|
|
12,960 |
|
|
Cash dividends declared per common share |
|
$ |
0.40 |
|
|
$ |
— |
|
|
$ |
— |
|
The accompanying notes are an integral part of these consolidated financial statements.
F-6
FBR & CO.
Consolidated Statements of Comprehensive Income
(Dollars in thousands)
|
|
|
Year Ended December 31, |
|
|||||||||
|
|
|
2015 |
|
|
2014 |
|
|
2013 |
|
|||
|
Net (loss) income |
|
$ |
(7,461 |
) |
|
$ |
17,019 |
|
|
$ |
92,912 |
|
|
Other comprehensive income, net of tax: |
|
|
|
|
|
|
|
|
|
|
|
|
|
Change in unrealized gain (loss) on available-for-sale investment securities, net of taxes of $28, $7, and $22, respectively |
|
|
(44 |
) |
|
|
10 |
|
|
|
1,128 |
|
|
Comprehensive (loss) income |
|
$ |
(7,505 |
) |
|
$ |
17,029 |
|
|
$ |
94,040 |
|
The accompanying notes are an integral part of these consolidated financial statements.
F-7
FBR & Co.
Consolidated Statements of Changes in Shareholders’ Equity
(Dollars and shares in thousands)
|
|
|
Common Stock Shares |
|
|
Common Stock Amount |
|
|
Additional Paid-in Capital |
|
|
Employee Stock Loan Receivable |
|
|
Restricted Stock Units |
|
|
Accumulated Other Comprehensive Income (Loss) |
|
|
Accumulated Deficit |
|
|
Total |
|
||||||||
|
Balances at December 31, 2012 |
|
|
12,224 |
|
|
$ |
12 |
|
|
$ |
402,668 |
|
|
$ |
(307 |
) |
|
$ |
25,235 |
|
|
$ |
(1,094 |
) |
|
$ |
(186,650 |
) |
|
$ |
239,864 |
|
|
Net income |
|
|
— |
|
|
|
— |
|
|
|
— |
|
|
|
— |
|
|
|
— |
|
|
|
— |
|
|
|
92,912 |
|
|
|
92,912 |
|
|
Issuance of common stock, net of forfeitures |
|
|
957 |
|
|
|
1 |
|
|
|
18,697 |
|
|
|
307 |
|
|
|
(13,688 |
) |
|
|
— |
|
|
|
— |
|
|
|
5,317 |
|
|
Repurchase of common stock |
|
|
(2,378 |
) |
|
|
(2 |
) |
|
|
(55,539 |
) |
|
|
— |
|
|
|
— |
|
|
|
— |
|
|
|
— |
|
|
|
(55,541 |
) |
|
Repurchase of common stock for employee tax withholding |
|
|
(258 |
) |
|
|
— |
|
|
|
(3,817 |
) |
|
|
— |
|
|
|
— |
|
|
|
— |
|
|
|
— |
|
|
|
(3,817 |
) |
|
Stock compensation expense for options granted to purchase common stock |
|
|
— |
|
|
|
— |
|
|
|
974 |
|
|
|
— |
|
|
|
— |
|
|
|
— |
|
|
|
— |
|
|
|
974 |
|
|
Issuance of restricted stock units |
|
|
— |
|
|
|
— |
|
|
|
— |
|
|
|
— |
|
|
|
9,940 |
|
|
|
— |
|
|
|
— |
|
|
|
9,940 |
|
|
Change in unrealized (loss) on available-for-sale investment securities, net of taxes |
|
|
— |
|
|
|
— |
|
|
|
— |
|
|
|
— |
|
|
|
— |
|
|
|
1,128 |
|
|
|
— |
|
|
|
1,128 |
|
|
Balances at December 31, 2013 |
|
|
10,545 |
|
|
$ |
11 |
|
|
$ |
362,983 |
|
|
$ |
— |
|
|
$ |
21,487 |
|
|
$ |
34 |
|
|
$ |
(93,738 |
) |
|
$ |
290,777 |
|
|
Net income |
|
|
— |
|
|
|
— |
|
|
|
— |
|
|
|
— |
|
|
|
— |
|
|
|
— |
|
|
|
17,019 |
|
|
|
17,019 |
|
|
Issuance of common stock, net of forfeitures |
|
|
295 |
|
|
|
— |
|
|
|
5,447 |
|
|
|
— |
|
|
|
(3,100 |
) |
|
|
— |
|
|
|
— |
|
|
|
2,347 |
|
|
Repurchase of common stock |
|
|
(2,380 |
) |
|
|
(3 |
) |
|
|
(64,091 |
) |
|
|
— |
|
|
|
— |
|
|
|
— |
|
|
|
— |
|
|
|
(64,094 |
) |
|
Repurchase of common stock for employee tax withholding |
|
|
(71 |
) |
|
|
— |
|
|
|
(1,823 |
) |
|
|
— |
|
|
|
— |
|
|
|
— |
|
|
|
— |
|
|
|
(1,823 |
) |
|
Stock compensation expense for options granted to purchase common stock |
|
|
— |
|
|
|
— |
|
|
|
204 |
|
|
|
— |
|
|
|
— |
|
|
|
— |
|
|
|
— |
|
|
|
204 |
|
|
Issuance of restricted stock units |
|
|
— |
|
|
|
— |
|
|
|
— |
|
|
|
— |
|
|
|
15,966 |
|
|
|
— |
|
|
|
— |
|
|
|
15,966 |
|
|
Change in unrealized gain on available-for-sale investment securities, net of taxes |
|
|
— |
|
|
|
— |
|
|
|
— |
|
|
|
— |
|
|
|
— |
|
|
|
10 |
|
|
|
— |
|
|
|
10 |
|
|
Balances at December 31, 2014 |
|
|
8,389 |
|
|
$ |
8 |
|
|
$ |
302,720 |
|
|
$ |
— |
|
|
$ |
34,353 |
|
|
$ |
44 |
|
|
$ |
(76,719 |
) |
|
$ |
260,406 |
|
|
Net loss |
|
|
— |
|
|
|
— |
|
|
|
— |
|
|
|
— |
|
|
|
— |
|
|
|
— |
|
|
|
(7,461 |
) |
|
|
(7,461 |
) |
|
Common stock dividends |
|
|
— |
|
|
|
— |
|
|
|
(3,710 |
) |
|
|
— |
|
|
|
— |
|
|
|
— |
|
|
|
— |
|
|
|
(3,710 |
) |
|
Issuance of common stock, net of forfeitures |
|
|
494 |
|
|
|
1 |
|
|
|
8,147 |
|
|
|
— |
|
|
|
(5,680 |
) |
|
|
— |
|
|
|
— |
|
|
|
2,468 |
|
|
Repurchase of common stock |
|
|
(1,950 |
) |
|
|
(2 |
) |
|
|
(45,217 |
) |
|
|
— |
|
|
|
— |
|
|
|
— |
|
|
|
— |
|
|
|
(45,219 |
) |
|
Repurchase of common stock for employee tax withholding |
|
|
(138 |
) |
|
|
— |
|
|
|
(3,113 |
) |
|
|
— |
|
|
|
— |
|
|
|
— |
|
|
|
— |
|
|
|
(3,113 |
) |
|
Stock compensation expense for options granted to purchase common stock |
|
|
— |
|
|
|
— |
|
|
|
184 |
|
|
|
— |
|
|
|
— |
|
|
|
— |
|
|
|
— |
|
|
|
184 |
|
|
Issuance of restricted stock units |
|
|
— |
|
|
|
— |
|
|
|
— |
|
|
|
— |
|
|
|
7,256 |
|
|
|
— |
|
|
|
— |
|
|
|
7,256 |
|
|
Change in unrealized gain on available-for-sale investment securities, net of taxes |
|
|
— |
|
|
|
— |
|
|
|
— |
|
|
|
— |
|
|
|
— |
|
|
|
(44 |
) |
|
|
— |
|
|
|
(44 |
) |
|
Balances at December 31, 2015 |
|
|
6,795 |
|
|
$ |
7 |
|
|
$ |
259,011 |
|
|
$ |
— |
|
|
$ |
35,929 |
|
|
$ |
— |
|
|
$ |
(84,180 |
) |
|
$ |
210,767 |
|
The accompanying notes are an integral part of these consolidated financial statements.
F-8
FBR & Co.
Consolidated Statements of Cash Flows
(Dollars in thousands)
|
|
|
Year Ended December 31, |
|
|||||||||
|
|
|
2015 |
|
|
2014 |
|
|
2013 |
|
|||
|
Cash flows from operating activities |
|
|
|
|
|
|
|
|
|
|
|
|
|
Net (loss) income |
|
$ |
(7,461 |
) |
|
$ |
17,019 |
|
|
$ |
92,912 |
|
|
Adjustments to reconcile net (loss) income to net cash (used in) provided by operating activities: |
|
|
|
|
|
|
|
|
|
|
|
|
|
Depreciation and amortization |
|
|
3,312 |
|
|
|
1,990 |
|
|
|
1,290 |
|
|
Deferred income taxes |
|
|
(8,820 |
) |
|
|
2,239 |
|
|
|
(30,915 |
) |
|
Net investment income from investments |
|
|
(5,433 |
) |
|
|
(17,774 |
) |
|
|
(6,920 |
) |
|
Gain on the sale of assets |
|
|
— |
|
|
|
— |
|
|
|
(8,944 |
) |
|
Stock compensation |
|
|
7,192 |
|
|
|
9,397 |
|
|
|
8,457 |
|
|
Other |
|
|
46 |
|
|
|
192 |
|
|
|
166 |
|
|
Changes in operating assets: |
|
|
|
|
|
|
|
|
|
|
|
|
|
Receivables: |
|
|
|
|
|
|
|
|
|
|
|
|
|
Securities borrowed |
|
|
(90,363 |
) |
|
|
(594,674 |
) |
|
|
— |
|
|
Brokers, dealers and clearing organizations |
|
|
6,940 |
|
|
|
(5,405 |
) |
|
|
(279 |
) |
|
Customers |
|
|
2,209 |
|
|
|
780 |
|
|
|
(2,003 |
) |
|
Affiliates |
|
|
(3,341 |
) |
|
|
(4,022 |
) |
|
|
(71 |
) |
|
Interest, dividends and other |
|
|
2,810 |
|
|
|
(468 |
) |
|
|
681 |
|
|
Trading securities |
|
|
43,662 |
|
|
|
499 |
|
|
|
16,029 |
|
|
Prepaid expenses and other assets |
|
|
1,505 |
|
|
|
(483 |
) |
|
|
979 |
|
|
Changes in operating liabilities: |
|
|
|
|
|
|
|
|
|
|
|
|
|
Securities loaned |
|
|
91,726 |
|
|
|
595,717 |
|
|
|
— |
|
|
Trading account financial instruments sold, not yet purchased |
|
|
(38,452 |
) |
|
|
(2,863 |
) |
|
|
(14,688 |
) |
|
Accounts payable, accrued expenses and other liabilities |
|
|
(4,008 |
) |
|
|
4,235 |
|
|
|
(3,979 |
) |
|
Accrued compensation and benefits |
|
|
(21,141 |
) |
|
|
(16,614 |
) |
|
|
41,519 |
|
|
Brokers, dealers and clearing organizations |
|
|
— |
|
|
|
(8,702 |
) |
|
|
5,003 |
|
|
Net cash (used in) provided by operating activities |
|
|
(19,617 |
) |
|
|
(18,937 |
) |
|
|
99,237 |
|
|
Cash flows from investing activities |
|
|
|
|
|
|
|
|
|
|
|
|
|
Purchases of investment securities and other investments |
|
|
(17,563 |
) |
|
|
(74,382 |
) |
|
|
(68,864 |
) |
|
Proceeds from sales of and distributions from investments |
|
|
40,950 |
|
|
|
60,681 |
|
|
|
38,190 |
|
|
Settlement of financial instruments sold, not yet purchased |
|
|
(288,860 |
) |
|
|
(208,848 |
) |
|
|
— |
|
|
Financial instruments sold, not yet purchased |
|
|
217,940 |
|
|
|
301,230 |
|
|
|
— |
|
|
Due from brokers, dealers and clearing organizations |
|
|
84,134 |
|
|
|
(84,134 |
) |
|
|
— |
|
|
Proceeds from sale of assets |
|
|
— |
|
|
|
— |
|
|
|
19,294 |
|
|
Purchase of broker-dealer, net of cash acquired |
|
|
(2,275 |
) |
|
|
— |
|
|
|
— |
|
|
Purchase of securities lending business |
|
|
(2,166 |
) |
|
|
(1,000 |
) |
|
|
— |
|
|
Purchases of furniture, equipment, software, and leasehold improvements |
|
|
(2,261 |
) |
|
|
(9,509 |
) |
|
|
(882 |
) |
|
Net cash provided by (used in) investing activities |
|
|
29,899 |
|
|
|
(15,962 |
) |
|
|
(12,262 |
) |
|
Cash flows from financing activities |
|
|
|
|
|
|
|
|
|
|
|
|
|
Repurchases of common stock |
|
|
(48,332 |
) |
|
|
(65,917 |
) |
|
|
(59,358 |
) |
|
Proceeds from sales of common stock and repayments of employee stock purchase plan |
|
|
2,089 |
|
|
|
1,805 |
|
|
|
5,431 |
|
|
Dividends paid |
|
|
(2,934 |
) |
|
|
— |
|
|
|
— |
|
|
Net cash used in financing activities |
|
|
(49,177 |
) |
|
|
(64,112 |
) |
|
|
(53,927 |
) |
|
Cash and cash equivalents |
|
|
|
|
|
|
|
|
|
|
|
|
|
Net (decrease) increase in cash and cash equivalents |
|
|
(38,895 |
) |
|
|
(99,011 |
) |
|
|
33,048 |
|
|
Cash and cash equivalents, beginning of period |
|
|
108,962 |
|
|
|
207,973 |
|
|
|
174,925 |
|
|
Cash and cash equivalents, end of period |
|
$ |
70,067 |
|
|
$ |
108,962 |
|
|
$ |
207,973 |
|
|
Supplemental cash flows disclosures |
|
|
|
|
|
|
|
|
|
|
|
|
|
Income tax payments |
|
$ |
19 |
|
|
$ |
3,339 |
|
|
$ |
3,372 |
|
|
Interest payments |
|
$ |
35,745 |
|
|
$ |
21,775 |
|
|
$ |
— |
|
|
Non-cash investing and financing activities |
|
|
|
|
|
|
|
|
|
|
|
|
|
Leasehold improvement incentives |
|
$ |
68 |
|
|
$ |
4,434 |
|
|
$ |
— |
|
|
Acquisition of securities lending business - contingent consideration |
|
$ |
(637 |
) |
|
$ |
4,070 |
|
|
$ |
— |
|
|
Dividends payable |
|
$ |
776 |
|
|
$ |
— |
|
|
$ |
— |
|
The accompanying notes are an integral part of these consolidated financial statements.
F-9
FBR & Co.
Notes to Consolidated Financial Statements
(Dollars in thousands, except per share amounts)
Note 1. Organization and Nature of Operations:
Organization
FBR & Co., (the “Company”), a Virginia corporation, is a holding company of which the principal operating companies are FBR Capital Markets & Co. (“FBRCM”), FBR Capital Markets LT, Inc. (“FBRLT”), MLV & Co. LLC (“MLV”), and FBR Capital Markets PT, Inc. (“FBRPT”).
FBRCM is an SEC-registered broker-dealer and member of the Financial Industry Regulatory Authority Inc. (“FINRA”). FBRCM acts as an introducing broker and forwards all transactions to clearing brokers on a fully disclosed basis. FBRCM does not hold funds or securities for, nor owe funds or securities to, customers. In addition, FBRCM provides capital raising and advisory services. The Company conducts its syndicated loan trading activity at FBRLT.
On September 1, 2015, the Company completed the purchase of MLV, an investment banking and brokerage firm focused on equity capital markets and a leading provider of at-the-market (“ATM”) offerings. Similar to FBRCM, MLV is an SEC-registered broker-dealer and member of FINRA that acts as an introducing broker and forwards all transactions to a clearing broker on a fully disclosed basis. See Note 5 Acquisitions.
FBRPT holds and manages the Company’s investment positions which include investments in non-registered investment funds that are managed by third parties, merchant banking, marketable equity securities, non-public equity securities, corporate debt investments and U.S. Treasury securities.
In October 2013, the Company received the final payment related to its 2012 agreement to sell the assets related to the management of the FBR Funds, a family of mutual funds. The FBR Funds were managed by a subsidiary of the Company, FBR Fund Advisers, Inc. See Note 16 Discontinued Operations.
Nature of Operations
The Company’s principal business activities, including capital raising, financial advisory, institutional sales and trading, differentiated securities research and securities lending are all linked to the capital markets.
The Company’s investment banking and institutional brokerage business activities are primarily focused on small- and mid-cap stocks in the following industry sectors: consumer, energy and natural resources, financial institutions, healthcare, industrials, insurance, real estate, and technology, media and telecommunications. Additionally, beginning in August 2014 the Company provides securities lending services to a broad group of banks and broker-dealers. These services include facilitating the sourcing, borrowing and lending of equity and fixed income securities (see Note 4 Securities Lending). By their nature, the Company’s business activities are conducted in markets which are highly competitive and are subject to general market conditions, volatile trading markets and fluctuations in the volume of market activity, as well as conditions affecting the companies and markets in the Company’s areas of focus.
The Company’s revenues from investment banking are subject to substantial fluctuations due to a variety of factors that cannot be predicted with great certainty, including the overall condition of the economy and the securities markets as a whole and of the sectors on which the Company focuses. Fluctuations also occur due to the level of market activity, which, among other things, affects the flow of investment dollars and the size, number and timing of transactions. As a result, net income (loss) and revenues may vary significantly from quarter-to-quarter and year-to-year.
F-10
Concentration of Revenue
A substantial portion of the Company’s revenues may be derived from investment banking and these revenues may be concentrated in a small number of transactions. For the years ended December 31, 2015, 2014 and 2013 investment banking revenue accounted for 59%, 63%, and 76%, respectively, of the Company’s revenues, net of interest expense. In addition, 56% of 2015 investment banking revenues were derived from four transactions, 70% of 2014 investment banking revenues were derived from six transactions, and 68% of 2013 investment banking revenues were derived from six transactions.
Note 2. Summary of Significant Accounting Policies:
Principles of Consolidated Financial Statements and Basis of Presentation
The consolidated financial statements include the accounts of the Company and its wholly-owned subsidiaries. All significant intercompany accounts and transactions have been eliminated. Certain reclassifications have been made to prior period amounts in order to conform with the current period presentation.
On February 28, 2013, the Company affected a one-for-four reverse stock split of the Company’s issued and outstanding common stock. While this reverse stock split reduced the number of issued and outstanding common shares, it had no effect on the Company’s total shareholders’ equity. Pursuant to the requirements of the FBR & Co. Long Term Incentive Plan and the provisions of the reverse stock split, all outstanding stock awards under the plan have been adjusted. These adjustments reduced the number of outstanding awards and, in addition for options to purchase common stock, the applicable exercise price, but had no effect on the unrecognized compensation expense applicable to these awards.
Use of Estimates
The preparation of the Company’s financial statements, in conformity with accounting principles generally accepted in the United States of America (“U.S. GAAP”), requires management to make estimates and assumptions affecting the reported amounts of assets and liabilities and disclosure of contingent assets and liabilities at the date of the financial statements and the reported amounts of revenues and expenses during the reporting period. Although, the Company bases its estimates and assumptions on historical experience and market information (when available) and on various other factors that it believes to be reasonable under the circumstances, management exercises significant judgment in the final determination of its estimates. Actual results may differ from these estimates.
Cash Equivalents
Cash equivalents include demand deposits with banks, money market accounts and highly liquid investments with original maturities of three months or less at the date of acquisition that are not held for sale in the ordinary course of business. As of December 31, 2015 and 2014, approximately 77% and 92%, respectively, of the Company’s cash equivalents were invested in money market funds that invest primarily in U.S. Treasuries and other securities directly or indirectly guaranteed by the U.S. government. The Company holds cash in financial institutions in excess of FDIC insured limits. The Company periodically reviews the financial condition of the financial institutions and assesses the credit risk of such investments.
Securities Borrowed and Securities Loaned
Securities borrowed and securities loaned are recorded based upon the amount of cash advanced or received. Securities borrowed transactions facilitate the settlement process and require the Company to deposit cash or other collateral with the lender. With respect to securities loaned, the Company receives collateral in the form of cash. The amount of collateral required to be deposited for securities borrowed, or received for securities loaned, is an amount generally in excess of the market value of the applicable securities borrowed or loaned. The Company monitors the market value of the securities borrowed and loaned on a daily basis, with additional collateral obtained, or excess collateral recalled, when deemed appropriate. As of December 31, 2015 and 2014, and during the years then ended,
F-11
all collateral received or paid was in the form of cash. A substantial portion of the Company’s interest revenue and interest expense results from these activities.
The Company accounts for securities lending transactions in accordance with Accounting Standards Update (“ASU”) 2013-01, “Balance Sheet (Topic 210): Clarifying the Scope of Disclosures about Offsetting Assets and Liabilities,” requiring companies to report disclosures of offsetting assets and liabilities. The Company does not net securities borrowed and securities loaned and these items are presented on a gross basis in the consolidated balance sheets.
Due from/to Brokers, Dealers, and Clearing Organizations
The Company clears all of its proprietary and customer transactions through other broker-dealers on a fully disclosed basis. The amount receivable from or payable to the clearing brokers represents the net of proceeds from unsettled securities sold, the Company’s clearing deposit and amounts receivable for commissions less amounts payable for unsettled securities purchased by the Company and amounts payable for clearing costs and other settlement charges. This amount also includes the cash collateral received for securities loaned less cash collateral for securities borrowed. Any amounts payable would be fully collateralized by all of the securities owned by the Company and held on deposit at the clearing broker. In addition, these balances may include unsettled syndicated loan trades.
Fair Value of Financial Instruments
The Financial Accounting Standards Board’s (“FASB”) Accounting Standards Codification (“ASC”) 820 “Fair Value Measurement” (“ASC 820”) defines fair value as the price that would be received to sell an asset or paid to transfer a liability in an orderly transaction between market participants at the measurement date, not adjusted for transaction costs. ASC 820 also establishes a fair value hierarchy that prioritizes the inputs to valuation techniques used to measure fair value into three broad levels giving the highest priority to quoted prices in active markets for identical assets or liabilities (Level 1) and the lowest priority to unobservable inputs (Level 3) as described below:
|
Level 1 Inputs |
— |
Unadjusted quoted prices in active markets for identical assets or liabilities that are accessible by the Company; |
|
Level 2 Inputs |
— |
Quoted prices in markets that are not active or financial instruments for which all significant inputs are observable, either directly or indirectly; |
|
Level 3 Inputs |
— |
Unobservable inputs for the asset or liability, including significant assumptions of the Company and other market participants. |
The Company determines fair values for the following assets and liabilities:
Equity securities, listed options and warrants—The Company classifies marketable equity securities and listed options within Level 1 of the fair value hierarchy because quoted market prices from an exchange are used to value these securities. Non-public equity securities, which primarily include securities where the Company acted as a placement agent in an offering of equity securities and where the Company facilitates over-the-counter trading activity for the securities, are classified within Level 3 of the fair value hierarchy. In determining the fair value of these securities, the Company considers enterprise value and analyzes various financial, performance and market factors to estimate the value, including where applicable, over-the-counter market trading activity. Non-exchange traded warrants to purchase equity securities are classified as Level 3 as a Black-Scholes valuation model is used to value these securities.
U.S. government securities, convertible and fixed income debt instruments—The Company classifies U.S. government securities, including highly liquid U.S. Treasury securities within Level 1 as quoted prices are used to value these securities. Convertible and fixed income debt instruments are classified within Level 2 of the fair value hierarchy as they are valued using quoted market prices provided by a broker or dealer, or alternative pricing services that provide reasonable levels of price transparency. The Company primarily uses price quotes from an independent broker dealer who makes markets in or is a specialist with expertise in the valuation of these financial instruments. The Company reviews broker or pricing service quotes it receives to assess the reasonableness of the values provided; such reviews include comparison to internal pricing models
F-12
and, when available, prices observed for recently executed market transactions of comparable size. Based on this assessment, at each reporting date the Company will adjust price quotes it receives if such an adjustment is determined to be appropriate.
Investment funds—The Company invests in proprietary investment funds that are valued at net asset value (“NAV”) determined by the fund administrator. The underlying securities held by these investment companies are primarily corporate and asset-backed fixed income securities and restrictions exist on the redemption of amounts invested by the Company. As a practical expedient, the Company relies on the NAV of these investments as their fair value. The NAVs that have been provided by the fund administrators are derived from the fair values of the underlying investments as of the reporting date. As a result of our adoption of Accounting Standards Update 2015-07, “Fair Value Measurement (Topic 820): Disclosures for Investments in Certain Entities That Calculate Net Asset Value per Share (or Its Equivalent),” (“ASU 2015-07”) in 2015, these investment funds are no longer categorized within the fair value hierarchy.
The estimated fair values of the Company’s financial instrument assets and liabilities which are not measured at fair value on the consolidated balance sheets are as follows:
|
|
|
December 31, 2015 |
|
|||||||||||||||||
|
|
|
|
|
|
|
Estimated Fair Value |
|
|||||||||||||
|
|
|
Carrying Amount |
|
|
Level 1 |
|
|
Level 2 |
|
|
Level 3 |
|
|
Total |
|
|||||
|
Financial Assets |
|
|
|
|
|
|
|
|
|
|
|
|
|
|
|
|
|
|
|
|
|
Cash and cash equivalents |
|
$ |
70,067 |
|
|
$ |
70,067 |
|
|
$ |
— |
|
|
$ |
— |
|
|
$ |
70,067 |
|
|
Due from broker, dealers and clearing organizations |
|
|
5,513 |
|
|
|
— |
|
|
|
5,513 |
|
|
|
— |
|
|
|
5,513 |
|
|
Non-interest bearing receivables |
|
|
7,324 |
|
|
|
— |
|
|
|
7,324 |
|
|
|
— |
|
|
|
7,324 |
|
|
Other investments, at cost (1) |
|
|
5,000 |
|
|
|
— |
|
|
|
— |
|
|
|
5,000 |
|
|
|
5,000 |
|
|
Financial Liabilities |
|
|
|
|
|
|
|
|
|
|
|
|
|
|
|
|
|
|
|
|
|
Accounts payable, accrued expenses and other liabilities (1) |
|
|
18,680 |
|
|
|
— |
|
|
|
18,680 |
|
|
|
— |
|
|
|
18,680 |
|
|
(1) |
As of December 31, 2015, there were $1,539 of other investments, at cost and $1,267 of accounts payable, accrued expenses and other liabilities recorded at fair value on a non-recurring basis. |
|
|
|
December 31, 2014 |
|
|||||||||||||||||
|
|
|
|
|
|
|
Estimated Fair Value |
|
|||||||||||||
|
|
|
Carrying Amount |
|
|
Level 1 |
|
|
Level 2 |
|
|
Level 3 |
|
|
Total |
|
|||||
|
Financial Assets |
|
|
|
|
|
|
|
|
|
|
|
|
|
|
|
|
|
|
|
|
|
Cash and cash equivalents |
|
$ |
108,962 |
|
|
$ |
108,962 |
|
|
$ |
— |
|
|
$ |
— |
|
|
$ |
108,962 |
|
|
Due from brokers, dealers and clearing organizations |
|
|
94,489 |
|
|
|
— |
|
|
|
94,489 |
|
|
|
— |
|
|
|
94,489 |
|
|
Non-interest bearing receivables |
|
|
8,576 |
|
|
|
— |
|
|
|
8,576 |
|
|
|
— |
|
|
|
8,576 |
|
|
Other investments, at cost |
|
|
7,000 |
|
|
|
— |
|
|
|
— |
|
|
|
7,395 |
|
|
|
7,395 |
|
|
Financial Liabilities |
|
|
|
|
|
|
|
|
|
|
|
|
|
|
|
|
|
|
|
|
|
Accounts payable, accrued expenses and other liabilities |
|
|
23,093 |
|
|
|
— |
|
|
|
23,093 |
|
|
|
— |
|
|
|
23,093 |
|
The carrying amounts noted above for cash and cash equivalents, due from brokers, dealers and clearing organizations, non-interest bearing receivables, and accounts payable, accrued expenses and other liabilities approximate fair value due to the short term nature of these items and/or minimal credit risk. The fair value of other investments, at cost, which primarily include non-public equity securities, was determined based on the Company’s assessment of enterprise values as discussed above.
F-13
Securities and Principal Investments
Trading securities and investments owned by the Company’s broker-dealer subsidiaries and financial instruments sold, not yet purchased are recorded on the trade-date and carried at fair value. Realized and unrealized gains and losses from trading desk securities are reflected in institutional brokerage revenue in the consolidated statements of operations. Realized and unrealized gains and losses from investment positions are reflected in net investment income in the consolidated statements of operations.
Marketable equity and debt securities held for investment purposes at non-broker-dealer subsidiaries are recorded on the trade date and designated as either available-for-sale or trading investments pursuant to ASC 320, “Investments—Debt and Equity Securities” (“ASC 320”). These investments are carried at fair value with resulting unrealized gains and losses on available-for-sale securities reflected in accumulated other comprehensive income in the consolidated balance sheets and unrealized gains and losses on trading securities reflected in net investment income in the consolidated statements of operations. Investments in equity securities of non-public companies that are held in non-broker-dealer subsidiaries are carried at cost, unless an election is made pursuant to ASC 825, “Financial Instruments” (“ASC 825”), to account for the security at fair value. Such elections are made at the date of purchase based on the Company’s assessment of the prospective liquidity of the non-public equity security.
The Company evaluates available-for-sale securities and investments in securities of non-public companies carried at cost for other-than-temporary impairment at least on a quarterly basis, and more frequently when economic or market concerns warrant such evaluation. The value of the Company’s investments in securities of non-public companies and marketable equity securities designated as available-for-sale can fluctuate significantly. Such values may be based on unobservable inputs, including significant assumptions of the Company and consideration of the liquidity and size of the Company’s position. In evaluating these investments for other-than-temporary impairment, consideration is given to (1) the length of time and the extent to which the fair value has been lower than carrying value, (2) the severity of the decline in fair value, (3) the financial condition and near-term prospects of the issuer, and (4) the Company’s intent and ability to retain its investment in the issuer for a period of time sufficient to allow for any anticipated recovery in fair value. If it is determined that an investment impairment is other-than-temporary then the amount that the fair value is below its current basis is recorded as an impairment charge and recorded through earnings in net investment income in the consolidated statements of operations.
For unrealized losses that are determined to be temporary, the Company continues to evaluate these at each reporting date. If the Company determines at a future date that an impairment of a marketable equity security is other-than-temporary, the applicable unrealized loss will be reclassified from accumulated other comprehensive income and recognized as an other-than-temporary impairment loss at the time the determination is made.
Realized gains and losses on sales of equity and debt securities are determined using the specific identification method.
For restricted shares, including private company shares, these investments by their nature have limited or no price transparency. Adjustments to carrying value may be based on third-party transactions evidencing a change in value and output from the Company’s valuation models and estimates of fair value. In reaching that determination, the Company may consider factors such as, but not limited to, the financial performance of the companies relative to projections, trends within sectors, underlying business models and expected exit timing and strategy.
The Company’s investments in proprietary investment funds include non-registered investment companies. As of December 31, 2015 and 2014, these investments are comprised of non-registered investment companies where the underlying fund investments consist primarily of corporate and asset-backed fixed income securities. These funds record their investments in securities at fair value and report NAV to investors representing the fair value of the underlying investments held by the funds. The funds’ determination of these fair values is a matter of judgment. The Company reflects the increase/decrease in NAV (including realized and unrealized gains and losses) in net investment income in the consolidated statements of operations. The Company’s disposition of these investment funds may be subject to contractual restrictions.
F-14
Goodwill and Intangible Assets
The Company’s intangible assets consist of goodwill and intangible assets with finite useful lives. All of these intangible assets were recognized as a result of business combinations. Goodwill is not amortized but is tested annually for impairment (during the third quarter) or more frequently if an adverse event occurs that may indicate impairment. The values of the intangible assets with finite useful lives are amortized in proportion to their expected economic benefit over their estimated useful life or straight-line if the economic benefit cannot be reliably determined. These intangible assets are periodically tested for impairment by comparing expected future gross cash flows to the asset’s carrying amount. If the expected gross cash flows are less than the carrying amount, the asset is impaired and is written-down to its fair value.
Furniture, Equipment, Software and Leasehold Improvements
Furniture, equipment, software and leasehold improvements are stated at cost less accumulated depreciation and amortization. Furniture and equipment are depreciated using the straight-line method over their estimated useful lives of three to five years. Amortization of purchased software is recorded over the estimated useful lives of three to five years. Leasehold improvements are amortized using the straight-line method over the shorter of the useful life or lease term.
Leases
The Company leases its corporate headquarters and other offices under non-cancelable leases. The terms of the Company’s lease agreements range up to 10 years and may contain renewal options, escalation clauses, rent-free periods and operating cost adjustments.
For leases that contain escalation clauses or rent-free periods, the Company recognizes the related rent expense on a straight-line basis from the date the Company takes possession of the property to the end of the initial lease term. The Company records any difference between the straight-line rent amounts and amounts payable under the leases as part of accounts payable and accrued expenses and other liabilities. Lease incentives received upon entering into certain leases are recognized on a straight-line basis as a reduction of rent expense from the date the Company takes possession of the property or receives the incentive to the end of the initial lease term. The Company records the unamortized portion of lease incentives as part of accounts payable, accrued expenses and other liabilities.
Investment Banking Revenues
Capital raising revenues represent fees earned from private placement transactions and from public offerings of securities in which the Company acts as placement agent or underwriter. These revenues consist of placement fees, selling concessions, underwriting fees, management fees and reimbursed expenses. Advisory revenues represent fees earned from mergers and acquisitions, mutual conversions, financial restructuring and other advisory services provided to clients. Capital raising revenues are recorded as revenue at the time the underwriting or private placement is completed under the terms of each engagement. Advisory fees are recorded as revenue when the related service has been rendered and the client is contractually obligated to pay. Certain fees received in advance of services rendered are deferred and recognized as revenue over the service period. Expenses associated with such transactions are deferred until the related revenue is recognized or the engagement is otherwise concluded or cancelled, at which time such expenses are recognized.
Institutional Brokerage Revenues
Institutional brokerage revenues consist of commissions resulting from securities transactions executed as agent or principal and related net trading gains and losses. Revenues generated from securities transactions and related commission income and expense are recorded on the trade date. Institutional brokerage revenues also include direct payments received by the Company for equity research.
F-15
Compensation and Benefits
Compensation and benefits includes base salaries, incentive compensation, stock-based compensation, employee benefit costs, and employer taxes. Incentive compensation is a significant component of compensation expense and is accrued based on the Company’s performance and the contribution of key business units, and in certain limited cases, using pre-defined formulas. The Company’s compensation accruals are reviewed and evaluated on a quarterly basis. The Company recognizes stock-based compensation expense in the consolidated statements of operations based on the grant-date fair value of awards of equity instruments issued to employees. The grant-date fair value is based on the closing price of FBR & Co.’s common stock on the date of grant. The expense is recognized over the period during which employees are required to provide service. The expense is recorded net of an estimated forfeiture rate for awards on the date of grant.
Income Taxes
The Company files a consolidated U.S. federal income tax return. The Company is also subject to income tax in various states and municipalities in which it operates. Income taxes are provided for using the asset and liability method. Deferred tax assets and liabilities represent the differences between the financial statement and income tax bases of assets and liabilities using enacted tax rates. The measurement of net deferred tax assets is adjusted by a valuation allowance if, based on our evaluation and our consideration of the criteria in ASC 740, “Income Taxes” (“ASC 740”), it is more likely than not that they will not be realized. Tax liabilities for uncertain tax positions are recorded in accordance with ASC 740. The Company’s policy for recording interest and penalties associated with uncertain tax positions is to record such items as a component of other operating expenses in the consolidated statements of operations.
Other Comprehensive Income
Comprehensive income includes net income as currently reported by the Company on the consolidated statements of operations adjusted for other comprehensive income. Other comprehensive income for the Company represents changes in unrealized gains and losses related to the Company’s investment securities accounted for as available-for-sale with changes in fair value recorded through shareholders’ equity.
Income Per Share
Basic earnings per common share is calculated by dividing net income (loss) available to common shareholders by the weighted average number of common shares outstanding for the period, including restricted stock units (“RSUs”) that are not subject to forfeiture. Diluted earnings per common share is calculated by adjusting the weighted average outstanding shares to include the dilutive effect of unvested RSUs and shares of restricted stock that are subject forfeiture and the conversion of all potentially dilutive options to purchase common stock.
Recent Accounting Pronouncements
In May 2014, the FASB issued ASU 2014-09, “Revenue from Contracts with Customers” (“ASU 2014-09”), which supersedes nearly all existing revenue recognition guidance under U.S. GAAP. The core principle of ASU 2014-09 is to recognize revenues when promised goods or services are transferred to customers in an amount that reflects the consideration to which an entity expects to be entitled for those goods or services. ASU 2014-09 defines a five step process to achieve this core principle and, in doing so, more judgment and estimates may be required within the revenue recognition process than are required under existing U.S. GAAP. The standard is effective for annual periods beginning after December 15, 2017, and interim periods therein, using either of the following transition methods: (i) a full retrospective approach reflecting the application of the standard in each prior reporting period with the option to elect certain practical expedients, or (ii) a retrospective approach with the cumulative effect of initially adopting ASU 2014-09 recognized at the date of adoption (which includes additional footnote disclosures). The Company is currently evaluating the impact of its pending adoption of ASU 2014-09 on its consolidated financial statements.
F-16
In April 2015, the FASB issued ASU 2015-05, “Intangibles – Goodwill and Other Internal-Use Software (Subtopic 350-40): Customer’s Accounting for Fees Paid in a Cloud Computing Arrangement,” (“ASU 2015-05”). This ASU provides guidance to customers about whether a cloud computing arrangement includes a software license. If a cloud computing arrangement includes a software license, the customer should account for the software license element of the arrangement consistent with the acquisition of other software licenses. If a cloud computing arrangement does not include a software license, the customer should account for the arrangement as a service contract. The new guidance does not change the accounting for a customer’s accounting for service contracts. ASU 2015-05 is effective for interim and annual reporting periods beginning after December 15, 2015. The Company does not anticipate that the adoption of ASU 2015-05 will have a material impact on its consolidated financial statements.
In May 2015, the FASB issued ASU 2015-07. This ASU provides guidance for eliminating the requirement to categorize within the fair value hierarchy all investments for which fair value is measured using the NAV per share as a practical expedient for fair value. Removing investments measured using the practical expedient from the fair value hierarchy is intended to eliminate the diversity in practice that currently exists with respect to the categorization of these investments. Although classification within the fair value hierarchy is no longer required, an entity must disclose the amount of investments measured using the NAV in order to permit reconciliation of the fair value of investments in the hierarchy to the corresponding line items in the balance sheet. ASU 2015-07 is effective for interim and annual reporting periods beginning after December 15, 2015 with early adoption permitted. A retrospective transition approach is required. The retrospective approach requires that an investment for which fair value is measured using the net asset value per share practical expedient be removed from the fair value hierarchy in all periods presented. The Company adopted ASU 2015-07 in the fourth quarter of 2015 with no material impact on its consolidated financial statements or disclosures.
In January 2016, the FASB issued ASU 2016-01, "Financial Instruments—Overall (Subtopic 825-10): Recognition and Measurement of Financial Assets and Financial Liabilities" ("ASU 2016-01"). The amendments in ASU 2016-01 address certain aspects of the recognition, measurement, presentation and disclosure of financial instruments. ASU 2016-01 is effective for annual and interim periods beginning after December 15, 2017. Except for the early application guidance outlined in ASU 2016-01, early adoption is not permitted. The Company is evaluating the impact of the new guidance on its consolidated financial statements.
In February 2016, the FASB issued ASU 2016-02, “Leases (Topic 842),” (“ASU 2016-02”). The new standard establishes a right-of-use (“ROU”) model that requires a lessee to record a ROU asset and a lease liability on the balance sheet for all leases with terms longer than 12 months. Leases will be classified as either finance or operating, with classification affecting the pattern of expense recognition in the income statement. The new standard is effective for fiscal years beginning after December 15, 2018, including interim periods within those fiscal years. A modified retrospective transition approach is required for lessees for capital and operating leases existing at, or entered into after, the beginning of the earliest comparative period presented in the financial statements, with certain practical expedients available. While we are still evaluating the impact of our pending adoption of the new standard on our consolidated financial statements, we expect that upon adoption we will recognize ROU assets and lease liabilities and that the amounts could be material.
Note 3. Financial Instruments:
Fair Value Hierarchy
The following tables set forth, by level within the fair value hierarchy, financial instruments, including long-term investments accounted for under ASC 820 as of December 31, 2015 and 2014, respectively. As required by ASC 820, assets and liabilities that are measured at fair value are classified in their entirety based on the lowest level of input that is significant to the fair value measurement.
F-17
Items Measured at Fair Value on a Recurring Basis
|
|
|
December 31, 2015 |
|
|
Level 1 |
|
|
Level 2 |
|
|
Level 3 |
|
||||
|
Financial instruments owned, at fair value: |
|
|
|
|
|
|
|
|
|
|
|
|
|
|
|
|
|
Financial instruments held for trading activities at broker-dealer subsidiary: |
|
|
|
|
|
|
|
|
|
|
|
|
|
|
|
|
|
Marketable and non-public equity securities |
|
$ |
13,221 |
|
|
$ |
5,586 |
|
|
$ |
— |
|
|
$ |
7,635 |
|
|
Convertible and fixed income debt instruments |
|
|
815 |
|
|
|
— |
|
|
|
815 |
|
|
|
— |
|
|
|
|
|
14,036 |
|
|
|
5,586 |
|
|
|
815 |
|
|
|
7,635 |
|
|
Financial instruments held for investment activities: |
|
|
|
|
|
|
|
|
|
|
|
|
|
|
|
|
|
Designated as trading: |
|
|
|
|
|
|
|
|
|
|
|
|
|
|
|
|
|
Marketable and non-public equity securities |
|
|
13,849 |
|
|
|
5,415 |
|
|
|
— |
|
|
|
8,434 |
|
|
Warrants |
|
|
436 |
|
|
|
— |
|
|
|
— |
|
|
|
436 |
|
|
|
|
|
14,285 |
|
|
|
5,415 |
|
|
|
— |
|
|
|
8,870 |
|
|
Total |
|
|
28,321 |
|
|
$ |
11,001 |
|
|
$ |
815 |
|
|
$ |
16,505 |
|
|
Investment funds valued at net asset value(1) |
|
|
66,602 |
|
|
|
|
|
|
|
|
|
|
|
|
|
|
Total financial instruments owned, at fair value |
|
$ |
94,923 |
|
|
|
|
|
|
|
|
|
|
|
|
|
|
Financial instruments sold, not yet purchased, at fair value: |
|
|
|
|
|
|
|
|
|
|
|
|
|
|
|
|
|
Marketable and non-public equity securities |
|
$ |
1,933 |
|
|
$ |
1,933 |
|
|
$ |
— |
|
|
$ |
— |
|
|
Convertible and fixed income debt instruments |
|
|
1 |
|
|
|
— |
|
|
|
1 |
|
|
|
— |
|
|
Total |
|
$ |
1,934 |
|
|
$ |
1,933 |
|
|
$ |
1 |
|
|
$ |
— |
|
|
(1) |
In accordance with Subtopic 820-10, certain investments that are measured at fair value using the net asset value per share (or its equivalent) practical expedient have not been classified in the fair value hierarchy. The fair value amounts presented in this table are intended to permit reconciliation of the fair value hierarchy to the amounts presented in the consolidated balance sheets. |
As of December 31, 2015, financial assets measured and reported at fair value on a recurring basis and classified within Level 3 were $16,505 or 1.8% of the Company’s total assets at that date. Regarding these Level 3 financial assets, in determining fair value, the Company analyzes various financial, performance and market factors to estimate the value, including where applicable, over-the-counter market trading activity. The following table provides the valuation technique and unobservable inputs primarily used in assessing the value of these securities as of December 31, 2015:
|
Valuation Technique |
|
Fair Value |
|
|
Unobservable Input |
|
Range |
|
|
Weighted Average |
|
|||
|
Market approach—assets |
|
$ |
16,069 |
|
|
Over-the-counter trading activity |
|
$0 - $14.10/share |
|
|
$11.13 |
|
||
|
Black-Scholes—assets |
|
$ |
436 |
|
|
Volatility |
|
|
30% |
|
|
|
30% |
|
|
|
|
|
|
|
|
Dividend Yield |
|
|
0% |
|
|
|
0% |
|
|
|
|
|
|
|
|
Interest Rate |
|
|
1.9% |
|
|
|
1.9% |
|
For those non-public equity securities valued using a market approach, adverse industry market conditions or events experienced by the underlying entities could result in lower over-the-counter trading prices for the securities. Such lower trading prices would result in a decline in the estimated fair value of these assets. For warrants valued using Black-Scholes, adverse industry market conditions or events experienced by the issuer could result in a lower trading price for the underlying equity security and therefore a lower value of these warrants. A reduction in the estimated volatility would also result in a lower value of the warrants. The Company assessed the reasonableness of the fair values of the non-public equity securities noted above based on its consideration of available financial data related to these issuers as well as an assessment of the nature of any over-the-counter trading activity during the period. The Company assessed the reasonableness of the fair value of the non-exchange traded warrants valued using a Black-Scholes valuation based on its consideration of the fair values of comparable exchange-traded options.
F-18
|
|
|
December 31, 2014 |
|
|
Level 1 |
|
|
Level 2 |
|
|
Level 3 |
|
||||
|
Financial instruments owned, at fair value: |
|
|
|
|
|
|
|
|
|
|
|
|
|
|
|
|
|
Financial instruments held for trading activities at broker-dealer subsidiary: |
|
|
|
|
|
|
|
|
|
|
|
|
|
|
|
|
|
Marketable and non-public equity securities |
|
$ |
14,832 |
|
|
$ |
14,758 |
|
|
$ |
— |
|
|
$ |
74 |
|
|
Listed options |
|
|
2 |
|
|
|
2 |
|
|
|
— |
|
|
|
— |
|
|
Convertible and fixed income debt instruments |
|
|
42,864 |
|
|
|
— |
|
|
|
42,864 |
|
|
|
— |
|
|
|
|
|
57,698 |
|
|
|
14,760 |
|
|
|
42,864 |
|
|
|
74 |
|
|
Financial instruments held for investment activities: |
|
|
|
|
|
|
|
|
|
|
|
|
|
|
|
|
|
Designated as trading: |
|
|
|
|
|
|
|
|
|
|
|
|
|
|
|
|
|
Marketable and non-public equity securities |
|
|
2,325 |
|
|
|
175 |
|
|
|
— |
|
|
|
2,150 |
|
|
Warrants |
|
|
964 |
|
|
|
— |
|
|
|
— |
|
|
|
964 |
|
|
Designated as available-for-sale: |
|
|
|
|
|
|
|
|
|
|
|
|
|
|
|
|
|
Marketable equity securities |
|
|
172 |
|
|
|
172 |
|
|
|
— |
|
|
|
— |
|
|
|
|
|
3,461 |
|
|
|
347 |
|
|
|
— |
|
|
|
3,114 |
|
|
Total |
|
|
61,159 |
|
|
$ |
15,107 |
|
|
$ |
42,864 |
|
|
$ |
3,188 |
|
|
Investment funds valued at net asset value(1) |
|
|
104,888 |
|
|
|
|
|
|
|
|
|
|
|
|
|
|
Total financial instruments owned, at fair value |
|
$ |
166,047 |
|
|
|
|
|
|
|
|
|
|
|
|
|
|
Financial instruments sold, not yet purchased, at fair value: |
|
|
|
|
|
|
|
|
|
|
|
|
|
|
|
|
|
U.S. Treasury securities |
|
$ |
84,950 |
|
|
$ |
84,950 |
|
|
$ |
— |
|
|
$ |
— |
|
|
Marketable and non-public equity securities |
|
|
34,043 |
|
|
|
34,043 |
|
|
|
— |
|
|
|
— |
|
|
Convertible and fixed income debt instruments |
|
|
2,317 |
|
|
|
— |
|
|
|
2,317 |
|
|
|
— |
|
|
Total |
|
$ |
121,310 |
|
|
$ |
118,993 |
|
|
$ |
2,317 |
|
|
$ |
— |
|
|
(1) |
In accordance with Subtopic 820-10, certain investments that are measured at fair value using the net asset value per share (or its equivalent) practical expedient have not been classified in the fair value hierarchy. The fair value amounts presented in this table are intended to permit reconciliation of the fair value hierarchy to the amounts presented in the consolidated balance sheets. |
As of December 31, 2014, financial assets measured and reported at fair value on a recurring basis and classified within Level 3 were $3,188 or 0.3% of the Company’s total assets at that date. Regarding these Level 3 financial assets, in determining fair value, the Company analyzes various financial, performance and market factors to estimate the value, including where applicable, over-the-counter market trading activity. The following table provides the valuation technique and unobservable inputs primarily used in assessing the value of these securities as of December 31, 2014:
|
Valuation Technique |
|
Fair Value |
|
|
Unobservable Input |
|
Range |
|
|
Weighted Average |
|
|||
|
Market approach—assets |
|
$ |
2,224 |
|
|
Over-the-counter trading activity |
|
$ 0 - $34.00/share |
|
|
$11.56 |
|
||
|
Black-Scholes—assets |
|
$ |
964 |
|
|
Volatility |
|
|
30% |
|
|
|
30% |
|
|
|
|
|
|
|
|
Dividend Yield |
|
|
0% |
|
|
|
0% |
|
|
|
|
|
|
|
|
Interest Rate |
|
|
2.1% |
|
|
|
2.1% |
|
F-19
For those non-public equity securities valued using a market approach, adverse industry market conditions or events experienced by the underlying entities could result in lower over-the-counter trading prices for the securities. Such lower trading prices would result in a decline in the estimated fair value of these assets. An increase in the trading prices of trading securities sold but not yet purchased would result in an increase in the estimated fair value of these liabilities. For warrants valued using Black-Scholes, adverse industry market conditions or events experienced by the issuer could result in a lower trading price for the underlying equity security and therefore a lower value of these warrants. A reduction in the estimated volatility would also result in a lower value of the warrants. The Company assessed the reasonableness of the fair values of the non-public equity securities noted above based on its consideration of available financial data related to these issuers as well as an assessment of the nature of any over-the-counter trading activity during the period. The Company assessed the reasonableness of the fair value of the non-exchange traded warrants valued using a Black-Scholes valuation based on its consideration of the fair values of comparable exchange-traded options.
Level 3 Gains and Losses
The tables below set forth a summary of changes in the fair value of the Company’s Level 3 financial assets and liabilities that are measured at fair value on a recurring basis for the years ended December 31, 2015 and 2014. As of December 31, 2015 and 2014, the Company did not have any net unrealized gains (losses) included in accumulated other comprehensive income on Level 3 financial assets:
|
|
|
Year Ended December 31, |
|
|
Year Ended December 31, |
|
||||||
|
|
|
2015 |
|
|
2014 |
|
||||||
|
|
|
Trading Securities |
|
|
Trading Securities |
|
|
Financial Instruments Sold, not yet Purchased |
|
|||
|
Beginning balance, January 1, |
|
$ |
3,188 |
|
|
$ |
11,535 |
|
|
$ |
(1,499 |
) |
|
Total net losses (realized/unrealized) included in earnings |
|
|
(332 |
) |
|
|
(254 |
) |
|
|
(122 |
) |
|
Purchases |
|
|
75,173 |
|
|
|
124,223 |
|
|
|
6,043 |
|
|
Sales/distributions |
|
|
(61,495 |
) |
|
|
(126,067 |
) |
|
|
(4,422 |
) |
|
Transfers out of Level 3 |
|
|
(29 |
) |
|
|
(6,249 |
) |
|
|
— |
|
|
Ending balance, December 31, |
|
$ |
16,505 |
|
|
$ |
3,188 |
|
|
$ |
— |
|
|
The amount of total gains or losses for the period included in earnings attributable to the change in unrealized gains or losses relating to assets and liabilities still held at the reporting date |
|
$ |
(631 |
) |
|
$ |
266 |
|
|
$ |
— |
|
During the year ended December 31, 2015, there was one transfer out of Level 3 and into Level 1 for an equity security that was previously a non-public equity security and during the applicable period became publicly traded. During the year ended 2014, two transfers were made out of Level 3 and into Level 1 for equity securities that were previously non-public equity securities and during the applicable period became publicly traded.
F-20
Gains and losses from Level 3 financial assets and liabilities that are measured at fair value on a recurring basis, that are included in earnings for the years ended December 31, 2015, 2014 and 2013, are reported in the following line descriptions on the Company’s consolidated statements of operations:
|
|
|
Year Ended December 31, |
|
|||||||||
|
|
|
2015 |
|
|
2014 |
|
|
2013 |
|
|||
|
Total gains and losses included in earnings for the period: |
|
|
|
|
|
|
|
|
|
|
|
|
|
Institutional brokerage |
|
$ |
422 |
|
|
$ |
38 |
|
|
$ |
1,722 |
|
|
Net investment (loss) income |
|
|
(754 |
) |
|
|
(415 |
) |
|
|
2,648 |
|
|
Change in unrealized gains or losses relating to assets still held at the end of the respective period: |
|
|
|
|
|
|
|
|
|
|
|
|
|
Institutional brokerage |
|
|
123 |
|
|
|
(38 |
) |
|
|
438 |
|
|
Net investment (loss) income |
|
|
(754 |
) |
|
|
304 |
|
|
|
2,551 |
|
Items Measured at Fair Value on a Non-Recurring Basis
The Company also measures certain financial assets and liabilities and other assets at fair value on a non-recurring basis including items such as cost method investments, intangibles, fixed assets and estimated contingent consideration payable. Adjustments to the fair value of these assets and liabilities usually result from the application of lower-of-cost-or-market accounting or impairments of individual assets. Adjustments to the fair value of contingent consideration payable would result from differences between the underlying forecasted securities lending results and actual results. Due to the nature of these assets, unobservable inputs are used to value these assets and liabilities. In determining the fair value, the Company analyzes various financial, performance, and market factors to estimate the fair value, including where applicable, market activity. As a result, these assets and liabilities are classified within Level 3 of the fair value hierarchy.
During the year ended December 31, 2015, except for changes in contingent consideration payable, discussed below, and the recognition of a $461 other-than-temporary impairment loss on a cost method investment, there were no assets or liabilities measured at fair value on a non-recurring basis for which there was a change in carrying value. During the year ended December 31, 2015 the Company made payments of $2,166 related to its contingent consideration obligation. Additionally, as a result of changes in forecasted securities lending results, the Company reduced the carrying value of this liability by $637 during 2015 and as of December 31, 2015 the contingent consideration payable was valued at $1,267. This reduction in value is included in dividends and other income in the consolidated statements of operations. During the year ended December 31, 2014, there were no assets or liabilities measured at fair value on a non-recurring basis for which there was a change in carrying value. During the year ended December 31, 2013, other than the recognition of an other-than-temporary impairment loss of $545 related to a marketable equity security, there were no assets measured at fair value on a non-recurring basis for which there was a change in carrying value.
F-21
Financial Instruments Held for Investment—Designated as Trading
As of December 31, 2015, and during the years ended December 31, 2015 and 2014, the Company had certain investments in marketable equity securities held by other than its broker-dealer subsidiaries that were classified as trading securities. In addition, during the years ended December 31, 2015 and 2014, the Company had short positions in U.S. Treasury securities held by other than its broker-dealer subsidiaries that were classified as trading securities. These investments are designated as trading based on the Company’s intent at the time of designation. In accordance with ASC 320, these securities are carried at fair value with resulting realized and unrealized gains and losses reflected as net investment income in the consolidated statements of operations. In addition, pursuant to ASC 825, from time-to-time the Company may elect to account for non-public equity securities acquired by other than the Company’s broker-dealer subsidiaries as part of its trading portfolio at fair value with resulting realized and unrealized gains and losses reflected as net investment income in the consolidated statements of operations. During 2015, the Company elected to account for two non-public equity securities, purchased at a cost of $6,510, at fair value. During 2014, the Company elected to account for two non-public equity securities, purchased at a cost of $6,148, at fair value. Net gains and losses on such trading securities as of the dates indicated were as follows:
|
|
|
Year Ended December 31, |
|
|||||||||
|
|
|
2015 |
|
|
2014 |
|
|
2013 |
|
|||
|
Net (loss) gains recognized on trading securities |
|
$ |
(1,442 |
) |
|
$ |
3,630 |
|
|
$ |
1,213 |
|
|
Less: Net loss (gains) recognized on trading securities sold during the period |
|
|
933 |
|
|
|
(3,732 |
) |
|
|
(261 |
) |
|
Unrealized (losses) gains recognized on trading securities still held at the reporting date |
|
$ |
(509 |
) |
|
$ |
(102 |
) |
|
$ |
952 |
|
As part of the Company’s investing activities, during 2015 the Company entered into two short sales, totaling $200,000 face value, of 4.625% U.S. Treasury securities maturing in November 2016. These two short sales were settled in the third quarter of 2015. During 2014, the Company entered into one short-sale of a $75,000 face value 7.25% U.S. Treasury security and two short-sales of $100,000 face value each, 4.50% U.S. Treasury securities with maturity dates of May 2016, November 2015 and February 2016, respectively. The Company closed the two $100,000 face value positions during the fourth quarter of 2014 and closed the $75,000 face value position in the fourth quarter of 2015. The $75,000 face value position was open at December 31, 2014 and is included in financial instruments sold, not yet purchased on the Company’s consolidated balance sheets. During the years ended December 31, 2015 and 2014, the Company recognized realized and unrealized gains of $9,954 and $10,451, respectively, related to these short sales. Proceeds from open short-sales, as well as related margin requirements, were held in a collateral account and were included in due from brokers, dealers and clearing organizations in the Company’s consolidated balance sheets. Such amounts were not available for withdrawal and were subject to closure of the open short positions. During the years ended December 31, 2015 and 2014, the Company incurred $11,160 and $11,678, respectively, of interest expense related to these transactions.
Fair Value of the Investments Valued at NAV
As of December 31, 2015 and 2014, the Company has $66,602 and $104,888, respectively, of investments that are valued at NAV. The following table presents information about the Company’s investments in hedge funds and private equity funds measured at fair value based on NAV at December 31, 2015 and 2014:
|
|
|
December 31, 2015 |
|
|
December 31, 2014 |
|
||||||||||
|
|
|
Fair Value |
|
|
Unfunded Commitment |
|
|
Fair Value |
|
|
Unfunded Commitment |
|
||||
|
Hedge funds: |
|
|
|
|
|
|
|
|
|
|
|
|
|
|
|
|
|
Fixed income/credit-related |
|
$ |
38,972 |
|
|
$ |
— |
|
|
$ |
57,532 |
|
|
$ |
— |
|
|
Multi-strategy |
|
|
18,930 |
|
|
|
— |
|
|
|
37,890 |
|
|
|
— |
|
|
Private equity funds |
|
|
8,700 |
|
|
|
212 |
|
|
|
9,466 |
|
|
|
2,586 |
|
|
Total |
|
$ |
66,602 |
|
|
$ |
212 |
|
|
$ |
104,888 |
|
|
$ |
2,586 |
|
F-22
The investments in non-registered investment funds are valued at NAV as determined by the fund administrators. The underlying fund investments consist primarily of corporate and asset-backed fixed income securities. Considering the general lack of transparency necessary to conduct an independent assessment of the fair value of the securities underlying each of the NAVs provided by the fund administrators, our reporting process includes a number of assessment processes to assist the Company in the evaluation of the information provided by fund managers and fund administrators. These assessment processes include, but are not limited to regular review and discussion of each fund’s performance with its manager and regular evaluation of performance against applicable benchmarks.
Investments in hedge funds may be subject to lock-up restrictions or gates. A hedge fund lockup provision is a provision that provides that an investor may not make a withdrawal from the fund or may be subject to withdrawal fees. The purpose of a gate is to restrict the level of redemptions that an investor in a particular hedge fund can demand at any redemption date. All of the Company’s hedge fund investments have the ability to impose redemption gates. As of December 31, 2015, 54% of the fair value of the Company’s fund investments, or $31,452 of the hedge funds, was redeemable on either a monthly or quarterly basis with notice periods of 60 days or less, 46% of the fair value, or $26,450 of the hedge funds, was redeemable on a quarterly basis with notice periods of between 90 days and 180 days. As of December 31, 2015, the Company has initiated redemptions for approximately $28,000 of the fair value of the hedge funds.
The Company’s fixed income and credit-related hedge fund investments include funds that primarily employ long-short or relative value strategies in order to benefit from investments in undervalued or overvalued securities that are primarily debt or credit related. The Company’s multi-strategy fund investments include funds that pursue a variety of fixed income, credit and asset-backed strategies to realize short and long term gains. Management of these hedge funds has the ability to overweight or underweight different strategies to best capitalize on current investment opportunities.
The Company’s private equity fund investments include funds that pursue multiple strategies including direct lending, asset securitization and real estate development. These investments by the Company are generally not redeemable with the funds. The nature of these fund investments is that distributions are received through the liquidation of the underlying assets of the fund. At December 31, 2015 it was estimated that these funds will be liquidated in the next three years.
Financial Instruments Held for Investment—Designated as Available-for-Sale
As of December 31, 2014, the Company had certain investments in marketable equity securities held by other than the Company’s broker-dealer subsidiary that were classified as available-for-sale securities. These investments were designated as available-for-sale due to the Company’s intent at the time of designation to hold these securities for investment purposes over an extended period, however, they were available to be sold should economic conditions warrant such a transaction. In accordance with ASC 320, these securities were carried at fair value with resulting unrealized gains and losses reflected as other comprehensive income or loss. Gross unrealized gains and losses on these securities as of December 31, 2014 were as follows:
|
|
|
December 31, 2014 |
|
|||||||||||||
|
|
|
|
|
|
|
Unrealized |
|
|
|
|
|
|||||
|
|
|
Cost Basis |
|
|
Gains |
|
|
Losses |
|
|
Fair Value |
|
||||
|
Marketable equity securities |
|
$ |
100 |
|
|
$ |
72 |
|
|
$ |
— |
|
|
$ |
172 |
|
F-23
The following provides detail of the amounts included in accumulated other comprehensive income and reclassified to earnings during the specified periods:
|
|
|
Year Ended December 31, |
|
|||||||||
|
|
|
2015 |
|
|
2014 |
|
|
2013 |
|
|||
|
Beginning balance |
|
$ |
44 |
|
|
$ |
34 |
|
|
$ |
(1,094 |
) |
|
Net unrealized investment gains (losses) during the period: |
|
|
|
|
|
|
|
|
|
|
|
|
|
Unrealized holding gains (losses), net of taxes |
|
|
— |
|
|
|
10 |
|
|
|
619 |
|
|
Reclassification adjustment for recognized losses included in net income, net of taxes |
|
|
(44 |
) |
|
|
— |
|
|
|
509 |
|
|
Ending balance |
|
$ |
— |
|
|
$ |
44 |
|
|
$ |
34 |
|
The Company evaluates its portfolio of marketable equity securities for impairment as of each reporting date. For the securities with unrealized losses, the Company will review the underlying cause for the impairments, as well as the severity and duration of the impairments. If the impairment is determined to be other-than-temporary, the Company will recognize an other-than-temporary impairment loss in its consolidated statements of operations. During the years ended December 31, 2015, 2014 and 2013, the Company recorded other-than-temporary impairment losses of $-0-, $-0- and $545, respectively, in the consolidated statements of operations relating to marketable equity securities.
The Company did not hold any marketable equity securities that were in unrealized loss positions as of December 31, 2015 and 2014. During the year ended December 31, 2013, the Company recognized a $545 other-than-temporary impairment loss related to a company in the financial services industry. The Company recognized this impairment loss as a result of a change in its intent to hold this investment for a period of time sufficient for a forecasted recovery of its fair value. In this case the change in intent was a result of changes in market conditions during 2013 specific to this investment. The carrying value of this investment subsequent to the impairment was $4,257.
During the year ended December 31, 2015, the Company received $191 from the sale of a marketable equity security designated as available-for-sale resulting in a gross gain of $91. There were no sales of marketable equity securities designated as available-for-sale during the year ended December 31, 2014. During the year ended December 31, 2013, the Company received $25,431 from sales of marketable equity securities designated as available-for-sale resulting in gross gains of $698 and gross losses of $32.
Other Comprehensive Income
The following tables set forth the changes in the Company’s accumulated other comprehensive income by component for the periods indicated.
|
|
|
Year Ended December 31, |
|
|||||
|
|
|
2015 |
|
|
2014 |
|
||
|
Accumulated other comprehensive income, Beginning balance |
|
$ |
44 |
|
|
$ |
34 |
|
|
Other comprehensive income before reclassifications |
|
|
— |
|
|
|
10 |
|
|
Amounts reclassified from other comprehensive income |
|
|
(44 |
) |
|
|
— |
|
|
Accumulated other comprehensive income, at period end |
|
$ |
— |
|
|
$ |
44 |
|
Other Investments, at Cost
Other investments consist of non-public equity securities of $6,539 and $7,000 as of December 31, 2015 and 2014, respectively. The Company evaluates its investments, carried at cost, for impairment as of each reporting date.
F-24
This evaluation includes consideration of the operating performance of the respective underlying companies, any over-the-counter trading activity, their financial condition and their near-term and long-term prospects. Based on its evaluations of these investments, the Company recorded a $461 impairment loss during the year ended December 31, 2015. The Company recorded no impairment losses during the years ended December 31, 2014 and 2013.
There were no sales of, or distributions from, non-public equity securities during 2015. During the year ended December 31, 2014, the Company received proceeds of $1,428 from the sale of a non-public equity security resulting in a gross gain of $1,176, and the Company received $5,000 reflecting the full repayment at its maturity of a corporate debt investment. In addition, during the year ended December 31, 2014, a non-public equity security carried at cost with a basis of $428 became publicly traded during the period. The Company designated this security as trading at the time it became publicly traded. There were no sales of, or distributions from, non-public equity securities during 2013. The Company received $317 from the maturity of a note receivable that was carried at cost during 2013. In addition, during 2013 a non-public equity security carried at cost with a basis of $2,390 became publicly traded. The Company designated this security as trading at the time it became publicly traded.
Note 4. Securities Lending:
Securities borrowed and securities loaned are recorded based upon the amount of cash advanced or received. Securities borrowed transactions facilitate the settlement process and require the Company to deposit cash or other collateral with the lender. With respect to securities loaned, the Company receives collateral in the form of cash. The amount of collateral required to be deposited for securities borrowed, or received for securities loaned, is an amount generally in excess of the market value of the applicable securities borrowed or loaned. The Company monitors the market value of the securities borrowed and loaned on a daily basis, with additional collateral obtained, or excess collateral recalled, when deemed appropriate.
The following tables present the contractual gross and net securities borrowing and lending balances and the related offsetting amount as of December 31, 2015 and 2014:
|
|
|
Gross amounts recognized |
|
|
Gross amounts offset in the consolidated balance sheets (1) |
|
|
Net amounts included in the consolidated balance sheets |
|
|
Amounts not offset in the balance sheet but eligible for offsetting upon counterparty default (2) |
|
|
Net amounts |
|
|||||
|
As of December 31, 2015 |
|
|
|
|
|
|
|
|
|
|
|
|
|
|
|
|
|
|
|
|
|
Securities borrowed |
|
$ |
685,037 |
|
|
$ |
— |
|
|
$ |
685,037 |
|
|
$ |
685,037 |
|
|
$ |
— |
|
|
Securities loaned |
|
$ |
687,443 |
|
|
$ |
— |
|
|
$ |
687,443 |
|
|
$ |
687,443 |
|
|
$ |
— |
|
|
As of December 31, 2014 |
|
|
|
|
|
|
|
|
|
|
|
|
|
|
|
|
|
|
|
|
|
Securities borrowed |
|
$ |
594,674 |
|
|
$ |
— |
|
|
$ |
594,674 |
|
|
$ |
594,674 |
|
|
$ |
— |
|
|
Securities loaned |
|
$ |
595,717 |
|
|
$ |
— |
|
|
$ |
595,717 |
|
|
$ |
595,717 |
|
|
$ |
— |
|
|
|
|
(1) |
Includes financial instruments subject to enforceable master netting provisions that are permitted to be offset to the extent an event of default has occurred. |
|
(2) |
Includes the amount of cash collateral held/posted. |
Note 5. Acquisitions:
On September 1, 2015, the Company completed the purchase of MLV, an investment banking and brokerage firm focused on equity capital markets and a leading provider of ATM offerings. In addition, on August 4, 2014, the Company completed its purchase of a securities lending business from Lazard Capital Markets LLC (“LCM”).
The Company accounted for these acquisitions in accordance with ASC 805, “Business Combinations” (“ASC 805”), using the acquisition method of accounting which requires, among other things, that assets acquired and
F-25
liabilities assumed be recognized at their estimated fair values as of the acquisition date. The Company’s estimates of fair value included in the consolidated financial statements, in conformity with ASC 820, represent the Company’s best estimates and valuations. These estimates and underlying assumptions are inherently subject to significant uncertainties and contingencies beyond the control of the Company. Accordingly, the Company cannot provide assurance that the estimates, assumptions, and values reflected in its valuations will be realized, and actual results could vary materially.
MLV
As a result of this acquisition, the Company added approximately 20 client-facing employees, primarily in investment banking and research. Pursuant to the terms of the transaction agreement related to this acquisition, the Company made a cash payment of $3,250 to acquire 100% of the stock of MLV. The Company believes that this acquisition will be accretive to its overall revenue per employee and operating margin. As a result of this purchase, the Company recorded goodwill of $1,259 and finite-lived intangible assets of $506 related to acquired customer relationships. The goodwill and intangible asset balances are expected to be deductible for tax purposes. The Company incurred $691 of transaction costs related to this acquisition that are included in professional services expense in the consolidated statements of operations. The table below summarizes the estimates of the fair value of the assets acquired and liabilities assumed as of the acquisition date:
|
Purchase Price: |
|
|
|
|
|
Cash paid |
|
$ |
3,250 |
|
|
Fair Value of Assets Acquired: |
|
|
|
|
|
Cash |
|
|
975 |
|
|
Due from brokers, dealers and clearing organizations |
|
|
2,098 |
|
|
Investment banking receivables |
|
|
1,111 |
|
|
Other |
|
|
606 |
|
|
Total |
|
$ |
4,790 |
|
|
Fair Value of Liabilities Assumed: |
|
|
|
|
|
Accounts payable, accrued expenses and other liabilities |
|
$ |
3,305 |
|
|
|
|
|
|
|
|
Fair value of net assets acquired |
|
$ |
1,485 |
|
|
Purchase price allocated to goodwill |
|
|
1,259 |
|
|
Purchase price allocated to intangible assets |
|
|
506 |
|
|
Total purchase price |
|
$ |
3,250 |
|
Securities Lending
As a result of this acquisition, the Company has an active securities borrowed and loaned business in which it borrows securities from one party and lends them to another. The Company believes that this acquisition will be accretive to its overall revenue per employee and operating margin. The Company made an initial cash payment of $1,000 at closing and is obligated to make additional payments that are contingent on the performance of the business over the 18 month period subsequent to closing. As of December 31, 2014, the Company estimated these aggregate contingent payments to be $4,070 and included this in accounts payable, accrued expenses and other liabilities on the consolidated balance sheets. During the year ended December 31, 2015, the Company made contingent payments of $2,166. During 2015, based on changes in its forecasted results, the Company reduced the estimate of the aggregate remaining contingent payments by $637, which is included in dividends and other on the consolidated statements of operations, and as of December 31, 2015 has estimated its remaining obligation to be $1,267.
As a result of this purchase, the Company recorded goodwill of $2,570 and a finite-lived intangible asset related to acquired customer relationships of $2,500. The goodwill and intangible asset balances are expected to be deductible for tax purposes. The Company incurred $379 of transaction costs related to this acquisition that are
F-26
included in professional services expense in the consolidated statements of operations. The table below summarizes the preliminary estimates of contingent consideration, and the fair value of the assets acquired and liabilities assumed as of the acquisition date:
|
Purchase Price: |
|
|
|
|
|
Cash paid |
|
$ |
1,000 |
|
|
Estimated contingent consideration |
|
|
4,070 |
|
|
Total |
|
$ |
5,070 |
|
|
Fair Value of Assets Acquired: |
|
|
|
|
|
Securities borrowed |
|
|
675,709 |
|
|
Due from brokers, dealers and clearing organizations |
|
|
357 |
|
|
Total |
|
$ |
676,066 |
|
|
Fair Value of Liabilities Assumed: |
|
|
|
|
|
Securities loaned |
|
$ |
676,066 |
|
|
|
|
|
|
|
|
Purchase price allocated to goodwill |
|
$ |
2,570 |
|
|
Purchase price allocated to intangible assets |
|
|
2,500 |
|
|
Total purchase price |
|
$ |
5,070 |
|
Note 6. Goodwill and Intangible Assets:
Goodwill
The changes in the carrying amount of goodwill for the years ended December 31, 2015 and 2014 are as follows:
|
|
|
December 31, |
|
|||||
|
|
|
2015 |
|
|
2014 |
|
||
|
Balance as of January 1: |
|
|
|
|
|
|
|
|
|
Goodwill |
|
$ |
2,570 |
|
|
$ |
— |
|
|
Accumulated impairment losses |
|
|
— |
|
|
|
— |
|
|
|
|
|
2,570 |
|
|
|
— |
|
|
Goodwill acquired during year |
|
|
1,259 |
|
|
|
2,570 |
|
|
Impairment losses |
|
|
— |
|
|
|
— |
|
|
Balance as of December 31: |
|
|
|
|
|
|
|
|
|
Goodwill |
|
|
3,829 |
|
|
|
2,570 |
|
|
Accumulated impairment losses |
|
|
— |
|
|
|
— |
|
|
|
|
$ |
3,829 |
|
|
$ |
2,570 |
|
Goodwill is included in the Company’s capital markets segment. The Company performed its annual assessment of goodwill impairment during the third quarter of 2015. Based on the Company’s assessments, no impairment charges were recognized during the years ended December 31, 2015 and 2014.
Intangible Assets
The following table reflects the components of intangible assets as of the dates indicated:
|
|
|
December 31, |
|
|||||
|
|
|
2015 |
|
|
2014 |
|
||
|
Customer relationships |
|
$ |
3,006 |
|
|
$ |
2,500 |
|
|
Accumulated amortization |
|
|
(562 |
) |
|
|
(149 |
) |
|
Net |
|
$ |
2,444 |
|
|
$ |
2,351 |
|
F-27
The intangible asset balances are included in the Company’s capital markets segment. These intangible assets will be amortized over their estimated useful lives, of three to seven years, on a straight-line basis. For the years ended December 31, 2015, 2014 and 2013, amortization expense recognized was $413, $149 and $-0-, respectively. Estimated amortization expense for each of the next five years is as follows:
|
|
|
Amount |
|
|
|
2016 |
|
$ |
524 |
|
|
2017 |
|
|
524 |
|
|
2018 |
|
|
468 |
|
|
2019 |
|
|
357 |
|
|
2020 |
|
|
357 |
|
Note 7. Furniture, Equipment, Software and Leasehold Improvements:
Furniture, equipment, software and leasehold improvements, summarized by major classification, were:
|
|
|
December 31, |
|
|||||
|
|
|
2015 |
|
|
2014 |
|
||
|
Leasehold improvements |
|
$ |
16,250 |
|
|
$ |
17,340 |
|
|
Furniture and equipment |
|
|
11,206 |
|
|
|
10,776 |
|
|
Software |
|
|
6,845 |
|
|
|
7,303 |
|
|
|
|
|
34,301 |
|
|
|
35,419 |
|
|
Less: Accumulated depreciation and amortization |
|
|
(19,230 |
) |
|
|
(20,031 |
) |
|
|
|
$ |
15,071 |
|
|
$ |
15,388 |
|
For the years ended December 31, 2015, 2014 and 2013, depreciation expense was $2,899, $1,841, and $1,290, respectively. For the years ended December 31, 2015 and 2014, the Company incurred losses of $24 and $26, respectively, related to the write-off of retired fixed assets. For the year ended December 31, 2013, the Company did not incur any losses related to fixed assets.
Note 8. Income Taxes:
The provision (benefit) for income taxes consists of the following for the years ended December 31, 2015, 2014 and 2013:
|
|
|
2015 |
|
|
2014 |
|
|
2013 |
|
|||
|
Federal |
|
$ |
383 |
|
|
$ |
(2,030 |
) |
|
$ |
3,010 |
|
|
State and local |
|
|
168 |
|
|
|
126 |
|
|
|
317 |
|
|
|
|
$ |
551 |
|
|
$ |
(1,904 |
) |
|
$ |
3,327 |
|
|
|
|
|
|
|
|
|
|
|
|
|
|
|
|
Current |
|
$ |
551 |
|
|
$ |
(1,904 |
) |
|
$ |
3,327 |
|
|
Deferred |
|
|
(8,848 |
) |
|
|
2,245 |
|
|
|
(30,810 |
) |
|
|
|
$ |
(8,297 |
) |
|
$ |
341 |
|
|
$ |
(27,483 |
) |
F-28
Deferred tax assets and liabilities consisted of the following as of December 31, 2015 and 2014:
|
|
|
2015 |
|
|
2014 |
|
||
|
Deferred tax assets |
|
|
|
|
|
|
|
|
|
Net operating loss, domestic |
|
$ |
16,986 |
|
|
$ |
4,574 |
|
|
Stock-based and other compensation |
|
|
15,579 |
|
|
|
23,105 |
|
|
Unrealized losses on investment |
|
|
1,739 |
|
|
|
— |
|
|
AMT credit carryforward |
|
|
1,661 |
|
|
|
1,666 |
|
|
Deferred rent |
|
|
1,547 |
|
|
|
462 |
|
|
Partnership income |
|
|
1,027 |
|
|
|
— |
|
|
Capital loss carryforward |
|
|
344 |
|
|
|
5,383 |
|
|
Other, net |
|
|
226 |
|
|
|
461 |
|
|
Total deferred tax assets |
|
|
39,109 |
|
|
|
35,651 |
|
|
Deferred tax liabilities |
|
|
|
|
|
|
|
|
|
Partnership income |
|
|
— |
|
|
|
(2,077 |
) |
|
Deferred expenses |
|
|
(1,268 |
) |
|
|
(1,391 |
) |
|
Net deferred tax assets |
|
|
37,841 |
|
|
|
32,183 |
|
|
Valuation allowance |
|
|
(344 |
) |
|
|
(3,535 |
) |
|
Net deferred tax asset |
|
$ |
37,497 |
|
|
$ |
28,648 |
|
The Company evaluates the need for a valuation allowance against its deferred tax assets on a quarterly basis, based on the criteria in ASC 740, by assessing the positive and negative evidence to determine if it is more likely than not that some or all of the deferred tax assets will be realized. At December 31, 2014, the Company’s net deferred tax assets totaled $32,183 and were offset by a valuation allowance of $3,535. This valuation allowance related to capital loss carryforwards and was determined based on the Company’s conclusion that it was more likely than not that the benefits of these assets would not be realized in the future. At December 31, 2015, the Company’s net deferred tax assets totaled $37,841 and, based on its application of the guidance in ASC 740, were offset by a valuation allowance of $344. This valuation allowance related to state capital loss carryforwards. The Company will continue to assess the need to maintain a valuation allowance against its net deferred tax assets at each reporting date. Realization of the Company’s deferred tax assets will be dependent on the Company’s ability to generate future taxable income.
As of December 31, 2015, the Company has $32,513 of domestic federal net operating loss carryforwards. The Company has state and local net operating loss carryforwards of $8,626 on a tax-effected basis, excluding the federal tax benefit. The net operating losses include no tax benefit related to windfalls from the vesting of equity compensation. The state and local net operating loss carryforwards begin to expire in 2028.
As of December 31, 2015, the Company has no pre-tax capital loss carryforwards for federal tax purposes. As of December 31, 2015, the Company has pre-tax capital loss carryforwards for state tax purposes of $8,836 which will expire in 2017.
F-29
The Company’s effective tax rate for the years ended December 31, 2015, 2014 and 2013 was 52.7%, 2.0% and (48.0%), respectively. The provision for income taxes results in effective tax rates that differ from the federal statutory rates. The reconciliation of the Company’s reported amount of income tax provision (benefit) attributable to continuing operations to the amount of income tax expense that would result from applying domestic federal statutory tax rates to income from continuing operations was:
|
|
|
Year Ended December 31, |
|
|||||||||
|
|
|
2015 |
|
|
2014 |
|
|
2013 |
|
|||
|
Federal income tax provision, at statutory rate |
|
$ |
(5,515 |
) |
|
$ |
6,076 |
|
|
$ |
20,045 |
|
|
State and local income taxes benefit, net of federal benefit |
|
|
(907 |
) |
|
|
1,322 |
|
|
|
2,693 |
|
|
Nondeductible expenses |
|
|
295 |
|
|
|
281 |
|
|
|
7 |
|
|
Effect of stock-based compensation |
|
|
989 |
|
|
|
87 |
|
|
|
82 |
|
|
Other, net |
|
|
(363 |
) |
|
|
(622 |
) |
|
|
1,047 |
|
|
Uncertain tax positions |
|
|
— |
|
|
|
— |
|
|
|
— |
|
|
Valuation allowance |
|
|
(2,796 |
) |
|
|
(6,803 |
) |
|
|
(51,357 |
) |
|
Effective income tax (benefit) provision |
|
$ |
(8,297 |
) |
|
$ |
341 |
|
|
$ |
(27,483 |
) |
The Components of (loss) income before income taxes were as follows:
|
|
|
For the Year Ended December 31, |
|
|||||||||
|
|
|
2015 |
|
|
2014 |
|
|
2013 |
|
|||
|
United States |
|
$ |
(15,758 |
) |
|
$ |
17,360 |
|
|
$ |
57,368 |
|
|
United Kingdom |
|
|
— |
|
|
|
— |
|
|
|
(98 |
) |
|
|
|
$ |
(15,758 |
) |
|
$ |
17,360 |
|
|
$ |
57,270 |
|
As of December 31, 2015 and 2014, the Company had no liability for uncertain tax positions. The Company records interest and penalties in other operating expenses and other revenue respectively in the consolidated statements of operations. The Company did not recognize any interest related to tax uncertainties in the statements of operations for the years ended December 31, 2015 and 2014. The Company had no accrued interest related to uncertain tax positions as of December 31, 2015 and 2014.
The Internal Revenue Service has completed its examination of the Company’s tax return for 2010 and did not propose any adjustments. The Company is not currently under audit related to its federal tax returns. As of December 31, 2015, tax years subsequent to December 31, 2012 remain open under the federal statute of limitations and for the Company’s significant state jurisdictions. The Company is currently under audit in New York State for tax years 2011 through 2013.
Note 9. Regulatory Capital Requirements:
FBRCM and MLV are registered with the SEC and are members of FINRA. As such, each of FBRCM and MLV is subject to the minimum net capital requirements promulgated by the SEC. As of December 31, 2015 and 2014, FBRCM had net capital of $40,869 and $60,761, respectively, which was $38,793 and $56,994, respectively, in excess of its required net capital of $2,076 and $3,767, respectively. As of December 31, 2015, MLV had net capital of $663 which was $413 in excess of its required net capital of $250.
F-30
Note 10. Commitments and Contingencies:
Contractual Obligations
The Company has contractual obligations to make future payments in connection with non-cancelable lease agreements and other contractual commitments as well as uncalled capital commitments to investment partnerships that may be called over the next two years. The following table sets forth these contractual obligations by fiscal year:
|
|
|
2016 |
|
|
2017 |
|
|
2018 |
|
|
2019 |
|
|
2020 |
|
|
Thereafter |
|
|
Total |
|
|||||||
|
Minimum rental commitments |
|
$ |
5,508 |
|
|
$ |
4,767 |
|
|
$ |
3,846 |
|
|
$ |
3,406 |
|
|
$ |
3,488 |
|
|
$ |
17,583 |
|
|
$ |
38,598 |
|
These rental commitments are for operating leases of the Company. The Company currently has no commitments associated with capital leases. Equipment and office rent expense for the years ended December 31, 2015, 2014 and 2013 was $5,228, $5,351 and $5,353, respectively. The Company also has $212 of uncalled capital commitments to investment partnerships that may be called over the next two years. The Company cannot currently determine when, if ever, these capital commitments will be called.
Clearing Brokers
The Company’s broker-dealer subsidiaries clear all of their securities transactions through clearing brokers on a fully disclosed basis. Pursuant to the terms of the agreements between our broker-dealer subsidiaries and their respective clearing brokers, the clearing brokers have the right to charge our broker-dealer subsidiaries for losses that result from a counterparty’s failure to fulfill its contractual obligations.
As the right to charge our broker-dealer subsidiaries has no maximum amount and applies to all trades executed through the clearing brokers, the Company believes there is no maximum amount assignable to this right. At December 31, 2015 and 2014, the Company has recorded no liabilities, and during the years ended December 31, 2015, 2014 and 2013, the Company did not incur any significant costs with regard to this right.
Litigation
As of December 31, 2015, except as described below, the Company was neither a defendant nor plaintiff in any lawsuits or arbitrations nor involved in any governmental or self-regulatory organization matters that are expected to have a material adverse effect on its financial condition, results of operations, or liquidity. The Company has been named as a defendant in a small number of civil lawsuits relating to its various businesses. In addition, the Company is subject to various reviews, examinations, investigations and other inquiries by governmental agencies and self regulatory organizations. There can be no assurance that these matters individually or in aggregate will not have a material adverse effect on the Company’s financial condition, results of operations, or liquidity in a future period. However, based on management’s review with counsel, resolution of these matters is not expected to have a material adverse effect on the Company’s financial condition, results of operations or liquidity.
Many aspects of the Company’s business involve substantial risks of liability and litigation. Underwriters, broker-dealers and investment advisers are exposed to liability under federal and state securities laws, other federal and state laws and court decisions, including decisions with respect to underwriters’ liability and limitations on indemnification, as well as with respect to the handling of customer accounts. For example, underwriters may be held liable for material misstatements or omissions of fact in a prospectus used in connection with the securities being offered and broker-dealers may be held liable for statements made by their securities analysts or other personnel. In the past, FBRCM and MLV have been named as a defendant in a small number of securities claims involving their respective investment banking clients as a result of such broker-dealer’s role as an underwriter. In these cases, the underwriting agreement provides, subject to certain conditions, that the investment banking client is required to indemnify the underwriters against certain claims or liabilities, including claims or liabilities under the Securities Act of 1933, as amended (the “Securities Act”), or contribute to payments which the underwriters are required to make as a result of the litigation. There can be no assurance that such indemnification or contribution will ultimately be available to the Company or that an investment banking client will be able to satisfy its indemnity or contribution obligations when due.
F-31
FBRCM has been named a defendant in the putative class action lawsuit Waterford Township Police & Fire, Retirement System, vs. Regional Management Corp. et al., pending in the United States District Court for the Southern District of New York. The amended complaint, filed on November 24, 2014 (the “Amended Complaint”), names FBRCM as a co-managing underwriter of offerings in September 2013 and December 2013. Plaintiffs allege that the Registration Statement and Prospectus used in connection with these offerings were negligently prepared and, as a result, contained untrue statements of material fact and omitted to state other facts necessary to make the statements made not misleading. The Amended Complaint asserts claims against all the underwriters under Sections 11 and 12 of the Securities Act. Regional Management has agreed to indemnify all the underwriters, including FBRCM, pursuant to the operative underwriting agreement. In response to the defendants’ motions to dismiss, filed on January 23, 2015, the putative class plaintiffs filed a second amended complaint (the “Second Amended Complaint”), which shall serve as the operative complaint. The underwriter defendants have moved to dismiss the Second Amended Complaint and the briefing was completed in July 2015.
In November 2015, MLV was named a defendant in two putative class action lawsuits alleging substantially identical claims against the officers and directors and underwriters of Miller Energy Resources, Inc. (“Miller”). The lawsuits, styled Goldberg v. Miller et al., and Gaynor v. Miller et al., are currently pending in the United States District Court for the Eastern District of Tennessee, and allege claims under Sections 11 and 12 of the Securities Act against nine underwriters for alleged material misrepresentations and omissions in the registration statement and prospectuses issued in connection with 6 offerings (February 13, 2013; May 8, 2013; June 28, 2013; September 26; 2013; October 17, 2013 (as to MLV only) and August 21, 2014) with an alleged aggregate offering price of approximately $151,000. The plaintiffs seek unspecified compensatory damages and reimbursement of certain costs and expenses. Although MLV is contractually entitled to be indemnified by Miller in connection with this lawsuit, Miller filed for bankruptcy in October 2015 and this likely will decrease or eliminate the value of the indemnity that MLV receives from Miller. The plaintiffs are currently seeking to remand to Tennessee state court; defendants are vigorously opposing the remand.
In accordance with applicable accounting guidance, the Company establishes an accrued liability for litigation and regulatory matters when those matters present loss contingencies that are both probable and estimable. In such cases, there may be an exposure to loss in excess of any amounts accrued. When a loss contingency is not both probable and estimable, the Company does not establish an accrued liability. As a litigation or regulatory matter develops, management, in conjunction with counsel, evaluates on an ongoing basis whether such matter presents a loss contingency that is probable and estimable. The pending cases discussed above involving FBRCM and MLV are at a preliminary stage, and based on management’s review with counsel and present information known by management, a loss contingency for these matters was not probable and estimable as of December 31, 2015.
In certain circumstances, broker-dealers and asset managers may also be held liable by customers and clients for losses sustained on investments. In recent years, there has been an increasing incidence of litigation and actions by government agencies and self regulatory organizations involving the securities industry, including class actions that seek substantial damages. The Company is also subject to the risk of litigation, including litigation that may be without merit. As the Company intends to actively defend any such litigation, significant legal expenses could be incurred. An adverse resolution of any future litigation against the Company could materially affect its financial condition, operating results and liquidity.
Other
In February 2012, pursuant to a compensation plan, the Company granted certain employees an interest in a pool of assets valued at $3,000. The individual awards are subject to a 4-year cliff vesting requirement based on continued service. The terms of the compensation plan provide that any forfeited awards be reallocated to remaining award recipients and that the total value of the asset pool at the date of vesting be distributed. The specific assets in the pool may change over the vesting period and the Company may settle the awards in cash. The value of the asset pool was $3,849 as of December 31, 2015. During the years ended December 31, 2015, 2014 and 2013 the Company recorded expense of $896, $1,267 and $879, respectively, related to this plan. These amounts are included in compensation and benefits in the consolidated statements of operations.
F-32
Note 11. Shareholders’ Equity:
Share Repurchases
During the year ended December 31, 2015, the Company repurchased, in open market or privately negotiated transactions, 1,949,517 shares of its common stock at a weighted average share price of $23.20 per share for a total cost of $45,219. As of December 31, 2015, the Company had remaining authority to repurchase 624,123 additional shares. See Note 18 Subsequent Events for information regarding an increase to the Company’s share repurchase authorization.
During the year ended December 31, 2014, the Company repurchased 2,380,504 shares of its common stock at a weighted average share price of $26.92 per share for a total cost of $64,094. Included in these share repurchases were 1,178,607 shares repurchased in open market transactions at a weighted average share price of $25.76 per share for a total cost $30,362 and 1,201,897 shares repurchased pursuant to a modified “Dutch auction” tender offer at a weighted average share price of $28.06 per share and a total cost, including transaction costs, of $33,732.
During the year ended December 31, 2013, the Company repurchased 2,377,583 shares of its common stock in privately negotiated or open market transactions at a weighted average share price of $23.36 per share for a total cost of $55,541.
The Company also purchases shares of its common stock from recipients of stock-based compensation awards upon the vesting of RSU and restricted stock awards, and the exercise of options to purchase stock, as recipients sell shares to meet their tax obligations. During the years ended December 31, 2015, 2014 and 2013, the Company purchased 138,000 shares, 71,000 shares and 258,000, respectively, at weighted average prices per share of $22.56, $25.68 and $14.79, respectively, for a total cost of $3,113, $1,823 and $3,817, respectively.
Dividends
For the years ended December 31, 2015 and 2014, our Board of Directors has declared cash dividends on our common stock as summarized in the following table.
|
Date Declared |
|
Record Date |
|
Payable Date |
|
Dividends per Share |
|
|
|
October 20, 2015 |
|
November 2, 2015 |
|
November 27, 2015 |
|
$ |
0.20 |
|
|
June 16, 2015 |
|
July 31, 2015 |
|
August 28, 2015 |
|
$ |
0.20 |
|
See Note 18 Subsequent Events for information regarding dividends declared subsequent to the balance sheet date.
Unvested RSUs and restricted shares carry dividend rights in which dividends are payable as the RSUs and restricted shares vest in accordance with the respective underlying grants. As of December 31, 2015, the Company had $779 of dividends payable related to such unvested RSUs and restricted shares. With respect to RSUs that vest based on both individual service requirements and the Company’s achievement of specific performance goals, the Company’s dividend payable is consistent with the Company’s assessment of the rate at which these awards would vest.
FBR & Co. Employee Stock Purchase Plan
Under the Employee Stock Purchase Plan (“Purchase Plan”), eligible employees may purchase common stock through payroll deductions at a price that is 85% of the lower of the market value of the common stock on the first day of the offering period or the last day of the offering period. In accordance with the provisions of ASC 718, “Compensation – Stock Compensation” (“ASC 718”), the Company is required to recognize compensation expense relating to shares offered under the Purchase Plan. For the years ended December 31, 2015, 2014 and 2013, the Company recognized compensation expense of $177, $247 and $220, respectively, related to the Purchase Plan.
F-33
Stock Compensation Plans
FBR & Co. Amended 2006 Long-Term Incentive Plan (“FBR & Co. Long-Term Incentive Plan”)
Under the FBR & Co. Long-Term Incentive Plan, as amended, the Company may grant options to purchase stock, stock appreciation rights, performance awards, restricted and unrestricted stock and RSUs for up to an aggregate of 7,217,496 shares of common stock, subject to increase under certain provisions of the plan, to eligible participants. Participants include employees, officers and directors of the Company and its subsidiaries. The plan’s termination date is October 22, 2023 unless it is terminated sooner by the Company’s Board of Directors. The FBR & Co. Long-Term Incentive Plan has a term of 10 years and options granted may have an exercise period of up to 10 years. Options may be incentive stock options, as defined by Section 422 of the Internal Revenue Code, or nonqualified stock options.
The Company grants options to purchase stock, restricted shares of common stock and RSUs to employees that vest based on meeting specified service conditions of three to five years and in certain cases achievement of specified performance goals. The following table presents compensation expense related to these awards for the periods indicated:
|
|
|
Year Ended December 31, |
|
|||||||||
|
|
|
2015 |
|
|
2014 |
|
|
2013 |
|
|||
|
Stock options |
|
$ |
7 |
|
|
$ |
(44 |
) |
|
$ |
484 |
|
|
Restricted shares |
|
|
381 |
|
|
|
296 |
|
|
|
146 |
|
|
RSUs |
|
|
6,627 |
|
|
|
8,897 |
|
|
|
7,589 |
|
The following table presents the unrecognized compensation related to unvested restricted shares of common stock and RSUs and the weighted average vesting period in which the expense will be recognized:
|
|
|
As of December 31, 2015 |
|
|||||||||
|
|
|
Restricted Shares |
|
|
RSUs |
|
|
Performance Condition RSUs (1) |
|
|||
|
Unrecognized compensation |
|
$ |
244 |
|
|
$ |
2,244 |
|
|
$ |
431 |
|
|
Unvested awards |
|
|
22,191 |
|
|
|
1,060,492 |
|
|
|
375,000 |
|
|
Weighted average vesting period |
|
0.53 years |
|
|
0.29 years |
|
|
0.25 years |
|
|||
|
(1) |
The unvested performance condition RSUs and unrecognized compensation amounts specified are based on the Company’s assessment of the rate at which the performance conditions will be met and the related percentage of awards that will vest. The total unvested awards that include a performance condition and related unrecognized compensation and weighted average vesting period are 882,663, $12,525 and 1.0 year, respectively. This total compensation would only be recognized if all of the applicable awards with performance conditions vested at a 100% rate. |
F-34
Stock Options
A summary of option activity under the FBR & Co. Long Term Incentive Plan as of December 31, 2015, and changes during the years ended December 31, 2015, 2014 and 2013 are presented below:
|
|
|
Number of Shares |
|
|
Weighted-average Exercise Prices |
|
|
Weighted-average Remaining Contractual Life |
|
|||
|
Share Balance as of December 31, 2012 |
|
|
1,288,027 |
|
|
$ |
21.72 |
|
|
|
2.12 |
|
|
Granted |
|
|
— |
|
|
|
— |
|
|
|
|
|
|
Forfeitures/Expirations |
|
|
(102,802 |
) |
|
|
24.14 |
|
|
|
|
|
|
Option Exercised |
|
|
(118,422 |
) |
|
|
20.34 |
|
|
|
|
|
|
Share Balance as of December 31, 2013 |
|
|
1,066,803 |
|
|
$ |
21.63 |
|
|
|
0.13 |
|
|
Granted |
|
|
— |
|
|
|
— |
|
|
|
|
|
|
Forfeitures/Expirations |
|
|
(13,334 |
) |
|
|
22.44 |
|
|
|
|
|
|
Option Exercised |
|
|
(63,368 |
) |
|
|
16.87 |
|
|
|
|
|
|
Share Balance as of December 31, 2014 |
|
|
990,101 |
|
|
$ |
21.92 |
|
|
|
0.08 |
|
|
Granted |
|
|
— |
|
|
|
— |
|
|
|
|
|
|
Forfeitures/Expirations |
|
|
(80,651 |
) |
|
|
26.79 |
|
|
|
|
|
|
Option Exercised |
|
|
(448,657 |
) |
|
|
21.49 |
|
|
|
|
|
|
Share Balance as of December 31, 2015 |
|
|
460,793 |
|
|
$ |
21.49 |
|
|
|
1.99 |
|
|
Options Exercisable as of December 31, 2015 |
|
|
460,793 |
|
|
$ |
21.49 |
|
|
|
1.99 |
|
The Company did not grant any options during the years ended December 2015, 2014 and 2013.
Restricted Stock
A summary of unvested restricted stock awards as of December 31, 2015, and changes during the years ended December 31, 2015, 2014 and 2013 are presented below:
|
|
|
Number of Shares |
|
|
Weighted-average Grant-date Fair Value |
|
|
Weighted-average Remaining Vested Period |
|
|||
|
Share Balance as of December 31, 2012 |
|
|
6,252 |
|
|
$ |
25.04 |
|
|
|
0.15 |
|
|
Granted |
|
|
10,421 |
|
|
|
24.23 |
|
|
|
0.43 |
|
|
Vestings |
|
|
(6,252 |
) |
|
|
26.13 |
|
|
|
|
|
|
Forfeitures |
|
|
— |
|
|
|
— |
|
|
|
|
|
|
Share Balance as of December 31, 2013 |
|
|
10,421 |
|
|
$ |
24.23 |
|
|
|
0.43 |
|
|
Granted |
|
|
12,218 |
|
|
|
26.19 |
|
|
|
0.42 |
|
|
Vestings |
|
|
(10,421 |
) |
|
|
24.23 |
|
|
|
|
|
|
Forfeitures |
|
|
— |
|
|
|
— |
|
|
|
|
|
|
Share Balance as of December 31, 2014 |
|
|
12,218 |
|
|
$ |
26.19 |
|
|
|
0.42 |
|
|
Granted |
|
|
22,191 |
|
|
|
22.02 |
|
|
|
0.53 |
|
|
Vestings |
|
|
(12,218 |
) |
|
|
26.19 |
|
|
|
|
|
|
Forfeitures |
|
|
— |
|
|
|
— |
|
|
|
|
|
|
Share Balance as of December 31, 2015 |
|
|
22,191 |
|
|
|
22.02 |
|
|
|
0.53 |
|
F-35
RSUs
A summary of unvested restricted stock units as of December 31, 2015, and changes during the years ended December 31, 2015, 2014 and 2013 are presented below:
|
|
|
Number of Shares |
|
|
Weighted-average Grant-date Fair Value |
|
|
Weighted-average Remaining Vested Period |
|
|||
|
Share Balance as of December 31, 2012 |
|
|
1,667,411 |
|
|
$ |
15.72 |
|
|
|
2.10 |
|
|
Granted |
|
|
827,562 |
|
|
|
18.94 |
|
|
|
|
|
|
Vestings |
|
|
(501,307 |
) |
|
|
22.11 |
|
|
|
|
|
|
Forfeitures |
|
|
(90,332 |
) |
|
|
14.58 |
|
|
|
|
|
|
Share Balance as of December 31, 2013 |
|
|
1,903,334 |
|
|
$ |
15.69 |
|
|
|
1.88 |
|
|
Granted |
|
|
374,939 |
|
|
|
24.71 |
|
|
|
|
|
|
Vestings |
|
|
(162,993 |
) |
|
|
18.81 |
|
|
|
|
|
|
Forfeitures |
|
|
(126,368 |
) |
|
|
16.82 |
|
|
|
|
|
|
Share Balance as of December 31, 2014 |
|
|
1,988,912 |
|
|
$ |
17.06 |
|
|
|
1.17 |
|
|
Granted |
|
|
372,547 |
|
|
|
23.44 |
|
|
|
|
|
|
Vestings |
|
|
(328,415 |
) |
|
|
17.29 |
|
|
|
|
|
|
Forfeitures |
|
|
(89,889 |
) |
|
|
19.03 |
|
|
|
|
|
|
Share Balance as of December 31, 2015 |
|
|
1,943,155 |
|
|
$ |
18.06 |
|
|
|
0.62 |
|
Included in the RSUs granted during the year ended December 31, 2015 are 230,258 RSU awards that will vest based on both individual service requirements and the achievement of a specified performance goal. In order for the performance goal to be met at a minimum level and for the awards to vest at a 50% rate, the tangible book value of FBR & Co., measured on a per share basis, must increase by an amount equal to a 6% compound annual growth rate over the three-year period beginning on January 1, 2015 (the “2015 performance period”). The awards will vest at a 100% level if FBR & Co. achieves a 9% annual growth rate over the 2015 performance period and the awards will vest at a proportionate rate at annual growth rates between 6% and 9%. During the year ended December 31, 2015, no compensation was recognized for these awards based on the Company’s assessment that the minimum performance threshold will not be met.
There were 277,405 RSUs granted during the year ended December 31, 2014 that will vest based on both individual service requirements and the achievement of a specified performance goal (“2014 performance condition RSUs”). Additionally, there were 375,000 RSUs granted during the year ended December 31, 2013 that will vest based on both individual service requirements and the achievement of a specified performance goal (“2013 performance condition RSUs”). During the year ended December 31, 2015, for the 2014 performance condition RSUs the Company recognized compensation based on its assessment that the minimum performance threshold will not be met, and for the 2013 performance condition RSUs the Company recognized compensation based on its assessment that the performance threshold will be met at a 100% vesting level.
F-36
Deferred Compensation Awards
In addition, as part of the Company’s satisfaction of incentive compensation earned for past service under the Company’s variable compensation programs, employees may receive restricted shares of common stock or RSUs in lieu of cash payments. These shares and RSUs are issued to an irrevocable trust for the benefit of the employees and are not returnable to the Company. For the years ended December 31, 2015, 2014 and 2013, the Company granted such stock-based awards with an aggregate fair value upon grant date of $630, $7,317 and $2,099, respectively. A summary of restricted stock irrevocable trust awards as of December 31, 2015, and changes during the years ended December 31, 2015, 2014 and 2013 are presented below:
|
|
|
Number of Shares |
|
|
Weighted-average Grant-date Fair Value |
|
|
Weighted-average Remaining Vested Period |
|
|||
|
Share Balance as of December 31, 2012 |
|
|
5,901 |
|
|
$ |
19.60 |
|
|
|
0.64 |
|
|
Granted |
|
|
— |
|
|
|
— |
|
|
|
|
|
|
Vestings |
|
|
(4,399 |
) |
|
|
16.15 |
|
|
|
|
|
|
Share Balance as of December 31, 2013 |
|
|
1,502 |
|
|
$ |
13.51 |
|
|
|
0.46 |
|
|
Granted |
|
|
— |
|
|
|
— |
|
|
|
|
|
|
Vestings |
|
|
(1,225 |
) |
|
|
14.40 |
|
|
|
|
|
|
Share Balance as of December 31, 2014 |
|
|
277 |
|
|
$ |
9.56 |
|
|
|
1.10 |
|
|
Granted |
|
|
— |
|
|
|
— |
|
|
|
|
|
|
Vestings |
|
|
— |
|
|
|
— |
|
|
|
|
|
|
Share Balance as of December 31, 2015 |
|
|
277 |
|
|
$ |
9.56 |
|
|
|
0.11 |
|
A summary of restricted stock unit awards held in the irrevocable trust as of December 31, 2015, and changes during the years ended December 31, 2015, 2014 and 2013 are presented below:
|
|
|
Number of Shares |
|
|
Weighted-average Grant-date Fair Value |
|
|
Weighted-average Remaining Vested Period |
|
|||
|
Share Balance as of December 31, 2012 |
|
|
185,340 |
|
|
$ |
18.68 |
|
|
|
1.48 |
|
|
Granted |
|
|
127,977 |
|
|
|
16.40 |
|
|
|
|
|
|
Vestings |
|
|
(77,953 |
) |
|
|
19.45 |
|
|
|
|
|
|
Share Balance as of December 31, 2013 |
|
|
235,364 |
|
|
$ |
18.09 |
|
|
|
1.92 |
|
|
Granted |
|
|
294,843 |
|
|
|
24.82 |
|
|
|
|
|
|
Vestings |
|
|
(34,737 |
) |
|
|
15.43 |
|
|
|
|
|
|
Share Balance as of December 31, 2014 |
|
|
495,470 |
|
|
$ |
20.79 |
|
|
|
1.68 |
|
|
Granted |
|
|
26,549 |
|
|
|
23.73 |
|
|
|
|
|
|
Vestings |
|
|
(5,470 |
) |
|
|
9.56 |
|
|
|
|
|
|
Share Balance as of December 31, 2015 |
|
|
516,549 |
|
|
$ |
21.10 |
|
|
|
0.79 |
|
F-37
Note 12. Net (Loss) Income Per Share:
Basic earnings per share includes no dilution and is computed by dividing net income or loss available to common shareholders by the weighted average number of common shares outstanding for the period, including RSUs that are not subject to forfeiture. Diluted earnings per share includes the impact of dilutive securities such as stock options, and unvested shares of restricted stock and RSUs that are subject to forfeiture. The following table presents the computations of basic and diluted earnings per share for the periods indicated:
|
|
|
Year Ended |
|
|
Year Ended |
|
|
Year Ended |
|
|||||||||||||||
|
|
|
December 31, 2015 |
|
|
December 31, 2014 |
|
|
December 31, 2013 |
|
|||||||||||||||
|
|
|
Basic |
|
|
Diluted |
|
|
Basic |
|
|
Diluted |
|
|
Basic |
|
|
Diluted |
|
||||||
|
Weighted average shares outstanding: |
|
|
|
|
|
|
|
|
|
|
|
|
|
|
|
|
|
|
|
|
|
|
|
|
|
Common stock (in thousands) |
|
|
8,069 |
|
|
|
8,069 |
|
|
|
10,283 |
|
|
|
10,283 |
|
|
|
11,963 |
|
|
|
11,963 |
|
|
Stock options, unvested restricted stock and RSUs (in thousands) |
|
|
— |
|
|
|
— |
|
|
|
— |
|
|
|
1,182 |
|
|
|
— |
|
|
|
997 |
|
|
Weighted average common and common equivalent shares outstanding (in thousands) |
|
|
8,069 |
|
|
|
8,069 |
|
|
|
10,283 |
|
|
|
11,465 |
|
|
|
11,963 |
|
|
|
12,960 |
|
|
Net (loss) income applicable to common stock |
|
$ |
(7,461 |
) |
|
$ |
(7,461 |
) |
|
$ |
17,019 |
|
|
$ |
17,019 |
|
|
$ |
92,912 |
|
|
$ |
92,912 |
|
|
Net (loss) income per common share |
|
$ |
(0.92 |
) |
|
$ |
(0.92 |
) |
|
$ |
1.66 |
|
|
$ |
1.48 |
|
|
$ |
7.77 |
|
|
$ |
7.17 |
|
The following table presents the number of antidilutive stock options, unvested restricted stock and RSUs outstanding for the periods indicated (in thousands):
|
|
|
Year Ended December 31, |
|
|||||||||
|
|
|
2015 |
|
|
2014 |
|
|
2013 |
|
|||
|
Stock Options—Employees and directors |
|
|
461 |
|
|
|
731 |
|
|
|
840 |
|
|
Stock Options—Non-employee |
|
|
32 |
|
|
|
27 |
|
|
|
32 |
|
|
Restricted Stock, unvested |
|
|
22 |
|
|
|
12 |
|
|
|
8 |
|
|
Restricted Stock Units, unvested |
|
|
1,943 |
|
|
|
1,074 |
|
|
|
1,136 |
|
|
Total |
|
|
2,458 |
|
|
|
1,844 |
|
|
|
2,016 |
|
Note 13. Financial Instruments with Off-Balance-Sheet Risk and Credit Risk:
Financial Instruments
The Company’s trading and investment activities include equity securities, convertible debt securities, corporate debt securities, bank loans, and listed equity options that are primarily traded in United States markets. The Company also invests in non-registered investment funds that trade and invest in public and non-public debt and equity securities. As of December 31, 2015 and 2014, the Company had not entered into any transactions involving financial instruments that would expose the Company to significant related off-balance-sheet risk.
In addition, as part of its market making activities, the Company sells equity and debt securities it does not currently own (financial instruments sold, not yet purchased—see Note 3 Financial Instruments). When the Company sells a security short and borrows the security to make a delivery, a gain, limited to the price at which the Company sold the security short, or a loss, unlimited in size, will be realized upon the termination of the short sale.
F-38
Market Risk
The securities industry is subject to numerous risks, including the risk of loss associated with the underwriting, ownership, and trading of securities, and the risk of reduced revenues in periods of reduced demand for security offerings and activity in secondary trading markets. Changing economic and market trends may negatively impact the liquidity and value of the Company’s investments and the level of security offerings underwritten by the Company, which may adversely affect the Company’s revenues and profitability.
Market risk is primarily caused by movements in market prices of the Company’s trading and investment securities and changes in value of the underlying securities of the investment funds in which the Company invests. The Company’s trading securities and investments are also subject to interest rate volatility and possible illiquidity in markets in which the Company trades or invests. The Company seeks to manage market risk through monitoring procedures. The Company’s principal transactions are primarily long and short equity and convertible debt transactions.
Positions taken and commitments made by the Company, including those made in connection with investment banking activities, may result in substantial amounts of exposure to individual issuers and businesses, including non-investment grade issuers, securities with low trading volumes and those not readily marketable. These issuers and securities may expose the Company to a higher degree of risk than associated with investment grade instruments.
Credit Risk
The Company’s broker-dealer subsidiaries clear all of their securities transactions through clearing brokers on a fully disclosed basis. Pursuant to the terms of the agreements between the Company’s broker-dealer subsidiaries and their clearing brokers, the clearing brokers have the right to charge the Company for losses that result from a counterparty’s failure to fulfill its contractual obligations. As the right to charge our broker-dealer subsidiaries has no maximum amount and applies to all trades executed through the clearing brokers, the Company believes there is no maximum amount assignable to this right. At December 31, 2015 and 2014, the Company has recorded no liabilities, and during the years ended December 31, 2015, 2014 and 2013, the Company did not incur any significant costs, with regard to this right. In addition, the Company has the right to pursue collection from the counterparties who do not perform under their contractual obligations. The Company monitors the credit standing of the clearing brokers and all counterparties with which it conducts business. The Company attempts to limit its credit spread risk by offsetting long or short positions in various related securities.
Through indemnification provisions in agreements with clearing organizations, customer activities may expose the Company to off-balance-sheet credit risk. Financial instruments may have to be purchased or sold at prevailing market prices in the event a customer fails to settle a trade on its original terms or in the event cash and securities in customer margin accounts are not sufficient to fully cover customer obligations. The Company seeks to manage the risks associated with customer activities through customer screening and selection procedures as well as through requirements on customers to maintain margin collateral in compliance with various regulations and clearing organization policies.
Credit risk from the Company’s securities lending operations arises if a lender or borrower defaults on an outstanding securities loan or borrow transaction and the cash or securities the Company is holding is insufficient to cover the amount they owe the Company for that receivable. The Company assigns credit limits and collateral posting thresholds for each counterparty and these limits and thresholds are reviewed periodically.
The Company’s equity and debt securities held for trading and investment purposes include non-investment grade securities of privately held issuers with no ready markets. The concentration and illiquidity of these investments expose the Company to a higher degree of risk than associated with readily marketable securities.
F-39
Note 14. Related-Party Transactions:
From time to time the Company may provide interest bearing loans to employees, generally in connection with employee recruitment, that are typically short term in nature and repaid from incentive compensation earned by the employee.
In connection with the MLV acquisition, during 2015 the Company made full-recourse employee loans that can be forgiven based on continued employment and performance over the next five years. Such employee loans will be forgiven and amortized to compensation and benefits expense based on a combination of continued employment and achievement of performance goals over the five-year term. As of December 31, 2015 and 2014 there was $3,485 and $143, respectively, of outstanding employee loans included in other receivables on the consolidated balance sheets.
Professional Services Agreement
During the year ended December 31, 2013, under a professional services agreement, as amended, with Crestview Partners, L.P. (“Crestview”), a party that prior to 2014 had designated for election two members of the Company’s Board of Directors, the Company agreed to pay Crestview Advisors, L.L.C. a $1,000 annual strategic advisory fee plus reimbursement of reasonable out-of-pocket expenses as long as Crestview continued to own at least 50% of the shares purchased by certain Crestview affiliates in our 2006 private offering. In June 2010, the Company and Crestview agreed to amend the professional services agreement to allow Crestview the ability to elect to receive a portion of their fee in restricted stock and/or options to purchase shares of the Company’s common stock. If elected, stock options would be issued with a strike price equal to the prevailing market price per share as of the grant date and with an expiration of 4 years. Based on Crestview’s election, in June 2013, the Company issued 32,432, such options to Crestview Advisors, L.L.C. valued at issuance at $270. The remainder of the annual strategic advisory fee was paid in cash. During the year ended December 31, 2013, the Company recognized $905 of expense associated with this agreement.
Other
During the third quarter of 2013, Crestview exercised options to purchase 54,369 shares of the Company’s common stock at an average price of $15.85 per share at an aggregate cost of $862. The Company subsequently repurchased those 54,369 shares and 670,631 other shares from Crestview at $26.25 per share at a total cost of $19,031.
During the fourth quarter of 2013, Crestview exercised options to purchase 87,332 shares of the Company’s common stock at an average price of $12.02 per share at an aggregate cost of $1,050. The Company subsequently repurchased those 87,332 shares and 649,449 other shares from Crestview at $25.75 per share at a total cost of $18,974. Subsequent to these share repurchases, Crestview no longer holds any shares of the Company’s common stock and the Company no longer has any obligations under the Professional Services Agreement with Crestview discussed above.
Note 15. Employee Benefits:
Employees of the Company are eligible to participate in the FBR & Co 401(k) Plan (the “401(k) Plan”), a defined contribution plan sponsored by FBR & Co. Participants may contribute to the Plan up to the limits set by the United States Internal Revenue Service. The Company may make discretionary contributions to the 401(k) Plan for the benefit of eligible employees contingent upon achieving certain annual Company goals. Employee contributions and discretionary Company matches paid by the Company are 100% vested when made. During the year ended December 31, 2014, the Company contributed $717 to the 401(k) Plan for the benefit of eligible employees. The Company did not make any comparable contributions during each of the years ended December 31, 2015 and 2013.
F-40
Note 16. Discontinued Operations:
The Company completed the sale of the FBR Funds, a family of mutual funds, in October 2012. Subsequent to the sale closing, the Company has had no continuing involvement in the management of these funds. As a result of this sale transaction, the Company reports the results of its former asset management operations as discontinued operations. As described below, the Company received the final proceeds from this sale in 2013, and accordingly has no activity related to discontinued operations in 2015 or 2014. The results related to the former asset management operations reflected in the consolidated statements of operations are presented in the following table.
|
|
|
Year Ended December 31, |
|
|
|
|
|
2013 |
|
|
|
Revenues |
|
$ |
— |
|
|
Gain on sale of assets |
|
|
8,944 |
|
|
Expenses |
|
|
170 |
|
|
Income from discontinued operations before income taxes |
|
|
8,774 |
|
|
Income tax provision |
|
|
615 |
|
|
Income from discontinued operations, net of taxes |
|
$ |
8,159 |
|
During the years ended December 31, 2015 and 2014, the Company did not generate any income from discontinued operations. For the year ended December 31, 2013, the Company received $19,294, representing its receipt of the final payment due from the sale of the FBR Funds, and generated $8,159 of net income from discontinued operations. The Company’s 2013 net income from discontinued operations reflects the change in value during the year of the contingent payment that was due from this sale and recorded as a receivable at December 31, 2012. The increase in value during 2013 was due primarily to market appreciation of the funds during the period subsequent to the sale. The tax provision recognized in 2013 relates primarily to state taxes on income that could not be offset by either net operating loss or capital loss carryforwards.
Note 17. Segment Information:
The Company considers its capital markets and principal investing operations to be separate reportable segments. The capital markets segment includes the Company’s investment banking and institutional sales, trading and research operations. These businesses operate as a single integrated unit to deliver capital raising, advisory and sales and trading services to corporate and institutional clients. Principal investing includes investments in investment funds, merchant banking and other equity investments, and corporate debt investments.
The Company has developed systems and methodologies to allocate overhead costs to its business units and, accordingly, presents segment information consistent with internal management reporting. Revenue generating transactions between the individual segments have been included in the net revenue and pre-tax income of each segment.
The decrease in the principal investing segment’s total assets as of December 31, 2015 compared to December 31, 2014 was a result of investing activities during the year ended December 31, 2015, in particular the settlement of a short-sale of a $75,000 face value, 7.25% U.S. Treasury security that was outstanding at December 31, 2014, and net reductions to the Company’s investment fund positions and other securities. The increase in the capital markets segment’s total assets as of December 31, 2014 compared to December 31, 2013 that is specified in the tables below was due primarily to the purchase of a securities lending business resulting in an increase in securities borrowed, an asset, of $594,674 which was offset by securities loaned, a liability, of $595,717 (see Note 4 Securities Lending). The increase in the principal investing segment’s total assets as of December 31, 2014 compared to December 31, 2013 was a result of investing activities during the year ended December 31, 2014, in particular a short-sale of a $75,000 face value, 7.25% U.S. Treasury security that was outstanding at December 31, 2014, and net additions to the Company’s long positions in investment funds and other securities.
F-41
The following tables illustrate the financial information for the Company’s segments for the periods indicated:
|
|
|
Year Ended December 31, 2015 |
|
|||||||||
|
|
|
Capital Markets |
|
|
Principal Investing |
|
|
Total |
|
|||
|
Revenues, net of interest expense: |
|
|
|
|
|
|
|
|
|
|
|
|
|
Investment banking |
|
$ |
71,091 |
|
|
$ |
— |
|
|
$ |
71,091 |
|
|
Institutional brokerage |
|
|
45,442 |
|
|
|
— |
|
|
|
45,442 |
|
|
Net investment income |
|
|
— |
|
|
|
5,433 |
|
|
|
5,433 |
|
|
Interest |
|
|
31,745 |
|
|
|
29 |
|
|
|
31,774 |
|
|
Dividends and other |
|
|
1,103 |
|
|
|
589 |
|
|
|
1,692 |
|
|
Total revenues |
|
|
149,381 |
|
|
|
6,051 |
|
|
|
155,432 |
|
|
Interest expense |
|
|
23,877 |
|
|
|
11,160 |
|
|
|
35,037 |
|
|
Revenues, net of interest expense |
|
|
125,504 |
|
|
|
(5,109 |
) |
|
|
120,395 |
|
|
Operating expenses: |
|
|
|
|
|
|
|
|
|
|
|
|
|
Variable |
|
|
35,651 |
|
|
|
37 |
|
|
|
35,688 |
|
|
Fixed |
|
|
98,331 |
|
|
|
2,134 |
|
|
|
100,465 |
|
|
Total |
|
|
133,982 |
|
|
|
2,171 |
|
|
|
136,153 |
|
|
Pre-tax loss |
|
$ |
(8,478 |
) |
|
$ |
(7,280 |
) |
|
$ |
(15,758 |
) |
|
Compensation and benefits: |
|
|
|
|
|
|
|
|
|
|
|
|
|
Variable |
|
$ |
18,889 |
|
|
$ |
— |
|
|
$ |
18,889 |
|
|
Fixed |
|
|
57,165 |
|
|
|
1,409 |
|
|
|
58,574 |
|
|
Total |
|
$ |
76,054 |
|
|
$ |
1,409 |
|
|
$ |
77,463 |
|
|
Total assets |
|
$ |
834,205 |
|
|
$ |
99,211 |
|
|
$ |
933,416 |
|
|
|
|
Year Ended December 31, 2014 |
|
|||||||||
|
|
|
Capital Markets |
|
|
Principal Investing |
|
|
Total |
|
|||
|
Revenues, net of interest expense: |
|
|
|
|
|
|
|
|
|
|
|
|
|
Investment banking |
|
$ |
115,255 |
|
|
$ |
— |
|
|
$ |
115,255 |
|
|
Institutional brokerage |
|
|
56,182 |
|
|
|
— |
|
|
|
56,182 |
|
|
Net investment income |
|
|
— |
|
|
|
17,774 |
|
|
|
17,774 |
|
|
Interest |
|
|
12,945 |
|
|
|
122 |
|
|
|
13,067 |
|
|
Dividends and other |
|
|
549 |
|
|
|
481 |
|
|
|
1,030 |
|
|
Total revenues |
|
|
184,931 |
|
|
|
18,377 |
|
|
|
203,308 |
|
|
Interest expense |
|
|
9,505 |
|
|
|
11,678 |
|
|
|
21,183 |
|
|
Revenues, net of interest expense |
|
|
175,426 |
|
|
|
6,699 |
|
|
|
182,125 |
|
|
Operating expenses: |
|
|
|
|
|
|
|
|
|
|
|
|
|
Variable |
|
|
59,500 |
|
|
|
316 |
|
|
|
59,816 |
|
|
Fixed |
|
|
102,426 |
|
|
|
2,523 |
|
|
|
104,949 |
|
|
Total |
|
|
161,926 |
|
|
|
2,839 |
|
|
|
164,765 |
|
|
Pre-tax income |
|
$ |
13,500 |
|
|
$ |
3,860 |
|
|
$ |
17,360 |
|
|
Compensation and benefits: |
|
|
|
|
|
|
|
|
|
|
|
|
|
Variable |
|
$ |
42,408 |
|
|
$ |
305 |
|
|
$ |
42,713 |
|
|
Fixed |
|
|
59,639 |
|
|
|
1,459 |
|
|
|
61,098 |
|
|
Total |
|
$ |
102,047 |
|
|
$ |
1,764 |
|
|
$ |
103,811 |
|
|
Total assets |
|
$ |
830,938 |
|
|
$ |
204,159 |
|
|
$ |
1,035,097 |
|
F-42
|
|
|
Year Ended December 31, 2013 |
|
|||||||||
|
|
|
Capital Markets |
|
|
Principal Investing |
|
|
Total |
|
|||
|
Revenues, net of interest expense: |
|
|
|
|
|
|
|
|
|
|
|
|
|
Investment banking |
|
$ |
196,213 |
|
|
$ |
— |
|
|
$ |
196,213 |
|
|
Institutional brokerage |
|
|
53,738 |
|
|
|
— |
|
|
|
53,738 |
|
|
Net investment income |
|
|
— |
|
|
|
6,920 |
|
|
|
6,920 |
|
|
Interest |
|
|
1,050 |
|
|
|
740 |
|
|
|
1,790 |
|
|
Dividends and other |
|
|
432 |
|
|
|
728 |
|
|
|
1,160 |
|
|
Total revenues |
|
|
251,433 |
|
|
|
8,388 |
|
|
|
259,821 |
|
|
Interest expense |
|
|
— |
|
|
|
— |
|
|
|
— |
|
|
Revenues, net of interest expense |
|
|
251,433 |
|
|
|
8,388 |
|
|
|
259,821 |
|
|
Operating expenses: |
|
|
|
|
|
|
|
|
|
|
|
|
|
Variable |
|
|
103,755 |
|
|
|
1,179 |
|
|
|
104,934 |
|
|
Fixed |
|
|
96,121 |
|
|
|
1,496 |
|
|
|
97,617 |
|
|
Total |
|
|
199,876 |
|
|
|
2,675 |
|
|
|
202,551 |
|
|
Pre-tax income |
|
$ |
51,557 |
|
|
$ |
5,713 |
|
|
$ |
57,270 |
|
|
Compensation and benefits: |
|
|
|
|
|
|
|
|
|
|
|
|
|
Variable |
|
$ |
89,574 |
|
|
$ |
1,172 |
|
|
$ |
90,746 |
|
|
Fixed |
|
|
53,013 |
|
|
|
961 |
|
|
|
53,974 |
|
|
Total |
|
$ |
142,587 |
|
|
$ |
2,133 |
|
|
$ |
144,720 |
|
|
Total assets |
|
$ |
308,870 |
|
|
$ |
101,702 |
|
|
$ |
410,572 |
|
During the first quarter of 2016, based on changes in the Company’s business profile since its IPO in 2007, including significant changes in capital allocation and revenue mix that have occurred over that time, the Company will revise its segment reporting structure. Beginning with the first quarter of 2016, the Company’s investment activities will be included within its capital markets segment and not as a separate reportable segment. This change is consistent with how the Company’s chief operating decision maker evaluates performance and allocates resources.
Note 18. Subsequent Events:
Share Repurchase Program
On February 10, 2016, the Company’s Board of Directors approved an increase in the Company’s repurchase authorization to an aggregate of 1,000,000 shares.
Dividend Declaration
On February 10, 2016, the Company’s Board of Directors declared a quarterly cash dividend of $0.20 per common share to be paid on March 4, 2016 to shareholders of record as of the close of business on February 22, 2016.
F-43
Note 19. Quarterly Data (Unaudited):
The following tables set forth selected information for each of the fiscal quarters during the years ended December 31, 2015 and 2014. The selected quarterly data is derived from unaudited financial statements of the Company and has been prepared on the same basis as the annual, audited financial statements to include, in the opinion of management, all adjustments (consisting of only normal recurring adjustments) necessary for fair statement of the results for such periods:
Note: The sum of quarterly earnings per share amounts may not equal full year earnings per share amounts due to differing average outstanding shares amounts for the respective periods.
|
|
|
Revenues, net of interest expense |
|
|
Net (loss) income before income taxes |
|
|
Net (loss) income |
|
|
Basic (loss) earnings per share |
|
|
Diluted (loss) earnings per share |
|
|
|||||
|
2015 |
|
|
|
|
|
|
|
|
|
|
|
|
|
|
|
|
|
|
|
|
|
|
First Quarter |
|
$ |
27,095 |
|
|
$ |
(3,843 |
) |
|
$ |
(2,522 |
) |
|
$ |
(0.29 |
) |
|
$ |
(0.29 |
) |
|
|
Second Quarter |
|
|
44,256 |
|
|
|
4,398 |
|
|
|
2,899 |
|
|
|
0.36 |
|
|
|
0.32 |
|
|
|
Third Quarter |
|
|
25,580 |
|
|
|
(6,309 |
) |
|
|
(3,428 |
) |
|
|
(0.43 |
) |
|
|
(0.43 |
) |
|
|
Fourth Quarter |
|
|
23,464 |
|
|
|
(10,004 |
) |
|
|
(4,410 |
) |
|
|
(0.59 |
) |
|
|
(0.59 |
) |
|
|
Total Year |
|
$ |
120,395 |
|
|
$ |
(15,758 |
) |
|
$ |
(7,461 |
) |
|
$ |
(0.92 |
) |
|
$ |
(0.92 |
) |
|
|
2014 |
|
|
|
|
|
|
|
|
|
|
|
|
|
|
|
|
|
|
|
|
|
|
First Quarter |
|
$ |
54,358 |
|
|
$ |
9,015 |
|
|
$ |
5,610 |
|
|
$ |
0.51 |
|
|
$ |
0.46 |
|
|
|
Second Quarter |
|
|
57,098 |
|
|
|
8,975 |
|
|
|
6,976 |
|
|
|
0.65 |
|
|
|
0.58 |
|
|
|
Third Quarter |
|
|
42,097 |
|
|
|
3,308 |
|
|
|
3,501 |
|
|
|
0.34 |
|
|
|
0.31 |
|
|
|
Fourth Quarter |
|
|
28,572 |
|
|
|
(3,938 |
) |
|
|
932 |
|
|
|
0.10 |
|
|
|
0.09 |
|
|
|
Total Year |
|
$ |
182,125 |
|
|
$ |
17,360 |
|
|
$ |
17,019 |
|
|
$ |
1.66 |
|
|
$ |
1.48 |
|
|
F-44