Attached files
| file | filename |
|---|---|
| EX-23.1 - EX-23.1 - AROTECH CORP | ex23-1.htm |
| EX-31.2 - EX-31.2 - AROTECH CORP | ex31-2.htm |
| EX-32.1 - EX-32.1 - AROTECH CORP | ex32-1.htm |
| EX-31.1 - EX-31.1 - AROTECH CORP | ex31-1.htm |
| EX-32.2 - EX-32.2 - AROTECH CORP | ex32-2.htm |
|
UNITED STATES
SECURITIES AND EXCHANGE COMMISSION
Washington, D.C. 20549
|
OMB APPROVAL
|
|||
|
OMB Number:
|
3235-0063
|
|||
|
Expires:
|
March 31, 2018
|
|||
|
Estimated average burden
|
||||
|
hours per response
|
1,998.78
|
|||
FORM 10-K
x ANNUAL REPORT PURSUANT TO SECTION 13 OR 15(d) OF THE SECURITIES EXCHANGE ACT OF 1934 FOR THE FISCAL YEAR ENDED DECEMBER 31, 2015.
o TRANSITION REPORT PURSUANT TO SECTION 13 OR 15(d) OF THE SECURITIES EXCHANGE ACT OF 1934 FOR THE TRANSITION PERIOD FROM ______ TO ______.
Commission File Number: 0-23336
AROTECH CORPORATION
(Exact name of registrant as specified in its charter)
|
Delaware
|
95-4302784
|
|
(State or other jurisdiction of incorporation or organization)
|
(I.R.S. Employer Identification No.)
|
|
1229 Oak Valley Drive, Ann Arbor, Michigan
|
48108
|
|
(Address of principal executive offices)
|
(Zip Code)
|
|
(800) 281-0356
|
|
(Registrant’s telephone number, including area code)
|
Securities registered pursuant to Section 12(b) of the Act:
|
Title of each class
|
Name of each exchange on which registered
|
|
Common Stock, $0.01 par value
|
The Nasdaq Stock Market LLC
|
Securities registered pursuant to section 12(g) of the Act: Common Stock, $0.01 par value
Indicate by check mark if the registrant is a well-known seasoned issuer, as defined in Rule 405 of the Securities Act. Yes oNo x
Indicate by check mark if the registrant is not required to file reports pursuant to Section 13 or Section 15(d) of the Act. Yes oNo x
Indicate by check mark whether the registrant (1) has filed all reports required to be filed by Section 13 or 15(d) of the Securities Exchange Act of 1934 during the preceding 12 months (or for such shorter period that the registrant was required to file such reports), and (2) has been subject to such filing requirements for the past 90 days: Yes x No o
Indicate by check mark whether the registrant has submitted electronically and posted on its corporate Web site, if any, every Interactive Data File required to be submitted and posted pursuant to Rule 405 of Regulation S-T (§ 232.405 of this chapter) during the preceding 12 months (or for such shorter period that the registrant was required to submit and post such files). Yes x No o
Indicate by check mark if disclosure of delinquent filers pursuant to Item 405 of Regulation S-K (§ 229.405 of this chapter) is not contained herein, and will not be contained, to the best of registrant’s knowledge, in definitive proxy or information statements incorporated by reference in Part III of this Form 10-K or any amendment to this Form 10-K. x
Indicate by check mark whether the registrant is large accelerated filer, an accelerated filer, a non-accelerated filer, or a smaller reporting company. See definitions of “large accelerated filer,” “accelerated filer” and “smaller reporting company” in Rule 12b-2 of the Exchange Act.
|
Large accelerated filer: o
|
Accelerated filer: x
|
Non-accelerated filer: o
|
Smaller reporting company: o
|
Indicate by check mark whether the registrant is a shell company (as defined in Rule 12b-2 of the Act). Yes o No x
The aggregate market value of the registrant’s voting and non-voting common equity held by non-affiliates of the registrant as of June 30, 2015 was approximately $52,414,921 (based on the last sale price of such stock on such date as reported by The Nasdaq Global Market and assuming, for the purpose of this calculation only, that all of the registrant’s directors and executive officers are affiliates).
(Applicable only to corporate registrants) Indicate the number of shares outstanding of each of the registrant’s classes of common stock, as of the latest practicable date: 26,461,245 as of 3/11/2016
Documents incorporated by reference: None
SEC 1673 (11-14)
|
Potential persons who are to respond to the collection of information contained in this form are not required to respond unless the form displays a currently valid OMB control number.
|
TABLE OF CONTENTS
|
PART I
|
Page
|
|
|
ITEM 1.
|
4
|
|
|
ITEM 1A.
|
12
|
|
|
ITEM 1B.
|
24
|
|
|
ITEM 2.
|
24
|
|
|
ITEM 3.
|
24
|
|
|
ITEM 4.
|
24
|
|
|
PART II
|
||
|
ITEM 5.
|
25
|
|
|
ITEM 6.
|
27
|
|
|
ITEM 7.
|
28
|
|
| ITEM 7A. | 40 | |
|
ITEM 8.
|
40
|
|
|
ITEM 9.
|
40
|
|
|
ITEM 9A.
|
40
|
|
|
ITEM 9B.
|
41
|
|
|
PART III
|
||
|
ITEM 10.
|
42
|
|
|
ITEM 11.
|
50
|
|
|
ITEM 12.
|
63
|
|
|
ITEM 13.
|
65
|
|
|
ITEM 14.
|
66
|
|
|
PART IV
|
||
|
ITEM 15.
|
67
|
|
|
69
|
PRELIMINARY NOTE
This annual report contains historical information and forward-looking statements within the meaning of the Private Securities Litigation Reform Act of 1995 with respect to our business, financial condition and results of operations. The words “estimate,” “project,” “intend,” “expect” and similar expressions are intended to identify forward-looking statements. These forward-looking statements are subject to risks and uncertainties that could cause actual results to differ materially from those contemplated in such forward-looking statements. Further, we operate in an industry sector where securities values may be volatile and may be influenced by economic and other factors beyond our control. In the context of the forward-looking information provided in this annual report and in other reports, please refer to the discussions of Risk Factors detailed in, as well as the other information contained in, our other filings with the Securities and Exchange Commission (the “SEC”).
Electric Fuel® is a registered trademark and Arotech™, SWIPES™ and MILO Range™ are all trademarks of Arotech Corporation, formerly known as Electric Fuel Corporation. All company and product names mentioned may be trademarks or registered trademarks of their respective holders. Unless otherwise indicated, “we,” “us,” “our” and similar terms refer to Arotech Corporation and its subsidiaries.
PART I
ITEM 1. BUSINESS
General
We are a defense and security products and services company, engaged in two business areas: interactive simulation for military, law enforcement and commercial markets; and batteries and charging systems for the military, commercial and medical markets. We operate in two business units:
|
Ø
|
We develop, manufacture and market advanced high-tech multimedia and interactive digital solutions for engineering, use-of-force training and operator training of military, law enforcement, security, emergency services and other personnel through our Training and Simulation Division:
|
|
|
·
|
We provide interactive operator training systems featuring state-of-the-art vehicle simulator technology enabling training and research in situation awareness, risk analysis and decision-making, emergency reaction and avoidance procedures, conscientious equipment operation, and crew coordination;
|
|
|
·
|
We provide aircrew decision making support software, part-task aircraft simulators, and simulated weapon models to support military operations and aircrew training to the United States and foreign militaries; and
|
|
|
·
|
We provide specialized “use-of-force” training simulators and systems for police, security personnel and the military under the trade name MILO Range™ (“MILO Range”).
|
|
Ø
|
We provide advanced battery solutions, innovative energy management and power distribution technologies and world-class product design and manufacturing services for the aerospace, defense, law enforcement, and homeland security markets, and we manufacture and sell primary and rechargeable batteries, for defense and security products and medical and industrial applications through our Power Systems Division:
|
|
|
·
|
We provide high-end electronics engineering and design services, system integration services, rapid prototyping, and vertically-integrated production services for military, aerospace, and industrial customers, including: (i) hybrid power generation systems, (ii) smart power subsystems for military vehicles and dismounted applications, and (iii) aircraft and missile systems support for cutting-edge weapons and communications technologies;
|
|
|
·
|
We develop and sell rechargeable and primary batteries and smart chargers to the military and medical markets and to private defense industry in the Middle East, Europe and Asia under our Epsilor nameplate;
|
|
|
·
|
We develop, manufacture and market primary batteries, rechargeable batteries and battery chargers for the military, focusing on soldier system applications that demand high energy and light weight batteries with intelligent power management and distribution; and
|
|
|
·
|
We produce water-activated lifejacket lights for commercial aviation and marine applications under our Electric Fuel nameplate.
|
Background
We were incorporated in Delaware in 1990 under the name “Electric Fuel Corporation,” and we changed our name to “Arotech Corporation” on September 17, 2003. We operate through our various subsidiaries (all of which are 100% owned by us):
|
Ø
|
FAAC Incorporated (“FAAC”), a Michigan corporation located in Ann Arbor, Michigan (Training and Simulation Division);
|
|
Ø
|
Epsilor-Electric Fuel Ltd. (“Epsilor-EFL”), an Israeli corporation with facilities located in Beit Shemesh, Israel (between Jerusalem and Tel-Aviv), Dimona, Israel (in Israel’s Negev desert area), and in Sderot, Israel (near the Gaza Strip) (Power Systems Division);
|
|
Ø
|
UEC Electronics, LLC (“UEC”), a South Carolina limited liability company located in Hanahan, South Carolina (Power Systems Division); and
|
|
Ø
|
Electric Fuel Battery Corporation (“EFB”), a Delaware corporation located in Hanahan, South Carolina (Power Systems Division).
|
Unless the context requires otherwise, all references to us refer collectively to Arotech Corporation and its subsidiaries.
Our results for 2013 and for the first three months of 2014 do not include the results of UEC Electronics, LLC, a South Carolina limited liability company that we purchased on April 1, 2014.
Until December 2011, we were also engaged in utilizing advanced engineering concepts to manufacture military and paramilitary armored vehicles, and employing sophisticated lightweight materials to produce aviation armor, through our Armor Division. In December 2011, our Board of Directors approved management’s plan to sell our Armor Division in order to focus on the more profitable and growth-oriented aspects of our business. We completed the sale of our Armor Division in June 2012. Unless otherwise indicated, all reported figures include only the operations of our current business units and exclude the discontinued Armor segment.
For financial information concerning the business segments in which we operate, see Note 16.b. of the Notes to the Consolidated Financial Statements. For financial information about geographic areas in which we engage in business, see Note 16.c. of the Notes to the Consolidated Financial Statements.
Facilities
Our principal executive offices are located at 1229 Oak Valley Drive, Ann Arbor, Michigan 48108, and our toll-free telephone number at our executive offices is (800) 281-0356. Our corporate website is www.arotech.com. Our current reports on Form 8-K and our periodic reports on Form 10-Q and Form 10-K, including any amendments thereto, as well as recent filings relating to transactions in our securities by our executive officers and directors, that have been filed with the SEC in EDGAR format are made available through hyperlinks located on the investor relations page of our website, at http://ir.arotech.com/all-sec-filings, as soon as reasonably practicable after such material is electronically filed with or furnished to the SEC. Reference to our websites does not constitute incorporation of any of the information thereon or linked thereto into this annual report.
The offices and facilities of our Power Systems Division are located in Hanahan, South Carolina, and in Israel (in Beit Shemesh, Dimona and Sderot, all of which are within Israel’s pre-1967 borders). Most of the members of our senior management work extensively out of our facilities in Beit Shemesh. Our financial operations are conducted primarily from our principal executive offices in Ann Arbor, Michigan, which is the headquarters of our Training and Simulation Division. The Training and Simulation Division also maintains offices in Royal Oak, Michigan and in Orlando, Florida.
Training and Simulation Division
Our Training and Simulation Division develops, manufactures and markets an extensive array of trainers and simulation based solutions that provide interactive and situational training for military, law enforcement and commercial customers. Our simulators safely and economically train people, from municipal rail and bus drivers to military convoy crews, to respond immediately and appropriately in threatening and dangerous situations while under extreme pressure. During 2015, 2014 and 2013, revenues from our Training and Simulation Division were approximately $54.6 million, $56.4 million and $63.4 million, respectively.
The Training and Simulation Division concentrates on three different product areas:
|
Ø
|
Our Vehicle Simulation group provides high fidelity vehicle simulators for use in operator and crew training;
|
|
Ø
|
Our Air Warfare Simulations group provides weapon simulations used to train military pilots, weapon employment information used in the effective use of air launched weapons, and part-task simulators to train aircrew; and
|
|
Ø
|
Our Use of Force group provides training products focused on developing judgement skills necessary for the proper employment of various lethal and non-lethal options for public safety and military personnel.
|
Vehicle Simulation
We provide simulators, systems engineering support and software products focused on training vehicle operators for cars, trucks, and military vehicles. We provide these products to the United States military, government, municipalities, and private industry. Our fully interactive driver-training systems feature state-of-the-art vehicle simulator technology enabling training in situation awareness, risk analysis and decision making, emergency reaction and avoidance procedures, and proper equipment operation techniques. We also offer simulation software applications, consulting services, and custom software and hardware development services primarily for use by the automobile industry and universities engaged in the study of vehicle performance or operator/vehicle interactions. Our simulators have been used to train hundreds of thousands of drivers.
Our Vehicle Simulation group focuses on the development and delivery of complete simulation solutions for a wide range of vehicle types and applications– such as trucks, automobiles, subway trains, buses, fire trucks, police cars, ambulances, airport ground vehicles, and military vehicles and encompasses both driver training and full crew coordination training. We are a prime contractor in respect of the U.S. Army’s Virtual Clearance Training Suite (“VCTS”) program. VCTS trains route clearance teams on techniques to detect and neutralize improvised explosive devices. In 2015, 2014 and 2013, our Vehicle Simulations group accounted for approximately 40%, 42% and 57%, respectively, of our Training and Simulation Division’s revenues. In 2015, 2014 and 2013, our Vehicle Simulations group accounted for 23%, 23% and 41% of our consolidated revenues, respectively.
We believe that we have held a dominant market share in U.S. military wheeled vehicle operator driver training simulators since 1999 and that we are currently one of three significant participants in the U.S. municipal wheeled vehicle simulators market.
Air Warfare Simulations
In the area of Air Warfare Simulations, we believe we are a premier developer of validated, high fidelity analytical models and simulations of tactical air and land warfare systems for all branches of the U.S. Department of Defense (“DoD”) and its related industrial contractors. Our simulations are found in systems ranging from instrumented air combat and maneuver training ranges (such as Top Gun), full task training devices such as the F-18 Weapon Tactics Trainer, and in the on-board computer of many fighter jet aircraft. We supply on-board software to support weapon launch decisions for the F-15, F-16, F-18, F-22 and F-35 aircraft. Two of our key Air Warfare Simulations programs are the Zone Acquisition Program (ZAP) and our Air National Guard Boom Operator Simulator System (BOSS). ZAP provides aircrew with weapon employment information using highly accurate high-speed weapon simulations embedded in the operational flight programs of all US fighter aircraft. BOSS trains the boom operators for the performance of in-flight refueling. Boom operators control the equipment on a specially designed, refueling aircraft that passes fuel to other aircrafts in midair. We commenced production of this trainer and started to generate revenue from the sale of these trainers in 2015. In 2015, 2014 and 2013, our Air Warfare Simulations group accounted for 36%, 35%, and 28%, respectively, of our Training and Simulation Division’s revenues. In 2015, 2014, and 2013, the Air Warfare Simulations group accounted for 20%, 19%, and 20% of our consolidated revenues, respectively.
Use-of-Force
We are a leading provider of interactive, multimedia, fully digital use-of-force training simulators for law enforcement, security, military and similar applications. With a large customer base spread over twenty countries around the world, we are a leader in the supply of simulation training products to law enforcement, governmental, and commercial clients. We conduct our interactive training activities and market our interactive training products, such as the MILO Range (interactive Use-of-Force and firearms training), the MILO Theater (an immersive training environment enabling trainees to experience up to 300 degrees of field of regard), and the MILO Response (judgement skills training for EMS personnel), using our MILO Range nameplate. In 2015, 2014 and 2013, our Use-of-Force group accounted for 15%, 16% and 11%, respectively, of our Training and Simulation Division’s revenues.
Warranty
We typically offer a one to two year warranty for most of our products. Additionally, we sell extended warranties to our existing customers. In 2015, 2014 and 2013, warranty revenue accounted for 9%, 7% and 4%, respectively, of our Training and Simulation Division’s revenues.
Marketing and Customers
We market our Training and Simulation Division products to all branches of the U.S. military, international militaries, federal and local governments, municipal transportation departments, research institutions, private organizations, and public safety groups. Municipalities throughout the U.S. are using our vehicle simulators and use-of-force products, and our penetration in Asia, Europe and the Americas continues through the use of commissioned sales agents and regional distributors.
We have long-term relationships, many of over twenty years’ duration, with the U.S. Air Force, U.S. Navy, U.S. Army, U.S. Marine Corps, Department of Homeland Security, and most major U.S. Department of Defense training and simulation prime contractors and related subcontractors. The quality of our customer relationships is illustrated by the multiple program contract awards we have earned from many of our customers.
Competition
Our technical excellence, superior product reliability, high customer satisfaction and warranty services have enabled us to develop market leadership and attractive competitive positions in each of our product areas.
Vehicle Simulators
Several potential competitors in this segment are large, diversified defense and aerospace conglomerates, such as L-3 Communications and Leidos, who do not focus exclusively on our specific niches. As such, we are able to provide service on certain large military contracts through strategic agreements with these organizations or can compete directly with these organizations based on our strength in developing higher quality software solutions. In municipal market applications, we compete against smaller, less sophisticated companies, such as Raydon, Doron and Simulation Technology. Many of our competitors have financial, technical, marketing, sales, manufacturing, distribution and other resources significantly greater than ours.
Air Warfare Simulations
Currently, we believe that no significant competitors participate in the markets we serve around our weapon simulation niche. Our nearly 45-year history in this space provides us with a library of resources that would require substantial investment by a competitor to offer a comparable product. The companies that have the potential to compete with us are companies that now subcontract this work to us: Boeing Company (NYSE: BA) (“Boeing”), Raytheon Company (NYSE: RTN) (“Raytheon”), and Cubic Corporation (NYSE: CUB).
Use of Force
We compete against a number of established companies that provide similar products and services, many of which have financial, technical, marketing, sales, manufacturing, distribution and other resources significantly greater than ours. There are also companies whose products do not compete directly, but are sometimes closely related to the products we offer. Firearms Training Systems, Inc., Meggitt, Vitra, and LaserShot Inc. are our main competitors in this space.
Power Systems Division
Our Power Systems Division develops and provides sophisticated portable energy solutions for diverse applications, including military equipment carried by soldiers, hybrid energy generation/storage in austere environments, power management and power distribution, and clean, stable power for tactical vehicles, unmanned vehicles and medical devices, all of which are designed to complex and demanding customer specifications. During 2015, 2014 and 2013, revenues from our Power Systems Division were approximately $42.0 million, $47.2 million and $25.1 million, respectively. Revenues in 2013 and the first quarter of 2014 did not include the results of UEC, which we did not own until April 2014. On a pro forma basis, assuming we had owned all components of our Power Systems Division since January 1, 2013, Power Systems Division revenues in 2015, 2014 and 2013 would have been approximately $42.0 million, $59.7 million and $57.6 million, respectively.
Electronics Engineering and Design Services for the Military
Introduction
We design, engineer, and manufacture proprietary electronics, spanning components and sub-assemblies, for a broad range of end use systems in multiple markets that include aerospace, defense, industrial and medical. We specialize in electronic/electromechanical systems, subsystems, and component level requirements, which include circuit card assemblies and wire and cable assemblies. Our products range from complex integrated assemblies up through multi-rack functional systems and test equipment.
In addition, we also specialize in core, proprietary engineering capabilities in highly-demanded solution areas, including: (i) hybrid power generation systems, (ii) smart power subsystems for military vehicles and dismounted applications, and (iii) aircraft and missile systems support for cutting-edge weapons and communications technologies. Our unique brand of comprehensive service is highly sought-after by customer agencies such as the Marine Corps Systems Command, Space and Naval Warfare Systems Command (“SPAWAR”), US Army Communications and Electronics Research (“CERDEC”) and Tank Automotive Command (“TACOM”), as well as large prime contractors such as Raytheon, Boeing, Lockheed Martin Corporation (NYSE: LMT), and BAE Systems plc (LON: BA) (“BAE”). Our key program areas in this field include the following:
|
|
·
|
We supply the United States Marine Corps (“USMC”) with its program of record Ground Renewable Expeditionary Energy Network Systems (“GREENS”), a renewable power generation, intelligent energy storage and distribution system for troops serving in austere environments. GREENS is the only DoD Program of Record for renewable power generation. We are currently launching a commercial (not-ITAR restricted) version of this product, targeting both domestic and international mission critical, rugged markets.
|
|
|
·
|
We supply the USMC with Mobile Hybrid Expeditionary Energy System (“MHEES”), a product that incorporates both solar collection and high density battery technologies to intelligently reduce run time and optimize efficiency of tactical generators. This single system is scalable to 3.5kW, 7kW and 10.5kW output, making it an ideal solution for multiple military missions.
|
|
|
·
|
We have designed and continue to refine a proprietary Distributed Power Control and Management System (DPCMS) that replaces electrical systems on aging tactical vehicles such at the Light Armored Vehicle (LAV) and Assault Amphibious Vehicle (AAV). This power management and distribution system enables vehicles that have already exceeded the OEM’s recommended life to be refurbished and to take advantage of new automotive communication protocols J-1939. These refurbishments permit aging tactical vehicle fleets to function as a new vehicle, without the cost implications of replacing it with a new vehicle. This system, which has been successfully tested on LAVs by the USMC and UEC is currently under contract with the USMC to design and integrate the DPCMS system into multiple variants of the AAV.
|
|
|
·
|
We have developed significant expertise and past performance qualifications in the area of solutions for Command, Control, Communications, Computers Intelligence, Surveillance and Reconnaissance (C4ISR), providing these solutions to, among others, SPAWAR and Raytheon.
|
Competition
Our main competitors for renewable energy and power management systems products and services are ZeroBase Energy, LLC, a provider of hybrid and renewable power systems, Energy Technologies, Inc., a provider of power systems, EnerDel, Inc., a provider of compact lithium-ion-powered batteries for transportation, utility grid and industrial electronics markets, and Solar Stik, Inc., a provider of portable and custom power solutions, as well as companies that compete with us on proposals to Raytheon, including Celestica Inc. (NYSE: CLS), Ducommun Incorporated (NYSE: DCO), Sanmina-SCI Corporation (Nasdaq: SANM), Jabil Circuit, Inc., a supplier of manufacturing services for circuit board assemblies, and Woven Electronics Corporation, an electronics parts supplier.
We believe the fact that we have full-service engineering coupled with state-of-the-art manufacturing provides us with an advantage over most of our competitors, enabling us to customize solutions for customers, quickly develop prototype and first-article units, and move into full-rate production before many of our competitors are beyond the requirements definition phase. We believe few in the industry have both the agility and capabilities required to offer this advantage. As a manufacturer, we build our own cable harnesses, circuit cards, and integrated complex assemblies, which enables us to control our own supply chain and program schedules. These combined capabilities have resulted in lower costs and shorter lead times, both very important discriminators for our customers in this current fiscal environment.
Marketing and Customers
We market to a diverse array of customers. The renewable and hybrid energy market prior to 2015 has been primarily focused on the U.S. Department of Defense. We believe we have achieved significant success in this market; however, we are modifying our products to better meet commercial/industrial demands. In addition, we are refocusing marketing efforts internationally on the heels of our GREENS and MHEES programs. Specific efforts include attendance at international trade shows, establishing international sales channels, establishing networks within the U.S. commercial service, and an increase in outbound marketing efforts designed to drive potential customers to our solutions.
Over ninety percent of revenues are attributed to existing customers with new requirements or referrals of new customers from our existing customer base. This customer loyalty is closely tied to our technical solutions, our on-time delivery and quality of product metrics (consistently 98% or greater).
Manufacturing
Our four AS9100 and ISO 9001 registered facilities are located in the tri-county area of Charleston, South Carolina. All facilities are well equipped with state of the art design tools and automated manufacturing equipment to support our customers’ design, testing, and production needs.
Lithium Batteries and Charging Systems for Military, Industrial and Medical Markets
We sell lithium batteries and charging systems, including the SWIPES™ power hubs that we produce for the Army’s Soldier Warrior program, to the military, industrial and medical markets.
We develop and produce high-end lithium batteries, both primary (disposable) and secondary (rechargeable), as well as “smart” chargers for the rechargeable batteries and electronic sub-assemblies. We market to the military, the medical, and the industrial markets. We believe we are among the few companies in the world with the capability to develop and manufacture complex portable power sources needed by high-end portables. We perform the development and manufacturing in-house with the exception of the electrochemical cells, which we purchase from suppliers. We have also begun to penetrate the “special” batteries market, meaning large format batteries (such as those used to power submarines) and high power batteries (such as those used in missile launchers and battle tank emergency startup units.
We have experience in working with government agencies, the military and large corporations. Our technical team has significant expertise in the fields of electrochemistry, electronics, software and battery design, production, packaging and testing. We also specialize in custom products that must meet the highest possible military, industrial and medical specifications.
Our SWIPES™ power hub utilizes the MOLLE (Modular Lightweight Load-carrying Equipment) vest and integrates force protection electronics and communications equipment with an advanced battery. The system utilizes a modular power distribution system that is powered by a conformal wearable battery allowing for extended mission times without the burden of power source swaps or charging due to their high energy density. It also reduces the battery weight soldiers carry by up to 30%. The batteries continuously charge the secondary batteries inside various devices, such as two way radios, GPS units and shot detection systems. In 2015 US Army CERDEC awarded us with a development contract to expand the solider system wearable capabilities through the development of super capacitor based Radio Power Adapters (RPA). These RPAs are expected to further reduce the weight that a solider carries and allows for the next level of capability for integrated soldier systems.
Customers
The principal customers for our lithium batteries during 2015 were the Israel Ministry of Defense, Elbit, Israel Aircraft Industries, Aeronautics, and Thales. The principal customer for our soldier power systems in 2015 was the U.S. Army.
Competition
There are a limited number of players globally that are a one-stop-shop for high-end custom portable power. Our main competitors are Bren-Tronics, Inc., Ultralife Corporation (NASDAQ:ULBI) (“Ultralife”), EnerSys (NYSE: ENS), Inventus Power, Safety Insurance Group, Inc. (NASDAQ: SAFT), Electrochem Solutions, Inc., RRC Power Solutions and Inspired Energy Plc (LONDON: INSE).
Manufacturing
Our U.S. manufacturing facility for batteries and chargers is located in Hanahan, South Carolina, in the Charleston area. In parallel, we have manufacturing facilities in Beit Shemesh, Dimona and Sderot, all located in Israel.
Lifejacket Lights
We are a world leader in the supply of water-activated lifejacket and survivor locator lights to the marine and aviation markets. Since 1996 we have offered a range of safety products used by the marine and aerospace industries, commercial airlines and military outfitters. Our lifejacket lights are certified by air and marine regulatory organizations, and are available through distributors worldwide.
Products
We have a product line consisting of seven lifejacket light models. Five of these models are for use with marine lifejackets and two are for use with aviation lifejackets. The marine lifejacket lights come in two LED alkaline-powered models (a one-piece and a two-piece model), two LED lithium-powered models (a one-piece product and a two-piece product), and a two-piece lithium-powered incandescent mode. Both our aviation locator incandescent lights are powered by our patented magnesium copper chloride battery chemistry. All of our lifejacket lights work in both freshwater and seawater. Each of our lifejacket lights is certified for use by relevant governmental agencies under various U.S. and international regulations, including the U.S. Federal Aviation Administration’s Technical Standard Order (“TSO”), the EU’s Marine Equipment Directive 96/98/EC (MED), and the International Safety of Life at Sea (SOLAS) Convention. We manufacture, assemble and package all our lifejacket lights in our factory in Beit Shemesh, Israel.
Marketing
We market our marine safety products through our own network of distributors in Europe, the United States, Asia and Oceania. We market our lights to the commercial aviation industry through an independent company that receives a commission on sales.
Competition
Our primary competitor in the field of aviation safety products, including TSO-approved lifejacket lights, is ACR Electronics Inc. of Ft. Lauderdale, Florida. Other significant competitors in the marine market include Daniamant Aps of Denmark and England, a provider of survivor location lights, and Alcares ApS of Denmark, a manufacturer of marine emergency lights.
Flow Battery
We are engaged in preliminary research and development of an iron flow battery for grid storage.
Electricity generation can be highly variable, especially if the supply is generated from intermittent, renewable sources such as the sun or wind. A flow battery can store a substantial amount of grid power produced by renewables and return it to the grid as needed, providing a buffer between the supply and demand of electricity. For example, in a solar power station, more power might be generated in the mid-day sun than is needed. The excess power could be stored in the flow battery during the day and used on demand without the need to generate additional electricity at that time.
Flow battery plants can help minimize the necessity of building new fuel-based power plants to address momentary peak demand. It can do this by using stored energy during times of peak demand and collecting energy at trough times, reducing the need to scale fuel-based energy production. This becomes even more crucial as more renewables come on line with their highly variable output. We believe this would be an integral part of the initiative to modernize the electrical power grid.
According to the Boston Consulting Group, the grid storage market is estimated to exceed $400 billion by 2030. This represents a global storage capacity of 430 giga-watts, which would be an increase of more than four times in just 16 years.
Preliminary research and development into the iron flow battery has yielded what we believe to be promising results in lab tests, and we have filed two patent applications covering our new technology. In the last year we have manufactured and demonstrated a lab-scale pilot battery, complete with a unique membrane and an in-house manufactured anode. We are now working on the next stage of the project: manufacturing and demonstrating a 10kW/60kWh pilot battery.
Backlog
We generally sell our products under standard purchase orders. Orders constituting our backlog are subject to changes in delivery schedules and are typically cancelable by our customers until a specified time prior to the scheduled delivery date. Accordingly, our backlog is not necessarily an accurate indication of future sales. As of December 31, 2015, 2014 and 2013, our funded backlog was approximately $63.0 million, $69.9 million and $58.0 million, respectively, divided between our divisions as follows:
|
Division
|
2015
|
2014
|
2013
|
||||||||||
|
Training and Simulation Division
|
$ | 29,772,000 | $ | 45,731,000 | $ | 45,892,000 | |||||||
|
Power Systems Division
|
33,248,000 | 24,175,000 | 12,067,000 | ||||||||||
|
TOTAL:
|
$ | 63,020,000 | $ | 69,906,000 | $ | 57,959,000 | |||||||
Major Customers
During 2015, 2014 and 2013, including both of our divisions, various branches of the United States military accounted for approximately 48%, 56% and 55% of our revenues. See “Item 1A. Risk Factors – Risks Related to Government Contracts,” below.
Patents and Trade Secrets
We rely on certain proprietary technology and seek to protect our interests through a combination of patents, trademarks, copyrights, know-how, trade secrets and security measures, including confidentiality agreements. Our policy generally is to secure protection for significant innovations to the fullest extent practicable. Further, we seek to expand and improve the technological base and individual features of our products through ongoing research and development programs.
Our intellectual property portfolio includes three issued U.S. patents, which expire between 2018 and 2031. We also have three patent applications pending for examination in U.S. and foreign jurisdictions.
We rely on the laws of unfair competition and trade secrets to protect our proprietary rights. We attempt to protect our trade secrets and other proprietary information through confidentiality and non-disclosure agreements with customers, suppliers, employees and consultants, and through other security measures. However, we may be unable to detect the unauthorized use of, or take appropriate steps to enforce our intellectual property rights. Effective trade secret protection may not be available in every country in which we offer or intend to offer our products and services to the same extent as in the United States. Failure to adequately protect our intellectual property could harm or even destroy our brands and impair our ability to compete effectively. Further, enforcing our intellectual property rights could result in the expenditure of significant financial and managerial resources and may not prove successful. Although we intend to protect our rights vigorously, there can be no assurance that these measures will be successful.
Research and Development
During the years ended December 31, 2015, 2014 and 2013, our research and product development expenses were approximately $4.0 million, $3.3 million and $3.0 million, respectively. Not included in these figures is research and development where the costs were underwritten by customers or charged directly to projects as non-recovered engineering costs.
Employees
As of December 31, 2015, we employed 523 total employees worldwide, the majority of whom were full-time employees. Our success will depend in large part on our ability to attract and retain skilled and experienced employees.
With respect to those of our employees who are Israeli residents, Israeli law generally requires severance pay upon the retirement or death of an employee or termination of employment without due cause; additionally, some of our senior employees have special severance arrangements, certain of which are described under “Item 11. Executive Compensation – Employment Contracts,” below. We currently partially fund our ongoing severance obligations by making monthly payments to approved severance funds or insurance policies.
Raw Materials
We are dependent on the availability of raw materials from our suppliers. The most important raw materials are lithium cells and zinc for our batteries. We purchase these raw materials from various suppliers. We believe alternative sources generally exist for the raw materials used for our batteries.
Regulatory Matters
Our businesses are heavily regulated in most of our markets. We deal with numerous U.S. government agencies and entities, including, but not limited to, branches of the U.S. military and the Department of Homeland Security. Similar government authorities exist in our international markets. We are also subject to export regulations. For additional information related to export regulations, see Item 1A, entitled “Risk Factors – We may not be able to receive or retain the necessary licenses or authorizations required for us to export or re-export….”
Government Contracts
The U.S. government, and other governments, may terminate any of our government contracts at their convenience, as well as for default, based on our failure to meet specified performance requirements. If any of our U.S. government contracts were to be terminated for convenience, we generally would be entitled to receive payment for work completed and allowable termination or cancellation costs. If any of our government contracts were to be terminated for default, generally the U.S. government would pay only for the work that has been accepted and can require us to pay the difference between the original contract price and the cost to re-procure the contract items, net of the work accepted from the original contract. The U.S. government can also hold us liable for damages resulting from the default. For additional information related to government contracts, see Item 1A. “Risk Factors – Risks Related to Government Contracts.”
Environmental
We are subject to various federal, state, local and non-U.S. laws and regulations relating to environmental protection, including the discharge, treatment, storage, disposal and remediation of hazardous substances and wastes. We continually assess our compliance status and management of environmental matters to ensure our operations are in substantial compliance with all applicable environmental laws and regulations. Investigation, remediation, operation and maintenance costs associated with environmental compliance and management of sites are a normal, recurring part of our operations. These costs often are allowable costs under our contracts with the U.S. government. It is reasonably possible that continued environmental compliance could have a material impact on our results of operations, financial condition or cash flows if additional work requirements or more stringent clean-up standards are imposed by regulators, new areas of soil and groundwater contamination are discovered and/or expansions of work scope are prompted by the results of investigations.
ITEM 1A. RISK FACTORS
The following factors, among others, could cause actual results to differ materially from those contained in forward-looking statements made in this Report and presented elsewhere by management from time to time.
Business-Related Risks
We have had a history of losses and may incur future losses.
We were incorporated in 1990 and began our operations in 1991. We have funded our operations principally from funds raised in public and private offerings of our common stock and equity and debt securities convertible or exercisable into shares of our common stock; research contracts and supply contracts; funds received under research and development grants from the Government of Israel; and sales of products that we and our subsidiaries manufacture. We have incurred significant net losses since our inception. Additionally, as of December 31, 2015, we had an accumulated deficit (including discontinued operations) of approximately $182.6 million. In an effort to reduce operating expenses and maximize available resources, we have consolidated certain of our subsidiaries, shifted personnel and reassigned responsibilities. We have also taken a variety of other measures to limit spending and will continue to assess our internal processes to seek additional cost-structure improvements. Although we believe that such steps have helped to reduce our operating expenses and maximize our available resources and enabled us to operate at a net profit in the recent past, there can be no assurance that we will be able to maintain profitability consistently or that our business will continue to exist.
We need significant amounts of capital to operate and grow our business and to pay our debt.
We require substantial funds to operate our business, including marketing our products and developing and marketing new products. To the extent that we are unable to fully fund our operations, including repaying our outstanding debt, through profitable sales of our products and services, we will need to seek additional funding, including through the issuance of equity or debt securities. In addition, based on our internal forecasts, the assumptions described under “Liquidity and Capital Resources” below, and subject to the other risk factors described herein, we believe that our present cash position and anticipated cash flows from operations and lines of credit should be sufficient to satisfy our current estimated cash requirements for 2016. However, in the event our internal forecasts and other assumptions regarding our liquidity prove to be incorrect, we may need to seek additional funding. There can be no assurance that we will obtain any such additional financing in a timely manner, on acceptable terms, or at all. If additional funds are raised by issuing equity securities or convertible debt securities, stockholders may incur further dilution. If we incur additional indebtedness, we may be subject to affirmative and negative covenants that may restrict our ability to operate or finance our business. If additional funding is not secured, we will have to modify, reduce, defer or eliminate parts of our present and anticipated future commitments and/or programs.
Our existing indebtedness may adversely affect our ability to obtain additional funds and may increase our vulnerability to economic or business downturns.
Our bank and other indebtedness (short and long term) totaled approximately $20.3 million as of December 31, 2015 (not including trade payables, other account payables, and accrued severance pay), of which $4.1 million was bank working capital lines of credit and approximately $16.2 million represents two term loans entered into to fund the UEC acquisition. In addition, we may incur additional indebtedness in the future. Accordingly, we are subject to the risks associated with significant indebtedness, including:
|
|
·
|
we must dedicate a portion of our cash flows from operations to pay principal and interest and, as a result, we may have less funds available for operations and other purposes;
|
|
|
·
|
it may be more difficult and expensive to obtain additional funds through financings, if available at all;
|
|
|
·
|
we are more vulnerable to economic downturns and fluctuations in interest rates, less able to withstand competitive pressures and less flexible in reacting to changes in our industry and general economic conditions; and
|
|
|
·
|
if we default under any of our existing debt instruments, including paying the outstanding principal when due, and if our creditors demand payment of a portion or all of our indebtedness, we may not have sufficient funds to make such payments.
|
The occurrence of any of these events could materially adversely affect our results of operations and financial condition and adversely affect our stock price.
Failure to comply with the terms of our indebtedness could result in a default that could have material adverse consequences for us.
As of December 31, 2015, the Company maintained a $15 million line of credit; an $18 million, 61-month senior term loan at an interest rate of LIBOR plus 3.75%; a $4.5 million, 61 month “B” term loan at an interest rate of LIBOR plus 5.5% (the “Bank Facilities”). The amounts outstanding at December 31, 2015, on the line of credit, senior term loan, and “B” term loan were The Bank Facilities were planned to expire in May 2016.
Effective at the end of the second quarter 2015, the old primary bank eliminated the covenant that provided that UEC’s earnings before interest, taxes, depreciation and amortization with certain add-backs (“EBITDA”), may not be less than $4.5 million for any trailing twelve-month period ending at the end of a fiscal quarter. In addition, during the fiscal quarter ended September 30, 2015, the Company obtained a waiver from the Bank with respect to maintaining a minimum fixed charge coverage ratio of 1.25 to 1.
On March 11, 2016, we entered into a new credit agreement with a new primary bank, whereby our new bank agreed to provide (i) a $15 million revolving credit facility (“Revolver”), (ii) a $10 million Term Loan (the “Term Loan”), and (iii) a $1 million Mortgage Loan (the “Mortgage Loan” and, together with the Revolver and the Term Loan, the “Credit Facilities”) in respect of certain property located in Ann Arbor, Michigan.
The maturity of the Term Loan is five years from the date of the new credit agreement. The Term Loan maintains an interest rate on a scale ranging from LIBOR plus 2.0% up to LIBOR plus 3.25%. The repayment of the Term Loan will consist of 60 consecutive monthly payments of principal plus accrued interest based on annual principal reductions of 10% during the first year, 20% during the second through fourth years, and 30% during the fifth year. The Revolver and Term Loan are secured by our assets.
The maturity of the Mortgage Loan is five years from the date of the new credit agreement and maintains an interest rate on a scale identical to the Term Loan.
The Credit Facilities maintain certain reporting requirements, conditions precedent, affirmative covenants and financial covenants. The financial covenants include that we must maintain both a Maximum Debt to EBITDA ratio of 3.00 to 1.00 and a Minimum Fixed Charge Coverage Ratio of 1.20 to 1.00.
A failure to comply with the obligations contained in the agreements governing our indebtedness could result in an event of default under such agreements which could result in an acceleration of debt under other instruments evidencing indebtedness that contain cross-acceleration or cross-default provisions. If our indebtedness were to be accelerated, there can be no assurance that our future cash flow or assets would be sufficient to repay in full such indebtedness. During 2015, we received waivers from our former primary lending institution that enabled us to avoid covenant violations that could have triggered a default on our indebtedness. There can be no assurance that any similar waivers with our new bank will, if needed, be granted in the future.
The Company was required to prepare quarterly covenant calculations for its old primary bank. With the onset of the new bank agreement, the requirement to submit its December 31, 2015 covenants was discharged.
We may not be successful in operating our electronics engineering and design services for the military business, which is a new business for us.
The business of electronics engineering and design services for the military is a new business for us and our management group has limited experience operating this particular type of business. Although we have retained most of UEC’s management personnel, we cannot assure that such personnel will continue to work for us or that we will be successful in managing this new business. Additionally, we may not be able to successfully integrate the operations and personnel of UEC into our business, and we may not realize any anticipated benefits of such acquisition. If we are unable to successfully operate this new business, our business, financial condition and results of operations could be materially impaired.
We may consider acquisitions in the future to grow our business, and such activity could subject us to various risks.
We may consider acquiring companies that will complement our existing operations or provide us with an entry into markets we do not currently serve. Growth through acquisitions involves substantial risks, including the risk of improper valuation of the acquired business and the risk of inadequate integration. There can be no assurance that suitable acquisition candidates will be available, that we will be able to acquire or manage profitably such additional companies or that future acquisitions will produce returns that justify our investments in such companies. In addition, we may compete for acquisition and expansion opportunities with companies that have significantly greater resources than we do. Furthermore, acquisitions could disrupt our ongoing business, distract the attention of our senior officers, increase our expenses, make it difficult to maintain our operational standards, controls and procedures and subject us to contingent and latent risks that are different, in nature and magnitude, than the risks we currently face.
We may finance future acquisitions with cash from operations or additional debt or equity financings. There can be no assurance that we will be able to generate internal cash or obtain financing from external sources or that, if available, such financing will be on terms acceptable to us. The issuance of additional common stock to finance acquisitions may result in substantial dilution to our stockholders. Any debt financing may significantly increase our leverage and may involve restrictive covenants which limit our operations.
If we are successful in acquiring additional businesses, we may experience a period of rapid growth that could place significant additional demands on, and require us to expand, our management, resources and management information systems. Our failure to manage any such rapid growth effectively could have a material adverse effect on our financial condition, results of operations and cash flows.
We may not generate sufficient cash flow to service all of our debt obligations.
Our ability to make payments on our indebtedness and to fund our operations depends on our ability to generate cash in the future. Our future operating performance is subject to market conditions and business factors that are beyond our control. Consequently, we cannot assure you that we will generate sufficient cash flow to pay the principal and interest on our debt. If our cash flows and capital resources are insufficient to allow us to make scheduled payments on our debt, we may have to reduce or delay capital expenditures, sell assets, seek additional capital or restructure or refinance our debt. We cannot assure you that the terms of our debt will allow for these alternative measures or that such measures would satisfy our scheduled debt service obligations. In addition, in the event that we are required to dispose of material assets or restructure or refinance our debt to meet our debt obligations, we cannot assure you as to the terms of any such transaction or how quickly such transaction could be completed. Our ability to refinance our indebtedness or obtain additional financing will depend on, among other things:
|
|
·
|
our financial condition at the time;
|
|
|
·
|
restrictions in the agreements governing our other indebtedness; and
|
|
|
·
|
other factors, including the condition of the financial markets and our industry.
|
Our earnings may decline if we write off additional goodwill and other intangible assets.
As of December 31, 2015, we had recorded goodwill of $45.5 million. Any future impairment of goodwill or other intangible assets may have a significant impact on earnings. Goodwill is not amortized, but is tested for impairment at the reporting unit level. Goodwill is required to be tested for impairment annually and between annual tests if events or circumstances indicate that it is more likely than not that the fair value of a reporting unit is less than its carrying amount, which, in the Power Systems Division in 2015, was a 2% percent margin. There are numerous risks that may cause the fair value of a reporting unit to fall below its carrying amount, which could lead to the measurement and recognition of goodwill impairment. These risks include, but are not limited to, adverse changes in legal factors or the business climate, an adverse action or assessment by a regulator, a more-likely-than-not expectation that all or a significant portion of a reporting unit may be disposed of, a sustained decline in our market capitalization, significant negative variances between actual and expected financial results, and lowered expectations of future financial results.
Significant judgments inherent in these analyses include assumptions about appropriate sales growth rates, WACC and the amount of expected future net cash flows. The judgments and assumptions used in the estimate of fair value are generally consistent with the projections and assumptions that are used in current operating plans. Such assumptions are subject to change as a result of changing economic and competitive conditions. The determination of fair value is highly sensitive to differences between estimated and actual cash flows and changes in the related discount rate used to evaluate the fair value of the reporting units and trade name.
The goodwill of our Training and Simulation Division equaled $24.4 million and the goodwill of our Power Systems Division equaled $21.1 million at December 31, 2015. During 2015, the Power Systems reporting unit incurred losses from operations that were attributable to discrete events that management considers to be temporary in nature. Based on the discounted cash flow valuation at December 31, 2015, an increase in the WACC or changes in other significant variables for the Power Systems Division could potentially result in impairment.
Some of the components of our products pose potential safety risks which could create potential liability exposure for us.
Some of the components of our products contain elements that are known to pose potential safety risks. In addition to these risks, there can be no assurance that accidents in our facilities will not occur. Any accident, whether occasioned by the use of all or any part of our products or technology or by our manufacturing operations, could adversely affect commercial acceptance of our products and could result in significant production delays or claims for damages resulting from injuries. Any of these occurrences would materially adversely affect our operations and financial condition. In the event that our products fail to perform as specified, users of these products may assert claims for substantial amounts. These claims could have a materially adverse effect on our financial condition and results of operations. There is no assurance that the amount of the general product liability insurance that we maintain will be sufficient to cover potential claims or that the present amount of insurance can be maintained at the present level of cost, or at all.
We are subject to the Dodd-Frank Wall Street Reform and Consumer Protection Act disclosure requirements regarding the use of “conflict minerals”
Beginning in 2014, the Dodd-Frank Wall Street Reform and Consumer Protection Act imposes new disclosure requirements regarding the use of “conflict minerals” mined from the Democratic Republic of Congo and adjoining countries in products, whether or not these products are manufactured by third parties. The definition of “conflict minerals” includes tin, tantalum, tungsten and gold, and their derivatives, some of which we use in the activities of our Power Systems Division. These new requirements could affect the pricing, sourcing and availability of minerals used in the manufacture of our products. There will be additional costs associated with complying with the disclosure requirements, such as costs related to determining the source of any conflict minerals used in our products. Our supply chain is complex and we may be unable to verify the origins for all metals used in our products. We may also encounter challenges with our customers and stockholders if we are unable to certify that our products are conflict free.
Our fields of business are highly competitive.
The competition to develop defense and security products and to obtain funding for the development of these products is, and is expected to remain, intense.
Our defense and security products compete with other manufacturers of specialized training systems.
Various battery technologies are being considered for use in defense and safety products by other manufacturers and developers, including the following: lead-acid, nickel-cadmium, nickel-iron, nickel-zinc, nickel-metal hydride, sodium-sulfur, sodium-nickel chloride, zinc-bromine, lithium-ion, lithium-polymer, lithium-iron sulfide, primary lithium, rechargeable alkaline and Zinc-Air.
Many of our competitors have financial, technical, marketing, sales, manufacturing, distribution and other resources significantly greater than ours. If we are unable to compete successfully in each of our operating areas, our business and results of operations could be materially adversely affected.
Our business is dependent on proprietary rights that may be difficult to protect and could affect our ability to compete effectively.
Our ability to compete effectively will depend on our ability to maintain the proprietary nature of our technology and manufacturing processes through a combination of patent and trade secret protection, non-disclosure agreements and licensing arrangements.
Litigation, or participation in administrative proceedings, may be necessary to protect our proprietary rights. This type of litigation can be costly and time consuming and could divert company resources and management attention to defend our rights, and this could harm us even if we were to be successful in the litigation and there is no guarantee we would be successful in such litigation. In the absence of patent protection, and despite our reliance upon our proprietary confidential information, our competitors may be able to use innovations similar to those used by us to design and manufacture products directly competitive with our products. In addition, no assurance can be given that others will not obtain patents that we will need to license or design around. To the extent any of our products are covered by third-party patents, we could need to acquire a license under such patents to develop and market our products.
Despite our efforts to safeguard and maintain our proprietary rights, we may not be successful in doing so. In addition, competition is intense, and there can be no assurance that our competitors will not independently develop or patent technologies that are substantially equivalent or superior to our technology. In the event of patent litigation, we cannot assure you that a court would determine that we were the first creator of inventions covered by our issued patents or pending patent applications or that we were the first to file patent applications for those inventions. If existing or future third-party patents containing broad claims were upheld by the courts or if we were found to infringe third-party patents, we may not be able to obtain the required licenses from the holders of such patents on acceptable terms, if at all. Failure to obtain these licenses could cause delays in the introduction of our products or necessitate costly attempts to design around such patents, or could foreclose the development, manufacture or sale of our products. We could also incur substantial costs in defending ourselves in patent infringement suits brought by others and in prosecuting patent infringement suits against infringers.
We also rely on trade secrets and proprietary know-how that we seek to protect, in part, through non-disclosure and confidentiality agreements with our customers, employees, consultants, and entities with which we maintain strategic relationships. We cannot assure you that these agreements will not be breached, that we would have adequate remedies for any breach or that our trade secrets will not otherwise become known or be independently developed by competitors.
Our business could be negatively impacted by cyber attacks and other security breaches.
In the ordinary course of our business, we collect and store sensitive data, including intellectual property, our proprietary business information and that of our customers, suppliers and business partners, in our data centers and on our networks. As part of our business, we may face certain security threats, including threats to our information technology infrastructure, attempts to gain access to our proprietary, sensitive or classified information. Cybersecurity threats could evolve quickly and include, but not be limited to, computer viruses, attempts to access information and other electronic security breaches. Our information technology networks and related systems are critical to the operation of our business and essential to our ability to successfully perform day-to-day operations. In addition, our customers, suppliers, subcontractors and other third parties with whom we do business generally face similar security threats, and in some cases we must rely on the safeguards put in place by these parties to protect against security threats. We believe we have implemented appropriate measures and controls and have invested in resources to appropriately identify and monitor these threats and mitigate potential risks, including risks involving our customers and suppliers. However, such actions may not be sufficient to prevent cybersecurity breaches, disruptions to mission critical systems, the unauthorized release of sensitive information or corruption of data, or harm to facilities or personnel.
In addition, as a provider of products and services to government and commercial customers, our products and services may be the targets of cyber attacks that attempt to sabotage or otherwise disable such products and services, or our cybersecurity and other products and services ultimately may not be able to effectively detect, prevent, or protect against or otherwise mitigate losses from all cyber attacks. Furthermore, as a defense contractor with a security clearance we would be obligated to notify the Department of Defense of certain penetrations of protected networks.
The impact of these security threats and other disruptions, including cyber attacks and other security breaches, is difficult to predict. However, the cost and operational consequences of responding to breaches and implementing remediation measures could be significant and our insurance coverage may not cover all related costs. These threats and other events could also disrupt our operations, or the operations of our customers, suppliers, subcontractors and other third parties, could require significant management attention and resources, could result in the loss of business, regulatory actions and potential liability, and could negatively impact our reputation among our customers and the public, any one of which could have a negative impact on our financial condition, results of operations or liquidity.
We are dependent on key personnel and our business would suffer if we fail to retain them.
We are highly dependent on the managers of our Training and Simulation Division and our Power Systems Division, and the loss of the services of any of these persons could adversely affect us. We are especially dependent on the services of our President and Chief Executive Officer, Steven Esses. The loss of Mr. Esses could have a material adverse effect on us. We are party to an amended employment agreement with Mr. Esses, which agreement expires at the end of 2018. We have key-man life insurance on Mr. Esses. If we are not successful in attracting and retaining highly qualified personnel, we may not be able to successfully implement our business strategy.
We face risks related to general domestic and global economic conditions.
In general, our operating results can be significantly affected by negative economic conditions, high labor, material and commodity costs and unforeseen changes in demand for our products and services. These risks are heightened as economic conditions globally have deteriorated significantly and may remain at recessionary levels for the foreseeable future. The current recessionary conditions could have a potentially significant negative impact on demand for our products and services, which may have a direct negative impact on our sales and profitability, as well as our ability to generate sufficient internal cash flows or access credit at reasonable rates to meet future operating expenses, service debt and fund capital expenditures.
There are risks involved with the international nature of our business.
A significant portion of our sales are made to customers located outside the U.S., primarily in Europe and Asia. In 2015, 2014 and 2013, 19.5%, 19.1% and 16.5%, respectively, of our revenues, were derived from sales to customers located outside the U.S. We expect that our international customers will continue to account for a substantial portion of our revenues in the near future. Sales to international customers may be subject to political and economic risks, including political instability, currency controls, exchange rate fluctuations, foreign taxes, longer payment cycles and changes in import/export regulations and tariff rates. In addition, various forms of protectionist trade legislation have been and in the future may be proposed in the U.S. and certain other countries. Any resulting changes in current tariff structures or other trade and monetary policies could adversely affect our sales to international customers. See also “Israel-Related Risks,” below.
Risks Related to Government Contracts
A significant portion of our business is dependent on government contracts and reduction or reallocation of defense or law enforcement spending could reduce our revenues.
Most of our customers to date have been in the public sector of the U.S., including the federal, state and local governments and the military, and in the public sectors of a number of other countries. A significant decrease in the overall level or allocation of defense or law enforcement spending in the U.S. or other countries could reduce our revenues and have a material adverse effect on our future results of operations and financial condition.
Sales to public sector customers are subject to a multiplicity of detailed regulatory requirements and public policies as well as to changes in training and purchasing priorities. Contracts with public sector customers may be conditioned upon the continuing availability of public funds, which in turn depends upon lengthy and complex budgetary procedures, and may be subject to certain pricing constraints. Moreover, U.S. government contracts and those of many international government customers may generally be terminated for a variety of factors when it is in the best interests of the government and contractors may be suspended or debarred for misconduct at the discretion of the government. There can be no assurance that these factors or others unique to government contracts or the loss or suspension of necessary regulatory licenses will not reduce our revenues and have a material adverse effect on our future results of operations and financial condition.
A decline in the U.S. Government defense budget, changes in budgetary priorities or timing of contract awards may adversely affect our future revenues and limit our growth prospects.
Revenues under contracts with the U.S. Department of Defense (“DoD”), either as a prime contractor or subcontractor to other contractors, represent a substantial portion of our total revenues. Our operating results could be adversely affected by spending caps or changes in the budgetary priorities of the U.S. Government or the DoD, as well as delays in program starts or the award of contracts or task orders under contracts.
An impasse in federal budget decision-making could lead to substantial delays or reductions in federal spending. For example, as a result of inability of the U.S. Government to reach agreement on budget reduction measures required by the Budget Control Act of 2011, sequestration triggered substantial automatic spending reductions beginning in January 2013, divided between defense and domestic spending over a nine-year period. As a result, U.S. Government funding for certain of our customers may be reduced, delayed or eliminated, which could significantly impact these customers’ demand for our products and services and if so would have a material adverse effect on our business, results of operations and cash flows. While the future impact of sequestration is uncertain, these automatic across-the-board budget cuts in sequestration could have significant negative consequences to our business and industry.
In years when Congress does not complete its budget process before the end of its fiscal year (September 30), government operations are funded through a continuing resolution (CR) that temporarily funds federal agencies. Recent CRs have generally provided funding at the levels provided in the previous fiscal year and have not authorized new spending initiatives. When the federal government operates under a CR, delays can occur in the procurement of products and services. Historically, such delays have not had a material effect on our business; however, should sequestration not be alleviated, it could continue to have significant consequences to our business and our industry.
Additionally, our business could be affected if the demand for and priority of funding for combat operations overseas decreases, which may reduce the demand for our services on contracts supporting some operations and maintenance activities in the Department of Defense or if we experience an increase in set-asides for small businesses, which could result in our inability to compete directly for prime contracts.
Our U.S. government contracts may be terminated at any time and may contain other unfavorable provisions.
The U.S. government, and other governments, typically can terminate or modify any of its contracts with us either for its convenience or if we default by failing to perform under the terms of the applicable contract. A termination arising out of our default could expose us to liability and have a material adverse effect on our ability to re-compete for future contracts and orders. Our U.S. government contracts contain provisions that allow the U.S. government to unilaterally suspend us from receiving new contracts pending resolution of alleged violations of procurement laws or regulations, reduce the value of existing contracts, issue modifications to a contract and control and potentially prohibit the export of our products, services and associated materials.
Government agencies routinely audit government contracts. These agencies review a contractor's performance on its contract, pricing practices, cost structure and compliance with applicable laws, regulations and standards. If we are audited, we will not be reimbursed for any costs found to be improperly allocated to a specific contract, while we would be required to refund any improper costs for which we had already been reimbursed. Therefore, an audit could result in a substantial adjustment to our revenues. If a government audit uncovers improper or illegal activities, we may be subject to civil and criminal penalties and administrative sanctions, including termination of contracts, forfeitures of profits, suspension of payments, fines and suspension or debarment from doing business with United States government agencies. We could suffer serious reputational harm if allegations of impropriety were made against us. A governmental determination of impropriety or illegality, or an allegation of impropriety, could have a material adverse effect on our business, financial condition or results of operations.
We may be liable for penalties under a variety of procurement rules and regulations, and changes in government regulations could adversely impact our revenues, operating expenses and profitability.
Our defense and commercial businesses must comply with and are affected by various government regulations that impact our operating costs, profit margins and our internal organization and operation of our businesses. Among the most significant regulations are the following:
|
|
·
|
the U.S. Federal Acquisition Regulations, which regulate the formation, administration and performance of government contracts;
|
|
|
·
|
the U.S. Truth in Negotiations Act, which requires certification and disclosure of all cost and pricing data in connection with contract negotiations; and
|
|
|
·
|
the U.S. Cost Accounting Standards, which impose accounting requirements that govern our right to reimbursement under certain cost-based government contracts.
|
These regulations affect how we and our customers do business and, in some instances, impose added costs on our businesses. Any changes in applicable laws could adversely affect the financial performance of the business affected by the changed regulations. With respect to U.S. government contracts, any failure to comply with applicable laws could result in contract termination, price or fee reductions or suspension or debarment from contracting with the U.S. government.
We may not be able to receive or retain the necessary licenses or authorizations required for us to export or re-export our products, technical data or services, or to transfer technology from foreign sources (including our own subsidiaries) and to work collaboratively with them. Denials of such licenses and authorizations could have a material adverse effect on our business and results of operations.
U.S. regulations concerning export controls require us to screen potential customers, destinations, and technology to ensure that sensitive equipment, technology and services are not exported in violation of U.S. policy or diverted to improper uses or users.
In order for us to export certain products, technical data or services, we are required to obtain licenses from the U.S. government, often on a transaction-by-transaction basis. These licenses are generally required for the export of the military versions of our products and technical data and for defense services. We cannot be sure of our ability to obtain the U.S. government licenses or other approvals required to export our products, technical data and services for sales to foreign governments, foreign commercial customers or foreign destinations.
In addition, in order for us to obtain certain technical know-how from foreign vendors and to collaborate on improvements on such technology with foreign vendors, including at times our own foreign subsidiaries, we may need to obtain U.S. government approval for such collaboration through manufacturing license or technical assistance agreements approved by U.S. government export control agencies.
The U.S. government has the right, without notice, to revoke or suspend export licenses and authorizations for reasons of foreign policy, issues over which we have no control.
Failure to receive required licenses or authorizations would hinder our ability to export our products, data and services and to use some advanced technology from foreign sources. This could have a material adverse effect on our business, results of operations and financial condition.
Our failure to comply with export control rules could have a material adverse effect on our business.
Our failure to comply with the export control rules described above rules could expose us to significant criminal or civil enforcement action by the U.S. government, and a conviction could result in denial of export privileges, as well as contractual suspension or debarment under U.S. government contracts, either of which could have a material adverse effect on our business, results of operations and financial condition.
Our operating margins may decline under our fixed-price contracts if we fail to estimate accurately the time and resources necessary to satisfy our obligations.
Some of our contracts are fixed-price contracts under which we bear the risk of any cost overruns. Our profits are adversely affected if our costs under these contracts exceed the assumptions that we used in bidding for the contract. Often, we are required to fix the price for a contract before we finalize the project specifications, which increases the risk that we will misprice these contracts. The complexity of many of our engagements makes accurately estimating our time and resources more difficult. In the event we fail to estimate our time and resources accurately, our expenses will increase and our profitability, if any, under such contracts will decrease.
If we are unable to retain our contracts with the U.S. government and subcontracts under U.S. government prime contracts in the competitive rebidding process, our revenues may suffer.
Upon expiration of a U.S. government contract or subcontract under a U.S. government prime contract, if the government customer requires further services of the type provided in the contract, there is frequently a competitive rebidding process. We cannot guarantee that we, or if we are a subcontractor that the prime contractor, will win any particular bid, or that we will be able to replace business lost upon expiration or completion of a contract. Further, all U.S. government contracts are subject to protest by competitors. The termination or nonrenewal of several of our significant contracts could result in considerable revenue shortfalls.
The loss of, or a significant reduction in, U.S. military business would have a material adverse effect on us.
U.S. military contracts account for a significant portion of our business. The U.S. military funds these contracts in annual increments. These contracts require subsequent authorization and appropriation that may not occur or that may be greater than or less than the total amount of the contract. Changes in the U.S. military’s budget, spending allocations and the timing of such spending could adversely affect our ability to receive future contracts. None of our contracts with the U.S. military has a minimum purchase commitment, and the U.S. military generally has the right to cancel its contracts unilaterally without prior notice. The loss of, or a significant reduction in, U.S. military business could have a material adverse effect on our business, financial condition, results of operations and liquidity.
Market-Related Risks
The price of our common stock is volatile.
The market price of our common stock has been volatile in the past and may change rapidly in the future. The following factors, among others, may cause significant volatility in our stock price:
|
|
·
|
announcements by us, our competitors or our customers;
|
|
|
·
|
the introduction of new or enhanced products and services by us or our competitors;
|
|
|
·
|
changes in the perceived ability to commercialize our technology compared to that of our competitors;
|
|
|
·
|
rumors relating to our competitors or us;
|
|
|
·
|
actual or anticipated fluctuations in our operating results;
|
|
|
·
|
the issuance of our securities, including warrants, in connection with financings and acquisitions; and
|
|
|
·
|
general market or economic conditions.
|
If our shares were to be delisted, our stock price might decline further and we might be unable to raise additional capital.
One of the continued listing standards for our stock on the Nasdaq Stock Market (both the Nasdaq Global Market, on which our stock is currently listed, and the Nasdaq Capital Market) is the maintenance of a $1.00 bid price. Our stock price has periodically traded below $1.00 in the past. If our bid price were to decrease and remain below $1.00 for 30 consecutive business days, Nasdaq could notify us of our failure to meet the continued listing standards, after which we would have 180 calendar days to correct such failure or be delisted from the Nasdaq Global Market. Although we would have the opportunity to appeal any potential delisting, there can be no assurances that this appeal would be resolved favorably. As a result, there can be no assurance that our common stock will remain listed on the Nasdaq Global Market. If our common stock were to be delisted from the Nasdaq Global Market, we might apply to be listed on the Nasdaq Capital Market if we then met the initial listing standards of the Nasdaq Capital Market (other than the $1.00 minimum bid standard). If we were to move to the Nasdaq Capital Market, current Nasdaq regulations would give us the opportunity to obtain an additional 180-day grace period if we meet certain net income, stockholders’ equity or market capitalization criteria; if at the end of that period we had not yet achieved compliance with the minimum bid price rule, we would be subject to delisting from the Nasdaq Capital Market. Although we would have the opportunity to appeal any potential delisting, there can be no assurances that this appeal would be resolved favorably. In addition, we may be unable to satisfy the other continued listing requirements. As a result, there can be no assurance that our common stock will remain listed on the Nasdaq Stock Market.
While our stock would continue to trade on the over-the-counter bulletin board following any delisting from the Nasdaq, any such delisting of our common stock could have an adverse effect on the market price of, and the efficiency of the trading market for, our common stock. Trading volume of over-the-counter bulletin board stocks has been historically lower and more volatile than stocks traded on an exchange or the Nasdaq Stock Market. As a result, holders of our securities could find it more difficult to sell their securities. Also, if in the future we were to determine that we need to seek additional equity capital, any delisting could have an adverse effect on our ability to raise capital in the public equity markets.
In addition, if we fail to maintain Nasdaq listing for our securities, and no other exclusion from the definition of a “penny stock” under the Securities Exchange Act of 1934, as amended, is available, then any broker engaging in a transaction in our securities would be required to provide any customer with a risk disclosure document, disclosure of market quotations, if any, disclosure of the compensation of the broker-dealer and its salesperson in the transaction and monthly account statements showing the market values of our securities held in the customer’s account. The bid and offer quotation and compensation information must be provided prior to effecting the transaction and must be contained on the customer’s confirmation. If brokers become subject to the “penny stock” rules when engaging in transactions in our securities, they would become less willing to engage in transactions, thereby making it more difficult for our stockholders to dispose of their shares.
Changes in internal controls or accounting guidance could cause volatility in our stock price.
Guidance regarding implementation and interpretation of the provisions of Section 404 of the Sarbanes-Oxley Act continues to be issued by the standards-setting community. We became an accelerated filer as of December 31, 2014 and are subject to an audit of our internal controls. As a result of the ongoing interpretation of new guidance and the audit testing that may be required to be completed in the future, our internal controls over financial reporting may include an unidentified material weakness that would result in our receiving an adverse opinion on our internal controls over financial reporting from our independent registered public accounting firm. This could result in significant additional expenditures responding to the Section 404 internal control audit, heightened regulatory scrutiny and potentially an adverse effect to the price of our stock.
In addition, due to increased regulatory scrutiny surrounding publicly traded companies, the possibility exists that a restatement of past financial results could be necessitated by an alternative interpretation of present accounting guidance and practice. Although management does not currently anticipate that this will occur, a potential result of such interpretation could be costly and have an adverse effect on our stock price.
Failure to maintain effective internal control over financial reporting in accordance with Section 404 of the Sarbanes-Oxley Act could have a material adverse effect on our business and stock price.
During the course of testing our disclosure controls and procedures and internal control over financial reporting, we may identify and disclose material weaknesses or significant deficiencies in internal control over financial reporting that will have to be remedied. Implementing any appropriate changes to our internal control may require specific compliance training of our directors, officers and employees, entail substantial costs to modify our existing accounting systems, and take a significant period of time to complete. Such changes may not, however, be effective in maintaining the adequacy of our internal control over financial reporting, and any failure to maintain that adequacy or inability to produce accurate financial statements on a timely basis could result in our financial statements being unreliable, increase our operating costs and materially impair our ability to operate our business.
Failure to achieve and maintain effective internal control over financial reporting could result in a loss of investor confidence in our financial reports and could have a material adverse effect on our stock price. Additionally, failure to maintain effective internal control over our financial reporting could result in government investigation or sanctions by regulatory authorities.
Compliance with public company obligations, including the securities laws and regulations, is costly and requires significant management resources, and we may fail to comply. We are now an “accelerated filer,” and as a result are subject to more comprehensive disclosure obligations, with increased compliance costs.
The federal securities laws and regulations, including the corporate governance and other requirements of the Sarbanes-Oxley Act of 2002, impose complex and continually changing regulatory requirements on our operations and reporting. Because the aggregate market value of our public float was in excess of $75 million as of June 30, 2014, we became an “accelerated filer” as of the end of our 2014 fiscal year. As a result, pursuant to Section 404 of the Sarbanes-Oxley Act of 2002, our independent registered public accounting firm auditing our financial statements is now required to attest to and report on the effectiveness of our internal control over financial reporting, and we are now required to satisfy all of the larger reporting company disclosure requirements. These requirements have increased our legal compliance obligations and costs, which could harm our results of operations and divert management’s attention from business operations.
Relatively speaking, we are a small company with limited resources. There can be no assurances that we will be able to comply with the added “accelerated filer” requirements by applicable deadlines and to maintain compliance in the future. If our independent registered public accounting firm is unable to provide us with an unqualified report as to the effectiveness of our internal control over financial reporting for future year ends, investors could lose confidence in the reliability of our financial reporting.
We do not anticipate paying cash dividends.
We currently intend to retain any future earnings for funding growth and, as a result, do not expect to pay any cash dividends in the foreseeable future. Additionally, our ability to declare dividends, should we decide to do so, is restricted by the terms of our debt agreements.
Our certificate of incorporation and bylaws and Delaware law contain provisions that could discourage a takeover.
Provisions of our amended and restated certificate of incorporation may have the effect of making it more difficult for a third party to acquire, or of discouraging a third party from attempting to acquire, control of us. These provisions could limit the price that certain investors might be willing to pay in the future for shares of our common stock. These provisions:
|
•
|
divide our board of directors into three classes serving staggered three-year terms;
|
|
•
|
only permit removal of directors by stockholders “for cause,” and require the affirmative vote of at least 85% of the outstanding common stock to so remove; and
|
|
•
|
allow us to issue preferred stock without any vote or further action by the stockholders.
|
The classification system of electing directors and the removal provision may tend to discourage a third-party from making a tender offer or otherwise attempting to obtain control of us and may maintain the incumbency of our board of directors, as the classification of the board of directors increases the difficulty of replacing a majority of the directors. These provisions may have the effect of deferring hostile takeovers, delaying changes in our control or management or may make it more difficult for stockholders to take certain corporate actions. The amendment of any of these provisions would require approval by holders of at least 85% of the outstanding common stock.
Israel-Related Risks
A significant portion of our operations takes place in Israel, and we could be adversely affected by the economic, political and military conditions in that region.
The offices and facilities of Epsilor-EFL are located in Israel (in Beit Shemesh, Dimona, and Sderot, all of which are within Israel’s pre-1967 borders). Some of our senior management is located in Beit Shemesh. Although we expect that most of our sales will continue to be made to customers outside Israel, we are nonetheless directly affected by economic, political and military conditions in that country. Accordingly, any major hostilities involving Israel or the interruption or curtailment of trade between Israel and its present trading partners could have a material adverse effect on our operations. Since the establishment of the State of Israel in 1948, a number of armed conflicts have taken place between Israel and its Arab neighbors and a state of hostility, varying in degree and intensity, has led to security and economic problems for Israel.
Historically, Arab states have boycotted any direct trade with Israel and to varying degrees have imposed a secondary boycott on any company carrying on trade with or doing business in Israel. Although in October 1994, the states comprising the Gulf Cooperation Council (Saudi Arabia, the United Arab Emirates, Kuwait, Dubai, Bahrain and Oman) announced that they would no longer adhere to the secondary boycott against Israel, and Israel has entered into certain agreements with Egypt, Jordan, the Palestine Liberation Organization and the Palestinian Authority, Israel has not entered into any peace arrangement with Syria or Lebanon. Moreover, since September 2000, there has been a significant deterioration in Israel’s relationship with the Palestinian Authority. Efforts to resolve the problem have failed to result in an agreeable solution.
In July and August of 2006, Israel was involved in a full-scale armed conflict with Hezbollah, a Lebanese Islamist Shiite militia group and political party, in southern Lebanon, which involved missile strikes against civilian targets in northern Israel that resulted in economic losses. On August 14, 2006, a ceasefire was declared relating to that armed conflict, although it is uncertain whether or not the ceasefire will continue to hold.
Israel withdrew unilaterally from the Gaza Strip and certain areas in northern Samaria in 2005. Thereafter Hamas, an Islamist terrorist group responsible for many attacks, including missile strikes against Israeli civilian targets, won the majority of the seats in the Parliament of the Palestinian Authority in January 2006 and took control of the entire Gaza Strip, by force, in June 2007. Since then, Hamas and other Palestinian movements have launched thousands of missiles from the Gaza strip into civilian targets in southern Israel. In late 2008, a sharp increase in rocket fire from Gaza on Israel’s western Negev region, extending as far as 25 miles into Israeli territory and disrupting most day-to-day civilian activity in the proximity of the border with the Gaza Strip, prompted the Israeli government to launch military operations against Hamas that lasted approximately three weeks. Israel declared a unilateral ceasefire in January 2009, which substantially diminished the frequency of, but did not eliminate, Hamas rocket attacks against Israeli cities. In November 2012, following an increase in rocket attacks and hostile activity originating from the Gaza Strip, the Israeli government launched an air attack on Hamas. Rockets were fired into Israel extending as far as Tel Aviv and Jerusalem. After seven days, a ceasefire was agreed to by Israel and Hamas. This was followed by a period of relative calm that continued until July 2014, when rocket attacks resumed, and Israel began experiencing another round of armed conflict with Hamas in the Gaza Strip, with missiles reaching throughout Israel and Israeli ground forces engaged in operations within the Gaza Strip. The landing of one rocket about a mile from Israel’s primary international airport on July 22, 2014 caused the Federal Aviation Administration to prohibit landings of U.S.-based carriers into Ben Gurion International Airport for a period of approximately 48 hours. A ceasefire was agreed to in August 2014.
Our Israeli production facilities in the cities of Beit Shemesh and Dimona, are located approximately 27 miles and 38 miles, respectively, from the nearest point of the border with the Gaza Strip. We also have a small production facility in Sderot, which is located 0.6 miles from the nearest point of the border with the Gaza Strip. There can be no assurance that Hamas will not begin to use on a more frequent basis longer-range missiles capable of reaching our facilities, which could result in a significant disruption of the Israel-based portion of our business. Additionally, recent political events, including political uprisings, social unrest and regime change, in various countries in the Middle East and North Africa have weakened the stability of those countries, which could result in extremists coming to power, including in countries with which Israel has signed peace treaties that may not be respected by extremists. In addition, Iran has threatened to attack Israel, and is widely believed to be developing nuclear weapons. Iran is also believed to have a strong influence among extremist groups in the region, such as Hamas in Gaza and Hezbollah in Lebanon. These situations may potentially escalate in the future to more violent events which may affect Israel and us. Any major hostilities involving Israel, including as a result of the military conflicts between the Fatah and Hamas in Gaza Strip, Judea and Samaria, or the interruption or curtailment of trade between Israel and its present trading partners could have a material adverse effect on our business, operating results and financial condition.
In addition to the foregoing, since the end of 2010, numerous acts of protest and civil unrest have taken place in several countries in the Middle East and North Africa, many of which involved significant violence. The civil unrest in Egypt, which borders Israel, resulted in significant changes to the country’s government. In Syria, also bordering Israel, large and violent protests against the government are taking place. The ultimate effect of these developments on the political and security situation in the Middle East and on Israel’s position within the region is not clear at this time.
Service of process and enforcement of civil liabilities on us and our officers may be difficult to obtain.
We are organized under the laws of the State of Delaware and will be subject to service of process in the United States. However, approximately 21% of our assets are located outside the United States. In addition, two of our directors and some of our executive officers are residents of Israel and a portion of the assets of such directors and executive officers are located outside the United States.
There is doubt as to the enforceability of civil liabilities under the Securities Act of 1933, as amended, and the Securities Exchange Act of 1934, as amended, in original actions instituted in Israel. As a result, it may not be possible for investors to enforce or effect service of process upon these directors and executive officers or to judgments of U.S. courts predicated upon the civil liability provisions of U.S. laws against our assets, as well as the assets of these directors and executive officers. In addition, awards of punitive damages in actions brought in the U.S. or elsewhere may be unenforceable in Israel.
Exchange rate fluctuations between the U.S. dollar and the Israeli NIS may negatively affect our earnings.
Although a substantial majority of our revenues and a substantial portion of our expenses are denominated in U.S. dollars, a portion of our costs, including personnel and facilities-related expenses, is incurred in New Israeli Shekels (NIS). Inflation in Israel will have the effect of increasing the dollar cost of our operations in Israel, unless it is offset on a timely basis by a devaluation of the NIS relative to the dollar. In 2015, the inflation-adjusted NIS held steady against the dollar.
ITEM 1B. UNRESOLVED STAFF COMMENTS
None.
ITEM 2. PROPERTIES
Our primary executive offices are located in the offices of our Training and Simulation Division, consisting of approximately 17,300 square feet of office and warehouse space in Ann Arbor, Michigan, pursuant to a lease expiring in July 2018. We have also leased 17,200 square feet of office and warehouse space adjacent to our main offices pursuant to a lease beginning in June 2006 and expiring in July 2018. Additionally, pursuant to a lease expiring in October 2016, we are leasing approximately 10,000 square feet of office and lab space in Orlando, Florida.
We also lease approximately 5,500 square feet in Royal Oak, Michigan pursuant to a lease terminating in November 2018.
In August 2011, we purchased 40,000 square feet of office and warehouse space in Ann Arbor, Michigan, approximately three miles from the mail location of our Training and Simulation Division, where we began to consolidate certain of our operations beginning in 2011. Subsequently, in December 2012, we subleased 7,000 square feet of surplus space of the purchased building to a non-profit organization as office space for a term of ten years with an option to terminate the sublease with a one year prior notice in May 2018.
Our Power Systems Division operates out of facilities in Hanahan, South Carolina, constituting approximately 72,000 square feet, which are leased from the former owners of UEC through the end of 2019 with an option to renew through 2024.
Our management and administrative facilities and research, development and production facilities for the manufacture and assembly of our Survivor Locator Lights, constituting approximately 21,000 square feet, are located in Beit Shemesh, Israel, located between Jerusalem and Tel-Aviv (within Israel’s pre-1967 borders). The lease for these facilities in Israel expires on December 31, 2017. Certain of the members of our senior management, including our President and Chief Executive Officer, work extensively out of our Beit Shemesh facility. Our Chief Financial Officer works out of our Ann Arbor, Michigan facility.
Our Power Systems Division also maintains approximately 23,000 square feet of factory, office and warehouse space in Dimona, Israel, in Israel’s Negev desert (within Israel’s pre-1967 borders), on a month-to-month basis. We also maintain approximately 2,300 square feet of factory, office and warehouse space in Sderot, Israel, located approximately 0.6 miles from the nearest point of the border with the Gaza Strip, pursuant to a lease expiring in June 2016 and having a two-year renewal option.
In March 2007, we purchased 16,700 square feet of space for the now discontinued Armor Division in Auburn, Alabama for approximately $1.1 million pursuant to a seller-financed secured purchase money mortgage. Half of the mortgage is payable over ten years in equal monthly installments based on a 20-year amortization of the full principal amount, and the remaining half is payable at the end of ten years in a balloon payment. The building was leased to a third party and was listed for sale with a local real estate agent. Additionally, the carrying value of this property was written down to zero as part of the 2011 Armor Division impairment. On February 9, 2015, we sold the building to the current tenant for $925,000. On that same date, the existing mortgage and existing building lease were terminated which ended any obligation we had for this property.
We believe that our existing and currently planned facilities are adequate to meet our current and foreseeable future needs.
ITEM 3. LEGAL PROCEEDINGS
As of the date of this filing, there were no material pending legal proceedings against us.
ITEM 4. MINE SAFETY DISCLOSURES
None.
PART II
ITEM 5. MARKET FOR REGISTRANT’S COMMON EQUITY, RELATED STOCKHOLDER MATTERS AND ISSUER PURCHASES OF EQUITY SECURITIES
Information about our equity compensation plans may be found in Item 12 of this report which is hereby incorporated by reference.
Our common stock is traded on the Nasdaq Global Market. Our Nasdaq ticker symbol is “ARTX.” The following table sets forth, for the periods indicated, the range of high and low sales prices of our common stock on the Nasdaq Global Market System:
|
Year Ended December 31, 2015
|
|
High
|
|
|
Low
|
|
||
|
Fourth Quarter
|
|
$
|
2.31
|
|
|
$
|
1.27
|
|
|
Third Quarter
|
|
$
|
2.48
|
|
|
$
|
1.11
|
|
|
Second Quarter
|
|
$
|
3.26
|
|
|
$
|
2.39
|
|
|
First Quarter
|
|
$
|
3.74
|
|
|
$
|
2.18
|
|
|
Year Ended December 31, 2014
|
|
High
|
|
|
Low
|
|
||
|
Fourth Quarter
|
|
$
|
3.54
|
|
|
$
|
2.02
|
|
|
Third Quarter
|
|
$
|
4.73
|
|
|
$
|
3.13
|
|
|
Second Quarter
|
|
$
|
5.92
|
|
|
$
|
2.96
|
|
|
First Quarter
|
|
$
|
6.61
|
|
|
$
|
2.40
|
|
As of February 29, 2016, we had approximately 156 registered holders of record of our common stock.
Share Repurchase Program
In February 2009, we authorized the repurchase in the open market or in privately negotiated transactions of up to $1.0 million of our common stock. The repurchase program was extended in August 2015 for an additional year and the authorization expanded repurchase up to $2.0 million of our common stock. Pursuant to this program, through December 31, 2015, we repurchased 738,611 shares for an aggregate purchase price of $1,098,967, or $1,084,060, net of commissions. There were no shares repurchased during the three months ended December 31, 2015. As of December 31, 2015, we have remaining authorization for the repurchase of up to $915,940 in shares of our common stock. The repurchase program, which expires on August 10, 2016, is subject to management’s discretion.
Dividends
We have never paid any cash dividends on our common stock. The Board of Directors presently intends to retain all earnings for use in our business. Any future determination as to payment of dividends will depend upon our financial condition and results of operations and such other factors as the Board of Directors deems relevant. Additionally, our ability to declare dividends should we decide to do so is restricted by the terms of our debt agreements.
Performance Graph
The following performance graph and related information shall not be deemed “soliciting material” or to be “filed” with the SEC, nor shall such information be incorporated by reference into any future filing under the Securities Act of 1933, as amended (the “Securities Act”), or the Exchange Act of 1934 as amended (the “Exchange Act”), except to the extent that we specifically incorporate it by reference into such filing.
The following graph compares our cumulative total stockholder return for the past five years with the cumulative total return on the Russell Microcap Index (Broad Market Index) and a self-constructed peer group index (the “Peer Group Index”) consisting of two companies in the simulation and training space (Kratos Defense & Security Solutions, Inc. (NASDAQ: KTOS) and VirTra Systems, Inc. (OTC: VTSI)) and three companies in the power and defense space (Highpower International, Inc. (NASDAQ: HPJ), KVH Industries, Inc. (NASDAQ: KVHI) and API Technologies Corp. (NASDAQ: ATNY)). The market capitalization of the peer companies in the simulation and training space is roughly equivalent to that of the peer companies in the power and defense space, and we believe that all these companies are “microcap” companies that are fairly comparable to us.
The cumulative total stockholder return is based on $100 invested in our common stock and in the respective indices on January 1, 2010, and assumes that all dividends were reinvested. The stock prices on the performance graph are not necessarily indicative of future price performance.
CUMULATIVE TOTAL RETURN THROUGH DECEMBER 31, 2015 AMONG
AROTECH CORPORATION, THE RUSSELL MICROCAP INDEX,
AND PEER GROUP INDEX
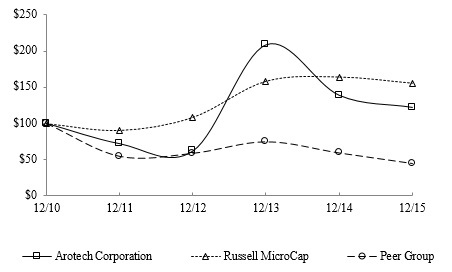
|
12/31/10
|
12/31/11
|
12/31/12
|
12/31/13
|
12/31/14
|
12/31/15
|
|||||||||||||||||||
|
AROTECH
|
100.00 | 71.86 | 61.68 | 208.98 | 138.92 | 122.16 | ||||||||||||||||||
|
PEER GROUP(1)
|
100.00 | 54.31 | 58.55 | 74.55 | 58.99 | 44.35 | ||||||||||||||||||
|
RUSSELL MICROCAP
|
100.00 | 90.73 | 108.64 | 158.20 | 163.97 | 155.51 | ||||||||||||||||||
|
|
(1)
|
The Peer Group Index is comprised of the following companies: Kratos Defense & Security Solutions, Inc., VirTra Systems, Inc., Highpower International, Inc., KVH Industries, Inc. and API Technologies Corp. The returns of each company have been weighted according to their respective stock market capitalization for purposes of arriving at a peer group average.
|
[Cumulative total return data provided by Research Data Group, Inc.]
ITEM 6. SELECTED FINANCIAL DATA
The selected financial information set forth below with respect to the consolidated statements of comprehensive income for each of the five fiscal years in the period ended December 31, 2015, and with respect to the consolidated balance sheets at the end of each such fiscal year has been derived from our consolidated financial statements audited by BDO USA, LLP, independent registered public accounting firm.
The results of operations, including revenue, operating expenses, and financial income, of the Armor Division for the year ended December 31, 2011 have been re-classified in the accompanying statements of operations as discontinued operations. Our accompanying consolidated balance sheet at December 31, 2011 gives effect to the assets of the armor division as Discontinued Operations within current assets and liabilities. Thus, the financial information presented herein includes only continuing operations.
The financial information set forth below is qualified by and should be read in conjunction with the consolidated financial statements contained in Item 8 of this Report and the notes thereto and “Item 7. Management’s Discussion and Analysis of Financial Condition and Results of Operations,” below.
|
Year Ended December 31,
|
||||||||||||||||||||
|
2015
|
2014
|
2013
|
2012
|
2011
|
||||||||||||||||
|
(dollars in thousands, except per share data)
|
||||||||||||||||||||
|
Statement of Comprehensive Income Data:
|
||||||||||||||||||||
|
Revenues
|
$ | 96,574 | $ | 103,562 | $ | 88,571 | $ | 80,050 | $ | 62,136 | ||||||||||
|
Cost of revenues
|
$ | 68,456 | $ | 70,855 | $ | 64,480 | $ | 62,141 | $ | 45,951 | ||||||||||
|
Research and development expenses
|
$ | 3,969 | $ | 3,322 | $ | 2,956 | $ | 2,044 | $ | 1,402 | ||||||||||
|
Selling and marketing expenses
|
$ | 5,373 | $ | 5,921 | $ | 5,618 | $ | 5,488 | $ | 5,255 | ||||||||||
|
General and administrative expenses
|
$ | 16,339 | $ | 17,261 | $ | 10,887 | $ | 10,053 | $ | 10,678 | ||||||||||
|
Amortization of intangible assets
|
$ | 3,044 | $ | 2,697 | $ | 1,091 | $ | 1,186 | $ | 1,905 | ||||||||||
|
Total operating costs and expenses
|
$ | 97,182 | $ | 100,057 | $ | 85,032 | $ | 80,911 | $ | 65,191 | ||||||||||
|
Operating income (loss)
|
$ | (608 | ) | $ | 3,506 | $ | 3,540 | $ | (861 | ) | $ | (3,055 | ) | |||||||
|
Other income (expense)
|
$ | (24 | ) | $ | 2,513 | $ | 270 | $ | 8 | $ | (44 | ) | ||||||||
|
Financial expense, net
|
$ | (1,152 | ) | $ | 1,507 | $ | (483 | ) | $ | (548 | ) | $ | 343 | |||||||
|
Total other income (expense)
|
$ | (1,176 | ) | $ | (1,005 | ) | $ | (213 | ) | $ | (540 | ) | $ | 299 | ||||||
|
Income (loss) before income tax expense
|
$ | (1,784 | ) | $ | 4,511 | $ | 3,327 | $ | (1,400 | ) | $ | (3,355 | ) | |||||||
|
Income tax expense
|
$ | 1,160 | $ | 1,024 | $ | 1,053 | $ | 628 | $ | 1,609 | ||||||||||
|
Net income (loss)
|
$ | (2,945 | ) | $ | 3,487 | $ | 2,152 | $ | (2,028 | ) | $ | (4,963 | ) | |||||||
|
Other comprehensive income (loss), net of income tax:
|
||||||||||||||||||||
|
Foreign currency translation adjustment
|
$ | 15 | $ | (1,206 | ) | $ | 628 | $ | (135 | ) | $ | (770 | ) | |||||||
|
Comprehensive income (loss)
|
$ | (2,930 | ) | $ | 2,281 | $ | 2,780 | $ | (3,152 | ) | $ | (12,297 | ) | |||||||
|
|
||||||||||||||||||||
|
Basic net income (loss) per share
|
$ | (0.12 | ) | $ | 0.16 | $ | 0.13 | $ | (0.21 | ) | $ | (0.82 | ) | |||||||
|
|
||||||||||||||||||||
|
Diluted net income (loss) per share
|
$ | (0.12 | ) | $ | 0.15 | $ | 0.12 | $ | (0.21 | ) | $ | (0.82 | ) | |||||||
|
Weighted average number of shares used in computing basic net income (loss) per share
|
23,687,733 | 21,934,532 | 16,507,848 | 14,713,583 | 14,011,566 | |||||||||||||||
|
Weighted average number of shares used in computing diluted net income (loss) per share
|
23,687,733 | 22,537,272 | 17,110,588 | 14,713,583 | 14,011,566 | |||||||||||||||
|
As At December 31,
|
||||||||||||||||||||
| 2015 | 2014 | 2013 | 2012 | 2011 | ||||||||||||||||
|
(dollars in thousands)
|
||||||||||||||||||||
|
Balance Sheet Data:
|
||||||||||||||||||||
|
Cash, cash equivalents, and restricted collateral deposits
|
$ | 10,698 | $ | 11,528 | $ | 6,320 | $ | 1,767 | $ | 4,004 | ||||||||||
|
Receivables and other assets
|
$ | 45,557 | $ | 49,486 | $ | 37,324 | $ | 38,848 | $ | 38,893 | ||||||||||
|
Property and equipment, net of depreciation
|
$ | 6,440 | $ | 6,463 | $ | 4,927 | $ | 4,465 | $ | 4,631 | ||||||||||
|
Goodwill and other intangible assets, net
|
$ | 54,798 | $ | 57,263 | $ | 32,084 | $ | 32,801 | $ | 33,574 | ||||||||||
|
Total assets
|
$ | 117,493 | $ | 124,739 | $ | 80,655 | $ | 77,880 | $ | 81,102 | ||||||||||
|
Current liabilities
|
$ | 26,776 | $ | 28,117 | $ | 18,235 | $ | 26,473 | $ | 28,379 | ||||||||||
|
Long-term liabilities
|
$ | 26,669 | $ | 30,266 | $ | 14,443 | $ | 12,986 | $ | 11,598 | ||||||||||
|
Stockholders’ equity
|
$ | 64,047 | $ | 66,355 | $ | 47,977 | $ | 38,421 | $ | 41,125 | ||||||||||
|
Total liabilities and stockholders’ equity
|
$ | 117,493 | $ | 124,739 | $ | 80,655 | $ | 77,880 | $ | 81,102 | ||||||||||
ITEM 7. MANAGEMENT’S DISCUSSION AND ANALYSIS OF FINANCIAL CONDITION AND RESULTS OF OPERATION
The following Management’s Discussion and Analysis of Financial Condition and Results of Operations contains forward-looking statements that involve inherent risks and uncertainties. When used in this discussion, the words “believes,” “anticipates,” “expects,” “estimates” and similar expressions are intended to identify such forward-looking statements. Such statements are subject to certain risks and uncertainties that could cause actual results to differ materially from those projected. Readers are cautioned not to place undue reliance on these forward-looking statements, which speak only as of the date hereof. We undertake no obligation to publicly release the result of any revisions to these forward-looking statements that may be made to reflect events or circumstances after the date hereof or to reflect the occurrence of unanticipated events. Our actual results could differ materially from those anticipated in these forward-looking statements as a result of certain factors including, but not limited to, those set forth elsewhere in this report. Please see “Risk Factors,” above, and in our other filings with the Securities and Exchange Commission.
The following discussion and analysis should be read in conjunction with the Consolidated Financial Statements contained in Item 8 of this report, and the notes thereto. We have rounded amounts reported here to the nearest thousand, unless such amounts are more than $1.0 million, in which event we have rounded such amounts to the nearest hundred thousand.
General
We are a defense and security products and services company, engaged in two business areas: interactive simulation for military, law enforcement and commercial markets; and batteries and charging systems for the military, commercial and medical markets. We operate in two business units:
|
Ø
|
We develop, manufacture and market advanced high-tech multimedia and interactive digital solutions for use-of-force training and driving training of military, law enforcement, security, emergency services and other personnel through our Training and Simulation Division.
|
|
Ø
|
We provide advanced battery solutions, innovative energy management and power distribution technologies and world-class product design and manufacturing services for the aerospace, defense, law enforcement, homeland security markets, and we manufacture and sell lithium and Zinc-Air batteries for defense and security products and other military applications, through our Power Systems Division.
|
Our results for 2013 and for the first three months of 2014 do not include the results of UEC Electronics, LLC, a South Carolina limited liability company that we purchased on April 1, 2014.
Until December 2011 we were also engaged in utilizing advanced engineering concepts to manufacture military and paramilitary armored vehicles, and employing sophisticated lightweight materials to produce aviation armor, through our Armor Division. In December 2011, our Board of Directors approved management’s plan to sell our Armor Division in order to focus on the more profitable and growth-oriented aspects of our business. We completed the sale of our Armor Division in June 2012. Unless otherwise indicated, all reported figures include only these operations and exclude the discontinued Armor segment.
Critical Accounting Policies
The preparation of financial statements requires us to make estimates and assumptions that affect the reported amounts of assets and liabilities and the disclosure of contingent liabilities at the date of the financial statements and the reported amounts of revenues and expenses during the reporting period. On an ongoing basis, we evaluate our estimates and judgments, including those related to revenue recognition, allowance for bad debts, taxes, inventory, purchase price allocation, contingencies and deferred warranty revenue, impairment of intangible assets and goodwill. We base our estimates and judgments on historical experience and on various other factors that we believe to be reasonable under the circumstances, the results of which form the basis for making judgments about the carrying values of assets and liabilities that are not readily apparent from other sources. Under different assumptions or conditions, actual results may differ from these estimates.
We believe the following critical accounting policies affect our more significant judgments and estimates used in the preparation of our consolidated financial statements.
Revenue Recognition
Significant management judgments and estimates must be made and used in connection with the recognition of revenue in any accounting period. Material differences in the amount of revenue in any given period may result if these judgments or estimates prove to be incorrect or if management’s estimates change on the basis of development of the business or market conditions. Management judgments and estimates have been applied consistently and have been reliable historically.
A portion of our revenue is derived from license agreements that entail the customization of FAAC’s simulators to the customer’s specific requirements. Revenues from initial license fees for such arrangements are recognized in accordance with Financial Accounting Standards Board (“FASB”) ASC 605-35 based on the percentage of completion method over the period from signing of the license through to customer acceptance, as such simulators require significant modification or customization that takes time to complete. The percentage of completion is measured by monitoring progress using records of actual time incurred to date in the project compared with the total estimated project requirement, which corresponds to the costs related to earned revenues. Estimates of total project requirements are based on prior experience of customization, delivery and acceptance of the same or similar technology and are reviewed and updated regularly by management.
Similarly, UEC also uses percentage of completion for certain contracts. The percentage of completion is measured by monitoring progress using records of actual time incurred to date in the project compared with the total estimated project requirement, which corresponds to the costs related to earned revenues. Estimates of total project requirements are based on prior experience of customization, delivery and acceptance of the same or similar technology and are reviewed and updated regularly by management.
We believe that the use of the percentage of completion method is appropriate as we have the ability to make reasonably dependable estimates of the extent of progress towards completion, contract revenues and contract costs. In addition, contracts executed include provisions that clearly specify the enforceable rights regarding services to be provided and received by the parties to the contracts, the consideration to be exchanged and the manner and terms of settlement. In all cases we expect to perform our contractual obligations and our licensees are expected to satisfy their obligations under the contract. The complexity of the estimation process and the issues related to the assumptions, risks and uncertainties inherent with the application of the percentage of completion method of accounting affect the amounts of revenue and related expenses reported in our consolidated financial statements. A number of internal and external factors can affect our estimates, including labor rates, utilization and specification and testing requirement changes.
We account for our other revenues from MILO Range simulators in accordance with the provisions of FASB ASC 985-605. We exercise judgment and use estimates in connection with the determination of the amount of software license and services revenues to be recognized in each accounting period.
Allowance for Doubtful Accounts
We make judgments as to our ability to collect outstanding receivables and provide allowances for the portion of receivables when collection becomes doubtful. If necessary, provisions are made based upon a specific review of all significant outstanding receivables. In determining the provision, we analyze our historical collection experience and current economic trends. We reassess these allowances each accounting period. Historically, our actual losses and credits have been consistent with these provisions with the exception of 2014, when we wrote off $305,000 in our Training and Simulation Division for a bad debt with a foreign client. If actual payment experience with our customers is different than our estimates, adjustments to these allowances may be necessary resulting in additional charges to our statement of operations.
Accounting for Income Taxes
Significant judgment is required in determining our worldwide income tax expense provision. In the ordinary course of a global business, there are many transactions and calculations where the ultimate tax outcome is uncertain. Some of these uncertainties arise as a consequence of cost reimbursement arrangements among related entities, the process of identifying items of revenue and expense that qualify for preferential tax treatment and segregation of foreign and domestic income. Although we believe that our estimates are reasonable, the final tax outcome of these matters may be different than that which is reflected in our historical income tax provisions and accruals.
We have provided a valuation allowance on our net deferred income tax assets, which includes federal, state and foreign net operating loss carryforwards, because of the uncertainty regarding their realization. Our accounting for deferred taxes under FASB ASC 740-10, involves the evaluation of a number of factors concerning the realizability of our deferred tax assets. In concluding that a valuation allowance was required, we primarily considered such factors as our history of operating losses and expected future losses in certain jurisdictions and the nature of our deferred tax assets. We provide valuation allowances in respect of deferred tax assets resulting principally from the carryforward of tax losses. Management currently believes that it is more likely than not that our deferred tax assets in the U.S. and Israel will not be realized in the foreseeable future but as our results improve, this may change in future periods. We do not provide for U.S. federal income taxes on the undistributed earnings of our foreign subsidiaries because such earnings are re-invested and, in the opinion of management, will continue to be re-invested indefinitely.
We have indefinitely-lived intangible assets consisting of trademarks and goodwill. Pursuant to FASB ASC 350-10, these indefinitely-lived intangible assets are not amortized for financial reporting purposes. However, these assets are tax deductible, and therefore amortized over 15 years for tax purposes. As such, deferred income tax expense and a deferred tax liability arise as a result of the tax-deductibility of these indefinitely-lived intangible assets. The resulting deferred tax liability, which is expected to continue to increase over time, will have an indefinite life, resulting in what is referred to as a “naked tax credit.” This deferred tax liability could remain on our balance sheet indefinitely for continuing operations unless there is an impairment of the related assets (for financial reporting purposes), or the business to which those assets relate were to be disposed of. Due to the fact that the aforementioned deferred tax liability could have an indefinite life, it should not be netted against our deferred tax assets (which primarily relate to net operating loss carryforwards) when determining the required valuation allowance. Doing so would result in the understatement of the valuation allowance and related deferred income tax expense.
We have adopted the provisions of the FASB ASC 740-10. FASB ASC 740-10 prescribes a recognition threshold and measurement attribute for the financial statement recognition and measurement of a tax position taken in a tax return. We must determine whether it is “more-likely-than-not” that a tax position will be sustained upon examination, including resolution of any related appeals or litigation processes, based on the technical merits of the position. Once it is determined that a position meets the more-likely-than-not recognition threshold, the position is measured to determine the amount of benefit to recognize in the financial statements. Uncertain tax positions require determinations and estimated liabilities to be made based on provisions of the tax law which may be subject to change or varying interpretation. If our determinations and estimates prove to be inaccurate, the resulting adjustments could be material to our future financial statements.
In addition, we operate within multiple taxing jurisdictions and may be subject to audits in these jurisdictions. These audits can involve complex issues that may require an extended period of time for resolution. In management’s opinion, adequate provisions for income taxes have been made.
Inventories
Our policy for valuation of inventory and commitments to purchase inventory, including the determination of obsolete or excess inventory, requires us to perform a detailed assessment of inventory at each balance sheet date, which includes a review of, among other factors, an estimate of future demand for products within specific time horizons, valuation of existing inventory, as well as product lifecycle and product development plans. The estimates of future demand that we use in the valuation of inventory are the basis for our revenue forecast, which is also used for our short-term manufacturing plans. Inventory reserves are also provided to cover risks arising from slow-moving items. We write down our inventory for estimated obsolescence or unmarketable inventory equal to the difference between the cost of inventory and the estimated market value based on assumptions about future demand and market conditions. We may be required to record additional inventory write-down if actual market conditions are less favorable than those projected by our management. For fiscal 2015, no significant changes were made to the underlying assumptions related to estimates of inventory valuation or the methodology applied.
Goodwill
As of December 31, 2015, we had recorded goodwill of $45.5 million. We allocate goodwill acquired in a business combination to the appropriate reporting unit as of the acquisition date. Our two reporting units, Training and Simulation and our Power Systems Divisions are also our reportable segments. The associated goodwill of was determined when the specific businesses in the reportable segments were purchased. For the Training and Simulation Division and the Power Systems Division, we have recorded goodwill amounting to $24.4 million and $21.1 million, respectively.
When testing goodwill for impairment we have the option of performing a qualitative assessment before calculating the fair value of a reporting unit. If the Company determines, on the basis of qualitative factors, that it is more likely than not that the fair value of the reporting unit is greater than the carrying amount, the two-step impairment test would not be required. If we cannot determine on the basis of qualitative factors that goodwill is not impaired, goodwill is then tested for impairment by using a discounted cash flow analysis. This type of analysis requires us to make assumptions and estimates regarding industry economic factors and the profitability of future business strategies. Significant estimates used in the methodologies include estimates of future cash flows, future short-term and long-term growth rates, weighted average cost of capital and estimates of market multiples for the reportable units. It is our policy to conduct impairment testing based on our current business strategy in light of present industry and economic conditions, as well as future expectations. In assessing the recoverability of our goodwill, we may be required to make assumptions regarding estimated future cash flows and other factors to determine the fair value of the respective assets. This process is subjective and requires judgment at many points throughout the analysis. If our estimates or their related assumptions change in subsequent periods or if actual cash flows are below our estimates, we may be required to record impairment charges for these assets not previously recorded.
We completed our annual goodwill impairment review using the financial results as of the quarter ended December 31, 2015, using our forecasted plan developed in the fourth quarter.
With respect to our Training and Simulation Division, we determined, using qualitative factors, that goodwill was not impaired.
For our Power Systems Division, we determined that it was necessary to perform a quantitative assessment of our goodwill for the purpose of determining whether a goodwill impairment existed at December 31, 2015. When conducting this analysis, we identified the four factors necessary to ensure the accuracy and completeness of our analysis.
|
|
1.
|
We engaged third party valuation experts with a detailed understanding of our Power Systems Division, to perform a valuation of the Power Systems Division on a going concern basis. The fair value was defined as the price that would be received to sell an asset or paid to transfer a liability in an orderly transaction between market participants at December 31, 2015.
|
|
|
2.
|
We evaluated whether the financial performance realized in 2015 was a result of discrete matters that are considered highly unlikely to recur in the future or whether the matters were systemic in nature that might result in a downturn of the reporting unit.
|
|
|
3.
|
We engaged third party consultants to validate our 2016 budget used in our discounted cash flow analysis.
|
|
|
4.
|
We prepared a discounted cash flow analysis over a five year period so as to derived a reasonable view of the cash flows that the Power Systems Division would generate from 2016-2020.
|
Key valuation assumptions
Inherent in a valuation of a firm is the reliance on key assumptions, including, but not limited to, the cash flows of the reporting unit, weighted average cost of capital (“WACC”), and terminal growth rates of the Company. In evaluating our key variables, we concluded, consistent with 2014, that our WACC and terminal growth rates of the Company were approximately 12% and 3%, respectively. With all other assumptions remaining constant, to the extent that either the WACC increases by 0.5% or the terminal growth rate decreases by 0.5%, we may determine that proceeding to step 2 of the impairment analysis, as indicated in ASC 350-10, is necessary.
Throughout the course of 2015 and into the 2016 budget planning process, we continued to monitor the results of the reporting unit to understand whether our operating losses in the quarters ended June 30 and September 30, 2015 were as a result of discrete matters that we consider highly unlikely to recur in the future or were systemic business issues that might result in a prolonged downturn of the reporting unit. During this process, we concluded that significant revenues that were originally planned for 2015 are now anticipated to materialize in future years. Furthermore, we anticipate that we will realize the benefits of the transition of the production of EFB products to UEC in 2016 and into future years.
As part of our of our annual budget process, the Power Systems Division leadership team prepared its 2016 budget and provided a prospective view of their various businesses, including key products, new and existing markets and customers, and their insight into the future growth of the business. In light of the financial performance of the reporting unit in 2015 pertaining to the shift of UEC revenue to future years and the difficulties encountered during the transition of EFB to UEC, we believed that it was necessary to engage a third party to validate our key assumptions so as to provide an independent view of our projections. Their conclusions were consistent with our conclusions and were the basis for our 2016 budget and the starting point for our future projections. However, to the extent that there is a significant economic downturn, a freeze in military spending, a loss of a major contract or customer, or a significant shift of pre-existing customer arrangement to future years, we may need to evaluate goodwill for impairment in between the annual measurement period if events and circumstances indicated that it is more likely than not the asset is impaired.
As a result of our quantitative analysis, in which we computed the fair value of the Power Systems Division, we concluded that the fair value of the reporting unit exceeded the reporting unit’s carrying value by approximately 2%. We will continue to monitor the actual results of the reporting unit against our plan and re-evaluate goodwill as required in between the annual measurement period if events and circumstances indicated that it is more likely than not the asset is impaired.
We also consider our current market capitalization compared to the sum of the estimated fair values of our reporting units in conjunction with each impairment assessment. As part of this consideration, management recognizes that our market capitalization may not be an accurate representation of the sum of the reporting unit fair values for the following reasons:
|
|
·
|
The long term horizon of the valuation process versus a short term valuation using current market conditions;
|
|
|
·
|
The valuation by individual business segments versus the market share value based on our company as a whole including unallocable corporate costs;
|
|
|
·
|
The fact that our stock is thinly traded and widely dispersed with minimal institutional ownership, and thus not followed by major market analysts, leading management to conclude that the market in our securities was not acting as an informationally efficient reflection of all known information regarding us; and
|
|
|
·
|
Control premiums reflected in the reporting unit fair values but not in our stock price.
|
As of the December 31, 2015 valuation date, our market capitalization was approximately $50.4 million, which did not, in management’s view, suggest that the fair value estimates used in its impairment assessment required any adjustment. Subsequent to the end of the year, our market capitalization increased to approximately $66 million as of the close of business on March 11, 2016.
As a result of these analyses, we concluded that the goodwill recorded in relation to the Power Systems Division was not impaired at December 31, 2015.
Other Intangible Assets
Other intangible assets are amortized over the period during which benefits are expected to accrue, currently estimated at one to ten years.
The determination of the value of such intangible assets requires us to make assumptions regarding future business conditions and operating results in order to estimate future cash flows and other factors to determine the fair value of the respective assets. If these estimates or the related assumptions change in the future, we could be required to record additional impairment charges.
Impairment analysis triggering events include - A significant decrease in the market price of a long-lived asset, a significant adverse change in the extent or manner in which a long-lived asset is being used or in its physical condition, a significant adverse change in legal factors or in the business climate that could affect the value of a long-lived asset, a current-period operating or cash flow loss combined with a history of operating or cash flow losses or a projection or forecast that demonstrates continuing losses associated with the use of the long lived asset, and a current expectation that, more likely than not, a long-lived asset will be sold or otherwise disposed of significantly before the end of its previously estimated useful life.
Contingencies
We are from time to time involved in legal proceedings and other claims. We are required to assess the likelihood of any adverse judgments or outcomes to these matters, as well as potential ranges of probable losses. We have not made any material changes in the accounting methodology used to establish our self-insured liabilities during the past three fiscal years.
A determination of the amount of reserves required, if any, for any contingencies are made after careful analysis of each individual issue. The required reserves may change due to future developments in each matter or changes in approach, such as a change in the settlement strategy in dealing with any contingencies, which may result in higher net loss.
If actual results are not consistent with our assumptions and judgments, we may be exposed to gains or losses that could be material.
Warranty Reserves
We typically offer a one to two year warranty for many of our products. The specific terms and conditions of those warranties vary depending upon the product sold and country in which we do business. We estimate the costs that may be incurred under our basic limited warranty, including parts and labor, and record warranty liability in the amount of such costs at the time product revenue is recognized. Factors that affect our warranty liability include the number of installed units, historical and anticipated rates of warranty claims, and cost per claim. We periodically assesses the adequacy of our reserves and adjust the amounts as necessary.
Functional Currency
We consider the United States dollar to be the currency of the primary economic environment in which we and EFL operate and, therefore, both we and EFL have adopted and are using the United States dollar as our functional currency. Transactions and balances originally denominated in U.S. dollars are presented at the original amounts. Gains and losses arising from non-dollar transactions and balances are included in net income.
The majority of financial transactions of Epsilor is in New Israeli Shekels (“NIS”) and a substantial portion of Epsilor’s costs is incurred in NIS. Management believes that the NIS is the functional currency of Epsilor. Accordingly, the financial statements of Epsilor have been translated into U.S. dollars. All balance sheet accounts have been translated using the exchange rates in effect at the balance sheet date. Statement of operations amounts have been translated using the average exchange rate for the period. The resulting translation adjustments are reported as a component of accumulated other comprehensive loss in stockholders’ equity.
Executive Summary
Overview of Results of Operations
We achieved profitability for the years ended December 31, 2014 and 2013 but we incurred an operating loss for the year ended December 31, 2015. While we expect to continue to derive revenues from the sale of products that we manufacture and the services that we provide, there can be no assurance that we will be able to regain or maintain profitability on a consistent basis.
Throughout the course of 2015, we continued to achieve profitable results in our Training and Simulation Division. Our reported revenues and net income were $54.6 million and $8.7 million, respectively. However, our Power Systems Division experienced a decline in both revenues and net income resulting in reported revenue and a net loss of $42.0 million and $4.7 million, respectively. The decline in revenues resulted from a shift in customer demand that led to higher proportional costs relative to revenue than experienced in 2014. In addition, we experienced significant one-time transition related expenses of $1.0 million associated with the EFB plant closure and related transfer of production to our UEC business based in South Carolina.
Acquisitions
In acquisition of subsidiaries, part of the purchase price is allocated to intangible assets and goodwill. Amortization of intangible assets related to acquisition of subsidiaries is recorded based on the estimated expected life of the assets. Accordingly, for a period of time following an acquisition, we incur a non-cash charge related to amortization of intangible assets in the amount of a fraction (based on the useful life of the intangible assets) of the amount recorded as intangible assets. Such amortization charges continued during 2015 and increased due to the UEC acquisition. We are required to review intangible assets for impairment whenever events or changes in circumstances indicate that carrying amount of the assets may not be recoverable. If we determine, through the impairment review process, that an intangible asset has been impaired, we must record the impairment charge in our statement of operations.
In the case of goodwill, the assets recorded as goodwill are not amortized; instead, we are required to perform an annual impairment review. If we determine, through the impairment review process, that goodwill has been impaired, we must record the impairment charge in our statement of operations.
We incurred non-cash charges for amortization of intangible assets in 2015, 2014 and 2013 in the amount of $3.0 million, $2.7 million and $1.1 million, respectively.
Issuances of Restricted Shares and Restricted Stock Units.
During 2015 we issued restricted shares to our directors, and during 2014 and 2013, we issued restricted shares and restricted stock units to certain of our employees and to our directors. Each restricted stock unit is equal to one share of Company common stock and is redeemable only for stock. These shares were issued as time and performance grants or were the required annual grant to directors, and are restricted for a period of up to three years from the date of issuance in accordance with the terms of our 2009 Equity Incentive Plan and our 2007 Non-Employee Director Equity Compensation Plan. Relevant accounting rules provide that the aggregate amount of the difference between the purchase price of the restricted shares or restricted stock units (in this case, generally zero) and the market price of the shares on the date of grant is taken as a general and administrative expense, amortized over the life of the period of the restriction.
We incurred non-cash charges related to stock-based compensation in 2015, 2014 and 2013 in the amount of approximately $622,000, $1.4 million and $437,000, respectively.
Accelerated Filer Status
We became an accelerated filer as of December 31, 2014 and are now subject to an audit of our internal controls. Our general and administrative expenses in 2015 reflect these new expenses, which are expected to continue going forward.
Overview of Operating Performance and Backlog
Overall, our pre-tax loss from continuing operations for 2015 was $1.8 million on revenues of $96.6 million, compared to a pre-tax profit from continuing operations of $4.5 million on revenues of $103.6 million for 2014, and a pre-tax profit from continuing operations of $3.3 million on revenues of $88.6 million during 2013. As of December 31, 2015, our overall backlog for continuing operations totaled $63.0 million, compared to a backlog of $69.9 million as of December 31, 2014 and $58.0 million as of December 31, 2013.
In our Training and Simulation Division, revenues decreased from $63.4 million in 2013 to $56.4 million in 2014 to $54.6 million in 2015. This decrease was primarily due to the wind down of the first phase of our VCTS program and the timing of contracts. As of December 31, 2015, our backlog for our Training and Simulation Division totaled $29.8 million, compared to a backlog of $45.7 million as of December 31, 2014 and a backlog of $45.9 million as of December 31, 2013.
In our Power Systems Division, revenues increased from $25.2 million in 2013 to $47.2 million in 2014 and decreased to $42.0 million in 2015. This increase in revenues between 2014 and 2013 was primarily due to having nine months of UEC operations in 2014 as the business was acquired in April 2014. The decrease in revenues between 2015 and 2014 was primarily due to sales delays on existing customer programs. As of December 31, 2015, our backlog for our Power Systems Division totaled $33.2 million, compared to a backlog of $24.2 million as of December 31, 2014 and a backlog of $12.1 million as of December 31, 2013.
Common Stock Repurchase Program
In February of 2009, we authorized the repurchase in the open market or in privately negotiated transactions of up to $1.0 million of our common stock. The repurchase program was extended in August 2015 for an additional year and the authorization expanded repurchases up to $2.0 million of the Company’s common stock. Pursuant to this plan, through December 31, 2015 we have repurchased an aggregate of 738,611 shares of our common stock for an aggregate purchase price of $1,098,967 ($1,084,060 net of commissions), all of which was purchased after April 1, 2009. At December 31, 2015, we had remaining authorization for the repurchase of up to $915,940 in shares of our common stock. The repurchase program, which expires on August 10, 2016, is subject to the discretion of our management.
Results of Operations
Summary
Following is a table summarizing our results of continuing operations for the years ended December 31, 2015, 2014 and 2013, after which we present a narrative discussion and analysis. Our results for 2013 and for the first three months of 2014 do not include the results of UEC Electronics, LLC, a South Carolina limited liability company that we purchased on April 1, 2014.
|
Year Ended December 31,
|
||||||||||||
|
2015
|
2014
|
2013
|
||||||||||
|
Revenues:
|
||||||||||||
|
Training and Simulation Division
|
$
|
54,617,611
|
$
|
56,404,498
|
$
|
63,425,319
|
||||||
|
Power Systems Division
|
41,956,336
|
47,157,851
|
25,146,109
|
|||||||||
|
$
|
96,573,947
|
$
|
103,562,349
|
$
|
88,571,428
|
|||||||
|
Cost of revenues:
|
||||||||||||
|
Training and Simulation Division
|
$
|
34,238,306
|
$
|
35,322,870
|
$
|
44,257,129
|
||||||
|
Power Systems Division
|
34,218,016
|
35,531,867
|
20,223,011
|
|||||||||
|
$
|
68,456,322
|
$
|
70,854,737
|
$
|
64,480,140
|
|||||||
|
Research and development expenses:
|
||||||||||||
|
Training and Simulation Division
|
$
|
1,766,667
|
$
|
1,571,295
|
$
|
1,296,956
|
||||||
|
Power Systems Division
|
2,202,752
|
1,751,154
|
1,658,927
|
|||||||||
|
$
|
3,969,419
|
$
|
3,322,449
|
$
|
2,955,883
|
|||||||
|
Selling and marketing expenses:
|
||||||||||||
|
Training and Simulation Division
|
$
|
4,796,288
|
$
|
4,800,580
|
$
|
4,448,036
|
||||||
|
Power Systems Division
|
577,133
|
1,120,758
|
1,169,669
|
|||||||||
|
$
|
5,373,421
|
$
|
5,921,338
|
$
|
5,617,705
|
|||||||
|
General and administrative expenses:
|
||||||||||||
|
Training and Simulation Division
|
$
|
4,610,586
|
$
|
4,340,145
|
$
|
3,553,058
|
||||||
|
Power Systems Division
|
6,859,143
|
3,941,568
|
1,630,641
|
|||||||||
|
Corporate
|
4,869,298
|
8,979,645
|
5,703,260
|
|||||||||
|
$
|
16,339,027
|
$
|
17,261,358
|
$
|
10,886,959
|
|||||||
|
Amortization of intangible assets:
|
||||||||||||
|
Training and Simulation Division
|
$
|
264,411
|
$
|
263,365
|
$
|
581,886
|
||||||
|
Power Systems Division
|
2,779,125
|
2,433,375
|
509,240
|
|||||||||
|
$
|
3,043,536
|
$
|
2,696,740
|
$
|
1,091,126
|
|||||||
|
Operating income (loss):
|
||||||||||||
|
Training and Simulation Division
|
$
|
8,941,353
|
$
|
10,106,243
|
$
|
9,288,254
|
||||||
|
Power Systems Division
|
(4,679,833
|
)
|
2,379,129
|
(45,379
|
)
|
|||||||
|
Corporate
|
(4,869,298
|
)
|
(8,979,645
|
)
|
(5,703,260
|
)
|
||||||
|
$
|
(607,778
|
)
|
$
|
3,505,727
|
$
|
3,539,615
|
||||||
|
Other income (loss):
|
||||||||||||
|
Training and Simulation Division
|
$
|
51,349
|
$
|
227,360
|
$
|
4,761
|
||||||
|
Power Systems Division
|
(79,030
|
)
|
200,125
|
237,182
|
||||||||
|
Corporate
|
3,500
|
2,085,075
|
27,986
|
|||||||||
|
$
|
(24,181
|
)
|
$
|
2,512,560
|
$
|
269,929
|
||||||
|
Financial (expense) income:
|
||||||||||||
|
Training and Simulation Division
|
$
|
(59,791
|
)
|
$
|
(50,975
|
)
|
$
|
(44,146
|
)
|
|||
|
Power Systems Division
|
21,432
|
(203,902
|
)
|
(14,315
|
)
|
|||||||
|
Corporate
|
(1,113,762
|
)
|
(1,252,612
|
)
|
(424,395
|
)
|
||||||
|
$
|
(1,152,121
|
)
|
$
|
(1,507,489
|
)
|
$
|
(482,856
|
)
|
||||
|
Income tax expense (benefit):
|
||||||||||||
|
Training and Simulation Division
|
$
|
233,106
|
$
|
133,692
|
$
|
319,225
|
||||||
|
Power Systems Division
|
-
|
(61,777
|
)
|
134,995
|
||||||||
|
Corporate
|
927,840
|
951,922
|
598,500
|
|||||||||
|
$
|
1,160,946
|
$
|
1,023,837
|
$
|
1,052,720
|
|||||||
|
Net income (loss) – continuing operations:
|
||||||||||||
|
Training and Simulation Division
|
$
|
8,699,805
|
$
|
10,148,936
|
$
|
8,929,644
|
||||||
|
Power Systems Division
|
(4,737,431
|
)
|
2,437,129
|
42,493
|
||||||||
|
Corporate
|
(6,907,400
|
)
|
(9,099,104
|
)
|
(6,698,167
|
)
|
||||||
|
$
|
(2,945,026
|
)
|
$
|
3,486,961
|
$
|
2,273,970
|
||||||
Fiscal Year 2015 compared to Fiscal Year 2014
Revenues. During 2015, we recognized revenues as follows:
|
Ø
|
Training and Simulation Division – We recognized revenues from the sale of air warfare simulators and vehicle simulators, interactive use-of-force training systems and from the provision of maintenance services in connection with such systems.
|
|
Ø
|
Power Systems Division – We recognized revenues from sales of electronics engineering products and provision of design services for the military, as well as from the sale of batteries, chargers, adapters and power hub products to the military and commercial customers. We also recognized revenues from the sale of water-activated battery (“WAB”) lifejacket lights.
|
Revenues for 2015 totaled $96.6 million, compared to $103.6 million in 2014, a decrease of $7.0 million, or 6.8%, due primarily to delays on existed customer programs in our Power Systems Division. In 2015, revenues were $54.6 million for the Training and Simulation Division as compared to $56.4 million in 2014, a decrease of $1.8 million, or 3.2%, due primarily to the timing of contracts; and $42.0 million for the Power Systems Division as compared to $47.2 million in 2014, a decrease of $5.2 million, or 11%, as noted above.
The table below details the percentage of total recognized revenue by type of arrangement for the years ended December 31, 2015 and 2014:
|
Year Ended December 31,
|
||||||||
|
Type of Revenue
|
2015
|
2014
|
||||||
|
Sale of products
|
94.1
|
%
|
94.7
|
%
|
||||
|
Maintenance and support agreements
|
5.5
|
%
|
3.8
|
%
|
||||
|
Long term research and development contracts
|
0.4
|
%
|
1.5
|
%
|
||||
|
Total
|
100.0
|
%
|
100.0
|
%
|
||||
Cost of revenues. Cost of revenues totaled $68.5 million during 2015, compared to $70.9 million in 2014, an decrease of $2.4 million, or 3.4%, due primarily to lower costs associated with lower revenues. Cost of revenues were $34.2 million for the Training and Simulation Division as compared to $35.3 million in 2014, a decrease of $1.1 million, or 3.1%, due primarily to lower costs associated with lower revenues and $34.2 million for the Power Systems Division as compared to $35.5 million in 2014, a decrease of $1.3 million, or 3.7%, due primarily to lower costs associated with decreased revenues.
Research and development expenses. Research and development expenses for 2015 were $4.0 million, compared to $3.3 million during 2014, an increase of $647,000, or 19.5%, due primarily to increased product development activities in our Power Systems Division as well as the inclusion of twelve months of UEC operations in 2015 as compared to nine months of operations in 2014.
Selling and marketing expenses. Selling and marketing expenses for 2015 were $5.4 million, compared to $5.9 million in 2014, a decrease of $548,000, or 9.3%, due primarily to the reduction in headcount and marketing efforts associated with the relocation of the EFB operation from Alabama to South Carolina.
General and administrative expenses. General and administrative expenses for 2015 were $16.3 million, compared to $17.3 million in 2014, a decrease of $1.0 million, or 5.2%, due primarily to a gain of $895,000 on the sale of our Auburn, Alabama building in March 2015.
Amortization of intangible assets. Amortization of intangible assets totaled $3.0 million in 2015, compared to $2.7 million in 2014, an increase of $347,000, or 12.9%, due primarily to having had twelve months of UEC operations in 2015 compared to nine months in 2014.
Other income (expense), net. Other expense totaled ($24,000) in 2015, compared to other income of $2.5 million in 2014, a decrease of $2.5 million. This decrease is due primarily to a $2.0 million fair value adjustment of the potential 2015 earn-out due the previous owners of UEC.
Financial expense, net. Financial expense totaled $1.2 million in 2015, compared to financial expense of $1.5 million in 2014, a decrease of $355,000, or 23.6%, due primarily to non-recurring fees associated with the financing of the UEC acquisition in 2014.
Income taxes. We recorded $1.2 million in tax expense in 2015, compared to $1.0 million in tax expense in 2014, an increase of $137,000, or 13.4%, primarily due to incremental tax recognized in related to the “naked’ tax credits previously described.
Net income (loss). Due to the factors cited above, we went from a net income from continuing operations of $3.5 million in 2014 to a net loss of $2.9 million in 2015, a difference of $6.4 million.
Fiscal Year 2014 compared to Fiscal Year 2013
Revenues. During 2014, we recognized revenues as follows:
|
Ø
|
Training and Simulation Division – We recognized revenues from the sale of air warfare simulators and vehicle simulators, interactive use-of-force training systems and from the provision of maintenance services in connection with such systems.
|
|
Ø
|
Power Systems Division – We recognized revenues from sales of electronics engineering products and provision of design services for the military, as well as from the sale of batteries, chargers, adapters and power hub products to the military and commercial customers. We also recognized revenues from the sale of WAB lifejacket lights.
|
Revenues for 2014 totaled $103.6 million, compared to $88.6 million in 2013, an increase of $15.0 million, or 16.9%, due to the factors discussed below. In 2014, revenues were $56.4 million for the Training and Simulation Division as compared to $63.4 million in 2013, a decrease of $7.0 million, or 11.1%, due primarily to the wind down of the first phase of our VCTS program; and $47.2 million for the Power Systems Division as compared to $25.2 million in 2013, an increase of $22.0 million, or 87.5%, due primarily to $27.2 million in revenue generated by our new electronics engineering and design services for the military business, offset by reduced revenue in certain of our other businesses.
The table below details the percentage of total recognized revenue by type of arrangement for the years ended December 31, 2014 and 2013:
|
Year Ended December 31,
|
||||||||
|
Type of Revenue
|
2014
|
2013
|
||||||
|
Sale of products
|
94.7
|
%
|
95.0
|
%
|
||||
|
Maintenance and support agreements
|
3.8
|
%
|
3.3
|
%
|
||||
|
Long term research and development contracts
|
1.5
|
%
|
1.7
|
%
|
||||
|
Total
|
100.0
|
%
|
100.0
|
%
|
||||
Cost of revenues. Cost of revenues totaled $70.9 million during 2014, compared to $64.5 million in 2013, a decrease of $6.4 million, or 9.9%, due primarily to the product mix of the reporting units, which included products sold at a higher margin. Cost of revenues were $35.3 million for the Training and Simulation Division as compared to $44.3 million in 2013, a decrease of $9.0 million, or 20.2%, due primarily to lower revenue and a higher margin product mix and $35.5 million for the Power Systems Division (compared to $20.2 million in 2013, an increase of $15.3 million, or 75.7%, due primarily to revenue generated by our electronics engineering and design services for the military business, offset by reduced revenue in certain of our other businesses).
Research and development expenses. Research and development expenses for 2014 were $3.3 million, compared to $3.0 million during 2013, an increase of $367,000, or 12.4%, due primarily to continuing research on training systems and battery technologies for new products.
Selling and marketing expenses. Selling and marketing expenses for 2014 were $5.9 million, compared to $5.6 million in 2013, an increase of $304,000, or 5.4%, due primarily to increased trade show representation and the sales efforts of both divisions, including additional expenses related to our addition of a new line of business.
General and administrative expenses. General and administrative expenses for 2014 were $17.3 million, compared to $10.9 million in 2013, an increase of $6.4 million, or 56.9%, due primarily to our acquisition of UEC and $813,000 in one-time, acquisition related expenses, along with increased corporate salary and benefit expenses.
Amortization of intangible assets. Amortization of intangible assets totaled $2.7 million in 2014, compared to $1.1 million in 2013, an increase of $1.6 million, or 147.2%, due primarily to the additional $2.4 million in amortization expenses relating to our acquisition of UEC, offset by fully amortized acquisition related intangibles relating to other subsidiaries in our Training and Simulation and Power Systems Divisions.
Other income. Other income totaled $2.6 million in 2014, compared to other income of $286,000 in 2013, an increase of $2.3 million, due primarily to a $2.0 million fair value adjustment of the potential 2015 earn-out due the previous owners of UEC. This adjustment was recorded due to reduction of the deemed purchase price of UEC as a result of potential payments to the seller that will not be earned because of changes in the expected timing of forecasted cash flows.
Financial expense, net. Financial expense totaled $1.6 million in 2014, compared to financial expense of $449,000 in 2013, an increase of $1.1 million, due primarily to increased long term interest and bank financing fees relating to our acquisition of UEC, offset by a decrease in corporate interest and bank charges in 2014.
Income taxes. We recorded $1.0 million in tax expense in 2014, compared to $1.1 million in tax expense in 2013, a decrease of $30,000, or 2.7%, mainly concerning “naked” tax credits previously described.
Net income. Due to the factors cited above, we went from a net income from continuing operations of $2.3 million in 2013 to a net income of $3.5 million in 2014, an improvement of $1.2 million, or 53.3%.
Liquidity and Capital Resources
As of December 31, 2015, we had $10.6 million in cash and $90,000 in restricted collateral deposits, as compared to December 31, 2014, when we had $11.3 million in cash and $236,000 in restricted collateral deposits, and December 31, 2013, when we had $5.8 million in cash and $498,000 in restricted collateral deposits. We have experienced fluctuations in available cash in the previous twelve months due to the funding requirements of our larger contracts. These fluctuations have not had a significant impact on our operations, due in part to the increase in our credit facility that was negotiated with our previous primary bank in 2013. We also had $9.3 million in available, unused bank lines of credit with our previous primary bank as of December 31, 2015, under a $15.0 million credit facility under our FAAC subsidiary, described below.
We used available funds in 2015 primarily for investment in fixed assets, repayment of long-term debt, and funding losses from operations within our Power Systems Division for the quarters ended June 30 and September 30, 2015. We purchased approximately $2.0 million of property and equipment during 2015. Our net property and equipment amounted to $6.4 million as of December 31, 2015.
Net cash provided by operating activities for 2015, 2014 and 2013 was $4.4 million, $7.4 million and $10.2 million, respectively, representing a net change between 2015 and 2014 of $3.0 million and between 2014 and 2013 of $2.8 million. The net change in cash providing by operating activities for 2015 as compared to 2014 was due primarily to losses from continuing operations and a gain recorded on the sale of a building located in Auburn, Alabama of approximately $895,000; offset by a net increase in working capital of approximately $2.0 million, and the non-recurring change in fair value of an earnout of $2.0 million related to the UEC acquisition in 2014. The timing of cash inflows and outflows impacting working capital has impacted us due to the timing of contracts, production, and procurement and collections associated with our Simulation and Training Division and Power Systems Division.
Net cash used in investing activities for 2015, 2014 and 2013 was $1.4 million, $31.3 million and $1.9 million, a net change between 2015 and 2014 of $29.9 million and between 2014 and 2013 of $29.4 million. The net change in cash used in investing activities for 2015 as compared to 2014 was approximately $30 million. This difference was due primarily to the non-recurring nature of the cash used to acquire UEC in 2014 net of cash proceeds of approximately $925,000 from the sale of the building located in Auburn, Alabama.
Net cash provided by (used in) financing activities for 2015, 2014 and 2013 was ($3.6) million, $29.9 million and ($4.4) million, respectively, a change between 2015 and 2014 of $33.5 million and between 2014 and 2013 of $34.3 million. The decrease in 2015 of cash provided by financing activities was due to the $22.5 million in long term debt incurred in 2014 in connection with the acquisition of UEC and net proceeds from the 2014 stock offering in the amount of $10.7 million as compared to no stock offering proceeds in 2015. This change in cash was offset by an increase in our line of credit of $4.0 million used primarily to fund operating losses in our Power Systems Division and a decrease in cash used to pay the UEC acquisition related earnout of $2.5 million. Additionally, there were repayments of an additional $5.1 million in long-term debt in 2015.
As of December 31, 2015, our line-of-credit and long-term bank debt, including current maturities, was $4.1 million and $16.2 million as compared to December 31, 2014, when we had no amount outstanding on our line of credit and $20.3 million in long-term debt outstanding, including current maturities.
Effective at the end of the second quarter 2015, our bank eliminated the covenant that provided that UEC’s earnings before interest, taxes, depreciation and amortization with certain add-backs (“EBITDA”) may not be less than $4.5 million for any trailing twelve-month period ending at the end of a fiscal quarter. In addition, during the fiscal quarter ended September 30, 2015, the Company obtained a waiver from the Bank with respect to maintaining a minimum fixed charge coverage ratio of 1.25 to 1. The Company was required to prepare quarterly covenant calculations and provide compliance certificates to its former primary lender. With the onset of the new bank agreement described below, the requirement to submit its December 31, 2015 covenants was discharged thereby eliminating the requirement to obtain a waiver for the period. The Company’s projections indicate compliance with the new lending agreement covenants throughout 2016.
On March 11, 2016, we entered into a new credit agreement with a new primary bank, whereby our new bank agreed to provide (i) a $15.0 million revolving credit facility (“Revolver”), (ii) a $10.0 million Term Loan (the “Term Loan”), and (iii) a $1.0 million Mortgage Loan (the “Mortgage Loan” and, together with the Revolver and the Term Loan, the “Credit Facilities”) in respect to property located in Ann Arbor, Michigan.
The maturity of the Term Loan is five years from the date of the new credit agreement. The Term Loan maintains an interest rate on a scale ranging from LIBOR plus 2.0% up to LIBOR plus 3.25%. The repayment of the Term Loan will consist of 60 consecutive monthly payments of principal plus accrued interest based on annual principal reductions of 10% during the first year, 20% during the second through fourth years, and 30% during the fifth year. The Revolver and Term Loan are secured by our assets and the assets of our domestic subsidiaries.
The maturity of the Mortgage Loan is five years from the date of the new credit agreement and maintains an interest rate on a scale identical to the Term Loan.
The Credit Facilities maintain certain reporting requirements, conditions precedent, affirmative covenants and financial covenants. The financial covenants include that we must maintain both a Maximum Debt to EBITDA ratio of 3.00 to 1.00 and a Minimum Fixed Charge Coverage Ratio of 1.20 to 1.00.
Subject to all of the reservations regarding “forward-looking statements” set forth above, we believe that our present cash position, anticipated cash flows from operations and availability under our lines of credit should be sufficient to satisfy our current estimated cash requirements through the next twelve months. In this connection, we note that from time to time our working capital needs are partially dependent on our and/or our subsidiaries’ lines of credit.
Effective Corporate Tax Rate
Certain of our subsidiaries incurred net operating losses during the years ended December 31, 2015 and 2014. With respect to some of our U.S. subsidiaries that operated at a net profit during 2013, we were able to offset federal taxes against our net operating loss carryforward. These subsidiaries are, however, subject to state taxes that cannot be offset against our net operating loss carryforward. We also set up a tax liability for the impact of the deductions taken for goodwill.
As of December 31, 2015, we had a U.S. net operating loss carryforward of approximately $36 million that is available to offset future taxable income under certain circumstances, expiring primarily from 2021 through 2032, and foreign net operating and loss carryforwards of approximately $80.1 million, which are available indefinitely to offset future taxable income under certain circumstances.
Off-Balance Sheet Arrangements
We do not have any off-balance sheet arrangements that have or are reasonably likely to have a current or future effect on our financial condition, changes in financial condition, revenues or expenses, results of operations, liquidity, capital expenditures or capital resources that are material to our stockholders.
Contractual Obligations
The following table lists our contractual obligations and commitments as of December 31, 2015, not including trade payables and other accounts payable:
|
Payment Due by Period
|
||||||||||||||||||||
|
Contractual Obligations
|
Total
|
Less Than 1 Year
|
1-3 Years
|
3-5 Years
|
More than 5 Years
|
|||||||||||||||
|
Bank obligations*
|
$
|
20,278,960
|
$
|
8,422,438
|
$
|
11,040,218
|
$
|
816,304
|
$
|
–
|
||||||||||
|
Operating lease obligations**
|
$
|
3,280,394
|
$
|
1,143,388
|
$
|
2,137,006
|
$
|
–
|
$
|
–
|
||||||||||
|
Severance obligations***
|
$
|
7,516,980
|
$
|
–
|
$
|
2,623,752
|
$
|
–
|
$
|
4,893,228
|
||||||||||
|
*Includes $4,060,000 in short-term bank debt.
|
||||||||||||
|
**Includes operating lease obligations related to rent.
|
||||||||||||
|
***Includes obligations related to special severance pay arrangements in addition to the severance amounts due to certain employees pursuant to Israeli severance pay law (the amount shown in the table above with payment due during the next 1-3 years might not be paid in the period stated in the event the employment agreements to which such severance obligations relate are extended).
|
||||||||||||
ITEM 7A. QUANTITATIVE AND QUALITATIVE DISCLOSURES ABOUT MARKET RISK.
Not applicable.
ITEM 8. FINANCIAL STATEMENTS AND SUPPLEMENTARY DATA
|
Consolidated Financial Statements
|
Page
|
|
|
F-1
|
||
|
F-2
|
||
|
F-4
|
||
|
F-5
|
||
|
F-8
|
||
|
F-10
|
ITEM 9. CHANGES IN AND DISAGREEMENTS WITH ACCOUNTANTS ON ACCOUNTING AND FINANCIAL DISCLOSURE
Not applicable.
ITEM 9A. CONTROLS AND PROCEDURES
Evaluation of Disclosure Controls and Procedures
As of December 31, 2015, our management, including the principal executive officer and principal financial officer, evaluated our disclosure controls and procedures related to the recording, processing, summarization, and reporting of information in our reports that we file with the SEC. These disclosure controls and procedures are intended to ensure that information relating to us, including our subsidiaries, that is required to be disclosed in the reports that we file with the SEC is made known to our management, including these officers, by other of our employees, and that this information is recorded, processed, summarized, evaluated, and reported, as applicable, within the time periods specified in the SEC’s rules and forms and to allow timely decisions regarding required disclosure. Due to the inherent limitations of control systems, not all misstatements may be detected. These inherent limitations include the realities that judgments in decision-making can be faulty and that breakdowns can occur because of simple error or mistake. Any system of controls and procedures, no matter how well designed and operated, can at best provide only reasonable assurance that the objectives of the system are met and management necessarily is required to apply its judgment in evaluating the cost benefit relationship of possible controls and procedures. Additionally, controls can be circumvented by the individual acts of some persons, by collusion of two or more people, or by management override of the control. Our controls and procedures are intended to provide only reasonable, not absolute, assurance that the above objectives have been met.
Based on their evaluation as of December 31, 2015, our principal executive officer and principal financial officer were able to conclude that our disclosure controls and procedures (as defined in Rules 13a-15(e) and 15d-15(e) under the Securities Exchange Act of 1934) were effective.
We will continue to review and evaluate the design and effectiveness of our disclosure controls and procedures on an ongoing basis and to improve our controls and procedures over time and correct any deficiencies that we may discover in the future. Our goal is to ensure that our senior management has timely access to all material financial and non-financial information concerning our business. While we believe the present design of our disclosure controls and procedures is effective to achieve our goal, future events affecting our business may cause us to modify our disclosure controls and procedures.
Management’s Report on Internal Control Over Financial Reporting
Our management, including our principal executive and financial officers, is responsible for establishing and maintaining adequate internal control over our financial reporting, as such term is defined in Exchange Act Rule 13a-15(f). Our management has evaluated the effectiveness of our internal controls over financial reporting as of the end of the period covered by this Annual Report on Form 10-K for the year ended December 31, 2015. In making our assessment of internal control over financial reporting, management used the criteria set forth by the Committee of Sponsoring Organizations (“COSO”) of the Treadway Commission in the 2013 Internal Control – Integrated Framework.
Our management concluded that our internal control over financial reporting was effective as of December 31, 2015.
Our internal control over financial reporting as of December 31, 2015 has been audited by BDO USA, LLP, an independent registered public accounting firm, as stated in their attestation report which appears herein.
Changes in Internal Control Over Financial Reporting
There have been no changes in our internal control over financial reporting that occurred during our last fiscal quarter to which this Annual Report on Form 10-K relates that have materially affected, or are reasonably likely to materially affect, our internal control over financial reporting.
Report of Independent Registered Public Accounting Firm
To the Board of Directors and Shareholders of Arotech Corporation
Ann Arbor, Michigan
We have audited Arotech Corporation’s internal control over financial reporting as of December 31, 2015, based on criteria established in Internal Control – Integrated Framework (2013) issued by the Committee of Sponsoring Organizations of the Treadway Commission (the COSO criteria). Arotech Corporation’s management is responsible for maintaining effective internal control over financial reporting and for its assessment of the effectiveness of internal control over financial reporting, included in this Item 9A, Management’s Report on Internal Control Over Financial Reporting. Our responsibility is to express an opinion on the Company’s internal control over financial reporting based on our audit.
We conducted our audit in accordance with the standards of the Public Company Accounting Oversight Board (United States). Those standards require that we plan and perform the audit to obtain reasonable assurance about whether effective internal control over financial reporting was maintained in all material respects. Our audit included obtaining an understanding of internal control over financial reporting, assessing the risk that a material weakness exists, and testing and evaluating the design and operating effectiveness of internal control based on the assessed risk. Our audit also included performing such other procedures as we considered necessary in the circumstances. We believe that our audit provides a reasonable basis for our opinion.
A company’s internal control over financial reporting is a process designed to provide reasonable assurance regarding the reliability of financial reporting and the preparation of financial statements for external purposes in accordance with generally accepted accounting principles. A company’s internal control over financial reporting includes those policies and procedures that (1) pertain to the maintenance of records that, in reasonable detail, accurately and fairly reflect the transactions and dispositions of the assets of the company; (2) provide reasonable assurance that transactions are recorded as necessary to permit preparation of financial statements in accordance with generally accepted accounting principles, and that receipts and expenditures of the company are being made only in accordance with authorizations of management and directors of the company; and (3) provide reasonable assurance regarding prevention or timely detection of unauthorized acquisition, use, or disposition of the company’s assets that could have a material effect on the financial statements.
Because of its inherent limitations, internal control over financial reporting may not prevent or detect misstatements. Also, projections of any evaluation of effectiveness to future periods are subject to the risk that controls may become inadequate because of changes in conditions, or that the degree of compliance with the policies or procedures may deteriorate.
In our opinion, Arotech Corporation maintained, in all material respects, effective internal control over financial reporting as of December 31, 2015, based on the COSO criteria.
We also have audited, in accordance with the standards of the Public Company Accounting Oversight Board (United States), the consolidated balance sheets of Arotech Corporation as of December 31, 2015, 2014 and 2013, and the related consolidated statements of comprehensive income, changes in stockholders’ equity and cash flows for each of the three years in the period ended December 31, 2015 and our report dated March 15, 2016 expressed an unqualified opinion thereon.
/s/ BDO USA, LLP
Grand Rapids, Michigan
March 15, 2016
ITEM 9B. OTHER INFORMATION
None.
PART III
ITEM 10. DIRECTORS, EXECUTIVE OFFICERS AND CORPORATE GOVERNANCE
Executive Officers, Directors and Significant Employees
Executive Officers and Directors
Our executive officers and directors and their ages as of February 29, 2016 were as follows:
|
Name
|
Age
|
Position
|
||
|
Steven Esses
|
52
|
President, Chief Executive Officer and Director
|
||
|
Robert S. Ehrlich
|
78
|
Executive Chairman of the Board
|
||
|
Dr. Jay M. Eastman
|
67
|
Director
|
||
|
Michael E. Marrus
|
52
|
Director
|
||
|
Richard Rudy
|
57
|
Director
|
||
|
Kenneth W. Cappell
|
63
|
Director
|
||
|
Jon B. Kutler
|
59
|
Director
|
||
|
Carol J. Battershell
|
54
|
Director
|
||
|
James J. Quinn
|
63
|
Director Nominee
|
||
|
Thomas J. Paup
|
67
|
Senior Vice President – Finance and Chief Financial Officer
|
Our by-laws provide for a board of directors of one or more directors. There are currently eight directors. Under the terms of our certificate of incorporation, the board of directors is composed of three classes of similar size, each elected in a different year, so that only one-third of the board of directors is elected in any single year. Dr. Eastman, Mr. Marrus and Mr. Kutler are designated Class I directors and have been elected for a term expiring in 2018 or until their successors are elected and qualified; Mr. Rudy and Ms. Battershell are designated Class II directors elected for a term expiring in 2017 or until their successors are elected and qualified; and Messrs. Esses, Ehrlich and Cappell are designated Class III directors elected for a term that expires in 2016 or until their successors are elected and qualified. A majority of the Board is “independent” under relevant SEC and Nasdaq regulations.
On February 16, 2016, Robert S. Ehrlich, the Executive Chairman of our Board, delivered written notice to the Secretary of the Board announcing his intention not to seek reelection to his position on the Board at our 2016 annual meeting of stockholders. Upon his leaving the Board, Mr. Ehrlich will no longer serve as the Executive Chairman of the Board of Directors but will continue to be employed by us as the Chairman of the Company’s Iron Flow Storage development program through the end of his current employment agreement.
Directors and Executive Officers
Steven Esses has been our President and Chief Executive Officer since October 2014. He has been a director since July 2002, our Executive Vice President since January 2003, our Chief Operating Officer from February 2003 until February 2012 and our President since December 2005. From 2000 until 2002, Mr. Esses was a principal with Stillwater Capital Partners, Inc. (“Stillwater”), a New York-based investment research and advisory company specializing in alternative investment strategies. During this time, Mr. Esses also acted as an independent consultant to new and existing businesses in the areas of finance and business development. In 1995, Mr. Esses founded the Dunkin’ Donuts franchise in Israel and was its Managing Director and CEO until 2005. Before founding Dunkin’ Donuts Israel, Mr. Esses was the Director of Retail Jewelry Franchises with Hamilton Jewelry, and before that he served as Executive Director of Operations for the Conway Organization, a major off-price retailer with 17 locations.
Mr. Esses has been actively involved in the day-to-day management of companies since he was 22, when he co-founded a company that eventually went public. He has worked in retail and wholesale, in high-tech and low-tech, in a variety of industries. Throughout his career, he has been highly numbers-oriented, focusing on budgetary and fiscal matters and on building business value. We believe that Mr. Esses’s background and experience make him appropriate to serve as one of our directors in light of our business and structure.
Robert S. Ehrlich has been our Executive Chairman of the Board since October 2014 and was our Chairman of the Board from January 1993. From October 2002 until September 2014, Mr. Ehrlich was our Chief Executive Officer. From May 1991 until January 1993, Mr. Ehrlich was our Vice Chairman of the Board, from May 1991 until October 2002 he was our Chief Financial Officer, and from October 2002 until December 2005, Mr. Ehrlich also held the title of President. From 1981 to 1991, Mr. Ehrlich served as Chairman of the Board and CEO of Fresenius USA, Inc. (NYSE: FRN), a manufacturer of medical devices. Mr. Ehrlich received a B.S. and J.D. from Columbia University in New York, New York.
Mr. Ehrlich has experience as an accountant, an attorney and as an investment banker. He has been involved with public companies since the late 1960s, both as an investment banker and as the chief financial officer and a director of Mattel (Nasdaq: MAT), where he was instrumental in helping to uncover fraudulent practices in the preparation of certain of that company’s financial statements, and he continued to serve as a director of Mattel through the late 1980s. After leaving Mattel, Mr. Ehrlich founded his own boutique investment banking company and became a director of certain of the companies involved in his investment banking business. Mr. Ehrlich ultimately became the Chairman and CEO of Fresenius USA, prior to becoming our Chief Financial Officer in 1991 and our Chief Executive Officer in 2002. We believe that Mr. Ehrlich’s background and experience make him appropriate to serve as one of our directors in light of our business and structure.
Dr. Jay M. Eastman has been one of our directors since October 1993. From November 1991 to December 2011, Dr. Eastman served as President and Chief Executive Officer of Lucid, Inc. (OTCQB: LCDX), a public company that is developing laser technology applications for medical diagnosis and treatment; since December 2011, Dr. Eastman has served as a director and Chief Science Officer of Lucid. Dr. Eastman is also a director of Dimension Technologies, Inc., a developer and manufacturer of 3D displays for computer and video displays, and of Chapman Instruments, Inc., a private manufacturer of precision surface metrology instruments. From 1981 until 1983, Dr. Eastman was the Director of the University of Rochester’s Laboratory for Laser Energetics, where he was a member of the staff from 1975 to 1981. He holds, as inventor or co-inventor, 44 patents, and is a fellow of the Optical Society of America and the Society of Photo-Optical Instrumentation Engineers, as well as an honorary member of the Rochester Engineering Society. Dr. Eastman holds a B.S. and a Ph.D. in Optics from the University of Rochester in New York.
Dr. Eastman brings to our Board the unique perspective of a trained scientist who has also been deeply involved in the business world. Since many of our products are of a “high-tech” nature, Dr. Eastman’s scientific background is extremely valuable to the Board. Additionally, Dr. Eastman brings to the Board his experience as President and Chief Executive Officer of a high-tech company, as well as his experience as a director of other public companies. We believe that Dr. Eastman’s background and experience make him appropriate to serve as one of our directors in light of our business and structure.
Michael E. Marrus has been one of our directors since October 2007. Since September 2015, Mr. Marrus has been the managing director of The Special Equities Group is a Division of Chardan Capital Markets, LLC. Before that, Mr. Marrus was a Senior Managing Director at Dominick and Dominick, a wealth management and investment services firm, and a Managing Director of Merriman Capital, Inc., a financial services firm focused on growth companies. From 1998 to 2009, he was a Managing Director of C.E. Unterberg, Towbin & Co., an investment banking firm that was acquired by Collins Stewart plc. Prior to joining Unterberg, Towbin, Mr. Marrus was a Principal and founding member of Fieldstone Private Capital Group, an investment banking firm specializing in corporate, project and structured finance. Previously, he was employed at Bankers Trust Company, initially in the Private Equity and Merchant Banking Groups and subsequently in BT Securities, the securities affiliate of Bankers Trust. Mr. Marrus has an A.B. from Brown University and an MBA from the Graduate School of Business, University of Chicago.
Mr. Marrus has been involved in mergers and acquisitions as an investment banker and has experience in company valuation in a wide range of industries, a critical skill set for us. We believe that Mr. Marrus’s background and experience make him appropriate to serve as one of our directors in light of our business and structure.
Richard I. Rudy has been one of our directors since August 2014. Since January of 2012, Mr. Rudy has been a founder and partner of Advanced Energy Capital, LLC, a private investment management concern with a focus on energy-related investments. Prior to that, beginning in 1997, Mr. Rudy was a principal of Stillwater; before that, he was Chief Financial Officer and general counsel of the Conway Stores, a New York-based chain of discount apparel stores. Mr. Rudy received a B.S. (summa cum laude) in accounting from Brooklyn College and a J.D. from New York University School of Law.
Mr. Rudy has experience as a CFO, an attorney and a hedge fund principal, which positions him for all aspects of credit analysis and management. He spent several years at EF Hutton, a stock brokerage firm, and Drexel, Burnham & Lambert, formerly an investment banking firm focused on leveraged buyouts, advising high net worth clients with regard to alternatives to traditional equity and credit investments, including energy and real estate-related investments. Mr. Rudy spent several years in a variety of corporate financial/managerial capacities and was jointly responsible for founding and running a $1.3 billion investment advisor whose primary focus was credit and asset based lending. Over the last years he has spearheaded several energy-related transactions and has through Advanced Energy Capital and other vehicles, financed over $400 million in energy-related sales transactions. He has co-managed many investment funds and vehicles and has been featured at several alternative investment conferences around the world. He has served on the boards of directors of several privately held companies and charitable institutions. We believe that Mr. Rudy’s background and experience make him appropriate to serve as one of our directors in light of our business and structure.
Kenneth W. Cappell has been one of our directors since May 2015. Mr. Cappell has been an Adjunct Professor of Accounting at Baruch College since August 2015. Mr. Cappell held a similar role at Yeshiva University from August 2014 until his appointment at Baruch College. From 1987 until 2014, Mr. Cappell was a partner of PwC and its predecessor firms, first as an audit partner (through 2000), then as a regional leader of internal audit services (through 2010), and finally as a managing partner of strategic development for PwC’s Risk Assurance practice (through his retirement in 2014). Mr. Cappell has worked with public companies in a variety of industries, including consumer and industrial products, financial services and entertainment. He has advised public company audit committees on diverse topics and has served as the de facto internal audit director at several companies. Mr. Cappell is a member of AICPA and the New York State Society of CPAs. He has served as a guest lecturer at the New York University Stern School of Business and Baruch College. Mr. Cappell has a B.A. in Economics from Yeshiva University and an MBA in Finance from NYU Stern.
Mr. Cappell brings many years of experience as a partner at PwC with extensive financial accounting knowledge that is critical to our board of directors. Mr. Cappell’s experience with accounting principles, financial reporting rules and regulations, evaluating financial results and generally overseeing the financial reporting process of large public companies from an independent auditor’s perspective, coupled with his knowledge of internal audit, risks and controls, makes him an invaluable asset to our board of directors. We believe that Mr. Cappell’s background and experience make him appropriate to serve as one of our directors in light of our business and structure.
Jon B. Kutler has been one of our directors since February 2016. Mr. Kutler is currently chairman and CEO of Admiralty Partners, Inc. (“API”), a private equity investment firm, a position he has held for more than the past five years. After service in the U.S. Navy and nearly a decade on Wall Street, Mr. Kutler founded Quarterdeck Investment Partners, an international investment bank focused on the global aerospace and defense markets. He sold Quarterdeck to Jefferies & Company in 2002 to focus on private equity investments under API. He is a Trustee of the California Institute of Technology, where he serves as chairman of the Jet Propulsion Laboratory and as a member of the Technology Transfer Committee. From January 2011 until its sale in February 2016, Mr. Kutler served on the Board of Directors of TeleCommunication Systems, Inc. (Nasdaq: TSYS). Mr. Kutler is a graduate of the United States Naval Academy and holds a Bachelor of Science degree in Naval Architecture. He received his Masters of Business Administration from Harvard University.
Mr. Kutler is a recognized investor, investment banker and expert in the aerospace and defense industries. He has been profiled in BusinessWeek, The New York Times, Fortune, Institutional Investor, The Los Angeles Times, Defense News, and Aviation Week & Space Technology, which have also featured his articles on consolidation, restructuring, and industry trends. He has also been a frequent commentator regarding industry issues on CNN, CNBC and Bloomberg Television. He has testified before Congressional committees, served as Chairman of the White House Small Business Task Force on Defense Conversion, and as a member of an advisory panel established by the Congressional Office of Technology Assessment to evaluate the status of the space launch vehicle industry. We believe that Mr. Kutler’s background and experience make him appropriate to serve as one of our directors in light of our business and structure.
Carol J. Battershell has been one of our directors since February 2016. Ms. Battershell currently serves as the Deputy Director for Energy Systems in the Office of Energy Policy and Systems Analysis (EPSA), whose role is to deliver unbiased energy analysis to the Department of Energy’s (DOE) leadership on existing and prospective energy-related policies. Ms. Battershell joined the DOE in 2008 in Energy Efficiency and Renewable Energy. She served first as a Senior Advisor with a focus on technology commercialization and then as Executive Director of Field Operations from 2010 to 2013, when she then moved to her current position with the EPSA. Prior to joining the DOE, Ms. Battershell spent 25 years in the energy industry, with BP, plc. (NYSE: BP) and before that with Standard Oil (which was purchased by BP). Her last roles at BP included Vice President, Policy and Strategy for BP Alternative Energy (2005-2008), where she was instrumental in developing the strategy and business case for an $8 billion investment to launch and grow the new BP Alternative Energy division, and Director, BP Renewables and Alternative Fuels (2002-2005), where she directed BP’s global activities in hydrogen research, their European wind business, as well as managing BP’s green energy consulting start-up company. Additional energy industry positions have included operations and strategy roles in retail fuels marketing, strategy and financial roles in business-to-business fuels marketing, as well a corporate role in environmental policy and development roles as chief of staff to two of BP’s most senior executives. She began her career as a refinery engineer in Ohio. Ms. Battershell holds a B.S. in engineering from Purdue University in West Lafayette, Indiana, and an MBA from Case Western Reserve University in Cleveland, Ohio.
Ms. Battershell’s years in the energy industry, both in the private and the public sector, make her experience highly relevant to our business. Additionally, her service as the chief financial officer of a $3 billion revenue division of BP enables her to bring additional value to our Board through her ability to sit on our Audit Committee as an “audit committee financial expert” under applicable SEC and Nasdaq regulations. We believe that Ms. Battershell’s background and experience make her appropriate to serve as one of our directors in light of our business and structure.
Thomas J. Paup has been our Vice President – Finance since December 2005 and our Chief Financial Officer since February 2006, and in May 2013, Mr. Paup was promoted to Senior Vice President. Mr. Paup is currently also a Finance Lecturer at Eastern Michigan University. Mr. Paup was an Affiliated Partner with McMillan|Doolittle LLP, a retail consulting firm, from March 2002 until accepting this position with us, and prior thereto, he was an Executive in Residence and Finance Instructor at DePaul University’s Kellstadt Graduate School of Business. Prior to his teaching experience, Mr. Paup spent over 25 years in the retail industry. Most recently, between 1997 and 2000, Mr. Paup was the Executive Vice President and Chief Financial Officer and member of the Board of Directors of Montgomery Ward and Company, formerly a private mail order and department store retailer. Mr. Paup brings a broad background of strategic and operational management experiences from the department store industry, where he served as CFO of Lord & Taylor, an upscale, specialty-retail department store chain, and Kaufmann’s, a department store that merged into Macy’s, Inc. (“Macy’s”), and Controller of Bloomingdale’s, an upscale chain of department stores owned by Macy’s, and Robinson-May, formerly a chain of department stores. Mr. Paup holds an MBA in Finance and a BBS from Eastern Michigan University.
Director Nominees
Rear Admiral James J. Quinn, USN (Ret.) will be a management nominee for election as a Class III director at our next annual meeting of stockholders. Adm. Quinn left the United States Navy in October 2003 after a 30-year career that included tours of duty as Director of Operations, Plans, Policy and Training with the Atlantic Fleet, a total of five commands (including command of a carrier group and of a nuclear-powered aircraft carrier), Senior Military Assistant to the Secretary of Defense, Commander of Naval Space Command, and the Naval Aide to two U.S. Presidents. After leaving the Navy, Adm. Quinn began a ten-year business career with Northrop Grumman Aerospace Systems, a division of Northrop Grumman Corporation (“NGC”) (NYSE: NOC), where he served as Director of Navy-Marine Corps Programs & Corporate Lead Executive for the NGC Integrated Systems Sector from 2003 to 2004, Vice President of Business Development for the Military Space Systems Division of NGC from 2004 to 2009, Vice President of Business Development for the Strike & Surveillance Systems Division of NGC from 2009 to 2011, and Vice President of Business Development for the Unmanned Systems Division of NGC from 2012 until his retirement from NGC in 2013. Adm. Quinn holds a B.S. in Mathematics from the United States Naval Academy, and is a graduate of the Navy Nuclear Power Program. He received his wings and was designated a Naval Flight Officer at Naval Air Station Pensacola in 1975. Adm. Quinn is the recipient of the Defense Superior Service Medal, five Legions of Merit, two Bronze Stars, two Meritorious Service Medals, four Air Medals (two Individual with Combat “V”/2 Strike-Flight) and four Navy Commendation Medals (two with Combat “V”).
Adm. Quinn’s extraordinary record of service and experience, both military and business, give him experience that we expect to be an invaluable addition to our Board. Adm. Quinn’s experience in both the military and civilian side of the defense sector is highly relevant to our business. We believe that Adm. Quinn’s background and experience make him appropriate to serve as one of our directors in light of our business and structure.
Board Leadership Structure
We do not have a policy regarding the advisability of separating the positions of chief executive officer and chairman of the board. From October 2002 until October 2014, our chief executive officer served as our chairman of the board. However, upon the retirement of Mr. Ehrlich as our CEO after thirteen years in that position, our board re-evaluated its leadership structure. Beginning in October 2014 with the appointment of Mr. Esses as our new CEO, the board determined that it would be preferable for Mr. Ehrlich to continue to head our Board of Directors as its Executive Chairman. We believed this board leadership structure to be best for our company and our shareholders as Mr. Esses began his service as CEO of our company.
In making its decision to change the leadership structure and appoint a separate chairman, the board considered Mr. Ehrlich’s long experience as our Chairman and as chairman of the board of other public companies, and the time that Mr. Esses will be required to devote to the CEO position in the current economic environment. Having Mr. Ehrlich serve as Executive Chairman of the Board at the beginning of Mr. Esses’s tenure as CEO enabled Mr. Esses to focus his entire energy during this critical initial period on running the company. Additionally, we believe our chief executive officer and our executive chairman have had an excellent working relationship that has allowed Mr. Esses to make a good transition into the role of chief executive officer and will allow him to focus on growing our company in a difficult business environment. We believe this provided strong leadership for our board, while also positioning our CEO as the leader of the company in the eyes of our customers, employees and stockholders.
The Board recognizes that in circumstances where the Chairman of the Board is also a member of management, investors believe it is desirable that the Board appoint a Lead Independent Director with clearly defined roles and responsibilities. In view of these facts, our Board has adopted a Lead Independent Director Charter (available through a hyperlink located on the investor relations page of our website at http://content.stockpr.com/arotech/media/5239a829da7db7747afc24f2e1f73af3.pdf), and the independent directors appointed Jon B. Kutler as Lead Independent Director.
As part of our periodic board self-evaluation process, we evaluate our leadership structure to ensure that the board continues to believe that it provides the optimal structure for our company and stockholders. We recognize that different board leadership structures may be appropriate for companies in different situations. In light of Mr. Ehrlich’s decision not to seek reelection as a director at the next annual meeting of stockholders, our Board reevaluated this decision and determined that the next Board chairman should not be a member of management.
Committees of the Board of Directors
Our board of directors has an Audit Committee, a Compensation Committee, a Nominating Committee and an Executive and Finance Committee. The current composition of the various committees of the Board of Directors is as follows (the name of the chairman of each committee appears in italics):
|
Audit Committee
|
Compensation Committee
|
Nominating Committee
|
Executive and Finance Committee
|
|||
|
Kenneth W. Cappell
Michael E. Marrus
Richard I. Rudy
Carol J. Battershell
|
Jay M. Eastman
Michael E. Marrus
Richard I. Rudy
|
Michael Marrus
Jay M. Eastman
Richard I. Rudy
|
Robert S. Ehrlich
Steven Esses
Michael E. Marrus
Jon B. Kutler
|
Audit Committee
The purpose of the Audit Committee is to review with management and our independent auditors the scope and results of the annual audit, the nature of any other services provided by the independent auditors, changes in the accounting principles applied to the presentation of our financial statements, and any comments by the independent auditors on our policies and procedures with respect to internal accounting, auditing and financial controls. The Audit Committee was established in accordance with Section 3(a)(58)(A) of the Securities Exchange Act of 1934, as amended. In addition, the Audit Committee is charged with the responsibility for making decisions on the engagement, compensation, retention and oversight of the work of our independent auditors. The Audit Committee also is responsible for the oversight and work of our of internal audit department. The Audit Committee consists of Mr. Cappell (Chair) Messrs. Marrus and Rudy, and Ms. Battershell. Each member of the Audit Committee is an “independent director,” as that term is defined in Nasdaq Marketplace Rule 4200(a)(15) and the SEC’s Rule 10A-3. All Audit Committee members possess the level of financial literacy required by law. Our Board of Directors has determined that each of Mr. Cappell and Ms. Battershell qualifies as an “audit committee financial expert” under applicable SEC and Nasdaq regulations. As required by law, the Audit Committee operates pursuant to a charter that governs its duties, available through a hyperlink located on the investor relations page of our website at http://content.equisolve.net/arotech/media/b7c6b7bc3ea4b17ef9af28aab2221d6d.pdf.
Compensation Committee
The duties of the Compensation Committee are to recommend compensation arrangements for our executive officers and review annual compensation arrangements for all other officers and significant employees.
The Compensation Committee consists of Dr. Eastman (Chair), and Messrs. Marrus and Rudy. Each member of the Compensation Committee is an independent director as that term is defined in the NASD listing standards. The Compensation Committee operates under a formal charter that governs its duties, which charter is publicly available through a hyperlink located on the investor relations page of our website, at http://content.stockpr.com/arotech/media/249a9ac7cc90aa315f94037d49d2246e.pdf.
The Compensation Committee maintains compensation and incentive programs designed to motivate, retain and attract management and utilize various combinations of base salary, bonuses payable upon the achievement of specified goals, discretionary bonuses and grants of restricted stock. Our President and Chief Executive Officer, Mr. Steven Esses, our Executive Chairman, Mr. Robert S. Ehrlich, and our Chief Financial Officer, Mr. Thomas J. Paup, are all parties to employment agreements with us. The Compensation Committee reviews the compensation, both cash and stock, of our executive officers on an annual basis, while taking into account as well changes in compensation during previous years. Some of these components, such as salary, are generally fixed and do not vary based on our financial and other performance; some components, such as bonus, are in whole or in part dependent upon the achievement of certain goals jointly agreed upon by our management and the Compensation Committee; and some components, such as restricted stock, have a value that is dependent upon our stock price at the time of award and going forward. The Compensation Committee reviews the compensation, both cash and stock, of our executive officers on an annual basis, while taking into account as well changes in compensation during previous years.
The Compensation Committee performs an annual review of our executive officers’ cash compensation and restricted stock holdings to determine whether they provide adequate compensation for the services they perform, as well as adequate incentives and motivation to our executive officers and whether they adequately compensate our executive officers relative to comparable officers in other companies.
Compensation Committee meetings typically have included, for all or a portion of some of the meetings, a representative of The Burke Group, Inc., a well-known consulting firm specializing in executive officer compensation, as well as preliminary discussion with our senior officers prior to our Compensation Committee deliberating without any members of management present. For compensation decisions, including decisions regarding the grant of equity compensation relating to executive officers (other than our Chairman and Chief Executive Officer), the Compensation Committee typically considers the recommendations of our Chairman and Chief Executive Officer.
Nominating Committee
The Nominating Committee identifies and proposes candidates to serve as members of the Board of Directors. Proposed nominees for membership on the Board of Directors submitted in writing by stockholders to Arotech’s Secretary will be brought to the attention of the Nominating Committee and will be evaluated in accordance with the same guidelines as other candidates are considered by the Nominating Committee. The Nominating Committee consists of Mr. Marrus (Chair), Dr. Eastman and Mr. Rudy. Each member of the Nominating Committee is an independent director as that term is defined in the Nasdaq listing standards. The Nominating Committee makes recommendations to the Board of Directors regarding new directors to be selected for membership on the Board of Directors and its various committees. The Nominating Committee operates under a formal charter that governs its duties. The Nominating Committee’s charter is publicly available through a hyperlink located on the investor relations page of our website, at http://content.equisolve.net/arotech/media/9db8a8bd53ecd3f2d895b23986e237c8.pdf.
Executive and Finance Committee
The Executive and Finance Committee exercises the powers of the Board during the intervals between meetings of the Board, in the management of our property, business and affairs (except with respect to certain extraordinary transactions). The Executive and Finance Committee consists of Messrs. Ehrlich (Chair), Esses, Marrus and Kutler.
Code of Ethics
We have adopted a Code of Ethics, as required by Nasdaq listing standards and the rules of the SEC, that applies to our principal executive officer, our principal financial officer and our principal accounting officer. The Code of Ethics is publicly available through a hyperlink located on the investor relations page of our website, at http://content.equisolve.net/arotech/media/df40a6c92bcbf0b776162586acce0841.pdf. If we make substantive amendments to the Code of Ethics or grant any waiver, including any implicit waiver, that applies to anyone subject to the Code of Ethics, we will disclose the nature of such amendment or waiver on the website or in a report on Form 8-K in accordance with applicable Nasdaq and SEC rules.
Code of Conduct
We have adopted a general Code of Conduct, as required by Nasdaq listing standards and the rules of the SEC, that applies to all of our employees. The Code of Conduct is publicly available through a hyperlink located on the investor relations page of our website, at http://content.equisolve.net/arotech/media/5c5e3b052edfcf1e78084a414a4c37c1.pdf.
Whistleblower Policy
We have adopted a Whistleblower Policy, as required by Nasdaq listing standards, in order to ensure compliance with the provisions of the Sarbanes-Oxley Act of 2002. The Whistleblower Policy is publicly available through a hyperlink located on the investor relations page of our website, at http://content.stockpr.com/arotech/media/6a9edfc8a5cd8b55aa0c9f4a6aef0363.pdf. Employees with complaints about our compliance with applicable legal and regulatory requirements relating to accounting, auditing and internal control matters may submit their complaints in person, by mail or other written communication or by telephone to our Complaint Administrator. The Complaint Administrator can be contacted anonymously, by submitting the form located on our corporate website at http://www.arotech.com/contact/ethics-compliance. Complaints sent in this manner will automatically be stripped of all computer-encoded information identifying the originating e-mail address, and will then automatically be forwarded to the Complaint Administrator’s regular e-mail address at Arotech.
Voting Agreement
On February 2, 2016, we entered into a Stock Purchase Agreement with Admiralty Partners, Inc. (“API”), which was subsequently amended on February 23, 2016 (as amended, the “API Agreement”). In connection with the API Agreement, API and Messrs. Ehrlich and Esses are parties to a Voting Agreement pursuant to which each of Messrs. Ehrlich and Esses agrees to vote the shares of our common stock held by him in favor of the election of a director nominee designated by API. This obligation shall remain in effect for so long as API and its affiliates continue to beneficially own at least 750,000 shares of our common stock. On February 24, 2016, in connection with the API Agreement, Jon B. Kutler was appointed to our Board as a Class I director.
Director Compensation
Non-employee members of our Board of Directors are entitled to a cash retainer of $8,000 (plus expenses) per quarter, plus $500 per quarter for each committee on which such outside directors serve ($1,000 per quarter for members of the Executive and Finance Committee). The Chairman of the Audit Committee receives an additional retainer of $1,500 per quarter, and the Chairman of the Compensation Committee receives an additional retainer of $1,000 per quarter. No per-meeting fees are paid. In addition, we have adopted a Non-Employee Director Equity Compensation Plan, pursuant to which non-employee directors receive an initial grant of a number of restricted shares of our common stock having a fair market value on the date of grant equal to $25,000 upon their election as a director, and an annual grant on March 31 of each year of a number of restricted shares having a fair market value on the date of grant equal to $35,000. Each grant of restricted stock shall become free of restrictions in three equal installments on each of the first, second and third anniversaries of the grant, unless the director is removed from the Board of Directors for cause prior to such vesting. Restrictions lapse automatically in the event of a director being removed for service other than for cause, or being nominated as a director but failing to be elected, or death, disability or mandatory retirement. Furthermore, all restrictions lapse prior to the consummation of a merger or consolidation involving us, our liquidation or dissolution, any sale of substantially all of our assets or any other transaction or series of related transactions as a result of which a single person or several persons acting in concert own a majority of our then-outstanding common stock.
The following table shows the compensation earned or received by each of our non-officer directors for the year ended December 31, 2015:
DIRECTOR COMPENSATION
|
Name
|
Fees
Earned or
Paid in
Cash
|
Stock
Awards
Granted
2015(1)
|
Total
|
|||||||||
|
Dr. Jay M. Eastman
|
$
|
40,000
|
$
|
35,000
|
$
|
75,000
|
(2)
|
|||||
|
Seymour Jones*
|
$
|
42,000
|
$
|
35,000
|
$
|
77,000
|
(3)
|
|||||
|
Michael E. Marrus
|
$
|
38,000
|
$
|
35,000
|
$
|
73,000
|
(4)
|
|||||
|
Richard I. Rudy
|
$
|
38,000
|
$
|
35,000
|
$
|
73,000
|
(5)
|
|||||
|
Kenneth W. Cappell
|
$
|
17,000
|
$
|
25,000
|
$
|
42,000
|
(6)
|
|||||
|
*
|
This individual retired as a director effective February 24, 2016.
|
|||||||||||||
|
(1)
|
This amount reflects the aggregate grant date fair value computed in accordance with FASB ASC Topic 718.
|
|||||||||||||
|
(2)
|
As of December 31, 2015, Dr. Eastman held 19,797 unvested restricted shares of our common stock.
|
|||||||||||||
|
(3)
|
As of December 31, 2015, Prof. Jones held 19,797 unvested restricted shares of our common stock.
|
|||||||||||||
|
(4)
|
As of December 31, 2015, Mr. Marrus held 19,797 unvested restricted shares of our common stock.
|
|||||||||||||
|
(5)
|
As of December 31, 2015, Mr. Rudy held 16,672 unvested restricted shares of our common stock.
|
|||||||||||||
|
(6)
|
As of December 31, 2015, Mr. Cappell held 8,960 unvested restricted shares of our common stock.
|
|||||||||||||
Compensation Committee Interlocks and Insider Participation
The Compensation Committee is composed entirely of directors who are not our current or former employees, each of whom meets the applicable definition of “independent” in the current rules of the under the listing standards of Nasdaq and SEC rules and regulations. None of the members of the compensation committee during fiscal 2015 (i) had any relationships requiring disclosure by us under the SEC’s rules requiring disclosure of related party transactions, or (ii) was an executive officer of a company of which one of our executive officers is a director. The Compensation Committee is responsible for establishing and administering our executive compensation policies. Our Compensation Committee does not have any interlocks with other companies.
Significant Employees
Our significant employees as of February 29, 2016, and their ages as of December 31, 2015, are as follows:
|
Name
|
Age
|
Position
|
||
|
Dean Krutty
|
50
|
Senior Vice President, Operations – North America
|
||
|
Ronen Badichi
|
50
|
General Manager, Power Systems Division – Europe and Asia
|
||
|
Yaakov Har-Oz
|
58
|
Senior Vice President, General Counsel and Secretary
|
||
|
Colin Gallagher
|
42
|
Corporate Controller, Chief Accounting Officer
|
Dean Krutty became President of our Training and Simulation Division in January 2005, after having spent the prior thirteen years as a member of the FAAC management team, and was promoted to Arotech’s Senior Vice President, Operations – North America in January 2015. He began his career at FAAC as an electrical engineer in FAAC’s part task trainer division and served as FAAC’s Director of Operations prior to becoming its President. He also has significant experience managing programs in the training and simulation industry. Mr. Krutty holds a B.S. in electrical engineering from the Michigan State University.
Ronen Badichi became the General Manager of Epsilor Electronic Industries in May 2005 and the General Manager of our Power Systems Division – Europe and Asia in December 2007. Prior to joining Epsilor, Mr. Badichi served since 1999 as the General Manager of Maoz Industries, a high end supplier of displays to the aviation industry. Prior thereto, Mr. Badichi was a project manager at BAE and served as the F-16 Avionics Integration manager in the Israeli Air Force, with the rank of Captain. Mr. Badichi holds a B.Sc. in Physics and Electro-Optic Engineering from the Lev Institute of Technology in Jerusalem.
Yaakov Har-Oz has served as our Vice President and General Counsel since October 2000 and as our corporate Secretary since December 2000, and in December 2005 Mr. Har-Oz was promoted to Senior Vice President. From 1994 until October 2000, Mr. Har-Oz was a partner in the Jerusalem law firm of Ben-Ze’ev, Hacohen & Co. Prior to moving to Israel in 1993, he was an administrative law judge and in private law practice in New York. Mr. Har-Oz holds a B.A. from Brandeis University in Waltham, Massachusetts and a J.D. from Vanderbilt Law School (where he was an editor of the law review) in Nashville, Tennessee. He is a member of the New York bar and the Israel Chamber of Advocates.
Colin Gallagher has served as our Controller and as our Chief Accounting Officer since May 2015. Prior to joining Arotech, from 2013 to 2014, Mr. Gallagher was the Controller of DTE Energy Trading, a physical and financial gas and power marketing company. Prior to DTE, he was a Finance Director at Owens Corning (NYSE: OC) in Toledo Ohio, the world’s largest manufacturer of fiberglass and related products. Before starting at Owens Corning, Mr. Gallagher spent twelve years at PwC in various positons, ending his career there as a Senior Manager in the public and private company sector. Mr. Gallagher is a certified public accountant. He holds a BBA from the Haworth College of Business at Western Michigan University in Kalamazoo, Michigan and an MBA from the Mendoza College of Business at the University of Notre Dame in South Bend, Indiana.
Section 16(a) Beneficial Ownership Reporting Compliance
Under the securities laws of the United States, our directors, certain of our officers and any persons holding more than ten percent of our common stock are required to report their ownership of our common stock and any changes in that ownership to the Securities and Exchange Commission. Specific due dates for these reports have been established and we are required to report any failure to file by these dates during 2015. We are not aware of any instances during 2015, not previously disclosed by us, where such “reporting persons” failed to file the required reports on or before the specified dates.
ITEM 11. EXECUTIVE COMPENSATION
Compensation Committee Report
Under the rules of the SEC, this Compensation Committee Report is not deemed
to be incorporated by reference by any general statement incorporating
this Annual Report by reference into any filings with the SEC.
The Compensation Committee has reviewed and discussed the following Compensation Discussion and Analysis required by Item 402(b) of Regulation S-K with management and, based on such review and discussions, the Compensation Committee recommended to the Board of Directors that the following Compensation Discussion and Analysis be included in this Annual Report on Form 10-K.
Submitted by the Compensation Committee
Dr. Jay M. Eastman, Chairman
Michael Marrus
Richard I. Rudy
Introduction
In this section we present the principles underlying our executive officer compensation decisions and the most important factors that we believe are relevant to an analysis of these decisions. Our goal here is to provide qualitative information regarding the manner and context in which compensation is awarded to and earned by our named executive officers and to place in perspective the numerical and other quantitative data presented in the tables and other information that follow this section.
Pursuant to applicable SEC regulations, the information we present in this section relates to the chief executive officer, the chief financial officer, and the three additional most highly compensated “executive officers” (as this term is defined in the regulations promulgated under the Securities Exchange Act of 1934, as amended), as well as up to two additional persons meeting the above criteria but who were not employed by us at the end of the last fiscal year. We believe that in 2015 three individuals met these criteria, as follows (we refer to these individuals throughout this Compensation Discussion and Analysis as our “named executive officers”):
|
Ø
|
Steven Esses, our President and Chief Executive Officer;
|
|
Ø
|
Robert S. Ehrlich, our Executive Chairman; and
|
|
Ø
|
Thomas J. Paup, our Senior Vice President – Finance and Chief Financial Officer.
|
We have designed the compensation of our named executive officers in order to attract, as needed, individuals with the skills necessary for us to achieve our business plan, to reward those individuals fairly over time, and to retain those individuals who perform at or above our expectations.
Our named executive officers’ annual cash and stock compensation consists of several components, as follows:
|
Ø
|
base salary;
|
|
Ø
|
bonus, some of which is paid in cash in the year in which it is earned and some of which is accrued in the year in which it is earned but is paid in cash in a subsequent year; and
|
|
Ø
|
grants of restricted stock or restricted stock units, where (i) the stock vests over a period of time or pursuant to the attainment of set performance goals, (ii) sale or other transfer of such stock is prohibited while unvested, and (iii) unvested stock is forfeited to us should the executive officer’s employment be terminated, provided that certain grants of restricted stock provide for accelerated vesting under certain circumstances.
|
The Compensation Committee reviews the compensation, both cash and stock, of our named executive officers on an annual basis, while taking into account as well changes in compensation during previous years.
Some of these components, such as base salary, are generally fixed and do not vary based on our financial and other performance; some components, such as bonus, are in whole or in part dependent upon the achievement of certain goals jointly agreed upon by our management and the Compensation Committee; and some components, such as restricted stock, have a value that is dependent upon our stock price at the time of award. and going forward.
We compensate our named executive officers in these different ways in order to achieve different goals. Cash compensation, for example, provides our named executive officers with a guaranteed minimum base salary. We fix the base salary of each of our named executive officers at a level that we believe enables us to hire and retain individuals in a competitive environment and rewards satisfactory individual performance and a satisfactory level of contribution to our overall business goals. We also take into account the base salaries paid by similarly situated companies and the base salaries of other private and public companies with which we believe we compete for talent. To this end, we utilize the services of an independent employee benefits administration and compensation consulting firm retained by the Compensation Committee, and our Compensation Committee consults with this firm periodically, and annually when we review named executive officer compensation.
Incentive bonus compensation is generally linked to the achievement of short-term operational, strategic or financial goals, and is intended to reward our named executive officers for their performance in reaching goals that are agreed in advance between our management and the Compensation Committee. We design the cash incentive bonuses for each of our named executive officers to focus the named executive officer on achieving key objectives within a yearly time horizon, as described in more detail below.
Grants of restricted stock are intended to link our named executive officers’ longer-term compensation with the performance of our stock, which is an issue of vital importance to our stockholders. This encourages our named executive officers to remain with us, to act in ways intended to maximize stockholder value, and to penalize them if our stock fails to perform to expectations. These grants are intended to produce significant value for each named executive officer if our stock performance is outstanding and if the named executive officer remains with us, provided that certain grants of restricted stock provide for accelerated vesting under certain circumstances.
We view the three components of our named executive officer compensation as related but distinct. Although our Compensation Committee does review total compensation, we do not believe that compensation derived from one component of compensation should negate or reduce compensation from other components. We determine the appropriate level for each compensation component based in part, but not exclusively, on our view of internal equity and consistency, individual performance and other information we deem relevant, such as the data we receive from the consulting firm referred to above. Except as described below, our Compensation Committee has not adopted any formal or informal policies or guidelines for allocating compensation between long-term and currently paid out compensation, between cash and non-cash compensation, or among different forms of compensation. This is due to the small size of our named executive officer team and the need to tailor each named executive officer’s award to attract and retain that named executive officer.
In addition, we provide our named executive officers with benefits that are generally available to our salaried employees. With respect to those of our named executive officers who live in Israel (all of our named executive officers except for Mr. Paup), we also provide other benefits that are either legally required to be paid by Israeli law or that are otherwise customarily provided in Israel, primarily consisting of:
|
Ø
|
accruals (but not cash payments) in respect of pension plans, which consist of a savings plan, life insurance and statutory severance pay benefits, and a continuing education fund;
|
|
Ø
|
accruals (but not cash payments) in respect of contractual termination compensation in excess of the Israeli statutory minimum;
|
|
Ø
|
annual statutory holiday pay; and
|
|
Ø
|
redemption of all unused vacation days and up to a maximum of 30 unused sick days.
|
Our Compensation Committee performs an annual review of our named executive officers’ cash compensation and restricted stock holdings to determine whether they provide adequate compensation for the services they perform, as well as adequate incentives and motivation to our named executive officers and whether they adequately compensate our named executive officers relative to comparable officers in other companies. Our Compensation Committee’s most recent review occurred in February 2016, and utilized data and assessments from our independent compensation consultant, The Burke Group, Inc., a well-known consulting firm specializing in named executive officer compensation. This review is described in more detail below. We also use “tally sheets” that provide a summary of the compensation history of our President and Chief Executive Officer and those members of senior management reporting to the Chief Executive Officer. These tally sheets include a historical summary of base salary, annual bonus and long-term equity awards.
Compensation Committee meetings typically have included, for all or a portion of some of the meetings, a representative of The Burke Group, as well as preliminary discussion with our President and Chief Executive Officer prior to our Compensation Committee deliberating without any members of management present. For compensation decisions, including decisions regarding the grant of equity compensation relating to named executive officers (other than our President and Chief Executive Officer), the Compensation Committee typically considers the recommendations of our President and Chief Executive Officer.
We account for the equity compensation expense for our employees under the rules of ASC 718, which requires us to estimate and record an expense for each award of equity compensation over the service period of the award. Accounting rules also require us to record cash compensation as an expense at the time the obligation is accrued. We structure cash incentive bonus compensation so that it is taxable to our employees at the time it is paid to them. It is not anticipated that any named executive officer’s annual compensation will exceed $1 million, and we have accordingly not made any plans to qualify for any compensation deductions under Section 162(m) of the Internal Revenue Code.
Benchmarking of Base Compensation and Equity Holdings
At its January 2016 meeting, our Compensation Committee determined that our respective named executive officers’ salaries, cash incentive bonuses and equity holdings were at or below the median of named executive officers with similar roles at public companies having comparable revenues and that no material changes should be made to the cash compensation levels of our named executive officers until our annual named executive officer performance reviews, which were conducted in the first quarter of 2016. This median was derived based on a report we obtained from The Burke Group. The report compared our named executive officer compensation with the results of two surveys, involving companies in the aerospace and military/defense industry with revenues of between $100 million and $200 million, one from Towers Watson Data Services and one from the Economic Research Institute. Our Compensation Committee realizes that benchmarking our compensation against the compensation earned at comparable companies may not always be appropriate, but believes that engaging in a comparative analysis of our compensation practices is useful. In instances where a named executive officer is uniquely key to our success, the Compensation Committee may provide compensation above the median referred to above. The Committee’s choice not to recommend to the Board of Directors immediate material changes to the compensation levels following its review of The Burke Group’s report reflects our consideration of stockholders’ interests in paying what is necessary, but not more than necessary, to achieve our corporate goals while conserving cash and equity as much as is practicable. We believe that our compensation levels are generally sufficient to retain our existing named executive officers and to hire new named executive officers when and as required.
Compensation Policies and Practices as They Relate to Risk Management
In 2015, the Compensation Committee reviewed our compensation policies and practices and concluded that the mix and design of these policies and practices are not reasonably likely to encourage our employees to take excessive risks, and that our compensation policies and practices are not reasonably likely to have a material adverse effect on us. In connection with its evaluation, the Compensation Committee considered, among other things, the structure, philosophy and design characteristics of our primary incentive compensation plans and programs in light of our risk management and governance procedures, as well as other factors that may calibrate or balance potential risk-taking incentives. In particular, the Compensation Committee reviewed our compensation programs for certain design features that have been identified by experts as having the potential to encourage excessive risk-taking, including long term incentive compensation value that is driven entirely by increases in stock price, and low compensation levels exacerbated by performance-driven awards not paying out; including both annual bonus and long term incentive compensation, and noted that these are not substantial factors in our executives’ compensation packages.
Equity Compensation
No restricted stock grants were made in 2015. However, at the January 2016 meeting of the Compensation Committee, the Compensation Committee, in consultation with The Burke Group, analyzed the current restricted share holdings of our named executive officers and others, and found that the level of equity stake of our named executive officers was lower than the norm for companies of similar size and experience as a public company, and concluded that this level was insufficient to provide our named executive officers with the desired level of value for each named executive officer if our stock performance is outstanding and if the named executive officer remains with us. Accordingly, based on the number of restricted shares and restricted stock units held by our executive officers, the Compensation Committee, in January 2016, made the grants of restricted stock reflected in the “Grants of Plan-Based Awards” table below.
We do not have any program, plan or obligation that requires us to grant equity compensation to any named executive officer on specified dates. The authority to make equity grants to named executive officers rests with our Compensation Committee, although, as noted above, the Compensation Committee does consider the recommendations of its President and Chief Executive Officer in setting the compensation of our other named executive officers.
Cash Incentive Bonuses
Yearly cash incentive bonuses for our named executive officers are established as part of their respective individual employment agreements. Each of these employment agreements provides that the named executive officer will receive a cash incentive bonus determined in the discretion of our Board of Directors, with a target bonus amount specified for that named executive officer based on individualized objective and subjective criteria, pursuant to a specific formula. These bonus criteria are established by the Compensation Committee on an annual basis, and include specific objectives relating to the achievement of business and/or financial milestones. The target cash incentive bonus amount for each of our named executive officers is as follows:
|
Name of Named Executive Officer
|
Title
|
Minimum Bonus
|
Maximum Bonus
|
|||
|
Steven Esses
|
President and Chief Executive Officer
|
None
|
75% of annual base salary
|
|||
|
Robert S. Ehrlich
|
Executive Chairman of the Board
|
None
|
50% of annual base salary
|
|||
|
Thomas J. Paup
|
Senior Vice President – Finance and Chief Financial Officer
|
None
|
50% of annual base salary
|
For 2015, the Compensation Committee chose financial targets for determining eligibility for the above-referenced cash incentive bonuses that are determined on the achievement of set budgetary forecast targets for Adjusted EBITDA, which is determined by taking net profit and adding back in interest expense (income), depreciation of fixed assets, taxes, and amortization of inventory adjustments and of intangible assets, capitalized software costs and technology impairment, as well as stock compensation expense, one-time transaction expenses and certain other non-cash expenses. The Compensation Committee determined that we did not achieve the financial performance criteria established by the Compensation Committee for the year ended December 31, 2015, and accordingly no cash incentive bonuses were paid in respect of the year ended December 31, 2015. Financial targets for 2016 were set in accordance with our 2016 budget forecast, and targets for determining eligibility for cash incentive bonuses will again be determined entirely on the achievement of set budgetary forecast targets for Adjusted EBITDA.
Severance and Change in Control Benefits
Messrs. Esses and Paup have a provision in their respective employment agreements providing for certain severance benefits in the event of termination or retirement. These severance provisions are described in the “Employment Agreements” section below, and certain estimates of these change of control benefits are provided in “Estimated Payments and Benefits upon Termination” below.
We believe the severance arrangements that we have with Messrs. Esses and Paup are at or near the median of executive officers with similar roles at public companies having comparable revenues.
Benefits
Mr. Paup is eligible to participate in all of our employee benefit plans, such as medical, group life and disability insurance and our 401(k) plan, in each case on the same basis as our other U.S. employees. Our named executive officers located in Israel have the pension, insurance, severance and other benefits described above that are legally required to be provided in Israel; their medical expenses are covered by Israel’s national health funds.
Perquisites
All of our named executive officers receive cellular telephones. We also pay a portion of the home telephone bills of our named executive officers located in Israel, in view of the fact that the time difference between the United States and Israel causes them to do much work from their homes after normal business hours in Israel.
Pursuant to the terms of their employment agreements, our named executive officers located in Israel also receive a tax planning allowance.
Our use of perquisites as an element of compensation is limited and is largely based on historical practices and policies of our company. We do not view perquisites as a significant element of our comprehensive compensation structure but do believe that they can be used in conjunction with base salary to attract, motivate and retain individuals in a competitive environment.
Effect of Shareholder Advisory Vote on Executive Compensation
Of the 11,560,599 shares that voted (this number excludes the 131,197 shares that abstained from voting and 8,939,307 broker non-votes) on the advisory vote on executive compensation at the 2014 Annual Meeting, approximately 80% of the shares approved of our executive compensation policies and decisions. We have considered the results of this vote, and we view this vote as an affirmation of our compensation objectives. The committee and entire Board of Directors intend to continue careful review of the compensation programs and policies to assure that the compensation remains consistent with our philosophy and objectives as stated above and reflective of our financial performance.
Cash and Other Compensation
Summary Compensation Table
The following table, which should be read in conjunction with the explanations provided below, shows the compensation that we paid (or accrued) to our named executive officers during the fiscal years ended December 31, 2015, 2014 and 2013:
SUMMARY COMPENSATION TABLE(1)
|
Stock Awards
|
All Other
|
|||||||||||||||||||||||
|
Name and Principal Position
|
Year
|
Salary
|
Bonus(2)
|
(3)
|
Compensation
|
Total
|
||||||||||||||||||
|
Steven Esses
|
2015
|
$
|
324,060
|
(4)
|
$
|
160,496
|
$
|
–
|
$
|
444,617
|
(5)
|
$
|
929,173
|
|||||||||||
|
President, Chief Executive
|
2014
|
$
|
330,946
|
(6)
|
$
|
374,600
|
$
|
560,500
|
$
|
516,356
|
(7)
|
$
|
1,782,402
|
|||||||||||
|
Officer and a director
|
2013
|
$
|
273,437
|
(8)
|
$
|
205,400
|
$
|
273,750
|
$
|
398,878
|
(9)
|
$
|
1,151,465
|
|||||||||||
|
Robert S. Ehrlich (10)
|
2015
|
$
|
304,993
|
$
|
104,162
|
$
|
–
|
$
|
8,179
|
(11)
|
$
|
417,334
|
||||||||||||
|
Executive Chairman of
|
2014
|
$
|
482,808
|
$
|
361,250
|
$
|
111,500
|
$
|
64,385
|
(12)
|
$
|
1,019,943
|
||||||||||||
|
the Board and a director
|
2013
|
$
|
444,356
|
$
|
379,900
|
$
|
365,000
|
$
|
135,423
|
(13)
|
$
|
1,324,679
|
||||||||||||
|
Thomas J. Paup
|
2015
|
$
|
250,000
|
$
|
112,500
|
$
|
–
|
$
|
–
|
|
$
|
362,500
|
||||||||||||
|
Senior Vice President –
|
2014
|
$
|
225,000
|
$
|
187,250
|
$
|
133,800
|
$
|
1,436
|
(14)
|
$
|
547,486
|
||||||||||||
|
Finance and Chief Financial Officer
|
2013
|
$
|
201,400
|
$
|
100,500
|
$
|
273,750
|
$
|
–
|
|
$
|
575,650
|
||||||||||||
|
(1)
|
We paid the amounts reported for each named executive officer in U.S. dollars and/or New Israeli Shekels (NIS). We have translated amounts paid in NIS into U.S. dollars at the exchange rate of NIS into U.S. dollars at the time of payment or accrual, except that certain items are pursuant to corporate policy paid at a set exchange rate that may be higher than the actual exchange rate on the date of payment. The difference, which was a positive number in 2014 and 2013, has been reported under “Salary.” The exchange rate differences for Mr. Ehrlich were $97,330 and $88,797 for 2014 and 2013, respectively. The exchange rate differences for Mr. Esses were $66,716 and $54,642 for 2014 and 2013, respectively.
|
|||||||||||||||||||||||
|
(2)
|
Bonuses are performance-based, against criteria established by the Compensation Committee of the Board of Directors and approved by the full Board of Directors and represent cash awards for 2014 company performance. See “Employment Contracts,” below.
|
|||||||||||||||||||||||
|
(3)
|
Reflects the value of awards of restricted stock or restricted stock units granted to our named executive officers based on the compensation cost of their stock-based awards (the aggregate grant date fair value computed in accordance with FASB ASC Topic 718); see Note 13.b. of the Notes to Consolidated Financial Statements. The number of shares of restricted stock or restricted stock units received by our named executive officers pursuant to such awards in 2014, vesting entirely after one year (dependent 33% on tenure and 67% on performance), was as follows: Mr. Esses, 225,000; Mr. Ehrlich, 50,000; and Mr. Paup, 60,000. The number of shares of restricted stock or restricted stock units received by our named executive officers pursuant to such awards in 2013, vesting entirely after one year (dependent 33% on tenure and 67% on performance), was as follows: Mr. Esses, 75,000; Mr. Ehrlich, 100,000; and Mr. Paup, 75,000. All of these shares vested in 2014.
|
|||||||||||||||||||||||
|
(4)
|
Does not include approximately $124,720 that we paid in consulting fees to Sampen Corporation, a New York corporation owned by members of Steven Esses’s immediate family, from which Mr. Esses receives a salary. See “Item 13. Certain Relationships and Related Transactions – Consulting Agreement with Sampen Corporation,” below.
|
|||||||||||||||||||||||
|
(5)
|
Of this amount, $109,493 represents payments to Israeli pension and education funds; $319,867 represents the change in our accrual for severance pay that will be payable to Mr. Esses upon his leaving our employ other than if he is terminated for cause, such as a breach of trust; $37,425 represents sick pay redemption; ($16,005) represents the change in sick pay accruals; $62,376 represents vacation days redemption; ($72,626) represents the change of our accrual for vacation pay; $503 represents tax reimbursements; and $3,588 represents other normal or mandated Israeli benefits.
|
|
(6)
|
Does not include approximately $124,723 that we paid in consulting fees to Sampen Corporation, a New York corporation owned by members of Steven Esses’s immediate family, from which Mr. Esses receives a salary. See “Item 13. Certain Relationships and Related Transactions – Consulting Agreement with Sampen Corporation,” below.
|
|
(7)
|
Of this amount, $119,570 represents payments to Israeli pension and education funds; $378,207 represents the change in our accrual for severance pay that will be payable to Mr. Esses upon his leaving our employ other than if he is terminated for cause, such as a breach of trust; $37,460 represents sick pay redemption; $4,544 represents the change in sick pay accruals; $(18,460) represents the change of our accrual for vacation pay; $825 represents tax reimbursements; and $3,298 represents other normal or mandated Israeli benefits.
|
|
(8)
|
Does not include approximately $148,723 that we paid in consulting fees to Sampen Corporation, a New York corporation owned by members of Steven Esses’s immediate family, from which Mr. Esses receives a salary. See “Item 13. Certain Relationships and Related Transactions – Consulting Agreement with Sampen Corporation,” below.
|
|
(9)
|
Of this amount, $38,745 represents payments to Israeli pension and education funds; $38,856 represents the change in our accrual for severance pay that will be payable to Mr. Esses upon his leaving our employ other than if he is terminated for cause, such as a breach of trust; $28,680 represents sick pay redemption; $214,559 represents the change in sick pay accruals; $8,687 represents the change of our accrual for vacation pay; $750 represents tax reimbursements; and $68,601 represents other normal or mandated Israeli benefits.
|
|
(10)
|
Mr. Ehrlich was serving as our Chief Executive Officer until October 2014, at which time he became our Executive Chairman of the Board.
|
|
(11)
|
Of this amount, $25,406 represents the change in our accrual for severance pay that will be payable to Mr. Ehrlich upon his leaving our employ other than if he is terminated for cause, such as a breach of trust; $(24,735) represents the change of our accrual for vacation pay; $682 represents tax reimbursements, and $6,826 represents other normal or mandated Israeli benefits.
|
|
(12)
|
Of this amount, $31,013 represents the change in our accrual for severance pay that will be payable to Mr. Ehrlich upon his leaving our employ other than if he is terminated for cause, such as a breach of trust; $29,112 represents the change of our accrual for vacation pay; $857 represents tax reimbursements, $44,609 represents vacation days redemption and $17,018 represents other normal or mandated Israeli benefits.
|
|
(13)
|
Of this amount, $91,834 represents the change in our accrual for severance pay that will be payable to Mr. Ehrlich upon his leaving our employ other than if he is terminated for cause, such as a breach of trust; $32,205 represents the change of our accrual for vacation pay; $3,578 represents tax reimbursements and $7,806 represents other normal or mandated Israeli benefits.
|
|
(14)
|
Represents the increase (decrease) in our accrual for Mr. Paup for accrued but unused vacation days.
|
Executive Loans
In 2000, we extended a loan to one of our named executive officers. This loan is summarized in the following table, and is further described under “Item 13. Certain Relationships and Related Transactions – Officer Loan,” below.
|
Name of Borrower
|
Date of Loan
|
Original
Principal
Amount of Loan
|
Amount
Outstanding
as of
12/31/2015
|
Terms of Loan
|
|||||||
|
Robert S. Ehrlich
|
02/09/2000
|
$
|
329,163
|
$
|
452,995
|
Twenty-five-year non-recourse loan to purchase our stock, secured by the shares of stock purchased; interest rate imputed until 2008 at 1% above the then federal funds rate
|
|||||
Plan-Based Awards
Grants of Restricted Stock or Restricted Stock Units
During 2015, the Compensation Committee did not grant any shares of restricted stock or restricted stock units to our named executive officers. However, early in 2016 the Compensation Committee did grant shares of restricted stock and restricted stock units to our named executive officers that will vest in part on the basis of our 2016 results, as reflected in the table under “Compensation Discussion and Analysis – Equity Compensation,” above.
Vesting of Restricted Stock Awards
The following table presents awards of restricted stock or restricted stock units that vested during the year ended December 31, 2015.
STOCK VESTED
|
Name
|
Number of Shares
Acquired on Vesting
(#)
|
Value Realized
on Vesting(1)
($)
|
||||||
|
Steven Esses
|
175,000
|
$
|
357,000
|
|||||
|
Robert S. Ehrlich
|
150,000
|
$
|
306,000
|
|||||
|
Thomas J. Paup
|
95,000
|
$
|
193,800
|
|||||
|
(1)
|
Reflects the aggregate market value of the shares of restricted stock or restricted stock units determined based on a per share price at vesting based on the closing price of our common stock on the Nasdaq Global Market on December 31, 2015, which was the last trading day of 2015.
|
||||||||||
Outstanding Equity Awards at Fiscal Year-End
The table below sets forth information for our named executive officers with respect to restricted stock and restricted stock unit values at the end of the fiscal year ended December 31, 2015.
OUTSTANDING EQUITY AWARDS AT FISCAL YEAR-END
|
Stock Awards
|
||||||||||||||||||||
|
Equity Incentive Plan Awards
|
||||||||||||||||||||
|
Number of
|
Market Value
|
|||||||||||||||||||
|
Number of
|
Market Value
|
Unearned
|
of Unearned
|
|||||||||||||||||
|
Shares that
|
of Shares that
|
Shares that
|
Shares that
|
|||||||||||||||||
|
Have Not
|
Have Not
|
Have Not
|
Have Not
|
|||||||||||||||||
|
Vested
|
Vested(1)
|
Vested
|
Vested(1)
|
|||||||||||||||||
|
Name
|
(#)
|
($)
|
(#)
|
($)
|
||||||||||||||||
|
Steven Esses
|
83,333
|
(2)
|
$
|
170,000
|
–
|
$
|
–
|
|||||||||||||
|
(1)
|
Reflects the aggregate market value of the shares of restricted stock or restricted stock units determined based on a per share price at grant based on the closing price of our common stock on that day on the Nasdaq Global Market on December 31, 2015, which was the last trading day of 2015.
|
||||||||||||||||||
|
(2)
|
41,667 of these shares vest on December 31, 2016, and 41,666 of these shares vest on December 31, 2017, based solely on continued employment through such dates.
|
||||||||||||||||||
Employment Contracts
Steven Esses
Mr. Esses is party to an amended and restated employment agreement with us effective October 1, 2014. The term of this employment agreement expires on December 31, 2017. The employment agreement provides that Mr. Esses will serve as our President and Chief Executive Officer.
In February 2016, we entered an amended and restated employment agreement with Mr. Esses, effective July 1, 2016 and expiring December 31, 2018. The terms presented below are the terms of Mr. Esses’s current employment agreement that will be in effect until June 30, 2016.
The employment agreement provides for a monthly base salary of NIS 105,000 (approximately $27,666 per month at the rate of exchange in effect on November 10, 2014, which is the date the agreement was signed), as adjusted for Israeli inflation (but with no retroactive inflation adjustment for 2015 in respect of inflation during 2014) in an amount of not less than 3.5%. Additionally, the board may, at its discretion, raise Mr. Esses’s base salary. Mr. Esses also received a retention bonus in the amount of 125,000 shares of restricted stock, vesting (contingent on continued employment) in three equal tranches on each of December 31, 2015, 2016 and 2017.
The employment agreement provides that if the results we actually attain in a given year are at least 100% of the amount we budgeted at the beginning of the year, we will pay a bonus, on a sliding scale, in an amount equal to a minimum of 25% of Mr. Esses’s annual base salary then in effect, up to a maximum of 75% of his annual base salary then in effect if the results we actually attain for the year in question are 110% or more of the amount we budgeted at the beginning of the year. For 2013, 2014 and 2015, the Compensation Committee chose financial targets for determining eligibility for the above-referenced cash incentive bonus that are determined on the achievement of set budgetary forecast targets for adjusted EBITDA, a non-GAAP measurement, and, in the case of 2013, in part on the achievement of a target for revenues. Bonus targets will be chosen for 2016 based upon future budgetary forecasts.
The employment agreement also contains various benefits customary in Israel for senior executives, tax and financial planning expenses, and contains confidentiality and non-competition covenants.
We can terminate Mr. Esses’s employment agreement in the event of death or disability or for “Cause” (defined as conviction of certain crimes, willful failure to carry out directives of our board of directors or gross negligence or willful misconduct). Mr. Esses has the right to terminate his employment upon a change in our control or for “Good Reason,” which is defined to include adverse changes in employment status or compensation, our insolvency, material breaches and certain other events. Additionally, Mr. Esses may retire (after age 65), retire early (after age 55) or terminate his agreement for any reason upon 150 days’ notice.
Upon termination of employment, the employment agreement provides for payment of all accrued and unpaid compensation (including under most circumstances Israeli statutory severance), and (unless we have terminated the agreement for Cause or Mr. Esses has terminated the agreement without Good Reason and without giving us 150 days’ notice of termination) bonuses (to the extent earned) due for the year in which employment is terminated and severance pay equal to the greater of (i) twenty-four (24) times monthly salary, and (ii) NIS 4,430,250 (approximately $1,167,296 at the rate of exchange in effect on November 10, 2014). In addition, upon retirement or early retirement, Mr. Esses receives a further payment of up to $250,000. Furthermore, Mr. Esses will receive, in respect of all benefits, an additional sum in the amount of (i) $75,000, in the case of termination due to disability, Good Reason, death, or non-renewal, or (ii) $150,000, in the case of termination due to early retirement, retirement, change of control or change of location. Additionally, in respect of any termination due to a change of control or a change in the primary location from which Mr. Esses shall have conducted his business activities during the 60 days prior to such change or in the event of his death or disability, all outstanding options and all restricted shares will be fully vested. Restricted shares that have vested prior to the date of termination are not forfeited under any circumstances, including termination for Cause.
A table describing the payments that would have been due to Mr. Esses under his employment agreement had Mr. Esses’s employment with us been terminated at the end of 2015 under various circumstances appears under “Potential Payments and Benefits upon Termination of Employment – Steven Esses,” below.
In April 2009, we, with the agreement of Mr. Esses, funded a portion of his severance security by means of issuing to him, in trust, restricted stock having a value (based on the closing price of our stock on the Nasdaq Stock Market on the date on which Mr. Esses and our board of directors agreed on this arrangement) of $200,000, a total of 273,973 shares. In Mr. Esses’s new employment agreement, we agreed with him that these shares would still be restricted, but that the issuance of these shares to him would not reduce our severance obligations referred to above.
The changes in Mr. Esses’s employment agreement that will be effective July 1, 2016 include the elimination of the “single-trigger” severance in the event of a change of control (where Mr. Esses could decide unilaterally to resign and receive his severance after a change of control) and the institution instead of a “double-trigger” severance in the event of a change of control (where Mr. Esses can receive his severance after a change of control only if subsequently terminated by new management).
The amount being paid by the Company to Mr. Esses in salary under the new agreement, which is higher than the amount paid to him under his current agreement, is substantially unchanged from the total of the amounts previously paid to Mr. Esses and entities affiliated with Mr. Esses prior to termination of the Sampen Agreement effective June 30, 2016, which the Compensation Committee of the Board has determined to be well within the median range of the amounts paid by similarly-sized companies in the industry for the services of a chief executive officer.
See also “Item 13. Certain Relationships and Related Transactions – Consulting Agreement with Sampen Corporation,” below.
Robert S. Ehrlich
Mr. Ehrlich is party to an amended and restated employment agreement with us effective in January 2015. The term of this employment agreement expires on December 31, 2017. The employment agreement provides that Mr. Ehrlich will serve as our Executive Chairman of the Board.
The employment agreement provides for a monthly base salary of NIS 98,822 (approximately $25,236 at the rate of exchange in effect on December 24, 2014, which is the date the agreement was signed), as adjusted for Israeli inflation (but with no retroactive inflation adjustment for 2015 in respect of inflation during 2014). Additionally, the board may, at its discretion, raise Mr. Ehrlich’s base salary.
The employment agreement also provides for an annual bonus divided into three tranches. The first tranche of the bonus is in an amount equaling between 20% and 50% of one-third of Mr. Ehrlich’s gross annual Base Salary, and is awarded based on the achievement of acquisition and finance objectives during the previous fiscal year, such objectives to be set by the Compensation Committee after consultation with management. The second and third tranches are based on the results we actually attain in a given year, and are paid on a sliding scale, in an amount equal to a minimum of 20% of two-thirds of Mr. Ehrlich’s annual base salary then in effect if the results we actually attain for the year in question are 100% of the amount we budgeted at the beginning of the year, up to a maximum of 50% of two-thirds of his annual base salary then in effect if the results we actually attain for the year in question are 110% or more of the amount we budgeted at the beginning of the year. Budget targets in the past have included combinations of revenues, EBITDA, backlog, and/or other factors. Mr. Ehrlich’s previous employment agreement had a similar bonus provision (but with a lower (20%) threshold bonus). For 2013, 2014 and 2015, the Compensation Committee choose financial targets for determining eligibility for the above-referenced cash incentive bonus that are determined on the achievement of set budgetary forecast targets for adjusted EBITDA, a non-GAAP measurement, and, in the case of 2013, in part on the achievement of a target for revenues. Bonus targets will be chosen for 2016 based upon future budgetary forecasts.
The employment agreement also contains various benefits customary in Israel for senior executives, tax and financial planning expenses, and contains confidentiality and non-competition covenants.
We can terminate Mr. Ehrlich’s employment agreement in the event of death or disability or for “Cause” (defined as conviction of certain crimes, willful failure to carry out directives of our board of directors or gross negligence or willful misconduct). Mr. Ehrlich has the right to terminate his employment upon a change in our control or for “Good Reason,” which is defined to include adverse changes in employment status or compensation, our insolvency, material breaches and certain other events.
Upon termination of employment, the employment agreement provides for payment of all accrued and unpaid compensation and benefits (including under most circumstances Israeli statutory severance), and (unless we have terminated the agreement for Cause or Mr. Ehrlich has terminated the agreement without Good Reason) bonuses (to the extent earned) due for the year in which employment is terminated. Furthermore, in respect of any termination by us other than termination for Cause, all outstanding options and all restricted shares will be fully vested. Restricted shares that have vested prior to the date of termination are not forfeited under any circumstances, including termination for Cause.
The employment agreement further notes that Mr. Ehrlich’s severance payment of $1,625,400 under his prior agreement, which has been fully earned, has been paid to him (or that bank standing instructions have been issued with respect to such payment).
A table describing the payments that would have been due to Mr. Ehrlich under his employment agreement had Mr. Ehrlich’s employment with us been terminated at the end of 2015 under various circumstances (pursuant to the terms of his then-current employment agreement) appears under “Potential Payments and Benefits upon Termination of Employment – Robert S. Ehrlich,” below.
Thomas J. Paup
Mr. Paup is party to an amended and restated employment agreement with us executed in May 2013 and amended in January 2014, having a term running until December 31, 2015. The employment agreement provides that Mr. Paup will serve as our Senior Vice President – Finance and Chief Financial Officer. In January 2015, Mr. Paup’s employment agreement was amended to, among other things, extend the term through March 31, 2017 and to increase the number of vacation days Mr. Paup receives annually from 20 to 40.
Under the terms of his employment agreement as amended, Mr. Paup is entitled to receive a base salary of $250,000, as adjusted annually for inflation (but with no retroactive inflation adjustment for 2013 in respect of inflation during 2012).
The employment agreement provides that if the results we actually attain in a given year are at least 90% of the amount we budgeted at the beginning of the year, we will pay a bonus, on a sliding scale, in an amount equal to a minimum of 16.5% of Mr. Paup’s annual base salary then in effect, up to a maximum of 50% of his annual base salary then in effect if the results we actually attain for the year in question are 110% or more of the amount we budgeted at the beginning of the year. Mr. Paup’s previous employment agreement had a similar bonus provision (but with a higher (20%) threshold bonus). For 2013, 2014 and 2015, the Compensation Committee chose financial targets for determining eligibility for the above-referenced cash incentive bonus that are determined on the achievement of set budgetary forecast targets for adjusted EBITDA, a non-GAAP measurement, and, in the case of 2013, in part on the achievement of a target for revenues. Bonus targets will be chosen for 2016 based upon future budgetary forecasts.
Mr. Paup’s employment agreement provides that if we terminate his agreement other than for cause (defined as conviction of certain crimes, willful failure to carry out directives of our board of directors or gross negligence or willful misconduct), we must pay Mr. Paup severance in an amount of twelve times his monthly salary. Restricted shares that have vested prior to the date of termination are not forfeited under any circumstances, including termination for Cause.
A table describing the payments that would have been due to Mr. Paup under his employment agreement had Mr. Paup’s employment with us been terminated at the end of 2015 under various circumstances (pursuant to the terms of his then-current employment agreement) appears under “Potential Payments and Benefits upon Termination of Employment – Thomas J. Paup,” below.
Others
Other employees have entered into individual employment agreements with us. These agreements govern the basic terms of the individual’s employment, such as salary, vacation, overtime pay, severance arrangements and pension plans. Subject to Israeli law, which restricts a company’s right to relocate an employee to a work site farther than sixty kilometers from his or her regular work site, we have retained the right to transfer certain employees to other locations and/or positions provided that such transfers do not result in a decrease in salary or benefits. All of these agreements also contain provisions governing the confidentiality of information and ownership of intellectual property learned or created during the course of the employee’s tenure with us. Under the terms of these provisions, employees must keep confidential all information regarding our operations (other than information which is already publicly available) received or learned by the employee during the course of employment. This provision remains in force for five years after the employee has left our service. Further, intellectual property created during the course of the employment relationship belongs to us.
A number of the individual employment agreements, but not all, contain non-competition provisions which restrict the employee’s rights to compete against us or work for an enterprise which competes against us. Such provisions generally remain in force for a period of two years after the employee has left our service.
Under the laws of Israel, an employee of ours who has been dismissed from service, died in service, retired from service upon attaining retirement age, or left due to poor health, maternity or certain other reasons, is entitled to severance pay at the rate of one month’s salary for each year of service, pro rata for partial years of service. We currently fund this obligation by making monthly payments to approved private provident funds and by its accrual for severance pay in the consolidated financial statements. See Note 2.q. of the Notes to the Consolidated Financial Statements.
Potential Payments and Benefits upon Termination of Employment
This section sets forth in tabular form quantitative disclosure regarding estimated payments and other benefits that would have been received by certain of our executive officers if their employment had terminated on December 31, 2015 (the last business day of the fiscal year), pursuant to the terms of their then-current employment agreements.
For a narrative description of the severance and change in control arrangements in the current employment contracts of Messrs. Esses, Ehrlich and Paup, see “– Employment Contracts,” above. Each of Messrs. Esses and Ehrlich will be eligible to receive severance payments in excess of accrued but unpaid items only if he signs a general release of claims.
Steven Esses
The following table describes the potential payments and benefits upon employment termination for Steven Esses, our President and Chief Executive Officer, pursuant to applicable law and the terms of his then-current employment agreement with us, as if his employment had terminated on December 31, 2015 (the last business day of the fiscal year) under the various scenarios described in the column headings as explained in the footnotes below.
See also “Item 13. Certain Relationships and Related Transactions – Consulting Agreement with Sampen Corporation,” below.
|
STEVEN ESSES
|
|||||||||||||||||||||||||||||||||||
|
Payments
and Benefits
|
Non-
Renewal(1)
|
Death or
Disability(2)
|
Cause(3)
|
Good
Reason(4)
|
Change of
Control(5)
|
Retirement(6)
|
Early
Retirement(7)
|
Other
Employee
Termination(8)
|
|||||||||||||||||||||||||||
|
Accrued but unpaid(9):
|
|||||||||||||||||||||||||||||||||||
|
Base salary
|
$
|
23,333
|
$
|
23,333
|
$
|
23,333
|
$
|
23,333
|
$
|
23,333
|
$
|
23,333
|
$
|
23,333
|
$
|
23,333
|
|||||||||||||||||||
|
Vacation
|
5,815
|
5,815
|
5,815
|
5,815
|
5,815
|
5,815
|
5,815
|
5,815
|
|||||||||||||||||||||||||||
|
Sick leave(10)
|
202,192
|
202,192
|
202,192
|
202,192
|
202,192
|
202,192
|
202,192
|
202,192
|
|||||||||||||||||||||||||||
|
Recuperation pay(11)
|
323
|
323
|
323
|
323
|
323
|
323
|
323
|
323
|
|||||||||||||||||||||||||||
|
Benefits:
|
|||||||||||||||||||||||||||||||||||
|
Manager’s insurance(12)
|
3,695
|
3,695
|
3,695
|
3,695
|
3,695
|
3,695
|
3,695
|
3,695
|
|||||||||||||||||||||||||||
|
Continuing education fund(13)
|
1,750
|
1,750
|
1,750
|
1,750
|
1,750
|
1,750
|
1,750
|
1,750
|
|||||||||||||||||||||||||||
|
Contractual severance
|
1,135,379
|
1,135,379
|
–
|
1,135,379
|
1,135,379
|
1,135,379
|
1,135,379
|
–
|
|||||||||||||||||||||||||||
|
Statutory severance(14)
|
464,370
|
464,370
|
–
|
464,370
|
464,370
|
464,370
|
464,370
|
–
|
|||||||||||||||||||||||||||
|
Benefits
|
–
|
–
|
–
|
75,000
|
150,000
|
150,000
|
150,000
|
–
|
|||||||||||||||||||||||||||
|
TOTAL:
|
$
|
1,836,857
|
$
|
1,836,857
|
$
|
237,108
|
$
|
1,911,857
|
$
|
1,986,857
|
$
|
1,986,857
|
$
|
1,986,857
|
$
|
237,108
|
|||||||||||||||||||
|
(1)
|
“Non-renewal” is defined in Mr. Esses’s employment agreement as a decision, made with written notice of at least 90 days in advance of the effective date of such decision, by either us or Mr. Esses not to renew Mr. Esses’s employment for an additional two-year term. Pursuant to the terms of Mr. Esses’s employment agreement, in the absence of such notice, Mr. Esses’s employment agreement automatically renews.
|
||||||||||||||||||||||||||||||||||
|
(2)
|
“Disability” is defined in Mr. Esses’s employment agreement as a physical or mental infirmity which impairs Mr. Esses’s ability to substantially perform his duties and which continues for a period of at least 180 consecutive days.
|
||||||||||||||||||||||||||||||||||
|
(3)
|
“Cause” is defined in Mr. Esses’s employment agreement as (i) conviction for fraud, crimes of moral turpitude or other conduct which reflects on us in a material and adverse manner; (ii) a willful failure to carry out a material directive of our Chief Executive Officer, provided that such directive concerned matters within the scope of Mr. Esses’s duties, would not give Mr. Esses “Good Reason” to terminate his agreement (see footnote 4 below) and was capable of being reasonably and lawfully performed; (iii) conviction in a court of competent jurisdiction for embezzlement of our funds; or (iv) reckless or willful misconduct that is materially harmful to us.
|
||||||||||||||||||||||||||||||||||
|
(4)
|
“Good Reason” is defined in Mr. Esses’s employment agreement as (i) (a) a change in Mr. Esses’s status, title, position or responsibilities which, in Mr. Esses’s reasonable judgment, represents a reduction or demotion in his status, title, position or responsibilities as in effect immediately prior thereto, (b) a change in the primary location from which Mr. Esses shall have conducted his business activities during the 60 days prior to such change, or (c) a change in the composition of a majority of the Board of Directors; or (ii) a reduction in Mr. Esses’s base salary; (iii) the failure by us to continue in effect any material compensation or benefit plan in which Mr. Esses is participating; (iv) our insolvency or the filing (by any party, including us) of a petition for our winding-up; (v) any material breach by us of any provision of Mr. Esses’s employment agreement; or (vi) any purported termination of Mr. Esses’s employment for cause by us which does not comply with the terms of Mr. Esses’s employment agreement.
|
||||||||||||||||||||||||||||||||||
|
(5)
|
Represents additional payment due to Mr. Esses should he terminate his employment under the circumstances set forth in clause (i)(c) of footnote 4 above.
|
||||||||||||||||||||||||||||||||||
|
(6)
|
“Retirement” is defined as Mr. Esses terminating his employment with us at age 65 or older on at least 150 days’ prior notice.
|
||||||||||||||||||||||||||||||||||
|
(7)
|
“Early Retirement” is defined as Mr. Esses terminating his employment with us at age 55 or older (up to age 65) on at least 150 days’ prior notice.
|
||||||||||||||||||||||||||||||||||
|
(8)
|
Any termination by Mr. Esses of his employment with us that does not fit into any of the prior categories, including but not limited to Mr. Esses terminating his employment with us, with or without notice, other than at the end of an employment term or renewal thereof, in circumstances that do not fit into any of the prior categories.
|
||||||||||||||||||||||||||||||||||
|
(9)
|
Does not include a total of $17,203 in accrued but unpaid consulting fees due at December 31, 2015 to Sampen Corporation, a New York corporation owned by members of Steven Esses’s immediate family, from which Mr. Esses receives a salary. See “Item 13. Certain Relationships and Related Transactions – Consulting Agreement with Sampen Corporation,” below.
|
||||||||||||||||||||||||||||||||||
|
(10)
|
Limited to an aggregate of 30 days.
|
||||||||||||||||||||||||||||||||||
|
(11)
|
Pursuant to Israeli law and our customary practice, we pay Mr. Esses in July of each year the equivalent of six days’ “recuperation pay” at the statutory rate of NIS 378 (approximately $97) per day.
|
||||||||||||||||||||||||||||||||||
|
(12)
|
Payments to managers’ insurance, a benefit customarily given to senior executives in Israel, come to a total of 15.83% of base salary, consisting of 8.33% for payments to a fund to secure payment of statutory severance obligations, 5% for pension and 2.5% for disability. The managers’ insurance funds reflected in the table do not include the 8.33% payments to a fund to secure payment of statutory severance obligations with respect to amounts paid prior to December 31, 2015, which funds are reflected in the table under the “Statutory severance” heading.
|
||||||||||||||||||||||||||||||||||
|
(13)
|
Pursuant to Israeli law, we must contribute an amount equal to 7.5% of Mr. Esses’s base salary to a continuing education fund, up to the permissible tax-exempt salary ceiling according to the income tax regulations in effect from time to time. At December 31, 2015, the ceiling then in effect was NIS 15,712 (approximately $4,027). In Mr. Esses’s case, we have customarily contributed to his continuing education fund in excess of the tax-exempt ceiling, and then reimbursed Mr. Esses for the tax. The sums in the table reflect this additional contribution and the resultant tax reimbursement.
|
||||||||||||||||||||||||||||||||||
|
(14)
|
Under Israeli law, employees terminated other than for cause receive severance in the amount of one month’s base salary for each year of work, at their salary rate at the date of termination.
|
||||||||||||||||||||||||||||||||||
Robert S. Ehrlich
The following table describes the potential payments and benefits upon employment termination for Robert S. Ehrlich, our Executive Chairman of the Board, pursuant to applicable law and the terms of his then-current employment agreement with us, as if his employment had terminated on December 31, 2015 (the last business day of the fiscal year) under the various scenarios described in the column headings as explained in the footnotes below.
|
ROBERT S. EHRLICH
|
||||||||||||||||
|
Payments and Benefits
|
Death or
Disability(1)
|
Cause(2)
|
Good
Reason(3)
|
Other
Employee
Termination(4)
|
||||||||||||
|
Accrued but unpaid:
|
||||||||||||||||
|
Base salary
|
$
|
21,960
|
$
|
21,960
|
$
|
21,960
|
$
|
21,960
|
||||||||
|
Vacation
|
88,240
|
88,240
|
88,240
|
88,240
|
||||||||||||
|
Recuperation pay(5)
|
404
|
404
|
404
|
404
|
||||||||||||
|
Benefits:
|
||||||||||||||||
|
Continuing education fund(6)
|
1,647
|
1,647
|
1,647
|
1,647
|
||||||||||||
|
Statutory severance(7)
|
998,352
|
–
|
998,352
|
–
|
||||||||||||
|
TOTAL:
|
$
|
1,110,603
|
$
|
112,251
|
$
|
1,110,603
|
$
|
112,251
|
||||||||
|
(1)
|
“Disability” is defined in Mr. Ehrlich’s employment agreement as a physical or mental infirmity which impairs Mr. Ehrlich’s ability to substantially perform his duties and which continues for a period of at least 180 consecutive days.
|
||||||||||||||||||
|
(2)
|
“Cause” is defined in Mr. Ehrlich’s employment agreement as (i) conviction for fraud, crimes of moral turpitude or other conduct which reflects on us in a material and adverse manner; (ii) a willful failure to carry out a material directive of our Board of Directors, provided that such directive concerned matters within the scope of Mr. Ehrlich’s duties, would not give Mr. Ehrlich “Good Reason” to terminate his agreement (see footnote 4 below) and was capable of being reasonably and lawfully performed; (iii) conviction in a court of competent jurisdiction for embezzlement of our funds; or (iv) reckless or willful misconduct that is materially harmful to us.
|
||||||||||||||||||
|
(3)
|
“Good Reason” is defined in Mr. Ehrlich’s employment agreement as (i) a change in Mr. Ehrlich’s status, title, position or responsibilities which, in Mr. Ehrlich’s reasonable judgment, represents a reduction or demotion in his status, title, position or responsibilities as in effect immediately prior thereto; (ii) a reduction in Mr. Ehrlich’s base salary; (iii) the failure by us to continue in effect any material compensation or benefit plan in which Mr. Ehrlich is participating; (iv) our insolvency or the filing (by any party, including us) of a petition for our winding-up; (v) any material breach by us of any provision of Mr. Ehrlich’s employment agreement; (vi) any purported termination of Mr. Ehrlich’s employment for cause by us which does not comply with the terms of Mr. Ehrlich’s employment agreement; or (vii) any movement of the location where Mr. Ehrlich is generally to render his services to us from the Jerusalem/Tel Aviv area of Israel.
|
||||||||||||||||||
|
(4)
|
“Other Employee Termination” means a termination by Mr. Ehrlich of his employment other than for Good Reason.
|
||||||||||||||||||
|
(5)
|
Pursuant to Israeli law and our customary practice, we pay Mr. Ehrlich in July of each year the equivalent of ten days’ “recuperation pay” at the statutory rate of NIS 378 (approximately $97) per day.
|
||||||||||||||||||
|
(6)
|
Pursuant to Israeli law, we must contribute an amount equal to 7.5% of Mr. Ehrlich’s base salary to a continuing education fund, up to the permissible tax-exempt salary ceiling according to the income tax regulations in effect from time to time. At December 31, 2015, the ceiling then in effect was NIS 15,712 (approximately $4,027).
|
||||||||||||||||||
|
(7)
|
Under Israeli law, employees terminated other than for cause receive severance in the amount of one month’s base salary for each year of work, at their salary rate at the date of termination.
|
||||||||||||||||||
Thomas J. Paup
The following table describes the potential payments and benefits upon employment termination for Thomas J. Paup, our Senior Vice President – Finance and Chief Financial Officer, pursuant to applicable law and the terms of his then-current employment agreement with us, as if his employment had terminated on December 31, 2015 (the last business day of the fiscal year) under the various scenarios described in the column headings as explained in the footnotes below.
|
THOMAS J. PAUP
|
||||||||||||||||
|
Payments and Benefits
|
Death or
Disability(1)
|
Cause(2)
|
Non-Renewal(3)
|
Termination
at Will(4)
|
||||||||||||
|
Accrued but unpaid:
|
||||||||||||||||
|
Base salary
|
$
|
250,000
|
$
|
250,000
|
$
|
250,000
|
$
|
250,000
|
||||||||
|
Contractual severance
|
250,000
|
–
|
250,000
|
250,000
|
||||||||||||
|
TOTAL:
|
$
|
500,000
|
$
|
250,000
|
$
|
500,000
|
$
|
500,000
|
||||||||
|
(1)
|
“Disability” is defined in Mr. Paup’s employment agreement as a physical or mental infirmity which impairs Mr. Paup’s ability to substantially perform his duties and which continues for a period of at least 180 consecutive days.
|
||||||||||||||||||
|
(2)
|
“Cause” is defined in Mr. Paup’s employment agreement as (i) a breach of trust by Mr. Paup, including, for example, but without limitation, commission of an act of moral turpitude, theft, embezzlement, self-dealing or insider trading; (ii) the unauthorized disclosure by Mr. Paup of confidential information of or relating to us; (iii) a material breach by Mr. Paup of his employment agreement; or (iv) any act of, or omission by, Mr. Paup which, in our reasonable judgment, amounts to a serious failure by Mr. Paup to perform his responsibilities or functions or in the exercise of his authority, which failure, in our reasonable judgment, rises to a level of gross nonfeasance, misfeasance or malfeasance.
|
||||||||||||||||||
|
(3)
|
“Non-Renewal” is defined in Mr. Paup’s employment agreement as the agreement coming to the end of the Term and not being extended or immediately succeeded by a new substantially similar employment agreement.
|
||||||||||||||||||
|
(4)
|
“Termination at Will” is defined in Mr. Paup’s employment agreement as Mr. Paup terminating his employment with us on written notice of at least 120 days in advance of the effective date of such termination.
|
||||||||||||||||||
ITEM 12. SECURITY OWNERSHIP OF CERTAIN BENEFICIAL OWNERS AND MANAGEMENT AND RELATED STOCKHOLDER MATTERS
Security Ownership of Certain Beneficial Owners and Management
The following table sets forth information regarding the security ownership, as of February 29, 2016, of those persons owning of record or known by us to own beneficially more than 5% of our common stock and of each of our Named Executive Officers and directors, and the shares of common stock held by all of our directors and executive officers as a group.
|
Name and Address of Beneficial Owner(1)
|
Shares Beneficially
Owned(2)(3)
|
Percentage of Total Shares Outstanding(3)
|
||||||
|
Ephraim Fields (4)
|
2,175,273
|
(5)
|
8.2
|
%
|
||||
|
Admiralty Partners, Inc.(6)
|
1,650,700
|
(7)(8)
|
6.2
|
|||||
|
Steven Esses
|
1,199,513
|
(9)(8)
|
4.5
|
%
|
||||
|
Robert S. Ehrlich
|
1,194,276
|
(10)(8)
|
4.5
|
%
|
||||
|
Thomas J. Paup
|
300,426
|
(11)
|
1.1
|
%
|
||||
|
Dr. Jay M. Eastman
|
91,346
|
(12)
|
*
|
|||||
|
Michael E. Marrus
|
94,636
|
(13)
|
*
|
|||||
|
Richard I. Rudy
|
19,000
|
(14)
|
*
|
|||||
|
Kenneth W. Cappell
|
23,960
|
(15)
|
*
|
|||||
|
Jon B. Kutler
|
1,661,204
|
(7)(8)
|
6.3
|
%
|
||||
|
Carol J. Battershell
|
10,504
|
(16)
|
*
|
|||||
|
James J. Quinn
|
0
|
(17)
|
–
|
|||||
|
All of our directors and executive officers as a group (8 persons)
|
4,594,865
|
(18)
|
17.3
|
%
|
||||
|
*
|
Less than one percent.
|
|||||||||||
|
(1)
|
Unless otherwise indicated in these footnotes, the address of each named beneficial owner is in care of Arotech Corporation, 1229 Oak Valley Drive, Ann Arbor, Michigan 48108.
|
|||||||||||
|
(2)
|
Unless otherwise indicated in these footnotes, each of the persons or entities named in the table has sole voting and sole investment power with respect to all shares shown as beneficially owned by that person, subject to applicable community property laws.
|
|||||||||||
|
(3)
|
Based on 26,461,245 shares of common stock outstanding as of February 29, 2016. For purposes of determining beneficial ownership of our common stock, owners of options exercisable or restricted stock that vests within 60 days of February 29, 2016 are considered to be the beneficial owners of the shares of common stock for which such securities are exercisable. The percentage ownership of the outstanding common stock reported herein is based on the assumption (expressly required by the applicable rules of the Securities and Exchange Commission) that only the person whose ownership is being reported has exercised his options for shares of common stock.
|
|||||||||||
|
(4)
|
The principal place of business for Ephraim Fields is c/o Echo Lake Capital, 888 Seventh Avenue, 17th Floor, New York, New York 10019. All information in this footnote and in the text to which this footnote relates is based on a Schedule 13D filed by Mr. Fields with the Securities and Exchange Commission on March 23, 2015, as amended on February 23, 2016.
|
|||||||||||
|
(5)
|
Consists of 2,175,273 shares. Does not include 337,251 shares as to which Keith Rosenblum, by virtue of his power to direct the affairs of Cruiser Capital Advisors, LLC, has sole voting and dispositive power. Mr. Rosenblum, together with Cruiser Capital Advisors, LLC and Lawrence F. Hagenbuch, may be deemed to constitute a “group” with Mr. Fields for purposes of Section 13(d)(3) of the Securities Exchange Act of 1934, as amended, but Mr. Fields expressly disclaims beneficial ownership of securities held by Mr. Rosenbloom, Cruiser Capital Advisors, LLC and Mr. Hagenbuch. All information in this footnote and in the text to which this footnote relates is based on a Schedule 13D filed by Mr. Fields with the Securities and Exchange Commission on March 23, 2015, as amended on February 23, 2016.
|
|||||||||||
|
(6)
|
The principal place of business for API is 68-1052 Honoka’ope Way, Kamuela, Hawaii 96743. All information in this footnote and in the text to which this footnote relates is based on a Schedule 13D filed by API and certain of its related entities and persons, including our director Jon B. Kutler, with the Securities and Exchange Commission on February 3, 2016, as amended on February 26, 2016.
|
|||||||||||
|
(7)
|
Jon B. Kutler and his wife are directors of API, which owns 1,500,000 shares of our common stock. They are also settlors and trustees of two trusts that between them own an additional 150,700 shares. Accordingly, Mr. and Ms. Kutler have shared voting and dispositive power with respect to 1,650,700 shares. Mr. and Mrs. Kutler disclaim beneficial ownership of these shares except to the extent of their respective voting and/or dispositive power. Mr. Kutler also holds 10,504 unvested restricted shares. All information in this footnote and in the text to which this footnote relates is based on a Schedule 13D filed by API and certain of its related entities and persons, including our director Jon B. Kutler, with the Securities and Exchange Commission on February 3, 2016, as amended on February 26, 2016.
|
|||||||||||
|
(8)
|
API and Messrs. Ehrlich and Esses are parties to a Voting Agreement pursuant to which each of Messrs. Ehrlich and Esses agrees to vote the shares of our common stock held by him in favor of the election of a director nominee designated by API. This obligation shall remain in effect for so long as API and its affiliates continue to beneficially own at least 750,000 shares of our common stock.
|
|||||||||||
|
(9)
|
Consists of 742,207 shares held directly by Mr. Esses (including 183,333 unvested restricted shares, the vesting of 33,333 of which is subject to performance criteria), and 273,973 shares issued to a trust and to be held in such trust until such time as Mr. Esses shall be entitled to payment of his severance package).
|
|||||||||||
|
(10)
|
Consists of 1,143,178 shares held directly by Mr. Ehrlich (including 36,000 unvested restricted shares, the vesting of 24,000 of which is subject to performance criteria), 3,571 shares held by Mr. Ehrlich’s wife (in which shares Mr. Ehrlich disclaims beneficial ownership), and 11,527 shares held in Mr. Ehrlich’s pension plan.
|
|||||||||||
|
(11)
|
Consists of 300,426 shares held directly by Mr. Paup. Does not include 60,000 restricted stock units, the vesting of 40,000 of which is subject to performance criteria.
|
|||||||||||
|
(12)
|
Consists of 71,549 shares owned directly by Dr. Eastman, 9,121 shares of unvested restricted stock that vest within 60 days of February 29, 2016, and 10,676 unvested restricted shares.
|
|||||||||||
|
(13)
|
Consists of 74,839 shares owned directly by Mr. Marrus, 9,121 shares of unvested restricted stock that vest within 60 days of February 29, 2016, and 10,676 unvested restricted shares.
|
|||||||||||
|
(14)
|
Consists of 2,328 shares owned directly by Mr. Rudy, 4,007 shares of unvested restricted stock that vest within 60 days of February 29, 2016, and 12,665 unvested restricted shares.
|
|||||||||||
|
(15)
|
Consists of 15,000 shares owned directly by Mr. Cappell and 8,960 unvested restricted shares.
|
|||||||||||
|
(16)
|
Consists of 10,504 unvested restricted shares.
|
|||||||||||
|
(17)
|
Adm. Quinn will be a management nominee for election as a Class III director at our next annual meeting of stockholders
|
|||||||||||
|
(18)
|
Includes 31,370 shares of unvested restricted stock that vest within 60 days of February 29, 2016, 104,341 shares of unvested restricted stock, and 273,973 shares of restricted stock held as part of a trust securing payment of severance. Does not include 60,000 unvested restricted stock units.
|
|||||||||||
Securities Authorized for Issuance Under Equity Compensation Plans
The following table sets forth certain information, as of December 31, 2015, with respect to our 2007 and 2009 equity compensation plans, as well as any stock options previously issued by us (including individual compensation arrangements) as compensation for goods and services:
EQUITY COMPENSATION PLAN INFORMATION
|
Plan Category
|
Number of securities to
be issued upon exercise
of outstanding options,
warrants and rights
(a)
|
Weighted-average
exercise price of
outstanding options,
warrants and rights
(b)
|
Number of securities
remaining available for
future issuance under
equity compensation plans
(excluding securities
reflected in column (a))
(c)
|
|||||||||
|
Equity compensation plans approved by security holders
|
-
|
-
|
2,945,397
|
|||||||||
ITEM 13. CERTAIN RELATIONSHIPS AND RELATED TRANSACTIONS, AND DIRECTOR INDEPENDENCE
Officer Loans
On February 9, 2000, Mr. Ehrlich exercised stock options to purchase 9,404 shares of our common stock. At the time of exercise, Mr. Ehrlich was our Chief Financial Officer and Chairman of the Board of Directors. Currently, Mr. Ehrlich is our Executive Chairman of the Board of Directors. Mr. Ehrlich paid the exercise price of the stock options and certain taxes that we paid on his behalf by giving us a non-recourse promissory note due in 2025 in the amount of $329,163, bearing annual interest at 1% over the then-current federal funds rate announced from time to time by the Wall Street Journal, secured by the shares of our common stock acquired through the exercise of the options and certain compensation due to Mr. Ehrlich upon termination. As of December 31, 2015, the aggregate amount outstanding pursuant to this promissory note was $452,995. No payments of principal or interest were due or paid during the year ended December 31, 2015.
Voting Agreement
API and Messrs. Ehrlich and Esses are parties to a Voting Agreement pursuant to which each of Messrs. Ehrlich and Esses agrees to vote the shares of our common stock held by him in favor of the election of a director nominee designated by API. This obligation shall remain in effect for so long as API and its affiliates continue to beneficially own at least 750,000 shares of our common stock.
Director Consulting Agreement
In connection with the API Agreement, we and Mr. Jon Kutler, who is now one of our directors, entered into a consulting agreement pursuant to which Mr. Kutler agreed to provide consulting services to us for a period of three years, unless terminated earlier. Under the terms of this agreement, Mr. Kutler will receive an annual fee for the three-year term of the consulting agreement equal to the difference between $125,000 and the amount of cash and the value of any stock received by Mr. Kutler for serving on our Board.
Consulting Agreement with Sampen Corporation
We have an amended and restated consulting agreement with Sampen Corporation that we executed in November 2014. Sampen is a New York corporation owned by members of the immediate family of Steven Esses, our President and Chief Executive Officer, and Mr. Esses is an employee of both the Company and of Sampen. The term of this consulting agreement is until December 31, 2017, unless terminated earlier.
In February 2016, we and Sampen agreed to terminate Sampen’s consulting agreement effective June 30, 2016. The terms of the consulting agreement described below relate only to the period prior to June 30, 2016, at which point we will cease to have any further financial or other obligations toward Sampen.
Pursuant to the terms of our agreement with Sampen, Sampen provides one of its employees to us for such employee to serve as our President and Chief Executive Officer. We pay Sampen $8,960 per month, plus an annual bonus, on a sliding scale, in an amount equal to a minimum of 25% of Sampen’s annual base compensation then in effect if the results we actually attain for the year in question are 100% or more of the amount we budgeted at the beginning of the year, up to a maximum of 75% of its annual base compensation then in effect if the results we actually attain for the year in question are 110% or more of the amount we budgeted at the beginning of the year. We also pay Sampen, to cover the cost of our use of Sampen’s offices as an ancillary New York office and the attendant expenses and insurance costs, an amount equal to 16% of each monthly payment of base compensation.
Director Independence
For information related to director independence, see Item 10. “Directors, Executive Officers and Corporate Governance – (i) Executive Officers and Directors, (ii) Board Leadership Structure and (iii) Committees of the Board of Directors.”
ITEM 14. PRINCIPAL ACCOUNTING FEES AND SERVICES
In accordance with the requirements of the Sarbanes-Oxley Act of 2002 and the Audit Committee’s charter, all audit and audit-related work and all non-audit work performed by our independent accountants, BDO USA, LLP (“BDO”), is approved in advance by the Audit Committee, including the proposed fees for such work. The Audit Committee is informed of each service actually rendered.
|
Ø
|
Audit Fees. Audit fees billed or expected to be billed to us by BDO for the audit of the financial statements included in our Annual Report on Form 10-K, and reviews of the financial statements included in our Quarterly Reports on Form 10-Q, for the years ended December 31, 2015 and 2014 totaled approximately $525,000 and $552,000, respectively.
|
|
Ø
|
Audit-Related Fees. BDO billed or expected to bill us $120,000 and $191,000 for the fiscal years ended December 31, 2015 and 2014, respectively, for other assurance and related services that are not directly related to the performance of the annual audit or review of our financial statements.
|
|
Ø
|
Tax Fees. BDO billed or expected to bill us $235,000 (including consultation related to mergers and acquisitions) and $20,000 for the fiscal years ended December 31, 2015 and 2014, respectively, for tax services.
|
|
Ø
|
All Other Fees. BDO billed or expected to bill us an aggregate of zero for both fiscal years ended December 31, 2015 and 2014 for permitted non-audit services.
|
Applicable law and regulations provide an exemption that permits certain services to be provided by our outside auditors even if they are not pre-approved. We have not relied on this exemption at any time since the Sarbanes-Oxley Act was enacted.
PART IV
ITEM 15. EXHIBITS, FINANCIAL STATEMENT SCHEDULES
(a) The following documents are filed as part of this report:
|
(1)
|
Financial Statements. See Index to Financial Statements on page 40 above and the financial pages following page 69 below.
|
|
(2)
|
Financial Statements Schedules. All schedules are omitted because of the absence of conditions under which they are required or because the required information is presented in the financial statements or related notes thereto.
|
|
(3)
|
Exhibits. The following Exhibits are either filed herewith or have previously been filed with the Securities and Exchange Commission and are referred to and incorporated herein by reference to such filings:
|
|
Exhibit No.
|
Description
|
|
|
(1)
|
3.1
|
Amended and Restated Certificate of Incorporation
|
|
(3)
|
3.1.1
|
Amendment to Amended and Restated Certificate of Incorporation
|
|
(4)
|
3.1.2
|
Amendment to Amended and Restated Certificate of Incorporation
|
|
(6)
|
3.1.3
|
Amendment to Amended and Restated Certificate of Incorporation
|
|
(7)
|
3.1.4
|
Amendment to Amended and Restated Certificate of Incorporation
|
|
(8)
|
3.1.5
|
Amendment to Amended and Restated Certificate of Incorporation
|
|
(2)
|
3.2
|
Amended and Restated By-Laws
|
|
(5)
|
4.1
|
Specimen Certificate for shares of common stock, $0.01 par value
|
|
(3)
|
10.1
|
Promissory Note dated February 9, 2000, from Robert S. Ehrlich to Arotech Corporation
|
|
(5)
|
10.2
|
Lease dated April 8, 1997, between AMR Holdings, L.L.C. and FAAC Incorporated
|
|
(6)
|
10.3
|
Lease dated February 10, 2006 between Arbor Development Company LLC and FAAC Incorporated
|
|
(13)
|
10.4
|
Lease dated October 31, 2014 between UEC Properties, LLC and UEC Electronics, LLC
|
|
(8)
|
10.5
|
Membership Interest Purchase Agreement among, inter alia, Arotech Corporation, UEC Electronics, LLC and Ufkes Holdings, LLC dated April 1, 2014
|
|
(8)
|
10.6
|
Amended and Restated Credit Agreement among Arotech Corporation, FAAC Incorporated and Fifth Third Bank dated March 31, 2014
|
|
(9)
|
10.7
|
Joinder Agreement between UEC Electronics, LLC and Fifth Third Bank dated April 1, 2014
|
|
(9)
|
10.8
|
Security Agreement between UEC Electronics, LLC and Fifth Third Bank dated April 1, 2014
|
|
(9)
|
10.9
|
Guaranty from UEC Electronics, LLC to Fifth Third Bank dated April 1, 2014
|
|
(9)
|
10.10
|
Patent and Trademark Security Agreement among Arotech Corporation, FAAC Incorporated, Electric Fuel Battery Corporation and Fifth Third Bank dated March 31, 2014 [a substantially identical agreement was executed by UEC Electronics, LLC]
|
|
† (10)
|
10.11
|
Fourth Amended and Restated Employment Agreement, dated November 14, 2014 and effective as of October 1, 2014, among Arotech Corporation, Epsilor-EFL and Steven Esses
|
|
† (17)
|
10.12
|
Fifth Amended and Restated Employment Agreement, dated February 16, 2016 and effective as of July 1, 2016, among Arotech Corporation, Epsilor-EFL and Steven Esses
|
|
† (10)
|
10.13
|
Second Amended and Restated Consulting Agreement, dated November 14, 2014 and effective as of October 1, 2014, between Arotech Corporation and Sampen Corporation
|
|
† (11)
|
10.14
|
Sixth Amended and Restated Employment Agreement, dated May 13, 2013 and effective as of May 1, 2013, among us, Epsilor-EFL and Robert S. Ehrlich
|
|
† (8)
|
10.15
|
Third Amended and Restated Employment Agreement between Arotech Corporation and Thomas J. Paup dated May 13, 2013 and effective as of May 1, 2013
|
|
† (12)
|
10.15.1
|
Amendment dated January 14, 2015 to Third Amended and Restated Employment Agreement, dated May 13, 2013 and effective as of May 1, 2013, between Arotech Corporation and Thomas J. Paup
|
|
† (13)
|
10.16
|
Arotech Corporation 2007 Non-Employee Director Equity Compensation Plan
|
|
† (14)
|
10.17
|
Arotech Corporation 2009 Equity Incentive Plan
|
|
(16)
|
10.18
|
Stock Purchase Agreement dated as of February 2, 2016 between Arotech Corporation and Admiralty Partners, Inc.
|
|
(18)
|
10.18.1
|
Amendment dated February 23, 2016 to Stock Purchase Agreement dated as of February 2, 2016 between Arotech Corporation and Admiralty Partners, Inc.
|
|
(16)
|
10.19
|
Consulting Agreement dated February 2, 2016 between Arotech Corporation and Admiralty Partners, Inc.
|
|
(16)
|
10.20
|
Registration Rights Agreement dated as of February 2, 2016 between Arotech Corporation and Admiralty Partners, Inc.
|
|
(18)
|
10.21
|
Voting Agreement dated as of February 23, 2016 between Arotech Corporation and Admiralty Partners, Inc.
|
|
(19)
|
10.22
|
Credit Agreement between JPMorgan Chase Bank, N.A. and Arotech Corporation and certain of Arotech Corporation’s subsidiaries dated March 11, 2016
|
|
(19)
|
10.23
|
Pledge and Security Agreement between JPMorgan Chase Bank, N.A. and Arotech Corporation and certain of Arotech Corporation’s subsidiaries dated March 11, 2016
|
|
(19)
|
10.24
|
Patent and Trademark Security Agreement between JPMorgan Chase Bank, N.A. and Arotech Corporation and certain of Arotech Corporation’s subsidiaries dated March 11, 2016
|
|
(15)
|
21.1
|
List of Subsidiaries of Arotech Corporation
|
|
*
|
23.1
|
|
|
*
|
31.1
|
|
|
*
|
31.2
|
|
|
*
|
32.1
|
|
|
*
|
32.2
|
|
|
*
|
101.INS
|
XBRL Instance Document
|
|
*
|
101.SCH
|
XBRL Taxonomy Extension Schema Document
|
|
*
|
101.CAL
|
XBRL Taxonomy Extension Calculation Linkbase Document
|
|
*
|
101.DEF
|
XBRL Taxonomy Extension Definition Linkbase Document
|
|
*
|
101.LAB
|
XBRL Taxonomy Extension Label Linkbase Document
|
|
*
|
101.PRE
|
XBRL Taxonomy Extension Presentation Linkbase Document
|
|
*
|
Filed herewith
|
|
|
†
|
Includes management contracts and compensation plans and arrangements
|
|
|
(1)
|
Incorporated by reference to our Registration Statement on Form S-1 (Registration No. 33-73256), which became effective on February 23, 1994
|
|
|
(2)
|
Incorporated by reference to our Registration Statement on Form S-1 (Registration No. 33-97944), which became effective on February 5, 1996
|
|
|
(3)
|
Incorporated by reference to our Annual Report on Form 10-K for the year ended December 31, 2000
|
|
|
(4)
|
Incorporated by reference to our Annual Report on Form 10-K for the year ended December 31, 2003
|
|
|
(5)
|
Incorporated by reference to our Annual Report on Form 10-K for the year ended December 31, 2004
|
|
|
(6)
|
Incorporated by reference to our Annual Report on Form 10-K for the year ended December 31, 2005
|
|
|
(7)
|
Incorporated by reference to our Quarterly Report on Form 10-Q for the quarter ended June 30, 2006
|
|
|
(8)
|
Incorporated by reference to our Quarterly Report on Form 10-Q for the quarter ended March 31, 2013
|
|
|
(9)
|
Incorporated by reference to our Current Report on Form 8-K filed April 1, 2014
|
|
|
(10)
|
Incorporated by reference to our Quarterly Report on Form 10-Q for the quarter ended September 30, 2014
|
|
|
(11)
|
Incorporated by reference to our Current Report on Form 8-K filed December 24, 2014
|
|
|
(12)
|
Incorporated by reference to our Current Report on Form 8-K filed January 14, 2015
|
|
|
(13)
|
Incorporated by reference to our Registration Statement on Form S-8 (Registration No. 333-146752), which became effective on October 17, 2007
|
|
|
(14)
|
Incorporated by reference to our Registration Statement on Form S-8 (Registration No. 333-160717), which became effective on July 21, 2009
|
|
|
(15)
|
Incorporated by reference to our Annual Report on Form 10-K for the year ended December 31, 2014
|
|
|
(16)
|
Incorporated by reference to our Current Report on Form 8-K filed February 3, 2016
|
|
|
(17)
|
Incorporated by reference to our Current Report on Form 8-K filed February 19, 2016
|
|
|
(18)
|
Incorporated by reference to our Current Report on Form 8-K filed February 25, 2016
|
|
|
(19)
|
Incorporated by reference to our Current Report on Form 8-K filed March 14, 2016
|
|
Pursuant to the requirements of Section 13 or 15(d) of the Securities Exchange Act of 1934, the registrant has duly caused this report to be signed on its behalf by the undersigned, thereunto duly authorized.
|
AROTECH CORPORATION
|
|||
|
By:
|
/s/ Steven Esses
|
||
|
Name: Steven Esses
|
|||
|
Title: President and Chief Executive Officer
|
|||
|
Date:
|
March 15, 2016
|
||
Pursuant to the requirements of the Securities Exchange Act of 1934, this report has been signed below by the following persons on behalf of the registrant and in the capacities and on the dates indicated.
|
Signature
|
Title
|
Date
|
|
/s/ Steven Esses
|
President, Chief Executive Officer and Director
|
March 15, 2016
|
|
Steven Esses
|
(Principal Executive Officer)
|
|
|
/s/ Thomas J. Paup
|
Senior Vice President – Finance and Chief Financial Officer
|
March 15, 2016
|
|
Thomas J. Paup
|
(Principal Financial Officer)
|
|
|
/s/ Colin Gallagher
|
Controller
|
March 15, 2016
|
|
Colin Gallagher
|
(Principal Accounting Officer)
|
|
|
/s/ Robert S. Ehrlich
|
Executive Chairman of the Board and Director
|
March 15, 2016
|
|
Robert S. Ehrlich
|
||
|
/s/ Jay M. Eastman
|
Director
|
March 15 , 2016
|
|
Dr. Jay M. Eastman
|
||
|
/s/ Michael E. Marrus
|
Director
|
March 15, 2016
|
|
Michael E. Marrus
|
||
|
/s/ Richard I. Rudy
|
Director
|
March 15, 2016
|
|
Richard I. Rudy
|
||
|
/s/ Kenneth W. Cappell
|
Director
|
March 15, 2016
|
|
Kenneth W. Cappell
|
||
|
|
Director
|
March , 2016
|
|
Jon B. Kutler
|
||
|
/s/ Carol J. Battershell
|
Director
|
March 15, 2016
|
|
Carol J. Battershell
|
Report of Independent Registered Public Accounting Firm
To the Board of Directors and Shareholders of Arotech Corporation:
Ann Arbor, Michigan
We have audited the accompanying consolidated balance sheets of Arotech Corporation (the “Company”) as of December 31, 2015 and 2014 and the related consolidated statements of comprehensive income (loss), changes in stockholders’ equity and cash flows for each of the three years in the period ended December 31, 2015. These financial statements are the responsibility of the Company’s management. Our responsibility is to express an opinion on these financial statements based on our audits.
We conducted our audits in accordance with the standards of the Public Company Accounting Oversight Board (United States). Those standards require that we plan and perform the audit to obtain reasonable assurance about whether the financial statements are free of material misstatement. An audit includes examining, on a test basis, evidence supporting the amounts and disclosures in the financial statements, assessing the accounting principles used and significant estimates made by management, as well as evaluating the overall presentation of the financial statements. We believe that our audits provide a reasonable basis for our opinion.
In our opinion, the consolidated financial statements referred to above present fairly, in all material respects, the financial position of Arotech Corporation at December 31, 2015 and 2014, and the results of its operations and its cash flows for the three years in the period ended December 31, 2015, in conformity with accounting principles generally accepted in the United States of America.
We also have audited, in accordance with the standards of the Public Company Accounting Oversight Board (United States), Arotech Corporation’s internal control over financial reporting as of December 31, 2015, based on criteria established in Internal Control – Integrated Framework (2013) issued by the Committee of Sponsoring Organizations of the Treadway Commission (COSO) and our report dated March 15, 2016 expressed an unqualified opinion thereon.
/s/ BDO USA, LLP
Grand Rapids, Michigan
March 15, 2016
AROTECH CORPORATION AND SUBSIDIARIES
CONSOLIDATED BALANCE SHEETS
|
December 31,
|
||||||||
|
2015
|
2014
|
|||||||
|
ASSETS
|
||||||||
|
CURRENT ASSETS:
|
||||||||
|
Cash and cash equivalents
|
$
|
10,608,420
|
$
|
11,291,784
|
||||
|
Restricted collateral deposits
|
89,985
|
236,428
|
||||||
|
Trade receivables
|
17,401,479
|
17,595,811
|
||||||
|
Unbilled receivables
|
12,132,484
|
15,937,060
|
||||||
|
Other accounts receivable and prepaid expenses
|
1,007,358
|
1,155,548
|
||||||
|
Inventories
|
9,607,836
|
9,811,783
|
||||||
|
Total current assets
|
50,847,562
|
56,028,414
|
||||||
|
LONG TERM ASSETS:
|
||||||||
|
Contractual and Israeli statutory severance pay fund
|
5,384,024
|
4,961,918
|
||||||
|
Other long term receivables
|
23,403
|
23,482
|
||||||
|
Property and equipment, net
|
6,440,270
|
6,462,949
|
||||||
|
Other intangible assets, net
|
9,334,730
|
11,840,365
|
||||||
|
Goodwill
|
45,463,027
|
45,422,219
|
||||||
|
Total long term assets
|
66,645,454
|
68,710,933
|
||||||
|
Total assets
|
$
|
117,493,016
|
$
|
124,739,347
|
||||
The accompanying notes are an integral part of the consolidated financial statements.
AROTECH CORPORATION AND SUBSIDIARIES
CONSOLIDATED BALANCE SHEETS
In U.S. dollars
|
December 31,
|
||||||||
|
|
2015
|
2014
|
||||||
|
LIABILITIES AND STOCKHOLDERS’ EQUITY
|
||||||||
|
CURRENT LIABILITIES:
|
||||||||
|
Trade payables
|
$ | 5,914,042 | $ | 6,772,082 | ||||
|
Other accounts payable and accrued expenses
|
5,560,040 | 9,105,214 | ||||||
|
Current portion of long term debt
|
4,362,438 | 4,380,730 | ||||||
|
Short term bank credit
|
4,060,000 | 33,238 | ||||||
|
Deferred revenues
|
6,879,815 | 7,826,178 | ||||||
|
Total current liabilities
|
26,776,335 | 28,117,442 | ||||||
|
LONG TERM LIABILITIES:
|
||||||||
|
Contractual and accrued Israeli statutory severance pay
|
7,516,980 | 7,051,630 | ||||||
|
Long term portion of debt
|
11,856,522 | 16,934,360 | ||||||
|
Deferred income tax liability
|
7,031,564 | 6,117,021 | ||||||
|
Other long term liabilities
|
264,244 | 163,446 | ||||||
|
Total long-term liabilities
|
26,669,310 | 30,266,457 | ||||||
|
Total liabilities
|
53,445,645 | 58,383,899 | ||||||
|
STOCKHOLDERS’ EQUITY:
|
||||||||
|
Share capital –
|
||||||||
|
Common stock – $0.01 par value each;
Authorized: 50,000,000 shares as of December 31, 2015 and 2014;
Issued and outstanding: 24,697,335 and 24,533,121 shares as of
December 31, 2015 and 2014, respectively
|
246,973 | 245,331 | ||||||
|
Preferred shares – $0.01 par value each;
Authorized: 1,000,000 shares as of December 31, 2015 and 2014;
No shares issued or outstanding as of December 31, 2015 and 2014
|
– | – | ||||||
|
Additional paid-in capital
|
246,591,415 | 245,970,742 | ||||||
|
Accumulated deficit
|
(182,554,637 | ) | (179,609,611 | ) | ||||
|
Notes receivable from stockholders
|
(908,054 | ) | (908,054 | ) | ||||
|
Accumulated other comprehensive income
|
671,674 | 657,040 | ||||||
|
Total stockholders’ equity
|
64,047,371 | 66,355,448 | ||||||
|
Total liabilities and stockholders’ equity
|
$ | 117,493,016 | $ | 124,739,347 | ||||
The accompanying notes are an integral part of the consolidated financial statements.
AROTECH CORPORATION AND SUBSIDIARIES
CONSOLIDATED STATEMENTS OF COMPREHENSIVE INCOME (LOSS)
|
December 31,
|
||||||||||||
|
2015
|
2014
|
2013
|
||||||||||
|
Revenues
|
$ | 96,573,947 | $ | 103,562,349 | $ | 88,571,428 | ||||||
|
Cost of revenues
|
68,456,322 | 70,854,737 | 64,480,140 | |||||||||
|
Research and development expenses
|
3,969,419 | 3,322,449 | 2,955,883 | |||||||||
|
Selling and marketing expenses
|
5,373,421 | 5,921,338 | 5,617,705 | |||||||||
|
General and administrative expenses
|
16,339,027 | 17,261,358 | 10,886,959 | |||||||||
|
Amortization of intangible assets
|
3,043,536 | 2,696,740 | 1,091,126 | |||||||||
|
Total operating costs and expenses
|
97,181,725 | 100,056,622 | 85,031,813 | |||||||||
|
Operating income (loss)
|
(607,778 | ) | 3,505,727 | 3,539,615 | ||||||||
|
Other income (expense), net
|
(24,181 | ) | 2,512,560 | 269,931 | ||||||||
|
Financial expense, net
|
(1,152,121 | ) | (1,507,489 | ) | (482,856 | ) | ||||||
|
Total other income (expense)
|
(1,176,302 | ) | 1,005,071 | (212,925 | ) | |||||||
|
Income (loss) from continuing operations before income tax expense
|
(1,784,080 | ) | 4,510,798 | 3,326,690 | ||||||||
|
Income tax expense
|
1,160,946 | 1,023,837 | 1,052,720 | |||||||||
|
Income (loss) from continuing operations
|
(2,945,026 | ) | 3,486,961 | 2,273,970 | ||||||||
|
Loss from discontinued operations
|
– | – | (121,619 | ) | ||||||||
|
Net income (loss)
|
(2,945,026 | ) | 3,486,961 | 2,152,351 | ||||||||
|
Other comprehensive income (loss), net of $0 income tax
|
||||||||||||
|
Foreign currency translation adjustment
|
14,634 | (1,205,589 | ) | 627,768 | ||||||||
|
Comprehensive income (loss)
|
$ | (2,930,392 | ) | $ | 2,281,372 | $ | 2,780,119 | |||||
|
Income per share of common stock:
|
||||||||||||
|
Basic – continuing operations
|
$ | (0.12 | ) | $ | 0.16 | $ | 0.14 | |||||
|
Basic – discontinued operations
|
$ | – | $ | – | $ | (0.01 | ) | |||||
|
Basic net income (loss) per share
|
$ | (0.12 | ) | $ | 0.16 | $ | 0.13 | |||||
|
Diluted – continuing operations
|
$ | (0.12 | ) | $ | 0.15 | $ | 0.13 | |||||
|
Diluted – discontinued operations
|
$ | – | $ | – | $ | (0.01 | ) | |||||
|
Diluted net income (loss) per share
|
$ | (0.12 | ) | $ | 0.15 | $ | 0.12 | |||||
|
Weighted average number of shares used in computing basic net income (loss) per share
|
23,687,733 | 21,934,532 | 16,507,848 | |||||||||
|
Weighted average number of shares used in computing diluted net income (loss) per share
|
23,687,733 | 22,537,272 | 17,110,588 | |||||||||
The accompanying notes are an integral part of the consolidated financial statements.
AROTECH CORPORATION AND SUBSIDIARIES
CONSOLIDATED STATEMENTS OF CHANGES IN STOCKHOLDERS’ EQUITY
|
Notes
|
Accumulated
|
|||||||||||||||||||||||||||
|
Additional
|
receivable
|
other
|
Total
|
|||||||||||||||||||||||||
|
Common stock
|
paid-in
|
Accumulated
|
From
|
comprehensive
|
stockholders’
|
|||||||||||||||||||||||
|
Shares
|
Amount
|
capital
|
deficit
|
stockholders
|
income
|
equity
|
||||||||||||||||||||||
|
Balance as of January 1, 2015
|
24,533,121
|
$
|
245,331
|
$
|
245,970,742
|
$
|
(179,609,611
|
)
|
$
|
(908,054
|
)
|
$
|
657,040
|
$
|
66,355,448
|
|||||||||||||
|
Stock based compensation
|
–
|
–
|
622,315
|
–
|
–
|
–
|
622,315
|
|||||||||||||||||||||
|
Restricted stock issued
|
57,028
|
570
|
(570
|
)
|
–
|
–
|
–
|
–
|
||||||||||||||||||||
|
Restricted stock units vested
|
107,186
|
1,072
|
(1,072
|
)
|
–
|
–
|
–
|
–
|
||||||||||||||||||||
|
Foreign currency translation adjustment
|
–
|
–
|
–
|
–
|
–
|
14,634
|
14,634
|
|||||||||||||||||||||
|
Net loss
|
–
|
–
|
–
|
(2,945,026
|
)
|
–
|
–
|
(2,945,026
|
)
|
|||||||||||||||||||
|
Balance as of December 31, 2015
|
24,697,335
|
$
|
246,973
|
$
|
246,591,415
|
$
|
(182,554,637
|
)
|
$
|
(908,054
|
)
|
$
|
671,674
|
$
|
64,047,371
|
|||||||||||||
The accompanying notes are an integral part of the consolidated financial statements.
AROTECH CORPORATION AND SUBSIDIARIES
CONSOLIDATED STATEMENTS OF CHANGES IN STOCKHOLDERS’ EQUITY
|
Notes
|
Accumulated
|
|||||||||||||||||||||||||||
|
Additional
|
receivable
|
other
|
Total
|
|||||||||||||||||||||||||
|
Common stock
|
paid-in
|
Accumulated
|
From
|
comprehensive
|
stockholders’
|
|||||||||||||||||||||||
|
Shares
|
Amount
|
capital
|
deficit
|
stockholders
|
income (loss)
|
Equity
|
||||||||||||||||||||||
|
Balance as of January 1, 2014
|
20,163,163
|
$
|
201,632
|
$
|
229,917,341
|
$
|
(183,096,572
|
)
|
$
|
(908,054
|
)
|
$
|
1,862,629
|
$
|
47,976,976
|
|||||||||||||
|
Stock based compensation
|
–
|
–
|
1,411,970
|
–
|
–
|
–
|
1,411,970
|
|||||||||||||||||||||
|
Restricted stock issued
|
344,106
|
3,441
|
(3,441
|
)
|
–
|
–
|
–
|
–
|
||||||||||||||||||||
|
Sale of stock – public offering, net of offering costs
|
3,289,000
|
32,890
|
10,665,282
|
–
|
–
|
–
|
10,698,172
|
|||||||||||||||||||||
|
Purchase of treasury shares
|
(100,000
|
)
|
(1,000
|
)
|
(228,042
|
)
|
–
|
–
|
–
|
(229,042
|
)
|
|||||||||||||||||
|
Issuance of stock – acquisition
|
775,000
|
7,750
|
4,208,250
|
–
|
–
|
–
|
4,216,000
|
|||||||||||||||||||||
|
Restricted stock units vested
|
61,852
|
618
|
(618
|
)
|
–
|
–
|
–
|
–
|
||||||||||||||||||||
|
Foreign currency translation adjustment
|
–
|
–
|
–
|
–
|
–
|
(1,205,589
|
)
|
(1,205,589
|
)
|
|||||||||||||||||||
|
Net income
|
–
|
–
|
–
|
3,486,961
|
|
–
|
–
|
3,486,961
|
||||||||||||||||||||
|
Balance as of December 31, 2014
|
24,533,121
|
$
|
245,331
|
$
|
245,970,742
|
$
|
(179,609,611
|
)
|
$
|
(908,054
|
)
|
$
|
657,040
|
$
|
66,355,448
|
|||||||||||||
The accompanying notes are an integral part of the consolidated financial statements.
AROTECH CORPORATION AND SUBSIDIARIES
CONSOLIDATED STATEMENTS OF CHANGES IN STOCKHOLDERS’ EQUITY (continued)
|
Notes
|
Accumulated
|
|||||||||||||||||||||||||||
|
Additional
|
receivable
|
other
|
Total
|
|||||||||||||||||||||||||
|
Common stock
|
paid-in
|
Accumulated
|
From
|
comprehensive
|
stockholders’
|
|||||||||||||||||||||||
|
Shares
|
Amount
|
capital
|
deficit
|
stockholders
|
income (loss)
|
equity
|
||||||||||||||||||||||
|
Balance as of January 1, 2013
|
16,151,298
|
$
|
161,513
|
$
|
223,181,705
|
$
|
(185,248,923
|
)
|
$
|
(908,054
|
)
|
$
|
1,234,861
|
$
|
38,421,102
|
|||||||||||||
|
Stock based compensation
|
–
|
–
|
437,306
|
–
|
–
|
–
|
437,306
|
|||||||||||||||||||||
|
Sale of stock – public offering
|
3,942,856
|
39,429
|
6,299,020
|
–
|
–
|
–
|
6,338,449
|
|||||||||||||||||||||
|
Restricted stock issued
|
268,305
|
2,683
|
(2,683
|
)
|
–
|
–
|
–
|
–
|
||||||||||||||||||||
|
Restricted stock units vested
|
62,889
|
629
|
(629
|
)
|
–
|
–
|
–
|
–
|
||||||||||||||||||||
|
Restricted stock forfeitures
|
(262,185
|
)
|
(2,622
|
)
|
2,622
|
–
|
–
|
–
|
–
|
|||||||||||||||||||
|
Foreign currency translation adjustment
|
–
|
–
|
–
|
–
|
–
|
627,768
|
627,768
|
|||||||||||||||||||||
|
Net income
|
–
|
–
|
–
|
2,152,351
|
–
|
–
|
2,152,351
|
|||||||||||||||||||||
|
Balance as of December 31, 2013
|
20,163,163
|
$
|
201,632
|
$
|
229,917,341
|
$
|
(183,096,572
|
)
|
$
|
(908,054
|
)
|
$
|
1,862,629
|
$
|
47,976,976
|
|||||||||||||
The accompanying notes are an integral part of the consolidated financial statements.
AROTECH CORPORATION AND SUBSIDIARIES
CONSOLIDATED STATEMENTS OF CASH FLOWS
|
2015
|
2014
|
2013
|
||||||||||
|
CASH FLOWS FROM OPERATING ACTIVITIES:
|
||||||||||||
|
Net income (loss)
|
$ | (2,945,026 | ) | $ | 3,486,961 | $ | 2,152,351 | |||||
|
Adjustments required to reconcile net income (loss) to net cash provided by
operating activities:
|
||||||||||||
|
Depreciation
|
1,851,982 | 1,558,506 | 1,196,425 | |||||||||
|
Amortization of intangible assets
|
3,043,536 | 2,696,740 | 1,091,126 | |||||||||
|
Stock based compensation
|
622,315 | 1,411,970 | 437,306 | |||||||||
|
Change in fair value of acquisition earn out liabilities
|
– | (2,000,000 | ) | – | ||||||||
|
(Gain) loss from sale of property and equipment
|
(781,023 | ) | 12,809 | 16,418 | ||||||||
|
Deferred tax provision
|
914,543 | 598,500 | 598,500 | |||||||||
|
Changes in continuing operating assets and liabilities:
|
||||||||||||
|
Trade receivables
|
194,332 | (2,529,966 | ) | (2,723,162 | ) | |||||||
|
Unbilled receivables
|
3,804,576 | 2,337,691 | 4,910,084 | |||||||||
|
Other accounts receivable and prepaid expenses
|
148,269 | 582,502 | (219,664 | ) | ||||||||
|
Inventories
|
203,947 | 809,827 | (41,241 | ) | ||||||||
|
Severance pay, net
|
43,244 | 38,463 | 95,695 | |||||||||
|
Trade payables
|
(858,040 | ) | (1,143,632 | ) | (2,049,119 | ) | ||||||
|
Other accounts payable and accrued expenses
|
(944,376 | ) | 6,480 | 1,805,568 | ||||||||
|
Deferred revenues
|
(946,363 | ) | (464,211 | ) | 3,221,993 | |||||||
|
Discontinued operations
|
– | – | (291,410 | ) | ||||||||
|
Net cash provided by operating activities
|
4,351,916 | 7,402,640 | 10,200,870 | |||||||||
|
CASH FLOWS FROM INVESTING ACTIVITIES:
|
||||||||||||
|
Acquisition of UEC(1)
|
– | (29,113,655 | ) | – | ||||||||
|
Changes in restricted collateral deposits
|
146,443 | 262,067 | (312,189 | ) | ||||||||
|
Purchase of property and equipment
|
(2,002,104 | ) | (2,122,886 | ) | (1,701,110 | ) | ||||||
|
Additions to capitalized software development
|
(537,901 | ) | (377,954 | ) | (3,675 | ) | ||||||
|
Proceeds from sale of property and equipment
|
953,824 | 25,892 | 25,898 | |||||||||
|
Discontinued operations
|
– | – | 44,827 | |||||||||
|
Net cash used in investing activities
|
$ | (1,439,738 | ) | $ | (31,326,536 | ) | $ | (1,946,249 | ) | |||
AROTECH CORPORATION AND SUBSIDIARIES
CONSOLIDATED STATEMENTS OF CASH FLOWS (continued)
| 2015 |
2014
|
2013
|
|||||||||
|
CASH FLOWS FROM FINANCING ACTIVITIES:
|
|||||||||||
|
Repayment of long term debt
|
$
|
(5,096,130)
|
$
|
(3,110,640
|
)
|
$
|
(878,490
|
)
|
|||
|
Proceeds from long term debt
|
–
|
22,500,000
|
–
|
||||||||
|
Change in short term bank credit
|
4,026,762
|
33,238
|
(9,787,779
|
)
|
|||||||
|
Purchase of treasury stock
|
–
|
(229,042
|
)
|
–
|
|||||||
|
Payment of acquisition related earnout
|
(2,500,000
|
)
|
–
|
–
|
|||||||
|
Proceeds from sale of common stock, net of offering costs
|
–
|
|
10,698,173
|
6,338,449
|
|||||||
|
Discontinued operations
|
–
|
–
|
(49,634
|
)
|
|||||||
|
Net cash provided by (used in) financing activities
|
( 3,569,368
|
) |
29,891,729
|
(4,377,454
|
)
|
||||||
|
INCREASE (DECREASE) IN CASH AND CASH EQUIVALENTS
|
(657,190
|
) |
5,967,833
|
3,877,167
|
|||||||
|
CASH DIFFERENCES DUE TO EXCHANGE RATE CHANGES
|
(26,174
|
) |
(497,374
|
)
|
256,983
|
||||||
|
NET CHANGE IN CASH AND CASH EQUIVALENTS - DISCONTINUED
|
–
|
–
|
106,548
|
||||||||
|
CASH AND CASH EQUIVALENTS AT THE BEGINNING OF THE YEAR
|
11,291,784
|
5,821,325
|
1,580,627
|
||||||||
|
CASH AND CASH EQUIVALENTS AT THE END OF THE YEAR
|
$
|
10,608,420
|
$
|
11,291,784
|
$
|
5,821,325
|
|||||
|
SUPPLEMENTARY CASH FLOW INFORMATION:
|
|||||||||||
|
Interest paid during the year
|
$
|
1,084,710
|
$
|
1,004,052
|
$
|
420,505
|
|||||
|
Taxes on income paid during the year
|
679,055
|
256,246
|
93,004
|
||||||||
|
SUPPLEMENTARY INFORMATION ON NON-CASH TRANSACTIONS:
|
|||||||||||
|
Common stock issued in acquisition of UEC
|
$
|
–
|
$
|
4,216,000
|
$
|
–
|
|||||
______________
|
(1)
|
On April 1, 2014, the Company acquired all of the outstanding membership interests of UEC Electronics, LLC (“UEC”). The cash portion of the transaction is summarized as follows:
|
|
Cash paid at closing
|
28,000,000
|
|||
|
Net working capital adjustment (paid in May 2014)
|
1,206,245
|
|||
|
Cash acquired
|
(92,590
|
)
|
||
|
Total
|
$
|
29,113,655
|
The accompanying notes are an integral part of the consolidated financial statements.
AROTECH CORPORATION AND SUBSIDIARIES
NOTES TO CONSOLIDATED FINANCIAL STATEMENTS
NOTE 1:– GENERAL
a. Corporate structure:
Arotech Corporation (“Arotech”) and its wholly-owned subsidiaries (the “Company”) provide defense and security products for the military, law enforcement, emergency services and homeland security markets, including advanced zinc-air and lithium batteries and chargers, and multimedia interactive simulators/trainers. The Company operates primarily through its wholly-owned subsidiaries FAAC Incorporated, a Michigan corporation located in Ann Arbor, Michigan (Training and Simulation Division) with locations in Royal Oak, Michigan and Orlando, Florida; Epsilor-Electric Fuel Ltd. (“Epsilor-EFL”), an Israeli corporation located in Beit Shemesh, Israel (between Jerusalem and Tel-Aviv) and in Dimona, Israel (in Israel’s Negev desert area) (Power Systems Division); UEC Electronics, LLC (“UEC”), a South Carolina limited liability company located in Hanahan, South Carolina (Power Systems Division). Pursuant to a management decision in the fourth quarter of 2011 and sale in 2012, the Company’s Armor Division, consisting of M.D.T. Protective Industries, Ltd., based in Lod, Israel, and MDT Armor Corporation, based in Auburn, Alabama, along with the trade name of Armor of America Incorporated, are reflected as discontinued operations for all periods presented.
b. Discontinued operations
In December 2011, the Company’s Board of Directors approved management’s plan to sell the Armor Division. The sale of the assets was completed in June 2012 at a cash purchase price of $50,000. Unless otherwise indicated, discontinued operations are not included in the Company’s reported results and amounts and disclosures throughout the Notes to Consolidated Financial Statements relate only to the Company’s continuing operations.
The operations in 2013 primarily represent the completion of certain contracts that were not assumed by the buyer of the Armor Division and include revenues of $2,009, operating costs of $118,323 and other costs of $62,067.
The Company retained the facility used by the Armor operations and leased it to the buyer of those operations under a three year operating lease for approximately $9,300 per month. As of December 31, 2014, the Company was marketing the facility for sale, and it had no recorded book value. On February 9, 2015, the Company sold the building to the tenant for $925,000, resulting in a gain (after fees) of $895,000 which was recorded in general and administrative expenses on the income statement. On that same date, the existing mortgage and building sublease were terminated and this ended any obligation the Company had in relation to the property.
c. Related parties
Sampen Corporation
The Company has had a consulting agreement with Sampen Corporation since 2005. Sampen is a New York corporation owned by members of the immediate family of one of the Company’s executive officers, and this executive officer is an employee of both the Company and of Sampen. In 2014, the term of this consulting agreement was extended until December 31, 2017, unless either Sampen or the Company terminates the agreement sooner.
Pursuant to the terms of the Company’s agreement with Sampen, Sampen provides one of its employees to the Company for such employee to serve as our President and Chief Executive Officer of the Company. The Company pays Sampen $8,960 per month, plus an annual bonus, if certain performance criteria are met, on a sliding scale, in an amount equal to a minimum of 25% of Sampen’s annual base compensation then in effect, up to a maximum of 75% of its annual base compensation then in effect if the results the Company actually attained for the year in question are 110% or more of the amount the Company budgeted at the beginning of the year. The Company also pays Sampen to cover the cost of the Company’s use of Sampen’s offices as an ancillary New York office and the attendant expenses and insurance costs, an amount equal to 16% of each monthly payment of base compensation.
During the years ended December 31, 2015, 2014 and 2013, the Company incurred a total expenses of $124,720, $124,720 and $148,723, respectively, related to Sampen.
On February 16, 2016, the Company notified Sampen that it will terminate its consulting agreement effective June 30, 2016.
AROTECH CORPORATION AND SUBSIDIARIES
NOTES TO CONSOLIDATED FINANCIAL STATEMENTS
NOTE 1:– GENERAL (Cont.)
Note Receivable
On February 9, 2000, Mr. Ehrlich, the Company’s Executive Chairman of the Board, exercised 9,404 stock options. Mr. Ehrlich paid the exercise price of the stock options and certain taxes that the Company paid on his behalf by giving the Company a non-recourse promissory note due in 2025 in the amount of $329,163, originally bearing annual interest at 1% over the then-current federal funds rate announced from time to time by the Wall Street Journal, secured by the shares of the Company’s common stock acquired through the exercise of the options and certain compensation due to Mr. Ehrlich upon termination. As of December 31, 2015 and 2014, the aggregate amount outstanding pursuant to this promissory note was $452,995. Additionally, there is a former employee with the same arrangement with an outstanding promissory note of $455,059. Effective 2008, the Company no longer accrues interest on these promissory notes.
UEC Facility Headquarters
On October 31, 2014, the Company entered into a lease agreement with UEC Properties, LLC, a company controlled by the former owners of UEC, and now employees and shareholders’ of the Company, for land and buildings that represent the headquarters of UEC Electronics. The lease term with UEC Properties commenced on January 1, 2015 and it extends for ten years, expiring on December 31, 2024. The 2015 monthly lease payment is $28,862 and increases at a rate of 2.5% per year through the term of the lease. Lease expense recognized in 2014 was $346,344. Upon written notice, the Company and UEC Properties, LLC, may elect to terminate the lease after five years.
Admiralty Partners
On February 3, 2016, the Company entered into a consulting agreement with Admiralty Partners, a business controlled by a member of the Board of Directors, for a period of three years. In exchange, the Company will pay an annual fee equal to the difference between total accrued compensation of the Board member and $125,000. The agreement can be terminated by either party upon sufficient written notice. See Note 20 – Subsequent Events.
NOTE 2:– SIGNIFICANT ACCOUNTING POLICIES
The consolidated financial statements have been prepared in accordance with generally accepted accounting principles in the United States (“U.S. GAAP”).
a. Principles of consolidation:
The consolidated financial statements include the accounts of Arotech and its wholly owned subsidiaries. Intercompany balances and transactions have been eliminated upon consolidation.
b. Financial Statements in U.S. Dollars:
A majority of the revenues of the Company are generated in U.S. dollars (“dollars”). In addition, a substantial portion of the Company’s costs are incurred in dollars. Management believes that the dollar is the primary currency of the economic environment in which the Company operates. Thus, the functional and reporting currency of the Company including most of its subsidiaries is the dollar. Accordingly, monetary accounts maintained in currencies other than dollars are re-measured into dollars, with resulting gains and losses reflected in the consolidated statements of comprehensive income as financial income or expenses, as appropriate.
The majority of transactions of Epsilor-EFL are in New Israel Shekels (“NIS”) and a substantial portion of Epsilor-EFL’s costs is incurred in NIS. Management believes that the NIS is the functional currency of Epsilor-EFL. Accordingly, the financial statements of Epsilor-EFL have been translated into dollars. All balance sheet accounts have been translated using the exchange rates in effect at the balance sheet date. Statement of comprehensive income amounts have been translated using the weighted average exchange rate for the period. The resulting translation adjustments are reported as a component of accumulated other comprehensive income (loss) in stockholders’ equity.
AROTECH CORPORATION AND SUBSIDIARIES
NOTES TO CONSOLIDATED FINANCIAL STATEMENTS
NOTE 2:– SIGNIFICANT ACCOUNTING POLICIES (Cont.)
c. Cash equivalents:
Cash equivalents are short-term highly liquid investments that are readily convertible to cash with original maturities of three months or less when acquired.
d. Restricted collateral deposits:
Restricted collateral deposits are primarily invested in highly liquid deposits which are used as a security for the Company’s performance guarantees at FAAC and Epsilor-EFL.
e. Inventories:
Inventories are stated at the lower of cost or market value. Inventory write-offs and write-down provisions are provided to cover risks arising from slow-moving items or technological obsolescence and for market prices lower than cost. The Company periodically evaluates the quantities on hand relative to current and historical selling prices and historical and projected sales volume. Based on this evaluation, provisions are made to write inventory down to its market value. In 2015, 2014, and 2013, the Company wrote off approximately $321,000, $509,000, and $186,000 respectively, of obsolete inventory, which has been included in the cost of revenues.
Cost is determined as follows:
Raw and packaging materials – by the average cost method or FIFO.
Work in progress – represents the cost of manufacturing including allocable indirect and direct manufacturing costs.
Finished products
f. Property and equipment:
Property and equipment are stated at cost net of accumulated depreciation and investment grants received from the State of Israel for investments in fixed assets under the Law for the Encouragement of Capital Investments, 5719-1959 (the “Investments Law”). The Company did not receive any investment grants in 2015, 2014, or 2013, respectively.
Depreciation is calculated by the straight-line method over the following estimated useful lives of the assets:
|
Depreciable life (in years)
|
||
|
Computers and related equipment
|
3 to5 | |
|
Motor vehicles
|
5 to7 | |
|
Office furniture and equipment
|
3 to5 | |
|
Machinery, equipment and installations
|
5 to 10 | |
| Buildings | 30 | |
|
Land
|
Not depreciated
|
|
|
Leasehold improvements
|
Shorter of the term of the lease or the life of the asset
|
|
|
Demo inventory
|
3 to 5 |
The Company tests long-lived asset groups for recoverability when changes in circumstances indicate the carrying value may not be recoverable, for example, when there are material adverse changes in projected revenues or expenses, significant underperformance relative to historical or projected operating results, or significant negative industry or economic trends. We also perform a test for recoverability when management has committed to a plan to sell or otherwise dispose of an asset group. We evaluate recoverability of an asset group by comparing its carrying value to the future net undiscounted cash flows that we expect will be generated by the asset group. If the comparison indicates that the carrying value of an asset group is not recoverable, we recognize an impairment loss for the excess of carrying value over the estimated fair value. When we recognize an impairment loss for assets to be held and used, we depreciate the adjusted carrying amount of those assets over their remaining useful life.
AROTECH CORPORATION AND SUBSIDIARIES
NOTES TO CONSOLIDATED FINANCIAL STATEMENTS
NOTE 2:– SIGNIFICANT ACCOUNTING POLICIES (Cont.)
g. Goodwill and Other Intangible Assets:
Goodwill may result from our business acquisitions. Goodwill is assigned to our reporting units based on the expected benefit from the synergies arising from each business combination, determined by using certain financial metrics, including the forecast discounted cash flows associated with each reporting unit. As of December 31, 2015, we had recorded goodwill of $45.5 million. We allocate goodwill acquired in a business combination to the appropriate reporting unit as of the acquisition date. Our two reporting units, Training and Simulation and our Power Systems Divisions are also our reportable segments. The associated goodwill was determined when the specific businesses in the reportable segments were purchased. For the Training and Simulation Division and the Power Systems Division, we have recorded goodwill amounting to $24.4 million and $21.1 million, respectively.
When testing goodwill for impairment we have the option of performing a qualitative assessment before calculating the fair value of a reporting unit. If the Company determines, on the basis of qualitative factors, that it is more likely than not that the fair value of the reporting unit is greater than the carrying amount, the two-step impairment test would not be required. If we cannot determine on the basis of qualitative factors that goodwill is not impaired, goodwill is then tested for impairment by using a discounted cash flow analysis. This type of analysis requires us to make assumptions and estimates regarding industry economic factors and the profitability of future business strategies. Significant estimates used in the methodologies include estimates of future cash flows, future short-term and long-term growth rates, weighted average cost of capital and estimates of market multiples for the reportable units. It is our policy to conduct impairment testing based on our current business strategy in light of present industry and economic conditions, as well as future expectations. In assessing the recoverability of our goodwill, we may be required to make assumptions regarding estimated future cash flows and other factors to determine the fair value of the respective assets. This process is subjective and requires judgment at many points throughout the analysis. If our estimates or their related assumptions change in subsequent periods or if actual cash flows are below our estimates, we may be required to record impairment charges for these assets not previously recorded.
The Company also maintains other indefinite-lived intangible assets and definite-lived intangible assets. The indefinite-lived intangible assets are not amortized but are tested for impairment on at least an annual basis or when determined to have a finite useful life. Substantially all of the indefinite-lived intangible assets are trademarks. Definite-lived intangible assets are reviewed for recoverability when changes in circumstances indicate the carrying value may not be recoverable, for example, when there are material adverse changes in projected revenues or expenses, significant underperformance relative to historical or projected operating results, or significant negative industry or economic trends. If the comparison indicates that the carrying value of an asset group is not recoverable, we recognize an impairment loss for the excess of carrying value over the estimated fair value.
h. Revenue recognition:
The Company is a defense and security products and services company, engaged in two business areas: interactive simulation for military, law enforcement and commercial markets; and power systems and batteries for the military, commercial and medical markets. During 2015, 2014 and 2013, the Company recognized revenues (i) from the sale and customization of interactive training systems and from the maintenance services in connection with such systems (Training and Simulation Division); (ii) from the sale of batteries, chargers and adapters, and under certain development contracts with the U.S. Army (Power Systems Division); and (iii) from the sale of lifejacket lights (Power Systems Division).
Revenues from certain products sold by the Power Systems Division are recognized when persuasive evidence of an agreement exists, delivery has occurred, the fee is fixed or determinable, collectability is probable, and no further obligation remains. Typically revenue is recognized, per the contract, when the transaction is entered into the U.S. Government’s Wide Area Workflow system, which occurs after the products have been accepted at the plant or when shipped. Sales to other entities are recorded in accordance with the contract, either when shipped or delivered. Normally there are no further obligations that would preclude the recognition of revenue. Additionally, certain contracts are recognized using contract accounting on a percentage of completion method.
AROTECH CORPORATION AND SUBSIDIARIES
NOTES TO CONSOLIDATED FINANCIAL STATEMENTS
NOTE 2:– SIGNIFICANT ACCOUNTING POLICIES (Cont.)
Revenues from contracts in the Training and Simulation Division and Power Systems Division that involve customization of the system to customer specifications are recognized using contract accounting on a percentage of completion method, in accordance with the “Input Method.” The amount of revenue recognized is based on the percentage to completion achieved. The percentage to completion is measured by monitoring progress using records of actual time, materials and other costs incurred to date in the project compared to the total estimated project requirement. Estimates of total project requirements are based on prior experience of customization, delivery and acceptance of the same or similar technology and are reviewed and updated regularly by management. Provisions for estimated losses on uncompleted contracts are made in the period in which such losses are first determined, in the amount of the estimated loss on the entire contract. Normally there are no further obligations that would preclude the recognition of revenue.
The Company believes that the use of the percentage of completion method is appropriate for certain contracts as the Company has the ability to make reasonably dependable estimates of the extent of progress towards completion, contract revenues and contract costs. In addition, contracts executed include provisions that clearly specify the enforceable rights regarding services to be provided and received by the parties to the contracts, the consideration to be exchanged and the manner and the terms of settlement, including in cases of terminations for convenience. In all cases, the Company expects to perform its contractual obligations and its customers are expected to satisfy their obligations under the contract.
Revenues from products that do not require significant customization are recognized when persuasive evidence of an agreement exists, delivery has occurred, no significant obligations with regard to implementation remain, the fee is fixed or determinable and collectability is probable.
Maintenance and support revenue included in multiple element arrangements is deferred and recognized on a straight-line basis over the term of the maintenance and support services. Revenues from training are recognized when it is performed. The Vendor Specific Objective Evidence (“VSOE”) of fair value of the maintenance, training and support services is determined based on the price charged when sold separately or when renewed.
i. Trade receivables
The Company records trade accounts receivable at net realizable value. This value includes an appropriate allowance for estimated uncollectible accounts to reflect any loss anticipated on the trade accounts receivable balances and charged to the provision for doubtful accounts. The Company calculates this allowance based on its history of write-offs, the level of past-due accounts based on the contractual terms of the receivables, and its relationships with, and the economic status of, its customers. During the years ended December 31, 2015 and 2014, the Company made no provisions or had any recoveries of doubtful accounts and had no reserves at either year end. The Company believes its exposure to concentrations of credit risk is limited due to the nature of its operations.
Unbilled receivables include cost and gross profit earned in excess of billing.
Deferred revenues include unearned amounts received under maintenance and support services, customer prepayments and billing in excess of costs and estimated earnings on uncompleted contracts.
j. Warranty:
The Company typically offers a one to two year warranty for many of its products. The specific terms and conditions of those warranties vary depending upon the product sold and country in which the Company does business. The Company estimates the costs that may be incurred under its basic limited warranty, including parts and labor, and records deferred revenue in the amount of such costs at the time product revenue is recognized in the Training and Simulation Division. In the Power Systems Division, warranty costs are estimated, accrued and recorded on the balance sheet in deferred revenues. Factors that affect the Company’s warranty liability include the number of installed units, historical and anticipated rates of warranty claims, and cost per claim. The Company periodically assesses the adequacy of its reserves and adjusts the amounts as necessary. (See Note 17.)
NOTES TO CONSOLIDATED FINANCIAL STATEMENTS
NOTE 2:– SIGNIFICANT ACCOUNTING POLICIES (Cont.)
k. Research and development cost:
The Company capitalizes certain software development costs, subsequent to the establishment of technological feasibility. Based on the Company’s product development process, technological feasibility is established upon the completion of a working model or a detailed program design. Research and development costs incurred in the process of developing product improvements or new products are generally charged to expenses as incurred. Significant costs incurred by the Company between completion of the working model or a detailed program design and the point at which the product is ready for general release have been capitalized. Capitalized software costs will be amortized by the greater of the amount computed using: (i) the ratio that current gross revenues from sales of the software bears to the total of current and anticipated future gross revenues from sales of that software, or (ii) the straight-line method over the estimated useful life of the product (one to three years). The Company assesses the net realizable value of this intangible asset on a regular basis by determining whether the amortization of the asset over its remaining life can be recovered through undiscounted future operating cash flows from the specific software product sold. Based on its most recent analyses, management believes that no impairment of capitalized software development costs exists as of December 31, 2015.
In 2015 and 2014, the Training and Simulation Division capitalized approximately $538,000 and $378,000, respectively, in software development costs that will be amortized on a straight-line method over 2 years, the useful life of the software.
l. Income taxes:
The Company accounts for income taxes under the asset and liability method, whereby deferred tax assets and liability account balances are determined based on tax credit carryforwards and differences between the financial reporting and the tax basis of assets and liabilities and are measured using the enacted tax rates and laws that will be in effect when the differences are expected to reverse. The Company provides a valuation allowance, if necessary, to reduce deferred tax assets to their estimated realizable value.
The Company has adopted the provisions of the Financial Accounting Standards Board (“FASB”) issued Accounting Standards Update (“ASU”) ASC 740-10, which prescribes a recognition threshold and measurement attribute for the financial statement recognition and measurement of a tax position taken in a tax return. The Company must determine whether it is “more-likely-than-not” that a tax position will be sustained upon examination, including resolution of any related appeals or litigation processes, based on the technical merits of the position. Once it is determined that a position meets the more-likely-than-not recognition threshold, the position is measured to determine the amount of benefit to recognize in the financial statements. Uncertain tax positions require determinations and estimated liabilities to be made based on provisions of the tax law which may be subject to change or varying interpretation. If the Company’s determinations and estimates prove to be inaccurate, the resulting adjustments could be material to the Company’s future financial statements.
m. Concentrations of credit risk:
Financial instruments that potentially subject the Company to concentrations of credit risk consist principally of cash and cash equivalents, restricted collateral deposits and trade receivables. Cash and cash equivalents are invested mainly in U.S. dollar deposits with major Israeli and U.S. banks. Such deposits in the U.S. may be in excess of insured limits and are not insured in other jurisdictions. Management believes that the financial institutions that hold the Company’s investments are financially sound and, accordingly, minimal credit risk exists with respect to these investments.
The trade receivables of the Company are mainly derived from sales to customers located primarily in the United States and Israel along with the countries listed in footnote 16.c. Management believes that credit risks are moderated by the diversity of its end customers and geographical sales areas. The Company performs ongoing credit evaluations of its customers’ financial condition.
The Company had no off-balance-sheet concentration of credit risk such as foreign exchange contracts, option contracts or other foreign currency hedging arrangements as of December 31, 2015 and 2014.
AROTECH CORPORATION AND SUBSIDIARIES
NOTES TO CONSOLIDATED FINANCIAL STATEMENTS
NOTE 2:– SIGNIFICANT ACCOUNTING POLICIES (Cont.)
n. Basic and diluted net income per share:
Basic net income per share is computed based on the weighted average number of shares of common stock outstanding during each year. For periods with net income, basic net income per common share is computed by dividing the net income attributable to common stockholders by the weighted average number of share of common stock outstanding during the period. Diluted net income per share is derived, using the “treasury stock” method, based on the weighted average number of shares of common stock outstanding during each year, plus dilutive common stock equivalents related to participating securities, including outstanding stock options and non-vested restricted stock. The total weighted average number of shares related to the outstanding common stock equivalents excluded from the calculations of diluted net income per share was none, 602,740, and 611,700 for the years ended December 31, 2015, 2014, and 2013 respectively.
o. Accounting for stock-based compensation:
Stock-based awards to employees are recognized as compensation expense based on the calculated fair value on the date of grant. The costs are amortized over the straight line vesting period. The Company did not grant any stock options in 2015 or 2014. The Company typically uses a 5-10% forfeiture rate for restricted stock and restricted stock units and adjusts both forfeiture rates based on historical forfeitures. Each restricted stock unit is equal to one share of Company stock and is redeemable only for stock.
p. Fair value of financial instruments:
The following methods and assumptions were used by the Company in estimating their fair value disclosures for financial instruments using the required three-tier value hierarchy, which prioritizes the inputs used in measuring fair value as follows: (Level 1) observable inputs such as quoted prices in active markets; (Level 2) inputs other than the quoted prices in active markets that are observable either directly or indirectly; and (Level 3) unobservable inputs in which there is little or no market data, which may require the Company to develop its own assumptions.
The carrying amounts of cash and cash equivalents, restricted collateral deposits, trade and other receivables, short-term bank credit, and trade payables approximate their fair value due to the short-term maturity of such instruments (Level 1).
The fair values of long-term promissory notes are estimated by discounting the future cash flows using current interest rates for loans of similar terms and maturities. The carrying amount of the long-term liabilities approximates their fair value (Level 3).
q. Severance pay:
The Company’s liability for severance pay for its Israeli employees is calculated pursuant to Israeli severance pay law based on the most recent salary of the employees multiplied by the number of years of employment as of the balance sheet date. Israeli employees are
entitled to one month’s salary for each year of employment, or a portion thereof. The Company’s liability for all of its Israeli employees is fully provided for by monthly deposits into severance pay funds held by insurance companies on behalf of the employees, insurance policies and by accrual. The fair value of these funds, which are considered Level 2 fair value measurements, is recorded as an asset in the Company’s consolidated balance sheet.
In addition, according to certain employment agreements, the Company is obligated to provide for a special severance pay in addition to amounts due to certain employees pursuant to Israeli severance pay law. During the years ended December 31, 2015, 2014 and 2013, the Company had made provisions of $143,000, $124,000, and $49,000, respectively, for this special severance pay. As of December 31, 2015, 2014 and 2013, the unfunded severance pay in that regard amounted to $1,387,000, $1,441,000, and $1,317,000, respectively.
Pursuant to the terms of the respective employment agreements between the Company and its Chief Executive Officer, its Chief Financial Officer and its Executive Chairman of the Board, funds to secure payment of their respective contractual severance amounts are to be deposited for their benefit in either Israel or the U.S., with payments to be made pursuant to an agreed-upon schedule. These funds continue to be owned by the Company, which benefits from all gains and bears the risk of all losses resulting from investments of these funds.
AROTECH CORPORATION AND SUBSIDIARIES
NOTES TO CONSOLIDATED FINANCIAL STATEMENTS
NOTE 2:– SIGNIFICANT ACCOUNTING POLICIES (Cont.)
The deposited funds include profits and losses accumulated up to the balance sheet date. The deposited funds may be withdrawn only upon the fulfillment of the obligation pursuant to Israeli severance pay law or labor agreements. The fair value of the deposited funds is based on the cash surrender value of these policies and includes immaterial profits.
In April 2009, the Company, with the agreement of its then-Chairman and Chief Executive Officer and its then-President (now its Executive Chairman of the Board and its President and Chief Executive Officer, respectively), funded an additional portion of their severance security by means of issuing to them, in trust, restricted stock having a value (based on the closing price of the Company’s stock on the Nasdaq Stock Market on the date on which the executives and the Company’s board of directors agreed to this arrangement) of $440,000, a total of 602,740 shares. The Company agreed with the executives that the economic risk of gain or loss on these shares is to be borne by them. Should they leave the Company’s employ under circumstances in which they are not entitled to their severance package (primarily, termination for Cause as defined in their employment agreement), these shares would be returned to the Company for cancellation and because of this, these shares were not included in the basic EPS calculation. In an agreement dated November 10, 2014 that was effective October 1, 2014, the contract with our current CEO was amended and his 273,973 shares are considered conditional restricted shares but without the previously-agreed reduction in his severance of $200,000.
Severance expenses from continuing operations for the years ended December 31, 2015, 2014, 2013, amounted to $625,000, $779,000, and $410,000, respectively.
r. Advertising costs:
The Company records advertising costs as incurred. Advertising expense for the years ended December 31, 2015, 2014, and 2013 was approximately $159,000, $111,000, and $71,000, respectively.
s. New accounting pronouncements:
In April 2015, the FASB issued ASU No. 2015-03, Simplifying the Presentation of Debt Issuance Costs (Topic 835-30) and in August issued ASU 2015-15, Presentation and Subsequent Measurement of Debt Issuance Costs Associated with Line-of-Credit Arrangements. These ASUs require the presentation of debt issuance costs in the balance sheet as a direct deduction from the related debt liability rather than as an asset. Amortization of such costs is reported as interest expense. This change conforms the presentation with that of debt discounts. In the case of debt issuance costs associated with a line-of-credit arrangement, the SEC does not object to classifying these costs as an asset and amortizing the deferred issuance costs over the life of the line-of-credit arrangement. The ASU is effective for annual reporting periods (including interim reporting periods within those periods) beginning after December 15, 2015; early adoption is permitted. The guidance is required to be applied retrospectively to all prior periods. The Company does not expect that the adoption of this standard will have a material effect on its financial statements.
In July 2015, the FASB issued ASU No. 2015-11, Simplifying the Measurement of Inventory (Topic 330). ASU No. 2015-11 eliminates the notions of replacement cost and net realizable value less a normal profit margin. This change is intended to simplify the accounting for inventory. This ASU is effective for annual reporting periods beginning after December 15, 2016, and for interim periods within fiscal years beginning after December 15, 2017. Early adoption is permitted. The guidance is required to be applied prospectively and will be accounted for as a change in accounting principle. The Company does not expect that the adoption of this standard will have a material effect on its financial statements.
In August 2015, the FASB issued ASU No. 2015-14, Revenue from Contracts with Customers (Topic 606): Deferral of the Effective Date. This ASU formally deferred the implementation date of ASU No. 2014-09, Revenue from Contracts with Customers (Topic 606) from annual reporting periods beginning after December 15, 2016 to annual reporting periods beginning after December 15, 2017. The ASU completes the joint effort by the FASB and International Accounting Standards Board to improve financial reporting by creating similar revenue recognition guidance for U.S. GAAP and International Financial Reporting Standards. ASU 2014-09 applies to all companies that enter into contracts with customers to transfer goods or services. The Company is currently evaluating the requirements of ASU 2014-09 and has not yet determined its impact on the Company’s consolidated financial statement or its adoption method.
AROTECH CORPORATION AND SUBSIDIARIES
NOTES TO CONSOLIDATED FINANCIAL STATEMENTS
NOTE 2:– SIGNIFICANT ACCOUNTING POLICIES (Cont.)
In September 2015, the FASB issued Accounting Standards Update (ASU) No. 2015-16, Business Combination (Topic 805): Simplifying the Accounting for Measurement-Period Adjustments. This change eliminates the requirement to restate prior period financial statements for measurement period adjustments following a business combination and requires that the cumulative impact of a measurement period adjustment (including the impact on prior periods) be recognized in the reporting period in which the adjustment is identified. The prior period impact of the adjustment should be either presented separately on the face of the income statement or disclosed in the notes. The ASU is effective for financial statements issued for fiscal years beginning after December 15, 2016, with early adoption permitted. The Company does not expect that the adoption of this standard will have a material effect on its financial statements.
In November 2015, the FASB issued ASU No. 2015-17, Balance Sheet Classification of Deferred Taxes. The new guidance eliminates the current requirement to present deferred tax assets and liabilities as current and noncurrent on the consolidated balance sheets. Instead, organizations will be required to classify all deferred tax assets and liabilities as noncurrent. This guidance is effective for financial statements issued for fiscal years beginning after December 15, 2016, and interim periods within those fiscal years, with early adoption permitted. The Company early adopted this new guidance on a prospective basis as a change in accounting policy and therefore prior periods were not retrospectively adjusted.
In February 2016, the FASB issued ASU No. 2016-02, Leases. The new standard establishes a right-of-use (ROU) model that requires a lessee to record a ROU asset and a lease liability on the balance sheet for all leases with terms longer than 12 months. Leases will be classified as either finance or operating, with classification affecting the pattern of expense recognition in the income statement. The new standard is effective for fiscal years beginning after December 15, 2018, including interim periods within those fiscal years. A modified retrospective transition approach is required for lessees for capital and operating leases existing at, or entered into after, the beginning of the earliest comparative period presented in the financial statements, with certain practical expedients available. We are currently evaluating the impact of our pending adoption of the new standard on our consolidated financial statements. No other new accounting pronouncements issued or effective during 2015 have had or are expected to have a significant impact on the Company’s consolidated financial statements.
t. Share repurchase:
In February 2009, the Company’s Board of Directors authorized the repurchase in the open market or in privately negotiated transactions of up to $1.0 million of the Company’s common stock. The repurchase program was extended in August 2015 for an additional year and the authorization expanded repurchase up to $2.0 million of the Company’s common stock. Through December 31, 2015, the Company repurchased an aggregate of 738,611 shares of its common stock for a total of $1,084,060, net of commissions. There were no shares repurchased during the year ended December 31, 2015. The repurchase program is subject to management’s discretion, and expires August 10, 2016.
u. Share-Based Payments
The Company has adopted FASB ASC 260-45-28, Share-Based Payment Arrangements, which classifies unvested share-based payment awards that contain non-forfeitable rights to dividends or dividend equivalents (whether paid or unpaid) as participating securities and requires them to be included in the computation of earnings per share using the two class method. The Company has determined that the unvested restricted stock issued to our employees and directors are “participating securities” and as such, are included, net of estimated forfeitures, in the total shares used to calculate the Company’s both the basic and diluted earnings per share.
v. Use of estimates:
The preparation of financial statements in conformity with U.S. GAAP requires management to make estimates and assumptions that affect the amounts reported in the financial statements and accompanying notes. Actual results could differ from those estimates.
w. Reclassification:
Prior period amounts are reclassified, when necessary, to conform to the current period presentation.
AROTECH CORPORATION AND SUBSIDIARIES
NOTES TO CONSOLIDATED FINANCIAL STATEMENTS
NOTE 2:– SIGNIFICANT ACCOUNTING POLICIES (Cont.)
x. Business Combinations:
The Company recognizes the assets acquired and liabilities assumed in business combinations on the basis of their fair values at the date of acquisition. We assess the fair value of assets, including intangible assets, using a variety of methods and each asset is measured at fair value from the perspective of a market participant. The method used to estimate the fair values of intangible assets incorporates significant assumptions regarding the estimates a market participant would make in order to evaluate an asset, including a market participant’s use of the asset and the appropriate discount rates for a market participant. Assets recorded from the perspective of a market participant that are determined to not have economic use for us are expensed immediately. Any excess purchase price over the fair value of the net tangible and intangible assets acquired is allocated to goodwill. Transaction costs and restructuring costs associated with a business combination are expensed as incurred.
NOTE 3:– RESTRICTED COLLATERAL DEPOSITS
The following is a summary of restricted collateral deposits as of December 31, 2015 and 2014:
|
December 31,
|
||||||||
|
2015
|
2014
|
|||||||
|
Deposits in connection with Epsilor/EFL projects
|
$
|
89,985
|
$
|
90,286
|
||||
|
Deposits in connection with FAAC projects
|
–
|
146,142
|
||||||
|
Total restricted collateral deposits
|
$
|
89,985
|
$
|
236,428
|
||||
NOTE 4:– OTHER ACCOUNTS RECEIVABLE AND PREPAID EXPENSES
The following is a summary of other accounts receivable and prepaid expenses as of December 31, 2015 and 2014:
|
December 31,
|
||||||||
|
2015
|
2014
|
|||||||
|
Government authorities
|
$
|
307,339
|
$
|
253,320
|
||||
|
Employees
|
65,990
|
81,150
|
||||||
|
Prepaid expenses
|
625,511
|
819,386
|
||||||
|
Other
|
8,518
|
1,692
|
||||||
|
Total
|
$
|
1,007,358
|
$
|
1,155,548
|
||||
NOTE 5:– INVENTORIES
The following is a summary of inventories as of December 31, 2015 and 2014:
|
December 31,
|
||||||||
|
2015
|
2014
|
|||||||
|
Raw and packaging materials
|
$
|
8,184,476
|
$
|
8,195,623
|
||||
|
Work in progress
|
760,585
|
683,083
|
||||||
|
Finished products
|
662,775
|
933,077
|
||||||
|
Total
|
$
|
9,607,836
|
$
|
9,811,783
|
||||
AROTECH CORPORATION AND SUBSIDIARIES
NOTES TO CONSOLIDATED FINANCIAL STATEMENTS
NOTE 6:– PROPERTY AND EQUIPMENT, NET
a. Composition of property and equipment is as follows:
|
December 31,
|
||||||||
|
2015
|
2014
|
|||||||
|
Cost:
|
||||||||
|
Computers and related equipment
|
$
|
2,703,721
|
$
|
3,303,357
|
||||
|
Motor vehicles
|
831,925
|
624,562
|
||||||
|
Office furniture and equipment
|
1,512,663
|
1,590,124
|
||||||
|
Machinery, equipment and installations
|
7,284,986
|
7,678,040
|
||||||
|
Buildings
|
1,603,374
|
1,430,925
|
||||||
|
Land
|
300,000
|
300,000
|
||||||
|
Leasehold improvements
|
1,982,552
|
1,852,066
|
||||||
|
Demo inventory
|
2,288,031
|
2,286,159
|
||||||
|
18,507,252
|
19,065,233
|
|||||||
|
Accumulated depreciation:
|
||||||||
|
Computers and related equipment
|
2,222,724
|
2,661,174
|
||||||
|
Motor vehicles
|
298,881
|
295,298
|
||||||
|
Office furniture and equipment
|
1,237,923
|
1,175,897
|
||||||
|
Machinery, equipment and installations
|
5,266,579
|
5,675,452
|
||||||
|
Buildings
|
300,196
|
222,486
|
||||||
|
Leasehold improvements
|
1,012,810
|
1,097,739
|
||||||
|
Demo inventory
|
1,727,869
|
1,474,238
|
||||||
|
12,066,982
|
12,602,284
|
|||||||
|
Property and equipment, net
|
$
|
6,440,270
|
$
|
6,462,949
|
||||
b. Depreciation expense amounted to $1,851,982, $1,558,506 and $1,196,425 for the years ended December 31, 2015, 2014 and 2013, respectively.
As for liens, see Note 10.d.
NOTE 7:– GOODWILL AND OTHER INTANGIBLE ASSETS, NET
a. Goodwill
The Company allocates goodwill acquired in a business combination to the appropriate reporting unit as of the acquisition date. Currently, the Company’s reporting units are also its reportable segments and the associated goodwill was determined when the specific businesses in the reportable segments were purchased.
A summary of the goodwill by business segment is as follows:
|
December 31,
2014
|
Additions
|
Adjustments
(currency)
|
December 31,
2015
|
|||||||||||||
|
Training and Simulation Division
|
$
|
24,435,641
|
$
|
–
|
$
|
–
|
$
|
24,435,641
|
||||||||
|
Power Systems Division
|
20,986,578
|
–
|
40,808
|
21,027,386
|
||||||||||||
|
Total
|
$
|
45,422,219
|
$
|
–
|
$
|
40,808
|
$
|
45,463,027
|
||||||||
We completed our annual goodwill impairment review using the financial results as of the quarter ended December 31, 2015, using our forecasted plan developed in the fourth quarter.
With respect to our Training and Simulation Division, we determined, using qualitative factors, that goodwill was not impaired.
AROTECH CORPORATION AND SUBSIDIARIES
NOTES TO CONSOLIDATED FINANCIAL STATEMENTS
NOTE 7:– GOODWILL AND OTHER INTANGIBLE ASSETS, NET (Cont.)
For our Power Systems Division, we determined that it was necessary to perform a quantitative assessment of our goodwill for the purpose of determining whether a goodwill impairment existed at December 31, 2015. When conducting this analysis, we identified the four factors necessary to ensure the accuracy and completeness of our analysis.
|
1.
|
We engaged third party valuation experts with a detailed understanding of our Power Systems Division, to perform a valuation of the Power Systems Division on a going concern basis. The fair value was defined as the price that would be received to sell an asset or paid to transfer a liability in an orderly transaction between market participants at December 31, 2015.
|
|
2.
|
We evaluated whether the financial performance realized in 2015 was a result of discrete matters that are considered highly unlikely to recur in the future or whether the matters were systemic in nature that might result in a downturn of the reporting unit.
|
|
3.
|
We engaged third party consultants to validate our 2016 budget used in our discounted cash flow analysis.
|
|
4.
|
We prepared a discounted cash flow analysis over a five year period so as to derived a reasonable view of the cash flows that the Power Systems Division would generate from 2016-2020.
|
Key valuation assumptions
Inherent in a valuation of a firm is the reliance on key assumptions, including, but not limited to, the cash flows of the reporting unit, weighted average cost of capital (“WACC”), and terminal growth rates of the Company. In evaluating our key variables, we concluded, consistent with 2014, that our WACC and terminal growth rates of the Company were approximately 12% and 3%, respectively. With all other assumptions remaining constant, to the extent that either the WACC increases by 0.5% or the terminal growth rate decreases by 0.5%, we may determine that proceeding to step 2 of the impairment analysis, as indicated in ASC 350-10, is necessary.
As part of our of our annual budget process and in light of the operating losses of the reporting unit in 2015, the Power Systems Division prepared its 2016 budget and provided a prospective view of their various businesses, including key products, new and existing markets and customers, production processes, and insight into the future growth of the business. To the extent that there is a significant economic downturn, a freeze in military spending, a loss of a major contract or customer, or a significant shift of pre-existing customer arrangement to future years, we may need to evaluate goodwill for impairment in between the annual measurement period if events and circumstances indicate that it is more likely than not the asset is impaired.
As a result of our quantitative analysis, in which we computed the fair value of the Power Systems Division, we concluded that the fair value of the reporting unit exceeded the reporting unit’s carrying value by approximately 2%. We will continue to monitor the actual results of the reporting unit against our plan and re-evaluate goodwill as required in between the annual measurement period if events and circumstances indicate that it is more likely than not the asset is impaired.
We also consider our current market capitalization compared to the sum of the estimated fair values of our reporting units in conjunction with each impairment assessment. As part of this consideration, management recognizes that our market capitalization may not be an accurate representation of the sum of the reporting unit fair values for the following reasons:
|
·
|
The long term horizon of the valuation process versus a short term valuation using current market conditions;
|
|
·
|
The valuation by individual business segments versus the market share value based on our company as a whole including unallocable corporate costs;
|
|
·
|
The fact that our stock is thinly traded and widely dispersed with minimal institutional ownership, and thus not followed by major market analysts, leading management to conclude that the market in our securities was not acting as an informationally efficient reflection of all known information regarding us; and
|
|
·
|
Control premiums reflected in the reporting unit fair values but not in our stock price.
|
As of the December 31, 2015 valuation date, our market capitalization was approximately $50.4 million, which did not, in management’s view, suggest that the fair value estimates used in its impairment assessment required any adjustment.
As a result of these analyses, we concluded that the goodwill recorded in relation to the Power Systems Division was not impaired at December 31, 2015.
AROTECH CORPORATION AND SUBSIDIARIES
NOTES TO CONSOLIDATED FINANCIAL STATEMENTS
NOTE 7:– GOODWILL AND OTHER INTANGIBLE ASSETS, NET (Cont.)
b. Other intangible assets:
|
December 31,
|
|||||||||||||||||
|
2015
|
2014
|
||||||||||||||||
|
Original Useful life
|
Cost
|
Net book value
|
Cost
|
Net book value
|
|||||||||||||
|
Technology
|
4 - 8 years |
$
|
9,988,000
|
$
|
2,377,250
|
$
|
9,988,000
|
$
|
2,970,500
|
||||||||
|
Capitalized software costs
|
1 - 3 years |
4,609,946
|
630,230
|
4,072,045
|
347,740
|
||||||||||||
|
Trademarks
|
10 years |
28,000
|
5,600
|
28,000
|
8,400
|
||||||||||||
|
Backlog/customer relationship
|
1 - 10 years |
2,844,000
|
38,650
|
2,844,000
|
598,725
|
||||||||||||
|
Covenant not to compete
|
6 years |
400,000
|
304,000
|
400,000
|
382,000
|
||||||||||||
|
Customer list
|
2 - 10 years |
14,173,645
|
5,180,000
|
14,173,645
|
6,734,000
|
||||||||||||
|
32,043,591
|
$
|
8,535,730
|
31,505,690
|
$
|
11,041,365
|
||||||||||||
|
Less - accumulated amortization
|
(23,507,861
|
)
|
(20,464,325
|
)
|
|||||||||||||
|
Amortized cost
|
8,535,730
|
11,041,365
|
|||||||||||||||
|
Trademarks (indefinite lives)
|
799,000
|
799,000
|
|||||||||||||||
|
Net book value
|
$
|
9,334,730
|
$
|
11,840,365
|
|||||||||||||
Amortization expense amounted to $3,043,536, $2,696,740 and $1,091,126 for the years ended December 31, 2015, 2014 and 2013, respectively, including amortization of capitalized software costs of $255,000, $378,000 and $366,000, respectively.
c. Estimated amortization expenses, using both straight line and accelerated amortization methods, for the years shown is as follows:
|
Year ending December 31,
|
||||
|
2016
|
$
|
2,850,935
|
||
|
2017
|
2,019,545
|
|||
|
2018
|
1,266,750
|
|||
|
2019
|
885,000
|
|||
|
2020
|
574,500
|
|||
|
Thereafter
|
939,000
|
|||
|
Total
|
$
|
8,535,730
|
||
Goodwill and other intangible assets are adjusted on a quarterly basis for any change due to currency fluctuations and any variation is included in the accumulated other comprehensive income on the consolidated balance sheets.
NOTE 8:– SHORT-TERM BANK CREDIT AND LOANS
The Company’s FAAC subsidiary has a $15,000,000 line of credit (the “Line of Credit”) with Fifth Third Bank (the “Bank”) at a rate of LIBOR plus 3.00%, secured by the assets and receivables of FAAC and by the assets and receivables of Arotech and EFB. Additionally, Arotech and EFB are guarantors of the Line of Credit. The effective interest rate on the line of credit at December 31, 2015 was 3.24%.
AROTECH CORPORATION AND SUBSIDIARIES
NOTES TO CONSOLIDATED FINANCIAL STATEMENTS
NOTE 8:– SHORT-TERM BANK CREDIT AND LOANS (Cont.)
On April 1, 2014, pursuant to an Amended and Restated Credit Agreement (the “Amended Credit Agreement”), the parties to the original credit agreement (the “Original Credit Agreement”) agreed to amend the Line of Credit to add two term loans to it: an $18.0 million 61-month senior term loan at a 2014 interest rate of 3.75% over LIBOR, and a $4.5 million 61-month B term loan at a 2014 interest rate of 5.5% over LIBOR. Pursuant to a joinder agreement that took effect upon the Company’s acquisition of UEC (the “Joinder Agreement”), UEC became a party to the Amended Credit Agreement as a co-borrower with FAAC, and provided a guaranty and security substantially identical to that granted by the Company and EFB. The Company, FAAC and EFB also entered into a patent and trademark security agreement with the Bank; upon effectiveness of the Joinder Agreement, UEC executed a substantially identical agreement.
Certain covenants contained in the Original Credit Agreement have been modified in the Amended Credit Agreement. Commencing with the fiscal quarter ending September 30, 2014, the Company’s “Fixed Charge Coverage Ratio,” determined on a combined basis with UEC and otherwise computed in the same manner as under the Original Credit Agreement, has been raised to 1.25 to 1 from 1.10 to 1. “Net Advances to Affiliates” as defined in the Original Credit Agreement are now defined with reference to FAAC or UEC, as the case may be, and may not increase by more than $5,500,000 on a combined basis for both borrowers in any calendar year over a “Base Amount” to be determined by mutual agreement of FAAC and the Bank.
In addition, the Company also maintains a ratio of “Combined Funded Indebtedness” (defined as all indebtedness (a) in respect of money borrowed, (b) evidenced by a note, debenture or other like written obligation to pay money, (c) in respect of rent or hire of property under leases or lease arrangements which under GAAP are required to be capitalized or (d) in respect of obligations under conditional sales or other title retention agreements, all as determined on a combined basis for FAAC and UEC) to “Combined Adjusted EBITDA” (defined as EBITDA of FAAC and UEC computed on a combined basis) less (e) cash held on account with the Bank may not exceed (a) 2.25 to 1.0 for the Test Period ending September 30, 2014 or any Test Period ending as of the end of any fiscal quarter thereafter prior to the fiscal quarter ending March 31, 2015 or (b) 2.00 to 1.0 for the Test Period ending March 31, 2015 or any Test Period ending as of the end of any fiscal quarter thereafter.
Effective at the end of the second quarter 2015, the Bank eliminated the covenant that provided that UEC’s earnings before interest, taxes, depreciation and amortization with certain add-backs (“EBITDA”), may not be less than $4,500,000 for any trailing twelve-month period ending at the end of a fiscal quarter. In addition, during the fiscal quarter ended September 30, 2015, the Company obtained a waiver from the Bank with respect to maintaining a minimum fixed charge coverage ratio of 1.25 to 1. The Company was required to prepare quarterly covenant calculations and provide compliance certificates to its former primary lender. With the onset of the new bank agreement described in Note 20, the requirement to submit its December 31, 2015 covenants was discharged thereby eliminating the requirement to obtain a waiver for the period.
Pursuant to the requirements of the Amended Credit Agreement, the Company was required to deliver an Interest Rate Swap agreement fixing the interest rate of 1.37% on approximately $9.0 million of the outstanding term loans associated with the acquisition of UEC. Accordingly, in April 2014, the Company entered into an interest rate swap for a notional amount of $9.0 million. The expiration date of this interest rate swap is April 1, 2019. The fair value of the interest rate swap liability $34,000 and $51,000 at December 31, 2015 and December 31, 2014, respectively. The liability is included in accrued expenses and the change in fair value is recorded through financial expenses.
Effective March 11, 2016, the Company entered into a Credit Facilities agreement with JPMorgan Chase Bank, thereby replacing the credit agreement with Fifth Third Bank.
See Note 20 – Subsequent Events.
NOTE 9:– OTHER ACCOUNTS PAYABLE AND ACCRUED EXPENSES
The following is a summary of other accounts payable and accrued expenses as of December 31, 2015 and 2014:
|
December 31,
|
||||||||
|
2015
|
2014
|
|||||||
|
Employees and payroll accruals
|
$
|
3,310,170
|
$
|
4,254,140
|
||||
|
Accrued vacation pay
|
1,073,348
|
1,203,552
|
||||||
|
Accrued expenses
|
829,240
|
589,380
|
||||||
|
Government authorities
|
347,282
|
558,142
|
||||||
|
Earn-out liability
|
–
|
2,500,000
|
||||||
|
Total
|
$
|
5,560,040
|
$
|
9,105,214
|
||||
AROTECH CORPORATION AND SUBSIDIARIES
NOTES TO CONSOLIDATED FINANCIAL STATEMENTS
In U.S. dollars
NOTE 10:– COMMITMENTS AND CONTINGENT LIABILITIES
a. Royalty commitments:
Under Epsilor-EFL’s research and development agreements with the Office of the Chief Scientist (“OCS”), and pursuant to applicable laws, Epsilor-EFL is required to pay royalties at the rate of 3%-3.5% of net sales of products developed with funds provided by the OCS, up to an amount equal to 100% of research and development grants received from the OCS. Amounts due in respect of projects approved after 1999 also bear interest at the LIBOR rate. Epsilor-EFL is obligated to pay royalties only on sales of products in respect of which OCS participated in their development. Should the project fail, Epsilor-EFL will not be obligated to pay any royalties or refund the grants. During 2015, 2014 and 2013, Epsilor-EFL received grants in the total amount of $322,820, $177,918 and zero, respectively.
Royalties expensed for the year ended December 31, 2013 to the OCS amounted to $14,997. No royalties were expensed for 2015 and 2014, respectively.
b. Lease commitments:
The Company rents its facilities under various operating lease agreements, which expire on various dates through 2019, with an option to renew the building lease, through 2025 The minimum rental payments under non-cancelable operating leases are as follows:
|
December 31
|
Minimum rental payments
|
|||
|
2016
|
$
|
1,143,388
|
||
|
2017
|
1,097,275
|
|||
|
2018
|
644,236
|
|||
|
2019
|
395,495
|
|||
|
2020
|
–
|
|||
|
Thereafter
|
–
|
|||
|
Total
|
$
|
3,280,394
|
||
Total rent expenses for the years ended December 31, 2015, 2014, and 2013 were $1,404,183 and $1,366,192, and $887,796, respectively.
c. Guarantees:
The Company obtained bank guarantees in the amount of $26,000 in connection with (i) obligations of one of the Company’s subsidiaries to the Israeli customs authorities, and (ii) the obligation of one of the Company’s subsidiaries to secure the return of products loaned to the Company from one of its customers.
d. Liens:
As security for compliance with the terms related to the investment grants from the State of Israel, Epsilor-EFL has registered floating liens (that is, liens that apply not only to assets owned at the time but also to after-acquired assets) on all of its assets, in favor of the State of Israel.
The Company has $385,000 in credit liens collateralized by the assets of the Company and guaranteed by the Company.
Epsilor-EFL has recorded a lien on all of its assets in favor of its banks to secure overdraft protection. In addition Epsilor-EFL has a specific pledge on assets in respect of which government guaranteed loans were given.
e. Litigation and other claims:
As of the date of this filing, there were no material pending legal proceedings against the Company.
AROTECH CORPORATION AND SUBSIDIARIES
NOTES TO CONSOLIDATED FINANCIAL STATEMENTS
NOTE 11:– LONG TERM DEBT
a. Mortgage Note, Ann Arbor, Michigan:
In July 2011, the Training and Simulation Division purchased a building for $1,500,000 containing both office and lab space. The building was financed with a $1,100,000 mortgage loan that was obtained through the Company’s primary bank. The note requires a payment (principal and interest) of approximately $8,000 per month at an interest rate of LIBOR plus 375 basis points per annum with a balloon payment due in May 2017. The effective interest rate for the mortgage note at December 31, 2015 was 3.99%. (See Note 8 for the relevant covenants.) In December 2012, FAAC leased surplus space of the purchased building to a non-profit organization for $6,300 per month as office space for a term of 10 years with an option to terminate the lease with a one year prior notice in May 2018. See Note 20 – Subsequent Events.
b. Term loans A and B – UEC acquisition:
In April 2014, pursuant to the Amended Credit Agreement, the parties to the original credit agreement agreed to amend the Line of Credit to add two term loans to it: an $18,000,000 61-month senior term loan at an interest rate of 3.75% over LIBOR, and a $4,500,000 61-month B term loan at an interest rate of 5.5% over LIBOR. As of the end of 2015, the effective interest rate on Term Loans A and B were 3.99% and 5.74%, respectively Arotech is also a guarantor of any sums due pursuant to the Amended and Restated Credit Agreement which are detailed in Note 8 above. Principal payments are made monthly for term loan A of $360,000 and quarterly for term loan B of $160,714. Interest is paid monthly for both loans. See Note 20 – Subsequent Events.
c. Mortgage Note, Auburn, Alabama:
In March 2007, the Company purchased space for the now-discontinued Armor Division in Auburn, Alabama for approximately $1,100,000 pursuant to a seller-financed secured purchase money mortgage. Half the mortgage is payable over ten years in equal monthly installments based on a 20-year amortization of the full principal amount, and the remaining half is payable at the end of ten years in a balloon payment. The note requires a payment (principal and interest) of approximately $9,300 per month at an interest rate of 8.0% per annum. In September 2013, the Company transferred the seller-financed mortgage to Arotech from the discontinued Armor Division. Until February 2015, the Company was leasing this building to the buyer of the Armor Division for approximately $9,300 per month under a three year lease expiring in June 2015. On February 9, 2015, the Company sold the building to the tenant for $925,000. On that same date, the existing mortgage and existing building lease were terminated which ended any obligation the Company had for this property.
d. Minimum loan payments:
|
Minimum loan payments
|
December 31,
|
|||
|
2016
|
$
|
4,362,438
|
||
|
2017
|
5,156,453
|
|||
|
2018
|
4,297,714
|
|||
|
2019
|
1,586,051
|
|||
|
2020
|
816,304
|
|||
|
Thereafter
|
–
|
|||
|
Total
|
$
|
16,218,960
|
||
NOTE 12:– COSTS AND ESTIMATED EARNINGS ON UNCOMPLETED CONTRACTS
Billings in excess of costs generated under the percentage-of-completion method are recorded as deferred revenues until the revenue recognition criteria are met. Deferred revenues include unearned amounts received under maintenance and support services and customer deposits of $251,925 and $264,339 for 2015 and 2014, respectively, and billing in excess of costs and estimated earnings on uncompleted contracts.
AROTECH CORPORATION AND SUBSIDIARIES
NOTES TO CONSOLIDATED FINANCIAL STATEMENTS
NOTE 12:– COSTS AND ESTIMATED EARNINGS ON UNCOMPLETED CONTRACTS (Cont.)
The following is a summary of the costs and estimated earnings on uncompleted contracts as of December 31, 2015 and 2014. Open contracts are expected to be completed in the following year. The billings in excess of costs are included in the deferred revenue line of the balance sheet:
|
Year ended December 31,
|
||||||||
|
2015
|
2014
|
|||||||
|
Costs incurred on uncompleted contracts
|
$
|
235,476,048
|
$
|
231,676,372
|
||||
|
Estimated earnings
|
45,484,219
|
46,179,276
|
||||||
|
280,960,267
|
277,855,648
|
|||||||
|
Less billings to date
|
(272,058,689
|
)
|
(265,026,596
|
)
|
||||
|
Total
|
$
|
8,901,578
|
$
|
12,829,052
|
||||
|
Costs and estimated earnings in excess of billings
|
$
|
12,132,484
|
$
|
15,937,060
|
||||
|
Billings in excess of costs and estimated earnings (included in deferred revenues)
|
(3,230,906
|
)
|
(3,108,008
|
)
|
||||
|
Total
|
$
|
8,901,578
|
$
|
12,829,052
|
||||
NOTE 13:– STOCKHOLDERS’ EQUITY
a. Stockholders’ rights:
The Company’s shares confer upon the holders the right to receive notice to participate and vote in the general meetings of the Company and right to receive dividends, if and when declared.
b. The Company has adopted the following stock award plans, whereby options may be granted for purchase of shares of the Company’s common stock and where restricted shares and restricted stock units may be granted if approved by the Board of Directors. Each restricted stock unit is equal to one share of Company stock and is redeemable only for stock. Under the terms of the award plans, the Board of Directors or the designated committee grants options, restricted stock and restricted stock units. The Board of Directors or the designated committee also determines the vesting period and the exercise terms.
1. 2007 Non-Employee Director Equity Compensation Plan – 750,000 shares reserved for issuance, of which 287,022 were available for future grants to outside directors as of December 31, 2015.
2. 2009 Equity Incentive Plan – 5,000,000 shares reserved for issuance, of which 2,641,568 were available for future grants to employees and consultants as of December 31, 2015.
3. Under these plans, restricted shares and restricted stock units generally vest after one to three years or pursuant to defined performance criteria; in the event that employment is terminated within that period, unvested restricted shares and restricted stock units generally revert back to the Company.
4. Stock compensation expense is recorded ratably over the vesting period of the option or the restriction period of the restricted shares and restricted stock units. The stock compensation expense that has been charged in the consolidated statements of comprehensive income in respect of restricted shares and restricted stock units to employees and directors in 2015, 2014, and 2013 was $622,315, $1,411,970, and $437,306, respectively. All stock options were fully vested as of December 31, 2012.
AROTECH CORPORATION AND SUBSIDIARIES
NOTES TO CONSOLIDATED FINANCIAL STATEMENTS
NOTE 13:– STOCKHOLDERS’ EQUITY (Cont.)
5. A summary of the status of the Company’s plans and other share options, restricted shares and restricted stock units granted as of December 31, 2015 and 2014, and changes during the years ended on those dates, is presented below:
Stock Options:
| 2015 |
2014
|
2013
|
||||||||||||||||||||||
| Amount |
Weighted average
exercise price
|
Amount | Weighted average
exercise price
|
Amount |
Weighted average
exercise price
|
|||||||||||||||||||
|
Options outstanding at beginning of year
|
– | $ | – | 8,960 | $ | 5.46 | 12,228 | $ | 5.46 | |||||||||||||||
|
Changes during year:
|
||||||||||||||||||||||||
|
Granted
|
– | $ | – | – | $ | – | – | $ | – | |||||||||||||||
|
Exercised
|
– | $ | – | – | $ | – | – | $ | – | |||||||||||||||
|
Forfeited
|
– | $ | – | (8,960 | ) | $ | 5.46 | (3,268 | ) | $ | 5.46 | |||||||||||||
|
Options outstanding at end of year
|
– | $ | – | – | $ | – | 8,960 | $ | 5.46 | |||||||||||||||
|
Options vested at end of year
|
– | $ | – | – | $ | – | 8,960 | $ | 5.46 | |||||||||||||||
Restricted Shares and Restricted Stock Units:
|
2015
|
2014
|
2013
|
||||||||||||||||||||||
|
Shares
|
Weighted
average fair value at grant date
|
Shares
|
Weighted
average fair value at grant date
|
Shares
|
Weighted
average fair value at grant date
|
|||||||||||||||||||
|
Non-vested at the beginning of the year
|
920,678 | $ | 2.99 | 584,746 | $ | 2.52 | 844,270 | $ | 1.30 | |||||||||||||||
|
Changes during year:
|
||||||||||||||||||||||||
|
Restricted stock granted
|
57,028 | $ | 2.89 | 341,861 | $ | 2.60 | 270,550 | $ | 2.94 | |||||||||||||||
|
Restricted units granted
|
– | $ | – | 163,175 | $ | 2.48 | 110,180 | $ | 1.67 | |||||||||||||||
|
Vested
|
(451,122 | ) | $ | 3.15 | (166,110 | ) | $ | 2.23 | (434,732 | ) | $ | 1.22 | ||||||||||||
|
Forfeited
|
(9,632 | ) | $ | 2.38 | (2,994 | ) | $ | 3.65 | (205,522 | ) | $ | 1.41 | ||||||||||||
|
Non-vested at the end of the year
|
516,952 | $ | 2.94 | 920,678 | $ | 2.99 | 584,746 | $ | 2.52 | |||||||||||||||
|
Restricted shares vested at end of year
|
3,405,960 | $ | 2.22 | 2,954,838 | $ | 2.07 | 2,788,728 | $ | 1.85 | |||||||||||||||
6. The remaining total compensation cost related to non-vested restricted share and restricted stock unit awards not yet recognized (before applying a forfeiture rate) in the income statement as of December 31, 2015 was $244,856. The weighted average period over which this compensation cost is expected to be recognized is approximately one year.
AROTECH CORPORATION AND SUBSIDIARIES
NOTES TO CONSOLIDATED FINANCIAL STATEMENTS
NOTE 14:– INCOME TAXES
a. General:
As of December 31, 2015, Arotech has net operating loss (“NOL”) carryforwards for U.S. federal income tax purposes of $40.7 million, which are available to offset future taxable income, if any, expiring in 2021 through 2035. Utilization of U.S. net operating losses is subject to substantial annual limitations due to the “change in ownership” provisions of the Internal Revenue Code of 1986 and similar state provisions. The annual limitation may result in the expiration of net operating losses before utilization.
At December 31, 2015, the Company had net deferred tax assets before valuation allowance of $41.9 million. The deferred tax assets are primarily composed of federal, state and foreign tax NOL carryforwards. Due to uncertainties surrounding the Company’s ability to generate future taxable income to realize these assets, a full valuation allowance has been established to offset its net deferred tax asset. Additionally, the future utilization of the Company’s NOL carryforwards to offset future taxable income is subject to a substantial annual limitation as a result of IRC Section 382 changes that have occurred. Any carryforwards that will expire prior to utilization as a result of such limitations will be removed from deferred tax assets with a corresponding reduction of the valuation allowance.
The Company has indefinite-lived intangible assets consisting of trademarks and goodwill. These intangible assets are not amortized for financial reporting purposes. However, these assets are tax deductible, and therefore amortized over 15 years for tax purposes. As such, deferred income tax expense and a deferred tax liability arise as a result of the tax-deductibility of these assets. The resulting deferred tax liability, which is expected to continue to increase over time, will have an indefinite life, resulting in what is referred to as a “naked tax credit.” This deferred tax liability could remain on the Company’s balance sheet permanently unless there is an impairment of the related assets (for financial reporting purposes), or the business to which those assets relate were to be disposed of. Due to the fact that the aforementioned deferred tax liability could have an indefinite life, it is not netted against the Company’s deferred tax assets when determining the required valuation allowance. Doing so would result in the understatement of the valuation allowance and related deferred income tax expense.
The Company has also evaluated its income tax positions under FASB ASC 740-10 as of December 31, 2015 and the Company believes that it has no material uncertain tax positions and therefore has no uncertain tax position reserves and does not expect to provide for any such reserves. The Company does not believe that the unrecognized tax benefits will change within 12 months of this reporting date. It is the Company’s policy that any assessed penalties and interest on uncertain tax positions would be charged to income tax expense.
The Company does not provide for U.S. federal income taxes on the undistributed earnings of its foreign subsidiaries because such earnings, if any, are re-invested and, in the opinion of management, will continue to be re-invested indefinitely.
The Company files income tax returns, including returns for its subsidiaries, with federal, state, local and foreign jurisdictions. The Company is no longer subject to IRS examination for periods prior to 2012, although carryforward losses that were generated prior to 2012 may still be adjusted by the IRS if they are used in a future period. Additionally, the Company is no longer subject to examination in Israel for periods prior to 2014.
The Company files consolidated tax returns for its U.S. entities.
AROTECH CORPORATION AND SUBSIDIARIES
NOTES TO CONSOLIDATED FINANCIAL STATEMENTS
NOTE 14:– INCOME TAXES (Cont.)
b. Israeli subsidiary (Epsilor-EFL):
Epsilor-EFL’s tax rate was 26.5% for 2015, 2014 and 2013, respectively. In addition, dividends paid from the profits of Epsilor-EFL are subject to tax at the rate of 15% in the hands of their recipient. Management has indicated that it has no intention of declaring a dividend.
The Israeli government has established certain development zones so as to incentivize business development and export activities. Companies that reside in this zone and meet certain criteria are subject to a favorable tax rates. Epsilor-EFL is located in an approved development zone, however, currently does not meet the criteria established by the government to obtain the tax incentives.
As of December 31, 2015, the Company has tax loss carryforwards, generated by the predecessor of Epsilor-EFL, of $80.1 million, which is available indefinitely to offset future taxable income. Due to the 2009 merger of EFL-Epsilor, the utilization of the tax loss carryforward is subject to annual limitations.
c. Consolidated deferred income taxes:
Deferred income taxes reflect tax credit carryforwards and the net tax effects of temporary differences between the carrying amounts of assets and liabilities for financial reporting purposes and amounts used for income tax purposes. Significant components of the Company’s deferred tax assets are as follows:
|
December 31,
|
||||||||
|
2015
|
2014
|
|||||||
|
U.S. operating loss carryforward
|
$
|
14,814,390
|
$
|
12,163,441
|
||||
|
Foreign operating loss carryforward
|
20,228,547
|
21,284,600
|
||||||
|
Total operating loss carryforward
|
35,042,937
|
33,448,041
|
||||||
|
Temporary differences:
|
||||||||
|
Compensation and benefits
|
2,417,056
|
2,438,804
|
||||||
|
Warranty reserves
|
1,394,672
|
1,743,409
|
||||||
|
Foreign temporary differences
|
735,948
|
711,222
|
||||||
|
All other temporary differences
|
2,327,485
|
1,979,413
|
||||||
|
Total temporary differences
|
6,875,161
|
6,872,848
|
||||||
|
Deferred tax asset before valuation allowance
|
41,918,098
|
40,320,889
|
||||||
|
Valuation allowance
|
(41,918,098
|
)
|
(40,320,889
|
)
|
||||
|
Total deferred tax asset
|
$
|
–
|
$
|
–
|
||||
|
Deferred tax liability – intangible assets
|
$
|
7,031,564
|
$
|
6,117,021
|
||||
The Company provided valuation allowances for the deferred tax assets resulting from tax loss carryforwards and other temporary differences. At present, management currently believes that it is more likely than not that the deferred tax assets related to the operating loss carryforwards and other temporary differences will not be realized.
AROTECH CORPORATION AND SUBSIDIARIES
NOTES TO CONSOLIDATED FINANCIAL STATEMENTS
NOTE 14:– INCOME TAXES (Cont.)
d. Income from continuing operations before taxes on income are as follows:
|
Year ended December 31
|
||||||||||||
|
2015
|
2014
|
2013
|
||||||||||
|
Domestic
|
$ | (3,071,694 | ) | $ | 4,455,370 | $ | 4,215,005 | |||||
|
Foreign
|
1,287,614 | 55,428 | (888,315 | ) | ||||||||
| $ | (1,784,080 | ) | $ | 4,510,798 | $ | 3,326,690 | ||||||
e. Taxes on income were comprised of the following:
|
Year ended December 31
|
||||||||||||
|
2015
|
2014
|
2013
|
||||||||||
|
Current federal taxes
|
$
|
–
|
$
|
183,758
|
$
|
117,448
|
||||||
|
Current state and local taxes
|
246,403
|
316,444
|
210,299
|
|||||||||
|
Deferred taxes
|
914,543
|
598,500
|
598,500
|
|||||||||
|
Foreign taxes
|
–
|
–
|
–
|
|||||||||
|
Taxes in respect of prior years
|
–
|
(74,865
|
)
|
126,473
|
||||||||
|
Expense
|
$
|
1,160,946
|
$
|
1,023,837
|
$
|
1,052,720
|
||||||
f. A reconciliation between the theoretical tax expense, assuming all income is taxed at the U.S. federal statutory tax rate applicable to income of the Company and the actual tax expense as reported in the Statements of Comprehensive Income is as follows:
|
Year ended December 31,
|
||||||||||||
| 2015 |
2014
|
2013
|
||||||||||
|
Income (loss) from continuing operations before taxes
|
$ |
(1,784,080
|
) |
$
|
4,510,798
|
$
|
3,326,690
|
|||||
|
Statutory tax rate
|
34
|
%
|
34
|
%
|
34
|
%
|
||||||
|
Theoretical income tax on the above amount at the U.S. statutory tax rate
|
$ |
(606,587
|
)
|
$
|
1,533,671
|
$
|
1,131,075
|
|||||
|
Deferred taxes for which valuation allowance was provided
|
1,669,806
|
(949,966
|
)
|
(797,899
|
)
|
|||||||
|
Non-deductible expenses
|
31,841
|
66,720
|
67,928
|
|||||||||
|
State taxes, net of federal benefit
|
181,771
|
269,508
|
327,747
|
|||||||||
|
Foreign income in tax rates other than U.S. rate
|
(115,885
|
) |
(4,989
|
) |
79,948
|
|||||||
|
Taxes in respect of prior years
|
–
|
(74,865
|
) |
126,473
|
||||||||
|
Alternative minimum tax for which valuation allowance was not provided
|
–
|
183,758
|
117,448
|
|||||||||
|
Actual tax expense
|
$ |
1,160,946
|
$
|
1,023,837
|
$
|
1,052,720
|
||||||
AROTECH CORPORATION AND SUBSIDIARIES
NOTES TO CONSOLIDATED FINANCIAL STATEMENTS
NOTE 15:– SELECTED STATEMENTS OF COMPREHENSIVE INCOME DATA
Financial income (expense), net:
|
Year ended December 31,
|
||||||||||||
|
2015
|
2014
|
2013
|
||||||||||
|
Financial expenses:
|
||||||||||||
|
Interest, bank charges and fees
|
$ | (1,202,224 | ) | $ | (1,333,895 | ) | $ | (563,252 | ) | |||
|
Foreign currency transaction differences
|
– | (173,594 | ) | (16,418 | ) | |||||||
|
Other
|
– | – | (20,789 | ) | ||||||||
|
Total financial expenses
|
(1,202,224 | ) | (1,507,489 | ) | (600,459 | ) | ||||||
|
Financial income:
|
||||||||||||
|
Foreign currency transaction differences
|
50,103 | – | 117,603 | |||||||||
|
Total financial income
|
50,103 | – | 117,603 | |||||||||
|
Financial expense, net
|
$ | (1,152,121 | ) | $ | (1,507,489 | ) | $ | (482,856 | ) | |||
NOTE 16:– SEGMENT INFORMATION
a. General:
The Company operates in two continuing business segments (see Note 1.a. for a brief description of the Company’s business).
The Company’s reportable segments have been determined in accordance with the Company’s internal management structure, which is organized based on operating activities. The accounting policies of the reportable segments are the same as those described in the summary of significant accounting policies. The Company evaluates performance based on two primary factors: the segment’s operating income and the segment’s contribution to the Company’s future strategic growth.
AROTECH CORPORATION AND SUBSIDIARIES
NOTES TO CONSOLIDATED FINANCIAL STATEMENTS
NOTE 16:– SEGMENT INFORMATION (Cont.)
b. The following is information about reportable segment gains, losses and assets and are presented after the elimination of intra-segment revenues and expenses:
|
Training and
Simulation
Division
|
Power Systems
Division
|
Corporate
Expenses
|
Discontinued
operations
|
Total
Company
|
||||||||||||||||
|
2015
|
||||||||||||||||||||
|
Revenues from outside customers
|
$
|
54,617,611
|
$
|
41,956,336
|
$
|
–
|
$
|
–
|
$
|
96,573,947
|
||||||||||
|
Depreciation and amortization expenses (1)
|
(912,930
|
)
|
(3,957,368
|
)
|
(25,220
|
)
|
–
|
(4,895,518
|
)
|
|||||||||||
|
Direct expenses (2)
|
(44,711,979
|
)
|
(42,757,831
|
)
|
(4,840,578
|
)
|
–
|
(92,310,388
|
)
|
|||||||||||
|
Segment net income (loss)
|
8,992,702
|
(4,758,863
|
) |
(4,865,798
|
)
|
–
|
(631,959
|
)
|
||||||||||||
|
Financial income (expense)
|
(59,791
|
)
|
21,432
|
(1,113,762
|
)
|
–
|
(1,152,121
|
)
|
||||||||||||
|
Income tax (expense) benefit
|
(233,106
|
)
|
–
|
(927,840
|
)
|
–
|
(1,160,946
|
)
|
||||||||||||
|
Net income (loss)
|
$
|
8,699,805
|
$
|
(4,437,940
|
)
|
$
|
(6,907,400
|
)
|
$
|
–
|
$
|
(2,945,026
|
)
|
|||||||
|
Segment assets
|
$
|
57,433,489
|
$
|
59,566,605
|
$
|
492,922
|
$
|
–
|
$
|
117,493,016
|
||||||||||
|
Additions to long-lived assets
|
$
|
1,139,074
|
$
|
1,396,429
|
$
|
4,501
|
$
|
–
|
$
|
2,540,004
|
||||||||||
|
Training and
Simulation
Division
|
Power Systems
Division
|
Corporate
Expenses
|
Discontinued
operations
|
Total
Company
|
||||||||||||||||
|
2014
|
||||||||||||||||||||
|
Revenues from outside customers
|
$
|
56,404,498
|
$
|
47,157,851
|
$
|
–
|
$
|
–
|
$
|
103,562,349
|
||||||||||
|
Depreciation and amortization expenses (1)
|
(756,939
|
)
|
(3,477,855
|
)
|
(20,452
|
)
|
–
|
(4,255,246
|
)
|
|||||||||||
|
Direct expenses (2)
|
(45,313,956
|
)
|
(41,100,742
|
)
|
(6,874,118
|
)
|
–
|
(93,288,816
|
)
|
|||||||||||
|
Segment net income (loss)
|
10,333,603
|
2,579,254
|
(6,894,570
|
)
|
–
|
6,018,287
|
||||||||||||||
|
Financial expense
|
(50,975
|
)
|
(203,902
|
)
|
(1,252,612
|
)
|
–
|
(1,507,489
|
)
|
|||||||||||
|
Income tax (expense) benefit
|
(133,692
|
)
|
61,777
|
(951,922
|
)
|
–
|
(1,023,837
|
)
|
||||||||||||
|
Net income (loss)
|
$
|
10,148,936
|
$
|
2,437,129
|
$
|
(9,099,104
|
)
|
$
|
–
|
$
|
3,486,961
|
|||||||||
|
Segment assets
|
$
|
58,090,953
|
$
|
65,781,686
|
$
|
866,708
|
$
|
–
|
$
|
124,739,347
|
||||||||||
|
Additions to long-lived assets (3)
|
$
|
1,533,371
|
$
|
29,159,805
|
$
|
13,344
|
$
|
–
|
$
|
30,706,520
|
||||||||||
*Includes intangible assets associated with the acquisition of UEC.
|
2013
|
Training and
Simulation
Division
|
Power Systems
Division
|
Corporate
Expenses
|
Discontinued
operations
|
Total
Company
|
|||||||||||||||
|
Revenues from outside customers
|
$
|
63,425,319
|
$
|
25,146,109
|
$
|
–
|
$
|
–
|
$
|
88,571,428
|
||||||||||
|
Depreciation and amortization expenses (1)
|
(988,893
|
)
|
(1,272,399
|
)
|
(26,259
|
)
|
–
|
(2,287,551
|
)
|
|||||||||||
|
Direct expenses (2)
|
(53,143,411
|
)
|
(23,681,907
|
)
|
(5,649,013
|
)
|
–
|
(82,474,331
|
)
|
|||||||||||
|
Segment net income (loss)
|
9,293,015
|
191,803
|
(5,675,272
|
)
|
–
|
3,809,546
|
||||||||||||||
|
Financial expense
|
(44,146
|
)
|
(14,315
|
)
|
(424,395
|
)
|
–
|
(482,856
|
)
|
|||||||||||
|
Income tax expense
|
(319,225
|
) |
(134,995
|
) |
(598,500
|
) |
–
|
(1,052,720
|
) | |||||||||||
|
Net income (loss) – continuing operations
|
8,929,644
|
42,493
|
(6,698,167
|
)
|
–
|
2,273,970
|
||||||||||||||
|
Net loss – discontinued operations
|
–
|
–
|
–
|
(121,619
|
)
|
(121,619
|
)
|
|||||||||||||
|
Net income (loss)
|
$
|
8,929,644
|
$
|
42,493
|
$
|
(6,698,167
|
)
|
$
|
(121,619
|
)
|
$
|
2,152,351
|
||||||||
|
Segment assets
|
$
|
53,424,900
|
$
|
26,346,840
|
$
|
882,902
|
$
|
–
|
$
|
80,654,642
|
||||||||||
|
Additions to long-lived assets
|
$
|
409,805
|
$
|
1,294,980
|
$
|
–
|
$
|
–
|
$
|
1,704,785
|
||||||||||
(1) Includes depreciation of property and equipment and amortization expenses of intangible assets.
(2) Including, inter alia, sales and marketing, general and administrative, research and development and other income.
(3) Includes intangible assets associated with the acquisition of UEC.
AROTECH CORPORATION AND SUBSIDIARIES
NOTES TO CONSOLIDATED FINANCIAL STATEMENTS
NOTE 16:– SEGMENT INFORMATION (Cont.)
c. Summary information about geographic areas:
The following discloses total revenues according to the locations of the Company’s end customers and long-lived assets as of and for the years ended December 31, 2015, 2014, and 2013:
|
2015
|
2014
|
2013
|
||||||||||||||||||||||
|
Total
revenues
|
Long-lived
Assets
|
Total
revenues
|
Long-lived
Assets
|
Total
revenues
|
Long-lived
assets
|
|||||||||||||||||||
|
U.S.A.
|
$ | 77,715,872 | $ | 52,938,660 | $ | 83,739,406 | $ | 55,970,370 | $ | 73,973,996 | $ | 28,506,630 | ||||||||||||
|
Israel
|
14,114,688 | 8,299,367 | 11,428,427 | 7,755,163 | 9,109,921 | 8,504,224 | ||||||||||||||||||
|
Germany
|
1,076,872 | – | 1,117,094 | – | 372,446 | – | ||||||||||||||||||
|
Korea
|
875,593 | – | 1,994,634 | – | 51,920 | – | ||||||||||||||||||
|
Canada
|
587,516 | – | 651,846 | – | 790,363 | – | ||||||||||||||||||
|
Saudi Arabia
|
548,837 | – | 2,469,988 | – | 424,444 | – | ||||||||||||||||||
|
Thailand
|
329,975 | – | – | – | – | – | ||||||||||||||||||
|
Guatemala
|
201,796 | – | – | – | – | – | ||||||||||||||||||
|
China
|
154,803 | – | 305,800 | – | 203,563 | – | ||||||||||||||||||
|
Australia
|
109,041 | – | 459,153 | – | – | – | ||||||||||||||||||
|
U.A.E.
|
– | – | 518,634 | – | – | – | ||||||||||||||||||
|
Hong Kong
|
– | – | 48,331 | – | 1,460,000 | – | ||||||||||||||||||
|
India
|
– | – | 14,865 | – | 325,782 | – | ||||||||||||||||||
|
Mexico
|
– | – | 2,300 | – | 94,595 | – | ||||||||||||||||||
|
Greece
|
– | – | – | – | 249,500 | – | ||||||||||||||||||
|
Taiwan
|
– | – | – | – | 231,267 | – | ||||||||||||||||||
|
Slovenia
|
– | – | – | – | 191,163 | – | ||||||||||||||||||
|
Other
|
858,954 | – | 811,871 | – | 1,092,468 | – | ||||||||||||||||||
| $ | 96,573,947 | $ | 61,238,027 | $ | 103,562,349 | $ | 63,725,533 | $ | 88,571,428 | $ | 37,010,854 | |||||||||||||
d. Revenues from major customers (as a percentage of consolidated revenues):
Other than for sales to various branches of the United States Military, which accounted for 48%, 56% and 55% of consolidated continuing revenues for 2015, 2014 and 2013, respectively, no single customer accounted for more than 10% of revenues for either year.
e. Revenues from major products:
|
Year ended December 31,
|
||||||||||||
|
2015
|
2014
|
2013
|
||||||||||
|
Simulators
|
$ | 54,617,611 | $ | 56,404,498 | $ | 63,425,319 | ||||||
|
Batteries and charging systems
|
37,331,372 | 42,930,497 | 21,073,942 | |||||||||
|
Water activated batteries
|
4,624,964 | 4,227,354 | 4,072,167 | |||||||||
|
Total
|
$ | 96,573,947 | $ | 103,562,349 | $ | 88,571,428 | ||||||
AROTECH CORPORATION AND SUBSIDIARIES
NOTES TO CONSOLIDATED FINANCIAL STATEMENTS
NOTE 17:– WARRANTY
The following is a summary of the deferred warranty revenue in the Simulation Division included in total deferred revenue as of December 31, 2015 and 2014:
|
Year ended December 31,
|
||||||||
|
2015
|
2014
|
|||||||
|
Balance at beginning of period
|
$
|
4,300,602
|
$
|
3,206,369
|
||||
|
Deferred revenue
|
4,323,821
|
5,006,658
|
||||||
|
Revenue recognized
|
(5,265,557
|
)
|
(3,912,425
|
)
|
||||
|
Balance at end of period
|
$
|
3,358,866
|
$
|
4,300,602
|
||||
The following is a summary of the warranty liability in the Power Systems Division that is also included in deferred revenue as of December 31, 2015 and 2014:
|
Year ended December 31,
|
||||||||
|
2015
|
2014
|
|||||||
|
Balance at beginning of period
|
$
|
386,202
|
$
|
–
|
||||
|
Reserves acquired in UEC acquisition
|
–
|
698,943
|
||||||
|
New reserves
|
187,969
|
44,670
|
||||||
|
Costs incurred
|
(193,267
|
)
|
(297,411
|
)
|
||||
|
Balance at end of period
|
$
|
380,904
|
$
|
386,202
|
||||
NOTE 18:– ACQUISITION OF UEC ELECTRONICS, LLC
In April 2014, the Company entered into a stock purchase agreement pursuant to the terms of which the Company purchased all of the outstanding membership interests of UEC from the seller of UEC, a company owned by UEC’s two top managers (the “Acquisition”). UEC develops and manufactures electronic components and subsystems primarily for military, aerospace and industrial customers. The Company’s management considered the purchase of UEC to be an accretive addition to the Power Systems Division.
The Acquisition was accounted for under the acquisition method accounting. Accordingly, all assets and liabilities acquired, along with the potential $5.5 million earn out (with an estimated fair value of $4.5 million at the acquisition date) were recorded at their estimated fair market values as of the date of acquisition. The liability for the earn out was recorded in other accounts payable and accrued expenses ($2.2 million) and other long-term liabilities ($2.3 million) and then was adjusted in the fourth quarter of 2014 to $2.5 million in accrued expenses and zero in long term liabilities since the 2014 earn-out was paid in April 2015 and the 2015 earn-out was no longer expected to be achieved. The fair value measurements were based on significant inputs that were not observable in the market which are Level 3 inputs in the fair value hierarchy. The results of UEC’s operations have been included in the consolidated financial statements commencing on the date of acquisition. The total consideration of $36.7 million for the membership interests purchased consisted of (i) cash in the amount of $29,206,245, (ii) 775,000 shares of the Company’s common stock, valued at $4,216,000, and (iii) contingent consideration with an estimated fair value of $4.5 million.
AROTECH CORPORATION AND SUBSIDIARIES
NOTES TO CONSOLIDATED FINANCIAL STATEMENTS
NOTE 18:– ACQUISITION OF UEC ELECTRONICS, LLC (Cont.)
Based upon a valuation of tangible and intangible assets acquired, the Company has allocated the cost of the Acquisition to UEC’s net assets as follows:
|
Tangible assets acquired:
|
||||
|
Cash
|
$
|
92,590
|
||
|
Accounts receivable and unbilled revenues
|
12,513,805
|
|||
|
Other current assets
|
854,776
|
|||
|
Property and equipment, net
|
1,010,321
|
|||
|
Intangible assets:
|
||||
|
Customer list
|
7,400,000
|
|||
|
Contracts in place (backlog)
|
2,100,000
|
|||
|
Technology
|
3,200,000
|
|||
|
Covenant not to compete
|
400,000
|
|||
|
Goodwill (intangibles that did not qualify for separate recognition)
|
15,105,680
|
|||
|
Total asset value
|
42,677,172
|
|||
|
Less: liabilities assumed
|
(4,754,927
|
)
|
||
|
Net fair value of assets acquired
|
$
|
37,922,245
|
These fair value measurements were based on third-party valuations.
Intangible assets in the amount of $13.1 million have a weighted-average useful life of approximately five years. Goodwill arising from acquisitions is not be amortized. In lieu of amortization, the Company is required to perform an annual impairment test. If the Company determines, through the impairment review process, that goodwill has been impaired, it will record the impairment charge in its statement of comprehensive income. The Company will also assess the impairment of goodwill whenever events or changes in circumstances indicate that the carrying value may not be recoverable. This goodwill is deductible for tax purposes.
The revenue and net income of UEC from the date of acquisition through December 31, 2014 was $27,193,926 and $2,544,315, respectively.
AROTECH CORPORATION AND SUBSIDIARIES
NOTES TO CONSOLIDATED FINANCIAL STATEMENTS
NOTE 18:– ACQUISITION OF UEC ELECTRONICS, LLC (Cont.)
Pro forma financial information
In April 2014, the Company acquired UEC, as more fully described above (the “Acquisition”). The following summary pro forma information includes the effects of the Acquisition on the operating results of the Company. The pro forma data for the years ended December 31, 2014 and 2013 are presented as if the Acquisition had been completed on January 1, 2013. This pro forma financial information does not purport to be indicative of the results of operations that would have occurred had the Acquisition taken place on January 1, 2013, nor do they purport to be indicative of the results of operations that will be obtained in the future.
|
Year Ended December 31,
|
||||||||
|
2014
|
2013
|
|||||||
|
Revenues
|
$ | 116,113,345 | $ | 120,854,708 | ||||
|
Income – continuing operations before income tax
|
$ | 8,050,164 | $ | 2,562,522 | ||||
|
Net income
|
$ | 7,026,327 | $ | 1,388,183 | ||||
|
Basic net income per share
|
$ | 0.32 | $ | 0.08 | ||||
|
Diluted net income per share
|
$ | 0.31 | $ | 0.08 | ||||
|
Weighted average number of shares used in computing basic net income per share
|
22,127,751 | 17,282,848 | ||||||
|
Weighted average number of shares used in computing diluted net income per share
|
22,730,491 | 17,885,588 | ||||||
Pro forma results presented above reflect: (1) amortization relating to fair value estimates of intangible assets; (2) elimination of UEC expenses that were not part of the transaction; and (3) incremental interest expense on new long term debt incurred in connection with the transaction as though the transaction occurred as of January 1, 2013.
Additionally, acquisition related expenses of approximately $813,000 recognized as general and administrative expenses in the year ended December 31, 2014 are reflected in the pro forma results above as though they were recognized during the year ended December 31, 2013 and have been removed from the pro forma results for the year ended December 31, 2014.
NOTE 19:– QUARTERLY RESULTS OF OPERATIONS (UNAUDITED):
|
(in thousands, except per share data)
|
|
First
Quarter
|
|
Second
Quarter
|
|
Third
Quarter
|
|
Fourth
Quarter
|
||||||||
|
Fiscal year ended December 31, 2015:
|
|
|
|
|
||||||||||||
|
Revenues
|
|
$
|
24,227
|
|
|
$
|
21,644
|
|
|
$
|
23,289
|
|
|
$
|
27,414
|
|
|
Gross profit
|
|
6,897
|
|
|
6,223
|
|
|
7,035
|
|
|
7,963
|
|
||||
|
Net (loss) income
|
|
(483
|
)
|
|
(2,243
|
)
|
|
(618
|
)
|
|
399
|
|
||||
|
Basic net income/(loss) per common share
|
|
$
|
(0.02
|
)
|
|
$
|
(0.10
|
)
|
|
$
|
(0.03
|
)
|
|
$
|
0.02
|
|
|
Diluted net income/(loss) per common share
|
|
$
|
(0.02
|
)
|
|
$
|
(0.10
|
)
|
|
$
|
(0.03
|
)
|
|
$
|
0.02
|
|
|
Fiscal year ended December 31, 2014:
|
|
|
|
|
||||||||||||
|
Revenues
|
|
$
|
22,383
|
|
|
$
|
27,829
|
|
|
$
|
24,783
|
|
|
$
|
28,567
|
|
|
Gross profit
|
|
7,339
|
|
|
9,966
|
|
|
8,008
|
|
|
7,394
|
|
||||
|
Net (loss) income
|
|
1,014
|
|
1,783
|
|
|
379
|
|
312
|
|||||||
|
Basic net income/(loss) per common share
|
|
$
|
0.05
|
|
$
|
0.09
|
$
|
0.02
|
|
$
|
0.01
|
|||||
|
|
|
|
||||||||||||||
|
Diluted net income/(loss) per common share
|
|
$
|
0.05
|
|
$
|
0.09
|
|
|
$
|
0.02
|
|
$
|
0.01
|
AROTECH CORPORATION AND SUBSIDIARIES
NOTES TO CONSOLIDATED FINANCIAL STATEMENTS
NOTE 20:– SUBSEQUENT EVENTS
a. Credit Facilities Agreement
On March 11, 2016, the Company entered into a Credit Facilities agreement (the “Chase Agreement”) with JPMorgan Chase Bank, N.A. (“Chase”), whereby Chase agreed to provide (i) a $15,000,000 revolving credit facility (“Revolver”), (ii) a $10,000,000 Term Loan (the “Term Loan”), and (iii) a $1,000,000 Mortgage Loan (the “Mortgage Loan” and, together with the Revolver and the Term Loan, the “Credit Facilities”) in respect of certain property located in Ann Arbor, Michigan. The Credit Facilities replaced the revolving credit agreement with Fifth Third Bank described in Note 8 and Note 11.
The maturity of the Revolver is five years from the date of the Chase Agreement. The Revolver maintains an interest rate on a scale ranging from LIBOR plus 1.75% up to LIBOR plus 3.00%.
The maturity of the Term Loan is five years from the date of the Chase Agreement. The Term Loan maintains an interest rate on a scale ranging from LIBOR plus 2.0% up to LIBOR plus 3.25%. The repayment of the Term Loan will consist of 60 consecutive monthly payments of principal plus accrued interest based on annual principal reductions of 10% during the first year, 20% during the second through fourth years, and 30% during the fifth year. The Revolver and Term Loan are secured by the assets of the Company.
The maturity of the Mortgage Loan is five years from the date of the Chase Agreement and maintains an interest rate on a scale identical to the Term Loan. The monthly payments on the Mortgage Loan are $5,555 in principal plus accrued interest, with a balloon payment due at the end of month 60.
The Credit Facilities maintain certain reporting requirements, conditions precedent, affirmative covenants and financial covenants. The financial covenants include that the Company must maintain both a Maximum Debt to EBITDA ratio of 3.00 to 1.00 and a Minimum Fixed Charge Coverage Ratio of 1.20 to 1.00.
The interest rate swap that the Company was required to maintain with Fifth Third was settled in connection with the termination of the Fifth Third Bank agreement.
The Credit Facilities are secured by the Company’s assets and the assets of the Company’s domestic subsidiaries.
b. Share Issuance
On February 2, 2016, the Company and an investor (the “Investor”) entered into a Stock Purchase Agreement (the “Investor Agreement”) providing for the sale to the Investor of a total of 1,500,000 shares of the Company’s common stock at a price valued at $1.99 per share. As amended on February 23, 2016, the Investor Agreement grants to the Investor the right to designate one person for election to the Board (the “Investor Designee”) for so long as the Investor and its affiliates continues to beneficially own at least 5% of the shares of Common Stock outstanding. A separate Voting Agreement provides that two members of the Company’s management must vote their shares of Common Stock in favor of the Investor Designee if he or she is nominated by the Nominating Committee of the Board of Directors of the Company for election to the Board. In addition, the Company granted the Investor and its affiliates the right to participate in future financings for so long as the Investor and its affiliates continue to beneficially own at least 750,000 shares of Common Stock.
The Investor Designee was appointed to the Board of the Company on February 24, 2016. In connection with the Investor Agreement, the Company and the Investor Designee entered into a consulting agreement (the “Consulting Agreement”) pursuant to which the Investor Designee agreed to provide consulting services to the Company for a period of three years, unless terminated earlier. Pursuant to the terms of the Consulting Agreement, the Investor Designee will receive an annual fee for the three-year term of the Consulting Agreement equal to the difference between $125,000 and the amount of cash and the value of any stock received by the Investor Designee for serving on the Board.
F-37