Attached files
| file | filename |
|---|---|
| 8-K - 8-K - LAYNE CHRISTENSEN CO | d162330d8k.htm |
March 2016 LAYNE CHRISTENSEN 28th Annual ROTH Conference Exhibit 99.1
Safe Harbor This presentation may contain forward-looking statements within the meaning of the Private Securities Litigation Reform Act of 1995. Such statements may include, but are not limited to, statements of plans and objectives, statements of future economic performance and statements of assumptions underlying such statements, and statements of management's intentions, hopes, beliefs, expectations or predictions of the future. Forward-looking statements can often be identified by the use of forward-looking terminology, such as "should," "intend," "continue," "believe," "may," "hope," "anticipate," "goal," "forecast," "plan," "estimate" and similar words or phrases. Such statements are based on current expectations and are subject to certain risks, uncertainties and assumptions, including but not limited to: estimates and assumptions regarding our strategic direction and business strategy, our ability to implement our restructuring plan for our Africa operations, the extent and timing of a recovery in the mining industry, prevailing prices for various commodities, longer term weather patterns, unanticipated slowdowns in our major markets, the seasonality of our business, the availability of credit, the risks and uncertainties normally incident to our construction industries, the impact of competition, the effectiveness of operational changes expected to reduce operating expenses and increase efficiency, productivity and profitability, the availability of equity or debt capital needed for our business, worldwide economic and political conditions and foreign currency fluctuations that may affect our results of operations. Should one or more of these risks or uncertainties materialize, or should underlying assumptions prove incorrect, actual results may vary materially and adversely from those anticipated, estimated or projected. These forward-looking statements are made as of the date of this presentation, and we assume no obligation to update such forward-looking statements or to update the reasons why actual results could differ materially from those anticipated in such forward-looking statements.
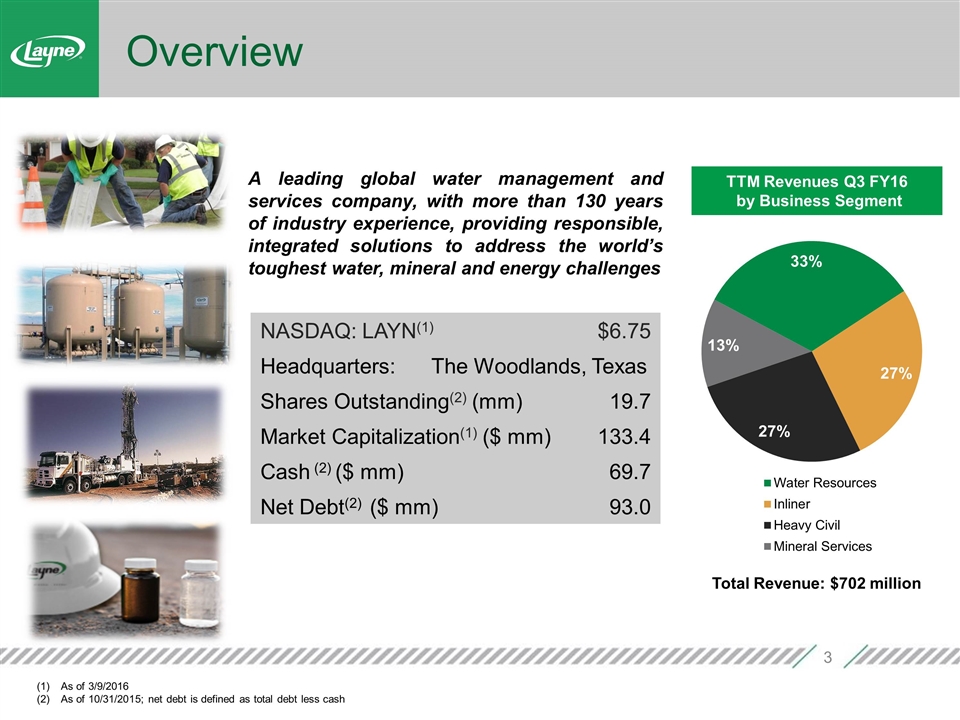
Overview A leading global water management and services company, with more than 130 years of industry experience, providing responsible, integrated solutions to address the world’s toughest water, mineral and energy challenges TTM Revenues Q3 FY16 by Business Segment Total Revenue: $702 million As of 3/9/2016 As of 10/31/2015; net debt is defined as total debt less cash NASDAQ: LAYN(1) $6.75 Headquarters: The Woodlands, Texas Shares Outstanding(2) (mm) 19.7 Market Capitalization(1) ($ mm) 133.4 Cash (2) ($ mm) 69.7 Net Debt(2) ($ mm) 93.0
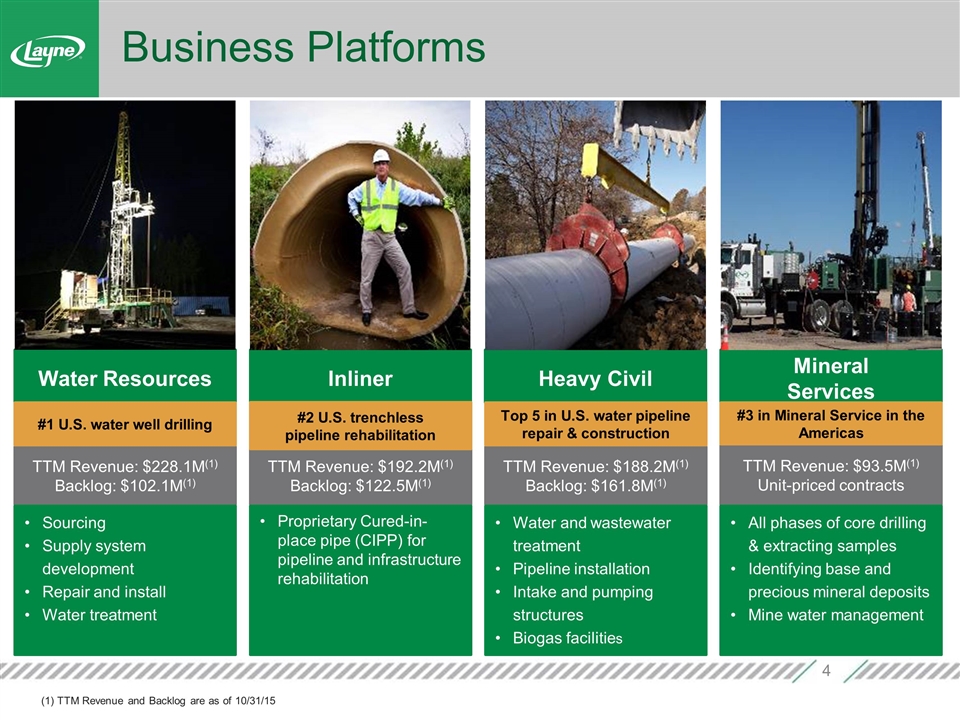
Business Platforms Water Resources Inliner Heavy Civil Mineral Services TTM Revenue: $228.1M(1) Backlog: $102.1M(1) TTM Revenue: $192.2M(1) Backlog: $122.5M(1) TTM Revenue: $188.2M(1) Backlog: $161.8M(1) TTM Revenue: $93.5M(1) Unit-priced contracts Sourcing Supply system development Repair and install Water treatment Proprietary Cured-in-place pipe (CIPP) for pipeline and infrastructure rehabilitation Water and wastewater treatment Pipeline installation Intake and pumping structures Biogas facilities All phases of core drilling & extracting samples Identifying base and precious mineral deposits Mine water management #1 U.S. water well drilling Top 5 in U.S. water pipeline repair & construction #2 U.S. trenchless pipeline rehabilitation #3 in Mineral Service in the Americas (1) TTM Revenue and Backlog are as of 10/31/15
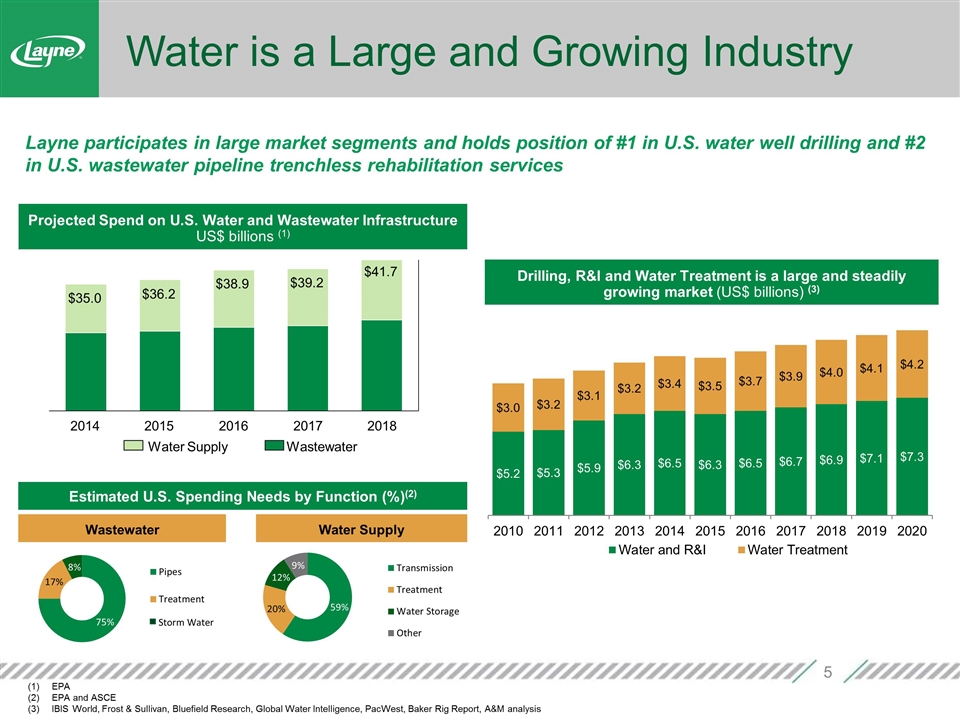
Water is a Large and Growing Industry Layne participates in large market segments and holds position of #1 in U.S. water well drilling and #2 in U.S. wastewater pipeline trenchless rehabilitation services Projected Spend on U.S. Water and Wastewater Infrastructure US$ billions (1) EPA EPA and ASCE IBIS World, Frost & Sullivan, Bluefield Research, Global Water Intelligence, PacWest, Baker Rig Report, A&M analysis Estimated U.S. Spending Needs by Function (%)(2) Wastewater Water Supply $ $ $ $ $ Wastewater Storm Water Drilling, R&I and Water Treatment is a large and steadily growing market (US$ billions) (3)
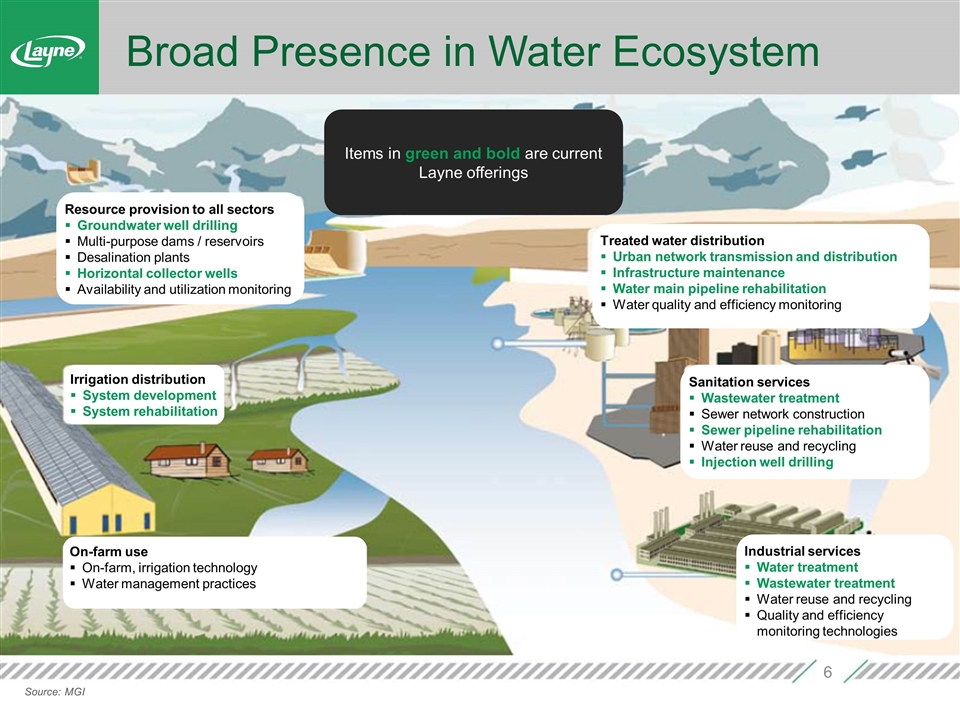
Broad Presence in Water Ecosystem Source: MGI Resource provision to all sectors Groundwater well drilling Multi-purpose dams / reservoirs Desalination plants Horizontal collector wells Availability and utilization monitoring Irrigation distribution System development System rehabilitation On-farm use On-farm, irrigation technology Water management practices Treated water distribution Urban network transmission and distribution Infrastructure maintenance Water main pipeline rehabilitation Water quality and efficiency monitoring Sanitation services Wastewater treatment Sewer network construction Sewer pipeline rehabilitation Water reuse and recycling Injection well drilling Industrial services Water treatment Wastewater treatment Water reuse and recycling Quality and efficiency monitoring technologies Items in green and bold are current Layne offerings
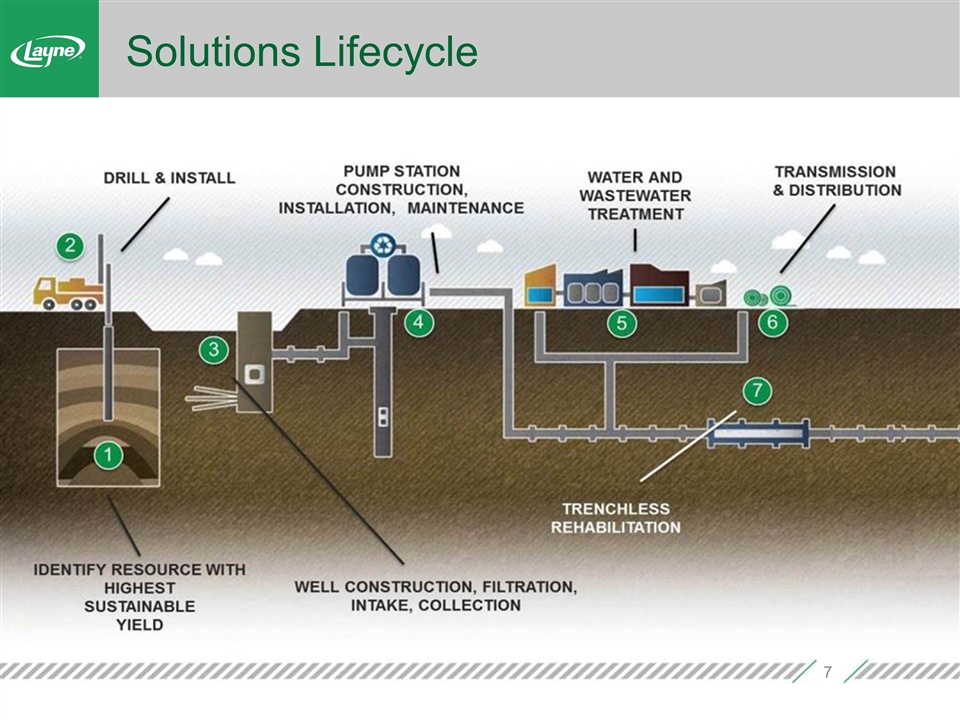
Solutions Lifecycle
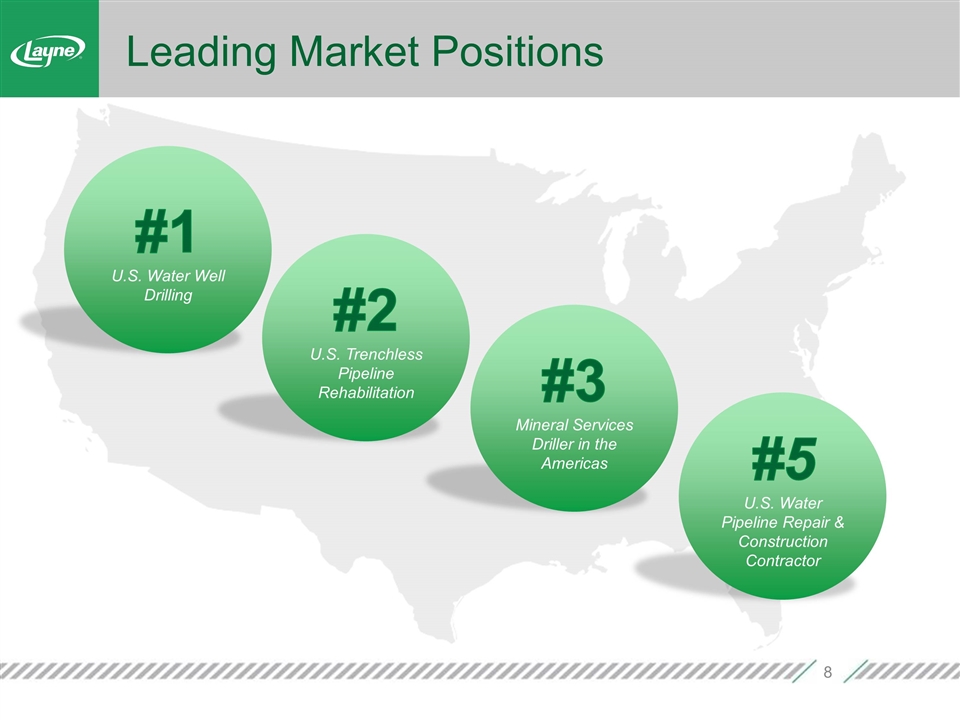
Leading Market Positions #5 U.S. Water Pipeline Repair & Construction Contractor #3 Mineral Services Driller in the Americas #2 U.S. Trenchless Pipeline Rehabilitation #1 U.S. Water Well Drilling
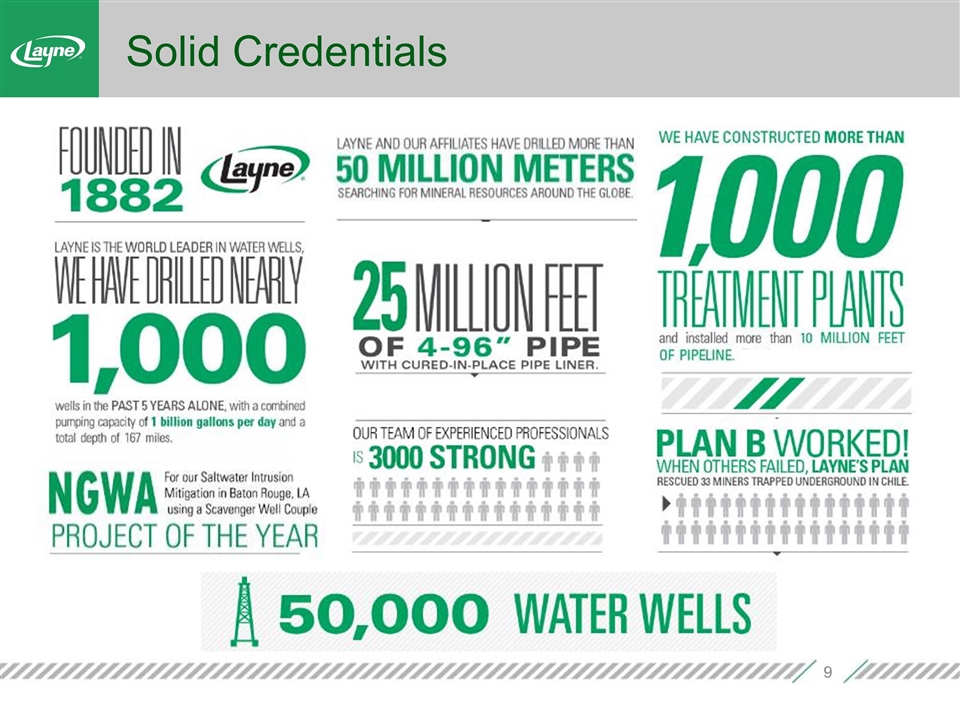
Solid Credentials
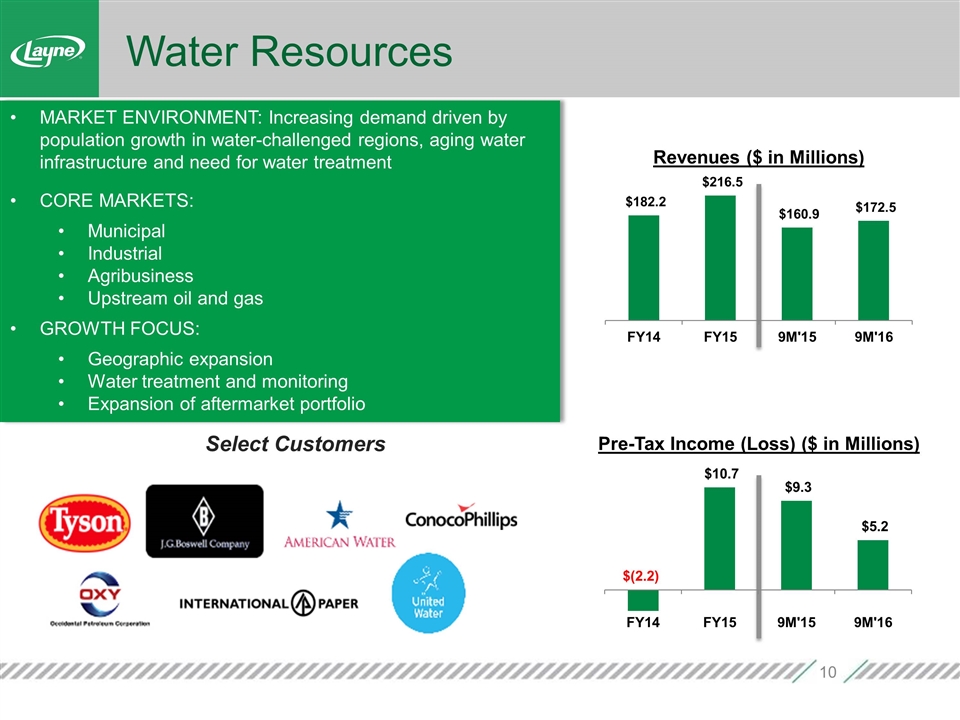
Select Customers Water Resources Pre-Tax Income (Loss) ($ in Millions) MARKET ENVIRONMENT: Increasing demand driven by population growth in water-challenged regions, aging water infrastructure and need for water treatment CORE MARKETS: Municipal Industrial Agribusiness Upstream oil and gas GROWTH FOCUS: Geographic expansion Water treatment and monitoring Expansion of aftermarket portfolio Revenues ($ in Millions)
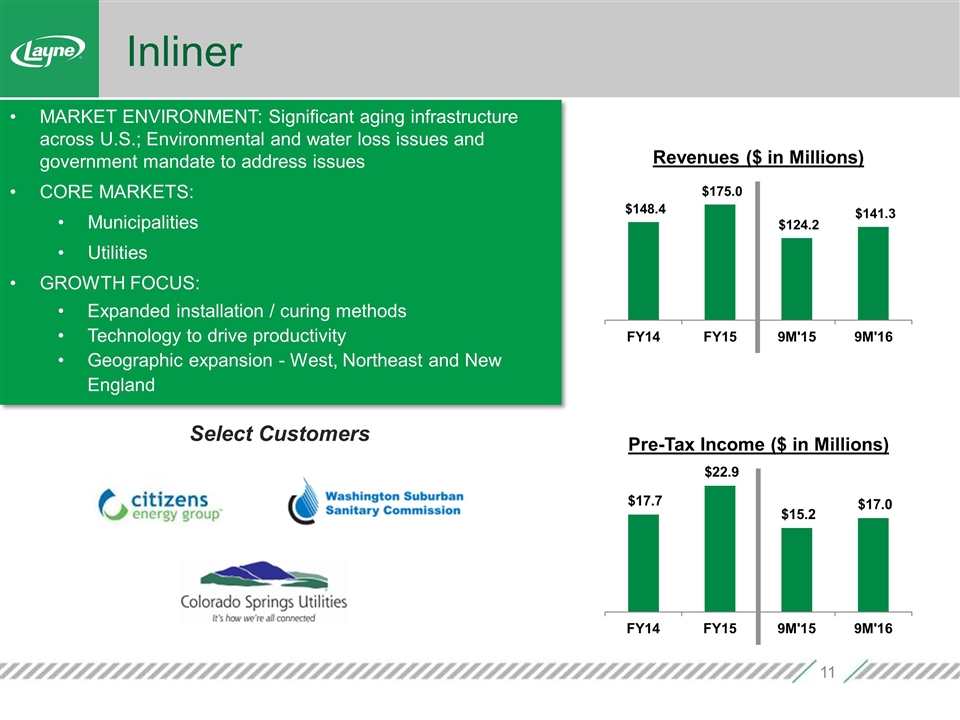
Inliner MARKET ENVIRONMENT: Significant aging infrastructure across U.S.; Environmental and water loss issues and government mandate to address issues CORE MARKETS: Municipalities Utilities GROWTH FOCUS: Expanded installation / curing methods Technology to drive productivity Geographic expansion - West, Northeast and New England Pre-Tax Income ($ in Millions) Select Customers Revenues ($ in Millions)
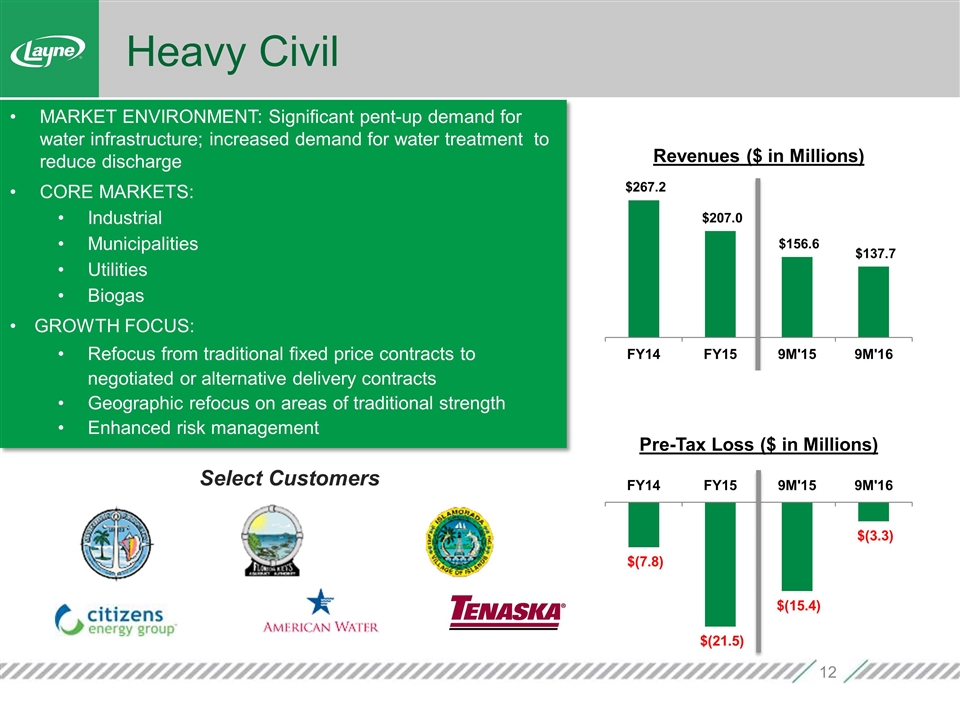
Heavy Civil MARKET ENVIRONMENT: Significant pent-up demand for water infrastructure; increased demand for water treatment to reduce discharge CORE MARKETS: Industrial Municipalities Utilities Biogas GROWTH FOCUS: Refocus from traditional fixed price contracts to negotiated or alternative delivery contracts Geographic refocus on areas of traditional strength Enhanced risk management Pre-Tax Loss ($ in Millions) Select Customers Revenues ($ in Millions)
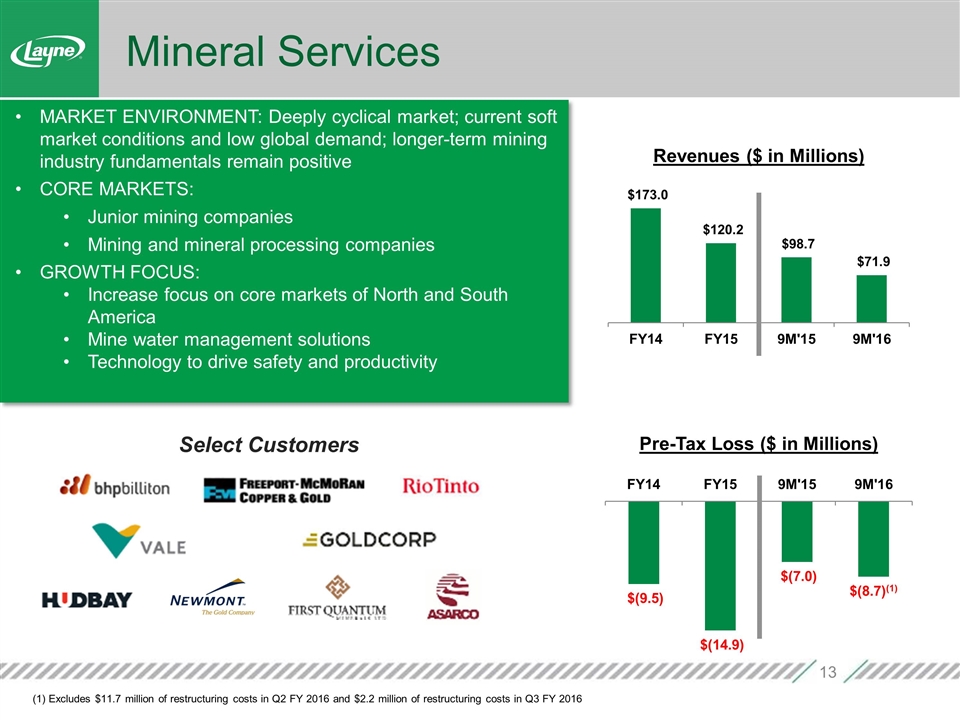
Mineral Services MARKET ENVIRONMENT: Deeply cyclical market; current soft market conditions and low global demand; longer-term mining industry fundamentals remain positive CORE MARKETS: Junior mining companies Mining and mineral processing companies GROWTH FOCUS: Increase focus on core markets of North and South America Mine water management solutions Technology to drive safety and productivity Pre-Tax Loss ($ in Millions) Select Customers (1) Excludes $11.7 million of restructuring costs in Q2 FY 2016 and $2.2 million of restructuring costs in Q3 FY 2016 Revenues ($ in Millions)
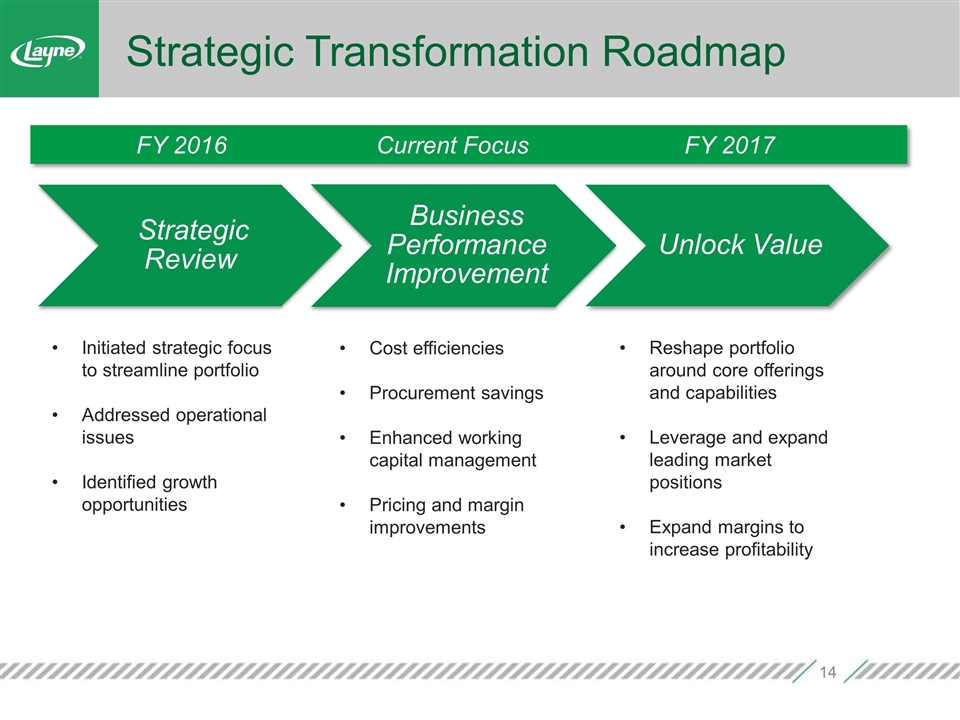
Strategic Transformation Roadmap FY 2016Current Focus FY 2017 Initiated strategic focus to streamline portfolio Addressed operational issues Identified growth opportunities Reshape portfolio around core offerings and capabilities Leverage and expand leading market positions Expand margins to increase profitability Cost efficiencies Procurement savings Enhanced working capital management Pricing and margin improvements Strategic Review Business Performance Improvement Unlock Value
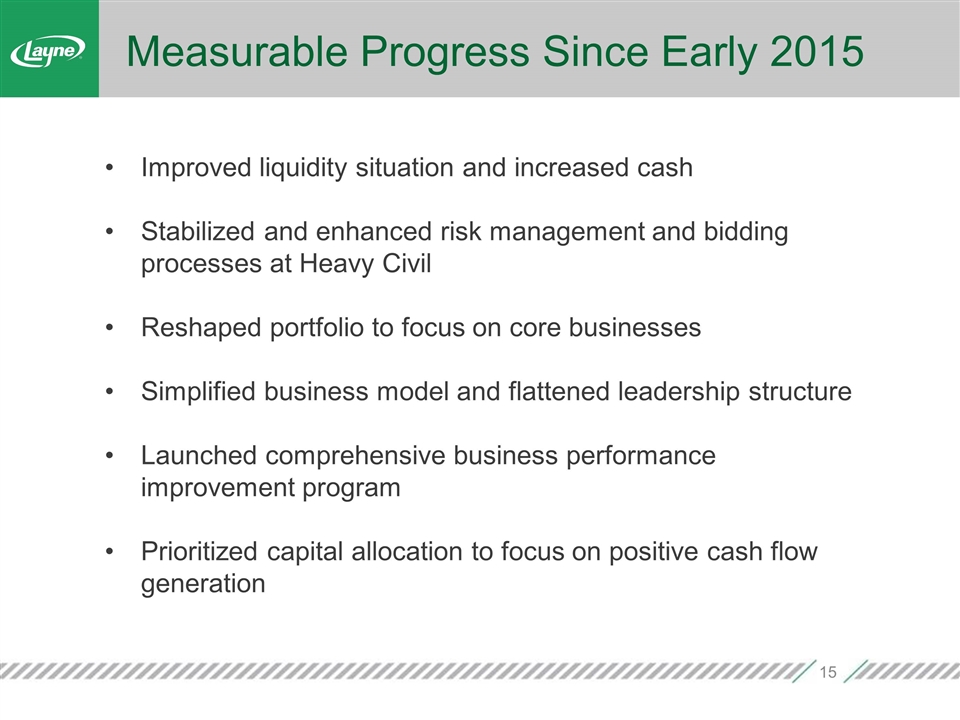
Measurable Progress Since Early 2015 Improved liquidity situation and increased cash Stabilized and enhanced risk management and bidding processes at Heavy Civil Reshaped portfolio to focus on core businesses Simplified business model and flattened leadership structure Launched comprehensive business performance improvement program Prioritized capital allocation to focus on positive cash flow generation
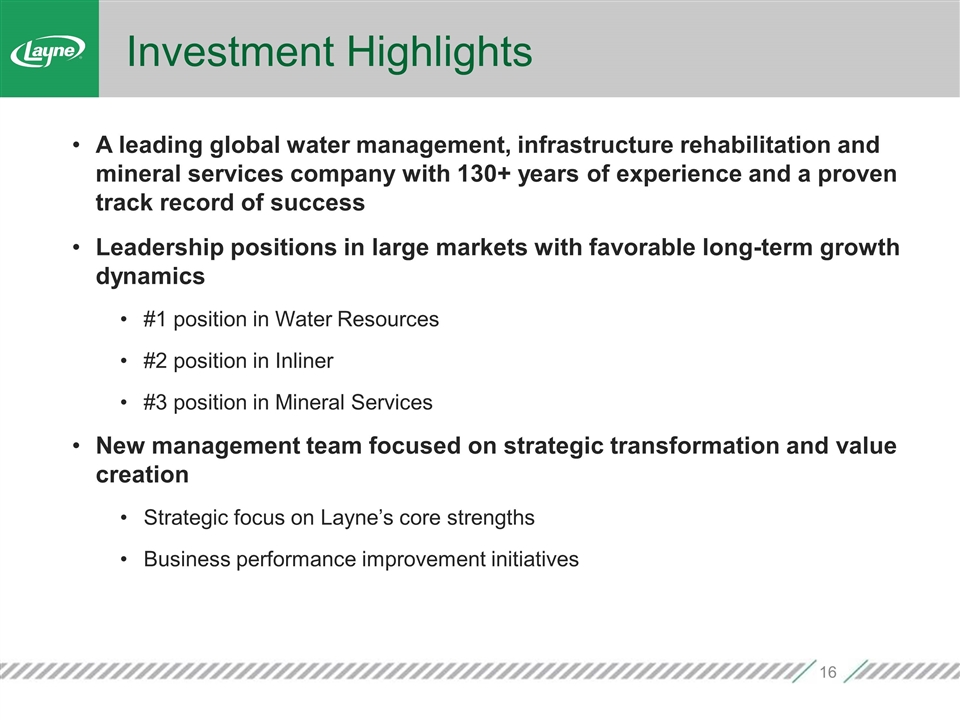
Investment Highlights A leading global water management, infrastructure rehabilitation and mineral services company with 130+ years of experience and a proven track record of success Leadership positions in large markets with favorable long-term growth dynamics #1 position in Water Resources #2 position in Inliner #3 position in Mineral Services New management team focused on strategic transformation and value creation Strategic focus on Layne’s core strengths Business performance improvement initiatives

Layne Investor Day NEW YORK CITY April 14, 2016 Lotte New York Palace Hotel To register Email layn@dennardlascar.com Or call 713-529-6600
Appendix
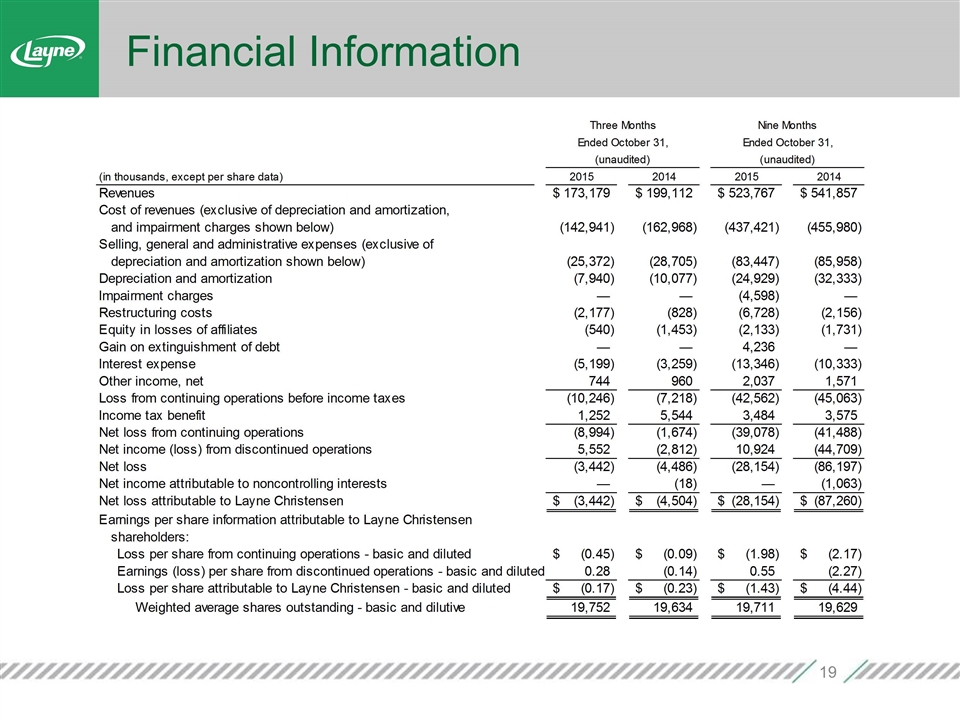
Financial Information
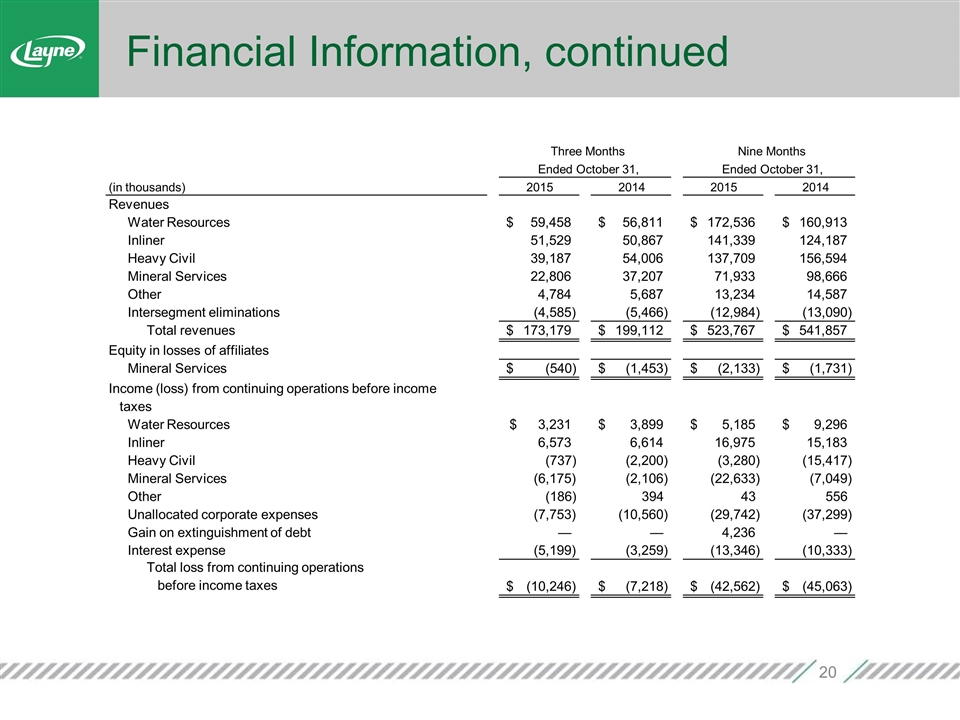
Financial Information, continued (in thousands) 2015 2014 2015 2014 Revenues Water Resources 59,458 $ 56,811 $ 172,536 $ 160,913 $ Inliner 51,529 50,867 141,339 124,187 Heavy Civil 39,187 54,006 137,709 156,594 Mineral Services 22,806 37,207 71,933 98,666 Other 4,784 5,687 13,234 14,587 Intersegment eliminations (4,585) (5,466) (12,984) (13,090) Total revenues 173,179 $ 199,112 $ 523,767 $ 541,857 $ Equity in losses of affiliates Mineral Services (540) $ (1,453) $ (2,133) $ (1,731) $ Income (loss) from continuing operations before income taxes Water Resources 3,231 $ 3,899 $ 5,185 $ 9,296 $ Inliner 6,573 6,614 16,975 15,183 Heavy Civil (737) (2,200) (3,280) (15,417) Mineral Services (6,175) (2,106) (22,633) (7,049) Other (186) 394 43 556 Unallocated corporate expenses (7,753) (10,560) (29,742) (37,299) Gain on extinguishment of debt — — 4,236 — Interest expense (5,199) (3,259) (13,346) (10,333) Total loss from continuing operations before income taxes (10,246) $ (7,218) $ (42,562) $ (45,063) $ Three Months Nine Months Ended October 31, Ended October 31,
Contacts Jack Lascar/Carol Coale 713-529-6600 layn@dennardlascar.com www.dennardlascar.com Michael J. Caliel, CEO 281-475-2691 Mike.Caliel@layne.com J. Michael Anderson, CFO 281-475-2694 Michael.Anderson@layne.com
