Attached files
| file | filename |
|---|---|
| EX-32.1 - EXHIBIT 32.1 - Dime Community Bancshares, Inc. /NY/ | t1600610_ex32-1.htm |
| EX-31.1 - EXHIBIT 31.1 - Dime Community Bancshares, Inc. /NY/ | t1600610_ex31-1.htm |
| EX-31.2 - EXHIBIT 31.2 - Dime Community Bancshares, Inc. /NY/ | t1600610_ex31-2.htm |
| EX-23 - EXHIBIT 23 - Dime Community Bancshares, Inc. /NY/ | t1600610_ex23.htm |
UNITED
STATES
SECURITIES AND EXCHANGE COMMISSION
Washington, D.C. 20549
FORM 10-K
| x | ANNUAL REPORT PURSUANT TO SECTION 13 OR 15(d) OF THE |
SECURITIES EXCHANGE ACT OF 1934
| For the fiscal year ended December 31, 2015 | Commission File No. 001-34096 |
BRIDGE
BANCORP, INC.
(Exact name of registrant as specified in its charter)
| NEW YORK | 11-2934195 | |||||
| (State or other jurisdiction of incorporation or organization) | (IRS Employer Identification Number) | |||||
| 2200 MONTAUK HIGHWAY, BRIDGEHAMPTON, NEW YORK | 11932 | |||
| (Address of principal executive offices) | (Zip Code) | |||
Registrant’s telephone number, including area code: (631) 537-1000
Securities registered pursuant to Section 12 (b) of the Act:
| Title of each class | Name of each exchange on which registered |
| Common Stock, Par Value of $0.01 Per Share | The Nasdaq Stock Market, LLC |
Securities registered pursuant to Section 12 (g) of the Act:
(Title of Class)
None
Indicate by check mark if the registrant
is a well-known seasoned issuer, as defined in Rule 405 of the Securities Act.
Yes ¨ No x
Indicate by check mark if the registrant
is not required to file reports pursuant to Section 13 or Section 15(d) of the Act.
Yes ¨ No x
Indicate by check mark whether the registrant (1) has filed all reports required to be filed by Section 13 or 15(d) of the Securities Exchange Act of 1934 during the preceding 12 months (or for such shorter period that the registrant was required to file such reports), and (2) has been subject to such filing requirements for the past 90 days. Yes x No ¨
Indicate by check mark whether the registrant has submitted electronically and posted on its corporate Web site, if any, every Interactive Data File required to be submitted and posted pursuant to Rule 405 of Regulation S-T (§232.405 of this chapter) during the preceding 12 months (or for such shorter period that the registrant was required to submit and post such files). Yes x No ¨
Indicate by check mark if disclosure of delinquent filers pursuant to Item 405 of Regulation S-K (§229.405) of this chapter is not contained herein, and will not be contained, to the best of registrant’s knowledge, in definitive proxy or information statements incorporated by reference in Part III of this Form 10-K or any amendment to this Form 10-K. x
Indicate by check mark whether the registrant is a large accelerated filer, an accelerated filer, a non-accelerated filer, or a smaller reporting company. See the definitions of “large accelerated filer,” “accelerated filer” and “smaller reporting company” in Rule 12b-2 of the Exchange Act. (Check one):
Large accelerated filer o Accelerated filer x Non-accelerated filer o Smaller reporting company o
Indicate by check mark whether the registrant is a shell company (as defined in Rule 12b-2 of the Act). Yes o No x
The approximate aggregate market value of the voting stock held by non-affiliates of the Registrant, based upon the closing price of the Common Stock on June 30, 2015, was $438,956,096.
The number of shares of the Registrant’s common stock outstanding on March 11, 2016 was 17,448,227.
Portions of the following documents are incorporated into the Parts of this Report on Form 10-K indicated below:
The Registrant’s definitive Proxy Statement for the 2016 Annual Meeting to be filed pursuant to Regulation 14A on or before April 29, 2016 (Part III).
Bridge Bancorp, Inc. (the “Registrant” or “Company”) is a registered bank holding company for The Bridgehampton National Bank (the “Bank”). The Bank was established in 1910 as a national banking association and is headquartered in Bridgehampton, New York. The Registrant was incorporated under the laws of the State of New York in 1988, at the direction of the Board of Directors of the Bank for the purpose of becoming a bank holding company pursuant to a plan of reorganization under which the former shareholders of the Bank became the shareholders of the Company. Since commencing business in March 1989, after the reorganization, the Registrant has functioned primarily as the holder of all of the Bank’s common stock. In May 1999, the Bank established a real estate investment trust subsidiary, Bridgehampton Community, Inc. (“BCI”), as an operating subsidiary. The assets transferred to BCI are viewed by the bank regulators as part of the Bank’s assets in consolidation. The operations of the Bank also include Bridge Abstract LLC (“Bridge Abstract”), a wholly owned subsidiary of the Bank, which is a broker of title insurance services and Bridge Financial Services LLC (“Bridge Financial Services’), an investment services subsidiary that was formed in March 2014; in October 2009, the Company formed Bridge Statutory Capital Trust II (the “Trust”) as a subsidiary, which sold $16.0 million of 8.5% cumulative convertible Trust Preferred Securities (the “Trust Preferred Securities”) in a private placement to accredited investors.
Federally chartered in 1910, the Bank was founded by local farmers and merchants and now operates forty branches, thirty-eight in the primary market areas of Suffolk and Nassau Counties, Long Island, with one branch in Bayside, Queens and one in Manhattan. For over a century, the Bank has maintained its focus on building customer relationships in its market area. The mission of the Company is to grow through the provision of exceptional service to its customers, its employees, and the community. The Company strives to achieve excellence in financial performance and build long term shareholder value. The Bank engages in full service commercial and consumer banking business, including accepting time, savings and demand deposits from the consumers, businesses and local municipalities surrounding its branch offices. These deposits, together with funds generated from operations and borrowings, are invested primarily in: (1) commercial real estate loans; (2) multi-family mortgage loans; (3) home equity loans; (4) construction loans; (5) residential mortgage loans; (6) secured and unsecured commercial and consumer loans; (7) FHLB, FNMA, GNMA and FHLMC and non-agency mortgage-backed securities, collateralized mortgage obligations and other asset backed securities; (8) New York State and local municipal obligations; and (9) U.S government sponsored entity (“U.S. GSE”) securities. The Bank also offers the CDARS program, providing multi-millions of FDIC insurance on CD deposits to its customers. In addition, the Bank offers merchant credit and debit card processing, automated teller machines, cash management services, lockbox processing, online banking services, remote deposit capture, safe deposit boxes, individual retirement accounts as well as investment services through Bridge Financial Services, which offers a full range of investment products and services through a third party broker dealer. Through its title insurance abstract subsidiary, the Bank acts as a broker for title insurance services. The Bank’s customer base is comprised principally of small businesses, municipal relationships and consumer relationships.
The Bank employs 433 people on a full-time and part-time basis. The Bank provides a variety of employment benefits and considers its relationship with its employees to be positive. In addition, the Company maintains equity incentive plans under which it may issue shares of common stock of the Company.
All phases of the Bank’s business are highly competitive. The Bank faces direct competition from a significant number of financial institutions operating in its market area, many with a statewide or regional presence, and in some cases, a national presence. There is also competition for banking business from competitors outside of its market areas. Most of these competitors are significantly larger than the Bank, and therefore have greater financial and marketing resources and lending limits than those of the Bank. The fixed cost of regulatory compliance remains high for community banks as compared to their larger competitors that are able to achieve economies of scale. The Bank considers its major competition to be local commercial banks as well as other commercial banks with branches in the Bank’s market area. Other competitors include savings banks, credit unions, mortgage brokers and financial services firms other than financial institutions such as investment and insurance companies. Increased competition within the Bank’s market areas may limit growth and profitability. Additionally, as the Bank’s market area expands westward, competitive pressure in new markets is expected to be strong. The title insurance abstract subsidiary also faces competition from other title insurance brokers as well as directly from the companies that underwrite title insurance. In New York State, title insurance is obtained on most transfers of real estate and mortgage transactions.
The Bank’s principal market area is located in Suffolk County, New York. Suffolk County is located on the eastern portion of Long Island and has a population of approximately 1.5 million. Eastern Long Island is semi-rural. Surrounded by water and including the Hamptons and North Fork, the region is a recreational destination for the New York metropolitan area, and a highly regarded resort locale world-wide. While the local economy flourishes in the summer months as a result of the influx of tourists and second homeowners, the year-round population has grown considerably in recent years, resulting in a reduction of the seasonal fluctuations in the economy. Industries represented in the marketplace include retail establishments; construction and trades; restaurants and bars; lodging and recreation; professional entities; real estate; health services; passenger transportation; and agricultural and related businesses. During the last decade, the Long Island wine industry has grown with an increasing number of new wineries and vineyards locating in the region each year. The vast majority of businesses are considered small businesses employing fewer than ten full-time
| Page -1- |
employees. In recent years, more national chains have opened retail stores within the villages on the north and south forks of the island. Major employers in the region include the municipalities, school districts, hospitals, and financial institutions.
The Company, the Bank and its subsidiaries, with the exception of the real estate investment trust which files its own federal and state income tax returns, report their income on a consolidated basis using the accrual method of accounting and are subject to federal and state income taxation. In general, banks are subject to federal income tax in the same manner as other corporations. However, gains and losses realized by banks from the sale of available for sale securities are generally treated as ordinary income, rather than capital gains or losses. The Bank is subject to the New York State Franchise Tax on Banking Corporations based on certain criteria. The taxation of net income is similar to federal taxable income subject to certain modifications.
DeNovo Branch Expansion
Since 2010, the Bank has opened ten new branches including seven over the last three years. The Bank opened two branches in 2012: one in Ronkonkoma, New York with proximity to MacArthur Airport complementing the Patchogue branch and extending the Bank’s reach into the Bohemia market and one branch and administrative offices in Hauppauge, New York. In 2013, the Bank opened two branches: one in Rocky Point, New York and one on Shelter Island, New York. In 2014, the Bank opened three branches: one in Bay Shore, New York in September, one in Port Jefferson, New York in November and one in Smithtown, New York in December. These branch openings demonstrate the Bank’s commitment to traditional growth through branch expansion and move the Bank geographically westward.
Mergers and Acquisitions
Hamptons State Bank
In May 2011, the Bank acquired Hamptons State Bank (“HSB”) which increased the Bank’s presence in an existing market with a branch located in the Village of Southampton. In July 2011, the Bank converted the former HSB customers to its core operating system. Management spent considerable time ensuring the transition progressed smoothly for HSB’s former customers and shareholders and demonstrated its ability to successfully integrate the former HSB customers and achieve expected cost savings while continuing to execute its business strategy.
FNBNY
On February 14, 2014, the Company acquired FNBNY Bancorp and its wholly owned subsidiary, the First National Bank of New York (collectively “FNBNY”) at a purchase price of $6.1 million and issued an aggregate of 240,598 Company shares in exchange for all the issued and outstanding stock of FNBNY. The purchase price was subject to certain post-closing adjustments equal to 60 percent of the net recoveries on $6.3 million of certain identified problem loans over a two-year period after the acquisition. As of February 14, 2016, a net recovery of $0.4 million was realized and $0.3 million has been distributed to the former FNBNY shareholders. At acquisition, FNBNY had total acquired assets on a fair value basis of $211.9 million, with loans of $89.7 million, investment securities of $103.2 million and deposits of $169.9 million. With three full-service branches, including the Company’s first two branches in Nassau County located in Merrick and Massapequa, and one in western Suffolk County located in Melville, the transaction expanded our geographic footprint into Nassau County, complemented our existing branch network and enhanced our asset generation capabilities. The expanded branch network allows us to serve a greater portion of the Long Island and metropolitan marketplace.
Community National Bank (“CNB”)
On June 19, 2015, the Company acquired Community National Bank (“CNB”) at a purchase price of $157.5 million, issued an aggregate of 5.647 million Bridge Bancorp common shares in exchange for all the issued and outstanding common stock of CNB and recorded goodwill of $89.0 million, which is not deductible for tax purposes. At acquisition, CNB had total acquired assets on a fair value basis of $899.9 million, with loans of $734.0 million, investment securities of $90.1 million and deposits of $786.9 million. The transaction expanded the Company’s geographic footprint across Long Island including Nassau County, Queens and into New York City. It complements the Bank’s existing branch network and enhances asset generation capabilities. The expanded branch network allows the Bank to serve a greater portion of the Long Island and metropolitan marketplace through a network of 40 branches. Management will continue to seek opportunities to expand its reach into other contiguous markets by network expansion, or through the addition of professionals with established customer relationships.
The Bank routinely adds to its menu of products and services, continually meeting the needs of consumers and businesses. We believe positive outcomes in the future will result from the expansion of our geographic footprint, investments in infrastructure and technology and continued focus on placing our customers first.
| Page -2- |
REGULATION AND SUPERVISION
The Bridgehampton National Bank
The Bank is a national bank organized under the laws of the United States of America. The lending, investment, and other business operations of the Bank are governed by federal law and regulations and the Bank is prohibited from engaging in any operations not specifically authorized by such laws and regulations. The Bank is subject to extensive regulation by the Office of the Comptroller of the Currency (“OCC”) and to a lesser extent by the Federal Deposit Insurance Corporation (“FDIC”), as its deposit insurer as well as by the Board of Governors of the Federal Reserve System. The Bank’s deposit accounts are insured up to applicable limits by the FDIC under its Deposit Insurance Fund (“DIF”). A summary of the primary laws and regulations that govern the operations of the Bank are set forth below.
The 2010 Dodd-Frank Wall Street Reform and Consumer Protection Act (the “Dodd-Frank Act”) made extensive changes in the regulation of insured depository institutions. Among other things, the Dodd-Frank Act created a new Consumer Financial Protection Bureau as an independent bureau of the Federal Reserve Board. The Consumer Financial Protection Bureau assumed responsibility for the implementation of the federal financial consumer protection and fair lending laws and regulations, a function previously assigned to prudential regulators, and has authority to impose new requirements. However, institutions of less than $10 billion in assets, such as the Bank, continue to be examined for compliance with consumer protection and fair lending laws and regulations by, and be subject to the primary enforcement authority of their prudential regulator rather than the Consumer Financial Protection Bureau.
In addition, the Dodd-Frank Act directed changes in the way that institutions are assessed for deposit insurance, mandated the revision of regulatory capital requirements, required regulations requiring originators of certain securitized loans to retain a percentage of the risk for the transferred loans, stipulated regulatory rate-setting for certain debit card interchange fees, repealed restrictions on the payment of interest on commercial demand deposits and contained a number of reforms related to mortgage originations.
The Dodd-Frank Act contained the so-called “Volcker Rule,” which generally prohibits banking organizations from engaging in proprietary trading and from investing in, sponsoring or having certain relationships with hedge or private equity funds (“covered funds”). On December 13, 2013, federal agencies issued a final rule implementing the Volcker Rule which, among other things, requires banking organizations to restructure and limit certain of their investments in and relationships with covered funds. The final rule unexpectedly included within the interests subject to its restrictions collateralized debt obligations backed by trust-preferred securities (“TRUPs CDOs”). Many banking organizations had purchased such instruments because of their favorable tax, accounting and regulatory treatment and would have been subject to unexpected write-downs. In response to concerns expressed by community banking organizations, the federal agencies subsequently issued an interim final rule which grandfathers TRUPS CDOs issued before May 19, 2010 if (i) acquired by a banking organization on or before December 10, 2013 and (ii) the organization reasonably believed the proceeds from the TRUPS CDOs were invested primarily in any trust preferred security or subordinated debt instrument issued by a depository institution holding company with less than $15 billion in assets or by a mutual holding company.
In addition, the Consumer Financial Protection Bureau has finalized the rule implementing the “Ability to Pay” requirements of the Dodd-Frank Act. The regulations generally require creditors to make a reasonable, good faith determination as to a borrower’s ability to repay most residential mortgage loans. The final rule establishes a safe harbor for certain “Qualified Mortgages,” which contain certain features deemed less risky and omit certain other characteristics considered to enhance risk. The Ability to Repay final rules were effective January 10, 2014.
Many of the provisions of the Dodd-Frank Act are subject to delayed effective dates and/or require the issuance of implementing regulations. The regulatory process is ongoing and the impact on operations cannot yet be fully assessed. However, there is a significant possibility that the Dodd-Frank Act will, at a minimum, result in increased regulatory burden, compliance costs and interest expense for the Company and the Bank.
Loans and Investments
There are no restrictions on the type of loans a national bank can originate and/or purchase. However, OCC regulations govern the Bank’s investment authority. Generally, a national bank is prohibited from investing in corporate equity securities for its own account. Under OCC regulations, a national bank may invest in investment securities, which are generally defined as marketable securities in the form of a note, bond or debenture. The OCC classifies investment securities into five different types and, depending on its type, a national bank may have the authority to deal in and underwrite the security. The OCC has also permitted national banks to purchase certain noninvestment grade securities that can be reclassified and underwritten as loans.
Lending Standards
The federal banking agencies adopted uniform regulations prescribing standards for extensions of credit that are secured by liens on interests in real estate or made for the purpose of financing the construction of a building or other improvements to real estate. Under these regulations, all insured depository institutions, such as the Bank, adopted and maintain written policies that establish appropriate
| Page -3- |
limits and standards for extensions of credit that are secured by liens or interests in real estate or are made for the purpose of financing permanent improvements to real estate. These policies must establish loan portfolio diversification standards, prudent underwriting standards (including loan-to-value limits) that are clear and measurable, loan administration procedures, and documentation, approval and reporting requirements. The real estate lending policies must reflect consideration of the Interagency Guidelines for Real Estate Lending Policies that have been adopted by the federal bank regulators.
Federal Deposit Insurance
The Bank is a member of the DIF, which is administered by the FDIC. Deposit accounts at the Bank are insured by the FDIC. Effective July 22, 2010, the Dodd-Frank Wall Street Reform and Consumer Protection Act permanently raised the deposit insurance available on all deposit accounts to $250,000 with a retroactive effective date of January 1, 2008.
Under the FDIC’s risk-based assessment system, insured institutions are assigned to one of four risk categories based on supervisory evaluations, regulatory capital levels and certain other factors, with less risky institutions paying lower assessments. An institution’s rate depends upon the category to which it is assigned, and certain adjustments specified by FDIC regulations. Institutions deemed less risky pay lower rates. The Dodd-Frank Act required the FDIC to revise its procedures to base its assessments upon each insured institution’s total assets less tangible equity instead of deposits. The FDIC finalized a rule, effective April 1, 2011, that set the assessment range at 2.5 to 45 basis points of total assets less tangible equity. The FDIC may adjust the scale uniformly, except that no adjustment can deviate more than two basis points from the base scale without notice and comment. No institution may pay a dividend if in default of the federal deposit insurance assessment.
Insurance of deposits may be terminated by the FDIC upon a finding that an institution has engaged in unsafe or unsound practices, is in an unsafe or unsound condition to continue operations or has violated any applicable law, regulation, rule, order or condition imposed by the FDIC. We do not know of any practice, condition or violation that might lead to termination of deposit insurance.
In addition to the FDIC assessments, the Financing Corporation (FICO) is authorized to impose and collect, with the approval of the FDIC, assessments for anticipated payments, issuance costs and custodial fees on bonds issued by the FICO in the 1980s to recapitalize the former Federal Savings and Loan Insurance Corporation. The bonds issued by the FICO are due to mature in 2017 through 2019. For the quarter ended December 31, 2015, the annualized FICO assessment was equal to 0.60 basis points of average consolidated total assets less average tangible equity.
Capitalization
Federal regulations require FDIC insured depository institutions, including national banks, to meet several minimum capital standards: a common equity Tier 1 capital to risk-based assets ratio of 4.5%, a Tier 1 capital to risk-based assets ratio of 6.0%, a total capital to risk-based assets of 8% and a 4% Tier 1 capital to total assets leverage ratio. The existing capital requirements were effective January 1, 2015 and are the result of a final rule implementing regulatory amendments based on recommendations of the Basel Committee on Banking Supervision and certain requirements of the Dodd-Frank Act.
As noted, the capital standards require the maintenance of common equity Tier 1 capital, Tier 1 capital and total capital to risk-weighted assets of at least 4.5%, 6% and 8%, respectively, and a leverage ratio of at least 4% Tier 1 capital. Common equity Tier 1 capital is generally defined as common stockholders’ equity and retained earnings. Tier 1 capital is generally defined as common equity Tier 1 and Additional Tier 1 capital. Additional Tier 1 capital generally includes certain noncumulative perpetual preferred stock and related surplus and minority interests in equity accounts of consolidated subsidiaries. Total capital includes Tier 1 capital (common equity Tier 1 capital plus Additional Tier 1 capital) and Tier 2 capital. Tier 2 capital is comprised of capital instruments and related surplus meeting specified requirements, and may include cumulative preferred stock and long-term perpetual preferred stock, mandatory convertible securities, intermediate preferred stock and subordinated debt. Also included in Tier 2 capital is the allowance for loan and lease losses limited to a maximum of 1.25% of risk-weighted assets and, for institutions that have exercised an opt-out election regarding the treatment of Accumulated Other Comprehensive Income (“AOCI”), up to 45% of net unrealized gains on available-for-sale equity securities with readily determinable fair market values. Institutions that have not exercised the AOCI opt-out have AOCI incorporated into common equity Tier 1 capital (including unrealized gains and losses on available-for-sale-securities). Calculation of all types of regulatory capital is subject to deductions and adjustments specified in the regulations.
In determining the amount of risk-weighted assets for purposes of calculating risk-based capital ratios, assets, including certain off-balance sheet assets (e.g., recourse obligations, direct credit substitutes, residual interests) are multiplied by a risk weight factor assigned by the regulations based on the risks believed inherent in the type of asset. Higher levels of capital are required for asset categories believed to present greater risk. For example, a risk weight of 0% is assigned to cash and U.S. government securities, a risk weight of 50% is generally assigned to prudently underwritten first lien one to four- family residential mortgages, a risk weight of 100% is assigned to commercial and consumer loans, a risk weight of 150% is assigned to certain past due loans and a risk weight of between 0% to 600% is assigned to permissible equity interests, depending on certain specified factors.
| Page -4- |
In addition to establishing the minimum regulatory capital requirements, the regulations limit capital distributions and certain discretionary bonus payments to management if the institution does not hold a “capital conservation buffer” consisting of 2.5% of common equity Tier 1 capital to risk-weighted assets above the amount necessary to meet its minimum risk-based capital requirements. The capital conservation buffer requirement is being phased in beginning January 1, 2016 at 0.625% of risk-weighted assets and increasing each year until fully implemented at 2.5% on January 1, 2019.
Safety and Soundness Standards
Each federal banking agency, including the OCC, has adopted guidelines establishing general standards relating to internal controls, information and internal audit systems, loan documentation, credit underwriting, interest rate exposure, asset growth, asset quality, earnings and compensation, fees and benefits. In general, the guidelines require, among other things, appropriate systems and practices to identify and manage the risks and exposures specified in the guidelines. The guidelines prohibit excessive compensation as an unsafe and unsound practice and describe compensation as excessive when the amounts paid are unreasonable or disproportionate to the services performed by an executive officer, employee, director, or principal shareholder.
On February 7, 2011, the FDIC approved a rulemaking to implement Section 956 of the Dodd-Frank Wall Street Reform and Consumer Protection Act that prohibits incentive-based compensation that encourages inappropriate risk taking.
Prompt Corrective Regulatory Action
Federal law requires, among other things, that federal bank regulatory authorities take “prompt corrective action” with respect to institutions that do not meet minimum capital requirements. For these purposes, the statute establishes five capital tiers: well capitalized, adequately capitalized, undercapitalized, significantly undercapitalized, and critically undercapitalized.
The OCC may order national banks which have insufficient capital to take corrective actions. For example, a bank which is categorized as “undercapitalized” would be subject to growth limitations and would be required to submit a capital restoration plan, and a holding company that controls such a bank would be required to guarantee that the bank complies with the restoration plan. A “significantly undercapitalized” bank would be subject to additional restrictions. National banks deemed by the OCC to be “critically undercapitalized” would be subject to the appointment of a receiver or conservator.
The recent final rule that increased regulatory capital standards adjusted the prompt corrective action tiers as of January 1, 2015. The various categories have been revised to incorporate the new common equity Tier 1 capital requirement, the increase in the Tier 1 to risk-based assets requirement and other changes. Under the revised prompt corrective action requirements, insured depository institutions are required to meet the following in order to qualify as “well capitalized:” (1) a common equity Tier 1 risk-based capital ratio of 6.5% (new standard); (2) a Tier 1 risk-based capital ratio of 8% (increased from 6%); (3) a total risk-based capital ratio of 10% (unchanged) and (4) a Tier 1 leverage ratio of 5% (unchanged).
Dividends
Under federal law and applicable regulations, a national bank may generally declare a dividend, without approval from the OCC, in an amount equal to its year-to-date net income plus the prior two years’ net income that is still available for dividend. Dividends exceeding those amounts require application to and approval by the OCC.
Transactions with Affiliates and Insiders
Sections 23A and 23B of the Federal Reserve Act govern transactions between a national bank and its affiliates, which includes the Company. The Federal Reserve Board has adopted Regulation W, which comprehensively implements and interprets Sections 23A and 23B, in part by codifying prior Federal Reserve Board interpretations under Sections 23A and 23B.
An affiliate of a bank is any company or entity that controls, is controlled by or is under common control with the bank. A subsidiary of a bank that is not also a depository institution or a “financial subsidiary” under federal law is not treated as an affiliate of the bank for the purposes of Sections 23A and 23B; however, the OCC has the discretion to treat subsidiaries of a bank as affiliates on a case-by-case basis. Sections 23A and 23B limit the extent to which a bank or its subsidiaries may engage in “covered transactions” with any one affiliate to an amount equal to 10% of such bank’s capital stock and surplus, and limit all such transactions with all affiliates to an amount equal to 20% of such capital stock and surplus. The statutory sections also require that all such transactions be on terms that are consistent with safe and sound banking practices. The term “covered transaction” includes the making of loans, purchase of assets, issuance of guarantees and other similar types of transactions. Further, most loans by a bank to any of its affiliates must be secured by collateral in amounts ranging from 100 to 130 percent of the loan amounts. In addition, any covered transaction by an association with an affiliate and any purchase of assets or services by an association from an affiliate must be on terms that are substantially the same, or at least as favorable, to the bank as those that would be provided to a non-affiliate.
| Page -5- |
A bank’s loans to its executive officers, directors, any owner of more than 10% of its stock (each, an insider) and any of certain entities affiliated with any such person (an insider’s related interest) are subject to the conditions and limitations imposed by Section 22(h) of the Federal Reserve Act and the FRB’s Regulation O thereunder. Under these restrictions, the aggregate amount of the loans to any insider and the insider’s related interests may not exceed the loans-to-one-borrower limit applicable to national banks. All loans by a bank to all insiders and insiders’ related interests in the aggregate may not exceed the bank’s unimpaired capital and unimpaired surplus. With certain exceptions, loans to an executive officer, other than loans for the education of the officer’s children and certain loans secured by the officer’s residence, may not exceed the greater of $25,000 or 2.5% of the bank’s unimpaired capital and unimpaired surplus, but in no event more than $100,000. Regulation O also requires that any proposed loan to an insider or a related interest of that insider be approved in advance by a majority of the board of directors of the bank, with any interested director not participating in the voting, if such loan, when aggregated with any existing loans to that insider and the insider’s related interests, would exceed either $500,000 or the greater of $25,000 or 5% of the bank’s unimpaired capital and surplus. Generally, such loans must be made on substantially the same terms as, and follow credit underwriting procedures that are no less stringent than, those that are prevailing at the time for comparable transactions with other persons and must not present more than a normal risk of collectibility. An exception is made for extensions of credit made pursuant to a benefit or compensation plan of a bank that is widely available to employees of the bank and that does not give any preference to insiders of the bank over other employees of the bank.
Examinations and Assessments
The Bank is required to file periodic reports with and is subject to periodic examination by the OCC. Federal regulations generally require annual on-site examinations for all depository institutions and annual audits by independent public accountants for all insured institutions. The Bank is required to pay an annual assessment to the OCC to fund its supervision.
Community Reinvestment Act
Under the Community Reinvestment Act (“CRA”), the Bank has a continuing and affirmative obligation consistent with its safe and sound operation to help meet the credit needs of its entire community, including low and moderate income neighborhoods. The CRA does not establish specific lending requirements or programs for financial institutions nor does it limit an institution’s discretion to develop the types of products and services that it believes are best suited to its particular community, consistent with the CRA. The CRA requires the OCC in connection with its examination of the Bank, to assess its record of meeting the credit needs of its community and to take that record into account in its evaluation of certain applications by the Bank. For example, the regulations specify that a bank’s CRA performance will be considered in its expansion (e.g., branching) proposals and may be the basis for approving, denying or conditioning the approval of an application. As of the date of its most recent regulatory examination, the Bank was rated “satisfactory” with respect to its CRA compliance.
USA PATRIOT Act
The USA PATRIOT Act of 2001 gave the federal government new powers to address terrorist threats through enhanced domestic security measures, expanded surveillance powers, increased information sharing and broadened anti-money laundering requirements. The USA PATRIOT Act also required the federal banking agencies to take into consideration the effectiveness of controls designed to combat money laundering activities in determining whether to approve a merger or other acquisition application of a member institution. Accordingly, if the Bank engages in a merger or other acquisition, our controls designed to combat money laundering would be considered as part of the application process. The Bank has established policies, procedures and systems designed to comply with these regulations.
Bridge Bancorp, Inc.
The Company, as a bank holding company controlling the Bank, is subject to the Bank Holding Company Act of 1956, as amended (“BHCA”), and the rules and regulations of the Federal Reserve Board under the BHCA applicable to bank holding companies. The Company is required to file reports with, and otherwise comply with the rules and regulations of the Federal Reserve Board.
The Federal Reserve Board previously adopted consolidated capital adequacy guidelines for bank holding structured similarly, but not identically, to those of the OCC for the Bank. The Dodd-Frank Act directed the Federal Reserve Board to issue consolidated capital requirements for depository institution holding companies that are no less stringent, both quantitatively and in terms of components of capital, than those applicable to institutions themselves. The previously discussed final rule regarding regulatory capital requirements implements the Dodd-Frank Act as to bank holding company capital standards. Consolidated regulatory capital requirements identical to those applicable to the subsidiary banks applied to bank holding companies as of January 1, 2015. As is the case with institutions themselves, the capital conservation buffer will be phased-in between 2016 and 2019. The new capital rule eliminates from Tier 1 capital the inclusion of certain instruments, such as trust preferred securities, that were previously includable by bank holding companies. However, the final rule grandfathers trust preferred issuances prior to May 19, 2010 in accordance with the Dodd-Frank Act. The Company has issued trust preferred securities that qualify for the grandfather. The Company met all capital adequacy requirements under the new capital rules on December 31, 2015.
| Page -6- |
The policy of the Federal Reserve Board is that a bank holding company must serve as a source of strength to its subsidiary banks by providing capital and other support in times of distress. The Dodd-Frank Act codified the source of strength policy.
Under the prompt corrective action provisions of federal law, a bank holding company parent of an undercapitalized subsidiary bank is required to guarantee, within specified limits, the capital restoration plan that is required of an undercapitalized bank. If an undercapitalized bank fails to file an acceptable capital restoration plan or fails to implement an accepted plan, the Federal Reserve Board may prohibit the bank holding company parent of the undercapitalized bank from paying dividends or making any other capital distribution.
As a bank holding company, the Company is required to obtain the prior approval of the Federal Reserve Board to acquire more than 5% of a class of voting securities of any additional bank or bank holding company or to acquire all, or substantially all, the assets of any additional bank or bank holding company. In addition, the bank holding companies may generally only engage in activities that are closely related to banking as determined by the Federal Reserve Board. Bank holding companies that meet certain criteria may opt to become a financial holding company and thereby engage in a broader array of financial activities.
Federal Reserve Board policy is that a bank holding company should pay cash dividends only to the extent that the company’s net income for the past two years is sufficient to fund the dividends and the prospective rate of earnings retention is consistent with the company’s capital needs, asset quality and overall financial condition.
A bank holding company is required to receive prior Federal Reserve Board approval of the redemption of its outstanding equity securities if the gross consideration for the purchase or redemption, when combined with the net consideration paid for all such purchases or redemptions during the preceding 12 months, will be equal to 10% or more of the company’s consolidated net worth. Such approval is not required for a bank holding company that meets certain qualitative criteria.
These regulatory authorities have extensive enforcement authority over the institutions that they regulate to prohibit or correct activities that violate law, regulation or a regulatory agreement or which are deemed to be unsafe or unsound banking practices. Enforcement actions may include the appointment of a conservator or receiver, the issuance of a cease and desist order, the termination of deposit insurance, the imposition of civil money penalties on the institution, its directors, officers, employees and institution-affiliated parties, the issuance of directives to increase capital, the issuance of formal and informal agreements, the removal of or restrictions on directors, officers, employees and institution-affiliated parties, and the enforcement of any such mechanisms through restraining orders or other court actions. Any change in laws and regulations, whether by the OCC, the FDIC, the Federal Reserve Board or through legislation, could have a material adverse impact on the Bank and the Company and their operations and stockholders.
During 2008, the Company received approval and began trading on the NASDAQ Global Select Market under the symbol “BDGE”. Equity incentive plan grants of stock options and stock awards are recorded directly to the holding company. The Company’s sources of funds are dependent on dividends from the Bank, its own earnings, additional capital raised and borrowings. The information in this report reflects principally the financial condition and results of operations of the Bank. The Bank’s results of operations are primarily dependent on its net interest income. The Bank also generates non-interest income, such as fee income on deposit accounts and merchant credit and debit card processing programs, investment services, income from its title insurance abstract subsidiary, and net gains on sales of securities and loans. The level of its non-interest expenses, such as salaries and benefits, occupancy and equipment costs, other general and administrative expenses, expenses from its title insurance abstract subsidiary, and income tax expense, further affects the Bank’s net income.
The Company had nominal results of operations for 2015, 2014, and 2013 on a parent-only basis. The Company’s capital strength is paralleled by the solid capital position of the Bank, as reflected in the excess of its regulatory capital ratios over the risk-based capital adequacy ratio levels required for classification as a “well capitalized” institution by the FDIC (see Note 16 of the Notes to the Consolidated Financial Statements). Since 2013, the Company has actively managed its capital position in response to its growth and has raised $210.7 million in capital.
The Company files certain reports with the Securities and Exchange Commission (“SEC”) under the federal securities laws. The Company’s operations are also subject to extensive regulation by other federal, state and local governmental authorities and it is subject to various laws and judicial and administrative decisions imposing requirements and restrictions on part or all of its operations. Management believes that the Company is in substantial compliance, in all material respects, with applicable federal, state and local laws, rules and regulations. Because the Company’s business is highly regulated, the laws, rules and regulations applicable to it are subject to regular modification and change. There can be no assurance that these proposed laws, rules and regulations, or any other laws, rules or regulations, will not be adopted in the future, which could make compliance more difficult or expensive or otherwise adversely affect the Company’s business, financial condition or prospects.
| Page -7- |
OTHER INFORMATION
Through a link on the Investor Relations section of the Bank’s website of www.bridgenb.com, copies of the Company’s Annual Reports on Form 10-K, Quarterly Reports on Form 10-Q and Current Reports on Form 8-K, and amendments to those reports filed or furnished pursuant to Section 13(a) for 15(d) of the Exchange Act, are made available, free of charge, as soon as reasonably practicable after electronically filing such material with, or furnishing it to, the SEC. Copies of such reports and other information also are available at no charge to any person who requests them or at www.sec.gov. Such requests may be directed to Bridge Bancorp, Inc., Investor Relations, 2200 Montauk Highway, PO Box 3005, Bridgehampton, NY 11932, (631) 537-1000.
The concentration of our loan portfolio in loans secured by commercial and residential real estate properties located in eastern Long Island could materially adversely affect our financial condition and results of operations if general economic conditions or real estate values in this area decline.
Unlike larger banks that are more geographically diversified, the Bank’s loan portfolio consists primarily of real estate loans secured by commercial and residential real estate properties located in Suffolk County on eastern Long Island. The local economic conditions on eastern Long Island have a significant impact on the volume of loan originations and the quality of our loans, the ability of borrowers to repay these loans, and the value of collateral securing these loans. A considerable decline in the general economic conditions caused by inflation, recession, unemployment or other factors beyond our control would impact these local economic conditions and could negatively affect our financial condition and results of operations. Additionally, while we have a significant amount of commercial real estate loans, the majority of which are owner-occupied, decreases in tenant occupancy may also have a negative effect on the ability of borrowers to make timely repayments of their loans, which would have an adverse impact on our earnings.
Changes in interest rates could affect our profitability.
The Bank’s ability to earn a profit, like most financial institutions, depends primarily on net interest income, which is the difference between the interest income that the Bank earns on its interest-earning assets, such as loans and investments, and the interest expense that the Bank pays on its interest-bearing liabilities, such as deposits. The Bank’s profitability depends on its ability to manage its assets and liabilities during periods of changing market interest rates.
In a period of rising interest rates, the interest income earned on the Bank’s assets may not increase as rapidly as the interest paid on its liabilities. In an increasing interest rate environment, the Bank’s cost of funds is expected to increase more rapidly than interest earned on its loan and investment portfolio as its primary source of funds is deposits with generally shorter maturities than those on its loans and investments. This makes the balance sheet more liability sensitive in the short term.
A sustained decrease in market interest rates could adversely affect the Bank’s earnings. When interest rates decline, borrowers tend to refinance higher-rate, fixed-rate loans at lower rates. Under those circumstances, the Bank would not be able to reinvest those prepayments in assets earning interest rates as high as the rates on those prepaid loans or in investment securities. In addition, the majority of the Bank’s loans are at variable interest rates, which would adjust to lower rates.
Changes in interest rates also affect the fair value of our securities portfolio. Generally, the value of securities moves inversely with changes in interest rates. As of December 31, 2015, our securities portfolio totaled $1.0 billion.
In addition, the Dodd-Frank Act eliminated the federal prohibition on paying interest on demand deposits effective July 21, 2011, thus allowing businesses to have interest-bearing checking accounts. Depending on competitive responses, this change to existing law could increase our interest expense.
Strong competition within our market area may limit our growth and profitability.
The Bank’s primary market area is located in Nassau and Suffolk Counties, Long Island. Since 2010, the Bank has expanded its market areas to include branches in the towns of Babylon, Smithtown and Islip. In December 2012, the Bank opened administrative offices in Hauppauge, New York, to better service customers as the Bank continues to move westward. During 2013, the Bank opened two new branches: one in March located in Rocky Point, New York and one in May located on Shelter Island, New York. During 2014, the Bank opened three branches in Suffolk County: Bay Shore, Port Jefferson and Smithtown, New York and added three branches, including the first two branches in Nassau County, from the acquisition of FNBNY. The acquisition of CNB during 2015 expanded the Bank’s geographic footprint across Long Island including Nassau County, Queens and into New York City. Competition in the banking and financial services industry remains intense. The profitability of the Bank depends on the continued ability to successfully compete. The Bank competes with commercial banks, savings banks, credit unions, insurance companies, and brokerage and investment banking firms. Many of our competitors have substantially greater resources and lending limits than the
| Page -8- |
Bank and may offer certain services that the Bank does not provide. In addition, competitors may offer deposits at higher rates and loans with lower fixed rates, more attractive terms and less stringent credit structures than the Bank has been willing to offer.
Acquisitions involve integrations and other risks.
Acquisitions involve a number of risks and challenges including: our ability to integrate the branches and operations we acquire, and the associated internal controls and regulatory functions, into our current operations; our ability to limit the outflow of deposits held by our new customers in the acquired branches and to successfully retain and manage the loans we acquire; our ability to attract new deposits and to generate new interest-earning assets in geographic areas we have not previously served. Additionally, no assurance can be given that the operation of acquired branches would not adversely affect our existing profitability; that we would be able to achieve results in the future similar to those achieved by our existing banking business; that we would be able to compete effectively in the market areas served by acquired branches; or that we would be able to manage any growth resulting from the transaction effectively. We face the additional risk that the anticipated benefits of the acquisition may not be realized fully or at all, or within the time period expected. Finally, acquisitions typically involve the payment of a premium over book and trading values and therefore, may result in dilution of our book and tangible book value per share.
Our future success depends on the success and growth of The Bridgehampton National Bank.
Our primary business activity for the foreseeable future will be to act as the holding company of the Bank. Therefore, our future profitability will depend on the success and growth of this subsidiary. The continued and successful implementation of our growth strategy will require, among other things that we increase our market share by attracting new customers that currently bank at other financial institutions in our market area. In addition, our ability to successfully grow will depend on several factors, including favorable market conditions, the competitive responses from other financial institutions in our market area, and our ability to maintain high asset quality. While we believe we have the management resources, market opportunities and internal systems in place to obtain and successfully manage future growth, growth opportunities may not be available and we may not be successful in continuing our growth strategy. In addition, continued growth requires that we incur additional expenses, including salaries, data processing and occupancy expense related to new branches and related support staff. Many of these increased expenses are considered fixed expenses. Unless we can successfully continue our growth, our results of operations could be negatively affected by these increased costs. Finally, our growth is also affected by the seasonality of our markets in Eastern Long Island, including the Hamptons and North Fork, a region that is a recreational destination for the New York metropolitan area, and a highly regarded resort locale world-wide. This seasonality results in more economic activity in the summer and fall months and decrease activity in the off season, which can adversely impact the consistency and sustainability of growth.
The loss of key personnel could impair our future success.
Our future success depends in part on the continued service of our executive officers, other key management, as well as our staff, and on our ability to continue to attract, motivate, and retain additional highly qualified employees. The loss of services of one or more of our key personnel or our inability to timely recruit replacements for such personnel, or to otherwise attract, motivate, or retain qualified personnel could have an adverse effect on our business, operating results and financial condition.
We operate in a highly regulated environment.
The Bank and Company are subject to extensive regulation, supervision and examination by the OCC, the FDIC, the Federal Reserve Board and the SEC. Such regulation and supervision governs the activities in which a financial institution and its holding company may engage and are intended primarily for the protection of the consumer rather than for the protection of shareholders. In order to comply with regulations, guidelines and examination procedures in this area as well as other areas of the Bank’s operations, we have been required to adopt new policies and procedures and to install new systems. We cannot be certain that the policies, procedures, and systems we have in place are effective and there is no assurance that in every instance we are in full compliance with these requirements. Regulatory authorities have extensive discretion in connection with their supervisory and enforcement activities, including the imposition of restrictions on the operation of an institution. Any change in such regulation and oversight, whether in the form of regulatory policy, regulations, or legislation, may have a material impact on our operations.
We may be adversely affected by current economic and market conditions.
Although economic and real estate conditions improved in 2015, we continue to operate in a challenging environment both nationally and locally. This poses significant risks to both the Company’s business and the banking industry as a whole. Although we have taken, and continue to take, steps to reduce our exposure to the risks that stem from adverse changes in such conditions, we nonetheless could be impacted by them to the degree that they affect the loans we originate and the securities we invest in. Specific risks include reduced loan demand from quality borrowers; increased competition for loans; increased loan loss provisions resulting from deterioration in loan quality caused by, among other things, depressed real estate values and high levels of unemployment; reduced net interest income and net interest margin caused by a sustained period of low interest rates; interest rate volatility; price competition for deposits due to liquidity concerns or otherwise; and volatile equity markets.
| Page -9- |
Increases to the allowance for credit losses may cause our earnings to decrease.
Our customers may not repay their loans according to the original terms, and the collateral securing the payment of those loans may be insufficient to pay any remaining loan balance. Hence, we may experience significant loan losses, which could have a material adverse effect on our operating results. We make various assumptions and judgments about the collectability of our loan portfolio, including the creditworthiness of our borrowers and the value of the real estate and other assets serving as collateral for the repayment of loans. In determining the amount of the allowance for credit losses, we rely on loan quality reviews, past loss experience, and an evaluation of economic conditions, among other factors. If our assumptions prove to be incorrect, our allowance for credit losses may not be sufficient to cover probable incurred losses in our loan portfolio, resulting in additions to the allowance. Material additions to the allowance through charges to earnings would materially decrease our net income.
Bank regulators periodically review our allowance for credit losses and may require us to increase our provision for credit losses or loan charge-offs. Any increase in our allowance for credit losses or loan charge-offs as required by these regulatory authorities could have a material adverse effect on our results of operations and/or financial condition.
The trust preferred securities and subordinated debentures that we issued have rights that are senior to those of our common shareholders. The conversion of the trust preferred securities into shares of our common stock could result in dilution of your investment.
In October 2009 we issued $16 million of 8.5% cumulative convertible trust preferred securities from a special purpose trust, and we issued an identical amount of junior subordinated debentures to this trust. Payments of the principal and interest on the trust preferred securities are conditionally guaranteed by us. Further, the accompanying junior subordinated debentures that we issued to the trust are senior to our shares of common stock. In addition, we issued $80 million of subordinated debentures in 2015. As a result, we must make payments on the junior subordinated debentures and the subordinated debentures before any dividends can be paid on our common stock and, in the event of our bankruptcy, dissolution or liquidation, the obligations with respect to the junior subordinated debentures and the subordinated debentures must be satisfied before any distributions can be made on our common stock. We have the right to defer distributions on the junior subordinated debentures (and the related trust preferred securities) for up to five years, during which time no dividends may be paid on our common stock.
In addition, each $1,000 in liquidation amount of the trust preferred securities currently is convertible, at the option of the holder, into 32.2581 shares of our common stock. The conversion of these securities into shares of our common stock would dilute the ownership interests of purchasers of our common stock in this offering.
The Dodd-Frank Wall Street Reform and Consumer Protection Act tightened capital standards, created a new Consumer Financial Protection Bureau and resulted in new laws and regulations that are expected to increase our cost of operations.
The Dodd-Frank Act is significantly changing the bank regulatory structure and is impacting the largest financial institutions as well as regional banks and community banks. The federal regulatory agencies, specifically the SEC and the new Consumer Financial Protection Bureau, are given significant discretion in drafting the implementing regulations.
The major bank-related provisions under the Dodd-Frank Act pertained to: capital requirements; mortgage reform and minimum lending standards; consumer financial protection bureau; sale of mortgage loans (including risk retention requirements); FDIC insurance-related provisions; preemption standards for national banks; abolishment of the Office of Thrift Supervision; interchange fee for debit card transactions; Volcker Rule; regulation of derivatives/swaps; Financial Services Oversight Council; resolution authority; and corporate governance matters (e.g.; “say on pay”; new executive compensation disclosure and clawbacks, etc.). Given the range of topics in the Dodd-Frank Act and the voluminous regulations required to implement by the Dodd-Frank Act, the full impact will not be known for some time.
Certain provisions of the Dodd-Frank Act impacted banks upon enactment of the legislation. Examples of this were the permanent increase of FDIC deposit insurance limits, the FDIC Assessment Base calculation change and the removal of the cap for the Deposit Insurance Fund, all of which in turn affected banks' FDIC deposit insurance premiums. Certain provisions of the Dodd-Frank Act had a near-term effect on us. For example, a provision of the Dodd-Frank Act eliminated the federal prohibitions on paying interest on demand deposits, thus allowing businesses to have interest-bearing checking accounts.
The Dodd-Frank Act created a new Consumer Financial Protection Bureau with broad powers to supervise and enforce consumer protection laws. The Consumer Financial Protection Bureau has broad rule-making authority for a wide range of consumer protection laws that apply to all banks and savings institutions, including the authority to prohibit “unfair, deceptive or abusive” acts and practices. The Consumer Financial Protection Bureau has examination and enforcement authority over all banks and savings institutions with more than $10 billion in assets. Banks and savings institutions with $10 billion or less in assets are examined by their applicable bank regulators. The Dodd-Frank Act also weakened the federal preemption rules that have been applicable for national banks and federal savings associations, and gives state attorneys general the ability to enforce federal consumer protection laws.
| Page -10- |
It is difficult to fully assess at this time what specific impact the Dodd-Frank Act and the implementing rules and regulations will have on community banks. However, it is expected that at a minimum they will increase our operating and compliance costs and could increase our interest expense.
The short-term and long-term impact of the changing regulatory capital requirements and anticipated new capital rules are uncertain.
In July 2013, the OCC and the other federal bank regulatory agencies issued a final rule that will revise their leverage and risk-based capital requirements and the method for calculating risk-weighted assets to make them consistent with agreements that were reached by the Basel Committee on Banking Supervision and certain provisions of the Dodd-Frank Act. Among other things, the rule establishes a new common equity Tier 1 minimum capital requirement (4.5% of risk-weighted assets), sets the leverage ratio at a uniform 4% of total assets, increases the minimum Tier 1 capital to risk-based assets requirement (from 4% to 6% of risk-weighted assets) and assigns a higher risk weight (150%) to exposures that are more than 90 days past due or are on nonaccrual status and to certain commercial real estate facilities that finance the acquisition, development or construction of real property. The rule also requires unrealized gains and losses on certain “available-for-sale” securities holdings to be included for purposes of calculating regulatory capital requirements unless a one-time opt-out is exercised. The rule limits a banking organization’s capital distributions and certain discretionary bonus payments to executive officers if the banking organization does not hold a “capital conservation buffer” consisting of 2.5% of common equity Tier 1 capital to risk-weighted assets in addition to the amount necessary to meet its minimum risk-based capital requirements. The final rule became effective January 1, 2015. The “capital conservation buffer” will be phased in from January 1, 2016 to January 1, 2019, when the full capital conservation buffer will be effective.
The application of more stringent capital requirements could, among other things, result in lower returns on equity, require the raising of additional capital, and result in regulatory actions if we were to be unable to comply with such requirements. Furthermore, the imposition of liquidity requirements in connection with the implementation of Basel III could result in our having to lengthen the term of our funding, restructure our business models, and/or increase our holdings of liquid assets. Implementation of changes to asset risk weightings for risk based capital calculations, items included or deducted in calculating regulatory capital or additional capital conservation buffers, could result in management modifying our business strategy and could limit our ability to make distributions, including paying dividends or buying back our shares.
Risks associated with system failures, interruptions, or breaches of security could negatively affect our operations and earnings.
Information technology systems are critical to our business. We collect, process and store sensitive customer data by utilizing computer systems and telecommunications networks operated by us and third party service providers. We have established policies and procedures to prevent or limit the impact of system failures, interruptions, and security breaches, but such events may still occur or may not be adequately addressed if they do occur. In addition, any compromise of our systems could deter customers from using our products and services. Although we rely on security systems to provide security and authentication necessary to effect the secure transmission of data, these precautions may not protect our systems from compromises or breaches of security.
In addition, we maintain interfaces with certain third-party service providers. If these third-party service providers encounter difficulties, or if we have difficulty communicating with them, our ability to adequately process and account for transactions could be affected, and our business operations could be adversely affected. Threats to information security also exist in the processing of customer information through various other vendors and their personnel.
The occurrence of any system failures, interruption, or breach of security could damage our reputation and result in a loss of customers and business thereby subjecting us to additional regulatory scrutiny, or could expose us to litigation and possible financial liability. Any of these events could have a material adverse effect on our financial condition and results of operations.
We are exposed to cyber-security risks, including denial of service, hacking, and identity theft.
There have been well-publicized distributed denials of service attacks on large financial services companies. Distributed denial of service attacks are designed to saturate the targeted online network with excessive amounts of network traffic, resulting in slow response times, or in some cases, causing the site to be temporarily unavailable. Hacking and identity theft risks, in particular, could cause serious reputational harm. Cyber threats are rapidly evolving and we may not be able to anticipate or prevent all such attacks. We may incur increasing costs in an effort to minimize these risks and could be held liable for any security breach or loss.
Severe weather, acts of terrorism and other external events could impact our ability to conduct business.
In the past, weather-related events have adversely impacted our market area, especially areas located near coastal waters and flood prone areas. Such events that may cause significant flooding and other storm-related damage may become more common events in the future. Financial institutions have been, and continue to be, targets of terrorist threats aimed at compromising operating and communication systems and the metropolitan New York area remain central targets for potential acts of terrorism. Such events could cause significant damage, impact the stability of our facilities and result in additional expenses, impair the ability of our borrowers to repay their loans, reduce the value of collateral securing repayment of our loans, and result in the loss of revenue. While we have
| Page -11- |
established and regularly test disaster recovery procedures, the occurrence of any such event could have a material adverse effect on our business, operations and financial condition.
Changes in tax laws.
The Company is subject to income tax under Federal, New York State, New York City and New Jersey State laws and regulations. Changes in such laws and regulations could increase the Company’s tax burden and such increase could have a material negative impact on the consolidated financial statements.
We may incur impairment to our goodwill
Goodwill arises when a business is purchased for an amount greater than the fair value of the net assets acquired. We recognized goodwill as an asset on our balance sheet in connection with the CNB, FNBNY and HSB acquisitions. We evaluate goodwill for impairment at least annually. Although we determined that goodwill was not impaired during 2015, a significant and sustained decline in our stock price and market capitalization, a significant decline in our expected future cash flows, a significant adverse change in the business climate, slower growth rates or other factors could result in impairment of goodwill. If we were to conclude that a future write-down of the goodwill was necessary, then we would record the appropriate charge to earnings, which could be materially adverse to the Company’s consolidated financial statements.
Item 1B. Unresolved Staff Comments
None.
At present, the Registrant does not own or lease any property. The Registrant uses the Bank’s space and employees without separate payment. Headquarters are located at 2200 Montauk Highway, Bridgehampton, New York 11932. The Bank’s internet address is www.bridgenb.com.
As of December 31, 2015, the Bank has six owned properties: our headquarters and branch office in Bridgehampton and 5 branches located in Montauk, Southold, Westhampton Beach, Southampton Village, and East Hampton Village. In 2011, the Bank purchased real estate in the Town of Southold which will also be considered as a site for a future branch facility. The Bank currently leases out a portion of the Montauk and Westhampton Beach buildings. The Bank leases thirty four additional properties as branch locations: twenty three in Suffolk County, nine in Nassau County, one in Queens and one in Manhattan. The Bank currently subleases a portion of the leased property located in Patchogue and Melville, New York. The Bank leases two properties as loan production offices: one in Riverhead, New York and one in New York City. In addition, one leased property in New York City is fully sublet.
The Registrant and its subsidiary are subject to certain pending and threatened legal actions that arise out of the normal course of business. In the opinion of management at the present time, the resolution of any pending or threatened litigation will not have a material adverse effect on the Company’s consolidated financial statements.
Item 4. Mine Safety Disclosures
Not applicable.
Item 5. Market for Registrant’s Common Equity, Related Stockholder Matters and Issuer Purchases of Equity Securities
At December 31, 2015, the Company had approximately 1,049 shareholders of record, not including the number of persons or entities holding stock in nominee or the street name through various banks and brokers
The Company’s common stock trades on the NASDAQ Global Select Market under the symbol “BDGE”. The following table details the quarterly high and low closing prices of the Company’s common stock and the dividends declared for such periods.
| Page -12- |
COMMON STOCK INFORMATION
| Stock Prices | ||||||||||||
| High | Low | Dividends Declared | ||||||||||
| By Quarter 2015 | ||||||||||||
| First | $ | 26.70 | $ | 24.55 | $ | 0.23 | ||||||
| Second | $ | 27.89 | $ | 24.33 | $ | 0.23 | ||||||
| Third | $ | 28.12 | $ | 25.85 | $ | 0.23 | ||||||
| Fourth | $ | 32.05 | $ | 26.26 | $ | 0.23 | ||||||
| Stock Prices | ||||||||||||
| High | Low | Dividends Declared | ||||||||||
| By Quarter 2014 | ||||||||||||
| First | $ | 27.35 | $ | 23.74 | $ | 0.23 | ||||||
| Second | $ | 27.40 | $ | 23.28 | $ | 0.23 | ||||||
| Third | $ | 25.37 | $ | 23.03 | $ | 0.23 | ||||||
| Fourth | $ | 27.03 | $ | 23.31 | $ | 0.23 | ||||||
Stockholders received cash dividends totaling $13.4 million in 2015 and $10.7 million in 2014. The ratio of dividends per share to net income per share was 63.55% in 2015 compared to 77.43% in 2014.
There are various legal limitations with respect to the Company’s ability to pay dividends to shareholders and the Bank’s ability to pay dividends to the Company. Under the New York Business Corporation Law, the Company may pay dividends on its outstanding shares unless the Company is insolvent or would be made insolvent by the dividend. Under federal banking law, the prior approval of the Federal Reserve Board and the Office Comptroller of the Currency (the “OCC”) may be required in certain circumstances prior to the payment of dividends by the Company or the Bank. A national bank may generally declare a dividend, without approval from the OCC, in an amount equal to its year-to-date net income plus the prior two years’ net income that is still available for dividend. At January 1, 2016, the Bank had $27.6 million of retained net income available for dividends to the Company. The OCC also has the authority to prohibit a national bank from paying dividends if such payment is deemed to be an unsafe or unsound practice. In addition, as a depository institution the deposits of which are insured by the FDIC, the Bank may not pay dividends or distribute any of its capital assets while it remains in default on any assessment due to the FDIC. The Bank currently is not (and never has been) in default under any of its obligations to the FDIC.
The Federal Reserve Board has issued a policy statement regarding the payment of dividends by bank holding companies. In general, the Federal Reserve Board’s policy provides that dividends should be paid only out of current earnings and only if the prospective rate of earnings retention by the bank holding company appears consistent with the organization’s capital needs, asset quality and overall financial condition. The Federal Reserve Board has the authority to prohibit the Company from paying dividends if such payment is deemed to be an unsafe or unsound practice.
| Page -13- |
PERFORMANCE GRAPH
Pursuant to the regulations of the SEC, the graph below compares the performance of the Company with that of the total return for the NASDAQ® stock market and for certain bank stocks of financial institutions with an asset size $1 billion to $5 billion, as reported by SNL Financial LC (“SNL”) from December 31, 2010 through December 31, 2015. The graph assumes the reinvestment of dividends in additional shares of the same class of equity securities as those listed below.
Bridge Bancorp, Inc.
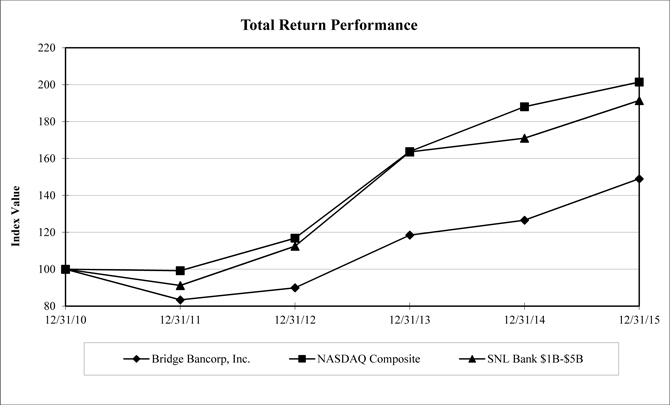
| Period Ending | ||||||||||||||||||||||||
| Index | 12/31/10 | 12/31/11 | 12/31/12 | 12/31/13 | 12/31/14 | 12/31/15 | ||||||||||||||||||
| Bridge Bancorp, Inc. | 100.00 | 83.40 | 89.93 | 118.48 | 126.55 | 149.00 | ||||||||||||||||||
| NASDAQ Composite | 100.00 | 99.21 | 116.82 | 163.75 | 188.03 | 201.40 | ||||||||||||||||||
| SNL Bank $1B-$5B | 100.00 | 91.20 | 112.45 | 163.52 | 170.98 | 191.39 | ||||||||||||||||||
ISSUER PURCHASES OF EQUITY SECURITIES
The Board of Directors approved a stock repurchase program on March 27, 2006 which authorized the repurchase of 309,000 shares. No shares were purchased during the year ended December 31, 2015. The total number of shares purchased as part of the publicly announced plan totaled 141,959 as of December 31, 2015. The maximum number of remaining shares that may be purchased under the plan totals 167,041 as of December 31, 2015. There is no expiration date for the stock repurchase plan. There is no stock repurchase plan that has expired or that has been terminated during the period ended December 31, 2015.
| Page -14- |
Item 6. Selected Financial Data
Five-Year Summary of Operations
(In thousands, except per share data and financial ratios)
Set forth below are selected consolidated financial and other data of the Company. The Company’s business is primarily the business of the Bank. This financial data is derived in part from, and should be read in conjunction with, the Consolidated Financial Statements of the Company.
| December 31, | 2015 | 2014 | 2013 | 2012 | 2011 | |||||||||||||||
| Selected Financial Data: | ||||||||||||||||||||
| Securities available for sale | $ | 800,203 | $ | 587,184 | $ | 575,179 | $ | 529,070 | $ | 441,439 | ||||||||||
| Securities, restricted | 24,788 | 10,037 | 7,034 | 2,978 | 1,660 | |||||||||||||||
| Securities held to maturity | 208,351 | 214,927 | 201,328 | 210,735 | 169,153 | |||||||||||||||
| Loans held for sale | — | — | — | — | 2,300 | |||||||||||||||
| Loans held for investment | 2,410,774 | 1,338,327 | 1,013,263 | 798,446 | 612,143 | |||||||||||||||
| Total assets | 3,781,959 | 2,288,524 | 1,896,612 | 1,624,574 | 1,337,345 | |||||||||||||||
| Total deposits | 2,843,625 | 1,833,779 | 1,539,079 | 1,409,322 | 1,188,185 | |||||||||||||||
| Total stockholders’ equity | 341,128 | 175,118 | 159,460 | 118,672 | 106,987 | |||||||||||||||
| Years Ended December 31, | ||||||||||||||||||||
| Selected Operating Data: | ||||||||||||||||||||
| Total interest income | $ | 106,240 | $ | 74,910 | $ | 58,430 | $ | 54,514 | $ | 50,426 | ||||||||||
| Total interest expense | 10,129 | 7,460 | 7,272 | 7,555 | 7,616 | |||||||||||||||
| Net interest income | 96,111 | 67,450 | 51,158 | 46,959 | 42,810 | |||||||||||||||
| Provision for loan losses | 4,000 | 2,200 | 2,350 | 5,000 | 3,900 | |||||||||||||||
| Net interest income after provision for loan losses | 92,111 | 65,250 | 48,808 | 41,959 | 38,910 | |||||||||||||||
| Total non-interest income | 12,668 | 8,166 | 8,891 | 10,673 | 6,949 | |||||||||||||||
| Total non-interest expense | 72,890 | 52,414 | 37,937 | 33,780 | 30,837 | |||||||||||||||
| Income before income taxes | 31,889 | 21,002 | 19,762 | 18,852 | 15,022 | |||||||||||||||
| Income tax expense | 10,778 | 7,239 | 6,669 | 6,080 | 4,663 | |||||||||||||||
| Net income(1)(2)(3)(4) | $ | 21,111 | $ | 13,763 | $ | 13,093 | $ | 12,772 | $ | 10,359 | ||||||||||
| December 31, | ||||||||||||||||||||
| Selected Financial Ratios and Other Data: | ||||||||||||||||||||
| Return on average equity(1)(2)(3)(4) | 7.91 | % | 7.76 | % | 9.89 | % | 11.78 | % | 14.37 | % | ||||||||||
| Return on average assets(1)(2)(3)(4) | 0.71 | % | 0.64 | % | 0.77 | % | 0.88 | % | 0.88 | % | ||||||||||
| Average equity to average assets | 9.01 | % | 8.27 | % | 7.80 | % | 7.49 | % | 6.11 | % | ||||||||||
| Dividend payout ratio (5)(6) | 63.55 | % | 77.43 | % | 51.58 | % | 77.50 | % | 44.35 | % | ||||||||||
| Basic earnings per share(1)(2)(3)(4) | $ | 1.43 | $ | 1.18 | $ | 1.36 | $ | 1.48 | $ | 1.54 | ||||||||||
| Diluted earnings per share(1)(2)(3)(4) | $ | 1.43 | $ | 1.18 | $ | 1.36 | $ | 1.48 | $ | 1.54 | ||||||||||
| Cash dividends declared per common share (5)(6) | $ | 0.92 | $ | 0.92 | $ | 0.69 | $ | 1.15 | $ | 0.69 | ||||||||||
| (1) | 2015 amount includes $6.3 of acquisition costs, net of income taxes, associated with the CNB acquisition. |
| (2) | 2014 amount includes $3.8 million of acquisition costs associated with the FNBNY and CNB acquisitions and branch restructuring costs, net of income taxes |
| (3) | 2013 amount includes $0.4 million of acquisition costs, net of income taxes, associated with the FNBNY acquisition. |
| (4) | 2011 amount includes $0.5 million of acquisition costs, net of income taxes, associated with the HSB acquisition. |
| (5) | The dividend payout ratio and cash dividends declared per common share for 2012 includes five declared quarterly dividends. |
| (6) | The dividend payout ratio and cash dividends declared per common share for 2013 and 2011 includes three declared quarterly dividends. |
| Page -15- |
Item 7. Management’s Discussion and Analysis of Financial Condition and Results of Operations
PRIVATE SECURITIES LITIGATION REFORM ACT SAFE HARBOR STATEMENT
This report may contain statements relating to the future results of the Company (including certain projections and business trends) that are considered “forward-looking statements” as defined in the Private Securities Litigation Reform Act of 1995 (the “PSLRA”). Such forward-looking statements, in addition to historical information, which involve risk and uncertainties, are based on the beliefs, assumptions and expectations of management of the Company. Words such as “expects,” “believes,” “should,” “plans,” “anticipates,” “will,” “potential,” “could,” “intend,” “may,” “outlook,” “predict,” “project,” “would,” “estimated,” “assumes,” “likely,” and variation of such similar expressions are intended to identify such forward-looking statements. Examples of forward-looking statements include, but are not limited to, possible or assumed estimates with respect to the financial condition, expected or anticipated revenue, and results of operations and business of the Company, including earnings growth; revenue growth in retail banking lending and other areas; origination volume in the consumer, commercial and other lending businesses; current and future capital management programs; non-interest income levels, including fees from the title abstract subsidiary and banking services as well as product sales; tangible capital generation; market share; expense levels; and other business operations and strategies.
Factors that could cause future results to vary from current management expectations include, but are not limited to, changing economic conditions; legislative and regulatory changes, including increases in FDIC insurance rates; monetary and fiscal policies of the federal government; changes in tax policies; rates and regulations of federal, state and local tax authorities; changes in interest rates; deposit flows; the cost of funds; demands for loan products; demand for financial services; competition; our ability to successfully integrate acquired entities; changes in the quality and composition of the Bank’s loan and investment portfolios; changes in management’s business strategies; changes in accounting principles, policies or guidelines, changes in real estate values; expanded regulatory requirements as a result of the Dodd-Frank Act, which could adversely affect operating results; and other factors discussed elsewhere in this report including factors set forth under Item 1A., Risk Factors, and in quarterly and other reports filed by the Company with the Securities and Exchange Commission. The forward-looking statements are made as of the date of this report, and the Company assumes no obligation to update the forward-looking statements or to update the reasons why actual results could differ from those projected in the forward-looking statements.
OVERVIEW
Who We Are and How We Generate Income
Bridge Bancorp, Inc., a New York corporation, is a bank holding company formed in 1989. On a parent-only basis, the Company has had minimal results of operations. The Company is dependent on dividends from its wholly owned subsidiary, The Bridgehampton National Bank (“the Bank”), its own earnings, additional capital raised, and borrowings as sources of funds. The information in this report reflects principally the financial condition and results of operations of the Bank. The Bank’s results of operations are primarily dependent on its net interest income, which is mainly the difference between interest income on loans and investments and interest expense on deposits and borrowings. The Bank also generates non-interest income, such as fee income on deposit accounts and merchant credit and debit card processing programs, investment services, income from its title abstract subsidiary, and net gains on sales of securities and loans. The level of its non-interest expenses, such as salaries and benefits, occupancy and equipment costs, other general and administrative expenses, expenses from its title insurance subsidiary, and income tax expense, further affects the Bank’s net income. Certain reclassifications have been made to prior year amounts and the related discussion and analysis to conform to the current year presentation. These reclassifications did not have an impact on net income or total stockholders’ equity.
Year and Quarterly Highlights
| • | Net income of $8.0 million and $0.46 per diluted share for the fourth quarter 2015 compared to $4.2 million and $0.36 per diluted share for the fourth quarter 2014. Net income for 2015 was $21.1 million and $1.43 per diluted share, compared to $13.8 million and $1.18 per diluted share in 2014. |
| • | Returns on average assets and equity for 2015 were 0.71% and 7.91%, respectively. |
| • | Net interest income increased to $96.1 million for 2015 compared to $67.5 million in 2014. |
| • | Net interest margin was 3.57% for 2015 and 3.41% for 2014. |
| • | Total assets of $3.8 billion at December 31, 2015, an increase of $1.5 billion or 65.3% over the same date last year. |
| • | Total loans held for investment of $2.4 billion at December 31, 2015, an increase of 80.1% from December 31, 2014. |
| Page -16- |
| • | Total investment securities of $1.0 billion at December 31, 2015, an increase of 25.7% over December 31, 2014. |
| • | Total deposits of $2.8 billion at December 31, 2015, an increase of $1.0 billion or 55.1% over 2014 level. |
| • | Allowance for loan losses was 0.86% of loans as of December 31, 2015, compared to 1.32% at December 31, 2014. |
| • | Completed the acquisition of CNB in June 2015. |
| • | A cash dividend of $0.23 per share was declared in January 2016 and paid in February 2016. |
Significant Events
Issuance of sub debt
In September 2015, the Company issued $80.0 million in aggregate principal amount of fixed-to-floating rate subordinated debentures (the “Notes”). $40.0 million of the Notes are callable at par after five years, have a stated maturity of September 30, 2025 and bear interest at a fixed annual rate of 5.25% per year, from and including September 21, 2015 until but excluding September 30, 2020. From and including September 30, 2020 to the maturity date or early redemption date, the interest rate will reset quarterly to an annual interest rate equal to the then-current three-month LIBOR plus 360 basis points. The remaining $40.0 million of the Notes are callable at par after ten years, have a stated maturity of September 30, 2030 and bear interest at a fixed annual rate of 5.75% per year, from and including September 21, 2015 until but excluding September 30, 2025. From and including September 30, 2025 to the maturity date or early redemption date, the interest rate will reset quarterly to an annual interest rate equal to the then-current three-month LIBOR plus 345 basis points.
The Notes are included in Tier 2 capital (with certain limitations applicable) under current regulatory guidelines and interpretations.
Acquisition of Community National Bank
On June 19, 2015, the Company acquired Community National Bank (“CNB”) at a purchase price of $157.5 million, issued an aggregate of 5.647 million Bridge Bancorp common shares in exchange for all the issued and outstanding common stock of CNB and recorded goodwill of $89.0 million, which is not deductible for tax purposes. At acquisition, CNB had total acquired assets on a fair value basis of $899.9 million, with loans of $734.0 million, investment securities of $90.1 million and deposits of $786.9 million. The transaction expanded the Company’s geographic footprint across Long Island including Nassau County, Queens and into New York City. It complements the Bank’s existing branch network and enhances asset generation capabilities. The expanded branch network allows the Bank to serve a greater portion of the Long Island and metropolitan marketplace through a network of 40 branches.
Acquisition of FNBNY
On February 14, 2014, the Company acquired FNBNY Bancorp and its wholly owned subsidiary, the First National Bank of New York (collectively “FNBNY”) at a purchase price of $6.1 million and issued an aggregate of 240,598 Company shares in exchange for all the issued and outstanding stock of FNBNY. The purchase price was subject to certain post-closing adjustments equal to 60 percent of the net recoveries on $6.3 million of certain identified problem loans over a two-year period after the acquisition. As of February 14, 2016, a net recovery of $0.4 million was realized and $0.3 million has been distributed to the former FNBNY shareholders. At acquisition, FNBNY had total acquired assets on a fair value basis of $211.9 million, with loans of $89.7 million, investment securities of $103.2 million and deposits of $169.9 million. With three full-service branches, including the Company’s first two branches in Nassau County located in Merrick and Massapequa, and one in western Suffolk County located in Melville, the transaction expanded our geographic footprint into Nassau County, complemented our existing branch network and enhanced our asset generation capabilities. The expanded branch network allowed the Company to serve a greater portion of the Long Island and metropolitan marketplace.
Current Regulatory Environment
The Bank continues to operate in a highly regulated environment with many new regulations issued and remaining to be issued under the Dodd-Frank Wall Street Reform and Consumer Protection Act (“Dodd-Frank Act”) enacted on July 21, 2010. The Act permanently raised the current standard maximum deposit insurance amount to $250,000. Section 331(b) of the Dodd-Frank Act required the FDIC to change the definition of the assessment base from which assessment fees are determined. The new definition for the assessment base is the average consolidated total assets of the insured depository institution less the average tangible equity of the insured depository institution. The financial reform legislation, among other things, created a new Consumer Financial Protection Bureau, tightened capital standards and resulted in new regulations that are expected to increase the cost of operations.
Additionally, the Federal Deposit Insurance Corporation and the other federal bank regulatory agencies issued a final rule In July 2013 that revised their leverage and risk-based capital requirements and the method for calculating risk-weighted assets to make them consistent with agreements that were reached by the Basel Committee on Banking Supervision and certain provisions of the Dodd-Frank Act. Among other things, the rule established a new common equity Tier 1 minimum capital requirement (4.5% of risk-
| Page -17- |
weighted assets), increased the minimum Tier 1 capital to risk-based assets requirement (from 4% to 6% of risk-weighted assets) and assigned a higher risk weight (150%) to exposures that are more than 90 days past due or are on nonaccrual status and to certain commercial real estate facilities that finance the acquisition, development or construction of real property. The rule also requires unrealized gains and losses on certain “available-for-sale” securities holdings to be included for purposes of calculating regulatory capital unless a one-time opt-out is exercised. Additional constraints were also imposed on the inclusion in regulatory capital of mortgage-servicing assets, defined tax assets and minority interests. The rule limits a banking organization’s capital distributions and certain discretionary bonus payments if the banking organization does not hold a “capital conservation buffer” consisting of 2.5% of common equity Tier 1 capital to risk-weighted assets in addition to the amount necessary to meet its minimum risk-based capital requirements. The final rule became effective for the Bank on January 1, 2015. The capital conservation buffer requirement will be phased in beginning January 1, 2016 and ending January 1, 2019, when the full capital conservation buffer requirement will be effective. The final rules, while more favorable to community banks, require that all banks maintain higher levels of capital. The Bank’s current capital levels meet these new requirements.
In December 2015, the Federal Reserve increased the federal funds target rate 25 basis points. The Federal Open Market Committee (“FOMC”) anticipates maintaining the federal funds target rate at 25 to 50 basis points due to uncertain global economic conditions. In determining the timing and amount of future adjustments to the target rate, the Committee will assess labor market conditions, inflation and economic activity, as well as global market developments. The Committee continues its existing policy of reinvesting principal payments from its holdings of agency debt and agency mortgage-backed securities and rolling over maturing Treasury securities at auction and anticipates doing so until normalization of the level of the federal funds rate is well under way.
Growth and service strategies have the potential to offset the compression on net interest margin with volume as the customer base grows through expanding the Bank’s footprint, while maintaining and developing existing relationships. Since 2010, the Bank has opened ten new branches, including the most recent branch openings in September 2014 in Bay Shore, New York, November 2014 in Port Jefferson, New York and December 2014 in Smithtown, New York. Most of the recent branch openings move the Bank geographically westward and demonstrate its commitment to traditional growth through branch expansion. The Bank has also grown through acquisitions including the June 2015 acquisition of CNB, the February 2014 acquisition of FNBNY, and the May 2011 acquisition of Hampton State Bank. Management will continue to seek opportunities to expand its reach into other contiguous markets by network expansion, or through the addition of professionals with established customer relationships.
Challenges and Opportunities
As noted earlier, on June 19, 2015, the Company acquired CNB. This acquisition increases the Company’s scale and continues the westward expansion into new markets in Nassau County, Queens and Manhattan. Management recognizes the challenges associated acquisitions and leveraged the experience gained in the acquisitions of FNBNY in 2014 and Hamptons State Bank in 2011, to successfully integrate the operations of CNB.
Although the economy, real estate values and unemployment rates have improved, recent declines in the stock market and in oil prices indicate that economic uncertainty still exists. The Bank continues to face challenges associated with ever increasing regulations and the current historically low interest rate environment. Over time, additional rate increases should provide some relief to net interest margin compression as new loans are funded and securities are reinvested at higher rates. However, in the short term, the fair value of our available for sale securities declines when rates increase, resulting in net unrealized losses and a reduction in stockholders’ equity. Strategies for managing for the eventuality of higher rates have a cost. Extending liability maturities or shortening the tenor of assets increases interest expense and reduces interest income. An additional method for managing in a higher rate environment is to grow stable core deposits, requiring continued investment in people, technology and branches. Over time, the costs of these strategies should provide long term benefits.
The key to delivering on the Company’s mission is combining its expanding branch network, improving technology, and experienced professionals with the critical element of local decision making. The successful expansion of the franchise’s geographic reach continues to deliver the desired results: increasing core deposits and loans, and generating higher levels of revenue and income.
Corporate objectives for 2016 include: leveraging our expanding branch network to build customer relationships and grow loans and deposits; focusing on opportunities and processes that continue to enhance the customer experience at the Bank; improving operational efficiencies and prudent management of non-interest expense; and maximizing non-interest income through Bridge Abstract as well as other lines of business. Management believes there remain opportunities to grow its franchise and that continued investments to generate core funding, quality loans and new sources of revenue remain keys to continue creating long term shareholder value. The ability to attract, retain, train and cultivate employees at all levels of the Company remains significant to meeting corporate objectives. The Company has made great progress toward the achievement of these objectives, and avoided many of the problems facing other financial institutions as a result of maintaining discipline in its underwriting, expansion strategies, investing and general business practices. The Company has capitalized on opportunities presented by the market and diligently seeks opportunities for growth and to strengthen the franchise. The Company recognizes the potential risks of the current economic environment and will monitor the impact of market events as we consider growth initiatives and evaluate loans and investments.
| Page -18- |
Management and the Board have built a solid foundation for growth and the Company is positioned to adapt to anticipated changes in the industry resulting from new regulations and legislative initiatives.
CRITICAL ACCOUNTING POLICIES
Note 1 of our Notes to Consolidated Financial Statements for the year ended December 31, 2015 contains a summary of our significant accounting policies. Various elements of our accounting policies, by their nature, are inherently subject to estimation techniques, valuation assumptions and other subjective assessments. Our policy with respect to the methodologies used to determine the allowance for loan losses is our most critical accounting policy. This policy is important to the presentation of our financial condition and results of operations, and it involves a higher degree of complexity and requires management to make difficult and subjective judgments, which often require assumptions or estimates about highly uncertain matters. The use of different judgments, assumptions and estimates could result in material differences in our results of operations or financial condition.
The following is a description of our critical accounting policy and an explanation of the methods and assumptions underlying its application.
ALLOWANCE FOR LOAN LOSSES
Management considers the accounting policy on the allowance for loan losses to be the most critical and requires complex management judgment as discussed below. The judgments made regarding the allowance for loan losses can have a material effect on the results of operations of the Company.
The allowance for loan losses is established and maintained through a provision for loan losses based on probable incurred losses inherent in the Bank’s loan portfolio. Management evaluates the adequacy of the allowance on a quarterly basis. The allowance is comprised of both individual valuation allowances and loan pool valuation allowances. If the allowance for loan losses is not sufficient to cover actual loan losses, the Company’s earnings could decrease. The Bank monitors its entire loan portfolio on a regular basis, with consideration given to detailed analysis of classified loans, repayment patterns, probable incurred losses, past loss experience, current economic conditions, and various types of concentrations of credit. Additions to the allowance are charged to expense and realized losses, net of recoveries, are charged to the allowance.
Individual valuation allowances are established in connection with specific loan reviews and the asset classification process including the procedures for impairment testing under FASB Accounting Standard Codification (“ASC”) No. 310, “Receivables”. Such valuation, which includes a review of loans for which full collectibility in accordance with contractual terms is not reasonably assured, considers the estimated fair value of the underlying collateral less the costs to sell, if any, or the present value of expected future cash flows, or the loan’s observable market value. Any shortfall that exists from this analysis results in a specific allowance for the loan. Pursuant to our policy, loan losses must be charged-off in the period the loans, or portions thereof, are deemed uncollectible. Assumptions and judgments by management, in conjunction with outside sources, are used to determine whether full collectibility of a loan is not reasonably assured. These assumptions and judgments are also used to determine the estimates of the fair value of the underlying collateral or the present value of expected future cash flows or the loan’s observable market value. Individual loan analyses are periodically performed on specific loans considered impaired. For collateral dependent impaired loans, appraisals are performed by certified general appraisers (for commercial properties) or certified residential appraisers (for residential properties) whose qualifications and licenses have been reviewed and verified by the Company. Once received, the Credit Administration department reviews the assumptions and approaches utilized in the appraisal as well as the overall resulting fair value in comparison with independent data sources, such as recent market data or industry-wide statistics. On a quarterly basis, the Company compares the actual selling price of collateral that has been sold, based on these independent sources, as well as recent appraisals associated with current loan origination activity, to the most recent appraised value to determine if additional adjustments should be made to the appraisal value to arrive at fair value. Adjustments to fair value are made only when the analysis indicates a probable decline in collateral values. Individual valuation allowances could differ materially as a result of changes in these assumptions and judgments. Individual loan analyses are periodically performed on specific loans considered impaired. The results of the individual valuation allowances are aggregated and included in the overall allowance for loan losses.
Loan pool valuation allowances represent loss allowances that have been established to recognize the inherent risks associated with our lending activities, but which, unlike individual allowances, have not been allocated to particular problem assets. Pool evaluations are broken down into loans with homogenous characteristics by loan type and include commercial real estate mortgages, owner and non-owner occupied; multi-family mortgages; residential real estate mortgages, first lien and home equity; commercial loans, secured and unsecured; installment/consumer loans; and real estate construction and land loans. The determination of the adequacy of the valuation allowance is a process that takes into consideration a variety of factors. The Bank has developed a range of valuation allowances necessary to adequately provide for probable incurred losses inherent in each pool of loans. We consider our own charge-off history along with the growth in the portfolio as well as the Bank’s credit administration and asset management philosophies and procedures, and concentrations in the portfolio when determining the allowances for each pool. In addition, we evaluate and consider the credit’s risk rating which includes management’s evaluation of: cash flow, collateral and trends in current values, guarantor support, financial disclosures, industry trends and strength of borrowers’ management, the impact that economic and market
| Page -19- |
conditions may have on the portfolio as well as known and inherent risks in the portfolio. Finally, we evaluate and consider the allowance ratios and coverage percentages of both peer group and regulatory agency data. These evaluations are inherently subjective because, even though they are based on objective data, it is management’s interpretation of that data that determines the amount of the appropriate allowance. If the evaluations prove to be incorrect, the allowance for loan losses may not be sufficient to cover losses inherent in the loan portfolio, resulting in additions to the allowance for loan losses.
The Credit Risk Management Committee is comprised of Bank management. The adequacy of the allowance is analyzed quarterly, with any adjustment to a level deemed appropriate by the Credit Risk Management Committee, based on its risk assessment of the entire portfolio. Each quarter, members of the Credit Risk Management Committee meet with the Credit Risk Committee of the Board to review credit risk trends and the adequacy of the allowance for loan losses. Based on the Credit Risk Management Committee’s review of the classified loans and the overall allowance levels as they relate to the loan portfolio at December 31, 2015 and 2014, management believes the allowance for loan losses has been established at levels sufficient to cover the probable incurred losses in the Bank’s loan portfolio. Future additions or reductions to the allowance may be necessary based on changes in economic, market or other conditions. Changes in estimates could result in a material change in the allowance. In addition, various regulatory agencies, as an integral part of the examination process, periodically review the allowance for loan losses. Such agencies may require the Bank to recognize adjustments to the allowance based on their judgments of the information available to them at the time of their examination.
For additional information regarding our allowance for loan losses, see Note 3 of the Notes to the Consolidated Financial Statements.
NET INCOME
Net income for 2015 totaled $21.1 million or $1.43 per diluted share while net income for 2014 totaled $13.8 million or $1.18 per diluted share, as compared to net income of $13.1 million, or $1.36 per diluted share for the year ended December 31, 2013. Net income increased $7.3 million or 53.4% in 2015 compared to 2014 and net income for 2014 increased $0.7 million or 5.1% as compared to 2013. Significant trends for 2015 include: (i) a $28.7 million or 42.5% increase in net interest income; (ii) a $1.8 million increase in the provision for loan losses; (iii) a $4.5 million or 55.1% increase in total non-interest income compared to 2014; and (iv) a $20.5 million or 39.1% increase in total non-interest expenses including $9.8 million of costs associated with the acquisition of CNB that closed on June 19, 2015. The effective income tax rate was 33.8% for 2015 compared to 34.5% for 2014.
NET INTEREST INCOME
Net interest income, the primary contributor to earnings, represents the difference between income on interest earning assets and expenses on interest bearing liabilities. Net interest income depends upon the volume of interest earning assets and interest bearing liabilities and the interest rates earned or paid on them.
The following table sets forth certain information relating to the Company’s average consolidated balance sheets and its consolidated statements of income for the years indicated and reflect the average yield on assets and average cost of liabilities for the years indicated. Such yields and costs are derived by dividing income or expense by the average balance of assets or liabilities, respectively, for the years shown. Average balances are derived from daily average balances and include nonaccrual loans. The yields and costs include fees, which are considered adjustments to yields. Interest on nonaccrual loans has been included only to the extent reflected in the consolidated statements of income. For purposes of this table, the average balances for investments in debt and equity securities exclude unrealized appreciation/depreciation due to the application of FASB ASC 320, “Investments - Debt and Equity Securities.”
| Page -20- |
| Years Ended December 31, | 2015 | 2014 | 2013 | |||||||||||||||||||||||||||||||||
| (Dollars in thousands) | Average Balance | Interest | Average Yield/ Cost | Average Balance | Interest | Average Yield/ Cost | Average Balance | Interest | Average Yield/ Cost | |||||||||||||||||||||||||||
| Interest earning assets: | ||||||||||||||||||||||||||||||||||||
| Loans, net (1)(2) | $ | 1,876,934 | $ | 89,204 | 4.75 | % | $ | 1,176,715 | $ | 57,637 | 4.90 | % | $ | 883,511 | $ | 45,257 | 5.12 | % | ||||||||||||||||||
| Mortgage-backed, CMOs and other asset-back securities | 562,553 | 11,173 | 1.99 | 512,929 | 10,644 | 2.08 | 395,402 | 6,956 | 1.76 | |||||||||||||||||||||||||||
| Tax exempt securities (2) | 73,796 | 2,590 | 3.51 | 86,795 | 2,925 | 3.37 | 112,393 | 3,355 | 2.99 | |||||||||||||||||||||||||||
| Taxable securities | 197,363 | 4,574 | 2.32 | 222,018 | 4,702 | 2.12 | 213,368 | 4,012 | 1.88 | |||||||||||||||||||||||||||
| Federal funds sold | 8 | — | — | — | — | — | — | — | — | |||||||||||||||||||||||||||
| Deposits with banks | 18,614 | 47 | 0.25 | 12,423 | 32 | 0.26 | 9,773 | 28 | 0.29 | |||||||||||||||||||||||||||
| Total interest earning assets | 2,729,268 | 107,588 | 3.94 | 2,010,880 | 75,940 | 3.78 | 1,614,447 | 59,608 | 3.69 | |||||||||||||||||||||||||||
| Non interest earning assets: | ||||||||||||||||||||||||||||||||||||
| Cash and due from banks | 55,570 | 40,728 | 33,417 | |||||||||||||||||||||||||||||||||
| Other assets | 179,205 | 93,405 | 49,398 | |||||||||||||||||||||||||||||||||
| Total assets | $ | 2,964,043 | $ | 2,145,013 | $ | 1,697,262 | ||||||||||||||||||||||||||||||
| Interest bearing liabilities: | ||||||||||||||||||||||||||||||||||||
| Savings, NOW and money market deposits | $ | 1,289,678 | $ | 4,002 | 0.31 | % | $ | 996,315 | $ | 3,223 | 0.32 | % | $ | 827,464 | $ | 3,543 | 0.43 | % | ||||||||||||||||||
| Certificates of deposit of $100,000 or more | 134,211 | 929 | 0.69 | 94,599 | 767 | 0.81 | 99,899 | 1,079 | 1.08 | |||||||||||||||||||||||||||
| Other time deposits | 96,617 | 673 | 0.70 | 59,321 | 426 | 0.72 | 38,462 | 340 | 0.88 | |||||||||||||||||||||||||||
| Federal funds purchased and repurchase agreements | 115,648 | 474 | 0.41 | 81,768 | 588 | 0.72 | 59,747 | 505 | 0.85 | |||||||||||||||||||||||||||
| Federal Home Loan Bank term advances | 127,358 | 1,425 | 1.12 | 125,949 | 1,091 | 0.87 | 41,113 | 440 | 1.07 | |||||||||||||||||||||||||||
| Subordinated debentures | 21,911 | 1,261 | 5.76 | — | — | — | — | — | — | |||||||||||||||||||||||||||
| Junior subordinated debentures | 15,875 | 1,365 | 8.60 | 15,870 | 1,365 | 8.60 | 15,864 | 1,365 | 8.60 | |||||||||||||||||||||||||||
| Total interest bearing liabilities | 1,801,298 | 10,129 | 0.56 | 1,373,822 | 7,460 | 0.54 | 1,082,549 | 7,272 | 0.67 | |||||||||||||||||||||||||||
| Non-interest bearing liabilities: | ||||||||||||||||||||||||||||||||||||
| Demand deposits | 873,794 | 578,936 | 474,367 | |||||||||||||||||||||||||||||||||
| Other liabilities | 21,936 | 14,714 | 7,994 | |||||||||||||||||||||||||||||||||
| Total liabilities | 2,697,028 | 1,967,472 | 1,564,910 | |||||||||||||||||||||||||||||||||
| Stockholders’ equity | 267,015 | 177,409 | 132,352 | |||||||||||||||||||||||||||||||||
| Total liabilities and stockholders’ equity | $ | 2,964,043 | $ | 2,144,881 | $ | 1,697,262 | ||||||||||||||||||||||||||||||
| Net interest income/interest rate spread (3) | 97,459 | 3.38 | % | 68,480 | 3.24 | % | 52,336 | 3.02 | % | |||||||||||||||||||||||||||
| Net interest earning assets/net interest margin (4) | $ | 927,970 | 3.57 | % | $ | 637,058 | 3.41 | % | $ | 531,898 | 3.24 | % | ||||||||||||||||||||||||
| Ratio of interest earning assets to interest bearing liabilities | 151.52 | % | 146.37 | % | 149.13 | % | ||||||||||||||||||||||||||||||
| Less: Tax equivalent adjustment | (1,348 | ) | (1,030 | ) | (1,178 | ) | ||||||||||||||||||||||||||||||
| Net interest income | $ | 96,111 | $ | 67,450 | $ | 51,158 | ||||||||||||||||||||||||||||||
| (1) | Amounts are net of deferred origination costs/(fees) and the allowance for loan loss, and include loans held for sale. |
| (2) | The above table is presented on a tax equivalent basis. |
| (3) | Net interest rate spread represents the difference between the yield on average interest earning assets and the cost of average interest bearing liabilities. |
| (4) | Net interest margin represents net interest income divided by average interest earning assets. |
| Page -21- |
RATE/VOLUME ANALYSIS
Net interest income can be analyzed in terms of the impact of changes in rates and volumes. The following table illustrates the extent to which changes in interest rates and in the volume of average interest earning assets and interest bearing liabilities have affected the Bank’s interest income and interest expense during the periods indicated. Information is provided in each category with respect to (i) changes attributable to changes in volume (changes in volume multiplied by prior rate); (ii) changes attributable to changes in rates (changes in rates multiplied by prior volume); and (iii) the net changes. For purposes of this table, changes that are not due solely to volume or rate changes have been allocated to these categories based on the respective percentage changes in average volume and rate. Due to the numerous simultaneous volume and rate changes during the periods analyzed, it is not possible to precisely allocate changes between volume and rates. In addition, average earning assets include nonaccrual loans.
| Years Ended December 31, | 2015 Over 2014 Changes Due To | 2014 Over 2013 Changes Due To | ||||||||||||||||||||||
| (In thousands) | Volume | Rate | Net Change | Volume | Rate | Net Change | ||||||||||||||||||
| Interest income on interest earning assets: | ||||||||||||||||||||||||
| Loans (1) (2) | $ | 33,380 | $ | (1,813 | ) | $ | 31,567 | $ | 14,403 | $ | (2,023 | ) | $ | 12,380 | ||||||||||
| Mortgage-backed, CMOs and other asset-backed securities | 1,004 | (475 | ) | 529 | 2,288 | 1,400 | 3,688 | |||||||||||||||||
| Tax exempt securities (2) | (453 | ) | 118 | (335 | ) | (824 | ) | 394 | (430 | ) | ||||||||||||||
| Taxable securities | (549 | ) | 421 | (128 | ) | 166 | 524 | 690 | ||||||||||||||||
| Deposits with banks | 16 | (1 | ) | 15 | 7 | (3 | ) | 4 | ||||||||||||||||
| Total interest earning assets | 33,398 | (1,750 | ) | 31,648 | 16,040 | 292 | 16,332 | |||||||||||||||||
| Interest expense on interest bearing liabilities: | ||||||||||||||||||||||||
| Savings, NOW and money market deposits | 884 | (105 | ) | 779 | 666 | (986 | ) | (320 | ) | |||||||||||||||
| Certificates of deposit of $100,000 or more | 462 | (300 | ) | 162 | (93 | ) | (219 | ) | (312 | ) | ||||||||||||||
| Other time deposits | 259 | (12 | ) | 247 | 157 | (71 | ) | 86 | ||||||||||||||||
| Federal funds purchased and repurchase agreements | 193 | (307 | ) | (114 | ) | 168 | (85 | ) | 83 | |||||||||||||||
| Federal Home Loan Bank Advances | 13 | 321 | 334 | 753 | (102 | ) | 651 | |||||||||||||||||
| Subordinated debentures | 1,261 | — | 1,261 | — | — | — | ||||||||||||||||||
| Junior subordinated debentures | — | — | — | — | — | — | ||||||||||||||||||
| Total interest bearing liabilities | 3,072 | (403 | ) | 2,669 | 1,651 | (1,463 | ) | 188 | ||||||||||||||||
| Net interest income | $ | 30,326 | $ | (1,347 | ) | $ | 28,979 | $ | 14,389 | $ | 1,755 | $ | 16,144 | |||||||||||
| (1) | Amounts are net of deferred origination costs/(fees) and the allowance for loan loss, and include loans held for sale. |
| (2) | The above table is presented on a tax equivalent basis. |
The net interest margin increased to 3.57% in 2015 compared to 3.41% for the year ended December 31, 2014 and 3.24% in 2013. The increase in 2015 compared to 2014 and 2013 is primarily attributable to the positive impact of increased loan demand, higher deposit balances, higher yields on securities, and the positive impact of accretion of purchase accounting discounts. The total average interest earning assets in 2015 increased $718.4 million or 35.7% over 2014 levels, yielding 3.94% and the overall funding cost was 0.38%, including demand deposits. The yield on interest earning assets increased approximately 16 basis points while the cost of interest bearing liabilities increased approximately 2 basis points during 2015 compared to 2014 due to the borrowing costs related to the subordinated debentures. Average total deposits increased $664.1 million compared to 2014 and funded higher yielding average loans, which grew $700.2 million from the comparable 2014 levels.
Net interest income was $96.1 million in 2015 compared to $67.5 million in 2014 and $51.2 million in 2013. The increase in net interest income of $28.6 million or 42.4% as compared to 2014, and the increase in net interest income of $16.3 million or 31.9% in 2014 as compared to 2013, primarily resulted from the effect of the increase in the volume of average total interest earning assets and the decrease in the cost of average total interest bearing liabilities being greater than the effect of the increase in volume of average total interest bearing liabilities and the decrease in yield on average total interest earning assets.
Average total interest earning assets grew by $718.4 million or 35.7% to $2.7 billion in 2015 compared to $2.0 billion in 2014. During this period, the yield on average total interest earning assets increased to 3.94% from 3.78%. Average total interest earning assets grew by $396.4 million or 24.6% to $2.0 billion in 2014 compared to $1.6 billion in 2013. During this period, the yield on average total interest earning assets increased to 3.78% from 3.69%.
| Page -22- |
For the year ended December 31, 2015, average loans grew by $700.2 million or 59.5% to $1.88 billion as compared to $1.18 billion in 2014 and increased $293.2 million or 33.2% compared to $883.5 million in 2013. Real estate mortgage loans, multi-family loans and commercial loans primarily contributed to the growth. The Bank remains committed to growing loans with prudent underwriting, sensible pricing and limited credit and extension risk.
For the year ended December 31, 2015, average total investments increased by $12.0 million or 1.5% to $833.7 million as compared to $821.7 million in 2014 and increased $100.5 million or 14.0% as compared to $721.2 million in 2013. To position the balance sheet for the future and better manage capital, liquidity and interest rate risk, a portion of the available for sale investment securities portfolio was sold during 2015, 2014 and 2013 resulting in net losses of $0.008 million and $1.1 million in 2015 and 2014, respectively, and net gains of $2.6 million for 2013. There were no federal funds sold in 2015, 2014 and 2013.
Average total interest bearing liabilities were $1.80 billion in 2015 compared to $1.38 billion in 2014 and $1.08 billion in 2013. The Bank grew deposits in 2015 as a result of opening three new branches in the fourth quarter of 2014, building new relationships in existing markets and the CNB acquisition, which closed in June 2015, adding eleven additional branches to the existing branch network. The cost of interest bearing liabilities increased to 0.56% for 2015 compared to 0.54% for 2014 and 0.67% for 2013. During 2015, the Bank reduced interest rates on deposit products through prudent management of deposit pricing. The reduction in deposit rates was offset by higher long-term borrowing costs associated with $80.0 million in subordinated debentures issued in September 2015. Since the Company’s interest bearing liabilities generally reprice or mature more quickly than its interest earning assets, an increase in short term interest rates initially results in a decrease in net interest income. Additionally, the large percentages of deposits in money market accounts reprice at short term market rates, making the balance sheet more liability sensitive.
For the year ended December 31, 2015, average total deposits increased by $665.1 million or 38.5% to $2.40 billion as compared to average total deposits of $1.73 billion for the year ended December 31, 2014. Components of this increase include an increase in average demand deposits for 2015 of $294.9 million or 50.9% to $873.8 million as compared to $578.9 million in average demand deposits for 2014 which increased by $104.6 million or 22.0% from $474.4 million in average demand deposits for 2013. The average balances in savings, NOW and money market accounts increased $293.4 million or 29.4% to $1.29 billion for the year ended December 31, 2015 compared to $996.3 million for the same period last year and increased $168.9 million or 20.4% over the 2013 amount of $827.5 million. Average balances in certificates of deposit of $100,000 or more and other time deposits increased $76.9 million or 50.0% to $230.8 million for 2015 as compared to 2014 and increased $15.6 million or 11.3% in 2014 as compared to 2013. Average public fund deposits comprised 14.7% of total average deposits during 2015, 16.8% in 2014 and 17.1% in 2013. Average federal funds purchased and repurchase agreements together with average Federal Home Loan Bank term advances increased $35.3 million or 17.0% to $243.0 million for the year ended December 31, 2015 as compared to average balances for 2014 and increased $106.9 million or 106.0% to $207.7 million for the year ended December 31, 2014 as compared to average balances for the same period in 2013.
Total interest income increased to $106.2 million in 2015 from $74.9 million in 2014 and $58.4 million in 2013, an increase of 41.8% during 2015 from 2014 and a 28.2% increase during 2014 from 2013. The ratio of interest earning assets to interest bearing liabilities increased to 151.5% in 2015 as compared to 146.4% in 2014 and 149.1% in 2013. Interest income on loans increased $31.1 million in 2015 over 2014 and $12.4 million in 2014 over 2013 was primarily due to growth in the loan portfolio. The yield on average loans was 4.8% for 2015, 4.9% for 2014 and 5.1% for 2013.
Interest income on investments in asset-backed, tax exempt and taxable securities decreased $0.3 million or 1.5% in 2015 to $17.0 million from $17.3 million in 2014 and increased $4.1 million or 31.1% in 2014 from $17.3 million in 2013. Interest income on securities included net amortization of premiums on securities of $4.9 million in 2015 compared to $3.8 million in 2014 and $5.2 million in 2013. The tax adjusted average yield on total securities was 2.2% in 2015, 2.2% in 2014, and 2.0% in 2013.
Total interest expense increased to $10.1 million for 2015 as compared to $7.5 million and $7.3 million for 2014 and 2013, respectively. The increase in interest expense in 2015 is a result of the increase in average interest bearing liabilities. The cost of average interest bearing liabilities was 0.56% in 2015, 0.54% in 2014, and 0.67% in 2013.
Provision for Loan Losses
The Bank’s loan portfolio consists primarily of real estate loans secured by commercial and residential real estate properties located in the Bank’s principal lending areas of Nassau and Suffolk Counties that are located on Long Island. The interest rates charged by the Bank on loans are affected primarily by the demand for such loans, the supply of money available for lending purposes, the rates offered by its competitors, the Bank’s relationship with the customer, and the related credit risks of the transaction. These factors are affected by general and economic conditions including, but not limited to, monetary policies of the federal government, including the Federal Reserve Board, legislative policies and governmental budgetary matters.
Loans of approximately $26.9 million or 1.1% of total loans at December 31, 2015 were categorized as classified loans compared to $30.3 million or 2.3% at December 31, 2014 and $46.6 million or 4.6% at December 31, 2013. Classified loans include loans with credit quality indicators with the internally assigned grades of special mention, substandard and doubtful. These loans are categorized
| Page -23- |
as classified loans as management has information that indicates the borrower may not be able to comply with the present repayment terms. These loans are subject to increased management attention and their classification is reviewed at least quarterly. The declining trend in the levels of classified loans reflects the improving economic environment.
At December 31, 2015, approximately $14.4 million of these classified loans were commercial real estate (“CRE”) loans which were well secured with real estate as collateral. Of the $14.4 million of CRE loans, $13.3 million were current and $1.1 million were past due. In addition, all of the CRE loans have personal guarantees. At December 31, 2015, approximately $2.3 million of classified loans were residential real estate loans with $0.1 million current and $2.2 million past due. Commercial, financial, and agricultural loans represented $10.1 million with $9.6 million current and $0.5 million past due. There were no classified real estate construction and land loans.. The remaining $0.1 million in classified loans are consumer loans that are unsecured and current, have personal guarantees and demonstrate sufficient cash flow to pay the loans. Due to the structure and nature of the credits, we do not expect to sustain a material loss on these relationships.
CRE loans, including multi-family loans, represented $1.40 billion or 58.3% of the total loan portfolio at December 31, 2015 compared to $814.4 million or 61.0% at December 31, 2014 and $592.4 million or 58.6% at December 31, 2013. The Bank’s underwriting standards for CRE loans requires an evaluation of the cash flow of the property, the overall cash flow of the borrower and related guarantors as well as the value of the real estate securing the loan. In addition, the Bank’s underwriting standards for CRE loans are consistent with regulatory requirements with original loan to value ratios generally less than or equal to 75%. The Bank considers charge-off history, delinquency trends, cash flow analysis, and the impact of the local economy on commercial real estate values when evaluating the appropriate level of the allowance for loan losses.
As of December 31, 2015 and December 31, 2014, the Company had impaired loans as defined by FASB ASC No. 310, “Receivables” of $3.0 million and $6.2 million, respectively. For a loan to be considered impaired, management determines after review whether it is probable that the Bank will not be able to collect all amounts due according to the contractual terms of the loan agreement. Management applies its normal loan review procedures in making these judgments. Impaired loans include individually classified nonaccrual loans and troubled debt restructured (“TDR”) loans. For impaired loans, the Bank evaluates the impairment of the loan in accordance with FASB ASC 310-10-35-22. Impairment is determined based on the present value of expected future cash flows discounted at the loan’s effective interest rate. For loans that are collateral dependent, the fair value of the collateral less costs to sell is used to determine the fair value of the loan. The fair value of the collateral is determined based upon recent appraised values. The fair value of the collateral less costs to sell or present value of expected cash flows is compared to the carrying value to determine if any write-down or specific loan loss allowance allocation is required. These methods of fair value measurement for impaired loans are considered level 3 within the fair value hierarchy described in FASB ASC 820-10-50-5.
Nonaccrual loans increased $0.1 million to $1.3 million or 0.06% of total loans at December 31, 2015 from $1.2 million or 0.09% of total loans at December 31, 2014. Approximately $0.09 million of the nonaccrual loans at December 31, 2015 and $0.5 million at December 31, 2014, represent troubled debt restructured loans.
Net charge-offs were $0.9 million for the year ended December 31, 2015 compared to $0.6 million for the year ended December 31, 2014 and $0.8 million for the year ended December 31, 2013. The ratio of allowance for loan losses to nonaccrual loans was 1,537%, 1,466% and 419%, at December 31, 2015, 2014, and 2013, respectively.
Based on our continuing review of the overall loan portfolio, the current asset quality of the portfolio, the growth in the loan portfolio and the net charge-offs, a provision for loan losses of $4.0 million was recorded in 2015 as compared to $2.2 million in 2014 and $2.4 million in 2013. The allowance for loan losses increased to $20.7 million at December 31, 2015 as compared to $17.6 million at December 31, 2014 and $16.0 million at December 31, 2013. As a percentage of total loans, the allowance was 0.86%, 1.32% and 1.58% at December 31, 2015, 2014 and 2013, respectively. In accordance with current accounting guidance, the acquired CNB loans were recorded at fair value, effectively netting estimated future losses against the loan balances. Management continues to carefully monitor the loan portfolio as well as real estate trends in Nassau and Suffolk Counties.
| Page -24- |
The following table sets forth changes in the allowance for loan losses:
| December 31, | 2015 | 2014 | 2013 | 2012 | 2011 | |||||||||||||||
| (Dollars in thousands) | ||||||||||||||||||||
| Allowance for loan losses balance at beginning of period | $ | 17,637 | $ | 16,001 | $ | 14,439 | $ | 10,837 | $ | 8,497 | ||||||||||
| Charge-offs: | ||||||||||||||||||||
| Commercial real estate mortgage loans | 50 | 461 | — | — | — | |||||||||||||||
| Multi-family loans | — | — | — | — | — | |||||||||||||||
| Residential real estate mortgage loans | 249 | 257 | 420 | 1,210 | 259 | |||||||||||||||
| Commercial, financial and agricultural loans | 827 | 104 | 420 | 285 | 372 | |||||||||||||||
| Real estate construction and land loans | — | — | 23 | — | 864 | |||||||||||||||
| Installment/consumer loans | 2 | 2 | 53 | 15 | 186 | |||||||||||||||
| Total | 1,128 | 824 | 916 | 1,510 | 1,681 | |||||||||||||||
| Recoveries: | ||||||||||||||||||||
| Commercial real estate mortgage loans | — | — | — | — | — | |||||||||||||||
| Multi-family loans | — | — | — | — | — | |||||||||||||||
| Residential real estate mortgage loans | 79 | 170 | 34 | 7 | 6 | |||||||||||||||
| Commercial, financial and agricultural loans | 149 | 87 | 87 | 83 | 96 | |||||||||||||||
| Real estate construction and land loans | — | — | 2 | — | — | |||||||||||||||
| Installment/consumer loans | 7 | 3 | 5 | 22 | 19 | |||||||||||||||
| Total | 235 | 260 | 128 | 112 | 121 | |||||||||||||||
| Net charge-offs | (893 | ) | (564 | ) | (788 | ) | (1,398 | ) | (1,560 | ) | ||||||||||
| Provision for loan losses charged to operations | 4,000 | 2,200 | 2,350 | 5,000 | 3,900 | |||||||||||||||
| Balance at end of period | $ | 20,744 | $ | 17,637 | $ | 16,001 | $ | 14,439 | $ | 10,837 | ||||||||||
| Ratio of net charge-offs during period to average loans outstanding | (0.04 | )% | (0.04 | )% | (0.09 | )% | (0.21 | )% | (0.28 | )% | ||||||||||
Allocation of Allowance for Loan Losses
The following table sets forth the allocation of the total allowance for loan losses by loan type:
| Years Ended December 31, | 2015 | 2014 | 2013 | 2012 | 2011 | |||||||||||||||||||||||||||||||||||
| (Dollars in thousands) | Amount | Percentage of Loans to Total Loans | Amount | Percentage of Loans to Total Loans | Amount | Percentage of Loans to Total Loans | Amount | Percentage of Loans to Total Loans | Amount | Percentage of Loans to Total Loans | ||||||||||||||||||||||||||||||
| Commercial real estate mortgage loans | $ | 7,850 | 43.8 | % | $ | 6,994 | 44.5 | % | $ | 6,279 | 47.9 | % | $ | 4,445 | 41.7 | % | $ | 3,530 | 46.4 | % | ||||||||||||||||||||
| Multi-family loans | 4,208 | 14.6 | 2,670 | 16.4 | 1,597 | 10.6 | 1,239 | 8.3 | 395 | 3.5 | ||||||||||||||||||||||||||||||
| Residential real estate mortgage loans | 2,115 | 16.3 | 2,208 | 11.7 | 2,712 | 15.2 | 2,803 | 18.0 | 2,280 | 23.1 | ||||||||||||||||||||||||||||||
| Commercial, financial and agricultural loans | 5,405 | 20.8 | 4,526 | 21.8 | 4,006 | 20.7 | 4,349 | 24.7 | 2,895 | 19.0 | ||||||||||||||||||||||||||||||
| Real estate construction and land loans | 1,030 | 3.8 | 1,104 | 4.8 | 1,206 | 4.7 | 1,375 | 6.1 | 1,465 | 6.6 | ||||||||||||||||||||||||||||||
| Installment/consumer loans | 136 | 0.7 | 135 | 0.8 | 201 | 0.9 | 228 | 1.2 | 272 | 1.4 | ||||||||||||||||||||||||||||||
| Total | $ | 20,744 | 100.0 | % | $ | 17,637 | 100.0 | % | $ | 16,001 | 100.0 | % | $ | 14,439 | 100.0 | % | $ | 10,837 | 100.0 | % | ||||||||||||||||||||
Non-Interest Income
Total non-interest income increased by $4.5 million or 55.1% in 2015 to $12.7 million and decreased by $0.7 million or 8.2% in 2014 to $8.2 million as compared to $8.9 million in 2013. The increase in total non-interest income in 2015 compared to 2014 was primarily the result of a $1.1 million decrease in net securities losses recognized for 2015, a $2.2 million increase in other operating income and $0.5 million increases in both service charges on deposit accounts and fees for other customer services. The decrease in total non-interest income in 2014 compared to 2013 was primarily the result of a $1.7 million decrease in net securities gains recognized for 2014, partially offset by an increase of $0.8 million in other operating income and $0.2 million in fees for other customer services.
Net securities losses of $8,000 were recognized in 2015 compared to net securities losses of $1.1 million in 2014. The decrease in net securities losses was the result of selling a portion of the available for sale investment securities portfolio in 2014 to position the balance sheet for the future and better manage capital, liquidity and interest rate risk. Net securities gains of $0.7 million were recognized in 2013. Bridge Abstract, the Bank’s title insurance abstract subsidiary, generated title fee income of $1.9 million in 2015 and $1.7 million in 2014 and 2013. Service charges on deposit accounts for the year ended December 31, 2015 increased $0.5 million or 16.6% to $3.7 million compared to $3.2 million for the years ended December 31, 2014 and 2013. Fees for other customer services
| Page -25- |
increased $0.5 million or 17.0% to $3.3 million compared to $2.8 million in 2014 and increased $0.2 million or 6.3% to $3.5 million compared to $3.3 million in 2013.
Other operating income for the year ended December 31, 2015 increased $2.2 million to $3.8 million compared to $1.6 million in 2014 and $0.8 million in 2013. The increase in 2015 is attributed to $1.0 million in gain on sales of mortgages and SBA loans, loan swap fee income of $0.4 million, $0.6 million in BOLI income and $0.2 million of loan service fee income.
Non-Interest Expense
Total non-interest expense increased $20.5 million or 39.1% to $72.9 million in 2015 compared to $52.4 million over the same period in 2014 and increased $14.5 million or 38.2% in 2014 from $37.9 million in 2013. The primary components of these increases were higher salaries and employee benefits, occupancy and equipment, technology and communications, marketing and advertising, professional services, FDIC assessments, amortization of core deposit intangibles, and other operating expenses. Additionally, during 2015 costs of $9.8 million were incurred related to the CNB acquisition.
Salaries and benefits increased $7.9 million or 30.2% to $33.9 million in 2015 as compared to $26.0 million in 2014 and increased $4.5 million or 20.8% from $21.5 million as of December 31, 2013. The increases in salary and benefits reflect additional positions to support the Company’s expanding infrastructure primarily related to the acquisition of CNB, a larger loan portfolio, and the related employee benefit costs.
Occupancy and equipment increased $3.3 million or 43.5% to $11.0 million in 2015 compared to $7.7 million in 2014 and increased $2.3 million or 43.5% from $5.4 million in 2014 compared to 2013. Technology and communications increased $0.4 million or 13.4% to $3.6 million compared to $3.2 million in 2014 and increased $0.6 million or 22.4% in 2014 from $2.6 million in 2013. Marketing and advertising increased $0.7 million or 28.6% to $3.1 million in 2015 from $2.4 million in 2014 and increased $0.5 million or 30.4% from $1.9 million in 2013. Higher occupancy and equipment expense, technology and communications, and marketing and advertising expense in 2015 and 2014 relate to the Company’s increased branch network and expanding infrastructure. Professional services increased $0.8 million or 51.4% to $2.3 million in 2015 from $1.5 million in 2014 and increased $0.2 million or 14.7% in 2014 from $1.3 million in 2013. FDIC assessments increased $0.3 million to $1.6 million compared to $1.3 million and $0.9 million in 2014 and 2013 respectively. In 2015, the Company incurred costs of $9.8 million related to the acquisition of CNB. For 2014, the Company incurred costs of $5.5 million related to the FNBNY and CNB acquisitions and branch restructuring costs. The acquisition costs of $0.5 million in 2013 were related solely to the FNBNY acquisition. The Company recorded amortization of other intangible assets of $1.4 million in 2015 primarily related to the CNB and FNBNY acquisitions, $0.3 million related to the FNBNY acquisition in 2014 and $0.1 million in 2013 for the HSB acquisition. Other operating expenses increased $1.6 million or 36.5% to $6.1 million in 2015 compared to $4.5 million in 2014 and $3.8 million in 2013.
Income Tax Expense
Income tax expense for December 31, 2015 was $10.8 million representing an increase of $3.5 million from 2014. Income tax expense for December 31, 2014 was $7.2 million representing an increase of $0.5 million from 2013. The effective tax rate was 33.8% for the year ended December 31, 2015 compared to 34.5% for the year ended December 31, 2014. The decrease in the effective tax rate relates primarily to the tax benefit recognized as a result of the change in New York City tax rates. The increase in income tax expense reflects higher income before income taxes, a lower percentage of interest income from tax exempt securities and higher state taxes. The effective tax rate for the year ended December 31, 2013 was 33.8%.
FINANCIAL CONDITION
The assets of the Company totaled $3.78 billion at December 31, 2015, an increase of $1.49 billion or 65.3% from the previous year-end with growth funded by deposits, borrowings and capital. This increase reflects strong growth in new and existing markets as well as $899.9 million in acquired assets from CNB on June 19, 2015.
Cash and due from banks increased $34.6 million or 76.8% to $79.8 million compared to December 2014 levels and interest earning deposits with banks increased $18.2 million or 274.7%. Total securities increased $206.4 million or 25.7% to $1.0 billion and net loans increased $1.1 billion or 81% to $2.4 billion compared to December 2014 levels. The increase in net loans includes $734.0 million of CNB acquired loans. The ability to grow the investment and loan portfolios, while minimizing interest rate risk sensitivity and maintaining credit quality, remains a strong focus of management. At December 31, 2015, goodwill increased $89.0 million to $98.4 million due to the CNB acquisition. Other intangible assets increased $7.5 million to $8.4 million. The increase in other intangible assets includes a $5.1 million core deposit intangible and a $1.5 million non-compete intangible related to the CNB acquisition, as well as $0.9 million of mortgage servicing rights. Total deposits grew $1.0 billion to $2.84 billion at December 31, 2015 compared to $1.83 billion at December 2014 and included $786.9 million of CNB acquired deposits in addition to organic growth in all markets and included both new commercial and consumer relationships. Demand deposits increased $453.8 million to $1.2 billion as of December 31, 2015 compared to $703.1 million at December 31, 2014. Savings, NOW and money market deposits increased $404.6 million to $1.394 billion at December, 2015 from $989.3 million at December 31, 2014. Certificates of deposit of
| Page -26- |
$100,000 or more increased $84.7 million to $167.8 million at December 31, 2015 from $83.1 million at December 31, 2014. Other time deposits increased $66.8 million to $125.1 million as of December 31, 2015 from $58.3 at December 31, 2014.
Federal funds purchased at December 31, 2015 increased $45.0 million or 60.0% to $120.0 million compared to $75.0 million in 2014. Federal Home Loan Bank term advances increased $159.2 million or 115.1% to $297.5 million for December 31, 2015 compared to $138.3 million in 2014. Repurchase agreements increased $14.6 million to $50.9 million or 40.3% compared to $36.3 million as of December 31, 2014. Other liabilities and accrued expenses increased $20.4 million to $34.6 million as of December 31, 2015 from $14.2 million as of December 31, 2014.
Stockholders’ equity was $341.1 million at December 31, 2015, an increase of $166.0 million or 94.8% from December 31, 2014, reflecting primarily, the issuance of $157.2 million in common equity in connection with the CNB transaction, the proceeds from the issuance of shares of common stock under the Dividend Reinvestment Plan of $0.8 million, share based compensation of $1.7 million and net income of $21.1 million partially offset by $13.4 million in declared cash dividends, a decrease in other comprehensive income, net of deferred income taxes of $1.3 million. In December 2012, due to the likelihood of a change in the tax rates on dividends beginning in 2013, the Company decided to accelerate the timing of the payment of the Company’s fourth quarter dividend to shareholders of $0.23 per share into calendar year 2012 resulting in five dividend payments in 2012 compared to three dividend payments totaling $6.8 million in 2013.
Loans
During 2015, the Company continued to experience growth trends in commercial and residential real estate lending. The concentration of loans in our primary market areas may increase risk. Unlike larger banks that are more geographically diversified, the Bank’s loan portfolio consists primarily of real estate loans secured by commercial and residential real estate properties located in the Bank’s principal lending areas of Nassau and Suffolk Counties on Long Island. The bank’s portfolio also includes to a lesser extent loans on properties located in the New York City market. The local economic conditions on Long Island have a significant impact on the volume of loan originations and the quality of our loans, the ability of borrowers to repay these loans, and the value of collateral securing these loans. A considerable decline in the general economic conditions caused by inflation, recession, unemployment or other factors beyond the Company’s control would impact these local economic conditions and could negatively affect the financial results of the Company’s operations. Additionally, while the Company has a significant amount of commercial real estate loans, the majority of which are owner-occupied, decreases in tenant occupancy may also have a negative effect on the ability of borrowers to make timely repayments of their loans, which would have an adverse impact on the Company’s earnings.
The interest rates charged by the Bank on loans are affected primarily by the demand for such loans, the supply of money available for lending purposes, the rates offered by its competitors, the Bank’s relationship with the customer, and the related credit risks of the transaction. These factors are affected by general and economic conditions including, but not limited to, monetary policies of the federal government, including the Federal Reserve Board, legislative policies and governmental budgetary matters.
The Bank targets its business lending and marketing initiatives towards promotion of loans that primarily meet the needs of small to medium-sized businesses. These small to medium-sized businesses generally have fewer financial resources in terms of capital or borrowing capacity than larger entities. If general economic conditions negatively impact these businesses, the results of operations and financial condition may be adversely affected.
With respect to the underwriting of loans, there are certain risks, including the risk of non-payment that is associated with each type of loan that the Bank markets. Approximately 74.5% of the Bank’s loan portfolio at December 31, 2015 is secured by real estate. Approximately 43.7% of the Bank’s loan portfolio is comprised of commercial real estate loans. Multifamily loans represent 14.6% of the Bank’s loan portfolio. Residential real estate mortgage loans represent 16.3% of the Bank’s loan portfolio and include home equity lines of credit of approximately 2.8% and residential mortgages of approximately 13.5% of the Bank’s loan portfolio. Real estate construction and land loans comprise approximately 3.8% of the Bank’s loan portfolio. Risks associated with a concentration in real estate loans include potential losses from fluctuating values of land and improved properties. Home equity loans represent loans originated in the Bank’s geographic markets with original loan to value ratios generally of 75% or less. The Bank’s residential mortgage portfolio includes approximately $83.7 million in interest only mortgages. The underwriting standards for interest only mortgages are consistent with the remainder of the loan portfolio and do not include any features that result in negative amortization. The largest loan concentrations by industry are loans granted to lessors of commercial property both owner occupied and non-owner occupied. The Bank uses conservative underwriting criteria to better insulate itself from a downturn in real estate values and economic conditions on Long Island that could have a significant impact on the value of collateral securing the loans as well as the ability of customers to repay loans.
The remainder of the loan portfolio is comprised of commercial and consumer loans, which represent approximately 21.6% of the Bank’s loan portfolio. The commercial loans are made to businesses and include term loans, lines of credit, senior secured loans to corporations and taxi medallion loans. The primary risks associated with commercial loans are the cash flow of the business, the experience and quality of the borrowers’ management, the business climate, and the impact of economic factors. The primary risks associated with consumer loans relate to the borrower, such as the risk of a borrower’s unemployment as a result of deteriorating
| Page -27- |
economic conditions or the amount and nature of a borrower’s other existing indebtedness, and the value of the collateral securing the loan if the Bank must take possession of the collateral. Consumer loans also have risks associated with concentrations of specific types of consumer loans within the portfolio.
The Bank’s policy for charging off loans is a multi-step process. A loan is considered a potential charge-off when it is in default of either principal or interest for a period of 90, 120 or 180 days, depending upon the loan type, as of the end of the prior month. In addition to date criteria, other triggering events may include, but are not limited to, notice of bankruptcy by the borrower or guarantor, death of the borrower, and deficiency balance from the sale of collateral. These loans identified are presented for evaluation at the regular meeting of the Credit Risk Management Committee. A loan is charged off when a loss is reasonably assured. The recovery of charged-off balances is actively pursued until the potential for recovery has been exhausted, or until the expense of collection does not justify the recovery efforts.
Total loans grew $1.07 billion or 80.2%, during 2015 and $324.4 million or 32.1% during 2014. Average net loans grew $700.2 million or 59.5% during 2015 over 2014 and $293.2 million or 33.2% during 2014 when compared to 2013. Real estate mortgage loans were the largest contributor of the growth for both 2015 and 2014 and increased $826.5 million or 85.2% and $224.7 million or 30.1%, respectively. Commercial real estate mortgage loans grew $458.0 million or 76.9% during 2015 and multi-family mortgage loans grew $131.8 million or 60.2% during 2015. Commercial, financial and agricultural loans increased $210.0 million or 72.0% in 2015 from 2014 and increased $82.3 million or 39.3% in 2014 from 2013. Real estate construction and land loans increased $27.6 million or 43.4% in 2015 and increased $16.6 million or 35.3% in 2014. Installment/consumer loans increased $7.5 million or 73.8% in 2015 and increased $0.8 million or 9.0% during 2014. Fixed rate loans represented 25.1%, 32.5% and 33.9% of total loans at December 31, 2015, 2014, and 2013, respectively.
The following table sets forth the major classifications of loans:
| December 31, | 2015 | 2014 | 2013 | 2012 | 2011 | |||||||||||||||
| (In thousands) | ||||||||||||||||||||
| Commercial real estate mortgage loans | $ | 1,053,399 | $ | 595,397 | $ | 484,900 | $ | 332,782 | $ | 283,917 | ||||||||||
| Multi-family loans | 350,793 | 218,985 | 107,488 | 66,080 | 21,402 | |||||||||||||||
| Residential real estate mortgage loans | 392,815 | 156,156 | 153,417 | 143,703 | 141,027 | |||||||||||||||
| Commercial, financial and agricultural loans | 501,766 | 291,743 | 209,452 | 197,448 | 116,319 | |||||||||||||||
| Real estate construction and land loans | 91,153 | 63,556 | 46,981 | 48,632 | 40,543 | |||||||||||||||
| Installment/consumer loans | 17,596 | 10,124 | 9,287 | 9,167 | 8,565 | |||||||||||||||
| Total loans | 2,407,522 | 1,335,961 | 1,011,525 | 797,812 | 611,773 | |||||||||||||||
| Net deferred loan costs and fees | 3,252 | 2,366 | 1,738 | 634 | 370 | |||||||||||||||
| 2,410,774 | 1,338,327 | 1,013,263 | 798,446 | 612,143 | ||||||||||||||||
| Allowance for loan losses | (20,744 | ) | (17,637 | ) | (16,001 | ) | (14,439 | ) | (10,837 | ) | ||||||||||
| Net loans | $ | 2,390,030 | $ | 1,320,690 | $ | 997,262 | $ | 784,007 | $ | 601,306 | ||||||||||
Selected Loan Maturity Information
The following table sets forth the approximate maturities and sensitivity to changes in interest rates of certain loans, exclusive of real estate mortgage loans and installment/consumer loans to individuals as of December 31, 2015:
| Within One Year | After One But Within Five Years | After Five Years | Total | |||||||||||||
| (In thousands) | ||||||||||||||||
| Commercial loans | $ | 230,000 | $ | 138,588 | $ | 133,178 | $ | 501,766 | ||||||||
| Construction and land loans (1) | 44,285 | 16,618 | 30,250 | 91,153 | ||||||||||||
| Total | $ | 274,285 | $ | 155,206 | $ | 163,428 | $ | 592,919 | ||||||||
| Rate provisions: | ||||||||||||||||
| Amounts with fixed interest rates | $ | 23,766 | $ | 88,566 | $ | 53,850 | $ | 166,182 | ||||||||
| Amounts with variable interest rates | 250,520 | 66,639 | 109,578 | 426,737 | ||||||||||||
| Total | $ | 274,286 | $ | 155,205 | $ | 163,428 | $ | 592,919 | ||||||||
(1) Included in the “After Five Years” column, are one-step construction loans that contain a preliminary construction period (interest only) that automatically converts to amortization at the end of the construction phase.
| Page -28- |
Past Due, Nonaccrual and Restructured Loans and Other Real Estate Owned
The following table sets forth selected information about past due, nonaccrual, restructured loans and other real estate owned:
| December 31, | 2015 | 2014 | 2013 | 2012 | 2011 | |||||||||||||||
| (In thousands) | ||||||||||||||||||||
| Loans 90 days or more past due and still accruing | $ | 964 | $ | 144 | $ | 1 | $ | 491 | $ | 411 | ||||||||||
| Nonaccrual loans excluding restructured loans | 850 | 713 | 1,856 | 2,262 | 2,156 | |||||||||||||||
| Restructured loans - Nonaccrual | 60 | 490 | 1,965 | 1,027 | 2,004 | |||||||||||||||
| Restructured loans - Performing | 1,681 | 5,031 | 5,184 | 5,039 | 4,904 | |||||||||||||||
| Other real estate owned, net | 250 | — | 2,242 | 250 | — | |||||||||||||||
| Total | $ | 3,805 | $ | 6,378 | $ | 11,248 | $ | 9,069 | $ | 9,475 | ||||||||||
| Years Ended December 31, | 2015 | 2014 | 2013 | 2012 | 2011 | |||||||||||||||
| (In thousands) | ||||||||||||||||||||
| Gross interest income that has not been paid or recorded during the year under original terms: | ||||||||||||||||||||
| Nonaccrual loans | $ | 6 | $ | 33 | $ | 66 | $ | 155 | $ | 122 | ||||||||||
| Restructured loans | 1 | 84 | 60 | 84 | 436 | |||||||||||||||
| Gross interest income recorded during the year: | ||||||||||||||||||||
| Nonaccrual loans | $ | 1 | $ | 4 | $ | 94 | $ | 33 | $ | 41 | ||||||||||
| Restructured loans | 109 | 214 | 282 | 226 | 241 | |||||||||||||||
| Commitments for additional funds | — | — | — | — | — | |||||||||||||||
The following table sets forth impaired loans by loan type:
| December 31, | 2015 | 2014 | 2013 | 2012 | 2011 | |||||||||||||||
| (In thousands) | ||||||||||||||||||||
| Nonaccrual loans excluding restructured loans: | ||||||||||||||||||||
| Commercial real estate mortgage loans | $ | 238 | $ | 295 | $ | 352 | $ | 492 | $ | 449 | ||||||||||
| Multi-family loans | — | — | — | — | — | |||||||||||||||
| Residential real estate mortgage loans | 612 | 315 | 1,436 | 1,496 | 1,156 | |||||||||||||||
| Commercial, financial and agricultural loans | — | 75 | — | 193 | 260 | |||||||||||||||
| Real estate construction and land loans | — | — | — | — | 250 | |||||||||||||||
| Installment/consumer loans | — | — | — | — | — | |||||||||||||||
| Total | 850 | 685 | 1,788 | 2,181 | 2,115 | |||||||||||||||
| Restructured loans - Nonaccrual: | ||||||||||||||||||||
| Commercial real estate mortgage loans | — | 300 | 617 | — | — | |||||||||||||||
| Multi-family loans | — | — | — | — | — | |||||||||||||||
| Residential real estate mortgage loans | 60 | 69 | 618 | 717 | 1,786 | |||||||||||||||
| Commercial, financial and agricultural loans | — | 118 | 720 | 310 | 218 | |||||||||||||||
| Real estate construction and land loans | — | — | — | — | — | |||||||||||||||
| Installment/consumer loans | — | — | — | — | — | |||||||||||||||
| Total | 60 | 487 | 1,955 | 1,027 | 2,004 | |||||||||||||||
| Total Non-performing impaired loans | 910 | 1,172 | 3,743 | 3,208 | 4,119 | |||||||||||||||
| Restructured loans - Performing: | ||||||||||||||||||||
| Commercial real estate mortgage loans | 1,391 | 4,541 | 4,260 | 4,284 | 4,630 | |||||||||||||||
| Multi-family loans | — | — | — | — | — | |||||||||||||||
| Residential real estate mortgage loans | — | — | 329 | 336 | — | |||||||||||||||
| Commercial, financial and agricultural loans | 290 | 489 | 526 | 380 | 274 | |||||||||||||||
| Real estate construction and land loans | — | — | — | — | — | |||||||||||||||
| Installment/consumer loans | — | — | — | — | — | |||||||||||||||
| Total | 1,681 | 5,030 | 5,115 | 5,000 | 4,904 | |||||||||||||||
| Total Impaired Loans | $ | 2,591 | $ | 6,202 | $ | 8,858 | $ | 8,208 | $ | 9,023 | ||||||||||
Restructured loans totaled $1.8 million and $5.5 million as of December 31, 2015 and December 31, 2014, respectively.
| Page -29- |
Securities
Total securities increased to $1.0 billion at December 31, 2015 from $802.1 million at December 31, 2014. The available for sale portfolio increased $213.0 million or 36.3% to $800.2 million from $587.2 million at December 31, 2014. Securities held as available for sale may be sold in response to, or in anticipation of, changes in interest rates and resulting prepayment risk, or other factors. Residential mortgage-backed securities increased by $98.8 million at December 31, 2015, commercial mortgage-backed securities increased by $9.5 million, residential collateralized mortgage obligations increased by $59.3 million, commercial collateralized mortgage obligations increased by $40.1 million, state and municipal obligations increased by $24.2 million, and corporate bonds increased by $14.5 million, while U.S. government sponsored entity (“U.S. GSE”) securities decreased by $32.8, and other asset backed securities decreased by $0.1 million. Securities held to maturity decreased $6.6 million or 0.03% to $208.4 million at December 31, 2015 compared to $214.9 million at December 31, 2014. Commercial mortgage-backed securities increased by $9.8 million, residential collateralized mortgage obligations increased by $1.4 million, residential mortgage-backed securities increased by $0.9 million while U.S. government sponsored entity (“U.S. GSE”) securities decreased by $3.8, commercial collateralized mortgage obligations decreased by $3.0 million and corporate bonds decreased by $11.9 million. Fixed rate securities represented 93.4% of total securities at December 31, 2015 compared to 91.5% at December 31, 2014. Residential collateralized mortgage obligations represented approximately 39.7% of the available for sale balance at December 31, 2015 as compared to 44.0% at the prior year-end.
The following table sets forth the fair value, amortized cost, maturities and approximated weighted average yield at December 31, 2015. Expected maturities will differ from contractual maturities because borrowers may have the right to call or prepay obligations with or without call or prepayment penalties. Yields on tax-exempt obligations have been computed on a tax-equivalent basis.
| Page -30- |
| December 31, 2015 (Dollars in thousands) | Within One Year | After One But Within Five Years | After Five But Within Ten Years | After Ten Years | Total | |||||||||||||||||||||||||||||||||||||||||||||||||||
| Fair Value Amount | Amortized Cost Amount | Yield | Fair Value Amount | Amortized Cost Amount | Yield | Fair Value Amount | Amortized Cost Amount | Yield | Fair Value Amount | Amortized Cost Amount | Yield | Fair Value Amount | Amortized Cost Amount | |||||||||||||||||||||||||||||||||||||||||||
| Available for sale: | ||||||||||||||||||||||||||||||||||||||||||||||||||||||||
| US GSE securities | $ | — | $ | — | — | % | $ | 33,747 | $ | 33,990 | 1.67 | % | $ | 28,927 | $ | 29,248 | 2.11 | % | $ | — | $ | — | — | % | $ | 62,674 | $ | 63,238 | ||||||||||||||||||||||||||||
| State and municipal obligations | 4,801 | 4,785 | 1.26 | 46,591 | 46,696 | 1.56 | 27,692 | 27,478 | 2.62 | 8,851 | 8,871 | 3.18 | 87,935 | 87,830 | ||||||||||||||||||||||||||||||||||||||||||
| US GSE Residential mortgage-backed securities | — | — | — | — | — | — | 14,369 | 14,441 | 1.70 | 185,895 | 186,856 | 2.06 | 200,264 | 201,297 | ||||||||||||||||||||||||||||||||||||||||||
| US GSE Residential collateralized mortgage obligations | — | — | — | — | — | — | 4,227 | 4,242 | 1.24 | 313,651 | 317,011 | 1.98 | 317,878 | 321,253 | ||||||||||||||||||||||||||||||||||||||||||
| US GSE Commercial mortgage-backed securities | — | — | — | 5,898 | 5,925 | 1.88 | 6,520 | 6,566 | 2.29 | — | — | — | 12,418 | 12,491 | ||||||||||||||||||||||||||||||||||||||||||
| US GSE Commercial collateralized mortgage obligations | — | — | — | — | — | — | 5,968 | 5,974 | 2.13 | 58,230 | 58,835 | 2.13 | 64,198 | 64,809 | ||||||||||||||||||||||||||||||||||||||||||
| Other Asset backed securities | — | — | — | — | — | — | — | — | — | 22,371 | 24,250 | — | 22,371 | 24,250 | ||||||||||||||||||||||||||||||||||||||||||
| Corporate Bonds | 1,000 | 1,000 | 0.52 | — | — | — | 31,465 | 32,000 | 2.73 | — | — | — | 32,465 | 33,000 | ||||||||||||||||||||||||||||||||||||||||||
| Total available for sale | $ | 5,801 | $ | 5,785 | 1.13 | % | $ | 86,236 | $ | 86,611 | 1.63 | % | $ | 119,168 | $ | 119,949 | 2.32 | % | $ | 588,998 | $ | 595,823 | 1.96 | % | $ | 800,203 | $ | 808,168 | ||||||||||||||||||||||||||||
| Held to maturity: | ||||||||||||||||||||||||||||||||||||||||||||||||||||||||
| US GSE securities | $ | — | $ | — | — | % | $ | 7,467 | $ | 7,466 | 1.65 | % | $ | — | $ | — | — | % | $ | — | $ | — | — | % | $ | 7,467 | $ | 7,466 | ||||||||||||||||||||||||||||
| State and municipal obligations | 4,864 | 4,859 | 1.13 | 16,474 | 16,384 | 2.03 | 39,098 | 37,616 | 3.21 | 6,044 | 6,019 | 2.99 | 66,480 | 64,878 | ||||||||||||||||||||||||||||||||||||||||||
| US GSE Residential mortgage-backed securities | — | — | — | — | — | — | — | — | — | 7,503 | 7,609 | 1.75 | 7,503 | 7,609 | ||||||||||||||||||||||||||||||||||||||||||
| US GSE Residential collateralized mortgage obligations | — | — | — | — | — | — | 1,536 | 1,494 | 3.71 | 59,516 | 59,439 | 2.52 | 61,052 | 60,933 | ||||||||||||||||||||||||||||||||||||||||||
| US GSE Commercial mortgage-backed securities | — | — | — | 5,032 | 5,080 | 1.88 | 14,685 | 14,841 | 2.47 | 3,236 | 3,135 | 2.91 | 22,953 | 23,056 | ||||||||||||||||||||||||||||||||||||||||||
| US GSE Commercial collateralized mortgage obligations | — | — | — | — | — | — | — | — | — | 33,506 | 33,409 | 2.42 | 33,506 | 33,409 | ||||||||||||||||||||||||||||||||||||||||||
| Corporate Bonds | — | — | — | 11,042 | 11,000 | 2.03 | — | — | — | — | — | — | 11,042 | 11,000 | ||||||||||||||||||||||||||||||||||||||||||
| Total held to maturity | 4,864 | 4,859 | 1.13 | 40,015 | 39,930 | 1.94 | 55,319 | 53,951 | 3.02 | 109,805 | 109,611 | 2.47 | 210,003 | 208,351 | ||||||||||||||||||||||||||||||||||||||||||
| Total securities | $ | 10,665 | $ | 10,644 | 1.13 | % | $ | 126,261 | $ | 126,541 | 1.72 | % | $ | 174,487 | $ | 173,900 | 2.54 | % | $ | 698,803 | $ | 705,434 | 2.04 | % | $ | 1,010,206 | $ | 1,016,519 | ||||||||||||||||||||||||||||
Deposits and Borrowings
Borrowings, including federal funds purchased, repurchase agreements, subordinated debentures and junior subordinated debentures, increased $297.2 million to $562.6 million at December 31, 2015 from the prior year-end. Total deposits increased $1.0 billion or 55.0% in 2015 as compared to 2014. The growth in deposits is attributable to an increase in individual, partnership and corporate (“core deposits”) account balances of $890.6 million, driven by the addition of the branches acquired in the CNB transaction, the building of new relationships in current markets, and an increase of $119.2 million in public funds deposits. Demand deposits increased $453.8 million or 64.5% and savings, NOW and money market deposits increased $404.6 million or 40.9% primarily related to core deposits growth. Certificates of deposit of $100,000 or more increased $84.7 million or 101.9% from December 31, 2014 and other time deposits increased $66.8 million or 114.6% as compared to the prior year.
| Page -31- |
The following table sets forth the remaining maturities of the Bank’s time deposits at December 31, 2015:
| Less than $100,000 | $100,000
or Greater | Total | ||||||||||
| (In thousands) | ||||||||||||
| 3 Months or less | $ | 19,955 | $ | 33,306 | $ | 53,261 | ||||||
| Over 3 through 6 months | 35,033 | 55,696 | 90,729 | |||||||||
| Over 6 through 12 months | 16,794 | 24,866 | 41,660 | |||||||||
| Over 12 months through 24 months | 30,478 | 24,393 | 54,871 | |||||||||
| Over 24 months through 36 months | 11,826 | 14,006 | 25,832 | |||||||||
| Over 36 months through 48 months | 8,249 | 12,006 | 20,255 | |||||||||
| Over 48 months through 60 months | 2,770 | 3,477 | 6,247 | |||||||||
| Total | $ | 125,105 | $ | 167,750 | $ | 292,855 | ||||||
LIQUIDITY
The objective of liquidity management is to ensure the sufficiency of funds available to respond to the needs of depositors and borrowers, and to take advantage of unanticipated opportunities for Company growth or earnings enhancement. Liquidity management addresses the ability of the Company to meet financial obligations that arise in the normal course of business. Liquidity is primarily needed to meet customer borrowing commitments, deposit withdrawals either on demand or contractual maturity, to repay borrowings as they mature, to fund current and planned expenditures and to make new loans and investments as opportunities arise.
The Company’s principal sources of liquidity included cash and cash equivalents of $25.5 million as of December 31, 2015, and dividends from the Bank. Cash available for distribution of dividends to shareholders of the Company is primarily derived from dividends paid by the Bank to the Company. During 2015, the Bank paid $10.0 million in cash dividends to the Company. Prior regulatory approval is required if the total of all dividends declared by the Bank in any calendar year exceeds the total of the Bank’s net income of that year combined with its retained net income of the preceding two years. As of January 1, 2016, the Bank has $27.6 million of retained net income available for dividends to the Company. In the event that the Company subsequently expands its current operations, in addition to dividends from the Bank, it will need to rely on its own earnings, additional capital raised and other borrowings to meet liquidity needs. The Company made capital contributions of $50.0 million and $24.0 million to the Bank during the twelve months ended December 31, 2015 and 2014, respectively.
The Bank’s most liquid assets are cash and cash equivalents, securities available for sale and securities held to maturity due within one year. The levels of these assets are dependent upon the Bank’s operating, financing, lending and investing activities during any given period. Other sources of liquidity include loan and investment securities principal repayments and maturities, lines of credit with other financial institutions including the Federal Home Loan Bank and Federal Reserve Bank, growth in core deposits and sources of wholesale funding such as brokered certificates of deposit. While scheduled loan amortization, maturing securities and short term investments are a relatively predictable source of funds, deposit flows and loan and mortgage-backed securities prepayments are greatly influenced by general interest rates, economic conditions and competition. The Bank adjusts its liquidity levels as appropriate to meet funding needs such as seasonal deposit outflows, loans, and asset and liability management objectives. Historically, the Bank has relied on its deposit base, drawn through its full-service branches that serve its market area and local municipal deposits, as its principal source of funding. The Bank seeks to retain existing deposits and loans and maintain customer relationships by offering quality service and competitive interest rates to its customers, while managing the overall cost of funds needed to finance its strategies.
During 2015, 2014 and 2013, the Bank grew its core deposits as well as its level of public funds. The Bank’s Asset/Liability and Funds Management Policy allows for wholesale borrowings of up to 25% of total assets. At December 31, 2015, the Bank had aggregate lines of credit of $295.0 million with unaffiliated correspondent banks to provide short term credit for liquidity requirements. Of these aggregate lines of credit, $275.0 million is available on an unsecured basis. As of December 31, 2015, the Bank had $120.0 million in overnight borrowings outstanding under these lines. The Bank also has the ability, as a member of the Federal Home Loan Bank (“FHLB”) system, to borrow against unencumbered residential and commercial mortgages owned by the Bank. The Bank also has a master repurchase agreement with the FHLB, which increases its borrowing capacity. As of December 31, 2015, the Bank had no outstanding FHLB overnight borrowings and $297.5 million outstanding in FHLB term borrowings. The Bank had $50.0 million of securities sold under agreements to repurchase outstanding as of December 31, 2015 with brokers and $0.9 million outstanding with customers. As of December 31, 2014, the Bank had $35.0 million of securities sold under agreements to repurchase outstanding with brokers and $1.3 million outstanding with customers. In addition, the Bank has an approved broker relationship for the purpose of issuing brokered certificates of deposit. As of December 31, 2015, the Bank had $22.4 million outstanding in brokered certificates of deposit and $148.0 million outstanding in brokered money market accounts. As of December 31, 2014, the Bank had $8.3 million of brokered certificates of deposits and no outstanding brokered money market accounts.
Management continually monitors the liquidity position and believes that sufficient liquidity exists to meet all of our operating requirements. Based on the objectives determined by the Asset and Liability Committee, the Bank’s liquidity levels may be affected by the use of short-term and wholesale borrowings, and the amount of public funds in the deposit mix. The Asset and Liability
| Page -32- |
Committee is comprised of members of senior management and the Board. Excess short-term liquidity is invested in overnight federal funds sold or in an interest earning account at the Federal Reserve.
CONTRACTUAL OBLIGATIONS
In the ordinary course of operations, the Company enters into certain contractual obligations.
The following represents contractual obligations outstanding at December 31, 2015:
| Total Amounts Committed | Less than One Year | One to Three Years | Four to Five Years | Over Five Years | ||||||||||||||||
| (In thousands) | ||||||||||||||||||||
| Operating leases | $ | 50,897 | $ | 6,710 | $ | 12,408 | $ | 9,925 | $ | 21,854 | ||||||||||
| FHLB term advances and repurchase agreements | 347,458 | 300,392 | 47,066 | — | — | |||||||||||||||
| Subordinated debentures | 80,000 | — | — | — | 80,000 | |||||||||||||||
| Junior subordinated debentures | 16,002 | — | — | — | 16,002 | |||||||||||||||
| Time deposits | 291,995 | 184,865 | 80,647 | 26,483 | — | |||||||||||||||
| Total contractual obligations outstanding | $ | 786,352 | $ | 491,967 | $ | 140,121 | $ | 36,408 | $ | 117,856 | ||||||||||
COMMITMENTS, CONTINGENT LIABILITIES, AND OFF-BALANCE SHEET ARRANGEMENTS
Some financial instruments, such as loan commitments, credit lines, letters of credit, and overdraft protection, are issued to meet customer financing needs. These are agreements to provide credit or to support the credit of others, as long as conditions established in the contract are met, and usually have expiration dates. Commitments may expire without being used. Off-balance-sheet risk to credit loss exists up to the face amount of these instruments, although material losses are not anticipated. The same credit policies are used to make such commitments as are used for loans, often including obtaining collateral at exercise of the commitment. At December 31, 2015, the Company had $46.0 million in outstanding loan commitments and $418.6 million in outstanding commitments for various lines of credit including unused overdraft lines. The Company also has $14.9 million of standby letters of credit as of December 31, 2015. See Note 14 of the Notes to the Consolidated Financial Statements for additional information on loan commitments and standby letters of credit.
CAPITAL RESOURCES
Stockholders’ equity increased to $341.1 million at December 31, 2015 from $175.1 million at December 31, 2014 as a result of (i) undistributed net income; (ii) the issuance of shares of common stock through the Dividend Reinvestment Plan and the stock based compensation plan; (iii) the change in pension liability under FASB ASC 715-30, net of deferred taxes; (iv) the change in net unrealized appreciation in securities available for sale, net of deferred taxes; (v) the declaration of dividends; and (vi) shares issued in connection with the acquisition of CNB. The ratio of average stockholders’ equity to average total assets was 9.78% at year-end 2015 compared to 8.27% at year-end 2014.
The Company’s capital strength is paralleled by the solid capital position of the Bank, as reflected in the excess of its regulatory capital ratios over the risk-based capital adequacy ratio levels required for classification as a “well capitalized” institution by the FDIC (see Note 16 of the Notes to the Consolidated Financial Statements). Since 2013, the Company has actively managed its capital position in response to its growth. During this period, the Company has raised $210.7 million in capital through the following initiatives:
| · | On October 8, 2013, the Company completed a public offering with net proceeds of $37.6 million in capital from the sale of 1,926,250 shares of common stock. The purpose of the offering was in part to provide additional capital to Bridge Bancorp to support its acquisition of FNBNY Bancorp, Inc. and for general corporate purposes. |
| · | On February 14, 2014, the Company issued 240,598 shares of common stock with net proceeds of $5.9 million in capital. These shares were issued directly in connection with the acquisition of FNBNY. |
| · | On June 19, 2015, the Company issued 5,647,268 shares of common stock with net proceeds of $157.1 million in capital. These shares were issued in connection with the acquisition of CNB. |
| · | Proceeds of $10.1 million in capital through issuance of common stock through the Dividend Reinvestment Plan. |
The Company has the ability to issue additional common stock and/or preferred stock should the need arise and intends on filing a new shelf registration statement in March 2016 to replenish issuable securities.
The Company had returns on average equity of 7.91%, 7.76%, and 9.89%, and returns on average assets of 0.71%, 0.64%, and 0.77% for the years ended December 31, 2015, 2014, and 2013, respectively. The Company also utilizes cash dividends and stock
| Page -33- |
repurchases to manage capital levels. In 2015, the Company declared four quarterly cash dividends totaling $13.4 million compared to four quarterly cash dividends of $10.7 million in 2014. The dividend payout ratios for 2015 and 2014 were 63.54% and 77.43%, respectively. The Company continues its trend of uninterrupted dividends. On March 27, 2006, the Company approved its stock repurchase plan allowing the repurchase of up to 5% of its then current outstanding shares, 309,000 shares. There is no expiration date for the share repurchase plan. The Company considers opportunities for stock repurchases carefully. The Company did not repurchase any shares in 2015, 2014 or 2013.
IMPACT OF INFLATION AND CHANGING PRICES
The Consolidated Financial Statements and notes thereto presented herein have been prepared in accordance with U.S. generally accepted accounting principles, which require the measurement of financial position and operating results in terms of historical dollars without considering changes in the relative purchasing power of money over time due to inflation. The primary effect of inflation on the operations of the Company is reflected in increased operating costs. Unlike most industrial companies, virtually all of the assets and liabilities of a financial institution are monetary in nature. As a result, changes in interest rates have a more significant effect on the performance of a financial institution than do the effects of changes in the general rate of inflation and changes in prices. Changes in interest rates could adversely affect our results of operations and financial condition. Interest rates do not necessarily move in the same direction, or in the same magnitude, as the prices of goods and services. Interest rates are highly sensitive to many factors, which are beyond the control of the Company, including the influence of domestic and foreign economic conditions and the monetary and fiscal policies of the United States government and federal agencies, particularly the Federal Reserve Bank.
IMPACT OF PROSPECTIVE ACCOUNTING STANDARDS
For discussion regarding the impact of new accounting standards, refer to Note 1 u) of the Notes to Consolidated Financial Statements.
Item 7A. Quantitative and Qualitative Disclosures about Market Risk
Management considers interest rate risk to be the most significant market risk for the Company. Market risk is the risk of loss from adverse changes in market prices and rates. Interest rate risk is the exposure to adverse changes in the net income of the Company as a result of changes in interest rates.
The Company’s primary earnings source is net interest income, which is affected by changes in the level of interest rates, the relationship between rates, the impact of interest rate fluctuations on asset prepayments, the level and composition of deposits and liabilities, and the credit quality of earning assets. The Company’s objectives in its asset and liability management are to maintain a strong, stable net interest margin, to utilize its capital effectively without taking undue risks, to maintain adequate liquidity, and to reduce vulnerability of its operations to changes in interest rates.
The Company’s Asset and Liability Committee evaluates periodically, but at least four times a year, the impact of changes in market interest rates on assets and liabilities, net interest margin, capital and liquidity. Risk assessments are governed by policies and limits established by senior management, which are reviewed and approved by the full Board of Directors at least annually. The economic environment continually presents uncertainties as to future interest rate trends. The Asset and Liability Committee regularly utilizes a model that projects net interest income based on increasing or decreasing interest rates, in order to be better able to respond to changes in interest rates.
At December 31, 2015, $942.4 million or 93.4% of the Company’s securities had fixed interest rates. Changes in interest rates affect the value of the Company’s interest earning assets and in particular its securities portfolio. Generally, the value of securities fluctuates inversely with changes in interest rates. Increases in interest rates could result in decreases in the market value of interest earning assets, which could adversely affect the Company’s stockholders’ equity and its results of operations if sold. The Company is also subject to reinvestment risk associated with changes in interest rates. Changes in market interest rates also could affect the type (fixed-rate or adjustable-rate) and amount of loans originated by the Company and the average life of loans and securities, which can impact the yields earned on the Company’s loans and securities. In periods of decreasing interest rates, the average life of loans and securities held by the Company may be shortened to the extent increased prepayment activity occurs during such periods which, in turn, may result in the investment of funds from such prepayments in lower yielding assets. Under these circumstances the Company is subject to reinvestment risk to the extent that it is unable to reinvest the cash received from such prepayments at rates that are comparable to the rates on existing loans and securities. Additionally, increases in interest rates may result in decreasing loan prepayments with respect to fixed rate loans (and therefore an increase in the average life of such loans), may result in a decrease in loan demand, and make it more difficult for borrowers to repay adjustable rate loans.
The Company utilizes the results of a detailed and dynamic simulation model to quantify the estimated exposure of net interest income to sustained interest rate changes. Management routinely monitors simulated net interest income sensitivity over a rolling two-year horizon. The simulation model captures the seasonality of the Company’s deposit flows and the impact of changing interest rates on the interest income received and the interest expense paid on all assets and liabilities reflected on the Company’s consolidated balance
| Page -34- |
sheet. This sensitivity analysis is compared to the asset and liability policy limits that specify a maximum tolerance level for net interest income exposure over a one-year horizon given a 100 and 200 basis point upward shift in interest rates and a 100 basis point downward shift in interest rates. A parallel and pro-rata shift in rates over a twelve-month period is assumed.
In addition to the above scenarios, the Company considers other, non-parallel rate shifts that would also exert pressure on earnings. The recent increase in short-term interest rates by the FOMC without a corresponding rise in long-term rates has resulted in the flattening of the yield curve. This has had the effect of raising short-term borrowings costs without allowing longer term assets to reprice higher.
The following reflects the Company’s net interest income sensitivity analysis at December 31, 2015:
| Change in Interest | Potential
Change in Future Net Interest Income | |||||||
| Rates in Basis Points | $ Change | % Change | ||||||
| (Dollars in thousands) | ||||||||
| 200 | $ | (5,472 | ) | (4.91 | )% | |||
| 100 | $ | (2,836 | ) | (2.55 | )% | |||
| Static | — | — | ||||||
| (100) | $ | 210 | 0.19 | % | ||||
As noted in the table above, a 200 basis point increase in interest rates is projected to decrease net interest income over the next twelve months by 4.91 percent. Our balance sheet sensitivity to such a move in interest rates at December 31, 2015 decreased as compared to December 31, 2014 (which was a decrease of 5.18 percent in net interest income over a 12 month period). This decrease is due to several factors which reflect our strategy to lessen our exposure to rising rates. Over the intervening year, the effective duration (a measure of price sensitivity to interest rates) of the bond portfolio decreased from 3.99 to 3.40. Additionally, the bank has increased its use of swaps to extend liabilities.
The preceding sensitivity analysis does not represent a Company forecast and should not be relied upon as being indicative of expected operating results. These hypothetical estimates are based upon numerous assumptions including, but not limited to, the nature and timing of interest rate levels and yield curve shapes, prepayments on loans and securities, deposit decay rates, pricing decisions on loans and deposits, and reinvestment and replacement of asset and liability cash flows. While assumptions are developed based upon perceived current economic and local market conditions, the Company cannot make any assurances as to the predictive nature of these assumptions including how customer preferences or competitor influences may change.
Also, as market conditions vary from those assumed in the sensitivity analysis, actual results will also differ due to prepayment and refinancing levels likely deviating from those assumed, the varying impact of interest rate change caps or floors on adjustable rate assets, the potential effect of changing debt service levels on customers with adjustable rate loans, depositor early withdrawals, prepayment penalties and product preference changes and other internal and external variables. Furthermore, the sensitivity analysis does not reflect actions that management might take in responding to, or anticipating changes in interest rates and market conditions.
| Page -35- |
Item 8. Financial Statements and Supplementary Data
CONSOLIDATED BALANCE SHEETS
(In thousands, except share and per share amounts)
| December
31, 2015 | December
31, 2014 | |||||||
| ASSETS | ||||||||
| Cash and due from banks | $ | 79,750 | $ | 45,109 | ||||
| Interest earning deposits with banks | 24,808 | 6,621 | ||||||
| Total cash and cash equivalents | 104,558 | 51,730 | ||||||
| Securities available for sale, at fair value | 800,203 | 587,184 | ||||||
| Securities held to maturity (fair value of $210,003 and $216,289, respectively) | 208,351 | 214,927 | ||||||
| Total securities | 1,008,554 | 802,111 | ||||||
| Securities, restricted | 24,788 | 10,037 | ||||||
| Loans held for investment | 2,410,774 | 1,338,327 | ||||||
| Allowance for loan losses | (20,744 | ) | (17,637 | ) | ||||
| Loans, net | 2,390,030 | 1,320,690 | ||||||
| Premises and equipment, net | 39,595 | 32,424 | ||||||
| Accrued interest receivable | 9,270 | 6,425 | ||||||
| Goodwill | 98,445 | 9,450 | ||||||
| Other intangible assets | 8,376 | 842 | ||||||
| Prepaid pension | 6,047 | 4,927 | ||||||
| Bank owned life insurance | 53,314 | 30,644 | ||||||
| Other real estate owned | 250 | — | ||||||
| Other assets | 38,732 | 19,244 | ||||||
| Total Assets | $ | 3,781,959 | $ | 2,288,524 | ||||
| LIABILITIES AND STOCKHOLDERS’ EQUITY | ||||||||
| Demand deposits | $ | 1,156,882 | $ | 703,130 | ||||
| Savings, NOW and money market deposits | 1,393,888 | 989,287 | ||||||
| Certificates of deposit of $100 or more | 167,750 | 83,071 | ||||||
| Other time deposits | 125,105 | 58,291 | ||||||
| Total deposits | 2,843,625 | 1,833,779 | ||||||
| Federal funds purchased | 120,000 | 75,000 | ||||||
| Federal Home Loan Bank advances | 297,507 | 138,327 | ||||||
| Repurchase agreements | 50,891 | 36,263 | ||||||
| Subordinated debentures, net | 78,363 | — | ||||||
| Junior subordinated debentures, net | 15,878 | 15,873 | ||||||
| Other liabilities and accrued expenses | 34,567 | 14,164 | ||||||
| Total Liabilities | 3,440,831 | 2,113,406 | ||||||
| Commitments and Contingencies | — | — | ||||||
| Stockholders’ equity: | ||||||||
| Preferred stock, par value $.01 per share (2,000,000 shares authorized; none issued) | — | — | ||||||
| Common stock, par value $.01 per share: | ||||||||
| Authorized: 40,000,000 shares; 17,388,918 and 11,651,398 shares issued, respectively; 17,388,918 and 11,650,405 shares outstanding, respectively | 174 | 117 | ||||||
| Surplus | 278,333 | 118,846 | ||||||
| Retained earnings | 72,243 | 64,547 | ||||||
| Less: Treasury Stock at cost, 0 and 993 shares, respectively | — | (25 | ) | |||||
| 350,750 | 183,485 | |||||||
| Accumulated other comprehensive loss, net of income tax | (9,622 | ) | (8,367 | ) | ||||
| Total Stockholders’ Equity | 341,128 | 175,118 | ||||||
| Total Liabilities and Stockholders’ Equity | $ | 3,781,959 | $ | 2,288,524 | ||||
See accompanying notes to Consolidated Financial Statements.
| Page -36- |
CONSOLIDATED STATEMENTS OF INCOME
(In thousands, except per share amounts)
| Years Ended December 31, | 2015 | 2014 | 2013 | |||||||||
| Interest income: | ||||||||||||
| Loans (including fee income) | $ | 88,760 | $ | 57,628 | $ | 45,250 | ||||||
| Mortgage-backed securities, CMOs and other assets-backed securities | 11,173 | 10,644 | 6,956 | |||||||||
| State and municipal obligations | 3,198 | 2,735 | 2,638 | |||||||||
| U.S. GSE securities | 1,630 | 2,716 | 2,982 | |||||||||
| Corporate bonds | 840 | 749 | 399 | |||||||||
| Deposits with banks | 47 | 32 | 28 | |||||||||
| Other interest and dividend income | 592 | 406 | 177 | |||||||||
| Total interest income | 106,240 | 74,910 | 58,430 | |||||||||
| Interest expense: | ||||||||||||
| Savings, NOW and money market deposits | 4,002 | 3,223 | 3,543 | |||||||||
| Certificates of deposit of $100 or more | 929 | 767 | 1,079 | |||||||||
| Other time deposits | 673 | 426 | 340 | |||||||||
| Federal funds purchased and repurchase agreements | 474 | 588 | 505 | |||||||||
| Federal Home Loan Bank advances | 1,425 | 1,091 | 440 | |||||||||
| Subordinated debentures | 1,261 | — | — | |||||||||
| Junior subordinated debentures | 1,365 | 1,365 | 1,365 | |||||||||
| Total interest expense | 10,129 | 7,460 | 7,272 | |||||||||
| Net interest income | 96,111 | 67,450 | 51,158 | |||||||||
| Provision for loan losses | 4,000 | 2,200 | 2,350 | |||||||||
| Net interest income after provision for loan losses | 92,111 | 65,250 | 48,808 | |||||||||
| Non-interest income: | ||||||||||||
| Service charges on deposit accounts | 3,737 | 3,206 | 3,174 | |||||||||
| Fees for other customer services | 3,317 | 2,835 | 2,613 | |||||||||
| Title fee income | 1,866 | 1,662 | 1,687 | |||||||||
| Net securities (losses) gains | (8 | ) | (1,090 | ) | 659 | |||||||
| Other operating income | 3,756 | 1,553 | 758 | |||||||||
| Total non-interest income | 12,668 | 8,166 | 8,891 | |||||||||
| Non-interest expense: | ||||||||||||
| Salaries and employee benefits | 33,871 | 26,011 | 21,532 | |||||||||
| Occupancy and equipment | 11,045 | 7,712 | 5,374 | |||||||||
| Technology and communications | 3,599 | 3,175 | 2,594 | |||||||||
| Marketing and advertising | 3,125 | 2,430 | 1,864 | |||||||||
| Professional services | 2,327 | 1,537 | 1,340 | |||||||||
| FDIC assessments | 1,593 | 1,265 | 924 | |||||||||
| Acquisition costs and branch restructuring | 9,766 | 5,504 | 499 | |||||||||
| Amortization of other intangible assets | 1,447 | 300 | 59 | |||||||||
| Other operating expenses | 6,117 | 4,480 | 3,751 | |||||||||
| Total non-interest expense | 72,890 | 52,414 | 37,937 | |||||||||
| Income before income taxes | 31,889 | 21,002 | 19,762 | |||||||||
| Income tax expense | 10,778 | 7,239 | 6,669 | |||||||||
| Net income | $ | 21,111 | $ | 13,763 | $ | 13,093 | ||||||
| Basic earnings per share | $ | 1.43 | $ | 1.18 | $ | 1.36 | ||||||
| Diluted earnings per share | $ | 1.43 | $ | 1.18 | $ | 1.36 | ||||||
See accompanying notes to Consolidated Financial Statements.
| Page -37- |
CONSOLIDATED STATEMENTS OF COMPREHENSIVE INCOME
(In thousands)
| Years Ended December 31, | 2015 | 2014 | 2013 | |||||||||
| Net Income | $ | 21,111 | $ | 13,763 | $ | 13,093 | ||||||
| Other comprehensive (loss) income: | ||||||||||||
| Change in unrealized net gains (losses) on securities available for sale, net of reclassification and deferred income taxes | (1,434 | ) | 8,687 | (14,732 | ) | |||||||
| Adjustment to pension liability, net of reclassifications and deferred income taxes | 380 | (3,348 | ) | 1,907 | ||||||||
| Unrealized (loss) gain on cash flow hedge, net of reclassifications and deferred income taxes | (201 | ) | (470 | ) | 7 | |||||||
| Total other comprehensive (loss) income | (1,255 | ) | 4,869 | (12,818 | ) | |||||||
| Comprehensive income | $ | 19,856 | $ | 18,632 | $ | 275 | ||||||
See accompanying notes to Consolidated Financial Statements.
| Page -38- |
CONSOLIDATED STATEMENTS OF STOCKHOLDERS’ EQUITY
(In thousands, except share and per share amounts)
| Common
Stock | Surplus | Retained Earnings | Treasury Stock | Accumulated Other Comprehensive Income (Loss) | Total | |||||||||||||||||||
| Balance at January 1, 2013 | $ | 89 | $ | 64,208 | $ | 55,102 | $ | (309 | ) | $ | (418 | ) | $ | 118,672 | ||||||||||
| Net income | 13,093 | 13,093 | ||||||||||||||||||||||
| Shares issued under the dividend reinvestment plan (“DRP”) | 4 | 8,656 | 8,660 | |||||||||||||||||||||
| Shares issued in common stock offerings, net of offering costs (1,926,250 shares) | 19 | 37,558 | 37,577 | |||||||||||||||||||||
| Stock awards granted and distributed | 1 | (435 | ) | 434 | — | |||||||||||||||||||
| Stock awards forfeited | 79 | (79 | ) | — | ||||||||||||||||||||
| Vesting of stock awards | (291 | ) | (291 | ) | ||||||||||||||||||||
| Exercise of stock options | (6 | ) | 10 | 4 | ||||||||||||||||||||
| Tax effect of stock plans | 21 | 21 | ||||||||||||||||||||||
| Shared based compensation expense | 1,296 | 1,296 | ||||||||||||||||||||||
| Cash dividend declared, $0.69 per share | (6,754 | ) | (6,754 | ) | ||||||||||||||||||||
| Other comprehensive loss, net of deferred income taxes | (12,818 | ) | (12,818 | ) | ||||||||||||||||||||
| Balance at December 31, 2013 | $ | 113 | $ | 111,377 | $ | 61,441 | $ | (235 | ) | $ | (13,236 | ) | $ | 159,460 | ||||||||||
| Net income | 13,763 | 13,763 | ||||||||||||||||||||||
| Shares issued under the DRP | 1 | 630 | 631 | |||||||||||||||||||||
| Shares issued in the acquisition of FNBNY Bancorp, net of offering costs (240,598 shares) | 2 | 5,946 | 5,948 | |||||||||||||||||||||
| Stock awards granted and distributed | 1 | (432 | ) | 431 | — | |||||||||||||||||||
| Stock awards forfeited | 58 | (58 | ) | — | ||||||||||||||||||||
| Vesting of stock awards | (173 | ) | (173 | ) | ||||||||||||||||||||
| Exercise of stock options | (3 | ) | 10 | 7 | ||||||||||||||||||||
| Tax effect of stock plans | 36 | 36 | ||||||||||||||||||||||
| Shared based compensation expense | 1,234 | 1,234 | ||||||||||||||||||||||
| Cash dividend declared, $0.92 per share | (10,657 | ) | (10,657 | ) | ||||||||||||||||||||
| Other comprehensive income, net of deferred income taxes | 4,869 | 4,869 | ||||||||||||||||||||||
| Balance at December 31, 2014 | $ | 117 | $ | 118,846 | $ | 64,547 | $ | (25 | ) | $ | (8,367 | ) | $ | 175,118 | ||||||||||
| Net income | 21,111 | 21,111 | ||||||||||||||||||||||
| Shares issued under the DRP | 779 | 779 | ||||||||||||||||||||||
| Shares issued in the acquisition of CNB net of offering costs (5,647,268 shares) | 56 | 157,143 | 157,199 | |||||||||||||||||||||
| Stock awards granted and distributed | 1 | (263 | ) | 262 | — | |||||||||||||||||||
| Stock awards forfeited | 125 | (125 | ) | — | ||||||||||||||||||||
| Vesting of stock awards | (228 | ) | (228 | ) | ||||||||||||||||||||
| Exercise of stock options | (36 | ) | 116 | 80 | ||||||||||||||||||||
| Tax effect of stock plans | 50 | 50 | ||||||||||||||||||||||
| Shared based compensation expense | 1,689 | 1,689 | ||||||||||||||||||||||
| Cash dividend declared, $0.92 per share | (13,415 | ) | (13,415 | ) | ||||||||||||||||||||
| Other comprehensive loss, net of deferred income taxes | (1,255 | ) | (1,255 | ) | ||||||||||||||||||||
| Balance at December 31, 2015 | $ | 174 | $ | 278,333 | $ | 72,243 | $ | — | $ | (9,622 | ) | $ | 341,128 | |||||||||||
See accompanying notes to Consolidated Financial Statements.
| Page -39- |
CONSOLIDATED STATEMENTS OF CASH FLOWS
(In thousands)
| Years Ended December 31, | 2015 | 2014 | 2013 | |||||||||
| Cash flows from operating activities: | ||||||||||||
| Net income | $ | 21,111 | $ | 13,763 | $ | 13,093 | ||||||
| Adjustments to reconcile net income to net cash provided by operating activities: | ||||||||||||
| Provision for loan losses | 4,000 | 2,200 | 2,350 | |||||||||
| Depreciation and (accretion) amortization | (3,789 | ) | 481 | 1,852 | ||||||||
| Net amortization on securities | 4,936 | 3,763 | 5,168 | |||||||||
| Increase in cash surrender value of bank owned life insurance | (1,225 | ) | (609 | ) | (35 | ) | ||||||
| Amortization of intangible assets | 1,447 | 300 | 59 | |||||||||
| Share based compensation expense | 1,689 | 1,234 | 1,296 | |||||||||
| Net securities losses (gains) | 8 | 1,090 | (659 | ) | ||||||||
| Increase in accrued interest receivable | (267 | ) | (777 | ) | (212 | ) | ||||||
| Small Business Administration (“SBA”) loans originated for sale | (5,043 | ) | — | — | ||||||||
| Proceeds from sale of the guaranteed portion of SBA loans | 5,659 | — | — | |||||||||
| Gain on sale of the guaranteed portion of SBA loans | (507 | ) | — | — | ||||||||
| Gain on sale of loans | (477 | ) | — | — | ||||||||
| (Increase) decrease in other assets | (6,815 | ) | 5,783 | (1,366 | ) | |||||||
| Increase (decrease) in accrued expenses and other liabilities | 10,799 | (1,417 | ) | 3,483 | ||||||||
| Net cash provided by operating activities | 31,526 | 25,811 | 25,029 | |||||||||
| Cash flows from investing activities: | ||||||||||||
| Purchases of securities available for sale | (330,646 | ) | (342,185 | ) | (333,359 | ) | ||||||
| Purchases of securities, restricted | (318,887 | ) | (408,439 | ) | (164,503 | ) | ||||||
| Purchases of securities held to maturity | (21,650 | ) | (52,464 | ) | (68,251 | ) | ||||||
| Proceeds from sales of securities available for sale | 75,750 | 360,963 | 129,431 | |||||||||
| Redemption of securities, restricted | 308,808 | 408,036 | 160,447 | |||||||||
| Maturities, calls and principal payments of securities available for sale | 113,217 | 80,242 | 130,411 | |||||||||
| Maturities, calls and principal payments of securities held to maturity | 34,897 | 37,983 | 76,128 | |||||||||
| Net increase in loans | (354,375 | ) | (235,320 | ) | (217,668 | ) | ||||||
| Proceeds from loan sale | 21,011 | — | — | |||||||||
| Proceeds from sales of other real estate owned (“OREO”), net | — | 2,942 | 218 | |||||||||
| Purchase of bank owned life insurance | — | (20,000 | ) | (10,000 | ) | |||||||
| Purchase of premises and equipment | (4,325 | ) | (5,232 | ) | (4,029 | ) | ||||||
| Net cash acquired in business combination | 24,628 | 2,926 | — | |||||||||
| Net cash used in investing activities | (451,572 | ) | (170,548 | ) | (301,175 | ) | ||||||
| Cash flows from financing activities: | ||||||||||||
| Net increase in deposits | 223,872 | 125,300 | 129,773 | |||||||||
| Net increase in federal funds purchased | 45,000 | 11,000 | 19,500 | |||||||||
| Net increase in FHLB advances | 124,087 | 1,499 | 83,000 | |||||||||
| Repayment of acquired unsecured debt | — | (1,450 | ) | — | ||||||||
| Net increase (decrease) in repurchase agreements | 14,628 | 24,893 | (1,020 | ) | ||||||||
| Net proceeds from issuance of subordinated debentures | 78,324 | — | — | |||||||||
| Net proceeds from issuance of common stock | 779 | 631 | 46,237 | |||||||||
| Net proceeds from exercise of stock options | 80 | 7 | 4 | |||||||||
| Repurchase of surrendered stock from exercise of stock options and vesting of restricted stock awards | (228 | ) | (173 | ) | (291 | ) | ||||||
| Excess tax benefit from share based compensation | 50 | 36 | 21 | |||||||||
| Cash dividends paid | (13,415 | ) | (10,657 | ) | (6,754 | ) | ||||||
| Other, net | (303 | ) | (192 | ) | — | |||||||
| Net cash provided by financing activities | 472,874 | 150,894 | 270,470 | |||||||||
| Net increase (decrease) in cash and cash equivalents | 52,828 | 6,157 | (5,676 | ) | ||||||||
| Cash and cash equivalents at beginning of period | 51,730 | 45,573 | 51,249 | |||||||||
| Cash and cash equivalents at end of period | $ | 104,558 | $ | 51,730 | $ | 45,573 | ||||||
| Supplemental Information-Cash Flows: | ||||||||||||
| Cash paid for: | ||||||||||||
| Interest | $ | 8,793 | $ | 7,377 | $ | 7,194 | ||||||
| Income tax | $ | 8,744 | $ | 4,068 | $ | 5,108 | ||||||
| Noncash investing and financing activities: | ||||||||||||
| Transfers from portfolio loans to OREO | $ | 250 | $ | 577 | $ | 2,242 | ||||||
| Acquisition of noncash assets and liabilities: | ||||||||||||
| Fair value of assets acquired | $ | 875,302 | $ | 209,022 | $ | — | ||||||
| Fair value of liabilities assumed | $ | 831,422 | $ | 213,224 | $ | — | ||||||
See accompanying notes to Consolidated Financial Statements.
| Page -40- |
| NOTES TO CONSOLIDATED FINANCIAL STATEMENTS |
| December 31, 2015, 2014 and 2013 |
1. SUMMARY OF SIGNIFICANT ACCOUNTING POLICIES
Bridge Bancorp, Inc. (the “Company”) is incorporated under the laws of the State of New York and is a registered bank holding company. The Company’s business currently consists of the operations of its wholly-owned subsidiary, The Bridgehampton National Bank (the “Bank”). The Bank’s operations include its real estate investment trust subsidiary, Bridgehampton Community, Inc. (“BCI”), a financial title insurance subsidiary, Bridge Abstract LLC (“Bridge Abstract”), and Bridge Financial Services LLC (“Bridge Financial Services’), an investment services subsidiary.
In addition to the Bank, the Company has another subsidiary, Bridge Statutory Capital Trust II, which was formed in 2009. In accordance with current accounting guidance, the trust is not consolidated in the Company’s financial statements. See Note 9 for a further discussion of Bridge Statutory Capital Trust II.
The financial statements have been prepared in accordance with U.S. generally accepted accounting principles (“GAAP”) and general practices within the financial institution industry. The following is a description of the significant accounting policies that the Company follows in preparing its Consolidated Financial Statements.
a) Basis of Financial Statement Presentation
The accompanying Consolidated Financial Statements are prepared on the accrual basis of accounting and include the accounts of the Company and its wholly-owned subsidiary, the Bank. All material intercompany transactions and balances have been eliminated.
The preparation of financial statements, in conformity with U.S. generally accepted accounting principles, requires management to make estimates and assumptions that affect the reported amounts of assets and liabilities and disclosure of contingent assets and liabilities as of the date of each consolidated balance sheet and the related consolidated statement of income for the years then ended. Such estimates are subject to change in the future as additional information becomes available or previously existing circumstances are modified. Actual future results could differ significantly from those estimates.
b) Cash and Cash Equivalents
For purposes of reporting cash flows, cash and cash equivalents include cash on hand, amounts due from banks, interest earning deposits with banks, and federal funds sold, which mature overnight. Cash flows are reported net for customer loan and deposit transactions, overnight borrowings and federal funds purchased, Federal Home Loan Bank advances, and repurchase agreements.
c) Securities
Debt and equity securities are classified in one of the following categories: (i) “held to maturity” (management has a positive intent and ability to hold to maturity), which are reported at amortized cost, (ii) “available for sale” (all other debt and marketable equity securities), which are reported at fair value, with unrealized gains and losses reported net of tax, as accumulated other comprehensive income, a separate component of stockholders’ equity, and (iii) “restricted” which represents FHLB, FRB and bankers’ banks stock which are reported at cost.
Premiums and discounts on securities are amortized and accreted to interest income over the estimated life of the respective securities using the interest method. Gains and losses on the sales of securities are recognized upon realization based on the specific identification method. Declines in the fair value of securities below their cost that are other than temporary are reflected as realized losses. In estimating other-than-temporary impairment (“OTTI”), management considers many factors including: (1) the length of time and extent that fair value has been less than cost, (2) the financial condition and near term prospects of the issuer, (3) whether the market decline was affected by macroeconomic conditions, and (4) whether the Company has the intent to sell the security or more than likely than not will be required to sell the security before its anticipated recovery. If either of the criteria regarding intent or requirement to sell is met, the entire difference between amortized cost and fair value is recognized as impairment through earnings. For debt securities that do not meet the aforementioned criteria, the amount of impairment is split into two components as follows: (1) OTTI related to credit loss, which must be recognized in the income statement and (2) impairment related to other factors, which is recognized in other comprehensive income. The credit loss is defined as the difference between the present value of the cash flows expected to be collected and the amortized cost basis. The assessment of whether any other than temporary decline exists may involve a high degree of subjectivity and judgment and is based on the information available to management at a point in time.
d) Federal Home Loan Bank (FHLB) Stock
The Bank is a member of the FHLB system. Members are required to own a particular amount of stock based on the level of borrowings and other factors, and may invest in additional amounts. FHLB stock is carried at cost and classified as a restricted
| Page -41- |
security, and periodically evaluated for impairment based on ultimate recovery of par value. Both cash and stock dividends are reported as income.
e) Loans, Loan Interest Income Recognition and Loans Held for Sale
Loans are stated at the principal amount outstanding, net of partial charge-offs, deferred origination costs and fees and purchase premiums and discounts. Loan origination and commitment fees and certain direct and indirect costs incurred in connection with loan originations are deferred and amortized to income over the life of the related loans as an adjustment to yield. When a loan prepays, the remaining unamortized net deferred origination fees or costs are recognized in the current year. Interest on loans is credited to income based on the principal outstanding during the period. Past due status is based on the contractual terms of the loan. Loans that are 90 days past due are automatically placed on nonaccrual and previously accrued interest is reversed and charged against interest income. However, if the loan is in the process of collection and the Bank has reasonable assurance that the loan will be fully collectible based upon individual loan evaluation assessing such factors as collateral and collectibility, accrued interest will be recognized as earned. If a payment is received when a loan is nonaccrual or a troubled debt restructuring loan is nonaccrual, the payment is applied to the principal balance. A performing troubled debt restructuring loan is on accrual status in line with the modified terms. Loans are returned to accrual status when all the principal and interest amounts contractually due are brought current and future payments are reasonably assured.
A loan is considered impaired when, based on current information and events, it is probable that the Bank will be unable to collect the scheduled payments of principal or interest when due according to the contractual terms of the loan agreement. Factors considered by management in determining impairment include payment status and the probability of collecting scheduled principal and interest payments when due. Loans for which the terms have been modified as a concession to the borrower due to the borrower experiencing financial difficulties are considered troubled debt restructurings and are classified as impaired. Loans considered to be troubled debt restructurings can be categorized as nonaccrual or performing. The impairment of a loan is measured at the value of expected future cash flows using the loan’s effective interest rate, or at the loan’s observable market price or the fair value of the collateral less costs to sell if the loan is collateral dependent. Generally, the Bank measures impairment of such loans by reference to the fair value of the collateral less costs to sell. Loans that experience minor payment delays and payment shortfall generally are not classified as impaired.
Loans over $50,000 are individually evaluated for impairment. If a loan is impaired, a portion of the allowance is allocated so that the loan is reported, net, at the present value of estimated future cash flows using the loan’s existing rate or at the fair value of collateral less costs to sell if repayment is expected solely from the collateral. Loans with balances less than $50,000 are collectively evaluated for impairment, and accordingly, they are not separately identified for impairment disclosures.
Loans that were acquired through the acquisition of Community National Bank on June 19, 2015 and First National Bank of New York on February 14, 2014, were initially recorded at fair value with no carryover of the related allowance for loan losses. After acquisition, losses are recognized through the allowance for loan losses. Determining fair value of the loans involves estimating the amount and timing of expected principal and interest cash flows to be collected on the loans and discounting those cash flows at a market interest rate. Some of the loans at time of acquisition showed evidence of credit deterioration since origination. These loans are considered purchased credit impaired loans.
For purchased credit impaired loans, the excess of cash flows expected at acquisition over the estimated fair value is referred to as the accretable discount and is recognized into interest income over the remaining life of the loan. The difference between contractually required payments at acquisition and the cash flows expected to be collected at acquisition is referred to as the nonaccretable discount. The nonaccretable discount represents estimated future credit losses expected to be incurred over the life of the loan. Subsequent increases to the expected cash flows result in the reversal of a corresponding amount of the nonaccretable discount which is then reclassified as accretable discount and recognized into interest income over the remaining life of the loan using the interest method. Subsequent decreases to the expected cash flows require us to evaluate the need for an addition to the allowance for loan losses.
Purchased credit impaired loans that met the criteria for nonaccrual of interest prior to the acquisition may be considered performing upon acquisition, regardless of whether the customer is contractually delinquent, if management can reasonably estimate the timing and amount of the expected cash flows on such loans and if management expects to fully collect the new carrying value of the loans. As such, management may no longer consider the loans to be nonaccrual or nonperforming and may accrue interest on these loans, including the impact of any accretable discount.
Loans held for sale are carried at the lower of aggregate cost, or estimated fair value. Any subsequent declines in fair value below the initial carrying value are recorded as a valuation allowance, which is established through a charge to earnings.
Unless otherwise noted, the above policy is applied consistently to all loan classes.
| Page -42- |
f) Allowance for Loan Losses
The allowance for loan losses is a valuation allowance for probable incurred credit losses. The Bank monitors its entire loan portfolio on a regular basis, with consideration given to loan growth, detailed analyses of classified loans, repayment patterns, delinquency status, past loss experience, current economic conditions, and various types of concentrations of credit. Additionally, the Bank considers its credit administration and asset management philosophies and procedures and concentrations in the portfolio when determining the allowances for each pool. The Bank evaluates and considers the credit’s risk rating which includes management’s evaluation of: cash flow, collateral, guarantor support, financial disclosures, industry trends and strength of borrowers’ management, the impact that economic and market conditions may have on the portfolio as well as known and inherent risks in the portfolio. Finally, the Bank evaluates and considers the allowance ratios and coverage percentages of both peer group and regulatory agency data. These evaluations are inherently subjective because, even though they are based on objective data, it is management’s interpretation of that data that determines the amount of the appropriate allowance. If the evaluations prove to be incorrect, the allowance for loan losses may not be sufficient to cover probable incurred losses in the loan portfolio, resulting in additions to the allowance for loan losses.
The allowance consists of specific and general components. The specific component relates to loans that are individually classified as impaired.
Additions to the allowance are charged to expense and realized losses, net of recoveries, are charged to the allowance. Based on the determination of management and the Credit Risk Committee, the overall level of allowance is periodically adjusted to account for the inherent and specific risks within the entire portfolio. Based on the Credit Risk Committee’s review of the classified loans and the overall allowance levels as they relate to the entire loan portfolio at December 31, 2015, management believes the allowance for loan losses is adequate.
A loan is considered a potential charge-off when it is in default of either principal or interest for a period of 90, 120 or 180 days, depending upon the loan type, as of the end of the prior month. In addition to delinquency criteria, other triggering events may include, but are not limited to, notice of bankruptcy by the borrower or guarantor, death of the borrower, and deficiency balance from the sale of collateral.
While management uses available information to recognize losses on loans, future additions to the allowance may be necessary based on changes in conditions. In addition, various regulatory agencies, as an integral part of the examination process, periodically review the Bank’s allowance for loan losses. Such agencies may require the Bank to recognize additions to, or charge-offs against, the allowance based on their judgment about information available to them at the time of their examination. Refer to Note 3 for further details.
Unless otherwise noted, the above policy is applied consistently to all loan segments.
g) Premises and Equipment
Buildings, furniture and fixtures and equipment are stated at cost less accumulated depreciation. Buildings and related components are depreciated using the straight-line method using a useful life of fifty years for buildings and a range of two to ten years for equipment, computer hardware and software, and furniture and fixtures. Leasehold improvements are amortized over the lives of the respective leases or the service lives of the improvements, whichever is shorter. Land is recorded at cost.
Improvements and major repairs are capitalized, while the cost of ordinary maintenance, repairs and minor improvements are charged to expense.
h) Bank-Owned Life Insurance
The Bank is the owner and beneficiary of life insurance policies on certain employees. Bank-owned life insurance (“BOLI”) is recorded at the amount that can be realized under the insurance contract at the balance sheet date, which is the cash surrender value adjusted for other charges or other amounts due that are probable at settlement.
i) Other Real Estate Owned
Real estate properties acquired through, or in lieu of, foreclosure are initially recorded at fair value less costs to sell when acquired, establishing a new cost basis. These assets are subsequently accounted for at lower of cost or fair value less estimated costs to sell. If fair value declines subsequent to foreclosure, a valuation allowance is recorded through expense. Operating costs after acquisition are charged to expense as incurred.
j) Goodwill and Other Intangible Assets
Goodwill resulting from business combinations is generally determined as the excess of the fair value of the consideration transferred over the fair value of the net assets acquired and liabilities assumed as of the acquisition date. Goodwill and intangible assets acquired
| Page -43- |
in a purchase business combination and determined to have an indefinite useful life are not amortized, but tested for impairment at least annually or more frequently if events and circumstances exist that indicate that a goodwill impairment test should be performed. The Company has selected November 30th as the date to perform the annual impairment test. Intangible assets with definite useful lives are amortized over their estimated useful lives to their estimated residual values. Goodwill is the only intangible asset with an indefinite life on our balance sheet.
Other intangible assets include core deposit
intangible assets and a non-compete intangible arising from whole bank acquisitions. They are amortized on an accelerated method
over their estimated useful lives of ten years and two years, respectively. Other intangible assets also include servicing
rights which result from the sale of Small Business Administration (“SBA”) loans with servicing rights retained. Servicing
rights are initially recorded at fair value with the income statement effect recorded in gains on sales of loans. Fair value is
based on market prices for comparable servicing contracts, when available or alternatively, is based on a valuation model that
calculates the present value of estimated future net servicing income. Servicing assets are subsequently measured using the amortization
method which requires servicing rights to be amortized into non-interest income in proportion to, and over the period of, the
estimated future net servicing income of the underlying loans. Servicing assets totaled $893,000 at December 31, 2015. There were
no servicing assets at December 31, 2014.
servicing
rights which result from the sale of Small Business Administration (“SBA”) loans with servicing rights retained. Servicing
rights are initially recorded at fair value with the income statement effect recorded in gains on sales of loans. Fair value is
based on market prices for comparable servicing contracts, when available or alternatively, is based on a valuation model that
calculates the present value of estimated future net servicing income. Servicing assets are subsequently measured using the amortization
method which requires servicing rights to be amortized into non-interest income in proportion to, and over the period of, the
estimated future net servicing income of the underlying loans. Servicing assets totaled $893,000 at December 31, 2015. There were
no servicing assets at December 31, 2014.
k) Loan Commitments and Related Financial Instruments
Financial instruments include off-balance sheet credit instruments, such as unused lines of credit, commitments to make loans and commercial letters of credit, issued to meet customer-financing needs. The face amount for these items represents the exposure to loss, before considering customer collateral or ability to repay. Such financial instruments are recorded on the balance sheet when they are funded.
l) Derivatives
The Company records cash flow hedges at the inception of the derivative contract based on the Company’s intentions and belief as to likely effectiveness as a hedge. Cash flow hedges represent a hedge of a forecasted transaction or the variability of cash flows to be received or paid related to a recognized asset or liability. For a cash flow hedge, the gain or loss on the derivative is reported in other comprehensive income and is reclassified into earnings in the same periods during which the hedged transaction affects earnings. The changes in the fair value of derivatives that are not highly effective in hedging the changes in fair value or expected cash flows of the hedged item are recognized immediately in current earnings. Changes in the fair value of derivatives that do not qualify for hedge accounting are reported currently in earnings, as noninterest income.
Net cash settlements on derivatives that qualify for hedge accounting are recorded in interest income or interest expense, based on the item being hedged. Net cash settlements on derivatives that do not qualify for hedge accounting are reported in noninterest income. Cash flows on hedges are classified in the cash flow statement the same as the cash flows of the items being hedged.
The Company formally documents the relationship between derivatives and hedged items, as well as the risk-management objective and the strategy for undertaking hedge transactions at the inception of the hedging relationship. This documentation includes linking cash flow hedges to specific assets and liabilities on the balance sheet or to specific firm commitments or forecasted transactions. The Company also formally assesses, both at the hedge’s inception and on an ongoing basis, whether the derivative instruments that are used are highly effective in offsetting changes in fair values or cash flows of the hedged items. The Company discontinues hedge accounting when it determines that the derivative is no longer effective in offsetting changes in the fair value or cash flows of the hedged item, the derivative is settled or terminates, a hedged forecasted transaction is no longer probable, a hedged firm commitment is no longer firm, or treatment of the derivative as a hedge is no longer appropriate or intended.
When hedge accounting is discontinued, subsequent changes in fair value of the derivative are recorded as noninterest income. A cash flow hedge is discontinued but the hedged cash flows or forecasted transactions are still expected to occur, gains or losses that were accumulated in other comprehensive income are amortized into earnings over the same periods which the hedged transactions will affect earnings.
m) Income Taxes
The Company follows the asset and liability approach, which requires the recognition of deferred tax assets and liabilities for the expected future tax consequences of temporary differences between the carrying amounts and the tax bases of assets and liabilities, computed using enacted tax rates. Deferred tax assets are recognized if it is more likely than not that a future benefit will be realized. It is management’s position, as currently supported by the facts and circumstances, that no valuation allowance is necessary against any of the Company’s deferred tax assets.
In accordance with FASB ASC 740, Accounting for Uncertainty in Income Taxes, a tax position is recognized as a benefit only if it is “more likely than not” that the tax position would be sustained in a tax examination, with a tax examination being presumed to occur. The amount recognized is the largest amount of tax benefit that is greater than 50% likely of being realized on examination. For tax positions not meeting the “more likely than not” test, no tax benefit is recorded. There are no such tax positions on the Company’s financial statements at December 31, 2015 and 2014, respectively.
The Company recognizes interest and/or penalties related to income tax matters in income tax expense. The Company did not have any amounts accrued for interest and penalties at December 31, 2015 and December 31, 2014, respectively.
| Page -44- |
n) Treasury Stock
Repurchases of common stock are recorded as treasury stock at cost. Treasury stock is reissued using the first in, first out method.
o) Earnings Per Share
Earnings per share is calculated in accordance with FASB ASC 260-10, “Determining Whether Instruments Granted in Share-Based Payment Transactions Are Participating Securities”. This ASC addresses whether instruments granted in share-based payment transactions are participating securities prior to vesting and, therefore, need to be included in the earnings allocation in computing earnings per share (“EPS”). Basic earnings per common share is net income attributable to common shareholders divided by the weighted average number of common shares outstanding during the period. Diluted earnings per share, which reflects the potential dilution that could occur if outstanding stock options were exercised and if junior subordinated debentures were converted into common shares, is computed by dividing net income attributable to common shareholders by the weighted average number of common shares and common stock equivalents.
p) Dividends
Cash available for distribution of dividends to stockholders of the Company is primarily derived from cash and cash equivalents of the Company and dividends paid by the Bank to the Company. Prior regulatory approval is required if the total of all dividends declared by the Bank in any calendar year exceeds the total of the Bank’s net income of that year combined with its retained net income of the preceding two years. Dividends from the Bank to the Company at January 1, 2016 are limited to $27.6 million which represents the Bank’s net retained earnings from the previous two years. During 2015, the Bank paid dividends of $10.0 million to the Company.
q) Segment Reporting
While management monitors the revenue streams of the various products and services, the identifiable segments are not material and operations are managed and financial performance is evaluated on a Company-wide basis. Accordingly, all of the financial service operations are considered by management to be aggregated in one reportable operating segment.
r) Stock Based Compensation Plans
Stock based compensation awards are recorded in accordance with FASB ASC No. 718 and 505, “Accounting for Stock-Based Compensation” which requires companies to record compensation cost for stock options, restricted stock awards and restricted stock units granted to employees in return for employee service. The cost is measured at the fair value of the options and awards when granted, and this cost is expensed over the employee service period, which is normally the vesting period of the options and awards. The Company’s stock-based compensation plans are described in Note 12.
s) Comprehensive Income
Comprehensive income includes net income and all other changes in equity during a period, except those resulting from investments by owners and distributions to owners. Other comprehensive income includes revenues, expenses, gains and losses that under generally accepted accounting principles are included in comprehensive income but excluded from net income. Other comprehensive income and accumulated other comprehensive income are reported net of deferred income taxes. Accumulated other comprehensive income for the Company includes unrealized holding gains or losses on available for sale securities, unrealized gains or losses on cash flow hedges and changes in the funded status of the pension liability. FASB ASC 715-30 “Compensation – Retirement Benefits – Defined Benefit Plans – Pension” requires employers to recognize the overfunded or underfunded status of a defined benefit postretirement plan as an asset or liability in its statement of financial position and to recognize changes in that funded status in the year the changes occur through comprehensive income.
t) Fair Value of Financial Instruments
Fair values of financial instruments are estimated using relevant market information and other assumptions, as more fully disclosed in Note 14. Fair value estimates involve uncertainties and matters of significant judgment regarding interest rates, credit risk, prepayments, and other factors, especially in the absence of broad markets for particular items. Changes in assumptions or in market conditions could significantly affect the estimates.
u) New Accounting Standards
In February 2016, the Financial Accounting Standards Board (“FASB”) issued Accounting Standards Update (“ASU”) No. 2016-02, “Leases – (Topic 842). ASU 2016-02 was issued to increase transparency and comparability among organizations by recognizing lease assets and lease liabilities on the balance sheet and disclosing key information about leasing arrangements. ASU 2016-02 will require lessees to recognize in the statement of financial position a liability to make lease payments (the lease liability) and a right-of-use asset representing its right to use the underlying asset for the lease term. The amendments in this update become effective for annual periods and interim periods within those annual periods beginning after December 15, 2019. We are currently evaluating the impact of adopting the new guidance on the consolidated financial statements
In January 2016, the Financial Accounting Standards Board ("FASB") issued Accounting Standards Update (“ASU”) No. 2016-01, “Financial Instruments – Overall (Subtopic 825-10): Recognition and measurement of Financial Assets and Financial Liabilities.” ASU 2016-01 requires all equity investments to be measured at fair value with changes in the fair value recognized through net income (other than those accounted for under equity method of accounting or those that result in consolidation of the investee). The
| Page -45- |
amendments in this Update also require an entity to present separately in other comprehensive income the portion of the total change in the fair value of a liability resulting from a change in the instrument-specific credit risk when the entity has elected to measure the liability at fair value in accordance with the fair value option for financial instruments. In addition, the amendments in this Update eliminate the requirement to disclose the fair value of financial instruments measured at amortized cost for entities that are not public business entities and the requirement to disclose the method(s) and significant assumptions used to estimate the fair value that is required to be disclosed for financial instruments measured at amortized cost on the balance sheet for public business entities. The amendments in this update become effective for annual periods and interim periods within those periods beginning after December 15, 2017. We are currently evaluating the impact of adopting the new guidance on the consolidated financial statements.
In May 2014, the FASB issued ASU No. 2014-09, “Revenue from Contracts with Customers” creating FASB Topic 606, Revenue from Contracts with Customers. The guidance in this update affects any entity that either enters into contracts with customers to transfer goods or services or enters into contracts for the transfer of nonfinancial assets unless those contracts are within the scope of other standards (for example, insurance contracts or lease contracts). The core principle of the guidance is that an entity should recognize revenue to depict the transfer of promised goods or services to customers in an amount that reflects the consideration to which the entity expects to be entitled in exchange for those goods or services. The guidance provides steps to follow to achieve the core principle. An entity should disclose sufficient information to enable users of financial statements to understand the nature, amount, timing and uncertainty of revenue and cash flows arising from contracts with customers. Qualitative and quantitative information is required about contracts with customers, significant judgments and changes in judgments, and assets recognized from the costs to obtain or fulfill a contract. The amendments in this update become effective for annual periods and interim periods within those annual periods beginning after December 15, 2016. We are currently evaluating the impact of adopting the new guidance on the consolidated financial statements.
v) Reclassifications
Certain reclassifications have been made to prior year amounts to conform to the current period presentation.
| Page -46- |
2. SECURITIES
A summary of the amortized cost, gross unrealized gains and losses and fair value of securities is as follows:
| December 31, | 2015 | 2014 | ||||||||||||||||||||||||||||||
| (In thousands) | Amortized Cost | Gross Unrealized Gains | Gross Unrealized Losses | Fair Value | Amortized Cost | Gross Unrealized Gains | Gross Unrealized Losses | Fair Value | ||||||||||||||||||||||||
| Available for sale: | ||||||||||||||||||||||||||||||||
| U.S. GSE securities | $ | 63,238 | $ | — | $ | (564 | ) | $ | 62,674 | $ | 97,560 | $ | 4 | $ | (2,139 | ) | $ | 95,425 | ||||||||||||||
| State and municipal obligations | 87,830 | 427 | (322 | ) | 87,935 | 63,583 | 318 | (208 | ) | 63,693 | ||||||||||||||||||||||
| U.S. GSE residential mortgage-backed securities | 201,297 | 237 | (1,270 | ) | 200,264 | 100,931 | 534 | (40 | ) | 101,425 | ||||||||||||||||||||||
| U.S. GSE residential collateralized mortgage obligations | 321,253 | 513 | (3,888 | ) | 317,878 | 261,256 | 310 | (2,967 | ) | 258,599 | ||||||||||||||||||||||
| U.S. GSE commercial mortgage-backed securities | 12,491 | 7 | (80 | ) | 12,418 | 3,016 | — | (71 | ) | 2,945 | ||||||||||||||||||||||
| U.S. GSE commercial collateralized mortgage obligations | 64,809 | 9 | (620 | ) | 64,198 | 24,179 | 44 | (141 | ) | 24,082 | ||||||||||||||||||||||
| Other asset backed securities | 24,250 | — | (1,879 | ) | 22,371 | 24,190 | — | (1,153 | ) | 23,037 | ||||||||||||||||||||||
| Corporate Bonds | 33,000 | — | (535 | ) | 32,465 | 17,952 | 161 | (135 | ) | 17,978 | ||||||||||||||||||||||
| Total available for sale | 808,168 | 1,193 | (9,158 | ) | 800,203 | 592,667 | 1,371 | (6,854 | ) | 587,184 | ||||||||||||||||||||||
| Held to maturity: | ||||||||||||||||||||||||||||||||
| U.S. GSE securities | 7,466 | 1 | — | 7,467 | 11,283 | 135 | (41 | ) | 11,377 | |||||||||||||||||||||||
| State and municipal obligations | 64,878 | 1,715 | (113 | ) | 66,480 | 64,864 | 1,658 | (98 | ) | 66,424 | ||||||||||||||||||||||
| U.S. GSE residential mortgage-backed securities | 7,609 | — | (106 | ) | 7,503 | 6,667 | — | (97 | ) | 6,570 | ||||||||||||||||||||||
| U.S. GSE residential collateralized mortgage obligations | 60,933 | 617 | (498 | ) | 61,052 | 59,539 | 507 | (862 | ) | 59,184 | ||||||||||||||||||||||
| U.S. GSE commercial mortgage-backed securities | 23,056 | 210 | (313 | ) | 22,953 | 13,213 | 233 | (26 | ) | 13,420 | ||||||||||||||||||||||
| U.S. GSE commercial collateralized mortgage obligations | 33,409 | 282 | (185 | ) | 33,506 | 36,413 | 267 | (431 | ) | 36,249 | ||||||||||||||||||||||
| Corporate Bonds | 11,000 | 42 | — | 11,042 | 22,948 | 139 | (22 | ) | 23,065 | |||||||||||||||||||||||
| Total held to maturity | 208,351 | 2,867 | (1,215 | ) | 210,003 | 214,927 | 2,939 | (1,577 | ) | 216,289 | ||||||||||||||||||||||
| Total securities | $ | 1,016,519 | $ | 4,060 | $ | (10,373 | ) | $ | 1,010,206 | $ | 807,594 | $ | 4,310 | $ | (8,431 | ) | $ | 803,473 | ||||||||||||||
Securities with unrealized losses at year-end 2015 and 2014, aggregated by category and length of time that individual securities have been in a continuous unrealized loss position, are as follows:
| December 31, | 2015 | 2014 | ||||||||||||||||||||||||||||||
| Less than 12 months | Greater than 12 months | Less than 12 months | Greater than 12 months | |||||||||||||||||||||||||||||
| (In thousands) | Fair Value | Unrealized losses | Fair Value | Unrealized losses | Fair Value | Unrealized losses | Fair Value | Unrealized losses | ||||||||||||||||||||||||
| Available for sale: | ||||||||||||||||||||||||||||||||
| U.S. GSE securities | $ | 37,759 | $ | 235 | $ | 24,914 | $ | 329 | $ | 4,991 | $ | 8 | $ | 90,233 | $ | 2,131 | ||||||||||||||||
| State and municipal obligations | 39,621 | 298 | 5,118 | 24 | 12,330 | 79 | 14,592 | 129 | ||||||||||||||||||||||||
| U.S. GSE residential mortgage-backed securities | 136,025 | 1,224 | 1,510 | 46 | — | — | 1,554 | 40 | ||||||||||||||||||||||||
| U.S. GSE residential collateralized mortgage obligations | 187,543 | 1,781 | 66,830 | 2,107 | 60,126 | 349 | 122,179 | 2,618 | ||||||||||||||||||||||||
| U.S. GSE commercial mortgage-backed securities | 8,594 | 80 | — | — | — | — | 2,944 | 71 | ||||||||||||||||||||||||
| U.S. GSE commercial collateralized mortgage obligations | 51,178 | 503 | 10,034 | 117 | 13,830 | 108 | 4,636 | 33 | ||||||||||||||||||||||||
| Other asset backed securities | — | — | 22,371 | 1,879 | 23,038 | 1,153 | — | — | ||||||||||||||||||||||||
| Corporate Bonds | 27,640 | 360 | 4,825 | 175 | 9,865 | 135 | — | — | ||||||||||||||||||||||||
| Total available for sale | 488,360 | 4,481 | 135,602 | 4,677 | 124,180 | 1,832 | 236,138 | 5,022 | ||||||||||||||||||||||||
| Held to maturity: | ||||||||||||||||||||||||||||||||
| U.S. GSE securities | — | — | — | — | — | — | 7,414 | 41 | ||||||||||||||||||||||||
| State and municipal obligations | 18,375 | 113 | — | — | 11,343 | 97 | 202 | 1 | ||||||||||||||||||||||||
| U.S. GSE residential mortgage-backed securities | 7,503 | 106 | — | — | — | — | 6,569 | 97 | ||||||||||||||||||||||||
| U.S. GSE residential collateralized mortgage obligations | 15,918 | 149 | 15,679 | 349 | 10,422 | 46 | 30,413 | 816 | ||||||||||||||||||||||||
| U.S. GSE commercial mortgage-backed securities | 13,982 | 313 | — | — | — | — | 4,188 | 26 | ||||||||||||||||||||||||
| U.S. GSE commercial collateralized mortgage obligations | 7,912 | 8 | 3,813 | 177 | 14,392 | 73 | 8,611 | 358 | ||||||||||||||||||||||||
| Corporate Bonds | — | — | — | — | 3,978 | 22 | — | — | ||||||||||||||||||||||||
| Total held to maturity | $ | 63,690 | $ | 689 | $ | 19,492 | $ | 526 | $ | 40,135 | $ | 238 | $ | 57,397 | $ | 1,339 | ||||||||||||||||
| Page -47- |
Unrealized losses on securities have not been recognized into income, as the losses on these securities would be expected to dissipate as they approach their maturity dates. The Company evaluates securities for other-than-temporary impairment periodically and with increased frequency when economic or market concerns warrant such evaluation. Consideration is given to the length of time and the extent to which the fair value has been less than cost, the financial condition and near-term prospects of the issuer, whether the market decline was affected by macroeconomic conditions, and whether the Company has the intent to sell the security or more than likely than not will be required to sell the security before its anticipated recovery. In analyzing an issuer’s financial condition, the Company may consider whether the securities are issued by the federal government or its entities, whether downgrades by bond rating agencies have occurred, and the issuer’s financial condition.
At December 31, 2015, the majority of unrealized losses on both the available for sale and held to maturity securities are related to the Company’s U.S. GSE residential collateralized mortgage obligations and Other Asset Backed securities. The decrease in fair value of the U.S. GSE residential collateralized mortgage obligations and Other Asset Backed securities is attributable to changes in interest rates and not credit quality. The Company does not have the intent to sell these securities and it is more likely than not that it will not be required to sell the securities before their anticipated recovery. Therefore, the Company does not consider these securities to be other-than-temporarily impaired at December 31, 2015.
The following table sets forth the fair value, amortized cost and maturities of the securities at December 31, 2015. Expected maturities will differ from contractual maturities because borrowers may have the right to call or prepay obligations with or without call or prepayment penalties.
| December 31, 2015 | Within One Year | After One But Within Five Years | After Five But Within Ten Years | After Ten Years | Total | |||||||||||||||||||||||||||||||||||
| (In thousands) | Fair Value Amount | Amortized Cost Amount | Fair Value Amount | Amortized Cost Amount | Fair Value Amount | Amortized Cost Amount | Fair Value Amount | Amortized Cost Amount | Fair Value Amount | Amortized Cost Amount | ||||||||||||||||||||||||||||||
| Available for sale: | ||||||||||||||||||||||||||||||||||||||||
| U.S. GSE securities | $ | — | $ | — | $ | 33,747 | $ | 33,990 | $ | 28,927 | $ | 29,248 | $ | — | $ | — | $ | 62,674 | $ | 63,238 | ||||||||||||||||||||
| State and municipal obligations | 4,801 | 4,785 | 46,591 | 46,696 | 27,692 | 27,478 | 8,851 | 8,871 | 87,935 | 87,830 | ||||||||||||||||||||||||||||||
| U.S. GSE residential mortgage-backed securities | — | — | — | — | 14,369 | 14,441 | 185,895 | 186,856 | 200,264 | 201,297 | ||||||||||||||||||||||||||||||
| U.S. GSE residential collateralized mortgage obligations | — | — | — | — | 4,227 | 4,242 | 313,651 | 317,011 | 317,878 | 321,253 | ||||||||||||||||||||||||||||||
| U.S. GSE commercial mortgage-backed securities | — | — | 5,898 | 5,925 | 6,520 | 6,566 | — | — | 12,418 | 12,491 | ||||||||||||||||||||||||||||||
| U.S. GSE commercial collateralized mortgage obligations | — | — | — | — | 5,968 | 5,974 | 58,230 | 58,835 | 64,198 | 64,809 | ||||||||||||||||||||||||||||||
| Other Asset backed securities | — | — | — | — | — | — | 22,371 | 24,250 | 22,371 | 24,250 | ||||||||||||||||||||||||||||||
| Corporate Bonds | 1,000 | 1,000 | — | — | 31,465 | 32,000 | — | — | 32,465 | 33,000 | ||||||||||||||||||||||||||||||
| Total available for sale | 5,801 | 5,785 | 86,236 | 86,611 | 119,168 | 119,949 | 588,998 | 595,823 | 800,203 | 808,168 | ||||||||||||||||||||||||||||||
| Held to maturity: | ||||||||||||||||||||||||||||||||||||||||
| U.S. GSE securities | — | — | 7,467 | 7,466 | — | — | — | — | 7,467 | 7,466 | ||||||||||||||||||||||||||||||
| State and municipal obligations | 4,864 | 4,859 | 16,474 | 16,384 | 39,098 | 37,616 | 6,044 | 6,019 | 66,480 | 64,878 | ||||||||||||||||||||||||||||||
| U.S. GSE residential mortgage-backed securities | — | — | — | — | — | — | 7,503 | 7,609 | 7,503 | 7,609 | ||||||||||||||||||||||||||||||
| U.S. GSE residential collateralized mortgage obligations | — | — | — | — | 1,536 | 1,494 | 59,516 | 59,439 | 61,052 | 60,933 | ||||||||||||||||||||||||||||||
| U.S. GSE commercial mortgage-backed securities | — | — | 5,032 | 5,080 | 14,685 | 14,841 | 3,236 | 3,135 | 22,953 | 23,056 | ||||||||||||||||||||||||||||||
| U.S. GSE commercial collateralized mortgage obligations | — | — | — | — | — | — | 33,506 | 33,409 | 33,506 | 33,409 | ||||||||||||||||||||||||||||||
| Corporate Bonds | — | — | 11,042 | 11,000 | — | — | — | — | 11,042 | 11,000 | ||||||||||||||||||||||||||||||
| Total held to maturity | 4,864 | 4,859 | 40,015 | 39,930 | 55,319 | 53,951 | 109,805 | 109,611 | 210,003 | 208,351 | ||||||||||||||||||||||||||||||
| Total securities | $ | 10,665 | $ | 10,644 | $ | 126,251 | $ | 126,541 | $ | 174,487 | $ | 173,900 | $ | 698,803 | $ | 705,434 | $ | 1,010,206 | $ | 1,016,519 | ||||||||||||||||||||
There were $75.8 million of proceeds on sales of available for sale securities with gross gains of approximately $0.5 million and gross losses of approximately $0.5 million realized in 2015. There were $361.0 million of proceeds on sales of available for sale securities with gross gains of approximately $1.2 million and gross losses of approximately $2.3 million realized in 2014. There were $129.4 million of proceeds on sales of available for sale securities with gross gains of approximately $1.5 million and gross losses of approximately $0.8 million realized in 2013.
Securities having a fair value of approximately $611.0 million and $451.1 million at December 31, 2015 and 2014, respectively, were pledged to secure public deposits and Federal Home Loan Bank and Federal Reserve Bank overnight borrowings. The Company did not hold any trading securities during the years ended December 31, 2015 and 2014.
As of December 31, 2015, there was no issuer, other than U.S. Government and its Sponsored Entities, where the Bank had invested holdings that exceeded 10% of consolidated stockholder’s equity. As of December 31, 2014, there was one issuer, other than U.S. Government and its Sponsored Entities, where the Bank had invested holdings that exceeded 10% of consolidated stockholder’s equity and represented 13% of consolidated stockholder’s equity. These assets were more than 95% backed by a U.S. Government guarantee.
| Page -48- |
3. LOANS
The following table sets forth the major classifications of loans:
| December 31, | 2015 | 2014 | ||||||
| (In thousands) | ||||||||
| Commercial real estate mortgage loans | $ | 1,053,399 | $ | 595,397 | ||||
| Multi-family mortgage loans | 350,793 | 218,985 | ||||||
| Residential real estate mortgage loans | 392,815 | 156,156 | ||||||
| Commercial, financial and agricultural loans | 501,766 | 291,743 | ||||||
| Real estate construction and land loans | 91,153 | 63,556 | ||||||
| Installment/consumer loans | 17,596 | 10,124 | ||||||
| Total loans | 2,407,522 | 1,335,961 | ||||||
| Net deferred loan costs and fees | 3,252 | 2,366 | ||||||
| 2,410,774 | 1,338,327 | |||||||
| Allowance for loan losses | (20,744 | ) | (17,637 | ) | ||||
| Net loans | $ | 2,390,030 | $ | 1,320,690 | ||||
On June 19, 2015, the Company completed the acquisition of Community National Bank (“CNB”) resulting in the addition of $734.0 million of acquired loans recorded at their fair value. There were approximately $659.7 million of acquired CNB loans remaining as of December 31, 2015.
On February 14, 2014, the Company completed the acquisition of FNBNY Bancorp, Inc. and its wholly owned subsidiary First National Bank of New York (collectively “FNBNY”) resulting in the addition of $89.7 million of acquired loans recorded at their fair value. There were approximately $37.7 million and $64.9 million of acquired FNBNY loans remaining as of December 31, 2015 and 2014, respectively.
Lending Risk
The principal business of the Bank is lending, primarily in commercial real estate mortgage loans, multi-family mortgage loans, residential real estate mortgage loans, construction loans, home equity loans, commercial and industrial loans, land loans and consumer loans. The Bank considers its primary lending area to be Nassau and Suffolk Counties located on Long Island and a substantial portion of the Bank’s loans are secured by real estate in this area. Accordingly, the ultimate collectibility of such a loan portfolio is susceptible to changes in market and economic conditions in this region.
Commercial Real Estate Mortgages
Loans in this classification include income producing investment properties and owner occupied real estate used for business purposes. The underlying properties are generally located largely in our primary market area. The cash flows of the income producing investment properties are adversely impacted by a downturn in the economy as evidenced by increased vacancy rates, which in turn, will have an effect on credit quality. Generally, management seeks to obtain annual financial information for borrowers with loans in excess of $0.25 million in this category. In the case of owner-occupied real estate used for business purposes, a weakened economy and resultant decreased consumer and/or business spending will have an adverse effect on credit quality.
Multi-Family Mortgages
Loans in this classification include income producing residential investment properties of 5 or more families. The loans are usually made in areas with limited single family residences generating high demand for these facilities. Loans are made to established owners with a proven and demonstrable record of strong performance. Loans are secured by a first mortgage lien on the subject property with a loan to value ratio generally not exceeding 75%. Repayment is derived generally from the rental income generated from the property and maybe supplemented by the owners’ personal cash flow. Credit risk arises with an increase in vacancy rates, property mismanagement and the predominance of non-recourse loans that are customary in the industry.
Residential Real Estate Mortgages and Home Equity Loans
Loans in these classifications are made to and secured by owner-occupied residential real estate and repayment is dependent on the credit quality of the individual borrower. The overall health of the economy, including unemployment rates and housing prices, can have an effect on the credit quality in this loan class. The Bank generally does not originate loans with a loan-to-value ratio greater than 80% and does not grant subprime loans.
| Page -49- |
Commercial, Industrial and Agricultural Loans
Loans in this classification are made to businesses and include term loans, lines of credit, senior secured loans to corporations and taxi medallion loans. Generally these loans are secured by assets of the business and repayment is expected from the cash flows of the business. A weakened economy, and resultant decreased consumer and/or business spending will have an effect on the credit quality in this loan class.
Real Estate Construction and Land Loans
Loans in this classification primarily include land loans to local individuals, contractors and developers for developing the land for sale or for the purpose of making improvements thereon. Repayment is derived primarily from sale of the lots/units including any pre-sold units. Credit risk is affected by market conditions, time to sell at an adequate price and cost overruns. To a lesser extent this class includes commercial development projects that the Company finances, which in most cases require interest only during construction, and then convert to permanent financing. Credit risk is affected by construction delays, cost overruns, market conditions and the availability of permanent financing, to the extent such permanent financing is not being provided by us.
Installment and Consumer Loans
Loans in this classification may be either secured or unsecured and repayment is dependent on the credit quality of the individual borrower and, if applicable, sale of the collateral securing the loan such as automobiles. Therefore, the overall health of the economy, including unemployment rates and housing prices, will have an effect on the credit quality in this loan class.
Allowance for Loan Losses
The allowance for loan losses is established and maintained through a provision for loan losses based on probable incurred losses inherent in the Bank’s loan portfolio. Management evaluates the adequacy of the allowance on a quarterly basis. The allowance is comprised of both individual valuation allowances and loan pool valuation allowances.
The Bank monitors its entire loan portfolio on a regular basis, with consideration given to detailed analysis of classified loans, repayment patterns, probable incurred losses, past loss experience, current economic conditions, and various types of concentrations of credit. Additions to the allowance are charged to expense and realized losses, net of recoveries, are charged to the allowance.
Individual valuation allowances are established in connection with specific loan reviews and the asset classification process including the procedures for impairment testing under FASB Accounting Standard Codification (“ASC”) No. 310, “Receivables”. Such valuation, which includes a review of loans for which full collectibility in accordance with contractual terms is not reasonably assured, considers the estimated fair value of the underlying collateral less the costs to sell, if any, or the present value of expected future cash flows, or the loan’s observable market value. Any shortfall that exists from this analysis results in a specific allowance for the loan. Pursuant to our policy, loan losses must be charged-off in the period the loans, or portions thereof, are deemed uncollectible. Assumptions and judgments by management, in conjunction with outside sources, are used to determine whether full collectibility of a loan is not reasonably assured. These assumptions and judgments are also used to determine the estimates of the fair value of the underlying collateral or the present value of expected future cash flows or the loan’s observable market value. Individual valuation allowances could differ materially as a result of changes in these assumptions and judgments. Individual loan analyses are periodically performed on specific loans considered impaired. The results of the individual valuation allowances are aggregated and included in the overall allowance for loan losses.
Loan pool valuation allowances represent loss allowances that have been established to recognize the inherent risks associated with our lending activities, but which, unlike individual allowances, have not been allocated to particular problem assets. Pool evaluations are broken down into loans with homogenous characteristics by loan type and include commercial real estate mortgages, multi-family mortgage loans, home equity loans, residential real estate mortgages, commercial and industrial loans, real estate construction and land loans and consumer loans. The determination of the adequacy of the valuation allowance is a process that takes into consideration a variety of factors. The Bank has developed a range of valuation allowances necessary to adequately provide for probable incurred losses inherent in each pool of loans. We consider our own charge-off history along with the growth in the portfolio as well as the Bank’s credit administration and asset management philosophies and procedures when determining the allowances for each pool. In addition, we evaluate and consider the credit’s risk rating which includes management’s evaluation of: cash flow, collateral, guarantor support, financial disclosures, industry trends and strength of borrowers’ management, the impact that economic and market conditions may have on the portfolio as well as known and inherent risks in the portfolio. Finally, we evaluate and consider the allowance ratios and coverage percentages of peer group and regulatory agency data. These evaluations are inherently subjective because, even though they are based on objective data, it is management’s interpretation of that data that determines the amount of the appropriate allowance. If the evaluations prove to be incorrect, the allowance for loan losses may not be sufficient to cover losses inherent in the loan portfolio, resulting in additions to the allowance for loan losses.
| Page -50- |
The Credit Risk Management Committee is comprised of Bank management. The adequacy of the allowance is analyzed quarterly, with any adjustment to a level deemed appropriate by the Credit Risk Management Committee, based on its risk assessment of the entire portfolio. Each quarter, members of the Credit Risk Management Committee meet with the Credit Risk Committee of the Board to review credit risk trends and the adequacy of the allowance for loan losses. Based on the Credit Risk Management Committee’s review of the classified loans and the overall allowance levels as they relate to the loan portfolio at December 31, 2015 and 2014, management believes the allowance for loan losses has been established at levels sufficient to cover the probable incurred losses in the Bank’s loan portfolio. Future additions or reductions to the allowance may be necessary based on changes in economic, market or other conditions. Changes in estimates could result in a material change in the allowance. In addition, various regulatory agencies, as an integral part of the examination process, periodically review the allowance for loan losses. Such agencies may require the Bank to recognize adjustments to the allowance based on their judgments of the information available to them at the time of their examination.
The following table sets forth changes in the allowance for loan losses:
| December 31, | 2015 | 2014 | 2013 | |||||||||
| (In thousands) | ||||||||||||
| Allowance for loan losses balance at beginning of period | $ | 17,637 | $ | 16,001 | $ | 14,439 | ||||||
| Charge-offs | (1,128 | ) | (824 | ) | (916 | ) | ||||||
| Recoveries | 235 | 260 | 128 | |||||||||
| Net charge-offs | (893 | ) | (564 | ) | (788 | ) | ||||||
| Provision for loan losses charged to operations | 4,000 | 2,200 | 2,350 | |||||||||
| Balance at end of period | $ | 20,744 | $ | 17,637 | $ | 16,001 | ||||||
The following table represents the balance in the allowance for loan losses and the recorded investment in loans by portfolio segment, as defined under ASC 310-10, and based on impairment method as of December 31, 2015, 2014 and 2013. The loan segment represents the categories that the Bank develops to determine its allowance for loan losses.
| December 31, 2015 | Commercial Real Estate Mortgage Loans | Multi-family Loans | Residential Real Estate Mortgage Loans | Commercial, Financial and Agricultural Loans | Real Estate Construction and Land Loans | Installment/ Consumer Loans | Total | |||||||||||||||||||||
| (In thousands) | ||||||||||||||||||||||||||||
| Allowance for Loan Losses | ||||||||||||||||||||||||||||
| Beginning balance | $ | 6,994 | $ | 2,670 | $ | 2,208 | $ | 4,526 | $ | 1,104 | $ | 135 | $ | 17,637 | ||||||||||||||
| Charge-offs | (50 | ) | — | (249 | ) | (827 | ) | — | (2 | ) | (1,128 | ) | ||||||||||||||||
| Recoveries | — | — | 79 | 149 | — | 7 | 235 | |||||||||||||||||||||
| Provision | 906 | 1,538 | 77 | 1,557 | (74 | ) | (4 | ) | 4,000 | |||||||||||||||||||
| Ending balance | $ | 7,850 | $ | 4,208 | $ | 2,115 | $ | 5,405 | $ | 1,030 | $ | 136 | $ | 20,744 | ||||||||||||||
| Ending balance: individually evaluated for impairment | $ | 20 | $ | — | $ | — | $ | 9 | $ | — | $ | — | $ | 29 | ||||||||||||||
| Ending balance: collectively evaluated for impairment | $ | 7,830 | $ | 4,208 | $ | 2,115 | $ | 5,396 | $ | 1,030 | $ | 136 | $ | 20,715 | ||||||||||||||
| Ending balance: loans acquired with deteriorated credit quality | $ | — | $ | — | $ | — | $ | — | $ | — | $ | — | $ | — | ||||||||||||||
| Loans | $ | 1,053,399 | $ | 350,793 | $ | 392,815 | $ | 501,766 | $ | 91,153 | $ | 17,596 | $ | 2,407,522 | ||||||||||||||
| Ending balance: individually evaluated for impairment | $ | 1,629 | $ | — | $ | 672 | $ | 290 | $ | — | $ | — | $ | 2,591 | ||||||||||||||
| Ending balance: collectively evaluated for impairment | $ | 1,051,135 | $ | 347,054 | $ | 390,876 | $ | 495,045 | $ | 91,153 | $ | 17,596 | $ | 2,392,859 | ||||||||||||||
| Ending balance: loans acquired with deteriorated credit quality(1) | $ | 635 | $ | 3,739 | $ | 1,267 | $ | 6,431 | $ | — | $ | — | $ | 12,072 | ||||||||||||||
(1) Includes loans acquired on June 19, 2015 from CNB, on February 14, 2014 from FNBNY and on May 27, 2011 from HSB.
| Page -51- |
| December 31, 2014 | Commercial Real Estate Mortgage Loans | Multi-family Loans | Residential Real Estate Mortgage Loans | Commercial, Financial and Agricultural Loans | Real Estate Construction and Land Loans | Installment/ Consumer Loans | Total | |||||||||||||||||||||
| (In thousands) | ||||||||||||||||||||||||||||
| Allowance for Loan Losses | ||||||||||||||||||||||||||||
| Beginning balance | $ | 6,279 | $ | 1,597 | $ | 2,712 | $ | 4,006 | $ | 1,206 | $ | 201 | $ | 16,001 | ||||||||||||||
| Charge-offs | (461 | ) | — | (257 | ) | (104 | ) | — | (2 | ) | (824 | ) | ||||||||||||||||
| Recoveries | — | — | 170 | 87 | — | 3 | 260 | |||||||||||||||||||||
| Provision | 1,176 | 1,073 | (417 | ) | 537 | (102 | ) | (67 | ) | 2,200 | ||||||||||||||||||
| Ending balance | $ | 6,994 | $ | 2,670 | $ | 2,208 | $ | 4,526 | $ | 1,104 | $ | 135 | $ | 17,637 | ||||||||||||||
| Ending balance: individually evaluated for impairment | $ | 23 | $ | — | $ | 72 | $ | 79 | $ | — | $ | — | $ | 174 | ||||||||||||||
| Ending balance: collectively evaluated for impairment | $ | 6,971 | $ | 2,670 | $ | 2,136 | $ | 4,447 | $ | 1,104 | $ | 135 | $ | 17,463 | ||||||||||||||
| Ending balance: loans acquired with deteriorated credit quality | $ | — | $ | — | $ | — | $ | — | $ | — | $ | — | $ | — | ||||||||||||||
| Loans | $ | 595,397 | $ | 218,985 | $ | 156,156 | $ | 291,743 | $ | 63,556 | $ | 10,124 | $ | 1,335,961 | ||||||||||||||
| Ending balance: individually evaluated for impairment | $ | 5,136 | $ | — | $ | 383 | $ | 682 | $ | — | $ | — | $ | 6,201 | ||||||||||||||
| Ending balance: collectively evaluated for impairment | $ | 582,946 | $ | 218,985 | $ | 154,897 | $ | 286,368 | $ | 63,556 | $ | 10,124 | $ | 1,316,876 | ||||||||||||||
| Ending balance: loans acquired with deteriorated credit quality(1) | $ | 7,315 | $ | — | $ | 876 | $ | 4,693 | $ | — | $ | — | $ | 12,884 | ||||||||||||||
(1) Includes loans acquired on February 14, 2014 from FNBNY and on May 27, 2011 from HSB
| December 31, 2013 | Commercial Real Estate Mortgage Loans | Multi-family Loans | Residential Real Estate Mortgage Loans | Commercial, Financial and Agricultural Loans | Real Estate Construction and Land Loans | Installment/ Consumer Loans | Total | |||||||||||||||||||||
| (In thousands) | ||||||||||||||||||||||||||||
| Allowance for Loan Losses | ||||||||||||||||||||||||||||
| Beginning balance | $ | 4,445 | $ | 1,239 | $ | 2,803 | $ | 4,349 | $ | 1,375 | $ | 228 | $ | 14,439 | ||||||||||||||
| Charge-offs | — | — | (420 | ) | (420 | ) | (23 | ) | (53 | ) | (916 | ) | ||||||||||||||||
| Recoveries | — | — | 34 | 87 | 2 | 5 | 128 | |||||||||||||||||||||
| Provision | 1,834 | 358 | 295 | (10 | ) | (148 | ) | 21 | 2,350 | |||||||||||||||||||
| Ending balance | $ | 6,279 | $ | 1,597 | $ | 2,712 | $ | 4,006 | $ | 1,206 | $ | 201 | $ | 16,001 | ||||||||||||||
| Ending balance: individually evaluated for impairment | $ | 116 | $ | — | $ | 122 | $ | — | $ | — | $ | — | $ | 238 | ||||||||||||||
| Ending balance: collectively evaluated for impairment | $ | 6,163 | $ | 1,597 | $ | 2,590 | $ | 4,006 | $ | 1,206 | $ | 201 | $ | 15,763 | ||||||||||||||
| Ending balance: loans acquired with deteriorated credit quality | $ | — | $ | — | $ | — | $ | — | $ | — | $ | — | $ | — | ||||||||||||||
| Loans | $ | 484,900 | $ | 107,488 | $ | 153,417 | $ | 209,452 | $ | 46,981 | $ | 9,287 | $ | 1,011,525 | ||||||||||||||
| Ending balance: individually evaluated for impairment | $ | 5,950 | $ | — | $ | 2,382 | $ | 526 | $ | — | $ | — | $ | 8,858 | ||||||||||||||
| Ending balance: collectively evaluated for impairment | $ | 478,129 | $ | 107,488 | $ | 151,035 | $ | 208,677 | $ | 46,641 | $ | 9,287 | $ | 1,001,257 | ||||||||||||||
| Ending balance: loans acquired with deteriorated credit quality(1) | $ | 821 | $ | — | $ | — | $ | 249 | $ | 340 | $ | — | $ | 1,410 | ||||||||||||||
(1) Includes loans acquired on May 27, 2011 from HSB
The recorded investment in loans excludes accrued interest receivable and loan origination fees, net due to immateriality.
| Page -52- |
Credit Quality Indicators
The Company categorizes loans into risk categories based on relevant information about the ability of borrowers to service their debt including repayment patterns, probable incurred losses, past loss experience, current economic conditions, and various types of concentrations of credit. Assigned risk rating grades are continuously updated as new information is obtained. Loans risk rated special mention, substandard and doubtful are reviewed on a quarterly basis. The Company uses the following definitions for risk rating grades:
Pass: Loans classified as pass include current loans performing in accordance with contractual terms, pools of homogenous residential real estate and installment/consumer loans that are not individually risk rated and loans which exhibit certain risk factors that do not require greater than usual monitoring by management.
Special mention: Loans classified as special mention, while generally not delinquent, have potential weaknesses that deserve management's close attention. If left uncorrected, these potential weaknesses may result in deterioration of the repayment prospects for the loan or in the Bank's credit position at some future date.
Substandard: Loans classified as substandard have a well-defined weakness or weaknesses that jeopardize the liquidation of the debt. There is a distinct possibility that the Bank will sustain some loss if the deficiencies are not corrected.
Doubtful: Loans classified as doubtful have all the weaknesses inherent in a substandard loan, and may also be at delinquency status and have defined weaknesses based on currently existing facts, conditions and values making collection or liquidation in full highly questionable and improbable.
The following table represents loans by class categorized by internally assigned risk grades:
| Grades: | ||||||||||||||||||||
| December 31, 2015 | Pass | Special Mention | Substandard | Doubtful | Total | |||||||||||||||
| (In thousands) | ||||||||||||||||||||
| Commercial real estate: | ||||||||||||||||||||
| Owner occupied | $ | 465,967 | $ | 3,239 | $ | 2,115 | $ | — | $ | 471,321 | ||||||||||
| Non-owner occupied | 573,049 | 542 | 8,487 | — | 582,078 | |||||||||||||||
| Multi-family loans | 350,785 | — | 8 | — | 350,793 | |||||||||||||||
| Residential real estate: | ||||||||||||||||||||
| Residential | 323,557 | 87 | 845 | — | 324,489 | |||||||||||||||
| Home equity | 66,910 | 523 | 893 | — | 68,326 | |||||||||||||||
| Commercial: | ||||||||||||||||||||
| Secured | 121,037 | 151 | 2,549 | — | 123,737 | |||||||||||||||
| Unsecured | 370,642 | 3,191 | 4,196 | — | 378,029 | |||||||||||||||
| Real estate construction and land loans | 91,153 | — | — | — | 91,153 | |||||||||||||||
| Installment/consumer loans | 17,496 | — | 100 | — | 17,596 | |||||||||||||||
| Total loans | $ | 2,380,596 | $ | 7,733 | $ | 19,193 | $ | — | $ | 2,407,522 | ||||||||||
At December 31, 2015 there were $0.02 million and $9.6 million, respectively, of acquired CNB loans included in the special mention and substandard grades and $0.1 million and $0.2 million, respectively, of acquired FNBNY loans included in the special mention and substandard grades.
| Page -53- |
| Grades: | ||||||||||||||||||||
| December 31, 2014 | Pass | Special Mention | Substandard | Doubtful | Total | |||||||||||||||
| (In thousands) | ||||||||||||||||||||
| Commercial real estate: | ||||||||||||||||||||
| Owner occupied | $ | 243,512 | $ | 7,133 | $ | 5,963 | $ | — | $ | 256,608 | ||||||||||
| Non-owner occupied | 334,790 | 171 | 3,828 | — | 338,789 | |||||||||||||||
| Multi-family loans | 217,855 | 202 | 928 | — | 218,985 | |||||||||||||||
| Residential real estate: | ||||||||||||||||||||
| First lien | 88,405 | — | 1,613 | — | 90,018 | |||||||||||||||
| Home equity | 64,994 | 212 | 932 | — | 66,138 | |||||||||||||||
| Commercial: | ||||||||||||||||||||
| Secured | 91,007 | 621 | 2,339 | — | 93,967 | |||||||||||||||
| Unsecured | 191,942 | 4,168 | 1,666 | — | 197,776 | |||||||||||||||
| Real estate construction and land loans | 63,190 | — | 366 | — | 63,556 | |||||||||||||||
| Installment/consumer loans | 9,921 | 100 | 103 | — | 10,124 | |||||||||||||||
| Total loans | $ | 1,305,616 | $ | 12,607 | $ | 17,738 | $ | — | $ | 1,335,961 | ||||||||||
At December 31, 2014 there were $0.3 million and $1.5 million, respectively, of acquired FNBNY loans included in the special mention and substandard grades.
Past Due and Nonaccrual Loans
The following table represents the aging of the recorded investment in past due loans as of December 31, 2015 and December 31, 2014 by class of loans, as defined by ASC 310-10:
| December 31, 2015 | 30-59 Days Past Due | 60-89 Days Past Due | >90 Days Past Due And Accruing | Nonaccrual Including 90 Days or More Past Due | Total Past Due and Nonaccrual | Current | Total Loans | |||||||||||||||||||||
| (In thousands) | ||||||||||||||||||||||||||||
| Commercial real estate: | ||||||||||||||||||||||||||||
| Owner occupied | $ | — | $ | — | $ | 435 | $ | 631 | $ | 1,066 | $ | 470,255 | $ | 471,321 | ||||||||||||||
| Non-owner occupied | — | — | — | — | — | 582,078 | 582,078 | |||||||||||||||||||||
| Multi-family loans | — | — | — | — | — | 350,793 | 350,793 | |||||||||||||||||||||
| Residential real estate: | ||||||||||||||||||||||||||||
| Residential mortgages | 939 | 245 | — | 62 | 1,246 | 323,243 | 324,489 | |||||||||||||||||||||
| Home equity | 69 | 100 | 188 | 610 | 967 | 67,359 | 68,326 | |||||||||||||||||||||
| Commercial: | ||||||||||||||||||||||||||||
| Secured | — | — | 341 | — | 341 | 123,396 | 123,737 | |||||||||||||||||||||
| Unsecured | 128 | 24 | — | 44 | 196 | 377,833 | 378,029 | |||||||||||||||||||||
| Real estate construction and land loans | — | — | — | — | — | 91,153 | 91,153 | |||||||||||||||||||||
| Installment/consumer loans | — | — | — | 3 | 3 | 17,593 | 17,596 | |||||||||||||||||||||
| Total loans | $ | 1,136 | $ | 369 | $ | 964 | $ | 1,350 | $ | 3,819 | $ | 2,403,703 | $ | 2,407,522 | ||||||||||||||
| December 31, 2014 | 30-59 Days Past Due | 60-89 Days Past Due | >90 Days Past Due And Accruing | Nonaccrual Including 90 Days or More Past Due | Total Past Due and Nonaccrual | Current | Total Loans | |||||||||||||||||||||
| (In thousands) | ||||||||||||||||||||||||||||
| Commercial real estate: | ||||||||||||||||||||||||||||
| Owner occupied | $ | — | $ | 184 | $ | — | $ | 595 | $ | 779 | $ | 255,829 | $ | 256,608 | ||||||||||||||
| Non-owner occupied | 181 | — | 10 | 10 | 201 | 338,588 | 338,789 | |||||||||||||||||||||
| Multi-family loans | — | — | — | — | — | 218,985 | 218,985 | |||||||||||||||||||||
| Residential real estate: | ||||||||||||||||||||||||||||
| First lien | — | — | — | 143 | 143 | 89,875 | 90,018 | |||||||||||||||||||||
| Home equity | 919 | — | 134 | 374 | 1,427 | 64,711 | 66,138 | |||||||||||||||||||||
| Commercial: | ||||||||||||||||||||||||||||
| Secured | — | — | — | — | — | 93,967 | 93,967 | |||||||||||||||||||||
| Unsecured | 25 | — | — | 222 | 247 | 197,529 | 197,776 | |||||||||||||||||||||
| Real estate construction and land loans | — | — | — | — | — | 63,556 | 63,556 | |||||||||||||||||||||
| Installment/consumer loans | 1 | — | — | 3 | 4 | 10,120 | 10,124 | |||||||||||||||||||||
| Total loans | $ | 1,126 | $ | 184 | $ | 144 | $ | 1,347 | $ | 2,801 | $ | 1,333,160 | $ | 1,335,961 | ||||||||||||||
| Page -54- |
As of December 31, 2015, there were $1.2 million of CNB acquired loans that were 30-89 days past due. There were no FNBNY acquired loans that were 30-89 days past due at December 31, 2015 and 2014. All loans 90 days or more past due that are still accruing interest represent loans that were acquired from CNB and FNBNY which were recorded at fair value upon acquisition. These loans are considered to be accruing as management can reasonably estimate future cash flows and expect to fully collect the carrying value of these acquired loans. Therefore, the difference between the carrying value of these loans and their expected cash flows is being accreted into income.
Impaired Loans
As of December 31, 2015 and 2014, the Company had impaired loans as defined by FASB ASC No. 310, “Receivables” of $2.6 million and $6.2 million, respectively. For a loan to be considered impaired, management determines after review whether it is probable that the Bank will not be able to collect all amounts due according to the contractual terms of the loan agreement. Management applies its normal loan review procedures in making these judgments. Impaired loans include individually classified nonaccrual loans and troubled debt restructured (“TDR”) loans. For impaired loans, the Bank evaluates the impairment of the loan in accordance with FASB ASC 310-10-35-22. Impairment is determined based on the present value of expected future cash flows discounted at the loan’s effective interest rate. For loans that are collateral dependent, the fair value of the collateral is used to determine the fair value of the loan. The fair value of the collateral is determined based upon recent appraised values. The fair value of the collateral or present value of expected cash flows is compared to the carrying value to determine if any write-down or specific loan loss allowance allocation is required. These methods of fair value measurement for impaired loans are considered level 3 within the fair value hierarchy described in FASB ASC 820-10-50-5.
The following tables represent impaired loans by class at December 31, 2015, 2014 and 2013:
| December 31, 2015 | Recorded Investment | Unpaid Principal Balance | Related Allocated Allowance | Average Recorded Investment | Interest Income Recognized | |||||||||||||||
| (In thousands) | ||||||||||||||||||||
| With no related allowance recorded: | ||||||||||||||||||||
| Commercial real estate: | ||||||||||||||||||||
| Owner occupied | $ | 384 | $ | 564 | $ | — | $ | 412 | $ | 10 | ||||||||||
| Non-owner occupied | 927 | 928 | — | 938 | 62 | |||||||||||||||
| Residential real estate: | ||||||||||||||||||||
| Residential mortgages | 62 | 73 | — | 66 | — | |||||||||||||||
| Home equity | 610 | 700 | — | 631 | — | |||||||||||||||
| Commercial: | ||||||||||||||||||||
| Secured | 96 | 96 | — | 93 | 6 | |||||||||||||||
| Unsecured | — | — | — | — | — | |||||||||||||||
| Total with no related allowance recorded | 2,079 | 2,361 | — | 2,140 | 78 | |||||||||||||||
| With an allowance recorded: | ||||||||||||||||||||
| Commercial real estate – Owner occupied | — | — | — | — | — | |||||||||||||||
| Commercial real estate – Non-owner occupied | 318 | 318 | 20 | 320 | 15 | |||||||||||||||
| Residential real estate– Residential mortgages | — | — | — | — | — | |||||||||||||||
| Residential real estate – Home equity | — | — | — | — | — | |||||||||||||||
| Commercial–Secured | — | — | — | — | — | |||||||||||||||
| Commercial–Unsecured | 194 | 194 | 9 | 223 | 17 | |||||||||||||||
| Total with an allowance recorded | 512 | 512 | 29 | 543 | 32 | |||||||||||||||
| Total: | ||||||||||||||||||||
| Commercial real estate: | ||||||||||||||||||||
| Owner occupied | 384 | 564 | — | 412 | 10 | |||||||||||||||
| Non-owner occupied | 1,245 | 1,246 | 20 | 1,258 | 77 | |||||||||||||||
| Residential real estate: | ||||||||||||||||||||
| Residential mortgages | 62 | 73 | — | 66 | — | |||||||||||||||
| Home equity | 610 | 700 | — | 631 | — | |||||||||||||||
| Commercial: | ||||||||||||||||||||
| Secured | 96 | 96 | — | 93 | 6 | |||||||||||||||
| Unsecured | 194 | 194 | 9 | 223 | 17 | |||||||||||||||
| Total | $ | 2,591 | $ | 2,873 | $ | 29 | $ | 2,683 | $ | 110 | ||||||||||
| Page -55- |
| December 31, 2014 | Recorded Investment | Unpaid Principal Balance | Related Allocated Allowance | Average Recorded Investment | Interest Income Recognized | |||||||||||||||
| (In thousands) | ||||||||||||||||||||
| With no related allowance recorded: | ||||||||||||||||||||
| Commercial real estate: | ||||||||||||||||||||
| Owner occupied | $ | 3,562 | $ | 3,707 | $ | — | $ | 3,974 | $ | 113 | ||||||||||
| Non-owner occupied | 1,251 | 1,568 | — | 961 | 63 | |||||||||||||||
| Residential real estate: | ||||||||||||||||||||
| Residential mortgages | 143 | 231 | — | 199 | — | |||||||||||||||
| Home equity | 169 | 377 | — | 229 | — | |||||||||||||||
| Commercial: | ||||||||||||||||||||
| Secured | 345 | 345 | — | 354 | 25 | |||||||||||||||
| Unsecured | — | — | — | — | — | |||||||||||||||
| Total with no related allowance recorded | 5,470 | 6,228 | — | 5,717 | 201 | |||||||||||||||
| With an allowance recorded: | ||||||||||||||||||||
| Commercial real estate – Owner occupied | — | — | — | — | — | |||||||||||||||
| Commercial real estate – Non-owner occupied | 323 | 323 | 23 | 27 | — | |||||||||||||||
| Residential real estate– Residential mortgages | — | — | — | — | — | |||||||||||||||
| Residential real estate – Home equity | 71 | 89 | 72 | 75 | 13 | |||||||||||||||
| Commercial–Secured | — | — | — | — | — | |||||||||||||||
| Commercial–Unsecured | 337 | 339 | 79 | 206 | — | |||||||||||||||
| Total with an allowance recorded | 731 | 751 | 174 | 308 | 13 | |||||||||||||||
| Total: | ||||||||||||||||||||
| Commercial real estate: | ||||||||||||||||||||
| Owner occupied | 3,562 | 3,707 | — | 3,974 | 113 | |||||||||||||||
| Non-owner occupied | 1,574 | 1,891 | 23 | 988 | 63 | |||||||||||||||
| Residential real estate: | ||||||||||||||||||||
| Residential mortgages | 143 | 231 | — | 199 | — | |||||||||||||||
| Home equity | 240 | 466 | 72 | 304 | 13 | |||||||||||||||
| Commercial: | ||||||||||||||||||||
| Secured | 345 | 345 | — | 354 | 25 | |||||||||||||||
| Unsecured | 337 | 339 | 79 | 206 | — | |||||||||||||||
| Total | $ | 6,201 | $ | 6,979 | $ | 174 | $ | 6,025 | $ | 214 | ||||||||||
| Page -56- |
| December 31, 2013 | Recorded Investment | Unpaid Principal Balance | Related Allocated Allowance | Average Recorded Investment | Interest Income Recognized | |||||||||||||||
| (In thousands) | ||||||||||||||||||||
| With no related allowance recorded: | ||||||||||||||||||||
| Commercial real estate: | ||||||||||||||||||||
| Owner occupied | $ | 3,696 | $ | 3,805 | $ | — | $ | 3,730 | $ | 118 | ||||||||||
| Non-owner occupied | 917 | 917 | — | 917 | 60 | |||||||||||||||
| Residential real estate: | ||||||||||||||||||||
| First lien | 1,463 | 2,213 | — | 1,482 | 26 | |||||||||||||||
| Home equity | 689 | 1,046 | — | 633 | — | |||||||||||||||
| Commercial: | ||||||||||||||||||||
| Secured | 352 | 352 | — | 450 | 26 | |||||||||||||||
| Unsecured | 174 | — | — | 232 | 59 | |||||||||||||||
| Total with no related allowance recorded | 7,291 | 8,333 | — | 7,444 | 289 | |||||||||||||||
| With an allowance recorded: | ||||||||||||||||||||
| Commercial real estate – Owner occupied | 720 | 720 | 94 | 420 | — | |||||||||||||||
| Commercial real estate – Non-owner occupied | 617 | 617 | 22 | 515 | — | |||||||||||||||
| Residential real estate – First Lien | 152 | 156 | 42 | 141 | — | |||||||||||||||
| Residential real Estate – Home equity | 78 | 89 | 80 | 81 | — | |||||||||||||||
| Total with an allowance recorded | 1,567 | 1,582 | 238 | 1,157 | — | |||||||||||||||
| Total: | ||||||||||||||||||||
| Commercial real estate: | ||||||||||||||||||||
| Owner occupied | 4,416 | 4,525 | 94 | 4,150 | 118 | |||||||||||||||
| Non-owner occupied | 1,534 | 1,534 | 22 | 1,432 | 60 | |||||||||||||||
| Residential real estate: | ||||||||||||||||||||
| First lien | 1,615 | 2,369 | 42 | 1,623 | 26 | |||||||||||||||
| Home equity | 767 | 1,135 | 80 | 714 | — | |||||||||||||||
| Commercial: | ||||||||||||||||||||
| Secured | 352 | 352 | — | 450 | 26 | |||||||||||||||
| Unsecured | 174 | — | — | 232 | 59 | |||||||||||||||
| Total | $ | 8,858 | $ | 9,915 | $ | 238 | $ | 8,601 | $ | 289 | ||||||||||
The recorded investment in loans excludes accrued interest receivable and loan origination fees, net due to immateriality. For purposes of this disclosure, the unpaid principal balance is not reduced for partial charge-offs.
The Bank had $250,000 other real estate owned at December 31, 2015 and none at December 31, 2014.
Troubled Debt Restructurings
The terms of certain loans were modified and are considered troubled debt restructurings (“TDR”). The modification of the terms of such loans included one or a combination of the following: a reduction of the stated interest rate of the loan; an extension of the maturity date at a stated rate of interest lower than the current market rate for new debt with similar risk; or a permanent reduction of the recorded investment in the loan. The modification of these loans involved a loan to borrowers who were experiencing financial difficulties.
In order to determine whether a borrower is experiencing financial difficulty, an evaluation is performed to determine if that borrower is currently in payment default under any of its obligations or whether there is a probability that the borrower will be in payment default on any of its debt in the foreseeable future without the modification. This evaluation is performed under the Company’s internal underwriting policy.
| Page -57- |
The following table presents loans by class modified as troubled debt restructurings:
| Years Ended December 31, | 2015 | 2014 | 2013 | |||||||||||||||||||||||||||||||||
| Number of Contracts | Pre- Modification Outstanding Recorded Investment | Post- Modification Outstanding Recorded Investment | Number of Contracts | Pre- Modification Outstanding Recorded Investment | Post- Modification Outstanding Recorded Investment | Number of Contracts | Pre- Modification Outstanding Recorded Investment | Post- Modification Outstanding Recorded Investment | ||||||||||||||||||||||||||||
| (Dollars in thousands) | ||||||||||||||||||||||||||||||||||||
| Trouble Debt Restructurings | ||||||||||||||||||||||||||||||||||||
| Commercial real estate: | ||||||||||||||||||||||||||||||||||||
| Owner occupied | — | $ | — | $ | — | — | $ | — | $ | — | 1 | $ | 720 | $ | 720 | |||||||||||||||||||||
| Non-owner occupied | — | — | — | 1 | 323 | 323 | 1 | 620 | 620 | |||||||||||||||||||||||||||
| Residential real estate: | ||||||||||||||||||||||||||||||||||||
| Home equity: | — | — | — | 1 | 127 | 127 | — | — | — | |||||||||||||||||||||||||||
| Commercial: | ||||||||||||||||||||||||||||||||||||
| Unsecured | 3 | 160 | 160 | 1 | 127 | 127 | 1 | 33 | 33 | |||||||||||||||||||||||||||
| Installment/consumer loans | — | — | — | 1 | 5 | 5 | — | — | — | |||||||||||||||||||||||||||
| Total loans | 3 | $ | 160 | $ | 160 | 4 | $ | 582 | $ | 582 | 3 | $ | 1,373 | $ | 1,373 | |||||||||||||||||||||
The TDRs described above did not increase the allowance for loan losses during the years ended December 31, 2015, 2014 and 2013.
There were $0.7 million and $0.5 million of charge-offs related to TDRs during the years ended December 31, 2015 and 2014, respectively. There were no charge-offs related to TDRs during the year ended December 31, 2013. There were no loans modified as TDRs during 2015 and 2014 for which there was a payment default within twelve months following the modification. During 2013, there was one loan modified as a TDR for which there was a payment default within twelve months following the modification. A loan is considered to be in payment default once it is 30 days contractually past due under the modified terms. The Bank had no commitments to lend additional amounts to loans that were classified as TDRs.
At December 31, 2015 and 2014, the Company had $0.1 million and $0.5 million, respectively of nonaccrual TDR loans and $1.7 million and $5.0 million, respectively of performing TDRs. At December 31, 2015 and 2014, total nonaccrual TDR loans are secured with collateral that has an appraised value of $0.3 million and $0.9 million, respectively.
The terms of certain other loans were modified during the year ended December 31, 2015 that did not meet the definition of a TDR. These loans have a total recorded investment as of December 31, 2015 of $11.0 million. The modification of these loans involved a modification of the terms of loans to borrowers who were not experiencing financial difficulties.
Acquired Loans
Loans acquired in a business combination are recorded at their fair value at the acquisition date. Credit discounts are included in the determination of fair value; therefore, an allowance for loan losses is not recorded at the acquisition date.
In determining the acquisition date fair value of purchased loans, acquired loans are aggregated into pools of loans with common characteristics. Each loan is reviewed at acquisition to determine if it should be accounted for as a loan that has experienced credit deterioration and it is probable that at acquisition, the Company will not be able to collect all the contractual principle and interest due from the borrower. All loans with evidence of deterioration in credit quality are considered purchased credit impaired (“PCI”) loans unless the loan type is specifically excluded from the scope of ASC 310-30 “Loans and Debt Securities Acquired with Deteriorated Credit Quality,” such as loans with active revolver features or because management has minimal doubt in the collection of the loan.
The Bank makes an estimate of the loans’ contractual principal and contractual interest payments as well as the total cash flows it expects to collect from the pools of loans, which includes undiscounted expected principal and interest. The excess of contractual amounts over the total cash flows expected to be collected from the loans is referred to as non-accretable difference, which is not accreted into income. The excess of the expected undiscounted cash flows over the fair value of the loans is referred to as accretable discount. Accretable discount is recognized as interest income on a level-yield basis over the life of the loans. Management has not included prepayment assumptions in its modeling of contractual or expected cash flows. The Bank continues to estimate cash flows expected to be collected over the life of the loans. Subsequent increases in total cash flows expected to be collected are recognized as an adjustment to the accretable yield with the amount of periodic accretion adjusted over the remaining life of the loans. Subsequent decreases in cash flows expected to be collected over the life of the loans are recognized as impairment in the current period through allowance for loan losses.
| Page -58- |
A PCI loan may be resolved either through a sale of the loan, by working with the customer and obtaining partial or full repayment, by short sale of the collateral, or by foreclosure. When a loan accounted for in a pool is resolved, it is removed from the pool at its carrying amount. Any differences between the amounts received and the outstanding balance are absorbed by the non-accretable difference of the pool. For loans not accounted for in pools, a gain or loss on resolution would be recognized based on the difference between the proceeds received and the carrying amount of the loan.
Payments received earlier than expected or in excess of expected cash flows from sales or other resolutions may result in the carrying value of a pool being reduced to zero even though outstanding contractual balances and expected cash flows remain related to loans in the pool. Once the carrying value of a pool is reduced to zero, any future proceeds, which may include cash or real estate acquired in foreclosure, from the remaining loans, representing further realization of accretable yield, are recognized as interest income upon receipt.
At the acquisition date, the purchased credit impaired loans acquired as part of the FNBNY acquisition had contractually required principal and interest payments receivable of $40.3 million; expected cash flows of $28.4 million; and a fair value (initial carrying amount) of $21.8 million. The difference between the contractually required principal and interest payments receivable and the expected cash flows ($11.9 million) represented the non-accretable difference. The difference between the expected cash flows and fair value ($6.6) million represented the initial accretable yield. At December 31, 2015, the contractually required principal and interest payments receivable and carrying amount of the purchased credit impaired loans was $13.9 million and $8.3 million, respectively, with a remaining non-accretable difference of $1.5 million.
At the acquisition date, the purchased credit impaired loans acquired as part of the CNB acquisition had contractually required principal and interest payments receivable of $8.2 million; expected cash flows of $3.0 million; and a fair value (initial carrying amount) of $2.7 million. The difference between the contractually required principal and interest payments receivable and the expected cash flows ($5.2 million) represented the non-accretable difference. The difference between the expected cash flows and fair value ($0.3) million represented the initial accretable yield. At December 31, 2015, the contractually required principal and interest payments receivable and carrying amount of the purchased credit impaired loans was $8.2 million and $2.8 million, respectively, with a remaining non-accretable difference of $5.2 million. Considering the closing date of the transaction, the amounts presented are preliminary and subject to adjustment as fair value assessments are finalized. Refer to Note 20. “Business Combinations,” for details related to the CNB acquisition.
The following table summarizes the activity in the accretable yield for the purchased credit impaired loans:
| December 31, | 2015 | 2014 | ||||||
| (In thousands) | ||||||||
| Balance at the beginning of the period | $ | 8,432 | $ | — | ||||
| Accretable discount arising from acquisition of PCI loans | 259 | 6,580 | ||||||
| Accretion | (3,570 | ) | (1,598 | ) | ||||
| Reclassification from (to) nonaccretable difference during the period | 1,992 | 3,450 | ||||||
| Accretable discount at end of period | $ | 7,113 | $ | 8,432 | ||||
The allowance for loan losses was not increased during the years ended December 31, 2015 and 2014 for those purchased credit impaired loans disclosed above. In addition, no allowances for loan losses were reversed during 2015.
Related Party Loans
Certain directors, executive officers, and their related parties, including their immediate families and companies in which they are principal owners, were loan customers of the Bank during 2015 and 2014.
The following table sets forth selected information about related party loans at December 31, 2015:
| Balance Outstanding | ||||
| (In thousands) | ||||
| Balance at January 1, 2015 | $ | 2,759 | ||
| New loans | — | |||
| Effective change in related parties | 20,118 | |||
| Advances | 13 | |||
| Repayments | (101 | ) | ||
| Balance at December 31, 2015 | $ | 22,789 | ||
| Page -59- |
4. PREMISES AND EQUIPMENT
Premises and equipment consist of:
| December 31, | 2015 | 2014 | ||||||
| (In thousands) | ||||||||
| Land | $ | 7,381 | $ | 7,381 | ||||
| Building and improvements | 14,839 | 14,829 | ||||||
| Furniture, fixtures and equipment | 22,292 | 19,134 | ||||||
| Leasehold improvements | 17,887 | 11,243 | ||||||
| 62,399 | 52,587 | |||||||
| Less: accumulated depreciation and amortization | (22,804 | ) | (20,163 | ) | ||||
| Total | $ | 39,595 | $ | 32,424 | ||||
Depreciation and amortization amounted to $3.6 million, $2.6 million and $2.0 million for 2015, 2014 and 2013, respectively.
5. GOODWILL AND OTHER INTANGIBLE ASSETS
FASB ASC No. 350, Intangibles —Goodwill and Other, requires a company to perform an impairment test on goodwill annually, or more frequently if events or changes in circumstance indicate that the asset might be impaired, by computing the fair value of such goodwill to its recorded or carrying amount. If the carrying amount of goodwill exceeds the fair value, an impairment charge must be recorded in an amount equal to the excess. The FASB issued ASU No. 2011-08, “Testing Goodwill for Impairment,” which permit an entity to first assess qualitative factors to determine whether it is more likely than not that the fair value of a reporting unit is less than its carrying amount as a basis for determining whether it is necessary to perform the two-step goodwill impairment test described in Topic 350. The more-likely-than-not threshold is defined as having a likelihood of more than 50 percent.
The Company tested goodwill for impairment during the fourth quarter of 2015. The Company has one reporting unit, Bridge Bancorp. Inc. and as such, evaluated goodwill at that reporting unit level. At December 31, 2015, the Company’s reporting unit elected to perform a qualitative assessment to determine if it was more likely than not that the fair value of the reporting unit exceeded its carrying value, including goodwill. The qualitative assessment indicated that it was more likely than not that the fair value of the reporting unit exceeded its carrying value and no further testing was required. The results of this assessment indicated that goodwill was not impaired.
Goodwill
The change in goodwill during the year is as follows:
| 2015 | 2014 | |||||||
| (In thousands) | ||||||||
| Balance at January 1 | $ | 9,450 | $ | 2,034 | ||||
| Acquired goodwill | 88,995 | 7,416 | ||||||
| Impairment | — | — | ||||||
| Balance at December 31 | $ | 98,445 | $ | 9,450 | ||||
Acquired Intangible Assets
Acquired intangible assets were as follows at year end:
| 2015 | 2014 | |||||||||||||||
| At December 31, | Gross Carrying Amount | Accumulated Amortization | Gross Carrying Amount | Accumulated Amortization | ||||||||||||
| (In thousands) | ||||||||||||||||
| Amortized intangible assets: | ||||||||||||||||
| Core deposit intangibles | $ | 7,211 | $ | 1,186 | $ | 1,311 | $ | 469 | ||||||||
| Non-compete intangible | 2,188 | 730 | — | — | ||||||||||||
| Total | $ | 9,399 | $ | 1,916 | $ | 1,311 | $ | 469 | ||||||||
Aggregate amortization expense for the years ended December 31, 2015, 2014, and 2013 was $1,447,000, $300,000, and $59,000, respectively.
| Page -60- |
Estimated amortization expense for each of the next five years and thereafter is as follows:
| Total | ||||
| (In thousands) | ||||
| 2016 | $ | 2,272 | ||
| 2017 | 1,412 | |||
| 2018 | 916 | |||
| 2019 | 786 | |||
| 2020 | 656 | |||
| Thereafter | 1,441 | |||
| $ | 7,483 | |||
6. DEPOSITS
Time Deposits
The following table sets forth the remaining maturities of the Bank’s time deposits at December 31, 2015:
| Total | ||||
| (In thousands) | ||||
| 2016 | $ | 185,650 | ||
| 2017 | 54,871 | |||
| 2018 | 25,832 | |||
| 2019 | 20,255 | |||
| 2020 | 6,247 | |||
| Total | $ | 292,855 | ||
The deposits that meet or exceed the FDIC insurance limit of $250,000 at December 31, 2015 and 2014 were $52.0 million and $27.6 million, respectively. Deposits from principal officers, directors and their affiliates at December 31, 2015 and 2014 were approximately $13.3 million and $2.6 million, respectively.
7. SECURITIES SOLD UNDER AGREEMENTS TO REPURCHASE
At December 31, 2015 and 2014, securities sold under agreements to repurchase totaled $50.9 million and $36.3 million, respectively, and were secured by U.S. GSE, residential mortgage-backed securities and residential collateralized mortgage obligations with carrying amounts of $55.9 million and $40.3 million, respectively.
Securities sold under agreements to repurchase are financing arrangements with $0.9 million maturing during the first quarter of 2016 and $50.0 million maturing during the fourth quarter of 2016. At maturity, the securities underlying the agreements are returned to the Company. Information concerning the securities sold under agreements to repurchase is summarized as follows:
| 2015 | 2014 | |||||||
| (Dollars in thousands) | ||||||||
| Average daily balance during the year | $ | 30,317 | $ | 14,185 | ||||
| Average interest rate during the year | 0.65 | % | 2.71 | % | ||||
| Maximum month-end balance during the year | $ | 51,400 | $ | 36,879 | ||||
| Weighted average interest rate at year-end | 0.64 | % | 2.67 | % | ||||
The primary risk associated with these secured borrowings is the requirement to pledge a market value based balance of collateral in excess of the borrowed amount. The excess collateral pledged represents an unsecured exposure to the lending counterparty. As the market value of the collateral changes, both through changes in discount rates and spreads as well as related cash flows, additional collateral may need to be pledged. In accordance with our policies, eligible counterparties are defined and monitored to minimize our exposure.
8. FEDERAL HOME LOAN BANK ADVANCES
The following table sets forth the contractual maturities and weighted average interest rates of FHLB advances for each of the next five years. There are no FHLB advances with contractual maturities after 2019.
| Page -61- |
| December 31, 2015 | ||||||||
| Contractual Maturity | Amount | Weighted Average Rate | ||||||
| (Dollars in thousands) | ||||||||
| Overnight | $ | — | — | % | ||||
| 2016 | 249,599 | 0.75 | % | |||||
| 2017 | 19,149 | 0.74 | ||||||
| 2018 | 25,781 | 1.04 | ||||||
| 2019 | 2,978 | 1.08 | ||||||
| 297,507 | 0.78 | % | ||||||
| $ | 297,507 | 0.78 | % | |||||
| December 31, 2014 | ||||||||
| Contractual Maturity | Amount | Weighted Average Rate | ||||||
| (Dollars in thousands) | ||||||||
| Overnight | $ | 69,000 | 0.32 | % | ||||
| 2015 | 41,508 | 0.37 | % | |||||
| 2016 | 11,703 | 0.69 | ||||||
| 2017 | — | — | ||||||
| 2018 | 16,116 | 1.00 | ||||||
| 69,327 | 0.57 | % | ||||||
| $ | 138,327 | 0.44 | % | |||||
Each advance is payable at its maturity date, with a prepayment penalty for fixed rate advances. The advances were collateralized by $666.3 million and $385.2 million of residential and commercial mortgage loans under a blanket lien arrangement at year end 2015 and 2014, respectively. Based on this collateral and the Company’s holdings of FHLB stock, the Company is eligible to borrow up to a total of $1.1 billion at year end 2015.
9. BORROWED FUNDS
Subordinated Debentures
In September 2015, the Company issued $80.0 million in aggregate principal amount of fixed-to-floating rate subordinated debentures (the “Notes”). $40.0 million of the Notes are callable at par after five years, have a stated maturity of September 30, 2025 and bear interest at a fixed annual rate of 5.25% per year, from and including September 21, 2015 until but excluding September 30, 2020. From and including September 30, 2020 to the maturity date or early redemption date, the interest rate will reset quarterly to an annual interest rate equal to the then-current three-month LIBOR plus 360 basis points. The remaining $40.0 million of the Notes are callable at par after ten years, have a stated maturity of September 30, 2030 and bear interest at a fixed annual rate of 5.75% per year, from and including September 21, 2015 until but excluding September 30, 2025. From and including September 30, 2025 to the maturity date or early redemption date, the interest rate will reset quarterly to an annual interest rate equal to the then-current three-month LIBOR plus 345 basis points.
The Notes are included in Tier 2 capital (with certain limitations applicable) under current regulatory guidelines and interpretations.
Junior Subordinated Debentures
In December 2009, the Company completed the private placement of $16.0 million in aggregate liquidation amount of 8.50% cumulative convertible trust preferred securities (the "TPS”), through its subsidiary, Bridge Statutory Capital Trust II. The TPS have a liquidation amount of $1,000 per security and are convertible into our common stock, at an effective conversion price of $31 per share. The TPS mature in 30 years but are callable by the Company at par any time after September 30, 2014.
The Company issued $16.0 million of junior subordinated debentures (the “Debentures”) to the trust in exchange for ownership of all of the common security of the trust and the proceeds of the preferred securities sold by the trust. In accordance with current accounting guidance, the trust is not consolidated in the Company’s financial statements, but rather the Debentures are shown as a liability. The Debentures bear interest at a fixed rate equal to 8.50% and mature on December 31, 2039. Consistent with regulatory
| Page -62- |
requirements, the interest payments may be deferred for up to 5 years, and are cumulative. The Debentures have the same prepayment provisions as the TPS.
The Debentures may be included in Tier I capital (with certain limitations applicable) under current regulatory guidelines and interpretations.
10. DERIVATIVES
Cash Flow Hedges of Interest Rate Risk
The Company utilizes interest rate swap agreements as part of its asset liability management strategy to help manage its interest rate risk position. The notional amount of the interest rate swap does not represent amounts exchanged by the parties. The amount exchanged is determined by reference to the notional amount and the other terms of the individual interest rate swap agreements.
Interest rate swaps with notional amounts totaling $125.0 million and $75.0 million as of December 31, 2015 and 2014, respectively, were designated as cash flow hedges of certain Federal Home Loan Bank advances and repurchase agreements. The swaps were determined to be fully effective during the periods presented and therefore no amount of ineffectiveness has been included in net income. The aggregate fair value of the swaps is recorded in other assets/(other liabilities) with changes in fair value recorded in other comprehensive income (loss). The amount included in accumulated other comprehensive income (loss) would be reclassified to current earnings should the hedges no longer be considered effective. The Company expects the hedges to remain fully effective during the remaining term of the swaps.
Summary information about the interest rate swaps designated as cash flow hedges as of December 31 is as follows:
| (Dollars in thousands) | 2015 | 2014 | ||||||
| Notional amounts | $ | 125,000 | $ | 75,000 | ||||
| Weighted average pay rates | 1.58 | % | 1.39 | % | ||||
| Weighted average receive rates | 0.51 | % | 0.24 | % | ||||
| Weighted average maturity | 3.22 years | 3.86 years | ||||||
Interest expense recorded on these swap transactions totaled $657,000 and $470,000 during 2015 and 2014, respectively, and is reported as a component of interest expense on FHLB Advances. Amounts reported in accumulated other comprehensive income related to derivatives will be reclassified to interest income/expense as interest payments are made/received on the Company’s variable-rate assets/liabilities. During the year ended December 31, 2015, the Company had $657,000 of reclassifications to interest expense. During the next twelve months, the Company estimates that $762,000 will be reclassified as an increase in interest expense.
The following tables present the net gains (losses) recorded in accumulated other comprehensive income and the Consolidated Statements of Income relating to the cash flow derivative instruments for the twelve months ended December 31:
| 2015 | ||||||||||||
| (In thousands) | Amount of (loss) recognized in OCI (Effective Portion) | Amount of (loss) reclassified from OCI to interest expense | Amount of (loss) recognized in other non- interest income (Ineffective Portion) | |||||||||
| Interest rate contracts | $ | (1,008 | ) | $ | (657 | ) | $ | — | ||||
| 2014 | ||||||||||||
| (In thousands) | Amount of (loss) recognized in OCI (Effective Portion) | Amount of (loss) reclassified from OCI to interest expense | Amount of (loss) recognized in other non- interest income (Ineffective Portion) | |||||||||
| Interest rate contracts | $ | (1,249 | ) | $ | (470 | ) | $ | — | ||||
| Page -63- |
The following table reflects the cash flow hedge included in the Consolidated Balance Sheets:
| As of December 31, | 2015 | 2014 | ||||||||||||||||||||||
| Fair | Fair | Fair | Fair | |||||||||||||||||||||
| Notional | Value | Value | Notional | Value | Value | |||||||||||||||||||
| (In thousands) | Amount | Asset | Liability | Amount | Asset | Liability | ||||||||||||||||||
| Included in other assets/(liabilities): | ||||||||||||||||||||||||
| Interest rate swaps related to FHLB Advances | $ | 100,000 | $ | 14 | $ | (713 | ) | $ | 40,000 | $ | 32 | $ | (280 | ) | ||||||||||
| Forward starting interest rate swap related to repurchase agreements | — | — | — | 10,000 | — | (445 | ) | |||||||||||||||||
| Forward starting interest rate swap related to FHLB Advances | 25,000 | — | (595 | ) | 25,000 | — | (250 | ) | ||||||||||||||||
Non-Designated Hedges
Derivatives not designated as hedges may be used to manage the Company’s exposure to interest rate movements or to provide service to customers but do not meet the requirements for hedge accounting under U.S. GAAP. The Company executes interest rate swaps with commercial lending customers to facilitate their respective risk management strategies. These interest rate swaps with customers are simultaneously offset by interest rate swaps that the Company executes with a third party in order to minimize the net risk exposure resulting from such transactions. These interest-rate swap agreements do not qualify for hedge accounting treatment, and therefore changes in fair value are reported in current period earnings.
The following table presents summary information about these interest rate swaps as of December 31:
| (Dollars in thousands) | 2015 | 2014 | ||||||
| Notional amounts | $ | 56,328 | $ | 11,175 | ||||
| Weighted average pay rates | 3.39 | % | 3.28 | % | ||||
| Weighted average receive rates | 3.39 | % | 3.28 | % | ||||
| Weighted average maturity | 3.39 years | 9.64 years | ||||||
| Fair value of combined interest rate swaps | $ | — | $ | — | ||||
Credit-Risk-Related Contingent Features
As of December 31, 2015 the termination value of derivatives in a net liability position, which includes accrued interest but excludes any adjustment for nonperformance risk, related to these agreements was $2.2 million. As of December 31, 2015, the Company has minimum collateral posting thresholds with certain of its derivative counterparties and has posted collateral of $1.9 million against its obligations under these agreements. If the Company had breached any of these provisions at December 31, 2015, it could have been required to settle its obligations under the agreements at the termination value.
11. INCOME TAXES
The components of income tax expense are as follows:
| Years Ended December 31, | 2015 | 2014 | 2013 | |||||||||
| (In thousands) | ||||||||||||
| Current: | ||||||||||||
| Federal | $ | 8,248 | $ | 3,926 | $ | 5,500 | ||||||
| State | 1,230 | 507 | 664 | |||||||||
| 9,478 | 4,433 | 6,164 | ||||||||||
| Deferred: | ||||||||||||
| Federal | 1,457 | 2,187 | 403 | |||||||||
| State | (157 | ) | 619 | 102 | ||||||||
| 1,300 | 2,806 | 505 | ||||||||||
| Income tax expense | $ | 10,778 | $ | 7,239 | $ | 6,669 | ||||||
| Page -64- |
The reconciliation of the expected Federal income tax expense at the statutory tax rate to the actual provision follows:
| Years Ended December 31, | 2015 | 2014 | 2013 | |||||||||||||||||||||
| (Dollars in thousands) | Amount | Percentage of Pre-tax Earnings | Amount | Percentage of Pre-tax Earnings | Amount | Percentage of Pre-tax Earnings | ||||||||||||||||||
| Federal income tax expense computed by applying the statutory rate to income before income taxes | $ | 11,161 | 35 | % | $ | 7,141 | 34 | % | $ | 6,828 | 34 | % | ||||||||||||
| Tax exempt interest | (927 | ) | (3 | ) | (665 | ) | (3 | ) | (740 | ) | (4 | ) | ||||||||||||
| State taxes, net of federal income tax benefit | 1,087 | 3 | 743 | 4 | 502 | 3 | ||||||||||||||||||
| Other | (543 | ) | (1 | ) | 20 | — | 79 | 1 | ||||||||||||||||
| Income tax expense | $ | 10,778 | 34 | % | $ | 7,239 | 35 | % | $ | 6,669 | 34 | % | ||||||||||||
Deferred tax assets and liabilities are comprised of the following:
| December 31, | 2015 | 2014 | ||||||
| (In thousands) | ||||||||
| Deferred tax assets: | ||||||||
| Allowance for loan losses | $ | 9,034 | $ | 7,311 | ||||
| Net unrealized losses on securities | 3,224 | 2,177 | ||||||
| Restricted stock awards | 1,435 | 1,003 | ||||||
| Purchase accounting fair value adjustments | 15,942 | 8,321 | ||||||
| Net change in pension liability | 2,811 | 2,985 | ||||||
| Net operating loss carryforward | 1,955 | 2,063 | ||||||
| Net loss on cash flow hedge | 524 | 374 | ||||||
| Other | 792 | 351 | ||||||
| Total | 35,717 | 24,585 | ||||||
| Deferred tax liabilities: | ||||||||
| Pension and SERP expense | (4,142 | ) | (3,765 | ) | ||||
| Depreciation | (1,828 | ) | (1,832 | ) | ||||
| REIT undistributed net income | (482 | ) | (628 | ) | ||||
| Net deferred loan costs and fees | (1,416 | ) | (981 | ) | ||||
| Other | (1,541 | ) | (707 | ) | ||||
| Total | (9,409 | ) | (7,913 | ) | ||||
| Net deferred tax asset | $ | 26,308 | $ | 16,672 | ||||
The Company and its subsidiaries are subject to U.S. federal income tax as well as income tax of the State and City of New York and the State of New Jersey. The Company is no longer subject to examination by taxing authorities for years before 2012. There are no unrecorded tax benefits and the Company does not expect the total amount of unrecognized income tax benefits to significantly increase in the next twelve months.
Tax laws were enacted in 2014 and 2015 that changed the manner in which financial institutions and their affiliates are taxed in New York State and New York City, effective January 1, 2015. The initial impact of enactment of these law changes on the carrying amount of the Company’s deferred tax assets and liabilities were immaterial to the consolidated financial statements.
In connection with the acquisitions of HSB and FNBNY, the Company acquired net operating loss (“NOL”) carryfowards subject to Internal Revenue Code Section 382. The Company recorded a deferred tax asset that it expects to realize within the carryfoward period. At December 31, 2015, the remaining NOL carryforward was $4.5 million.
12. EMPLOYEE BENEFITS
a) Pension Plan and Supplemental Executive Retirement Plan
The Bank maintains a noncontributory pension plan covering all eligible employees. The Bank uses a December 31st measurement date for this plan in accordance with FASB ASC 715-30 “Compensation – Retirement Benefits – Defined Benefit Plans – Pension”. In September 2011, the Bank transferred all of the Plan assets out of the New York State Bankers Association Retirement System to the new Trustee, Bank of America, N.A. During 2012, the Company amended the pension plan revising the formula for determining benefits effective January 1, 2013, except for certain grandfathered employees. Additionally, new employees hired on or after October 1, 2012 are not eligible for the pension plan.
| Page -65- |
During 2001, the Bank adopted the Bridgehampton National Bank Supplemental Executive Retirement Plan (“SERP”). The SERP provides benefits to certain employees, as recommended by the Compensation Committee of the Board of Directors and approved by the full Board of Directors, whose benefits under the pension plan are limited by the applicable provisions of the Internal Revenue Code. The benefit under the SERP is equal to the additional amount the employee would be entitled to under the Pension Plan and the 401(k) Plan in the absence of such Internal Revenue Code limitations. The assets of the SERP are held in a rabbi trust to maintain the tax-deferred status of the plan and are subject to the general, unsecured creditors of the Company. As a result, the assets of the trust are reflected on the Consolidated Balance Sheets of the Company. Information about changes in obligations and plan assets of the defined benefit pension plan and the defined benefit plan component of the SERP are as follows:
| Pension Benefits | SERP Benefits | |||||||||||||||
| At December 31, | 2015 | 2014 | 2015 | 2014 | ||||||||||||
| (In thousands) | ||||||||||||||||
| Change in benefit obligation: | ||||||||||||||||
| Benefit obligation at beginning of year | $ | 18,960 | $ | 13,243 | $ | 2,457 | $ | 1,919 | ||||||||
| Service cost | 1,134 | 905 | 168 | 132 | ||||||||||||
| Interest cost | 706 | 639 | 91 | 88 | ||||||||||||
| Benefits paid and expected expenses | (264 | ) | (282 | ) | (112 | ) | (112 | ) | ||||||||
| Assumption changes and other | (2,021 | ) | 4,455 | (49 | ) | 430 | ||||||||||
| Plan amendment | — | — | — | — | ||||||||||||
| Benefit obligation at end of year | $ | 18,515 | $ | 18,960 | $ | 2,555 | $ | 2,457 | ||||||||
| Change in plan assets, at fair value: | ||||||||||||||||
| Plan assets at beginning of year | $ | 23,887 | $ | 21,828 | $ | — | $ | — | ||||||||
| Actual return on plan assets | (60 | ) | 981 | — | — | |||||||||||
| Employer contribution | 999 | 1,361 | 112 | 112 | ||||||||||||
| Benefits paid and actual expenses | (264 | ) | (283 | ) | (112 | ) | (112 | ) | ||||||||
| Plan assets at end of year | $ | 24,562 | $ | 23,887 | $ | — | $ | — | ||||||||
| Funded status (plan assets less benefit obligations) | $ | 6,047 | $ | 4,927 | $ | (2,555 | ) | $ | (2,457 | ) | ||||||
Amounts recognized in accumulated other comprehensive income at December 31, consist of:
| Pension Benefits | SERP Benefits | |||||||||||||||
| At December 31, | 2015 | 2014 | 2015 | 2014 | ||||||||||||
| (In thousands) | ||||||||||||||||
| Net actuarial loss | $ | 7,108 | $ | 7,631 | $ | 546 | $ | 628 | ||||||||
| Prior service cost | (792 | ) | (869 | ) | — | — | ||||||||||
| Transition obligation | — | — | 60 | 87 | ||||||||||||
| Plan amendment | — | — | — | — | ||||||||||||
| Net amount recognized | $ | 6,316 | $ | 6,762 | $ | 606 | $ | 715 | ||||||||
The accumulated benefit obligation was $17.1 million and $1.9 million for the pension plan and the SERP, respectively, as of December 31, 2015. As of December 31, 2014, the accumulated benefit obligation was $16.7 million and $1.9 million for the pension plan and the SERP, respectively.
| Page -66- |
Components of Net Periodic Benefit Cost and Other Amounts Recognized in Other Comprehensive Income
| Pension Benefits | SERP Benefits | |||||||||||||||||||||||
| At December 31, | 2015 | 2014 | 2013 | 2015 | 2014 | 2013 | ||||||||||||||||||
| (In thousands) | ||||||||||||||||||||||||
| Components of net periodic benefit cost and other amounts recognized in Other Comprehensive Income | ||||||||||||||||||||||||
| Service cost | $ | 1,134 | $ | 905 | $ | 931 | $ | 168 | $ | 132 | $ | 149 | ||||||||||||
| Interest cost | 706 | 639 | 564 | 91 | 88 | 76 | ||||||||||||||||||
| Expected return on plan assets | (1,838 | ) | (1,625 | ) | (1,385 | ) | — | — | — | |||||||||||||||
| Amortization of net loss | 376 | 27 | 325 | 32 | — | — | ||||||||||||||||||
| Amortization of unrecognized prior service cost | (77 | ) | (77 | ) | (77 | ) | — | — | — | |||||||||||||||
| Amortization of unrecognized transition (asset) obligation | — | — | — | 28 | 28 | 43 | ||||||||||||||||||
| Net periodic benefit cost (credit) | $ | 301 | $ | (131 | ) | $ | 358 | $ | 319 | $ | 248 | $ | 268 | |||||||||||
| Net (gain) loss | $ | (123 | ) | $ | 5,099 | $ | (2,677 | ) | $ | (48 | ) | $ | 430 | $ | (193 | ) | ||||||||
| Prior service cost | — | — | — | — | — | — | ||||||||||||||||||
| Transition obligation | — | — | — | — | — | — | ||||||||||||||||||
| Amortization of net loss | (376 | ) | (27 | ) | (325 | ) | (32 | ) | — | — | ||||||||||||||
| Amortization of prior service cost | 77 | 77 | 77 | — | — | — | ||||||||||||||||||
| Amortization of transition obligation | — | — | — | (27 | ) | (27 | ) | (43 | ) | |||||||||||||||
| (422 | ) | 5,149 | (2,925 | ) | (107 | ) | 403 | (236 | ) | |||||||||||||||
| Deferred taxes | 141 | (2,044 | ) | 1,161 | 33 | (160 | ) | 93 | ||||||||||||||||
| Total recognized in other comprehensive income | (281 | ) | 3,105 | (1,764 | ) | (74 | ) | 243 | (143 | ) | ||||||||||||||
| Total recognized in net periodic benefit cost and other comprehensive income | $ | 20 | $ | 2,974 | $ | (1,406 | ) | $ | 245 | $ | 491 | $ | 125 | |||||||||||
The estimated net loss, transition obligation and prior service credit for the defined benefit pension plan that will be amortized from accumulated other comprehensive income into net periodic benefit cost over the next fiscal year are $400,000, $0 and $77,000, respectively. The estimated net loss and unrecognized net transition obligation for the SERP that will be amortized from accumulated other comprehensive income into net periodic benefit cost over the next fiscal year is $27,000 and $28,000, respectively.
Expected Long-Term Rate-of-Return
The expected long-term rate-of-return on plan assets reflects long-term earnings expectations on existing plan assets and those contributions expected to be received during the current plan year. In estimating that rate, appropriate consideration was given to historical returns earned by plan assets in the fund and the rates of return expected to be available for reinvestment. Average rates of return over the past 1, 3, 5 and 10-year periods were determined and subsequently adjusted to reflect current capital market assumptions and changes in investment allocations.
| Pension Benefits | SERP Benefits | |||||||||||||||||||||||
| At December 31, | 2015 | 2014 | 2013 | 2015 | 2014 | 2013 | ||||||||||||||||||
| Weighted Average Assumptions Used to Determine Benefit Obligations | ||||||||||||||||||||||||
| Discount rate | 4.30 | % | 3.90 | % | 4.90 | % | 4.20 | % | 3.80 | % | 4.70 | % | ||||||||||||
| Rate of compensation increase | 3.00 | 3.00 | 3.00 | 5.00 | 5.00 | 5.00 | ||||||||||||||||||
| Weighted Average Assumptions Used to Determine Net Periodic Benefit Cost | ||||||||||||||||||||||||
| Discount rate | 3.90 | % | 4.90 | % | 4.20 | % | 3.80 | % | 4.70 | % | 3.90 | % | ||||||||||||
| Rate of compensation increase | 3.00 | 3.00 | 3.00 | 5.00 | 5.00 | 5.00 | ||||||||||||||||||
| Expected long-term rate of return | 7.50 | 7.50 | 7.50 | — | — | — | ||||||||||||||||||
Plan Assets
The Plan seeks to provide retirement benefits to the employees of the Bank who are entitled to receive benefits under the Plan. The Plan Assets are overseen by a Committee comprised of management, who meet semi-annually, and set the investment policy guidelines.
The Plan’s overall investment strategy is to achieve a mix of approximately 97% of investments for long-term growth and 3% for near-term benefit payments with a wide diversification of asset types, fund strategies, and fund managers.
Cash equivalents consist primarily of short term investment funds.
Equity securities primarily include investments in common stock, mutual funds, depository receipts and exchange traded funds.
| Page -67- |
Fixed income securities include corporate bonds, government issues, mortgage backed securities, high yield securities and mutual funds.
The weighted average expected long term rate-of-return is estimated based on current trends in Plan assets as well as projected future rates of return on those assets and reasonable actuarial assumptions based on the guidance provided by ASOP No. 27 for the real and nominal rate of investment return for a specific mix of asset classes. The following assumptions were used in determining the long-term rate-of-return:
The long term rate of return considers historical returns for the S&P 500 index and corporate bonds from 1926 to 2014 representing cumulative returns of approximately 10.1% and 5%, respectively. These returns were considered along with the target allocations of asset categories.
Effective August 30, 2011, the Plan revised its investment guidelines. Except for pooled vehicles and mutual funds, which are governed by the prospectus and unless expressly authorized by management, the Plan and its investment managers are prohibited from purchasing the following investments:
| · | Purchases of letter stock, private placements, or direct payments |
| · | Purchases of securities not readily marketable |
| · | Pledging or hypothecating securities, except for loans of securities that are fully collateralized |
| · | Purchasing or selling derivative securities for speculation or leverage |
| · | Investments by the investment managers in their own securities, their affiliates or subsidiaries (excluding money market funds) |
| · | Purchases of Bridge Bancorp. stock. |
The target allocations for Plan assets are shown in the table below:
| Percentage of Plan Assets At December 31, | Weighted- Average Expected | |||||||||||||
| Target Allocation 2016 | 2015 | 2014 | Long-term Rate of Return | |||||||||||
| Asset Category | ||||||||||||||
| Cash Equivalents | 0 – 5 | % | 4.6 | % | 4.1 | % | — | |||||||
| Equity Securities | 45 - 65 | % | 62.2 | % | 62.1 | % | 4.9 | % | ||||||
| Fixed income securities | 35 - 55 | % | 33.2 | % | 33.8 | % | 2.6 | % | ||||||
| Total | 100.0 | % | 100.0 | % | 7.5 | % | ||||||||
Fair value is defined under ASC 820 as the exchange price that would be received for an asset or paid to transfer a liability (an exit price) in the principal or most advantageous market for the asset or liability in an orderly transaction between market participants on the measurement date. Valuation techniques used to measure fair value under ASC 820 must maximize the use of observable inputs and minimize the use of unobservable inputs. The standard describes a fair value hierarchy based on three levels of inputs, of which the first two are considered observable and the last unobservable, that may be used to measure fair value which are the following:
Level 1: Quoted prices (unadjusted) for identical assets or liabilities in active markets that the entity has the ability to access as of the measurement date.
Level 2: Significant other observable inputs other than Level 1 prices such as quoted prices for similar assets or liabilities; quoted prices in markets that are not active; or other inputs that are observable or can be corroborated by observable market data.
Level 3: Significant unobservable inputs that reflect a reporting entity’s own assumptions about the assumptions that market participants would use in pricing an asset or liability.
In instances in which the inputs used to measure fair value fall into different levels of the fair value hierarchy, the fair value measurement has been determined based on the lowest level input that is significant to the fair value measurement in its entirety. Investments valued using the Net Asset Value (“NAV”) are classified as level 2 if the Plan can redeem its investment with the investee
| Page -68- |
at the NAV at the measurement date. If the Plan can never redeem the investment with the investee at the NAV, it is considered a level 3. If the Plan can redeem the investment at the NAV at a future date, the Plan's assessment of the significance of a particular item to the fair value measurement in its entirety requires judgment, including the consideration of inputs specific to the asset.
In accordance with FASB ASC 715-20, the following table represents the Plan’s fair value hierarchy for its financial assets measured at fair value on a recurring basis as of December 31, 2015 and 2014:
| Fair Value Measurements at | ||||||||||||||||
| December 31, 2015 Using: | ||||||||||||||||
| Carrying Value | Quoted Prices In Active Markets for Identical Assets (Level 1) | Significant Other Observable Inputs (Level 2) | Significant Unobservable Inputs (Level 3) | |||||||||||||
| (Dollars in thousands) | ||||||||||||||||
| Cash and Cash Equivalents | ||||||||||||||||
| Cash | $ | 1,129 | $ | 1,129 | $ | — | ||||||||||
| Short term investment funds | 21 | — | 21 | |||||||||||||
| Total cash equivalents | 1,150 | 1,129 | 21 | |||||||||||||
| Equities: | ||||||||||||||||
| U.S. Large cap | 7,472 | 7,472 | — | |||||||||||||
| U.S. Mid cap/small cap | 2,259 | 2,259 | — | |||||||||||||
| International | 4,390 | 4,390 | — | |||||||||||||
| Equities blend | 1,151 | 1,151 | — | |||||||||||||
| Total equities | 15,272 | 15,272 | — | |||||||||||||
| Fixed income securities: | ||||||||||||||||
| Government issues | 1,329 | 984 | 345 | |||||||||||||
| Corporate bonds | 1,308 | — | 1,308 | |||||||||||||
| Mortgage backed | 562 | — | 562 | |||||||||||||
| High yield bonds and bond funds | 4,941 | — | 4,941 | |||||||||||||
| Total fixed income securities | 8,140 | 984 | 7,156 | |||||||||||||
| Total Plan Assets | $ | 24,562 | $ | 17,385 | $ | 7,177 | ||||||||||
| Fair Value Measurements at | ||||||||||||||||
| December 31, 2014 Using: | ||||||||||||||||
| Carrying Value | Quoted Prices In Active Markets for Identical Assets (Level 1) | Significant Other Observable Inputs (Level 2) | Significant Unobservable Inputs (Level 3) | |||||||||||||
| (Dollars in thousands) | ||||||||||||||||
| Cash and Cash Equivalents | ||||||||||||||||
| Cash | $ | 15 | $ | 15 | $ | — | ||||||||||
| Short term investment funds | 964 | — | 964 | |||||||||||||
| Total cash equivalents | 979 | 15 | 964 | |||||||||||||
| Equities: | ||||||||||||||||
| U.S. Large cap | 9,918 | 9,919 | — | |||||||||||||
| U.S. Mid cap | 800 | 800 | — | |||||||||||||
| U.S. Small cap | 782 | 782 | — | |||||||||||||
| International | 3,361 | 3,361 | — | |||||||||||||
| Total equities | 14,861 | 14,862 | — | |||||||||||||
| Fixed income securities: | ||||||||||||||||
| Government issues | 1,413 | — | 1,413 | |||||||||||||
| Corporate bonds | 1,220 | — | 1,220 | |||||||||||||
| Mortgage backed | 533 | — | 533 | |||||||||||||
| High yield bonds and bond funds | 4,881 | — | 4,881 | |||||||||||||
| Total fixed income securities | 8,047 | — | 8,047 | |||||||||||||
| Total Plan Assets | $ | 23,887 | $ | 14,877 | $ | 9,011 | ||||||||||
The Company has no minimum required pension contribution due to the overfunded status of the plan.
| Page -69- |
Estimated Future Payments
The following benefit payments, which reflect expected future service, are expected to be paid as follows:
| Year | Pension and SERP
Payments | |||
| 2016 | $ | 506 | ||
| 2017 | 568 | |||
| 2018 | 663 | |||
| 2019 | 733 | |||
| 2020 | 899 | |||
| 2021-2025 | 5,913 | |||
b) 401(k) Plan
The Company provides a 401(k) plan which covers substantially all current employees. Newly hired employees are automatically enrolled in the plan on the 90th day of employment, unless they elect not to participate. Under the provisions of the savings plan, employee contributions are partially matched by the Bank with cash contributions. Participants can invest their account balances into several investment alternatives. The savings plan does not allow for investment in the Company’s common stock. During the years ended December 31, 2015, 2014 and 2013 the Bank made cash contributions of $623,000, $530,000, and $466,000, respectively. Effective on January 1, 2013, the plan was amended to include a discretionary profit-sharing component. The Company made discretionary profit sharing contributions of $276,000 in 2015 and $247,000 in 2014. There were no profit-sharing contributions made in 2013.
c) Equity Incentive Plan
On May 4, 2012 the Bridge Bancorp, Inc. 2012 Stock-Based Incentive Plan (the “2012 Plan”) was approved by the shareholders to provide for the grant of stock-based and other incentive awards to officers, employees and directors of the Company. The plan supersedes the Bridge Bancorp, Inc. Equity Incentive Plan that was approved in 2006 (the “2006 Plan”). The number of shares of Common Stock of Bridge Bancorp, Inc. available for stock-based awards under the 2012 Plan is 525,000 plus 278,385 shares that were remaining under the 2006 Plan. Of the total 803,385 shares of common stock approved for issuance under the Plan, 581,369 shares remain available for issuance at December 31, 2015, including shares that may be granted in the form of restricted stock awards or restricted stock units.
The Compensation Committee of the Board of Directors determines awards under the Plan. The Company accounts for this Plan under FASB ASC No. 718 and 505.
Stock Options
The fair value of each option granted is estimated on the date of the grant using the Black-Scholes option-pricing model. No new grants of stock options were awarded during the years ended December 31, 2015 and 2014.
A summary of the status of the Company’s stock options as of December 31, 2015 follows:
| (Dollars in thousands, except per share amounts) | Number of Options | Weighted Average Exercise Price | Weighted Average Remaining Contractual Life | Aggregate Intrinsic Value | ||||||||||
| Outstanding, January 1, 2015 | 39,870 | $ | 25.63 | |||||||||||
| Granted | — | — | ||||||||||||
| Exercised | (14,014 | ) | $ | 25.53 | ||||||||||
| Forfeited | — | — | ||||||||||||
| Expired | (2,131 | ) | $ | 30.60 | ||||||||||
| Outstanding, December 31, 2015 | 23,725 | $ | 25.25 | 0.91 years | $ | 123 | ||||||||
| Vested and Exercisable, December 31, 2015 | 23,725 | $ | 25.25 | 0.91 years | $ | 123 | ||||||||
| Range of Exercise Prices | Number of Options | Exercise Price | ||||||
| 23,725 | $ | 25.25 | ||||||
| 23,725 | ||||||||
The aggregate intrinsic value for options outstanding and exercisable as of December 31, 2015 is the same because all options are currently vested.
| Page -70- |
A summary of activity related to the stock options follows:
| December 31, | 2015 | 2014 | 2013 | |||||||||
| (In thousands) | ||||||||||||
| Intrinsic value of options exercised | $ | 52 | $ | 3 | $ | 4 | ||||||
| Cash received from options exercised | 80 | 7 | 4 | |||||||||
| Tax benefit realized from option exercises | — | — | — | |||||||||
| Weighted average fair value of options granted | — | — | — | |||||||||
There was no compensation expense attributable to stock options for the years ended December 31, 2015, 2014, and 2013 because all stock options were vested.
Restricted Stock Awards
A summary of the status of the Company’s shares of unvested restricted stock for the year ended December 31, 2015 follows:
| Shares | Weighted Average Grant-Date Fair Value | |||||||
| Unvested, January 1, 2015 | 248,444 | $ | 22.48 | |||||
| Granted | 71,187 | $ | 26.33 | |||||
| Vested | (33,586 | ) | $ | 21.79 | ||||
| Forfeited | (4,969 | ) | $ | 26.61 | ||||
| Unvested, December 31, 2015 | 281,076 | $ | 23.46 | |||||
The 2012 Plan provides for issuance of restricted stock awards. During the year ended December 31, 2015, the Company granted restricted awards of 71,187 shares. Of the 71,187 shares granted, 30,625 shares vest over approximately seven years with a third vesting after years five, six and seven, 24,812 shares vest over approximately five years with a third vesting after years three, four and five, 10,550 shares vest ratably over five years, 4,000 shares vest ratably over 3 years and 1,200 shares vest ratably over two years. During the year ended December 31, 2014, the Company granted restricted awards of 80,273 shares. Of the 80,273 shares granted, 53,425 shares vest over approximately seven years with a third vesting after years five, six and seven, 20,598 shares vest over approximately five years with a third vesting after years three, four and five and 6,250 shares vest ratably over two years. During the year ended December 31, 2013, the Company granted restricted stock awards of 72,940 shares. Of the 72,940 shares granted, 51,175 shares vest over approximately seven years with a third vesting after years five, six and seven, 12,652 shares vest over approximately five years with a third vesting after years three, four and five and 9,113 shares vest ratably over five years. Such shares are subject to restrictions based on continued service as employees of the Company or its subsidiaries. Compensation expense attributable to these awards was approximately $1,266,000, $1,087,000 and $1,152,000 for the years ended December 31, 2015, 2014, and 2013, respectively. The total fair value of shares vested during the years ended December 31, 2015, 2014 and 2013 was $732,000, $579,000 and $1,065,000, respectively. As of December 31, 2015, there was $4,124,000 of total unrecognized compensation costs related to non-vested restricted stock awards granted under the Plan. The cost is expected to be recognized over a weighted-average period of 4.17 years.
Restricted Stock Units
Effective for 2015, the Board revised the design of the Long Term Incentive Plan (“LTI Plan”) for Named Executive Officers (“NEOs”) to include performance based awards. Sixty percent of the awards are performance vested and 40% are time vested. The performance based awards are in the form of restricted stock units (“RSUs”) and are subject to adjustment up or down based upon the Company’s 3-year relative Total Shareholder Return (“TSR”) to the proxy peer group. The awards cliff vest in five years and require an additional two year holding period before the RSUs are delivered in shares of common stock. The Company recorded expenses of approximately $81,000 for the year ended December 31, 2015.
In April 2009, the Company adopted a Directors Deferred Compensation Plan. Under the Plan, independent directors may elect to defer all or a portion of their annual retainer fee in the form of restricted stock units. In addition, Directors receive a non-election retainer in the form of restricted stock units. These restricted stock units vest ratably over one year and have dividend rights but no voting rights. In connection with this Plan, the Company recorded expenses of approximately $342,000, $147,000 and $144,000 for the years ended December 31, 2015, 2014 and 2013, respectively.
| Page -71- |
13. EARNINGS PER SHARE
FASB ASC 260-10-45 addresses whether instruments granted in share-based payment transactions are participating securities prior to vesting and, therefore, need to be included in the earnings allocation in computing earnings per share (“EPS”). The restricted stock awards and restricted stock units granted by the Company contain non-forfeitable rights to dividends and therefore are considered participating securities. The two-class method for calculating basic EPS excludes dividends paid to participating securities and any undistributed earnings attributable to participating securities. Prior period EPS figures have been presented in accordance with this accounting guidance.
The following is a reconciliation of earnings per share for December 31, 2015, 2014 and 2013:
| For the Years Ended December 31, | 2014 | 2014 | 2013 | |||||||||
| (In thousands, except per share data) | ||||||||||||
| Net Income | $ | 21,111 | $ | 13,763 | $ | 13,093 | ||||||
| Less: Dividends paid on and earnings allocated to participating securities | (451 | ) | (319 | ) | (329 | ) | ||||||
| Income attributable to common stock | $ | 20,660 | $ | 13,444 | $ | 12,764 | ||||||
| Weighted average common shares outstanding, including participating securities | 14,792 | 11,633 | 9,622 | |||||||||
| Less: weighted average participating securities | (319 | ) | (278 | ) | (242 | ) | ||||||
| Weighted average common shares outstanding | 14,473 | 11,355 | 9,380 | |||||||||
| Basic earnings per common share | $ | 1.43 | $ | 1.18 | $ | 1.36 | ||||||
| Income attributable to common stock | $ | 20,660 | $ | 13,444 | $ | 12,764 | ||||||
| Weighted average common shares outstanding | 14,473 | 11,355 | 9,380 | |||||||||
| Weighted average common equivalent shares outstanding | 4 | — | — | |||||||||
| Weighted average common and equivalent shares outstanding | 14,477 | 11,355 | 9,380 | |||||||||
| Diluted earnings per common share | $ | 1.43 | $ | 1.18 | $ | 1.36 | ||||||
There were 0, 39,870 and 45,395 options outstanding at December 31, 2015, 2014 and 2013, respectively that were not included in the computation of diluted earnings per share because the options’ exercise prices were greater than the average market price of common stock and were, therefore, antidilutive. The $16.0 million in convertible trust preferred securities outstanding at December 31, 2015, 2014, and 2013 were not included in the computation of diluted earnings per share because the assumed conversion of the trust preferred securities was antidilutive.
14. COMMITMENTS AND CONTINGENCIES AND OTHER MATTERS
In the normal course of business, there are various outstanding commitments and contingent liabilities, such as claims and legal actions, minimum annual rental payments under non-cancelable operating leases, guarantees and commitments to extend credit, which are not reflected in the accompanying consolidated financial statements. No material losses are anticipated as a result of these commitments and contingencies.
a) Leases
At December 31, 2015, the Company was obligated to make minimum annual rental payments under non-cancelable operating leases for its premises. Projected minimum rentals under existing leases are as follows:
| Year | ||||
| (In thousands) | ||||
| 2016 | $ | 6,710 | ||
| 2017 | 6,621 | |||
| 2018 | 5,787 | |||
| 2019 | 5,287 | |||
| 2020 | 4,638 | |||
| Thereafter | 21,854 | |||
| Total | $ | 50,897 | ||
Certain leases contain rent escalation clauses which are reflected in the amounts listed above. In addition, certain leases provide for additional payments based upon real estate taxes, interest and other charges. Certain leases contain renewal options which are not reflected. Rental expenses under leases for the years ended December 31, 2015, 2014 and 2013 approximated $5.3 million, $3.4 million, and $2.3 million, respectively, net of subleases in place.
| Page -72- |
b) Loan commitments
Some financial instruments, such as loan commitments, credit lines, letters of credit, and overdraft protection, are issued to meet customer financing needs. These are agreements to provide credit or to support the credit of others, as long as conditions established in the contract are met, and usually have expiration dates. Commitments may expire without being used. Off-balance-sheet risk of credit loss exists up to the face amount of these instruments, although material losses are not anticipated. The same credit policies are used to make such commitments as are used for loans, often including obtaining collateral at exercise of the commitment.
The following represents commitments outstanding:
| December 31, | 2015 | 2014 | ||||||
| (In thousands) | ||||||||
| Standby letters of credit | $ | 14,930 | $ | 1,903 | ||||
| Loan commitments outstanding (1) | 46,034 | 58,930 | ||||||
| Unused lines of credit | 418,596 | 248,328 | ||||||
| Total commitments outstanding | $ | 479,560 | $ | 309,161 | ||||
| (1) | Of the $46.0 million of loan commitments outstanding at December 31, 2014, $13.1 million are fixed rate commitments and $32.9 million are variable rate commitments. |
c) Other
During 2015, the Bank was required to maintain certain cash balances with the Federal Reserve Bank of New York for reserve and clearing requirements. The required cash balance at December 31, 2015 was $2.7 million. During 2015, the Federal Reserve Bank of New York offered higher interest rates on overnight deposits compared to our correspondent banks. Therefore the Bank invested overnight with the Federal Reserve Bank of New York and the average balance maintained during 2015 was $14.3 million.
During 2015, 2014 and 2013, the Bank maintained an overnight line of credit with the Federal Home Loan Bank of New York (“FHLB”). The Bank has the ability to borrow against its unencumbered residential and commercial mortgages and investment securities owned by the Bank. At December 31, 2015, the Bank had aggregate lines of credit of $295.0 million with unaffiliated correspondent banks to provide short-term credit for liquidity requirements. Of these aggregate lines of credit, $275.0 million is available on an unsecured basis. As of December 31, 2015, the Bank had $120.0 million of such borrowings outstanding.
In March 2001, the Bank entered into a Master Repurchase Agreement with the FHLB whereby the FHLB agrees to purchase securities from the Bank, upon the Bank’s request, with the simultaneous agreement to sell the same or similar securities back to the Bank at a future date. Securities are limited, under the agreement, to government securities, securities issued, guaranteed or collateralized by any agency or instrumentality of the U.S. Government or any government sponsored enterprise, and non-agency AA and AAA rated mortgage-backed securities. At December 31, 2015, there was $1.1 billion available for transactions under this agreement.
The Bank had $50.9 million of securities sold under agreements to repurchase outstanding as of December 31, 2015 (See Note 7).
15. FAIR VALUE
FASB ASC No. 820-10 defines fair value as the exchange price that would be received for an asset or paid to transfer a liability (exit price) in the principal or most advantageous market for the asset or liability in an orderly transaction between market participants on the measurement date. FASB ASC 820-10 also establishes a fair value hierarchy which requires an entity to maximize the use of observable inputs and minimize the use of unobservable inputs when measuring fair value. The standard describes three levels of inputs that may be used to measure fair values:
Level 1: Quoted prices (unadjusted) for identical assets or liabilities in active markets that the entity has the ability to access as of the measurement date.
Level 2: Significant other observable inputs other than Level 1 prices such as quoted prices for similar assets or liabilities; quoted prices in markets that are not active; or other inputs that are observable or can be corroborated by observable market data.
Level 3: Significant unobservable inputs that reflect a reporting entity’s own assumptions about the assumptions that market participants would use in pricing an asset or liability.
| Page -73- |
Assets and Liabilities Measured on a Recurring Basis
Assets and liabilities measured at fair value on a recurring basis are summarized below:
| Fair Value Measurements at | ||||||||||||||
| December 31, 2015 Using: | ||||||||||||||
| Carrying Value | Quoted Prices In Active Markets for Identical Assets (Level 1) | Significant Other Observable Inputs (Level 2) | Significant Unobservable Inputs (Level 3) | |||||||||||
| (In thousands) | ||||||||||||||
| Financial Assets: | ||||||||||||||
| Available for sale securities | ||||||||||||||
| U.S. GSE securities | $ | 62,674 | $ | 62,674 | ||||||||||
| State and municipal obligations | 87,935 | 87,935 | ||||||||||||
| U.S. GSE Residential mortgage-backed securities | 200,264 | 200,264 | ||||||||||||
| U.S. GSE Residential collateralized mortgage Obligations | 317,878 | 317,878 | ||||||||||||
| U.S. GSE Commercial mortgage-backed securities | 12,418 | 12,418 | ||||||||||||
| U.S. GSE Commercial collateralized mortgage Obligations | 64,198 | 64,198 | ||||||||||||
| Other Asset-backed securities | 22,371 | 22,371 | ||||||||||||
| Corporate Bonds | 32,465 | 32,465 | ||||||||||||
| Total available for sale securities | $ | 800,203 | $ | 800,203 | ||||||||||
| Derivatives | $ | 779 | 779 | |||||||||||
| Financial Liabilities: | ||||||||||||||
| Derivatives | $ | 2,073 | $ | 2,073 | ||||||||||
| Fair Value Measurements at | ||||||||||||||
| December 31, 2014 Using: | ||||||||||||||
| Carrying Value | Quoted Prices In Active Markets for Identical Assets (Level 1) | Significant Other Observable Inputs (Level 2) | Significant Unobservable Inputs (Level 3) | |||||||||||
| (In thousands) | ||||||||||||||
| Financial Assets: | ||||||||||||||
| Available for sale securities | ||||||||||||||
| U.S. GSE securities | $ | 95,425 | $ | 95,425 | ||||||||||
| State and municipal obligations | 63,693 | 63,693 | ||||||||||||
| U.S. GSE Residential mortgage-backed securities | 101,425 | 101,425 | ||||||||||||
| U.S. GSE Residential collateralized mortgage Obligations | 258,599 | 258,599 | ||||||||||||
| U.S. GSE Commercial mortgage-backed securities | 2,945 | 2,945 | ||||||||||||
| U.S. GSE Commercial collateralized mortgage Obligations | 24,082 | 24,082 | ||||||||||||
| Other Asset-backed securities | 23,037 | 23,037 | ||||||||||||
| Corporate Bonds | 17,978 | 17,978 | ||||||||||||
| Total available for sale securities | $ | 587,184 | $ | 587,184 | ||||||||||
| Derivatives | $ | 280 | $ | 280 | ||||||||||
| Financial Liabilities: | ||||||||||||||
| Derivatives | $ | 1,223 | $ | 1,223 | ||||||||||
| Page -74- |
Assets measured at fair value on a non-recurring basis are summarized below:
| Fair Value Measurements at | ||||||||||||||
| December 31, 2015 Using: | ||||||||||||||
| Carrying Value | Quoted Prices In Active Markets for Identical Assets (Level 1) | Significant Other Observable Inputs (Level 2) | Significant Unobservable Inputs (Level 3) | |||||||||||
| (In thousands) | ||||||||||||||
| Impaired loans | $ | 483 | $ | 483 | ||||||||||
| Other real estate owned | 250 | 250 | ||||||||||||
| Fair Value Measurements at | ||||||||||||||
| December 31, 2014 Using: | ||||||||||||||
| Carrying Value | Quoted Prices In Active Markets for Identical Assets (Level 1) | Significant Other Observable Inputs (Level 2) | Significant Unobservable Inputs (Level 3) | |||||||||||
| (In thousands) | ||||||||||||||
| Impaired loans | $ | 558 | $ | 558 | ||||||||||
Impaired loans with allocated allowance for loan losses at December 31, 2015, had a carrying amount of $0.5 million, which is made up of the outstanding balance of $0.5 million, net of a valuation allowance of $0.03 million. This resulted in an additional provision for loan losses of $0.03 million that is included in the amount reported on the income statement. Impaired loans with allocated allowance for loan losses at December 31, 2014, had a carrying amount of $0.5 million, which is made up of the outstanding balance of $0.7 million, net of a valuation allowance of $0.2 million. This resulted in an additional provision for loan losses of $0.2 million that is included in the amount reported on the Consolidated Statements of Income.
Other real estate owned at December 31, 2015 had a carrying amount of $250,000 and no valuation allowance recorded. There was no Other Real Estate Owned at December 31, 2014. Accordingly, there was no additional provision for loan losses included in the amount reported on the Consolidated Statements of Income.
The Company used the following method and assumptions in estimating the fair value of its financial instruments:
Cash and Due from Banks and Federal Funds Sold: Carrying amounts approximate fair value, since these instruments are either payable on demand or have short-term maturities. Cash on hand and non-interest due from bank accounts are Level 1 and interest bearing Cash Due from Banks and Federal Funds Sold are Level 2.
Securities Available for Sale and Held to Maturity: The estimated fair values are based on independent dealer quotations on nationally recognized securities exchanges, if available (Level 1). For securities where quoted prices are not available, fair value is based on matrix pricing, which is a mathematical technique widely used in the industry to value debt securities without relying exclusively on quoted prices for the specific securities but rather by relying on the securities’ relationship to other benchmark quoted securities (Level 2).
Restricted Securities: It is not practicable to determine the fair value of FHLB, ACBB and FRB stock due to restrictions placed on its transferability.
Derivatives: Represents an interest rate swap and the estimated fair values are based on valuation models using observable market data as of measurement date (Level 2).
Loans: The estimated fair values of real estate mortgage loans and other loans receivable are based on discounted cash flow calculations that use available market benchmarks when establishing discount factors for the types of loans resulting in a Level 3 classification. Exceptions may be made for adjustable rate loans (with resets of one year or less), which would be discounted straight to their rate index plus or minus an appropriate spread. All nonaccrual loans are carried at their current fair value. The methods utilized to estimate the fair value of loans do not necessarily represent an exit price and therefore, while permissible for presentation purposed under ASC 825-10, do not conform to ASC 820-10.
| Page -75- |
Impaired Loans and Other Real Estate Owned: For impaired loans, the Company evaluates the fair value of the loan in accordance with current accounting guidance. For loans that are collateral dependent, the fair value of the collateral is used to determine the fair value of the loan. The fair value of the collateral is determined based upon recent appraised values. The fair value of other real estate owned is also evaluated in accordance with current accounting guidance and determined based upon recent appraised values less the estimated cost to sell. These appraisals may utilize a single valuation approach or a combination of approaches including comparable sales and the income approach. Adjustments are routinely made in the appraisal process by the independent appraisers to adjust for differences between the comparable sales and income data available. Adjustments may relate to location, square footage, condition, amenities, market rate of leases as well as timing of comparable sales. All appraisals undergo a second review process to insure that the methodology employed and the values derived are accurate. The fair value of the loan is compared to the carrying value to determine if any write-down or specific reserve is required. Impaired loans are evaluated on a quarterly basis for additional impairment and adjusted accordingly.
Appraisals for collateral-dependent impaired loans are performed by certified general appraisers (for commercial properties) or certified residential appraisers (for residential properties) whose qualifications and licenses have been reviewed and verified by the Company. Once received, the Credit Administration department reviews the assumptions and approaches utilized in the appraisal as well as the overall resulting fair value in comparison with independent data sources such as recent market data or industry-wide statistics. On a quarterly basis, the Company compares the actual selling price of collateral that has been sold to the most recent appraised value to determine what additional adjustment should be made to the appraisal value to arrive at fair value. Management also considers the appraisal values for commercial properties associated with current loan origination activity. Collectively, this information is reviewed to help assess current trends in commercial property values. For each collateral dependent impaired loan, management considers information that relates to the type of commercial property to determine if such properties may have appreciated or depreciated in value since the date of the most recent appraisal. Adjustments to fair value are made only when the analysis indicates a probable decline in collateral values. Adjustments made in the appraisal process are not deemed material to the overall financial statements given the level of impaired loans measured at fair value on a nonrecurring basis.
Deposits: The estimated fair value of certificates of deposits are based on discounted cash flow calculations that use a replacement cost of funds approach to establishing discount rates for certificates of deposits maturities resulting in a Level 2 classification. Stated value is fair value for all other deposits resulting in a Level 1 classification.
Borrowed Funds: The estimated fair value of borrowed funds are based on discounted cash flow calculations that use a replacement cost of funds approach to establishing discount rates for funding maturities resulting in a Level 2 classification.
Subordinated Debentures: The estimated fair value is derived using discounted cash flow methodology based on a spread to the London Interbank Offered Rate (“LIBOR”) curve at the time of issuance and assuming the debt was issued at PAR resulting in a Level 3 classification.
Junior Subordinated Debentures: The estimated fair value is based on estimates using market data for similarly risk weighted items and takes into consideration the convertible features of the debentures into common stock of the Company which is an unobservable input resulting in a Level 3 classification.
Accrued Interest Receivable and Payable: For these short-term instruments, the carrying amount is a reasonable estimate of the fair value resulting in a Level 1 or 2 classification.
Off-Balance-Sheet Liabilities: The fair value of off-balance-sheet commitments to extend credit is estimated using fees currently charged to enter into similar agreements. The fair value is immaterial as of December 31, 2015 and December 31, 2014.
Fair value estimates are made at specific points in time and are based on existing on-and off-balance sheet financial instruments. Such estimates are generally subjective in nature and dependent upon a number of significant assumptions associated with each financial instrument or group of financial instruments, including estimates of discount rates, risks associated with specific financial instruments, estimates of future cash flows, and relevant available market information. Changes in assumptions could significantly affect the estimates. In addition, fair value estimates do not reflect the value of anticipated future business, premiums or discounts that could result from offering for sale at one time the Company’s entire holdings of a particular financial instrument, or the tax consequences of realizing gains or losses on the sale of financial instruments.
| Page -76- |
The estimated fair values and recorded carrying values of the Company’s financial instruments are as follows:
| Fair Value Measurement at | ||||||||||||||||||||
| December 31, 2015 Using: | ||||||||||||||||||||
| (In thousands) | Carrying Amount | Quoted Prices In Active Markets for Identical Assets (Level 1) | Significant Other Observable Inputs (Level 2) | Significant Unobservable Inputs (Level 3) | Total | |||||||||||||||
| Financial Assets: | ||||||||||||||||||||
| Cash and due from banks | $ | 79,750 | $ | 79,750 | $ | — | $ | — | $ | 79,750 | ||||||||||
| Interest bearing deposits with banks | 24,408 | — | 24,408 | — | 24,408 | |||||||||||||||
| Securities available for sale | 800,203 | — | 800,203 | — | 800,203 | |||||||||||||||
| Securities restricted | 24,788 | n/a | n/a | n/a | n/a | |||||||||||||||
| Securities held to maturity | 208,351 | — | 210,003 | — | 210,003 | |||||||||||||||
| Loans, net | 2,390,030 | — | — | 2,379,171 | 2,379,171 | |||||||||||||||
| Derivatives | 779 | — | 779 | — | 779 | |||||||||||||||
| Accrued interest receivable | 9,270 | — | 3,228 | 6,042 | 9,270 | |||||||||||||||
| Financial Liabilities: | ||||||||||||||||||||
| Certificates of deposit | 292,855 | — | 293,368 | — | 293,368 | |||||||||||||||
| Demand and other deposits | 2,550,770 | 2,550,770 | — | — | 2,550,770 | |||||||||||||||
| Federal funds purchased | 120,000 | 120,000 | — | — | 120,000 | |||||||||||||||
| Federal Home Loan Bank advances | 297,507 | 197,243 | 100,772 | — | 298,015 | |||||||||||||||
| Repurchase agreements | 50,891 | — | 51,480 | — | 51,480 | |||||||||||||||
| Subordinated Debentures | 78,363 | — | — | 78,830 | 78,830 | |||||||||||||||
| Junior Subordinated Debentures | 15,878 | — | — | 16,566 | 16,566 | |||||||||||||||
| Derivatives | 2,073 | — | 2,073 | — | 2,073 | |||||||||||||||
| Accrued interest payable | 1,644 | 93 | 1,551 | — | 1,644 | |||||||||||||||
| Fair Value Measurement at | ||||||||||||||||||||
| December 31, 2014 Using: | ||||||||||||||||||||
| (In thousands) | Carrying Amount | Quoted Prices In Active Markets for Identical Assets (Level 1) | Significant Other Observable Inputs (Level 2) | Significant Unobservable Inputs (Level 3) | Total | |||||||||||||||
| Financial Assets: | ||||||||||||||||||||
| Cash and due from banks | $ | 45,109 | $ | 45,109 | $ | — | $ | — | $ | 45,109 | ||||||||||
| Interest bearing deposits with banks | 6,621 | — | 6,621 | — | 6,621 | |||||||||||||||
| Securities available for sale | 587,184 | — | 587,184 | — | 587,184 | |||||||||||||||
| Securities restricted | 10,037 | n/a | n/a | n/a | n/a | |||||||||||||||
| Securities held to maturity | 214,927 | — | 216,289 | — | 216,289 | |||||||||||||||
| Loans, net | 1,320,690 | — | — | 1,317,625 | 1,317,625 | |||||||||||||||
| Derivatives | 280 | — | 280 | — | 280 | |||||||||||||||
| Accrued interest receivable | 6,425 | — | 2,721 | 3,704 | 6,425 | |||||||||||||||
| Financial Liabilities: | ||||||||||||||||||||
| Certificates of deposit | 141,362 | — | 142,264 | — | 142,264 | |||||||||||||||
| Demand and other deposits | 1,692,417 | 1,692,417 | — | — | 1,692,417 | |||||||||||||||
| Federal funds purchased | 75,000 | 75,000 | — | — | 75,000 | |||||||||||||||
| Federal Home Loan Bank advances | 138,327 | 98,070 | 40,165 | — | 138,235 | |||||||||||||||
| Repurchase agreements | 36,263 | — | 36,991 | — | 36,991 | |||||||||||||||
| Subordinated Debentures | — | — | — | — | — | |||||||||||||||
| Junior Subordinated Debentures | 16,002 | — | — | 16,528 | 16,528 | |||||||||||||||
| Derivatives | 1,223 | — | 1,223 | — | 1,223 | |||||||||||||||
| Accrued interest payable | 308 | 77 | 231 | — | 308 | |||||||||||||||
16. REGULATORY CAPITAL REQUIREMENTS
The Company and the Bank are subject to various regulatory capital requirements administered by the federal banking agencies. Failure to meet minimum capital requirements can result in certain mandatory and possibly additional discretionary actions by regulators that, if undertaken, could have a direct material effect on the Company’s and the Bank’s financial statements. Under capital adequacy guidelines and the regulatory framework for prompt corrective action, the Company and the Bank must meet specific capital requirements that involve quantitative measures of the Company’s and Bank’s assets, liabilities, and certain off-balance sheet items
| Page -77- |
calculated under regulatory accounting practices. The Company’s and Bank’s capital amounts and classifications also are subject to qualitative judgments by the regulators about components, risk weightings, and other factors.
Quantitative measures established by regulation to ensure capital adequacy require the Company and the Bank to maintain minimum amounts and ratios of total and Tier 1 capital to risk weighted assets and of Tier 1 capital to average assets. Tier 1 capital, risk weighted assets and average assets are as defined by regulation. The required minimums for the Corporation and Bank are set forth in the table that follows. The Company and the Bank met all capital adequacy requirements on December 31, 2015.
On January 1, 2015, the Basel III Capital Rules became effective and include transition provisions through January 1, 2019. These rules provide for the following minimum capital to risk-weighted assets ratios as of January 1, 2015: a) 4.5% based upon common equity tier 1 capital ("CET1"); b) 6.0% based upon tier 1 capital; and c) 8.0% based upon total regulatory capital. A minimum leverage ratio (tier 1 capital as a percentage of total average assets) of 4.0% is also required under the Basel III Capital Rules.
When fully phased in, the Basel III Capital Rules will additionally require institutions to retain a capital conservation buffer, composed of CET1, of 2.5% above these required minimum capital ratio levels. The capital conservation buffer requirement is being phased in beginning January 1, 2016 at 0.625% of risk-weighted assets and increasing by 0.625% each subsequent January 1, until it reaches 2.5% on January 1, 2019. When the capital conservation buffer is fully phased in on January 1, 2019, the Company and the Bank will effectively have the following minimum capital to risk-weighted assets ratios: a) 7.0% based upon CET1; b) 8.5% based upon tier 1 capital; and c) 10.5% based upon total regulatory capital.
The Company and the Bank made the one-time, permanent election to continue to exclude the effects of accumulated other comprehensive income or loss items included in stockholders' equity for the purposes of determining the regulatory capital ratios.
As of December 31, 2015, the most recent notification from the Federal Deposit Insurance Corporation categorized the Bank as “well capitalized” under the regulatory framework for prompt corrective action. To be categorized as “well capitalized,” the Bank must maintain minimum total risk-based, Tier 1 risk-based and Tier 1 leverage ratios as set forth in the table below. Since that notification, there are no conditions or events that management believes have changed the institution’s category.
The following table presents actual capital levels and minimum required levels for the Company and the Bank at December 31, 2015 (under Basel III rules) and December 31, 2014.
| Basel III | ||||||||||||||||||||||||
| Minimum To Be Well | ||||||||||||||||||||||||
| Minimum Capital | Capitalized Under Prompt | |||||||||||||||||||||||
| As of December 31, 2015 | Actual | Adequacy Requirement | Corrective Action Provisions | |||||||||||||||||||||
| (Dollars in thousands) | Amount | Ratio | Amount | Ratio | Amount | Ratio | ||||||||||||||||||
| Common Equity Tier 1 Capital to Risk Weighted Assets: | ||||||||||||||||||||||||
| Consolidated | $ | 249,921 | 9.3 | % | $ | 121,074 | 4.5 | % | n/a | n/a | ||||||||||||||
| Bank | 319,351 | 11.9 | 121,074 | 4.5 | $ | 174,884 | 6.5 | % | ||||||||||||||||
| Total Capital to Risk Weighted Assets: | ||||||||||||||||||||||||
| Consolidated | 366,393 | 13.6 | 215,243 | 8.0 | n/a | n/a | ||||||||||||||||||
| Bank | 340,371 | 12.7 | 215,242 | 8.0 | 269,053 | 10.0 | ||||||||||||||||||
| Tier 1 Capital to Risk Weighted Assets: | ||||||||||||||||||||||||
| Consolidated | 265,373 | 9.9 | 161,432 | 4.0 | n/a | n/a | ||||||||||||||||||
| Bank | 319,351 | 11.9 | 161,432 | 4.0 | 215,242 | 8.0 | ||||||||||||||||||
| Tier 1 Capital to Average Assets: | ||||||||||||||||||||||||
| Consolidated | 265,373 | 7.6 | 140,490 | 4.0 | n/a | n/a | ||||||||||||||||||
| Bank | 319,351 | 9.1 | 140,492 | 4.0 | 175,615 | 5.0 | ||||||||||||||||||
| Basel I | ||||||||||||||||||||||||
| Minimum To Be Well | ||||||||||||||||||||||||
| Minimum Capital | Capitalized Under Prompt | |||||||||||||||||||||||
| As of December 31, 2014 | Actual | Adequacy Requirement | Corrective Action Provisions | |||||||||||||||||||||
| (Dollars in thousands) | Amount | Ratio | Amount | Ratio | Amount | Ratio | ||||||||||||||||||
| Common Equity Tier 1 Capital to Risk Weighted Assets: | ||||||||||||||||||||||||
| Consolidated | n/a | n/a | n/a | n/a | n/a | n/a | ||||||||||||||||||
| Bank | n/a | n/a | n/a | n/a | n/a | n/a | ||||||||||||||||||
| Total Capital to Risk Weighted Assets: | ||||||||||||||||||||||||
| Consolidated | $ | 207,340 | 13.0 | % | $ | 127,445 | 8.0 | % | n/a | n/a | ||||||||||||||
| Bank | 206,633 | 13.0 | 127,427 | 8.0 | $ | 159,284 | 10.0 | % | ||||||||||||||||
| Tier 1 Capital to Risk Weighted Assets: | ||||||||||||||||||||||||
| Consolidated | 189,527 | 11.9 | 63,722 | 4.0 | n/a | n/a | ||||||||||||||||||
| Bank | 188,820 | 11.9 | 63,714 | 4.0 | 95,571 | 6.0 | ||||||||||||||||||
| Tier 1 Capital to Average Assets: | ||||||||||||||||||||||||
| Consolidated | 189,527 | 8.4 | 90,614 | 4.0 | n/a | n/a | ||||||||||||||||||
| Bank | 188,820 | 8.3 | 90,617 | 4.0 | 113,271 | 5.0 | ||||||||||||||||||
| Page -78- |
17. PARENT COMPANY ONLY CONDENSED FINANCIAL INFORMATION
Condensed financial information of Bridge Bancorp, Inc. (Parent Company only) follows:
Condensed Balance Sheets
| December 31, | 2015 | 2014 | ||||||
| (In thousands) | ||||||||
| ASSETS | ||||||||
| Cash and cash equivalents | $ | 25,475 | $ | 610 | ||||
| Other assets | 16 | 89 | ||||||
| Investment in the Bank | 411,106 | 190,292 | ||||||
| Total Assets | $ | 436,597 | $ | 190,991 | ||||
| LIABILITIES AND STOCKHOLDERS’ EQUITY | ||||||||
| Subordinated debentures | $ | 78,363 | $ | — | ||||
| Junior subordinated debentures | 15,878 | 15,873 | ||||||
| Other liabilities | 1,228 | — | ||||||
| Total Liabilities | 95,469 | 15,873 | ||||||
| Total Stockholders’ Equity | 341,128 | 175,118 | ||||||
| Total Liabilities and Stockholders’ Equity | $ | 436,597 | $ | 190,991 | ||||
Condensed Statements of Income
| Years ended December 31, | 2015 | 2014 | 2013 | |||||||||
| (In thousands) | ||||||||||||
| Dividends from the Bank | $ | 10,000 | $ | — | $ | — | ||||||
| Interest expense | 2,626 | 1,365 | 1,365 | |||||||||
| Non-interest expense | 73 | 86 | 69 | |||||||||
| Income (loss) before income taxes and equity in
undistributed earnings of the Bank | 7,301 | (1,451 | ) | (1,434 | ) | |||||||
| Income tax benefit | (933 | ) | (463 | ) | (483 | ) | ||||||
| Income (loss) before equity in undistributed earnings of the Bank | 8,234 | (988 | ) | (951 | ) | |||||||
| Equity in undistributed earnings of the Bank | 12,877 | 14,751 | 14,044 | |||||||||
| Net income | $ | 21,111 | $ | 13,763 | $ | 13,093 | ||||||
| Page -79- |
Condensed Statements of Cash Flows
| Years ended December 31, | 2015 | 2014 | 2013 | |||||||||
| (In thousands) | ||||||||||||
| Cash flows from operating activities: | ||||||||||||
| Net income | $ | 21,111 | $ | 13,763 | $ | 13,093 | ||||||
| Adjustments to reconcile net income to net cash (used in) operating activities: | ||||||||||||
| Equity in undistributed earnings of the Bank | (12,877 | ) | (14,751 | ) | (14,044 | ) | ||||||
| Amortization | 44 | 5 | 5 | |||||||||
| Decrease (increase) in other assets | 72 | 76 | (105 | ) | ||||||||
| Increase (decrease) in other liabilities | 1,228 | (48 | ) | (5 | ) | |||||||
| Net cash provided by (used in) operating activities | 9,578 | (955 | ) | (1,056 | ) | |||||||
| Cash flows from investing activities: | ||||||||||||
| Investment in the Bank | (50,000 | ) | (24,000 | ) | (6,000 | ) | ||||||
| Cash in lieu of fractional shares for business acquisition | — | (1 | ) | — | ||||||||
| Net cash used in investing activities | (50,000 | ) | (24,001 | ) | (6,000 | ) | ||||||
| Cash flows from financing activities: | ||||||||||||
| Net proceeds from issuance of subordinated debentures | 78,324 | — | — | |||||||||
| Repayment of acquired unsecured debt | — | (1,450 | ) | — | ||||||||
| Net proceeds from issuance of common stock | 779 | 631 | 46,237 | |||||||||
| Net proceeds from exercise of stock options | 80 | 7 | 4 | |||||||||
| Repurchase of surrendered stock from exercise of stock options and vesting of restricted stock awards | (228 | ) | (173 | ) | (291 | ) | ||||||
| Excess tax benefit from share based compensation | 50 | 36 | 21 | |||||||||
| Cash dividends paid | (13,415 | ) | (10,657 | ) | (6,754 | ) | ||||||
| Other, net | (303 | ) | (192 | ) | — | |||||||
| Net cash provided by (used in) financing activities | 65,287 | (11,798 | ) | 39,217 | ||||||||
| Net increase (decrease) in cash and cash equivalents | 24,865 | (36,754 | ) | 32,161 | ||||||||
| Cash and cash equivalents at beginning of year | 610 | 37,364 | 5,203 | |||||||||
| Cash and cash equivalents at end of year | $ | 25,475 | $ | 610 | $ | 37,364 | ||||||
18. OTHER COMPREHENSIVE INCOME (LOSS)
Other comprehensive income (loss) components and related income tax effects were as follows:
| Years Ended December 31, | 2015 | 2014 | 2013 | |||||||||
| (In thousands) | ||||||||||||
| Unrealized holding (losses) gains on available for sale securities | $ | (2,489 | ) | $ | 13,315 | $ | (23,771 | ) | ||||
| Reclassification adjustment for losses (gains) realized in income | 8 | 1,090 | (659 | ) | ||||||||
| Income tax effect | 1,047 | (5,718 | ) | 9,698 | ||||||||
| Net change in unrealized (losses) gains on available for sale securities | (1,434 | ) | 8,687 | (14,732 | ) | |||||||
| Unrealized net gain (loss) arising during the period | 196 | (5,529 | ) | 2,871 | ||||||||
| Reclassification adjustment for amortization realized in income | 358 | (23 | ) | 291 | ||||||||
| Income tax effect | (174 | ) | 2,204 | (1,255 | ) | |||||||
| Net change in post-retirement obligation | 380 | (3,348 | ) | 1,907 | ||||||||
| Change in fair value of derivatives used for cash flow hedges | (1,008 | ) | (1,249 | ) | (259 | ) | ||||||
| Reclassification adjustment for losses realized in income | 657 | 470 | 271 | |||||||||
| Income tax effect | 150 | 309 | (5 | ) | ||||||||
| Net change in unrealized (loss) gain on cash flow hedges | (201 | ) | (470 | ) | 7 | |||||||
| Total | $ | (1,255 | ) | $ | 4,869 | $ | (12,818 | ) | ||||
| Page -80- |
The following is a summary of the accumulated other comprehensive income balances, net of income tax:
| Details about Accumulated Other Comprehensive Income | Balance as of January 1, 2015 | Current Period Change | Balance as of December 31, 2015 | |||||||||
| (In thousands) | ||||||||||||
| Unrealized (losses) gains on available for sale securities | $ | (3,307 | ) | $ | (1,434 | ) | $ | (4,741 | ) | |||
| Unrealized (losses) gains on pension benefits | (4,491 | ) | 380 | (4,111 | ) | |||||||
| Unrealized (losses) gains on cash flow hedges | (569 | ) | (201 | ) | (770 | ) | ||||||
| Total | $ | (8,367 | ) | $ | (1,255 | ) | $ | (9,622 | ) | |||
The following represents the reclassifications out of accumulated other comprehensive income:
| Twelve Months Ended December 31, | ||||||||||||||
| Details about accumulated Other Comprehensive Income | 2015 | 2014 | 2013 | Affected Line Item in the Consolidated Statements of Income | ||||||||||
| (In thousands) | ||||||||||||||
| Realized (losses) gains on sale of available for sale securities | $ | (8 | ) | $ | (1,090 | ) | $ | 659 | Net securities losses | |||||
| Income tax benefit (expense) | 3 | 433 | (262 | ) | Income tax expense | |||||||||
| Net of income tax | (5 | ) | (657 | ) | 397 | |||||||||
| Amortization of defined benefit pension plan and the defined benefit plan component of the SERP: | ||||||||||||||
| Prior service credit | $ | 77 | $ | 77 | $ | 77 | Salaries and employee benefits | |||||||
| Transition obligation | (27 | ) | (27 | ) | (43 | ) | Salaries and employee benefits | |||||||
| Actuarial losses | (408 | ) | (27 | ) | (325 | ) | Salaries and employee benefits | |||||||
| (358 | ) | 23 | (291 | ) | ||||||||||
| Income tax benefit (expense) | 145 | (9 | ) | 116 | Income tax expense | |||||||||
| Net of income tax | (213 | ) | 14 | (175 | ) | |||||||||
| Realized losses on cash flow hedges | $ | (657 | ) | $ | (470 | ) | $ | (271 | ) | Interest Expense | ||||
| Income tax effect | 266 | 187 | 108 | Income tax expense | ||||||||||
| Net of income tax | (391 | ) | (283 | ) | (163 | ) | ||||||||
| Total reclassifications, net of income tax | $ | (609 | ) | $ | (926 | ) | $ | 59 | ||||||
| Page -81- |
19. QUARTERLY FINANCIAL DATA (UNAUDITED)
Selected Consolidated Quarterly Financial Data
| 2015 Quarter Ended, | March 31, | June 30, | September 30, | December 31, | ||||||||||||
| (In thousands, except per share amounts) | ||||||||||||||||
| Interest income | $ | 20,507 | $ | 22,380 | $ | 31,744 | $ | 31,609 | ||||||||
| Interest expense | 1,812 | 1,953 | 2,659 | 3,705 | ||||||||||||
| Net interest income | 18,695 | 20,427 | 29,085 | 27,904 | ||||||||||||
| Provision for loan losses | 800 | 700 | 1,500 | 1,000 | ||||||||||||
| Net interest income after provision for loan losses | 17,895 | 19,727 | 27,585 | 26,904 | ||||||||||||
| Non-interest income | 2,804 | 2,527 | 3,926 | 3,411 | ||||||||||||
| Non-interest expenses | 13,310 | (2) | 22,034 | (3) | 19,373 | (4) | 18,173 | (5) | ||||||||
| Income before income taxes | 7,389 | 220 | 12,138 | 12,142 | ||||||||||||
| Income tax expense | 2,626 | (243 | ) | 4,248 | 4,147 | |||||||||||
| Net income | $ | 4,763 | $ | 463 | $ | 7,890 | $ | 7,995 | ||||||||
| Basic earnings per share | $ | 0.41 | $ | 0.04 | $ | 0.45 | $ | 0.46 | ||||||||
| Diluted earnings per share | $ | 0.41 | $ | 0.04 | $ | 0.45 | $ | 0.46 | ||||||||
| 2014 Quarter Ended, | March 31, | June 30, | September 30, | December 31, | ||||||||||||
| (In thousands, except per share amounts) | ||||||||||||||||
| Interest income | $ | 17,358 | $ | 18,730 | $ | 19,219 | $ | 19,603 | ||||||||
| Interest expense | 1,822 | 1,915 | 1,857 | 1,866 | ||||||||||||
| Net interest income | 15,536 | 16,815 | 17,362 | 17,737 | ||||||||||||
| Provision for loan losses | 700 | 500 | 500 | 500 | ||||||||||||
| Net interest income after provision for loan losses | 14,836 | 16,315 | 16,862 | 17,237 | ||||||||||||
| Non-interest income | 802 | (1) | 2,292 | 2,562 | 2,510 | |||||||||||
| Non-interest expenses | 15,013 | (2) | 12,124 | (3) | 12,094 | 13,183 | (5) | |||||||||
| Income before income taxes | 625 | 6,483 | 7,330 | 6,564 | ||||||||||||
| Income tax expense | 219 | 2,165 | 2,459 | 2,396 | ||||||||||||
| Net income | $ | 406 | $ | 4,318 | $ | 4,871 | $ | 4,168 | ||||||||
| Basic earnings per share | $ | 0.04 | $ | 0.37 | $ | 0.42 | $ | 0.36 | ||||||||
| Diluted earnings per share | $ | 0.04 | $ | 0.37 | $ | 0.42 | $ | 0.36 | ||||||||
| (1) | 2014 amount includes net securities losses of $1.1 million. |
| (2) | 2015 amount includes costs associated with the CNB acquisition of $0.2 million. |
2014 amount includes costs associated with the FNBNY acquisition and branch restructuring of $4.4 million.
| (3) | 2015 amount includes costs associated with the CNB acquisition of $8.2 million. |
2014 amount includes costs associated with the FNBNY acquisition of $0.3 million.
| (4) | 2015 amount includes costs associated with the CNB acquisition of $0.9 million. |
| (5) | 2015 amount includes costs associated with the CNB acquisition of $0.5 million. |
2014 amount includes costs associated with the CNB acquisition of $0.8 million
20. BUSINESS COMBINATIONS
On June 19, 2015, the Company acquired Community National Bank (“CNB”) at a purchase price of $157.5 million, issued an aggregate of 5.647 million Bridge Bancorp common shares in exchange for all the issued and outstanding common stock of CNB and recorded goodwill of $89.0 million, which is not deductible for tax purposes. At acquisition, CNB had total acquired assets on a fair value basis of $899.9 million, with loans of $734.0 million, investment securities of $90.1 million and deposits of $786.9 million. The transaction expanded the Company’s geographic footprint across Long Island including Nassau County, Queens and into New York City. It complements the Bank’s existing branch network and enhances asset generation capabilities. The expanded branch network allows the Bank to serve a greater portion of the Long Island and metropolitan marketplace through a network of 40 branches.
The acquisition was accounted for under the acquisition method of accounting in accordance with FASB ASC 805, “Business Combinations.” Accordingly, the assets acquired and liabilities assumed were recorded at their respective acquisition date fair values, and identifiable intangible assets were recorded at fair value. The operating results of the Company for the year ended December 31, 2015 include the operating results of CNB since the acquisition date of June 19, 2015.
| Page -82- |
The following table summarizes the preliminary fair value of the assets acquired and liabilities assumed on June 19, 2015:
| (In thousands) | As
Initially Reported | Measurement
Period Adjustments | As Adjusted | |||||||||
| (In thousands, except per share amounts) | ||||||||||||
| Cash and due from banks | $ | 24,628 | $ | — | $ | 24,628 | ||||||
| Securities | 90,109 | — | 90,109 | |||||||||
| Loans | 736,348 | (2,362 | ) | 733,986 | ||||||||
| Bank Owned Life Insurance | 21,445 | — | 21,445 | |||||||||
| Premises and equipment | 6,398 | — | 6,398 | |||||||||
| Other intangible assets | 6,698 | — | 6,698 | |||||||||
| Other assets | 14,484 | 2,182 | 16,666 | |||||||||
| Total Assets Acquired | $ | 900,110 | $ | (180 | ) | $ | 899,930 | |||||
| Deposits | $ | 786,853 | — | 786,853 | ||||||||
| Federal Home Loan Bank term advances | 35,581 | — | 35,581 | |||||||||
| Other liabilities and accrued expenses | 5,647 | 3,341 | 8,988 | |||||||||
| Total Liabilities Assumed | $ | 828,081 | $ | 3,341 | $ | 831,422 | ||||||
| Net Assets Acquired | 72,029 | (3,521 | ) | 68,508 | ||||||||
| Consideration Paid | 157,503 | — | 157,503 | |||||||||
| Goodwill Recorded on Acquisition | $ | 85,474 | $ | 3,521 | $ | 88,995 | ||||||
The above fair values are final with the exception of loans, premises and equipment, other assets, other liabilities and accrued expenses which are subject to adjustment as the Company finalizes fair value assessments. In accordance with FASB ASC 805-10 (Subtopic 25-15), the Company has up to one year from date of acquisition to complete this assessment.
The following table presents selected unaudited pro forma financial information reflecting the Merger assuming it was completed as of January 1, 2015 and January 1, 2014. The unaudited pro forma financial information is presented for illustrative purposes only and is not necessarily indicative of the financial results of the combined companies had the Merger actually been completed at the beginning of the periods presented, nor does it indicate future results for any other interim or full fiscal year period.
The unaudited pro forma information, for the years ended December 31, 2015 and 2014, set forth below reflects the adjustments related to estimated amortization and accretion of purchase accounting fair value adjustments related to interest income on loans and investments, interest expense on time deposits and borrowings, unfavorable leases, SBA loan servicing rights, and core deposit and other intangibles. In the table below, merger-related expenses of $11.8 million and $1.3 million were excluded from pro forma non-interest expenses for the year ended December 31, 2015 and 2014, respectively. Additionally, the unaudited pro forma information does not reflect management’s estimate of any revenue enhancement opportunities or anticipated cost savings:
| Pro Forma for the Year | ||||||||
| Unaudited | Ended December 31, | |||||||
| (In thousands, except per share amounts) | 2015 | 2014 | ||||||
| Net Interest Income | $ | 129,538 | $ | 102,400 | ||||
| Net income | $ | 35,856 | $ | 20,089 | ||||
| Basic earnings per share | $ | 2.06 | $ | 1.90 | ||||
| Diluted earnings per share | $ | 2.06 | $ | 1.90 | ||||
| Page -83- |
On February 14, 2014, the Company acquired FNBNY resulting in the addition of total acquired assets on a fair value basis of $211.9 million, with loans of $89.7 million, investment securities of $103.2 million and deposits of $169.9 million.
The acquisition was accounted for under the acquisition method of accounting in accordance with FASB ASC 805, “Business Combinations.” Accordingly, the assets acquired and liabilities assumed were recorded at their respective acquisition date fair values, and identifiable intangible assets were recorded at fair value. The operating results of the Company include the operating results of FNBNY since the acquisition date of February 14, 2014.
The following table summarizes the finalized fair value of the assets acquired and liabilities assumed:
| (In thousands) | February 14, 2014 | |||
| (In thousands, except per share amounts) | ||||
| Cash and due from banks | $ | 1,883 | ||
| Interest earning deposits with banks | 1,044 | |||
| Securities | 103,192 | |||
| Loans | 89,714 | |||
| Premises and equipment | 1,787 | |||
| Core deposit intangible | 951 | |||
| Other assets | 13,378 | |||
| Total Assets Acquired | $ | 211,949 | ||
| Deposits | 169,873 | |||
| Federal Home Loan Bank term advances | 39,282 | |||
| Unsecured debt | 1,450 | |||
| Other liabilities and accrued expenses | 2,620 | |||
| Total Liabilities Assumed | $ | 213,225 | ||
| Net Assets Acquired/(Liabilities Assumed) | (1,276 | ) | ||
| Consideration Paid | 6,140 | |||
| Goodwill Recorded on Acquisition | $ | 7,416 | ||
21. PRESENTATION OF DEBT ISSUANCE COSTS
During the third quarter of 2015, the Company adopted Accounting Standards Update (“ASU”) No. 2015-03 “Simplifying the Presentation of Debt Issuance Costs,” which requires that debt issuance costs be presented in the balance sheet as a direct deduction from the carrying amount of debt liability. This ASU is required to be applied retrospectively to all periods presented. The following table summarizes the impact of retrospective application to the balance sheet for the year ended December 31, 2014:
| (in thousands) | December 31, 2014 | |||
| Other assets | ||||
| As previously reported | $ | 19,373 | ||
| As reported under the new guidance | 19,244 | |||
| Total assets | ||||
| As previously reported | $ | 2,288,653 | ||
| As reported under the new guidance | 2,288,524 | |||
| Junior subordinated debentures | ||||
| As previously reported | $ | 16,002 | ||
| As reported under the new guidance | 15,873 | |||
| Total liabilities | ||||
| As previously reported | $ | 2,113,535 | ||
| As reported under the new guidance | 2,113,406 | |||
| Page -84- |
REPORT OF INDEPENDENT REGISTERED PUBLIC ACCOUNTING FIRM
Audit Committee
Board of Directors
Bridge Bancorp, Inc.
Bridgehampton, New York
We have audited the accompanying consolidated balance sheets of Bridge Bancorp, Inc. as of December 31, 2015 and 2014, and the related consolidated statements of income, comprehensive income, stockholders’ equity and cash flows for each of the years in the three-year period ended December 31, 2015. We also have audited Bridge Bancorp, Inc.’s internal control over financial reporting as of December 31, 2015, based on criteria established in Internal Control—Integrated Framework (2013) issued by the Committee of Sponsoring Organizations of the Treadway Commission (COSO). Bridge Bancorp, Inc.’s management is responsible for these consolidated financial statements, for maintaining effective internal control over financial reporting, and for its assessment of the effectiveness of internal control over financial reporting, included in the Report By Management On Internal Control Over Financial Reporting located in Item 9A. Our responsibility is to express an opinion on these consolidated financial statements and an opinion on Bridge Bancorp, Inc.’s internal control over financial reporting based on our audits.
We conducted our audits in accordance with the standards of the Public Company Accounting Oversight Board (United States). Those standards require that we plan and perform the audits to obtain reasonable assurance about whether the financial statements are free of material misstatement and whether effective internal control over financial reporting was maintained in all material respects. Our audits of the financial statements included examining, on a test basis, evidence supporting the amounts and disclosures in the financial statements, assessing the accounting principles used and significant estimates made by management, and evaluating the overall financial statement presentation. Our audit of internal control over financial reporting included obtaining an understanding of internal control over financial reporting, assessing the risk that a material weakness exists, and testing and evaluating the design and operating effectiveness of internal control, based on the assessed risk. Our audits also included performing such other procedures as we considered necessary in the circumstances. We believe that our audits provide a reasonable basis for our opinions.
A company’s internal control over financial reporting is a process designed to provide reasonable assurance regarding the reliability of financial reporting and the preparation of financial statements for external purposes in accordance with generally accepted accounting principles. A company’s internal control over financial reporting includes those policies and procedures that (1) pertain to the maintenance of records that, in reasonable detail, accurately and fairly reflect the transactions and dispositions of the assets of the company; (2) provide reasonable assurance that transactions are recorded as necessary to permit preparation of financial statements in accordance with generally accepted accounting principles, and that receipts and expenditures of the company are being made only in accordance with authorizations of management and directors of the company; and (3) provide reasonable assurance regarding prevention or timely detection of unauthorized acquisition, use, or disposition of the company’s assets that could have a material effect on the financial statements.
Because of its inherent limitations, internal control over financial reporting may not prevent or detect misstatements. Also, projections of any evaluation of effectiveness to future periods are subject to the risk that controls may become inadequate because of changes in conditions, or that the degree of compliance with the policies or procedures may deteriorate.
In our opinion, the consolidated financial statements referred to above present fairly, in all material respects, the financial position of Bridge Bancorp, Inc. as of December 31, 2015 and 2014, and the results of its operations and its cash flows for each of the years in the three-year period ended December 31, 2015 in conformity with accounting principles generally accepted in the United States of America. Also in our opinion, Bridge Bancorp, Inc. maintained, in all material respects, effective internal control over financial reporting as of December 31, 2015, based on criteria established in Internal Control—Integrated Framework (2013) issued by the Committee of Sponsoring Organizations of the Treadway Commission (COSO).
 | |
| Crowe Horwath LLP |
New York, New York
March 14, 2016
| Page -85- |
Item 9. Changes in and Disagreements with Accountants on Accounting and Financial Disclosure
None.
Item 9A. Controls and Procedures
Disclosure Controls and Procedures
An evaluation was performed under the supervision and with the participation of the Company’s management, including the Principal Executive Officer and Principal Financial Officer, of the effectiveness of the design and operation of the Company’s disclosure controls and procedures (as defined in Rule 13a-15(e) promulgated under the Securities and Exchange Act of 1934, as amended) as of December 31, 2015. Based on that evaluation, the Company’s Principal Executive Officer and Principal Financial Officer concluded that the Company’s disclosure controls and procedures were effective as of the end of the period covered by the annual report.
Report by Management on Internal Control Over Financial Reporting
Management is responsible for establishing and maintaining an effective system of internal control over financial reporting. The Company’s system of internal control over financial reporting is designed to provide reasonable assurance regarding the reliability of financial reporting and the preparation of financial statements for external purposes in accordance with generally accepted accounting principles. There are inherent limitations in the effectiveness of any system of internal control over financial reporting, including the possibility of human error and circumvention or overriding of controls. Accordingly, even an effective system of internal control over financial reporting can provide only reasonable assurance with respect to financial statement preparation. Projections of any evaluation of effectiveness to future periods are subject to the risks that controls may become inadequate because of changes in conditions or that the degree of compliance with the policies or procedures may deteriorate.
Management assessed the Company’s internal control over financial reporting as of December 31, 2015. This assessment was based on criteria for effective internal control over financial reporting described in Internal Control - Integrated Framework (2013) issued by the Committee of Sponsoring Organizations of the Treadway Commission. Based on this assessment, management believes that, as of December 31, 2015, the Company maintained effective internal control over financial reporting based on those criteria.
The Company’s independent registered public accounting firm that audited the financial statements that are included in this annual report on Form 10-K, has issued an attestation report on the Company’s internal control over financial reporting. The attestation report of Crowe Horwath LLP appears on the previous page.
Changes in Internal Control Over Financial Reporting
There has been no change in the Company’s internal control over financial reporting during the quarter ended December 31, 2015, that has materially affected, or is reasonably likely to materially affect, the Company’s internal control over financial reporting.
None.
Item 10. Directors, Executive Officers and Corporate Governance
The information regarding Directors, Executive officers and Corporate Governance will be set forth in the Registrant’s Proxy Statement for the Annual Meeting of Shareholders to be held on May 6, 2016 and is incorporated herein by reference thereto.
Item 11. Executive Compensation
The information regarding Executive Compensation will be set forth in the Registrant’s Proxy Statement for the Annual Meeting of Shareholders to be held on May 6, 2016 and is incorporated herein by reference thereto.
| Page -86- |
Item 12. Security Ownership of Certain Beneficial Owners and Management and Related Stockholder Matters
The information regarding Security Ownership of Certain Beneficial Owners and Management and Related Stockholder Matters will be set forth in the Registrant’s Proxy Statement for the Annual Meeting of Shareholders to be held on May 6, 2016 and is incorporated herein by reference thereto.
Set forth below is certain information as of December 31, 2015, regarding the Company’s equity compensation plans that have been approved by stockholders. The Company does not have any equity compensation plans that have not been approved by shareholders.
| Equity Compensation Plan approved by Stockholders | Number
of securities to be Issued upon Exercise of outstanding options and awards | Weighted
Average Exercise Price with respect to Outstanding Stock Options | Number
of Securities Remaining Available for Issuance under the Plan | |||||||||
| 2006 Equity Incentive Plan | 114,602 | $ | 25.25 | — | ||||||||
| 2012 Equity Incentive Plan | 262,830 | — | 581,369 | |||||||||
| Total | 377,432 | $ | 25.25 | 581,369 | ||||||||
Item 13. Certain Relationships and Related Transactions, and Director Independence
The information regarding Certain Relationships and Related Transactions and Director Independence will be set forth in the Registrant’s Proxy Statement for the Annual Meeting of Shareholders to be held on May 6, 2016 and is incorporated herein by reference thereto.
Item 14. Principal Accountant Fees and Services
“Item 2 - Ratification of the Appointment of the Independent Registered Public Accounting Firm” “Fees Paid to Crowe Horwath,” and “Policy on Audit Committee Pre-approval of Audit and Non-audit Services of Independent Registered Public Accounting Firm” set forth in the Registrant’s Proxy Statement for the Annual Meeting of Shareholders to be held on May 6, 2016, is incorporated herein by reference.
Item 15. Exhibits and Financial Statement Schedules
(a) The following Consolidated Financial Statements, including notes thereto, and financial schedules of the Company, required in response to this item are included in Part II, Item 8.
| 1. | Financial Statements | Page No. | |||
| Consolidated Balance Sheets | 36 | ||||
| Consolidated Statements of Income | 37 | ||||
| Consolidated Statements of Comprehensive Income | 38 | ||||
| Consolidated Statements of Stockholders’ Equity | 39 | ||||
| Consolidated Statements of Cash Flows | 40 | ||||
| Notes to Consolidated Financial Statements | 41 | ||||
| Report of Independent Registered Public Accounting Firm | 85 | ||||
| 2. | Financial Statement Schedules | ||||
Financial Statement Schedules have been omitted because they are not applicable or the required information is shown in the Consolidated Financial Statements or Notes thereto under Item 8, “Financial Statements and Supplementary Data.”
| 3. | Exhibits. | |
| See Index of Exhibits on page 89. |
| Page -87- |
Pursuant to the requirements of Section 13 or 15(d) of the Securities and Exchange Act of 1934, the registrant has duly caused this report to be signed on its behalf by the undersigned, thereunto duly authorized.
| BRIDGE BANCORP, INC. | ||
| Registrant | ||
| March 14, 2016 | /s/ Kevin M. O’Connor | |
| Kevin M. O’Connor | ||
| President and Chief Executive Officer | ||
| March 14, 2016 | /s/ Howard H. Nolan | |
| Howard H. Nolan | ||
| Senior Executive Vice President and Chief Financial | ||
| Officer | ||
| March 14, 2016 | /s/ Lisa A. DiIorio | |
| Lisa A. DiIorio | ||
| Vice President, Principal Accounting Officer |
Pursuant to the requirements of the Securities and Exchange Act of 1934, this report has been signed below by the following persons on behalf of the registrant and in the capacities and on the dates indicated.
| March 14, 2016 | /s/ Marcia Z. Hefter | ,Director | |
| Marcia Z. Hefter | |||
| March 14, 2016 | /s/ Dennis A. Suskind | ,Director | |
| Dennis A. Suskind | |||
| March 14, 2016 | /s/ Kevin M. O’Connor | ,Director | |
| Kevin M. O’Connor | |||
| March 14, 2016 | /s/ Emanuel Arturi | ,Director | |
| Emanuel Arturi | |||
| March 14, 2016 | /s/ Charles I. Massoud | ,Director | |
| Charles I. Massoud | |||
| March 14, 2016 | /s/ Albert E. McCoy Jr. | ,Director | |
| Albert E. McCoy Jr. | |||
| March 14, 2016 | /s/ Howard H. Nolan | ,Director | |
| Howard H. Nolan | |||
| March 14, 2016 | /s/ Rudolph J. Santoro | ,Director | |
| Rudolph J. Santoro | |||
| March 14, 2016 | /s/ Thomas J. Tobin | ,Director | |
| Thomas J. Tobin | |||
| March 14, 2016 | /s/ Raymond A. Nielsen | ,Director | |
| Raymond A. Nielsen | |||
| March 14, 2016 | /s/ Daniel Rubin | ,Director | |
| Daniel Rubin | |||
| March 14, 2016 | /s/ Christian Yegen | ,Director | |
| Christian Yegen |
| Page -88- |
| EXHIBIT INDEX | ||||
| Exhibit Number | Description of Exhibit | Exhibit | ||
| 3.1 | Certificate of Incorporation of the registrant (incorporated by reference to Registrant’s amended Form 10, File No. 0-18546, filed October 15, 1990) | * | ||
| 3.1(i) | Certificate of Amendment of the Certificate of Incorporation of the Registrant (incorporated by reference to Registrant’s Form 10, File No. 0-18546, filed August 13, 1999) | * | ||
| 3.1(ii) | Certificate of Amendment of the Certificate of Incorporation of the Registrant (incorporated by reference to Registrant’s Definitive Proxy Statement, File No. 0-18546, filed November 18, 2008) | * | ||
| 3.2 | Revised By-laws of the Registrant (incorporated by reference to Registrant’s Form 8-K, File No. 1-34096, filed July 3, 2013) | * | ||
| 10.1 | Amended and Restated Employment Contract – Howard H. Nolan (incorporated by reference to Registrant’s Form 8-K, File No. 0-18546, filed June 27, 2012) | * | ||
| 10.2 | Employment Contract – Kevin M. O’Connor (incorporated by reference to Registrant’s Form 8-K, File No. 0-18546, filed October 9, 2007) | * | ||
| 10.3 | Form of Change in Control Agreement entered into with Messrs. McCaffery, Manseau and Santacroce (incorporated by reference to Registrant’s Form 10-K, File No. 001-34096, filed March 16, 2015) | * | ||
| 10.4 | Equity Incentive Plan (incorporated by reference to Registrant’s Form S-8, File No. 0-18546, filed August 14, 2006) | * | ||
| 10.5 | Supplemental Executive Retirement Plan (Revised for 409A) (incorporated by reference to Registrant’s Form 10-K, File No. 0-18546, filed March 14, 2008) | * | ||
| 10.6 | Agreement and Plan of Merger by and between Bridge Bancorp, Inc., The Bridgehampton National Bank and Community National Bank (incorporated by reference to Registrant’s Form 8-K, File No. 001-34096, filed December 18, 2014) | * | ||
| 23 | Consent of Independent Registered Public Accounting Firm | |||
| 31.1 | Certification of Principal Executive Officer pursuant to Rule 13a-14(a) | |||
| 31.2 | Certification of Principal Financial Officer pursuant to Rule 13a-14(a) | |||
| 32.1 | Certification of Chief Executive Officer and Chief Financial Officer pursuant to Rule 13a-14(b) and U.S.C. Section 1350 | |||
| 101 | The following financial statements from Bridge Bancorp, Inc.’s Annual Report on Form 10-K for the Year Ended December 31, 2015, filed on March 14, 2016, formatted in XBRL: (i) Consolidated Balance Sheets as of December 31, 2015 and December 31, 2014, (ii) Consolidated Statements of Income for the Years Ended December 31, 2015, 2014 and 2013, (iii) Consolidated Statements of Comprehensive Income for the Years Ended December 31, 2015, 2014 and 2013, (iv) Consolidated Statements of Stockholders’ Equity for the Years Ended December 31, 2015, 2014 and 2013, (v) Consolidated Statements of Cash Flows for the Years Ended December 31, 2015, 2014 and 2013, and (vi) the Notes to Consolidated Financial Statements. | |||
| 101.INS | XBRL Instance Document | |||
| 101.SCH | XBRL Taxonomy Extension Schema Document | |||
| 101.CAL | XBRL Taxonomy Extension Calculation Linkbase Document | |||
| 101.LAB | XBRL Taxonomy Extension Labels Linkbase Document | |||
| 101.PRE | XBRL Taxonomy Extension Presentation Linkbase Document | |||
| 101.DEF | XBRL Taxonomy Extension Definitions Linkbase Document | |||
| * | Denotes incorporated by reference. |
| Page -89- |