Attached files
| file | filename |
|---|---|
| EX-31.2 - EXHIBIT 31.2 - OMEGA PROTEIN CORP | ex31-2.htm |
| EX-23.1 - EXHIBIT 23.1 - OMEGA PROTEIN CORP | ex23-1.htm |
| EX-32.2 - EXHIBIT 32.2 - OMEGA PROTEIN CORP | ex32-2.htm |
| EX-31.1 - EXHIBIT 31.1 - OMEGA PROTEIN CORP | ex31-1.htm |
| EX-21 - EXHIBIT 21 - OMEGA PROTEIN CORP | ex21.htm |
| EX-32.1 - EXHIBIT 32.1 - OMEGA PROTEIN CORP | ex32-1.htm |
UNITED STATES
SECURITIES AND EXCHANGE COMMISSION
Washington, D.C. 20549
Form 10-K
|
☒ |
ANNUAL REPORT PURSUANT TO SECTION 13 OR 15(d) OF THE |
| SECURITIES EXCHANGE ACT OF 1934 |
For the fiscal year ended December 31, 2015
OR
|
☐ |
TRANSITION REPORT PURSUANT TO SECTION 13 OR 15(d) OF THE |
| SECURITIES EXCHANGE ACT OF 1934 |
For the transition period from to
Commission file number: 001-14003
OMEGA PROTEIN CORPORATION
(Exact name of Registrant as specified in its charter)
|
State of Nevada |
|
76-0562134 |
|
(State or other jurisdiction of incorporation or organization) |
|
(I.R.S. Employer Identification No.) |
|
2105 City West Blvd, Suite 500 |
|
|
|
Houston, Texas |
|
77042 |
|
(Address of principal executive offices) |
|
(Zip Code) |
Registrant’s telephone number, including area code: (713) 623-0060
Securities registered pursuant to Section 12(b) of the Act:
|
Title of each class |
Name of each exchange on which registered |
|
Common Stock, $0.01 par value |
New York Stock Exchange |
Securities registered pursuant to Section 12(g) of the Act:
None.
Indicate by check mark if the registrant is a well-known seasoned issuer, as defined in Rule 405 of the Securities Act. Yes ☐ No ☒
Indicate by check mark if the registrant is not required to file reports pursuant to Section 13 or Section 15(d) of the Exchange Act. Yes ☐ No ☒
Indicate by check mark whether the registrant (1) has filed all reports required to be filed by Section 13 or 15(d) of the Securities Exchange Act of 1934 during the preceding 12 months (or for such shorter period that the Registrant was required to file such reports), and (2) has been subject to such filing requirements for the past 90 days. Yes ☒ No ☐
Indicate by check mark whether the registrant has submitted electronically and posted on its corporate Web site, if any, every Interactive Data File required to be submitted and posted pursuant to Rule 405 of Regulation S-T (§232.405 of this chapter) during the preceding 12 months (or for such shorter period that the registrant was required to submit and post such files). Yes ☒ No ☐
Indicate by check mark if disclosure of delinquent filers pursuant to Item 405 of Regulation S-K is not contained herein, and will not be contained, to the best of registrant’s knowledge, in definitive proxy or information statements incorporated by reference in Part III of this Form 10-K or any amendment to this Form 10-K. ☒
Indicate by check mark whether the registrant is a large accelerated filer, an accelerated filer, a non-accelerated filer, or a smaller reporting company. See definitions of “large accelerated filer,” “accelerated filer” and “smaller reporting company” in Rule 12b-2 of the Exchange Act. (Check one):
|
Large accelerated filer ☐ |
Accelerated filer ☒ |
Non-accelerated filer ☐ |
Small reporting company ☐ |
Indicate by check mark whether the registrant is a shell company (as defined in Rule 12b-2 of the Exchange Act). Yes ☐ No ☒
The aggregate market value of the voting and non-voting common equity held by non-affiliates of the registrant was approximately $286,656,411 as of June 30, 2015 (computed by reference to the quoted closing price of the registrant’s common stock on the New York Stock Exchange on June 30, 2015). Shares of common stock held by each officer and director and by each person who owns 10% or more of the outstanding stock have been excluded from this computation in that such persons may be deemed to be affiliates. This determination of affiliate status is not necessarily a conclusive determination for other purposes.
On February 29, 2016, there were outstanding 22,204,451 shares of the Company’s common stock, $0.01 par value.
Documents incorporated by reference: Portions of the registrant’s definitive proxy statement for its 2016 annual meeting of stockholders, which will be filed with the Securities and Exchange Commission within 120 days after December 31, 2015, are incorporated by reference to the extent set forth in Part III of this Form 10-K.
OMEGA PROTEIN CORPORATION
TABLE OF CONTENTS
|
PART I. |
||
|
Items 1. and 2. |
Business and Properties |
3 |
|
Item 1A. |
Risk Factors |
18 |
|
Item 1B. |
Unresolved Staff Comments |
31 |
|
Item 3. |
Legal Proceedings |
31 |
|
Item 4. |
Mine Safety Disclosures |
31 |
|
PART II. |
||
|
Item 5. |
Market for Registrant’s Common Equity, Related Stockholder Matters and Issuer Purchases of Equity Securities |
32 |
|
Item 6. |
Selected Financial Data |
33 |
|
Item 7. |
Management’s Discussion and Analysis of Financial Condition and Results of Operations |
33 |
|
Item 7A. |
Quantitative and Qualitative Disclosure About Market Risk |
45 |
|
Item 8. |
Financial Statements and Supplementary Data |
45 |
|
|
Report of Independent Registered Public Accounting Firm |
46 |
|
|
Consolidated Balance Sheets as of December 31, 2015 and 2014 | 47 |
|
|
Consolidated Statements of Comprehensive Income for the years ended December 31, 2015, 2014 and 2013 | 48 |
|
|
Consolidated Statements of Cash Flows for the years ended December 31, 2015, 2014 and 2013 | 49 |
|
|
Consolidated Statements of Stockholders’ Equity for the years ended December 31, 2015, 2014 and 2013 | 51 |
|
|
Notes to Consolidated Financial Statements | 52 |
|
Item 9. |
Changes in and Disagreements with Accountants on Accounting and Financial Disclosure |
85 |
|
Item 9A. |
Controls and Procedures |
85 |
|
Item 9B. |
Other Information |
85 |
|
PART III. |
||
|
Item 10. |
Directors, Executive Officers and Corporate Governance |
86 |
|
Item 11. |
Executive Compensation |
86 |
|
Item 12. |
Security Ownership of Certain Beneficial Owners and Management and Related Stockholder Matters |
86 |
|
Item 13. |
Certain Relationships and Related Transactions, and Director Independence |
87 |
|
Item 14. |
Principal Accountant Fees and Services |
87 |
|
PART IV. |
||
|
Item 15. |
Exhibits, Financial Statement Schedules |
87 |
|
Signatures |
93 |
CAUTIONARY NOTE REGARDING FORWARD-LOOKING STATEMENTS
Forward-looking statements in this Annual Report on Form 10-K, future filings by the Company with the U.S. Securities and Exchange Commission (the “SEC”), the Company’s press releases and oral statements by authorized officers of the Company are intended to be subject to the safe harbor provisions of the Private Securities Litigation Reform Act of 1995. Investors are cautioned that all forward-looking statements involve risks and uncertainty, including without limitation, the risks set forth under Item 1A “Risk Factors.” The Company believes that forward-looking statements made by it are based on reasonable expectations; however, no assurances can be given that actual results will not differ materially from those contained in such forward-looking statements. Forward-looking statements involve statements that are predictive in nature, which depend upon or refer to future events or conditions, or which include the words “estimate,” “project,” “anticipate,” “expect,” “predict,” “believe,” “could,” “hope,” “plans,” “intend,” “seek,” “should,” “goal,” “would,” “may” and similar expressions. Readers are cautioned not to place undue reliance on forward-looking statements contained in this document, which speak only as of the date of this Annual Report on Form 10-K. We undertake no responsibility to publicly update or revise any forward looking statements after the date they are made, whether as a result of new information, future events or otherwise.
PART I
Items 1. and 2. Business and Properties.
General
Omega Protein Corporation is a nutritional products company that develops, produces and delivers nutritious products throughout the world to improve the nutritional integrity of foods, dietary supplements and animal feeds. As used herein, the term the “Company” refers to Omega Protein Corporation and its consolidated subsidiaries, as applicable. The Company’s principal executive offices are located at 2105 City West Boulevard, Suite 500, Houston, Texas 77042-2838 (Telephone: (713) 623-0060).
The Company operates in two primary industry segments: animal nutrition and human nutrition.
The Company’s animal nutrition segment is comprised primarily of two subsidiaries: Omega Protein, Inc. (“Omega Protein”) and Omega Shipyard, Inc. (“Omega Shipyard”). Omega Protein, the Company’s principal operating subsidiary, is predominantly dedicated to the production of animal nutrition products and operates in the menhaden harvesting and processing business and is the successor to a business conducted since 1913. Omega Protein currently operates a total of three menhaden processing plants in the states of Louisiana, Mississippi and Virginia. The Company also operates a Health and Science Center in Reedville, Virginia, which provides 100-metric tons per day of fish oil input capacity for the Company’s food, industrial and feed grade oils. A portion of Omega Protein’s production is transferred to its human nutrition segment. Omega Shipyard owns and operates a drydock facility in Moss Point, Mississippi that is used to provide shoreside maintenance for Omega Protein’s fishing fleet.
Prior to December 31, 2015, the Company’s human nutrition segment operated under the names Nutegrity and Bioriginal Food & Science Corp. (“Bioriginal Food & Science”). Nutegrity was comprised primarily of three subsidiaries: Cyvex Nutrition, Inc. (“Cyvex”), InCon Processing, L.L.C. (“InCon”) and Wisconsin Specialty Protein, L.L.C. (“WSP”). Subsequent to December 31, 2015, the Company combined the Nutegrity and Bioriginal Food & Science names into one name and does business under the name “Bioriginal” which includes all of the human nutrition businesses except the tera’s branded products. Bioriginal has three primary product lines: protein products, specialty oils and other nutraceutical ingredients. Cyvex, acquired by the Company in December 2010, is located in Irvine, California and is an ingredient supplier for the food and nutraceutical industries. InCon, acquired by the Company in September 2011, is located in Batavia, Illinois and is a specialty processor that utilizes molecular distillation technology to purify and concentrate Omega-3 fish oils and, subject to outside demand and excess capacity, a variety of other compound products for third-party tolling customers. On March 8, 2016, as part of its strategy to focus on non-concentrated omega-3 oils instead of concentrated omega-3 oils, the Company decided to exit this oil concentration facility and relocate certain assets from this facility to other Company facilities. In order to satisfy current customer obligations, the Company plans to continue to operate this facility on a limited basis through the middle of 2017. As of December 31, 2015, the Company recognized $4.5 million in losses relating to the impairment of property, plant and equipment as well as estimated decommissioning costs. For additional information see Note 4 – Plant Closure to the consolidated financial statements included in Item 8. WSP, acquired by the Company in February 2013, is a manufacturer and marketer of branded and bulk specialty dairy proteins and other related products headquartered in Madison, Wisconsin and operates a production facility in Reedsburg, Wisconsin. For additional information related to the Company’s acquisition of WSP, see Note 3 – Acquisition of Wisconsin Specialty Protein, L.L.C to the consolidated financial statements included in Item 8.
Bioriginal Food & Science, acquired by the Company in September 2014 and headquartered in Saskatoon, Canada with additional operations in the Netherlands, is a supplier of plant and marine based specialty oils to the food and nutraceutical industries. See Note 2 – Acquisition of Bioriginal Food & Science Corp. to the consolidated financial statements included in Item 8 for additional information.
The Company also operates a technical center in Houston, Texas, the Omega Protein Technology and Innovation Center, which has food science application labs as well as analytical, sensory, lipids research and pilot plant capabilities.
For financial information about the Company’s industry segments for years 2015, 2014 and 2013, see Note 17 to the consolidated financial statements included in Item 8.
Geographic Information
The Company’s export sales were approximately $130 million, $147 million, and $120 million in 2015, 2014 and 2013, respectively. Such sales were made primarily to Asian, European and Canadian markets. In 2015, 2014 and 2013, sales to the Company’s top customer were approximately $35.6 million, $26.6 million and $22.7 million, respectively. The top customer was Carrington Farms for 2015, ED and F Man Liquid Products for 2014 and Nestle Purina Pet Care for 2013. In 2014, a second customer, Nestle Purina Pet Care, accounted for approximately $24.9 million of revenue.
The following table shows the geographical distribution of revenues (in millions) based on location of customers:
|
Years Ended December 31, |
||||||||||||||||||||||||
|
2015 |
2014 |
2013 |
||||||||||||||||||||||
|
Revenues |
Percent |
Revenues |
Percent |
Revenues |
Percent |
|||||||||||||||||||
|
U.S. |
$ | 229.0 | 63.7 | % | $ | 161.8 | 52.4 | % | $ | 123.9 | 50.7 | % | ||||||||||||
|
Asia (1) |
54.9 | 15.3 | 58.5 | 19.0 | 70.9 | 29.0 | ||||||||||||||||||
|
Europe |
50.2 | 14.0 | 69.5 | 22.5 | 31.5 | 12.9 | ||||||||||||||||||
|
Canada |
21.2 | 5.9 | 16.1 | 5.2 | 11.6 | 4.8 | ||||||||||||||||||
|
Mexico |
2.6 | 0.7 | 1.9 | 0.6 | 1.3 | 0.5 | ||||||||||||||||||
|
South & Central America |
0.6 | 0.2 | 0.6 | 0.2 | 4.8 | 2.0 | ||||||||||||||||||
|
Other |
0.8 | 0.2 | 0.2 | 0.1 | 0.3 | 0.1 | ||||||||||||||||||
|
Total |
$ | 359.3 | 100.0 | % | $ | 308.6 | 100.0 | % | $ | 244.3 | 100.0 | % | ||||||||||||
|
(1) |
Of this amount, China comprised approximately $35.3 million, $35.9 million and $47.4 million for the years ended December 31, 2015, 2014 and 2013, respectively. |
The following table sets forth the Company’s revenues by product (in millions) and the approximate percentage of total revenues represented thereby, for the indicated periods:
| Years Ended December 31, | ||||||||||||||||||||||||
|
2015 |
2014 |
2013 |
||||||||||||||||||||||
|
Revenues |
Percent |
Revenues |
Percent |
Revenues |
Percent |
|||||||||||||||||||
|
Animal Nutrition Revenues |
||||||||||||||||||||||||
|
Fish meal |
$ | 152.4 | 42.5 | % | $ | 147.1 | 47.7 | % | $ | 142.5 | 58.3 | % | ||||||||||||
|
Fish oil |
39.3 | 10.9 | 70.8 | 22.9 | 43.8 | 18.0 | ||||||||||||||||||
|
Refined fish oil |
23.8 | 6.6 | 22.2 | 7.2 | 22.7 | 9.3 | ||||||||||||||||||
|
Fish solubles and other |
4.6 | 1.3 | 3.7 | 1.2 | 4.2 | 1.7 | ||||||||||||||||||
|
Human Nutrition Revenues |
||||||||||||||||||||||||
|
Specialty oils |
113.7 | 31.6 | 41.1 | 13.3 | 5.8 | 2.4 | ||||||||||||||||||
|
Dairy protein products |
12.9 | 3.6 | 11.7 | 3.8 | 9.8 | 4.0 | ||||||||||||||||||
|
Other nutraceutical ingredients |
12.6 | 3.5 | 12.0 | 3.9 | 15.5 | 6.3 | ||||||||||||||||||
|
Total |
$ | 359.3 | 100.0 | % | $ | 308.6 | 100.0 | % | $ | 244.3 | 100.0 | % | ||||||||||||
Company Overview
Businesses. The Company operates in two primary industry segments: animal nutrition and human nutrition. The animal nutrition segment is dedicated to the production of animal nutrition products and operates in the menhaden harvesting and processing business. Omega Protein is the largest U.S. producer of protein-rich meal and oil derived from marine sources. Omega Protein’s products are produced from menhaden (a herring-like fish found in commercial quantities), and include specialty fish meals, crude and refined fish oils and fish solubles that are sold primarily to animal nutrition markets. The human nutrition segment is a supplier of plant and marine based specialty oils, produces Omega-3 fish oils and specialty dairy proteins and other related products, and distributes these and other nutraceutical and food ingredients, which are sold to human nutrition markets.
Animal Nutrition Products
Fishing. Omega Protein’s principal raw material is menhaden, a species of fish that inhabits coastal and inland tidal waters in the United States. Menhaden usually school in large, tight clusters and are commonly found in shallow waters. Spotter aircraft locate the schools and direct the fishing vessels to them. The principal fishing vessels transport two 40-foot purse boats, each carrying several fishermen and one end of a 1,500-foot net. The purse boats encircle the school and capture the fish in the net. The fish are then pumped from the net into refrigerated holds of the fishing vessel and then are unloaded at Omega Protein’s processing plants.
At December 31, 2015, Omega Protein owned a fleet of 37 vessels and 27 spotter aircraft for use in its fishing operations and also leased additional aircraft where necessary to facilitate operations. During the 2015 fishing season in the Gulf of Mexico, which ran from mid-April through October, Omega Protein operated 21 fishing and carry vessels and 21 spotter aircraft. The fishing area in the Gulf is generally located along the Gulf Coast, with a concentration off the Louisiana and Mississippi coasts. The fishing season along the Atlantic coast began in May and ran through November. During the 2015 season, Omega Protein operated 8 fishing vessels and 7 independently-owned spotter aircraft along the Mid-Atlantic coast. The remaining fleet of fishing vessels and spotter aircraft are not routinely operated during the fishing season and are back-up to the active fleet, used for other transportation purposes, inactive, in the process of refurbishment in the Company’s shipyard or held for disposal.
Meal and Oil Processing Plants. Omega Protein operates three meal and oil processing plants, one in each of Louisiana, Mississippi and Virginia, where the menhaden are processed into three general product types: fish meal, fish oil and fish solubles. Omega Protein’s processing plants are located in coastal areas near Omega Protein’s fishing fleet. Annual volume processed varies depending upon menhaden catch and production yields. Each plant maintains a dedicated dock to unload fish, fish processing equipment and product storage facilities. The fish are unloaded from the fishing vessels into storage boxes and then conveyed into steam cookers. The fish are then passed through presses to remove most of the oil and water. The solid portions of the fish are dried and ground into fish meal. The liquid that is produced in the cooking and pressing operations contains oil, water, dissolved protein and some fish solids. This liquid is decanted to remove the solids and is put through a centrifugal oil and water separation process. The separated fish oil is a finished product called crude oil. The separated water and protein mixture is further processed through evaporators to recover the soluble protein, which can be sold as solubles or added to the solid portions of the fish for processing into fish meal.
In December 2013, the Company closed its Cameron, Louisiana menhaden processing plant and re-deployed some of its harvesting and processing assets to the three remaining menhaden processing plants. The strategic decision to close the facility and re-deploy these assets is the result of the Company’s efforts to improve financial performance by increasing the utilization of its existing assets and reducing maintenance-related capital expenditures. The Company believes that consolidating its two western Gulf of Mexico facilities into a single facility based in Abbeville, Louisiana has improved long term operating and capital efficiencies.
As a result of the closure, the Company recognized a loss on closure of approximately $2.1 million in 2015, $7.1 million in 2014 and $6.6 million in 2013 related to the impairment of harvesting and processing assets, re-deployment of assets to other plants, employee severances and other ongoing closure costs. For additional information, see Note 4 – Plant Closure to the consolidated financial statements included in Item 8.
Shipyard. Omega Shipyard owns a 49.4 acre shipyard facility in Moss Point, Mississippi which includes three dry docks, each with a capacity of 1,300 tons. The shipyard is used for routine maintenance and vessel refurbishment on Omega Protein’s fishing vessels.
Health and Science Center. Omega Protein’s Health and Science Center provides 100-metric tons per day of fish oil processing capacity and is located adjacent to Omega Protein’s Reedville, Virginia processing plant. The food-grade facility includes state-of-the-art processing equipment and controls that allow Omega Protein to refine, bleach, fractionate and deodorize its menhaden fish oil. The facility also provides Omega Protein with automated packaging and on-site frozen storage capacity and has a lipids analytical laboratory to enhance the development of Omega-3 oils and food products.
Products. Omega Protein sells three general types of menhaden based products: fish meal, fish oil and fish solubles.
Fish Meal. Fish meal, the principal product made from menhaden, is sold primarily as a high-protein feed ingredient. It is used as a feed ingredient in feed formulated for pigs and other livestock, aquaculture and household pets. Each use requires certain standards to be met regarding quality and protein content, which are determined by the freshness of the fish and by processing conditions such as speed and temperatures. Omega Protein markets fish meal as two different types:
Special Select™. Special Select™ is a premium grade fish meal that is targeted for monogastrics, including baby pigs, pets, shrimp and fish.
SeaLac®. SeaLac® is a premium grade fish meal that is targeted for the cattle industry.
Fish Oil. Omega Protein produces crude unrefined fish oil, refined fish oil and human grade fish oils.
Unrefined Fish Oil. Unrefined fish oil (also referred to as crude fish oil) is Omega Protein’s basic fish oil product. This grade of fish oil has not undergone any portion of the refining process, although some is filtered. Omega Protein’s markets for crude fish oil have changed over time. In the 1990’s, Omega Protein’s main crude fish oil market, which accounted for greater than 90% of Omega Protein’s production, was the manufacturers of hydrogenated oils for human consumption such as margarine and shortening. Since then, the development of the worldwide aquaculture industry has resulted in steady demand for fish oils in order to improve feed efficiency, nutritional value, survivability and health of farm-raised fish species. In 2015, 2014 and 2013, Omega Protein estimates that approximately 81%, 89% and 83% of its crude fish oil was sold as a feed ingredient to the aquaculture industry, respectively.
Refined Fish Oil. Omega Protein’s refined fish oils come in two basic grades.
Feed Grade Oils. Feed grade menhaden oil is processed and refined to offer a high Omega-3 oil for use in pet, aquaculture and livestock feeds. The processing reduces free fatty acids, color and oxidative precursors while enhancing Omega-3 fatty acids for incorporation in the final feed to enhance skin and coat conditioning, reproductive performance and immunity. Kosher products are available. Omega Protein’s refined feed grade fish oils are sold under the name Virginia Prime Gold®. Virginia Prime Gold® fish oil is alkali refined, bleached and then fractionated.
OmegaEquis®. OmegaEquis® is a specialty feed additive product for the equine market that supplies omega-3 fatty acids to horses. OmegaEquis® is Virginia Prime Gold® that has been alkali refined, bleached, fractionated and then flavored in order to enhance palatability.
Human Grade Oils. See Business and Properties – Human Nutrition Products – Specialty Oils.
Fish Solubles. Fish solubles are a liquid protein product used as an additive in fish meal and are also marketed as an independent product to animal feed formulators and the fertilizer industry. Omega Protein’s soluble-based products are:
Neptune Fish Concentrate®. This aqua grade liquid protein is composed of low molecular weight, water-soluble compounds such as free amino acids, peptides and nucleotides that are attractants for a variety of aquaculture feeds. The product is used as the attractant in some commercial baits and may be used in both shrimp and finfish diets to improve attractability and thus consumption. Neptune Fish Concentrate® also can be added directly to grow-out ponds as a fertilizer to help feed plankton and other natural food sources.
OmegaGrow®. OmegaGrow® is a liquid soil or foliar-applied fertilizer for plant nutrition. OmegaGrow® is listed for organic uses by the Organic Materials Review Institute. OmegaGrow® is a free-flowing product that has been filtered through an 80-mesh screen and can be applied by sprayers or through irrigation systems.
Distribution System. Omega Protein’s distribution system of warehouses and tank storage facilities allow for transportation via trucks, barges, containers and railcars to service Omega Protein’s customers throughout the United States and also foreign locations. Omega Protein owns and leases warehouses and tank storage space for storage of its products, generally at terminals along the Mississippi River. Omega Protein generally contracts with third-party trucking, vessel, barge, container and railcar companies to transport its products to and from warehouses and tank storage facilities and directly to its customers.
Omega Protein generally sells most of its products on up to a twelve-month forward contract basis with the balance sold on a spot basis through purchase orders or under longer-term forward contracts. Omega Protein’s sales contracts generally contain force majeure and other production allocation provisions. Historically, fish meal and fish oil sold on a forward contract basis has fluctuated from year to year based upon perceived market availability and forward price expectations. As of December 31, 2015, Omega Protein has sold forward on a contract basis approximately 72,000 short tons (1 short ton = 2,000 pounds) of fish meal and 10,000 metric tons (1 metric ton = 2,204.6 pounds) of fish oil for 2016, contingent on 2016 production and product availability. Of these 2016 forward sales, the majority was contracted during 2015. As a basis of comparison, as of December 31, 2014, Omega Protein had sold forward on a contract basis approximately 54,000 short tons of fish meal and 14,000 metric tons of fish oil for 2015.
Omega Protein’s annual revenues are highly dependent on pricing, annual fish catch, production yields and inventories. Inventory is generally carried over from one year to the next year and Omega Protein determines the level of inventory to be carried over based on existing contracts, prevailing market prices of the products and anticipated customer usage and demand during the off-season. Thus, production volume does not necessarily correlate with sales volume in the same year and sales volumes will fluctuate from quarter to quarter. Omega Protein’s fish meal products have a useable life of approximately one year from the date of production. Practically, however, Omega Protein attempts to empty its warehouses of the previous season’s products by May or June of the new fishing season. Omega Protein’s crude fish oil products do not lose efficacy unless exposed to oxygen and, therefore, their storage life typically is longer than that of fish meal.
Customers and Marketing. Most of Omega Protein’s marine products are sold directly to approximately 200 customers by Omega Protein’s agriproducts sales department, while a smaller amount is sold through independent sales agents and the Company’s human nutrition segment. The Company’s animal nutrition segment product inventory was $63.6 million as of December 31, 2015 versus $48.4 million as of December 31, 2014.
Omega Protein’s fish meal is sold to feed producers as a high-protein ingredient for the swine, aquaculture and pet food industries. Crude fish oil sales primarily involve export markets where the fish oil is used as an ingredient in aquaculture feeds. Over the past decade, increasing percentages of Omega Protein’s fish meal and oil products have been sold into the aquaculture industry. Generally, the growth of the worldwide aquaculture industry has resulted in increasing demand for fish oils and meals to improve feed efficiency, nutritional value and health of farm-raised fish species.
Omega Protein’s products are sold both in the U.S. and internationally. International sales consist of both fish meal and fish oil and are primarily to China, Norway, Canada, Saudi Arabia, Japan and Taiwan. Omega Protein’s sales in these foreign markets are denominated in U.S. Dollars and are not directly affected by currency fluctuations. Such sales could be adversely affected by changes in demand resulting from fluctuations in currency exchange rates.
A number of countries in which Omega Protein currently sells products impose various tariffs and duties, none of which have a significant impact on Omega Protein’s foreign sales. Certain of these duties have been reduced in recent years for certain countries under the North American Free Trade Agreement and the Uruguay Round Agreement of the General Agreement on Tariffs and Trade. In all cases, Omega Protein’s customers are responsible for any tariffs, duties or other levies imposed on Omega Protein’s products sold into these markets.
During the off season, Omega Protein fills purchase orders from the inventory it has accumulated during the fishing season or in some cases, by re-selling meal and oil purchased from other suppliers. Throughout the entire year, prices are often significantly influenced by supply and demand in world markets for competing products, primarily other global sources of fish meal and oil, and also other proteins for its fish meal products, and other fats and oils for its fish oil products when used as an alternative.
Quality Control. Omega Protein believes that maintaining high standards of quality in all aspects of its manufacturing operations plays an important part in its ability to attract and retain customers and maintain its competitive position. To that end, Omega Protein has adopted quality control systems and procedures designed to test the quality aspects of its products, such as protein content and digestibility. Omega Protein regularly reviews, updates and modifies these systems and procedures as appropriate.
Insurance. Omega Protein maintains insurance against physical loss and damage to its assets and coverage against third party liability it may incur in the course of its operations, as well as workers’ compensation, United States Longshoremen’s and Harbor Workers’ Compensation Act and Jones Act coverage. The coverage limits for Omega Protein’s insurance program are generally comprised of several excess liability policies, which are subject to deductibles, underlying limits, annual aggregates and exclusions. Omega Protein believes its insurance coverage to be in such form, against such risks, for such amounts and subject to such deductibles and self-retentions as are generally prudent for its operations but the securing of such coverage by necessity requires judgment in the balancing of retained risk and the cost effectiveness of such insurance programs. Omega Protein has generally elected to increase its deductibles and self-retentions in order to manage rising insurance premium costs. These higher deductibles and self-retentions have resulted in greater uninsured losses to Omega Protein in the cases of the Hurricanes Katrina, Rita and Ike and will expose Omega Protein to greater risk of loss if additional future claims occur.
Insurance coverage may not be available in the future at current costs or on what Omega Protein considers to be commercially reasonable terms. Furthermore, any insurance proceeds received for any loss of, or damage to, any of Omega Protein’s facilities may not be sufficient to restore the loss or damage without negative impact on its business, financial condition or results of operations. For example, property insurance coverage for flood damages caused by named storm hurricanes has from time to time been limited in its availability, and it is possible that such limited coverage might not be adequate to reimburse Omega Protein for its losses if these types of flood losses occur. In addition, should an insurer become insolvent, Omega Protein would be responsible for payment of all outstanding claims associated with that insurer’s policies.
Competition. Omega Protein competes with a domestic menhaden fishing company that was purchased in 2015 by a large foreign company and with numerous fish processors outside the United States. In addition, but to a lesser extent, Omega Protein’s marine protein and oil business is also subject to significant competition from producers of vegetable and other animal protein and oil products. Many of these competitors have significantly greater financial resources, less onerous regulatory costs and more extensive and diversified operations than those of Omega Protein.
Omega Protein competes on price, quality and performance characteristics of its products, such as protein level and amino acid profile in the case of fish meal. The principal competition for Omega Protein’s fish meal and fish solubles is from other global marine proteins as well as other protein sources such as soybean meal and other vegetable or animal protein products. Omega Protein believes, however, that these other non-marine sources are not complete substitutes because fish meal offers nutritional values not contained in such other sources. Other globally produced fish oils provide the primary market competition for Omega Protein’s fish oil, as well as soybean and rapeseed oil.
Prices for Omega Protein’s fish meal and fish oil products are established by worldwide supply and demand relationships over which Omega Protein has no control and tend to fluctuate significantly over the course of a year and from year to year.
Regulation. Omega Protein’s operations are subject to federal, state and local laws and regulations relating to the locations and periods in which fishing may be conducted as well as environmental and safety matters. At the state and local level, certain state and local government agencies have enacted legislation or regulations, which are subject to changes from time to time, which prohibit, restrict or regulate menhaden fishing within their jurisdictional waters.
Omega Protein’s menhaden fishing operations are also subject to regulation by two interstate compact commissions created by federal law: the Atlantic States Marine Fisheries Commission (“ASMFC”) which consists of 14 states along the Atlantic seaboard and three agencies, and the Gulf States Marine Fisheries Commission (“GSMFC”) which consists of five states along the Gulf of Mexico. The ASMFC and GSMFC manage the menhaden fishery throughout its coast-wide range. The Company supports the ASMFC’s and GSMFC’s goal of maintaining a healthy population of menhaden.
ASMFC.
2006 Chesapeake Bay Quota. In 2006, the ASMFC initiated a precautionary cap on the amount of menhaden that could be harvested by Omega Protein in the Chesapeake Bay of 109,020 metric tons (“mt”). The ASMFC later reduced this amount to 87,200 mt beginning in the 2013 fishing year. Omega Protein’s harvests in the Chesapeake Bay have generally been below the 87,200 mt level since 2007 and as a result, the Chesapeake Bay cap has not had a material adverse impact on the Company’s business, financial results, or results of operations.
2012 Coast-wide Quota. In December 2012, the ASMFC established a coast-wide limit on the amount of Atlantic menhaden that can be harvested each year (the “2012 Quota”). As a result, the total Atlantic menhaden harvest coast-wide for all participants in the menhaden fishery in the 2013 and 2014 fishing years was limited to 170,800 mt. This quota is divided among Atlantic coastal states based on average landings from 2009 through 2011. Based on this formula, Virginia’s share of the 2012 Quota was 85% or approximately 318 million pounds (approximately 144,576 mt) after deduction of a 1% quota set-aside. In turn, since 2013 Virginia has allocated its share of the 2012 Quota between the reduction and bait sectors of the menhaden industry on an approximate 90/10 basis resulting in an approximately 286 million pounds, or roughly 130,000 mt, quota for Omega Protein.
Based on the five year average through 2014, 34% of Omega Protein’s fish catch and 31% of its production of fish meal, oil and solubles came from its Atlantic operations. As a result of the implementation of the 2012 Quota, prior to the commencement of the 2013 fishing season Omega Protein reduced the number of vessels at its Reedville plant from eight to seven and reduced the number of Reedville employees from 260 to 225. Omega Protein estimates its 2015 harvest was 99.8% of its allocated quota.
2014 Stock Assessment and Coast-wide Quota Adjustment. In 2014, the ASMFC and the National Marine Fisheries Service jointly conducted a new benchmark stock assessment for Atlantic menhaden that utilized new data sources and a new statistical model. This assessment was the first comprehensive revisiting of the stock assessment model since 2001 and the first stock assessment since a statistically inconclusive update assessment in 2012. Initial results of the 2014 assessment were peer reviewed in December 2014 by an international panel of fisheries experts. In January 2015, the final stock assessment, peer review report and an addendum addressing questions raised by the peer review panel were issued. The peer reviewers approved the stock assessment, while the addendum reported results of additional tests and a change to one of the model parameters requested by the review panel.
The ASMFC final 2014 stock assessment benchmark found that the Atlantic menhaden stock was not overfished and that overfishing for Atlantic menhaden was not occurring.
The ASMFC reviewed and accepted the stock assessment for management use in February 2015. In May 2015, the ASMFC Menhaden Board established a new coast-wide quota for Atlantic menhaden for 2015 and 2016 in response to the positive Atlantic menhaden stock assessment. The revised coast-wide quota for the 2015 and 2016 fishing seasons is 187,880 mt, which represents a ten percent increase above the 2012 Quota. The allocation formula remains the same as established in 2012. As a result, after taking into account allocations among and within ASMFC member states, Omega Protein’s harvest for 2015 and 2016 is limited to approximately 143,000 mt. As a result of this action, Omega Protein increased the number of Atlantic fishing vessels from seven to eight and increased the number of Reedville employees by approximately 20 for the 2015 fishing season.
At its May 2015 meeting, the ASMFC Menhaden Board also initiated a management action to review and potentially change the allocation of quota among the ASMFC member states. This review was called for in the 2012 amendment that established the coast-wide quota system. While the current allocation is based on recent historical landings data, a common method by which the ASMFC allocates fishing privileges among its member states, some ASMFC member states with relatively low allocations of menhaden have argued that Virginia’s 85% share of the Atlantic menhaden quota is too high. It is possible that the ASMFC could decide to re-allocate in a manner that results in a lower percentage to Virginia and/or Omega Protein. If a re-allocation were to occur and depending on the magnitude of the reduction, it could have a material adverse impact on the Company’s business, financial results or results of operations.
The management action initiated by the ASFMC Menhaden Board in May 2015 will also consider establishing new management reference points – benchmarks used to establish quotas and determine when the stock is considered overfished – that consider Atlantic menhaden’s role as forage in the marine ecosystem. Omega Protein does not expect this management action to be completed and effective until 2017 or later. The new, higher quota levels have been set by the ASFMC Menhaden Board at a level below new, more conservative reference points recommended by the stock assessment panel and the menhaden stock is above the level that would be considered overfished. As a result, while the Company does not anticipate that the new reference points under consideration will have a material adverse impact on its business, financial condition or results of operations, it is not possible to predict how the ASMFC may utilize these reference points and what effect that they might ultimately have on the Company’s business, financial condition or results of operations.
In February 2016, the ASMFC initiated the process to establish Atlantic menhaden harvest levels for the 2017 fishing year. The Company believes that it is unlikely the 2017 quota will be reduced below current levels but it is not possible to predict what quota the ASMFC might put in place and what effect a changed quota would ultimately have on the Company’s business, financial condition or results of operations.
GSMFC. In October 2013, the GSMFC adopted reference points for the Gulf menhaden fishery. The reference points do not establish any caps or quotas on the Gulf menhaden fishery but rather measure the rate of harvest in order to insure the continued health of the population. The reference points were set at 663,583 mt annually as the target reference point and 680,765 mt annually as the threshold reference point. For reference, the 2015 total industry wide landings for Gulf menhaden were approximately 536,000 mt.
The GSMFC recommended that if the target level of 663,583 mt were to be exceeded two years in a row, the GSMFC would request an update to the Gulf menhaden stock assessment. In addition, if the threshold level of 680,765 mt were to be exceeded in a single year, the GSMFC would also request a stock assessment update.
Texas. The Texas Parks and Wildlife Commission has adopted regulations related to the menhaden fishery in Texas waters which limits the Total Allowable Catch (“TAC”) to 31.5 million pounds (approximately 14,288 mt) annually. The regulations also allow for a 10% underage or overage in each year which is credited or deducted, as applicable, to the TAC in the following year.
In 2015, Omega Protein’s Texas fish catch did not approach the TAC. Omega Protein’s menhaden fish catch in Texas in 2015 was estimated by the National Marine Fisheries Service to be approximately 4.1 million pounds (approximately 1,900 mt), or approximately 0.4% of Omega Protein’s total 2015 fish catch. With the 2013 closing of Omega Protein’s Cameron, Louisiana plant, which was the plant closest to the Texas border, this limitation is unlikely to have any material adverse effect on the Company’s business, results of operations or financial condition.
Omega Protein, through its operation of fishing vessels, is subject to the jurisdiction of the U.S. Coast Guard, the National Transportation Safety Board and the U.S. Customs Service. The Coast Guard and the National Transportation Safety Board set safety standards and are authorized to investigate vessel accidents and recommend improved safety standards. The U.S. Customs Service is authorized to inspect vessels at will.
Omega Protein’s operations are subject to federal, state and local laws and regulations relating to the protection of the environment, including the federal Clean Water Act, which imposes strict controls against the discharge of pollutants in reportable quantities, and along with the Oil Pollution Act, imposes substantial liability for the costs of oil removal, remediation and damages. Omega Protein’s operations also are subject to the federal Comprehensive Environmental Response, Compensation, and Liability Act, which imposes liability, without regard to fault, on certain classes of persons that contributed to the release of any “hazardous substances” into the environment and the federal Occupational Safety and Health Act (“OSHA”). The implementation of continuing safety and environmental regulations from these authorities could result in additional requirements and procedures for the Company, and it is possible that the costs of these requirements and procedures could be material.
OSHA’s Hazard Communications Standard, the Environmental Protection Agency (“E.P.A.”) community right-to-know regulations under Title III of the federal Superfund Amendment and Reauthorization Act and similar state statutes require the Company to organize information about hazardous materials used or produced in its operations. Certain information must be provided to employees, state and local governmental authorities and local citizens. Numerous other environmental laws and regulations, along with similar state laws, also apply to the operations of the Company, and all such laws and regulations are subject to change.
In April 2010, Omega Protein received a request for information from the E.P.A concerning its bail water practices used in its fishing operations at its Reedville, Virginia facility. In February 2011, the U.S. Coast Guard conducted inspections at Omega Protein’s Reedville facility regarding the Reedville vessels’ bilge water discharge practices. Based on these inquiries, both agencies commenced investigations of the Company’s bail water and bilge water practices at its Reedville facility. The U.S. Attorney’s Office for the Eastern District of Virginia subsequently reviewed both the results of the Coast Guard inspection and the E.P.A. request for information.
In June 2013, Omega Protein resolved both the U.S. Coast Guard and E.P.A. investigations by entering into a plea agreement with the United States Attorney’s Office for the Eastern District of Virginia. Pursuant to terms of the plea agreement, Omega Protein pled guilty to two Clean Water Act violations. The plea agreement required the subsidiary to pay a $5.5 million fine, be placed on a three year term of probation, and implement an environmental compliance program. In addition to the $5.5 million fine, the subsidiary was required to make a $2.0 million contribution to the National Fish and Wildlife Foundation to fund projects in Virginia related to the protection of the environmental health of the Chesapeake Bay. The plea agreement was approved by the U.S. District Court for the Eastern District of Virginia in June 2013 and Omega Protein paid both the $5.5 million fine and the $2.0 million contribution in July 2013. Omega Protein will be on probation until June 2016.
The Company has made, and anticipates that it will make in the future, expenditures in the ordinary course of its business in connection with environmental and regulatory matters. It is possible that environmental laws and regulations could require material expenditures or otherwise adversely affect the Company’s operations, financial condition and results of operations.
Omega Protein is also subject to laws and regulations in foreign countries regarding the importation of fish meal or fish oil in those jurisdictions. Some of these laws and regulations, particularly in countries such as China whose regulatory regimes may still be evolving, or in supra-national jurisdictions such as the European Union, may adversely affect the Company’s business, results of operations and financial condition. More stringent laws and regulations, or new interpretations of, or changes to, those laws and regulations, in foreign jurisdictions on approved additives, contaminant levels, health and sanitation requirements, import documentation, license requirement restrictions imposed by port of entry protocols or other similar restrictions could result in: (i) Omega Protein’s incurrence of additional capital expenditures and operating costs in order to comply with these requirements, (ii) Omega Protein’s withdrawal from marketing its products in those jurisdictions which could lead to a material loss of revenues, earnings and market share, or (iii) costs of demurrage, cure or product recall incurred by Omega Protein as it complies with, or attempts to comply with, these restrictions. For example, exports of fish meal to China and the European Union are subject to certain health and sanitation requirements that are administered by the Seafood Inspection Program (“SIP”), a U.S. federal agency selected by those jurisdictions as the competent authority to oversee compliance with export requirements by U.S. based manufacturers. Pursuant to SIP’s interpretation and application of China’s and the European Union’s health and sanitation requirements, Omega Protein’s processing facilities and its St. Louis fish meal warehouse may from time to time be limited or restricted in their ability to obtain export certificates in support of shipments of fish meal to China or the European Union or certain shipments by Omega Protein may need to be re-processed in order to meet these foreign health and sanitation requirements. In addition, certain foreign countries impose health and sanitation testing requirements for fish meal and fish oil exports that require pre-shipment testing of lots. These testing requirements may hinder particular lots from being approved for export to those countries. These limitations and restrictions may have an adverse effect on the Company’s business, financial condition or results of operations.
Omega Protein’s harvesting operations are subject to the Shipping Act of 1916 and the regulations promulgated there under by the Department of Transportation, Maritime Administration which require, among other things, that Omega Protein be incorporated under the laws of the U.S. or a state, the Company’s chief executive officer be a U.S. citizen, no more of the Company’s directors be non-citizens than a minority of the number necessary to constitute a quorum and at least 75% of the Company’s outstanding capital stock (including a majority of the Company’s voting capital stock) be owned by U.S. citizens. If the Company fails to observe any of these requirements, it will not be eligible to conduct its harvesting activities in U.S. jurisdictional waters. Such a loss of eligibility would have a material adverse effect on the Company’s business, results of operations and financial condition.
To protect against such loss of eligibility, the Company’s Articles of Incorporation (i) contain provisions limiting the aggregate percentage ownership by non-citizens of each class of the Company’s capital stock to no more than 25% of the outstanding shares of each such class (the “Permitted Percentage”) so that any purported transfer to non-citizens of shares in excess of the Permitted Percentage will be ineffective as against the Company for all purposes (including for purposes of voting, dividends and any other distribution, upon liquidation or otherwise), (ii) provide for a dual stock certificate system to determine such ownership pursuant to which certificates representing shares of Company Common Stock bear legends that designate such certificates as either “citizen” or “non-citizen” depending on the citizenship of the owner, and (iii) permit the Company’s Board of Directors to make such determinations as may reasonably be necessary to ascertain such ownership and implement restrictive limitations on those shares that exceed the Permitted Percentage (the “Excess Shares”). For example, the Company’s Board is authorized, among other things, to redeem for cash (upon written notice) any Excess Shares in order to reduce the aggregate ownership by non-citizens to the Permitted Percentage.
Human Nutrition Products
Products. The Company’s human nutrition business has three primary product lines: dairy protein products, specialty oils and other nutraceutical ingredients. The human nutrition business consists of Cyvex, InCon, WSP and Bioriginal Food & Science.
Specialty Oils. Bioriginal produces OmegaActiv®, a concentrated form of refined fish oil which is marketed as a dietary supplement ingredient. Bioriginal also produces OmegaPure®, a highly refined fish oil designed to deliver a stable, odorless, flavorless source of Omega-3 fatty acids which is marketed for food applications.
Omega-3 fatty acids exist in two forms: long-chain and short-chain. Long-chain Omega-3 fatty acids are found in marine sources and consist of two main types: eicosapentaenoic acid (“EPA”) and docosahexaenoic acid (“DHA”). EPA is a fatty acid that generally is associated with anti-inflammatory health benefits. DHA is a major structural fatty acid in the brain and the eye’s retina. DHA is important for proper brain and eye development in infants and both EPA and DHA have been shown to support cardiovascular health in adults. Short-chain Omega-3’s (or alpha-linolenic acid) are generally found in canola oil, soy beans and flaxseed, and are partially converted by the human body into EPA and DHA.
According to the Global Organization for EPA and DHA (“GOED”), there are more than 20,000 published scientific studies that have linked consumption of Omega-3 fatty acids to a number of nutritional and health benefits, such as heart health, alleviation of arthritis and other inflammatory diseases, optimal brain and eye development and maintenance, and minimization of depression.
The U.S. Food and Drug Administration (“FDA”) allows a qualified health claim for reduced risk of coronary heart disease on conventional foods that contain EPA and DHA. The FDA stated that scientific evidence indicates that these fatty acids may be beneficial in reducing coronary heart disease. The FDA also allows a similar qualified health claim for dietary supplements containing EPA and DHA omega-3 fatty acids and the reduced risk of coronary heart disease. Menhaden oil currently is the only marine source of long-chain Omega-3’s directly affirmed by the FDA (as opposed to self-affirmed) as a food ingredient that is Generally Recognized As Safe for direct human consumption. The FDA has approved menhaden oil use in 29 different food categories such as margarine, salad dressings, condiments, yogurt, ice cream, cheese, prepared meats, sauces, soups, crackers, cookies, cereals and bakery products.
Several other major health organizations such as the American Dietetic Association, the U.S. Dietary Guidelines Advisory Committee, the National Heart Foundation of Australia, and the United Kingdom Scientific Advisory Committee have all provided guidelines that address increasing the consumption of fish and omega-3 fatty acids EPA and DHA. These organizations now recommend various daily intake levels of EPA and DHA. While a Reference Daily Intake has not been established for the United States or Canada, many other countries have set a Reference Daily Intake for EPA and DHA.
The Company is one of the only fully-integrated fish oil processing operations in the United States that both directly conducts fishing operations and also manufactures highly refined Omega-3 fish oils from these marine resources. The Company can control the quality of its product from harvesting all the way through manufacturing and shipment.
Bioriginal’s Batavia, Illinois facility uses molecular distillation technology to concentrate long-chain Omega-3’s and other fatty acids and, subject to outside demand and excess capacity, a variety of other food-grade compound products for third-party tolling customers. With its technology, the facility can distill food products and specialty chemicals. The facility also provides analytical and processing expertise and pilot test capabilities. The facility also allows the Company to concentrate Omega-3 oil from other non-fish sources such as algal oils.
On March 8, 2016, as part of its strategy to focus on non-concentrated omega-3 oils instead of concentrated omega-3 oils, the Company decided to exit the Batavia, Illinois oil concentration facility and relocate certain assets from this facility to other Company facilities, including the Health and Science Center. In order to satisfy current customer obligations, the Company plans to continue to operate this facility on a limited basis through the middle of 2017. As of December 31, 2015, the Company recognized $4.5 million in losses related to the impairment of property, plant and equipment as well as estimated decommissioning costs. For additional information see Note 4 – Plant Closure to the consolidated financial statements included in Item 8. In addition to the above recognized losses, the Company expects to have additional losses related to additional impairment of property, plant and equipment, ongoing employee severance expenses and ongoing cost not attributable to future production such as clean-up and disassembly.
Bioriginal is a supplier of specialty oils to the food and nutraceutical industries across North America, Europe and Asia. Bioriginal sources ingredients from across the world to formulate products for its customers. Bioriginal has the technical and scientific expertise to combine specialty oils to develop efficacious formulations and delivery systems to meet its customers’ needs. Plant based oils include coconut oil, flax, borage, evening primrose and hemp. Marine based oils include menhaden, krill, tuna and other EPA and DHA rich oils.
Bioriginal produces, packages and markets a variety of specialty oils, and has developed proprietary methods and systems to provide customized turnkey solutions for its customers. Processing capabilities at its Canadian (Saskatoon, Saskatchewan), Netherlands (Den Bommel), Health and Science Center and Batavia facilities include cold press, blending, emulsifying and packaging.
The Omega Protein Technology and Innovation Center located in Houston, Texas serves as an in-house analytical laboratory and participates in various new product development and research and development projects by utilizing its scientific expertise and collaborating with Bioriginal research and marketing personnel located in Bioriginal’s production facilities. The facility has food science application labs, as well as analytical, sensory and pilot plant capabilities. The facility also has a lipids research lab where the Company plans to continue to develop new products that have improved functionality and technical characteristics.
Dairy Protein Products. Bioriginal produces a variety of value added dairy protein ingredients for the food and nutritional supplement industries, including organic and other specialty protein products, using processes applicable to a variety of nutritional dairy ingredients. Bioriginal has three main categories of dairy protein powders:
|
● |
rBGH-Free: Artificial growth hormone-free cow’s milk whey protein products, |
|
● |
Organic: Certified organic cow’s milk whey protein products, and |
|
● |
Goat: Goat’s milk whey protein concentrate. |
Bioriginal manufactures and sells Whey Protein Concentrate-80, Whey Protein Isolate, Milk Protein Concentrate and bulk ingredients globally to leading nutraceutical and food and beverage companies worldwide. By-products from the manufacturing process, including lactose, cream and animal feed supplements, are also sold.
Bioriginal also manufactures, blends and sells protein powder and beverage products labeled as food and dietary supplements under its various tera’swhey® and tera’s® brands. These products are sold to retail customers primarily in the natural, specialty foods and specialty supplements channels. The target market for these products is adults who seek a healthy lifestyle through minimally processed foods.
Bioriginal produces most of its dairy protein products at its Reedsburg, Wisconsin facility, which was acquired in 2013 and then expanded in 2014 to 33,000 square feet.
Other Nutraceutical Ingredients. Bioriginal markets and sells an extensive list of other nutraceutical ingredients derived from fruit, vegetables and botanicals. These products include the following signature ingredients:
|
● |
AvoVida® Avocado / Soy Unsaponifiables for joint support; |
|
● |
BioVinca® Vinpocetine for brain function support; |
|
● |
BioVin® grape extract for cardiovascular support; |
|
● |
Novusetin® for cognitive health support; |
|
● |
Euro Black Currant™ berry extract that provides anthocyanins with a high Oxygen Radical Absorbance Capacity value; and |
|
● |
BroccoPhane® broccoli sprout concentrate containing sulforophane. |
Industry Overview. The Company operates within the food, beverage and dietary supplement ingredient supplier industry. The Company expects several key demographic, healthcare, and lifestyle trends to drive the continued growth of this industry. These trends include:
Increasing awareness of dietary supplements and functional foods across major age and lifestyle segments of the North American population. The Company believes that, primarily as a result of increased media coverage, awareness of the benefits of nutritional supplements is growing among active, younger populations, providing the foundation for Bioriginal’s future customer base. In addition, the average age of the North American population is increasing. The Company believes that these consumers are likely to increasingly use dietary supplements, and generally have higher levels of disposable income to pursue healthier lifestyles.
Increased focus on fitness and healthy living. The Company believes that consumers are trying to lead more active lifestyles and becoming increasingly focused on healthy living, nutrition and supplementation. The Company believes that growth in this industry will continue to be driven by consumers who increasingly embrace health and wellness as an important part of their lifestyles.
Competition, Marketing, Trademarks and Other Intellectual Property, Quality Control, Insurance and Regulation in the Human Nutrition Segment
Competition. The food and dietary ingredient supplier industry is a large, highly fragmented and growing industry, with no single industry participant accounting for a majority of total industry sales. Competition is based primarily on price, quality and assortment of products, customer service, marketing support and availability of new ingredients. In addition, the market is highly sensitive to the introduction of new products. The human nutrition segment competes with manufacturers, distributors and marketers of food and dietary supplement ingredients both within and outside the United States, Canada and Europe.
Marketing. The Company markets its proprietary brands of food and dietary ingredients through an integrated marketing program that includes internet, print, public relations and direct sales to companies manufacturing foods, beverages and dietary supplements in all their forms (i.e. capsules, tablets and softgels). The Company also directs and participates in clinical research studies, often in collaboration with scientists and research institutions, to validate the benefits of a product and provide scientific support for product claims and marketing initiatives.
Trademarks and Other Intellectual Property. The Company believes trademark protection is particularly important to the maintenance of the recognized brand names under which the human nutrition segment markets its products. The Company owns or has rights to various trademarks or trade names, with certain trademark applications also pending, that the Company uses in conjunction with the sale of its products, including OmegaActiv®, OmegaPure®, tera’swhey®, tera’s®, BioPureDHA®, Fiberomega®, BioVin®, AvoVida® and others. Federal registration of a trademark with the United States Patent and Trademark Office affords the owner nationwide exclusive trademark rights in the registered mark and the ability to prevent others from using the same or similar marks. However, to the extent a common law user has made prior use of the mark in connection with similar goods or services in a particular geographic area, the nationwide rights conferred by federal registration would be subject to that geographic area. The Company also relies upon trade secrets, know-how, continuing technological innovations and licensing opportunities to develop and maintain its competitive position. The Company protects the human nutrition segment’s intellectual property rights through a variety of methods, including trademark, patent and trade secret laws, as well as confidentiality agreements and proprietary information agreements with vendors, employees, consultants and others who have access to its proprietary information. Protection of its intellectual property often affords the Company the opportunity to enhance the human nutrition segment’s position in the marketplace by precluding its competitors from using or otherwise exploiting its technology and brands. The human nutrition segment is also a party to several intellectual property license agreements relating to certain of its products. These license agreements generally continue until the Company elects to terminate the agreement, or upon the mutual consent of the parties.
Quality Control. The Company believes that maintaining high standards of quality in all aspects of its manufacturing operations plays an important part in its ability to attract and retain customers and maintain its competitive position. To that end, the Company has adopted quality control systems and procedures designed to test the quality aspects of its products. The Company regularly reviews, updates and modifies these systems and procedures as appropriate. Bioriginal utilizes its NutriPrint® quality assurance system, which uses FT-NIR (Fourier Transform – Near Infra Red) for identity testing of incoming raw materials. The Company uses internal and independent laboratories to test its products for purity, efficacy and composition.
Insurance. The Company purchases insurance to cover standard risks in the food and dietary ingredients industry, including policies to cover general products liability. The Company faces an inherent risk of exposure to product liability claims in the event that, among other things, the use of products sold by the human nutrition segment results in injury. With respect to product liability coverage, the Company carries insurance coverage typical of the human nutrition segment’s industry and product lines. The human nutrition segment’s coverage involves self-insured retentions with primary and excess liability coverage above the retention amount. The Company has the ability to refer claims to many of the human nutrition segment’s vendors and its insurers and require them to pay the costs associated with any claims arising from such vendors' products. In most cases, the human nutrition segment’s insurance covers such claims that are not adequately covered by a vendor's insurance and may provide for excess secondary coverage above the limits provided by the human nutrition segment’s product vendors. In addition, the Company may from time to time self-insure liability with respect to specific products that it may sell.
Regulation. The processing, formulation, safety, manufacturing, packaging, labeling, advertising and distribution of human nutrition segment products are subject to regulation by one or more federal agencies, including the FDA, the Canadian Food Inspection Agency (“CFIA”), the U.S. Federal Trade Commission (“FTC”), Health Canada, and by various agencies of the states and localities in which the products are sold. The area of business that these and other authorities regulate include, among others:
|
● |
claims and advertising; |
|
● |
labels; |
|
● |
ingredients; and |
|
● |
manufacturing, distributing, importing, selling and storing of products. |
In particular, the FDA regulates the formulation, manufacture, packaging, storage, labeling, importation and distribution and sale of dietary supplements and food ingredients in the United States. The CFIA regulates the manufacture, packaging, storage, importation and distribution and sale of food products in Canada. The FTC regulates marketing and advertising claims on food products and dietary supplements in the United States. Health Canada regulates the labeling of food products and dietary supplements in Canada.
The Dietary Supplement Health and Education Act of 1994 (“DSHEA”), an amendment to the Federal Food, Drug and Cosmetic Act, established a framework governing the composition, safety, labeling, manufacturing and marketing of dietary supplements in the United States. Generally, under DSHEA, dietary ingredients that were marketed in the United States prior to October 15, 1994 may be used in dietary supplements without notifying the FDA. “New” dietary ingredients (i.e., dietary ingredients that were “not marketed in the United States before October 15, 1994”) must be the subject of a new dietary ingredient notification submitted to the FDA unless the ingredient has been “present in the food supply as an article used for food” without being “chemically altered.” A new dietary ingredient notification must provide the FDA with evidence of a “history of use or other evidence of safety” establishing that use of the dietary ingredient "will reasonably be expected to be safe.” A new dietary ingredient notification must be submitted to the FDA at least 75 days before the initial marketing of the new dietary ingredient. The FDA may determine that a new dietary ingredient notification does not provide an adequate basis to conclude that a dietary ingredient is reasonably expected to be safe. Such a determination could prevent the marketing of such dietary ingredient.
In July 2011, the FDA issued a draft guidance governing notification of new dietary ingredients. While it is not mandatory to comply with FDA guidance, it is a strong indication of the FDA's current views on the topic of the guidance, including the agency’s position on enforcement. Depending on the recommendations made in the guidance, if and when it is finalized, particularly those relating to animal or human testing, such guidance could make it more difficult for the Company to successfully provide notification of new dietary ingredients. Moreover, such guidance could change the status of ingredients that the industry has viewed as “old” dietary ingredients to “new” dietary ingredients that may require submission of a new dietary ingredient notification.
DSHEA permits “structure/function claims” to be included in labeling for dietary supplements without FDA pre-market approval. Such statements must be submitted to the FDA within 30 days of marketing. Such statements may describe how a particular dietary ingredient affects the structure, function or general well-being of the body, or the mechanism of action by which a dietary ingredient may affect body structure, function, or well-being, but may not expressly or implicitly represent that a dietary supplement will diagnose, cure, mitigate, treat or prevent a disease. A company that uses a structure/function claim in labeling must possess scientific evidence substantiating that the statement is truthful and not misleading. If the FDA determines that a particular structure/function claim is an unacceptable drug claim or an unauthorized version of a “health claim,” or if the FDA determines that a particular claim is not adequately supported by existing scientific data or is false or misleading, we would be prevented from using the claim.
In addition, DSHEA provides that so-called “third-party literature,” e.g., a reprint of a peer-reviewed scientific publication linking a particular dietary ingredient with health benefits, may be used “in connection with the sale of a dietary supplement to consumers” without the literature being subject to regulation as labeling. The literature: (1) must not be false or misleading; (2) may not “promote” a particular manufacturer or brand of dietary supplement; (3) must present a balanced view of the available scientific information on the subject matter; (4) if displayed in an establishment, must be physically separate from the dietary supplements; and (5) should not have appended to it any information by sticker or any other method. If the literature fails to satisfy each of these requirements, the Company may be prevented from disseminating such literature in connection with its products, and any dissemination could subject the Company’s products to regulatory action as an unapproved drug.
The FDA has published detailed Good Manufacturing Practice ("GMP") regulations that govern the manufacture, packaging, labeling and holding operations of food and dietary supplement manufacturers. The GMP regulations, among other things, impose significant recordkeeping requirements on manufacturers. The GMP requirements are in effect for all manufacturers, and the FDA conducts inspections of manufacturers pursuant to these requirements. The failure of a manufacturing facility to comply with the GMP regulations renders products manufactured in such facility "adulterated," and subjects such products and the manufacturer to a variety of potential FDA enforcement actions.
In addition, under the FDA Food Safety Modernization Act (“FSMA”), which was enacted in 2011, the manufacture of food and dietary ingredients will be subject to more burdensome requirements, which will likely increase the costs of ingredients and will subject suppliers of such ingredients to more rigorous inspections and enforcement. The FSMA will also require importers to take measures to ensure that the foods they import, including food and dietary ingredients, meet domestic requirements. This could increase the cost of those articles, subject their importation to greater scrutiny, and potentially restrict their availability.
The FDA has broad authority to enforce the provisions of federal law applicable to food and dietary supplements, including powers to issue a public warning or notice of violation letter to a company, publicize information about illegal products, detain products intended for import, request a recall of illegal products from the market, and request the Department of Justice to initiate a seizure action, an injunction action, or a criminal prosecution in the U.S. courts. The FSMA expands the reach and regulatory powers of the FDA with respect to the production of food, including dietary supplements. The expanded reach and regulatory powers include the FDA's ability to order mandatory recalls, administratively detain domestic products and administratively revoke manufacturing facility registrations. The regulation of dietary supplements may increase or become more restrictive in the future.
Some Bioriginal products are packaged and sold directly to retailers and consumers, and therefore are subject to greater oversight and enforcement action by the FTC. The FTC exercises jurisdiction over the advertising of food and dietary supplements. In recent years, the FTC has instituted numerous enforcement actions against food and dietary supplement companies for failure to have adequate substantiation for claims made in advertising or for the use of false or misleading advertising claims. Such actions could result in substantial financial penalties and significantly restrict the marketing of a product.
In Canada, the Food and Drugs Act (“F&D Act”) is the primary legislation governing the safety and nutritional quality of food sold in Canada. Its scope includes food labeling, advertising and claims, food standards and compositional requirements, fortification, foods for special dietary uses, food additives, chemical and microbial hazards, packaging material, and pesticides. The Company is responsible for ensuring that its products are accurately positioned in the Canadian marketplace and comply with Canadian regulations. Food advertising must also be in compliance with Canada’s Consumer Packaging and Labelling Act.
In the EU, the European Commission has established harmonized rules to help ensure that food supplements are safe and properly labelled. Food supplements are regulated as foods and the legislation focuses on vitamins and minerals used as ingredients of food supplements. The main EU legislation is Directive 2002/46/EC related to food supplements containing vitamins and minerals. The Directive sets out labelling requirements and requires that EU-wide maximum and minimum levels are set for each vitamin and mineral added to supplements. In addition, its Annex II contains a list of permitted vitamin or mineral substances that may be added for specific nutritional purposes in food supplements. The European Food Safety Authority (“EFSA”) evaluates the safety and bioavailability of nutrient sources proposed for addition to the list of permitted substances in Annex II of the food supplements Directive.
Legislation or regulations may be introduced which, if passed, would impose substantial new regulatory requirements on the manufacture, packaging, labeling, advertising and distribution and sale of human nutrition segment products. The Company cannot determine what effect additional domestic or international governmental legislation, regulations or administrative orders, when and if promulgated, would have on Company’s business in the future. New legislation or regulations may require the reformulation, elimination or relabeling of certain products to meet new standards and revisions to certain sales and marketing materials, and it is possible that the costs of complying with these new regulatory requirements could be material.
Employees
At December 31, 2015, during Omega Protein’s off-season, the Company employed approximately 627 persons. At August 31, 2015, during the peak of Omega Protein’s 2015 fishing season, the Company employed approximately 1,118 persons. Of the employees working on Omega Protein’s Reedville, Virginia vessels, 112 are represented by an affiliate of the United Food and Commercial Workers Union. The collective bargaining agreement for the Reedville vessel employees has a three-year term that expires in April 2017 and the Company expects to enter into discussions with the union regarding a new collective bargaining agreement prior to that date. In addition, on March 1, 2016, Omega Protein received notice that the International Brotherhood of Boilermakers, Iron Ship Builders, Blacksmiths, Forgers and Helpers filed a petition with the National Labor Relations Board (“NLRB”) seeking certification to represent certain employees for the purpose of collective bargaining at the Company’s Moss Point fish processing plant. The matter is being processed and adjudicated under NLRB procedures. During the past five years the Company has not experienced any strike or work stoppage that has had a material impact on its operations. The Company considers its employee relations to be generally satisfactory.
Omega Protein has historically utilized workers in the United States H2B Visa Program whereby foreign nationals are permitted to enter the United States temporarily and engage in seasonal, non-agricultural employment. The Company did not utilize that program from 2008 through 2010 due to the small number of employees available under the program. Omega Protein was able to utilize the program during the 2011 through 2015 fishing seasons. Omega Protein has applied to participate in the H2B Visa Program for the 2016 fishing season but cannot predict the outcome of the application process.
Executive Officers of the Company
The names, ages and current offices of the executive officers of the Company as of December 31, 2015 are set forth below. Also indicated is the date when each such person commenced serving as an executive officer of the Company.
|
Name and Age |
|
Office |
|
Date Became |
|
Bret D. Scholtes (46) |
|
President, Chief Executive Officer and Director |
|
April 2010 |
|
John D. Held (53) |
|
Executive Vice President, General Counsel and Secretary |
|
January 2002 |
|
Andrew C. Johannesen (48) |
|
Executive Vice President and Chief Financial Officer |
|
July 2011 |
|
Dr. Mark E. Griffin (47) |
President – Animal Nutrition Division |
July 2009 | ||
|
Joseph Vidal (54) |
President – Bioriginal Food & Science |
September 2014 | ||
|
Matthew W. Phillips (45) |
Chief Commercial Officer – Nutegrity |
June 2011 | ||
|
Montgomery C. Deihl (52) |
Vice President of Operations |
July 2013 | ||
|
Mark A. Livingston (52) |
Vice President, Chief Accounting Officer and Controller |
August 2015 |
A description of the business experience for each of the executive officers of Omega is set forth below.
BRET D. SCHOLTES has served as the Company’s President and Chief Executive Officer since January 2012 and as a director since February 2013. Prior thereto, Mr. Scholtes served as the Company’s Senior Vice President — Corporate Development from April 2010 to December 2010 and as the Company’s Executive Vice President and Chief Financial Officer from January 2011 to December 2011. From 2006 to April 2010, Mr. Scholtes served as a Vice President at GE Energy Financial Services, a global energy investment firm. Prior to that, Mr. Scholtes held positions with two publicly traded energy companies. Mr. Scholtes also has five years of public accounting experience.
JOHN D. HELD has served as the Company’s Executive Vice President, General Counsel and Secretary since June 2006 and has served as General Counsel since 2000 and various other executive officer positions with the Company since 2002. From 1996 to 1999, Mr. Held was Senior Vice President, General Counsel and Secretary of American Residential Services, Inc., a then public company engaged in the consolidation of the air-conditioning, plumbing and electrical service industries. Prior to that, Mr. Held practiced law with Baker Botts LLP in Houston, Texas.
ANDREW C. JOHANNESEN has served as Executive Vice President and Chief Financial Officer of the Company since January 2012 and as Senior Vice President — Finance and Treasurer from July 2011 to December 2011. From December 2010 to July 2011, Mr. Johannesen served as Vice President and Treasurer of Westlake Chemical Corporation, a chemicals and plastic products manufacturer. From 2007 to December 2010, Mr. Johannesen served as Vice President and Treasurer of RRI Energy, Inc. (formerly Reliant Energy, Inc.), an electricity and energy service provider, and from 2005 to 2007 served as Vice President and Assistant Treasurer of RRI. Prior to that, Mr. Johannesen held various corporate development and finance positions at Reliant Energy and worked for Exxon Mobil Corporation and a major public accounting firm. Mr. Johannesen is a Certified Public Accountant.
DR. MARK E. GRIFFIN has served as President — Animal Nutrition Division and Research and Development since June 2013, as Vice President — Research and Development from July 2009 to December 2010 and as Senior Vice President — R&D and Sales and Marketing since January 2011. From April 2009 to July 2009, Dr. Griffin served as Technical Director of the Specialty Group of Land O’Lakes Purina Feed, LLC, a co-operative of agricultural producers and marketer of agriculture food products. From 2003 to April 2009, Dr. Griffin served as Director of the Zoo and Aquaculture divisions of Land O’Lakes Purina Feed, LLC. Dr. Griffin also previously held several positions in the aquaculture, companion animal, zoo and private label divisions of Purina Mills, Inc. and Land O’ Lakes Purina Feed, LLC.
JOSEPH R. VIDAL has served as President – Bioriginal Food & Science since 2005, a subsidiary acquired by the Company in September 2014. Prior thereto, Mr. Vidal served as Bioriginal Food & Science’s Chief Financial Officer since 1999. From 1991 to 1998, Mr. Vidal was employed by Hitachi Canadian Industries, a turbine and generator manufacturer, where his career included positions as General Manager, Deputy General Manager, Production Manager, and Accounting and Human Resources Manager. Mr. Vidal's experience also includes eight years with KPMG, an audit, tax and advisory firm, where he was a manager in the Accounting Systems group in the Saskatoon, Canada office and manager of the Information Technology Group in Toronto, Canada. In January 2016, Mr. Vidal was named President – Human Nutrition Division.
MATTHEW W. PHILLIPS has served as the Chief Commercial Officer — Nutegrity since June 2013 and the President of Cyvex Nutrition, Inc. (acquired by the Company in December 2010) since March 2008. Prior thereto, Mr. Phillips served as Vice President, Marketing and Sales American/Europe for BI Nutraceuticals, a botanical ingredient supplier, from January 2002 until March 2008. Prior thereto, Mr. Phillips held sales and marketing positions of increasing responsibility with various botanical, nutrition and wellness companies. In January 2016, Mr. Phillips title changed to Chief Commercial Officer –Bioriginal.
MONTGOMERY C. DEIHL has served as the Company’s Vice President of Operations since March 2015, as Senior Director — Fishing Plant Operations from April 2012 to March 2015, and as General Manager of the Company’s Reedville, Virginia facility from August 2009 to April 2012. Prior to joining the Company in August 2009, Mr. Deihl was a Senior Managing Consultant for IBM Corporation (supply chain management) from July 2007 to July 2009. Prior to that, Mr. Deihl served in the United States Air Force from 1987 to 2007, retiring as a Lieutenant Colonel. Mr. Deihl is a fifth generation menhaden fisherman.
MARK A. LIVINGSTON has served as Vice President, Chief Accounting Officer and Controller since August 2015. Prior thereto, Mr. Livingston served as the Director of Financial Reporting since June 2012 at ION Geophysical Corporation (“ION”). Prior to that position, Mr. Livingston was the Director of Internal Audit at ION since March 2008. Before joining ION, Mr. Livingston served as Director of Internal Audit at Symetra Financial Corporation and Qwest Communications Inc. Additionally, Mr. Livingston worked in internal audit positions at other public companies and at PriceWaterhouseCoopers LLP and Arthur Andersen LLP, nationally based accounting firms. Mr. Livingston is a Certified Public Accountant.
Properties
The Company’s material properties, by industry segment, are described below. The Company believes its facilities are adequate and suitable for its current level of operations.
Administrative and Executive Offices. The Company leases administrative and executive office space from an unaffiliated third party in Houston, Texas. The Company also leases the property for its Omega Protein Technology and Innovation Center from an unaffiliated third party in Houston, Texas.
Animal Nutrition Industry Segment
Fish Processing Plants. Omega Protein owns its plants in Reedville, Virginia, Moss Point, Mississippi and Abbeville, Louisiana. Omega Protein also owns its Health and Science Center in Reedville, Virginia.
Fish Meal and Fish Oil Warehouse and Storage. Omega Protein owns, as well as leases from unaffiliated third parties, warehouses and tank space for storage of its products, generally at terminals located along the Mississippi River and Tennessee River. Information regarding Omega Protein’s material storage facilities is set forth below:
|
Location |
Approximate Fish Meal |
Owned/Lease | ||
|
Reedville, Virginia |
|
42,000 tons |
Owned | |
|
Abbeville, Louisiana |
|
14,700 tons |
Owned | |
|
Moss Point, Mississippi |
|
13,000 tons |
Owned | |
|
St. Louis, Missouri |
|
10,000 tons |
Owned | |
|
Port Arthur, Louisiana |
10,000 tons |
Leased | ||
|
Avondale, Louisiana |
|
23,000 tons |
Leased |
Shipyard. Omega Shipyard owns a 49.4 acre shipyard facility in Moss Point, Mississippi which includes three dry docks, each with a capacity of 1,300 tons. The shipyard is used for routine maintenance and vessel refurbishment on Omega Protein’s fishing vessels.
Human Nutrition Industry Segment
Bioriginal leases combined office and warehouse space in Irvine, California, Batavia, Illinois and Den Bommel, Netherlands from unaffiliated third parties. Bioriginal also owns combined office, manufacturing and warehouse spaces in Reedsburg, Wisconsin and Saskatoon, Canada and leases warehouse, sales, administrative and executive office space from unaffiliated third parties in Baraboo and Madison, Wisconsin.
Available Information
The Company files annual, quarterly and current reports and other information with the SEC. The Company’s annual reports on Form 10-K, quarterly reports on Form 10-Q, current reports on Form 8-K and amendments to these reports filed under the Securities and Exchange Act of 1934 (“Exchange Act”), as well as Section 16 filings by officers and directors, are available free of charge at the Company’s website at www.omegaprotein.com or at the SEC’s website at www.sec.gov and are posted as soon as reasonably practicable after they are filed with the SEC. The Company will provide a copy of these documents to stockholders upon request. Information on the Company’s website or any other website is not incorporated by reference into this report and does not constitute part of this report.
In addition, the public may read and copy any materials filed by the Company with the SEC at the SEC’s Public Reference Room at 100 F. Street, NE., Washington, DC 20549. The public may obtain information on the operation of the Public Reference Room by calling the SEC at 1-800-SEC-0330. The SEC maintains a website that contains reports, proxy and information statements, and other information regarding issuers that file electronically with the SEC at www.sec.gov.
The Company’s Corporate Governance Guidelines, Code of Business Conduct and Ethics, Code of Ethics for Financial Professionals, as well as the Charters for the Board’s Audit Committee, Compensation Committee, Corporate Governance and Nominating Committee, are available at the Company’s website. These Guidelines, Codes and Charters are not incorporated by reference into this report and do not constitute part of this report. The Company will provide a copy of these documents to any stockholder upon request.
Item 1A. Risk Factors
The Company cautions investors that the following risk factors, and those factors described elsewhere in this report, other filings made by the Company with the SEC from time to time and press releases issued by the Company, could affect the Company’s actual results which could differ materially from those expressed in any forward-looking statements made by or on behalf of the Company.
The risks described below are not the only ones facing the Company. The Company’s business is also subject to other risks and uncertainties that affect many other companies, such as competition, technological obsolescence, labor relations (including risks of strikes), general economic conditions and geopolitical events. Other risks not currently known to the Company or risks that the Company currently believes are immaterial may also materially adversely affect the Company’s business, results of operations and financial condition.
Risks Relating to the Company’s Business and Industry:
Omega Protein, the Company’s largest operating subsidiary, is dependent on a single natural resource and may not be able to catch the amount of menhaden that it requires to operate profitably. Omega Protein’s primary raw material is menhaden. Omega Protein’s business is materially dependent on its annual menhaden harvest in ocean waters along the U.S. Atlantic and Gulf coasts. Omega Protein’s ability to meet its raw material requirements through its annual menhaden harvest fluctuates from year to year and month to month due to natural and other conditions over which Omega Protein has no control, including varying fish populations, adverse weather conditions, fish disease, water nutrient content and disruptions like the Deepwater Horizon oil spill incident in the Gulf of Mexico in 2010. These conditions may prevent Omega Protein from operating profitably.
Omega Protein’s operations are geographically concentrated in the Gulf of Mexico where they are susceptible to regional adverse weather patterns such as hurricanes. Two of Omega Protein’s three operating plants are located in the Gulf of Mexico (one in Louisiana and one in Mississippi), a region which has historically been subject to a late summer/early fall hurricane season. Omega Protein’s Virginia facility has in the past also at times been adversely affected by hurricanes. For example, in September 2008, Omega Protein’s Abbeville and former Cameron, Louisiana fish processing facilities were damaged by Hurricane Ike and were non-operational immediately after the hurricane. Operations at the Abbeville fish processing facility were restored to full capacity within two weeks, and the Cameron fish processing facility was fully functional prior to the beginning of the 2009 fishing season. As an additional example, all three of Omega Protein’s Gulf of Mexico plants operated at the time were severely damaged within a one-month span by Hurricanes Katrina and Rita in August and September 2005. Immediately after the second hurricane, approximately 70% of Omega Protein’s 2004 production capacity was impaired and Omega Protein’s business, results of operations and financial condition were materially adversely affected. Additional future weather related disruptions could, if they occur, also have a material adverse effect on the Company’s business, results of operations and financial condition.
Omega Protein’s operations are geographically concentrated in the Gulf of Mexico where they are susceptible to oil spills from offshore drilling, production and transportation activities. Two of Omega Protein’s three operating plants are located in the Gulf of Mexico (one in Louisiana and one in Mississippi), a region which has historically had a high concentration of oil and gas infrastructure. If this infrastructure were to be become damaged due to natural or other disasters such as the oil spill that resulted from the Deepwater Horizon incident in 2010, then it is possible that environmental damages to the area and ecosystem could result. If these environmental damages occurred, they could have a material adverse effect on the Company’s business, results of operation and financial condition.
The closure of the Company’s Cameron, Louisiana facility may result in potential unknown environmental liabilities which are not currently quantifiable. In connection with its closure of the Cameron, Louisiana fish processing facility in December 2013, the Company estimated various costs associated with the closure of that facility. Omega Protein’s lease arrangements for the Cameron facility have included environmental indemnities from Omega Protein in favor of third-party landlords and obligations by Omega Protein to remove certain facility improvements and restore the leased property to certain prior existing conditions upon termination of the lease. Omega Protein has not terminated the lease and is continuing to make its rental payments under the lease which terminates in June 2022.
The Company is not aware of any material liability associated with the Cameron facility and accordingly has not accrued any costs associated with environmental liabilities. However, if such liabilities emerge or such property restoration costs become material, these liabilities and costs could have a material adverse effect on the Company’s business, results of operation and financial condition.
If the Company’s Omega Protein subsidiary fails to comply with the terms of its probation under a plea agreement entered into in June 2013, we could be subject to criminal prosecution. In June 2013, Omega Protein, the Company’s principal subsidiary, entered into a plea agreement with the United States Attorney’s Office for the Eastern District of Virginia to resolve the previously disclosed government investigation related to the fishing vessels and operations of its Reedville, Virginia facility. Consistent with the terms of the plea agreement, the subsidiary pled guilty in the United States District Court for the Eastern District of Virginia to two felony counts under the Clean Water Act, paid a fine of $5.5 million, and made a $2.0 million contribution to an environmental fund.
The plea agreement and the terms of the court’s sentencing order require Omega Protein to develop and implement an environmental compliance program at all of its facilities, and also imposed a three year period of probation which will end in June 2016. The Company has implemented a comprehensive compliance program which covers the areas addressed by the plea agreement. The U.S. Probation Office, in consultation with the U.S. Attorney’s Office for the Eastern District of Virginia and the E.P.A., as necessary, have the right to monitor the Company’s compliance with these requirements during the term of probation.
In the event that Omega Protein does not comply with the terms of the plea agreement and the court’s sentencing order, including the terms of probation, Omega Protein could be subject to additional criminal penalties or prosecution (including for the matters covered and resolved by the plea agreement). In addition, if Omega Protein fails to maintain compliance with the Clean Water Act or other similar environmental regulatory requirements in the future, Omega Protein could become subject to additional criminal or civil liability in connection with any such non-compliance. Omega Protein could also experience increased compliance costs, or alterations to the conduct of its normal course operations, in connection with these matters. Any of the foregoing could result in a material adverse effect on the Company’s business, reputation, results of operation and financial condition.
In addition, the convictions under the Clean Water Act will adversely affect the Company’s ability to secure government contracts with the United States, and secure future loans under the NFMS Title XI loan program in connection with the affected facility. The subsidiary has received notice from the E.P.A. that it is ineligible, as a result of the convictions under the Clean Water Act, for receipt of government contracts, loans or benefits if any part of the work will be performed, or the loan collateral will be located, at the facility where the offense occurred.
The ASMFC has initiated regulatory action that may change the Atlantic menhaden quota among ASMFC member states or that may utilize new management reference points, either of which may lower future Atlantic menhaden harvests by the Company. In 2014, the ASMFC and the National Marine Fisheries Service jointly conducted a new benchmark stock assessment for Atlantic menhaden, which utilized new data sources and a new statistical model. Initial results of the 2014 assessment were peer reviewed in December 2014 and were accepted by the ASMFC at its February 2015 meeting. The 2014 stock assessment found that the Atlantic menhaden stock was not overfished and that overfishing for Atlantic menhaden was not occurring. The next assessment, which will be an update, will occur in 2017.
Based on the 2014 assessment, the ASMFC Menhaden Board established a new coast-wide quota for Atlantic menhaden at its May 2015 meeting. The menhaden quota for the 2015 and 2016 fishing seasons is 187,880 mt, which represents a ten percent increase above the quota established in 2012. In February 2016, the ASMFC initiated the process to establish Atlantic menhaden harvest levels for the 2017 fishing year. The Company believes that it is unlikely the 2017 quota will be reduced below current levels but it is not possible to predict what quota the ASMFC might put in place and what effect a changed quota would ultimately have on the Company’s business, financial condition or results of operations.
Under the ASMFC’s Interstate Fisheries Management Plan for Atlantic Menhaden, the total coastwide quota is allocated among states based on average landings for the years 2009 to 2011. Under that formula, Virginia is allocated approximately 85% of the total allowable catch. Of Virginia’s allocation, the Company is entitled to land approximately 143,000 mt. As a result of the 2015 quota increase, the Company increased the number of Atlantic fishing vessels from seven to eight for the 2015 fishing season.
At its May 2015 meeting, the ASMFC Menhaden Board also initiated a management action to review and potentially change the allocation of quota among the ASMFC member states. This reassessment was called for in the 2012 amendment that established the coast-wide quota system. Some ASMFC member states with relatively low allocations of menhaden have argued that Virginia’s share of the Atlantic menhaden quota is too high. While the current allocation is based on recent historical landings data, a common method by which the ASMFC allocates fishing privileges among its member states, it is possible that the ASMFC could decide to re-allocate in a manner that results in a lower percentage allocation to Virginia and/or the Company. If this re-allocation were to occur and depending on the magnitude of the reduction, it could have a material adverse impact on the Company’s business, financial results or results of operations.
The management action initiated by the ASMFC Menhaden Board in May 2015 will also consider establishing new management reference points – benchmarks used to establish quotas and determine when the stock is considered overfished – that consider Atlantic menhaden’s role as forage in the marine ecosystem. The Company does not expect this management action to be completed and effective until 2018. The new, higher quota levels have been set by the ASMFC Menhaden Board below new, more conservative reference points recommended by the stock assessment panel and the menhaden stock is above the level that would be considered overfished. As a result, while the Company does not anticipate that the new reference points under consideration will have a material adverse impact on its business, financial condition or results of operations, it is not possible to predict how the ASMFC may utilize these reference points and what effect that they might ultimately have on the Company’s business, financial condition or results of operations.
The Company’s acquisition of Bioriginal Food & Science, which closed in September 2014, was a sizeable acquisition that could pose integration challenges as it is integrated with the Company’s human nutrition division. A primary component of the Company’s growth strategy in the human nutrition segment has been to acquire complementary businesses that expand its customer base and provide access to new markets and increased benefits of scale. For example, we acquired the businesses of Cyvex in 2010, InCon in 2012, WSP in 2013 and most recently, Bioriginal, in September 2014. In 2016, the Company began further integration of its Nutegrity and Bioriginal units under the name Bioriginal. Acquisitions and integration plans involve certain known and unknown risks that could cause the Company’s actual growth or operating results to differ from its expectations. The Bioriginal Food & Science acquisition involved the acquisition of a company headquartered in Canada, which may inherently pose more risks than a domestic acquisition. It is possible that the integration of Bioriginal Food & Science into the Company’s human nutrition business may divert management’s attention away from its existing animal nutrition business or human nutrition business, resulting in the loss of key customers or employees, or expose us to unanticipated problems.
The Company’s inability to successfully integrate Bioriginal Food & Science into its human nutrition business could adversely affect its other business operations and financial results. The integration process may disrupt the Company’s business and may preclude the realization of the full benefits expected by the Company.
Some of the difficulties in integrating Bioriginal Food & Science into the Company’s human nutrition business may include, among other things:
|
● |
issues in integrating Bioriginal Food & Science’s products or customers with the Company’s human nutrition business’; |
|
● |
incompatibility of marketing and administration methods; |
|
● |
maintaining employee morale and retaining key employees; |
|
● |
integrating the cultures of both companies; |
|
● |
preserving important strategic customer relationships; |
|
● |
consolidating corporate and administrative infrastructures and information systems; and |
|
● |
coordinating and integrating geographically separate organizations located in different countries. |
The occurrence of any of the above difficulties could have a material adverse effect on the Company’s business, results of operation or financial condition.
The costs of energy may materially impact Omega Protein’s business. Omega Protein has occasionally experienced substantially higher costs for energy. Omega Protein’s business is materially dependent on diesel fuel for its vessels and natural gas, propane and potentially Bunker C fuel oil for its operating facilities. The costs of these commodities, which are beyond the Company’s control, may have an adverse material impact on the Company’s business, financial condition or results of operation.
Fluctuation in the “total yield” derived from Omega Protein’s fish catch could impact the Company’s ability to operate profitably. The “total yield,” or the percentage of fish meal, fish oil and fish solubles products derived from the menhaden fish has fluctuated over the years and from month to month due to natural conditions relating to fish biology over which Omega Protein has no control. For example, the Company’s 2015 oil yield results for the 2015 fishing season were below average. The Company’s oil yields for the 2015 fishing season were lower by 16% compared to those in the 2014 fishing season and were lower by 16.3% compared to the Company’s five year oil yield average. Total yields for the 2015 fishing season decreased by 3.9% compared to those in the 2014 fishing season and were lower by 4.5% compared to the Company’s five year total yield average, due primarily to the lower fish oil yields. The Company believes that fish oil yields are influenced by multiple factors, including but not limited to, fish diet, weather, water temperature and nutrient content, fish population and age of fish, but such possible relationships and inter-relationships are not generally well understood. Increased fish catch offset the impact of lower oil yields and resulted in lower per unit inventory cost for the 2015 fishing season as compared to the 2014 fishing season.
Laws or regulations regarding fish oil or meal importation into foreign jurisdictions may increase Omega Protein’s costs or cause Omega Protein to lose market share or eliminate certain countries all together. Laws and regulations regarding the importation of fish meal or fish oil into foreign countries, particularly in countries such as China whose regulatory regimes may still be evolving, or in supra-national jurisdictions such as the European Union, may adversely affect the Company’s business, results of operations and financial condition. More stringent laws and regulations, or new interpretations of, or changes to, those laws and regulations, in foreign jurisdictions on contaminant levels, permitted additives, health and sanitation requirements, import documentation, license requirement restrictions imposed by port of entry protocols or other similar restrictions could result in: (i) Omega Protein’s incurrence of additional capital expenditures and operating costs in order to comply with these requirements, (ii) Omega Protein’s withdrawal from marketing its products in those jurisdictions which could lead to material loss of revenues, earnings and market share, or (iii) costs of demurrage, cure or product recall incurred by Omega Protein as it complies with, or attempts to comply with, these restrictions. For example, exports of fish meal to China and the European Union are subject to certain health and sanitation requirements that are administered by the Seafood Inspection Program (“SIP”), a U.S. federal agency selected by these jurisdictions as the competent authority to oversee compliance with export requirements by U.S. based manufacturers. Pursuant to SIP’s interpretation and application of China’s and the European Union’s health and sanitation requirements, several domestic and foreign facilities, including Omega Protein’s processing facilities and its St. Louis fish meal warehouse, may from time to time be limited or restricted in their ability to obtain export certificates in support of shipments of fish meal to China or the European Union or certain shipments by the Company may be reprocessed in order to meet these requirements. In addition, certain foreign countries impose health and sanitation testing requirements for fish meal and fish oil exports that require pre-shipment testing of lots. These testing requirements may hinder particular lots from being approved for export to those countries. These limitations and restrictions may have an adverse effect on the Company’s business, financial condition or results of operation. If a greater portion of the Company’s sales are derived internationally, or become more concentrated in certain countries or jurisdictions such as China or the European Union, the potential impact of this risk is likely to become larger.
Laws or regulations that restrict or prohibit menhaden or purse seine fishing operations, or the manufacture, sale or distribution of menhaden products, could adversely affect Omega Protein’s ability to operate. The adoption of new laws or regulations at federal, regional, state or local levels that restrict or prohibit menhaden or purse seine fishing operations, or the manufacture, sale or distribution of menhaden products, or stricter interpretations of existing laws or regulations, could materially adversely affect Omega Protein’s business, results of operations and financial condition. In addition, the impact of a violation by Omega Protein of federal, regional, state or local law or regulation relating to its fishing operations, the protection of the environment or the health and safety of its employees could have a material adverse effect on the Company’s business, financial condition, or results of operation.
The Company is also subject to the introduction of legislation from time to time that seeks to ban its operations in their entirety or restrict the sale of its products. For example, in 2007, two bills in the U.S. House of Representatives were introduced and in 2009, a bill in the U.S. Senate was introduced, each of which would have banned menhaden fishing on the Atlantic coast. In the Virginia legislature, bills have been introduced in recent years that would have provided for a restriction on menhaden fishing in Virginia waters. As an additional example, a 2011 Maryland House bill would have prohibited the manufacture, sale or distribution in Maryland of products obtained from reduction of Atlantic menhaden. While none of these bills ever made any substantial headway in their respective legislative bodies, they are indicative of the challenging legislative and regulatory environment in which the Company operates and to which the Company must devote substantial resources.
The enactment of any restrictions similar to those described in the above bills could have a material adverse effect on the Company’s business, results of operations or financial condition.
Worldwide supply and demand relationships, which are beyond the Company’s control, influence the prices that the Company receives for many of its products and may from time to time result in low prices for many of the Company’s products. Prices for many of the Company’s products are subject to, or influenced by, worldwide and local supply and demand relationships over which the Company has no control and which tend to fluctuate to a significant extent over the course of a year and from year to year. The factors that influence these supply and demand relationships on the Company’s marine based products include world supplies of fish meal and oil made from other fish species, animal proteins and fats, palm oil, rapeseed oil, soy meal and oil, and other edible oils. The factors that influence the supply and demand relationship for the Company’s dairy-based products include global dairy ingredient prices, regional milk supply, regional cheese demand, regional raw whey demand and supply of alternative proteins made from other agricultural sources such as soy, rice and vegetable.
New laws or regulations regarding contaminants in fish oil or fish meal may increase Omega Protein’s cost of production or cause Omega Protein to lose business. It is possible that future enactment of increasingly stringent regulations regarding contaminants in fish meal or fish oil by foreign countries or the United States may adversely affect the Company’s business, results of operations and financial condition. More stringent regulations could result in: (i) Omega Protein’s incurrence of additional capital expenditures on contaminant reduction technology in order to meet the requirements of those jurisdictions, and possibly higher production costs for Omega Protein’s products, or (ii) Omega Protein’s withdrawal from marketing its products in those jurisdictions.
Omega Protein’s fish catch may be impacted by restrictions on its spotter aircraft. If Omega Protein’s spotter aircraft are prohibited or restricted from operating in their normal manner during Omega Protein’s fishing season, the Company’s business, results of operations and financial condition could be adversely affected. For example, as a direct result of the September 11, 2001 terrorist attacks, the Secretary of Transportation issued a federal ground stop order that grounded certain aircraft (including Omega Protein’s fish-spotting aircraft) for approximately nine days. This loss of spotter aircraft coverage severely hampered Omega Protein’s ability to locate menhaden fish during this nine-day period and thereby reduced its amount of saleable product.
The Company’s insurance coverage may not be sufficient, and insufficient insurance coverage and increased insurance costs could adversely impact the Company’s business, financial condition or results of operations. The Company maintains insurance against physical loss and damage to its assets and coverage against third party liability it may incur in the course of its operations, as well as workers’ compensation, United States Longshoremen’s and Harbor Workers’ Compensation Act and Jones Act coverage. The Company’s liability coverage program is generally comprised of several excess liability policies, which are subject to deductibles, underlying limits, annual aggregates and exclusions. The Company believes its insurance coverage to be in such form, against such risks, for such amounts and subject to such deductibles and self-retentions as are generally prudent for its operations, but the securing of such coverage by necessity requires judgment in the balancing of retained risk and the cost effectiveness of such insurance programs. In recent years, for example, the Company has elected to increase its deductibles and self-retentions in order to manage rising insurance premium costs. These higher deductibles and self-retentions have resulted in greater uninsured losses to the Company in the cases of Hurricanes Katrina, Rita and Ike and will expose the Company to greater risk of loss if additional future claims occur.
Insurance coverage may not be available in the future at current costs or on what the Company considers to be commercially reasonable terms. Furthermore, any insurance proceeds received for any loss of, or damage to, any of the Company’s facilities may not be sufficient to restore the loss or damage without negative impact on the results of its business, financial condition or results of operations. For example, property insurance coverage for flood damages caused by named storm hurricanes has in the past been limited in its availability, and it is possible that such limited coverage might not be adequate to reimburse the Company for its losses if these types of flood losses occur. In addition, should a Company insurer become insolvent, the Company would be responsible for payment of all outstanding claims associated with that insurer’s policies.
In addition, insurance coverage is not generally available for punitive damages, and some courts have been increasingly permissive regarding the imposition of punitive damages for Jones Act cases in recent years. For example, in 2009, the U.S. Supreme Court held that punitive damages were permissible in Jones Act “maintenance and cure” claims. If material uninsured punitive damages were to be assessed against the Company pursuant to a Jones Act claim or otherwise, this assessment could have a material adverse effect on the Company’s business, financial condition or results of operation.
The Company’s estimated reserves for claims may not be sufficient. Omega Protein carries insurance for certain losses relating to its vessels and Jones Act liabilities for employees aboard its vessels. Omega Protein records gross insurance reserves by using an estimation process that considers Company-specific and industry information as well as management’s experience, assumptions and consultation with counsel. These reserves include estimated settlement costs. In addition, insurance receivables are recorded for those portions of the claims in excess of Company insurance policy annual aggregate deductibles and stop losses. Management’s current estimated range of liabilities related to such cases is based on claims for which management can estimate the amount and range of loss. For those claims where there may be a range of loss, Omega Protein has recorded an estimated liability inside that range, based on management’s experience, assumptions and consultation with counsel. The process of estimating and establishing reserves for these claims is inherently uncertain and the actual ultimate net cost of a claim may vary materially from the estimated amount reserved. There is some degree of inherent variability in assessing the ultimate amount of losses associated with these claims due to the extended period of time that transpires between when a claim occurs and the full settlement of the claim. This variability is generally greater for Jones Act claims by vessel employees.
Omega Protein evaluates loss estimates associated with claims and losses as additional information becomes available and revises its estimates. Although management believes estimated reserves related to these claims are adequately recorded, it is possible that actual results could significantly differ from the recorded reserves, which could materially impact the Company’s business, results of operations or financial condition.
Other sources of Long Chain Omega-3 fatty acids may be discovered or created and might compete with the Company’s menhaden-based products. It is possible that other sources of omega–3 fatty acids derived from other sources such as animals, plants, algae, yeast, bacteria, genetically modified organisms or synthetic sources might be discovered or created and these sources might compete with menhaden–based products. Some of the research projects attempting to discover or develop these new sources of omega–3 products may be funded by companies with greater resources than the Company. If such products are developed and became commercially available to the point where the Company’s menhaden product sales are adversely impacted, this could have a material adverse effect on the Company’s business, financial condition or results of operation.
A proposed National Ocean Policy Plan could result in a material adverse effect on the Company’s business, financial condition or results of operation. In June 2009, President Obama issued a Presidential Memorandum creating an Interagency Ocean Policy Task Force charged with, among other things, creating a unitary National Ocean Policy for the United States. In July 2010, the Interagency Ocean Policy Task Force issued its Final Recommendations for a new policy and administrative structure to comprehensively assess, evaluate, and manage activities and uses impacting the nation’s oceans, coasts and Great Lakes. That same day, President Obama issued Executive Order 13547, creating the National Ocean Council (“NOC”), a body comprised of cabinet secretaries, agency heads and other senior members of the federal government.
In January 2012, the NOC issued a Draft National Ocean Policy Plan (“NOPP”) for public comment. In general, the NOPP outlines a detailed system of federal-state cooperation in managing all aspects of ocean policy, including, most relevantly, marine transportation and fisheries. If implemented, the NOPP would create eight regional councils with federal, state and tribal representatives that will draft comprehensive regional management plans that will be implemented by federal and state agencies pursuant to their governing legal authorities. Such “coastal and marine spatial plans” are to be guided by, among other things, the concept of “ecosystem-based management,” which the NOPP defines as “an integrated approach to resource management that considers the entire ecosystem, including humans.”
In May 2014, the Mid-Atlantic Regional Planning Body (“RPB”), formed pursuant to the NOPP and Executive Order 13547 issued its “Mid-Atlantic Regional Ocean Planning Framework” (“Framework”). The Framework does not identify any specific goals or objectives that directly seek to manage coastal fisheries. The Framework is not expected to have an adverse impact on the Company’s operations in 2016 or in the immediate future.
In October 2014, the RPB released a Draft Ocean Action Plan (“Draft Action Plan”) and initial outline of the Mid-Atlantic Regional Ocean Assessment (“ROA”) for public comment. The ROA is intended to serve as an overarching environmental assessment document intended to support the Draft Action Plan. Comment on the Draft Action Plan is expected to continue through the summer of 2016 and is expected to be finalized by the end of the year. The ROA has been presented only in outline form, organized by major goals and objectives identified in the Framework. Under the objective of “Healthy Ocean Ecosystem” and its associated topics of “Ecosystem Based Management,” “Ecosystem Changes in Mid-Atlantic,” and “Ecosystem Services,” the ROA proposes to include a discussion of Atlantic menhaden, along with six other species of vertebrate fish. Development of the ROA is expected to occur over a period of several years and will not, in and of itself, result in any actions being taken or prohibited. However, depending on the quality and level of analysis regarding Atlantic menhaden, such as analysis could be used to support future actions taken under the Action Plan that could have a material adverse effect on the Company’s business, financial condition or results of operation.
The Gulf of Mexico Alliance (“GMA”), formed in 2004, serves as the regional planning body under the NOPP for the Gulf of Mexico. The GMA adopted its first action plan in 2006, which contained broad objectives, such as identifying Gulf habitats, environmental education, wetland restoration, and water quality. GMA’s second action plan, covering 2009-2014, continued this focus and added a collection of ecosystem data to support fisheries management and to support ecosystem-based management initiatives as an action item. The GMA’s third action plan is still in development. The GMA has indicated that it will include a focus on “ecosystem services,” which may include a focus on fisheries and fish stocks such as menhaden. To date, the GMA has generally focused on data collection and high level objectives implemented over a period of years. Therefore, the Company believes that the GMA’s third action plan is unlikely to have a material adverse effect on the Company’s business, financial condition or results of operation, although it is possible that it could do so if the plan were to substantially regulate the menhaden fishery in a materially adverse manner.
Unfavorable publicity or consumer perception of Bioriginal’s products could cause fluctuations in the Company’s operating results and could have a material adverse effect on its reputation, the demand for its products, and its ability to generate revenues. The Company is dependent upon consumer perception of the safety and quality of Bioriginal’s products, as well as similar products distributed by other companies. Consumer perception of products can be significantly influenced by scientific research or findings, national media attention, and other publicity about product use. A product may be received favorably, resulting in high sales associated with that product that may not be sustainable as consumer preferences change. Future scientific research or publicity could be unfavorable to Bioriginal’s industries or any of its particular products and may not be consistent with earlier favorable research or publicity. Adverse publicity in the form of published scientific research or otherwise, whether or not accurate, that associates consumption of Bioriginal’s products or any other similar products with illness or other adverse effects, that questions the benefits of Bioriginal products or similar products, or that claims that such products are ineffective could have a material adverse effect on the Company’s reputation, the demand for Bioriginal products, and the Company’s ability to generate revenues.
Compliance with new and existing governmental regulations could increase the Company’s costs significantly, reduce its growth prospects and adversely affect Bioriginal’s results of operations. The processing, formulation, manufacturing, packaging, labeling, advertising and distribution of Bioriginal’s products are subject to federal laws and regulation by one or more federal agencies, including the FDA, FTC, CPSC, OSHA, E.P.A., Health Canada, CFIA and EFSA. These activities are also regulated by various state, local, and international laws and agencies of the states and localities in which the Company’s products are sold. Government regulations may prevent or delay the introduction, or require the reformulation, or require the discontinuance of Bioriginal products, which could result in lost revenues and increased costs to us. For instance, the FDA regulates, among other things, the composition, safety, manufacture, labeling, and marketing of dietary supplements (including vitamins, minerals, herbs, and other dietary ingredients for human use). The FDA may not accept the evidence of safety for any new dietary ingredient that Bioriginal may wish to market, may determine that a particular dietary supplement or ingredient presents an unacceptable health risk, or may determine that a particular claim or statement of nutritional value that the Company uses to support the marketing of a dietary supplement is an impermissible drug claim, the claim is not substantiated, or is an unauthorized version of a “health claim.” Any of these actions could prevent Bioriginal from marketing particular dietary supplement ingredients in the United States or making certain claims or statements for those products. The FDA could also require Bioriginal to remove a particular product from the market. Any future recall or removal would result in additional costs to the Company, including lost revenues from any products that Bioriginal is required to remove from the market. Any product recalls or removals could also lead to liability, substantial costs, and reduced growth prospects.
Additional or more stringent regulations of dietary supplements and food products have been considered from time to time. These regulations could require reformulation of some products to meet new standards, recalls or discontinuance of some products not able to be reformulated, additional record-keeping requirements, increased documentation of the properties of some products, additional or different labeling, additional scientific substantiation, adverse event reporting, or other new requirements. Any of these developments could increase costs significantly. We may not be able to comply with such new regulations without incurring additional expenses, which could be significant.
The Company may incur material product liability claims and product recall costs, which could increase the Company’s costs and adversely affect its reputation, revenues and operating income. As a manufacturer of products designed for human consumption, the Company is subject to product liability claims and product recall costs if the use of Bioriginal products are alleged to have resulted in injury. Bioriginal products contain vitamins, minerals, herbs and other dietary ingredients that are not subject to pre-market regulatory approval in the United States. Bioriginal products could unintentionally contain contaminated substances, and some of its products contain ingredients that do not have long histories of human consumption. It is possible that previously unknown adverse reactions resulting from human consumption of these ingredients could occur.
In addition, third-party manufacturers produce many of the products that Bioriginal sells. As a distributor of products manufactured by third parties, the Company may also be liable for various product liability claims for products that Bioriginal does not manufacture. Although Bioriginal’s purchase agreements with their third-party vendors typically require the vendor to indemnify Bioriginal to the extent of any such claims, any such indemnification is limited by its terms. Moreover, as a practical matter, any such indemnification is dependent on the creditworthiness of the indemnifying party and its insurer, and the absence of significant defenses by the insurers. We may be unable to obtain full recovery from the insurer or any indemnifying third party in respect of any claims against us in connection with products manufactured by such third party.
Increases in the price and shortage of supply of key raw materials could adversely affect Bioriginal’s business. Certain of Bioriginal’s products are composed of key raw materials that are purchased from third parties. Bioriginal purchases its botanical raw materials from manufacturers and distributors in Asia, Europe, and North America. Bioriginal also manufactures a substantial volume of products that are dependent on coconut raw materials as a source of supply and Bioriginal imports these coconut raw materials from foreign countries such as the Philippines and Sri Lanka. These areas are susceptible to hurricanes and political instability and these factors may make these sources of supply unavailable from time to time, or available at prices that are not attractive to Bioriginal. In addition, Bioriginal manufactures all of its dairy protein products from dairy ingredient raw materials that it purchases from local cheese makers and dairy farmers and is completely dependent on these local sources of supply. For example, three of Bioriginal’s dairy ingredient raw material suppliers accounted for approximately 59% of the cost of its dairy ingredient raw material supply for the year ended December 31, 2015. Dairy ingredient raw material purchase arrangements are typically short-term supply contracts or spot sales agreements.
Raw material prices may increase in the future and Bioriginal may not be able to pass on such increases to its customers. A significant increase in the price of raw materials that cannot be passed on to customers could have a material adverse effect on Bioriginal’s results of operations and financial condition. In addition, if Bioriginal cannot get access to key raw materials due to (i) increased regulatory scrutiny or changing regulatory standards involving dietary supplements or their ingredients or the importation of these raw materials into the United States or Canada, or (ii) lack of supply, it could have a material adverse effect on the Company’s results of operations and financial condition.
Real or perceived quality control problems with raw materials outsourced from certain regions could negatively impact consumer confidence in Bioriginal products, or expose the Company to liability. In addition, although some raw materials may be available from other sources, an unexpected interruption of supply or material increases in the price of raw materials, for any reason, such as changes in economic and political conditions, tariffs, trade disputes, regulatory requirements, import restrictions, loss of certifications, acts of God or other events, could have a material adverse effect on the Company’s business, results of operations, financial condition and cash flows. Also, fluctuations in the value of the U.S. dollar, Canadian dollar or Euro could result in higher costs for raw materials purchased in other countries.
The Company’s dealings in foreign countries require the Company to comply with anti-corruption laws and regulations of the U.S. government and various international jurisdictions in which the Company does business. Doing business in foreign markets requires the Company and its subsidiaries to comply with the laws and regulations of the U.S. government and various international jurisdictions, and the Company’s failure to successfully comply with these rules and regulations may expose it to liabilities. These laws and regulations apply to companies, individual directors, officers, employees and agents, and may restrict the Company’s operations, trade practices, investment decisions and partnering activities. In particular, the Company’s international operations are subject to U.S. and foreign anti-corruption laws and regulations, such as the Foreign Corrupt Practices Act (“FCPA”) and the U.K. Bribery Act (“UKBA”), the Canadian Corruption of Foreign Public Officials Act and the Dutch criminal code. The FCPA prohibits the Company from providing anything of value to foreign officials for the purposes of influencing official decisions or obtaining or retaining business or otherwise obtaining favorable treatment, and requires the Company to maintain adequate record-keeping and internal accounting practices to accurately reflect the Company’s transactions. As part of the Company’s business, the Company may deal with state-owned business enterprises, the employees and representatives of which may be considered foreign officials for purposes of these laws. In addition, some of the international locations in which the Company operates lack a developed legal system and have elevated levels of corruption. As a result of the above activities, the Company is exposed to the risk of violating anti-corruption laws. Violations of these legal requirements are punishable by criminal fines and imprisonment, civil penalties, disgorgement of profits, injunctions, debarment from government contracts as well as other remedial measures. The Company has established policies and procedures designed to assist it in complying with applicable U.S. and international laws and regulations. However, there can be no assurance that the Company’s policies and procedures will effectively prevent the Company from violating these regulations in every transaction in which the Company may engage, and such a violation could adversely affect the Company’s reputation, business, results of operation and financial condition.
Complying with recently enacted healthcare reform legislation could increase the Company’s costs and have a material adverse effect on the Company’s business, financial condition or results of operations. The Affordable Care Act enacted in 2010 and subsequent regulatory implementation of that legislation could significantly increase the Company’s costs and have a material adverse effect on its business, results of operations and financial condition by requiring the Company either to provide certain kinds of mandated health insurance coverage to its employees or to pay certain penalties for electing not to provide such coverage. Because these new requirements are broad, complex, subject to certain phase-in rules, it is difficult to predict the ultimate impact that this legislation will have on the Company’s business and operating costs. This legislation or any alternative version that may ultimately be implemented may materially increase the Company’s operating costs. This legislation could also adversely affect the Company’s employee relations and ability to compete for new employees if its response to this legislation is considered less favorable than the responses or health benefits offered by employers with whom the Company competes for talent.
The inability to protect the Company’s intellectual property rights could adversely affect its business. Despite the Company’s efforts, the Company may not be able to determine the extent of unauthorized use of its trademarks and patents. Such efforts are difficult, expensive, and time-consuming, and there can be no assurance that infringing goods could not be manufactured without the Company’s knowledge and consent. Many of the Company’s products are not subject to patent protection, and therefore they can be legally reverse-engineered by competitors. From time to time the Company faces opposition to its applications to register trademarks, and the Company may not ultimately be successful in its attempts to register certain trademarks.
Climate changes may affect the Company’s business. According to certain scientific studies, emissions of carbon dioxide, methane, nitrous oxide and other gases commonly known as greenhouse gases may be contributing to global warming of the earth’s atmosphere and to global climate change, which may exacerbate the severity of these conditions. It is also possible that these conditions, if they occur, would impact the spawning, feeding, migration, distribution and growth of the menhaden species and hence, the Company’s fishing harvest, as well as the cost or availability of the raw materials utilized by Bioriginal. As a result, such conditions may pose increased climate-related risks to the Company’s assets and operations. Due to the uncertainties surrounding the regulation of, and other risks associated with, climate issues, the Company cannot predict the financial impact of related developments on its business.
Third party labor strikes and supply chain interruptions could adversely impact the Company’s ability to import certain raw materials. Certain of the Company’s products are composed of raw materials that are imported from foreign manufacturers and distributors who may be subject to labor strikes, supply chain disruption and political turmoil in foreign countries. The occurrence of these sorts of adverse events could result in higher costs for raw materials purchased abroad and delivery delays to customers, and if these events continued for a sustained period of time, could have a material adverse effect on the Company’s business, financial condition or results of operation.
Risks Relating to the Company’s Operations:
The Company’s strategy to become a fully integrated nutritional ingredient company is subject to inherent risk. The Company’s strategy to become a fully integrated nutritional ingredient company and to expand the sales of its fish oil products into the markets for refined, functional foods and supplement grade fish oils for human consumption is subject to risks inherent in any business expansion. The Company’s expectations regarding future demand for nutritional products may prove to be incorrect or, if future demand does meet the Company’s expectations, it is possible that purchasers could utilize nutritional products other than the Company’s products. In addition, the Company is now operating in areas subject to different regulations and subject to different market forces than its historical commercial fishing business, all of which makes the Company’s overall business environment more complex and challenging.
The Company’s implementation of a new enterprise resource planning (“ERP”) system could result in problems that could negatively impact its business. The Company began implementing a new ERP system in 2014 that will support substantially all of the Company’s operating and financial functions and is continuing to implement this system in 2016. It is possible that the Company could experience problems in connection with this implementation, including compatibility issues, training requirements, higher than expected implementation costs and other integration challenges and delays, as the Company’s employees learn the new system, transfer data from the Company’s existing system to the new system and operate with the new system. Any difficulties that the Company encounters in implementing the new system may disrupt the Company’s operations and the Company’s ability to deal effectively with the Company’s employees, vendors, customers and other companies with which the Company has commercial relationships. Additionally, a significant problem with the implementation, integration with other systems or ongoing management of an ERP system and related systems could have an adverse effect on the Company’s ability to generate and interpret accurate management and financial reports and other information on a timely basis, which could have a material adverse effect on the Company’s financial reporting system and internal controls and adversely affect the Company’s ability to manage its business or comply with various regulations.
The Company has a moderate amount of indebtedness, which may adversely affect its ability to operate its business, remain in compliance with debt covenants and make payments on its debt. As of December 31, 2015, the aggregate amount of the Company’s outstanding indebtedness under its bank credit facility and other indebtedness was approximately $24.1 million. The Company has the ability, under current and potential future credit facilities and other indebtedness, to significantly increase its outstanding indebtedness in the future. The Company’s outstanding indebtedness could have important consequences, including the following:
|
● |
the Company’s ability to meet its expenses and debt obligations will depend on its future performance, which will be affected by financial, business, economic, regulatory and other factors. The Company will not be able to control many of these factors, such as economic conditions and governmental regulation. The Company cannot be certain that its earnings will be sufficient to allow it to pay the principal and interest on its existing or future debt and meet its other obligations. If the Company does not have enough money to service its existing or future debt, it may be required to refinance all or part of its existing or future debt, sell assets, borrow more money or raise equity. The Company may not be able to refinance its existing or future debt, sell assets, borrow more money or raise equity on terms acceptable to it, if at all; |
|
● |
it may be more difficult for the Company to satisfy its obligations with respect to its bank credit facility and other indebtedness and any failure to comply with the obligations of any of the agreements governing such indebtedness, including financial and other restrictive covenants, could result in an event of default under such agreements; |
|
● |
the covenants contained in the Company’s debt agreements limit its ability to borrow money in the future for acquisitions, capital expenditures or to meet its operating expenses or other general corporate obligations; |
|
● |
the amount of the Company’s interest expense may increase because its borrowings are, and any future borrowings under its bank credit facility and other indebtedness would be, at variable rates of interest, which, if interest rates increase, could result in higher interest expense; |
|
● |
the Company will need to use a portion of its cash flows to pay principal and interest on its debt, which will reduce the amount of money the Company has for operations, working capital, capital expenditures, expansion, acquisitions or general corporate or other business activities; |
|
● |
the Company may have a higher level of debt than some of its competitors, which could put it at a competitive disadvantage; |
|
● |
the Company may be more vulnerable to economic downturns and adverse developments in its industry or the economy in general; and |
|
● |
the Company’s debt level could limit its flexibility in planning for, or reacting to, changes in its business and the industry in which it operates. |
The Company’s quarterly operating results will fluctuate as its business is seasonal in nature and subject to estimates. Omega Protein’s menhaden harvesting and processing business is seasonal in nature. Omega Protein generally has higher sales during the third quarter of each fiscal year due to increased product availability and customer demand. Additionally, due to differences in gross profit margins for Omega Protein’s various products, any variation in the mix of product sales between quarters may result in significant variations of total gross profit margins. Similarly, from time to time Omega Protein defers sales of inventory based on worldwide prices for competing products that affect prices for its products, which may affect comparable period comparisons. As a result, the Company’s quarterly operating results have fluctuated in the past and may fluctuate in the future.
In addition, inventory is generally carried over from one year to the next year, and Omega Protein generally begins selling its current season’s production late in the second quarter and sells that production until the second quarter of the following year. Costs can change meaningfully from one season to the next.
Further, Omega Protein’s per unit cost of production is estimated prior to the beginning of each fishing season based on total estimated fishing costs (including off-season costs) divided by estimated total units of production. Omega Protein adjusts the cost of sales, unallocated inventory cost pool and inventory balances at the end of the second, third and fourth quarters based on revised estimates of total units of production to total inventoriable costs. Changes in estimates from one quarter to the next can have a significant impact on operating results.
The Company’s business is subject to significant competition, and some competitors have significantly greater financial resources and more extensive and diversified operations than the Company. The marine protein and oil business is subject to significant competition from producers of vegetable and other animal protein products and oil products such as Archer Daniels Midland and Cargill. In addition, Omega Protein competes with a domestic menhaden fishing company that was purchased in 2015 by a large foreign public company, and numerous fish processors outside the United States. Many of these competitors have significantly greater financial resources, less onerous regulatory costs and more extensive and diversified operations than the Company.
The dietary supplement ingredient supplier industry is a large, highly fragmented and growing industry, with no single industry participant accounting for a majority of total industry sales. Competition is based primarily on price, quality and assortment of products, customer service, marketing support and availability of new ingredients. In addition, the market is highly sensitive to the introduction of new products. Bioriginal competes with manufacturers, distributors and marketers of dietary supplement ingredients both within and outside the United States.
The Company’s foreign customers are subject to disruption typical to foreign countries. The Company’s sales of its products in foreign countries are subject to risks associated with foreign countries such as changes in social, political and economic conditions inherent in foreign operations, including:
|
● |
Changes in the law and policies that govern foreign investment and international trade in foreign countries; |
|
● |
Changes in U.S. laws and regulations relating to foreign investment and trade; |
|
● |
Changes in tax or other laws; |
|
● |
Partial or total expropriation; |
|
● |
Currency exchange rate fluctuations; |
|
● |
Restrictions on current repatriation; or |
|
● |
Political disturbances, insurrection or war. |
In addition, it is possible that the Company, at any one time, could have a significant amount of its revenues generated by sales in a particular country which would concentrate the Company’s susceptibility to adverse events in that country. For example, in 2015, approximately 10% of the Company’s revenues were derived from customers in China.
The Company may undertake acquisitions that are unsuccessful and the Company’s inability to control the inherent risks of acquiring businesses could adversely affect its business, results of operations and financial condition. In the future the Company may undertake acquisitions of other businesses, located either in the United States or in other countries, although there can be no assurances that this will occur. The Company had not made any acquisitions until its acquisitions of Cyvex in December 2010, InCon in September 2011, WSP in February 2013 and Bioriginal Food & Science in September 2014. There can be no assurance that the Company will be able (i) to identify and acquire acceptable acquisition candidates on favorable terms, (ii) to profitably manage recent acquisitions, or future businesses it may acquire, or (iii) to successfully integrate recent acquisitions or future businesses it may acquire without substantial costs, delays or other problems. Any of these outcomes could have a material adverse effect on the Company’s business, results of operations and financial condition.
The Company has recorded impairment charges with respect to goodwill and other intangible assets and may be required to record additional charges to future earnings if goodwill and other intangible assets become further impaired, which could have a material adverse effect on the Company’s financial condition and results of operations. As of December 31, 2015, the Company had goodwill and other intangibles assets of $38.1 million and $20.1 million, respectively, or approximately 14.3% of the Company’s total assets in the aggregate. Goodwill is measured as the excess of the cost of an acquisition over the sum of the amounts assigned to the fair value of tangible and intangible assets acquired less liabilities assumed. The Company tests goodwill and other intangible assets periodically for impairment of value, and whenever an event occurs or circumstances change that would more likely than not indicate that the carrying value of a reporting unit that includes goodwill is greater than the fair value of that reporting unit. Due to a decline in actual earnings compared with projected results, we performed interim and annual testing of the goodwill and other intangible assets for the Company’s InCon and Cyvex reporting unit and recorded $4.5 million of impairment charges during the year ended December 31, 2015. Similarly, we recorded a $4.7 million impairment charge relating to the InCon and Cyvex reporting unit during the year ended December 31, 2014. See Note 10 - Goodwill and Other Intangible Assets to the Company’s consolidated financial statements included in Item 8.
The assessments of goodwill and other intangible assets are based on assumptions that require speculation and are highly subjective given the early stage and transitional nature of the businesses and the use of other reasonable, but different, assumptions could provide significantly different fair values and result in additional impairments. The quantitative tests have assumed increasing cash flows over the next several years, based on anticipated sales growth and improved profitability. The Company’s ability to grow sales and improve profitability as expected is contingent on its ability to, among other factors, procure adequate supplies of raw materials, align product production and customer demand, and price products at appropriate margins above production or procurement costs. Considering the level of sensitivity with respect to the key assumptions, if the Company does not (i) ensure adequate supplies of raw materials, (ii) adequately anticipate changes in its customers’ demand for products or (iii) price products at appropriate margins above production or procurement costs, its future cash flows may fail to meet the Company’s cash flow projections. If the cash flows decline sufficiently, the estimated fair values would be reduced and the Company may be required to record additional charges to future earnings if its goodwill and other intangible assets become further impaired, which could have material adverse effect on the Company’s financial condition and results of operations.
The Company’s failure to comply with federal U.S. citizenship ownership requirements may prevent it from harvesting menhaden in the U.S. jurisdictional waters. Omega Protein’s harvesting operations are subject to the Shipping Act of 1916 and the regulations promulgated there under by the Department of Transportation, Maritime Administration which require, among other things, that the Company be incorporated under the laws of the U.S. or a state, the Company’s chief executive officer be a U.S. citizen, no more of the Company’s directors be non-citizens than a minority of a number necessary to constitute a quorum and at least 75% of the Company’s outstanding capital stock (including a majority of its voting capital stock) be owned by U.S. citizens. If the Company fails to observe any of these requirements, the Company will not be eligible to conduct its harvesting activities in U.S. jurisdictional waters which would have a material adverse effect on the Company’s business, results of operations and financial condition.
Omega Protein may not be able to recruit, train and retain qualified marine personnel in sufficient numbers. Omega Protein’s business is dependent on its ability to recruit, train and retain qualified marine personnel in sufficient numbers such as vessel captains, vessel engineers and other crewmembers. Omega Protein has experienced difficulty from time to time, depending on labor markets, in recruiting its optimal number of employees. To the extent that Omega Protein is not successful in recruiting, training and retaining employees in sufficient numbers, its productivity may suffer. If Omega Protein were unable to secure a sufficient number of workers during periods of peak employment, the lack of personnel could have an adverse effect on the Company’s business, results of operations and financial condition.
Omega Protein may lose access to the United States H2B Visa Program which we rely on for qualified marine personnel. Omega Protein has historically utilized workers in the United States H2B Visa Program whereby foreign nationals are permitted to enter the United States temporarily and engage in seasonal, non-agricultural employment. In February, 2016 the U.S. Department of Labor’s Office of Foreign Labor Certification announced that it was experiencing significant delays in processing employers H2B Visa applications. Accordingly, it is possible that the Company’s 2016 H2B Visa applications may be delayed. If Omega Protein cannot participate in the H2B Visa Program in 2016, or its participation in that program is delayed or restricted, then its ability to secure a sufficient number of qualified workers during periods of peak employment may have an adverse impact on the Company’s business, results of operations and financial condition.
Our business may be adversely impacted by work stoppages and other labor relations matters. Certain of our employees that work on vessels at our Reedville, Virginia facility are represented by an affiliate of the United Food and Commercial Workers Union. The collective bargaining agreement for these employees has a three-year term that expires in April 2017 and the Company expects to enter into discussions with the union regarding a new collective bargaining agreement prior to that date. While we have good relations with these employees and the union, we may be unsuccessful in negotiating and agreeing upon a new collective bargaining agreement at that time if the current collective bargaining agreement is terminated. We have also had attempts to unionize our other facilities, which to date have been unsuccessful. Most recently, on March 1, 2016, we received notice that the International Brotherhood of Boilermakers, Iron Ship Builders, Blacksmiths, Forgers and Helpers filed a petition with the NLRB seeking certification to represent certain employees for the purpose of collective bargaining at our Moss Point fish processing plant. The matter is being processed and adjudicated under NLRB procedures. While we believe that we have good relations with our workforce, we may experience work stoppages or other labor problems in the future, and further unionization efforts may be successful. Any prolonged work stoppage could have an adverse effect on our results of operations, cash flows and financial condition.
The Company’s bank credit facility contains covenants and restrictions that may limit the Company’s financial flexibility. The Company’s bank credit facility and other indebtedness contain various financial covenants with which the Company must comply. For more information on these bank covenants, please refer to Note 11 – Notes Payable and Long-Term Debt to the Company’s consolidated financial statements included in Item 8.
Investment Risks. Investment risks specifically related to the Company’s common stock include:
Proxy contests threatened or commenced against the Company could be disruptive and costly, cause uncertainty about the strategic direction of the Company’s business and adversely affect the Company’s business, operating results and financial condition. On February 23, 2016, Wynnefield Partners Small Cap Value, L.P., an affiliate of Wynnefield Capital Management, LLC (collectively “Wynnefield”), notified the Company of its intention to nominate three persons for election as directors at the Company’s 2016 Annual Meeting of Stockholders. According to Amendment No. 3 to the Schedule 13D filed with the SEC by Wynnefield on March 1, 2016, Wynnefield beneficially owns approximately 6.7% of the Company’s outstanding common stock. If Wynnefield continues to pursue a proxy contest and related actions at the Company’s 2016 Annual Meeting of Stockholders to elect directors other than those recommended by the Company’s Board of Directors, or takes other actions that conflict with the Company’s strategic direction, such actions could have a material and adverse effect on the Company for the following reasons:
|
● |
Responding to proxy contests and related actions by activist stockholders such as Wynnefield can be costly and time-consuming, disrupt the Company’s operations, and divert the attention of the Company’s management and employees away from their regular duties and the pursuit of the Company’s business strategies, which could materially and adversely affect the Company’s business, operating results and financial condition. |
|
● |
Perceived uncertainties as to the Company’s future direction as a result of potential changes to the composition of the Board of Directors may lead to the perception of a change in the direction of the Company’s business, instability or lack of continuity. This may be exploited by the Company’s competitors, affect the Company’s relationship with current or potential vendors, customers and other third parties, result in the loss of current and/or potential business opportunities and make it more difficult to attract and retain qualified personnel and business partners. If customers choose to terminate, cease, delay, defer or reduce transactions with the Company or transact with the Company’s competitors because of any such issues, then the Company’s business, operating results and financial condition could be materially and adversely affected. |
|
● |
Proxy contests and related actions by activist stockholders such as Wynnefield could cause significant fluctuations in the Company’s stock price based on temporary or speculative market perceptions or other factors that do not necessarily reflect the underlying fundamentals and prospects of the Company’s business. |
|
● |
A proxy contest could impede the Company’s previously announced strategic alternatives review process by deterring potential partners, or creating stock price volatility or speculative valuations that deter a strategic alternative transaction that might otherwise maximize value for long term stockholders. |
|
● |
If individuals were to be elected to the Company’s Board of Directors with agendas that are in conflict with the Company’s strategic plan, even though less than a majority, the Company’s ability to effectively implement its business strategy, retain, and attract experienced executives and employees and create additional value for the Company’s stockholders may be materially and adversely affected. |
Uncertain economic conditions may have material adverse impacts on the Company’s business, results of operation and financial condition that the Company currently cannot predict. As widely reported, economic conditions in the United States and globally drastically deteriorated during 2008 and 2009. Financial markets in the United States, Europe and Asia experienced a period of turmoil and upheaval characterized by extreme volatility and declines in security prices, severely diminished liquidity and credit availability, inability to access capital markets, the bankruptcy, failure, collapse or sale of various financial institutions, European sovereign debt issues and an unprecedented level of intervention from the United States federal government and other governments. Although many of these factors have changed by varying degrees during the following years, the Company cannot predict whether future similar events will occur or will materially adversely affect the Company’s business, results of operation and financial condition.
For example, it is possible that in the future:
|
● |
the Company may not be able to obtain modifications to the financial covenants under the bank credit facility and other indebtedness, if necessary, on acceptable terms, if at all; |
|
● |
the demand for fishmeal and oil may decline due to the uncertain economic conditions which could negatively impact the revenues, margins and profitability of the Company’s business; |
|
● |
the Company may be unable to obtain adequate funding under the bank credit facility and other indebtedness or future credit agreements due to lending counterparties being unwilling or unable to meet their funding obligations; |
|
● |
the tightening of credit or lack of credit availability to the Company’s customers could adversely affect its ability to collect trade receivables; |
|
● |
the Company’s ability to access the capital markets may be restricted at a time when the Company would like, or need, to raise capital for its business including for capital expenditures or acquisitions; |
|
● |
changes in the value of plan assets for the Company’s defined benefit plan may result in increased benefit costs and may increase the amount and accelerate the timing of required future contributions; or |
|
● |
the Company’s commodity hedging arrangements could become ineffective if the Company’s counterparties are unable to perform their obligations or seek bankruptcy protection. |
The limited liquidity for the Company’s common stock could affect shareholders’ ability to sell shares at a satisfactory price. The Company’s common stock is relatively illiquid. As of December 31, 2015, the Company had approximately 22.2 million shares of common stock outstanding. The average daily trading volume in the common stock during the prior 60 calendar days ending on that date was approximately 436,000 shares. A more active public market for the Company’s common stock, however, may not develop, which would continue to adversely affect the trading price and liquidity of the common stock. Moreover, a thin trading market for the common stock causes the market price for the common stock to fluctuate significantly more than the stock market as a whole. Without a large float, the Company’s common stock is less liquid than the stock of companies with broader public ownership and, as a result, the trading prices of the common stock may be more volatile. In addition, in the absence of an active public trading market, shareholders may be unable to liquidate their investment in the Company at a satisfactory price.
Issuance of shares in connection with financing transactions or under stock incentive plans will dilute current stockholders. Pursuant to the Company’s stock incentive plans, the Company’s management is authorized to grant stock awards to its employees, directors and consultants. Stockholders will incur dilution upon exercise of any outstanding stock awards. In addition, if the Company raises additional funds by issuing additional common stock, or securities convertible into or exchangeable or exercisable for common stock, further dilution to its existing stockholders will result, and new investors could have rights superior to existing stockholders.
The number of shares of the Company’s common stock eligible for future sale could adversely affect the market price of its stock. The Company had outstanding options to purchase approximately 0.6 million shares of its common stock with a weighted average exercise price of $7.74 per share as of December 31, 2015. These shares of common stock are registered for resale on currently effective registration statements. Certain of the Company’s officers and directors have from time to time in the past entered into, and in the future may enter into, Rule 10b5-1 sales plans with brokers unaffiliated with the Company whereby they commit to sell automatically and without discretion a predetermined number of shares of the Company’s common stock over a period of time according to their own individual criteria. The issuance of a significant number of shares of common stock upon the exercise of stock options, or the availability for sale, or sale, of a substantial number of the shares of common stock eligible for future sale under effective registration statements, Rule 10b5-1 plans, under Rule 144 or otherwise, could adversely affect the market price of the common stock.
Under the Company’s securities trading policy, Rule 10b5-1 stock sales or purchase plans are required to be approved by the Company for directors, officers and certain key employees. The Company expects that public disclosure regarding purchases or sales under these Rule 10b5-1 plans will be provided through Form 4 and Rule 144 filings with the Securities and Exchange Commission. The Company does not intend to disclose further information regarding the existence or terms of these trading plans for individual participants.
The Company has never paid dividends. The Company has never declared or paid any cash dividends on its common stock since it became a public company in 1998. Any determination as to payment of dividends will be made at the discretion of the Company’s Board of Directors and will depend upon the Company’s operating results, financial condition, capital requirements, general business conditions and such other factors that the Board of Directors deems relevant.
Provisions of the Company’s Articles of Incorporation and Bylaws, as well as Nevada and federal law, could delay or prevent corporate takeovers and could prevent stockholders from realizing a premium on their investment. Certain provisions of the Company’s Articles of Incorporation and Bylaws as well as the Nevada Corporation Law, could delay or frustrate the removal of incumbent directors and could make difficult a merger, tender offer or proxy contest involving the Company, even if such events could be viewed as beneficial by its stockholders. The Company’s Board of Directors is empowered to issue preferred stock or rights in one or more series without stockholder action. Any issuance of this blank-check preferred stock could materially limit the rights of holders of the Company’s common stock and render more difficult or discourage an attempt to obtain control of the Company by means of a tender offer, merger, proxy contest or otherwise. In addition, the Articles of Incorporation and Bylaws contain a number of provisions which could impede a takeover or change in control of the Company, including, among other things, staggered terms for members of its Board of Directors, the requiring of two-thirds vote of stockholders to amend certain provisions of the Articles of Incorporation or the inability to take action by written consent or to call special stockholder meetings. Certain provisions of the Nevada Corporation Law could also discourage takeover attempts that have not been approved by the Company’s Board of Directors. In addition, federal law requires that at least 75% of the Company’s outstanding capital stock be owned by U.S. citizens which could discourage takeover attempts by potential foreign purchasers.
Item 1B. Unresolved Staff Comments.
None.
Item 3. Legal Proceedings.
The Company is defending various claims and litigation arising from operations in the ordinary course of the Company’s business. In the opinion of management any losses resulting from these matters will not have a material adverse effect on the Company’s results of operations, cash flows or financial position.
Item 4. Mine Safety Disclosures
Not applicable.
PART II
Item 5. Market for Registrant’s Common Equity, Related Stockholder Matters and Issuer Purchases of Equity Securities.
The following performance graph compares the Company’s cumulative total stockholder return on its Common Stock with the cumulative total return on (i) the Russell 2000 Index, and (ii) a peer group stock index (the “Peer Group Index”) which consists of three publicly traded companies in the agriproducts industry. The companies that comprise the Peer Group Index are Archer Daniels Midland Company, ConAgra, Inc. and Tyson Foods, Inc.
The cumulative total return computations set forth in the Performance Graph assume the investment of $100 in Common Stock, the Russell 2000 Index, and the Peer Group Index on December 31, 2010. Any dividends are assumed to be reinvested.
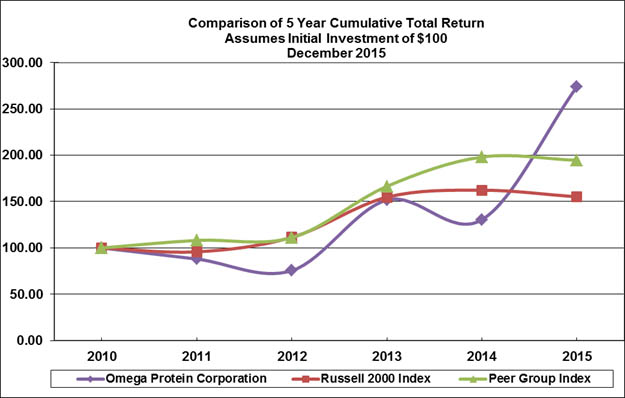
|
Period Ending |
||||||||||||||||||||||||
|
Company/Market/ Peer Group |
12/31/2010 |
12/31/2011 |
12/31/2012 |
12/31/2013 |
12/31/2014 |
12/31/2015 |
||||||||||||||||||
|
Omega Protein Corporation |
$ | 100.00 | $ | 88.02 | $ | 75.56 | $ | 151.73 | $ | 130.49 | $ | 274.07 | ||||||||||||
|
Russell 2000 Index |
$ | 100.00 | $ | 95.82 | $ | 111.49 | $ | 154.78 | $ | 162.35 | $ | 155.18 | ||||||||||||
|
Peer Group Index |
$ | 100.00 | $ | 108.20 | $ | 111.14 | $ | 166.47 | $ | 198.16 | $ | 194.59 | ||||||||||||
Note: $100 invested on December 31, 2010 including reinvestment of dividends.
The Performance Graph and related description shall be deemed “furnished” and not “filed” and are not incorporated by reference into any document that incorporates the Form 10-K by reference, except to the extent that the Company specifically incorporates this information by reference. In addition the Performance Graph and the related description shall not be deemed “soliciting material” or to be “filed” with the SEC or subject to Regulation 14A or 14C.
The Company’s common stock is listed on the New York Stock Exchange (“NYSE”) under the symbol “OME”. The daily high and low sales prices for the common stock, as reported in the consolidated transactions reporting system for each quarterly period ending on the date indicated, are shown in the following table. No dividends were paid during the periods set forth in the table.
|
Dec 31, 2015 |
Sep 30, 2015 |
Jun 30, 2015 |
Mar 31, 2015 |
Dec 31, 2014 |
Sep 30, 2014 |
Jun 30, 2014 |
Mar 31, 2014 |
|||||||||||||||||||||||||
|
High sales price |
$ | 25.22 | $ | 19.10 | $ | 14.50 | $ | 14.09 | $ | 15.25 | $ | 15.92 | $ | 14.80 | $ | 13.89 | ||||||||||||||||
|
Low sales price |
$ | 16.41 | $ | 13.07 | $ | 11.11 | $ | 10.25 | $ | 9.00 | $ | 11.58 | $ | 11.03 | $ | 9.78 | ||||||||||||||||
On March 2, 2016, the closing price of the Company’s common stock, as reported by the NYSE, was $24.76 per share and there were approximately 14 holders of record. This number does not include any beneficial owners for whom shares may be held in a “nominee” or “street” name.
The Company has never declared any dividends since it became a public company in April 1998. The Company generally intends to retain earnings, if any, and does not anticipate declaring or paying dividends on its common stock in the near future. Any future determination as to payment of dividends will be made at the discretion of the Board of Directors of the Company and will depend upon the Company’s operating results, financial condition, capital requirements, general business conditions and such other factors that the Board of Directors deems relevant. See “Item 7—Management’s Discussion and Analysis of Financial Conditional and Results of Operations—Liquidity and Capital Resources.”
Information relating to compensation plans under which the Company’s equity securities are authorized for issuance are set forth in Part III, Item 12 of this Report.
Item 6. Selected Financial Data.
The following table sets forth certain selected historical consolidated financial information for the periods presented and should be read in conjunction with the Consolidated Financial Statements of the Company included in Item 8 of this Report and the related notes thereto and with “Management's Discussion and Analysis of Financial Condition and Results of Operations” included in Item 7 of this Report.
| Years Ended December 31, | ||||||||||||||||||||
| 2015 | 2014 | 2013 | 2012 | 2011 | ||||||||||||||||
| (in thousands, except per share amounts) | ||||||||||||||||||||
|
Revenues |
$ | 359,311 | $ | 308,635 | $ | 244,293 | $ | 235,639 | $ | 251,743 | ||||||||||
|
Operating income |
41,789 | 31,586 | 48,013 | 12,626 | 54,359 | |||||||||||||||
|
Net income |
23,975 | 18,461 | 30,515 | 4,063 | 34,157 | |||||||||||||||
|
Per share income basic |
1.10 | 0.87 | 1.50 | 0.21 | 1.77 | |||||||||||||||
|
Per share income diluted |
1.07 | 0.85 | 1.45 | 0.20 | 1.71 | |||||||||||||||
|
Capital expenditures |
34,888 | 44,123 | 24,796 | 25,064 | 23,352 | |||||||||||||||
|
Working capital |
$ | 118,718 | $ | 82,971 | $ | 116,878 | $ | 106,452 | $ | 109,988 | ||||||||||
|
Property and equipment, net |
176,089 | 169,932 | 144,113 | 127,640 | 122,512 | |||||||||||||||
|
Total assets |
407,203 | 380,115 | 331,394 | 295,296 | 277,830 | |||||||||||||||
|
Current maturities of long-term debt |
1,214 | 14,741 | 3,112 | 3,326 | 3,509 | |||||||||||||||
|
Long-term debt |
22,882 | 20,486 | 21,130 | 24,242 | 27,570 | |||||||||||||||
|
Stockholders' equity |
295,170 | 265,882 | 247,230 | 205,603 | 196,561 | |||||||||||||||
Item 7. Management's Discussion and Analysis of Financial Condition and Results of Operations.
The following is a discussion of the Company's financial condition and results of operations. This discussion should be read in conjunction with the Consolidated Financial Statements of the Company appearing under Item 8 of this Report. Certain amounts applicable to the prior periods have been reclassified to conform to the classifications currently followed.
Company Overview
For a full discussion of the Company’s business, see Part I, Item 1. and 2. “Business and Properties”.
Markets and Sales. Pricing for Omega Protein’s fish meal, oil and solubles products has been volatile in the past several years and is attributable mainly to the international availability, or the perceived international availability, of these products. The following table as reported by the International Fishmeal and Fish Oil Organization shows global fish meal and fish oil production for the last 12 years in thousands of metric tons:
|
2004 |
2005 |
2006 |
2007 |
2008 |
2009 |
2010 |
2011 |
2012 |
2013 |
2014 |
2015 |
|||||||||||||||||||||||||||||||||||||
|
Fish Meal |
6,226 | 5,868 | 5,092 | 5,052 | 4,972 | 4,903 | 4,569 | 5,653 | 4,564 | 4,676 | 4,182 | 4,367 | ||||||||||||||||||||||||||||||||||||
|
Fish Oil |
1,129 | 988 | 983 | 1,061 | 1,056 | 1,032 | 864 | 1,080 | 921 | 894 | 873 | 811 | ||||||||||||||||||||||||||||||||||||
In an effort to reduce price volatility and to generate higher, more consistent profit margins, Omega Protein has implemented a quality control program designed to increase its capability of producing higher quality fish meal products and, in conjunction therewith, enhanced its sales efforts to penetrate premium product markets. Additionally, the Company continues to market its refined fish oil to food manufacturers and other related industries through the human nutrition segment. The Company has made sales of its refined fish oil, trademarked OmegaPure®, to food manufacturers in the United States and Canada at prices that provide improved margins over the margins that can typically be obtained from selling non-refined crude fish oil. The Company has also made sales of OmegaActiv® to human supplement manufacturers.
Omega Protein generally sells most of its fish meal, oil and solubles products on up to a twelve-month forward contract basis with the balance sold on a spot basis through purchase orders or under longer-term forward contracts. Omega Protein’s sales contracts generally contain force majeure and other production allocation provisions. Historically, fish meal and fish oil sold on a forward contract basis has fluctuated from year to year based upon perceived market availability and forward price expectations. As of December 31, 2015, Omega Protein has sold forward on a contract basis approximately 72,000 short tons (1 short ton = 2,000 pounds) of fish meal and 10,000 metric tons (1 metric ton = 2,204.6 pounds) of fish oil for 2016, contingent on 2016 production and product availability. Of these 2016 forward sales, the majority was contracted during 2015. As a basis of comparison, as of December 31, 2014, Omega Protein had sold forward on a contract basis approximately 54,000 short tons of fish meal and 14,000 metric tons of fish oil for 2015.
Omega Protein’s annual revenues from fish meal, oil and solubles are highly dependent on pricing, annual fish catch, production yields and inventories. Inventory is generally carried over from one year to the next year and Omega Protein determines the level of inventory to be carried over based on existing contracts, prevailing market prices of the products and anticipated customer usage and demand during the off-season. Thus, production volume does not necessarily correlate with sales volume in the same year and sales volumes will fluctuate from quarter to quarter. Omega Protein’s fish meal products have a useable life of approximately one year from the date of production. Practically, however, Omega Protein attempts to empty its warehouses of the previous season’s products by May or June of the new fishing season. Omega Protein’s crude fish oil products do not lose efficacy unless exposed to oxygen and, therefore, their storage life typically is longer than that of fish meal.
The following table shows total tons of fish meal and oil sold and revenue per ton for each year:
|
2009 |
2010 |
2011 |
2012 |
2013 |
2014 |
2015 |
||||||||||||||||||||||
|
Tons sold |
204,488 | 161,781 | 223,969 | 202,177 | 157,313 | 175,362 | 151,302 | |||||||||||||||||||||
|
Revenue per ton |
$ | 845 | $ | 1,063 | $ | 1,056 | $ | 1,043 | $ | 1,355 | $ | 1,390 | $ | 1,453 | ||||||||||||||
Fishing and Production. Omega Protein is the largest U.S. producer of protein-rich meal and oil derived from marine sources. Omega Protein's products are produced from menhaden (a herring-like fish found in commercial quantities), and include specialty fish meals, crude and refined fish oils and fish solubles. Omega Protein’s fish meal products are used as nutritional feed additives by animal feed manufacturers and by commercial livestock producers. Omega Protein's crude fish oil is sold to food producers and feed manufacturers, and its refined fish oil products are used in food production, feed production, certain industrial applications as well as dietary supplements. Fish solubles are sold as attractants for animal feeds and baits and as fertilizers.
Omega Protein’s harvesting season generally extends from May through November or December on the mid-Atlantic coast and from mid-April through October on the Gulf coast. Omega Protein generally begins selling its current season’s production late in the second quarter and sells that production until the second quarter of the following year.
The Company’s 2015 fish catch was 4.7% above the trailing five year average and related production results were equal to the trailing five year average. Higher fish catch and equal production is due to a reduction in total yield due, primarily as a result of lower fish oil yields. The Company believes that fish oil yields are influenced by multiple factors, including but not limited to, fish diet, weather, water temperature and nutrient content, fish population and age of fish, but such possible relationships and inter-relationships are not generally well understood. The increased fish catch offset the impact of lower oil yields and resulted in lower per unit inventory cost for the 2015 fishing season as compared to the 2014 fishing season.
The Company’s 2014 fish catch and related production results were below the trailing five year average. For illustrative purposes, the Company’s fish meal, oil and solubles production for the 2014 fishing season was lower by 26% compared to the Company’s five year production average. This reduction is due in part to the Company’s decision to close its Cameron, Louisiana facility and fish three less vessels, the limit on fish caught in the Atlantic Ocean enacted by the ASMFC and lower than normal early season fish availability in the Gulf of Mexico.
The Company’s 2013 fish catch was 5.9% below the trailing five year average but the related fish meal, oil and solubles production was 2.4% above the trailing five year average due to improved oil yields. This reduction in fish catch was due in part to the Company’s decision to delay the start of its 2013 Atlantic fishing season and utilize one less vessel due to the limit on fish caught along the Atlantic enacted by the ASMFC in 2013. For illustrative purposes, the Company’s oil yields for 2013 were higher by 34.0% compared to the Company’s five year oil yield average.
The following table summarizes the Omega Protein’s fishing and production for the indicated periods:
|
Years Ended December 31, |
||||||||||||
|
2015 |
2014 |
2013 |
||||||||||
|
Fish catch (short tons) |
530,767 | 394,281 | 485,626 | |||||||||
|
Production: |
||||||||||||
|
Fish Meal (short tons) |
137,234 | 103,472 | 123,740 | |||||||||
|
Oil (metric tons) |
||||||||||||
|
Crude |
26,487 | 20,357 | 45,155 | |||||||||
|
Refined |
11,189 | 10,626 | 11,168 | |||||||||
|
Solubles (short tons) |
6,641 | 3,754 | 10,083 | |||||||||
|
Total Production |
181,551 | 138,209 | 190,146 | |||||||||
Omega Protein’s harvesting and processing business is seasonal and fluctuates from year to year and month to month due to natural conditions over which Omega Protein has no control. Poor fish catch and total yields have at times materially impacted the amount of products that Omega Protein has been able to produce.
Human Nutrition Products – The Company produces and sells products for human consumption in three primary product lines: specialty oils, dairy protein products and other nutraceutical ingredients.
The following table summarizes revenues by product line for the Human Nutrition segment for the indicated periods (in thousands):
|
Years Ended December 31, |
||||||||||||
|
2015 |
2014 |
2013 |
||||||||||
|
Specialty oils |
$ | 113,642 | $ | 41,090 | $ | 5,780 | ||||||
|
Dairy protein products |
12,931 | 11,741 | 9,810 | |||||||||
|
Other nutraceutical ingredients |
12,593 | 12,007 | 15,467 | |||||||||
|
Human nutrition segment revenues |
$ | 139,166 | $ | 64,838 | $ | 31,057 | ||||||
In 2015, revenues from specialty oils increased due to the inclusion of a full twelve months of revenues from Bioriginal Food & Science. Revenues from dairy protein products increased by 10% due to increased tera’s brand sales. Revenues from other nutraceuticals increased by 5%.
In 2014, revenues from specialty oils increased due to the acquisition of Bioriginal Food & Science in September. For a description of this acquisition, see Note 2 – Acquisition of Bioriginal Food & Science Corp to the consolidated financial statements included in Item 8. Revenues from dairy protein products increased slightly due to the inclusion of a full twelve months of revenues in 2014 compared to 2013. Revenues from other nutraceuticals decreased by 22% from 2013 to 2014 due to decreased demand of a particular product.
In 2013, dairy protein revenues represented $9.8 million due to the acquisition of WSP in February. For a description of this acquisition, see Note 3 – Acquisition of Wisconsin Specialty Protein, L.L.C to the consolidated financial statements included in Item 8.
Results of Operations
The following discussion segregates the financial results of the Company’s two industry segments: animal nutrition and human nutrition. For a discussion of the Company’s segments, see Note 17 to the consolidated financial statements included in Item 8.
Animal Nutrition - 2015 compared to 2014
| Years Ended December 31, | ||||||||||||
| 2015 | 2014 |
Increase |
||||||||||
| (in millions) | ||||||||||||
|
Revenues |
$ | 220.1 | $ | 243.8 | $ | (23.7 | ) | |||||
|
Cost of sales |
139.0 | 171.1 | (32.1 | ) | ||||||||
|
Gross profit |
81.1 | 72.7 | 8.4 | |||||||||
|
Selling, general and administrative expenses (including research and development) |
2.5 | 2.2 | 0.3 | |||||||||
|
Loss related to plant closure |
2.1 | 7.1 | (5.0 | ) | ||||||||
|
Other (gains) and losses |
0.9 | 0.3 | 0.6 | |||||||||
|
Operating income |
$ | 75.6 | $ | 63.1 | $ | 12.5 | ||||||
Revenues. Animal nutrition related revenues decreased $23.7 million, or 9.7%, from $243.8 million in 2014 to $220.1 million in 2015. The decrease in animal nutrition related revenues was primarily due to decreased sales volumes of 45.3% for the Company’s fish oil, partially offset by increased sales prices of 24.1% and 3.3% for the Company’s fish oil and fish meal, respectively, and increased sales volumes of 0.2% for the Company’s fish meal. Considering fish meal, fish oil and fish solubles sales activities in total, the Company experienced a $38.7 million decrease in revenues due to the decrease in sales volumes partially offset by a $15.0 million increase in revenues caused by increased sales prices in 2015 as compared to 2014. The decrease in fish oil sales volumes is primarily due to the timing of contracts and reduced 2015 beginning of period inventory volumes due to decreased fish oil production during the 2014 fishing season compared to the 2013 fishing season. The increase in fish oil and fish meal sales prices is mainly a reflection of the prevailing market conditions and prices when underlying sales contracts were executed. The increase in fish oil sales prices is also due to a change in the product mix related to a larger relative volume of refined fish oil sales during 2015.
Cost of sales. Animal nutrition related cost of sales, including depreciation and amortization, for 2015 was $139.0 million, a decrease of $32.1 million, or 18.8%, as compared to 2014. Cost of sales as a percentage of revenues was 63.3% for 2015 as compared to 70.2% for 2014. The decrease in cost of sales as a percentage of revenues was primarily the result of increased revenue per unit of 4.5% and a decreased cost per unit of sales of 5.9% during 2015 as compared 2014. The increase in revenue per unit is primarily due to increased fish oil sales prices as discussed above. The decrease in cost per unit of sales is primarily due to higher fish catch and production in the 2015 fishing season compared to the 2014 fishing season.
Gross profit. Animal nutrition related gross profit increased $8.4 million, or 11.7%, from $72.7 million for 2014 to $81.1 million for 2015. Gross profit as a percentage of revenue was 36.8% for the 2015 as compared to 29.8% for 2014. The increase in gross profit as a percentage of revenue was primarily due to the increase in revenue per unit and decreased cost per unit of sales as discussed above.
Selling, general and administrative expenses. Animal nutrition related selling, general and administrative expenses increased $0.3 million to $2.5 million for 2015 as compared to 2014. The increase in selling, general and administrative expenses is primarily due to increased labor expenses during 2015 as compared 2014.
Loss related to plant closure. As a result of the closing of the Cameron, Louisiana fish processing plant, the Company recognized an ongoing loss on closure of approximately $2.1 million in 2015 primarily related to the relocation of certain Cameron facility assets and other closure costs not related to future inventory production. The Company recognized an ongoing loss on closure of approximately $7.1 million in 2014 related to impairment and relocation of property, plant and equipment, employee severances and other closure costs not related to future inventory production.
Other (gains) and losses. The Company recorded animal nutrition losses for 2015 and 2014 of $0.9 million and $0.3 million, respectively, primarily relating to the disposal of unused fishing vessels.
Human Nutrition - 2015 compared to 2014
| Years Ended December 31, | ||||||||||||
| 2015 | 2014 |
Increase |
||||||||||
|
(in millions) |
||||||||||||
|
Revenues |
$ | 139.2 | $ | 64.8 | $ | 74.4 | ||||||
|
Cost of sales |
121.4 | 59.9 | 61.5 | |||||||||
|
Gross profit |
17.8 | 4.9 | 12.9 | |||||||||
|
Selling, general and administrative expenses (including research and development) |
19.8 |
11.1 | 8.7 | |||||||||
|
Loss related to plant closure |
4.5 | — | 4.5 | |||||||||
|
Impairment of goodwill, other intangible assets and other |
5.5 | 4.9 | 0.6 | |||||||||
|
Operating loss |
$ | (12.0 | ) | $ | (11.1 | ) | $ | (0.9 | ) | |||
Revenues. Human nutrition revenues increased $74.4 million, or 114.6%, from $64.8 million for 2014 to $139.2 million for 2015, due primarily to increased sales of specialty oils following the acquisition of Bioriginal Food & Science in September 2014. Specialty oils added $113.6 million (including $4.9 million from menhaden omega-3 concentrates and tolling) of revenue in 2015 compared to $41.1 million (including $4.5 million from menhaden omega-3 concentrates and tolling) in 2014. Protein products increased to $12.9 million of revenue during 2015 from $11.7 million during 2014. Other nutraceutical ingredients provided $12.6 million of revenue during 2015 as compared to $12.0 million during 2014.
Cost of sales. Human nutrition cost of sales, including depreciation and amortization, for 2015 was $121.4 million, a $61.5 million increase, or 102.7%, as compared to 2014, due primarily to increased sales of specialty oils following the Bioriginal Food & Science acquisition. Human nutrition cost of sales as a percentage of revenue decreased from 92.3% for 2014 to 87.2% for 2015. Specialty oils added $99.6 million (including $7.9 million from menhaden omega-3 concentrates and tolling) and $40.1 million (including $7.3 million from menhaden omega-3 concentrates and tolling) of cost of sales during 2015 and 2014, respectively. Specialty oils cost of sales for 2014 was negatively impacted by the one time inventory write-up to fair value that was made in conjunction with the Company’s acquisition of Bioriginal Food & Science.
Protein products cost of sales was $13.9 million for 2015 as compared to $12.6 million during 2014. Other nutraceutical ingredients cost of sales was $7.9 million during 2015 as compared to $7.3 million for 2014. The increase in protein products and other nutraceutical ingredients cost of sales was mainly attributed to increased sales.
Gross profit. Human nutrition gross profit increased $12.9 million, or 258.1%, from $4.9 million for 2014 to $17.8 million for 2015. Gross profit as a percentage of revenue was 12.8% for 2015 as compared to 7.7% for 2014. The increase in gross profit as a percentage of revenue was primarily due to increased specialty oils revenues and gross profit as a percentage of revenues.
Selling, general and administrative expenses. Human nutrition selling, general and administrative expenses increased $8.7 million, from $11.1 million in 2014 to $19.8 million in 2015. The increase in selling, general and administrative expenses is primarily due to the acquisition of Bioriginal Food & Science.
Loss related to plant closure. As a result of the planned closing of the Batavia, Illinois oil concentration facility, the Company recognized a charge of $4.5 million primarily related to the impairment of property, plant and equipment during 2015. No such charge was recognized during 2014.
Impairment of goodwill, other intangible assets and other. Human nutrition impairment and other costs was $5.5 million for 2015 due primarily to impairment charges of $4.5 million related to the excess of carrying value over fair value for goodwill and certain other indefinite lived intangible assets at the InCon and Cyvex reporting unit. Additionally, WSP had an asset impairment charge of approximately $0.9 million recognized in 2015. Human nutrition impairment and other costs was $4.9 million for 2014 due primarily to impairment expenses of $4.7 million related to the excess of carrying value over fair value for goodwill and certain other indefinite lived intangible assets at the InCon and Cyvex reporting unit.
Unallocated - 2015 compared to 2014
| Years Ended December 31, | ||||||||||||
| 2015 | 2014 |
Increase |
||||||||||
| (in millions) | ||||||||||||
|
Selling, general and administrative expenses (including research and development) |
$ | 21.9 | $ | 20.4 | 1.5 | |||||||
Selling, general and administrative expenses (including research and development). Unallocated selling, general and administrative expenses increased $1.5 million, or 7.2%, from $20.4 million for 2014 to $21.9 million for 2015. The increase in selling, general and administrative expenses during 2015 as compared to 2014 is primarily due to increases in expenses related to professional services, research and development, and labor, partially offset by the absence of professional expenses in 2015 related to the acquisition of Bioriginal Food & Science in September 2014.
Other non-segmented results of operation - 2015 compared to 2014
Interest expense. Interest expense was $1.5 million for 2015 as compared to $1.3 million for 2014. The increase in interest expense is primarily due to a full year of increased borrowings associated with the acquisition of Bioriginal Food & Science in September 2014. Capitalized interest, which offsets interest expense, was $0.6 million for 2015 and 2014.
(Loss) on foreign currency. The Company recorded a $1.2 million loss and a $0.3 million gain on foreign currency in 2015 and 2014, respectively, related to transactions associated with Bioriginal Food & Science Canadian operations being denominated in local currency, the Canadian Dollar.
Provision for income taxes. The Company recorded a $14.6 million provision for income taxes 2015 representing an effective tax rate of 37.9% for income taxes compared to 38.9% for 2014. The decrease in the effective tax rate during 2015 is primarily a result of non-recurring expenses realized during 2014 related to the acquisition of Bioriginal Food & Science that were not deductible for tax purposes. The statutory tax rate of 35% for U.S. federal taxes was in effect for 2015 and 2014.
Animal Nutrition - 2014 compared to 2013
| Years Ended December 31, | ||||||||||||
| 2014 | 2013 |
Increase (Decrease) |
||||||||||
| (in millions) | ||||||||||||
|
Revenues |
$ | 243.8 | $ | 213.2 | $ | 30.6 | ||||||
|
Cost of sales |
171.1 | 136.1 | 35.0 | |||||||||
|
Gross profit |
72.7 | 77.1 | (4.4 | ) | ||||||||
|
Selling, general and administrative expenses (including research and development) |
2.2 | 2.8 | (0.6 | ) | ||||||||
|
Loss related to plant closure |
7.1 | 6.6 | 0.5 | |||||||||
|
Other (gains) and losses |
0.3 | 0.1 | 0.2 | |||||||||
|
Operating income |
$ | 63.1 | $ | 67.6 | $ | (4.5 | ) | |||||
Revenues. Animal nutrition revenues increased $30.6 million, or 14.3%, from $213.2 million in 2013 to $243.8 million in 2014. The increase in animal nutrition related revenues was primarily due to increased sales volumes of 45.6% and 1.1% for the Company’s fish oil and fish meal, respectively, and increased sales prices of 2.2% for the Company’s fish meal, partially offset by decreased sales prices of 4.0% for the Company fish oil. Considering fish meal, fish oil and fish solubles sales activities in total, the Company experienced approximately a $28.4 million increase in revenues due to the increase in sales volumes and a $2.2 million increase in revenues caused by increased sales prices, when comparing 2014 and 2013. The increase in fish oil sales volumes is primarily due to the timing of contracts and increased available fish oil inventory carried into 2014 due to the high fish oil yields experienced in 2013. The decrease in fish oil sales prices is primarily due to a change in product mix related to a larger relative volume of unrefined fish oil sales during 2014.
Cost of sales. Animal nutrition cost of sales, including depreciation and amortization, for 2014 was $171.1 million, an increase of $35.0 million, or 25.7%, as compared to 2013. Cost of sales as a percentage of revenues was 70.2% for 2014 as compared to 63.8% for 2013. The increase in cost of sales as a percentage of revenues was primarily the result of increased cost per unit of sales of 12.6%, partially offset by increased revenue per unit of 2.6%, during 2014 as compared to 2013. The increase in cost per unit of sales during 2014 is primarily due to a combination of product mix, as higher cost fish oil comprised a larger percentage of total sales volumes, and higher overall cost per unit, due to decreased fish oils yields and slower than anticipated early season fish catch in 2014. The increase in revenue per unit is primarily due to a greater percentage of revenue related to fish oil sales volumes, as fish oil generally has higher sales prices than fish meal.
Gross profit. Animal nutrition gross profit decreased $4.4 million, or 5.8%, from $77.1 million for 2013 to $72.7 million for 2014. Gross profit as a percentage of revenue was 29.8% for 2014 as compared to 36.2% for 2013. The decrease in gross profit as a percentage of revenue was primarily due to the impact of decreased fish oil yields and slower than anticipated early season fish catch in 2014 on cost per unit of sales as discussed above.
Selling, general and administrative expenses. Animal nutrition selling, general and administrative expenses decreased $0.6 million from $2.8 million for 2013 to $2.2 million for 2014. The decrease is largely due to decreased professional services costs.
Loss related to plant closure. As a result of the closing of the Cameron, Louisiana fish processing plant, the Company recognized an ongoing loss on closure of approximately $7.1 million in 2014 related to the impairment and relocation of certain additional assets at the Cameron facility, the future use of which was previously uncertain, employee severances and other closure costs not related to future inventory production. The Company recognized a loss on closure of approximately $6.6 million in 2013 related to the impairment of harvesting and processing assets, employee severances and other ongoing closure costs not related to future inventory production.
Other (gains) and losses. The Company recorded animal nutrition losses for 2014 of $0.3 million primarily relating to the disposal of unused fishing vessels. The Company recorded animal nutrition losses for 2013 of $0.1 million primarily relating to a $0.3 million reduction in an insurance receivable associated with the 2011 F/V Sandy Point incident, partially offset by the receipt of other insurance proceeds related to fully depreciated assets.
Human Nutrition - 2014 compared to 2013
| Years Ended December 31, | ||||||||||||
| 2014 | 2013 |
Increase (Decrease) |
||||||||||
| (in millions) | ||||||||||||
|
Revenues |
$ | 64.8 | $ | 31.1 | $ | 33.7 | ||||||
|
Cost of sales |
59.9 | 25.4 | 34.5 | |||||||||
|
Gross profit |
4.9 | 5.7 | (0.8 | ) | ||||||||
|
Selling, general and administrative expenses (including research and development) |
11.1 | 7.0 | 4.1 | |||||||||
|
Impairment of goodwill, other intangible assets and other |
4.9 | 0.3 | 4.6 | |||||||||
|
Operating loss |
$ | (11.1 | ) | $ | (1.6 | ) | $ | (9.5 | ) | |||
Revenues. Human nutrition revenues increased $33.7 million, or 108.8%, from $31.1 million for 2013 to $64.8 million of revenue for 2014, due primarily to increased sales of specialty oils following the acquisition of Bioriginal Food & Science in September 2014. Specialty oils added $41.1 million (including $4.5 million from menhaden omega-3 concentrates and tolling) and $5.8 million (including $5.3 million from menhaden omega-3 concentrates and tolling) of revenue during 2014 and 2013, respectively. Protein products from WSP contributed $11.7 million of revenue during 2014 as compared to $9.8 million for 2013. The increase in protein products revenue was due to a full twelve month results in 2014 as well as increased branded product sales partially offset by lower sales volumes on bulk ingredients. Other nutraceutical ingredients provided $12.0 million of revenue during 2014 as compared to $15.5 million during 2013.
Cost of sales. Human nutrition cost of sales, including depreciation and amortization, for 2014 was $59.9 million, a $34.5 million increase, or 135.7%, as compared to 2013. Human nutrition cost of sales as a percentage of revenue increased from 81.8% for 2013 to 92.3% for 2014. Specialty oils added $40.1 million (including $7.3 million from menhaden omega-3 concentrates and tolling) and $8.5 million (including $8.2 million from menhaden omega-3 concentrates and tolling) of cost of sales during 2014 and 2013, respectively. Cost of sales for specialty oils was negatively impacted by the one time inventory write-up to fair value that was made in conjunction with Bioriginal Food & Science being acquired by the Company in September 2014.
Protein products cost of sales was $12.6 million for 2014 as compared to $7.4 million during 2013. The increase in protein products cost of sales was attributed to various factors including increased raw material costs and higher revenues as well as start-up costs and initial inefficiencies associated with the recent plant expansion. Other nutraceutical ingredients cost of sales was $7.3 million during 2014 as compared to $9.5 million for 2013, due to the decrease in the revenue volume.
Gross profit. Human nutrition gross profit decreased $0.8 million, or 12.3%, from $5.7 million for 2013 to $4.9 million for 2014. Gross profit as a percentage of revenue was 7.7% for 2014 as compared to 18.2% for 2013. The decrease in gross profit as a percentage of revenue was primarily due to a decreased gross profit as a percentage of revenue for protein products and the addition of Bioriginal Food & Science including its one time acquisition-related inventory write-up to fair value.
Selling, general and administrative expenses. Human nutrition selling, general and administrative expenses increased $4.1 million, or 60.2%, from $7.0 million for 2013 to $11.1 million for 2014. The increase in selling, general and administrative expenses is primarily due to the acquisition of Bioriginal Food & Science in September 2014.
Impairment of goodwill, other intangible assets and other. Human nutrition impairment and other costs increased $4.6 million from $0.3 million for 2013 to $4.9 million for 2014 due primarily to impairment expenses of $4.7 million related to the excess of carrying value over fair value for goodwill and certain other indefinite lived intangible assets at the InCon and Cyvex reporting unit.
Unallocated - 2014 compared to 2013
| Years Ended December 31, | ||||||||||||
| 2014 | 2013 |
Increase (Decrease) |
||||||||||
| (in millions) | ||||||||||||
|
Selling, general and administrative expenses (including research and development) |
$ | 20.4 | $ | 18.0 | 2.4 | |||||||
Selling, general and administrative expenses (including research and development). Unallocated selling, general and administrative expenses increased $2.4 million, or 13.3%, from $18.0 million for 2013 to $20.4 million for 2014. The increase in selling, general and administrative expenses is primarily due to professional services expenses related to the acquisition of Bioriginal Food & Science in September 2014, partially offset by professional services expenses related to the acquisition of WSP in February 2013.
Other non-segmented results of operation - 2014 compared to 2013
Interest expense. Interest expense was $1.3 million for 2014 as compared to $1.6 million for 2013. Bioriginal Food & Science accounted for $0.3 in interest expense during 2014. Capitalized interest, which offsets interest expense, was $0.6 million and $0.3 million for 2014 and 2013, respectively.
(Loss) on foreign currency. Gain on foreign currency related to Bioriginal Food & Science was $0.3 million for 2014. No such gain for recognized for 2013.
Provision for income taxes. The Company recorded an $11.7 million provision for income taxes for 2014 representing an effective tax rate of 38.9% for income taxes compared to 33.6% for 2013. The increase in the effective tax rate is primarily a result of non-recurring expenses related to the acquisition of Bioriginal Food & Science that were not deductible for tax purposes. Additionally, the effective rate was adversely impacted by a lower qualified production activities deduction due to bonus tax depreciation. The statutory tax rate of 35% for U.S. federal taxes was in effect for 2014 and 2013.
Liquidity and Capital Resources
The Company’s primary sources of liquidity and capital resources have been cash flows from operations and bank credit facilities. These sources of cash flows have been used for operations, capital expenditures, payment of long-term debt, business acquisitions, purchases of fish meal and fish oil and the purchase and retirement of shares of the Company’s common stock.
At December 31, 2015, the Company had an unrestricted cash balance of $0.7 million, a decrease of $0.8 million from December 31, 2014. Omega Protein’s annual revenues and its resulting liquidity are highly dependent on annual fish catch, production yields, selling prices for its products and inventories available for sale. Omega Protein’s average selling price for its animal nutrition products for 2015 was 4.5% higher than its average selling price for 2014. Additionally, Omega Protein’s average per unit cost of sales for its animal nutrition ingredients for 2015 was 5.9% lower than its average per unit cost of sales for 2014.
The aggregate amount of the Company’s outstanding indebtedness as of December 31, 2015 was $24.1 million compared to $35.2 million as of December 31, 2014. The Company has a moderately leveraged financial structure which could limit its financial flexibility. In particular, the Company will be required to use a portion of its cash flows to pay principal and interest on its debt, which will reduce the amount of money the Company has for operations, capital expenditures, expansion, acquisitions or general corporate or other business activities. In addition, the covenants contained in the Company’s debt agreements limit its ability to borrow money in the future for acquisitions, capital expenditures or to meet the Company’s operating expenses or other general corporate obligations. See “Item 1A. Risk Factors - The Company has a moderate amount of indebtedness, which may adversely affect its ability to operate its business, remain in compliance with debt covenants and make payments on its debt.”
As of December 31, 2015, the Company has contracted through energy swap derivatives or physical contracts a portion of its estimated 2016 and 2017 energy use.
Source of Capital: Operations
Net cash flow provided by operating activities decreased from approximately $64.9 million for the year ended December 31, 2014 to $40.6 million for the year ended December 31, 2015. The decrease in operating cash flow is primarily attributable to changes in working capital driven by normal business operations including more production and ending animal nutrition segment inventory due to increased fish catch and timing of contracts along with dairy protein inventory in 2015 as compared to 2014.
Source of Capital: Debt
Net financing activities used cash of $6.7 million and $7.3 million during years ended December 31, 2015 and 2014, respectively. The year ended December 31, 2015 included $67.6 million in debt principal payments, $56.7 million in debt principal borrowings, $7.1 million in proceeds and tax effects received from stock options exercised, $1.0 million in debt issuance costs related to the refinancing of credit facilities and $1.9 million in stock repurchases relating to employee returns of restricted stock to the Company in satisfaction of withholding taxes. The year ended December 31, 2014 included $3.4 million in proceeds and tax effects received from stock options exercised, $0.6 million related to treasury stock repurchases, $35.1 million in debt principal payments and $25.0 million in debt principal borrowings.
In June 2011, pursuant to the Title XI program, the FFP approved a financing application made by the Company in the amount of $10 million (the “Approval Letter”) which expires on June 20, 2016. To date, the Company has not borrowed any amounts under the Approval Letter and its ability to do so has been adversely affected by an E.P.A. notice that the Company’s Omega Protein subsidiary is ineligible, as a result of its previous convictions under the Clean Water Act, for receipt of government contracts or benefits in certain cases. See “Item 1A. Risk Factors” for further detail on this E.P.A. notice. As of December 31, 2015, the Company had no borrowings outstanding under Title XI.
On August 20, 2015 (the “Closing Date”), the Company and certain subsidiaries entered into a Second Amended and Restated Loan Agreement (the “Loan Agreement”) with Wells Fargo Bank, National Association, as administrative agent (the “Agent”) for the lenders (currently Wells Fargo Bank, N.A., JP Morgan Chase Bank, N.A. and BMO Harris Bank, N.A.) (collectively, the “Lenders”) pursuant to which the Lenders agreed to extend credit to the Company in the form of loans (each a “Loan” and collectively, the “Loans”) on a revolving basis of up to $125.0 million in the aggregate (the “Commitment”), with $95.0 million of such Commitment allocated to Revolving A Loans to be made to the Company or Omega Protein in U.S. Dollars or Alternative Currencies (as such term is defined in the Loan Agreement) and $30.0 million of such Commitment allocated to Revolving B Loans to be made to the Company and certain subsidiaries, including Bioriginal Food & Science, in U.S. Dollars or Canadian Dollars. The Commitment includes a sub-facility for swingline loans up to an amount not to exceed $10.0 million, a sub-facility for standby letters of credit issued for the account of the Company or Omega Protein up to an amount not to exceed $20.0 million, a sub-facility for standby or commercial letters of credit issued for the account of Bioriginal Food & Science up to an amount not to exceed $7.5 million (subject to a temporary increase of $9.0 million), and an accordion feature that allows the Company to increase the amount of the Commitment up to an additional $75.0 million, subject to the further commitments of the Lenders and other customary conditions precedent. The Loan Agreement amended and restated the Company’s existing senior secured credit facility (the “Prior Loan Agreement”). The proceeds of the Loan Agreement were and will be used to (a) refinance existing debt under the Prior Loan Agreement, (b) pay fees and expenses incurred in connection with the refinancing of the Prior Loan Agreement and the entry into the Loan Agreement, (c) refinance certain debt owing to HSBC Bank Canada pursuant to an agreement that has been terminated, and (d) provide ongoing working capital and for other general corporate purposes of the Company and its subsidiaries.
Any Loans will bear interest as follows:
|
● |
Revolving A Loans and Revolving B Loans denominated in U.S. Dollars will bear interest, at the election of the Company, at (a) the Base Rate (defined as a fluctuating rate equal to the highest of: (x) the rate of interest most recently announced by the Agent as its “prime rate,” (y) the Federal Funds Rate plus 1.00% and (z) a rate determined by the Agent to be 1.50% above daily one month LIBOR (except during certain periods of time)) plus the Applicable Margin (as defined in the Loan Agreement), or (b) a rate per annum determined by the Agent to be equal to LIBOR in effect for the applicable interest period plus the Applicable Margin. |
|
● |
Revolving A Loans denominated in Alternative Currencies will bear interest at a rate per annum determined by the Agent to be equal to LIBOR in effect for the applicable interest period plus the Applicable Margin. |
|
● |
Revolving B Loans denominated in Canadian Dollars will bear interest at (a) the Canadian Prime Rate (defined as a fluctuating rate equal to the highest of (y) the rate of interest most recently announced by the Agent as its reference rate in effect for determining interest rates for Canadian Dollar denominated commercial loans in Canada and (z) a rate determined by the Agent to be 1.50% above daily one month CDOR plus the Applicable Margin) or (b) CDOR plus the Applicable Margin. |
|
● |
Swingline Loans shall bear interest at the Base Rate plus the Applicable Margin. |
All obligations of the Company under the Loan Agreement are secured by a first priority lien (subject to Permitted Liens, as defined in the Loan Agreement) against all assets of each of the Company and certain subsidiaries (other than certain excluded property, including property pledged to secure loans from the national fisheries finance program). Collateral provided by (a) the Company and its U.S.-domiciled subsidiaries shall guarantee or secure, as applicable, all of the obligations under the Loan Agreement and other Loan Documents and (b) Bioriginal Food & Science and, if applicable, its subsidiaries, shall only guarantee or secure, as applicable, obligations of Bioriginal Food & Science in respect of Revolving B Loans.
The Loan Agreement requires the Company to comply with various affirmative and negative covenants affecting the Company’s businesses and operations. In addition, the Loan Agreement requires the Company to comply with the following financial covenants:
|
● |
The Company is required to maintain on a consolidated basis Tangible Net Worth equal to at least the sum of the following: (a) $170,000,000, plus (b) 50% of net income (if positive, with no deduction for losses) earned in each quarterly accounting period commencing after December 31, 2014, plus (c) 75% of the net proceeds from any Equity Interests (as defined in the Loan Agreement) issued after the Closing Date, plus (d) 100% of any increase in stockholders’ equity resulting from the conversion of debt securities to Equity Interests after the Closing Date. |
|
● |
The Company is required to maintain on a consolidated basis a Consolidated Total Leverage Ratio of not greater than 3.00 to 1.00. This ratio will be calculated at the end of each fiscal quarter. |
|
● |
The Company is required to maintain on a consolidated basis a Consolidated Fixed Charge Coverage Ratio of at least 1.25 to 1.00. This ratio will be calculated at the end of each fiscal quarter. |
All Loans and all other obligations outstanding under the Loan Agreement shall be payable in full in August 2020.
As of December 31, 2015 and December 31, 2014, the Company had $22.9 million and $2.0 million outstanding under the Loan Agreement and Prior Loan Agreement, respectively, and approximately $7.8 million and $3.5 million in letters of credit as of December 31, 2015 and 2014, respectively, net of $4.3 million in back-to-back letters of credit in the process of being returned by its counterparty as of December 31, 2015. As of December 31, 2015, the Company was in compliance with all financial covenants under the Loan Agreement. The Company has no off-balance sheet arrangements other than normal operating leases and standby letters of credit. For a more detailed description of the Loan Agreement, see the Company’s Current Report on Form 8-K filed with the SEC on August 24, 2015.
In March 2015, Bioriginal Food & Science Europe extended the terms of its credit facility with ING Commercial Finance B.V. which provides borrowings up to an amount based on accounts receivable and inventory balances, and matures on March 31, 2018. Advances are repayable on demand and bear interest payable monthly at 1.75% + EURIBOR (currently 1.70%). This credit facility is secured by accounts receivable and inventory of Bioriginal Food & Science Europe to a maximum of 85% of accounts receivable and 60% of inventory. This credit facility contains cross default provisions and other covenants. As of December 31, 2015, $1.2 million was outstanding under this credit facility, which is included in current maturities.
In June 2010, Bioriginal Food & Science Europe entered into a credit facility with ING Bank N.V. which provides borrowings up to 250,000 Euro and matures on November 16, 2016. Under the credit facility, interest is paid at 2.70% plus the EURIBOR rate (currently 2.49%). This credit facility is secured by Bioriginal Food & Science Europe’s equipment. This facility contains cross default provisions and other covenants. As of December 31, 2015, there were no outstanding borrowings under this credit facility.
Uses of Capital: Investing (excluding Acquisitions)
The Company’s investing activities consist mainly of acquisition costs and capital expenditures for equipment purchases, replacements, vessel refurbishments, plant expansions, fish oil refining processes and technology. Net investing activities, without acquisition activities, used cash of $34.7 million and $43.8 million for the years ended December 31, 2015 and 2014, respectively. The Company made capital expenditures of approximately $34.9 million and $44.1 million, including $0.6 million and $0.6 million of capitalized interest, for the years ended December 31, 2015 and 2014, respectively. These capital expenditures included $16.1 million towards the expansion of its dairy protein production capabilities and $4.8 million to purchase the real property (which had been subject to an expiring operating lease) associated with Bioriginal Food & Science’s Saskatoon, Saskatchewan facility for the year ended December 31, 2014. The Company anticipates making approximately $40 million to $50 million in capital expenditures during 2016, excluding capitalized interest, primarily for the expansion of production capabilities, refurbishment of vessels and plant assets, regulatory and environmental requirements and for the repair of certain equipment. Additional investment opportunities or requirements may arise during the year, which could cause capital expenditures to exceed this range. Investing activities during 2015 and 2014 also includes $0.2 million and $0.3 million, respectively, in proceeds from the disposition of assets.
Use of Capital: Acquisitions
The Company from time to time considers potential transactions including, but not limited to, enhancement of physical facilities to improve production capabilities, the acquisition of other businesses and the repurchase of the Company’s common stock. Certain of the potential transactions reviewed by the Company would, if completed, result in its entering new lines of business, although historically, these opportunities have been generally related in some manner to the Company’s existing operations or which have added new nutritional products or capabilities to the Company’s product lines. Depending on the size of the acquisition, the Company would expect to finance the transaction using internally generated cash flows and its current credit agreements, or, if necessary, equity or new debt financings. The Company cannot assure that such financings will be available on acceptable terms, if at all.
On February 27, 2013, the Company acquired all of the outstanding equity of WSP in a cash transaction pursuant to the terms of a merger agreement. As of that date, WSP became a wholly owned subsidiary of the Company which is operated as part of Bioriginal and is included in the Company’s 2013 consolidated financial statements. The Company paid $26.7 million, net of cash received, in 2013 upon closing of the acquisition. See Note 3 – Acquisition of Wisconsin Specialty Protein, L.L.C to the consolidated financial statements in Item 8.
On September 5, 2014, the Company acquired all of the outstanding equity of Bioriginal Food & Science pursuant to the terms of a Share Purchase Agreement. Bioriginal Food & Science is now a wholly owned subsidiary of the Company. At closing, the Company assumed approximately $21.5 million of Bioriginal Food & Science’s indebtedness and paid an aggregate cash purchase price for the equity of Bioriginal Food & Science of $46.5 million and received $0.1 million during 2015 related to the finalization of the closing working capital adjustment. Of the cash purchase price amount, $14.0 million was initially funded by debt and $32.5 million was funded with cash on hand. See Note 2 – Acquisition of Bioriginal Food & Science Corp to the consolidated financial statements included in Item 8.
Use of Capital: Contractual Obligations
The following tables aggregate information about the Company’s contractual obligations and other commercial commitments (in thousands) as of December 31, 2015:
|
Payments Due by Period |
||||||||||||||||||||
|
Less than |
1 to 3 | 4 to 5 |
After 5 |
|||||||||||||||||
|
Contractual Obligations |
Total |
1 year |
years |
years |
years |
|||||||||||||||
|
Debt |
$ | 24,096 | $ | 1,214 | $ | — | $ | 22,882 | $ | — | ||||||||||
|
Interest on debt |
2,021 | 444 | 872 | 705 | — | |||||||||||||||
|
Operating lease obligations |
11,767 | 2,792 | 5,247 | 3,114 | 614 | |||||||||||||||
|
Pension funding (1) |
5,560 | 560 | 1,625 | 1,800 | 1,575 | |||||||||||||||
|
Total Contractual Obligations |
$ | 43,444 | $ | 5,010 | $ | 7,744 | $ | 28,501 | $ | 2,189 | ||||||||||
|
(1) |
Represents estimated future contributions to the plan based on the expected return on plan assets and assumptions regarding discount rates |
The Company believes that the existing cash, cash equivalents, cash flow from operations and funds available through the Loan Agreement described above will be sufficient to meet its working capital and capital expenditure requirements through the next twelve months.
Recently Issued Accounting Standards
For additional information on changes in accounting principles and new accounting principles, see Note 1 to the consolidated financial statements included in Item 8 – Financial Statements and Supplementary Data.
Critical Accounting Policies and Estimates
The methods, estimates and judgments used in applying the Company’s critical accounting policies have a significant impact on the results reported in the Consolidated Financial Statements. The SEC has defined the critical accounting policies as the ones that are most important to the portrayal of the Company’s financial condition and operating results, and requires the Company to make difficult and subjective judgments, often as a result of the need to make estimates of matters that are highly uncertain at the time of estimation. Based on this definition, the Company’s most critical policies include: valuation of inventory (Notes 1 and 6), valuation of losses related to Jones Act and worker’s compensation insurance claims (Note 1), valuation of income and deferred taxes (Notes 1 and 13), valuation of property, plant and equipment including impairments (Note 9), valuation of pension plan obligations (Notes 1 and 15), energy swap valuations (Notes 1) and the valuation of goodwill and other intangible assets (Notes 1 and 10).
Specifically with respect to fish related inventory, Omega Protein’s per unit cost of production is estimated prior to the beginning of each fishing season based on total estimated fishing costs (including off-season costs) divided by estimated total units of production. Omega Protein adjusts the cost of sales, unallocated inventory cost pool and inventory balances at the end of the second, third and fourth quarters based on revised estimates of total units of production to total inventoriable costs. For 2015 the cost per unit of production for the 2015 fishing season decreased 1.9% from the third quarter of 2015 to the fourth quarter of 2015 due to greater than anticipated fish catch and production. For the most part, Omega Protein begins selling its current season’s production during the second quarter and sells that production through the second quarter of the following year.
The Company does not amortize goodwill or indefinite-lived intangible assets but performs tests for impairment annually, or when indications of potential impairment exist, utilizing a fair value approach at the reporting unit level. The Company determines fair value using widely accepted valuation techniques, including the income approach which estimates the fair value of its reporting units based on the future discounted cash flows, and the market approach which estimates the fair value of its reporting units based on comparable market prices. In testing for a potential impairment of goodwill, the Company estimates the fair value of its reporting units to which goodwill relates and compares it to the carrying value (book value) of the assets and liabilities related to those businesses.
All of the Company’s goodwill and other intangible assets are the result of acquisitions in the human nutrition segment. This segment is comprised of three reporting units, 1) InCon and Cyvex, 2) WSP and 3) Bioriginal Food & Science. For the quantitative testing performed the following table summarizes the carrying amount of goodwill and other indefinite lived intangibles and the extent to which those values exceed their respective calculated fair values (in thousands):
|
Reporting Unit |
Goodwill |
Percent Fair Value Exceeds Carrying Value |
Other Indefinite Lived Intangibles |
Percent Fair Value Exceeds Carrying Value |
||||||||||||
|
InCon and Cyvex (1) |
$ | — | $ | 362 | 70 | % | ||||||||||
|
WSP (2) |
11,614 | 12 | % | 1,127 | 124 | % | ||||||||||
|
Bioriginal Food & Science (3) |
26,513 | 13 | % | 3,767 | 7 | % | ||||||||||
| $ | 38,127 | $ | 5,256 | |||||||||||||
|
(1) |
In conjunction with the impairment testing performed as of September 30, 2015 and December 31, 2015, goodwill and other indefinite lived intangibles were estimated to be impaired by $3.8 million and $0.6 million respectively. After these impairments were recorded, fair value approximated carrying value as of December 31, 2015. |
|
(2) |
Percentages based on impairment testing performed as of December 31, 2015. |
|
(3) |
The Company performed the first annual quantitative impairment testing of goodwill and indefinitely life intangible assets during the second quarter of 2015. |
Key assumptions in the fair value calculation of InCon and Cyvex include nutraceutical sales volumes and prices, the portion of sales attributable to trade names, production costs and the discount rate. Key assumptions in the fair value calculation of WSP include dairy protein product sales volumes and prices, the portion of sales attributable to the brand name, the cost and availability of raw materials and the discount rate. Key assumptions in the fair value calculation of Bioriginal Food & Science include sales volumes and prices, the portion of sales attributable to trade names, the cost and availability of raw materials and the discount rate. For InCon, Cyvex and WSP, the assessments of goodwill and other indefinite lived intangible assets are based on assumptions that require speculation and are highly subjective given the early stage and transitional nature of the businesses. The Company’s quantitative tests have assumed increasing cash flows over the next several years, based on anticipated sales growth and improved profitability. The Company’s ability to grow sales and improve profitability as expected is contingent on its ability to, among other factors, procure adequate supplies of raw materials, align product production and customer demand, and price product at appropriate margins above production or procurement costs. Considering the level of sensitivity with respect to the key assumptions, if the Company does not (i) ensure adequate supplies of raw materials, (ii) adequately anticipate changes in its customers’ demand for products, (iii) successfully penetrate new markets or (iv) price product at appropriate margins above production or procurement costs, its future cash flows may fail to meet the Company’s cash flow projections. If the cash flows decline sufficiently, the estimated fair values would be reduced and could potentially result in a material impairment in a subsequent period.
The Company utilizes the asset and liability method to account for income taxes. This method requires the recognition of deferred tax assets and liabilities for the expected future tax consequences of existing temporary differences between the financial reporting and tax reporting basis of assets and liabilities, and operating loss and tax credits carryforwards for tax purposes. The Company records a valuation allowance to reduce the deferred tax assets to the amount that is more likely than not to be realized. The Company believes that the deferred tax assets recorded as of December 31, 2015, net of the valuation allowance, are realizable through future reversals of existing taxable temporary differences and future taxable income. If the Company were to subsequently determine that it would be able to realize deferred tax assets in the future in excess of the net recorded amount, an adjustment to deferred tax assets would increase earnings for the period in which such determination was made. The Company will continue to assess the adequacy of the valuation allowance on a quarterly basis. Any changes to the estimated valuation allowance could be material to the consolidated financial condition and results of operations.
The Company also has other key accounting policies and accounting estimates relating to the allowance of doubtful accounts (Note 1), valuation of shares-based compensation (Note 15) and interest rate and energy swap valuations (Notes 1). The Company believes that these key accounting policies and accounting estimates either do not generally require the Company to make estimates and judgments that are as difficult or as subjective as its critical accounting policies, or it is less likely that they would have a material impact on the Company’s reported results of operations for a given period.
For all financial statement periods presented, there have been no material modifications to the application of these critical accounting policies.
Seasonal and Quarterly Results
Omega Protein’s menhaden harvesting and processing business is seasonal in nature. Omega Protein generally has higher sales during the third quarter of each fiscal year due to increased product availability and customer demand. Additionally, due to differences in gross profit margins for Omega Protein’s various products, any variation in the mix of product sales between quarters may result in significant variations of total gross profit margins. These margins may also be affected by changes in costs from year to year and month to month, which includes variations in production yields. Similarly, from time to time Omega Protein defers sales of inventory, which may affect comparable period comparisons. As a result, the Company’s quarterly operating results have fluctuated in the past and may fluctuate in the future.
In addition, inventory is generally carried over from one year to the next year, and Omega Protein generally begins selling its current season’s production late in the second quarter and sells that production until the second quarter of the following year. Costs can change meaningfully from one season to the next. For example, increased fish catch and changes in cost components of Omega Protein’s 2015 production resulted in lower standard costs for inventory for that season as compared to 2014 production. This resulted in a decrease in per unit cost of production of 5.9%.
Further, Omega Protein’s per unit cost of production is estimated prior to the beginning of each fishing season based on total estimated fishing costs (including off-season costs) divided by estimated total units of production. Omega Protein adjusts the cost of sales, unallocated inventory cost pool and inventory balances at the end of the second, third and fourth quarters based on revised estimates of total units of production to total inventoriable costs. Changes in estimates from one quarter to the next can have a significant impact on operating results. As an example, gross profit as a percentage of revenues for the quarter ended December 31, 2013 increased substantially as compared to the previous three quarters of 2013. This increase was due to greater than estimated inventory production after September 30, 2013. As a result, standard cost for 2013 inventory, for which sales commenced largely in the third quarter of 2013, was decreased and all previous sales of 2013 inventory production were adjusted during the quarter ended December 31, 2013. The impact of the change in standard cost to the quarter ended December 31, 2013 was estimated to be approximately $4 million. Similarly, but to a lesser degree, for the quarter ended December 31, 2015, standard cost for 2015 inventory, for which sales commenced largely in the third quarter of 2015, was decreased and all previous sales of 2015 inventory production were adjusted during the quarter ended December 31, 2015. The impact of the change in standard cost to the quarter ended December 31, 2015 is estimated to be approximately $1.4 million.
Item 7A. Quantitative and Qualitative Disclosure About Market Risk.
In the normal course of business, the financial condition of the Company is exposed to minimal market risk associated with interest rate movements on the Company’s borrowings. In the past, to mitigate this risk, the Company has entered into interest rate swap agreements to effectively lock-in the LIBOR component of certain debt instruments. However, no interest rate swap agreements are currently in effect. As of December 31, 2015, $24.1 million of the Company’s indebtedness was subject to variable interest rates. A one percent increase or decrease in the levels of interest rates on variable rate debt would not result in a material change to the Company’s results of operations.
The Company is exposed to market risk associated with diesel, natural gas, propane and potentially Bunker C fuel oil. To partially mitigate this risk, the Company has forward purchased a portion of its expected diesel and natural gas usage for 2016 and 2017. For 2016, the Company is exposed to market risk associated with increases in diesel, natural gas, propane and potentially Bunker C fuel oil prices related to the portion not covered by swaps or held in material and supplies inventory as of December 31, 2015. As an example, if energy prices related to these products were to increase by 10%, the energy cost related to the exposed portion would increase approximately $0.2 million, thus impacting the cost per unit of production.
Although the Company sells products in foreign countries, most of the Company’s revenues and costs are billed and paid for in US dollars. As a result, management does not believe that the Company is exposed to significant foreign country currency exchange risk. The Company had not historically utilized market risk sensitive instruments to manage its exposure to this risk but began to do so to a limited extent in 2015.
For a more complete discussion of risk factors, please see Item 1A. Risk Factors.
Item 8. Financial Statements and Supplementary Data.
Report of Independent Registered Public Accounting Firm
To the Board of Directors and Shareholders of Omega Protein Corporation:
In our opinion, the consolidated financial statements listed in the index appearing under Item 15(a)(1) present fairly, in all material respects, the financial position of Omega Protein Corporation and its subsidiaries (the “Company”) at December 31, 2015 and 2014, and the results of their operations and their cash flows for each of the three years in the period ended December 31, 2015 in conformity with accounting principles generally accepted in the United States of America. In addition, in our opinion, the financial statement schedule listed in the index appearing under Item 15 (a)(2) presents fairly, in all material respects, the information set forth therein when read in conjunction with the related consolidated financial statements. Also in our opinion, the Company maintained, in all material respects, effective internal control over financial reporting as of December 31, 2015, based on criteria established in Internal Control - Integrated Framework issued by the Committee of Sponsoring Organizations of the Treadway Commission (COSO) in 2013. The Company's management is responsible for these financial statements and financial statement schedule, for maintaining effective internal control over financial reporting and for its assessment of the effectiveness of internal control over financial reporting, included in Management's Report on Internal Control over Financial Reporting under Item 9A. Our responsibility is to express opinions on these financial statements, on the financial statement schedule, and on the Company's internal control over financial reporting based on our integrated audits. We conducted our audits in accordance with the standards of the Public Company Accounting Oversight Board (United States). Those standards require that we plan and perform the audits to obtain reasonable assurance about whether the financial statements are free of material misstatement and whether effective internal control over financial reporting was maintained in all material respects. Our audits of the financial statements included examining, on a test basis, evidence supporting the amounts and disclosures in the financial statements, assessing the accounting principles used and significant estimates made by management, and evaluating the overall financial statement presentation. Our audit of internal control over financial reporting included obtaining an understanding of internal control over financial reporting, assessing the risk that a material weakness exists, and testing and evaluating the design and operating effectiveness of internal control based on the assessed risk. Our audits also included performing such other procedures as we considered necessary in the circumstances. We believe that our audits provide a reasonable basis for our opinions.
A company’s internal control over financial reporting is a process designed to provide reasonable assurance regarding the reliability of financial reporting and the preparation of financial statements for external purposes in accordance with generally accepted accounting principles. A company’s internal control over financial reporting includes those policies and procedures that (i) pertain to the maintenance of records that, in reasonable detail, accurately and fairly reflect the transactions and dispositions of the assets of the company; (ii) provide reasonable assurance that transactions are recorded as necessary to permit preparation of financial statements in accordance with generally accepted accounting principles, and that receipts and expenditures of the company are being made only in accordance with authorizations of management and directors of the company; and (iii) provide reasonable assurance regarding prevention or timely detection of unauthorized acquisition, use, or disposition of the company’s assets that could have a material effect on the financial statements.
Because of its inherent limitations, internal control over financial reporting may not prevent or detect misstatements. Also, projections of any evaluation of effectiveness to future periods are subject to the risk that controls may become inadequate because of changes in conditions, or that the degree of compliance with the policies or procedures may deteriorate.
/s/PricewaterhouseCoopers LLP
Houston, Texas
March 9, 2016
OMEGA PROTEIN CORPORATION
CONSOLIDATED BALANCE SHEETS
|
December 31, 2015 |
December 31, 2014 |
|||||||
|
(in thousands) |
||||||||
|
ASSETS |
||||||||
|
Current assets: |
||||||||
|
Cash and cash equivalents |
$ | 661 | $ | 1,430 | ||||
|
Receivables, net |
40,489 | 36,621 | ||||||
|
Inventories |
119,994 | 97,513 | ||||||
|
Deferred tax asset, net |
3,422 | 1,871 | ||||||
|
Prepaid expenses and other current assets |
4,496 | 4,936 | ||||||
|
Total current assets |
169,062 | 142,371 | ||||||
|
Property, plant and equipment, net |
176,089 | 169,932 | ||||||
|
Goodwill |
38,127 | 42,501 | ||||||
|
Other intangible assets, net |
20,107 | 23,002 | ||||||
|
Other assets, net |
3,818 | 2,309 | ||||||
|
Total assets |
$ | 407,203 | $ | 380,115 | ||||
|
LIABILITIES AND STOCKHOLDERS’ EQUITY |
||||||||
|
Current liabilities: |
||||||||
|
Current maturities of long-term debt |
$ | 1,214 | $ | 14,741 | ||||
|
Accounts payable |
15,876 | 21,443 | ||||||
|
Accrued liabilities |
33,254 | 23,216 | ||||||
|
Total current liabilities |
50,344 | 59,400 | ||||||
|
Long-term debt, net of current maturities |
22,882 | 20,486 | ||||||
|
Deferred tax liability, net |
27,844 | 25,949 | ||||||
|
Pension liabilities, net |
6,048 | 5,375 | ||||||
|
Other long-term liabilities |
4,915 | 3,023 | ||||||
|
Total liabilities |
112,033 | 114,233 | ||||||
|
Commitments and contingencies |
||||||||
|
Stockholders’ equity: |
||||||||
|
Preferred stock, $0.01 par value; 10,000,000 authorized shares; none issued |
— | — | ||||||
|
Common Stock, $0.01 par value; 80,000,000 authorized shares; 22,371,179 and 21,587,751 shares issued and 22,221,027 and 21,527,319 shares outstanding at December 31, 2015 and 2014, respectively |
220 | 210 | ||||||
|
Capital in excess of par value |
151,250 | 141,855 | ||||||
|
Retained earnings |
159,243 | 135,268 | ||||||
|
Treasury stock, at cost – 150,152 and 60,432 shares at December 31, 2015 and 2014, respectively |
(2,505 | ) | (595 | ) | ||||
|
Accumulated other comprehensive loss |
(13,038 | ) | (10,856 | ) | ||||
|
Total stockholders’ equity |
295,170 | 265,882 | ||||||
|
Total liabilities and stockholders’ equity |
$ | 407,203 | $ | 380,115 | ||||
The accompanying notes are an integral part of the consolidated financial statements.
OMEGA PROTEIN CORPORATION
CONSOLIDATED STATEMENTS OF COMPREHENSIVE INCOME
| Years Ended December 31, | ||||||||||||
| 2015 | 2014 | 2013 | ||||||||||
| (in thousands, except per share amounts) | ||||||||||||
|
Revenues |
$ | 359,311 | $ | 308,635 | $ | 244,293 | ||||||
|
Cost of sales |
260,408 | 231,018 | 161,543 | |||||||||
|
Gross profit |
98,903 | 77,617 | 82,750 | |||||||||
|
Selling, general, and administrative expense |
40,859 | 31,516 | 25,293 | |||||||||
|
Research and development expense |
3,283 | 2,277 | 2,407 | |||||||||
|
Impairment of goodwill and other intangible assets |
4,495 | 4,718 | 266 | |||||||||
|
Loss related to plant closure |
6,650 | 7,058 | 6,597 | |||||||||
|
Loss (gain) on disposal of assets |
1,827 | 462 | 174 | |||||||||
|
Operating income |
41,789 | 31,586 | 48,013 | |||||||||
|
Interest expense |
(1,498 | ) | (1,331 | ) | (1,640 | ) | ||||||
|
(Loss) gain on foreign currency |
(1,217 | ) | 262 | — | ||||||||
|
Other expense, net |
(479 | ) | (310 | ) | (394 | ) | ||||||
|
Income before income taxes |
38,595 | 30,207 | 45,979 | |||||||||
|
Provision for income taxes |
14,620 | 11,746 | 15,464 | |||||||||
|
Net income |
$ | 23,975 | $ | 18,461 | $ | 30,515 | ||||||
|
Other comprehensive income (loss): |
||||||||||||
|
Foreign currency translation adjustment net of tax benefit of $956, $493, and $0, respectively |
(1,776 | ) | (915 | ) | — | |||||||
|
Energy swap adjustment, net of tax benefit (expense) of ($67), $1,247 and ($81), respectively |
125 | (2,316 | ) | 151 | ||||||||
|
Pension benefits adjustment, net of tax benefit (expense) of $286, $763 and ($1,920), respectively |
(531 | ) | (1,417 | ) | 3,565 | |||||||
|
Comprehensive income |
$ | 21,793 | $ | 13,813 | $ | 34,231 | ||||||
|
Basic earnings per share (See Note 12) |
$ | 1.10 | $ | 0.87 | $ | 1.50 | ||||||
|
Weighted average common shares outstanding |
21,307 | 20,562 | 19,913 | |||||||||
|
Diluted earnings per share (See Note 12) |
$ | 1.07 | $ | 0.85 | $ | 1.45 | ||||||
|
Weighted average common shares and potential common share equivalents outstanding |
21,732 | 21,168 | 20,634 | |||||||||
The accompanying notes are an integral part of the consolidated financial statements.
OMEGA PROTEIN CORPORATION
CONSOLIDATED STATEMENTS OF CASH FLOWS
| Years Ended December 31, | ||||||||||||
|
2015 |
2014 |
2013 |
||||||||||
| (in thousands) | ||||||||||||
|
Cash flows from operating activities: |
||||||||||||
|
Net income |
$ | 23,975 | $ | 18,461 | $ | 30,515 | ||||||
|
Adjustments to reconcile net income to net cash provided by operating activities: |
||||||||||||
|
Depreciation and amortization |
24,529 | 22,017 | 21,056 | |||||||||
|
Loss on disposal of assets, plant closure |
4,533 | 2,029 | 5,514 | |||||||||
|
Loss on disposal of assets |
1,827 | 462 | 174 | |||||||||
|
Impairment of goodwill and other intangible assets |
4,495 | 4,718 | 266 | |||||||||
|
Provisions for losses on receivables |
206 | 48 | 103 | |||||||||
|
Share based compensation |
2,353 | 2,378 | 1,982 | |||||||||
|
Deferred income taxes |
1,399 | 2,195 | 3,579 | |||||||||
|
Unrealized loss (gain) on foreign currency fluctuations, net |
1,217 | (262 | ) | — | ||||||||
|
Changes in assets and liabilities: |
||||||||||||
|
Receivables |
(4,457 | ) | (696 | ) | (2,630 | ) | ||||||
|
Inventories |
(22,957 | ) | 16,531 | (26,855 | ) | |||||||
|
Prepaid expenses and other current assets |
58 | 493 | (191 | ) | ||||||||
|
Other assets |
(2,041 | ) | 1,464 | 4,092 | ||||||||
|
Accounts payable |
(6,934 | ) | 4,943 | 1,644 | ||||||||
|
Accrued liabilities |
10,276 | (9,498 | ) | (5,250 | ) | |||||||
|
Pension liability, net |
142 | (159 | ) | (2,144 | ) | |||||||
|
Other long-term liabilities |
2,007 | (202 | ) | 165 | ||||||||
|
Net cash provided by operating activities |
40,628 | 64,922 | 32,020 | |||||||||
|
Cash flows from investing activities: |
||||||||||||
|
Capital expenditures |
(34,888 | ) | (44,123 | ) | (24,796 | ) | ||||||
|
Proceeds from disposition of assets |
235 | 290 | 470 | |||||||||
|
Acquisition of Bioriginal Food & Science, net of cash acquired |
— | (46,388 | ) | — | ||||||||
|
Acquisition of Wisconsin Specialty Protein, net of cash acquired |
— | — | (26,676 | ) | ||||||||
|
Land and building purchased in capital lease extinguishment |
— | — | (5,005 | ) | ||||||||
|
Net cash used in investing activities |
(34,653 | ) | (90,221 | ) | (56,007 | ) | ||||||
|
Cash flows from financing activities: |
||||||||||||
|
Principal payments of long-term debt |
(67,611 | ) | (35,080 | ) | (3,058 | ) | ||||||
|
Proceeds from long-term debt |
56,709 | 24,950 | — | |||||||||
|
Principal payments of capital lease obligation |
— | — | (309 | ) | ||||||||
|
Debt issuance costs |
(980 | ) | — | — | ||||||||
|
Treasury stock repurchase |
(1,910 | ) | (595 | ) | — | |||||||
|
Proceeds from stock options exercised |
4,983 | 2,245 | 4,009 | |||||||||
|
Excess tax benefit of stock options exercised |
2,069 | 1,150 | 1,406 | |||||||||
|
Net cash (used in) provided by financing activities |
(6,740 | ) | (7,330 | ) | 2,048 | |||||||
|
Net decrease in cash and cash equivalents |
(765 | ) | (32,629 | ) | (21,939 | ) | ||||||
|
Translation effect on cash |
(4 | ) | — | — | ||||||||
|
Cash and cash equivalents at beginning of year |
1,430 | 34,059 | 55,998 | |||||||||
|
Cash and cash equivalents at end of year |
$ | 661 | $ | 1,430 | $ | 34,059 | ||||||
OMEGA PROTEIN CORPORATION
CONSOLIDATED STATEMENTS OF CASH FLOWS — (Continued)
| Years Ended December 31, | ||||||||||||
| 2015 | 2014 | 2013 | ||||||||||
| (in thousands) | ||||||||||||
|
Supplemental cash flow information: |
||||||||||||
|
Cash paid during the year for: |
||||||||||||
|
Interest |
$ | 1,956 | $ | 1,870 | $ | 1,865 | ||||||
|
Income taxes |
$ | 4,543 | $ | 16,419 | $ | 8,107 | ||||||
The accompanying notes are an integral part of the consolidated financial statements.
OMEGA PROTEIN CORPORATION
CONSOLIDATED STATEMENTS OF STOCKHOLDERS’ EQUITY
|
Accumulated |
||||||||||||||||||||||||||||
|
Capital in |
Other |
Treasury |
Total |
|||||||||||||||||||||||||
|
Common Stock |
Excess of |
Retained |
Comprehensive |
Stock |
Stockholders’ |
|||||||||||||||||||||||
|
Shares |
Amount |
Par Value |
Earnings |
Income (Loss) |
Amount |
Equity |
||||||||||||||||||||||
| (in thousands) | ||||||||||||||||||||||||||||
|
Balance at December 31, 2012 |
19,884 | $ | 195 | $ | 129,040 | $ | 86,292 | $ | (9,924 | ) | — | $ | 205,603 | |||||||||||||||
|
Issuance of common stock |
862 | 8 | 6,019 | — | — | — | 6,027 | |||||||||||||||||||||
|
Restricted stock activity |
58 | — | 1,369 | — | — | — | 1,369 | |||||||||||||||||||||
|
Comprehensive income : |
||||||||||||||||||||||||||||
|
Net income |
— | — | — | 30,515 | — | — | 30,515 | |||||||||||||||||||||
|
Other comprehensive income: |
||||||||||||||||||||||||||||
|
Energy swap adjustment, net of tax expense of $81 |
— | — | — | — | 151 | — | 151 | |||||||||||||||||||||
|
Pension benefits adjustment, net of tax expense of $1,920 |
— | — | — | — | 3,565 | — | 3,565 | |||||||||||||||||||||
|
Balance at December 31, 2013 |
20,804 | $ | 203 | $ | 136,428 | $ | 116,807 | $ | (6,208 | ) | — | $ | 247,230 | |||||||||||||||
|
Issuance of common stock |
428 | 4 | 3,392 | — | — | — | 3,396 | |||||||||||||||||||||
|
Restricted stock activity |
356 | 3 | 2,035 | — | — | (595 | ) | 1,443 | ||||||||||||||||||||
|
Comprehensive income: |
||||||||||||||||||||||||||||
|
Net income |
— | — | — | 18,461 | — | — | 18,461 | |||||||||||||||||||||
|
Other comprehensive income: |
||||||||||||||||||||||||||||
|
Foreign currency translation adjustment, net of tax benefit of $493 |
— | — | — | — | (915 | ) | — | (915 | ) | |||||||||||||||||||
|
Energy swap adjustment, net of tax benefit of $1,247 |
— | — | — | — | (2,316 | ) | — | (2,316 | ) | |||||||||||||||||||
|
Pension benefits adjustment, net of tax benefit of $763 |
— | — | — | — | (1,417 | ) | — | (1,417 | ) | |||||||||||||||||||
|
Balance at December 31, 2014 |
21,588 | $ | 210 | $ | 141,855 | $ | 135,268 | $ | (10,856 | ) | $ | (595 | ) | $ | 265,882 | |||||||||||||
|
Issuance of common stock |
706 | 7 | 5,632 | — | — | — | 5,639 | |||||||||||||||||||||
|
Restricted stock activity |
77 | 3 | 3,763 | — | — | (1,910 | ) | 1,856 | ||||||||||||||||||||
|
Comprehensive income: |
||||||||||||||||||||||||||||
|
Net income |
— | — | — | 23,975 | — | — | 23,975 | |||||||||||||||||||||
|
Other comprehensive income: |
||||||||||||||||||||||||||||
|
Foreign currency translation adjustment, net of tax benefit of $956 |
— | — | — | — | (1,776 | ) | — | (1,776 | ) | |||||||||||||||||||
|
Energy swap adjustment, net of tax expense of $67 |
— | — | — | — | 125 | — | 125 | |||||||||||||||||||||
|
Pension benefits adjustment, net of tax benefit of $286 |
— | — | — | — | (531 | ) | — | (531 | ) | |||||||||||||||||||
|
Balance at December 31, 2015 |
22,371 | $ | 220 | $ | 151,250 | $ | 159,243 | $ | (13,038 | ) | $ | (2,505 | ) | $ | 295,170 | |||||||||||||
The accompanying notes are in integral part of the consolidated financial statements.
OMEGA PROTEIN CORPORATION
NOTES TO CONSOLIDATED FINANCIAL STATEMENTS
NOTE 1. SIGNIFICANT ACCOUNTING POLICIES
SUMMARY OF OPERATIONS AND BASIS OF PRESENTATION
Business Description
Omega Protein Corporation (the “Company”) is a nutritional products company that develops, produces and delivers healthy products throughout the world to improve the nutritional integrity of foods, dietary supplements and animal feeds. The Company operates through two industry segments: animal nutrition and human nutrition.
The animal nutrition segment is comprised primarily of two subsidiaries: Omega Protein, Inc. (“Omega Protein”) and Omega Shipyard, Inc. (“Omega Shipyard”). Omega Protein, the Company’s principal operating subsidiary, is the successor to a business conducted since 1913. Omega Protein produces and markets a variety of products produced from menhaden (a herring-like species of fish found in commercial quantities in the U.S. coastal waters of the Atlantic Ocean and Gulf of Mexico), including regular grade and value-added specialty fish meals, crude and refined fish oils and fish solubles. Omega Protein’s fish meal products are primarily used as a protein ingredient in animal feed for swine, aquaculture and household pets. Fish oil is utilized primarily for animal and aquaculture feeds, as well as additives to human food products and dietary supplements. Omega Protein’s fish solubles are sold primarily to livestock feed manufacturers, aquaculture feed manufacturers and for use as an organic fertilizer. Omega Protein’s business is seasonal in nature and generally has higher revenues during the third quarter of each fiscal year. A portion of Omega Protein’s production is transferred to the human nutrition segment where it is further processed and sold. Omega Shipyard owns and operates a drydock facility in Moss Point, Mississippi that is used to provide shoreside maintenance for Omega Protein’s fishing fleet.
The human nutrition segment, which operates under the name “Bioriginal”, has three primary product lines: plant and marine based specialty oils, protein products and other nutraceutical ingredients. Bioriginal is comprised primarily of four subsidiaries: Bioriginal Food & Science Corp. (“Bioriginal Food & Science”), Wisconsin Specialty Protein, L.L.C. (“WSP”), Cyvex Nutrition, Inc. (“Cyvex”) and InCon Processing, L.L.C. (“InCon”). Bioriginal Food & Science, acquired by the Company in September 2014 and headquartered in Saskatoon, Canada with additional operations in the Netherlands, is a supplier of plant and marine based specialty oils to the food and nutraceutical industries. See Note 2 – Acquisition of Bioriginal Food & Science Corp. for additional information related to the Company’s acquisition of Bioriginal Food & Science. WSP, acquired by the Company in February 2013, is a manufacturer and marketer of specialty dairy proteins and other related products headquartered in Madison, Wisconsin and operates a production facility in Reedsburg, Wisconsin. See Note 3 – Acquisition of Wisconsin Specialty Protein, L.L.C. for additional information related to the Company’s acquisition of WSP. Cyvex is located in Irvine, California and is an ingredient provider in the nutraceutical industry. InCon is located in Batavia, Illinois and is a specialty processor that utilizes molecular distillation technology to concentrate Omega-3 fish oils and, subject to outside demand and excess capacity, a variety of other compound products for third-party tolling customers. On March 8, 2016, as part of its strategy to focus on non-concentrated omega-3 oils instead of concentrated omega-3 oils, the Company decided to exit the Batavia, Illinois oil concentration facility and relocate certain assets from this facility to other Company facilities. In order to satisfy current customer obligations, the Company plans to continue to operate this facility on a limited basis through the middle of 2017. As of December 31, 2015, the Company recognized $4.5 million in losses relating to the impairment of property, plant and equipment as well as estimated decommissioning costs. For additional information see Note 4 – Plant Closure. In addition to the above recognized losses, to the extent we are unable to recover the remaining carrying value of our assets at the facility, we could have additional impairment charges. The remaining carrying value of these assets is $2.8 million. Additionally, we expect to incur additional costs associated with ongoing employee severance expenses and ongoing cost not attributable to future production such as clean-up and disassembly.
Consolidation
The consolidated financial statements include the accounts of Omega Protein Corporation and its wholly owned subsidiaries. All significant intercompany accounts and transactions have been eliminated in consolidation.
Financial Statement Preparation
The preparation of financial statements in conformity with accounting principles generally accepted in the United States of America requires management to make estimates and assumptions that affect the reported amounts of assets and liabilities and disclosure of contingent assets and liabilities at the date of the Company’s financial statements and the accompanying notes and the reported amounts of revenues and expenses during the reporting period. Actual amounts, when available, could differ from those estimates and those differences could have a material effect on the financial statements.
OMEGA PROTEIN CORPORATION
NOTES TO CONSOLIDATED FINANCIAL STATEMENTS — (Continued)
As noted in the Company’s Quarterly Report on Form 10-Q for the quarter ended March 31, 2015, the Company revised the December 31, 2014 consolidated balance sheet to correct for the classification of $0.4 million of accounts payable to other long-term liabilities. This revision was not considered to be material, individually or in the aggregate, to previously issued financial statements. The revisions had no effect on the results of operations (net or comprehensive income) or financial condition (stockholders’ equity).
Revenue Recognition
The Company derives revenue principally from the sales of a variety of protein and oil products derived from menhaden. In addition and as a result of its acquisitions of Cyvex, InCon, WSP and Bioriginal Food & Science, the Company’s revenues include sales of dietary supplements and food ingredients and products. The Company recognizes revenue for the sale of its products when price is established, collectability is reasonably assured and risk and rewards of ownership of its products and title are transferred to the customer.
Shipping and Handling
Amounts billed to customers associated with shipping and handling are included in revenues and the related costs are included in cost of sales. For 2015, 2014 and 2013, $10.3 million, $10.3 million and $9.4 million of shipping and handling costs are included in cost of sales, respectively.
Cash and Cash Equivalents
The Company considers cash in banks and short-term investments with original maturities of three months or less as cash and cash equivalents.
Allowances for Doubtful Accounts
The Company’s receivables are recorded at net realizable value. The Company maintains allowances for doubtful accounts for estimated losses resulting from the inability of the Company’s customers to make required payments. The Company considers the following factors when determining if collection is reasonably assured: customer credit worthiness, past transaction history with the customer, and changes in customer payment terms. If the Company has no previous experience with the customer, the Company typically obtains reports from credit organizations to ensure that the customer has a history of paying its creditors. The Company may also request financial information, including financial statements or other documents (e.g., bank statements), or may obtain a letter of credit from the customer to ensure that the customer has the means of making payment. If the financial condition of the Company’s customers were to deteriorate, adversely affecting their ability to make payments, additional allowances would be required.
Inventories
Omega Protein’s fishing season runs from mid-April to the first of November in the Gulf of Mexico and from the beginning of May into November or December in the Atlantic. Government regulations generally preclude Omega Protein from fishing during the off-seasons.
Omega Protein’s inventory cost system considers all costs associated with an annual fish catch and its processing, both variable and fixed, including both costs incurred during the off-season and during the fishing season. Omega Protein’s costing system allocates cost to inventory quantities on a per unit basis as calculated by a formula that considers total estimated inventoriable costs for a fishing season (including off-season costs) to total estimated units of production and the relative fair market value of the individual products produced. Omega Protein adjusts the cost of sales, off-season costs and inventory balances at the end of each quarter based on revised estimates of total inventoriable costs and units of production. Omega Protein’s lower-of-cost-or-market-value analyses at year-end and at interim periods compare the total estimated per unit production cost of Omega Protein’s expected production to the projected per unit market prices of the products. The impairment analyses involve estimates of, among other things, future fish catches and the related cost, and expected commodity prices for the fish products as well as projected purchase commitments from customers. These estimates, which management believes are reasonable and supportable, involve estimates of future activities and events which are inherently imprecise and from which actual results may differ materially from the Company’s estimates.
OMEGA PROTEIN CORPORATION
NOTES TO CONSOLIDATED FINANCIAL STATEMENTS — (Continued)
During the off-seasons, in connection with the upcoming fishing seasons, Omega Protein incurs costs (e.g., plant and vessel related labor, utilities, rent, repairs, and depreciation) that are directly related to Omega Protein’s infrastructure. These costs accumulate in inventory and are applied as elements of the cost of production of Omega Protein’s products throughout the fishing season ratably based on Omega Protein’s monthly units of production and the expected total units of production for the season.
Any costs incurred during abnormal downtime related to activity at Omega Protein’s plants are charged to expense as incurred.
The human nutrition segment generally uses FIFO for inventory it manufactures and for nutraceutical inventory. The Company’s inventory is stated at the lower of cost and net realizable value.
Business Interruption Insurance Proceeds
The Company recorded a receivable in December 2015 of approximately $0.3 million in proceeds, net of deductible, from its business interruption insurance coverage provider related to an incident causing downtime at one of its Gulf of Mexico production facilities in July 2014. The proceeds were calculated based on lost inventory production. Given that the Company experienced a slight decrease in production as a result of the incident some of which would have been sold in 2015, the proceeds related to lost inventory production were recognized as an increase in revenues.
Insurance
Omega Protein carries insurance for certain losses relating to its vessels and Jones Act liabilities for employees aboard its vessels. Omega Protein records gross insurance reserves by using an estimation process that considers Company-specific and industry information as well as management’s experience, assumptions and consultation with counsel. These reserves include estimated settlement costs. In addition, insurance receivables are recorded for those portions of the claims in excess of Company insurance policy annual aggregate deductibles and stop losses. Management’s current estimated range of liabilities related to such cases is based on claims for which management can estimate the amount and range of loss. For those claims where there may be a range of loss, Omega Protein has recorded an estimated liability inside that range, based on management’s experience, assumptions and consultation with counsel. The process of estimating and establishing reserves for these claims is inherently uncertain and the actual ultimate net cost of a claim may vary materially from the estimated amount reserved. There is some degree of inherent variability in assessing the ultimate amount of losses associated with these claims due to the extended period of time that transpires between when a claim occurs and the full settlement of the claim. This variability is generally greater for Jones Act claims by vessel employees. Omega Protein evaluates loss estimates associated with claims and losses as additional information becomes available and revises its estimates. Although management believes estimated reserves related to these claims are adequately recorded, it is possible that actual results could significantly differ from the recorded reserves, which could materially impact Omega Protein’s business, financial condition or results of operations.
The Company is primarily self-insured for health insurance. The Company purchases individual stop loss coverage with a large deductible. As a result, the Company is primarily self-insured for claims and associated costs up to the amount of the deductible, with claims in excess of the deductible amount being covered by insurance. Expected claims estimates are based on health care trend rates and historical claims data; actual claims may differ from those estimates. The Company evaluates its claims experience related to this coverage with information obtained from its risk management consultants.
Assumptions used in preparing these insurance estimates are based on factors such as claims settlement patterns, claim development trends, claim frequency and severity patterns, inflationary trends and data reasonableness. Together these factors will generally affect the analysis and determination of the “best estimate” of the projected ultimate claim losses. The results of these evaluations are used to both analyze and adjust the Company’s insurance loss reserves.
In addition to the above insurance policies, the Company maintains insurance coverage for property, inventory, workers compensation, general liability, product liability and other items. The nature and extent of the insurance coverage varies by line of policy.
Research and Development
Costs incurred in research and development activities are expensed as incurred.
OMEGA PROTEIN CORPORATION
NOTES TO CONSOLIDATED FINANCIAL STATEMENTS — (Continued)
Energy Swap Agreements
The Company does not enter into financial instruments for trading or speculative purposes. During 2015, 2014 and 2013, Omega Protein entered into energy swap agreements to manage portions of its cash flow exposure related to the volatility of natural gas, diesel and fuel oil energy prices for its fish meal and fish oil production operations. The swaps effectively fix pricing for the quantities listed below during the consumption periods.
|
Energy Swap |
Consumption Period |
Quantity |
Price Per Unit |
Energy Swap Asset/(Liability) as of December 31, 2015 |
Deferred Tax Asset/(Liability) as of December 31, 2015 |
|||||||||||
|
(in thousands) |
||||||||||||||||
|
Diesel - NYMEX Heating Oil Swap |
May - November, 2016 |
2,418,679 Gallons |
$ | 2.23 | $ | (2,319 | ) | $ | 812 | |||||||
|
Natural Gas - NYMEX Natural Gas Swap |
April – October, 2016 |
374,850 MMBTUs |
$ | 3.05 | (207 | ) | 72 | |||||||||
|
Propane – Natural Gas Liquids Swap |
June - November, 2016 |
1,902,590 Gallons |
$ | 0.58 | (322 | ) | 113 | |||||||||
|
Diesel - NYMEX Heating Oil Swap |
May - November, 2017 |
716,560 Gallons |
$ | 1.69 | (165 | ) | 58 | |||||||||
|
Natural Gas - NYMEX Natural Gas Swap |
April – October, 2017 |
187,400 MMBTUs |
$ | 2.97 | (45 | ) | 15 | |||||||||
| $ | (3,058 | ) | $ | 1,070 | ||||||||||||
|
Energy Swap |
Consumption Period |
Quantity |
Price Per Unit |
Energy Swap Asset/(Liability) as of December 31, 2014 |
Deferred Tax Asset/(Liability) as of December 31, 2014 |
|||||||||||
|
(in thousands) |
||||||||||||||||
|
Diesel - NYMEX Heating Oil Swap |
May - November, 2015 |
2,333,848 Gallons |
$ | 2.75 | $ | (2,097 | ) | $ | 734 | |||||||
|
Natural Gas - NYMEX Natural Gas Swap |
April – October, 2015 |
114,000 MMBTUs |
$ | 4.09 | (125 | ) | 44 | |||||||||
|
Propane – Natural Gas Liquids Swap |
June - November, 2015 |
1,024,800 Gallons |
$ | 0.86 | (346 | ) | 121 | |||||||||
|
Diesel - NYMEX Heating Oil Swap |
May - November, 2016 |
1,333,464 Gallons |
$ | 2.50 | (679 | ) | 238 | |||||||||
|
Propane – Natural Gas Liquids Swap |
June - November, 2016 |
341,600 Gallons |
$ | 0.67 | (41 | ) | 14 | |||||||||
| $ | (3,288 | ) | $ | 1,151 | ||||||||||||
As of December 31, 2015, Omega Protein has recorded a long-term liability of $0.2 million, net of the current portion included in other current liabilities of $2.9 million, to recognize the fair value of energy swap derivatives, and has also recorded a deferred tax asset of $1.1 million associated therewith. As of December 31, 2014, Omega Protein has recorded a long-term liability of $0.7 million net of the current portion included in other current liabilities of $2.6 million to recognize the fair value of energy swap derivatives, and has also recorded a deferred tax asset of $1.2 million associated therewith. The effective portion of the change in fair value from inception to December 31, 2015 is recorded in “accumulated other comprehensive loss” in the Company’s consolidated financial statements. The following table illustrates the changes recorded, net of tax, in accumulated other comprehensive loss resulting from the energy swap agreements.
| (in thousands) | ||||||||
|
2015 |
2014 |
|||||||
|
Balance at January 1, |
$ | (2,137 | ) | $ | 179 | |||
|
Net loss (gain), net of tax, reclassified to unallocated inventory cost pool |
2,083 | 34 | ||||||
|
Net change associated with current period swap transactions, net of tax, |
(1,958 | ) | (2,350 | ) | ||||
|
Balance at December 31, |
$ | (2,012 | ) | $ | (2,137 | ) | ||
OMEGA PROTEIN CORPORATION
NOTES TO CONSOLIDATED FINANCIAL STATEMENTS — (Continued)
The $2.0 million reported in accumulated other comprehensive loss as of December 31, 2015 will be reclassified to the unallocated inventory cost pool in the period when the energy consumption takes place. The amount to be reclassified, net of taxes, during the next 12 months is expected to be approximately $1.9 million.
The aggregate fair value of derivative instruments in gross liability positions as of December 31, 2015 and December 31, 2014 was $3.1 million and $3.3 million, respectively. These amounts represent the maximum exposure to loss at the reporting date as a result of all of the counterparties failing to perform as contracted.
|
As of December 31, 2015 (in thousands) |
Gross Amounts of Recognized Assets (Liabilities) |
Gross Amounts of Assets (Liabilities) Offset |
Net Amounts of Assets (Liabilities) Presented in the Balance Sheet |
|||||||||
|
Energy swap derivatives – liability position |
$ | (3,058 | ) | $ | — | $ | (3,058 | ) | ||||
|
As of December 31, 2014 (in thousands) |
Gross Amounts of Recognized Assets (Liabilities) |
Gross Amounts of Assets (Liabilities) Offset |
Net Amounts of Assets (Liabilities) Presented in the Balance Sheet |
|||||||||
|
Energy swap derivatives – liability position |
$ | (3,288 | ) | $ | — | $ | (3,288 | ) | ||||
If, at any time, the swaps are determined to be ineffective due to changes in the Company’s energy usage, price correlations or underlying hedge agreements or assumptions, the fair value of the portion of the energy swaps determined to be ineffective will be recognized as a gain or loss in cost of sales for the applicable period. For 2015 and 2014, the Company recognized a gain of $0.1 million and $0 million, respectively, to cost of sales resulting from transactions associated with the ineffectiveness of diesel energy swaps. The fair value of all outstanding derivatives is determined using a model with inputs that are observable in the market or can be derived from or corroborated by observable data (level 2).
The determination of the fair values above incorporates various factors required under FASB ASC 820-10. These factors include not only the credit standing of the counterparties involved and the impact of credit enhancements (such as cash deposits, letters of credit and priority interests), but also the impact of the Company’s nonperformance risk on its liabilities.
The fair value of the diesel, propane and natural gas energy swaps is derived from the underlying market price of similar instruments at a specific valuation date. The underlying market price for the diesel and natural gas swaps is based upon the NYMEX Futures Curve. The underlying market price for propane is based upon the Mont Belvieu Propane futures curve. These methods rely upon quoted prices for similar instruments in active markets.
Subsequent to December 31, 2015, Omega Protein entered into the following energy swap agreements:
|
Energy Swap |
Consumption Period |
Quantity |
Price Per Unit |
|||||
|
Diesel - NYMEX Heating Oil Swap |
May – November, 2016 |
518,100 Gallons |
$ | 1.08 | ||||
|
Propane – Natural Gas Liquids Swap |
June – November, 2016 |
658,200 Gallons |
$ | 0.38 | ||||
|
Diesel - NYMEX Heating Oil Swap |
May – November, 2017 |
1,802,000 Gallons |
$ | 1.32 | ||||
|
Natural Gas - NYMEX Natural Gas Swap |
April – October, 2017 |
125,000 MMBTUs |
$ | 2.59 | ||||
|
Propane – Natural Gas Liquids Swap |
June – November, 2017 |
1,464,800 Gallons |
$ | 0.40 | ||||
OMEGA PROTEIN CORPORATION
NOTES TO CONSOLIDATED FINANCIAL STATEMENTS — (Continued)
Income Taxes
The Company utilizes the asset and liability method to account for income taxes. This method requires the recognition of deferred tax assets and liabilities for the expected future tax consequences of existing temporary differences between the financial reporting and tax reporting basis of assets and liabilities, and operating loss and tax credits carryforwards for tax purposes. The Company records a valuation allowance to reduce the deferred tax assets to the amount that is more likely than not to be realized. The Company believes that the deferred tax assets recorded as of December 31, 2015, net of the valuation allowance, are realizable through future reversals of existing taxable temporary differences and future taxable income. If the Company were to subsequently determine that it would be able to realize deferred tax assets in the future in excess of the net recorded amount, the adjustment would increase earnings for the period in which such determination was made. The Company will continue to assess the adequacy of the valuation allowance on a quarterly basis. Any changes to the estimated valuation allowance could be material to the consolidated financial condition and results of operations.
Accounting for the Impairment of Long-Lived Assets
The Company evaluates at each balance sheet date the continued appropriateness of the carrying value of its long-lived assets, including its long-term receivables and property, plant and equipment. The Company reviews long-lived assets for impairment when events or changes in circumstances indicate that the carrying amount of any such assets or grouping of assets may not be recoverable. The Company has grouped certain assets together (primarily marine vessels) for impairment testing on a fleet basis. If indicators of impairment are present, management evaluates the undiscounted cash flows estimated to be generated by those assets or grouping of assets compared to the carrying amount of those items. The net carrying value of assets or grouping of assets not recoverable is reduced to fair value. The Company considers continued operating losses, or significant and long-term changes in business conditions, to be its primary indicators of a potential impairment.
Property, Equipment and Depreciation
Property and equipment additions are recorded at cost. Depreciation of property and equipment is computed by the straight-line method at rates expected to amortize the cost of property and equipment, net of salvage value, over their estimated useful lives. Estimated useful lives, determined at the date of acquisition, of new assets acquired are based primarily on the review of existing property and equipment as well as other factors. Estimated useful lives are as follows:
|
Useful Lives (years) |
|||||
|
Stainless steel equipment |
25 | ||||
|
Fishing vessels and fish processing plants |
15 | - | 20 | ||
|
Machinery, equipment, furniture and fixtures and other |
3 | - | 10 | ||
Replacements and major improvements are capitalized and amortized over a period of 5 to 15 years. Upon sale or retirement, the costs and related accumulated depreciation are eliminated from the accounts. Any resulting gains or losses are included in the statement of comprehensive income.
The Company reviews its assets for impairment when events or changes in circumstances indicate that an asset’s carrying amounts may not be recoverable. In connection with this review, assets are grouped at the lowest level at which identifiable cash flows are largely independent of other asset groupings. Among others, the Company considers continued operating losses, or significant and long-term changes in business conditions, to be indicators of a potential impairment. If the estimated undiscounted future cash flows are not sufficient to support the asset’s recorded value, an impairment charge is recognized to reduce the carrying amount of the long-lived asset to its estimated fair value.
Plant Closure
Property, plant and equipment impairments related to the closure of the Cameron, Louisiana and Batavia, Illinois plants are made in accordance with the impairment of long-lived assets policy. Employee severance related charges have been recognized to the extent that the amount is probable, measurable and no-future service is expected or for those still employed, recognized pro-rata over the remaining service period. Ongoing clean-up and dismantlement costs will be recognized as incurred unless obligated and measureable by a contractual commitment. See Note 4 – Plant Closure for additional information related to the charges incurred.
OMEGA PROTEIN CORPORATION
NOTES TO CONSOLIDATED FINANCIAL STATEMENTS — (Continued)
Acquisitions, Goodwill and Other Intangible Assets
Goodwill is measured as the excess of the cost of an acquisition over the sum of the amounts assigned to the fair value of tangible and intangible assets acquired less liabilities assumed. The determination of the fair value of the intangible assets acquired involves certain judgments and estimates. These judgments can include, but are not limited to, the cash flows that an asset is expected to generate in the future and the appropriate weighted average cost of capital.
The Company does not amortize goodwill or indefinite-lived intangible assets but performs tests for impairment annually, or when indications of potential impairment exist, utilizing a fair value approach at the reporting unit level. The Company determines fair value using widely accepted valuation techniques, including the income approach which estimates the fair value of its reporting units based on the future discounted cash flows, and the market approach which estimates the fair value of its reporting units based on comparable market prices. In testing for a potential impairment of goodwill, the Company estimates the fair value of its reporting units to which goodwill relates and compares it to the carrying value (book value) of the assets and liabilities related to those businesses.
All of the Company’s goodwill and other intangible assets are the result of acquisitions in the human nutrition segment. This segment is comprised of three reporting units, 1) InCon and Cyvex, 2) WSP and 3) Bioriginal Food & Science.
The Company amortizes other intangible assets with determinable lives over their estimated useful lives. The Company records an impairment charge on these assets when it determines that their carrying value may not be recoverable. The carrying value is not recoverable if it exceeds the undiscounted future cash flows resulting from the use of the asset and its eventual disposition. When there is existence of one or more indicators of impairment, the Company measures any impairment of intangible assets based on a projected discounted cash flow method using a discount rate determined by the Company’s management to be commensurate with the risk inherent in its business model. The Company’s estimates of future cash flows attributable to its other intangible assets require significant judgment based on the Company’s historical and anticipated results and are subject to many factors. See Note 10 - Goodwill and Other Intangible Assets for more information about goodwill and other intangible assets.
Pension Plans
The Company records the overfunded or underfunded status of defined benefit pension and postretirement plans as an asset or liability in its statement of financial position and changes in that funded status in the year in which the changes occur through other comprehensive income. The Company also measures the funded status of a plan as of the date of its year-end statement of financial position. The Company’s policy is to fund its pension plan at amounts not less than the minimum requirements of the Employee Retirement Income Security Act of 1974 (“ERISA”).
In 2002, the Board of Directors authorized a plan to freeze the Company’s pension plan in accordance with ERISA rules and regulations so that new employees, hired after July 31, 2002, are not eligible to participate in the pension plan and further benefits no longer accrue for existing participants. The freezing of the pension plan had the effect of vesting all existing participants in their pension benefits in the plan. See Note 15 – Benefit Plans for additional information related to the Company’s pension plans.
Comprehensive Income (Loss)
Comprehensive income (loss) is defined as change in equity of a business enterprise during a period from transactions and other events and circumstances from non-owner sources, including foreign currency translation adjustments, interest and energy swap transactions, and pension benefits adjustments, including recognition of actuarial losses. The Company presents comprehensive income (loss) in its consolidated statements of comprehensive income and consolidated statements of stockholders’ equity.
OMEGA PROTEIN CORPORATION
NOTES TO CONSOLIDATED FINANCIAL STATEMENTS — (Continued)
Accumulated Comprehensive Loss
The components of accumulated other comprehensive loss included in stockholders’ equity are as follows:
Changes in Accumulated Other Comprehensive Loss by Component
(in thousands)
|
Gains and Losses On Cash Flow Hedges |
Defined Benefit Pension Items |
Foreign currency Translation adjustment |
Total |
|||||||||||||
|
Beginning balance December 31, 2014 |
$ | (2,137 | ) | $ | (7,804 | ) | $ | (915 | ) | $ | (10,856 | ) | ||||
|
Other comprehensive loss before reclassifications |
(1,958 | ) | (1,311 | ) | (1,776 | ) | (5,045 | ) | ||||||||
|
Amounts reclassified from accumulated other comprehensive loss |
(a) | 2,083 | (b) | 780 | — | 2,863 | ||||||||||
|
Net current-period other comprehensive income |
125 | (531 | ) | (1,776 | ) | (2,182 | ) | |||||||||
|
Ending balance December 31, 2015 |
$ | (2,012 | ) | $ | (8,335 | ) | $ | (2,691 | ) | $ | (13,038 | ) | ||||
|
(a) |
This accumulated other comprehensive income component is reclassified to the unallocated inventory cost pool in the period when the energy consumption takes place. |
|
(b) |
This accumulated other comprehensive income component is included in the computation of net periodic pension costs as amortization of actuarial loss which are explained in more detail in Note 15. |
Changes in Accumulated Other Comprehensive Loss by Component
(in thousands)
|
Gains and Losses On Cash Flow Hedges |
Defined Benefit Pension Items |
Foreign currency Translation adjustment |
Total |
|||||||||||||
|
Beginning balance December 31, 2013 |
$ | 179 | $ | (6,387 | ) | $ | — | $ | (6,208 | ) | ||||||
|
Other comprehensive loss before reclassifications |
(2,350 | ) | (2,010 | ) | (915 | ) | (5,275 | ) | ||||||||
|
Amounts reclassified from accumulated other comprehensive loss |
(c) | 34 | (d) | 593 | — | 627 | ||||||||||
|
Net current-period other comprehensive income |
(2,316 | ) | (1,417 | ) | (915 | ) | (4,648 | ) | ||||||||
|
Ending balance December 31, 2014 |
$ | (2,137 | ) | $ | (7,804 | ) | $ | (915 | ) | $ | (10,856 | ) | ||||
|
(c) |
This accumulated other comprehensive loss component is reclassified to the unallocated inventory cost pool in the period when the energy consumption takes place. |
|
(d) |
This accumulated other comprehensive loss component is included in the computation of net periodic pension costs as amortization of actuarial loss which are explained in more detail in Note 15. |
Concentrations of Credit Risk
Financial instruments that potentially subject the Company to concentrations of credit risk consist principally of cash and trade accounts receivable. The Company’s customer base generally remains consistent from year to year. The Company performs ongoing credit evaluations of its customers and generally does not require material collateral. The Company maintains reserves for potential credit losses and such losses have historically been within management’s expectations. At December 31, 2015, the Company had cash deposits in a few major banks.
Earnings per Share
Basic earnings per share is calculated by dividing net income allocated to common shares outstanding by the weighted average number of shares of common stock outstanding. Diluted earnings per share assumes the exercise of stock options provided the effect is not anti-dilutive.
The Company grants certain incentive compensation awards, including restricted stock, to employees and non-employee directors that are considered to be participating securities. Due to the presence of participating securities, the Company has calculated its earnings per share using the two-class method. See Note 12 – Reconciliation of Basic and Diluted per Share Data.
Stock-Based Compensation
The Company has a stock-based compensation plan, which is described in more detail in Note 15 – Benefit Plans.
Shares Issued to Directors
In 2015, 2014 and 2013, approximately 0, 0, and 3,200 shares of the Company’s stock were issued to directors in non-cash transactions as payment in lieu of Board retainer and per diem fees. Expenses were recognized on these non-cash transactions of approximately $0, $0 and $25,200.
OMEGA PROTEIN CORPORATION
NOTES TO CONSOLIDATED FINANCIAL STATEMENTS — (Continued)
Foreign Currency Translations
All amounts are expressed in U.S. Dollars unless otherwise indicated. The U.S. Dollar is the functional currency of Bioriginal Food & Science’s Canadian-based subsidiaries (“Bioriginal Food & Science Canada”). Monetary assets and liabilities denominated in foreign currencies are translated into U.S. Dollars at exchange rates in effect at the balance sheet date. Non-monetary items are translated at rates of exchange in effect when the assets were acquired or obligations incurred. Revenue and expenses are translated at average rates in effect in the period of the transaction. Foreign exchange gains and losses are included in the consolidated statement of comprehensive income.
The Euro is the functional currency of Bioriginal Food & Science’s Netherlands-based subsidiaries (“Bioriginal Food & Science Europe”). The operations of these subsidiaries are considered self-sustaining and their financial statements are translated into U.S. Dollars using the current rate method. Under this method, all assets and liabilities are translated to U.S. Dollars at exchange rates in effect at the balance sheet date and all revenue and expenses are translated at rates in effect at the time of the transactions. Exchange gains and losses arising from this translation, representing the net unrealized foreign currency translation gain (loss) on the Company's net investment in its self-sustaining subsidiaries, are recorded in the accumulated other comprehensive income (loss) component of stockholders' equity. Adjustments to the accumulated other comprehensive income (loss) account are not recorded in the consolidated statement of comprehensive income until realized through an addition or reduction in the Company's net investment in such operations.
Recently Issued Accounting Standards
In February 2016, the Financial Accounting Standards Board (“FASB”) issued Accounting Standards Update (“ASU”) 2016-02, Leases, which is intended to improve the reporting of leasing transactions to provide users of financial statements with more decision-useful information. ASU 2016-02 will require organizations that lease assets to recognize on the balance sheet the assets and liabilities for the rights and obligations created by those leases. ASU 2016-02 is effective for fiscal years beginning after December 15, 2018, with early adoption permitted, including interim periods within those fiscal years. The Company is currently assessing the potential impact of ASU 2016-02 on the Company’s consolidated results of operations, financial position and related disclosures.
In November 2015, the FASB issued ASU 2015-17, Balance Sheet Classification of Deferred Taxes, which amends existing guidance on income taxes to require the classification of all deferred tax assets and liabilities as non-current on the balance sheet. The Company is required to adopt this ASU no later than January 1, 2018, with early adoption permitted, and the guidance may be applied either prospectively or retrospectively. The Company’s adoption of ASU No. 2015-17 is not expected to have a material impact on the Company’s consolidated results of operations, financial position and related disclosures.
In September 2015, the FASB issued ASU 2015-16 Business Combinations (Topic 805): Simplifying the Accounting for Measurement-Period Adjustments. This update eliminates the requirement for an acquirer in a business combination to account for measurement-period adjustments retrospectively. Acquirers would now recognize measurement-period adjustments during the period in which they determine the amount of the adjustment. This update is effective for annual and interim reporting periods beginning after December 15, 2015, including interim periods within those fiscal years, and should be applied prospectively to adjustments for provisional amounts that occur after the effective date with early adoption permitted for financial statements that have not been issued. The Company’s adoption of ASU No. 2015-16 is not expected to have a material impact on the Company’s consolidated results of operations, financial position and related disclosures.
In August 2015, the FASB issued ASU 2015-15 Interest—Imputation of Interest (Subtopic 835-30) related to the presentation of debt issuance costs. This standard clarifies the guidance set forth in ASU 2015-03, which required that debt issuance costs related to a recognized debt liability be presented on the balance sheet as a direct deduction from the debt liability rather than as an asset. The new pronouncement clarifies that debt issuance costs related to line-of-credit arrangements could continue to be presented as an asset and be subsequently amortized over the term of the line-of-credit arrangement, regardless of whether there are any outstanding borrowings on the arrangement. The Company will consider this clarification in conjunction with its adoption of ASU 2015-03, which is expected to occur for the Company’s fiscal year beginning January 1, 2016, and it is not expected to have a material impact on the Company’s consolidated results of operations, financial position and related disclosures.
In July 2015, the FASB issued ASU 2015-11, Inventory (Topic 330): Simplifying the Measurement of Inventory. The guidance applies to inventory that is measured using either the first-in, first-out or average cost methods and requires entities to measure their inventory at the lower of cost and net realizable value. The amendment defines net realizable value as the estimated selling prices in the ordinary course of business, less reasonably predictable costs of completion, disposal, and transportation. The new standard is effective for annual periods beginning after December 15, 2016, and interim periods within those annual periods. The Company’s adoption of ASU No. 2015-11 is not expected to have a material impact on the Company’s consolidated results of operations, financial position and related disclosures.
OMEGA PROTEIN CORPORATION
NOTES TO CONSOLIDATED FINANCIAL STATEMENTS — (Continued)
In February 2015, the FASB issued ASU 2015-02, Consolidation (Topic 810). The amendments (1) modify the evaluation of whether limited partnerships and similar legal entities are variable interest entities (VIEs) or voting interest entities, (2) eliminate the presumption that a general partner should consolidate a limited partnership, (3) affect the consolidation analysis of reporting entities that are involved with VIEs, particularly those that have fee arrangements and related party relationships, and (4) provide a scope exception from consolidation guidance for reporting entities with interest in legal entities that are required to comply with or operate in accordance with requirements that are similar to those in Rule 2a-7 of the Investment Company Act of 1940 for registered money market funds. The new standard is effective in annual periods beginning after December 15, 2015 and interim periods within those annual periods. Early adoption is permitted. The Company’s adoption of ASU No. 2015-02 is not expected to have an impact on the Company’s consolidated results of operations, financial position and related disclosures.
In January 2015, the FASB issued ASU 2015-01, Income Statement- Extraordinary and Unusual Items (Subtopic 225-20). The update eliminates from GAAP the concept of extraordinary items. Eliminating the concept of extraordinary items will save time and reduce costs for preparers because they will not have to assess whether a particular event or transaction event is extraordinary. This alleviates uncertainty for preparers, auditors, and regulators because auditors and regulators no longer will need to evaluate whether a preparer treated an unusual and/or infrequent item appropriately. The new standard is effective in annual periods beginning after December 15, 2015 and interim periods within those annual periods. Early adoption is permitted. The Company’s adoption of ASU No. 2015-01 is not expected to have an impact on the Company’s consolidated results of operations, financial position and related disclosures.
In November 2014, the FASB issued ASU 2014-16, Derivatives and Hedging: Determining whether the Host Contract in a Hybrid Financial Statement Issued in the Form of a Share is More Akin to Debt or Equity. This ASU amended the Derivatives and Hedging Accounting Standards Codification to eliminate the use of different methods in practice and thereby reduce existing diversity under GAAP in the accounting for hybrid financial instruments used in the form of a share. The new standard is effective in annual periods beginning on or after December 15, 2015 with early adoption permitted. The Company’s adoption of ASU No. 2014-16 is not expected to have an impact on the Company’s consolidated results of operations, financial position and related disclosures.
In August 2014, the FASB issued ASU No. 2014-15, Presentation of Financial Statements- Going Concern (Subtopic 205-40). The amendments require management to assess an entity’s ability to continue as a going concern by incorporating and expanding upon certain principles that are currently in the U.S. auditing standards. Specifically, the amendments (1) provide a definition of the term substantial doubt, (2) require an evaluation every reporting period including interim periods, (3) provide principles for considering the mitigating effect of management’s plans, (4) require certain disclosures when substantial doubt is alleviated as a result of consideration of management’s plans, (5) require an express statement and other disclosures when substantial doubt is not alleviated, and (6) require an assessment for a period of one year after the date that the financial statements are issued (or available to be issued). The guidance is effective for annual periods ending after December 15, 2016 and for annual periods thereafter. Early adoption is permitted. The Company does not expect this ASU to have a material impact on the Company’s consolidated results of operations, financial position and related disclosures.
In June 2014, the FASB issued ASU No. 2014-12, Compensation — Stock Compensation (Topic 718), Accounting for Share-Based Payments When the Terms of an Award Provide That a Performance Target Could Be Achieved after the Requisite Service Period. A performance target in a share-based payment that affects vesting and that could be achieved after the requisite service period should be accounted for as a performance condition under Accounting Standards Codification (“ASC”) 718, Compensation — Stock Compensation. As a result, the target is not reflected in the estimation of the award's grant date fair value. Compensation cost would be recognized over the required service period, if it is probable that the performance condition will be achieved. The guidance is effective for annual periods beginning after December 15, 2015 and interim periods within those annual periods. Early adoption is permitted. The Company does not expect this ASU to have a material impact on the Company’s consolidated results of operations, financial position and related disclosures.
In May 2014, the FASB and the International Accounting Standards Board (“IASB”) jointly issued new accounting guidance for recognition of revenue. This new guidance replaces virtually all existing U.S. GAAP and IFRS guidance on revenue recognition.
On July 9, 2015, the FASB voted to defer the effective date for its new revenue standard for public and nonpublic entities reporting under U.S. GAAP by one year. As a result, the new guidance is now effective for fiscal years beginning after December 15, 2017. This new guidance applies to all periods presented. Therefore, when the Company issues its financial statements on Forms 10-Q and 10-K for periods included in its year ended December 31, 2018, its comparative periods that are presented from the years ended December 31, 2016 and 2017, must be retrospectively presented in compliance with this new guidance. Early adoption is not allowed for U.S. GAAP. The new guidance requires companies to make more estimates and use more judgment than under current accounting guidance.
OMEGA PROTEIN CORPORATION
NOTES TO CONSOLIDATED FINANCIAL STATEMENTS — (Continued)
The FASB and IASB (collectively, the “Boards”) have discussed clarifying the guidance in their new revenue standards for: (1) licenses of intellectual property, (2) identifying performance obligations, (3) noncash consideration and (4) collectability. The Boards have also discussed whether to add practical expedients for the accounting for contract modifications at transition and the presentation of sales taxes, and the FASB separately discussed several technical corrections. The FASB and the IASB did not agree on the nature and breadth of all of the changes to be proposed. The Boards are expected to issue separate exposure drafts later this year.
The Company continues to evaluate (i) the two allowed adoption methods to determine which method it plans to use for retrospective presentation of comparative periods, (ii) the impact of proposed clarifications to the guidance on timing of the recognition of revenue within the Company’s various revenue streams and (iii) whether the implementation of this new guidance will have a material impact on the Company’s consolidated financial position or results of operations for the periods presented.
In April 2014, the FASB issued ASU No. 2014-08, Presentation of Financial Statements and Property, Plant and Equipment: Reporting Discontinued Operations and Disclosures of Disposals of Components of an Entity. This ASU changes the criteria for determining which disposals can be presented as discontinued operations and modifies related disclosure requirements. Under the new guidance, a discontinued operation is defined as a disposal of a component or group of components that is disposed of or is classified as held for sale and represents a strategic shift that has or will have a major effect on an entity's operations and financial results. The new standard is effective in annual periods beginning on or after December 15, 2014 with early adoption permitted. The guidance applies prospectively to new disposals and new classifications of disposal groups as held for sale after the effective date. The Company’s adoption of ASU No. 2014-08, effective January 1, 2015, did not have an impact on the Company’s consolidated results of operations, financial position and related disclosures.
NOTE 2. ACQUISITION OF BIORIGINAL FOOD & SCIENCE CORP.
A. Description of the Transaction
In September 2014, the Company acquired all of the issued and outstanding equity of Bioriginal Food & Science pursuant to the terms of a Share Purchase Agreement (“Purchase Agreement”) and Bioriginal Food & Science became a wholly owned subsidiary of the Company and is included as part of the Company’s human nutrition segment. Bioriginal Food & Science is a leading supplier of plant and marine based specialty oils to the food and nutraceutical industries across North America, Europe and Asia.
B. Recording of Assets Acquired and Liabilities Assumed
In connection with its acquisition of Bioriginal Food & Science, the Company paid an aggregate purchase price of $70.5 million, plus a working capital adjustment of $0.7 million, to the sellers as follows: (i) $46.5 million in cash to the sellers, (ii) assumption of approximately $21.5 million of Bioriginal Food & Science’s indebtedness, and (iii) issuance of 238,377 shares of restricted common stock of the Company valued at approximately $3.2 million (based on a 30-day average closing price) to certain sellers (the “Management Sellers”). The restrictions on the shares will terminate, with certain exceptions, on the third anniversary of the closing date and are subject to the terms and conditions of the Purchase Agreement; see Note - 1 Significant Accounting Policies Summary of Operations and Basis of Presentation for more information on Restricted Stock. The Purchase Agreement also provides for a performance-based earn-out amount of up to a maximum amount that, as of December 31, 2015, was $5.3 million Canadian Dollars to be paid in September 2017 to the Management Sellers for achieving or exceeding certain adjusted EBITDA targets for Bioriginal Food & Science during calendar years 2014 through 2016; see Note 16 Commitments and Contingencies for additional information. During 2015, the Company received $0.1 million related to the finalization of the closing working capital adjustment.
The Company incurred approximately $2.8 million in pretax transaction costs directly related to the acquisition that were expensed and included in selling, general and administrative expense in the consolidated statement of comprehensive income for the year ended December 31, 2014. The acquisition costs consisted primarily of legal, advisory, valuation, and other consulting fees. The transaction has been accounted for using the acquisition method of accounting which requires, among other things, that all assets acquired and liabilities assumed from acquisitions be recognized at their fair values as of the acquisition date. Any excess of the purchase price over the fair values of the net assets acquired are recorded as goodwill. The following table shows the allocation of the purchase price (in thousands):
|
Cash |
$ | 93 | ||
|
Accounts receivable |
15,072 | |||
|
Inventories |
20,309 | |||
|
Other current assets, net including prepaid expenses |
1,820 | |||
|
Property, plant, and equipment |
3,026 | |||
|
Identifiable intangible assets (a) |
16,987 | |||
|
Liabilities assumed |
(38,288 | ) | ||
|
Total identifiable net assets |
19,019 | |||
|
Goodwill |
27,462 | |||
|
Total consideration |
$ | 46,481 |
|
|
(a) |
See Note 10 – Goodwill and Other Intangible Assets for weighted average lives. |
OMEGA PROTEIN CORPORATION
NOTES TO CONSOLIDATED FINANCIAL STATEMENTS — (Continued)
Goodwill is calculated as the excess of the consideration transferred over the net assets recognized and represents the future economic benefits arising from other assets acquired that could not be individually identified and separately recognized. Specifically, the goodwill recorded as part of the acquisition of Bioriginal Food & Science includes the following:
|
● |
the expected synergies and other benefits that the Company believes may result from combining the operations of Bioriginal Food & Science with the operations of the Company’s human nutrition segment, |
|
● |
any intangible assets that do not qualify for separate recognition, and |
|
● |
the value of the going-concern element of Bioriginal Food & Science’s existing business (the higher rate of return on the assembled collection of net assets over the acquisition of all the net assets separately). |
See Note 10 - Goodwill and Other Intangible Assets, for more information about goodwill and other intangible assets.
C. Unaudited Pro Forma Financial Information
The unaudited financial information in the table below summarizes the combined results of operations of the Company and Bioriginal Food & Science on a pro forma basis, as though the companies had been combined as of January 1, 2013. The pro forma financial information is presented for informational purposes only and is not indicative of the results of operations that would have been achieved if the acquisition had actually taken place on January 1, 2013 and is not intended to be a projection of future results or trends.
| Revenue | Net income | |||||||
| (in thousands) | ||||||||
|
Bioriginal Food & Science from September 5, 2014 – December 31, 2014 |
$ | 36,014 | $ | 352 | ||||
|
2014 supplemental pro forma from January 1, 2014 – December 31, 2014 |
$ | 387,659 | $ | 19,958 | ||||
|
2013 supplemental pro forma from January 1, 2013 – December 31, 2013 |
$ | 347,975 | $ | 33,913 | ||||
NOTE 3. ACQUISITION OF WISCONSIN SPECIALTY PROTEIN, L.L.C.
A. Description of the Transaction
In February 2013, the Company acquired 100% of the outstanding equity interest of WSP, a Wisconsin limited liability company, in a cash transaction pursuant to the terms of an agreement and plan of merger. WSP is now a wholly owned subsidiary of the Company. WSP produces a variety of value-added whey protein ingredients for the food and nutritional supplement industries, including organic and other specialty protein products, using processes applicable to a variety of nutritional dairy ingredients. WSP is included as part of the Company’s human nutrition segment.
B. Recording of Assets Acquired and Liabilities Assumed
The Company paid an aggregate cash purchase price for the equity of WSP of $26.5 million plus $0.6 million representing WSP’s excess working capital on the closing date and reimbursable capital expenditures, utilizing cash on hand.
OMEGA PROTEIN CORPORATION
NOTES TO CONSOLIDATED FINANCIAL STATEMENTS — (Continued)
The Company incurred approximately $0.8 million in pretax transaction costs directly related to the acquisition that were expensed and included in selling, general and administrative expenses in the consolidated statement of comprehensive income for the year ended December 31, 2013. The acquisition costs consisted primarily of legal, advisory, valuation and other consulting fees. The transaction has been accounted for using the acquisition method of accounting which requires, among other things, that all assets acquired and liabilities assumed from acquisitions be recognized at their fair values as of the acquisition date. Any excess of the purchase price over the fair values of the net assets acquired are recorded as goodwill. The following table shows the allocation of the purchase price:
| (in thousands) | ||||
|
Cash |
$ | 403 | ||
|
Other current assets, net including receivables, prepaid and inventory |
2,515 | |||
|
Property, plant, and equipment, net |
14,095 | |||
|
Identifiable intangible assets (a) |
4,448 | |||
|
Liabilities assumed |
(5,996 | ) | ||
|
Total identifiable net assets |
15,465 | |||
|
Goodwill |
11,614 | |||
|
Total consideration |
$ | 27,079 | ||
|
(a) |
See Note 10 – Goodwill and Other Intangible Assets for weighted average lives. |
Goodwill is calculated as the excess of the consideration transferred over the net assets recognized and represents the future economic benefits arising from other assets acquired that could not be individually identified and separately recognized. Specifically, the goodwill recorded as part of the acquisition of WSP includes the following:
|
● |
the expected synergies and other benefits that the Company believes will result from combining the operations of WSP with the operations of Bioriginal, the Company’s human nutrition segment, |
|
● |
any intangible assets that do not qualify for separate recognition, and |
|
● |
the value of the going-concern element of WSP’s existing business (the higher rate of return on the assembled collection of net assets over the acquisition of all of the net assets separately). |
See Note 10 - Goodwill and Other Intangible Assets, for more information about goodwill and other intangible assets.
C. Unaudited Pro Forma Financial Information
The unaudited financial information in the table below summarizes the combined results of operations of the Company and WSP on a pro forma basis, as though the companies had been combined as of January 1, 2012. The pro forma financial information is presented for informational purposes only and is not indicative of the results of operations that would have been achieved if the acquisition had actually taken place on January 1, 2012 and is not intended to be a projection of future results or trends.
| Revenue | Net income (loss) | |||||||
| (in thousands) | ||||||||
|
WSP from February 27, 2013 – December 31, 2013 |
$ | 9,810 | $ | (195 | ) | |||
|
2013 supplemental pro forma from January 1, 2013 – December 31, 2013 |
$ | 246,361 | $ | 30,518 | ||||
NOTE 4. PLANT CLOSURE
Cameron Plant
In December 2013, the Company effectively closed its menhaden fish processing plant located in Cameron, Louisiana and re-deployed certain vessels from that facility to the Company’s other Gulf Coast facilities located in Abbeville, Louisiana and Moss Point, Mississippi. In conjunction with the closure, the following charges were incurred in the Company’s consolidated statements of comprehensive income during 2015, 2014 and 2013:
| 2015 | 2014 | 2013 | ||||||||||
| (in thousands) | ||||||||||||
|
Impairment of property, plant and equipment |
$ | — | $ | 3,126 | $ | 4,796 | ||||||
|
Write-off material and supplies inventory |
— | 53 | 97 | |||||||||
|
Employee severance costs |
— | 387 | 345 | |||||||||
|
Estimated decommissioning costs |
— | — | 250 | |||||||||
|
Other ongoing closure costs not attributable to future production |
2,117 | 3,492 | 1,109 | |||||||||
|
Total loss related to plant closure |
$ | 2,117 | $ | 7,058 | $ | 6,597 | ||||||
In addition to the above recognized losses, the Company expects that it may have additional losses related to ongoing costs not attributable to future production.
OMEGA PROTEIN CORPORATION
NOTES TO CONSOLIDATED FINANCIAL STATEMENTS — (Continued)
Batavia Plant
As part of our strategic review and operating results that did not meet expectations, we re-assessed our business strategy to produce and sell concentrated menhaden fish oils. During this assessment, efforts to sell significant volumes of concentrated menhaden fish oils were decreased and the Company determined that the carrying values of certain assets located at our facility in Batavia, Illinois were no longer recoverable. As a result, the following charges were recorded in the Company’s consolidated statements of comprehensive income:
| 2015 | ||||
| (in thousands) | ||||
|
Estimated decommissioning costs |
$ | 375 | ||
|
Impairment of property, plant and equipment |
4,158 | |||
|
Total loss related to plant closure |
$ | 4,533 | ||
See Note 19 – Subsequent Event for additional information regarding the decision made in March 2016 to exit our oil concentration facility located in Batavia, Illinois.
NOTE 5. RECEIVABLES, NET
Receivables as of December 31, 2015 and 2014 are summarized below:
| 2015 | 2014 | |||||||
| (in thousands) | ||||||||
|
Trade |
$ | 32,179 | $ | 29,534 | ||||
|
Insurance |
6,769 | 1,711 | ||||||
|
Income tax |
1,133 | 5,442 | ||||||
|
Other |
976 | 370 | ||||||
|
Total accounts receivable |
41,057 | 37,057 | ||||||
|
Less allowance for doubtful accounts |
(568 | ) | (436 | ) | ||||
|
Receivables, net |
$ | 40,489 | $ | 36,621 | ||||
NOTE 6. INVENTORY
The major classes of inventory as of December 31, 2015 and 2014 are summarized below:
| 2015 | 2014 | |||||||
| (in thousands) | ||||||||
|
Fish meal |
$ | 37,308 | $ | 28,400 | ||||
|
Fish oil |
25,600 | 19,300 | ||||||
|
Fish solubles |
696 | 683 | ||||||
|
Nutraceutical products |
6,393 | 4,635 | ||||||
|
Bioriginal Food & Science products |
24,024 | 26,219 | ||||||
|
Dairy protein products |
8,447 | 2,783 | ||||||
|
Unallocated inventory cost pool (including off-season costs) |
7,807 | 6,854 | ||||||
|
Other materials and supplies |
9,719 | 8,639 | ||||||
|
Total inventory |
$ | 119,994 | $ | 97,513 | ||||
The elements of December 31, 2015 unallocated inventory cost pool include Omega Protein’s plant and vessel related labor, utilities, rent, repairs and depreciation, to be allocated to 2016 fishing season production.
OMEGA PROTEIN CORPORATION
NOTES TO CONSOLIDATED FINANCIAL STATEMENTS — (Continued)
NOTE 7. PREPAID EXPENSES AND OTHER CURRENT ASSETS
Prepaid expenses and other current assets as of December 31, 2015 and 2014 are summarized below:
| 2015 | 2014 | |||||||
| (in thousands) | ||||||||
|
Prepaid insurance |
$ | 2,317 | $ | 2,322 | ||||
|
Product deposits |
767 | 998 | ||||||
|
Selling expenses |
50 | 156 | ||||||
|
Leases |
119 | 168 | ||||||
|
Other prepaid and expenses |
1,243 | 1,292 | ||||||
|
Total prepaid expenses and other current assets |
$ | 4,496 | $ | 4,936 | ||||
Amounts included in prepaid expenses and other current assets consist primarily of prepaid operating expenses including insurance, rents, and selling expenses. Prepaid selling expenses are expensed in those periods in which the related revenue is recognized.
NOTE 8. OTHER ASSETS, NET
Other assets as of December 31, 2015 and 2014 are summarized below:
| 2015 | 2014 | |||||||
| (in thousands) | ||||||||
|
Fish nets, net of accumulated amortization of $1,003 and $2,694 |
$ | 1,193 | $ | 1,195 | ||||
|
Insurance receivable |
1,369 | 498 | ||||||
|
Title XI debt issuance costs |
— | 246 | ||||||
|
Other debt issuance costs |
1,150 | 264 | ||||||
|
Deposits and other |
106 | 106 | ||||||
|
Total other assets, net |
$ | 3,818 | $ | 2,309 | ||||
Amortization expense for fishing nets amounted to approximately $1.2 million, $1.3 million, and $1.4 million for the years ended December 31, 2015, 2014 and 2013, respectively.
As of December 31, 2015 and 2014, insurance receivables primarily relate to Jones Act claims for employees aboard its vessels. This estimated amount is recorded gross of estimated claims which may be due to claimants and is included in accrued insurance liabilities.
The Company carries insurance for certain losses relating to its fishing vessels and Jones Act liability for employees aboard its vessels (collectively, “Vessel Claims Insurance”). The typical Vessel Claims Insurance policy contains an annual aggregate deductible (“AAD”) for which Omega Protein remains responsible, while the insurance carrier is responsible for all applicable amounts which exceed the AAD. It is Omega Protein’s policy to accrue current amounts due and record amounts paid out on each claim. Once payments exceed the AAD, Omega Protein records an insurance receivable for a given policy year.
NOTE 9. PROPERTY, PLANT AND EQUIPMENT, NET
Property, plant and equipment, net as of December 31, 2015 and 2014 are summarized below:
| 2015 | 2014 | |||||||
| (in thousands) | ||||||||
|
Land |
$ | 9,407 | $ | 9,326 | ||||
|
Plant assets |
207,249 | 188,498 | ||||||
|
Fishing vessels |
114,453 | 111,379 | ||||||
|
Furniture and fixtures |
12,315 | 7,792 | ||||||
|
Construction in progress |
13,793 | 15,893 | ||||||
|
Total property and equipment |
357,217 | 332,888 | ||||||
|
Less accumulated depreciation and impairment |
(181,128 | ) | (162,956 | ) | ||||
|
Property, plant and equipment, net |
$ | 176,089 | $ | 169,932 | ||||
OMEGA PROTEIN CORPORATION
NOTES TO CONSOLIDATED FINANCIAL STATEMENTS — (Continued)
Depreciation expense for 2015, 2014 and 2013 was $21.1 million, $19.5 million and $18.9 million, respectively.
The Company capitalizes interest as part of the acquisition cost of a qualifying asset. Interest is capitalized only during the period of time required to complete and prepare the asset for its intended use. For 2015, 2014 and 2013, the Company capitalized interest of approximately $0.6 million, $0.6 million and $0.3 million, respectively.
In conjunction with the decision to close its oil concentration facility located in Batavia, Illinois, the Company determined the carrying value of the assets remaining at the facility were no longer recoverable by evaluating the undiscounted cash flows estimated to be generated by those assets as a group and compared it to the carrying amount of those items. The factors inherent in the evaluation relate to management’s knowledge and experience of past purchases and disposals of used food-grade equipment and other potential uses to apply similar processes to various types of oils. As a result, the net carrying value of assets not recoverable was reduced to estimated fair value and an impairment charge of $4.2 million was recognized as of December 31, 2015. See Note 19 – Subsequent Event for additional information.
NOTE 10. GOODWILL AND OTHER INTANGIBLE ASSETS
Goodwill is measured as the excess of the cost of an acquisition over the sum of the amounts assigned to the fair value of tangible and intangible assets acquired less liabilities assumed. All of the Company’s goodwill and other intangible assets are the result of acquisitions in the human nutrition segment.
Goodwill is tested annually for impairment, and whenever an event occurs or circumstances change that would more likely than not indicate that the carrying value of a reporting unit that includes goodwill is greater than the fair value of that reporting unit. Determining whether an indicator of impairment has occurred during an interim period involves a significant amount of judgment. During the interim periods, qualitative factors such as deterioration in general economic conditions, changes in the market for an entity’s products or services, declines in actual or planned revenue or earnings compared with actual and projected results of relevant prior periods, among others, are evaluated to determine if a triggering event which would result in a potential impairment has incurred.
Cyvex and InCon
The 2015 testing related to the Cyvex and InCon reporting unit indicated the carrying value of its customer relations, trade names/secrets and goodwill exceeded their calculated fair values by $0.1 million, $0.6 million and $3.8 million, respectively. The 2014 testing related to the Cyvex and InCon reporting unit indicated the carrying value of its trade names/secrets and goodwill exceeded their calculated fair values by $0.6 million and $4.1 million, respectively. Fair value was determined by utilizing market and income approaches. As a result, impairment charges were recorded through operating income totaling $4.5 million and $4.7 million during 2015 and 2014, respectively. Key assumptions in the fair value calculation include nutraceutical sales volumes and prices, the portion of sales attributable to trade secrets, production costs and the discount rate.
Wisconsin Specialty Protein
During the fourth quarter of 2015, the Company completed its annual impairment testing of goodwill and indefinite life intangible assets related to the WSP reporting unit. The estimated fair value of the WSP reporting unit exceeded its carrying value by $2.5 million or 12% and could be at risk of failing a future step one test. Fair value was determined by utilizing an income approach. Key assumptions in the fair value analysis include annual revenue growth rates, dairy protein product sales volumes and prices, the portion of sales attributable to the tera’s brand name, the cost and successful procurement of adequate quantities of raw materials to meet sales growth, a discount rate of 14.3% and the long-term growth rate utilized in the terminal year of 4%. The assumptions that have the most significant impact on determining the fair value of the WSP reporting units are the discount rate, sales growth rate and the ability to procure adequate quantities of raw material. A 100 basis point increase in the discount rate would decrease the estimated fair value by approximately 26%, while a reduction in the terminal year sales growth rate assumption by 100 basis points would decrease the estimated fair value by approximately 18%. The sales growth rates utilized in the forecast are predicated on the Company’s ability to successfully introduce new products to the market as well as expand its distribution to international markets. In addition, the Company’s products are composed of key raw materials that are purchased from third parties. The Company has experienced pricing volatility with respect to these key raw materials in the past and, in the event of a price increase, the Company may not be successful in passing along such an increase to its customers. If these assumptions change in the future, the Company may be required to record an impairment charge on a portion or all of its goodwill, indefinite-lived intangible assets or long-lived assets.
Bioriginal Food & Science
During the second quarter of 2015, the Company completed its first annual impairment testing of goodwill and indefinite life intangible assets related to its acquisition of Bioriginal Food & Science in September 2014. As of June 30, 2015, the calculated fair value of Bioriginal Food & Science’s trade name exceeded its $3.8 million carrying value by 7% and the calculated fair value of goodwill and other indefinite lived intangible assets exceeded their $26.5 million carrying values by 13%. The Company does not consider the carrying value of these assets to be at risk due to the level of profitability of Bioriginal Food & Science. Key assumptions in the fair value calculation include sales volumes and prices, the portion of sales attributable to trade names, the cost and availability of raw materials and the discount rate.
OMEGA PROTEIN CORPORATION
NOTES TO CONSOLIDATED FINANCIAL STATEMENTS — (Continued)
The following table summarizes the changes in the carrying amount of goodwill by reporting unit (in thousands):
|
Bioriginal Food & Science |
WSP |
Cyvex and InCon |
Total |
|||||||||||||
|
January 1, 2014 |
$ | — | 11,614 | 7,986 | $ | 19,600 | ||||||||||
|
Acquisitions |
27,462 | — | — | 27,462 | ||||||||||||
|
Impairment |
— | — | (4,144 | ) | (4,144 | ) | ||||||||||
|
Foreign currency translation adjustment |
(417 | ) | — | — | (417 | ) | ||||||||||
|
December 31, 2014 |
$ | 27,045 | 11,614 | 3,842 | $ | 42,501 | ||||||||||
|
Impairment |
— | — | (3,842 | ) | (3,842 | ) | ||||||||||
|
Foreign currency translation adjustment |
(532 | ) | — | — | (532 | ) | ||||||||||
|
December 31, 2015 |
$ | 26,513 | 11,614 | — | $ | 38,127 | ||||||||||
The following table summarizes the Company’s intangible assets (in thousands):
|
Balance at January 1, 2015 |
(1) Amortization |
Impairment |
Foreign currency translation adjustment |
Balance at December 31, 2015 |
||||||||||||||||
|
Customer relationships and non-competes, net of accumulated amortization of $2,344 and $4,304, respectively |
$ | 17,090 | (1,960 | ) | (101 | ) | (178 | ) | $ | 14,851 | ||||||||||
|
Indefinite life intangibles – trade names/secrets and other |
5,912 | — | (552 | ) | (104 | ) | 5,256 | |||||||||||||
|
Total intangible assets |
$ | 23,002 | (1,960 | ) | (653 | ) | (282 | ) | $ | 20,107 | ||||||||||
|
Balance at January 1, 2014 |
Acquisition |
(1) Amortization |
Impairment |
Foreign currency translation adjustment |
Balance at December 31, 2014 |
|||||||||||||||||||
|
Customer relationships and non-competes, net of accumulated amortization of $1,248 and $2,344, respectively |
$ | 5,317 | 13,060 | (1,096 | ) | — | (191 | ) | $ | 17,090 | ||||||||||||||
|
Indefinite life intangibles – trade names/secrets and other |
2,615 | 3,927 | — | (574 | ) | (56 | ) | 5,912 | ||||||||||||||||
|
Total intangible assets |
$ | 7,932 | 16,987 | (1,096 | ) | (574 | ) | (247 | ) | $ | 23,002 | |||||||||||||
|
(1) |
Weighted average life of 10 years. |
Amortization expense of the Company’s intangible assets for the year ended December 31, 2015, 2014 and 2013 was approximately $2.0 million, $1.1 million and $0.6 million, respectively. The table below shows estimated future amortization expense related to intangible assets (in thousands):
|
2016 |
$ | 1,943 | ||
|
2017 |
1,943 | |||
|
2018 |
1,943 | |||
|
2019 |
1,943 | |||
|
Thereafter |
7,079 | |||
|
Total estimated future amortization expense |
$ | 14,851 |
OMEGA PROTEIN CORPORATION
NOTES TO CONSOLIDATED FINANCIAL STATEMENTS — (Continued)
NOTE 11. NOTES PAYABLE AND LONG-TERM DEBT
At December 31, 2015 and 2014, the Company's long-term debt consisted of the following:
|
2015 |
2014 |
|||||||
|
(in thousands) |
||||||||
|
U.S. government guaranteed obligations (Title XI loans) collateralized by a first lien on certain vessels and certain plant assets: |
||||||||
|
Repaid during 2015, interest from 5.7% to 6.6% |
$ | — | $ | 21,111 | ||||
|
Amounts due on Loan Agreement in August 2020, interest at a Base Rate, LIBOR, and CDOR plus an applicable margin (1.49% to 2.7% at December 31, 2015) |
22,882 | — | ||||||
|
Amounts due on prior loan agreement in March 2017, interest at LIBOR plus an applicable rate (1.84% at December 31, 2014) |
— | 2,000 | ||||||
|
ING Commercial Finance B.V., interest at EURIBOR plus an applicable rate (1.70% and 1.76% at December 31, 2015 and 2014, respectively) |
1,214 | 2,367 | ||||||
|
HSBC credit facility, repaid August 2015, interest at HSBC prime rate plus an applicable rate (4.5% December 31, 2014) |
— | 9,749 | ||||||
|
Total debt |
24,096 | 35,227 | ||||||
|
Less current maturities |
(1,214 | ) | (14,741 | ) | ||||
|
Long-term debt |
$ | 22,882 | $ | 20,486 | ||||
The estimated fair value of the Company’s total debt at December 31, 2015 and 2014, based on quoted market prices available to the Company for issuance of similar debt with similar terms (level 2), was $24.1 million and $36.9 million, respectively.
The Title XI loans, repaid during 2015, were secured by certain liens on the Company’s fishing vessels and mortgages on the Company’s Reedville, Virginia and Abbeville, Louisiana plants.
In June 2011, pursuant to the Title XI program, the United States Department of Commerce Fisheries Finance Program (the “FFP”) approved a financing application made by the Company in the amount of $10 million (the “Approval Letter”) which expires on June 20, 2016. To date, the Company has not borrowed any amounts under the Approval Letter and its ability to do so has been adversely affected by an Environment Protection Agency (“E.P.A.”) notice that the Company’s Omega Protein subsidiary is ineligible, as a result of its previous convictions under the Clean Water Act, for receipt of government contracts or benefits in certain cases. See “Item 1A. Risk Factors” for further detail on this E.P.A. notice. As of December 31, 2015, the Company had no borrowings outstanding under Title XI.
On August 20, 2015 (the “Closing Date”), the Company and certain subsidiaries entered into a Second Amended and Restated Loan Agreement (the “Loan Agreement”) with Wells Fargo Bank, National Association, as administrative agent (the “Agent”) for the lenders (currently Wells Fargo Bank, N.A., JP Morgan Chase Bank, N.A. and BMO Harris Bank, N.A.) (collectively, the “Lenders”) pursuant to which the Lenders agreed to extend credit to the Company in the form of loans (each a “Loan” and collectively, the “Loans”) on a revolving basis of up to $125.0 million in the aggregate (the “Commitment”), with $95.0 million of such Commitment allocated to Revolving A Loans to be made to the Company or Omega Protein in U.S. Dollars or Alternative Currencies (as such term is defined in the Loan Agreement) and $30.0 million of such Commitment allocated to Revolving B Loans to be made to the Company and certain subsidiaries, including Bioriginal Food & Science, in U.S. Dollars or Canadian Dollars. The Commitment includes a sub-facility for swingline loans up to an amount not to exceed $10.0 million, a sub-facility for standby letters of credit issued for the account of the Company or Omega Protein up to an amount not to exceed $20.0 million, a sub-facility for standby or commercial letters of credit issued for the account of Bioriginal Food & Science up to an amount not to exceed $7.5 million (subject to a temporary increase of $9.0 million), and an accordion feature that allows the Company to increase the amount of the Commitment up to an additional $75.0 million, subject to the further commitments of the Lenders and other customary conditions precedent. The Loan Agreement amended and restated the Company’s existing senior secured credit facility (the “Prior Loan Agreement”). The proceeds of the Loan Agreement were and will be used to (a) refinance existing debt under the Prior Loan Agreement, (b) pay fees and expenses incurred in connection with the refinancing of the Prior Loan Agreement and the entry into the Loan Agreement, (c) refinance certain debt owing to HSBC Bank Canada pursuant to an agreement that has been terminated, and (d) provide ongoing working capital and for other general corporate purposes of the Company and its subsidiaries.
In total, Company had $1.2 million in deferred debt issuance costs associated with the Loan Agreement, $0.2 million of which was carried over from the Prior Loan Agreement, on the Consolidated Balance Sheet. As of December 31, 2015 unamortized debt issuance costs included in other assets was $1.1 million.
OMEGA PROTEIN CORPORATION
NOTES TO CONSOLIDATED FINANCIAL STATEMENTS — (Continued)
Any Loans will bear interest as follows:
|
● |
Revolving A Loans and Revolving B Loans denominated in U.S. Dollars will bear interest, at the election of the Company, at (a) the Base Rate (defined as a fluctuating rate equal to the highest of: (x) the rate of interest most recently announced by the Agent as its “prime rate,” (y) the Federal Funds Rate plus 1.00% and (z) a rate determined by the Agent to be 1.50% above daily one month LIBOR (except during certain periods of time)) plus the Applicable Margin (as defined in the Loan Agreement), or (b) a rate per annum determined by the Agent to be equal to LIBOR in effect for the applicable interest period plus the Applicable Margin. |
|
● |
Revolving A Loans denominated in Alternative Currencies will bear interest at a rate per annum determined by the Agent to be equal to LIBOR in effect for the applicable interest period plus the Applicable Margin. |
|
● |
Revolving B Loans denominated in Canadian Dollars will bear interest at (a) the Canadian Prime Rate (defined as a fluctuating rate equal to the highest of (y) the rate of interest most recently announced by the Agent as its reference rate in effect for determining interest rates for Canadian Dollar denominated commercial loans in Canada and (z) a rate determined by the Agent to be 1.50% above daily one month CDOR plus the Applicable Margin) or (b) CDOR plus the Applicable Margin. |
|
● |
Swingline Loans shall bear interest at the Base Rate plus the Applicable Margin. |
All obligations of the Company under the Loan Agreement are secured by a first priority lien (subject to Permitted Liens, as defined in the Loan Agreement) against all assets of each of the Company and certain subsidiaries (other than certain excluded property, including property pledged to secure loans from the national fisheries finance program). Collateral provided by (a) the Company and its U.S.-domiciled subsidiaries shall guarantee or secure, as applicable, all of the obligations under the Loan Agreement and other Loan Documents and (b) Bioriginal Food & Science and, if applicable, its subsidiaries, shall only guarantee or secure, as applicable, obligations of Bioriginal Food & Science in respect of Revolving B Loans.
The Loan Agreement requires the Company to comply with various affirmative and negative covenants affecting the Company’s businesses and operations. In addition, the Loan Agreement requires the Company to comply with the following financial covenants:
|
● |
The Company is required to maintain on a consolidated basis Tangible Net Worth equal to at least the sum of the following: (a) $170,000,000, plus (b) 50% of net income (if positive, with no deduction for losses) earned in each quarterly accounting period commencing after December 31, 2014, plus (c) 75% of the net proceeds from any Equity Interests (as defined in the Loan Agreement) issued after the Closing Date, plus (d) 100% of any increase in stockholders’ equity resulting from the conversion of debt securities to Equity Interests after the Closing Date. |
|
● |
The Company is required to maintain on a consolidated basis a Consolidated Total Leverage Ratio of not greater than 3.00 to 1.00. This ratio will be calculated at the end of each fiscal quarter. |
|
● |
The Company is required to maintain on a consolidated basis a Consolidated Fixed Charge Coverage Ratio of at least 1.25 to 1.00. This ratio will be calculated at the end of each fiscal quarter. |
All Loans and all other obligations outstanding under the Loan Agreement shall be payable in full in August 2020.
As of December 31, 2015 and December 31, 2014, the Company had $22.9 million and $2.0 million outstanding under the Loan Agreement and Prior Loan Agreement, respectively, and approximately $7.8 million and $3.5 million in letters of credit as of December 31, 2015 and 2014, respectively, net of $4.3 million in back-to-back letters of credit in the process of being returned by its counterparty as of December 31, 2015. As of December 31, 2015, the Company was in compliance with all financial covenants under the Loan Agreement. The Company has no off-balance sheet arrangements other than normal operating leases and standby letters of credit. For a more detailed description of the Loan Agreement, see the Company’s Current Report on Form 8-K filed with the SEC on August 24, 2015.
In March 2015, Bioriginal Food & Science Europe extended the terms of its credit facility with ING Commercial Finance B.V. which provides borrowings up to an amount based on accounts receivable and inventory balances, and matures on March 31, 2018. Advances are repayable on demand and bear interest payable monthly at 1.75% + EURIBOR (currently 1.70%). This credit facility is secured by accounts receivable and inventory of Bioriginal Food & Science Europe to a maximum of 85% of accounts receivable and 60% of inventory. This credit facility contains cross default provisions and other covenants. As of December 31, 2015, $1.2 million was outstanding under this credit facility, which is included in current maturities.
OMEGA PROTEIN CORPORATION
NOTES TO CONSOLIDATED FINANCIAL STATEMENTS — (Continued)
In June 2010, Bioriginal Food & Science Europe entered into a credit facility with ING Bank N.V. which provides borrowings up to 250,000 Euro and matures on November 16, 2016. Under the credit facility, interest is paid at 2.70% plus the EURIBOR rate (currently 2.49%). This credit facility is secured by Bioriginal Food & Science Europe’s equipment. This facility contains cross default provisions and other covenants. As of December 31, 2015, there were no outstanding borrowings under this credit facility.
In April 2014, Bioriginal Food & Science Canada entered into a credit facility with HSBC Bank of Canada which provided borrowings up to $20 million Canadian Dollars. This credit facility was repaid in August 2015 and the agreement was terminated.
Annual Maturities
The annual maturities of long-term debt for the five years ending December 31, 2020 and thereafter are as follows (in thousands):
|
2016 |
2017 |
2018 |
2019 |
2020 |
Thereafter |
|||||||||||||||||
| $ | 1,214 | $ | — | $ | — | $ | — | $ | 22,882 | $ | — | |||||||||||
NOTE 12. RECONCILIATION OF BASIC AND DILUTED PER SHARE DATA (in thousands except per share data)
|
For the Years Ended December 31: |
2015 |
2014 |
2013 |
|||||||||||||||||||||
|
Allocation of earnings: |
||||||||||||||||||||||||
|
Net income |
$ | 23,975 | $ | 18,461 | $ | 30,515 | ||||||||||||||||||
|
Income allocated to participating securities |
(626 | ) | (525 | ) | (687 | ) | ||||||||||||||||||
|
Income allocated to common shares outstanding |
$ | 23,349 | $ | 17,936 | $ | 29,828 | ||||||||||||||||||
|
Weighted average common shares outstanding |
21,307 | 20,562 | 19,913 | |||||||||||||||||||||
|
Basic earnings per share |
$ | 1.10 | $ | 0.87 | $ | 1.50 | ||||||||||||||||||
|
Stock options assumed exercised |
425 | 606 | 721 | |||||||||||||||||||||
|
Weighted average diluted common shares and potential common share equivalents outstanding |
21,732 | 21,168 | 20,634 | |||||||||||||||||||||
|
Diluted earnings per share |
$ | 1.07 | $ | 0.85 | $ | 1.45 | ||||||||||||||||||
Options to purchase the following number of shares of common stock (in thousands) were outstanding during the year ended December 31, but were excluded from the computation of diluted earnings per share because the adjusted exercise prices of the options based upon the assumed proceeds were greater than the average market price of the shares during that year.
|
2015 |
2014 |
2013 | ||
|
0 |
125 |
130 |
NOTE 13. INCOME TAXES
The components of income before income taxes consists of the following:
| Years Ended December 31, | ||||||||||||
| 2015 | 2014 | 2013 | ||||||||||
| (in thousands) | ||||||||||||
|
Domestic |
$ | 34,598 | $ | 30,137 | $ | 45,979 | ||||||
|
Foreign |
3,997 | 70 | — | |||||||||
|
Total income before income taxes |
$ | 38,595 | $ | 30,207 | $ | 45,979 | ||||||
OMEGA PROTEIN CORPORATION
NOTES TO CONSOLIDATED FINANCIAL STATEMENTS — (Continued)
The Company’s provision for income taxes consisted of the following:
| Years Ended December 31, | ||||||||||||
| 2015 | 2014 | 2013 | ||||||||||
|
|
(in thousands) | |||||||||||
| Current: | ||||||||||||
|
State |
$ | 1,435 | $ | 756 | $ | 1,265 | ||||||
|
U.S. |
8,352 | 6,029 | 11,031 | |||||||||
|
Foreign |
1,663 | 188 | — | |||||||||
|
Deferred: |
||||||||||||
|
State |
(671 | ) | 358 | 227 | ||||||||
|
U.S. |
3,889 | 4,452 | 2,941 | |||||||||
|
Foreign |
(48 | ) | (37 | ) | — | |||||||
|
Provision (benefit) for income taxes |
$ | 14,620 | $ | 11,746 | $ | 15,464 | ||||||
As of December 31, 2015, for state income tax purposes, the Company had $9.1 million in net operating losses expiring in 2016 through 2035.
The following table reconciles the income tax provisions computed using the U.S. statutory rate of 35% for 2015, 2014 and 2013 to the provisions reflected in the financial statements.
| Years Ended December 31, | ||||||||||||
| 2015 | 2014 | 2013 | ||||||||||
| (in thousands) | ||||||||||||
|
Taxes at statutory rate |
$ | 13,508 | $ | 10,569 | $ | 16,097 | ||||||
|
Non-deductible expenses |
199 | 94 | 145 | |||||||||
|
Qualified production activities deduction |
(762 | ) | (403 | ) | (1,334 | ) | ||||||
|
Non-deductible acquisition costs |
— | 809 | — | |||||||||
|
Officer Compensation |
1,474 | 382 | — | |||||||||
|
Tax impact of foreign earnings |
(389 | ) | 2 | — | ||||||||
|
State taxes, net of federal benefit |
775 | 761 | 969 | |||||||||
|
Impact of federal tax credits |
(65 | ) | (147 | ) | (85 | ) | ||||||
|
Change in deferred tax asset valuation allowance |
98 | (33 | ) | (77 | ) | |||||||
|
Other |
(218 | ) | (288 | ) | (251 | ) | ||||||
|
Provision (benefit) for income taxes |
$ | 14,620 | $ | 11,746 | $ | 15,464 | ||||||
Temporary differences and tax credit carryforwards that gave rise to significant portions of deferred tax assets and liabilities as of December 31, 2015 and 2014 are as shown below:
| 2015 | 2014 | |||||||
| (in thousands) | ||||||||
| Deferred tax assets: | ||||||||
|
Assets and accruals not yet deductible |
$ | 6,596 | $ | 4,911 | ||||
|
Equity based compensation |
1,626 | 2,972 | ||||||
|
Equity in loss of unconsolidated affiliates |
— | 125 | ||||||
|
Net operating loss carryforward |
205 | 103 | ||||||
|
Tax credit carryforward |
— | 225 | ||||||
|
Pension liability |
4,764 | 4,478 | ||||||
|
State income tax |
334 | 456 | ||||||
|
Valuation allowance |
(423 | ) | (551 | ) | ||||
|
Total deferred tax assets |
13,102 | 12,719 | ||||||
| Deferred tax liabilities: | ||||||||
|
Property and equipment |
(27,053 | ) | (25,647 | ) | ||||
|
Intangible assets |
(1,608 | ) | (3,078 | ) | ||||
|
Pension and other retirement benefits |
(2,647 | ) | (2,597 | ) | ||||
|
Assets currently deductible |
(6,216 | ) | (5,475 | ) | ||||
|
Total deferred tax liabilities |
(37,524 | ) | (36,797 | ) | ||||
|
Net deferred tax liability |
$ | (24,422 | ) | $ | (24,078 | ) | ||
|
Deferred income tax asset (liability) current |
$ | 3,422 | $ | 1,871 | ||||
|
Deferred income tax asset (liability) non-current |
(27,844 | ) | (25,949 | ) | ||||
|
Net deferred tax liability |
$ | (24,422 | ) | $ | (24,078 | ) | ||
OMEGA PROTEIN CORPORATION
NOTES TO CONSOLIDATED FINANCIAL STATEMENTS — (Continued)
The Company or one of its subsidiaries files income tax returns in the U.S. federal jurisdiction, and various states and foreign jurisdictions. With a few exceptions, the Company is no longer subject to U.S. federal, state and local or non-U.S. income tax examinations by tax authorities for years before 2014. The Company is not currently under examination by the Internal Revenue Service, the various states or foreign jurisdictions.
Below is a reconciliation of the beginning and ending amount of unrecognized tax benefits, as presented in “Other long-term liabilities” on the balance sheet:
|
2015 |
2014 |
2013 |
||||||||||
|
(in thousands) |
||||||||||||
|
Balance at January 1, |
$ | 1,404 | $ | 1,572 | $ | 1,514 | ||||||
|
Additions for tax positions of prior years |
205 | 6 | 58 | |||||||||
|
Reductions for tax positions of prior years |
(490 | ) | (174 | ) | — | |||||||
|
Additions for tax positions related to the current year |
3 | — | — | |||||||||
|
Balance at December 31, |
$ | 1,122 | $ | 1,404 | $ | 1,572 | ||||||
Included in the balances at December 31, 2015, 2014 and 2013 are $1.1 million, $1.4 million and $1.6 million, respectively, of tax positions for which the ultimate deductibility is uncertain. The final settlement of these uncertain positions could positively or negatively impact the effective tax rate in the period settled. Because of the impact of deferred tax accounting, other than interest and penalties, the disallowance of the shorter deductibility period would not materially affect the annual effective tax rate but would accelerate the payment of cash to the taxing authority to an earlier period.
The Company recognizes interest accrued related to unrecognized tax benefits in interest expense and penalties in operating expenses. The Company recorded income of $113,000 in reversed interest charges and income of $62,000 in reversed penalty charges at December 31, 2015. The Company recorded an accrual for payment of $12,000 in interest and $43,000 in penalties at December 31, 2014.
NOTE 14. ACCRUED LIABILITIES
Accrued liabilities as of December 31, 2015 and 2014 are summarized below:
|
2015 |
2014 |
|||||||
|
(in thousands) |
||||||||
|
Insurance |
$ | 9,751 | $ | 5,998 | ||||
|
Reserve for plant closure costs |
375 | 456 | ||||||
|
Salary and benefits |
9,630 | 7,273 | ||||||
|
Trade creditors |
7,085 | 5,045 | ||||||
|
Taxes, other than income tax |
145 | 222 | ||||||
|
Income tax |
3,199 | — | ||||||
|
Energy swap liability, current portion |
2,849 | 2,568 | ||||||
|
Deferred revenue |
99 | 1,400 | ||||||
|
Accrued interest |
35 | 246 | ||||||
|
Other |
86 | 8 | ||||||
|
Total accrued liabilities |
$ | 33,254 | $ | 23,216 | ||||
Deferred revenue represents payments primarily received from international customers related to revenues which were not recognized until the subsequent period due to revenue recognition criteria.
OMEGA PROTEIN CORPORATION
NOTES TO CONSOLIDATED FINANCIAL STATEMENTS — (Continued)
NOTE 15. BENEFIT PLANS
Defined Contribution Plan
All qualified employees of the Company are covered under the Omega Protein 401(k) Savings and Retirement Plan (the “Plan”) as of December 31, 2015. WSP’s 401(k) plan was incorporated into the Plan as of May 1, 2013. The Company’s matching contributions to the Plan were approximately $1.4 million, $1.2 million, and $1.2 million during 2015, 2014, and 2013, respectively.
Employees of Bioriginal Food & Science are covered under a separate defined contribution plan. Bioriginal Food & Science’s matching contributions to its plan during 2015 and from the date the Company acquired Bioriginal Food & Science until December 31, 2014, were $0.2 million and $0.1 million, respectively.
Pension Plan
Plan benefits are generally based on an employee’s years of service and compensation level. The plan has adopted an excess benefit formula integrated with covered compensation.
In 2002, the Board of Directors froze the Company’s pension plan in accordance with ERISA rules and regulations so that new employees, after July 31, 2002, are not eligible to participate in the pension plan and further benefits no longer accrue for existing participants. The freezing of the pension plan had the effect of vesting all existing participants in their pension benefits in the plan.
Amounts listed as pension benefits adjustment under the caption “Comprehensive Income” on the Consolidated Statements of Stockholders’ Equity of $(0.5) million, $(1.4) million and $3.6 million for 2015, 2014 and 2013, respectively, represent the change, net of tax, in the portion of the additional pension liability recorded under “Accumulated Other Comprehensive Loss” on the Consolidated Balance Sheet. During 2016, the Company expects total net periodic benefit cost to be approximately $1.5 million. The amounts in accumulated other comprehensive loss that are expected to be recognized as a component of net periodic benefit cost during the 2016 year are as follows (in thousands):
|
Net Actuarial Loss |
$ | 1,365 |
The Company’s funding policy is to make contributions as required by applicable regulations. The Company uses a December 31 measurement date for its pension plan. The following tables set forth the benefit obligations, fair value of plan assets, and the funded status of the Company’s pension plan, amounts recognized in the Company’s financial statements, and the principal weighted average assumptions used:
| Years Ended December 31, | ||||||||
|
2015 |
2014 |
|||||||
|
(in thousands) |
||||||||
|
Accumulated Benefit Obligations |
$ | 26,101 | $ | 27,068 | ||||
|
Change in Benefit Obligation |
||||||||
|
Benefit Obligation at beginning of year |
$ | 27,068 | $ | 25,945 | ||||
|
Interest Cost |
917 | 1,093 | ||||||
|
Actuarial (Gain) Loss |
597 | 2,776 | ||||||
|
Benefits Paid |
(2,481 | ) | (2,746 | ) | ||||
|
Benefit Obligation at end of year |
$ | 26,101 | $ | 27,068 | ||||
|
Change in Plan Assets |
||||||||
|
Plan Assets at Fair Value at beginning of year |
$ | 21,693 | $ | 21,828 | ||||
|
Actual Return on Plan Assets |
(317 | ) | 871 | |||||
|
Company Contributions |
1,158 | 1,740 | ||||||
|
Benefits Paid |
(2,481 | ) | (2,746 | ) | ||||
|
Plan Assets at Fair Value at end of year |
$ | 20,053 | $ | 21,693 | ||||
|
Funded Status of the Plan |
$ | (6,048 | ) | $ | (5,375 | ) | ||
|
Additional Amounts Recognized in the Statement of Financial Position: |
||||||||
|
Long-term Liabilities |
$ | (6,048 | ) | $ | (5,375 | ) | ||
|
Amounts Recognized in Accumulated Other Comprehensive Loss: |
||||||||
|
Net Actuarial (Loss) Gain, net of tax |
$ | (8,335 | ) | $ | (7,804 | ) | ||
|
Other Changes in Plan Assets and Benefit Obligations Recognized in Other Comprehensive Loss: |
||||||||
|
Net Actuarial (Loss) Gain, net of tax |
$ | (1,311 | ) | $ | (2,010 | ) | ||
|
Reversal of Amortization Item: |
||||||||
|
Amortization of Net Loss, net of tax |
780 | 593 | ||||||
|
Total Recognized in Other Comprehensive Loss, net of tax |
$ | (531 | ) | $ | (1,417 | ) | ||
OMEGA PROTEIN CORPORATION
NOTES TO CONSOLIDATED FINANCIAL STATEMENTS — (Continued)
The Company, in consultations with its actuarial firm, employs a building block approach in determining the assumed long-term rate of return for plan assets. The Company reviews historical market data and long-term historical relationships between equities and fixed income in accordance with the widely-accepted capital market principle that assets with higher volatility generally generate greater returns over the long run. The Company also evaluates current market factors such as inflation and interest rates before it determines long-term capital market assumptions. After taking into account diversification of asset classes and the need to periodically re-balance asset classes, the Company establishes the assumed long-term portfolio rate of return by a building block approach. The Company also reviews peer data and historical returns to check its long-term rate of return for reasonability and appropriateness.
A change in the actuarial assumptions, such as the assumed discount rate, creates deferred actuarial gains or losses. Generally, when the assumed discount rate decreases compared to the prior measurement date, a deferred actuarial loss is created. When the assumed discount rate increases compared to the prior measurement date, a deferred actuarial gain is created. Actuarial gains and losses also are created when actual results differ from assumptions. The net of the deferred gains and losses are amortized to pension expense over the average service life of the remaining plan participants, when it exceeds certain thresholds defined in FASB ASC 715-30-35. This approach to amortization of gains and losses has the effect of reducing the volatility of pension expense attributable to investment returns and liability experience. Over time, it is not expected to reduce or increase the pension expense relative to an approach that immediately recognizes losses and gains.
As a result of the annual review of assumptions, the Company’s 2016 expected return on plan assets decreased from 7.25% to 7.00%, and the discount rate increased from 3.51% to 3.99%. The discount rate selected by the Company is consistent with general movements in interest rates. Additionally, the Company performed a yield curve analysis which concluded that when the Citigroup Above Median Double-A Yield Curve is applied to the Plan, it produces a discount rate of 3.99% and the selected discount rate is equal to the yield curve analysis.
|
Years Ended December 31, |
||||||||
|
2015 |
2014 |
|||||||
|
Assumptions |
||||||||
|
Weighted average assumptions used to determine benefit obligations at end of year |
||||||||
|
Discount Rate |
3.99 | % | 3.51 | % | ||||
|
Long-Term Rate of Return |
7.00 | % | 7.25 | % | ||||
|
Years Ended December 31, |
||||||||||||
|
2015 |
2014 |
2013 |
||||||||||
|
Weighted average assumptions used to determine net periodic benefit cost at beginning of year |
||||||||||||
|
Discount Rate |
3.51 | % | 4.36 | % | 3.47 | % | ||||||
|
Long-Term Rate of Return |
7.25 | % | 7.25 | % | 7.25 | % | ||||||
| Years Ended December 31, | ||||||||||||
|
2015 |
2014 |
2013 |
||||||||||
| (in thousands) | ||||||||||||
| Components of net periodic benefit cost: | ||||||||||||
|
Interest cost |
$ | 917 | $ | 1,093 | $ | 990 | ||||||
|
Expected return on plan assets |
(1,107 | ) | (1,194 | ) | (1,027 | ) | ||||||
|
Amortization of net loss |
1,187 | 914 | 1,561 | |||||||||
|
Net periodic benefit cost |
$ | 997 | $ | 813 | $ | 1,524 | ||||||
OMEGA PROTEIN CORPORATION
NOTES TO CONSOLIDATED FINANCIAL STATEMENTS — (Continued)
Plan Assets
The Company’s pension plan weighted-average asset allocations at December 31, 2015 and 2014, by asset category are shown below:
|
Plan Assets at December 31, |
||||||||||||||||
|
Asset Category |
2015 |
2014 |
||||||||||||||
|
Actual |
Target (1) |
Actual |
Target (1) |
|||||||||||||
|
Equity |
62.1 | % | 60.0 | % | 64.5 | % | 60.0 | % | ||||||||
|
Debt securities |
37.9 | 40.0 | 35.5 | 40.0 | ||||||||||||
|
Total |
100.0 | % | 100.0 | % | 100.0 | % | 100.0 | % | ||||||||
(1) Target is subject to ranges that include the actual allocations.
The fair values of the Company’s pension plan assets by major category are presented below. The fair value of the Company’s plan assets are estimated based on quoted prices for similar instruments in active markets and therefore are categorized, except as noted, as Level 2 of the fair value hierarchy.
|
Fair Value of Plan Assets at |
||||||||
|
December 31, Fair Value Measurements Using Level 2 (in thousands) (except as noted) |
||||||||
|
Asset Category |
2015 |
2014 |
||||||
|
Equity Securities |
||||||||
|
Large-Cap Growth |
$ | 4,166 | $ | 4,535 | ||||
|
Large Company Value |
1,421 | 1,601 | ||||||
|
Mid-Cap Growth |
758 | 893 | ||||||
|
Mid-Cap Value |
605 | 700 | ||||||
|
Small Company Growth |
563 | 692 | ||||||
|
Small Company Value |
782 | 875 | ||||||
|
International |
3,104 | * | 3,559 | * | ||||
|
REIT |
1,061 | 1,139 | ||||||
|
Fixed Income Securities |
||||||||
|
U.S. Treasuries |
1,236 | 1,202 | ||||||
|
U.S. Govt. Agencies |
1,141 | 1,002 | ||||||
|
Corporate bonds |
3,120 | 4,241 | ||||||
|
International fixed income |
150 | — | ||||||
|
Asset-backed securities |
550 | 490 | ||||||
|
Mortgage-backed securities |
806 | 290 | ||||||
|
Cash Equivalents |
590 | 474 | ||||||
|
Total |
$ | 20,053 | $ | 21,693 | ||||
*Categorized as Level 1 of the fair value hierarchy.
Plan assets are well diversified and managed by independent investment advisors, who are in turn overseen and monitored by an investment advisor engaged by the Investment Committee. The Plan’s investment objective is long-term capital appreciation with a prudent level of risk. The Plan’s Investment Committee periodically completes asset performance studies with the goal of maintaining an optimal asset allocation in order to meet future Plan benefit obligations. The investment objectives of the Plan assets have a long-term focus and the Plan is invested in accordance with prudent investment practices that emphasize long-term investment fundamentals which avoid any significant concentrations of risks.
OMEGA PROTEIN CORPORATION
NOTES TO CONSOLIDATED FINANCIAL STATEMENTS — (Continued)
Equity securities do not include any of the Company’s common stock at December 31, 2015 and 2014, respectively.
Projected Benefit Payments for the years ending December 31, 2016 – 2025
| (in thousands) | ||||||||||||||||||||||
|
2016 |
2017 |
2018 |
2019 |
2020 |
2021-2025 | |||||||||||||||||
| $ | 1,789 | $ | 1,772 | $ | 1,775 | $ | 1,779 | $ | 1,772 | $ | 8,619 | |||||||||||
Expected Contributions during 2016
The Company expects to make contributions of $0.6 million to the pension plan in 2016.
Stock Incentive Plans
On April 13, 2006, the Board of Directors approved the establishment of the Omega Protein Corporation 2006 Incentive Plan (“2006 Incentive Plan”) which was subsequently approved by the Company’s stockholders and became effective on June 7, 2006.
The Company has granted stock options under the 2006 Incentive Plan in the form of non-qualified stock options. See “Stock-Based Compensation” regarding the method the Company utilizes to record compensation expense for employee stock options. The Company establishes the exercise price based on the fair market value of the Company’s stock (as defined in the relevant plan) at the date of grant. Each quarter, the Company reports the potential dilutive impact of stock options in its diluted earnings per common share using the treasury-stock method. Out-of-the-money stock options (i.e., the average stock price during the period is below the strike price of the stock option) are not included in diluted earnings per common share.
The Company has also issued shares of restricted stock under the 2006 Incentive Plan. Holders of shares of restricted stock are entitled to all rights of a stockholder of the Company, including the right to vote the shares and receive any dividends or other distributions. The shares are considered issued and outstanding on the date granted and are included in the basic earnings per share calculation.
On April 21, 2015, the Board of Directors approved the Omega Protein Corporation 2015 Incentive Plan (“2015 Incentive Plan”) which was subsequently approved by the Company’s stockholders and became effective on June 25, 2015. The maximum aggregate number of shares of stock that may be issued with respect to awards under the 2015 Incentive Plan is 1,055,000. Shares of stock of an outstanding award that for any reason expire or are terminated, forfeited or canceled are available for issuance under the 2015 Incentive Plan. Shares withheld for the purchase price of an option or stock appreciation right are not available for issuance under the 2015 Incentive Plan. Awards to be paid solely in cash are not counted against the number of shares of stock available for the issuance of awards under the 2015 Incentive Plan. Shares of stock issued under awards granted in assumption, substitution or exchange for previously granted awards of a company acquired by the Company do not reduce the shares of stock available under the 2015 Incentive Plan and available shares under a stockholder approved plan of an acquired company (as appropriately adjusted to reflect the transaction) may be used for awards under the 2015 Incentive Plan and do not reduce the 2015 Incentive Plan’s share reserve as provided herein (subject to the listing requirements of the New York Stock Exchange, as long as the Stock is listed on this exchange or the applicable other exchange requirements on which the Stock is listed).
Stock-Based Compensation
Stock Options
The Company has issued stock options under the 2006 Incentive Plan. Net income for the years ended December 31, 2015, 2014 and 2013 includes $0 million, $0 million and $0.6 million ($0 million, $0 million and $0.4 million after-tax), respectively, of stock-based compensation costs related to stock options which are primarily included in selling, general and administrative expenses in the consolidated statement of comprehensive income. As of December 31, 2015, there was $0 of unrecognized compensation costs related to non-vested stock options.
A summary of option activity under the plans for years 2015, 2014 and 2013 is shown below (options in thousands):
|
2015 |
2014 |
2013 |
||||||||||||||||||||||
|
Number of |
Weighted |
Number of |
Weighted |
Number of |
Weighted |
|||||||||||||||||||
|
Shares |
Average |
Shares |
Average |
Shares |
Average |
|||||||||||||||||||
|
Underlying |
Exercise |
Underlying |
Exercise |
Underlying |
Exercise |
|||||||||||||||||||
|
Options |
Prices |
Options |
Prices |
Options |
||||||||||||||||||||
|
Outstanding at beginning of year |
1,349 | $ | 7.39 | 1,786 | $ | 6.89 | 2,652 | $ | 6.19 | |||||||||||||||
|
Exercised |
(706 | ) | $ | 7.06 | (427 | ) | $ | 5.26 | (859 | ) | $ | 4.67 | ||||||||||||
|
Expired |
— | — | (10 | ) | $ | 9.32 | — | — | ||||||||||||||||
|
Forfeited |
— | — | — | — | (7 | ) | $ | 12.81 | ||||||||||||||||
|
Outstanding and exercisable at end of year |
643 | $ | 7.74 | 1,349 | $ | 7.39 | 1,786 | $ | 6.89 | |||||||||||||||
OMEGA PROTEIN CORPORATION
NOTES TO CONSOLIDATED FINANCIAL STATEMENTS — (Continued)
| Aggregate Intrinsic Value | ||||||||||||
| 2015 | 2014 | 2013 | ||||||||||
| (in thousands) | ||||||||||||
|
Options outstanding as of December 31 |
$ | 9,300 | $ | 4,665 | $ | 9,814 | ||||||
|
Options exercisable as of December 31 |
$ | 9,300 | $ | 4,665 | $ | 9,814 | ||||||
|
Options exercised during the year |
$ | 6,355 | $ | 4,050 | $ | 5,430 | ||||||
The following table further describes the Company’s stock options outstanding as of December 31, 2015 (options in thousands).
|
Options Outstanding and Exercisable |
||||||||||||||
|
Range of Exercise Prices |
Options Outstanding at 12/31/2015 |
Weighted Average Remaining Contractual Life (years) |
Weighted Average Exercise Prices |
|||||||||||
| $2.22 | to | $4.70 | 25 | 4.1 | $ | 4.50 | ||||||||
| $4.71 | to | $6.00 | 20 | 3.5 | $ | 4.77 | ||||||||
| $6.01 | to | $7.55 | 484 | 5.0 | $ | 6.86 | ||||||||
| $7.56 | to | $10.58 | 14 | 6.3 | $ | 7.74 | ||||||||
| $10.59 | to | $15.88 | 100 | 4.2 | $ | 13.41 | ||||||||
| 643 | ||||||||||||||
Restricted Stock
The Company has issued shares of restricted stock under the 2015 Incentive Plan and 2006 Incentive Plan. Shares of restricted stock have generally vested on the third anniversary of the grant date or in equal installments over three years except for shares of restricted stock granted to non-employee directors which vest six months after the grant date. Non-vested shares are generally forfeited upon the termination of employment or service as a director. Holders of shares of restricted stock are entitled to all rights of a stockholder of the Company, including the right to vote the shares and receive any dividends or other distributions. The non-vested shares are considered participating securities and the Company has calculated earnings per share using the two-class method. See Note 12 – Reconciliation of Basic and Diluted Per Share Data.
Net income for the years ended December 31, 2015, 2014 and 2013 includes $2.4 million, $2.0 million and $1.4 million ($1.5 million, $1.3 million and $0.9 million after-tax), respectively, of stock-based compensation costs related to restricted stock which are primarily included in selling, general and administrative expenses in the consolidated statement of comprehensive income. As of December 31, 2015, there was approximately $2.9 million ($1.9 million after tax) of unrecognized compensation cost related to non-vested restricted shares that is expected to be recognized over a weighted-average period of 1.32 years. Based on restricted stock issued as of December 31, 2015, share-based compensation expense for fiscal year 2016 is expected to be approximately $1.8 million ($1.2 million after tax).
OMEGA PROTEIN CORPORATION
NOTES TO CONSOLIDATED FINANCIAL STATEMENTS — (Continued)
The following table shows restricted stock (in thousands) granted under the 2015 Incentive Plan and 2006 Incentive Plan to the Company’s employees and non-employee directors for the year ended December 31, 2015:
|
Date of Restricted |
Grant Date |
||||||||
|
Stock Award |
Fair Value |
Restricted Shares Granted |
Date(s) of Vesting | ||||||
|
February 26, 2015 |
$ | 10.93 | 82 |
February 26, 2016, 2017, 2018 | |||||
|
June 25, 2015 |
$ | 13.99 | 25 |
December 25, 2015 | |||||
|
August 31, 2015 |
$ | 16.98 | 4 |
August 31, 2016, 2017, 2018 | |||||
| 111 | |||||||||
A summary of the Company’s non-vested restricted stock activity is presented below (shares in thousands).
|
2015 |
2014 |
2013 |
|||||||||||||||||||||||
|
Number of |
Wgt. Avg. |
Number of |
Wgt. Avg. |
Number of |
Wgt. Avg. |
||||||||||||||||||||
|
Non-Vested |
Grant Date |
Non-Vested |
Grant Date |
Non-Vested |
Grant Date |
||||||||||||||||||||
|
Shares |
Fair Value |
Shares |
Fair Value |
Shares |
Fair Value |
||||||||||||||||||||
|
Outstanding at beginning of year |
581 | $ | 10.56 | 479 | $ | 7.36 | 421 | $ | 7.19 | ||||||||||||||||
|
Granted |
111 | $ | 11.82 | 356 | (1) | $ | 13.60 | 58 | $ | 8.60 | |||||||||||||||
|
Vested |
(281 | ) | $ | 7.52 | (254 | ) | $ | 8.79 | — | — | |||||||||||||||
|
Forfeited |
(33 | ) | $ | 8.52 | — | — | — | — | |||||||||||||||||
|
Outstanding at end of year |
378 | $ | 13.36 | 581 | $ | 10.56 | 479 | $ | 7.36 | ||||||||||||||||
|
(1) |
In conjunction with the acquisition of Bioriginal Food & Science in September 2014, 238 shares of restricted common stock were issued to the Management Sellers. See Note 2. Acquisition of Bioriginal Food & Science Corp. |
The aggregate intrinsic value of the Company’s outstanding non-vested restricted stock at December 31, 2015, 2014 and 2013 was $8.4 million, $6.1 million and $6.0 million, respectively. Approximately 55,600 shares of the Company’s restricted shares outstanding at December 31, 2015 are expected to vest during the year 2016.
Performance Units
On February 6, 2014, the Company adopted a cash incentive performance unit plan. The value of the units will be determined by reference to the performance of the Company’s common stock during the relevant performance period compared to the performance of the Russell 2000 Index member companies (the “Peer Group”) during that same period. One third of the Performance Units granted will be earned at the end of each calendar year of the performance period and will be valued for the calendar year based on the Total Shareholder Return (“TSR”) of the Company compared to the TSR of the Peer Group. The performance units contain a service provision of approximately 3 years and are liability-classified awards included in other long-term liabilities which are adjusted to fair value on a quarterly basis.
On February 26, 2015, the Company adopted a cash incentive performance unit plan. The value of the units will be determined by reference to the performance of the Company’s common stock during the relevant performance period compared to the performance of the Peer Group during that same period. One third of the Performance Units granted will be earned at the end of each calendar year of the performance period and will be valued for the calendar year based on the TSR of the Company compared to the TSR of the Peer Group. The performance units contain a service provision of approximately 3 years and are liability-classified awards included in other long-term liabilities which are adjusted to fair value on a quarterly basis.
The Company’s compensation expense related to performance units was approximately $1.4 million and $0.3 million for the years ended December 31, 2015 and 2014, respectively, which is primarily reflected in selling, general and administrative expenses in the consolidated statement of comprehensive income. As of December 31, 2015, there was approximately $2.1 million of unrecognized compensation cost related to performance units that is expected to be recognized over the next 1.8 years, of which $1.3 million of compensation expense is expected to be recognized during the year 2016.
NOTE 16. COMMITMENTS AND CONTINGENCIES
Operating Lease Payable
The Company has noncancellable operating leases, primarily for land and buildings, that expire over one to six years.
Future minimum payments under non-cancelable operating lease obligations for the five years ending December 31, 2020 and thereafter are as follows (in thousands):
|
2016 |
2017 |
2018 |
2019 |
2020 |
Thereafter |
|||||||||||||||||
| $ | 2,792 | $ | 2,645 | $ | 2,602 | $ | 2,017 | $ | 1,097 | $ | 614 | |||||||||||
Rental expense for long-term operating leases was $2.9 million, $3.1 million and $2.7 million in 2015, 2014 and 2013, respectively.
OMEGA PROTEIN CORPORATION
NOTES TO CONSOLIDATED FINANCIAL STATEMENTS — (Continued)
Bioriginal Food & Science Contingency
In September 2014, the Company acquired all of the outstanding equity of Bioriginal Food & Science pursuant to the terms of a share purchase agreement. A portion of the equity of Bioriginal Food & Science was indirectly held by the Management Sellers, who continue to be employed by Bioriginal Food & Science and share in the management of Bioriginal Food & Science’s business.
In addition to the acquisition date cash purchase price and restricted stock, the Management Sellers may also earn additional amounts based on the annual adjusted EBITDA of Bioriginal Food & Science’s business during each of the calendar years 2014 through 2016. For each calendar year, if the adjusted EBITDA meets or exceeds agreed upon targets, the Management Sellers will be eligible for an earn-out payment ranging from $1.2 million to $2.9 million Canadian Dollars, subject to certain forfeitures based on termination of Management Sellers’ employment. The maximum total payment for all three years is $5.3 million Canadian dollars.
The earn-out payments are estimated on a quarterly basis and will be paid-out in September 2017. The Company records the estimated contractual obligation as compensation expense during each year as it is deemed probable that such amount will be payable. As of December 31, 2015 and December 31, 2014, the outstanding liability associated with the earn-out was $1.3 million and $0.4 million liability, respectively.
Legal Contingencies
The Company is subject to various claims and lawsuits involving its business and operations. Management believes that costs, if any, relating to these matters will not have a material adverse effect on the results of operations, cash flows or financial position of the Company.
Insurance
The Company believes its insurance coverage to be in such form, against such risks, for such amounts and subject to such deductibles and self-retentions as are generally prudent for its operations but the securing of such coverage by necessity requires judgment in the balancing of retained risk and the cost effectiveness of such insurance programs. In recent years, for example, the Company has elected to increase its deductibles and self-retentions in order to manage rising insurance premium costs. These higher deductibles and self-retentions will expose the Company to greater risk of loss if future claims occur.
Insurance coverage may not be available in the future at current costs or on what the Company considers to be commercially reasonable terms. Furthermore, any insurance proceeds received for any loss of, or damage to, any of the Company’s facilities may not be sufficient to restore the loss or damage without a negative impact on its business, financial condition or results of operations. In addition, should a Company insurer become insolvent, the Company would be responsible for payment of all outstanding claims associated with that insurer’s policies.
Regulatory Matters
The Company is subject to various possible claims and lawsuits regarding environmental matters. Except as noted below, management believes that costs, if any, related to these matters will not have a material adverse effect on the results of operations, cash flows or financial position of the Company.
In April 2010, the Company received a request for information from the E.P.A. concerning its bail water practices used in its fishing operations at its Reedville, Virgina facility. In February 2011, the U.S. Coast Guard conducted inspections at the Company’s Reedville facility regarding the Reedville vessels’ bilge water discharge practices. Based on these inquiries, both agencies commenced investigations of the Company’s bail water and bilge water practices at its Reedville facility. The U.S. Attorney’s Office for the Eastern District of Virginia subsequently reviewed both the results of the Coast Guard inspection and the E.P.A. request for information.
OMEGA PROTEIN CORPORATION
NOTES TO CONSOLIDATED FINANCIAL STATEMENTS — (Continued)
In June 2013, the Company’s subsidiary, Omega Protein, resolved both the U.S. Coast Guard and E.P.A. investigations by entering into a plea agreement with the United States Attorney’s Office for the Eastern District of Virginia. Pursuant to terms of the plea agreement, the Company’s subsidiary pled guilty to two Clean Water Act violations. The plea agreement required the subsidiary to pay a $5.5 million fine, be placed on a three year term of probation, and implement an environmental compliance program. In addition to the $5.5 million fine, the subsidiary was required to make a $2.0 million contribution to the National Fish and Wildlife Foundation to fund projects in Virginia related to the protection of the environmental health of the Chesapeake Bay. The plea agreement was approved by the U.S. District Court for the Eastern District of Virginia in June 2013 and the subsidiary paid both the $5.5 million fine and the $2.0 million contribution in July 2013. Omega Protein will be on probation until June 2016.
Indemnification
The Company’s Articles of Incorporation and By-Laws limit the liability of the Company’s officers and directors to the fullest extent permitted by Nevada law. Nevada provides that directors of Nevada corporations may be relieved of monetary liabilities for breach of their fiduciary duties as directors, except under certain circumstances, including (i) acts or omissions which involve intentional misconduct, fraud or a knowing violation of law or (ii) the willful or grossly negligent payment of unlawful distributions.
The Company’s Articles of Incorporation and By-Laws generally require the Company to indemnify its directors and officers to the fullest extent permitted by Nevada law. The Company’s Articles of Incorporation and By-Laws also require the Company to advance expenses to its directors and its officers to the fullest extent permitted by Nevada law upon receipt of an undertaking by or on behalf of such director or officer to repay such amount if it should be ultimately determined that they are not entitled to indemnification by the Company. The Company also has entered into indemnification agreements with all of its directors and certain of its officers which provides for the indemnification and advancement of expenses by the Company. The Company also maintains director and officer liability insurance with respect to liabilities arising out of certain matters, including matters arising under the securities laws. This insurance is subject to limitations, conditions and deductibles set forth in the respective insurance policy.
NOTE 17. INDUSTRY SEGMENT AND GEOGRAPHIC INFORMATION
Segment Information
The Company evaluates and reviews its results of operations in two segments, animal nutrition and human nutrition. These segments are managed separately and information on each segment is provided to the chief operating decision makers as they make decisions about the Company’s overall resource allocation and assess performance.
The animal nutrition segment is primarily comprised of the Company’s fishing related assets. These assets produce fish meal, oil and solubles that are sold primarily to animal nutrition customers. A portion of the Company’s fish oil is also partially refined and transferred at cost to the human nutrition segment where it is further refined and concentrated for sale to the human nutrition market. The human nutrition segment is comprised of assets used to produce, procure, market and sell product to human nutrition markets.
The tables below present information about reported segments for 2015, 2014 and 2013 (in thousands). All cash and cash equivalent balances have been included in the identifiable assets of the unallocated segment.
|
2015 |
Animal Nutrition |
Human Nutrition |
Unallocated |
Total |
||||||||||||
|
Revenue (1) |
$ | 220,145 | $ | 139,166 | $ | — | $ | 359,311 | ||||||||
|
Cost of sales |
139,023 | 121,385 | — | 260,408 | ||||||||||||
|
Gross profit |
81,122 | 17,781 | — | 98,903 | ||||||||||||
|
Selling, general and administrative expense (including research and development) |
2,512 | 19,759 | 21,871 | 44,142 | ||||||||||||
|
Impairment of goodwill and intangible assets |
— | 4,495 | — | 4,495 | ||||||||||||
|
Loss related to plant closure |
2,117 | 4,533 | — | 6,650 | ||||||||||||
|
Loss on disposal of assets |
855 | 972 | — | 1,827 | ||||||||||||
|
Operating income (loss) |
$ | 75,638 | $ | (11,978 | ) | $ | (21,871 | ) | $ | 41,789 | ||||||
|
Depreciation and amortization |
$ | 17,880 | $ | 6,048 | $ | 601 | $ | 24,529 | ||||||||
|
Identifiable assets |
$ | 239,936 | $ | 161,878 | $ | 5,389 | $ | 407,203 | ||||||||
|
Capital expenditures |
$ | 27,996 | $ | 4,400 | $ | 2,492 | $ | 34,888 | ||||||||
(1) Excludes revenue from internal customers of $2.5 million for fish oil that was transferred from the animal nutrition segment to the human nutrition segment at cost.
OMEGA PROTEIN CORPORATION
NOTES TO CONSOLIDATED FINANCIAL STATEMENTS — (Continued)
|
2014 |
Animal Nutrition |
Human Nutrition (2) |
Unallocated |
Total |
||||||||||||
|
Revenue (3) |
$ | 243,797 | $ | 64,838 | $ | — | $ | 308,635 | ||||||||
|
Cost of sales |
171,146 | 59,872 | — | 231,018 | ||||||||||||
|
Gross profit |
72,651 | 4,966 | — | 77,617 | ||||||||||||
|
Selling, general and administrative expense (including research and development) |
2,249 | 11,148 | 20,396 | 33,793 | ||||||||||||
|
Impairment of goodwill and intangible assets |
— | 4,718 | — | 4,718 | ||||||||||||
|
Loss related to plant closure |
7,058 | — | — | 7,058 | ||||||||||||
|
Loss on disposal of assets |
265 | 197 | — | 462 | ||||||||||||
|
Operating income (loss) |
$ | 63,079 | $ | (11,097 | ) | $ | (20,396 | ) | $ | 31,586 | ||||||
|
Depreciation and amortization |
$ | 17,338 | $ | 4,070 | $ | 609 | $ | 22,017 | ||||||||
|
Identifiable assets |
$ | 211,283 | $ | 166,619 | $ | 2,213 | $ | 380,115 | ||||||||
|
Capital expenditures |
$ | 19,125 | $ | 22,949 | $ | 2,049 | $ | 44,123 | ||||||||
(2) Includes revenues and related expenses for Bioriginal Food & Science from September 5, 2014 through December 31, 2014.
(3) Excludes revenue from internal customers of $2.1 million for fish oil that was transferred from the animal nutrition segment to the human nutrition segment at cost.
|
2013 |
Animal Nutrition |
Human Nutrition (4) |
Unallocated |
Total |
||||||||||||
|
Revenue (5) |
$ | 213,236 | $ | 31,057 | $ | — | $ | 244,293 | ||||||||
|
Cost of sales |
136,146 | 25,397 | — | 161,543 | ||||||||||||
|
Gross profit |
77,090 | 5,660 | — | 82,750 | ||||||||||||
|
Selling, general and administrative expense (including research and development) |
2,744 | 6,959 | 17,997 | 27,700 | ||||||||||||
|
Loss related to plant closure |
6,597 | — | — | 6,597 | ||||||||||||
|
Impairment of other intangible assets and other |
140 | 305 | (5 | ) | 440 | |||||||||||
|
Operating income (loss) |
$ | 67,609 | $ | (1,604 | ) | $ | (17,992 | ) | $ | 48,013 | ||||||
|
Depreciation and amortization |
$ | 17,946 | $ | 2,369 | $ | 741 | $ | 21,056 | ||||||||
|
Identifiable assets |
$ | 243,656 | $ | 52,442 | $ | 35,296 | $ | 331,394 | ||||||||
|
Capital expenditures |
$ | 19,080 | $ | 5,350 | $ | 366 | $ | 24,796 | ||||||||
(4) Includes revenues and related expenses for WSP from February 27, 2013 through December 31, 2013.
(5) Excludes revenue from internal customers of $1.5 million for fish oil that was transferred from the animal nutrition segment to the human nutrition segment at cost.
A reconciliation of total segment operating income to total earnings from operations before income taxes for the years ended December 31, 2015, 2014, and 2013 is presented below (in thousands):
|
Years ended December 31, |
||||||||||||
|
2015 |
2014 |
2013 |
||||||||||
|
Operating income for reportable segments |
$ | 41,789 | $ | 31,586 | $ | 48,013 | ||||||
|
Interest expense |
(1,498 | ) | (1,331 | ) | (1,640 | ) | ||||||
|
(Loss) gain on foreign currency |
(1,217 | ) | 262 | — | ||||||||
|
Other expense, net |
(479 | ) | (310 | ) | (394 | ) | ||||||
|
Income before income taxes |
$ | 38,595 | $ | 30,207 | $ | 45,979 | ||||||
OMEGA PROTEIN CORPORATION
NOTES TO CONSOLIDATED FINANCIAL STATEMENTS — (Continued)
Geographical and Other Information
The Company’s export sales were approximately $130 million, $147 million, and $120 million in 2015, 2014 and 2013, respectively. Such sales were made primarily to Asian, European and Canadian markets. In 2015, 2014 and 2013, sales to the Company’s top customer were approximately $35.6 million, $26.6 million and $22.7 million, respectively. The top customer was Carrington Farms for 2015, ED and F Man Liquid Products for 2014 and Nestle Purina Pet Care for 2013. In 2014, a second customer, Nestle Purina Pet Care, accounted for approximately $24.9 million of revenue.
The following table shows the geographical distribution of revenues (in millions) based on location of customers:
|
Years Ended December 31, |
||||||||||||||||||||||||
|
2015 |
2014 |
2013 |
||||||||||||||||||||||
|
Revenues |
Percent |
Revenues |
Percent |
Revenues |
Percent |
|||||||||||||||||||
|
U.S. |
$ | 229.0 | 63.7 | % | $ | 161.8 | 52.4 | % | $ | 123.9 | 50.7 | % | ||||||||||||
|
Asia (1) |
54.9 | 15.3 | 58.5 | 19.0 | 70.9 | 29.0 | ||||||||||||||||||
|
Europe |
50.2 | 14.0 | 69.5 | 22.5 | 31.5 | 12.9 | ||||||||||||||||||
|
Canada |
21.2 | 5.9 | 16.1 | 5.2 | 11.6 | 4.8 | ||||||||||||||||||
|
Mexico |
2.6 | 0.7 | 1.9 | 0.6 | 1.3 | 0.5 | ||||||||||||||||||
|
South & Central America |
0.6 | 0.2 | 0.6 | 0.2 | 4.8 | 2.0 | ||||||||||||||||||
|
Other |
0.8 | 0.2 | 0.2 | 0.1 | 0.3 | 0.1 | ||||||||||||||||||
|
Total |
$ | 359.3 | 100.0 | % | $ | 308.6 | 100.0 | % | $ | 244.3 | 100.0 | % | ||||||||||||
|
(1) |
Of this amount, China comprised approximately $35.3 million, $35.9 million and $47.4 million for the years ended December 31, 2015, 2014 and 2013, respectively. |
The following table sets forth the Company’s revenues by product (in millions) and the approximate percentage of total revenues represented thereby, for the indicated periods:
| Years Ended December 31, | ||||||||||||||||||||||||
|
2015 |
2014 |
2013 |
||||||||||||||||||||||
|
Revenues |
Percent |
Revenues |
Percent |
Revenues |
Percent |
|||||||||||||||||||
|
Animal Nutrition Revenues |
||||||||||||||||||||||||
|
Fish meal |
$ | 152.4 | 42.5 | % | $ | 147.1 | 47.7 | % | $ | 142.5 | 58.3 | % | ||||||||||||
|
Fish oil |
39.3 | 10.9 | 70.8 | 22.9 | 43.8 | 18.0 | ||||||||||||||||||
|
Refined fish oil |
23.8 | 6.6 | 22.2 | 7.2 | 22.7 | 9.3 | ||||||||||||||||||
|
Fish solubles and other |
4.6 | 1.3 | 3.7 | 1.2 | 4.2 | 1.7 | ||||||||||||||||||
|
Human Nutrition Revenues |
||||||||||||||||||||||||
|
Specialty oils |
113.7 | 31.6 | 41.1 | 13.3 | 5.8 | 2.4 | ||||||||||||||||||
|
Dairy protein products |
12.9 | 3.6 | 11.7 | 3.8 | 9.8 | 4.0 | ||||||||||||||||||
|
Other nutraceutical ingredients |
12.6 | 3.5 | 12.0 | 3.9 | 15.5 | 6.3 | ||||||||||||||||||
|
Total |
$ | 359.3 | 100.0 | % | $ | 308.6 | 100.0 | % | $ | 244.3 | 100.0 | % | ||||||||||||
NOTE 18. QUARTERLY FINANCIAL DATA (UNAUDITED)
Seasonal and Quarterly Results
The following tables present certain unaudited operating results for each of the Company’s preceding eight quarters. The Company believes that the following information includes all adjustments (consisting only of normal recurring adjustments) that the Company considers necessary for a fair presentation, in accordance with generally accepted accounting principles. The operating results for any interim period are not necessarily indicative of results for any other period.
| Quarters Ended | ||||||||||||||||
|
March 31, 2015 |
June 30, 2015 |
September 30, 2015 |
December 31, 2015 |
|||||||||||||
| (in thousands, except per share amounts) | ||||||||||||||||
|
Revenues (1) |
$ | 71,623 | $ | 93,176 | $ | 112,216 | $ | 82,296 | ||||||||
|
Gross profit (1) |
14,795 | 25,831 | 35,193 | 23,084 | ||||||||||||
|
Operating income (1) (3) (4) |
3,660 | 14,388 | 17,244 | 6,497 | ||||||||||||
|
Net income (1) |
1,669 | 8,804 | 10,574 | 2,928 | ||||||||||||
|
Earnings per share (2): |
||||||||||||||||
|
Basic |
0.08 | 0.41 | 0.48 | 0.13 | ||||||||||||
|
Diluted |
0.08 | 0.40 | 0.47 | 0.13 | ||||||||||||
OMEGA PROTEIN CORPORATION
NOTES TO CONSOLIDATED FINANCIAL STATEMENTS — (Continued)
| Quarters Ended | ||||||||||||||||
|
March 31, 2014 |
June 30, 2014 |
September 30, 2014 |
December 31, 2014 |
|||||||||||||
| (in thousands, except per share amounts) | ||||||||||||||||
|
Revenues (1) |
$ | 63,500 | $ | 71,913 | $ | 70,764 | $ | 102,458 | ||||||||
|
Gross profit (1) |
20,493 | 20,424 | 14,178 | 22,522 | ||||||||||||
|
Operating income (1) (3) (4) |
12,346 | 10,752 | 1,799 | 6,689 | ||||||||||||
|
Net income (1) |
7,971 | 6,633 | 659 | 3,198 | ||||||||||||
|
Earnings per share (2): |
||||||||||||||||
|
Basic |
0.38 | 0.32 | 0.03 | 0.15 | ||||||||||||
|
Diluted |
0.37 | 0.31 | 0.03 | 0.14 | ||||||||||||
|
(1) |
Revenues, gross profit, operating income, and net income are rounded to thousands each quarter. Therefore, the sum of the quarterly amounts may not equal the annual amounts reported. |
|
(2) |
Earnings per share are computed independently for each quarter and the full year based upon respective average shares outstanding. Therefore, the sum of the quarterly earnings per share amounts may not equal the annual amounts reported. |
|
(3) |
The quarters ended March 31, June 30, September 30 and December 31, 2014 have $1.3 million, $2.6 million, $1.5 million and $1.6 million of expenses related to the loss on the plant closure. The quarters ended March 31, June 30, September 30 and December 31, 2015 have $0.6 million, $0.6 million, $0.6 million and $4.7 million of expenses related to the loss on plant closures. |
|
(4) |
Included in the quarter ended December 31, 2014 is a $4.7 million charge related to impairment of goodwill and other intangible assets. Included in the quarters ended September 30 and December 31, 2015 are $4.0 million and $5.0 million of charges related to impairment of property, plant and equipment, goodwill and other intangible assets. |
The Company’s menhaden harvesting and processing business is seasonal in nature. Omega Protein generally has higher sales during the menhaden harvesting season (which includes the second and third quarter of each fiscal year) due to increased product availability and customer demand. Additionally, due to differences in gross profit margins for Omega Protein’s various products, any variation in the mix of product sales between quarters may result in significant variations of total gross profit margins. As a result, the Company’s quarterly operating results have fluctuated in the past and may fluctuate in the future. In addition, from time to time Omega Protein defers sales of inventory based on prices for its products, which may affect comparable period comparisons.
NOTE 19. SUBSEQUENT EVENT
On March 8, 2016, the Company decided to exit its oil concentration facility located in Batavia, Illinois, and relocate certain assets from the facility to other Company facilities. In order to satisfy current customer obligations, the Company plans to continue to operate the facility on a limited basis through the middle of 2017. As of December 31, 2015, the Company recognized losses relating to the impairment of property, plant and equipment as well as estimated decommissioning costs. See Note 4 – Plant Closure. The Company expects to incur additional costs related to relocation of assets to be used at other facilities and has changed the remaining useful life of the property, plant and equipment that will remain in use at the facility until 2017. The remaining carry value of these assets is approximately $2.8 million.
OMEGA PROTEIN CORPORATION
Item 9. Changes in and Disagreements with Accountants on Accounting and Financial Disclosure.
None.
Item 9A. Controls and Procedures
(a) Evaluation of Disclosure Controls and Procedures
As of the end of the period covered by this report, the Company conducted an evaluation of the effectiveness of its “disclosure controls and procedures,” as that phrase is defined in Rules 13a-15(e) and 15d-15(e) under the Securities Exchange Act of 1934. The evaluation was carried out under the supervision and with the participation of management, including the Company’s Chief Executive Officer (“CEO”) and Chief Financial Officer (“CFO”).
Based on and as of the date of that evaluation, the Company’s CEO and CFO have concluded that (i) the Company’s disclosure controls and procedures are designed to ensure that information required to be disclosed by the Company in the reports that the Company files or submits under the Securities Exchange Act of 1934, is recorded, processed, summarized and reported within the time periods specified in the SEC’s rules and forms, and that such information is accumulated and communicated to the Company’s management, including the CEO and CFO, as appropriate to allow timely decisions regarding required disclosure, and (ii) that the Company’s disclosure controls and procedures are effective.
Notwithstanding the foregoing, there can be no assurance that the Company’s disclosure controls and procedures will detect or uncover all failures of persons within the Company and its consolidated subsidiaries to disclose material information otherwise required to be set forth in the Company’s periodic reports. There are inherent limitations to the effectiveness of any system of disclosure controls and procedures, including the possibility of human error and the circumvention or override of the controls and procedures.
(b) Management’s Annual Report on Internal Control Over Financial Reporting
Management is responsible for establishing and maintaining adequate internal control over financial reporting, and for performing an assessment of the effectiveness of internal control over financial reporting as of December 31, 2015. Internal control over financial reporting is a process designed to provide reasonable assurance regarding the reliability of financial reporting and the preparation of financial statements for external purposes in accordance with generally accepted accounting principles. The Company’s system of internal control over financial reporting includes those policies and procedures that (i) pertain to the maintenance of records that, in reasonable detail, accurately and fairly reflect the transactions and dispositions of the assets of the Company; (ii) provide reasonable assurance that transactions are recorded as necessary to permit preparation of financial statements in accordance with generally accepted accounting principles, and that receipts and expenditures of the Company are being made only in accordance with authorizations of management and directors of the Company; and (iii) provide reasonable assurance regarding prevention or timely detection of unauthorized acquisition, use, or disposition of the Company’s assets that could have a material effect on the financial statements.
Management performed an assessment of the effectiveness of the Company’s internal control over financial reporting as of December 31, 2015 based upon criteria set forth in 2013 in a report entitled “Internal Control—Integrated Framework” issued by the Committee of Sponsoring Organizations of the Treadway Commission (“COSO”). Based on that assessment and those criteria, management concluded that the Company’s internal control over financial reporting was effective as of December 31, 2015.
The effectiveness of the Company’s internal control over financial reporting as of December 31, 2015 has been audited by PricewaterhouseCoopers LLP, an independent registered public accounting firm, as stated in their report which appears herein. (See Item 8. Financial Statements and Supplementary Data.)
(c) Changes in Internal Control Over Financial Reporting
There were no changes in the Company’s internal control over financial reporting during the quarter ended December 31, 2015 that have materially affected, or are reasonably likely to materially affect, the Company’s internal control over financial reporting.
Item 9B. Other Information.
Certain Company directors, officers or other employees may from time to time enter into pre-arranged stock sales or purchase plans intended to qualify under Rule 10b5-1 of the Securities and Exchange Act of 1934. Rule 10b5-1 plans permit individuals who are not in possession of material non-public information to establish pre-arranged plans to buy or sell Company stock. These plans can minimize the market effect of insider purchases or sales by spreading these purchases or sales over a more extended period than the limited trading “windows” designated by the Company’s securities trading policy.
OMEGA PROTEIN CORPORATION
Under the Company’s securities trading policy, Rule 10b5-1 stock sales or purchase plans are required to be approved by the Company for directors, officers and certain key employees. The Company expects that public disclosure regarding purchases or sales under these Rule 10b5-1 plans will be provided through Form 4 and Rule 144 filings with the U.S. Securities and Exchange Commission. The Company does not intend to disclose further information regarding the existence or terms of these trading plans for individual participants.
On September 25, 2015, the Company announced that its Board of Directors is in the process of a review of strategic alternatives to enhance shareholder value, including a possible share repurchase program, sale, merger, spin-off or other separation of a selected business or other form of business combination or strategic transaction. J.P. Morgan Securities, LLC is serving as financial advisor in connection with this review.
This strategic review process is continuing and the Company’s Board of Directors has not set any timetable for the strategic review process. There can be no assurance that the process described above will result in the consummation of any transaction or, if a transaction is undertaken, as to its terms, structure or timing. The Company does not intend to disclose or comment on further developments regarding the review of strategic alternatives unless and until the Board of Directors approves a specific transaction or concludes its review.
PART III
Item 10. Directors, Executive Officers and Corporate Governance.
Pursuant to General Instruction G of Form 10-K, the information called for by Item 10 of Part III of Form 10-K is incorporated by reference to the information set forth in the Company’s definitive proxy statement relating to its 2016 Annual Meeting of Stockholders (the “2016 Proxy Statement”) to be filed pursuant to Regulation 14A under the Exchange Act, in response to Items 401, 405 and 407(c)(3), (d)(4) and (d)(5) of Regulation S-K under the Securities Act of 1933 and the Exchange Act (“Regulation S-K”). Reference is also made to the information appearing in Item 1 of Part I of this Annual Report on Form 10-K under the caption “Business and Properties—Executive Officers of the Registrant.”
The Company’s Code of Business Conduct and Ethics applies to all employees, officers and directors of the Company. The Code meets the requirements of a “code of ethics” as defined by Item 406 of Regulation S-K, and applies to the Company’s Chief Executive Officer, Chief Financial Officer, Chief Accounting Officer (who is also the Company’s Controller) as well as all other employees, as indicated above. The Code of Business Conduct and Ethics also meets the requirements of a code of business conduct and ethics under NYSE listing standards.
In addition to the above Code, the Company has adopted a Code of Ethics for Financial Professionals which applies to the Chief Executive Officer, Chief Financial Officer, Chief Accounting Officer and Controller and all other Company professionals worldwide serving in a finance, accounting, treasury, tax or investor relations role.
Both the Code of Business Conduct and Ethics and the Code of Ethics for Financial Professionals are posted on the Company’s website at www.omegaproteininc.com. The Company will provide a copy of the Code of Business Conduct and Ethics and Code of Ethics for Financial Professionals to any person without charge upon request. Inquires should be sent to Omega Protein Corporation, 2105 City West Blvd, Suite 500, Houston, Texas 77042, Attn: Corporate Secretary. The Company intends to disclose any amendments to the Codes, as well as any waivers to the Codes for executive officers or directors, on its website.
None of these codes, nor the Company’s website, is incorporated by reference in this report or constitutes part of this report.
Item 11. Executive Compensation.
Pursuant to General Instruction G of Form 10-K, the information called for by Item 11 of Part III of Form 10-K is incorporated by reference to the information set forth in the 2016 Proxy Statement in response to Items 402 and 407(e)(4) and (e)(5) of Regulation S-K.
Item 12. Security Ownership of Certain Beneficial Owners and Management and Related Stockholder Matters.
Pursuant to General Instruction G of Form 10-K, the information called for by Item 12 of Part III of Form 10-K is incorporated by reference to the information set forth in the 2016 Proxy Statement in response to Items 201(d) and 403 of Regulation S-K.
OMEGA PROTEIN CORPORATION
Item 13. Certain Relationships and Related Transactions, and Director Independence.
Pursuant to General Instruction G of Form 10-K, the information called for by Item 13 of Part III of Form 10-K is incorporated by reference to the information set forth in the 2016 Proxy Statement in response to Items 404 and 407(a) of Regulation S-K.
Item 14. Principal Accountant Fees and Services.
Pursuant to General Instruction G of Form 10-K, the information called for by Item 14 of Part III of Form 10-K is incorporated by reference to the information set forth in the 2016 Proxy Statement in response to Item 9(e) of Schedule 14A.
PART IV
Item 15. Exhibits, Financial Statement Schedules.
|
|
(a) (1) |
The Company’s consolidated financial statements listed below have been filed as part of this report: |
|
|
|
Report of Independent Registered Public Accounting Firm |
|
Consolidated balance sheets as of December 31, 2015 and 2014 | ||
|
Consolidated statements of comprehensive income for the years ended December 31, 2015, 2014 and 2013 | ||
|
|
|
Consolidated statements of cash flows for the years ended December 31, 2015, 2014 and 2013 |
|
|
|
Consolidated statements of stockholders’ equity for the years ended December 31, 2015, 2014 and 2013 |
|
|
|
Notes to consolidated financial statements |
| (a) (2) | Financial Statement Schedule |
SCHEDULE OF VALUATION AND QUALIFYING ACCOUNTS (in thousands)
|
Description |
Balance at Beginning of Period |
Charged to Costs and Expenses |
Deductions |
Balance at End of Period |
|||||||||||||
|
December 31, 2013: |
|||||||||||||||||
|
Allowance for doubtful accounts (A) |
$ | 341 | $ | 103 |
(B) |
$ | 57 | $ | 387 | ||||||||
|
December 31, 2014: |
|||||||||||||||||
|
Allowance for doubtful accounts (A) |
$ | 387 | $ | 93 | $ | 36 | $ | 444 | |||||||||
|
December 31, 2015: |
|||||||||||||||||
|
Allowance for doubtful accounts (A) |
$ | 444 | $ | 206 | $ | 74 | $ | 576 | |||||||||
|
(A) |
Includes allowance for doubtful accounts receivable and insurance receivable. |
|
(B) |
During 2013, the acquisition of WSP added an additional $48,000 to the allowance for doubtful accounts. |
|
|
(a) (3) |
Exhibits |
|
2.1* |
—Agreement and Plan of Merger between Marine Genetics, Inc. and Omega Protein Corporation (“Omega” or the “Company”) (Exhibit 2.1 to Omega Registration Statement on Form S-1 [Registration No. 333-44967]) |
|
2.2* |
—Share Purchase Agreement dated as of September 5, 2014 among Omega, 101264205 Saskatchewan Ltd. and the shareholders of Bioriginal Food & Science Corp. (Exhibit 2.1 to the Company’s Current Report on Form 8-K filed with the SEC on September 8, 2014) |
|
2.3* |
—Agreement and Plan of Merger dated as of February 27, 2013, by and between Omega and Wisconsin Specialty Protein, LLC. (Exhibit 10.1 to the Company’s Current Report on Form 8-K filed with the SEC on February 27, 2013) |
OMEGA PROTEIN CORPORATION
|
2.4* |
— Stock Purchase Agreement dated as of December 16, 2010 by and between Omega and Gilbert Gluck (Exhibit 10.17 to the Company’s Form 8-K filed with the SEC on December 10, 2010) |
|
2.5*† |
—Equity Purchase Agreement dated as of September 9, 2011 by and among Omega, InCon Processing, LLC, InCon International, Inc. and the shareholders of InCon International, Inc. (Exhibit 10.1 to the Company’s Form 8-K filed with the SEC on September 12, 2011) |
|
3.1* |
—Articles of Incorporation of Omega (Exhibit 3.1 to Omega Registration Statement on Form S-1[Registration No. 333-44967]) |
|
3.2* |
—Amended and Restated Bylaws of Omega dated November 5, 2015 (Exhibit 3.1 to the Company’s Current Report on Form 8-K filed with the SEC on November 9, 2015) |
|
3.3* |
—Certificate of Withdrawal of Certificate of Designation with respect to the Company’s Series A Junior Participating Preferred Stock (Exhibit 2.1 to the Company’s Current Report on Form 8-K filed with the SEC on April 1, 2014) |
|
4.1* |
—Form of Common Stock Certificate (Citizen) (Exhibit 4.1 to Amendment No. 2 to Omega Registration Statement on Form S-1 [Registration No. 333-44967]) |
|
4.2* |
—Form of Common Stock Certificate (Non-Citizen) (Exhibit 4.2 to Amendment No. 2 to Omega Registration Statement on Form S-1 [Registration No. 333-44967]) |
|
10.1*† |
—Form of Amended and Restated Indemnification Agreement for all Officers and Directors (Exhibit 10.1 to Omega Quarterly Report on Form 10-Q for quarter ended June 30, 2003) |
|
10.2*† |
—Omega Protein Corporation 2006 Incentive Plan (Appendix A to Omega Proxy Statement on Schedule 14A dated April 26, 2006) |
|
10.3*† |
—Omega Protein, Inc. Executive Medical Plan dated August 1993 (Exhibit 10.16 to Omega Annual Report on Form 10-K for the year ended December 31, 2002) |
|
10.4* |
—Lease dated July 1, 1992 with Ardoin Limited Partnership (Exhibit 10.12 to Omega Registration Statement on Form S-1 [Registration No. 333-44967]) |
|
10.5* |
—Amendment One Lease Extension dated February 22, 2006 to Lease Agreement dated July 1, 2002 between the Ardoin Limited Partnership and Omega Protein, Inc. (formerly known as Zapata Haynie Corporation) (Exhibit 10.1 to Omega Current Report on Form 8-K filed February 28, 2006) |
|
10.6* |
—Lease Agreement dated November 25, 1997 with O. W. Burton, Jr., individually and as trustee of the Trust of Anna Burton (Exhibit 10.13 to Omega Registration Statement on Form S-1 [Registration No. 333-44967]) |
|
10.7* |
—Commercial Lease Agreement dated January 1, 1971 with Purvis Theall and Ethlyn Cessac (Exhibit 10.15 to Omega Registration Statement on Form S-1 [Registration No. 333-44967]) |
|
10.8* |
—Lease Amendment and Option to Purchase, effective as of August 1, 2006, between Ivy and Dola Richard and Omega Protein, Inc. (Exhibit 10.1 to Omega Quarterly Report on Form 10-Q for the quarter ended June 30, 2006) |
|
10.9*† |
—Employment Agreement between Omega Protein Corporation and Bret Scholtes dated as of January 1, 2012 (Exhibit 10.2 to the Company’s Form 8-K filed with the SEC on January 4, 2012) |
| 10.10*† |
—Employment Agreement between Omega Protein Corporation and Andrew Johannesen dated as of January 1, 2012 (Exhibit 10.3 to the Company’s Form 8-K filed with the SEC on January 4, 2012) |
| 10.11*† |
—Amended and Restated Executive Employment Agreement dated as of December 31, 2007 between John D. Held and Omega Protein Corporation (Exhibit 10.3 to the Company’s Current Report on Form 8-K filed with the SEC on January 3, 2008) |
| 10.12*† |
—First Amendment to the Amended and Restated Executive Employment Agreement dated as of December 3, 2008, between John D. Held and Omega Protein Corporation (Exhibit 10.3 to the Company’s Current Report on Form 8-K filed with the SEC on December 8, 2008) |
OMEGA PROTEIN CORPORATION
| 10.13*† |
—Employment Agreement between Omega Protein Corporation and Dr. Mark Griffin dated as of January 1, 2012 (Exhibit 10.4 to the Company’s Form 8-K filed with the SEC on January 4, 2012) |
| 10.14*† |
—Form of Stock Option Agreement dated June 7, 2006 for each Independent Director (Exhibit 10.1 to Omega Current Report on Form 8-K filed with the SEC on June 9, 2006) |
|
10.15* |
—Promissory Note to the United States of America dated December 29, 2003 (Exhibit 10.66 to Omega Annual Report on Form 10-K for year ended December 31, 2003) |
|
10.16* |
—Title XI Financial Agreement dated December 29, 2003 with the United States of America (Exhibit 10.68 to Omega Protein Annual Report on Form 10-K for year ended December 31, 2003) |
|
10.17* |
—Lease Agreement between BMC Software Texas, L.P. and Omega Protein Corporation dated as of August 18, 2005 (Exhibit 10.1 to Omega Protein Current Report on Form 8-K dated August 17, 2005) |
|
10.18* |
—First Amendment to Lease Agreement between BMC Software Texas, L.P. and Omega dated as of September 15, 2005 (Exhibit 10.1 to Omega Current Report on Form 8-K dated September 15, 2005) |
|
10.19* |
—Second Amendment dated December 19, 2014 to Lease Agreement by and between PKY-2101 CityWest 3 & 4, L.P. and Omega Protein Corporation (Exhibit 10.26 to the Company’s Annual Report on Form 10-K for the fiscal year ended December 31, 2014) |
|
10.20* |
—Promissory Note to the United States of America Dated October 17, 2005 (Exhibit 10.2 to Omega Current Report on Form 8-K dated October 17, 2005) |
|
10.21* |
—Title XI Financial Agreement dated October 17, 2005 with the United States of America (Exhibit 10.4 to Omega Current Report on Form 8-K dated October 17, 2005) |
|
10.22* |
—Approval Letter dated as of December 1, 2005 and executed on December 6, 2005 by Omega Protein, Inc., the Company and United States Department of Commerce, Acting by National Oceanic and Atmospheric Administration, National Marine Fisheries Service (Exhibit 10.1 to Omega Current Report on Form 8-K dated December 6, 2005) |
|
10.23* |
—Promissory Note to the United States of America dated March 7, 2007 (Exhibit 10.4 to the Company’s Current Report on Form 8-K filed with the SEC on March 13, 2007) |
|
10.24* |
—Title XI Financial Agreement dated March 7, 2007 with the United States of America (Exhibit 10.6 to the Company’s Current Report on Form 8-K filed with the SEC on March 13, 2007) |
|
10.25* |
—Amended and Restated Loan Agreement dated as of March 21, 2012 by and among Omega Protein Corporation, Omega Protein, Inc., Wells Fargo Bank, National Association and JPMorgan Chase Bank, N.A.(Exhibit 10.1 to the Company’s Current Report on Form 8-K filed with the SEC on March 22, 2012) |
|
10.26* |
—Amended and Restated Revolving Credit Note dated as of March 21, 2012 executed by Omega Protein Corporation and Omega Protein, Inc. and made payable to Wells Fargo Bank, National Association (Exhibit 10.2 to the Company’s Current Report on Form 8-K filed with the SEC on March 22, 2012) |
|
10.27* |
—Revolving Credit Note dated as of March 21, 2012 executed by Omega Protein Corporation and Omega Protein, Inc. and made payable to JPMorgan Chase Bank, N.A. (Exhibit 10.3 to the Company’s Current Report on Form 8-K filed with the SEC on March 22, 2012) |
|
10.28* |
—Swingline Note dated as of March 21, 2012 executed by Omega Protein Corporation and Omega Protein, Inc. and made payable to Wells Fargo Bank, National Association (Exhibit 10.4 to the Company’s Current Report on Form 8-K filed with the SEC on March 22, 2012) |
|
10.29* |
—Amended and Restated Guaranty Agreement dated as of March 21, 2012 by Protein Finance Company, Omega Shipyard, Inc., Protein Industries, Inc., Cyvex Nutrition, Inc., and InCon Processing, L.L.C. in favor of Wells Fargo Bank, National Association (Exhibit 10.5 to the Company’s Current Report on Form 8-K filed with the SEC on March 22, 2012) |
|
10.30* |
—First Amendment to Amended and Restated Loan Agreement dated as of May 21, 2012, among Omega Protein Corporation, Omega Protein, Inc., Wells Fargo Bank, National Association and JP Morgan Chase Bank, N.A. (Exhibit 10.1 to the Company’s Current Report on Form 8-K filed with the SEC on May 23, 2012) |
OMEGA PROTEIN CORPORATION
|
10.31* |
—Approval Letter dated as of November 5, 2009 by Omega Protein, Inc., Omega Protein Corporation and United States Department of Commerce, acting by National Oceanic and Atmospheric Administration, National Marine Fisheries Service (Exhibit 10.1 to the Company’s Form 8-K filed with the SEC on June 1, 2010) |
|
10.32* |
—Corrected Promissory Note of Omega Protein, Inc. to the United States of America dated May 25, 2010 (Exhibit 10.3 to the Company’s Form 8-K filed with the SEC on June 1, 2010) |
|
10.33* |
—Title XI Financial Agreement dated May 25, 2010 between Omega Protein, Inc., Omega Protein Corporation and the United States of America (Exhibit 10.5 to the Company’s Form 8-K filed with the SEC on June 1, 2010) |
| 10.34*† | —Form of Stock Option Agreement dated December 1, 2010 (Exhibit 10.1 to the Company’s Form 8-K filed with the SEC on December 6, 2010) |
| 10.35*† | —Form of Form of Restricted Stock Agreement dated as of December 12, 2011, between Omega Protein Corporation and each of Bret D. Scholtes, John D. Held, Andrew C. Johannesen, Dr. Mark E. Griffin, Matthew Phillips and Gregory Toups (Exhibit 10.1 to the Company’s Form 8-K filed with the SEC on December 16, 2011) |
| 10.36*† | —Restricted Stock Agreement for Bret D. Scholtes dated as of January 1, 2012 (Exhibit 10.6 to the Company’s Form 8-K filed with the SEC on January 4, 2012) |
| 10.37*† | —Non-Statutory Stock Option Agreement for Dr. Jonathan Shepherd dated as of January 1, 2012 (Exhibit 10.5 to the Company’s Current Report on Form 8-K filed with the SEC on January 4, 2012) |
| 10.38*† | —Non-Statutory Stock Option Agreement for David W. Wehlmann dated April 1, 2012 (Exhibit 10.1 to the Company’s Current Report on Form 8-K filed with the SEC on April 2, 2012) |
| 10.39*† |
—Form of Restricted Stock Agreement dated as of December 4, 2012, between Omega Protein Corporation and each of Bret D. Scholtes, John D. Held, Andrew C. Johannesen, Dr. Mark E. Griffin, Matthew Phillips and Gregory Toups (Exhibit 10.1 to the Company’s Form 8-K filed with the SEC on December 7, 2012) |
| 10.40*† |
—Employment Agreement between Cyvex Nutrition, Inc. and Matthew Phillips dated as of January 1, 2013 (Exhibit 10.1 to the Company’s Current Report on Form 8-K filed with the SEC on January 4, 2013) |
|
10.41* |
—Joinder Agreement and Consent and Waiver dated as of February 27, 2013, by and among Wisconsin Specialty Protein, LLC, Wells Fargo Bank, National Association, and JPMorgan Chase Bank, N.A. (Exhibit 10.2 to the Company’s Current Report on Form 8-K filed with the SEC on February 27, 2013) |
|
10.42* |
—Plea Agreement entered into on June 4, 2013, between the United States Attorney’s Office for the Eastern District of Virginia and Omega Protein, Inc. (Exhibit 10.1 to the Company’s Current Report on Form 8-K filed with the SEC on June 5, 2013) |
|
10.43* |
—Form of Restricted Stock Agreement for Outside Directors dated as of July 1, 2013 (Exhibit 10.1 to the Company’s Current Report on Form 8-K filed with the SEC on June 24, 2013) |
|
10.44* |
—Second Amendment to Amended and Restated Loan Agreement, dated as of October 11, 2013, among Omega Protein Corporation, Omega Protein, Inc., Wells Fargo Bank, National Association and JPMorgan Chase Bank, N.A. (Exhibit 10.1 to the Company’s Current Report on Form 8-K filed with the SEC on October 15, 2013) |
|
10.45* |
—Omega Protein Corporation 2014 Cash Incentive Performance Unit Plan (Exhibit 10.1 to the Company’s Current Report on Form 8-K filed with the SEC on February 12, 2014) |
|
10.46* |
—Form of Restricted Stock Agreement (Exhibit 10.2 to the Company’s Current Report on Form 8-K filed with the SEC on February 12, 2014) |
|
10.47* |
—Form of Restricted Stock Agreement for Outside Directors dated as of June 19, 2014 (Exhibit 10.1 to the Company’s Current Report on Form 8-K filed with the SEC on June 23, 2014) |
|
10.48* |
—Third Amendment to Amended and Restated Loan Agreement dated as of September 4, 2014 by and among the Company, Omega Protein, Inc. and Wells Fargo Bank, National Association, and JP Morgan Chase Bank, N.A. (Exhibit 10.1 to the Company’s Current Report on Form 8-K filed with the SEC on September 8, 2014) |
OMEGA PROTEIN CORPORATION
|
10.49* |
—Revolving Credit Note (Accordion) dated as of September 4, 2014, of the Company and Omega Protein, Inc. payable to Wells Fargo Bank, National Association (Exhibit 10.2 to the Company’s Current Report on Form 8-K filed with the SEC on September 8, 2014) |
|
10.50* |
—Revolving Credit Note (Accordion) dated as of September 4, 2014, of the Company and Omega Protein, Inc. payable to JP Morgan Chase Bank, N.A. (Exhibit 10.3 to the Company’s Current Report on Form 8-K filed with the SEC on September 8, 2014) |
| 10.51*† |
—Omega Protein Corporation 2015 Cash Incentive Performance Unit Plan (Exhibit 10.1 to the Company’s Current Report on Form 8-K filed with the SEC on February 27, 2015) |
|
10.52* |
—Rental Agreement dated June 26, 2013 between T. Mast and J.P. Mast and Bioriginal Europe/Asia (Exhibit 10.62 to the Company’s Annual Report on Form 10-K for the fiscal year ended December 31, 2014) |
| 10.53*† |
—Employment Agreement dated as of March 10, 2015 between Omega Protein Corporation and Montgomery Deihl (Exhibit 10.63 to the Company’s Annual Report on Form 10-K for the fiscal year ended December 31, 2014) |
| 10.54*† | —Employment Agreement dated April 1, 2013 between Joseph R. Vidal and Bioriginal Food & Science Corp. (Exhibit 10.64 to the Company’s Annual Report on Form 10-K for the fiscal year ended December 31, 2014) |
| 10.56*† |
—Form of Restricted Stock Agreement for February 26, 2015 grants of restricted stock awards (Exhibit 10.2 to the Company’s Current Report on Form 8-K filed with the SEC on February 27, 2015) |
| 10.57*† |
—Omega Protein Corporation 2015 Long Term Incentive Plan (Appendix A to the Company’s Definitive Proxy Statement on Schedule 14A filed with the SEC on April 29, 2015) |
| 10.58*† |
—Form of Award of Restricted Stock Agreement for independent directors dated June 25, 2015 (Exhibit 10.1 to the Company’s Current Report on Form 8-K filed with the SEC on June 30, 2015) |
|
10.59* |
—Second Amended and Restated Loan Agreement dated as of August 20, 2015 by and among Omega Protein Corporation, Omega Protein, Inc., and Bioriginal Food & Science Corp., as Borrowers, Protein Finance Company, Omega Shipyard, Inc., Protein Industries, Inc., Cyvex Nutrition, Inc., InCon Processing, L.L.C. and Wisconsin Specialty Protein, LLC, as Guarantors, Wells Fargo Bank, National Association, as Administrative Agent, Swingline Lender, Issuing Lender and Lender, JPMorgan Chase Bank, N.A., as Lender, and BMO Harris Bank N.A., as Lender (Exhibit 10.1 to the Company’s Current Report on Form 8-K filed with the SEC on August 24, 2015) |
|
10.60* |
—Second Amended and Restated Revolving Credit Note (Revolving A Loans) dated as of August 20, 2015 executed by Omega Protein Corporation and Omega Protein, Inc., and made payable to Wells Fargo Bank, National Association (Exhibit 10.2 to the Company’s Current Report on Form 8-K filed with the SEC on August 24, 2015) |
|
10.61* |
—Revolving Credit Note (Revolving B Loans) dated as of August 20, 2015 executed by Omega Protein Corporation, Omega Protein, Inc. and Bioriginal Food & Science Corp., and made payable to Wells Fargo Bank, National Association (incorporated herein by reference to Exhibit 10.3 to the Company’s Current Report on Form 8-K filed with the Commission on August 24, 2015) |
|
10.62* |
—Amended and Restated Revolving Credit Note (Revolving A Loans) dated as of August 20, 2015 executed by Omega Protein Corporation and Omega Protein, Inc., and made payable to JPMorgan Chase Bank, N.A. (Exhibit 10.4 to the Company’s Current Report on Form 8-K filed with the SEC on August 24, 2015) |
|
10.63* |
—Revolving Credit Note (Revolving B Loans) dated as of August 20, 2015 executed by Omega Protein Corporation, Omega Protein, Inc. and Bioriginal Food & Science Corp., and made payable to JPMorgan Chase Bank, N.A. (Exhibit 10.5 to the Company’s Current Report on Form 8-K filed with the SEC on August 24, 2015) |
|
10.64* |
—Revolving Credit Note (Revolving A Loans) dated as of August 20, 2015 executed by Omega Protein Corporation and Omega Protein, Inc., and made payable to BMO Harris Bank N.A. (Exhibit 10.6 to the Company’s Current Report on Form 8-K filed with the SEC on August 24, 2015) |
|
10.65* |
—Revolving Credit Note (Revolving B Loans) dated as of August 20, 2015 executed by Omega Protein Corporation, Omega Protein, Inc. and Bioriginal Food & Science Corp., and made payable to BMO Harris Bank N.A. (Exhibit 10.7 to the Company’s Current Report on Form 8-K filed with the SEC on August 24, 2015) |
OMEGA PROTEIN CORPORATION
|
10.66* |
—Amended and Restated Swingline Note dated as of August 20, 2015 executed by Omega Protein Corporation and Omega Protein, Inc., and made payable to Wells Fargo Bank, National Association (Exhibit 10.8 to the Company’s Current Report on Form 8-K filed with the SEC on August 24, 2015) |
| 10.67*† |
—Second Amended and Restated Guaranty Agreement dated as of August 20, 2015 by Protein Finance Company, Omega Shipyard, Inc., Protein Industries, Inc., Cyvex Nutrition, Inc., InCon Processing, L.L.C. and Wisconsin Specialty Protein, LLC in favor of Wells Fargo Bank, National Association (Exhibit 10.9 to the Company’s Current Report on Form 8-K filed with the SEC on August 24, 2015) |
| 10.68*† |
—Employment Agreement dated as of August 31, 2015 by and between Mark Livingston and Omega Protein Corporation (Exhibit 10.1 to the Company’s Current Report on Form 8-K filed with the SEC on September 1, 2015) |
| 10.69*† |
—Award of Restricted Stock Agreement for Mark Livingston dated August 31, 2015 (Exhibit 10.2 to the Company’s Current Report on Form 8-K filed with the SEC on September 1, 2015) |
| 21 | —Schedule of Subsidiaries |
| 23.1 | —Consent of PricewaterhouseCoopers LLP |
| 24.1 | —Power of Attorney (included on signature page of this Annual Report on Form 10-K). |
| 31.1 | —Certification of Chief Executive Officer pursuant to Rule 13a-15(e)/Rule 15d-15(e) |
| 31.2 | —Certification of Chief Financial Officer pursuant to Rule 13a-15(e)/Rule 15d-15(e) |
| 32.1 | —Certification of Chief Executive Officer pursuant to Section 906 of the Sarbanes-Oxley Act of 2002 |
| 32.2 | —Certification of Chief Financial Officer pursuant to Section 906 of the Sarbanes-Oxley Act of 2002 |
|
#101.INS |
—XBRL Instance Document. |
|
#101.SCH |
—XBRL Taxonomy Extension Schema Document. |
|
#101.PRE |
—XBRL Taxonomy Presentation Linkbase Document. |
|
#101.LAB |
—XBRL Taxonomy Label Linkbase Document. |
|
#101.CAL |
—XBRL Taxonomy Calculation Linkbase Document. |
|
#101.DEF |
—XBRL Definition Linkbase Document. |
| * | Incorporated by reference |
|
# |
Pursuant to applicable securities laws and regulations, we are deemed to have complied with the reporting obligation relating to the submission of interactive data files in such exhibits and are not subject to liability under any anti-fraud provisions of the federal securities laws as long as we have made a good faith attempt to comply with the submission requirements and promptly amend the interactive data files after becoming aware that the interactive data files fail to comply with the submission requirements. Users of this data are advised pursuant to Rule 406T of Regulation S-T that this interactive data file is deemed not filed or part of a registration statement or prospectus for purposes of Sections 11 or 12 of the Securities Act of 1933, as amended, is deemed not filed for purposes of Section 18 of the Securities Exchange Act of 1934, as amended, and otherwise is not subject to liability under those Sections. |
|
† |
Management Contract or Compensatory Plan or arrangement required to be filed as an exhibit pursuant to the requirements of Item 15(b) of Form 10-K and Item 601 of Regulation S-K. |
|
(b) |
—Exhibits. See Item 15(a) (3) above. | |
| (c) | —Financial Statement Schedules. See Item 15(a) (2) above. |
OMEGA PROTEIN CORPORATION
SIGNATURES
Pursuant to the requirements of Section 13 or 15(d) of the Securities Exchange Act of 1934, the Registrant has duly caused this report to be signed on its behalf by the undersigned, thereunto duly authorized on March 9, 2016.
|
|
OMEGA PROTEIN CORPORATION |
| |
| (Registrant) | |||
|
|
|
|
|
|
|
|
|
|
|
|
By: |
/s/ Andrew C. Johannesen |
|
|
|
|
Andrew C. Johannesen |
|
|
|
|
Executive Vice President and |
|
| Chief Financial Officer | |||
KNOW ALL MEN BY THESE PRESENTS, that each person whose signature appears below constitutes and appoints Bret D. Scholtes or Andrew C. Johannesen, or either of them, his or her true and lawful attorney’s in-fact and agents, with full power of substitution and resubstitution, for him or her and in his or her name, place and stead, any and all capacities, to sign his or her name to the Company’s Form 10-K for the year ended December 31, 2015 and any or all amendments, and to file the same, with all exhibits thereto, and other documents in connection therewith, with the Securities and Exchange Commission, granting unto said attorneys-in-fact and agents, and each of them, full power and authority to do and perform each and every act and thing requisite and necessary to be done in and about the premises, as fully to all intents and purposes as he or she might or could do in person, hereby ratifying and confirming all that said attorneys-in-fact and agents, or either of them, or their or his or her substitute or substitutes, may lawfully do or cause to be done by virtue hereof.
Pursuant to the requirements of the Securities Exchange Act of 1934, this report has been signed below by the following persons on behalf of the Registrant and in the capacities and on the dates indicated.
|
Signature |
|
Title |
|
Date |
|
|
|
|
|
|
|
/s/ Bret D. Scholtes |
|
President, Chief Executive Officer |
|
March 9, 2016 |
|
Bret D. Scholtes |
|
and Director |
|
|
|
|
|
|
|
|
|
/s/ Andrew C. Johannesen |
|
Executive Vice President and |
|
March 9, 2016 |
|
Andrew C. Johannesen |
|
Chief Financial Officer |
|
|
|
|
|
|
|
|
|
/s/ Mark A. Livingston |
|
Vice President and |
|
March 9, 2016 |
|
Mark A. Livingston |
|
Chief Accounting Officer |
|
|
| /s/ Gary R. Goodwin | Chairman of the Board | March 9, 2016 | ||
| Gary R. Goodwin | ||||
| /s/ Gary L. Allee | Director | March 9, 2016 | ||
| Gary L. Allee | ||||
| /s/ Stephen Bryan | Director | March 9, 2016 | ||
| Stephen Bryan | ||||
| /s/ Gary J. Ermers | Director | March 9, 2016 | ||
| Gary J. Ermers | ||||
| /s/ Paul M. Kearns | Director | March 9, 2016 | ||
| Paul M. Kearns | ||||
| /s/ David A. Owen | Director | March 9, 2016 | ||
| David A. Owen | ||||
| /s/ David W. Wehlmann | Director | March 9, 2016 | ||
| David W. Wehlmann |
93