Attached files
| file | filename |
|---|---|
| 8-K - FORM 8-K - Jernigan Capital, Inc. | v433741_8k.htm |
Exhibit 99.1

1 Investor Presentation Exhibit 99.1

2 Disclaimer Forward - Looking Statements This presentation includes "forward - looking statements" within the meaning of the Private Securities Litigation Reform Act of 1995 and other federal securities laws, including statements regarding our future performance, our 2016 earnings guidance and related key assumptions, future profits from investments , our Heitman Joint Venture, including the potential, but not consummated, $75.0 million institutional co - investment in the Heitman Joint Venture, our proposed credit facility, our loan pipeline, our anticipated loan closings and future funding of existing loan commitments. The ultimate occurrence of events and results referenced in these forward - looking statements is subject to known and unknown risks and uncertainties, many of which are beyond our control. These forward - looking statements are based upon the Company's present intentions and expectations, but the events and results referenced in these statements are not guaranteed to occur. Investors should not place undue reliance upon forward - looking statements. There can be no assurance that Heitman will procure a $75.0 million institutional co - investment in the Heitman Joint Venture, that we will complete our proposed credit facility or that our expectations of the future performance of our investments or the Heitman Joint Venture will be achieved. There is the risk that we will fail to successfully negotiate term sheets and enter into definitive agreements with respect to prospective loan transactions included in the pipeline described above, as well as the possibility that loans we anticipate making in the future, for which we have signed term sheets, will not close. For a discussion of these and other risks facing our business, see the information under the heading “Risk Factors” in our Annual Report on Form 10 - K to be filed with the Securities and Exchange Commission (“SEC”) and our other filings with the SEC from time to time, which are accessible on the SEC’s website at www.sec.gov .

3 Table of Contents SECTION 1 | Company Overview SECTION 2 | How We Operate SECTION 3 | Our Current Portfolio SECTION 4 | Sector Ripe For JCAP’s Investment Strategy SECTION 5 | Recent Developments

4 Company Overview

5 About Jernigan Capital Jernigan Capital, Inc. (NYSE: JCAP) is a New York Stock Exchange - listed REIT that primarily invests in self - storage development projects in major markets and, secondarily makes first mortgage acquisition and refinancing loans on operating self - storage facilities . Since closing its IPO on April 1, 2015, JCAP has committed approximately $175.7 million of capital to 24 separate projects, including 14 development projects totaling $118.4 million of committed capital. Management’s extensive experience in over 100 U.S. markets — from acquiring and managing properties to new storage development — provides JCAP with knowledge unmatched by any investor in the self storage sector outside the large equity REITs . While its investments are structured as secured debt for legal, tax and financial reporting reasons, the Company underwrites like an equity investor and, in fact, obtains 50% profits interests and rights of first refusal upon sale of all newly - developed storage facilities, which comprise 67% of the Company’s investments to date and 95+% of the Company’s investment pipeline.

6 JCAP Mission Statement To be the preeminent capital partner to self - storage entrepreneurs nationwide by offering creative solutions through an experienced team demonstrating the highest levels of integrity, dedication, excellence, and community, while maximizing shareholder value.

7 » $175.7 million of closed loans with additional $600+ million pipeline » Sourced primarily through long - time industry relationships and reputations of management » Development activity increasing in sector starved for new supply » JCAP obtains ROFRs on all development investments, providing clear path to equity ownership » Founder Dean Jernigan has 30 + years of self - storage experience ▪ CEO of two publicly traded REITs (Storage USA and CubeSmart) for 16 years ▪ Executed $200 million through similar loan program/strategy at Storage USA » Chief Operating Officer John Good has over 28 + years working in the REIT and financial services industries, including time as a nationally recognized corporate and securities lawyer acting as lead counsel on over 200 equity and debt offerings Experienced and Aligned Management Investment Focus on Development of High Quality Self - Storage Properties in Major U.S. Markets Strong Growth Pipeline Robust Industry Fundamentals Company Highlights » Annual supply growth of <0.5% for last 5 years » Industry leading 8 - 10% same store NOI growth » Estimated 50%+ development margins » Closed 24 loans totaling $175.7 million; $118.4 million (67%) in 14 development investments » Currently 14 signed term sheets for $119.4 million of development investments (100% of term sheets) » Focus on high growth, high demographic U.S. markets with shortage of self - storage supply » Investment economics: 1% up - front and 3% prepayment fee, 6.9% current return, 49.9% profits interest » Risk mitigated by management experience, conservative reserves, ROFRs and protective deal terms » Expected $20.5 million to $28.5 million inherent JCAP profit in development portfolio

8 2006 - 2013: CEO of CubeSmart 1995 - 2002: Member of NAREIT’s Board of Governors Management Team Key Members Background Dean Jernigan President and Chief Executive Officer ▪ 30+ years of experience ▪ CEO of CubeSmart from 2006 to 2013 ▪ Chairman and CEO of Storage USA from 1984 to 2002 ▪ Member of NAREIT’s Board of Governors from 1995 to 2002 and as a member of its Executive Committee from 1998 to 2002 ▪ Has invested over $3 billion of capital in the self - storage industry John Good President and Chief Operating Officer ▪ 28+ years of experience with nationally - known corporate/securities law firms ▪ Former outside corporate and securities counsel to CubeSmart and IPO counsel for Jernigan Capital ▪ Nationally recognized corporate and securities lawyer, lead counsel on over 200 securities offerings raising in excess of $25 billion and M&A transactions in excess of $17 billion ▪ Ranked by Chambers USA as a leading lawyer to the REIT industry and has been active in NAREIT since 1994 Bill Drummond Chief Financial Officer ▪ 37 years of accounting experience at Ernst & Young, including 26 years as an audit partner ▪ Audit partner for over 15 public company clients ▪ Managing Partner of Memphis EY office 1994: Took Storage USA Public 1984: Founded Storage USA 2004 - 2006: President of Jernigan Property Group, LLC 2002: Sale of Storage USA after 18 years as CEO 2002 - 2004: Private investor 1999 - 2012 : Board of Directors of Thomas & Betts, Inc 2014 - 2015: Lead Director of Farmland Partners, Inc. Dean Jernigan Timeline 2014: Founded Jernigan Capital, LLC

9 How We Operate

10 We Are Not A Typical Mortgage REIT Typical Mortgage REIT • Higher corporate leverage, including leverage of junior debt • No equity participation • Structured finance arbitrage rather than property focus Jernigan Capital • Low corporate leverage • Equity participations that allow investors to participate in property appreciation • Specific niche property focus led by team with decades of experience in self - storage • Rights of first refusal for purchase of all new development (1) » JCAP has characteristics that distinguish it from a typical mortgage REIT ▪ Emphasis on outsized value accretion versus current cash flow ▪ Underwriting to own versus underwriting to avoid owning ▪ Structural pathway to asset ownership versus return and redeployment of principal (1) Excluding C/O take - out deals

11 Investment Strategy / Target Investments Opportunistic (33% of Current) C/O take - out Acquisitions Refinancing Development (67% of Current; 95%+ of Pipeline) Ground - up construction Major redevelopment ₋ Up to 90% LTC ₋ 4 - 6 year term ₋ 6.9% coupon + 50% profit interest ₋ 10 - 20% funded at origination; balance drawn over 8 - 14 months ₋ ROFR to acquire property ₋ Equity participation possible ₋ Fully funded at origination ₋ 4 - 6 year term ₋ Up to 90% LTV » Primary focus on programmatic self - storage development in top - tier markets ▪ We seek experienced developers looking for a reliable and fair capital partner x Known to JCAP management x High character, financial stability and proven track record for picking great sites x Loyalty ▪ We seek markets positioned for high return self - storage development x Low self - storage coverage per capita x High density, population growth and household incomes x Concentration of renters (particularly millennials) » Current portfolio includes 10 opportunistic refinancing/acquisition loans extended to generate current income – not currently seeking those loan investments

12 Conservative Underwriting and Expert Processing/Servicing » Conservative underwriting by management team with many years of experience ▪ Significant operating and interest reserves built into each project ▪ Developer equity funded up front ▪ Significant input from CUBE and other property managers on unit mix and projected operating results ▪ Conservative lease - up projection relative to current experience by equity REITs ▪ Rents not trended in underwriting ▪ Deal structure designed for quick takeover, together with strong covenants, completion guarantees and ROFR » Expert monitoring and servicing ▪ JCAP servicing team – collective experience of more than 40 years across all property types ▪ General Counsel – over 30 years of real estate experience representing primarily developers and serial acquirers ▪ Construction monitoring and draw authorization by Newbanks (national firm with 55 years in business, focused exclusively on construction consulting services and client list including all major financial institutions) ▪ Cloud - based loan accounting system used by major financial institutions

13 Underwriting Selection $1 billion + Loans reviewed $400 million Term sheets issued $285 million Signed Term Sheets $175.7 million Closed Loans JCAP uses a stringent underwriting process based on management’s extensive experience and successful track record underwriting self - storage properties and markets
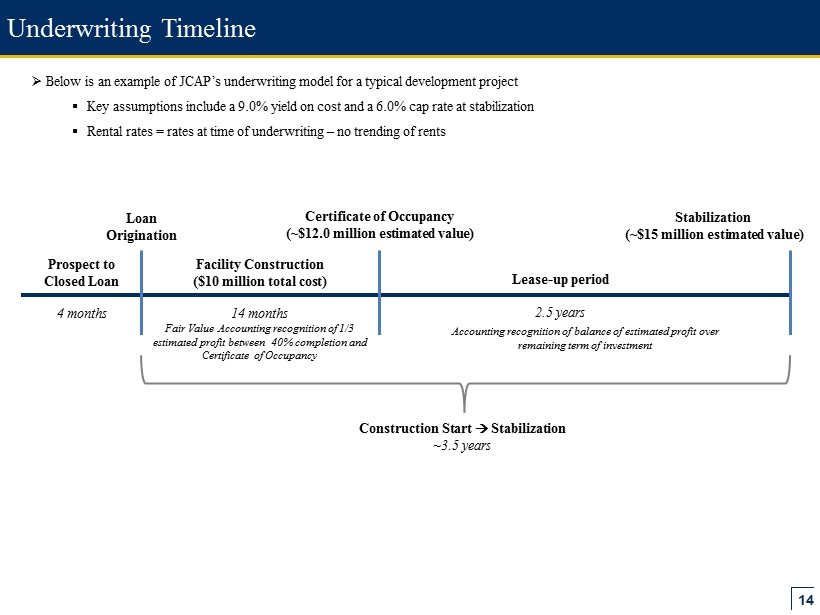
14 Underwriting Timeline Prospect to Closed Loan 4 months Facility Construction ($10 million total cost) 14 months Lease - up period 2.5 years Certificate of Occupancy (~$12.0 million estimated value) Loan Origination Stabilization (~$15 million estimated value) Construction Start Stabilization ~3.5 years » Below is an example of JCAP’s underwriting model for a typical development project ▪ Key assumptions include a 9.0% yield on cost and a 6.0% cap rate at stabilization ▪ Rental rates = rates at time of underwriting – no trending of rents Fair Value Accounting recognition of 1/3 estimated profit between 40% completion and Certificate of Occupancy Accounting recognition of balance of estimated profit over remaining term of investment

15 Our Current Portfolio

16 West Palm Beach Fort Lauderdale Miami Closed Loan Geography Atlanta (Alpharetta, Marietta) Development Market Stabilized Asset Market Current Markets Charlotte Orlando (Ocoee) New Orleans (Mandeville) Tampa (Riverview) Milwaukee Pittsburgh New Haven Austin (Round Rock) Sacramento Raleigh Jacksonville (Fleming Island) Lehigh Valley (Hackettstown) Sarasota Jernigan Capital’s existing portfolio is secured by high quality projects in top markets across the country Nashville (Arrington, Franklin) C/O Take - Out Market Chicago (Prospect Hills)

17 Sector Ripe for JCAP’s Investment Strategy

18 Current Self - Storage Market Opportunity Excellent Self - Storage Industry Fundamentals Significant Borrower Demand Lack of Adequate Financing Attractive Opportunity for JCAP

19 Industry Leading Fundamentals NOI Growth Occupancy » Self - storage total returns during the last ten years have been 4 times greater than the MSCI US REIT Index (RMS) » Industry is essentially full (91 - 94% occupied) and driving premium (8 - 11 %) same store NOI growth » Public REITs have predominantly avoided development, favoring acquisition and “C/O deals” (Certificate of Occupancy) 0.0% 2.0% 4.0% 6.0% 8.0% 10.0% 12.0% 4Q10 1Q11 2Q11 3Q11 4Q11 1Q12 2Q12 3Q12 4Q12 1Q13 2Q13 3Q13 4Q13 1Q14 2Q14 3Q14 4Q14 1Q15 2Q15 3Q15 4Q15 76.0% 78.0% 80.0% 82.0% 84.0% 86.0% 88.0% 90.0% 92.0% 94.0% 4Q10 1Q11 2Q11 3Q11 4Q11 1Q12 2Q12 3Q12 4Q12 1Q13 2Q13 3Q13 4Q13 1Q14 2Q14 3Q14 4Q14 1Q15 2Q15 3Q15 4Q15

20 0.00% 0.20% 0.40% 0.60% 0.80% 1.00% 1.20% - 2,000 4,000 6,000 8,000 10,000 12,000 14,000 16,000 18,000 2004 2005 2006 2007 2008 2009 2010 2011 2012 2013 2014 As % of Existing Supply New Square Footage (000s) New Square Footage Completions As a % of Existing Supply Development Loan Opportunity New Square Footage Constructed - Nationwide » Supply growth has historically been modest (<1%) due to “spec” build / long lease - up times » Exacerbated over the last 5 years due to financial crisis and resulting regulatory changes / pressures » Management estimates top 50 markets are undersupplied by 1,600 facilities » Drives strong industry fundamentals and creates development loan opportunities Source: FW Dodge, Self - Storage Almanac 5 years of dramatic undersupply

21 $0 $500 $1,000 $1,500 $2,000 $2,500 2015 2016 2017 Self Storage Maturing Loans in Millions Self Storage Loans maturing Self - Storage Stabilized Asset Funding Opportunity Transaction Volume - Nationwide CMBS Maturing Loans » Complementary multi - billion dollar opportunities in both acquisition and refinance loan markets » Capitalize on management’s expertise and relationships to solve problems for higher LTV borrowers Source: Cushman & Wakefield, Self - Storage Industry Group Source: Trepp, LLC $0 $500 $1,000 $1,500 $2,000 $2,500 $3,000 2009 2010 2011 2012 2013 2014 Dollar Volume in Millions Dollar Volume (Millions)

22 Recent Developments

23 Capitalization » Joint Venture with Heitman Capital Management ▪ $122.2 million venture – 90% Heitman ($110 million assuming procurement of $75 million institutional co - investment currently in progress; $41.9 million if no co - investment is procured) and 10% JCAP ($12.2 million) ▪ Includes three existing JCAP assets (two in Miami and one in Fort Lauderdale) not yet under construction with aggregate committed principal of $41.9 million ▪ Preferential return of operating cash flow of 1% of aggregate committed principal (excluding three contributed investments) ▪ $100,000 per year administrative fee to JCAP (upon full deployment of capital) ▪ All other operating cash flows split 90/10 ▪ Additional promoted interest (in addition to 10% ownership distribution) on residual (non - operating) cash flows: 10% if IRR to Heitman exceeds 14%, 20% if IRR exceeds 17% and 30% if IRR exceeds 20% ▪ JCAP to manage the venture, subject to removal upon breach of contract or change in control » Proposed Credit Facility ▪ $60 million secured facility currently subject to executed term sheet with documentation and lender diligence in process – estimated closing end of March ▪ 65% advance rate on loan advances made by JCAP; put right on defaulted loans but otherwise limited recourse to JCAP ▪ Rate in high 4s

24 2016 Earnings Guidance » Revenues increasing as capital is deployed ▪ Interest income of $6.0 million to $6.5 million ▪ Income from Heitman Joint Venture of $1.2 million to $1.3 million ▪ Total income of $7.2 million to $7.8 million » Stabilized G&A spread across increasing assets ▪ Total G&A of $ 7.4 million to $7.6 million ▪ G&A, exclusive of stock - based compensation, of $ 6.5 million to $6.7 million ▪ Management fee stable at approximately $1.7 million » Fair value adjustments are expected to increase earnings and book value per share ▪ Estimated $ 20.5 million to $28.5 million of realizable value from profits interests on development deals (including our anticipated share from the Heitman Joint Venture) ▪ Estimated $ 5.0 million to $7.0 million of fair value accretion in 2016 » Earnings per Share Estimates: ▪ Diluted earnings per share of $0.64 to $1.09 ▪ Adjusted earnings per share (EPS plus stock - based compensation) of $0.79 to $1.24 ▪ Adjusted cash earnings per share (Adjusted EPS less unrealized appreciation) of $(0.01) to $0.12

25 Non - GAAP Financial Measures and Reconciliations Non - GAAP Financial Measures Adjusted Earnings is a non - GAAP measure and is defined as net income plus stock - based compensation expense, and Adjusted Cash Earnings is a non - GAAP measure and is defined as Adjusted Earnings reduced by unrealized appreciation in fair value of investments. Management uses Adjusted Earnings and Adjusted Cash Earnings as key performance indicators in evaluating the operations of the Company's business. The Company is a capital provider to self - storage developers and believes that these measures are useful to management and investors as a starting point in measuring its operational performance because they exclude various non - cash items included in net income that do not relate to or are not indicative of its operating performance, which can make periodic and peer analyses of operating performance more difficult. The Company’s computation of Adjusted Earnings and Adjusted Cash Earnings may not be comparable to other key performance indicators reported by other REITs or real estate companies. 2016 Full Year Guidance Range or Value Diluted earnings per share of common stock $ 0.64 to $ 1.09 Plus: stock - based compensation 0.15 0.15 Adjusted Earnings per share of common stock $ 0.79 to $ 1.24 Less: unrealized appreciation in fair value of investments (0.80) (1.12) Adjusted Cash Earnings per share of common stock $ (0.01) to $ 0.12 RECONCILIATION OF ADJUSTED EARNINGS PER SHARE OF COMMON STOCK AND ADJUSTED CASH EARNINGS PER SHARE OF COMMON STOCK 2016 Guidance