Attached files
UNITED STATES
SECURITIES AND EXCHANGE COMMISSION
Washington, D.C. 20549
FORM 10-K
|
☒ |
|
ANNUAL REPORT PURSUANT TO SECTION 13 OR 15(d) OF THE SECURITIES EXCHANGE ACT OF 1934 |
|
For the fiscal year ended December 31, 2015 |
|
OR |
|
☐ |
|
TRANSITION REPORT PURSUANT TO SECTION 13 OR 15(d) OF THE SECURITIES EXCHANGE ACT OF 1934 |
|
For the transition period from to |
Commission File Number: 001-32563
 |
ORCHIDS PAPER PRODUCTS COMPANY
|
|
A Delaware corporation (State or other jurisdiction of incorporation or organization) |
23-2956944 (I.R.S. Employer Identification Number) |
|
4826 Hunt Street
Pryor, Oklahoma 74361
(Address of principal executive offices)
Registrant's telephone number, including area code: (918) 825-0616
Securities registered pursuant to Section 12(b) of the Act:
|
Title of each class |
|
Name of each exchange on which registered |
|
Common Stock, $0.001 Par Value |
|
NYSE MKT |
Securities registered pursuant to Section 12(g) of the Act: None
Indicate by check mark if the registrant is a well-known seasoned issuer, as defined in Rule 405 of the Securities Act.
Yes ☐ No ☒
Indicate by check mark if the registrant is not required to file reports pursuant to Section 13 or Section 15(d) of the Act.
Yes ☐ No ☒
Indicate by check mark whether the registrant (1) has filed all reports required to be filed by Section 13 or 15(d) of the Securities Exchange Act of 1934 during the preceding 12 months (or for such shorter period that the registrant was required to file such reports), and (2) has been subject to such filing requirements for the past 90 days. Yes ☒ No ☐
Indicate by check mark whether the registrant has submitted electronically and posted on its corporate Web site, if any, every Interactive Data File required to be submitted and posted pursuant to Rule 405 of Regulation S-T (§232.405 of this chapter) during the preceding 12 months (or for such shorter period that the registrant was required to submit and post such files). Yes ☒ No ☐
Indicate by check mark if disclosure of delinquent filers pursuant to Item 405 of Regulation S-K (§229.405 of this chapter) is not contained herein, and will not be contained, to the best of registrant's knowledge, in definitive proxy or information statements incorporated by reference in Part III of this Form 10-K or any amendment to this Form 10-K. ☐
Indicate by check mark whether the registrant is a large accelerated filer, an accelerated filer, a non-accelerated filer or a smaller reporting company. See definition of "accelerated filer", "large accelerated filer" and "smaller reporting company" in Rule 12b-2 of the Exchange Act. (Check One).
|
Large Accelerated Filer ☐ |
Accelerated Filer ☒ |
Non-accelerated Filer ☐ (Do not check if a smaller reporting company) |
Smaller Reporting Company ☐ |
Indicate by check mark whether the registrant is a shell company (as defined in Rule 12b-2 of the Exchange Act). Yes ☐ No ☒
The aggregate market value of the registrant's common equity held by non-affiliates was approximately $225.2 million as of June 30, 2015.
As of March 1, 2016, there were outstanding 10,275,141 shares of common stock, none of which are held in treasury.
DOCUMENTS INCORPORATED BY REFERENCE
Portions of the definitive Proxy Statement for the Registrant's 2016 Annual Meeting of Stockholders (the "Annual Meeting of Stockholders") to be filed within 120 days after December 31, 2015, are incorporated by reference into Part III of this Form 10-K.
TABLE OF CONTENTS
|
|
|
Page |
|
|
Part I |
|
|
|
|
|
|
Item 1. |
Business |
3 |
|
Item 1A. |
Risk Factors |
12 |
|
Item 1B. |
Unresolved Staff Comments |
18 |
|
Item 2. |
Properties |
19 |
|
Item 3. |
Legal Proceedings |
20 |
|
Item 4. |
Mine Safety Disclosures |
20 |
|
|
|
|
|
|
Part II |
|
|
|
|
|
|
Item 5. |
Market for Registrant's Common Equity, Related Stockholder Matters and Issuer Purchases of Equity Securities |
20 |
|
Item 6. |
Selected Financial Data |
22 |
|
Item 7. |
Management's Discussion and Analysis of Financial Condition and Results of Operations |
24 |
|
Item 7A. |
Quantitative and Qualitative Disclosures About Market Risk |
40 |
|
Item 8. |
Financial Statements and Supplementary Data |
41 |
|
Item 9. |
Changes in and Disagreements with Accountants on Accounting and Financial Disclosure |
71 |
|
Item 9A. |
Controls and Procedures |
71 |
|
Item 9B. |
Other Information |
71 |
|
|
|
|
|
|
Part III |
|
|
|
|
|
|
Item 10. |
Directors, Executive Officers and Corporate Governance |
72 |
|
Item 11. |
Executive Compensation |
72 |
|
Item 12. |
Security Ownership of Certain Beneficial Owners and Management and Related Stockholder Matters |
72 |
|
Item 13. |
Certain Relationships and Related Transactions, and Director Independence |
73 |
|
Item 14. |
Principal Accountant Fees and Services |
73 |
|
|
|
|
|
|
Part IV |
|
|
|
|
|
|
Item 15. |
Exhibits and Financial Statement Schedules |
74 |
|
Signatures |
75 | |
PART I
Throughout this Form 10-K we "incorporate by reference" certain information from parts of other documents filed with the Securities and Exchange Commission (the "SEC"). The SEC allows us to disclose important information by referring to it in that manner. Please refer to such information.
In Item 1A, we discuss some of the business risks and factors that could cause the Company's actual results to differ materially from those stated in our forward-looking statements and from our historical results.
Item 1. BUSINESS
Overview of Our Business
We are a customer focused, national supplier of high quality consumer tissue products. We produce bulk tissue paper, known as parent rolls, and convert parent rolls into finished products, including paper towels, bathroom tissue and paper napkins. We sell any parent rolls not required by our converting operation to other converters. Our integrated manufacturing facilities have flexible production capabilities, which allow us to produce high quality tissue products with short production times across all quality tiers for customers in our target regions. We predominately sell our products under private labels to our core customer base in the “at home” market, which consists primarily of dollar stores, discount retailers and grocery stores that offer limited alternatives across a wide range of products. Our focus to date has been the dollar stores (which are also referred to as discount retailers) and the broader discount retail market because of their overall market growth, consistent order patterns and low number of stock keeping units (“SKUs”). The “at-home” tissue market consists of several quality levels, including a value tier, premium tier and ultra-premium tier. To a lesser extent, we service customers in the “away from home” market. Our core customer base in the “away from home” market consists of companies in the janitorial market and food service market. Most of the products we sell in the “away from home” market are included in the value tier. While we expect to continue to service this market in the near term, we currently do not consider the “away from home” market a growth vehicle for us.
Our facilities have been designed to have the flexibility to produce and convert parent rolls across different product tiers and to use both virgin and recycled fibers to maximize quality and to control costs. We own an integrated facility in Pryor, Oklahoma with modern paper making and converting equipment, which primarily services the central United States. We recently invested approximately $39 million at this facility for a new paper machine and a new converting line. The new paper machine commenced operations in the first quarter of 2015 and provides us with an additional 17,000 tons of parent roll capacity. The new paper machine has improved our margins by reducing our manufacturing cost and providing us additional parent roll capacity, resulting in total capacity of 74,000 tons of parent rolls per year at our Pryor facility. In addition, our new converting line commenced operations in June 2015 and is expected to add 12,500 tons of capacity, for a total of 82,500 tons of converting capacity in our Pryor facility. In June 2014, we expanded our geographic presence to service the United States West coast through a strategic transaction with Fabrica de Papel San Francisco, S.A. de C.V. (“Fabrica”), one of the largest tissue manufacturers by capacity in Mexico (the “Fabrica Transaction”). The Fabrica Transaction provided us access to Fabrica’s U.S. customers, which we believe will allow us to further penetrate the region, and the supply agreement (“Supply Agreement”) we entered into with Fabrica has provided access to up to 19,800 tons of product each year (up to 27,500 tons in the first two years of the agreement).
As part of our strategy to be a national supplier of high quality consumer tissue products, we began construction on our plans to build a world-class integrated tissue operation in Barnwell, South Carolina in the second quarter of 2015. We believe that this new facility will allow us to better serve our existing customers in the Southeast United States, while also enabling us to penetrate new customers in this region. The facility is designed to provide highly flexible, cost competitive production across all quality tiers with paper making capacity of between 35,000 and 40,000 tons per year and converting capacity of between 30,000 and 32,000 tons per year. The first converting line is expected to be operational by the end of the first quarter of 2016 and the second converting line is expected to be operational by the end of the second quarter of 2016. The paper machine will utilize a highly versatile process capable of producing all quality grades, including ultra-premium tier products, and is expected to be operational by the beginning of 2017. We estimate the total costs of the project to be approximately $136 million, which will be financed through a combination of bank debt, the proceeds from our April 2015 follow-on stock offering and financing related to a New Market Tax Credit transaction.
Converted Products
The capacity of our twelve converting lines in Pryor, Oklahoma is highly dependent upon the mix of products produced (e.g. bath tissue versus paper towels versus napkins) and the configuration of products produced (e.g. one roll pack versus multi-roll packs, the size of multi-roll packs (6-count versus 8-count versus 12-count), and sheet counts). Current and expected product configurations and efficiencies reflect an annual converting capacity of approximately 12.0 million cases, or 82,500 tons, of finished tissue products.
Parent Rolls
Generally, our parent roll production operation runs on a 24/7 operating schedule. Any parent rolls we produce in excess of converting production requirements are sold into the open market. Our strategy is to sell all of the parent rolls we manufacture as converted products (such as paper towels, bathroom tissue and napkins), which generally carry higher margins than non-converted parent rolls. The capacity obtained under the previously described Fabrica Transaction will be sold in converted product form and we do not plan to sell any excess capacity arising from this transaction in parent roll form. Parent rolls are a commodity product and thus are subject to market pricing. We plan to continue to sell any excess parent roll capacity on the open market as long as market pricing is profitable. When converting production requirements exceed paper mill capacity, we supplement our paper making capacity by purchasing parent rolls on the open market, which we believe has an unfavorable impact on our gross profit margin. During the construction phase of our new paper machine, our total tissue paper production was reduced and we were required to purchase parent rolls on the outside market during the fourth quarter of 2014 and first quarter of 2015 to meet our converting requirements. In 2014, we ran all of our paper machines on a full-time basis until we began decommissioning two older paper machines in September of 2014 in preparation of construction and installation of the new paper machine.
We purchase various types of fibers to manufacture bulk rolls of tissue paper, called "parent rolls," which we then convert into a broad line of finished tissue products. The fiber we source to manufacture our parent rolls primarily consists of pre-consumer recycled grades, with a lesser amount consisting of virgin kraft grades. As we continue our efforts to expand our product offerings into the higher quality tiers of the market, the percentage of virgin kraft grades that we purchase will likely increase. Our paper mill has a pulping process which takes recycled fibers and kraft fibers and processes them for use in our three paper machines. Our pulping operation has the ability to selectively process our basket of fibers by specific recipe to achieve maximum quality and to control costs. In March of 2015, we replaced two of our older paper machines with a new paper machine, which increased our tissue paper making capacity from approximately 57,000 tons to approximately 74,000 tons, depending upon the mix of paper grades produced. The new machine also reduced our manufacturing costs, improved product quality and increased manufacturing flexibility.
Customers
We supply both large national customers and regional customers with a focus on high growth regions of the United States. Our largest customers are Dollar General, Family Dollar and HEB, which accounted for 61% of our converted product sales in 2015. Our products are a daily consumable item. Therefore, the order stream from our customer base is fairly consistent with limited seasonal fluctuations. Changes in the national economy do not materially affect the market for our products due to their non-discretionary nature and high degree of household penetration. Demand for tissue typically grows in line with overall population, and our customers are typically located in regions of the U.S. where the population is growing faster than the national average. Additionally, private label consumer products have continued to gain market share over branded products.
We focus our sales efforts on areas within approximately 500 miles of either our manufacturing facility in Oklahoma or Fabrica’s manufacturing facility in Mexicali, Mexico, as we believe this radius maximizes our freight cost advantage. The freight optimization effect will apply to our South Carolina facility as well. Because we are one of the few integrated tissue paper manufacturers in the areas around both our Oklahoma facility and Fabrica’s Mexicali facilities, we believe we typically have lower freight costs to our customers’ distribution centers located in our target regions. Our target region around our Oklahoma facility includes Texas, Oklahoma, Kansas, Missouri and Arkansas. The Fabrica Transaction has allowed us to more effectively service customers that are located on the West Coast by directly shipping them products that are produced in Mexico under the Supply Agreement. As a result, we have expanded our target region to include California, Nevada, Arizona, New Mexico and Utah. Our planned manufacturing facility in Barnwell, South Carolina is intended to help us meet the growing demand in the southeastern region of the United States. Demand for tissue in the “at home” tissue market has historically been closely correlated to population growth and as such, performs well in a variety of economic conditions. Our expanded target region has experienced strong population growth for the past fourteen years relative to the national average, and these trends are expected to continue.
Our products are sold primarily under our customers’ private labels and, to a lesser extent, under our brand names such as Colortex®, My Size®, Velvet®, Big Mopper®, Linen Soft®, Soft & Fluffy®, and Tackle®. The Fabrica Transaction gave us the exclusive right to sell products under Fabrica’s brand names in the United States, including under the names Virtue®, Truly Green®, Golden Gate Paper® and Big Quality®. All of our converted product net sales are derived through truck load purchase orders from our customers. Parent roll net sales are derived from purchase orders that generally cover a one-month time period. We do not have supply contracts with any of our customers, which is normal practice within our industry.
In 2015, we generated net sales of $168.4 million, of which 96% came from the sale of converted products and 4% came from the sale of parent rolls. Our converted product sales consisted of 52% from paper towels, 45% from bathroom tissue, and 3% from paper napkins. In 2015, 61% of our converted product net sales came from two discount retailers and one grocery store. The balance of 2015 converted product net sales came from other discount retailers, grocery stores, grocery wholesalers and cooperatives, convenience stores, janitorial supply companies and companies in the food service market.
Our profitability depends on several key factors, including but not limited to:
|
● |
the volume of converted product sales; |
|
● |
the cost of fiber used in producing paper; |
|
● |
the market price of our products; |
|
● |
the efficiency of operations in both our paper mill and converting facility; and |
|
● |
the cost of energy. |
The private label market of the tissue industry is highly competitive, and many discount retail customers are extremely price sensitive. As a result, it is difficult to affect price increases. We expect these competitive conditions to continue.
History
We were formed in April 1998 following the acquisition of our present facilities located in Pryor, Oklahoma and subsequently changed our name to Orchids Paper Products Company. In July 2005, we completed our initial public offering and in July 2009, we completed a follow-on stock offering. In 2014, in conjunction with the Fabrica Transaction, we acquired certain paper-making and converting assets located in Mexicali, Mexico, as well as Fabrica’s U.S. business. In April 2015, we completed a follow-on stock offering. The proceeds of $32.1 million were used to help fund the construction of our greenfield site in Barnwell, South Carolina.
Our Strategy
Our goal is to be a customer focused national supplier of high quality consumer tissue products. We intend to achieve our goal through the key strategies set forth below:
|
● |
Strengthen and expand our customer base. Long-term customer partnerships are central to our business strategy. We work closely with existing and prospective customers to develop new and innovative products and provide high value-added services, leading to deeper relationships and an increased store presence for our products. Our broad service expertise allows us to streamline logistics and improve inventory management for our customers as well as optimize our own product offerings. This high value-added approach to service has allowed us to develop new relationships and provided the opportunity for mutual growth with our customers. We expect our strategy of cooperative and innovative product development and superior customer service will further strengthen relationships with existing customers as well as expand our overall customer base. |
|
● |
Focus on higher growth geographic regions and private label channels. We are focusing our sales efforts on the growing private label channels and higher population growth regions of the United States. Our existing facilities are located within economic shipping distance to a number of these geographic regions and we focus our expansion efforts to further penetrate the higher growth regions. Within our economic shipping area, population growth is forecasted by the U.S. Census Bureau and the Weldon Cooper Center for Public Service to be 1.20% on average per year between 2014 and 2020, which compares favorably to the overall U.S. rate of 0.86% for the same period. In addition, our production is primarily focused on private label products, which, according to Information Resources Inc. (IRI), a provider of information about retail products, continues to benefit from a favorable long-term shift resulting in market share gains at the expense of national brands. Since 2010, according to IRI, private label sales of bathroom tissue, towels, and napkins have increased their market share by 3.6% versus branded tissue. We believe our strategy of targeting high growth markets and private label channels will enable us to continue to capitalize on these positive market trends. |
|
● |
Maintain flexible, low cost integrated facilities able to produce a broad product spectrum. In order to achieve our growth objectives, we believe it is crucial to maintain a low cost position across value, premium and ultra-premium product tiers. Our goal is to convert 100% of the parent rolls we produce to maximize margins and provide better control over the quality and cost of our converted products. Since 2004, we have invested over $160 million to modernize our Oklahoma facility, which resulted in increased capacity, improved quality and flexibility and reduced cost. Our alliance with Fabrica provides us with access to 19,800 tons per year of capacity through a broad offering of high quality tissue from a low cost, large scale integrated facility. We will continue to pursue opportunities to optimize our cost position, improve flexibility and improve our capabilities. |
|
● |
Expand manufacturing footprint. Strategically located manufacturing facilities are important to establishing and maintaining customer relationships due to the relatively high cost of freight for tissue product as a percentage of overall selling price. Currently, we are supplying significant converted product volumes to customers in the Southeast region despite an extended shipping distance from our Oklahoma facility. In order to better serve existing customers, grow market share and increase our profitability, we plan to develop manufacturing capabilities that are within more economically advantageous shipping distances to these customers. We expect that our expansion in South Carolina will also allow us to better reach new customers in this region, thereby providing an opportunity to reduce overall cost and gain additional market share. |
|
● |
Employ a disciplined capital strategy. We believe that a prudent and diligent approach to capital deployment can create significant value for stockholders. Our strategy is to focus on growing free cash flow, maintaining a low leverage balance sheet and targeting high return capital projects with paybacks of less than five years. Since we implemented a quarterly dividend in February 2011, the amount of the annual dividend has grown from $0.40 to $1.40 per share. While we will continue to evaluate capital projects consistent with our growth strategy, we intend to maintain our commitment to returning capital to shareholders through a dividend. |
Competitive Conditions
We believe the principal competitive factors in the markets in which we operate are quality attributes, price and service, and that our competitive strengths with respect to other private label manufacturers include long-standing relationships with discount retailers; providing value-added services to our customers; low cost, well-invested manufacturing operations; a strategically located manufacturing footprint; an experienced management team with a proven track record; a broad line of products; and flexible converting capabilities, which enables us to produce tissue products in a variety of sizes, packs and weights. This flexibility allows us to meet the particular demands of individual retailers. We believe the product quality attributes that can be produced from our converting lines, new processes on our newest paper machines and other new product development initiatives will allow us to effectively compete in the higher tier markets.
Competition in the tissue market is significantly affected by geographic location, as freight costs represent a material portion of end product costs. We believe it is generally economically feasible for us to ship within an approximate 900-mile radius of the production site; however we primarily focus on an approximate 500-mile radius, as we believe this radius maximizes our freight cost advantage over our competitors. In Oklahoma and the surrounding area, we believe that Georgia-Pacific's Muskogee, Oklahoma plant, Cascades' Memphis, Tennessee plant, Pacific Paper's Memphis, Tennessee plant, Sofidel’s Tulsa, Oklahoma converting plant and Clearwater Paper Corporation's Oklahoma City, Oklahoma converting plant are the only significant competing plants in this region. Our competitors also have plants in the 500-mile radius from Fabrica’s Mexicali plant, including Royal Paper in Arizona, Cascades in Arizona, Clearwater in Nevada, Sofidel in Nevada and Asia Pulp and Paper in California. However, we face greater competition in the Southeast and Midwest regions of the United States. Georgia-Pacific has additional plants in Georgia, Louisiana and Wisconsin; Cascades has plants in Pennsylvania, Wisconsin, and North Carolina; and Clearwater Paper Corporation has plants in Georgia, Idaho, Illinois, Mississippi, New York, North Carolina and Wisconsin.
The private label tissue market is highly fragmented and we believe the number of competitors in the private label market will not significantly increase in the near future because of the large capital expenditures required to establish a paper mill and converting facility and difficulties in obtaining environmental and local permits for parent roll manufacturing facilities.
Product Overview
We offer our customers an array of private label products, including bathroom tissue, paper towels and paper napkins, across the value, premium and ultra-premium market segments. In 2015, 52% of our converted product case shipments were paper towels, 45% were bathroom tissue and 3% were paper napkins. Of our converted products sold in 2015, 73% were packaged as private label products in accordance with our customers' specifications. The remaining 27% were packaged under our brands and those licensed from Fabrica, including Colortex®, My Size®, Velvet®, Big Mopper®, Linen Soft®, Soft & Fluffy®, Tackle®, Virtue®, Truly Green®, Golden Gate Paper® and Big Quality®. We do not currently actively promote our brand names and do not believe our brand names have significant market recognition. Products with our brand names are primarily sold to smaller customers who use them as their in-store labels. Our core customer base consists of discount retailers (including dollar stores). We also sell our products to grocery stores, grocery wholesalers and cooperatives, convenience stores, janitorial supply stores and stores in the food service market. Our recent growth has come from providing products from all market tiers to discount retailers, primarily dollar stores, as well as grocery stores. We believe we were among the first to focus on serving customers in the discount retail channel and we have benefited from their increased emphasis on consumables, such as tissue products and the expansion of their private label product line into higher tiers as part of their merchandising strategies. By seeking to provide improved product quality, consistently competitive prices, and superior customer service, we believe we have differentiated ourselves from our competitors and generated momentum with discount retailers. In 2015, approximately 64% of our converted product net sales was derived from sales to the discount retail channel.
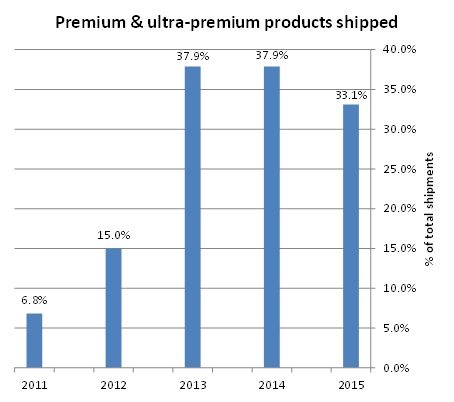
With strategic capital investments and new product development work on our paper machines and converting equipment, we are able to provide higher quality products and broaden our product offering into the higher tier markets through improved quality of paper, increased packaging configurations, enhanced graphics and improved embossing. In 2011, we began to place premium and ultra-premium tier products with certain of our customers and have been able to achieve significant growth in these market segments. The following graph shows shipments of our premium and ultra-premium tier products as a percentage of total cases shipped. Shipments of premium tier and ultra-premium tier products as a percentage of total cases shipped decreased following the Fabrica Transaction in June 2014 as a majority of the products shipped under the Supply Agreement are considered value tier products.
 |
Our ability to increase net sales depends significantly upon the growth of our largest customers, as well as our ability to increase business with other discount retailers, increase business in the grocery chain market, increase our share of the premium and ultra-premium tier markets and take market share from our competitors. We are focusing on diversifying our customer base and reducing customer concentration by implementing private label programs with grocery store customers and new discount retailers, but it is likely our business will remain concentrated among discount retailers for the foreseeable future.
Our largest customers are Dollar General, Family Dollar and HEB. Sales to these three customers represented 61% of our converted product sales in 2015.
The following provides additional details regarding our relationships with our largest customers:
Dollar General. Dollar General is our largest customer, accounting for approximately 34% of our net sales in 2015. With annual revenue of $18.9 billion and more than 12,000 stores in 43 states, Dollar General is the largest small-box discount retailer in the United States. We currently supply value tier products to over half of Dollar General's eleven distribution centers and supply premium tier products to less than half of Dollar General's distribution centers.
HEB. HEB became our second largest customer in 2014, primarily due to business gained in the Fabrica Transaction, accounting for approximately 15% of our net sales in 2015. HEB is one of the largest independent food retailers in the United States with stores in more than 150 communities in Texas. We currently supply value and premium tier products to HEB.
Family Dollar. Family Dollar, which became a wholly-owned subsidiary of Dollar Tree in 2015, is our third largest customer, accounting for approximately 12% of our net sales in 2015. Prior to acquisition by Dollar Tree, Family Dollar had grown into one of the leading discount retailers in the industry with more than 8,100 stores in 46 states and sales in excess of $10 billion. Family Dollar currently has eleven distribution centers throughout the United States. We currently supply value tier products to six of Family Dollar's distribution centers and premium tier products to half of Family Dollar's distribution centers.
Sales and Marketing Team
We maintain an internal sales team of six employees led by our Vice President of Sales and Marketing. Our sales staff directly services seven customers representing approximately 67% of our sales in 2015 and indirectly services all other customers by supervising our network of approximately 40 brokers. Our sales staff and broker network are instrumental in establishing and maintaining strong relationships with our customers. Our management team recognizes that these brokers have relationships with many of our customers and we work with these brokers in an effort to increase our business with these accounts. Our sales and marketing organization seeks to collaborate with our brokers to leverage these relationships. With each of our key customers, however, our senior management team participates with the independent brokers in all critical customer meetings to establish and maintain direct customer relationships.
A majority of our brokers provide marketing support to their retail accounts which includes shelf placement of products and in-store merchandising activities to support our product distribution. We generally pay our brokers commissions ranging from 1% to 3% of the sales they generate. Commissions totaling $1.1 million and $1.6 million were paid in the years ended December 31, 2015 and 2014, respectively.
Manufacturing
We own and operate a paper mill, converting facility and a finished goods warehouse, which are all located at our headquarters in Pryor, Oklahoma. Additionally, as a result of the Fabrica Transaction, we own paper making and converting assets in Mexicali, Mexico, which are operated by Fabrica under a lease agreement (“Equipment Lease Agreement”). The following table sets forth our volume, in tons, of parent rolls manufactured, sold, purchased and converted for each of the past five years, including products produced in Mexico by Fabrica subsequent to the Fabrica Transaction in June 2014:
|
2015 |
2014 |
2013 |
2012 |
2011 |
||||||||||||||||
|
Total Manufactured |
91,326 | 68,023 | 57,734 | 56,775 | 56,145 | |||||||||||||||
|
Sold to Third Parties |
(7,436 | ) | (4,922 | ) | (6,726 | ) | (10,334 | ) | (16,410 | ) | ||||||||||
|
Purchased from Third Parties |
2,963 | 492 | 1,155 | - | - | |||||||||||||||
|
Converted |
86,853 | 63,593 | 52,163 | 46,441 | 39,735 | |||||||||||||||
Oklahoma Facility
Our Oklahoma paper mill, which consists of two facilities totaling 162,000 square feet and a 29,400 square foot paper warehouse, produces parent rolls that are then converted into tissue products at our adjacent converting facility or are sold to other converters. The paper mill facility has three paper machines which produce paper made primarily from pre-consumer solid bleached sulfate paper, or "SBS paper." We utilize these high grades of recycled fiber along with a basket of other fibers, including virgin bleached pulp kraft fiber such as northern bleached softwood, eucalyptus and northern bleached hardwood, to produce our parent rolls. The mix of fiber used is dependent upon the quality attributes required for the particular grades of product. As we continue our efforts to gain converted product business in the higher quality premium and ultra-premium tier markets, we expect to increase our use of virgin bleached pulp kraft fiber to produce a portion of the paper that will service these higher tier markets.
Generally, our Oklahoma paper mill operates 24 hours a day, 363 days a year, with a two-day annual planned maintenance shutdown. Our parent roll production capacity has typically exceeded the requirements of our converting operation and any excess parent rolls that we have we sell into the open market. However, in September of 2014, we demolished two older paper machines in order to begin construction of the new paper machine, which started up in March 2015. As a result, we purchased parent rolls from third parties during the fourth quarter of 2014 and the first quarter of 2015. During 2013, we purchased parent rolls from third parties due to an anticipated short-term increase in converted product shipments that we believed would exceed our parent roll manufacturing capacity.
We convert parent rolls into finished tissue products at our converting facility. The converting process, which varies slightly by product category, generally includes embossing, laminating, and perforating or cutting the parent rolls as they are unrolled; pressing two or more plies together in the case of multiple-ply products; printing designs for certain products and cutting into rolls or stacks; wrapping in polyethylene film; and packing in corrugated boxes or on display-ready pallets for shipment.
In our 300,000 square-foot converting facility, we operate our higher-speed, more flexible converting lines 24 hours a day 7 days a week and utilize our other converting lines as needed. We believe this schedule allows us to provide world-class customer service while optimizing our operating costs. In 2015, we installed another high-speed, flexible converting line. The converting facility produced approximately 8.3 million cases, or 58,000 tons, in 2015.
One of the key advantages of our converting plant is its flexible manufacturing capabilities, which enables us to provide our customers with a variety of package sizes and format options and enables our customers to fit products into particular price categories. We believe our converting facility, together with our low direct labor costs and overhead, combine to produce relatively low overall operating costs.
Our 245,000 square foot finished goods warehouse is located adjacent to our converting facility and has the capacity to hold approximately 600,000 cases of finished product. Our normal finished goods inventory level is three to four weeks of sales. We utilize third-party warehousing from time to time to accommodate changes in inventory carry levels to support customer shipment requirements.
Mexico Assets
The paper making and converting equipment we own in Mexico, which had a net book value of $6.5 million at December 31, 2015, is operated by Fabrica under the Equipment Lease Agreement entered into in conjunction with the Fabrica Transaction. In accordance with the terms of the transaction, Fabrica has discretion on the most effective manner in which to use these assets. Fabrica may use these assets to provide parent rolls or products under the Supply Agreement or may utilize its other assets to produce products purchased under the Supply Agreement, depending on quality requirements and machine capabilities. The terms of the Supply Agreement allow us to purchase up to 19,800 annual tons (27,500 tons in the first two years of the agreement) of converted products from Fabrica.
South Carolina Facility
We are currently constructing a greenfield facility in Barnwell, South Carolina. This facility will include a 115,000 square foot paper mill housing one tissue paper machine with annual paper making capacity between 35,000 and 40,000 tons and a 300,000 square foot converting facility housing two converting lines with annual converting capacity between 30,000 and 32,000 tons. The facility will also include a recycling facility and storage space for raw materials and finished goods. The first converting line is expected to begin producing converted products in the first quarter of 2016, with the second converting line expected to come on-line late in the second quarter of 2016. Construction of the paper machine began in 2015, with completion projected in early 2017.
Distribution
Our products are delivered to our customers in truckload quantities. For shipments from our Oklahoma location, most of our customers arrange for transportation of our products to their distribution centers. In 2015, approximately 77% of our shipments from Pryor were picked up by the customer or their agent. For our remaining shipments, we arrange for third-party freight companies to deliver the products. In 2015, Fabrica arranged for third-party freight companies to deliver shipments under the Supply Agreement.
Raw Materials and Energy
In our Oklahoma facility, the principal raw materials used to manufacture our parent rolls are fiber, primarily recycled fibers and to a lesser extent virgin kraft fibers, and water. Currently, recycled fiber accounts for a majority of the fiber used to produce our parent rolls. The pulping process at the paper mill is currently configured to primarily process a particular class of recycled fiber known as SBS paper. Pursuant to an exclusive supply agreement, Dixie Pulp and Paper, Inc. supplies all of our recycled fiber needs under an evergreen contract. Under the terms of the contract, unless either party gives notice at least ninety days prior to the end of the term, the agreement automatically renews each year for one additional year. This agreement is intended to ensure our long-term supply of quality recycled fiber on terms that we believe are reasonable. If we were unable to purchase a sufficient quantity of SBS paper or if prices materially increased, we could reconfigure our pulping plant to process other forms of fiber, or we could use an alternative type of fiber with our existing pulping process. Reconfiguring our pulping plant would require additional capital expenditures, which could be substantial. Purchasing alternative types of fiber could result in higher fiber costs. We seek to assure we have adequate supplies of SBS paper by maintaining approximately a three-week inventory. We use virgin kraft fibers in the production of premium and ultra-premium tier products. As our business in that market segment continues to grow, we expect our consumption of virgin kraft fiber will increase.
Energy is a key cost factor in our business operations. We source our electricity from the Grand River Dam Authority. In 2006, in connection with our purchase of a new paper machine, we installed a natural gas fired boiler to supply our own steam. We utilize a third-party energy supplier to purchase all of our natural gas requirements through a combination of fixed price contracts and at market purchases. We have the following fixed price contracts in effect:
Effective April 1, 2009, we entered into a fixed price contract to supply approximately 60% of our natural gas requirements, or 334,000 MMBTUs per year. Subsequently, the agreement has been extended to supply approximately 70% to 80% of our natural gas requirements through December 2017 as follows:
|
Period |
MMBTUs |
Price per MMBTU |
Management fee per MMBTU |
|||||||||||
|
January 2016 |
- | March 2016 | 95,900 | $ | 4.53 | $ | 0.07 | |||||||
|
April 2016 |
- | June 2016 | 93,600 | $ | 4.17 | $ | 0.07 | |||||||
|
July 2016 |
- | September 2016 | 92,300 | $ | 4.26 | $ | 0.07 | |||||||
|
October 2016 |
- | December 2016 | 91,900 | $ | 4.42 | $ | 0.07 | |||||||
|
January 2017 |
- | December 2017 | 467,505 | $ | 4.06 | $ | - | |||||||
The remainder of our natural gas requirements through December 2017 are expected to be purchased on the open market.
Backlog
Our tissue products generally require short production times. Typically, we have a backlog of approximately two weeks of sales. As of December 31, 2015, our backlog of customer orders was 638,904 cases, or approximately $8.8 million, of finished converted products for shipments from Oklahoma and from Mexico under the Supply Agreement and 1,264 tons of parent rolls, or approximately $1.2 million. As of December 31, 2014, our backlog of customer orders was 549,792 cases of finished converted products and no tons of parent rolls, or approximately $7.4 million.
Trademarks and Trade Names
We sell some of our tissue products under our various brand names, including Colortex®, My Size®, Velvet®, Big Mopper®, Linen Soft®, Soft & Fluffy®, and Tackle®. We also sell tissue products under brand names licensed from Fabrica, such as, Virtue®, Truly Green®, Golden Gate Paper® and Big Quality®. Our brand names are trademarked with the United States Patent and Trademark Office. We intend to renew our registered trademarks prior to expiration. We do not believe these trademarks are significant corporate assets. Products with our brand names are primarily sold to smaller customers, who use them as their in-store labels.
Employee and Labor Relations
As of December 31, 2015, we had approximately 352 full time employees of whom 285 were union hourly employees and 67 were non-union salaried employees. Of our employees, approximately 328 were engaged in manufacturing and production and 24 were engaged in sales, clerical and administration. Our hourly employees in Oklahoma are represented under collective bargaining agreements with the United Steel, Paper and Forestry, Rubber, Manufacturing, Energy, Allied Industrial & Service Workers International Union Local 5-930 and Local 5-1480 at the mill and converting facility, respectively. In 2015, we negotiated a new three-year contract with our hourly employees at the mill which expires in February 2018. In 2012, we negotiated a new four-year contract with our hourly employees in the converting plant which expires on June 25, 2016. We have not experienced a work stoppage in the last ten years and no grievance proceedings, material arbitrations, labor disputes, strikes or labor disturbances are currently pending or threatened against us. We believe we have good relations with our union employees at each of our facilities.
Environmental, Health and Safety Matters
Our operations are subject to various environmental, health and safety laws and regulations promulgated by federal, state and local governments. These laws and regulations impose stringent standards on us regarding, among other things, air emissions, water discharges, use and handling of hazardous materials, use, handling and disposal of waste, and remediation of environmental contamination. Since our products are made primarily from SBS paper, we do not make extensive use of chemicals.
The U.S. Environmental Protection Agency (the "EPA") requires that certain pulp and paper mills meet stringent air emissions and waste water discharge standards for toxic and hazardous pollutants. These standards are commonly known as the "Cluster Rules." Our operations are not subject to the current "Cluster Rules." If however, due to a revision in the Cluster Rules or a change in our operations we were to become subject to the Cluster Rules, we might need to incur significant capital expenditures in order to become compliant.
We believe our manufacturing facilities are in compliance in all material respects with all existing federal, state and local environmental regulations, but we cannot predict whether more stringent air, water and solid waste disposal requirements will be imposed by government authorities in the future. Pursuant to applicable federal, state and local statutes and regulations, we believe that we possess, either directly or through the Oklahoma Ordinance Works Authority ("OOWA") and the City of Barnwell, all of the environmental permits and approvals necessary for the operation of our Oklahoma and South Carolina facilities.
OOWA, the operator of the industrial park in which we operate in Oklahoma, holds the waste water permit that covers our Oklahoma facilities and controls, among other things, the level of biological oxygen demand ("BOD") and total suspended solids ("TSS") we are allowed to send to the OOWA following pre-treatment at our facility. The OOWA reduced our BOD and TSS limits effective with a permit issued August 1, 2007. We have invested capital in recent years to improve the capability and increase capacity in our Oklahoma waste water treatment facility and believe our facility is well suited to meet our current permit limits.
The City of Barnwell (the “City”) holds the waste water permit that covers our South Carolina facilities and controls, among other things, the level of TSS we are allowed to send to the City following pre-treatment at our facility. We believe our South Carolina facility is being engineered to well suit our permit limits once our paper machine begins operating in 2017.
Our assets in Mexicali are operated by Fabrica under the Equipment Lease Agreement entered into as part of the Fabrica Transaction. In accordance with the terms of this agreement, Fabrica has indemnified us from and against any and all claims, actions, suits, losses, damage, demands and liabilities of every nature in any way arising directly or indirectly from the use, possession, maintenance, operations or control of the equipment located in Mexico, including environmental matters.
Executive Officers and Key Employees
Set forth below is the name, age as of March 7, 2016, position and a brief account of the business experience of each of our executive officers. Each of Messrs. Schoen and Schroeder served in the capacities set forth below as of December 31, 2015 and continue to serve in such capacities as of the date of this report.
|
Name |
Age |
Position | |||
|
Jeffrey S. Schoen |
55 |
Chief Executive Officer and President, Director | |||
|
Keith R. Schroeder |
60 |
Chief Financial Officer | |||
Jeffrey S. Schoen, 55, Chief Executive Officer and President, Director
Mr. Schoen was appointed President and Chief Executive Officer of Orchids Paper Products in November 2013. Mr. Schoen joined the Board of Directors of Orchids Paper Products in February 2007 and served as Chairman from May 2013 to November 2013. Mr. Schoen worked for Cumberland Swan Holdings, Inc., a manufacturer of private label personal care products, from 2002 to 2006, last serving as Executive Vice President and General Manager. Mr. Schoen worked for Paragon Trade Brands, Inc., a manufacturer of private label disposable diapers and training pants, from 1999 to 2002, last serving as Vice President-Operations. Mr. Schoen held various positions when he worked for Kimberly Clark—Infant Care, from 1985 to 1993, last serving as Maintenance & Stores Manager.
Keith R. Schroeder, 60, Chief Financial Officer
Mr. Schroeder has been our Chief Financial Officer since January 2002. Prior to joining us, he served as Corporate Finance Director for Kruger, Inc.'s tissue operations from October 2000 to December 2001 and as Vice President of Finance and Treasurer of Global Tissue from 1996 to October 2000. Global Tissue was acquired by Kruger, Inc. in 1999. Prior to joining Global Tissue, Mr. Schroeder held a number of finance and accounting positions with Cummins, Inc. and Atlas Van Lines. Mr. Schroeder is a certified public accountant and holds a BS degree in Business Administration with an accounting major from the University of Evansville.
Available Information
We file annual, quarterly and current reports and other information with the Securities and Exchange Commission (the "SEC"). You may read and copy any document we file with the SEC at the SEC's public reference room at 100 F Street, NE, Washington, DC 20549. Please call the SEC at 1-800-SEC-0330 for information on the public reference room. The SEC maintains an internet site that contains annual, quarterly and current reports, proxy and information statements and other information that issuers (including Orchids Paper Products Company) file electronically with the SEC. The SEC's internet site is www.sec.gov. In addition, we make available free of charge our annual report on Form 10-K, quarterly reports on Form 10-Q and current reports on Form 8-K through our website at www.orchidspaper.com. Such reports are made available as soon as reasonably practicable after they are filed with or furnished to the SEC. Information available on the website is not incorporated by reference and is not deemed to be part of this Form 10-K.
Item 1A. RISK FACTORS
We operate in a changing environment that involves numerous known and unknown risks and uncertainties that could materially affect our operations. The risks, uncertainties and other factors set forth below may cause our actual results, performances or achievements to be materially different from those expressed or implied by our forward-looking statements. If any of these risks or events occur, our business, financial condition or results of operations may be adversely affected. The risk factors set forth below are not exhaustive and are not the only risks that may affect our business. Our business could also be affected by additional risks not currently known to us or described below. We may amend or supplement the risk factors described below from time to time in other reports we file with the SEC in the future.
Risks Related To Our Business
There can be no assurance that we will be able to complete the construction project of our South Carolina facility on schedule or at all. Our failure to realize the benefits that we anticipate from this investment could substantially adversely affect our strategic plans and our financial position and results of operations.
We began the construction of a converting facility in Barnwell, South Carolina in the second quarter of 2015. However, there can be no assurance that the installation of the paper machines or ramping up of the converting production lines will proceed on schedule for the anticipated cost or at all. If the equipment suppliers fail to timely deliver the proper equipment or the construction of the paper mill facility is delayed due to weather or structural issues, we may be unable to complete the construction project and bring the facility to full capacity in a timely and cost effective manner, and as a result our business and projections could be adversely impacted.
We face intense competition and if we cannot successfully compete in the marketplace, our business, financial condition and operating results may be materially adversely affected.
The consumer market for private label tissue products is highly competitive. Many of our competitors have greater financial, managerial, sales and marketing and capital resources than we do, which may allow them to respond more quickly to new opportunities or changes in customer requirements. These competitors may also be larger in size or scope than us, which may allow them to achieve greater economies of scale or allow them to better withstand periods of declining prices and adverse operating conditions.
Our ability to successfully compete depends upon a variety of factors, including:
|
● |
aggressive pricing by competitors, which may force us to decrease prices in order to maintain market share; |
|
● |
our ability to improve plant efficiencies and operating rates and lower manufacturing costs; |
|
● |
the availability, quality and cost of labor and raw materials, particularly recycled fiber; and |
|
● |
the cost of energy. |
Our tissue paper products are commodity products, and if we do not maintain competitive prices, we may lose significant market share. Our ability to keep our prices at competitive levels depends in large part on our ability to control our costs. In addition, consolidation among retailers in the discount retail channel may put additional pressure on us to reduce our prices in order to maintain market share. If we are unable to effectively adjust our cost structure to address such increased competitive pressures, our sales level and profitability could be harmed and our operations could be materially adversely affected.
Increased competition in our region may affect our business.
In recent years, our competitors have added plants in the region in which we primarily focus our sales efforts. In 2014, Sofidel opened a converting plant in Tulsa, Oklahoma. In 2010, Clearwater Paper Corporation, via its acquisition of Cellu Tissue, started production from a new converting plant in Oklahoma City, Oklahoma, and in 2009, Pacific Paper added a new converting plant in Memphis, Tennessee. All plants are in our focused 500-mile sales area of our Oklahoma facility. Furthermore, our competitors also have plants in the 500-mile radius from Fabrica’s Mexicali plant, including Royal Paper and Cascades in Arizona, Clearwater and Sofidel in Nevada, and Asia Pulp and Paper in California. The increased presence of competition in our focused region may reduce some of our competitive cost advantage which could result in the loss of business or force us to reduce prices, either of which could have a material adverse effect on our business.
A substantial percentage of our net sales are attributable to three large customers, any or all of which may decrease or cease purchases at any time.
Our largest customer, Dollar General, accounted for 34% of our net sales in 2015. Family Dollar and HEB accounted for 12% and 15%, respectively, of our net sales in 2015. We expect that sales to a limited number of customers will continue to account for a substantial portion of our net sales for the foreseeable future. Sales to these customers are made pursuant to purchase orders and not supply agreements. We may not be able to keep our key customers, or these customers may cancel purchase orders or reschedule or decrease their level of purchases from us. Any substantial decrease or delay in sales to one or more of our key customers would harm our sales and financial results. In particular, the loss of sales to one or more distribution centers would result in a sudden and significant decrease in our sales. If sales to current key customers cease or are reduced, we may not obtain sufficient orders from other customers necessary to offset any such losses or reductions.
We primarily use pre-consumer solid bleached sulfate paper, or SBS paper, and, to a lesser extent, virgin kraft fibers to produce parent rolls and any disruption in our supply or increase in the cost of pre-consumer SBS paper or virgin kraft could disrupt our production and harm our ability to produce tissue at competitive prices.
We do not produce any of the fiber we use to produce our parent rolls. We depend heavily on access to sufficient, reasonably priced quantities of fiber to manufacture our tissue products. Our paper mill is configured to convert recycled fiber, specifically SBS paper, and virgin kraft fiber into paper pulp for use in our paper production lines. In 2015, we purchased approximately 73,000 tons of SBS paper at a total cost of $19.7 million compared to 59,000 tons of SBS paper at a total cost of $14.1 million in 2014. In 2015, we purchased approximately 11,000 tons of virgin kraft at a total cost of $6.8 million compared to 8,000 tons of virgin kraft at a total cost of $5.0 million in 2014. Prices for SBS paper and virgin kraft have fluctuated significantly in the past and will likely continue to fluctuate significantly in the future, principally due to market imbalances between supply and demand. In addition, the market price of SBS fiber can also be influenced by market swings in the price of virgin pulp and other fiber grades. If either the available supply of SBS paper and/or virgin kraft diminishes or the demand for SBS paper and/or virgin kraft increases, it could substantially increase our cost of fiber, require us to purchase alternate fiber grades at increased costs, or cause a production slow-down or stoppage until we are able to identify new sources of fiber or reconfigure our pulping plant to process other available forms of paper fiber. We could experience a material adverse effect on our business, financial condition and results of operations should the price or supply of SBS paper and/or virgin kraft be disrupted. Further, we currently obtain all of our recycled fiber from a single supplier, Dixie Pulp and Paper, Inc. ("Dixie") and the majority of our virgin kraft from Marubeni America Corporation (“Marubeni”). If our relationship with Dixie and/or Marubeni is altered or terminated for any reason, we will have to seek alternative channels to obtain our recycled and virgin kraft fiber, and there can be no assurance that we would be able to make arrangements that adequately meet our needs or on reasonable terms.
Fabrica’s failure to execute under the Supply Agreement could adversely affect our business.
Under the Supply Agreement with Fabrica de Papel San Francisco, S.A. de C.V. (“Fabrica”), we have the right to purchase up to 19,800 tons of parent rolls and equivalent converting capacity for certain specified product during each twelve month period following the effective date of the Supply Agreement. We may purchase up to an additional 7,700 tons annually in each of the first two years of the agreement, which has an initial term of twenty years. Fabrica’s failure to execute under this agreement could result in our inability to service existing customers, thereby reducing sales volumes and profitability. A failure to execute would also harm the relationships we have established with those customers serviced under the Supply Agreement. Furthermore, Fabrica’s failure to execute under this agreement could require us to look for other sources of capacity that are less favorable to us, thereby increasing costs and reducing profits.
Increased competition and or deterioration in business conditions could adversely affect our ability to realize anticipated growth from the Fabrica Transaction.
We desired to acquire assets and certain operations from Fabrica with the expectation that the acquisition will result in various benefits for us, including, among others, a competitive manufacturing cost, business and growth opportunities, and increased revenue streams. Increased competition and/or deterioration in business conditions may limit our ability to expand upon Fabrica’s business. As such, we may not be able to realize the synergies, goodwill, business opportunities and growth prospects anticipated in connection with the Fabrica Transaction.
Changes in the policies of our retail trade customers and increasing dependence on key retailers in developed markets may adversely affect our business.
Our products are sold in a highly competitive marketplace, which is experiencing increased concentration and the growing presence of large format retailers and discounters. With the consolidation of retail trade, especially in developed markets, we are increasingly dependent on key retailers, and some of these retailers, including the large format retailers, may have greater bargaining power than we do. They may use this leverage to demand higher trade discounts or allowances which could lead to reduced profitability. We may also be negatively affected by changes in the policies of retail trade customers, such as inventory de-stocking, limitations on access to shelf space, and delisting of our products. If we lose a significant customer or if sales of our products to a significant customer materially decrease, our business, financial condition and results of operations may be materially adversely affected.
Excess supply in the markets may reduce the prices we are able to charge for our products.
New paper machines or new converting equipment may be built or idle machines may be activated by other paper companies, which would add more capacity to the tissue markets. Increased production capacity could cause an oversupply resulting in lower market prices for our products and increased competition, either of which could have a material adverse effect on our business, financial condition and operating results.
The availability of and prices for energy will significantly impact our business.
The production of our products requires a significant amount of energy and we rely primarily on natural gas and electric energy for our energy needs. The prices of these inputs are subject to change based on many factors that are beyond our control, such as worldwide supply and demand and government regulation. In particular, natural gas prices are highly volatile. Beginning in April 2009 and continuing through December 2017, approximately 70% to 80% of our natural gas requirements were covered by a fixed price contract, as described above in Item 1—Business, Raw Materials and Energy. The remainder of our requirements through December 2017 are expected to be purchased on the open market. Our average price per MMBTU was $4.11 in 2015 compared to $5.05 in 2014 and $4.86 in 2013. During the year ended December 31, 2015, we consumed 525,000 MMBTU of natural gas at a total cost of $2.2 million and 58.9 million kilowatt hours of electricity at a total cost of $3.2 million. If our energy costs increase, our cost of sales will increase, and our operating results may be materially adversely affected. Furthermore, we may not be able to pass increased energy costs on to our customers if the market does not allow us to raise the prices of our finished products. If price adjustments significantly trail the increase in energy costs or if we cannot effectively hedge against these costs, our operating results may be materially adversely affected.
Failure to purchase the contracted quantity of natural gas may result in financial exposure.
As discussed above in Item 1—Business, Raw Materials and Energy, we have entered into a fixed price contract to purchase approximately 70% to 80% of our natural gas requirements, or 374,000 to approximately 468,000 MMBTUs per year, through December 2017, with the remainder purchased on the open market. A significant interruption in our parent roll production due to tornado, fire or other natural disaster, adverse market conditions or mechanical failure could reduce our natural gas requirements to a level below that of our contracted amount. If we are unable to purchase the contracted amounts and the market price at that time is less than the contracted price, we would be obligated under the terms of our agreement to reimburse an amount equal to the difference between the contracted amount and the amount actually purchased multiplied by the difference between our contract price and a price designed in the contract, which typically approximates spot price.
Our exposure to variable interest rates may affect our financial health.
Debt incurred under our existing revolving credit and most of our term loan agreements accrues interest at a variable rate. Specifically, our interest is calculated on LIBOR or the base rate plus an interest rate margin which is calculated quarterly. As of December 31, 2015, our weighted average bank debt interest rate was 2.17% compared to a weighted average interest rate of 1.42% at December 31, 2014. Any increase in the interest rates on our debt would result in a higher interest expense which would require us to dedicate more of our cash flow from operations to make payments on our debt and reduce funds available to us for our operations and future business opportunities which could have a material adverse effect on our results of operations. For more information on our liquidity, see "Management's Discussion and Analysis of Financial Condition and Results of Operations—Liquidity and Capital Resources."
We depend on our management team to operate the Company and execute our business plan.
We are highly dependent on the principal members of our management staff, in particular Jeffrey Schoen, our Chief Executive Officer, and Keith Schroeder, our Chief Financial Officer. We have entered into employment agreements with Jeffrey Schoen and Keith Schroeder. Mr. Schoen's employment is "at will" and, subject to certain conditions (such as the potential obligation to pay severance benefits), may be terminated by either party at any time, for any reason, with or without notice. Mr. Schroeder's employment agreement expired on December 31, 2011, but includes automatic one-year extensions unless either party provides notice of termination. The loss of either of our executive officers or our inability to attract and retain other qualified personnel could harm our business and our ability to compete.
Labor interruptions would adversely affect our business.
All of our hourly paid employees in Oklahoma are represented by the United Steel, Paper and Forestry, Rubber, Manufacturing, Energy, Allied Industrial & Service Workers International Union. The collective bargaining agreement with Local 5-930, which represents the paper mill workers, will expire in February 2018, and the collective bargaining agreement with Local 5-1480, which represents the converting facility workers, will expire in June 2016. Negotiations of new collective bargaining agreements may result in significant increases in the cost of labor or could break down and result in a strike or other disruption of our operations. If any of the preceding were to occur, it could impair our ability to manufacture our products and result in increased costs and/or decreased operating results. In addition, some of our key customers and suppliers are also unionized. Disruption in their labor relations could also have an adverse effect on our business.
Our manufacturing operations may experience shutdowns due to unforeseen operational problems or maintenance outages which may cause significant lost production which would adversely affect our financial position and results of operations.
We currently manufacture and process the majority of our tissue paper products from our headquarters located in Pryor, Oklahoma. Any natural disaster or other serious disruption to our facilities due to tornado, fire or any other calamity could damage our capital equipment or supporting infrastructure and materially impair our ability to manufacture and process tissue paper products. Even a short-term disruption in our production output could damage relations with our customers, causing them to reduce or eliminate the amount of finished products they purchase from us. Any such disruption could result in lost sales, increased costs and reduced profits.
Furthermore, unexpected production disruptions due to any number of circumstances, including shortages of raw materials, disruptions in the availability of transportation, labor disputes and mechanical or process failures, could cause us to shut down our paper mill or our converting operation, or any part thereof.
If any part of our facilities is shut down, it may experience a prolonged start-up period, regardless of the reason for the shutdown. Those start-up periods could range from several days to several months, depending on the reason for the shutdown and other factors. The shutdown of our facilities for a substantial period of time for any reason could have a material adverse effect on our financial position and results of operations.
Our operations require substantial capital, and we may not have adequate capital resources to provide for all of our cash requirements.
Our operations require substantial capital. Expansion or replacement of existing facilities or equipment may require substantial capital expenditures. For example, in 2015, we built a new paper machine and installed a new converting line, which cost approximately $33.7 million. In 2010, we built a new finished goods warehouse and installed a new converting line, which cost approximately $27.0 million. In 2009 and 2010, under new environmental standards we were required to build a water treatment facility costing approximately $7.0 million to reduce BOD and TSS from our discharge water. We are currently building a new facility in Barnwell, South Carolina, which is expected to cost approximately $136.0 million. If our capital resources are inadequate to provide for our operating needs, capital expenditures and other cash requirements, this shortfall could have a material adverse effect on our business and liquidity.
Our business is subject to governmental regulations and any imposition of new regulations or failure to comply with existing regulations could involve significant additional expense.
Our operations are subject to various environmental, health and safety laws and regulations promulgated by federal, state and local governments. These laws and regulations impose stringent standards on us regarding, among other things, air emissions, water discharges, use and handling of hazardous materials, use, handling and disposal of waste, and remediation of environmental contamination. Any failure to comply with applicable environmental laws, regulations or permit requirements may result in civil or criminal fines or penalties or enforcement actions. These may include regulatory or judicial orders enjoining or curtailing operations or requiring corrective measures, installing pollution control equipment or remedial actions, any of which could involve significant expenditures. Future development of such laws and regulations may require capital expenditures to ensure compliance. We may discover currently unknown environmental problems or conditions in relation to our past or present operations, or we may face unforeseen environmental liabilities in the future. These conditions and liabilities may require site remediation or other costs to maintain compliance or correct violations of environmental laws and regulations; or result in governmental or private claims for damage to person, property or the environment, any of which could have a material adverse effect on our financial condition and results of operations. In addition, we may be subject to strict liability and, under specific circumstances, joint and several liabilities for the investigation and remediation of the contamination of soil, surface and ground water, including contamination caused by other parties, at properties that we own or operate and at properties where we or our predecessors arranged for the disposal of regulated materials.
If we fail to maintain an effective system of internal controls, we may not be able to accurately report our financial results or prevent fraud and, as a result, our business could be harmed and current and potential stockholders could lose confidence in us, which could cause our stock price to fall.
We have completed an evaluation of our internal control systems to allow management to report on, and our independent registered public accounting firm to attest to, our internal control over financial reporting in compliance with the management assessment and auditor attestation requirements of Section 404 of the Sarbanes-Oxley Act of 2002. In our report under Section 404, which is included in Item 9A of this report, we have concluded that our internal control over financial reporting is effective.
A material weakness or significant deficiency in internal control over financial reporting could materially affect our reported financial results and the market price of our stock could significantly decline. Additionally, adverse publicity related to the disclosure of a material weakness or significant deficiency in internal controls could have a negative effect on our reputation, business and stock price. Although management's assessment and auditor's attestation may provide some level of comfort to the investing public, even the best designed and executed systems of internal controls can only provide reasonable assurance against misreported results and the prevention of fraud.
The parent roll market is a commodity market and subject to fluctuations in demand and pricing.
Overall demand for parent rolls can fluctuate due to changes in the demand for converted products and due to new paper machine start-ups. A significant reduction in demand or increase in paper making capacity can result in an over-supply of parent rolls, which could negatively affect the market price for parent rolls. A significant reduction in parent roll selling prices could reduce our net sales, decrease our profits and cause us to shut down some of our excess paper making capacity.
We have indebtedness which limits our free cash flow and subjects us to restrictive covenants relating to the operation of our business.
As a result of closing the Fabrica Transaction and beginning construction of our South Carolina facility, our indebtedness is now greater than our indebtedness prior to these events. At December 31, 2015, we had $75.6 million of indebtedness. In 2016, under the terms of our existing loan agreement, we anticipate making principal payments of $3.9 million and interest payments of approximately $1.6 million. Operating with this amount of leverage may require us to direct a significant portion of our cash flow from operations to make payments on our debt, which reduces the funds otherwise available for operations, capital expenditures, payment of dividends, the pursuit of future business opportunities and other corporate purposes. It may also limit our flexibility in planning for or reacting to changes in our business and our industry and may impair our ability to obtain additional financing.
The terms of our loan agreements require us to meet specified financial ratios and other financial and operating covenants which restrict our ability to incur additional debt, place liens on our assets, make capital expenditures, effect mergers or acquisitions, dispose of assets or pay dividends in certain circumstances. If we fail to meet those financial ratios and covenants and our lenders do not waive them, we may be required to pay fees and penalties, and our lenders could accelerate the maturity of our debt and proceed against any pledged collateral, which could force us to seek alternative financing, or otherwise adversely affect our business operations and/or liquidity. If this were to happen, we may be unable to obtain additional financing or it may not be available on terms acceptable to us.
Additionally, the Company's indebtedness is secured by all or substantially all of the Company's assets. Therefore, if the Company defaults on any of its debt obligations, it could result in the lenders foreclosing on our assets. In such an event, the lenders' rights to such assets would likely be superior to those of our shareholders.
If we are unable to continue to implement our business strategies, our financial conditions and operating results could be materially affected.
Our future operating results will depend, in part, on the extent to which we can successfully implement our business strategies in a cost effective manner. However, our strategies are subject to significant business, economic and competitive uncertainties and contingencies, many of which are beyond our control. If we are unable to successfully implement our business strategies, our business, financial condition and operating results could be materially adversely affected.
We may not be able to sell the capacity generated from our converting lines.
We continue to focus on increasing the capacity of our twelve converting lines at our Pryor location. Additionally, the two converting lines at our South Carolina facility are expected to add an additional 30,000 to 32,000 tons of annual capacity. However, we may not be able to sell enough of our products to fully utilize such capacity. Our strategy includes converting and selling more of our parent roll tonnage as converted product. Converted products sell at a higher price per ton than parent rolls and typically carry a higher margin on a tonnage basis. If we are unable to increase our sales of converted product to fully utilize the capacity from our converting lines, it could result in lost opportunity for increased margins and the need to temporarily or permanently curtail the production of one or more of our converting lines.
Risks Related To Our Common Stock
We may not sustain our quarterly dividend.
On February 21, 2011, our Board of Directors initiated a quarterly cash dividend. We paid dividends totaling $1.40 in 2015 and 2014 and $1.35 per share in 2013. However, we may not sustain regular quarterly dividend payments. The declaration and payment of future dividends to holders of our common stock will be at the discretion of our Board of Directors, and will depend upon many factors, including our financial condition, earnings, capital requirements of our businesses, legal requirements, regulatory constraints, industry practice and other factors that the Board of Directors deems relevant. Further, our credit agreement contains an indirect restriction on the amount of dividends we may pay in that the amount of any dividends paid is included in the calculation of our fixed charge coverage ratio.
Our certificate of incorporation, bylaws and Delaware law contain provisions that could discourage a takeover.
Our certificate of incorporation, bylaws and Delaware law contain provisions that might enable our management to resist a takeover. These provisions may:
|
● |
discourage, delay or prevent a change in the control of the Company or a change in our management; |
|
● |
adversely affect the voting power of holders of common stock; and |
|
● |
limit the price that investors might be willing to pay in the future for shares of our common stock. |
Our future operating results may be below securities analysts' or investors' expectations, which could cause our stock price to decline.
Our revenue and income potential depends on expanding our production capacity and finding buyers for our additional production, and we may be unable to generate significant revenues or grow at the rate expected by securities analysts or investors. In addition, our costs may be higher than we, securities analysts or investors expect. If we fail to generate sufficient revenues or our costs are higher than we expect, our results of operations will suffer, which in turn could cause our stock price to decline. Our results of operations will depend upon numerous factors, including:
| ● | the market price of our product; |
| ● | the cost of fiber used in producing paper; |
| ● | the efficiency of operations in both our paper mill and converting facility; and |
| ● | the cost of energy. |
Our operating results in any particular period may not be a reliable indication of our future performance. In some future quarters, our operating results may be below the expectations of securities analysts or investors. If this occurs, the price of our common stock will likely decline.
Our common stock has low average trading volume, and we expect that the price of our common stock could fluctuate substantially.
The average daily trading volume of our common stock in 2015 was approximately 63,000 shares. The market price for our common stock is affected by a number of factors, including:
|
● |
actual or anticipated variations in our results of operations or those of our competitors; |
|
● |
changes in earnings estimates or recommendations by securities analysts or our failure to achieve analysts' earnings estimates; and |
|
● |
developments in our industry. |
The stock prices of many companies in the paper products industry have experienced wide fluctuations that have often been unrelated to the operating performance of these companies. Because of the low trading volume, our stock price is subject to greater potential volatility. Following periods of volatility in the market price of a company's securities, stockholders have often instituted class action securities litigation against those companies. Class action securities litigation, if instituted against us, could result in substantial costs and a diversion of our management resources, which could significantly harm our business.
Our directors have limited personal liability and rights of indemnification from us for their actions as directors.
Our certificate of incorporation limits the liability of directors to the maximum extent permitted by Delaware law. Delaware law provides that directors of a corporation will not be personally liable for monetary damages for breach of their fiduciary duties as directors, except liability for:
|
● |
any breach of their duty of loyalty to the corporation or its stockholders; |
|
● |
acts or omissions not in good faith or which involve intentional misconduct or a knowing violation of law; |
|
● |
unlawful payments of dividends or unlawful stock repurchases or redemptions; or |
|
● |
any transaction from which the director derived an improper personal benefit. |
This limitation of liability does not apply to liabilities arising under the federal securities laws and does not affect the availability of equitable remedies such as injunctive relief or rescission.
Our certificate of incorporation and bylaws provide that we will indemnify our directors and executive officers and other officers and employees and agents to the fullest extent permitted by law.
We entered into separate indemnification agreements with each of our directors and officers which are broader than the specific indemnification provision under Delaware law. Under these agreements, we are required to indemnify them against all expenses, judgments, fines, settlements and other amounts actually and reasonably incurred, in connection with any actual, or any threatened, proceeding if any of them may be made a party because he or she is or was one of our directors or officers.
If any litigation or proceeding were pursued against any of our directors, officers, employees or agents where indemnification is required or permitted, we could incur significant legal expenses and be responsible for any resulting settlement or judgment.
Item 1B. UNRESOLVED STAFF COMMENTS
None.
Item 2. PROPERTIES
We own a 36-acre property in Pryor, Oklahoma that serves as the Company’s headquarters and main production facilities. Parent roll production is housed in our paper mill, which consists of two facilities. The older paper making facility is approximately 135,000 square feet and, as of March 2015, houses two paper machines and related processing equipment. The newer paper making facility is approximately 27,000 square feet and houses one paper machine and a 29,400 square foot parent roll warehouse. Adjacent to our paper mill, we have an approximately 300,000 square feet converting facility which has twelve lines of converting equipment. We also own a 245,000 square foot finished goods warehouse which adjoins the converting facility. Under the Supply Agreement we have with Fabrica, up to 19,800 tons (27,500 tons in the first two years of the agreement) of our products or parent rolls may be manufactured at Fabrica’s location in Mexicali, Mexico.
We are currently constructing an integrated facility in Barnwell, South Carolina on an 86-acre property that was donated to the Company by the state of South Carolina. This facility will include a 115,000 square foot paper mill with one tissue paper machine and a 300,000 square foot converting facility housing two converting production lines. Additionally, the property will include a recycling facility and storage space for raw materials and finished goods. The first converting line is expected to begin production in the first quarter of 2016, with the second converting line expected to begin production late in the second quarter of 2016. Construction of the paper mill began in 2015, with completion projected in early 2017.
|
Facility |
Location |
Sq. Ft. |
Owned or Leased |
Annual Estimated Capacity (1) (in tons) |
2015 Production (in tons) | ||||||||
|
Paper Mill |
Pryor, OK |
162,000 |
Owned |
74,000 |
66,829 | ||||||||
|
Paper Mill - Paper Warehouse |
Pryor, OK |
29,400 |
Owned |
||||||||||
|
Converting |
Pryor, OK |
300,000 |
Owned |
|
82,500 |
58,040 | |||||||
|
Converting - Warehouse |
Pryor, OK |
245,000 |
Owned |
||||||||||
|
Converting |
Barnwell, SC |
300,000 |
Under Construction |
30,000 |
- | 32,000 | |||||||
|
Paper Mill |
Barnwell, SC |
115,000 |
Under Construction |
35,000 |
- | 40,000 | |||||||
|
(1) |
Annual estimated capacity can vary significantly depending upon several factors. Paper mill capacity is heavily dependent upon the mix of paper grades produced, including the effects of basis weight on tonnage produced. Converting capacity is heavily dependent upon the mix of converted products produced, including the product configurations. We believe we can effectively use 85% to 90% of the converting capacity and still maintain a high level of customer service. Paper mill production for 2015 was less than estimated capacity due to a project to install a new paper machine, which did not start up until late March 2015. |
Additionally, in conjunction with the Fabrica Transaction, we acquired certain paper making and converting equipment which is located in Mexico and operated by Fabrica under the terms of the Equipment Lease Agreement signed as part of the transaction. This equipment includes one paper machine and two converting lines with capacity of approximately 19,800 annual tons. In accordance with the terms of the transaction, Fabrica has discretion on the most effective manner in which to use these assets. Fabrica may use these assets to provide converted products under the Supply Agreement or may use these assets to manufacture products sold to its customers. Furthermore, in accordance with terms of the transaction, items produced under the Supply Agreement may be manufactured on Fabrica’s paper making assets, which can produce quality grades ranging from the value tier to the ultra-premium tier, using the latest paper machine technology.
We believe our facilities in Pryor, Oklahoma are well maintained and, with the addition of the capacity obtained under the Fabrica Transaction and the construction of our facility in South Carolina, are adequate to serve our present and near term operating requirements. While we currently do not have any specific plans to do so, we believe we have adequate land available to add additional paper making capacity at our Oklahoma site. Any future expansion of converting capacity at the Pryor location would likely result in the need to acquire land adjacent to our facility and to construct additional manufacturing space. During 2013, we entered into an option to purchase land adjacent to our converting facility in Oklahoma, which expires in May of 2016. Additionally, we entered into a third-party storage agreement and began utilizing the third-party storage to facilitate the warehousing requirement of increasing converted product shipments.
Item 3. LEGAL PROCEEDINGS
From time to time, we are involved in litigation relating to claims arising out of our operations in the normal course of business. As of the date of this report, we were not engaged in any legal proceedings which are expected, individually or in the aggregate, to have a material adverse effect on us.
Item 4. MINE SAFETY DISCLOSURES
Not applicable.
PART II
Item 5. MARKET FOR REGISTRANT'S COMMON EQUITY, RELATED STOCKHOLDER MATTERS AND ISSUER PURCHASES OF EQUITY SECURITIES
Market Information
Since July 15, 2005, our common stock has been traded on the NYSE MKT (formerly known as NYSE Amex), under the symbol "TIS". The following table sets forth the high and low closing prices of our common stock for the periods indicated and reported by the NYSE MKT.
|
HIGH |
LOW |
|||||||
|
Year Ended December 31, 2014: |
||||||||
|
First Quarter |
$ | 33.97 | $ | 27.72 | ||||
|
Second Quarter |
$ | 32.04 | $ | 26.53 | ||||
|
Third Quarter |
$ | 32.67 | $ | 24.56 | ||||
|
Fourth Quarter |
$ | 29.90 | $ | 23.22 | ||||
|
Year Ended December 31, 2015: |
||||||||
|
First Quarter |
$ | 29.01 | $ | 25.35 | ||||
|
Second Quarter |
$ | 26.32 | $ | 21.49 | ||||
|
Third Quarter |
$ | 27.27 | $ | 22.86 | ||||
|
Fourth Quarter |
$ | 32.10 | $ | 26.07 | ||||
As of February 16, 2016, there were nine holders of record of an aggregate 10,271,391 shares of our common stock. The actual number of stockholders is greater than the number of record holders, and includes stockholders who are beneficial owners, but whose shares are held in street name by brokers and other nominees. We estimate that we have approximately 10,000 beneficial owners of our common stock. On March 1, 2016, the last reported sale price of our common stock on the NYSE MKT was $27.47.
Performance Graph
The following graph compares the cumulative total stockholder return on our common stock since December 31, 2010, with the cumulative total return of the Standard & Poor's Small Cap Price Index, the Standard & Poor's Composite 600 Paper Products Index and our selected peer group companies comprised of Clearwater Paper Products, Wausau Paper, and Cascades. These comparisons assume the investment of $100 on December 31, 2010, and the reinvestment of dividends.
These indices are included only for comparative purposes as required by the SEC and do not necessarily reflect management's opinion that such indices are an appropriate measure of the relative performance of the common stock. They are not intended to forecast possible future performance of our common stock.
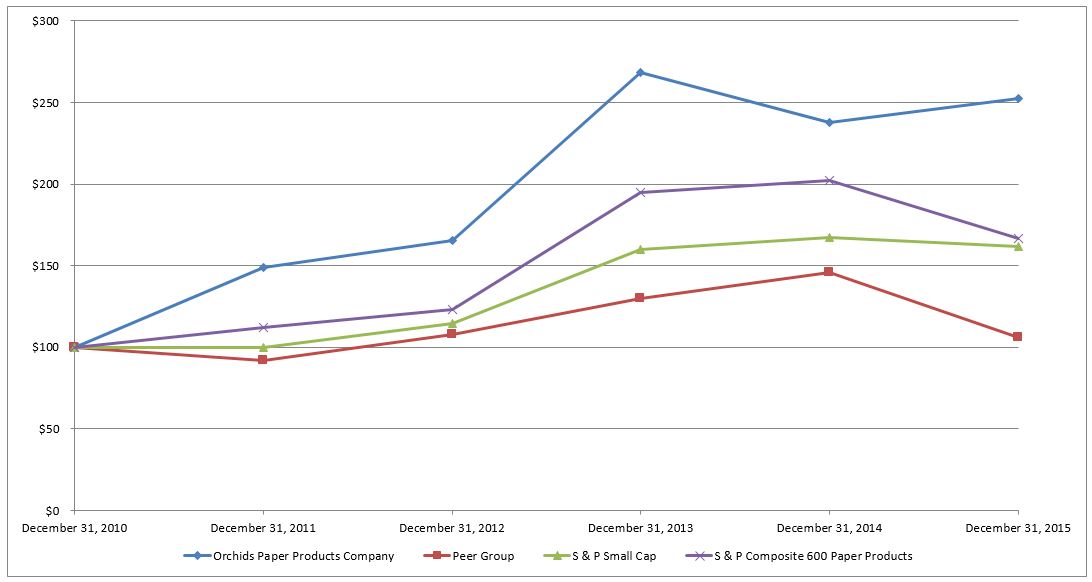 |
|
December 31, 2010 |
December 31, 2011 |
December 31, 2012 |
December 31, 2013 |
December 31, 2014 |
December 31, 2015 |
|||||||||||||||||||
|
Orchids Paper Products Company |
$ | 100.00 | $ | 148.72 | $ | 165.22 | $ | 268.34 | $ | 237.87 | $ | 252.66 | ||||||||||||
|
Peer Group |
$ | 100.00 | $ | 92.19 | $ | 108.10 | $ | 129.84 | $ | 145.94 | $ | 105.85 | ||||||||||||
|
S & P Small Cap |
$ | 100.00 | $ | 99.84 | $ | 114.63 | $ | 160.09 | $ | 167.20 | $ | 161.58 | ||||||||||||
|
S & P Composite 600 Paper Products |
$ | 100.00 | $ | 112.14 | $ | 123.13 | $ | 195.00 | $ | 202.34 | $ | 166.86 | ||||||||||||
Common Stock Dilution
As of December 31, 2015, we had 10,268,891 shares of common stock outstanding. We have outstanding options to purchase shares of our common stock, which once fully vested, represent approximately 8% of the current outstanding shares. As of December 31, 2015, we had options outstanding to purchase 825,850 shares of our common stock at an exercise price ranging from $5.18 to $31.125. The options expire on various dates from 2016 to 2025.
Dividends
On February 21, 2011, our Board of Directors initiated a quarterly cash dividend. We paid the following dividends on each share of the Company's common stock then outstanding in 2013, 2014 and 2015:
|
2013 |
2014 |
2015 |
||||||||||
|
First Quarter |
$ | 0.30 | $ | 0.35 | $ | 0.35 | ||||||
|
Second Quarter |
$ | 0.35 | $ | 0.35 | $ | 0.35 | ||||||
|
Third Quarter |
$ | 0.35 | $ | 0.35 | $ | 0.35 | ||||||
|
Fourth Quarter |
$ | 0.35 | $ | 0.35 | $ | 0.35 | ||||||
|
Total |
$ | 1.35 | $ | 1.40 | $ | 1.40 | ||||||
On February 3, 2016, the Board of Directors authorized a quarterly cash dividend of $0.35 per outstanding share of the Company's common stock. The Company paid this dividend on March 1, 2016 to stockholders of record at the close of business on February 16, 2016.
The declaration and payment of future dividends to holders of our common stock will be at the discretion of our Board of Directors, and will depend upon many factors, including our financial condition, earnings, capital requirements of our business, legal requirements, regulatory constraints, industry practice and other factors that the Board of Directors deems relevant. Our credit agreement contains an indirect restriction on the amount of cash dividends we may pay in that the amount of any dividends paid is included in the calculation of our fixed charge coverage ratio.
Recent Sales of Unregistered Securities
None.
Repurchase of Equity Securities
We do not have any programs to repurchase shares of our common stock and no such repurchases were made during the year ended December 31, 2015.
Item 6. SELECTED FINANCIAL DATA
The following selected financial data should be read in conjunction with "Management's Discussion and Analysis of Financial Condition and Results of Operations" following this section and our financial statements and related notes included in Item 8 of this Form 10-K. The following tables set forth selected financial data as of and for the years ended December 31, 2015, 2014, 2013, 2012, and 2011, which were derived from our audited financial statements. Our audited financial statements as of December 31, 2015 and 2014, and for each of the three years in the period ended December 31, 2015, are included below under Item 8 of this Form 10-K. The historical results are not necessarily indicative of the operating results to be expected in any future period. The results for the years ended December 31, 2015 and 2014 include the impacts of the Fabrica Transaction discussed in Note 2 of the notes to the audited financial statements included below under Item 8 of this Form 10-K.
|
Year Ended December 31, 2015 |
Year Ended December 31, 2014 |
Year Ended December 31, 2013 |
Year Ended December 31, 2012 |
Year Ended December 31, 2011 |
||||||||||||||||
|
(in thousands, except per share and Tons) |
||||||||||||||||||||
|
Converted Product Net Sales |
$ | 161,052 | $ | 138,382 | $ | 109,611 | $ | 90,505 | $ | 81,949 | ||||||||||
|
Parent Roll Net Sales |
7,394 | 4,342 | 6,763 | 10,314 | 15,894 | |||||||||||||||
|
Net Sales |
168,446 | 142,724 | 116,374 | 100,819 | 97,843 | |||||||||||||||
|
Cost of Sales |
137,949 | 115,985 | 88,494 | 78,253 | 81,886 | |||||||||||||||
|
Gross Profit |
30,497 | 26,739 | 27,880 | 22,566 | 15,957 | |||||||||||||||
|
Selling, General and Administrative Expenses |
9,540 | 11,675 | 9,471 | 8,456 | 6,810 | |||||||||||||||
|
Intangibles Amortization |
1,507 | 753 | - | - | - | |||||||||||||||
|
Operating Income |
19,450 | 14,311 | 18,409 | 14,110 | 9,147 | |||||||||||||||
|
Interest Expense |
521 | 271 | 371 | 407 | 647 | |||||||||||||||
|
Other (Income) Expense, net |
(683 | ) | 181 | (173 | ) | 302 | (42 | ) | ||||||||||||
|
Income Before Income Taxes |
19,612 | 13,859 | 18,211 | 13,401 | 8,542 | |||||||||||||||
|
Provision for Income Taxes |
6,055 | 4,394 | 4,892 | 4,144 | 2,344 | |||||||||||||||
|
Net Income |
$ | 13,557 | $ | 9,465 | $ | 13,319 | $ | 9,257 | $ | 6,198 | ||||||||||
|
Net income per common share - Diluted |
$ | 1.38 | $ | 1.11 | $ | 1.67 | $ | 1.18 | $ | 0.80 | ||||||||||
|
Cash dividends declared per share |
$ | 1.40 | $ | 1.40 | $ | 1.35 | $ | 0.85 | $ | 0.50 | ||||||||||
|
Operating Data |
||||||||||||||||||||
|
Converted product tons shipped |
82,972 | 67,870 | 52,592 | 43,661 | 39,104 | |||||||||||||||
|
Parent roll tons shipped |
7,436 | 4,922 | 6,726 | 10,334 | 16,410 | |||||||||||||||
|
Total Tons Shipped |
90,408 | 72,792 | 59,318 | 53,995 | 55,514 | |||||||||||||||
|
Cash Flow Data |
||||||||||||||||||||
|
Cash Flow Provided by (Used in): |
||||||||||||||||||||
|
Operating Activities |
$ | 18,791 | $ | 20,152 | $ | 20,796 | $ | 17,451 | $ | 15,655 | ||||||||||
|
Investing Activities |
$ | (75,189 | ) | $ | (37,434 | ) | $ | (12,179 | ) | $ | (9,788 | ) | $ | 1,969 | ||||||
|
Financing Activities |
$ | 59,738 | $ | 11,098 | $ | (7,146 | ) | $ | (6,226 | ) | $ | (13,469 | ) | |||||||
|
As of December 31, |
||||||||||||||||||||
|
2015 |
2014 |
2013 |
2012 |
2011 |
||||||||||||||||
|
Working Capital |
$ | 20,753 | $ | 4,754 | $ | 22,440 | $ | 20,454 | $ | 15,342 | ||||||||||
|
Net Property, Plant and Equipment |
$ | 173,378 | $ | 119,720 | $ | 95,745 | $ | 91,188 | $ | 92,285 | ||||||||||
|
Total Assets |
$ | 251,379 | $ | 170,739 | $ | 127,092 | $ | 119,358 | $ | 114,968 | ||||||||||
|
Long-Term Debt, net of current portion |
$ | 71,699 | $ | 33,662 | $ | 13,927 | $ | 15,079 | $ | 16,231 | ||||||||||
|
Total Stockholders' Equity |
$ | 133,783 | $ | 100,513 | $ | 84,849 | $ | 77,178 | $ | 72,649 | ||||||||||
Item 7. MANAGEMENT'S DISCUSSION AND ANALYSIS OF FINANCIAL CONDITION AND RESULTS OF OPERATIONS
You should read the following discussion of our financial condition and results of operations in conjunction with the audited financial statements and the notes to those statements included elsewhere in this Form 10-K. This discussion contains forward-looking statements that involve risks and uncertainties. You should specifically consider the various risk factors identified in this filing that could cause actual results to differ materially from those anticipated in these forward-looking statements.
Executive Overview
What were our key 2015 financial results?
|
● |
Our net sales in 2015 increased 18% to a new record of $168.4 million compared to $142.7 million in 2014. |
|
● |
Net sales of converted product were $161.1 million during 2015, a new twelve-month record. Converted product net sales increased $22.7 million, or 16%, to $161.1 million in 2015 compared to $138.4 million in 2014, primarily due to the full-year effect of sales related to the Fabrica Transaction and an 8% increase in shipments from our Oklahoma site. |
|
● |
Our earnings per diluted common share in 2015 increased to $1.38 per diluted common share compared with $1.11 per diluted common share in 2014, including the effects of a follow-on stock offering of 1.5 million shares of common stock in April 2015, primarily due to improved production costs in our paper mill, higher margins on sales related to the Fabrica Transaction due to a strong US dollar exchange rate with the Mexican peso, and increased parent roll tonnage available for sale due to the installation of a new paper machine in March 2015. |
|
● |
Our EBITDA in 2015 increased to $31.4 million compared to $23.8 million in 2014, primarily due to the factors cited above. |
What did we focus on in 2015?
In 2015, we continued to work toward our vision to be recognized as a national supplier of high quality consumer tissue products in the value, premium and ultra-premium tier product segments. Furthermore, we began to execute our long-term goal to increase the Company’s Adjusted EBITDA and earnings per share by maximizing sales and profitability across our manufacturing sites in Oklahoma and South Carolina and our operations in Mexico. We successfully implemented a new converting line and a new paper machine in our Oklahoma location, resulting in capacity and cost improvements, and began construction on our greenfield site in South Carolina. As a result of these efforts, we realized record net sales, converted product sales and shipments from our Pryor location for the second consecutive year. We continued to focus on controlling production costs while improving quality attributes, such as bathroom tissue softness, to supplement the higher product quality production capabilities of our newer converting lines and improving utilization of current converting equipment to improve capacity.
What challenges and opportunities did our business face in 2015?
During the first quarter of 2015, our net sales and margins were negatively affected by construction and installation of a new paper machine, which resulted in reduced absorption of fixed costs in our paper making operation, required external purchases of parent rolls, and resulted in lost margins on parent roll sales, as there were no excess parent rolls to sell in the open market. Furthermore, during 2015, we continued to be challenged by the price of furnish, one of our largest inputs to the production process. In 2015, the average price across our fiber basket increased 4% compared to 2014, which increased cost of goods sold by $2.4 million. We also experienced a 5% decrease in the net selling price per ton of our converted products due to product mix and a competitive industry and increased production costs in our converting operation, primarily due to higher labor and maintenance and repair costs. Finally, in the fourth quarter of 2015, we experienced an incident that damaged a section of one of our converting lines, which restricted production in the face of strong open orders, causing a reduction in sales in the quarter.
Despite these challenges, we were able to increase converted product shipments from our Oklahoma site by 8%, primarily due to the installation of a new converting line, which is expected to ultimately add 12,500 tons, or 15%, of additional converting capacity in our Oklahoma site. Our new paper machine project also allowed us to take advantage of a strong demand for parent rolls, as reflected by a 51% increase in parent roll tons shipped and a 13% increase in parent roll selling price per ton. The paper machine project also resulted in a significant decrease in paper production costs in 2015. Additionally, our first full-year of sales under the Fabrica Transaction provided a significant increase in sales and EBITDA, as expected.
What will we focus on in 2016?
In 2016, our primary focus will be on the successful, timely start-up of two converting lines at our facility in South Carolina. A successful startup will provide additional converting capacity of approximately 30,000 to 32,000 tons, and will improve manufacturing flexibility and product quality. Another main area of focus will be the further expansion of our partnership with Fabrica, which we expect to improve the new product development efforts and manufacturing techniques and processes of each site. We expect these efforts to improve our net sales, overall production costs and operating margins. We also intend to focus on improving the efficiencies of our converting operation in Oklahoma, which we expect will result in lower production costs and increased availability of converting products to be sold.
We intend to continue to focus our sales and marketing efforts on obtaining new business, broadening our customer base and further expansion into the premium and ultra-premium tier markets to support our vision of being recognized as a national supplier of high quality consumer tissue products in the value, premium and ultra-premium tier product segments. Through our new product development efforts, our partnership with Fabrica and the superior equipment being installed in South Carolina, we believe we have positioned ourselves to produce higher quality tissue products with attractive cost characteristics that provide good price points for retailers and good value for consumers. We will continue to focus on optimizing the capacity of our current assets in Oklahoma, especially our converting lines.
Business Overview
We are a customer focused, national supplier of high quality consumer tissue products. We produce bulk tissue paper, known as parent rolls, and convert parent rolls into finished products, including paper towels, bathroom tissue and paper napkins. We sell any parent rolls not required by our converting operation to other converters. Our strategy is to sell all of the parent rolls we manufacture as converted products, which generally carry higher margins than parent rolls. Our integrated manufacturing facilities have flexible production capabilities, which allow us to produce high quality tissue products with short production times across all quality tiers for customers in our target regions. We predominately sell our products under private labels to our core customer base in the “at home” market, which consists primarily of dollar stores, discount retailers and grocery stores that offer limited alternatives across a wide range of products. Our focus to date has been the dollar stores (which are also referred to as discount retailers) and the broader discount retail market because of their overall market growth, consistent order patterns and low number of stock keeping units (“SKUs”). The “at-home” tissue market consists of several quality levels, including a value tier, premium tier and ultra-premium tier. To a lesser extent, we service customers in the “away from home” market. Our core customer base in the “away from home” market consists of companies in the janitorial market and food service market. Most of the products we sell in the “away from home” market are included in the value tier. While we expect to continue to service this market in the near term, we currently do not consider the “away from home” market a growth vehicle for us.
Our facilities have been designed to have the flexibility to produce and convert parent rolls across different product tiers and to use both virgin and recycled fibers to maximize quality and to control costs. We own an integrated facility in Pryor, Oklahoma with modern paper making and converting equipment. In June 2014, we expanded our geographic presence to service the United States West Coast through a strategic transaction with Fabrica de Papel San Francisco, S.A. de C.V. (“Fabrica”), one of the largest tissue manufacturers by capacity in Mexico (the “Fabrica Transaction”). The Fabrica Transaction provided us access to Fabrica’s U.S. customers, which we believe will allow us to further penetrate the region, and the supply agreement (“Supply Agreement”) we entered into with Fabrica has provided access to up to 19,800 tons of product each year (up to 27,500 tons in the first two years of the agreement). In the second quarter of 2015, we began construction on our plans to build a world-class integrated tissue operation in Barnwell, South Carolina. We believe that this new facility will allow us to better serve our existing customers in the Southeast United States, while also enabling us to penetrate new customers in this region. The facility is designed to provide highly flexible, cost competitive production across all quality tiers.
Our products are sold primarily under our customers' private labels and, to a lesser extent, under our brand names such as Colortex®, My Size®, Velvet®, Big Mopper®, Linen Soft®, Soft & Fluffy®, and Tackle®. The Fabrica Transaction gave us the exclusive right to sell products into the United States under Fabrica’s brand names, including Virtue®, Truly Green®, Golden Gate Paper® and Big Quality®. All of our converted product net sales are derived pursuant to truck load purchase orders from our customers. Parent roll net sales are derived from purchase orders that generally cover a one-month time period. We do not have supply contracts with any of our customers, which is normal practice within our industry. Because our product is a daily consumable item, the order stream from our customer base is fairly consistent with no significant seasonal fluctuations. However, we do typically experience some mild seasonal softness in the first and fourth quarters of each year, primarily due to the effects of winter weather on consumers buying habits and occasional effects of holidays on shipping schedules. Changes in the national economy, in general, do not materially affect the market for our converted products.
Our profitability depends on several key factors, including:
|
● |
the market price of our product; |
|
● |
the cost of fiber used in producing paper; |
|
● |
the efficiency of operations in our paper mill and converting facilities; and |
|
● |
the cost of energy. |
The private label market of the tissue industry is highly competitive, and discount retail customers are extremely price sensitive. As a result, it is difficult to effect price increases. We expect these competitive conditions to continue.
Comparative Years Ended December 31, 2015, 2014 and 2013
Net Sales
|
Years Ended December 31, |
||||||||||||
|
2015 |
2014 |
2013 |
||||||||||
|
(in thousands, except price per ton and tons) |
||||||||||||
|
Converted product net sales |
$ | 161,052 | $ | 138,382 | $ | 109,611 | ||||||
|
Parent roll net sales |
7,394 | 4,342 | 6,763 | |||||||||
|
Total net sales |
$ | 168,446 | $ | 142,724 | $ | 116,374 | ||||||
|
Converted product tons shipped |
82,972 | 67,870 | 52,592 | |||||||||
|
Parent roll tons shipped |
7,436 | 4,922 | 6,726 | |||||||||
|
Total tons shipped |
90,408 | 72,792 | 59,318 | |||||||||
Net sales for the year ended December 31, 2015 increased $25.7 million, or 18%, to $168.4 million compared to $142.7 million for the year ended December 31, 2014. These net sales figures include gross selling price, including freight, less discounts and sales promotions. Net sales of converted product increased $22.7 million, or 16%, to $161.1 million compared to $138.4 million in 2014. Net sales of parent rolls increased $3.1 million, or 70%, in 2015, to $7.4 million compared to $4.3 million in 2014. The increase in converted product sales was primarily due to a 22% increase in converted product tonnage shipped, which was partially offset by a 5% decrease in net selling prices per ton. A full-year of sales under the Fabrica Transaction accounted for 72% of the increase in tonnage shipped. Shipments from our Oklahoma site increased 8% in 2015. The decrease in selling price is due to the mix of products sold, including a full-year of “away from home” shipments under the Fabrica Transaction, which typically have a lower selling price per ton. The increase in parent roll sales was due to a 51% increase in parent roll tons shipped and a 13% increase in the net sales price per ton. The increase in parent roll shipments was primarily due to the new paper machine project in Oklahoma, which resulted in a higher amount of tons produced and available for sale in the open market. The increase in selling price per ton is primarily due to strong demand for parent rolls in 2015.
Net sales for the year ended December 31, 2014 increased $26.3 million, or 23%, to $142.7 million compared to $116.4 million for the year ended December 31, 2013. Net sales of converted product increased $28.8 million, or 26%, to $138.4 million compared to $109.6 million in 2013. Net sales of parent rolls decreased $2.4 million, or 36%, in 2014, to $4.3 million compared to $6.8 million in 2013. The increase in converted product sales was primarily due to a 29% increase in converted product tonnage shipped, which was partially offset by a 2% decrease in net selling prices per ton. Converted product tons shipped increased primarily due to the effect of the U.S. business acquired from Fabrica, which accounted for 90% of the increase in tonnage shipped, and due to increased sales to existing customers. The selling price decrease is due to the mix of business obtained in the Fabrica Transaction, which contained some “away from home” business, which typically sells at a lower price per ton. The decrease in parent roll sales was due to a 27% decrease in parent rolls shipped and a 12% decrease in the net sales price per ton. The decrease in parent roll shipments was primarily due to the demolition of two paper machines in September 2014, which reduced parent roll output from the paper mill. The decrease in selling price per ton is primarily due to a continued soft market for parent rolls.
Cost of Sales
|
Years Ended December 31, |
||||||||||||
|
2015 |
2014 |
2013 |
||||||||||
|
(in thousands, except gross profit margin % and price per ton) |
||||||||||||
|
Cost of goods sold |
$ | 128,232 | $ | 107,049 | $ | 80,881 | ||||||
|
Depreciation |
9,717 | 8,936 | 7,613 | |||||||||
|
Cost of sales |
$ | 137,949 | $ | 115,985 | $ | 88,494 | ||||||
|
Gross Profit |
$ | 30,497 | $ | 26,739 | $ | 27,880 | ||||||
|
Gross Profit Margin % |
18.1 | % | 18.7 | % | 24.0 | % | ||||||
Major components of cost of sales are the cost of internally produced paper, raw materials, direct labor and benefits, freight on products shipped to customers, insurance, repairs and maintenance, energy, utilities, depreciation and the cost of converted products purchased under the Supply Agreement with Fabrica.
Cost of sales for the year ended December 31, 2015 increased $22.0 million, or 19%, to $137.9 million compared to $116.0 million in the year ended December 31, 2014. Cost of sales as a percentage of net sales was 81.9% in the 2015 period compared to 81.3% in the 2014 period. Cost of sales as a percent of net sales was negatively affected by the effects of our new paper machine project in the first quarter of 2015, higher fiber costs, higher production costs in our Oklahoma converting operation, an incident in our Oklahoma converting operation that curtailed production in the fourth quarter, resulting in lost sales, and higher depreciation. These factors were partially offset by lower paper production costs in our Oklahoma facility following the start-up of the new paper machine in March 2015.
Our cost of goods sold were negatively affected in the first quarter of 2015 by two main factors resulting from the new paper machine project. The de-commissioning of two paper machines in late 2014 resulted in lower overall production, which had the effect reducing fixed cost absorption and resulted in the need to purchase parent rolls to support our converting requirements. We consumed approximately 3,000 tons of parent rolls during the project period, which increased our cost of goods sold by approximately $3.4 million. Average fiber prices across our fiber basket increased approximately 4% in 2015 compared to the same period of 2014, which also increased our cost of sales by approximately $2.4 million. Production costs in our converting operation were higher primarily due to higher labor and higher repair and maintenance expenses. Additionally, an incident in our converting operation in the fourth quarter of 2015 resulted in lost sales and the resultant margins on approximately 300,000 cases. This incident is covered by a business interruption insurance policy, under which we expect to recover approximately $1.0 million when settled. Depreciation expense increased by $781,000 in 2015 due to 2014 and 2015 capital expenditures.
Cost of sales for the year ended December 31, 2014 increased $27.5 million, or 31%, to $116.0 million compared to $88.5 million in the year ended December 31, 2013. Cost of sales as a percentage of net sales was 81.3% in the 2014 period compared to 76.0% in the 2013 period. Cost of sales as a percent of net sales was negatively affected by higher fiber costs, higher production costs in both converting and the paper production operations, higher depreciation and lower parent roll selling prices.
Paper production costs increased approximately 5%, or $2.1 million, in the year ended December 31, 2014 compared to the 2013 period. Paper production costs increased primarily due to the new paper machine project in which two paper machines were de-commissioned in September of 2014. This had the effect of reducing production and raising production costs during the construction phase of the project. Average fiber prices across our fiber basket increased approximately 8% in 2014 compared to the same period of 2013, which increased our cost of sales by approximately $1.1 million. The reduced production also resulted in the need to purchase parent rolls in the open market to supplement our paper making capacity.
Depreciation expense increased by $1.3 million in 2014 due to 2013 and 2014 capital expenditures. Converting per unit production costs were unfavorable by approximately 7% to the prior year primarily due to higher maintenance and repair costs, and, to a lesser extent, relocating newly hired employees and a one-time charge related to the project to install a new converting line.
Gross Profit
Gross profit increased by $3.8 million, or 14%, to $30.5 million in the year ended December 31, 2015, compared to $26.7 million in 2014. As a percentage of net sales, gross profit decreased to 18.1% in 2015 compared to 18.7% in 2014. The decrease in gross profit margin was primarily due to higher fiber costs, the effect of the new paper machine project on our first quarter 2015 results, higher production costs in our converting operation, higher depreciation, and an incident in our converting operation in the fourth quarter of 2015 that curtailed production and resulted in lost sales.
Gross profit decreased by $1.1 million, or 4%, to $26.7 million in the year ended December 31, 2014, compared to $27.9 million in 2013. As a percentage of net sales, gross profit decreased to 18.7% in 2014 compared to 24.0% in 2013. The decrease in gross profit margin was primarily due to higher fiber costs, higher production costs in both converting and the paper production operations, higher depreciation and lower parent roll selling prices. Fiber costs, converting production costs, paper production costs and depreciation increased primarily due to the reasons noted above under Cost of Sales. The decrease in parent roll selling prices is primarily due to a continued soft market for parent rolls and reduced our gross margin by approximately $607,000 in 2014.
Selling, General and Administrative Expenses
|
Years Ended December 31, |
||||||||||||
|
2015 |
2014 |
2013 |
||||||||||
|
(In thousands, except SG&A as a % of net sales) |
||||||||||||
|
Commission expense |
$ | 1,117 | $ | 1,587 | $ | 1,879 | ||||||
|
Other S,G&A expenses |
8,423 | 10,088 | 7,592 | |||||||||
|
Selling, General & Adm expenses |
$ | 9,540 | $ | 11,675 | $ | 9,471 | ||||||
|
SG&A as a % of net sales |
5.7 | % | 8.2 | % | 8.1 | % | ||||||
Selling, general and administrative (SG&A) expenses include salaries, commissions to brokers and other miscellaneous expenses. SG&A expenses decreased $2.1 million, or 18%, to $9.5 million in the year ended December 31, 2015 compared to $11.7 million in 2014. The reduction in SG&A was primarily due to lower commissions in 2015 related to mix of products sold and lower non-cash compensation expense related to stock options granted to management. Additionally, $1.6 million of expenses recorded in 2014 related to the Fabrica Transaction did not reoccur in 2015. As a percentage of net sales, SG&A decreased to 5.7% in 2015 compared to 8.2% in 2014.
SG&A expenses increased $2.2 million, or 23%, to $11.7 million in the year ended December 31, 2014 compared to $9.5 million in 2013. The higher expenses were primarily due to $1.6 million of expenses related to the Fabrica Transaction and $1.4 million of additional non-cash compensation expense related to stock options granted to management in 2014, which were partially offset by lower commission expense due to the mix of converted products sold and lower artwork related expenses. As a percentage of net sales, SG&A increased slightly to 8.2% in 2014 compared to 8.1% in 2013.
Amortization of Intangibles
The Company recognized $1.5 million and $753,000 of amortization expense related to the intangible assets acquired in the Fabrica Transaction during 2015 and 2014, respectively.
Operating Income
As a result of the foregoing factors, operating income for the years ended December 31, 2015, 2014 and 2013 was $19.5 million, $14.3 million, and $18.4 million, respectively.
Interest and Other (Income) Expense
|
Years Ended December 31, |
||||||||||||
|
2015 |
2014 |
2013 |
||||||||||
|
(In thousands) |
||||||||||||
|
Interest expense |
$ | 521 | $ | 271 | $ | 371 | ||||||
|
Other (income) expense, net |
$ | (683 | ) | $ | 181 | $ | (173 | ) | ||||
|
Income before income taxes |
$ | 19,612 | $ | 13,859 | $ | 18,211 | ||||||
Interest expense includes interest paid and accrued on all debt and amortization of deferred debt issuance costs. See "Liquidity and Capital Resources" below. Interest expense for the year ended December 31, 2015 was $521,000 compared to $271,000 in the same period in 2014. Interest expense for 2015 excludes $487,000 of interest capitalized on significant projects during the period, compared to $252,000 of capitalized interest in the same period in 2014. The higher level of total interest in 2015 resulted from higher debt balances in 2015 due primarily to additional debt incurred in conjunction with paper machine and converting line projects in Oklahoma and construction of our South Carolina facility, and the full-year effect of debt incurred in conjunction with the Fabrica Transaction in June 2014.
Interest expense for the year ended December 31, 2014 was $271,000 compared to $371,000 in the same period in 2013. Interest expense for 2014 excludes $252,000 of interest capitalized on significant projects during the period. The higher level of total interest in 2014 resulted from higher debt balances in the last half of 2014 due primarily to additional debt incurred in conjunction with the Fabrica Transaction, additional borrowings to finance capital expenditures, and writing off $38,000 of deferred debt costs when we refinanced our debt with a new creditor.
Income Before Income Taxes
As a result of the foregoing factors, income before income taxes increased $5.8 million, or 42%, to $19.6 million for the year ended December 31, 2015 compared to $13.9 million for the year ended December 31, 2014. Income before income taxes decreased $4.4 million, or 24%, to $13.9 million for the year ended December 31, 2014 compared to $18.2 million for the year ended December 31, 2013.
Income Tax Provision
For the year ended December 31, 2015, income tax expense was $6.1 million, resulting in an effective tax rate of 30.9%. This rate is lower than the statutory rate primarily due to Oklahoma Investment Tax Credit (“OITC”) associated with investments in our manufacturing operations, manufacturing tax deductions and Federal Indian Employment Credits (“IEC”).
For the year ended December 31, 2014, income tax expense was $4.4 million, resulting in an effective tax rate of 31.7%. This rate is lower than the statutory rate primarily due to a change in estimate recognized in 2014, as we believe our deferred assets and liabilities will be recognized at rates other than previously estimated, manufacturing tax deductions and OITC associated with investments in our manufacturing operations.
For the year ended December 31, 2013, income tax expense was $4.9 million, resulting in an effective tax rate of 26.9%. This rate is lower than the statutory rate primarily due to Oklahoma Investment Tax Credits ("OITC") associated with investments in our manufacturing operations, tax benefits recognized when employees and board members exercised stock options during the year and Federal Indian Employment Credits ("IEC").
Our current Oklahoma tax obligations for the years ended December 31, 2015, 2014 and 2013 were satisfied by using our OITC carryforward.
In 2014, due to effects of the Fabrica Transaction, we began recording current and deferred income taxes in the country of Mexico. The effects of foreign taxes were not material to our effective tax rate due to U.S. income tax credits related to foreign-sourced income.
LIQUIDITY AND CAPITAL RESOURCES
Overview
Liquidity refers to the liquid financial assets available to fund our business operations and pay for near-term obligations. These liquid financial assets consist of cash and unused borrowing capacity under our revolving credit facility. Our cash requirements have historically been satisfied through a combination of cash flows from operations and equity and debt financings. We expect this trend to continue.
As of December 31, 2015, we had unrestricted cash of $4.4 million, compared to a net bank overdraft of $685,000 as of December 31, 2014. Additionally, as of December 31, 2015, we had $12.0 million of cash that is restricted to use for construction of our South Carolina greenfield facility. During 2015, the most significant event effecting liquidity and capital needs was the announcement of a greenfield expansion in Barnwell, SC, which is expected to cost approximately $136 million. Financing for this project was provided through a combination of: (i) a follow-on offering of 1.5 million shares our common stock in April 2015, which provided net proceeds of $32.1 million; (ii) refinancing and expansion of our credit facility with U.S. Bank in June 2015, as discussed below, and (iii) a New Market Tax Credit (“NMTC”) transaction in December 2015, under which we received $16.2 million of proceeds. During 2015, we incurred $63.2 million of capital expenditures, including $41.8 million of assets associated with our South Carolina facility.
In April 2015, we amended our credit facility with US. Bank National Association (“U.S. Bank”) to add $40 million of borrowing capacity under a delayed draw term loan. In June 2015, we again amended our credit facility with U.S. Bank to obtain additional borrowing capacity, which will primarily be utilized to finance capital expenditures associated with our South Carolina facility and planned capital expenditures at our Oklahoma facility. This amendment combined $20.0 million outstanding under the revolving line of credit and $27.3 million outstanding under our existing term loan into a $47.3 million term loan, increased the delayed draw facility from $40 million to $115 million, extended the maturity of the delayed draw facility from August 2015 to June 2020 and added a $50 million accordion feature. Proceeds from the delayed draw term loan must be used solely to finance the purchase and installation of new equipment and construction at our South Carolina facility.
In December 2015, we entered into a NMTC transaction, which provided $16.2 million of loan proceeds, which will be used to finance capital expenditures associated with our South Carolina facility. This transaction allowed the Company to fix the interest on $11.1 million of its long-term debt for seven years and includes the potential for future debt forgiveness of approximately $5.1 million in seven years. In connection with this transaction, the maximum borrowing capacity under our delayed draw facility was reduced from $115 million to $99.6 million. This transaction is discussed in further detail in the Notes to the Consolidated Financial Statements included in Item 8 of this Form 10-K.
On February 21, 2011, we initiated a quarterly cash dividend. The initial quarterly dividend payment was established at $0.10 per share and the per share dividends that have been paid in the past three years are as follows:
|
2013 |
2014 |
2015 |
||||||||||
|
First Quarter |
$ | 0.30 | $ | 0.35 | $ | 0.35 | ||||||
|
Second Quarter |
$ | 0.35 | $ | 0.35 | $ | 0.35 | ||||||
|
Third Quarter |
$ | 0.35 | $ | 0.35 | $ | 0.35 | ||||||
|
Fourth Quarter |
$ | 0.35 | $ | 0.35 | $ | 0.35 | ||||||
|
Total |
$ | 1.35 | $ | 1.40 | $ | 1.40 | ||||||
On February 3, 2016, the Board of Directors authorized a quarterly cash dividend of $0.35 per outstanding share of the Company's common stock. The Company paid this dividend on March 1, 2016 to stockholders of record at the close of business on February 16, 2016.
Quarterly dividends are approved and the payment amount is established based on our Board of Directors' review of our expected future cash flows, our balance sheet leverage and future capital requirements. The Board of Directors will evaluate the appropriate dividend payment on a quarterly basis. While we expect to continue to declare quarterly dividends, the payment of future dividends is at the discretion of the Board of Directors and the timing and amount of any future dividends will depend upon earnings, cash requirements and financial condition of the Company.
Capital expenditures for our Oklahoma facility in 2016 are estimated at $6.0 million, while capital expenditures for our South Carolina facility in 2016 are estimated at $90.0 million. As discussed above, we expect to fund the improvement projects with a combination of cash from operations, cash from the NMTC transaction and additional borrowings under our revolving credit facility and delayed draw term loan. Significant future expansion or capacity improvement projects beyond those discussed will likely be funded by a combination of additional bank financing and equity offerings, consistent with our past practices.
As of December 31, 2015, we estimate that Oklahoma Investment Tax credits ("OITC") will likely eliminate all Oklahoma income tax liability for the next few years. As of December 31, 2015, $5.6 million was recorded as an income tax receivable due to overpayments of estimated quarterly tax payments. This amount will be used to offset quarterly tax payments due in 2016.
The following table summarizes key cash flow information for the years ended December 31, 2015, 2014 and 2013:
|
Years Ended December 31, |
||||||||||||
|
2015 |
2014 |
2013 |
||||||||||
|
(in thousands) |
||||||||||||
|
Cash flow provided by (used in): |
||||||||||||
|
Operating activities |
$ | 18,791 | $ | 20,152 | $ | 20,796 | ||||||
|
Investing activities |
$ | (75,189 | ) | $ | (37,434 | ) | $ | (12,179 | ) | |||
|
Financing activities |
$ | 59,738 | $ | 11,098 | $ | (7,146 | ) | |||||
Cash flows provided by operating activities decreased from $20.2 million in 2014 to $18.8 million in 2015 primarily due to an increase in deferred income taxes and income taxes receivable, an increase in inventories and an increase in accounts receivable. The increases in deferred income taxes and income taxes receivable are primarily due to the ratification of the Indian Employment Tax Credit and accelerated depreciation extenders in December 2015 and state investment tax credits that were higher than previously estimated. The increase in inventories is primarily due to an increase in parent roll inventory as we prepare for the start-up of the converting lines in our South Carolina facility. The increase in accounts receivable is primarily due to the timing of sales to customers and related cash receipts.
Cash flows used in investing activities increased from $37.4 million in 2014 to $75.2 million in 2015 due to $63.2 million of capital expenditures, including $41.8 million for our South Carolina facility, and $12.0 million of cash restricted in the NMTC transaction. This cash may only be used to purchase assets for our South Carolina facility. Cash flows used in investing activities in 2014 included $25.8 million of capital expenditures and $16.7 million of cash paid for the Fabrica Transaction, which were partially offset by $5.0 million of proceeds from the sale of short-term investments.
Cash flows provided by financing activities increased from $11.1 million in 2014 to $59.7 million in 2015, primarily due to $32.1 million of net proceeds received from a follow-on offering of 1.5 million shares of the Company’s common stock in April 2015. Additionally, we borrowed $41.9 million under our credit facility and term loans with U.S. Bank and received $5.1 million of net proceeds under the NMTC transaction. These inflows were partially offset by dividend payments to stockholders of $13.8 million in 2015, $2.7 million of debt principal repayments, a decrease in bank overdrafts of $1.7 million, and $1.3 million of debt issuance costs incurred. In comparison, we borrowed $39.4 million under our credit facility with U.S. Bank in 2014, including $1.7 million of bank overdrafts, which were partially offset by $16.4 million of debt principal repayments and $11.8 million of dividends paid to stockholders.
Cash flows provided by operating activities decreased slightly from $20.8 million in 2013 to $20.2 million in 2014 primarily due to lower earnings, changes in deferred taxes, and increases in accounts receivable and other assets, which were partially offset by an increase in accounts payable and a decrease in inventories. Deferred taxes changed primarily due to changes in estimates, including the rate at which the deferred taxes are expected to become current tax liabilities. Accounts receivable increased primarily due to increased sales during 2014 from the Fabrica Transaction, while other assets increased primarily due to the timing of value-added tax (“VAT”) payments, which are primarily due to equipment purchased from Fabrica. The increase in accounts payable was primarily due to items purchased from Fabrica under the Supply Agreement and timing of related payments, while inventories decreased due to increased sales during 2014.
Cash flows used in investing activities increased from $12.2 million in 2013 to $37.4 million in 2014 primarily due to the Fabrica Transaction and increased capital expenditures. We paid $16.7 million in cash for the assets acquired in the Fabrica Transaction in 2014. Furthermore, capital expenditures in 2014 were $25.8 million, compared to $12.2 million in 2013, primarily due to the $38.9 million capacity expansion projects currently underway. These expenditures were partially offset by the sale of $5.0 million of short-term investments during 2014 to help finance these expenditures.
Cash flows provided by financing activities were $11.1 million in 2014 compared to cash flows used in financing activities of $7.1 million in 2013. The increase in cash flows provided by financing activities was primarily due to $39.4 million of borrowings under our credit facility with U.S. Bank in 2014, which were partially offset by $16.4 million of repayments of long-term debt, including $14.6 million of debt paid to our previous creditor when we refinanced our debt with U.S. Bank. This compares to $1.2 million of debt repayments in 2013. Additionally, we paid $11.8 million in dividends to stockholders in 2014, compared to $10.7 million in 2013. Finally, cash flows used in financing activities in 2013 were partially offset by $4.7 million of benefits related to stock option exercises. These benefits were minimal in 2014.
As noted above, in June 2015, the Company entered into the Second Amended and Restated Credit Agreement (the “Credit Agreement”) with U.S. Bank consisting of the following:
| ● | a $25 million revolving credit line due June 2020; |
|
● |
a $47.3 million term loan with a 5-year term and payable in quarterly installments of $675,000 through June 2016 and $1.0 million per quarter thereafter; |
|
● |
a $115.0 million delayed draw term loan with a 2-year draw period due June 2020 and payable in quarterly installments beginning in September 2017 of 1.5% of the June 30, 2017 outstanding balance; and |
|
● |
an accordion feature allowing the revolving credit line and/or delayed draw commitment under the Credit Agreement to be increased by up to $50.0 million at any time on or before the expiration date of the Credit Agreement. |
The Credit Agreement had the effect of (i) combining our existing $20 million revolving line of credit designated for the purchase and construction of a paper machine and converting line in Pryor, Oklahoma and $27.3 million currently outstanding under our existing term loan into a $47.3 million term loan, (ii) increasing the delayed draw facility from $40 million to $115 million, (iii) extending the maturity of the delayed draw facility from August 2015 to June 2020, and (iv) adding a $50 million accordion feature. Proceeds from the delayed draw term loan must be utilized solely to finance the purchase and installation of new equipment and construction at our South Carolina facility.
In December 2015, in connection with the NMTC transaction, the maximum borrowing capacity under the delayed draw term loan was reduced from $115.0 million to $99.6 million.
Under the terms of the Credit Agreement, amounts outstanding will bear interest at a variable rate of LIBOR or the base rate plus a specified margin, depending upon the Company’s quarterly Leverage Ratio, as defined in the Credit Agreement. Additionally, the Company will pay a commitment fee for the available portion of its revolving credit line at the applicable rate, as follows:
|
Leverage Ratio |
LIBOR Margin |
Base Margin |
Commitment Fee |
|||||||||
|
Less than 1.00 |
1.25 | % | 0.00 | % | 0.15 | % | ||||||
|
Greater than or equal to 1.00 but less than 2.00 |
1.50 | % | 0.00 | % | 0.20 | % | ||||||
|
Greater than or equal to 2.00 but less than 3.00 |
1.75 | % | 0.00 | % | 0.25 | % | ||||||
|
Greater than or equal to 3.00 but less than 3.50 |
2.25 | % | 0.00 | % | 0.30 | % | ||||||
|
Greater than or equal to 3.50 |
2.50 | % | 0.25 | % | 0.35 | % | ||||||
The Company’s leverage ratio at December 31, 2015 was 2.33.
The amount available under the revolving credit line may be reduced in the event that the Company's borrowing base, which is based upon qualified receivables and qualified inventory, is less than $25.0 million. As of December 31, 2015, our borrowing base was $14.8 million, including $8.3 million of eligible accounts receivable and $6.5 million of eligible inventory.
Obligations under the Credit Agreement are secured by substantially all of the Company's assets. The Credit Agreement contains representations and warranties, and affirmative and negative covenants customary for financings of this type, including, but not limited to, limitations on additional borrowings, additional investments and asset sales. The financial covenants, which are tested as of the end of each fiscal quarter, require the Company to maintain the following specific ratios: fixed charge coverage (minimum of 1.20 to 1.0) and leverage (maximum of 4.00 to 1.0 through June 2017; maximum of 3.75 to 1.0 on September 30, 2017; maximum of 3.50 to 1.0 on December 31, 2017 and thereafter). The table below compares the actual ratios as of December 31, 2015 with the limits specified in the credit agreement.
|
Actual as of 12/31/15 |
Required in Credit Agreement |
Excess |
||||||||||
|
Leverage ratio |
2.33 | 4.0 | 1.67 | |||||||||
|
Fixed charge coverage ratio |
1.99 | 1.20 | 0.79 | |||||||||
Contractual Obligations
As of December 31, 2015, our contractual cash obligations were our long-term debt and associated interest, our natural gas contract, and equipment purchase obligations primarily related to the construction of our South Carolina facility. We do not have any material leasing commitments or debt guarantees outstanding as of December 31, 2015. We do not have any defined benefit pension plans or any obligation to fund any postretirement benefit obligations for our work force.
Maturities of these contractual obligations consist of the following:
|
Payments Due by Period |
||||||||||||||||||||
|
Years |
||||||||||||||||||||
|
Contractual Cash Obligations |
Total |
1 |
2 and 3 |
4 and 5 |
after 5 |
|||||||||||||||
|
( in thousands) |
||||||||||||||||||||
|
Long-term debt (1) |
$ | 75,581 | $ | 3,882 | $ | 9,557 | $ | 53,950 | $ | 8,192 | ||||||||||
|
Interest payments (2) |
$ | 7,542 | $ | 1,641 | $ | 2,996 | $ | 2,226 | $ | 679 | ||||||||||
|
Natural Gas Contract (3) |
$ | 3,548 | $ | 1,650 | $ | 1,898 | $ | - | $ | - | ||||||||||
|
Equipment purchase obligations (4) |
$ | 53,549 | $ | 53,549 | $ | - | $ | - | $ | - | ||||||||||
|
Total |
$ | 140,220 | $ | 60,722 | $ | 14,451 | $ | 56,176 | $ | 8,871 | ||||||||||
| (1) | Under our revolving credit and term loan agreements, the maturity of outstanding debt could be accelerated if we do not maintain certain financial covenants. At December 31, 2015, we were in compliance with our loan covenants. | |
|
|
(2) |
The majority of our long-term debt carries interest at variable rates. These amounts have been calculated based on the interest rates in effect as of December 31, 2015, which ranged from 1.74% to 1.92% on variable rate loans and was 4.4% on our fixed rate loan, resulting in a weighted average rate of 2.17%. |
|
|
(3) |
In October 2008, we entered into a contract to purchase 334,000 MMBTU per year of natural gas requirements at $7.50 per MMBTU plus a $0.07 per MMBTU management fee for the period from April 2009 through March 2011. Subsequently, the agreement has been extended as follows: |
|
Period |
MMBTUs |
Price per MMBTU |
Management fee per MMBTU |
|||||||||||
|
January 2016 |
- | March 2016 | 95,900 | $ | 4.53 | $ | 0.07 | |||||||
|
April 2016 |
- | June 2016 | 93,600 | $ | 4.17 | $ | 0.07 | |||||||
|
July 2016 |
- | September 2016 | 92,300 | $ | 4.26 | $ | 0.07 | |||||||
|
October 2016 |
- | December 2016 | 91,900 | $ | 4.42 | $ | 0.07 | |||||||
|
January 2017 |
- | December 2017 | 467,505 | $ | 4.06 | $ | - | |||||||
| If we are unable to purchase the contracted amounts and the market price at that time is less than the contracted price, we would be obligated under the terms of our agreements to reimburse an amount equal to the difference between the contracted amount and the amount actually purchased, multiplied by the difference between our contract price and a price designated in the contract (approximates spot price). | ||
|
|
(4) |
In April 2015, we announced plans to construct a new facility in South Carolina, totaling approximately $136.0 million. As of December 31, 2015, we have entered into purchase orders to purchase, construct and install buildings, two converting lines, a paper machine and a de-inking plant at this location. |
Off-Balance Sheet Arrangements
We have not entered into any transactions, agreements or other contractual arrangements that would result in significant off-balance sheet liabilities.
Critical Accounting Policies and Estimates
The preparation of our financial statements and related disclosures in conformity with accounting principles generally accepted in the United States of America requires management to make estimates and judgments that affect our reported amounts of assets and liabilities, revenues and expenses, and related disclosures of contingent assets and liabilities. On an on-going basis, we evaluate our estimates and assumptions based upon historical experience and various other factors and circumstances. Management believes that our estimates and assumptions are reasonable under the circumstances; however, actual results may vary from these estimates and assumptions under different future circumstances. We have identified the following critical accounting policies that affect the more significant judgments and estimates used in the preparation of our financial statements:
Accounts Receivable. Accounts receivable consist of amounts due to us from normal business activities. Our management must make estimates of accounts receivable that will not be collected. We perform ongoing credit evaluations of our customers and adjust credit limits based upon payment history and the customer's creditworthiness as determined by our review of their current credit information. We continuously monitor collections and payments from our customers and maintain a provision for estimated losses based on historical experience and specific customer collection issues that we have identified. Trade receivables are written-off when all reasonable collection efforts have been exhausted, including, but not limited to, external third-party collection efforts and litigation. While such credit losses have historically been within management's expectations and the provisions established, there can be no assurance that we will continue to experience the same credit loss rates as in the past. During 2015, no accounts receivable were written off against the allowance for doubtful accounts, nor was the provision for bad debts increased or decreased based on sales levels, historical experience and an evaluation of the quality of existing accounts receivable, resulting in no change to the allowance. During 2014, no accounts receivable were written off against the allowance for doubtful accounts, while the provision was increased by $19,000 based on sales levels, historical experience and an evaluation of the quality of existing accounts receivable. Additionally, $1,000 of accounts receivable previously written off were recovered, resulting in a net increase in the allowance of $20,000. During 2013, $35,000 of accounts receivable not expected to be collected were written off against the allowance for doubtful accounts, while the provision was increased by $45,000 based on sales levels, historical experience and an evaluation of the quality of existing accounts receivable, resulting in a net increase of $10,000 in the allowance.
Inventory. Our inventory consists of converted finished goods, bulk paper rolls and raw materials and is based on standard cost, specific identification, or first-in, first-out (“FIFO”). Standard costs approximate actual costs on a FIFO basis. Material, labor and factory overhead necessary to produce the inventories are included in the standard cost. Our management regularly reviews inventory quantities on hand and records a provision for excess and obsolete inventory based on the age of the inventory and forecasts of product demand. A significant decrease in demand could result in an increase in the amount of excess inventory quantities on hand. During the year ended December 31, 2015, the inventory allowance was increased $239,000 based on a specific review of estimated slow moving or obsolete inventory items and decreased $296,000 due to actual write offs of obsolete inventory items, resulting an a net decrease in the allowance of $57,000. During the year ended December 31, 2014, the inventory allowance was increased $193,000 based on a specific review of estimated slow moving or obsolete inventory items and decreased $100,000 due to actual write offs of obsolete inventory items, resulting in a net increase in the allowance of $93,000. During the year ended December 31, 2013, the inventory allowance was increased $6,000 based on a specific review of estimated slow moving or obsolete inventory items and was decreased by $79,000 due to actual write offs of obsolete inventory items, resulting in a net decrease in the allowance of $73,000.
Property, plant and equipment. Significant capital expenditures are required to establish and maintain a paper mill and converting facility. Our property, plant and equipment consists of land, buildings and improvements, machinery and equipment, vehicles, parts and spares and construction-in-process, which are stated at cost, net of accumulated depreciation. Depreciation of property, plant and equipment is calculated using the straight-line method over the estimated useful lives of the assets. Our management regularly reviews estimated useful lives to determine whether any changes are necessary to reflect the related assets' actual productive lives. The lives of our property, plant and equipment currently range from 2.5 to 40 years. As of December 31, 2015, we estimate that a 1 year decrease in useful lives would have increased our depreciation expense by approximately $1.1 million, which would result in a corresponding reduction in our gross profit and operating income.
Stock-based Compensation. U.S. GAAP requires equity-classified, share-based payments to employees, including grants of employee stock options, to be valued at fair value on the date of grant and to be expensed over the applicable vesting period. We recognize this expense on a straight-line basis over the options’ expected terms. We issue stock options that vest over a specified period (time-based vesting) and stock options that vest when the price of the Company’s common stock reaches a certain price (market-based vesting). We also issue restricted stock.
We granted options to purchase 136,600, 585,000 and 43,750 shares of our common stock in 2015, 2014 and 2013, respectively. We recorded stock-based compensation expense of $1,003,000, $1,828,000 and $293,000 during 2015, 2014 and 2013, respectively, in connection with the option grants. During 2013, we granted 16,000 shares of restricted stock pursuant to the 2005 Stock Incentive Plan. We recorded stock-based compensation expense of $44,000, $51,000 and $53,000 during 2015, 2014 and 2013, respectively, in connection with the restricted stock grants. Grants of restricted stock are valued using the closing market price of our common stock on the date of grant.
We estimate the grant date fair value of time-based stock option awards using the Black-Scholes option valuation model, which requires assumptions involving an estimate of the fair value of the underlying common stock on the date of grant, the expected term of the options, volatility, discount rate and dividend yield. Separate values were determined for options having exercise prices ranging from $5.18 to $30.09. For options valued using the Black-Scholes option valuation model, we calculated expected option terms based on the “simplified” method for “plain vanilla” options, due to the Company’s limited exercise information. The “simplified method” calculates the expected term as the average of the vesting term and the original contractual term of the options. We calculated volatility using the daily volatilities of our common stock since our Initial Public Offering (“IPO”), while the discount rate was estimated using the interest rate for a treasury note with the same contractual term as the options granted. Dividend yield is estimated at our current dividend rate, which adjustments for any known future changes in the rate.
We have engaged a valuation specialist to estimate the grant date fair value of market-based stock option awards. Separate values were determined for options having exercise prices ranging from $25.24 to $31.125. The specialist utilizes a Monte Carlo valuation method to estimate the grant date fair value of the options granted in order to simulate a range of our possible future stock prices. Significant assumptions to the Monte Carlo method include the expected life of the option, volatility and dividend yield. The expected life of the option is based on the average of the service period and the contractual term of the option, using the “simplified” method for “plain vanilla” options. Volatility is calculated based on a mix of historical and implied volatility during the expected life of the options. Historical volatility is considered since our IPO and implied volatility is based on the publicly traded options of a three company peer group within the paper industry. Dividend yield is estimated based on our average historical dividend yield and our current dividend yield as of the grant date. The Monte Carlo analysis is performed under a risk-neutral premise, under which price drift is modeled using treasury note yields matching the expected life of the options.
Under U.S. GAAP, we expense the compensation cost related to the marked-based stock option awards on a straight-line basis over the derived service periods of the options as calculated under the Monte Carlo valuation method. However, if the market condition is achieved for any tranche of these options prior to the end of the derived service period, all remaining expense related to that tranche would be recognized in the period in which the market condition is achieved. Additionally, if the service period is met but the share price target required for the options to become exercisable is never achieved, no compensation cost may be reversed. As such, we may recognize expense for options that never become exercisable.
In addition, we are required to develop an estimate of the number of share-based awards that will be forfeited due to employee turnover. The guidance on stock compensation requires forfeitures to be estimated at the time of grant and revised, if necessary, in subsequent periods if actual forfeitures differ from those estimates in order to derive our best estimate of awards ultimately expected to vest. We estimate forfeitures based on historical experience related to our own stock-based awards granted. We anticipate that these estimates will be revised, if necessary, in subsequent periods if actual forfeitures differ from those estimates.
Intangible Assets and Goodwill. We allocate the cost of business acquisitions to the assets acquired and liabilities assumed based on their estimated fair values at the date of acquisition (commonly referred to as the purchase price allocation). As part of the purchase price allocations for our business acquisitions, identifiable intangible assets are recognized as assets apart from goodwill if they arise from contractual or other legal rights, or if they are capable of being separated or divided from the acquired business and sold, transferred, licensed, rented or exchanged. We have engaged a valuation specialist to estimate the fair value of our purchase price and the related intangible assets acquired.
During 2014, we acquired certain assets and the U.S. business of Fabrica. Due to these transactions, we separately recognized the fair values of a combined Supply and Lease Agreement, trademarks, a non-compete agreement and customer relationships. The fair value of these assets was determined using an income approach, as follows: Supply and Lease Agreement - discounted cash flows method, trademarks — “relief from royalty” method, non-compete agreement - “with and without” method, and customer relationships - excess earnings method. An income approach requires estimates of future income. Under the discounted cash flow method, we utilized assumptions related to the term of the agreements, the net benefit from the agreements and any changes in that benefit over the term of the agreement, future tax rates and discount rates. Under the relief from royalty method, we estimated the useful lives of the trademarks, future revenues associated with the trademarks, a royalty rate and a discount rate. The with and without method requires assumptions related to the probability of competition in the absence of the non-compete agreement, the loss of future revenues due to competition and discount rates. Under the excess earnings method, we must estimate future revenues, including growth and attrition rates, income tax rates, a rate of return on assets, and discount rates. Future revenues and estimated benefits from the agreements are based on management’s knowledge of the industry, customers, operations and the agreements. Tax rates are based on current effective tax rates. The royalty rate is based on analysis of current royalty rates for corporate and product trademarks for similar products and evaluation of factors such as alternative trademarks available, legal defensibility, remaining useful life, licensing power, net revenue margin, market share, barriers to entry, capital requirements and customers’ bargaining power. The discount rate used to determine the present value of future cash flows was based on the weighted average cost of capital method.
The value assigned to goodwill equals the amount of the purchase price of the business acquired in excess of the sum of the amounts assigned to identifiable acquired assets, both tangible and intangible, less liabilities assumed. At December 31, 2015, we had goodwill of $7.6 million and identifiable intangible assets, net of accumulated amortization, of $15.7 million.
Intangible assets are amortized over their respective estimated useful lives ranging from two to twenty years. The useful life of an intangible asset is the period over which the asset is expected to contribute directly or indirectly to our future cash flows rather than the period of time that it would take us to internally develop an intangible asset that would provide similar benefits. The estimate of the useful lives of our intangible asset is based on an analysis of all pertinent factors, in particular:
|
● |
the expected use of the asset by the entity; |
|
● |
the expected useful life of another asset or group of assets to which the useful life of the intangible asset may relate; |
|
● |
any legal, regulatory or contractual provisions that may limit the useful life; |
|
● |
any legal, regulatory, or contractual provisions that enable renewal or extension of the asset’s legal or contractual life without substantial cost (provided there is evidence to support renewal or extension and renewal or extension can be accomplished without material modifications of the existing terms and conditions); |
|
● |
the effects of obsolescence, demand, competition and other economic factors (such as the stability of the industry, known technological advances, legislative action that results in an uncertain or changing regulatory environment, and expected changes in distribution channels); and |
|
● |
the level of regular maintenance expenditures (but not enhancements) required to obtain the expected future cash flows from the asset (for example, a material level of required maintenance in relation to the carrying amount of the asset may suggest a limited useful life). |
If no legal, regulatory, contractual, competitive, economic, or other factors limit the useful life of an intangible asset, the useful life of the asset is considered to be indefinite. The term indefinite does not mean infinite. An intangible asset with a finite useful life is amortized over that useful life; an intangible asset with an indefinite useful life is not amortized. We have no intangible assets with indefinite useful lives. Under U.S. GAAP, goodwill is not amortized.
Impairment of Long-Lived Assets. We review long-lived assets such as property, plant and equipment, intangible assets and goodwill for impairment whenever events or changes in circumstances indicate that the carrying amount of these assets may not be recoverable, and also review goodwill annually. U.S. GAAP requires that goodwill be tested, at a minimum, annually for each reporting unit. The first step in testing goodwill to assess qualitative factors to determine whether it is more likely than not that goodwill is impaired as a basis for determining whether it is necessary to perform the quantitative impairment test. If the first step indicates a quantitative test must be performed, the second step is to identify any potential impairment by comparing the carrying value of the reporting unit to its fair value. If a potential impairment is identified, the third step is to measure the impairment loss by comparing the implied fair value of goodwill with the carrying value of goodwill of the reporting unit. Alternatively, the Company may bypass the qualitative assessment in any period and proceed directly to performing the second step.
The Company performed its initial goodwill impairment test on October 1, 2015 by performing the first step, a qualitative impairment test, to determine whether it was more likely than not that goodwill was impaired. Goodwill is tested at a level of reporting referred to as the “reporting unit”. The Company has two reporting units, which are defined as the “at home” business and the “away from home” business. Based on this qualitative test, we determined it was more likely than not that the fair value of the Company’s reporting units were greater than their carrying amounts; as such, we determined that performing the second and third steps of the impairment test were not necessary and that goodwill was not impaired. In performing this qualitative assessment, we considered factors including, but not limited to, the following:
|
● |
Macroeconomic conditions, including general economic conditions, limitations on accessing capital, and other developments in equity and credit markets; |
|
● |
Industry and market considerations, including any deterioration in the environment in which we operate, an increased competitive environment, a decline in market-dependent multiples or metrics, a change in the market for our products or services, and regulatory or political developments; |
|
● |
Cost factors such as increases in raw materials, labor, exchange rates or other costs that have a negative effect on earnings and cash flows; |
|
● |
Overall financial performance, including negative or declining cash flows or a decline in actual or planned revenue or earnings compared with actual and projected results of relevant prior periods; |
|
● |
Other relevant entity-specific events, such as changes in management, key personnel, strategy, customers, or litigation; and |
|
● |
Whether a sustained, material decrease in share price had occurred. |
Subsequent to October 1, 2015 we did not note any additional qualitative factors that would indicate that the Company’s goodwill was impaired.
New Accounting Pronouncements
Refer to the discussion of recently adopted/issued accounting pronouncements under Item 8, Financial Statements and Supplementary Data, Footnote 1—New accounting pronouncements.
Non-GAAP Discussion
In addition to our GAAP results, we also consider non-GAAP measures of our performance for a number of purposes including EBITDA, Adjusted EBITDA and Net Debt, each of which is defined below.
EBITDA and Adjusted EBITDA
We use EBITDA and Adjusted EBITDA as supplemental measures of our performance that is not required by, or presented in accordance with GAAP. EBITDA and Adjusted EBITDA should not be considered as an alternative to net income, operating income or any other performance measure derived in accordance with GAAP, or as an alternative to cash flow from operating activities or a measure of our liquidity.
EBITDA represents net income before net interest expense, income tax expense, depreciation and amortization. Amortization of deferred debt issuance costs is included in net interest expense. Adjusted EBITDA represents EBITDA before non-cash stock compensation expense and sporadic expenses, such as costs of business acquisitions and costs to demolish property, plant and equipment. We believe EBITDA and Adjusted EBITDA facilitate operating performance comparisons from period to period by eliminating potential differences caused by variations in capital structures (affecting relative interest expense), tax positions (such as the impact on periods or companies of changes in effective tax rates or net operating losses), the age and book depreciation of facilities and equipment (affecting relative depreciation expense), non-cash compensation and valuation (affecting stock compensation expense) and sporadic expenses (including costs of business acquisitions, demolition costs and change in estimated state tax liabilities).
EBITDA and Adjusted EBITDA have limitations as an analytical tool, and you should not consider it in isolation, or as a substitute for any of our results as reported under GAAP. Some of these limitations include:
|
● |
they do not reflect our cash expenditures for capital assets; |
|
● |
they do not reflect changes in, or cash requirements for, our working capital requirements; |
|
● |
they do not reflect cash requirements for cash dividend payments; |
|
● |
they do not reflect the interest expense, or the cash requirements necessary to service interest or principal payments on our indebtedness; |
|
● |
although depreciation and amortization are non-cash charges, the assets being depreciated and amortized will often have to be replaced in the future, and EBITDA and Adjusted EBITDA do not reflect cash requirements for such replacements; and |
|
● |
other companies, including other companies in our industry, may calculate these measures differently than we do, limiting their usefulness as a comparative measure. |
Because of these limitations, EBITDA and Adjusted EBITDA should not be considered as a measure of discretionary cash available to us to invest in the growth of our business or to reduce our indebtedness. We compensate for these limitations by relying primarily on our GAAP results and using EBITDA and Adjusted EBITDA on a supplemental basis.
The following table reconciles EBITDA and Adjusted EBITDA to net income for the years ended December 31, 2015, 2014 and 2013:
|
Years Ended December 31, |
||||||||||||
|
2015 |
2014 |
2013 |
||||||||||
|
(In thousands, except % of net sales) |
||||||||||||
|
Net income |
$ | 13,557 | $ | 9,465 | $ | 13,319 | ||||||
|
Plus: Interest expense, net |
521 | 271 | 371 | |||||||||
|
Plus: Income tax expense |
6,055 | 4,394 | 4,892 | |||||||||
|
Plus: Depreciation |
9,717 | 8,936 | 7,613 | |||||||||
|
Plus: Intangibles Amortization |
1,507 | 753 | - | |||||||||
|
EBITDA |
$ | 31,357 | $ | 23,819 | $ | 26,195 | ||||||
|
% of net sales |
18.6 | % | 16.7 | % | 22.5 | % | ||||||
|
Plus: Stock compensation expense |
1,048 | 1,879 | 346 | |||||||||
|
Plus: Acquisition costs |
- | 1,572 | - | |||||||||
|
Plus: Demolition costs |
- | 400 | - | |||||||||
|
Adjusted EBITDA |
$ | 32,405 | $ | 27,670 | $ | 26,541 | ||||||
|
% of net sales |
19.2 | % | 19.4 | % | 22.8 | % | ||||||
Adjusted EBITDA increased $4.7 million to $32.4 million for the year ended December 31, 2015, compared to $27.7 million in the same period in 2014. Adjusted EBITDA as a percent of net sales decreased from 19.4% in 2014 to 19.2% in 2015. EBITDA increased $7.5 million to $31.4 million for the year ended December 31, 2015, compared to $23.8 million in the same period in 2014. EBITDA as a percent of net sales increased from 16.7% in 2014 to 18.6% in 2015. The foregoing factors discussed in the net sales, cost of sales, and selling, general and administrative expenses sections are the reasons for the change.
Adjusted EBITDA increased $1.1 million to $27.7 million for the year ended December 31, 2014, compared to $26.5 million in the same period in 2013. Adjusted EBITDA as a percent of net sales decreased from 22.8% in 2013 to 19.4% in 2014. EBITDA decreased $2.4 million to $23.8 million for the year ended December 31, 2014, compared to $26.2 million in the same period in 2013. EBITDA as a percent of net sales decreased from 22.5% in 2013 to 16.7% in 2014. The foregoing factors discussed in the net sales, cost of sales, and selling, general and administrative expenses sections are the reasons for the change.
Net Debt
We use Net Debt as a supplemental measure of our leverage that is not required by, or presented in accordance with, GAAP. Net Debt should not be considered as an alternative to total debt, total liabilities or any other performance measure derived in accordance with GAAP. Net Debt represents total debt reduced by cash. We use this figure as a means to evaluate our ability to repay our indebtedness and to measure the risk of our financial structure.
Net Debt represents the amount that Cash is less than total Debt of the Company. The amounts included in the Net Debt calculation are derived from amounts included in the historical Balance Sheets. We have reported Net Debt because we regularly review Net Debt as a measure of the Company's leverage. However, the Net Debt measure presented in this document may not be comparable to similarly titled measures reported by other companies due to differences in the components of the calculation.
Net Debt increased from $37.0 million on December 31, 2014 to $71.2 million on December 31, 2015 primarily as a result of an increase in total debt, which was partially offset by an increase in our total cash. The increase in total debt is primarily due to additional borrowings to fund capital expenditures in 2015. The increase in cash was primarily due to increased cash provided by financing activities in 2015, including $32.1 million of proceeds from a follow-on stock offering in April 2015, $5.1 million of net proceeds from the NMTC transaction and increased borrowings under our credit facility.
The following table presents Net Debt as of December 31, 2015 and December 31, 2014:
|
As of |
||||||||
|
Net Debt Reconciliation: |
December 31, 2015 |
December 31, 2014 |
||||||
|
Current Portion Long-Term Debt |
$ | 3,882 | $ | 2,700 | ||||
|
Long-Term Debt |
71,699 | 33,662 | ||||||
|
Total Debt |
75,581 | 36,362 | ||||||
|
Less Cash, net of Bank Overdrafts |
(4,361 | ) | 685 | |||||
|
Net Debt |
$ | 71,220 | $ | 37,047 | ||||
SPECIAL NOTE REGARDING FORWARD-LOOKING STATEMENTS
This Form 10-K, including the sections entitled "Business," "Risk Factors" and "Management's Discussion and Analysis of Financial Condition and Results of Operations," contains forward-looking statements. These statements relate to, among other things:
|
● |
our business strategy; |
|
● |
the market opportunity for our products, including expected demand for our products; |
|
● |
our estimates regarding our capital requirements; and |
|
● |
any of our other plans, objectives, expectations and intentions contained in this Form 10-K that are not historical facts. |
These statements relate to future events or future financial performance, and involve known and unknown risks, uncertainties and other factors that may cause our actual results, levels of activity, performance or achievement to be materially different from any future results, levels of activity, performance or achievements expressed or implied by such forward-looking statements. In some cases, you can identify forward-looking statements by terminology such as "may," "should," "could," "expects," "plans," "intends," "anticipates," "believes," "estimates," "predicts," "potential," “will” or "continue" or the negative of such terms or other comparable terminology. Although we believe that the expectations reflected in the forward-looking statements are reasonable, we cannot guarantee future results, levels of activity, performance or achievements. These statements are only predictions.
You should not place undue reliance on forward-looking statements because they involve known and unknown risks, uncertainties, and other factors that are, in some cases, beyond our control and that could materially affect actual results, levels of activity, performance or achievements. Factors that could materially affect our actual results, levels of activity, performance or achievements include, but are not limited to, those detailed under the caption "Risk Factors" and the following items:
|
● |
failure to complete the construction of our South Carolina facility on schedule or at all; | |
|
● |
intense competition in our markets and aggressive pricing by our competitors could force us to decrease our prices and reduce our profitability; | |
|
● |
a substantial percentage of our converted product revenues are attributable to a small number of customers who may decrease or cease purchases at any time; | |
|
● |
disruption in our supply or increase in the cost of fiber; | |
|
● |
Fabrica’s failure to execute under the Supply Agreement; | |
|
● |
failure to successfully integrate the Fabrica business into our existing operations and the additional indebtedness incurred to finance the Fabrica Transaction; | |
|
● |
increased competition in our region; | |
|
● |
changes in our retail trade customers' policies and increased dependence on key retailers in developed markets; | |
|
● |
excess supply in the market may reduce our prices; | |
|
● |
the availability of, and prices for, energy; | |
|
● |
failure to purchase the contracted quantity of natural gas may result in financial exposure; | |
|
● |
our exposure to variable interest rates; | |
|
● |
the loss of key personnel; | |
|
● |
labor interruption; | |
|
● |
natural disaster or other disruption to our facilities; | |
|
● |
ability to finance the capital requirements of our business; |
|
● |
cost to comply with existing and new laws and regulations; |
|
● |
failure to maintain an effective system of internal controls necessary to accurately report our financial results and prevent fraud; |
|
● |
the parent roll market is a commodity market and subject to fluctuations in demand and pricing; |
|
● |
indebtedness limits our free cash flow and subjects us to restrictive covenants relating to the operation of our business; |
|
● |
an inability to continue to implement our business strategies; and |
|
● |
inability to sell the capacity generated from our converting lines. |
You should read this Form 10-K completely and with the understanding that our actual results may be materially different from what we expect. We undertake no duty to update these forward-looking statements after the date of this Form 10-K, even though our situation may change in the future. We qualify all of our forward-looking statements by these cautionary statements.
Item 7A. QUANTITATIVE AND QUALITATIVE DISCLOSURES ABOUT MARKET RISK
Interest Rate Risk
Our market risks relate primarily to changes in interest rates. Our revolving line of credit and most of our term loans carry a variable interest rate that is tied to market indices and, therefore, our statement of income and our cash flows will be exposed to changes in interest rates. As of December 31, 2015, we had floating-rate borrowings of $64.5 million. The amounts outstanding under all variable rate loans bear interest at a variable rate of LIBOR or the base rate plus a specified margin or 1.74% to 1.92% as of December 31, 2015. The margin is set quarterly and based on our leverage ratio. As of December 31, 2015, we also had fixed-rate borrowings of $11.1 million at 4.4%, resulting in a weighted average interest rate of 2.17%.
We considered the historical volatility of short-term interest rates and determined that it would be reasonably possible that an adverse change of 100 basis points could be experienced in the near term. Based on current borrowing levels and interest rate structures, a 100 basis point increase in interest rates would result in a pre-tax $643,000 increase to our annual interest expense. We attempt to mitigate interest rate risk by refinancing our debt at lower interest rates when it is deemed cost-effective to do so.
Commodity Price Risk
We are subject to commodity price risk, the most significant of which relates to the price of fiber. Selling prices of tissue products are influenced by the market price of fiber, which is determined by industry supply and demand. The effect of a fiber price increase of $10.00 per ton would be approximately $840,000 per year. As previously discussed under Item 1A, "Risk Factors," increases in fiber prices could adversely affect earnings if selling prices are not adjusted or if such adjustments trail the increase in fiber prices. We attempt to mitigate commodity price risk by entering into supply agreements that provide discounts to current market prices.
Natural Gas Price Risk
We are exposed to market risks for changes in natural gas commodity pricing. We partially mitigate this risk through our natural gas firm price contract that started in April 2009 and continues through December 2017, for approximately 70% to 80% of our natural gas requirements for our manufacturing facilities. The effect of a $1.00/MMBTU increase on the 20% to 30% not under firm price contract would be approximately $151,000 a year.
Item 8. FINANCIAL STATEMENTS AND SUPPLEMENTARY DATA
INDEX TO FINANCIAL STATEMENTS
|
Report of Independent Registered Public Accounting Firm |
42 |
|
|
|
|
Consolidated Balance Sheets as of December 31, 2015 and 2014 |
43 |
|
|
|
|
Consolidated Statements of Income for the Years ended December 31, 2015, 2014 and 2013 |
44 |
|
|
|
|
Consolidated Statements of Changes in Stockholders' Equity for the Years ended December 31, 2013, 2014 and 2015 |
45 |
|
|
|
|
Consolidated Statements of Cash Flows for the Years ended December 31, 2015, 2014 and 2013 |
46 |
|
|
|
|
Notes to Consolidated Financial Statements |
47 - 70 |
REPORT OF INDEPENDENT REGISTERED PUBLIC ACCOUNTING FIRM
To the Board of Directors and Stockholders
Orchids Paper Products Company
We have audited the accompanying consolidated balance sheets of Orchids Paper Products Company and subsidiaries as of December 31, 2015 and 2014, and the related consolidated statements of income, changes in stockholders' equity and cash flows for each of the three years in the period ended December 31, 2015, and the financial statement schedule of Orchids Paper Products Company listed in Item 15(a). We also have audited Orchids Paper Products Company's internal control over financial reporting as of December 31, 2015, based on criteria established in Internal Control—Integrated Framework issued by the Committee of Sponsoring Organizations of the Treadway Commission in 2013. Orchids Paper Products Company's management is responsible for these financial statements and financial statement schedule, for maintaining effective internal control over financial reporting, and for its assessment of the effectiveness of internal control over financial reporting included in the accompanying Management's Report on Internal Control Over Financial Reporting. Our responsibility is to express an opinion on these financial statements and an opinion on the Company's internal control over financial reporting based on our audits.
We conducted our audits in accordance with the standards of the Public Company Accounting Oversight Board (United States). Those standards require that we plan and perform the audits to obtain reasonable assurance about whether the financial statements are free of material misstatement and whether effective internal control over financial reporting was maintained in all material respects. Our audits of the financial statements included examining, on a test basis, evidence supporting the amounts and disclosures in the financial statements, assessing the accounting principles used and significant estimates made by management, and evaluating the overall financial statement presentation. Our audit of internal control over financial reporting included obtaining an understanding of internal control over financial reporting, assessing the risk that a material weakness exists, and testing and evaluating the design and operating effectiveness of internal control based on the assessed risk. Our audits also included performing such other procedures as we considered necessary in the circumstances. We believe that our audits provide a reasonable basis for our opinions.
A company's internal control over financial reporting is a process designed to provide reasonable assurance regarding the reliability of financial reporting and the preparation of financial statements for external purposes in accordance with generally accepted accounting principles. A company's internal control over financial reporting includes those policies and procedures that (a) pertain to the maintenance of records that, in reasonable detail, accurately and fairly reflect the transactions and dispositions of the assets of the company; (b) provide reasonable assurance that transactions are recorded as necessary to permit preparation of financial statements in accordance with generally accepted accounting principles, and that receipts and expenditures of the company are being made only in accordance with authorizations of management and directors of the company; and (c) provide reasonable assurance regarding prevention or timely detection of unauthorized acquisition, use, or disposition of the company's assets that could have a material effect on the financial statements.
Because of its inherent limitations, internal control over financial reporting may not prevent or detect misstatements. Also, projections of any evaluation of effectiveness to future periods are subject to the risk that controls may become inadequate because of changes in conditions, or that the degree of compliance with the policies or procedures may deteriorate.
In our opinion, the consolidated financial statements referred to above present fairly, in all material respects, the financial position of Orchids Paper Products Company and subsidiaries as of December 31, 2015 and 2014, and the results of its operations and its cash flows for each of the years in the three-year period ended December 31, 2015, in conformity with accounting principles generally accepted in the United States of America, and in our opinion, the related financial statement schedule, when considered in relation to the basic consolidated financial statements taken as a whole, presents fairly in all material respects the information set forth therein. Also in our opinion, Orchids Paper Products Company maintained, in all material respects, effective internal control over financial reporting as of December 31, 2015, based on criteria established in Internal Control—Integrated Framework issued by the Committee of Sponsoring Organizations of the Treadway Commission in 2013.
/s/ HOGANTAYLOR LLP
Tulsa, Oklahoma
March 7, 2016
ORCHIDS PAPER PRODUCTS COMPANY AND SUBSIDIARIES
CONSOLIDATED BALANCE SHEETS
(Dollars in thousands, except share and per share data)
|
As of December 31, |
||||||||
|
2015 |
2014 |
|||||||
|
ASSETS |
||||||||
|
Current assets: |
||||||||
| Cash | $ | 4,361 | $ | 1,021 | ||||
| Accounts receivable, net of allowance of $155 in 2015 and 2014 | 10,509 | 9,109 | ||||||
| Receivables from related party | 1,325 | 1,086 | ||||||
| Inventories, net | 13,501 | 9,650 | ||||||
| Income taxes receivable | 5,628 | 634 | ||||||
| Prepaid expenses | 1,136 | 1,285 | ||||||
| Other current assets | 1,853 | 899 | ||||||
| Deferred income taxes | 1,300 | 614 | ||||||
|
Total current assets |
39,613 | 24,298 | ||||||
|
Property, plant and equipment |
232,925 | 169,551 | ||||||
|
Accumulated depreciation |
(59,547 | ) | (49,831 | ) | ||||
|
Net property, plant and equipment |
173,378 | 119,720 | ||||||
|
Restricted cash |
12,005 | - | ||||||
|
VAT receivable |
1,751 | 1,734 | ||||||
|
Intangible assets, net of accumulated amortization of $2,260 in 2015 and $753 in 2014 |
15,730 | 17,237 | ||||||
|
Goodwill |
7,560 | 7,560 | ||||||
|
Deferred debt issuance costs, net of accumulated amortization of $121 in 2015 and $20 in 2014 |
1,342 | 190 | ||||||
|
Total assets |
$ | 251,379 | $ | 170,739 | ||||
|
LIABILITIES AND STOCKHOLDERS' EQUITY |
||||||||
|
Current liabilities: |
||||||||
| Bank overdrafts | $ | - | $ | 1,706 | ||||
| Accounts payable | 7,211 | 4,796 | ||||||
| Accounts payable to related party | 3,887 | 6,595 | ||||||
| Accrued liabilities | 3,880 | 3,747 | ||||||
| Current portion of long-term debt | 3,882 | 2,700 | ||||||
|
Total current liabilities |
18,860 | 19,544 | ||||||
|
Long-term debt, less current portion |
71,699 | 33,662 | ||||||
|
Other long-term liabilities |
5,098 | - | ||||||
|
Deferred income taxes |
21,939 | 17,020 | ||||||
|
Stockholders' equity: |
||||||||
| Common stock, $.001 par value, 25,000,000 shares authorized, 10,268,891 and 8,757,975 shares issued and outstanding in 2015 and 2014, respectively | 10 | 9 | ||||||
| Additional paid-in capital | 97,834 | 64,275 | ||||||
| Retained earnings | 35,939 | 36,229 | ||||||
|
Total stockholders' equity |
133,783 | 100,513 | ||||||
|
Total liabilities and stockholders' equity |
$ | 251,379 | $ | 170,739 | ||||
See notes to consolidated financial statements.
ORCHIDS PAPER PRODUCTS COMPANY AND SUBSIDIAIRES
CONSOLIDATED STATEMENTS OF INCOME
Years ended December 31, 2015, 2014 and 2013
(Dollars in thousands, except share and per share data)
|
2015 |
2014 |
2013 |
||||||||||
|
Net sales |
$ | 168,446 | $ | 142,724 | $ | 116,374 | ||||||
|
Cost of sales |
137,949 | 115,985 | 88,494 | |||||||||
|
Gross profit |
30,497 | 26,739 | 27,880 | |||||||||
|
Selling, general and administrative expenses |
9,540 | 11,675 | 9,471 | |||||||||
|
Intangibles amortization |
1,507 | 753 | - | |||||||||
|
Operating income |
19,450 | 14,311 | 18,409 | |||||||||
|
Interest expense |
521 | 271 | 371 | |||||||||
|
Other (income) expense, net |
(683 | ) | 181 | (173 | ) | |||||||
|
Income before income taxes |
19,612 | 13,859 | 18,211 | |||||||||
|
Provision for (benefit from) income taxes: |
||||||||||||
|
Current |
1,820 | 6,774 | 5,034 | |||||||||
|
Deferred |
4,235 | (2,380 | ) | (142 | ) | |||||||
| 6,055 | 4,394 | 4,892 | ||||||||||
|
Net income |
$ | 13,557 | $ | 9,465 | $ | 13,319 | ||||||
|
Net income per common share: |
||||||||||||
|
Basic |
$ | 1.39 | $ | 1.12 | $ | 1.69 | ||||||
|
Diluted |
$ | 1.38 | $ | 1.11 | $ | 1.67 | ||||||
|
Weighted average common shares used in calculating net income per common share: |
||||||||||||
|
Basic |
9,778,167 | 8,462,875 | 7,870,350 | |||||||||
|
Diluted |
9,844,221 | 8,538,752 | 7,936,948 | |||||||||
|
Dividends per share |
$ | 1.40 | $ | 1.40 | $ | 1.35 | ||||||
See notes to consolidated financial statements.
ORCHIDS PAPER PRODUCTS COMPANY AND SUBSIDIARIES
CONSOLIDATED STATEMENTS OF CHANGES IN STOCKHOLDERS' EQUITY
Years ended December 31, 2013, 2014 and 2015
(Dollars in thousands, except share amounts)
|
Common Stock |
Additional Paid-in |
Retained |
||||||||||||||||||
|
Shares |
Value |
Capital |
Earnings |
Total |
||||||||||||||||
|
Balance at December 31, 2012 |
7,642,475 | $ | 8 | $ | 41,238 | $ | 35,932 | $ | 77,178 | |||||||||||
|
Stock based compensation |
8,000 | - | 346 | - | 346 | |||||||||||||||
|
Stock options exercised |
416,334 | - | 3,305 | - | 3,305 | |||||||||||||||
|
Dividends paid to stockholders |
- | - | - | (10,708 | ) | (10,708 | ) | |||||||||||||
|
Net income |
- | - | - | 13,319 | 13,319 | |||||||||||||||
|
Excess tax benefit of stock options exercised |
- | - | 1,409 | - | 1,409 | |||||||||||||||
|
Balance at December 31, 2013 |
8,066,809 | $ | 8 | $ | 46,298 | $ | 38,543 | $ | 84,849 | |||||||||||
|
Acquisition of Fabrica assets and U.S. business |
686,083 | 1 | 15,999 | - | 16,000 | |||||||||||||||
|
Stock based compensation |
(667 | ) | - | 1,879 | - | 1,879 | ||||||||||||||
|
Stock options exercised |
5,750 | - | 79 | - | 79 | |||||||||||||||
|
Dividends paid to stockholders |
- | - | - | (11,779 | ) | (11,779 | ) | |||||||||||||
|
Net income |
- | - | - | 9,465 | 9,465 | |||||||||||||||
|
Excess tax benefit of stock options exercised |
- | - | 20 | - | 20 | |||||||||||||||
|
Balance at December 31, 2014 |
8,757,975 | $ | 9 | $ | 64,275 | $ | 36,229 | $ | 100,513 | |||||||||||
|
Stock based compensation |
(334 | ) | - | 1,048 | - | 1,048 | ||||||||||||||
|
Stock options exercised |
11,250 | - | 210 | - | 210 | |||||||||||||||
|
Net proceeds from follow-on stock offering |
1,500,000 | 1 | 32,118 | - | 32,119 | |||||||||||||||
|
Land donation |
- | - | 189 | - | 189 | |||||||||||||||
|
Dividends paid to stockholders |
- | - | - | (13,847 | ) | (13,847 | ) | |||||||||||||
|
Net income |
- | - | - | 13,557 | 13,557 | |||||||||||||||
|
Excess tax deficiency of stock options exercised |
- | - | (6 | ) | - | (6 | ) | |||||||||||||
|
Balance at December 31, 2015 |
10,268,891 | $ | 10 | $ | 97,834 | $ | 35,939 | $ | 133,783 | |||||||||||
See notes to consolidated financial statements.
ORCHIDS PAPER PRODUCTS COMPANY AND SUBSIDIARIES
CONSOLIDATED STATEMENTS OF CASH FLOWS
Years ended December 31, 2015 2014 and 2013
(Dollars in thousands)
|
2015 |
2014 |
2013 |
||||||||||
|
Cash Flows From Operating Activities |
||||||||||||
|
Net income |
$ | 13,557 | $ | 9,465 | $ | 13,319 | ||||||
|
Adjustments to reconcile net income to net cash provided by operating activities: |
||||||||||||
|
Depreciation and amortization |
11,420 | 9,749 | 7,621 | |||||||||
|
Provision for doubtful accounts |
- | 20 | 10 | |||||||||
|
Deferred income taxes |
4,235 | (2,491 | ) | (142 | ) | |||||||
|
Stock compensation expense |
1,048 | 1,879 | 346 | |||||||||
|
Loss (gain) on disposal of property, plant and equipment |
- | 8 | (146 | ) | ||||||||
|
Changes in cash due to changes in operating assets and liabilities: |
||||||||||||
|
Accounts receivable |
(1,640 | ) | (2,556 | ) | (1,189 | ) | ||||||
|
Inventories |
(3,852 | ) | 1,272 | (646 | ) | |||||||
|
Income taxes receivable |
(4,994 | ) | (634 | ) | 607 | |||||||
|
Prepaid expenses |
149 | (422 | ) | (226 | ) | |||||||
|
Other assets |
(972 | ) | (3,560 | ) | 44 | |||||||
|
Accounts payable |
(293 | ) | 7,706 | - | ||||||||
|
Accrued liabilities |
133 | (284 | ) | 1,198 | ||||||||
|
Net cash provided by operating activities |
18,791 | 20,152 | 20,796 | |||||||||
|
Cash Flows From Investing Activities |
||||||||||||
|
Acquisition of Fabrica assets and U.S. business |
- | (16,700 | ) | - | ||||||||
|
Purchases of property, plant and equipment |
(63,184 | ) | (25,769 | ) | (12,171 | ) | ||||||
|
Increase in restricted cash |
(12,005 | ) | - | - | ||||||||
|
Purchases of short-term investments |
- | (2 | ) | (8 | ) | |||||||
|
Proceeds from the sale of short-term investments |
- | 5,037 | - | |||||||||
|
Net cash used in investing activities |
(75,189 | ) | (37,434 | ) | (12,179 | ) | ||||||
|
Cash Flows From Financing Activities |
||||||||||||
|
Borrowings under long-term debt |
31,109 | 30,000 | - | |||||||||
|
Net procceds under New Market Tax Credit financing |
5,098 | - | - | |||||||||
|
Principal payments on long-term debt |
(2,700 | ) | (16,429 | ) | (1,152 | ) | ||||||
|
Net borrowings on revolving credit line |
10,810 | 7,712 | - | |||||||||
|
Bank overdrafts |
(1,706 | ) | 1,706 | - | ||||||||
|
Proceeds from follow-on stock offering |
32,119 | - | - | |||||||||
|
Dividends paid to stockholders |
(13,847 | ) | (11,781 | ) | (10,708 | ) | ||||||
|
Proceeds from the exercise of stock options |
210 | 79 | 3,305 | |||||||||
|
Excess tax benefit of stock options exercised |
(6 | ) | 20 | 1,409 | ||||||||
|
Deferred debt issuance costs |
(1,349 | ) | (209 | ) | - | |||||||
|
Net cash provided by (used in) financing activities |
59,738 | 11,098 | (7,146 | ) | ||||||||
|
Net increase (decrease) in cash |
3,340 | (6,184 | ) | 1,471 | ||||||||
|
Cash, beginning |
1,021 | 7,205 | 5,734 | |||||||||
|
Cash, ending |
$ | 4,361 | $ | 1,021 | $ | 7,205 | ||||||
|
Supplemental Disclosure: |
||||||||||||
|
Interest paid |
$ | 720 | $ | 499 | $ | 367 | ||||||
|
Income taxes paid, net |
$ | 6,722 | $ | 7,301 | $ | 2,753 | ||||||
|
Tax benefits realized from stock options exercised |
$ | 23 | $ | 16 | $ | 408 | ||||||
|
Stock issued for Fabrica assets and U.S. business |
$ | - | $ | 16,000 | $ | - | ||||||
|
Value of donated land |
$ | 189 | $ | - | $ | - | ||||||
See notes to consolidated financial statements.
ORCHIDS PAPER PRODUCTS COMPANY AND SUBSIDIARIES
NOTES TO CONSOLIDATED FINANCIAL STATEMENTS
December 31, 2015, 2014 and 2013
Note 1— Nature of Business and Summary of Significant Accounting Policies
Business
Orchids Paper Products Company and its subsidiaries (collectively, “Orchids” or the “Company”) produces bulk tissue paper, known as parent rolls, and converts parent rolls into finished products, including paper towels, bathroom tissue and paper napkins. The Company predominately sells its products for use in the "at home" market under private labels to a customer base consisting primarily of dollar stores, discount retailers and grocery stores that offer limited alternatives across a wide range of products, and, to a lesser extent, the “away from home” market. The Company has owned and operated its manufacturing facility in Pryor, Oklahoma since 1998. On June 3, 2014, the Company completed the acquisition of certain assets from Fabrica de Papel San Francisco, S.A. de C.V. (“Fabrica”) pursuant to an Asset Purchase Agreement (see Note 2). In connection with the acquisition of these assets, the Company formed three wholly-owned subsidiaries: Orchids Mexico DE Holdings, LLC, Orchids Mexico DE Member, LLC, and OPP Acquisition Mexico, S. de R.L. de C.V. (“Orchids Mexico”). In April 2015, the Company announced the construction of a new manufacturing facility in Barnwell, South Carolina. In conjunction with this project, the Company established a wholly-owned subsidiary: Orchids Paper Products Company of South Carolina. Furthermore, in connection with a New Market Tax Credit (“NMTC”) transaction in December 2015 (see Note 12), the Company created Orchids Lessor SC, LLC, another wholly-owned subsidiary.
The Company's stock trades on the NYSE MKT under the ticker symbol "TIS."
Summary of Significant Accounting Policies
Principles of consolidation
The accompanying consolidated financial statements include the accounts of Orchids Paper Products Company, its wholly-owned subsidiaries, as described above, and variable interest entities for which Orchids is the primary beneficiary. All significant intercompany transactions and balances have been eliminated in consolidation.
Cash
Cash includes cash on hand and cash in banks that management expects to utilize for operational activities.
Accounts receivable
Accounts receivable are carried at original invoice amount less an estimate made for doubtful receivables based on a review of all outstanding amounts. A trade receivable is considered to be past due if it is outstanding for more than five days past terms. Management determines the allowance for doubtful accounts by regularly evaluating individual customer receivables and considering a customer's financial condition, credit history, and current economic conditions. Receivables are written-off when deemed uncollectible. Recoveries of receivables previously written-off are recorded when received. The Company does not typically charge interest on trade receivables.
Inventories
Inventories are stated at the lower of cost or market. The Company's cost is based on standard cost, specific identification, or FIFO (first-in, first-out). Standard costs approximate actual costs on a first-in, first-out basis. Material, labor, and factory overhead necessary to produce the inventories are included in the standard cost.
Property, plant and equipment
Property, plant and equipment are stated at cost. Depreciation of property, plant and equipment is computed using the straight-line method over the estimated useful lives of the assets. The Company expenses normal maintenance and repair costs as incurred. Spare parts that are maintained to keep the Company’s machinery and equipment in working order are capitalized and expensed when used rather than depreciated. Gain and loss on disposal of property, plant and equipment is recognized in the period incurred.
ORCHIDS PAPER PRODUCTS COMPANY AND SUBSIDIARIES
NOTES TO CONSOLIDATED FINANCIAL STATEMENTS (Continued)
December 31, 2015, 2014 and 2013
Note 1—Nature of Business and Summary of Significant Accounting Policies (Continued)
Goodwill, intangible assets and long-lived assets
The Company records the excess of purchase price over the fair value of the tangible and identifiable intangible assets acquired and liabilities assumed as goodwill. Goodwill is tested for impairment annually as well as when an event, or change in circumstances, indicates that the carrying value may not be recoverable.
Under accounting principles generally accepted in the United States (“U.S. GAAP”), the Company may first assess qualitative factors to determine whether the existence of events or circumstances leads to a determination that it is more likely than not that the fair value of its reporting unit is greater than its carrying amount. If, after assessing the totality of events or circumstances, the Company determines it is more likely than not that the fair value of a reporting unit is greater than its carrying amount, there is no need to perform any further testing. However, if the Company concludes otherwise, it is required to perform the first step of a two-step impairment test by calculating the fair value of the reporting unit and comparing the fair value with the carrying amount of the reporting unit. If the fair value of the reporting unit is less than its carrying value, it is required to perform the second step of the two-step impairment test, in which an impairment loss is calculated and recorded to the extent that the implied fair value of the goodwill of the reporting unit is less than its carrying value. Alternatively, the Company may bypass the qualitative assessment in any period and proceed directly to performing the first step of the two-step goodwill impairment test.
The Company performed its initial goodwill impairment test on October 1, 2015 by performing the first step (e.g. “step zero”), a qualitative impairment test, to determine whether it was more likely than not that goodwill was impaired. Goodwill is tested at a level of reporting referred to as the “reporting unit”. The Company has two reporting units, which are defined as the “at home” business and the “away from home” business. Based on this qualitative test, we determined it was more likely than not that the fair value of the Company’s reporting units were greater than their carrying amounts; as such, we determined that performing the second and third steps of the impairment test were not necessary and that goodwill was not impaired.
Intangible assets consist of the Supply Agreement and Equipment Lease Agreements with Fabrica (see Note 2), licenses, trademarks, customer relationships and a non-compete agreement. The Company amortizes these assets on a straight-line basis over the expected lives of the assets, which range from 2 to 20 years.
The Company reviews its long-lived assets, primarily property, plant and equipment and intangible assets, for impairment whenever events or changes in circumstances indicate that the carrying values may not be recoverable. Impairment evaluation is based on estimates of remaining useful lives and the current and expected future profitability and cash flows. The determination of future profitability and cash flows require significant estimates to be made by the Company’s management. The Company had no impairment of long-lived assets during the years ended December 31, 2015, 2014 or 2013.
Income taxes
Income taxes are computed in accordance with the tax rules and regulations of the taxing authorities where the income is earned. Deferred income taxes are computed using the liability method and are provided on all temporary differences between the financial basis and the tax basis of the Company's assets and liabilities. Future tax benefits are recognized to the extent that realization of those benefits is considered to be more likely than not. A valuation allowance is provided for deferred tax assets for which realization is not likely. The Company uses the flow through method to account for Oklahoma investment tax credits earned on eligible capital expenditures in the State of Oklahoma. Under this method, the investment tax credits are recognized as a reduction to income tax expense.
Deferred debt issuance costs
Costs incurred in obtaining debt funding are deferred and amortized on an effective interest method over the terms of the loans. Amortization expense for 2015, 2014 and 2013 was $198,000, $60,000, and $7,000, respectively, and has been classified as interest expense in the statement of income.
ORCHIDS PAPER PRODUCTS COMPANY AND SUBSIDIARIES
NOTES TO CONSOLIDATED FINANCIAL STATEMENTS (Continued)
December 31, 2015, 2014 and 2013
Note 1—Nature of Business and Summary of Significant Accounting Policies (Continued)
Stock compensation expense
Grant-date cost of stock options and restricted stock are recognized on a straight-line basis over the requisite service periods of the respective options and shares, based on the fair value of the award on the grant date. The fair value of stock options that have time-based vesting requirements is estimated using the Black-Scholes option pricing model. The fair value of stock options that have market-based vesting requirements is estimated using a Monte-Carlo option pricing model. The fair value of restricted stock awards is calculated as the arithmetic mean of the high and low market price of the Company’s stock on the grant date.
Excess tax benefits related to share-based compensation that are available to absorb future tax deficiencies related to share-based compensation are recorded in additional paid-in capital ("APIC pool") when realized. If the amount of tax deficiencies is greater than the available APIC pool, the excess is recorded as current income tax expense in the statement of income.
Revenue recognition
Revenues for products loaded on customer trailers are recognized when the customer has accepted custody and left the Company's dock. Revenues for products shipped to customers are recognized when title passes upon shipment. Customer discounts and pricing allowances are included in net sales.
Shipping and handling costs
Shipping and handling costs incurred to ship raw materials to the Company's facilities are included in inventory and cost of sales in the statement of income. Shipping and handling costs incurred to ship finished goods to customer locations and warehouse locations are included in cost of sales in the statement of income.
Advertising costs
Advertising costs, which include costs related to artwork and packaging development, totaled approximately $319,000, $292,000, and $618,000, respectively, for the years ended December 31, 2015, 2014 and 2013. These costs are expensed when incurred and included in selling, general and administrative expenses.
Use of estimates
The preparation of financial statements in conformity with accounting principles generally accepted in the United States of America requires management to make estimates and assumptions that affect the amounts reported in the financial statements and accompanying notes. Actual results could differ from those estimates.
Reclassifications
Certain immaterial prior period amounts in the accompanying financial statements have been reclassified to conform to the current period presentation. These reclassifications did not affect previously reported amounts of net income.
New accounting pronouncements
In May 2014, the FASB issued Accounting Standards Update 2014-09, “Revenue from Contracts with Customers” (“ASU 2014-09”). ASU 2014-09 clarifies the principles for recognizing revenue and develops a common revenue standard under U.S. GAAP under which an entity should recognize revenue to depict the transfer of promised goods or services to customers in an amount that reflects the consideration to which the entity expects to be entitled in exchange for those goods or services. Due to the issuance of Accounting Standards Update 2015-14, “Revenue from Contracts with Customers – Deferral of the Effective Date” (“ASU 2015-14), in July 2015, the effective date of ASU 2014-09 was deferred for one year and becomes effective for the Company for interim and annual periods beginning on or after December 15, 2017. Management is currently assessing the impact ASU 2014-09 will have on the Company, but it is not expected to have a material effect on the Company’s financial position, results of operations or cash flows.
ORCHIDS PAPER PRODUCTS COMPANY AND SUBSIDIARIES
NOTES TO CONSOLIDATED FINANCIAL STATEMENTS (Continued)
December 31, 2015, 2014 and 2013
Note 1—Nature of Business and Summary of Significant Accounting Policies (Continued)
In April 2015, the FASB issued Accounting Standards Update 2015-03, “Interest – Imputation of Interest: Simplifying the Presentation of Debt Issuance Costs” (“ASU 2015-03”). ASU 2015-03 requires that debt issuance costs related to a recognized debt liability be presented in the balance sheet as a direct deduction from the carrying amount of that debt liability, consistent with debt discounts. ASU 2015-03 is effective for annual and interim periods beginning after December 15, 2015. This standard is not expected to have a material effect on the Company’s financial position, results of operations or cash flows, as it simply requires a change in presentation and does not affect the recognition and measurement guidance for debt issuance costs.
In April 2015, the FASB issued Accounting Standards Update 2015-05, “Intangibles – Goodwill and Other – Internal-Use Software – Customer’s Accounting for Fees Paid in a Cloud Computing Arrangement” (“ASU 2015-05”). ASU 2015-05 provides guidance to customers about whether a cloud computing arrangement includes a software license. If a cloud computing arrangement includes a software license, then the customer should account for the software license element of the arrangement consistent with the acquisition of other software licenses. If a cloud computing arrangement does not include a software license, the customer should account for the arrangement as a service contract. The guidance does not change the accounting for a customer’s service contracts. ASU 2015-05 is effective for annual and interim periods beginning after December 15, 2015. Management is currently assessing the impact ASU 2015-05 on the Company, but it is not expected to have a material effect on the Company’s financial position, results of operations or cash flows.
In July 2015, the FASB issued Accounting Standards Update 2015-11, “Inventory – Simplifying the Measurement of Inventory” (“ASU 2015-11”). ASU 2015-11 requires inventory measured using all methods other than the last-in, first-out (LIFO) or retail methods to be measured at the lower of cost or net realizable value. Net realizable value is defined as the estimated selling price in the ordinary course of business less reasonably predictable costs of completion, disposal and transportation. ASU 2015-11 is effective for public companies for annual and interim periods beginning after December 15, 2016. Management is currently assessing the impact ASU 2015-11 will have, if any, on the Company’s financial position, results of operations and cash flows.
In August 2015, the FASB issued Accounting Standards Update 2015-15, “Interest – Imputation of Interest: Presentation and Subsequent Measurement of Debt Issuance Costs Associated with Line-of-Credit Arrangements” (“ASU 2015-15”). ASU 2015-15 states that since ASU 2015-03, as discussed above, does not address presentation or subsequent measurement of debt issuance costs related to line-of-credit arrangements, the SEC staff will not object to an entity deferring and presenting debt issuance costs as an asset and subsequently amortizing the deferred debt issuance costs ratably over the term of the line-of-credit arrangement, regardless of whether there are any outstanding borrowings on the line-of-credit arrangement. Management is currently assessing the impact ASU 2015-15 will have, if any, on the Company’s financial position, results of operations and cash flows.
In November 2015, the FASB issued Accounting Standards Update 2015-17, “Income Taxes: Balance Sheet Classification of Deferred Taxes” (“ASU 2015-17”). ASU 2015-18 requires that deferred tax liabilities and assets be classified as noncurrent in a classified statement of financial position. ASU 2015-17 is effective for public companies for annual and interim periods beginning after December 15, 2016. Management is currently assessing the impact ASU 2015-17 will have, if any, on the Company’s financial position, results of operations and cash flows. However, this standard is not expected to have a material impact on the Company’s results of operations or cash flows, as it simply requires a change in presentation of deferred tax assets and liabilities and does not affect the recognition and measurement guidance for deferred tax assets and liabilities, nor does this change affect any of the Company’s financial covenants under its current credit facility.
In January 2016, the FASB issued Accounting Standards Update 2016-01, “Financial Instruments – Overall: Recognition and Measurement of Financial Assets and Financial Liabilities” (“ASU 2016-01”). ASU 2016-01 addresses certain aspects of recognition, measurement, presentation and disclosure of financial instruments, specifically equity investments and financial instruments measured at amortized cost. Management is currently assessing the impact ASU 2016-01 will have, if any, on the Company’s financial position, results of operations and cash flows.
Note 2 —Fabrica Transaction
On May 5, 2014, Orchids Paper Products Company and its wholly owned subsidiary, Orchids Mexico, entered into an asset purchase agreement (“APA”) with Fabrica to acquire certain assets and 100% of the U.S. business of Fabrica. On June 3, 2014, the Company closed on the transaction set forth in the APA, and in connection therewith, entered into a supply agreement (“Supply Agreement”) and an equipment lease agreement (“Equipment Lease Agreement”) (collectively, the “Fabrica Transaction”). Orchids expects the Fabrica Transaction to allow the Company to effectively and efficiently service customers in the western United States.
ORCHIDS PAPER PRODUCTS COMPANY AND SUBSIDIARIES
NOTES TO CONSOLIDATED FINANCIAL STATEMENTS (Continued)
December 31, 2015, 2014 and 2013
Note 2 —Fabrica Transaction (Continued)
Asset Purchase Agreement and Assignment and Assumption of Supply Agreement
Pursuant to the terms of the APA, Orchids Mexico acquired a paper machine, two converting lines, Fabrica’s U.S. customer list, exclusive rights to all of Fabrica’s trademarks in the United States, and Fabrica’s covenant not to compete in the United States. The purchase price consisted of 411,650 shares of Orchids’ common stock, which were valued at $12.0 million based on the closing price of the Company’s shares on the closing date and had a fair market value of $9.6 million on the closing date due to restrictions on the sale of the stock. In connection with closing the APA, Orchids Paper Products Company also entered into an Assignment and Assumption of Supply Agreement with Elgin Finance & Investment Corp. (“Elgin”) for $16.7 million in cash and 274,433 shares of Orchids’ common stock, which were valued at $8.0 million based on the closing price of the Company’s shares on the closing date and had a fair market value of $6.4 million on the closing date due to restrictions on the sale of the stock, in exchange for the assignment to Orchids of Elgin’s supply agreement with Fabrica which provided Elgin exclusive supply rights with respect to Fabrica’s U.S. business.
Under the Supply Agreement, the Company has the right to purchase from Fabrica up to 19,800 tons of parent rolls and equivalent converting capacity for certain specified product during each twelve month period following the effective date of the Supply Agreement. The Company may purchase up to an additional 7,700 tons annually in each of the first two years of the agreement. Pursuant to the terms of the Supply Agreement, Fabrica and its affiliates will be subject to a non-compete provision with respect to business in the U. S. The Supply Agreement has an initial term of twenty years. In the event of a termination of the Supply Agreement due to (i) a material breach as a result of intentional, willful or grossly negligent conduct by Fabrica, (ii) a breach of Fabrica’s covenant not to compete, or (iii) a voluntary filing of bankruptcy by Fabrica, Fabrica must pay the Company $100 million in liquidated damages. In the event of a change of control of Fabrica, the Company will have a two year right to terminate the Supply Agreement, and in such event, Fabrica would be required to pay the Company liquidated damages of $36.7 million.
Equipment Lease Agreement
Pursuant to the terms of the Equipment Lease Agreement, Orchids Mexico will lease the paper making and converting assets acquired under the APA back to Fabrica. The rental fee will be based upon the number of metric tons shipped by Fabrica to the Company, subject to annual adjustment based on the calculation of the purchase price for product under the Supply Agreement. The Equipment Lease Agreement has a term of twenty years, but will terminate automatically upon termination of the Supply Agreement.
Upon the earlier of (i) the termination of the Equipment Lease Agreement or (ii) the purchase by Orchids of a separate paper making or converting asset and the entry into of an equipment lease agreement between Orchids and Fabrica with respect to such purchased asset, Orchids Mexico shall have the right to sell to Fabrica the paper assets leased under the Equipment Lease Agreement on an as-is-where-is basis, for $12.0 million.
Purchase Price Allocation
The acquisition of Fabrica’s U.S. business in the Fabrica Transaction is being accounted for under the Financial Accounting Standards Board’s (the “FASB”) Accounting Standards Codification 805, “Business Combinations”. The $32.7 million purchase price of $16.7 million in cash (financed by a term loan) and $16.0 million in common stock was allocated as follows (in thousands):
|
Total purchase price |
$ | 32,700 | ||
|
Less: net assets acquired |
||||
|
Machinery & Equipment |
7,150 | |||
|
Intangible Asset - Supply and Equipment Lease Agreements |
12,800 | |||
|
Intangible Asset - Licenses/Trademarks |
1,350 | |||
|
Intangible Asset - Non-Compete Agreement |
1,150 | |||
|
Intangible Asset - Customer Relationships |
2,690 | |||
|
Goodwill |
$ | 7,560 |
ORCHIDS PAPER PRODUCTS COMPANY AND SUBSIDIARIES
NOTES TO CONSOLIDATED FINANCIAL STATEMENTS (Continued)
December 31, 2015, 2014 and 2013
Note 2 —Fabrica Transaction (Continued)
Intangibles and goodwill
Intangible assets at December 31, 2015 were:
|
Life (in years) |
Gross Carrying Amount |
Accumulated Amortization |
Net Carrying Value |
|||||||||||||
|
(in thousands) |
||||||||||||||||
|
Intangible Asset - Supply and Equipment Lease Agreements |
20 | $ | 12,800 | $ | 960 | $ | 11,840 | |||||||||
|
Intangible Asset - Licenses/Trademarks |
20 | 1,350 | 101 | 1,249 | ||||||||||||
|
Intangible Asset - Non-Compete Agreement |
2 | 1,150 | 863 | 287 | ||||||||||||
|
Intangible Asset - Customer Relationships |
12 | 2,690 | 336 | 2,354 | ||||||||||||
| $ | 17,990 | $ | 2,260 | $ | 15,730 | |||||||||||
Intangible assets at December 31, 2014 were:
|
Life (in years) |
Gross Carrying Amount |
Accumulated Amortization |
Net Carrying Value |
|||||||||||||
|
(in thousands) |
||||||||||||||||
|
Intangible Asset - Supply and Equipment Lease Agreements |
20 | $ | 12,800 | $ | 320 | $ | 12,480 | |||||||||
|
Intangible Asset - Licenses/Trademarks |
20 | 1,350 | 34 | 1,316 | ||||||||||||
|
Intangible Asset - Non-Compete Agreement |
2 | 1,150 | 287 | 863 | ||||||||||||
|
Intangible Asset - Customer Relationships |
12 | 2,690 | 112 | 2,578 | ||||||||||||
| $ | 17,990 | $ | 753 | $ | 17,237 | |||||||||||
Estimated future intangible amortization expense is $1.2 million in 2016, and $0.9 million in 2017, 2018, 2019, and 2020, respectively.
There were no changes to the $7.6 million carrying amount of goodwill recognized from the Fabrica Transaction during 2014 or 2015. No goodwill impairment was recorded in 2014 or 2015.
Goodwill of $7.6 million represents the premium the Company was willing to pay to enter into a long-term relationship with Fabrica and the benefits the Company expects to receive from being able to cost effectively serve its current customers and to develop relationships with new customers with distribution centers in the western United States. The relationship with Fabrica is expected to provide opportunities for future production capacity and sales growth. Goodwill is not amortized, but is tested at least annually for impairment, or if circumstances occur that more likely than not will reduce the fair value of the reporting unit to below its carrying amount. No goodwill impairment has been recorded as of December 31, 2015. There were no other changes in the carrying amount of goodwill subsequent to the acquisition. All of the goodwill related to the Fabrica Transaction is expected to be tax-deductible.
Operating Results of Business Acquired
The consolidated statements of income include the following revenues and operating income related to the U.S. business acquired from Fabrica:
|
Year Ended December 31, |
||||||||
|
2015 |
2014 |
|||||||
|
(in thousands) |
||||||||
|
Revenues |
$ | 46,316 | $ | 25,498 | ||||
|
Operating income |
$ | 10,569 | $ | 4,896 | ||||
Operating income included in the above table does not include an allocation of any of the Company’s overhead or selling, general and administrative expenses.
Transaction costs of $1,572,000 related to the Fabrica Transaction are recognized in selling, general and administrative expenses in the consolidated statement of income for the year ended December 31, 2014.
ORCHIDS PAPER PRODUCTS COMPANY AND SUBSIDIARIES
NOTES TO CONSOLIDATED FINANCIAL STATEMENTS (Continued)
December 31, 2015, 2014 and 2013
Note 2 —Fabrica Transaction (Continued)
Pro Forma Information (unaudited)
The following unaudited pro forma information presents a summary of the operating results of the Company for the year ended December 31, 2014 and 2013 as if the U.S. business acquired from Fabrica had been included in the Company’s results of operations as of January 1, 2013:
|
Year Ended December 31, |
||||||||
|
2014 |
2013 |
|||||||
|
(in thousands) (unaudited) |
||||||||
|
Pro forma net sales |
$ | 156,886 | $ | 142,213 | ||||
|
Pro forma net income |
$ | 11,537 | $ | 12,575 | ||||
|
Pro forma net income per share - basic |
$ | 1.32 | $ | 1.47 | ||||
|
Pro forma net income per share - diluted |
$ | 1.31 | $ | 1.46 | ||||
Pro forma adjustments to net income include amortization costs related to the intangibles acquired, acquisition related costs, and the tax effect of the historical results of operations of Fabrica’s U.S. business, excluding certain mark-up and selling, general and administrative costs that will not be incurred by Orchids.
The pro forma amounts are presented for informational purposes only and are not intended to represent or be indicative of the Company’s consolidated results of operations or financial condition that would have been reported had the acquisition been completed as of the beginning of the periods presented and should not be taken as indicative of the Company’s future consolidated results of operations or financial condition.
Related party transactions
The Company incurred the following transactions with Fabrica during the years ended December 31, 2015 and 2014:
|
2015 |
2014 |
|||||||
|
(in thousands) |
||||||||
|
Products purchased under the Supply Agreement |
$ | 37,373 | $ | 22,726 | ||||
|
Amounts billed to Fabrica under the Equipment Lease Agreement |
$ | 2,172 | $ | 1,912 | ||||
|
Parent rolls purchased by Fabrica |
$ | 6,119 | $ | - | ||||
ORCHIDS PAPER PRODUCTS COMPANY AND SUBSIDIARIES
NOTES TO CONSOLIDATED FINANCIAL STATEMENTS (Continued)
December 31, 2015, 2014 and 2013
Note 3—Fair Value Measurements
The valuation hierarchy included in U.S. GAAP considers the transparency of inputs used to value assets and liabilities as of the measurement date. The less transparent or observable the inputs used to value assets and liabilities, the lower the classification of the assets and liabilities in the valuation hierarchy. A financial instrument's classification within the valuation hierarchy is based on the lowest level of input that is significant to its fair value measurement. The three levels of the valuation hierarchy and the classification of the Company's financial assets and liabilities within the hierarchy are as follows:
Level 1—Quoted prices (unadjusted) in active markets for identical assets or liabilities that the reporting entity has the ability to access at the measurement date.
Level 2—Observable inputs other than quoted prices included within Level 1 for the asset or liability, either directly or indirectly. If an asset or liability has a specified term, a Level 2 input must be observable for substantially the full term of the asset or liability.
Level 3—Unobservable inputs for the asset or liability.
The Company does not report any assets or liabilities at fair value in the financial statements. However, the fair value of the Company's long-term debt is estimated by management to approximate the carrying value of $75,581,000 and $36,362,000 at December 31, 2015 and 2014, respectively. Management's estimates are based on periodic comparisons of the characteristics of the Company's obligations, including floating interest rates, credit rating, maturity and collateral, to current market conditions as stated by an independent third-party financial institution. Such valuation inputs are considered a Level 2 measurement in the fair value valuation hierarchy.
As the Company has no assets or liabilities reported at fair value in the financial statements, there were no transfers among Level 1, Level 2 or Level 3 assets during the years ended December 31, 2015, 2014 and 2013.
Note 4—Commitments and Contingencies
The Company may be involved from time to time in litigation arising from the normal course of business. In management's opinion, as of the date of this report, the Company is not engaged in legal proceedings which individually or in the aggregate are expected to have a materially adverse effect on the Company's results of operations or financial condition.
Gas purchase commitments
In October 2008, the Company entered into a contract to purchase 334,000 MMBTU per year of natural gas. This contract has been extended through December 2016. In September 2014, the Company entered into a similar contract with a different vendor for natural gas requirements in 2017. These contracts provide for approximately 70% to 80% of the Company's natural gas requirements through December 31, 2017. Commitments under these contracts are as follows:
|
Period |
MMBTUs |
Price per MMBTU |
Management fee per MMBTU |
|||||||||||
| January 2016 | - |
March 2016 |
95,900 | $ | 4.53 | $ | 0.07 | |||||||
| April 2016 | - |
June 2016 |
93,600 | $ | 4.17 | $ | 0.07 | |||||||
| July 2016 | - |
September 2016 |
92,300 | $ | 4.26 | $ | 0.07 | |||||||
| October 2016 | - |
December 2016 |
91,900 | $ | 4.42 | $ | 0.07 | |||||||
| January 2017 | - |
December 2017 |
467,505 | $ | 4.06 | $ | - | |||||||
Purchases under the gas contract were $1.7 million, $1.9 million, and $1.9 million in 2015, 2014 and 2013, respectively. If the Company is unable to purchase the contracted amounts and the market price at that time is less than the contracted price, the Company would be obligated under the terms of the agreements to reimburse an amount equal to the difference between the contracted amount and the amount actually purchased, multiplied by the difference between the contract price and a price designated in the contract (approximates spot price).
ORCHIDS PAPER PRODUCTS COMPANY AND SUBSIDIARIES
NOTES TO CONSOLIDATED FINANCIAL STATEMENTS (Continued)
December 31, 2015, 2014 and 2013
Note 4—Commitments and Contingencies (Continued)
Other purchase commitments
In April 2015, Orchids announced projects to build a new integrated paper converting facility in Barnwell, South Carolina. This project has a total estimated cost of approximately $136.0 million. As part of this project, the Company entered into significant purchase orders for two converting lines and construction of a paper machine. As of December 31, 2015, obligations under these purchase orders totaled $53.5 million.
Note 5—Inventories
Inventories at December 31 were:
|
2015 |
2014 |
|||||||
|
(in thousands) |
||||||||
|
Raw materials |
$ | 4,467 | $ | 4,392 | ||||
|
Bulk paper rolls |
3,789 | 861 | ||||||
|
Converted finished goods |
5,386 | 4,595 | ||||||
|
Inventory valuation reserve |
(141 | ) | (198 | ) | ||||
| $ | 13,501 | $ | 9,650 | |||||
Note 6—Property, Plant and Equipment
The principal categories and estimated useful lives of property, plant and equipment at December 31 were:
|
2015 |
2014 |
Estimated Useful Lives |
|||||||||||
|
(in thousands) |
|||||||||||||
|
Land |
$ | 1,316 | $ | 1,119 | - | ||||||||
|
Buildings and improvements |
24,321 | 23,190 | 7 | to | 40 | ||||||||
|
Machinery and equipment |
141,811 | 107,251 | 2.5 | to | 40 | ||||||||
|
Vehicles |
1,796 | 1,489 | 3 | to | 5 | ||||||||
|
Nondepreciable machinery and equipment (parts and spares) |
10,250 | 9,121 | - | ||||||||||
|
Construction-in-process |
53,431 | 27,381 | - | ||||||||||
| $ | 232,925 | $ | 169,551 | ||||||||||
For the year ended December 31, 2014, other (income) expense includes $400,000 of expenses related to the demolition of two paper machines in the Company’s paper mill, which were replaced with a new paper machine. For the year ended December 31, 2013, other (income) expense includes a gain of approximately $146,000 due to the disposal of a piece of equipment used in the Company’s paper mill operation.
ORCHIDS PAPER PRODUCTS COMPANY AND SUBSIDIARIES
NOTES TO CONSOLIDATED FINANCIAL STATEMENTS (Continued)
December 31, 2015, 2014 and 2013
Note 7—Long-Term Debt and Revolving Line of Credit
In June 2015, the Company entered into the Second Amended and Restated Credit Agreement (the “Credit Agreement”), with U.S. Bank National Association (“U.S. Bank”) consisting of the following:
|
● |
a $25.0 million revolving credit line due June 2020; |
| ● |
a $47.3 million Term Loan with a 5-year term due June 2020 and payable in quarterly installments of $675,000 through June 2016 and $1.0 million per quarter thereafter; |
| ● |
a $115.0 million delayed draw term loan with a 2-year draw period due June 2020 and payable in quarterly installments beginning in September 2017 of 1.5% of the June 30, 2017 outstanding balance; and |
| ● |
an accordion feature allowing the revolving credit line and/or delayed draw commitment under the Credit Agreement to be increased by up to $50.0 million at any time on or before the expiration date of the Credit Agreement. |
The Credit Agreement has the effect of (i) combining the Company’s existing $20 million revolving line of credit designated for the purchase and construction of a paper machine and converting line in Pryor, Oklahoma and $27.3 million currently outstanding under the Company’s existing term loan into a $47.3 million term loan, (ii) increasing the delayed draw facility from $40 million to $115 million, (iii) extending the maturity of the delayed draw facility from August 2015 to June 2020, and (iv) adding a $50 million accordion feature. Proceeds from the delayed draw term loan must be utilized solely to finance the purchase and installation of new equipment and construction at the Company’s Barnwell, South Carolina facility.
In December 2015, in connection with the NMTC transaction (see Note 12), the maximum borrowing capacity under the delayed draw term loan was reduced from $115.0 million to $99.6 million.
Under the terms of the Credit Agreement, amounts outstanding will bear interest at a variable rate of LIBOR plus a specified margin, or the base rate plus a specified margin, at the Company’s option. The specified margin is based on the Company’s quarterly Leverage Ratio, as defined in the Credit Agreement. The following table outlines the specified margins and the commitment fees payable under the Credit Agreement:
|
Leverage Ratio |
LIBOR Margin |
Base Margin |
Commitment Fee |
|||||||||
|
Less than 1.00 |
1.25 | % | 0.00 | % | 0.15 | % | ||||||
|
Greater than or equal to 1.00 but less than 2.00 |
1.50 | % | 0.00 | % | 0.20 | % | ||||||
|
Greater than or equal to 2.00 but less than 3.00 |
1.75 | % | 0.00 | % | 0.25 | % | ||||||
|
Greater than or equal to 3.00 but less than 3.50 |
2.25 | % | 0.00 | % | 0.30 | % | ||||||
|
Greater than or equal to 3.50 |
2.50 | % | 0.25 | % | 0.35 | % | ||||||
Additionally, in connection with the NMTC transaction discussed in Note 12, the Company entered into an $11.1 million term loan with U.S. Bank. This loan bears interest at a fixed rate of 4.4% and matures on December 29, 2022. The loan requires quarterly payments of principal and interest of approximately $255,000, beginning on March 29, 2016, with a balloon payment due on the maturity date.
As of December 31, 2015, the Company’s weighted-average interest rate was 2.17%.
ORCHIDS PAPER PRODUCTS COMPANY AND SUBSIDIARIES
NOTES TO CONSOLIDATED FINANCIAL STATEMENTS (Continued)
December 31, 2015, 2014 and 2013
Note 7—Long-Term Debt and Revolving Line of Credit (Continued)
Long-term debt at December 31 consists of:
|
December 31, 2015 |
December 31, 2014 |
|||||||
|
(in thousands) |
||||||||
|
Revolving line of credit, maturing on June 3, 2019 |
$ | - | $ | 7,712 | ||||
|
Delayed draw term loan, maturing on June 25, 2020 |
18,522 | - | ||||||
|
Term Loan, maturing on June 3, 2020, due in quarterly installments of $675,000 for the first two years and $1,000,000 thereafter, excluding interest paid separately |
- | 28,650 | ||||||
|
Term Loan, maturing on June 25, 2020, due in quarterly installments of $675,000 for the first year and $1,000,000 thereafter, excluding interest paid separately |
45,950 | - | ||||||
|
Term Loan, maturing on December 29, 2022, due in quarterly installments of $255,006, including interest |
11,109 | - | ||||||
| $ | 75,581 | $ | 36,362 | |||||
|
Less current portion |
3,882 | 2,700 | ||||||
| $ | 71,699 | $ | 33,662 | |||||
The annual maturities of long-term debt at December 31, 2015, are as follows:
|
Year |
Annual Payment Amount |
|||
|
(in thousands) |
||||
|
2016 |
$ | 3,882 | ||
|
2017 |
4,696 | |||
|
2018 |
4,861 | |||
|
2019 |
4,887 | |||
|
2020 |
49,063 | |||
|
after 2020 |
8,192 | |||
| $ | 75,581 | |||
The amount available under the revolving credit line may be reduced in the event that the Company's borrowing base, which is based upon qualified receivables and qualified inventory is less than $25.0 million. As of December 31, 2015, the Company’s borrowing base was $14.8 million, including $8.3 million of eligible accounts receivable and $6.5 million of eligible inventory.
Obligations under the Credit Agreement and the NMTC loan are secured by substantially all of the Company's assets. The Credit Agreement contains representations and warranties, and affirmative and negative covenants customary for financings of this type, including, but not limited to, limitations on additional borrowings, additional investments and asset sales. The financial covenants, which are tested as of the end of each fiscal quarter, require the Company to maintain the following specific ratios: fixed charge coverage (minimum of 1.20 to 1.0) and leverage (maximum of 4.00 to 1.0 through June 2017; maximum of 3.75 to 1.0 on September 30, 2017; maximum of 3.50 to 1.0 on December 31, 2017 and thereafter). The Company has the right to prepay borrowings under the Credit Agreement at any time without penalty.
The Company’s leverage ratio at December 31, 2015 was 2.33, while the fixed charge coverage ratio was 1.99.
ORCHIDS PAPER PRODUCTS COMPANY AND SUBSIDIARIES
NOTES TO CONSOLIDATED FINANCIAL STATEMENTS (Continued)
December 31, 2015, 2014 and 2013
Note 8—Income Taxes
The Company is subject to income tax in the United States and Mexico. Income from continuing operations before taxes subject to United States and foreign income taxes for each of the three years ended December 31, were as follows:
|
Year ended December 31, |
||||||||||||
|
2015 |
2014 |
2013 |
||||||||||
|
(in thousands) |
||||||||||||
|
United States |
$ | 17,902 | $ | 12,169 | $ | 18,211 | ||||||
|
Foreign |
1,710 | 1,690 | - | |||||||||
|
Total income before income taxes |
$ | 19,612 | $ | 13,859 | $ | 18,211 | ||||||
The components of the provision for income taxes for each of the three years ended December 31, were as follows:
|
Year ended December 31, |
||||||||||||
|
2015 |
2014 |
2013 |
||||||||||
|
(in thousands) |
||||||||||||
|
Current: |
||||||||||||
|
U.S. Federal |
$ | 1,945 | $ | 6,086 | $ | 5,034 | ||||||
|
U.S. State |
(224 | ) | 224 | - | ||||||||
|
Foreign |
99 | 464 | - | |||||||||
| 1,820 | 6,774 | 5,034 | ||||||||||
|
Deferred: |
||||||||||||
|
U.S. Federal |
3,930 | (3,404 | ) | (142 | ) | |||||||
|
U.S. State |
- | 981 | - | |||||||||
|
Foreign |
305 | 43 | - | |||||||||
| 4,235 | (2,380 | ) | (142 | ) | ||||||||
|
Total provision for (benefit from) income taxes |
$ | 6,055 | $ | 4,394 | $ | 4,892 | ||||||
ORCHIDS PAPER PRODUCTS COMPANY AND SUBSIDIARIES
NOTES TO CONSOLIDATED FINANCIAL STATEMENTS (Continued)
December 31, 2015, 2014 and 2013
Note 8—Income Taxes (Continued)
Significant components of the Company's deferred income tax assets and liabilities at December 31 were:
|
2015 |
2014 |
|||||||
|
(in thousands) |
||||||||
|
Deferred income taxes – current |
||||||||
|
Inventories |
$ | 1,168 | $ | 478 | ||||
|
Prepaid expenses |
(163 | ) | (127 | ) | ||||
|
Accrued vacation |
219 | 181 | ||||||
|
Bad debt provision |
54 | 54 | ||||||
|
Other |
22 | 28 | ||||||
|
Deferred income tax assets – current |
$ | 1,300 | $ | 614 | ||||
|
Deferred income taxes – noncurrent |
||||||||
|
Plant and equipment |
$ | (25,552 | ) | $ | (20,397 | ) | ||
|
State investment tax credit carryforward |
2,415 | 2,412 | ||||||
|
Stock-based compensation |
1,241 | 932 | ||||||
|
Intangible assets |
(103 | ) | (30 | ) | ||||
|
Other |
60 | 63 | ||||||
|
Deferred income tax liabilities – noncurrent |
$ | (21,939 | ) | $ | (17,020 | ) | ||
The following table summarizes the differences between the U.S. federal statutory rate and the Company's effective tax rate for financial statement purposes:
|
Year ended December 31, |
||||||||||||
|
2015 |
2014 |
2013 |
||||||||||
|
Statutory tax rate |
35.0 | % | 35.0 | % | 34.0 | % | ||||||
|
State income taxes, net of U.S. federal tax benefit |
3.3 | % | 7.9 | % | 2.2 | % | ||||||
|
Indian employment credits |
(1.2 | %) | (0.9 | %) | (1.9 | %) | ||||||
|
Employee and board stock compensation |
0.1 | % | (0.1 | %) | (2.3 | %) | ||||||
|
State investment tax credits |
(5.5 | %) | (0.9 | %) | (3.3 | %) | ||||||
|
Section 199 manufacturing deduction |
(1.5 | %) | (2.6 | %) | (2.2 | %) | ||||||
|
Change in estimates on deferred taxes |
- | (10.4 | %) | - | ||||||||
|
Foreign income taxes, net of U.S. federal tax credits |
0.6 | % | 0.3 | % | - | |||||||
|
Acquisition costs |
- | 2.4 | % | - | ||||||||
|
Other |
0.1 | % | 1.0 | % | 0.4 | % | ||||||
| 30.9 | % | 31.7 | % | 26.9 | % | |||||||
For the year ended December 31, 2015, the effective tax rate was lower than the statutory rate primarily due to Oklahoma Investment Tax Credits (“OITC”) associated with investments in the Company’s manufacturing operations in Pryor, Oklahoma, manufacturing tax deductions and Federal Indian Employment Credits (“IEC”).
ORCHIDS PAPER PRODUCTS COMPANY AND SUBSIDIARIES
NOTES TO CONSOLIDATED FINANCIAL STATEMENTS (Continued)
December 31, 2015, 2014 and 2013
Note 8—Income Taxes (Continued)
For the year ended December 31, 2014, the effective tax rate was lower than the statutory rate primarily due to a change in estimate recognized in 2014, as the Company believes certain deferred tax liabilities will be recognized at amounts and rates other than previously estimated. The effective tax rate for 2014 was also lowered by manufacturing tax deductions and OITC associated with investments in the Company’s manufacturing operations in Pryor, Oklahoma. Additionally, in 2014, Orchids began recording current and deferred income taxes in the state of California and the country of Mexico due to impacts of the Fabrica Transaction (see Note 2). Taxes related to California increased the Company’s effective tax rate by approximately 3.1%. The Company’s earnings in Mexico are subject to the country’s 30% income tax rate. The net effect of foreign taxes was not material to the Company’s effective tax rate due to U.S. income tax credits related to foreign-sourced income.
The Company has significant carryforwards for the State of Oklahoma which includes an Oklahoma Investment Tax Credit of $2.4 million primarily associated with the Company's $36 million investment in a new paper machine in 2006, a $20 million investment in a new converting line in 2010, an $8.3 million investment in a new converting line in 2015, and a $26 million investment in another new paper machine in 2015. The Company believes that its future state taxable income will be sufficient to allow realization before the Oklahoma Investment Tax Credit expires in varying amounts from 2027 through 2035. Accordingly, deferred tax assets have been recognized for this credit.
The U.S. tax code requires that certain types of income produced by non-U.S. subsidiaries be currently taxed without regard to actual distribution (Subpart F income). Income earned by Orchids Mexico meets the definition of Subpart F income. As a result, U.S. current and deferred federal income tax has been recorded on these earnings. Upon remittance of these earnings, no significant incremental U.S. tax is expected.
Based upon a review of its income tax filing positions, the Company believes that its positions would be sustained upon an audit and does not anticipate any adjustments that would result in a material change to its financial position. The Company recognizes interest related to income taxes as interest expense and penalties as selling, general and administrative expenses. The tax years 2012 through 2015 remain open to examination by major taxing jurisdictions in which the Company files income tax returns.
ORCHIDS PAPER PRODUCTS COMPANY AND SUBSIDIARIES
NOTES TO CONSOLIDATED FINANCIAL STATEMENTS (Continued)
December 31, 2015, 2014 and 2013
Note 9—Earnings per Share
During the first quarter of 2013, the Company granted restricted stock to certain employees. These awards include a nonforfeitable right to receive dividends and therefore are considered to participate in undistributed earnings with common shareholders. Therefore, the Company calculates basic and diluted earnings per common share using the two-class method, under which net earnings are allocated to each class of common stock and participating security. The computation of basic and diluted net income per common share for the years ended December 31, 2015, 2014 and 2013, is as follows:
|
Year ended December 31, |
||||||||||||
|
2015 |
2014 |
2013 |
||||||||||
|
Net income - ($ thousands) |
$ | 13,557 | $ | 9,465 | $ | 13,319 | ||||||
|
Less: distributed earnings allocable to participating securities |
(3 | ) | (7 | ) | (11 | ) | ||||||
|
Less: undistributed earnings allocable to participating securities |
- | 1 | (4 | ) | ||||||||
|
Distributed and undistributed earnings allocable to common shareholders |
$ | 13,554 | $ | 9,459 | $ | 13,304 | ||||||
|
Weighted average shares outstanding |
9,778,167 | 8,462,875 | 7,870,350 | |||||||||
|
Effect of stock options |
66,054 | 75,877 | 66,598 | |||||||||
|
Weighted average shares outstanding - assuming dilution |
9,844,221 | 8,538,752 | 7,936,948 | |||||||||
|
Net income per common share: |
||||||||||||
|
Basic |
$ | 1.39 | $ | 1.12 | $ | 1.69 | ||||||
|
Diluted |
$ | 1.38 | $ | 1.11 | $ | 1.67 | ||||||
|
Stock options not considered above because they were anti-dilutive |
598,000 | 555,000 | - | |||||||||
Note 10—Stock Incentives
In April 2014, the Orchids Paper Products Company 2014 Stock Incentive Plan (the “2014 Plan”) was approved. The 2014 Plan replaced the Orchids Paper Products Company 2005 Stock Incentive Plan (the “2005 Plan”) and provides for the granting of stock options and other stock based awards to employees and Board members selected by the Board's compensation committee. The Company's policy is to issue shares of remaining authorized common stock to satisfy option exercises under the 2014 Plan. A total of 400,000 shares may be issued pursuant to the 2014 Plan. As of December 31, 2015, there were 223,400 shares available for issuance under the 2014 Plan. The exercise price of each option is generally equal to the arithmetic mean of the high and low sales price per share of the Company's common stock on the grant date. Options granted to Board members under the Plan generally vest immediately. Options granted to employees generally vest over a service period of 2 to 5 years or are market-based and vest when the share price of the Company’s common stock closes at or above a certain percentage of the purchase price of the option for three consecutive business days. Options granted with market-based vesting expire if they remain unvested five years after the grant date. Options granted under the 2014 Plan have a 10-year life.
Stock options with time-based vesting conditions
The Company uses the Black-Scholes option valuation model to estimate the grant date fair value of stock options issued with time-based vesting conditions, as this model was developed for use in estimating the fair value of traded options which have no vesting restrictions and are fully transferable. Option valuation models require the input of highly subjective assumptions including the expected stock price volatility. Estimated volatility is calculated based on actual historical volatility of the Company's common stock from the Company's initial public offering date to the grant date. The Company's dividend yield assumption is based on the expected dividend yield as of the grant date. Expected life is calculated based on the simplified method for "plain vanilla" options, due to limited available exercise information. The Company expenses the cost of these options granted over the vesting period of the option based on the grant-date fair value of the award.
ORCHIDS PAPER PRODUCTS COMPANY AND SUBSIDIARIES
NOTES TO CONSOLIDATED FINANCIAL STATEMENTS (Continued)
December 31, 2015, 2014 and 2013
Note 10—Stock Incentives (Continued)
The following table details the options granted to certain members of the board of directors and management that were valued using the Black-Scholes valuation model and the assumptions used in the Black-Scholes option valuation model for those grants during 2013, 2014 and 2015:
|
Grant Date |
Number of Shares |
Exercise Price |
Grant Date Fair Value |
Risk-Free Interest Rate |
Estimated Volatility |
Dividend Yield |
Expected Life (in years) |
|||||||||||||||||||||
|
February-13 |
3,750 | $ | 21.695 | $ | 5.68 | 2.02 | % | 43 | % | 4.61 | % | 5 | ||||||||||||||||
|
May-13 |
40,000 | $ | 22.95 | $ | 5.28 | 1.87 | % | 43 | % | 5.88 | % | 5 | ||||||||||||||||
|
May-14 |
35,000 | $ | 29.65 | $ | 7.50 | 2.62 | % | 41 | % | 4.72 | % | 5 | ||||||||||||||||
|
June-14 |
5,000 | $ | 30.09 | $ | 7.67 | 2.63 | % | 41 | % | 4.65 | % | 5 | ||||||||||||||||
|
May-15 |
40,000 | $ | 22.485 | $ | 4.64 | 2.13 | % | 40 | % | 6.23 | % | 5 | ||||||||||||||||
|
November-15 |
68,000 | $ | 29.575 | $ | 7.37 | 2.32 | % | 40 | % | 4.73 | % | 5 | ||||||||||||||||
In 2015, 3,750 of time-based options granted in 2005 expired unexercised.
Stock options with market-based vesting conditions
The Company uses a Monte Carlo option valuation model to estimate the grant date fair value of stock options issued with market-based vesting conditions, as these options include a market condition. Option valuation models require the input of highly subjective assumptions including the expected stock price volatility, dividend yield and expected life of the option. Estimated volatility is calculated based on a mix of historical and implied volatility during the expected life of the options. Historical volatility is considered since the Company’s initial public offering and implied volatility is based on the publicly traded options of a three company peer group within the paper industry. The Company's dividend yield assumption is based on the Company’s average historical dividend yield and current dividend yield as of the grant date. Expected life is calculated based on the average of the service period and the contractual term of the option, using the simplified method for "plain vanilla" options. The Company expenses the cost of these options granted over the implicit, or derived, service period of the option based on the completed Monte Carlo models.
During 2014 and 2015, the Board of Directors granted options to purchase 145,000 and 28,600 shares, respectively, of the Company’s common stock to certain members of management. These options will become exercisable in four equal tranches, if at all, if and when the share price of the Company’s common stock closes at or above a certain percentage of the purchase price of the option for three consecutive business days, in accordance with the following vesting schedule:
|
Share price required to achieve vesting |
2014 options |
2015 options |
||||||
|
Tranche 1 |
$ | 34.788 | $ | 29.560 | ||||
|
Tranche 2 |
$ | 42.350 | $ | 36.000 | ||||
|
Tranche 3 |
$ | 51.425 | $ | 43.710 | ||||
|
Tranche 4 |
$ | 60.500 | $ | 51.430 | ||||
ORCHIDS PAPER PRODUCTS COMPANY AND SUBSIDIARIES
NOTES TO CONSOLIDATED FINANCIAL STATEMENTS (Continued)
December 31, 2015, 2014 and 2013
Note 10—Stock Incentives (Continued)
Any unvested portion of the options shall expire five years from the date of grant and the options shall terminate ten years after the date of grant. The following table details the options granted to certain members of management that were valued using the Monte Carlo valuation model and the assumptions used in the valuation model for those grants during 2014 and 2015:
|
Grant Date |
Number of Shares |
Exercise Price |
Grant Date Fair Value |
Risk-Free Interest Rate |
Estimated Volatility |
Dividend Yield |
Expected Life (years) |
Derived Service Period (years) |
||||||||||||||||||||||||||
|
January 14 |
- | Tranche 1 | 10,000 | $ | 31.125 | $ | 5.64 | 1.98 | % | 31 | % | 4.50 | % | 5.15 | 0.31 | |||||||||||||||||||
|
January 14 |
- | Tranche 2 | 10,000 | $ | 31.125 | $ | 5.46 | 1.98 | % | 31 | % | 4.50 | % | 5.58 | 1.15 | |||||||||||||||||||
|
January 14 |
- | Tranche 3 | 10,000 | $ | 31.125 | $ | 5.03 | 1.98 | % | 31 | % | 4.50 | % | 5.97 | 1.94 | |||||||||||||||||||
|
January 14 |
- | Tranche 4 | 10,000 | $ | 31.125 | $ | 4.27 | 1.98 | % | 31 | % | 4.50 | % | 6.25 | 2.50 | |||||||||||||||||||
|
February 14 |
- | Tranche 1 | 25,000 | $ | 30.88 | $ | 5.51 | 1.98 | % | 31 | % | 4.60 | % | 5.17 | 0.35 | |||||||||||||||||||
|
February 14 |
- | Tranche 2 | 25,000 | $ | 30.88 | $ | 5.35 | 1.98 | % | 31 | % | 4.60 | % | 5.60 | 1.19 | |||||||||||||||||||
|
February 14 |
- | Tranche 3 | 25,000 | $ | 30.88 | $ | 4.88 | 1.98 | % | 31 | % | 4.60 | % | 5.99 | 1.98 | |||||||||||||||||||
|
February 14 |
- | Tranche 4 | 25,000 | $ | 30.88 | $ | 4.15 | 1.98 | % | 31 | % | 4.60 | % | 6.27 | 2.54 | |||||||||||||||||||
|
May 14 |
- | Tranche 1 | 1,250 | $ | 28.185 | $ | 5.06 | 2.03 | % | 31 | % | 4.70 | % | 5.36 | 0.71 | |||||||||||||||||||
|
May 14 |
- | Tranche 2 | 1,250 | $ | 28.185 | $ | 4.74 | 2.03 | % | 31 | % | 4.70 | % | 5.78 | 1.56 | |||||||||||||||||||
|
May 14 |
- | Tranche 3 | 1,250 | $ | 28.185 | $ | 4.02 | 2.03 | % | 31 | % | 4.70 | % | 6.14 | 2.29 | |||||||||||||||||||
|
May 14 |
- | Tranche 4 | 1,250 | $ | 28.185 | $ | 3.29 | 2.03 | % | 31 | % | 4.70 | % | 6.39 | 2.79 | |||||||||||||||||||
|
September 15 |
- | Tranche 1 | 7,150 | $ | 25.24 | $ | 4.44 | 1.82 | % | 34 | % | 5.20 | % | 5.20 | 0.40 | |||||||||||||||||||
|
September 15 |
- | Tranche 2 | 7,150 | $ | 25.24 | $ | 3.92 | 1.82 | % | 34 | % | 5.20 | % | 5.51 | 1.02 | |||||||||||||||||||
|
September 15 |
- | Tranche 3 | 7,150 | $ | 25.24 | $ | 3.11 | 1.82 | % | 34 | % | 5.20 | % | 5.77 | 1.54 | |||||||||||||||||||
|
September 15 |
- | Tranche 4 | 7,150 | $ | 25.24 | $ | 2.36 | 1.82 | % | 34 | % | 5.20 | % | 5.93 | 1.87 | |||||||||||||||||||
In 2014, none of these options vested, as the share price of the Company’s common stock did not reach any of the share prices required for vesting. Additionally, 25,000 of the options that were granted in January 2014 were forfeited when an employee left the Company. In 2015, Tranche 1 of the options granted in September 2015, or 7,150 options, vested when the share price of the Company’s common stock closed above $29.56 for three consecutive business days. Additionally, 25,000 of the options that were granted in February 2014 and the 5,000 options granted in May 2014 were forfeited when employees left the Company.
ORCHIDS PAPER PRODUCTS COMPANY AND SUBSIDIARIES
NOTES TO CONSOLIDATED FINANCIAL STATEMENTS (Continued)
December 31, 2015, 2014 and 2013
Note 10—Stock Incentives (Continued)
Stock options issued outside of the 2014 Plan
In April 2014, the Company’s stockholders voted to approve the options granted to Mr. Jeffrey S. Schoen, the Company’s President and Chief Executive Officer, on November 8, 2013. Upon his appointment as an officer of the Company, Mr. Schoen was granted an option to purchase up to 400,000 shares of the common stock of the Company at a purchase price of $30.25 per share. The option will become exercisable, if at all, if and when the share price of the Company’s common stock closes at or above a certain percentage of the purchase price of the option for three consecutive business days, in accordance with the following vesting schedule:
|
Share price closes at or above the following percentage of the purchase price for the Option |
Number of shares that become vested |
|||||
|
115% (share price $34.788) |
100,000 | |||||
|
140% (share price $42.35) |
100,000 | |||||
|
170% (share price $51.425) |
100,000 | |||||
|
200% (share price $60.50) |
100,000 | |||||
These options were granted outside of the 2005 Plan and the 2014 Plan. Any unvested portion of the option shall expire five years from the date of grant and the option shall terminate ten years after the date of grant. The Company used a Monte Carlo option valuation model to estimate the grant date fair value of each tranche of 100,000 options, as they include a market condition. Assumptions used in the valuation model were the same as those for the stock options with market-based vesting conditions issued to employees, which are noted above. The Company expenses the cost of these options granted over the implicit service period of the option based on the completed Monte Carlo models. The following table details the assumption used in the valuation model for the options granted to Mr. Schoen:
|
Number of Shares |
Exercise Price |
Grant Date Fair Value |
Risk-Free Interest Rate |
Estimated Volatility |
Dividend Yield |
Expected Life (years) |
Derived Service Period (years) |
|||||||||||||||||||||||||
|
Tranche 1 |
100,000 | $ | 30.25 | $ | 5.18 | 2.10 | % | 30 | % | 4.60 | % | 4.99 | 0.40 | |||||||||||||||||||
|
Tranche 2 |
100,000 | $ | 30.25 | $ | 5.04 | 2.10 | % | 30 | % | 4.60 | % | 5.42 | 1.25 | |||||||||||||||||||
|
Tranche 3 |
100,000 | $ | 30.25 | $ | 4.31 | 2.10 | % | 30 | % | 4.60 | % | 5.79 | 2.00 | |||||||||||||||||||
|
Tranche 4 |
100,000 | $ | 30.25 | $ | 3.50 | 2.10 | % | 30 | % | 4.60 | % | 6.04 | 2.50 | |||||||||||||||||||
Total option expense
The Company recognized the following expenses related to all options granted during 2015, 2014 and 2013 under the 2005 Plan, the 2014 Plan and the Schoen options:
|
2015 |
2014 |
2013 |
||||||||||
|
Time-Based Vesting Options |
$ | 298,000 | $ | 308,000 | $ | 293,000 | ||||||
|
Market-Based Vesting Options |
705,000 | 1,520,000 | - | |||||||||
|
Total compensation expense related to stock options |
$ | 1,003,000 | $ | 1,828,000 | $ | 293,000 | ||||||
ORCHIDS PAPER PRODUCTS COMPANY AND SUBSIDIARIES
NOTES TO CONSOLIDATED FINANCIAL STATEMENTS (Continued)
December 31, 2015, 2014 and 2013
Note 10—Stock Incentives (Continued)
Future expected market-based stock option expense
The grant of options that vest based on a market condition have had a material effect and will have a lesser effect on the Company’s results of operations in 2016. Based on the derived service periods of the options, the Company expects to expense the compensation cost related to these options as shown in the following table. However, if the market condition is achieved for any tranche of these options prior to the end of the derived service period, all remaining expense related to that tranche would be recognized in the period in which the market condition is achieved.
|
2015 |
2015 |
2016 |
2017 |
|||||||||||||||||||||||||
|
Q1 |
Q2 |
Q3 |
Q4 |
Total |
Total |
Total |
||||||||||||||||||||||
|
(in thousands) |
||||||||||||||||||||||||||||
|
Tranche 1 |
$ | - | $ | - | $ | - | $ | 26 | $ | 26 | $ | 5 | $ | - | ||||||||||||||
|
Tranche 2 |
134 | 104 | 1 | 5 | 244 | 19 | $ | - | ||||||||||||||||||||
|
Tranche 3 |
73 | 72 | 47 | 71 | 263 | 71 | $ | 3 | ||||||||||||||||||||
|
Tranche 4 |
47 | 48 | 30 | 47 | 172 | 137 | $ | 5 | ||||||||||||||||||||
|
Total expense |
$ | 254 | $ | 224 | $ | 78 | $ | 149 | $ | 705 | $ | 232 | $ | 8 | ||||||||||||||
Summary of option activity
The following tables summarize activity related to options granted under the 2005 Plan, the 2014 Plan and the Schoen options:
|
Number |
Weighted Average Exercise Price |
Weighted Average Remaining Contractual Life (in years) |
Aggregate Intrinsic Value |
|||||||||||||
|
Balance, December 31, 2012 |
558,250 | $ | 9.63 | |||||||||||||
|
Granted |
43,750 | $ | 22.84 | |||||||||||||
|
Exercised |
(416,334 | ) | $ | 7.94 | ||||||||||||
|
Forfeited |
(5,666 | ) | $ | 18.77 | ||||||||||||
|
Balance, December 31, 2013 |
180,000 | $ | 16.46 | |||||||||||||
|
Granted |
585,000 | $ | 30.36 | |||||||||||||
|
Exercised |
(5,750 | ) | $ | 13.80 | ||||||||||||
|
Forfeited |
(25,000 | ) | $ | 31.125 | ||||||||||||
|
Balance, December 31, 2014 |
734,250 | $ | 27.06 | |||||||||||||
|
Granted |
136,600 | $ | 26.59 | |||||||||||||
|
Exercised |
(11,250 | ) | $ | 18.64 | ||||||||||||
|
Forfeited/Expired |
(33,750 | ) | $ | 27.775 | ||||||||||||
|
Balance, December 31, 2015 |
825,850 | $ | 27.07 | 7.97 | $ | 3,186,379 | ||||||||||
|
Exercisable at December 31, 2015 |
260,000 | $ | 20.46 | 6.79 | $ | 2,720,375 | ||||||||||
|
For the year ended December 31, |
||||||||||||
|
2015 |
2014 |
2013 |
||||||||||
|
Fair value of options vested |
$ | 321,358 | $ | 344,040 | $ | 342,868 | ||||||
|
Weighted average grant-date fair value of granted options |
$ | 5.75 | $ | 4.83 | $ | 5.31 | ||||||
|
Aggregate intrinsic value of exercised options |
$ | 49,938 | $ | 102,657 | $ | 7,565,711 | ||||||
ORCHIDS PAPER PRODUCTS COMPANY AND SUBSIDIARIES
NOTES TO CONSOLIDATED FINANCIAL STATEMENTS (Continued)
December 31, 2015, 2014 and 2013
Note 10—Stock Incentives (Continued)
Following is a summary of nonvested shares under the 2014 Plan as of December 31, 2015 and changes during the year then ended:
|
Number |
Weighted Average Grant-Date Fair Value |
|||||||
|
Balance, December 31, 2014 |
521,000 | $ | 4.61 | |||||
|
Granted |
136,600 | $ | 5.75 | |||||
|
Vested |
(61,750 | ) | $ | 5.20 | ||||
|
Forfeited |
(30,000 | ) | $ | 4.86 | ||||
|
Balance, December 31, 2014 |
565,850 | $ | 4.81 | |||||
The following table summarizes options outstanding and exercisable under the 2005 Plan, the 2014 Plan and the Schoen options as of December 31, 2015:
|
Options Outstanding |
Options Exercisable |
||||||||||||||||||||||
|
Exercise price range |
Number |
Weighted Average Exercise Price |
Weighted Average Remaining Contractual Life (in years) |
Number |
Weighted Average Exercise Price |
||||||||||||||||||
| $5.18 | - | $7.48 | 15,000 | $ | 6.33 | 1.96 | 15,000 | $ | 6.33 | ||||||||||||||
| $8.58 | - | $12.50 | 20,750 | $ | 11.39 | 4.70 | 20,750 | $ | 11.39 | ||||||||||||||
| $13.84 | - | $17.85 | 79,750 | $ | 16.52 | 4.99 | 79,750 | $ | 16.52 | ||||||||||||||
| $21.695 | - | $31.125 | 710,350 | $ | 29.14 | 8.53 | 144,500 | $ | 25.40 | ||||||||||||||
| 825,850 | 260,000 | ||||||||||||||||||||||
As of December 31, 2015, there was $393,000 of unrecognized compensation expense related to non-vested stock options with a time-based vesting condition for options granted in 2015, 2014 and 2013. This cost is expected to be recognized on a straight-line basis over a weighted average period of 2.9 years. At December 31, 2015, there was $235,000 of unrecognized compensation expense related to non-vested stock options with a market-based vesting condition for options granted in 2015 and 2014. This cost is expected to be recognized on a straight-line basis for each tranche of options granted over a weighted average period of 0.5 years.
During the years ended December 31, 2015, 2014 and 2013, the Company received $210,000, $79,000, and $3,305,000, respectively, in proceeds from the exercise of stock options. The Company realized $23,000, $16,000, and $408,000 of tax benefits related to stock option exercises during the years ended December 31, 2015, 2014 and 2013, respectively. Excess tax benefits related to stock option exercises are recorded to additional-paid in capital ("APIC pool") when realized and may be used to offset future tax deficiencies. During the years ended December 31, 2015, 2014 and 2013, the Company recorded excess tax (deficiencies) benefits of ($6,000), $20,000, and $1,409,000, respectively. As of December 31, 2015, the Company’s APIC pool was $1.8 million.
Restricted stock
In February 2013, the Company granted 16,000 shares of restricted stock to certain employees under the 2005 Plan. These awards were valued at the arithmetic mean of the high and low market price of the Company's stock on the grant date, which was $21.695 per share, and vest ratably over a three year period beginning on the first anniversary of the grant date. The Company expenses the cost of restricted stock granted over the vesting period of the shares based on the grant-date fair value of the award. The Company recognized expense of $44,000, $51,000 and $53,000 during 2015, 2014 and 2013, respectively, related to the shares granted under the 2005 Plan.
ORCHIDS PAPER PRODUCTS COMPANY AND SUBSIDIARIES
NOTES TO CONSOLIDATED FINANCIAL STATEMENTS (Continued)
December 31, 2015, 2014 and 2013
Note 10—Stock Incentives (Continued)
The following tables summarize activity related to unvested restricted stock granted under the 2005 Plan as of December 31, 2015 and for the year then ended:
|
Number |
Weighted Average Grant-Date Fair Value |
|||||||
|
Balance, December 31, 2014 |
4,667 | $ | 21.695 | |||||
|
Granted |
- | - | ||||||
|
Vested |
(2,333 | ) | $ | 21.695 | ||||
|
Forfeited |
(334 | ) | $ | 21.695 | ||||
|
Balance, December 31, 2015 |
2,000 | $ | 21.695 | |||||
|
For the year ended December 31, |
||||||||
|
2015 |
2014 |
|||||||
|
Fair value of shares vested |
$ | 63,481 | $ | 57,839 | ||||
|
Weighted average grant-date fair value of granted shares |
$ | - | $ | - | ||||
No shares of restricted stock were granted in the years ending December 31, 2015 or 2014.
Note 11—Major Customers and Concentration of Credit Risk
Major customers
The Company sells its paper production in the form of parent rolls and converted products. Revenues from converted product sales and parent roll sales in the years ended December 31, 2015, 2014 and 2013 were:
|
2015 |
2014 |
2013 |
||||||||||
|
(in thousands) |
||||||||||||
|
Converted product net sales |
$ | 161,052 | $ | 138,382 | $ | 109,611 | ||||||
|
Parent roll net sales |
7,394 | 4,342 | 6,763 | |||||||||
|
Total net sales |
$ | 168,446 | $ | 142,724 | $ | 116,374 | ||||||
Credit risk for the Company was concentrated in the following customers who each comprised more than 10% of the Company's total sales during the years ended December 31, 2015, 2014 and 2013:
|
2015 |
2014 |
2013 |
||||||||||
|
Converted product customer 1 |
34 | % | 40 | % | 51 | % | ||||||
|
Converted product customer 2 |
15 | % | 12 | % | * | |||||||
|
Converted product customer 3 |
12 | % | 11 | % | 11 | % | ||||||
|
Total percent of net sales |
61 | % | 63 | % | 62 | % | ||||||
*Customer did not account for more than 10% of sales during the period indicated.
ORCHIDS PAPER PRODUCTS COMPANY AND SUBSIDIARIES
NOTES TO CONSOLIDATED FINANCIAL STATEMENTS (Continued)
December 31, 2015, 2014 and 2013
Note 11—Major Customers and Concentration of Credit Risk (Continued)
At December 31, 2015 and 2014, the three significant customers accounted for the following amounts of the Company's accounts receivable (in thousands):
|
2015 |
2014 |
|||||||||||||||
|
Converted product customer 1 |
$ | 3,434 | 32 | % | $ | 2,634 | 28 | % | ||||||||
|
Converted product customer 2 |
$ | 931 | 9 | % | $ | 813 | 9 | % | ||||||||
|
Converted product customer 3 |
$ | 2,071 | 19 | % | $ | 1,410 | 15 | % | ||||||||
|
Total of accounts receivable |
$ | 6,436 | 60 | % | $ | 4,857 | 52 | % | ||||||||
No other customers of the Company accounted for more than 10% of sales during these periods. The Company generally does not require collateral from its customers and has not incurred any significant losses on uncollectible accounts receivable.
Paper supply agreement
On February 20, 2008, the Company signed an exclusive supply agreement with Dixie Pulp and Paper, Inc. to supply all of its recycled fiber needs. This agreement was effective beginning April 1, 2008 and carried an initial five-year term through April 1, 2013. However, the agreement automatically renews for successive one-year periods unless either party gives 90 days' notice. As of the date of this report, the Company has not received notice of intention not to renew the agreement nor has the Company provided such a notice to the counterparty, and the agreement is in effect.
Cash in excess of insured limits
Much of the Company's cash is maintained at financial institutions which are insured by the Federal Deposit Insurance Corporation ("FDIC") up to $250,000 per depositor at each financial institution. At times, balances may exceed these federally insured limits or may be contained in foreign bank accounts, which are not insured by the FDIC. The Company has never experienced any losses related to these accounts. At December 31, 2015, the Company had approximately $12.6 million of non-interest bearing cash balances in excess of federally insured limits. Additionally, $3.5 million of the Company’s cash was in bank accounts in Mexico, which are not insured by the FDIC.
Note 12—New Market Tax Credit
In December 2015, the Company received approximately $5.1 million in net proceeds from financing agreements related to capital expenditures at its Barnwell, South Carolina facility. This financing arrangement was structured with a third party financial institution (the “NMTC Investor”) associated with U.S. Bank, an investment fund, and two community development entities (the “CDEs”) majority owned by the investment fund. This transaction was designed to qualify under the federal New Market Tax Credit (“NMTC”) program, pursuant to Section 45D of the Internal Revenue Code of 1986, as amended. Through this transaction, the Company has secured low interest financing and the potential for future debt forgiveness related to the South Carolina facility. Upon closing of the NMTC transaction, the Company provided an aggregate of approximately $11.1 million, which was borrowed from U.S. Bank, to the investment fund, in the form of a loan receivable, with a term of 25 years, bearing an interest rate of 1.0% per annum. This $11.1 million in proceeds plus $5.1 million of net capital from the NMTC Investor were contributed to and used by the CDEs to make loans in the aggregate of $16.2 million to a subsidiary of the Company, Orchids Lessor SC, LLC (“Orchids Lessor”). These loans bear interest at a fixed rate of 1.275%. Orchids Lessor is using the loan proceeds to partially fund $18.0 million of the Company’s capital assets associated with the Barnwell facility. These capital assets will serve as collateral to the financing arrangement. This transaction also includes a put/call feature whereby, at the end of a seven-year compliance period, we may be obligated or entitled to repurchase the NMTC Investor’s interest in the investment fund. The value attributable to the put price is nominal. Consequently, if exercised, the put could result in the forgiveness of the NMTC Investor’s interest in the investment fund, and result in a net non-operating gain of up to $5.1 million. The call price will be valued at the net present value of the cash flows of the lease inherent in the transaction.
ORCHIDS PAPER PRODUCTS COMPANY AND SUBSIDIARIES
NOTES TO CONSOLIDATED FINANCIAL STATEMENTS (Continued)
December 31, 2015, 2014 and 2013
Note 12—New Market Tax Credit (Continued)
The NMTC Investor is subject to 100% recapture of the New Market Tax Credits it receives for a period of seven years as provided in the Internal Revenue Code and applicable U.S. Treasury regulations. The Company is required to be in compliance with various regulations and contractual provisions that apply to the New Market Tax Credit arrangement. Noncompliance with applicable requirements could result in the NMTC Investor’s projected tax benefits not being realized and, therefore, require the Company to indemnify the NMTC Investor for any loss or recapture of New Market Tax Credits related to the financing until such time as the recapture provisions have expired under the applicable statute of limitations. The Company does not anticipate any credit recapture will be required in connection with this financing arrangement.
The investment fund and the community development entities are considered Variable Interest Entities (VIEs) and the Company is the primary beneficiary of the VIEs. This conclusion was reached based on the following:
| ● |
|
The ongoing activities of the VIEs—collecting and remitting interest and fees and NMTC compliance—were all considered in the initial design and are not expected to significantly affect performance throughout the life of the VIE; | |
| ● |
|
Contractual arrangements obligate the Company to comply with NMTC rules and regulations and provide various other guarantees to the NMTC Investor and community development entities; |
| ● |
|
The NMTC Investor lacks a material interest in the underling economics of the project; and | |
| ● |
|
The Company is obligated to absorb losses of the VIEs. |
Because the Company is the primary beneficiary of the VIEs, they have been included in the consolidated financial statements. There are no other assets, liabilities or transactions in these VIEs outside of the financing transactions executed as part of the NMTC transaction.
At December 31, 2015, the NMTC Investor’s interest of $5.1 million is recorded in other long-term liabilities on the consolidated balance sheet, while the $11.1 million borrowed from U.S. Bank to loan to the investment fund is recorded in long-term debt, net of the current portion. The Company incurred approximately $357,000 of debt issuance costs related to the above transactions, which are being amortized over the life of the agreements. Unspent proceeds from the arrangement of approximately $12.0 million, which are obligated for funding the specified capital assets at the Barnwell facility, are included in restricted cash.
Note 13—ODFA Pooled Financing
In September 2014, the Company entered into an agreement with the Oklahoma Development Finance Authority (“ODFA”) whereby the ODFA agreed to provide the Company up to $3.5 million to fund a portion of the cost of a new paper production line before September 1, 2020. The agreement provides for the Oklahoma state withholding payroll taxes withheld by the Company from its employees to be placed into the Community Economic Development Pooled Finance Revolving Fund – Orchids Paper Products (“Revolving Fund”). Each year on September 1, beginning in 2015 and ending in 2020, the ODFA will return these state withholding taxes in the Revolving Fund to the Company, up to an amount totaling $3.5 million. These amounts are recognized as a note receivable in other current assets in the consolidated balance sheet and in other income in the consolidated statements of income as they are withheld from employees. As of December 31, 2015 and 2014, the Company had a note receivable of $328,000 and $213,000, respectively, related to amounts due under the ODFA pooled financing agreement. The Company recognized income of $685,000 and $213,000 in 2015 and 2014, respectively, related to this agreement.
Note 14—Employee Incentive Bonus and Retirement Plans
The Company sponsors three separate defined contribution plans covering substantially all employees. Company contributions are based on either a percentage of participant contributions or as required by collective bargaining agreements. Participants immediately vest in Company contributions to each of the three plans. Contributions to the plans by the Company were $579,000, $496,000, and $558,000, for the years ended December 31, 2015, 2014 and 2013, respectively.
ORCHIDS PAPER PRODUCTS COMPANY AND SUBSIDIARIES
NOTES TO CONSOLIDATED FINANCIAL STATEMENTS (Continued)
December 31, 2015, 2014 and 2013
Note 15—Selected Quarterly Financial Data (Unaudited)
|
2015 |
||||||||||||||||
|
First Quarter |
Second Quarter |
Third Quarter |
Fourth Quarter |
|||||||||||||
|
(in thousands, except per share data) |
||||||||||||||||
|
Sales |
$ | 37,415 | $ | 42,295 | $ | 46,832 | $ | 41,904 | ||||||||
|
Gross Profit |
$ | 4,786 | $ | 7,719 | $ | 9,845 | $ | 8,147 | ||||||||
|
Operating Income |
$ | 1,912 | $ | 5,102 | $ | 7,032 | $ | 5,404 | ||||||||
|
Net Income |
$ | 1,236 | $ | 3,878 | $ | 4,742 | $ | 3,701 | ||||||||
|
Basic Earnings per common share |
$ | 0.14 | $ | 0.40 | $ | 0.46 | $ | 0.36 | ||||||||
|
Diluted Earnings per common share |
$ | 0.14 | $ | 0.39 | $ | 0.45 | $ | 0.36 | ||||||||
|
Dividends per share |
$ | 0.35 | $ | 0.35 | $ | 0.35 | $ | 0.35 | ||||||||
|
Price per common share |
||||||||||||||||
|
High |
$ | 29.01 | $ | 26.32 | $ | 27.27 | $ | 32.10 | ||||||||
|
Low |
$ | 25.35 | $ | 21.49 | $ | 22.86 | $ | 26.07 | ||||||||
|
2014 |
||||||||||||||||
|
First Quarter |
Second Quarter |
Third Quarter |
Fourth Quarter |
|||||||||||||
|
(in thousands, except per share data) |
||||||||||||||||
|
Sales |
$ | 27,759 | $ | 29,196 | $ | 44,429 | $ | 41,340 | ||||||||
|
Gross Profit |
$ | 6,018 | $ | 5,490 | $ | 8,784 | $ | 6,447 | ||||||||
|
Operating Income |
$ | 3,839 | $ | 975 | $ | 5,921 | $ | 3,576 | ||||||||
|
Net Income |
$ | 2,643 | $ | 546 | $ | 3,830 | $ | 2,446 | ||||||||
|
Basic Earnings per common share |
$ | 0.33 | $ | 0.07 | $ | 0.44 | $ | 0.28 | ||||||||
|
Diluted Earnings per common share |
$ | 0.32 | $ | 0.07 | $ | 0.44 | $ | 0.28 | ||||||||
|
Dividends per share |
$ | 0.35 | $ | 0.35 | $ | 0.35 | $ | 0.35 | ||||||||
|
Price per common share |
||||||||||||||||
|
High |
$ | 33.97 | $ | 32.04 | $ | 32.67 | $ | 29.90 | ||||||||
|
Low |
$ | 27.72 | $ | 26.53 | $ | 24.56 | $ | 23.22 | ||||||||
Note 16—Follow-On Stock Offering and Registration of Securities
In April 2015, the Company completed an underwritten public follow-on offering of 1,500,000 shares of its common stock at $23.00 per share. The underwriters were granted an option to purchase up to an additional 225,000 shares for a period of 30 days, which was not exercised. Net proceeds to the Company were $32.1 million, after giving effect to expenses incurred related to the offering.
On September 16, 2015, the Company’s shelf Registration Statement on Form S-3 (the “Registration Statement”) was declared effective by the Securities and Exchange Commission. Pursuant to the Registration Statement, the Company, from time to time, may sell common stock, warrants or units comprised of the other securities described in the Registration Statement, in a single or multiple offerings up to a total dollar amount of $50,000,000, at prices and terms that will be determined at the time of the offering.
The Company’s willingness and ability to raise capital pursuant to the Registration Statement will depend upon a number of circumstances, including, without limitation, the Company’s need for additional capital to fund operations, organic growth or acquisitions, the Company’s financial and operating performance and the receptiveness of the capital markets to potential offerings by the Company. As of the date of this report, the Company does not have any agreements with respect to the issuance of securities pursuant to the Registration Statement.
Note 17—Subsequent Events
Dividend
On February 3, 2016, the Board of Directors authorized a quarterly cash dividend of $0.35 per outstanding share of the Company’s common stock. The Company paid this dividend on March 1, 2016 to stockholders of record at the close of business on February 16, 2016.
Item 9. CHANGES IN AND DISAGREEMENTS WITH ACCOUNTANTS ON ACCOUNTING AND FINANCIAL DISCLOSURE
None.
Item 9A. CONTROLS AND PROCEDURES
|
(a) |
Evaluation of Disclosure Controls and Procedures: |
We maintain "disclosure controls and procedures," as such term is defined in Rule 13a-15(e) under the Securities Exchange Act of 1934 (the "Exchange Act"), that are designed to ensure that information required to be disclosed in reports we file or submit under the Exchange Act is recorded, processed, summarized and reported within the time periods specified in Securities and Exchange Commission rules and forms, and that such information is collected and communicated to management, including our Chief Executive Officer and Chief Financial Officer, as appropriate, to allow timely decisions regarding required disclosure. In designing and evaluating our disclosure controls and procedures, management recognizes that no matter how well conceived and operated, disclosure controls and procedures can provide only reasonable, not absolute, assurance that the objectives of the disclosure controls and procedures are met. Our disclosure controls and procedures have been designed, and management believes that they meet, reasonable assurance standards. Based on their evaluation as of the end of the period covered by this Annual Report on Form 10-K, the Chief Executive Officer and the Chief Financial Officer have concluded that, subject to the limitations noted above, our disclosure controls and procedures were effective.
|
(b) |
Management's Report on Internal Control Over Financial Reporting |
The management of Orchids Paper Products Company is responsible for establishing and maintaining adequate internal control over financial reporting. Our internal control system was designed to provide reasonable assurance to our management and board of directors regarding the preparation and fair presentation of published financial statements.
All internal control systems, no matter how well designed, have inherent limitations. Therefore, even those systems determined to be effective can provide only reasonable assurance with respect to financial statement preparation and presentation.
Our management assessed the effectiveness of our internal control over financial reporting as of December 31, 2015. In making this assessment, we used the criteria set forth in Internal Control—Integrated Framework issued by the Committee of Sponsoring Organizations of the Treadway Commission (COSO) in 2013. Based on our assessment under the 2013 COSO framework, we believe that, as of December 31, 2015, the Company's internal control over financial reporting was effective based on those criteria.
The effectiveness of our internal control over financial reporting as of December 31, 2015 has been audited by HoganTaylor LLP, an independent registered public accounting firm, as stated in their report which is included in this Form 10-K.
|
(c) |
Changes in Internal Control Over Financial Reporting |
As of the quarter ended December 31, 2015, there were no changes in our internal control over financial reporting (as defined in Rule 13a-15(f) under the Exchange Act) that have materially affected, or are reasonably likely to affect, our internal control over financial reporting.
Item 9B. OTHER INFORMATION
None.
PART III
Item 10. DIRECTORS, EXECUTIVE OFFICERS AND CORPORATE GOVERNANCE
Information concerning our directors is contained in our Proxy Statement to be issued in connection with our 2016 Annual Meeting of Stockholders under the caption "ELECTION OF DIRECTORS," which information is incorporated herein by reference.
Information concerning our executive officers is contained in this report under Item 1, "BUSINESS—Executive Officers and Key Employees," which information is incorporated herein by reference.
The information required by Item 405 of Regulation S-K is contained in our Proxy Statement to be issued in connection with our 2016 Annual Meeting of Stockholders under the caption "Section 16(a) Beneficial Ownership Reporting Compliance."
Our Board of Directors adopted a Business Conduct and Ethics Policy for all of our directors, officers and employees effective June 22, 2005, and updated the policy during 2015. We have posted our Business Conduct and Ethics Policy on our website (www.orchidspaper.com ). In addition, stockholders may request a free copy of our Business Conduct and Ethics Policy from our Chief Financial Officer as follows:
Orchids Paper Products Company
Attention: Keith R. Schroeder
4826 Hunt Street
Pryor, Oklahoma 74361
(918) 825-0616
To the extent required by law or the rules of the NYSE MKT, any amendments to, or waivers from, any provision of the Business Conduct and Ethics Policy will be promptly disclosed publicly. To the extent permitted by such requirements, we intend to make such public disclosure by posting the relevant material on our website in accordance with SEC rules.
Item 11. EXECUTIVE COMPENSATION
Information concerning executive compensation is contained in our Proxy Statement to be issued in connection with our 2016 Annual Meeting of Stockholders under the caption "EXECUTIVE COMPENSATION," which information is incorporated herein by reference.
Item 12. SECURITY OWNERSHIP OF CERTAIN BENEFICIAL OWNERS AND MANAGEMENT AND RELATED STOCKHOLDER MATTERS
Information concerning security ownership of certain beneficial owners and management is contained in the Company's Proxy Statement to be issued in connection with our 2016 Annual Meeting of Stockholders under the caption "ELECTION OF DIRECTORS" and "SECURITY OWNERSHIP OF CERTAIN BENEFICIAL OWNERS," which information is incorporated herein by reference.
Securities Authorized for Issuance Under Equity Compensation Plan
The following is provided with respect to compensation plans (including individual compensation arrangements) under which equity securities are authorized for issuance as of December 31, 2015:
| Plan Category |
Number of securities to be issued upon exercise of outstanding options, warrants and rights (a) |
Weighted-average exercise price of outstanding options, warrants and rights (b) |
Number of securities remaining available for future issuance under equity compensation plans (excluding securities reflected in column (a) (c) |
|||||||||
|
Equity compensation plans approved by security holders |
827,850 | $ | 27.05 | 223,400 | ||||||||
|
Equity compensation plans not approved by security holders |
- | - | - | |||||||||
|
Total |
827,850 | 223,400 | ||||||||||
Item 13. CERTAIN RELATIONSHIPS AND RELATED TRANSACTIONS, AND DIRECTOR INDEPENDENCE
Information concerning certain relationships and related transactions is contained in our Proxy Statement to be issued in connection with our 2016 Annual Meeting of Stockholders under the captions "AGREEMENTS WITH NAMED EXECUTIVE OFFICERS" and "CERTAIN RELATIONSHIPS AND RELATED TRANSACTIONS," which information is incorporated herein by reference.
Item 14. PRINCIPAL ACCOUNTANT FEES AND SERVICES
Information concerning accountant fees and services is contained in our Proxy Statement to be issued in connection with our 2016 Annual Meeting of Stockholders under the caption "FEES PAID TO INDEPENDENT REGISTERED PUBLIC ACCOUNTING FIRM," which information is incorporated herein by reference.
PART IV
Item 15. EXHIBITS AND FINANCIAL STATEMENT SCHEDULES
(a)(1) Financial Statements
The information required by this item is included in Item 8 of Part II of this report.
(a)(2) Financial Statement Schedules
Schedule II—Valuation and Qualifying Accounts is included below. The rest of the schedules required by this item have been omitted as they are not required, not applicable or are included in Item 8 of Part II of this report.
Orchids Paper Products Company and Subsidiaries
Schedule II - Valuation and Qualifying Accounts
Years ended December 31, 2015, 2014 and 2013
|
Balance at Beginning of Period |
Additions Charged (Credited) to Costs and Expenses |
Deductions Describe (1) (2) |
Balance at End of Period |
|||||||||||||
|
(in thousands) |
||||||||||||||||
|
Accounts Receivable Reserve: |
||||||||||||||||
|
Year ended December 31, 2015 |
||||||||||||||||
|
Bad Debt Reserve |
$ | 155 | $ | - | $ | - | $ | 155 | ||||||||
|
Year ended December 31, 2014 |
||||||||||||||||
|
Bad Debt Reserve |
$ | 135 | $ | 19 | $ | (1 | ) | $ | 155 | |||||||
|
Year ended December 31, 2013 |
||||||||||||||||
|
Bad Debt Reserve |
$ | 125 | $ | 45 | $ | 35 | $ | 135 | ||||||||
|
Inventory Valuation Reserve: |
||||||||||||||||
|
Year ended December 31, 2015 |
||||||||||||||||
|
Inventory Valuation Reserve |
$ | 198 | $ | 239 | $ | 296 | $ | 141 | ||||||||
|
Year ended December 31, 2014 |
||||||||||||||||
|
Inventory Valuation Reserve |
$ | 105 | $ | 193 | $ | 100 | $ | 198 | ||||||||
|
Year ended December 31, 2013 |
||||||||||||||||
|
Inventory Valuation Reserve |
$ | 178 | $ | 6 | $ | 79 | $ | 105 | ||||||||
(1) Write-off of uncollectible accounts, net of recoveries
(2) Write-off of obsolete inventory and physical inventory adjustments
SIGNATURES
Pursuant to the requirements of Section 13 or 15(d) of the Securities Exchange Act of 1934, the registrant has duly caused this report to be signed on its behalf by the undersigned, thereunto duly authorized.
|
ORCHIDS PAPER PRODUCTS COMPANY |
|
By: |
/s/ JEFFREY S. SCHOEN |
||
|
|
Jeffrey S. Schoen |
||
|
|
Chief Executive Officer |
|
Date: March 7, 2016 |
|
By: |
/s/ KEITH R. SCHROEDER |
||
|
|
Keith R. Schroeder | ||
|
|
Chief Financial Officer |
POWER OF ATTORNEY
Each person whose signature appears below hereby constitutes and appoints Jeffrey S. Schoen and Keith R. Schroeder, and each of them, his or her true and lawful attorneys-in-fact and agents, with full power of substitution, to sign any amendments to this Annual Report on Form 10-K and to file such amendments and any related documents with the Securities and Exchange Commission, and ratifies and confirms the actions that any such attorney-in-fact and agents, or their substitutes, may lawfully do or cause to be done under this power of attorney.
Pursuant to the requirements of the Securities Exchange Act of 1934, this report has been signed below by the following persons on behalf of the registrant and in the capacities and on the dates indicated.
|
Signature |
Title |
Date | ||
|
/s/ STEVEN BERLIN |
Chairman of the Board of Directors |
March 7, 2016 | ||
|
Steven Berlin |
||||
|
/s/ JEFFREY S. SCHOEN |
Chief Executive Officer (Principal Executive Officer) and Director |
March 7, 2016 | ||
|
Jeffrey S. Schoen |
||||
|
/s/ JOHN G. GUTTILLA |
Director |
March 7, 2016 | ||
|
John G. Guttilla |
||||
|
/s/ DOUGLAS E. HAILEY |
Director |
March 7, 2016 | ||
|
Douglas E. Hailey |
||||
|
/s/ ELAINE MACDONALD |
Director |
March 7, 2016 | ||
|
Elaine MacDonald |
||||
|
/s/ MARK H. RAVICH |
Director |
March 7, 2016 | ||
|
Mark H. Ravich |
||||
|
/s/ MARIO ARMANDO GARCIA |
Director |
March 7, 2016 | ||
|
Mario Armando Garcia |
||||
|
/s/ KEITH R. SCHROEDER |
Chief Financial Officer (Principal Financial and Accounting Officer) |
March 7, 2016 | ||
|
Keith R. Schroeder |
Exhibit Index
(c) EXHIBITS
|
|
Exhibit Number |
|
Description |
|
|
3.1 |
|
Amended and Restated Certificate of Incorporation of the Registrant dated May 17, 2013, incorporated by reference to Exhibit 3.1 to the Registrant’s Form 10-Q (SEC Accession No. 0001104659-13-058279) filed with the SEC on July 31, 2013. |
|
|
|
|
|
|
|
3.2 |
|
Amended and Restated Bylaws of the Registrant amended May 17, 2013, incorporated by reference to Exhibit 3.2 to the Registrant’s Form 10-Q (SEC Accession No. 0001104659-13-058279) filed with the SEC on July 31, 2013. |
|
|
|
|
|
|
|
4.1 |
|
Specimen Stock Certificate, incorporated by reference to Exhibit 4.1 to the Registrant's Amendment No. 2 to its Registration Statement on Form S-1/A (SEC Accession No. 0000950137-05-007858) filed with the SEC on June 24, 2005. |
|
|
|
|
|
|
|
10.1 |
# |
Form of Incentive Stock Option Agreement incorporated by reference to Exhibit 10.1 to the Registrant's Current Report on Form 8-K (SEC Accession No. 0000950138-09-000048) filed with the SEC on January 26, 2009. |
|
|
|
|
|
|
|
10.2 |
# |
Orchids Paper Products Company Stock Incentive Plan, amended May 19, 2011, incorporated by reference to Exhibit 10.1 to the Registrant's Form S-8 (SEC Accession No. 0000950138-11-000411) filed with the SEC on July 1, 2011. |
|
|
|
|
|
|
|
10.3 |
# |
Orchids Paper Products Company 2014 Stock Incentive Plan, incorporated by reference to the Registrant’s Definitive Proxy Statement (SEC Accession No. 0001047469-14-001834) filed with the SEC on March 5, 2014. |
|
|
|
|
|
|
|
10.4 |
# |
Employment Agreement dated February 27, 2009 and effective as of March 1, 2009, between Keith R. Schroeder and the Registrant, incorporated by reference to Exhibit 10.1 to the Registrant's Current Report on Form 8-K (SEC Accession No. 0000950138-09-000171) filed with the SEC on March 2, 2009. |
|
|
|
|
|
|
|
10.5 |
# |
Executive Employment Agreement effective as of November 8, 2013, between the Registrant and Jeffrey S. Schoen, incorporated by reference to Exhibit 10.1 to the Registrant's Current Report on Form 8-K/A (SEC Accession No. 0001144204-14-004735) filed with the SEC on January 29, 2014. |
|
|
|
|
|
|
|
10.6 |
# |
Nonqualified Stock Option Agreement effective as of November 8, 2013, between the Registrant and Jeffrey S. Schoen, incorporated by reference to Exhibit 10.2 to the Registrant's Current Report on Form 8-K/A (SEC Accession No. 0001144204-14-004735) filed with the SEC on January 29, 2014. |
|
|
|
|
|
|
|
10.7 |
# |
Form of Indemnification Agreement between Registrant and each of its Directors and Officers, incorporated by reference to Exhibit 10.5 to the Registrant's Amendment No. 1 to its Registration Statement on Form S-1/A (SEC Accession No. 0000950137-05-006966) filed with the SEC on June 1, 2005. |
|
|
Exhibit Number |
|
Description |
|
|
10.8 |
* |
Supplier Agreement dated February 20, 2008 and effective as of April 1, 2008, between Dixie Pulp & Paper, Inc. and the Registrant, incorporated by reference to Exhibit 10.1 to the Registrant's Form 10-Q (SEC Accession No. 0000950137-08-00) filed with the SEC on May 2, 2008. |
|
|
|
|
|
|
|
10.9 |
|
Asset Purchase Agreement, dated as of May 5, 2014, among the Registrant, Orchids Mexico (DE) Holdings, LLC and Fabrica de Papel San Francisco, S.A. de C.V., incorporated by reference to Exhibit 2.1 to the Registrant’s Current Report on Form 8-K (SEC Accession No. 0001104659-14-034678) filed with the SEC on May 5, 2014. |
|
|
|
|
|
|
|
10.10 |
# |
Orchids Paper Products Company Annual Bonus Plan, incorporated by reference to the Registrant’s Form 10-K (SEC Accession No. 0001437749-15-004472) filed with the SEC on March 9, 2015. |
|
|
|
|
|
|
|
10.11 |
Second Amended and Restated Credit Agreement, dated as of June 25, 2015, among Orchids, U.S. Bank National Association, as administrative agent, lead arranger and sole book runner, the lenders named therein, and JPMorgan Chase Bank, N.A., as documentation agent, incorporated by reference to the Registrant’s Current Report on Form 8-K (SEC Accession No. 0001144204-15-039721) filed with the SEC on June 29, 2015. | |
|
|
|
|
|
|
10.12 |
Amendment No. 1 to Second Amended and Restated Credit Agreement, dated as of November 6, 2015, among Orchids and U.S. Bank National Association, as administrative agent, incorporated by reference to the Registrant’s Form 10-Q (SEC Accession No. 0001437749-15-020194) filed with the SEC on November 9, 2015. | ||
|
10.13 |
Amendment No. 2, dated as of December 29, 2015, to Second Amended and Restated Credit Agreement, dated as of June 25, 2015, among Orchids and U.S. Bank National Association, as administrative agent, incorporated by reference to the Registrant’s Current Report on Form 8-K (SEC Accession No. 0001437749-16-023119) filed with the SEC on January 5, 2016. | ||
|
|
21 |
|
Subsidiaries of the Company. |
|
|
|
|
|
|
|
23.1 |
|
Consent of Independent Registered Public Accounting Firm—HoganTaylor LLP. |
|
|
|
|
|
|
|
31.1 |
|
Certification Pursuant to Section 302(a) of the Sarbanes-Oxley Act of 2002 for Jeffrey S. Schoen. |
|
|
|
|
|
|
|
31.2 |
|
Certification Pursuant to Section 302(a) of the Sarbanes-Oxley Act of 2002 for Keith R. Schroeder. |
|
|
|
|
|
|
|
32.1 |
|
Certification Pursuant to Section 906 of the Sarbanes-Oxley Act of 2002 for Jeffrey S. Schoen. |
|
|
|
|
|
|
|
32.2 |
|
Certification Pursuant to Section 906 of the Sarbanes-Oxley Act of 2002 for Keith R. Schroeder. |
|
|
|
|
|
|
|
101 |
|
The following financial information from Orchids Paper Products Company's Annual Report on Form 10-K for the fiscal year ended December 31, 2015, formatted in XBRL (eXtensible Business Reporting Language): (i) Consolidated Statements of Income for the fiscal years ended December 31, 2015, 2014 and 2013, (ii) Consolidated Balance Sheets as of December 31, 2015 and 2014, (iii) Consolidated Statements of Changes in Stockholders’ Equity for the fiscal years ended December 31, 2013, 2014 and 2015, (iv) Consolidated Statements of Cash Flows for the fiscal years ended December 31, 2015, 2014 and 2012, and (v) Consolidated Notes to Financial Statements. |
# Indicates management contract or compensatory plan
* Confidential treatment has been granted with respect to certain portions of this exhibit. Omitted portions have been filed separately with the Securities and Exchange Commission.