Attached files
UNITED
STATES
SECURITIES AND
EXCHANGE COMMISSION
Washington, D.C. 20549
FORM 10-K
| (Mark One) | ||
| ☒ | ANNUAL REPORT PURSUANT TO SECTION 13 OR 15(d) OF THE SECURITIES | |
| EXCHANGE ACT OF 1934 | ||
| For the fiscal year ended December 31, 2015 | ||
| ☐ | TRANSITION REPORT PURSUANT TO SECTION 13 OR 15(d) OF THE | |
| SECURITIES EXCHANGE ACT OF 1934 | ||
| For the transition period from _______ to _______ | ||
| Commission file number 000-20827 |
![]()
| CASS INFORMATION SYSTEMS, INC. |
| (Exact name of registrant as specified in its charter) |
| Missouri | 43-1265338 | |
| (State or other jurisdiction of incorporation or organization) | (I.R.S. Employer Identification No.) | |
| 12444 Powerscourt Drive, Suite 550, St. Louis, Missouri 63131 | (314) 506-5500 | |
| (Address of principal executive offices) (Zip Code) | (Telephone Number, incl. area code) | |
| Securities registered pursuant to Section 12(b) of the Act: | ||
| Title of each Class | Name of each exchange on which registered | |
| Common Stock, par value $.50 | The Nasdaq Global Select Market | |
| Securities registered pursuant to Section 12(g) of the Act: | ||
| Title of each Class | ||
| None |
Indicate by check mark whether the registrant is a large accelerated filer, an accelerated filer, a non-accelerated filer or a smaller reporting company. See definitions of “large accelerated filer,” “accelerated filer” and “smaller reporting company” in Rule 12b-2 of the Exchange Act. Large accelerated filer: ☐ Accelerated filer: ☒ Non-accelerated filer: ☐ Smaller reporting company: ☐
The aggregate market value of the common stock held by non-affiliates of the Registrant was approximately $609,000,000 based on the closing price of the common stock of $56.22 on June 30, 2015, as reported by The Nasdaq Global Select Market. As of March 1, 2016, the Registrant had 11,293,246 shares outstanding of common stock.
DOCUMENTS INCORPORATED BY REFERENCE
Certain information required for Part III of this report is incorporated by reference to the Registrant’s Proxy Statement for the 2016 Annual Meeting of Shareholders.
CASS INFORMATION SYSTEMS,
INC.
FORM 10-K ANNUAL REPORT
TABLE OF CONTENTS
Forward-looking Statements - Factors That May Affect Future Results
This report may contain or incorporate by reference forward-looking statements made pursuant to the safe harbor provisions of Section 27A of the Securities Act of 1933, as amended, and Section 21E of the Securities Exchange Act of 1934, as amended. Although we believe that, in making any such statements, our expectations are based on reasonable assumptions, forward-looking statements are not guarantees of future performance and involve risks, uncertainties, and other factors beyond our control, which may cause future performance to be materially different from expected performance summarized in the forward-looking statements. These risks, uncertainties and other factors are discussed in the section Part I, Item 1A, “Risk Factors.” We undertake no obligation to publicly update or revise any forward-looking statements to reflect changed assumptions, the occurrence of anticipated or unanticipated events, or changes to future results over time.
Description of Business
Cass Information Systems, Inc. (“Cass” or the “Company”) is a leading provider of payment and information processing services to large manufacturing, distribution and retail enterprises across the United States with operating locations in Missouri, Ohio, Massachusetts, South Carolina and Florida. The Company provides transportation invoice rating, payment processing, auditing, accounting and transportation information to many of the nation’s largest companies. It is also a processor and payer of energy invoices, including electricity, gas, waste, and other facility related expenses. Additionally, Cass competes in the telecommunications expense management market which includes bill processing, audit and payment services for telephone, data line, cellular and communication equipment expense. The Company, through its wholly owned bank subsidiary, Cass Commercial Bank (the “Bank”), also provides commercial banking services. The Bank’s primary focus is to support the Company’s payment operations and provide banking services to its target markets, which include privately-owned businesses and churches and church-related ministries. Services include commercial and commercial real estate loans, checking, savings and time deposit accounts and other cash management services.
Company Strategy and Core Competencies
Cass is an information services company with a primary focus on processing payables and payables-related transactions for large corporations located in the United States. Cass possesses four core competencies that encompass most of its processing services.
Data acquisition – This refers to the gathering of data elements from diverse, heterogeneous sources and the building of complete databases for our customers. Data is the raw material of the information economy. Cass gathers vital data from complex and diverse input documents, electronic media, proprietary databases and data feeds, including data acquired from vendor invoices as well as customer procurement and sales systems. Through its numerous methods of obtaining streams and pieces of raw data, Cass is able to assemble vital data into centralized data management systems and warehouses, thus producing an engine to create the power of information for managing critical corporate functions and processing systems.
Data management – Once data is assembled, Cass is able to utilize the power from derived information to produce significant savings and benefits for its clients. This information is integrated into customers’ unique financial and accounting systems, eliminating the need for internal accounting processing and providing internal and external support for these critical systems. Information is also used to produce management and exception reporting for operational control, feedback, planning assistance and performance measurement.
Business Intelligence – Receiving information in the right place at the right time and in the required format is paramount for business survival. Cass’ information delivery solutions provide reports, digital images, data files and retrieval capabilities through the Internet or directly into customer internal systems. Cass’ proprietary Internet management delivery system is the foundation for driving these critical functions. Transaction, operational, control, status and processing exception information are all delivered through this system creating an efficient, accessible and highly reliable asset for Cass customers.
Financial exchange – Since Cass is unique among its competition in that it owns a commercial bank, it is also able to manage the movement of funds from its customers to their suppliers. This is a distinguishing factor, which clearly requires the processing capability, operating systems and financial integrity of a banking organization. Cass provides immediate, accurate, controlled and protected funds management and transfer system capabilities for all of its customers. Old and costly check processing and delivery mechanisms are replaced with more efficient electronic cash management and funds transfer systems.
Cass’ core competencies allow it to perform the highest volumes of transaction processing in an integrated, efficient and systematic approach. Not only is Cass able to process the transaction, it is also able to collect the data defining the transaction and effect the financial payment governing its terms.
Cass’ shared business processes – accounting, human resources and technology – support its core competencies. Cass’ accounting function provides the internal control systems to ensure the highest levels of accountability and protection for customers. Cass’ human resources department provides experienced people dedicated to streamlining business procedures and reducing expenses. Cass’ technology is proven and reliable. The need to safeguard data and secure the efficiency, speed and timeliness that govern its business is a priority within the organization. The ability to leverage technology over its strategic units allows Cass the advantage of deploying technology in a proven and reliable manner without hindering clients’ strategic business and system requirements.
These core competencies, enhanced through shared business processes, drive Cass’ strategic business units. Building upon these foundations, Cass continues to explore new business opportunities that leverage these competencies and processes.
1
Marketing, Customers and Competition
The Company, through its Transportation Information Services business unit, is one of the largest firms in the transportation bill processing and payment industry in the United States based on the total dollars of transportation bills paid and items processed. Competition consists of a few primary competitors and numerous small transportation bill audit firms located throughout the United States. While offering transportation payment services, few of these audit firms compete on a national basis. These competitors compete mainly on price, functionality and service levels. The Company, through its Expense Management business unit, also competes with other companies, located throughout the United States, that pay energy and waste bills and provide management reporting. Available data indicates that the Company is one of the largest providers of energy information processing and payment services. Cass is unique among these competitors in that it is not exclusively affiliated with any one energy service provider (“ESP”). The ESPs market the Company’s services adding value with their unique auditing, consulting and technological capabilities. Many of Cass’ services are customized for the ESPs, providing a full-featured solution without any development costs to the ESP. Also the Company, through its Telecom Information Services business unit, is a leader in the growing telecom expense management market, and competes with other companies located throughout the United States in this market.
The Bank is organized as a Missouri trust company with banking powers and was founded in 1906. The Company is classified as a bank holding corporation due to its ownership of a federally-insured commercial bank and was originally organized in 1982 as Cass Commercial Corporation under the laws of Missouri. Approval by the Board of Governors of the Federal Reserve System was received in February 1983. The Company changed its name to Cass Information Systems, Inc. in January 2001. In December 2011, the Federal Reserve Bank (“FRB”) of St. Louis approved the election of Cass Information Systems, Inc. to become a financial holding company. As a financial holding company, Cass may engage in activities that are financial in nature or incidental to a financial activity. The Bank encounters competition from numerous banks and financial institutions located throughout the St. Louis, Missouri metropolitan area and other areas in which the Bank competes. The Bank’s principal competitors, however, are large bank holding companies that are able to offer a wide range of banking and related services through extensive branch networks. The Bank targets its services to privately held businesses located in the St. Louis, Missouri area and church and church-related institutions located in St. Louis, Missouri, Orange County, California, Colorado Springs, Colorado, and other selected cities located throughout the United States.
The Company holds several trademarks for the payment and rating services it provides. These include: FreightPay®, Transdata®, Ratemaker®, Best Rate®, Rate Exchange®, CassPort®, Expense$mart®, WasteVision™ and Direct2Carrier Payments™. The Company and its subsidiaries are not dependent on any one customer for a significant portion of their businesses. The Company and its subsidiaries have a varied client base with no individual client exceeding 10% of total revenue.
Employees
The Company and its subsidiaries had 722 full-time and 267 part-time employees as of March 2, 2016. Of these employees, the Bank had 54 full-time and no part-time employees.
Supervision and Regulation
The Company and its bank subsidiary are extensively regulated under federal and state law. These laws and regulations are intended to primarily protect depositors, not shareholders. The Bank is subject to regulation and supervision by the Missouri Division of Finance, the FRB and the Federal Deposit Insurance Corporation (the “FDIC”). The Company is a financial holding company within the meaning of the Bank Holding Company Act of 1956, as amended (the “BHC Act”), and as such, it is subject to regulation, supervision and examination by the FRB. Significant elements of the laws and regulations applicable to the Company and the Bank are described below. The description is qualified in its entirety by reference to the full text of the statutes, regulations and policies that are described. Also, such statutes, regulations and policies are continually under review by Congress and state legislatures and federal and state regulatory agencies. A change in statutes, regulations or regulatory policies applicable to the Company and its subsidiaries could have a material effect on the business, financial condition and results of operations of the Company.
Bank Holding Company Activities – In general, the BHC Act limits the business of bank holding companies to banking, managing or controlling banks and other related activities. In addition, bank holding companies that qualify and elect to be financial holding companies such as the Company, may engage in any activity, or acquire and retain the shares of a company engaged in any activity, that is either (i) financial in nature or incidental to such financial activity complementary to a financial activity and does not pose a substantial risk to the safety and soundness of depository institutions or the financial system generally. Such permitted activities include securities underwriting and dealing, insurance underwriting and making merchant banking investments.
To maintain financial holding company status, a financial holding company and all of its depository institution subsidiaries must be “well capitalized” and “well managed.” A depository institution subsidiary is considered to be “well capitalized” if it satisfies the requirements for this status discussed in the section “Prompt Corrective Action” below. A depository institution subsidiary is considered “well managed” if it received a composite rating and management rating of at least “satisfactory” in its most recent examination. A financial holding company’s status will also depend upon it maintaining its status as “well capitalized” and “well managed’ under applicable FRB regulations. If a financial holding company ceases to meet these capital and management requirements, the FRB may impose limitations or conditions on the conduct of its activities during the non-compliance period, and the company may not commence any of the broader financial activities permissible for financial holding companies or acquire a company engaged in such financial activities without prior approval of the FRB. If the company does not return to compliance within 180 days, the FRB may require divestiture of the holding company’s depository institutions.
2
In order for a financial holding company to commence any new activity permitted by the BHC Act or to acquire a company engaged in any new activity permitted by the BHC Act, each insured depository institution subsidiary of the financial holding company must have received a rating of at least “satisfactory” in its most recent examination under the Community Reinvestment Act. See “Community Reinvestment Act” below.
The FRB has the power to order any bank holding company or its subsidiaries to terminate any activity or to terminate its ownership or control of any subsidiary when the FRB has reasonable grounds to believe that continuation of such activity or such ownership or control constitutes a serious risk to the financial soundness, safety or stability of any bank subsidiary of the bank holding company.
The BHC Act, the Bank Merger Act, and other federal and state statutes regulate acquisitions of banks and banking companies. The BHC Act requires the prior approval of the FRB for the direct or indirect acquisition by the Company of more than 5% of the voting shares or substantially all of the assets of a bank or bank holding company. Under the Bank Merger Act, the prior approval of the FRB or other appropriate bank regulatory authority is required for the Bank to merge with another bank or purchase the assets or assume the deposits of another bank. In reviewing acquisition applications, the bank regulatory authorities will consider, among other things, the competitive effect and public benefits of the transactions, the capital position of the combined organization, the risks to the stability of the U.S. banking or financial system, the applicant’s performance record under the Community Reinvestment Act and fair housing laws.
The Dodd-Frank Act – The Dodd-Frank Wall Street Reform and Consumer Protection Act (the “Dodd-Frank Act”), enacted in July 2010, significantly restructured the financial regulatory environment in the United States, affecting all bank holding companies and banks, including the Company and the Bank, some of which are described in more detail below. The scope and impact of many of the Dodd-Frank Act’s provisions will be determined over time as regulations are issued and become effective. As a result, the Company cannot predict the ultimate impact of the Dodd-Frank Act on the Company or the Bank at this time, including the extent to which it could increase costs or restrict the ability to pursue business opportunities, or otherwise adversely affect the Company’s business, financial condition and results of operations. However, at a minimum, the Company expects that the regulations enacted under the Dodd-Frank Act will increase operating and compliance costs.
Dividends – Both the Company and the Bank are subject to various regulations that restrict their ability to pay dividends and the amount of dividends that they may pay. Under the Federal Deposit Insurance Corporation Improvement Act of 1991 (“FDICIA”), a depository institution, such as the Bank, may not pay dividends if payment would cause it to become undercapitalized or if it is already undercapitalized. The payment of dividends by the Company and the Bank may also be affected or limited by other factors, such as the requirement to maintain adequate capital and, under certain circumstances, the ability of federal regulators to prohibit dividend payments as an unsound or unsafe practice.
Capital Requirements – As a bank holding company, the Company and the Bank are subject to capital requirements pursuant to the FRB’s capital guidelines which include (i) risk-based capital guidelines, which are designed to make capital requirements more sensitive to various risk profiles and account for off-balance sheet exposure; (ii) guidelines that consider market risk, which is the risk of loss due to change in value of assets and liabilities due to changes in interest rates; and (iii) guidelines that use a leverage ratio which places a constraint on the maximum degree of risk to which a financial holding company may leverage its equity capital base.
Effective July 2, 2013, the FRB approved final rules known as the “Basel III Capital Rules” that substantially revised the risk-based capital and leverage capital requirements applicable to bank holding companies and depository institutions, including the Company and the Bank. The Basel III Capital Rules implement aspects of the Basel III capital framework agreed upon by the Basel Committee and incorporate changes required by the Dodd-Frank Act. The Basel III Capital Rules came into effect for the Company and the Bank on January 1, 2015 (subject to a phase-in period).
The Basel III Capital Rules require FDIC insured depository institutions to meet and maintain several minimum capital standards: a common equity Tier 1 capital to risk-based assets ratio of 4.5%, a Tier 1 capital to risk-based assets ratio of 6.0%, a total capital to risk-based assets of 8%, and a 4% Tier 1 capital to total assets leverage ratio.
Common equity Tier 1 capital is generally defined as common stockholders’ equity and retained earnings. Tier 1 capital is generally defined as common equity Tier 1 and Additional Tier 1 capital. Additional Tier 1 capital generally includes certain noncumulative perpetual preferred stock and related surplus and minority interests in equity accounts of consolidated subsidiaries. Total capital includes Tier 1 capital (common equity Tier 1 capital plus Additional Tier 1 capital) and Tier 2 capital. Tier 2 capital is comprised of capital instruments and related surplus meeting specified requirements. Also included in Tier 2 capital is the allowance for loan losses limited to a maximum of 1.25% of risk-weighted assets and, for institutions like Cass, that have exercised an opt-out election regarding the treatment of Accumulated Other Comprehensive Income (“AOCI”), up to 45% of net unrealized gains on available-for-sale equity securities with readily determinable fair market values. The calculation of all types of regulatory capital is subject to deductions and adjustments specified in the regulations.
3
In determining the amount of risk-weighted assets for purposes of calculating risk-based capital ratios, all assets, including certain off-balance sheet assets are multiplied by a risk weight factor assigned by the regulations based on the risks believed inherent in the type of asset. Higher levels of capital are required for asset categories believed to present greater risk. For example, a risk weight of 0% is assigned to cash and U.S. government securities, a risk weight of 50% is generally assigned to prudently underwritten first lien one to four-family residential mortgages, a risk weight of 100% is assigned to commercial and consumer loans, a risk weight of 150% is assigned to certain past due loans, and a risk weight of between 0% to 600% is assigned to permissible equity interests, depending on certain specified factors.
In addition to establishing the minimum regulatory capital requirements, the Basel III Capital Rules limit capital distributions and certain discretionary bonus payments to management if the institution does not hold a “capital conservation buffer” consisting of 2.5% of common equity Tier 1 capital to risk-weighted assets above the amount necessary to meet its minimum risk-based capital requirements. The capital conservation buffer requirement is being phased in beginning January 1, 2016 at 0.625% of risk-weighted assets and increasing each year until fully implemented at 2.5% on January 1, 2019.
The FRB has authority to establish individual minimum capital requirements in appropriate cases upon a determination that an institution’s capital level is or may become inadequate in light of the particular risks or circumstances. As of December 31, 2015, the Company and the Bank met all capital adequacy requirements under the Basel III Capital Rules.
Source of Strength Doctrine – FRB and other regulations require bank holding companies to act as a source of financial and managerial strength to their subsidiary banks. Under this requirement, the Company is expected to commit resources to support the Bank. Any capital loans by a bank holding company to any of its subsidiary banks are subordinate in right of payment to depositors and to certain other indebtedness of such subsidiary banks. In the event of a bank holding company’s bankruptcy, any commitment by the bank holding company to a federal bank regulatory agency to maintain the capital of a subsidiary bank will be assumed by the bankruptcy trustee and entitled to priority of payment.
Deposit Insurance – Substantially all of the deposits of the Bank are insured up to applicable limits by the Deposit Insurance Fund (“DIF”) of the FDIC, and the Bank is subject to deposit insurance assessments to maintain the DIF. Deposit insurance assessments are based on average consolidated total assets minus average tangible equity. Under the FDIC’s risk-based assessment system, insured institutions with less than $10 billion in assets, such as the Bank, are assigned to one of four risk categories based on supervisory evaluations, regulatory capital level, and certain other factors, with less risky institutions paying lower assessments. An institution’s assessment rate depends upon the category to which it is assigned and certain other factors.
In October 2010, the FDIC adopted a new DIF restoration plan to ensure that the DIF reserve ratio reaches 1.35% by September 30, 2020, as required by the Dodd-Frank Act. At least semi-annually, the FDIC will update its loss and income projections for the fund and, if needed, will increase or decrease assessment rates, following notice-and-comment rulemaking if required. FDIC insurance expense totaled approximately $349,200, $332,600 and $320,700 for the years ended December 31, 2015, 2014 and 2013, respectively.
The FDIC may terminate deposit insurance upon a finding that the institution has engaged in unsafe and unsound practices, is in an unsafe or unsound condition to continue operations, or has violated any applicable law, regulation, rule, order or condition imposed by the FDIC.
Prompt Corrective Action – The Basel III Capital Rules incorporate new requirements into the prompt correction action framework, described above. The Federal Deposit Insurance Act (“FDIA”) requires that federal banking agencies take “prompt corrective action” against depository institutions that do not meet minimum capital requirements and includes the following five capital tiers: “well-capitalized,” “adequately capitalized,” “undercapitalized,” “significantly undercapitalized” and “critically undercapitalized.” A depository institution’s capital tier will depend upon how its capital levels compare with various relevant capital measures and certain other factors, as established by regulation.
A depository institution is deemed to be (i) “well-capitalized” if the institution has a total risk-based capital ratio of 10% or greater, a Tier 1 risk-based capital ratio of 8% or greater, a leverage ratio of 5% or greater, a common equity Tier 1 ratio of 6.5% or greater and is not subject to any regulatory order agreement or written directive to meet and maintain a specific capital level for any capital measure; (ii) “adequately capitalized” if the institution has a total risk-based capital ratio of 8% or greater, a Tier 1 risk-based capital ratio of 6% or greater, a leverage ratio of 4% or greater, a common equity Tier 1 ratio of 4.5% or greater and does not meet the definition of “well capitalized”; (iii) “undercapitalized” if the institution has a total risk-based capital ratio that is less than 8%, a Tier 1 risk-based capital ratio of less than 6%, a leverage ratio of less than 4% or a common equity Tier 1 ratio of less than 4.5%; (iv) “significantly undercapitalized” if the institution has a total risk-based capital ratio of less than 6%, a Tier 1 risk-based capital ratio of less than 4%, a leverage ratio of less than 3% or a common equity Tier 1 ratio of less than 3%; and (v) “critically undercapitalized” if the institution has a ratio of tangible equity (as defined in the regulations) to total assets that is equal to or less than 2%. An institution may be deemed to be in a capital category that is lower than indicated by its capital ratios if it is determined to be in an unsafe or unsound condition or if it receives an unsatisfactory examination rating with respect to certain matters. A bank’s capital category is determined solely for the purpose of applying prompt corrective action regulations, and the capital category may not constitute an accurate representation of the bank’s overall financial condition or prospects for other purposes.
4
Subject to a narrow exception, a receiver or conservator is required to be appointed for an institution that is “critically undercapitalized” within specified time frames. The regulations also provide that a capital restoration plan must be filed with the FRB within 45 days of the date an institution is deemed to have received notice that it is “undercapitalized,” “significantly undercapitalized” or “critically undercapitalized.” Compliance with the plan must be guaranteed by any parent holding company up to the lesser of 5% of the institution’s total assets when it was deemed to be undercapitalized or the amount necessary to achieve compliance with applicable capital requirements. In addition, numerous mandatory supervisory actions become immediately applicable to an undercapitalized institution including, but not limited to, increased monitoring by regulators and restrictions on growth, capital distributions and expansion. The FRB could also take any one of a number of discretionary supervisory actions, including the issuance of a capital directive and the replacement of senior executive officers and directors. Significantly and critically undercapitalized institutions are subject to additional mandatory and discretionary measures.
As of December 31, 2015, the most recent notification from the regulatory agencies categorized the Company and the Bank as well-capitalized. For further information regarding the capital ratios and leverage ratio of the Company and the Bank, see Item 8, Note 2 of this report.
Safety and Soundness Regulations – In accordance with the FDIA, the federal banking agencies adopted guidelines establishing general standards relating to internal controls, information systems, internal audit systems, loan documentation, credit underwriting, interest rate risk exposure, asset growth, asset quality, earnings, compensation, fees and benefits. In general, the guidelines require that institutions maintain appropriate systems and practices to identify and manage the risks and exposures specified in the guidelines. The guidelines prohibit excessive compensation as an unsafe and unsound practice and describe compensation as excessive when the amounts paid are unreasonable or disproportionate to the services performed by an executive officer, employee, director or principal shareholder. In addition, regulations adopted by the federal banking agencies authorize the agencies to require that an institution that has been given notice that it is not satisfying any of such safety and soundness standards to submit a compliance plan. If the institution fails to submit an acceptable compliance plan or fails in any material respect to implement an accepted compliance plan, the agency must issue an order directing corrective actions and may issue an order directing other actions of the types to which an undercapitalized institution is subject under the “prompt corrective action” provisions of FDIA. If the institution fails to comply with such an order, the agency may seek to enforce such order in judicial proceedings and to impose civil money penalties.
Loans-to-One-Borrower – The Bank generally may not make loans or extend credit to a single or related group of borrowers in excess of 15% of unimpaired capital and surplus. An additional amount may be loaned, up to 10% of unimpaired capital and surplus, if the loan is secured by readily marketable collateral, which generally does not include real estate. As of December 31, 2015, the Bank was in compliance with the loans-to-one-borrower limitations.
Depositor Preference – The FDIA provides that, in the event of the “liquidation or other resolution” of an insured depository institution, the claims of depositors of the institution, including the claims of the FDIC as subrogee of insured depositors, and certain claims for administrative expenses of the FDIC as a receiver, will have priority over other general unsecured claims against the institution. If an insured depository institution fails, insured and uninsured depositors, along with the FDIC, will have priority in payment ahead of unsecured, non-deposit creditors, including depositors whose deposits are payable only outside of the United States and the parent bank holding company, with respect to any extensions of credit they have made to such insured depository institution.
Community Reinvestment Act – The Community Reinvestment Act of 1977 (“CRA”) requires depository institutions to assist in meeting the credit needs of their market areas consistent with safe and sound banking practice. Under the CRA, each depository institution is required to help meet the credit needs of its market areas by, among other things, providing credit to low- and moderate-income individuals and communities. Depository institutions are periodically examined for compliance with the CRA and are assigned ratings that must be publicly disclosed. In order for a financial holding company to commence any new activity permitted by the BHC Act, or to acquire any company engaged in any new activity permitted by the BHC Act, each insured depository institution subsidiary of the financial holding company must have received a rating of at least “satisfactory” in its most recent examination under the CRA. The Bank received a rating of “satisfactory” in its most recent CRA exam.
5
Financial Privacy – Banks and other financial institutions are subject to regulations that limit their ability to disclose non-public information about consumers to nonaffiliated third parties. These limitations require disclosure of privacy policies to consumers and affect how consumer information is transmitted through diversified financial companies and conveyed to outside vendors.
The Bank is also subject to regulatory guidelines establishing standards for safeguarding customer information and maintaining information security programs. The standards set forth in the guidelines are intended to ensure the security and confidentiality of customer records and information, protect against any anticipated threats or hazards to the security or integrity of such records and protect against unauthorized access to or use of such records or information that could result in substantial harm or inconvenience to any customer.
Transactions with Affiliates – Transactions between the Bank and its affiliates are subject to regulations that limit the types and amounts of covered transactions engaged in by the Bank and generally require those transactions to be on an arm’slength basis. The term “affiliate” is defined to mean any company that controls or is under common control with the Bank and includes the Company and its non-bank subsidiaries. “Covered transactions” include a loan or extension of credit, as well as a purchase of securities issued by an affiliate, certain purchases of assets from the affiliate, certain derivative transactions that create a credit exposure to an affiliate, the acceptance of securities issued by the affiliate as collateral for a loan, and the issuance of a guarantee, acceptance or letter of credit on behalf of an affiliate. In general, these regulations require that any such transaction by the Bank (or its subsidiaries) with an affiliate must be secured by designated amounts of specified collateral and must be limited to certain thresholds on an individual and aggregate basis.
Federal law also limits the Bank’s authority to extend credit to its directors, executive officers and 10% shareholders, as well as to entities controlled by such persons. Among other things, extensions of credit to insiders are required to be made on terms that are substantially the same as, and follow credit underwriting procedures that are not less stringent than, those prevailing for comparable transactions with unaffiliated persons. Also, the terms of such extensions of credit may not involve more than the normal risk of repayment or present other unfavorable features and may not exceed certain limitations on the amount of credit extended to such persons, individually and in the aggregate, which limits are based, in part, on the amount of the Bank’s capital.
Federal Reserve System – FRB regulations require depository institutions to maintain cash reserves against their transaction accounts (primarily NOW and demand deposit accounts). A reserve of 3% is to be maintained against aggregate transaction accounts between $12.4 million and $79.5 million (subject to adjustment by the FRB) plus a reserve of 10% (subject to adjustment by the FRB between 8% and 14%) against that portion of total transaction accounts in excess of $79.5 million. The first $12.4 million of otherwise reservable balances (subject to adjustment by the FRB) is exempt from the reserve requirements. The Bank is in compliance with the foregoing requirements.
Other Regulations – The operations of the Company and the Bank are also subject to:
| ● |
Truth-In-Lending Act,
governing disclosures of credit terms to consumer
borrowers; |
| ● |
Fair Credit Reporting Act, governing the
provision of consumer information to credit reporting agencies and the use
of consumer information; |
| ● |
Fair Debt Collection
Act, governing the manner in which consumer debts may be collected by
collection agencies; |
| ● |
Electronic Funds
Transfer Act, governing automatic deposits to and withdrawals from deposit
accounts and customers’ rights and liabilities arising from the use of
automated teller machines and other electronic banking
services. |
| ● |
Real Estate
Settlement Procedures Act, requiring that borrowers for mortgage loans for
one- to four-family residential real estate receive various disclosures,
including good faith estimates of settlement costs, lender servicing and
escrow account practices, and prohibiting certain practices that increase
the cost of settlement services; |
| ● |
Equal Credit
Opportunity Act, prohibiting discrimination on the basis of race, creed or
other prohibited factors in extending credit; |
| ● |
Check Clearing for the 21st
Century Act (also known as “Check 21”), which gives “substitute checks,”
such as digital check images and copies made from that image, the same
legal standing as the original paper check; and |
| ● |
The USA PATRIOT Act, which requires banks and savings institutions to establish broadened anti-money laundering compliance programs and due diligence policies and controls to ensure the detection and reporting of money laundering. |
6
Website Availability of SEC Reports
Cass files annual, quarterly and current reports with the Securities and Exchange Commission (the “SEC”). Cass will, as soon as reasonably practicable after they are electronically filed with or furnished to the SEC, make available free of charge on its website each of its Annual Reports on Form 10-K, Quarterly Reports on Form 10-Q, Current Reports on Form 8-K, all amendments to those reports, and its definitive proxy statements. The address of Cass’ website is: www.cassinfo.com. All reports filed with the SEC are available for reading and copying at the SEC’s Public Reference Room at 100 F Street, NE, Washington, DC 20549-2736 or for more information call the Public Reference Room at 1-800-SEC-0330. The SEC also makes all filed reports, proxy statements and information statements available on its website at www.sec.gov.
The reference to the Company’s website address does not constitute incorporation by reference of the information contained on the website and should not be considered part of this report.
Financial Information about Segments
The services provided by the Company are classified in two reportable segments: Information Services and Banking Services. The revenues from external customers, net income and total assets by segment as of and for each of the years in the three-year period ended December 31, 2015, are set forth in Item 8, Note 16 of this report.
Statistical Disclosure by Bank Holding Companies
For the statistical disclosure by bank holding companies, refer to Item 7 “Management’s Discussion and Analysis of Financial Condition and Results of Operations.”
This section highlights specific risks that could affect the Company’s business. Although this section attempts to highlight key factors, please be aware that other risks may prove to be important in the future. New risks may emerge at any time, and Cass cannot predict such risks or estimate the extent to which they may affect the Company’s financial performance. In addition to the factors discussed elsewhere or incorporated by reference in this report, the identified risks that could cause actual results to differ materially include the following:
General political, economic or industry conditions may be less favorable than expected.
Local, domestic, and international economic, political and industry-specific conditions and governmental monetary and fiscal policies affect the industries in which the Company competes, directly and indirectly. Conditions such as inflation, recession, unemployment, volatile interest rates, tight money supply, real estate values, international conflicts and other factors outside of Cass’ control may adversely affect the Company. Economic downturns could result in the delinquency of outstanding loans, which could have a material adverse impact on Cass’ earnings.
Unfavorable developments concerning customer credit quality could affect Cass’ financial results.
Although the Company regularly reviews credit exposure related to its customers and various industry sectors in which it has business relationships, default risk may arise from events or circumstances that are difficult to detect or foresee. Under such circumstances, the Company could experience an increase in the level of provision for credit losses, delinquencies, nonperforming assets, net charge-offs and allowance for credit losses.
The Company has lending concentrations, including, but not limited to, churches and church-related entities located in selected cities and privately-held businesses located in or near St. Louis, Missouri, that could suffer a significant decline which could adversely affect the Company.
Cass’ customer base consists, in part, of lending concentrations in several segments and geographical areas. If any of these segments or areas is significantly affected by weak economic conditions, the Company could experience increased credit losses, and its business could be adversely affected.
7
Fluctuations in interest rates could affect Cass’ net interest income and balance sheet.
The operations of financial institutions such as the Company are dependent to a large degree on net interest income, which is the difference between interest income from loans and investments and interest expense on deposits and borrowings. Prevailing economic conditions, the fiscal and monetary policies of the federal government and the policies of various regulatory agencies all affect market rates of interest, which in turn significantly affect financial institutions’ net interest income. Fluctuations in interest rates affect Cass’ financial statements, as they do for all financial institutions. Volatility in interest rates can also result in disintermediation, which is the flow of funds away from financial institutions into direct investments, such as federal government and corporate securities and other investment vehicles, which, because of the absence of federal insurance premiums and reserve requirements, generally pay higher rates of return than financial institutions. As discussed in greater detail in Item 7A, “Quantitative and Qualitative Disclosures about Market Risk,” a continuation of the current low level of interest rates would have a negative impact on the Company’s net interest income.
Methods of reducing risk exposures might not be effective.
Instruments, systems and strategies used to hedge or otherwise manage exposure to various types of credit, interest rate, market and liquidity, operational, regulatory/compliance, business risks and enterprise-wide risks could be less effective than anticipated. As a result, the Company may not be able to effectively mitigate its risk exposures in particular market environments or against particular types of risk.
Customer borrowing, repayment, investment, deposit, and payable processing practices may be different than anticipated.
The Company uses a variety of financial tools, models and other methods to anticipate customer behavior as part of its strategic and financial planning and to meet certain regulatory requirements. Individual, economic, political and industry-specific conditions and other factors outside of Cass’ control could alter predicted customer borrowing, repayment, investment, deposit, and payable processing practices. Such a change in these practices could adversely affect Cass’ ability to anticipate business needs, including cash flow and its impact on liquidity, and to meet regulatory requirements.
Cass must respond to rapid technological changes and these changes may be more difficult or expensive than anticipated.
If competitors introduce new products and services embodying new technologies, or if new industry standards and practices emerge, the Company’s existing product and service offerings, technology and systems may become obsolete. Further, if Cass fails to adopt or develop new technologies or to adapt its products and services to emerging industry standards, Cass may lose current and future customers. Finally, Cass’ ability to adopt these technologies can also be inhibited by intellectual property rights of third parties. Any of these could have a material adverse effect on its business, financial condition and results of operations. The payment processing and financial services industries are changing rapidly and in order to remain competitive, Cass must continue to enhance and improve the functionality and features of its products, services and technologies. These changes may be more difficult or expensive than the Company anticipates.
Operational difficulties or cyber-security problems could damage Cass’ reputation and business.
The Company depends on the reliable operation of its computer operations and network connections from its clients to its systems. Any operational problems or outages in these systems would cause Cass to be unable to process transactions for its clients, resulting in decreased revenues. In addition, any system delays, failures or loss of data, whatever the cause, could reduce client satisfaction with the Company’s products and services and harm Cass’ financial results. Cass also depends on the security of its systems. Company networks may be vulnerable to unauthorized access, computer viruses and other disruptive problems. A material security problem affecting Cass could damage its reputation, deter prospects from purchasing its products and services, deter customers from using its products and services or result in liability to Cass.
Cass’ stock price can become volatile and fluctuate widely in response to a variety of factors.
The Company’s stock price can fluctuate based on factors that can include actual or anticipated variations in Cass’ quarterly results; new technology or services by competitors; unanticipated losses or gains due to unexpected events, including losses or gains on securities held for investment purposes; significant acquisitions or business combinations, strategic partnerships, joint ventures or capital commitments by or involving the Company or its competitors; changes in accounting policies or practices; failure to integrate acquisitions or realize anticipated benefits from acquisitions; or changes in government regulations.
General market fluctuations, industry factors and general economic and political conditions, such as economic slowdowns or recessions, governmental intervention, interest rate changes, credit loss trends, low trading volume or currency fluctuations also could cause Cass’ stock price to decrease regardless of the Company’s operating results.
8
Competitive product and pricing pressure within Cass’ markets may change.
The Company operates in a very competitive environment, which is characterized by competition from a number of other vendors and financial institutions in each market in which it operates. The Company competes with large payment processors and national and regional financial institutions and also smaller auditing companies and banks in terms of products and pricing. If the Company is unable to compete effectively in products and pricing in its markets, business could decline.
Management’s ability to maintain and expand customer relationships may differ from expectations.
The industries in which the Company operates are very competitive. The Company not only competes for business opportunities with new customers, but also competes to maintain and expand the relationships it has with its existing customers. The Company continues to experience pressures to maintain these relationships as its competitors attempt to capture its customers.
The introduction, withdrawal, success and timing of business initiatives and strategies, including, but not limited to, the expansion of payment and processing activities to new markets, the expansion of products and services to existing markets and opening of new bank branches, may be less successful or may be different than anticipated. Such a result could adversely affect Cass’ business.
The Company makes certain projections as a basis for developing plans and strategies for its payment processing and banking products. If the Company does not accurately determine demand for its products and services, it could result in the Company incurring significant expenses without the anticipated increases in revenue, which could result in an adverse effect on its earnings.
Management’s ability to retain key officers and employees may change.
Cass’ future operating results depend substantially upon the continued service of Cass’ executive officers and key personnel. Cass’ future operating results also depend in significant part upon Cass’ ability to attract and retain qualified management, financial, technical, marketing, sales, and support personnel. Competition for qualified personnel is intense, and the Company cannot ensure success in attracting or retaining qualified personnel. There may be only a limited number of persons with the requisite skills to serve in these positions, and it may be increasingly difficult for the Company to hire personnel over time. Cass’ business, financial condition and results of operations could be materially adversely affected by the loss of any of its key employees, by the failure of any key employee to perform in his or her current position, or by Cass’ inability to attract and retain skilled employees.
Recent legislative and regulatory initiatives to support the financial services industry have been coupled with numerous restrictions and requirements that could detrimentally affect the Company’s business.
The Dodd-Frank Act is significantly changing the current bank regulatory structure and affecting the lending, deposit, investment, trading and operating activities of financial institutions and their holding companies.
The Company and the Bank are supervised and regulated primarily by the FRB. In addition, the Company is subject to consolidated capital requirements, made more strict by the recent adoptions and implementation of the Basel III Capital Rules, and must serve as a source of strength to the Bank. It is possible such requirements may limit our capacity to pay dividends or repurchase shares.
The Dodd-Frank Act also broadens the base for FDIC insurance assessments. The FDIC insures deposits at FDIC-insured financial institutions, including the Bank. The FDIC charges insured financial institutions premiums to maintain the DIF at a specific level. The Bank’s FDIC insurance premiums increased substantially beginning in 2009, and they expect to pay high premiums in the future. Economic conditions during the recent recession increased bank failures and decreased the DIF. The FDIC may increase the assessment rates or impose additional special assessments in the future to keep the DIF at the statutory target level. Any increase in our FDIC premiums could have an adverse effect on the Bank’s profits and financial condition.
The scope and impact of many of the Dodd-Frank Act provisions will be determined over time as regulations are issued and become effective. As a result, the Company cannot predict the ultimate impact of the Dodd-Frank Act at this time, including the extent to which it could increase costs or limit the ability to pursue business opportunities in an efficient manner, or otherwise adversely affect the business, financial condition and results of operations. However, it is expected that at a minimum, they will increase operating and compliance costs.
9
New capital rules generally require insured depository institutions and their holding companies to hold more capital. The impact of the new rules on our financial condition and operations is uncertain but could be materially adverse.
The Dodd-Frank Act requires the federal banking agencies to establish stricter risk-based capital requirements and leverage limits to apply to banks and bank and savings and loan holding companies. In July 2013, the federal banking agencies published the final Basel III Capital Rules that revised their risk-based and leverage capital requirements and their method for calculating risk-weighted assets. The Basel III Capital Rules will apply to banking organizations, including the Company and the Bank. As discussed in Item 1, “Business—Supervision and Regulation,” the Basel III Capital Rules became effective on January 1, 2015 with a phase-in period that generally extends through January 1, 2019. The final rules increase capital requirements and generally include two new capital measurements that will affect the Company—a risk-based common equity Tier 1 ratio and a capital conservation buffer. Common equity Tier 1 capital is a subset of Tier 1 capital and is limited to common equity (plus related surplus), retained earnings, accumulated other comprehensive income and certain other items. Other instruments that have historically qualified for Tier 1 treatment, including non-cumulative perpetual preferred stock, are consigned to a category known as Additional Tier 1 capital and must be phased out over a period of nine years beginning in 2014. The rules permit bank holding companies with less than $15 billion in assets (such as the Company) to continue to include trust preferred securities and non-cumulative perpetual preferred stock issued before May 19, 2010 in Tier 1 capital, but not common equity Tier 1 capital. Tier 2 capital consists of instruments that have historically been placed in Tier 2, as well as cumulative perpetual preferred stock.
The final rules adjust all three categories of capital by requiring new deductions from and adjustments to capital that will result in more stringent capital requirements. Beginning January 1, 2015, the minimum capital requirements are (i) a common equity Tier 1 capital ratio of 4.5%; (ii) a Tier 1 capital ratio (common equity Tier 1 capital plus Additional Tier 1 capital) of 6%; and (iii) a total capital ratio of 8%. The leverage ratio requirement will remain at the 3% level now required. Beginning in 2016, a capital conservation buffer will phase in over three years, ultimately resulting in a requirement of 2.5% on top of the common equity Tier 1, Tier 1 and total capital requirements, resulting in a required common equity Tier 1 capital ratio of 7%, a Tier 1 capital ratio of 8.5%, and a total capital ratio of 10.5%. Failure to satisfy any of these three capital requirements will result in limits on paying dividends, engaging in share repurchases and paying discretionary bonuses. These limitations will establish a maximum percentage of eligible retained income that could be utilized for such actions.
In addition to the higher required capital ratios and the new deductions and adjustments, the final rules increase the risk weights for certain assets, meaning that the Company will have to hold more capital against these assets. For example, commercial real estate loans that do not meet certain new underwriting requirements now must be risk-weighted at 150%, rather than the previous 100%. There are also new risk weights for unsettled transactions and derivatives. There will also be a requirement to hold capital against short-term commitments that are not unconditionally cancelable (currently, there are no capital requirements for these off-balance sheet assets). All changes to the risk weights took effect in 2015. Implementation of changes to asset risk weightings for risk-based capital calculations, items included or deducted in calculating regulatory capital or additional capital conservation buffers, could result in management modifying its business strategy and could limit the ability to make distributions, including paying dividends or buying back shares.
Cass is subject to extensive regulatory oversight.
The Company is subject to extensive regulation and supervision that is designed primarily for the protection of the DIF and depositors, and not to the benefit of the shareholders. As a result, the Company is limited in the manner in which it conducts business, undertakes new investments and activities and obtains financing. This regulatory structure also gives the regulatory authorities extensive discretion in connection with their supervisory and enforcement activities and examination policies, including policies with respect to capital levels, the timing and amount of dividend payments, the classification of assets and the establishment of adequate loan loss reserves for regulatory purposes. Failure to comply with these and other regulatory requirements can lead to, among other remedies, administrative enforcement actions and other legal proceedings, including the imposition of civil money penalties.
Changes in regulation or oversight may have a material adverse impact on Cass’ operations.
The Company is subject to extensive regulation, supervision and examination by the Missouri Division of Finance, the FDIC, the FRB, the SEC and other regulatory bodies. Such regulation and supervision governs the activities in which the Company may engage. Regulatory authorities have extensive discretion in their supervisory and enforcement activities, including the imposition of restrictions on Cass’ operations, investigations and limitations related to Cass’ securities, the classification of Cass’ assets and determination of the level of Cass’ allowance for loan losses. Any change in such regulation and oversight, whether in the form of regulatory policy, regulations, legislation or supervisory action, may have a material adverse impact on Cass’ operations.
Legal and regulatory proceedings and related matters with respect to the financial services industry, including those directly involving the Company and its subsidiaries, could adversely affect Cass or the financial services industry in general.
The Company is subject to various legal and regulatory proceedings. It is inherently difficult to assess the outcome of these matters, and there can be no assurance that the Company will prevail in any proceeding or litigation. Any such matter could result in substantial cost and diversion of Cass’ efforts, which by itself could have a material adverse effect on Cass’ financial condition and operating results. Further, adverse determinations in such matters could result in actions by Cass’ regulators that could materially adversely affect Cass’ business, financial condition or results of operations. Please refer to Item 3, “Legal Proceedings.”
10
The Company’s accounting policies and methods are the basis of how Cass reports its financial condition and results of operations, and they require management to make estimates about matters that are inherently uncertain. In addition, changes in accounting policies and practices, as may be adopted by the regulatory agencies, the Financial Accounting Standards Board, or other authoritative bodies, could materially impact Cass’ financial statements.
The Company’s accounting policies and methods are fundamental to how Cass records and reports its financial condition and results of operations. Management must exercise judgment in selecting and applying many of these accounting policies and methods in order to ensure that they comply with generally accepted accounting principles and reflect management’s judgment as to the most appropriate manner in which to record and report Cass’ financial condition and results of operations. In some cases, management must select the accounting policy or method to apply from two or more alternatives, any of which might be reasonable under the circumstances yet might result in the Company reporting materially different amounts than would have been reported under a different alternative.
Cass has identified four accounting policies as being “critical” to the presentation of its financial condition and results of operations because they require management to make particularly subjective and/or complex judgments about matters that are inherently uncertain and because of the likelihood that materially different amounts would be reported under different conditions or using different assumptions. More information on Cass’ critical accounting policies is contained in Item 7, “Management’s Discussion and Analysis of Financial Condition and Results of Operations.”
From time to time, the regulatory agencies, the Financial Accounting Standards Board (“FASB”), and other authoritative bodies change the financial accounting and reporting standards that govern the preparation of the Company’s financial statements. These changes can be hard to predict and can materially impact how management records and reports the Company’s financial condition and results of operations.
Cass is subject to examinations and challenges by tax authorities, which, if not resolved in the Company’s favor, could adversely affect the Company’s financial condition and results of operations.
In the normal course of business, Cass and its affiliates are routinely subject to examinations and challenges from federal and state tax authorities regarding the amount of taxes due in connection with investments it has made and the businesses in which it is engaged. Recently, federal and state taxing authorities have become increasingly aggressive in challenging tax positions taken by financial institutions. These tax positions may relate to tax compliance, sales and use, franchise, gross receipts, payroll, property and income tax issues, including tax base, apportionment and tax credit planning. The challenges made by tax authorities may result in adjustments to the timing or amount of taxable income or deductions or the allocation of income among tax jurisdictions. If any such challenges are made and are not resolved in the Company’s favor, they could have an adverse effect on Cass’ financial condition and results of operations.
There could be terrorist activities or other hostilities, which may adversely affect the general economy, financial and capital markets, specific industries, and the Company.
The terrorist attacks in September 2001 in the United States and ensuing events, as well as the resulting decline in consumer confidence, had a material adverse effect on the economy. Any similar future events may disrupt Cass’ operations or those of its customers. In addition, these events had and may continue to have an adverse impact on the U.S. and world economy in general and consumer confidence and spending in particular, which could harm Cass’ operations. Any of these events could increase volatility in the U.S. and world financial markets, which could harm Cass’ stock price and may limit the capital resources available to its customers and the Company. This could have a significant impact on Cass’ operating results, revenues and costs and may result in increased volatility in the market price of Cass’ common stock.
There could be natural disasters, including, but not limited to, hurricanes, tornadoes, earthquakes, fires and floods, which may adversely affect the general economy, financial and capital markets, specific industries, and the Company.
The Company has significant operations and customer base in Missouri, California, Ohio, Massachusetts, South Carolina, Kansas, Florida, Colorado and other regions where natural disasters may occur. These regions are known for being vulnerable to natural disasters and other risks, such as tornadoes, hurricanes, earthquakes, fires and floods. These types of natural disasters at times have disrupted the local economy, Cass’ business and customers and have posed physical risks to Cass’ property. A significant natural disaster could materially affect Cass’ operating results.
11
Operations of the Company’s customer base are impacted by macro-economic factors such as a strong dollar and/or volatility in commodity prices. A reduction in its customers’ operations could have a material adverse effect on Cass’ results of operations.
The recent decline in the cost of oil worldwide has had a negative effect on both the number of freight transactions processed and the dollar amount of invoices processed. For example, lower oil prices have caused a significant drop in drilling supplies being transported to fracking operations by domestic railroads and trucks, as U.S. oil prices are no longer as competitive with the prices of imported oil. Lower oil price have also resulted in lower gas and fuel prices, negatively affecting the dollar amounts of the invoices that Cass processes for its freight and shipping customers. A decline in oil prices would continue to have an adverse effect on the Company’s revenues and could significantly impact its results of operations.
ITEM 1B. UNRESOLVED STAFF COMMENTS
None.
In September 2012, the Company entered into a 10-year lease for office space in St. Louis County, Missouri, to house the headquarters of the Company and the Bank. The Company’s headquarters occupy 13,991 square feet in an office center at 12444 Powerscourt Drive, and the Bank’s headquarters occupy 10,564 square feet in the same center at 12412 Powerscourt Drive.
The Company owns approximately 61,500 square feet of office space at 13001 Hollenberg Drive in Bridgeton, Missouri where the Company’s transportation processing activities are performed.
The Company owns a production facility of approximately 45,500 square feet located at 2675 Corporate Exchange Drive, Columbus, Ohio. Additional facilities are located in Lowell, Massachusetts, Greenville, South Carolina, Wellington, Kansas, Jacksonville, Florida and Columbus, Ohio. The Company has an office in Breda, Netherlands to service its multinational customers.
In addition, the Bank owns a banking facility near downtown St. Louis, Missouri, has an operating branch in the Bridgeton, Missouri location, and has additional leased facilities in Fenton, Missouri, Santa Ana, California and Colorado Springs, Colorado.
Management believes that these facilities are suitable and adequate for the Company’s operations.
The Company and its subsidiaries are not involved in any pending proceedings other than ordinary routine litigation incidental to their businesses. Management believes none of these proceedings, if determined adversely, would have a material effect on the business or financial conditions of the Company or its subsidiaries.
ITEM 4. MINE SAFETY DISCLOSURES
Not applicable.
12
ITEM 5. MARKET FOR REGISTRANT’S COMMON EQUITY AND RELATED STOCKHOLDER MATTERS
The Company’s common stock is quoted on The Nasdaq Global Select Market® under the symbol “CASS.” As of March 2, 2016, there were approximately 2,908 holders of record of the Company’s common stock. High and low sale prices, as reported by The Nasdaq Global Select Market for each quarter of 2015 and 2014, were as follows:
| 2015 | 2014 | |||||||||||
| High | Low | High | Low | |||||||||
| 1st Quarter | $ | 57.54 | $ | 43.00 | $ | 67.29 | $ | 45.74 | ||||
| 2nd Quarter | 58.25 | 48.97 | 54.17 | 48.55 | ||||||||
| 3rd Quarter | 59.09 | 43.78 | 51.00 | 41.19 | ||||||||
| 4th Quarter | 54.71 | 47.40 | 54.91 | 39.00 | ||||||||
The Company has continuously paid regularly scheduled cash dividends since 1934 and expects to continue to pay quarterly cash dividends in the future. Cash dividends paid per share by the Company during the two most recent fiscal years were as follows:
| 2015 | 2014 | |||||
| March | $ | .210 | $ | .200 | ||
| June | .210 | .200 | ||||
| September | .210 | .200 | ||||
| December | .220 | .210 | ||||
Subsidiary dividends can be a significant source of funds for payment of dividends by the Company to its shareholders. Both the Company and the Bank are subject to various regulations that restrict their ability to pay dividends and the amount of dividends that they may pay. Under the FDICIA, a depository institution, such as the Bank, may not pay dividends if payment would cause it to become undercapitalized or if it is already undercapitalized. The payment of dividends by the Company and the Bank may also be affected or limited by other factors, such as the requirement to maintain adequate capital and, under certain circumstances, the ability of federal regulators to prohibit dividend payments as an unsound or unsafe practice. For further information regarding capital ratios and leverage ratio requirements of the Company and the Bank and the effect on payment of dividends, see Item 8, Note 2 of this report.
During the three months ended December 31, 2015, the Company repurchased a total of 23,722 shares of its common stock pursuant to its treasury stock buyback program, as follows:
| Total Number of | Maximum Number | |||
| Shares Purchased as | of Shares that May | |||
| Part of Publicly | Yet Be Purchased | |||
| Total Number of | Average Price Paid | Announced Plans or | Under the Plans or | |
| Period | Shares Purchased | per Share | Programs(1) | Programs |
| October 1, 2015 – | ||||
| October 31, 2015 | 12,001 | $48.44 | 12,001 | 487,999 |
| November 1, 2015 – | ||||
| November 30, 2015 | — | — | — | 487,999 |
| December 1, 2015 – | ||||
| December 31, 2015 | 11,721 | $49.78 | 11,721 | 476,278 |
| Total | 23,722 | $49.10 | 23,722 | 476,278 |
| (1) |
All repurchases made during the quarter ended December 31, 2015 were made pursuant to the treasury stock buyback program which was re-authorized by the Board of Directors on October 17, 2011 and announced by the Company on October 20, 2011. As restored by the Board of Directors on October 19, 2015, the program provides that the Company may repurchase up to an aggregate of 500,000 shares of common stock and has no expiration date. |
The Company repurchased a total of 216,412 shares at an aggregate cost of $10,591,000 during the year ended December 31, 2015 and 39,502 at an aggregate cost of $1,848,000 during the year ended December 31, 2014. A portion of the repurchased shares may be used for the Company’s employee benefit plans, and the balance will be available for other general corporate purposes. The stock repurchase authorization does not have an expiration date and the pace of repurchase activity will depend on factors such as levels of cash generation from operations, cash requirements for investments, repayment of debt, current stock price, and other factors. The Company may repurchase shares from time to time on the open market or in private transactions, including structured transactions. The stock repurchase program may be modified or discontinued at any time.
13
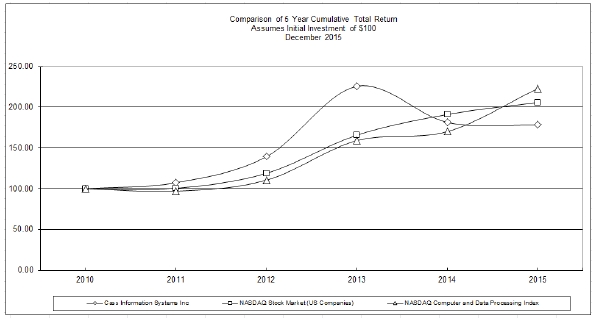
Performance Quoted on The Nasdaq Stock Market for the Last Five Fiscal Years
The following graph compares the cumulative total returns over the last five fiscal years of a hypothetical investment of $100 in shares of common stock of the Company with a hypothetical investment of $100 in The Nasdaq Stock Market (“Nasdaq”) and in the index of Nasdaq computer and data processing stocks. The graph assumes $100 was invested on December 31, 2010, with dividends reinvested. Returns are based on period end prices.
ITEM 6. SELECTED FINANCIAL DATA
The following table presents selected financial information for each of the five years ended December 31. The selected financial data should be read in conjunction with the Company’s consolidated financial statements and accompanying notes included in Item 8 of this report.
| (Dollars in thousands except per share data) | 2015 | 2014 | 2013 | 2012 | 2011 | |||||||||||||||
| Fee revenue and other income | $ | 83,368 | $ | 79,907 | $ | 76,572 | $ | 71,138 | $ | 62,824 | ||||||||||
| Interest income on loans | 28,669 | 29,726 | 32,110 | 35,525 | 39,515 | |||||||||||||||
| Interest income on debt and equity securities | 9,498 | 9,441 | 8,915 | 9,938 | 10,034 | |||||||||||||||
| Other interest income | 543 | 592 | 552 | 470 | 686 | |||||||||||||||
| Total interest income | 38,710 | 39,759 | 41,577 | 45,933 | 50,235 | |||||||||||||||
| Interest expense on deposits | 2,111 | 2,460 | 2,832 | 3,148 | 4,374 | |||||||||||||||
| Provision for loan losses | (850 | ) | — | 500 | 2,400 | 2,150 | ||||||||||||||
| Net interest income after provision | 37,449 | 37,299 | 38,245 | 40,385 | 43,711 | |||||||||||||||
| Operating expense | 89,783 | 85,414 | 84,086 | 80,333 | 75,029 | |||||||||||||||
| Income before income tax expense | 31,034 | 31,792 | 30,731 | 31,190 | 31,506 | |||||||||||||||
| Income tax expense | 7,978 | 7,759 | 7,234 | 7,887 | 8,497 | |||||||||||||||
| Net income | $ | 23,056 | $ | 24,033 | $ | 23,497 | $ | 23,303 | $ | 23,009 | ||||||||||
| Diluted earnings per share | $ | 2.00 | $ | 2.06 | $ | 2.02 | $ | 2.02 | $ | 2.01 | ||||||||||
| Dividends per share | .85 | .81 | .74 | .64 | .55 | |||||||||||||||
| Dividend payout ratio | 42.06 | % | 38.85 | % | 36.21 | % | 31.59 | % | 27.29 | % | ||||||||||
| Average total assets | $ | 1,439,511 | $ | 1,424,967 | $ | 1,351,782 | $ | 1,344,492 | $ | 1,301,635 | ||||||||||
| Average net loans | 659,109 | 651,984 | 647,827 | 671,900 | 683,215 | |||||||||||||||
| Average investment securities | 330,095 | 321,836 | 294,846 | 313,184 | 263,264 | |||||||||||||||
| Average total deposits | 579,752 | 571,039 | 550,110 | 541,046 | 541,337 | |||||||||||||||
| Average total shareholders’ equity | 197,853 | 200,149 | 175,441 | 167,867 | 151,669 | |||||||||||||||
| Return on average total assets | 1.60 | % | 1.69 | % | 1.74 | % | 1.73 | % | 1.77 | % | ||||||||||
| Return on average equity | 11.65 | 12.01 | 13.39 | 13.88 | 15.17 | |||||||||||||||
| Average equity to assets ratio | 13.74 | 14.05 | 12.98 | 12.49 | 11.65 | |||||||||||||||
| Equity to assets ratio at year-end | 14.25 | 13.36 | 14.36 | 13.80 | 12.17 | |||||||||||||||
| Tangible common equity to tangible assets | 13.42 | 12.52 | 13.39 | 12.47 | 11.66 | |||||||||||||||
| Tangible common equity to risk-weighted | ||||||||||||||||||||
| assets | 21.19 | 19.65 | 20.37 | 17.98 | 17.47 | |||||||||||||||
| Net interest margin | 3.38 | 3.43 | 3.63 | 4.00 | 4.31 | |||||||||||||||
| Allowance for loan losses to loans at year-end | 1.77 | 1.78 | 1.79 | 1.80 | 1.93 | |||||||||||||||
| Nonperforming assets to loans and foreclosed | ||||||||||||||||||||
| assets | .48 | .07 | .27 | 1.15 | * | .51 | ||||||||||||||
| Net loan (recoveries) charge-offs to average | ||||||||||||||||||||
| loans outstanding | (.09 | ) | (.03 | ) | .18 | .44 | .16 | |||||||||||||
| * |
In February 2013, a payment of $4,115,000 was received for one nonaccrual loan with a balance of $4,198,000. $83,000 was charged off. The percentage, as adjusted, would have been .54%. |
14
| ITEM 7. | MANAGEMENT'S DISCUSSION AND ANALYSIS OF FINANCIAL CONDITION AND RESULTS OF OPERATIONS |
The following discussion and analysis provides information about the financial condition and results of operations of the Company for the years ended December 31, 2015, 2014 and 2013. This discussion and analysis should be read in conjunction with the Company’s consolidated financial statements and accompanying notes and other selected financial data presented elsewhere in this report.
Executive Overview
Cass provides payment and information processing services to large manufacturing, distribution and retail enterprises from its offices/locations in St. Louis, Missouri, Columbus, Ohio, Boston, Massachusetts, Greenville, South Carolina, Wellington, Kansas, Jacksonville, Florida, and Breda, Netherlands. The Company’s services include freight invoice rating, payment processing, auditing, and the generation of accounting and transportation information. Cass also processes and pays energy invoices, which include electricity and gas as well as waste and telecommunications expenses, and is a provider of telecom expense management solutions. Cass extracts, stores, and presents information from freight, energy, telecommunication and environmental invoices, assisting its customers’ transportation, energy, environmental and information technology managers in making decisions that will enable them to improve operating performance. The Company receives data from multiple sources, electronic and otherwise, and processes the data to accomplish the specific operating requirements of its customers. It then provides the data in a central repository for access and archiving. The data is finally transformed into information through the Company’s databases that allow client interaction as required and provide Internet-based tools for analytical processing. The Company also, through Cass Commercial Bank, its St. Louis, Missouri-based bank subsidiary, provides banking services in the St. Louis metropolitan area, Orange County, California, Colorado Springs, Colorado, and other selected cities in the United States. In addition to supporting the Company’s payment operations, the Bank provides banking services to its target markets, which include privately-owned businesses and churches and church-related ministries.
The specific payment and information processing services provided to each customer are developed individually to meet each customer’s requirements, which can vary greatly. In addition, the degree of automation such as electronic data interchange, imaging, work flow, and web-based solutions varies greatly among customers and industries. These factors combine so that pricing varies greatly among the customer base. In general, however, Cass is compensated for its processing services through service fees and investment of account balances generated during the payment process. The amount, type, and calculation of service fees vary greatly by service offering, but generally follow the volume of transactions processed. Interest income from the balances generated during the payment processing cycle is affected by the amount of time Cass holds the funds prior to payment and the dollar volume processed. Both the number of transactions processed and the dollar volume processed are therefore key metrics followed by management. Other factors will also influence revenue and profitability, such as changes in the general level of interest rates, which have a significant effect on net interest income. The funds generated by these processing activities are invested in overnight investments, investment grade securities, and loans generated by the Bank. The Bank earns most of its revenue from net interest income, or the difference between the interest earned on its loans and investments and the interest paid on its deposits and other borrowings. The Bank also assesses fees on other services such as cash management services.
Industry-wide factors that impact the Company include the willingness of large corporations to outsource key business functions such as freight, energy, telecommunication and environmental payment and audit. The benefits that can be achieved by outsourcing transaction processing, and the management information generated by Cass’ systems can be influenced by factors such as the competitive pressures within industries to improve profitability, the general level of transportation costs, deregulation of energy costs, and consolidation of telecommunication providers. Economic factors that impact the Company include the general level of economic activity that can affect the volume and size of invoices processed, the ability to hire and retain qualified staff, and the growth and quality of the loan portfolio. The general level of interest rates also has a significant effect on the revenue of the Company. As discussed in greater detail in Item 7A, “Quantitative and Qualitative Disclosures about Market Risk,” a decline in the general level of interest rates can have a negative impact on net interest income and conversely, a rise in the general level of interest rates can have a positive impact on net interest income. The cost of fuel is another factor that has a significant impact on the transportation sector. As the price of fuel goes up or down, the Company’s earnings increase or decrease with the dollar amount of transportation invoices. Another negative impact of low fuel prices was a significant drop in the number of invoices related to drilling supplies carried by domestic railroads and trucks that move pipes, sand and water for fracking operations.
15
In 2015, total fee revenue and other income increased $3,461,000, or 4%, net interest income after provision for loan losses increased $150,000, or .4%, and total operating expenses increased $4,369,000, or 5%. This positive performance in 2015 was attributable to sales growth generated by new customers and broadened service offerings which helped offset the headwinds created by the challenging economic environment plus the receipt of a one-time litigation settlement of $1.4 million ($800,000 reduction in other operating expenses and $600,000 loan loss recovery) in the fourth quarter of 2015. Gains on sales of investments securities were up significantly by $2,887,000 in 2015 compared to 2014. The asset quality of the Company’s loans and investments as of December 31, 2015 remained strong.
Currently, management views Cass’ major opportunity as the continued expansion of its payment and information processing service offerings and customer base. Management intends to accomplish this by maintaining the Company’s leadership position in applied technology, which when combined with the security and processing controls of the Bank, makes Cass unique in the industry.
Impact of New and Not Yet Adopted Accounting Pronouncements
The new accounting pronouncements are not applicable to the Company and/or do not materially impact the Company.
Critical Accounting Policies
The Company has prepared the consolidated financial statements in this report in accordance with the FASB Accounting Standards Codification (“ASC”). In preparing the consolidated financial statements, management makes estimates and assumptions that affect the reported amount of assets and liabilities, disclosure of contingent assets and liabilities at the date of the financial statements, and the reported amounts of revenue and expenses during the reporting period. These estimates have been generally accurate in the past, have been consistent and have not required any material changes. There can be no assurances that actual results will not differ from those estimates. Certain accounting policies that require significant management estimates and are deemed critical to the Company’s results of operations or financial position have been discussed with the Audit Committee of the Board of Directors and are described below.
Investment in Debt Securities. The Company classifies its debt marketable securities as available-for-sale. Securities classified as available-for-sale are carried at fair value. Unrealized gains and losses, net of the related tax effect, are excluded from earnings and reported in accumulated other comprehensive income, a component of shareholders’ equity. A decline in the fair value of any available-for-sale security below cost that is deemed other than temporary results in a charge to earnings and the establishment of a new cost basis for the security. To determine whether impairment is other than temporary, the Company considers guidance provided in FASB ASC Topic 320, Investments –Debt and Equity Securities. When determining whether a debt security is other-than-temporarily impaired, the Company assesses whether it has the intent to sell the security and whether it is more likely than not that the Company will be required to sell prior to recovery of the amortized cost basis. Evidence considered in this assessment includes the reasons for impairment, the severity and duration of the impairment, changes in value subsequent to year-end and forecasted performance of the investee.
Allowance for Loan Losses. The Company performs periodic and systematic detailed reviews of its loan portfolio to assess overall collectability. The level of the allowance for loan losses reflects management’s estimate of the collectability of the loan portfolio. Although these estimates are based on established methodologies for determining allowance requirements, actual results can differ significantly from estimated results. These policies affect both segments of the Company. The impact and associated risks related to these policies on the Company’s business operations are discussed in the “Provision and Allowance for Loan Losses” section of this report. The Company’s estimates have been materially accurate in the past, and accordingly, the Company expects to continue to utilize the present processes.
Income Taxes. The objectives of accounting for income taxes are to recognize the amount of taxes payable or refundable for the current year and deferred tax liabilities and assets for the future tax consequences of events that have been recognized in an entity's financial statements or tax returns. Judgment is required in addressing the future tax consequences of events that have been recognized in the Company’s financial statements or tax returns such as the realization of deferred tax assets or changes in tax laws or interpretations thereof. In addition, the Company is subject to the continuous examination of its income tax returns by the Internal Revenue Service and other taxing authorities. In accordance with FASB ASC 740, “Income Taxes,” the Company has unrecognized tax benefits related to tax positions taken or expected to be taken. See Item 8, Note 13 to the consolidated financial statements contained herein.
16
Pension Plans. The amounts recognized in the consolidated financial statements related to pension plans are determined from actuarial valuations. Inherent in these valuations are assumptions, including expected return on plan assets, discount rates at which the liabilities could be settled at December 31, 2015, rate of increase in future compensation levels and mortality rates. These assumptions are updated annually and are disclosed in Item 8, Note 10 to the consolidated financial statements. Pursuant to FASB ASC 715, “Compensation – Retirement Benefits” (“ASC 715”), the Company has recognized the funded status of its defined benefit postretirement plan in its balance sheet and has recognized changes in that funded status through comprehensive income. The funded status is measured as the difference between the fair value of the plan assets and the projected benefit obligation as of the date of its fiscal year-end.
Summary of Results
| For the Years Ended December 31, | % Change | |||||||||||||||||
| (In thousands except per share data) | 2015 | 2014 | 2013 | 2015 v. 2014 | 2014 v. 2013 | |||||||||||||
| Total processing volume | 54,521 | 54,741 | 51,397 | (0.4 | )% | 6.5 | % | |||||||||||
| Total processing dollars | $ | 36,264,188 | $ | 38,472,500 | $ | 35,089,708 | (5.7 | ) | 9.6 | |||||||||
| Payment and processing fees | $ | 78,622 | $ | 77,427 | $ | 70,805 | 1.5 | 9.4 | ||||||||||
| Net interest income after provision for | ||||||||||||||||||
| loan losses | $ | 37,449 | $ | 37,299 | $ | 38,245 | 0.4 | (2.5 | ) | |||||||||
| Total net revenue | $ | 120,817 | $ | 117,206 | $ | 114,817 | 3.1 | 2.1 | ||||||||||
| Average earning assets | $ | 1,244,797 | $ | 1,242,549 | $ | 1,198,710 | 0.2 | 3.7 | ||||||||||
| Net interest margin* | 3.38 | % | 3.43 | % | 3.63 | % | ||||||||||||
| Net income | $ | 23,056 | $ | 24,033 | $ | 23,497 | (4.1 | ) | 2.3 | |||||||||
| Diluted earnings per share | $ | 2.00 | $ | 2.06 | $ | 2.02 | (2.9 | ) | 2.0 | |||||||||
| Return on average assets | 1.60 | % | 1.69 | % | 1.74 | % | — | — | ||||||||||
| Return on average equity | 11.65 | % | 12.01 | % | 13.39 | % | — | — | ||||||||||
* Presented on a tax-equivalent basis
The results of 2015 compared to 2014 include the following significant items:
Overall, the Company’s performance was impacted by lingering adverse economic factors including low interest rates, plummeting energy prices and a contraction in U.S. manufacturing output. Total processing dollars fell 6%. The decrease in processing dollars generated smaller investable balances that lowered investment income. The Company received a one-time litigation settlement of $1.4 million ($800,000 reduction in other operating expenses and $600,000 loan loss recovery).
Net interest income after provision for loan losses and average earning assets increased very slightly year over year, primarily due to a negative provision for loan losses of $850,000 in the fourth quarter of 2015.
Gains from the sale of securities were $2,910,000 in 2015 and $23,000 in 2014. Bank service fees increased $91,000, or 8% and other income was down $712,000. Operating expenses increased $4,369,000, or 5%, as the Company incurred higher health insurance costs and retirement plan expenses. Salaries also increased as the Company invested in staff and technology to win and support new business.
The results of 2014 compared to 2013 include the following significant items:
Payment and processing fee revenue increased as the number of transactions processed increased. This positive performance in 2014 was mainly attributed to a large number of new customers in the transportation expense management operation, driven by both successful marketing efforts and the solid market leadership position held by Cass. Conversely, performance in the facility expense management operation was hampered, despite a high number of new customer wins, as competitor consolidation in the energy sector continued to impair customer retention.
Net interest income after provision for loan losses decreased $946,000, or 2%, due to the decrease in the net interest margin on a tax equivalent basis from 3.63% in 2013 to 3.43% in 2014. The increase in average earning assets was the result of increases in accounts and drafts payable and deposits.
Gains from the sale of securities were $23,000 in 2014 and $4,024,000 in 2013. Bank service fees were down $83,000, or 7%, and other income was up $797,000. Operating expenses increased $1,328,000, or 2%, primarily due to salary and technology expense increases.
17
Fee Revenue and Other Income
The Company’s fee revenue is derived mainly from transportation and facility payment and processing fees. As the Company provides its processing and payment services, it is compensated by service fees which are typically calculated on a per-item basis, discounts received for services provided to carriers and by the accounts and drafts payable balances generated in the payment process which can be used to generate interest income. Processing volumes, fee revenue and other income were as follows:
| December 31, | % Change | ||||||||||||||
| (In thousands) | 2015 | 2014 | 2013 | 2015 v. 2014 | 2014 v. 2013 | ||||||||||
| Transportation invoice transaction volume | 33,958 | 34,141 | 31,895 | (0.5 | )% | 7.0 | % | ||||||||
| Transportation invoice dollar volume | $ | 24,534,285 | $ | 25,993,966 | $ | 23,506,097 | (5.6 | ) | 10.6 | ||||||
| Expense management transaction volume* | 20,563 | 20,600 | 19,502 | (0.2 | ) | 5.6 | |||||||||
| Expense management dollar volume* | $ | 11,729,903 | $ | 12,478,534 | $ | 11,583,611 | (6.0 | ) | 7.7 | ||||||
| Payment and processing revenue | $ | 78,622 | $ | 77,427 | $ | 70,805 | 1.5 | 9.4 | |||||||
| Bank service fees | $ | 1,223 | $ | 1,132 | $ | 1,215 | 8.0 | (6.8 | ) | ||||||
| Gains on sales of investment securities | $ | 2,910 | $ | 23 | $ | 4,024 | — | (99.4 | ) | ||||||
| Other | $ | 613 | $ | 1,325 | $ | 528 | (53.7 | ) | 150.9 | ||||||
* Includes energy, telecom and environmental
Fee revenue and other income in 2015 compared to 2014 include the following significant pre-tax components:
The transportation group added new accounts which produced higher transaction volume, but the benefits of that growth were offset by declining activity from existing customers, especially those involved in oil and gas production, resulting in a decrease of less than 1%. Transportation dollar volume fell 6% as lower fuel prices reduced average invoice amounts. The decrease in dollar volume also generated smaller investable balances that reduced investment income and more significantly lowered fees from carrier services. Expense management dollar volume declined as competitor consolidation in the market offset success in growing new accounts. Gains on sales of investment securities increased significantly as the Company took advantage of market gains.
Fee revenue and other income in 2014 compared to 2013 include the following significant pre-tax components:
Transportation transaction volume increased 7% during the year, primarily due to increased activity from new customers. Expense management transaction volume increased 6%. Overall, revenues for the year were up primarily due to new business in the transportation sector. Gains on sales of investment securities were down significantly because the Company held on to its investments.
Net Interest Income
Net interest income is the difference between interest earned on loans, investments, and other earning assets and interest expense on deposits and other interest-bearing liabilities. Net interest income is a significant source of the Company’s revenues. The following table summarizes the changes in tax-equivalent net interest income and related factors:
| December 31, | % Change | |||||||||||||||||
| (In thousands) | 2015 | 2014 | 2013 | 2015 v. 2014 | 2014 v. 2013 | |||||||||||||
| Average earning assets | $ | 1,244,797 | $ | 1,242,549 | $ | 1,198,710 | 0.2 | % | 3.7 | % | ||||||||
| Net interest income* | $ | 42,025 | $ | 42,587 | $ | 43,468 | (1.3 | )% | (2.0 | ) | ||||||||
| Net interest margin* | 3.38 | % | 3.43 | % | 3.63 | % | ||||||||||||
| Yield on earning assets* | 3.55 | % | 3.63 | % | 3.86 | % | ||||||||||||
| Rate on interest bearing liabilities | .51 | % | .58 | % | .69 | % | ||||||||||||
* Presented on a tax-equivalent basis using a tax rate of 35% in all years.
Net interest income in 2015 compared to 2014:
The decrease in net interest income was caused by a decrease in net interest margin. The decrease in net interest margin was due to the lack of satisfactory investment alternatives in this historically low interest rate environment. More information is contained in the tables below and in Item 7A of this report.
Total average loans increased $7,195,000, or 1%, to $671,019,000. Loans have a positive effect on interest income and the net interest margin due to the fact that loans are one of the Company’s highest yielding earning assets for any given maturity.
Total average investment in securities and certificates of deposit increased $12,557,000, or 4%. The investment portfolio will expand and contract over time as the Company manages its liquidity and interest rate position. All purchases were made in accordance with the Company’s investment policy. Interest bearing deposits in other financial institutions decreased $7,189,000, or 5%. Total average federal funds sold and other short-term investments decreased $10,315,000, or 8%.
18
The Bank’s total average interest-bearing deposits decreased $8,059,000, or 2%, compared to the prior year. Average rates paid on interest-bearing liabilities decreased from .58% to .51% as a result of the continued low interest rate environment.
Net interest income in 2014 compared to 2013:
The decrease in net interest income was caused by a decrease in net interest margin. The decrease in net interest margin was due to the lack of satisfactory investment alternatives in this historically low interest rate environment. More information is contained in the tables below and in Item 7A of this report.
Total average loans increased $4,402,000, or less than 1%, to $663,824,000. Loans have a positive effect on interest income and the net interest margin due to the fact that loans are one of the Company’s highest yielding earning assets for any given maturity.
Total average investment in securities increased $26,990,000, or 9%. The investment portfolio will expand and contract over time as the Company manages its liquidity and interest rate position. All purchases were made in accordance with the Company’s investment policy. Interest bearing deposits in other financial institutions increased $14,591,000, or 12%. Total average federal funds sold and other short-term investments decreased $2,144,000, or 2%.
The Bank’s total average interest-bearing deposits increased $11,019,000, or 3%, compared to the prior year. Average rates paid on interest-bearing liabilities decreased from .69% to .58% as a result of the continued low interest rate environment.
Distribution of Assets, Liabilities and Shareholders' Equity; Interest Rate and Interest Differential
The following table contains condensed average balance sheets for each of the periods reported, the tax-equivalent interest income and expense on each category of interest-earning assets and interest-bearing liabilities, and the average yield on such categories of interest-earning assets and the average rates paid on such categories of interest-bearing liabilities for each of the periods reported:
| 2015 | 2014 | 2013 | ||||||||||||||||||||||||||||
| Interest | Interest | Interest | ||||||||||||||||||||||||||||
| Average | Income/ | Yield/ | Average | Income/ | Yield/ | Average | Income/ | Yield/ | ||||||||||||||||||||||
| (In thousands) | Balance | Expense | Rate | Balance | Expense | Rate | Balance | Expense | Rate | |||||||||||||||||||||
| Assets1 | ||||||||||||||||||||||||||||||
| Earning assets | ||||||||||||||||||||||||||||||
| Loans2, 3: | ||||||||||||||||||||||||||||||
| Taxable | $ | 649,472 | $ | 28,049 | 4.32 | % | $ | 647,896 | $ | 29,316 | 4.52 | % | $ | 657,385 | $ | 32,078 | 4.88 | % | ||||||||||||
| Tax-exempt4 | 21,547 | 954 | 4.43 | 15,928 | 630 | 3.96 | 2,037 | 49 | 2.45 | |||||||||||||||||||||
| Securities5: | ||||||||||||||||||||||||||||||
| Taxable | 1,168 | 21 | 1.8 | 1,095 | 21 | 1.92 | 1,068 | 21 | 1.97 | |||||||||||||||||||||
| Tax-exempt4 | 328,927 | 14,553 | 4.42 | 316,991 | 14,480 | 4.57 | 288,571 | 13,573 | 4.70 | |||||||||||||||||||||
| Certificates of deposit | 4,298 | 17 | 0.4 | 3,750 | 8 | 0.21 | 5,207 | 27 | 0.52 | |||||||||||||||||||||
| Interest-bearing deposits in other | ||||||||||||||||||||||||||||||
| financial institutions | 128,074 | 393 | 0.31 | 135,263 | 424 | 0.31 | 120,672 | 398 | 0.33 | |||||||||||||||||||||
| Federal funds sold and other | ||||||||||||||||||||||||||||||
| short-term investments | 111,311 | 150 | 0.13 | 121,626 | 168 | 0.14 | 123,770 | 154 | 0.12 | |||||||||||||||||||||
| Total earning assets | 1,244,797 | 44,137 | 3.55 | 1,242,549 | 45,047 | 3.63 | 1,198,710 | 46,300 | 3.86 | |||||||||||||||||||||
| Non-earning assets | ||||||||||||||||||||||||||||||
| Cash and due from banks | 13,050 | 12,074 | 12,476 | |||||||||||||||||||||||||||
| Premise and equipment, net | 18,544 | 14,793 | 12,258 | |||||||||||||||||||||||||||
| Bank owned life insurance | 15,665 | 15,295 | 15,160 | |||||||||||||||||||||||||||
| Goodwill and other | ||||||||||||||||||||||||||||||
| intangibles | 14,187 | 14,593 | 15,078 | |||||||||||||||||||||||||||
| Other assets | 145,178 | 137,503 | 109,695 | |||||||||||||||||||||||||||
| Allowance for loan losses | (11,910 | ) | (11,840 | ) | (11,595 | ) | ||||||||||||||||||||||||
| Total assets | $ | 1,439,511 | $ | 1,424,967 | $ | 1,351,782 | ||||||||||||||||||||||||
| Liabilities and Shareholders’ | ||||||||||||||||||||||||||||||
| Equity1 | ||||||||||||||||||||||||||||||
| Interest-bearing liabilities | ||||||||||||||||||||||||||||||
| Interest-bearing demand | ||||||||||||||||||||||||||||||
| deposits | $ | 330,742 | $ | 1,392 | .42 | % | $ | 317,120 | $ | 1,564 | 0.49 | % | $ | 283,728 | $ | 1,737 | 0.61 | % | ||||||||||||
| Savings deposits | 14,656 | 65 | .44 | 17,073 | 87 | 0.51 | 20,840 | 138 | 0.66 | |||||||||||||||||||||
| Time deposits >=$250 | 15,236 | 189 | 1.24 | 17,715 | 202 | 1.14 | 19,957 | 212 | 1.06 | |||||||||||||||||||||
| Other time deposits | 54,771 | 465 | .85 | 71,556 | 607 | 0.85 | 87,920 | 745 | 0.85 | |||||||||||||||||||||
| Total interest-bearing deposits | 415,405 | 2,111 | .51 | 423,464 | 2,460 | 0.58 | 412,445 | 2,832 | 0.69 | |||||||||||||||||||||
| Short-term borrowings | 63 | 1 | 1.59 | 6 | — | — | 3 | — | — | |||||||||||||||||||||
| Total interest-bearing liabilities | 415,468 | 2,112 | .51 | 423,470 | 2,460 | 0.58 | 412,448 | 2,832 | 0.69 | |||||||||||||||||||||
| Non-interest bearing liabilities | ||||||||||||||||||||||||||||||
| Demand deposits | 164,347 | 147,575 | 137,665 | |||||||||||||||||||||||||||
| Accounts and drafts payable | 632,604 | 643,077 | 600,611 | |||||||||||||||||||||||||||
| Other liabilities | 29,239 | 10,696 | 25,617 | |||||||||||||||||||||||||||
| Total liabilities | 1,241,658 | 1,224,818 | 1,176,341 | |||||||||||||||||||||||||||
| Shareholders’ equity | 197,853 | 200,149 | 175,441 | |||||||||||||||||||||||||||
| Total liabilities and share- | ||||||||||||||||||||||||||||||
| holders’ equity | $ | 1,439,511 | $ | 1,424,967 | $ | 1,351,782 | ||||||||||||||||||||||||
| Net interest income | $ | 42,025 | $ | 42,587 | $ | 43,468 | ||||||||||||||||||||||||
| Net interest margin | 3.38 | % | 3.43 | % | 3.63 | % | ||||||||||||||||||||||||
| Interest spread | 3.04 | % | 3.05 | % | 3.17 | % | ||||||||||||||||||||||||
| 1 |
Balances shown are daily averages. |
| 2 |
For purposes of these computations, nonaccrual loans are included in the average loan amounts outstanding. Interest on nonaccrual loans is recorded when received as discussed further in Item 8, Note 1 of this report. |
| 3 |
Interest income on loans includes net loan fees of $469,000, $325,000, and $339,000 for 2015, 2014 and 2013, respectively. |
| 4 |
Interest income is presented on a tax-equivalent basis assuming a tax rate 35% in all years. The tax-equivalent adjustment was approximately $5,427,000, $5,288,000 and $4,723,000 for 2015, 2014 and 2013, respectively. |
| 5 |
For purposes of these computations, yields on investment securities are computed as interest income divided by the average amortized cost of the investments. |
19
Analysis of Net Interest Income Changes
The following table presents the changes in interest income and expense between years due to changes in volume and interest rates.
| 2015 Over 2014 | 2014 Over 2013 | |||||||||||||||||||||||
| (In thousands) | Volume1 | Rate1 | Total | Volume1 | Rate1 | Total | ||||||||||||||||||
| Increase (decrease) in interest income: | ||||||||||||||||||||||||
| Loans2,3: | ||||||||||||||||||||||||
| Taxable | $ | 71 | $ | (1,338 | ) | $ | (1,267 | ) | $ | (457 | ) | $ | (2,305 | ) | $ | (2,762 | ) | |||||||
| Tax-exempt4 | 243 | 81 | 324 | 533 | 48 | 581 | ||||||||||||||||||
| Securities: | ||||||||||||||||||||||||
| Taxable | 1 | (1 | ) | — | 1 | (1 | ) | — | ||||||||||||||||
| Tax-exempt4 | 536 | (463 | ) | 73 | 1,307 | (400 | ) | 907 | ||||||||||||||||
| Certificates of deposit | 1 | 8 | 9 | (6 | ) | (13 | ) | (19 | ) | |||||||||||||||
| Interest-bearing deposits in other | ||||||||||||||||||||||||
| financial institutions | (22 | ) | (9 | ) | (31 | ) | 46 | (20 | ) | 26 | ||||||||||||||
| Federal funds sold and other short-term | ||||||||||||||||||||||||
| investments | (14 | ) | (4 | ) | (18 | ) | (3 | ) | 17 | 14 | ||||||||||||||
| Total interest income | $ | 816 | $ | (1,726 | ) | $ | (910 | ) | $ | 1,421 | $ | (2,674 | ) | $ | (1,253 | ) | ||||||||
| Interest expense on: | ||||||||||||||||||||||||
| Interest-bearing demand deposits | $ | 65 | $ | (237 | ) | $ | (172 | ) | $ | 189 | $ | (362 | ) | $ | (173 | ) | ||||||||
| Savings deposits | (11 | ) | (11 | ) | (22 | ) | (22 | ) | (29 | ) | (51 | ) | ||||||||||||
| Time deposits >=$250 | (30 | ) | 17 | (13 | ) | (25 | ) | 15 | (10 | ) | ||||||||||||||
| Other time deposits | (143 | ) | 1 | (142 | ) | (139 | ) | 1 | (138 | ) | ||||||||||||||
| Short-term borrowings | 1 | — | 1 | — | — | — | ||||||||||||||||||
| Total interest expense | (118 | ) | (230 | ) | (348 | ) | 3 | (375 | ) | (372 | ) | |||||||||||||
| Net interest income | $ | 934 | $ | (1,496 | ) | $ | (562 | ) | $ | 1,418 | $ | (2,299 | ) | $ | (881 | ) | ||||||||
| 1 |
The change in interest due to the combined rate/volume variance has been allocated in proportion to the absolute dollar amounts of the change in each. |
| 2 |
Average balances include nonaccrual loans. |
| 3 |
Interest income includes net loan fees. |
| 4 |
Interest income is presented on a tax-equivalent basis assuming a tax rate 35% in all years. |
20
Loan Portfolio
Interest earned on the loan portfolio is a primary source of income for the Company. The loan portfolio was $659,055,000 and represented 45% of the Company's total assets as of December 31, 2015 and generated $28,669,000 in revenue during the year then ended. The Company had no sub-prime mortgage loans or residential development loans in its portfolio for any of the years presented. The following tables show the composition of the loan portfolio at the end of the periods indicated and remaining maturities for loans as of December 31, 2015.
| Loans by Type | December 31, | ||||||||||||||
| (In thousands) | 2015 | 2014 | 2013 | 2012 | 2011 | ||||||||||
| Commercial and industrial | $ | 193,430 | $ | 203,350 | $ | 171,304 | $ | 160,862 | $ | 136,916 | |||||
| Real estate (commercial and church): | |||||||||||||||
| Mortgage | 415,564 | 423,641 | 455,190 | 502,961 | 488,574 | ||||||||||
| Construction | 30,139 | 18,612 | 16,449 | 23,475 | 45,564 | ||||||||||
| Industrial Revenue Bond | 19,831 | 23,348 | 9,167 | — | — | ||||||||||
| Other | 91 | 395 | 67 | 435 | 511 | ||||||||||
| Total loans | $ | 659,055 | $ | 669,346 | $ | 652,177 | $ | 687,733 | $ | 671,565 | |||||
| Loans by Maturity | |||||||||||||||||||||
| (At December 31, 2015) | |||||||||||||||||||||
| One Year | Over 1 Year | Over | |||||||||||||||||||
| Or Less | Through 5 Years | 5 Years | |||||||||||||||||||
| Fixed | Floating | Fixed | Floating | Fixed | Floating | ||||||||||||||||
| (In thousands) | Rate | Rate1 | Rate | Rate1 | Rate | Rate1 | Total | ||||||||||||||
| Commercial and industrial | $ | 4,622 | $ | 79,358 | $ | 32,437 | $ | 31,924 | $ | 8,585 | $ | 36,504 | $ | 193,430 | |||||||
| Real Estate: | |||||||||||||||||||||
| Mortgage | 31,746 | 8,349 | 291,237 | 15,298 | 47,378 | 21,556 | 415,564 | ||||||||||||||
| Construction | 5,802 | 19,752 | 4,585 | — | — | — | 30,139 | ||||||||||||||
| Industrial Revenue Bonds | — | — | 9,857 | — | 9,974 | — | 19,831 | ||||||||||||||
| Other | — | 91 | — | — | — | — | 91 | ||||||||||||||
| Total loans | $ | 42,170 | $ | 107,550 | $ | 338,116 | $ | 47,222 | $ | 65,937 | $ | 58,060 | $ | 659,055 | |||||||
| 1 |
Loans have been classified as having "floating" interest rates if the rate specified in the loan varies with the prime commercial rate of interest. Note: Due to the historically low interest rates, the Company instituted a 4% floor for its prime lending rate. |
The Company has no concentrations of loans exceeding 10% of total loans, which are not otherwise disclosed in the loan portfolio composition table and as are discussed in Item 8, Note 4, of this report. As can be seen in the loan composition table above and as discussed in Item 8, Note 4, the Company's primary market niche for banking services is privately held businesses and churches and church-related ministries.
Loans to commercial entities are generally secured by the business assets of the borrower, including accounts receivable, inventory, machinery and equipment, and the real estate from which the borrower operates. Operating lines of credit to these companies generally are secured by accounts receivable and inventory, with specific percentages of each determined on a customer-by-customer basis based on various factors including the type of business. Intermediate term credit for machinery and equipment is generally provided at some percentage of the value of the equipment purchased, depending on the type of machinery or equipment purchased by the entity. Loans secured exclusively by real estate to businesses and churches are generally made with a maximum 80% loan to value ratio, depending upon the Company's estimate of the resale value and ability of the property to generate cash. The Company's loan policy requires an independent appraisal for all loans over $250,000 secured by real estate. Company management monitors the local economy in an attempt to determine whether it has had a significant deteriorating effect on such real estate loans. When problems are identified, appraised values are updated on a continual basis, either internally or through an updated external appraisal.
Loan portfolio changes from December 31, 2014 to December 31, 2015:
Total loans decreased $10,291,000, or 2%, to $659,055,000. Additional details regarding the types and maturities of loans in the loan portfolio are contained in the tables above and in Item 8, Note 4.
Loan portfolio changes from December 31, 2013 to December 31, 2014:
Total loans increased $17,169,000, or 3%, to $669,346,000. Additional details regarding the types and maturities of loans in the loan portfolio are contained in the tables above and in Item 8, Note 4.
21
Provision and Allowance for Loan Losses (ALLL)
The Company recorded ($850,000) provision for loan losses in 2015, $0 in 2014 and $500,000 in 2013. The amount of the provisions for loan losses was derived from the Company’s quarterly analysis of the allowance for loan losses. The amount of the provision will fluctuate as determined by these quarterly analyses. The Company had net loan (recoveries) charge-offs of ($591,000), ($215,000), and $1,178,000 in 2015, 2014, and 2013, respectively. The ALLL was $11,635,000 at December 31, 2015 compared to $11,894,000 at December 31, 2014 and $11,679,000 at December 31, 2013. The year-end 2015 allowance represented 1.8% of outstanding loans, the same as year-end 2014 and 2013. From December 31, 2014 to December 31, 2015, the level of nonperforming loans increased $2,647,000 from $488,000 to $3,135,000, which represents .48% of outstanding loans. Nonperforming loans are more fully explained in the section entitled “Nonperforming Assets.”
The ALLL has been established and is maintained to absorb reasonably estimated and probable losses in the loan portfolio. An ongoing assessment is performed to determine if the balance is adequate. Charges or credits are made to expense to cover any deficiency or reduce any excess, as required. The current methodology consists of two components: 1) estimated credit losses on individually evaluated loans that are determined to be impaired in accordance with FASB ASC 310, “Allowance for Credit Losses” and 2) estimated credit losses inherent in the remainder of the loan portfolio in accordance with FASB ASC 450, “Contingencies.” Estimated credit losses is an estimate of the current amount of loans that is probable the Company will be unable to collect according to the original terms.
For loans that are individually evaluated, the Company uses two impairment measurement methods: 1) the present value of expected future cash flows and 2) collateral value. For the remainder of the portfolio, the Company groups loans with similar risk characteristics into eight segments and applies historical loss rates to each segment based on a four fiscal-year look-back period. In addition, qualitative factors including credit concentration risk, national and local economic conditions, nature and volume of loan portfolio, legal and regulatory factors, downturns in specific industries including losses in collateral value, trends in credit quality at the Company and in the banking industry and trends in risk-rating agencies are also considered.
The Company also utilizes ratio analysis to evaluate the overall reasonableness of the ALLL compared to its peers and required levels of regulatory capital. Federal and state agencies review the Company’s methodology for maintaining the ALLL. These agencies may require the Company to adjust the ALLL based on their judgments and interpretations about information available to them at the time of their examinations.
The following schedule summarizes activity in the ALLL and the allocation of the allowance to the Company’s loan categories.
Summary of Loan Loss Experience
| December 31, | ||||||||||||||||||||
| (In thousands) | 2015 | 2014 | 2013 | 2012 | 2011 | |||||||||||||||
| Allowance at beginning of year | $ | 11,894 | $ | 11,679 | $ | 12,357 | $ | 12,954 | $ | 11,891 | ||||||||||
| Loans charged-off: | ||||||||||||||||||||
| Commercial and industrial | 30 | — | 1,307 | 1,546 | 1,118 | |||||||||||||||
| Real estate (commercial and church): | ||||||||||||||||||||
| Mortgage | — | 76 | 233 | 1,562 | 28 | |||||||||||||||
| Construction | — | — | — | — | — | |||||||||||||||
| Other | — | 3 | — | — | — | |||||||||||||||
| Total loans charged-off | 30 | 79 | 1,540 | 3,108 | 1,146 | |||||||||||||||
| Recoveries of loans previously charged-off: | ||||||||||||||||||||
| Commercial and industrial | 610 | 41 | 47 | 111 | 58 | |||||||||||||||
| Real estate (commercial and church): | ||||||||||||||||||||
| Mortgage | 10 | 252 | 315 | — | 1 | |||||||||||||||
| Construction | — | — | — | — | — | |||||||||||||||
| Other | 1 | 1 | — | — | — | |||||||||||||||
| Total recoveries of loans previously charged-off | 621 | 294 | 362 | 111 | 59 | |||||||||||||||
| Net loans (recovered) charged-off | (591 | ) | (215 | ) | 1,178 | 2,997 | 1,087 | |||||||||||||
| Provision (credited) charged to expense | (850 | ) | — | 500 | 2,400 | 2,150 | ||||||||||||||
| Allowance at end of year | $ | 11,635 | $ | 11,894 | $ | 11,679 | $ | 12,357 | $ | 12,954 | ||||||||||
| Loans outstanding: | ||||||||||||||||||||
| Average | 671,019 | $ | 663,824 | $ | 659,422 | $ | 684,597 | $ | 695,984 | |||||||||||
| December 31 | 659,055 | 669,346 | 652,177 | 687,733 | 671,565 | |||||||||||||||
| Ratio of allowance for loan losses to loans | ||||||||||||||||||||
| outstanding: | ||||||||||||||||||||
| Average | 1.76 | % | 1.79 | % | 1.77 | % | 1.81 | % | 1.86 | % | ||||||||||
| December 31 | 1.77 | % | 1.78 | % | 1.79 | % | 1.80 | % | 1.93 | % | ||||||||||
| Ratio of net charge-offs to average loans | ||||||||||||||||||||
| outstanding | (.09 | )% | (.03 | )% | .18 | % | .44 | % | .16 | % | ||||||||||
| Allocation of allowance for loan losses1: | ||||||||||||||||||||
| Commercial and industrial | $ | 3,083 | $ | 3,515 | $ | 3,139 | $ | 3,192 | $ | 2,594 | ||||||||||
| Real estate (commercial and church): | ||||||||||||||||||||
| Mortgage | 6,885 | 7,076 | 7,439 | 8,687 | 9,573 | |||||||||||||||
| Construction | 226 | 140 | 124 | 470 | 783 | |||||||||||||||
| Industrial Revenue Bond | 320 | 394 | 155 | — | — | |||||||||||||||
| Other2 | 1,121 | 769 | 822 | 8 | 4 | |||||||||||||||
| Total | $ | 11,635 | $ | 11,894 | $ | 11,679 | $ | 12,357 | $ | 12,954 | ||||||||||
| Percentage of categories to total loans: | ||||||||||||||||||||
| Commercial and industrial | 29.3 | % | 30.4 | % | 26.3 | % | 23.4 | % | 20.4 | % | ||||||||||
| Real estate (commercial and church): | ||||||||||||||||||||
| Mortgage | 63.1 | % | 63.3 | % | 69.8 | % | 73.1 | % | 72.7 | % | ||||||||||
| Construction | 4.6 | % | 2.8 | % | 2.5 | % | 3.4 | % | 6.8 | % | ||||||||||
| Industrial Revenue Bond | 3.0 | % | 3.5 | % | 1.4 | % | — | — | ||||||||||||
| Other | — | % | — | % | — | % | 0.1 | % | 0.1 | % | ||||||||||
| Total | 100.0 | % | 100.0 | % | 100.0 | % | 100.0 | % | 100.0 | % | ||||||||||
| 1 |
Although specific allocations exist, the entire allowance is available to absorb losses in any particular loan category. |
| 2 |
Includes unallocated of $1,121,000 and $767,000 in 2015 and 2014, respectively. |
22
Nonperforming Assets
Nonperforming loans are defined as loans on non-accrual status and loans 90 days or more past due but still accruing. Nonperforming assets include nonperforming loans plus foreclosed real estate. Troubled debt restructurings are not included in nonperforming loans unless they are on non-accrual status or past due 90 days or more.
It is the policy of the Company to continually monitor its loan portfolio and to discontinue the accrual of interest on any loan for which collection is not probable. Subsequent payments received on such loans are applied to principal if collection of principal is not probable; otherwise, these receipts are recorded as interest income. Interest on nonaccrual loans, which would have been recorded under the original terms of the loans, was approximately $390,000 and $108,000 for the years ended December 31, 2015 and 2014, respectively. Of this amount, approximately $34,000 and $77,000 was actually recorded as interest income on such loans during the years ended December 31, 2015 and 2014, respectively.
Total nonaccrual loans at December 31, 2015 consists of three loans totaling $3,135,000 that relate to businesses/churches that have weak financial positions and/or are in liquidation. Allocations of the allowance for loan losses have been established for the estimated loss exposure.
There were no foreclosed assets at December 31, 2015 and December 31, 2014.
The Company does not have any foreign loans. The Company's loan portfolio does not include a significant amount of single family real estate mortgages, as the Company does not market its services to retail customers. Also, the Company had no sub-prime mortgage loans or residential development loans in its portfolio in any of the years presented.
The Company does not have any other interest-earning assets which would have been included in nonaccrual, past due or restructured loans if such assets were loans.
Summary of Nonperforming Assets
| December 31, | |||||||||||||||
| (In thousands) | 2015 | 2014 | 2013 | 2012 | 2011 | ||||||||||
| Commercial and industrial: | |||||||||||||||
| Nonaccrual | $ | — | $ | — | $ | 11 | $ | 1,439 | $ | 56 | |||||
| Contractually past due 90 days or more and still | |||||||||||||||
| accruing | — | — | — | — | — | ||||||||||
| Real estate – mortgage: | |||||||||||||||
| Nonaccrual | 3,135 | 488 | 1,786 | 5,133 | * | 1,653 | |||||||||
| Contractually past due 90 days or more and still | |||||||||||||||
| accruing | — | — | — | — | 29 | ||||||||||
| Total nonperforming loans | $ | 3,135 | $ | 488 | $ | 1,797 | $ | 6,572 | $ | 1,738 | |||||
| Total foreclosed assets | — | — | — | 1,322 | 1,689 | ||||||||||
| Total nonperforming assets | $ | 3,135 | $ | 488 | $ | 1,797 | $ | 7,894 | $ | 3,427 | |||||
| * |
In February 2013, a payment of $4,115,000 was received for one nonaccrual loan with a balance of $4,198,000. $83,000 was charged off. |
23
Operating Expenses
Operating expenses in 2015 compared to 2014 include the following significant pre-tax components:
Salaries and employee benefits expense increased $4,214,000, or 6%, to $70,314,000 as the Company invested in staff and technology to win and support new business. Occupancy expense increased $228,000, or 7%, due to the expansion of the Company’s operating facilities for its transportation and waste management operations. Equipment expense increased $161,000 to $4,291,000 primarily due to depreciation on new furniture and additional systems hardware and software. Amortization of intangibles decreased $75,000 to $408,000. Other operating expense decreased $159,000, or 1%, to $11,370,000 primarily due to a one-time litigation settlement ($800,000 reduction in other operating expenses).
Operating expenses in 2014 compared to 2013 include the following significant pre-tax components:
Salaries and employee benefits expense increased $378,000, or less than 1%, to $66,100,000. Occupancy expense increased $298,000, or 10%, due to the rent escalation on two properties and additional depreciation on building improvements. Equipment expense increased $320,000 to $4,130,000 primarily due to depreciation on new furniture and additional systems software. Amortization of intangibles decreased $52,000 to $483,000. Other operating expense increased $384,000, or 3%, to $11,529,000 primarily due to an increase in outside service fees.
Income Tax Expense
Income tax expense in 2015 totaled $7,978,000 compared to $7,759,000 and $7,234,000 in 2014 and 2013, respectively. When measured as a percent of income, the Company’s effective tax rate was 26% in 2015, 24% in 2014, and 24% in 2013. The effective tax rate varies from year-to-year primarily due to changes in the Company’s pre-tax income and the amount of investment in tax-exempt municipal bonds.
Investment Portfolio
Investment portfolio changes from December 31, 2014 to December 31, 2015:
State and political subdivision securities increased $16,679,000, or 5%, to $369,070,000. The investment portfolio provides the Company with a significant source of earnings, secondary source of liquidity, and mechanisms to manage the effects of changes in loan demand and interest rates. Therefore, the size, asset allocation and maturity distribution of the investment portfolio will vary over time depending on management’s assessment of current and future interest rates, changes in loan demand, changes in the Company’s sources of funds and the economic outlook. During this period, the Company purchased state and political subdivision securities. These securities all had A or better credit ratings and maturities approaching 15 years. With the additional liquidity provided by the increase in deposits and accounts and drafts payable, the Company made these purchases to continue to reduce the level of short-term rate sensitive assets. All purchases were made in accordance with the Company’s investment policy. As of December 31, 2015, the Company had no mortgage-backed securities in its portfolio.
There was no single issuer of securities in the investment portfolio at December 31, 2015 for which the aggregate amortized cost exceeded 10% of total shareholders' equity.
Investments by Type
| December 31, | |||||||||
| (In thousands) | 2015 | 2014 | 2013 | ||||||
| State and political subdivisions | $ | 369,070 | $ | 352,391 | $ | 314,017 | |||
| Certificates of deposit | 6,626 | 3,750 | 3,750 | ||||||
| Total investments | $ | 375,696 | $ | 356,141 | $ | 317,767 | |||
Investment Securities by
Maturity
(At December 31,
2015)
| Within 1 | Over 1 to 5 | Over 5 to | Over | ||||||||||||||||
| (In thousands) | Year | Years | 10 Years | 10 Years | Yield | ||||||||||||||
| State and political subdivisions | $ | 25,201 | $ | 78,329 | $ | 145,780 | $ | 119,760 | 3.88 | % | |||||||||
| Certificates of deposit | 5,750 | 876 | — | — | .63 | % | |||||||||||||
| Total investments | $ | 30,951 | $ | 79,205 | $ | 145,780 | $ | 119,760 | 3.82 | % | |||||||||
| Weighted average yield1 | 3.61 | % | 4.46 | % | 3.62 | % | 3.70 | % | 3.82 | % | |||||||||
| 1 |
Weighted average yield is presented on a tax-equivalent basis assuming a tax rate of 35%. |
Deposits and Accounts and Drafts Payable
Noninterest-bearing demand deposits increased 14% from December 31, 2014 to $181,823,000 at December 31, 2015. The average balances of these deposits increased 11% in 2015 to $164,347,000. These balances are primarily maintained by commercial customers and churches and can fluctuate on a daily basis.
24
Interest-bearing deposits increased $5,461,000, or 1%, to $464,661,000 at December 31, 2015. The average balances of these deposits decreased to $415,405,000 in 2015 from $423,464,000 in 2014.
Accounts and drafts payable generated by the Company in its payment processing operations decreased $78,169,000, or 12%, at December 31, 2014 to $577,259,000 at December 31, 2015. The average balance of these funds decreased $10,473,000, or 2%, to $632,604,000 in 2015. A significant contributing factor to this decline was the drop in energy prices which reduced both the number and amount of invoices processed. Due to the Company’s payment processing cycle, average balances are much more indicative of the underlying activity than period-end balances since point-in-time comparisons can be misleading if the comparison dates fall on different days of the week.
The composition of average deposits and the average rates paid on those deposits is represented in the table entitled “Distribution of Assets, Liabilities and Shareholders' Equity; Interest Rate and Interest Differential” which is included earlier in this discussion. The Company does not have any significant deposits from foreign depositors.
Maturities of Certificates of Deposit as of December 31, 2015
| $100 to Less | $250 or | |||||||||||
| (In thousands) | $100 or Less | Than $250 | More | Total | ||||||||
| Three months or less | $ | 1,932 | $ | 29,778 | $ | 2,084 | $ | 33,794 | ||||
| Three to six months | 1,357 | 10,773 | 2,766 | 14,896 | ||||||||
| Six to twelve months | 665 | 687 | 5,309 | 6,661 | ||||||||
| Over twelve months | 804 | 1,940 | 3,605 | 6,349 | ||||||||
| Total | $ | 4,758 | $ | 43,178 | $ | 13,764 | $ | 61,700 | ||||
Liquidity
The discipline of liquidity management as practiced by the Company seeks to ensure that funds are available to fulfill all payment obligations relating to invoices processed as they become due and meet depositor withdrawal requests and borrower credit demands while at the same time maximizing profitability. This is accomplished by balancing changes in demand for funds with changes in supply of funds. Primary liquidity to meet demand is provided by short-term liquid assets that can be converted to cash, maturing securities and the ability to obtain funds from external sources. The Company's Asset/Liability Committee (“ALCO”) has direct oversight responsibility for the Company's liquidity position and profile. Management considers both on-balance sheet and off-balance sheet items in its evaluation of liquidity.
The balances of liquid assets consist of cash and cash equivalents, which include cash and due from banks, interest-bearing deposits in other financial institutions, federal funds sold, and money market funds, totaled $253,172,000 at December 31, 2015, a decrease of $41,163,000, or 14%, from December 31, 2014. At December 31, 2015, these assets represented 17% of total assets. Cash and cash equivalents are the Company’s and its subsidiaries’ primary source of liquidity to meet future expected and unexpected loan demand, depositor withdrawals or reductions in accounts and drafts payable.
Secondary sources of liquidity include the investment portfolio and borrowing lines. Total investment in debt securities available-for-sale at fair value was $375,696,000 at December 31, 2015, an increase of $19,555,000, or 5%, from December 31, 2014. These assets represented 26% of total assets at December 31, 2015 and were primarily state and political subdivision securities. Of the total portfolio, 8% mature in one year or less, 21% mature after one year through five years and 71% mature after five years. The Company sold $99,347,000 in securities available-for-sale during 2015.
As of December 31, 2015, the Bank had unsecured lines of credit at correspondent banks to purchase federal funds up to a maximum of $78,000,000 at the following banks: Bank of America, $10,000,000; US Bank, $20,000,000; Wells Fargo Bank, $15,000,000; PNC Bank, $12,000,000; Frost National Bank, $10,000,000; JPM Chase Bank, $6,000,000; and UMB Bank $5,000,000. As of December 31, 2015, the Bank had secured lines of credit with the Federal Home Loan Bank (“FHLB”) of $170,195,000 collateralized by commercial mortgage loans. There were no amounts outstanding under any of the lines of credit discussed above at December 31, 2015 or 2014. At December 31, 2015, the Company had a line of credit from UMB Bank of $50,000,000 and First Tennessee Bank of $50,000,000 collateralized by state and political subdivision securities.
The deposits of the Company's banking subsidiary have historically been stable, consisting of a sizable volume of core deposits related to customers that utilize many other commercial products of the Bank. The accounts and drafts payable generated by the Company have also historically been a stable source of funds.
Net cash flows provided by operating activities for the years 2015, 2014 and 2013 were $33,493,000, $34,843,000 and $28,886,000, respectively. Net income plus depreciation and amortization accounts for most of the operating cash provided. Net cash flows from investing and financing activities fluctuate greatly as the Company actively manages its investment and loan portfolios and customer activity influences changes in deposit and accounts and drafts payable balances. Further analysis of the changes in these account balances is discussed earlier in this report. Due to the daily fluctuations in these account balances, management believes that the analysis of changes in average balances, also discussed earlier in this report, can be more indicative of underlying activity than the period-end balances used in the statements of cash flows. Management anticipates that cash and cash equivalents, maturing investments, cash from operations, and borrowing lines will continue to be sufficient to fund the Company’s operations and capital expenditures in 2016. The Company anticipates the annual capital expenditures for 2016 should range from $3 million to $5 million. Capital expenditures in 2016 are expected to consist of equipment and software related to the payment and information processing services business.
25
There are several trends and uncertainties that may impact the Company’s ability to generate revenues and income at the levels that it has in the past. In addition, these trends and uncertainties may impact available liquidity. Those that could significantly impact the Company include the general levels of interest rates, business activity, and energy costs as well as new business opportunities available to the Company.
As a financial institution, a significant source of the Company’s earnings is generated from net interest income. Therefore, the prevailing interest rate environment is important to the Company’s performance. A major portion of the Company’s funding sources are the non-interest bearing accounts and drafts payable generated from its payment and information processing services. Accordingly, higher levels of interest rates will generally allow the Company to earn more net interest income. Conversely, a lower interest rate environment will generally tend to depress net interest income. The Company actively manages its balance sheet in an effort to maximize net interest income as the interest rate environment changes. This balance sheet management impacts the mix of earning assets maintained by the Company at any point in time. For example, in a low interest rate environment, short-term relatively lower rate liquid investments may be reduced in favor of longer term relatively higher yielding investments and loans. If the primary source of liquidity is reduced in a low interest rate environment, a greater reliance would be placed on secondary sources of liquidity including borrowing lines, the ability of the Bank to generate deposits, and the investment portfolio to ensure overall liquidity remains at acceptable levels.
The overall level of economic activity can have a significant impact on the Company’s ability to generate revenues and income, as the volume and size of customer invoices processed may increase or decrease. Lower levels of economic activity decrease both fee income (as fewer invoices are processed) and balances of accounts and drafts payable generated (as fewer invoices are processed) from the Company’s transportation customers.
The relative level of energy costs can impact the Company’s earnings and available liquidity. Lower levels of energy costs will tend to decrease transportation and energy invoice amounts resulting in a corresponding decrease in accounts and drafts payable. Decreases in accounts and drafts payable generate lower interest income and reduce liquidity.
New business opportunities are an important component of the Company’s strategy to grow earnings and improve performance. Generating new customers allows the Company to leverage existing systems and facilities and grow revenues faster than expenses. During 2015, new business was added in both the transportation and facility expense management operations, driven by both successful marketing efforts and the solid market leadership position held by Cass.
Capital Resources
One of management’s primary objectives is to maintain a strong capital base to warrant the confidence of customers, shareholders, and bank regulatory agencies. A strong capital base is needed to take advantage of profitable growth opportunities that arise and to provide assurance to depositors and creditors. The Company and its banking subsidiary continue to exceed all regulatory capital requirements, as evidenced by the capital ratios at December 31, 2015 as shown in Item 8, Note 2 of this report.
In 2015, cash dividends paid were $.85 per share for a total of $9,697,000, an increase of $360,000, or 4%, compared to $.81 per share for a total of $9,337,000 in 2014. The increase is attributable to the per-share amount paid.
Shareholders’ equity was $207,378,000, or 14% of total assets, at December 31, 2015, an increase of $6,946,000 over the balance at December 31, 2014. This increase resulted primarily from net income of $23,056,000 and the pension adjustment per FASB ASC 715 of $3,932,000 offset by the repurchase of treasury shares of $10,591,000 and cash dividends of $9,697,000.
Dividends from the Bank are a source of funds for payment of dividends by the Company to its shareholders. The only restrictions on dividends are those dictated by regulatory capital requirements, state corporate laws and prudent and sound banking principles. As of December 31, 2015, unappropriated retained earnings of $24,208,000 were available at the Bank for the declaration of dividends to the Company without prior approval from regulatory authorities.
The Company maintains a treasury stock buyback program pursuant to which the Board of Directors has authorized the repurchase of up to 500,000 shares of the Company’s common stock. The Company repurchased 216,412 shares at an aggregate cost of $10,591,000 during the year ended December 31, 2015 and 39,502 at an aggregate cost of $1,848,000 during the year ended December 31, 2014. As of December 31, 2015, 476,278 shares remained available for repurchase under the program. A portion of the repurchased shares may be used for the Company's employee benefit plans, and the balance will be available for other general corporate purposes. The stock repurchase authorization does not have an expiration date and the pace of repurchase activity will depend on factors such as levels of cash generation from operations, cash requirements for investments, repayment of debt, current stock price, and other factors. The Company may repurchase shares from time to time on the open market or in private transactions, including structured transactions. The stock repurchase program may be modified or discontinued at any time.
26
Commitments, Contractual Obligations and Off-Balance Sheet Arrangements
In the normal course of business, the Company is party to activities that involve credit, market and operational risk that are not reflected in whole or in part in the Company’s consolidated financial statements. Such activities include traditional off-balance sheet credit-related financial instruments and commitments under operating and capital leases. These financial instruments include commitments to extend credit, commercial letters of credit and standby letters of credit. The Company’s maximum potential exposure to credit loss in the event of nonperformance by the other party to the financial instrument for commitments to extend credit, commercial letters of credit and standby letters of credit is represented by the contractual amounts of those instruments. At December 31, 2015, no amounts have been accrued for any estimated losses for these instruments.
Commitments to extend credit are agreements to lend to a customer as long as there is no violation of any condition established in the contract. Commercial and standby letters of credit are conditional commitments issued by the Company or its subsidiaries to guarantee the performance of a customer to a third party. These off-balance sheet financial instruments generally have fixed expiration dates or other termination clauses and may require payment of a fee. At December 31, 2015, the balance of loan commitments, standby and commercial letters of credit were $11,755,000, $11,581,000 and $1,857,000, respectively. Since some of the financial instruments may expire without being drawn upon, the total amounts do not necessarily represent future cash requirements. Commitments to extend credit and letters of credit are subject to the same underwriting standards as those financial instruments included on the consolidated balance sheets. The Company evaluates each customer’s credit worthiness on a case-by-case basis. The amount of collateral obtained, if deemed necessary upon extension of the credit, is based on management’s credit evaluation of the borrower. Collateral held varies, but is generally accounts receivable, inventory, residential or income-producing commercial property or equipment. In the event of nonperformance, the Company or its subsidiaries may obtain and liquidate the collateral to recover amounts paid under its guarantees on these financial instruments.
The following table summarizes contractual cash obligations of the Company related to operating lease commitments and time deposits at December 31, 2015:
| Amount of Commitment Expiration per Period | |||||||||||||||
| Less than 1 | 1-3 | 3-5 | Over | ||||||||||||
| (In thousands) | Total | Year | Years | Years | 5 Years | ||||||||||
| Operating lease commitments | $ | 6,871 | $ | 1,336 | $ | 2,453 | $ | 1,659 | $ | 1,423 | |||||
| Time deposits | 61,700 | 55,350 | 4,256 | 2,094 | — | ||||||||||
| Total | $ | 68,571 | $ | 56,686 | $ | 6,709 | $ | 3,753 | $ | 1,423 | |||||
During 2015, the Company made no contribution to its noncontributory defined benefit pension plan. In determining pension expense, the Company makes several assumptions, including the discount rate and long-term rate of return on assets. These assumptions are determined at the beginning of the plan year based on interest rate levels and financial market performance. For 2015, these assumptions were as follows:
| Assumption | Rate | |
| Weighted average discount rate | 4.00% | |
| Rate of increase in compensation levels | (a) | |
| Expected long-term rate of return on assets | 6.75% |
| (a) |
6.00% graded down to 3.25% over the first seven years of service. |
ITEM 7A. QUANTITATIVE AND QUALITATIVE DISCLOSURES ABOUT MARKET RISK
Interest Rate Sensitivity
The Company faces market risk to the extent that its net interest income and its fair market value of equity are affected by changes in market interest rates. The asset/liability management discipline as applied by the Company seeks to limit the volatility, to the extent possible, of both net interest income and the fair market value of equity that can result from changes in market interest rates. This is accomplished by limiting the maturities of fixed rate investments, loans, and deposits; matching fixed rate assets and liabilities to the extent possible; and optimizing the mix of fees and net interest income. However, as discussed below, the Company's asset/liability position often differs significantly from most other financial holding companies with significant positive cumulative "gaps" shown for each time horizon presented. This asset sensitive position is caused primarily by the operations of the Company, which generate large balances of accounts and drafts payable. These balances, which are noninterest bearing, contribute to the Company’s historical high net interest margin but cause the Company to become susceptible to changes in interest rates, with a decreasing net interest margin and fair market value of equity in periods of declining interest rates and an increasing net interest margin and fair market value of equity in periods of rising interest rates.
27
The Company’s ALCO measures the Company's interest rate risk sensitivity on a quarterly basis to monitor and manage the variability of earnings and fair market value of equity in various interest rate environments. The ALCO evaluates the Company's risk position to determine whether the level of exposure is significant enough to hedge a potential decline in earnings and value or whether the Company can safely increase risk to enhance returns. The ALCO uses gap reports, 12-month net interest income simulations, and fair market value of equity analyses as its main analytical tools to provide management with insight into the Company's exposure to changing interest rates.
Management uses a gap report to review any significant mismatch between the re-pricing points of the Company’s rate sensitive assets and liabilities in certain time horizons. A negative gap indicates that more liabilities re-price in that particular time frame and, if rates rise, these liabilities will re-price faster than the assets. A positive gap would indicate the opposite. Gap reports can be misleading in that they capture only the re-pricing timing within the balance sheet, and fail to capture other significant risks such as basis risk and embedded options risk. Basis risk involves the potential for the spread relationship between rates to change under different rate environments and embedded options risk relates to the potential for the alteration of the level and/or timing of cash flows given changes in rates.
Another measurement tool used by management is net interest income simulation, which forecasts net interest income during the coming 12 months under different interest rate scenarios in order to quantify potential changes in short-term accounting income. Management has set policy limits specifying acceptable levels of interest rate risk given multiple simulated rate movements. These simulations are more informative than gap reports because they are able to capture more of the dynamics within the balance sheet, such as basis risk and embedded options risk. A table containing simulation results as of December 31, 2015, from an immediate and sustained parallel change in interest rates is shown below.
While net interest income simulations do an adequate job of capturing interest rate risk to short term earnings, they do not capture risk within the current balance sheet beyond 12 months. The Company uses fair market value of equity analyses to help identify longer-term risk that may reside on the current balance sheet. The fair market value of equity is represented by the present value of all future income streams generated by the current balance sheet. The Company measures the fair market value of equity as the net present value of all asset and liability cash flows discounted at forward rates suggested by the current U.S. Treasury curve plus appropriate credit spreads. This representation of the change in the fair market value of equity under different rate scenarios gives insight into the magnitude of risk to future earnings due to rate changes. Management has set policy limits relating to declines in the market value of equity. The table below contains the analysis, which illustrates the effects of an immediate and sustained parallel change in interest rates as of December 31, 2015:
| Change in Interest Rates | % Change in Net Interest Income | % Change in Fair Market Value of Equity | ||
| +200 basis points | 3% | 7% | ||
| +100 basis points | 2% | 4% | ||
| Stable rates | — | — | ||
| -100 basis points | (2%) | (3%) | ||
| -200 basis points | (4%) | (4%) |
28
Interest Rate Sensitivity Position
The following table presents the Company’s interest rate risk position at December 31, 2015 for the various time periods indicated:
| Variable | 0-90 | 91-180 | 181-364 | 1-5 | Over | ||||||||||||||||||
| (In thousands) | Rate | Days | Days | Days | Years | 5 Years | Total | ||||||||||||||||
| Earning assets: | |||||||||||||||||||||||
| Loans: | |||||||||||||||||||||||
| Taxable | $ | 212,832 | $ | 42,170 | $ | — | $ | — | $ | 328,259 | $ | 55,963 | $ | 639,224 | |||||||||
| Tax-exempt | — | — | — | — | 9,857 | 9,974 | 19,831 | ||||||||||||||||
| Securities1: | |||||||||||||||||||||||
| Tax-exempt | — | 25,201 | — | — | 78,329 | 265,540 | 369,070 | ||||||||||||||||
| Certificates of deposit | — | — | — | 5,750 | 876 | — | 6,626 | ||||||||||||||||
| Investments in the FHLB | |||||||||||||||||||||||
| and FRB | 1,189 | — | — | — | — | — | 1,189 | ||||||||||||||||
| Federal funds sold and other | |||||||||||||||||||||||
| short-term investments | 244,157 | — | — | — | — | — | 244,157 | ||||||||||||||||
| Total earning assets | $ | 458,178 | $ | 67,371 | $ | — | $ | 5,750 | $ | 417,321 | $ | 331,477 | $ | 1,280,097 | |||||||||
| Interest-sensitive liabilities: | |||||||||||||||||||||||
| Money market accounts | $ | 250,599 | $ | — | $ | — | $ | — | $ | — | $ | — | $ | 250,599 | |||||||||
| Now accounts | 135,604 | — | — | — | — | — | 135,604 | ||||||||||||||||
| Savings deposits | 16,758 | — | — | — | — | — | 16,758 | ||||||||||||||||
| Time deposits: | |||||||||||||||||||||||
| $250K and more | — | 2,084 | 2,766 | 5,309 | 3,605 | — | 13,764 | ||||||||||||||||
| Less than $250K | — | 31,709 | 12,129 | 1,353 | 2,745 | — | 47,936 | ||||||||||||||||
| Federal funds purchased and | |||||||||||||||||||||||
| other short-term borrowing | — | — | — | — | — | — | — | ||||||||||||||||
| Total interest-bearing liabilities | $ | 402,961 | $ | 33,793 | $ | 14,895 | $ | 6,662 | $ | 6,350 | $ | — | $ | 464,661 | |||||||||
| Interest sensitivity gap: | |||||||||||||||||||||||
| Periodic | $ | 55,217 | $ | 33,578 | $ | (14,895 | ) | $ | (912 | ) | $ | 410,971 | $ | 331,477 | $ | 815,346 | |||||||
| Cumulative | 55,217 | 88,795 | 73,900 | 72,988 | 483,959 | 815,436 | 815,436 | ||||||||||||||||
| Ratio of interest-bearing assets | |||||||||||||||||||||||
| to interest-bearing liabilities: | |||||||||||||||||||||||
| Periodic | 1.14 | 1.99 | — | 0.86 | 65.72 | — | 2.75 | ||||||||||||||||
| Cumulative | 1.14 | 1.20 | 1.16 | 1.16 | 2.04 | 2.75 | 2.75 | ||||||||||||||||
| 1 |
Balances shown reflect earliest re-pricing date. |
29
ITEM 8. FINANCIAL STATEMENTS AND SUPPLEMENTARY DATA
CASS INFORMATION SYSTEMS,
INC. AND SUBSIDIARIES
CONSOLIDATED BALANCE SHEETS
| December 31, | ||||||||
| (In thousands except share and per share data) | 2015 | 2014 | ||||||
| Assets | ||||||||
| Cash and due from banks | $ | 9,015 | $ | 11,307 | ||||
| Interest-bearing deposits in other financial institutions | 176,405 | 200,966 | ||||||
| Federal funds sold and other short-term investments | 67,752 | 82,062 | ||||||
| Cash and cash equivalents | 253,172 | 294,335 | ||||||
| Securities available-for-sale, at fair value | 375,696 | 356,141 | ||||||
| Loans | 659,055 | 669,346 | ||||||
| Less allowance for loan losses | 11,635 | 11,894 | ||||||
| Loans, net | 647,420 | 657,452 | ||||||
| Premises and equipment, net | 19,648 | 16,909 | ||||||
| Investments in bank-owned life insurance | 15,933 | 15,429 | ||||||
| Payments in excess of funding | 105,526 | 120,227 | ||||||
| Goodwill | 11,590 | 11,590 | ||||||
| Other intangible assets, net | 2,405 | 2,762 | ||||||
| Other assets | 24,116 | 25,886 | ||||||
| Total assets | $ | 1,455,506 | $ | 1,500,731 | ||||
| Liabilities and Shareholders’ Equity | ||||||||
| Liabilities: | ||||||||
| Deposits | ||||||||
| Noninterest-bearing | $ | 181,823 | $ | 158,999 | ||||
| Interest-bearing | 464,661 | 459,200 | ||||||
| Total deposits | 646,484 | 618,199 | ||||||
| Accounts and drafts payable | 577,259 | 655,428 | ||||||
| Other liabilities | 24,385 | 26,672 | ||||||
| Total liabilities | 1,248,128 | 1,300,299 | ||||||
| Shareholders’ Equity: | ||||||||
| Preferred stock, par value $.50 per share; 2,000,000 | ||||||||
| shares authorized and no shares issued | – | – | ||||||
| Common stock, par value $.50 per share; 40,000,000 | ||||||||
| shares authorized, 11,931,147 shares | ||||||||
| issued at December 31, 2015 and 2014 | 5,966 | 5,966 | ||||||
| Additional paid-in capital | 126,290 | 126,169 | ||||||
| Retained earnings | 103,994 | 90,635 | ||||||
| Common shares in treasury, at cost (598,875 and 428,572 | ||||||||
| shares at December 31, 2015 and 2014, respectively) | (22,208 | ) | (12,707 | ) | ||||
| Accumulated other comprehensive loss | (6,664 | ) | (9,631 | ) | ||||
| Total shareholders’ equity | 207,378 | 200,432 | ||||||
| Total liabilities and shareholders’ equity | $ | 1,455,506 | $ | 1,500,731 | ||||
See accompanying notes to consolidated financial statements.
30
CASS INFORMATION SYSTEMS,
INC. AND SUBSIDIARIES
CONSOLIDATED STATEMENTS OF INCOME
| For the Years Ended December 31, | ||||||||||
| (In thousands except per share data) | 2015 | 2014 | 2013 | |||||||
| Fee Revenue and Other Income: | ||||||||||
| Information services payment and processing revenue | $ | 78,622 | $ | 77,427 | $ | 70,805 | ||||
| Bank service fees | 1,223 | 1,132 | 1,215 | |||||||
| Gains on sales of securities | 2,910 | 23 | 4,024 | |||||||
| Other | 613 | 1,325 | 528 | |||||||
| Total fee revenue and other income | 83,368 | 79,907 | 76,572 | |||||||
| Interest Income: | ||||||||||
| Interest and fees on loans | 28,669 | 29,726 | 32,110 | |||||||
| Interest and dividends on securities: | ||||||||||
| Taxable | 38 | 29 | 48 | |||||||
| Exempt from federal income taxes | 9,460 | 9,412 | 8,867 | |||||||
| Interest on federal funds sold and | ||||||||||
| other short-term investments | 543 | 592 | 552 | |||||||
| Total interest income | 38,710 | 39,759 | 41,577 | |||||||
| Interest Expense: | ||||||||||
| Interest on deposits | 2,111 | 2,460 | 2,832 | |||||||
| Total interest expense | 2,111 | 2,460 | 2,832 | |||||||
| Net interest income | 36,599 | 37,299 | 38,745 | |||||||
| Provision for loan losses | (850 | ) | – | 500 | ||||||
| Net interest income after provision for loan losses | 37,449 | 37,299 | 38,245 | |||||||
| Total net revenue | 120,817 | 117,206 | 114,817 | |||||||
| Operating Expense: | ||||||||||
| Salaries and employee benefits | 70,314 | 66,100 | 65,722 | |||||||
| Occupancy | 3,400 | 3,172 | 2,874 | |||||||
| Equipment | 4,291 | 4,130 | 3,810 | |||||||
| Amortization of intangible assets | 408 | 483 | 535 | |||||||
| Other operating | 11,370 | 11,529 | 11,145 | |||||||
| Total operating expense | 89,783 | 85,414 | 84,086 | |||||||
| Income before income tax expense | 31,034 | 31,792 | 30,731 | |||||||
| Income tax expense | 7,978 | 7,759 | 7,234 | |||||||
| Net income | $ | 23,056 | $ | 24,033 | $ | 23,497 | ||||
| Basic Earnings Per Share | $ | 2.03 | $ | 2.09 | $ | 2.05 | ||||
| Diluted Earnings Per Share | 2.00 | 2.06 | 2.02 | |||||||
See accompanying notes to consolidated financial statements.
31
CASS INFORMATION SYSTEMS,
INC. AND SUBSIDIARIES
CONSOLIDATED STATEMENTS OF COMPREHENSIVE INCOME
| For the Years Ended December 31, | ||||||||||||
| (In thousands) | 2015 | 2014 | 2013 | |||||||||
| Comprehensive income: | ||||||||||||
| Net income | $ | 23,056 | $ | 24,033 | $ | 23,497 | ||||||
| Other comprehensive income: | ||||||||||||
| Net unrealized gain (loss) on securities available-for-sale | 1,527 | 8,333 | (10,748 | ) | ||||||||
| Tax effect | (567 | ) | (3,096 | ) | 3,993 | |||||||
| Reclassification adjustments for gains included in | ||||||||||||
| net income | (2,910 | ) | (23 | ) | (4,024 | ) | ||||||
| Tax effect | 1,081 | 8 | 1,408 | |||||||||
| FASB ASC 715 adjustment | 6,256 | (14,621 | ) | 15,674 | ||||||||
| Tax effect | (2,324 | ) | 5,432 | (5,823 | ) | |||||||
| Foreign currency translation adjustments | (96 | ) | (104 | ) | 53 | |||||||
| Total comprehensive income | $ | 26,023 | $ | 19,962 | $ | 24,030 | ||||||
See accompanying notes to consolidated financial statements.
32
CASS INFORMATION SYSTEMS,
INC. AND SUBSIDIARIES
CONSOLIDATED STATEMENTS OF CASH FLOWS
| For the Years Ended December 31, | ||||||||||||
| (In thousands) | 2015 | 2014 | 2013 | |||||||||
| Cash Flows From Operating Activities: | ||||||||||||
| Net income | $ | 23,056 | $ | 24,033 | $ | 23,497 | ||||||
| Adjustments to reconcile net income to net cash provided | ||||||||||||
| by operating activities: | ||||||||||||
| Depreciation and amortization | 8,859 | 8,181 | 7,346 | |||||||||
| Net gains on sales of securities | (2,910 | ) | (23 | ) | (4,024 | ) | ||||||
| Stock-based compensation expense | 2,059 | 2,041 | 1,975 | |||||||||
| Provisions for loan losses | (850 | ) | – | 500 | ||||||||
| Deferred income tax expense (benefit) | (137 | ) | (621 | ) | 57 | |||||||
| (Decrease) increase in income tax liability | 47 | (24 | ) | (964 | ) | |||||||
| Increase in pension liability | 4,550 | 2,282 | 2,822 | |||||||||
| Other operating activities, net | (1,181 | ) | (1,026 | ) | (2,323 | ) | ||||||
| Net cash provided by operating activities | 33,493 | 34,843 | 28,886 | |||||||||
| Cash Flows From Investing Activities: | ||||||||||||
| Proceeds from sales of securities available-for-sale | 99,347 | 587 | 95,742 | |||||||||
| Proceeds from maturities of securities available-for-sale | 38,460 | 18,340 | 18,117 | |||||||||
| Purchase of securities available-for-sale | (161,279 | ) | (54,054 | ) | (104,351 | ) | ||||||
| Net decrease (increase) in loans | 10,882 | (16,954 | ) | 34,378 | ||||||||
| Decrease (increase) in payments in excess of funding | 14,701 | (42,577 | ) | (14,128 | ) | |||||||
| Purchases of premises and equipment, net | (5,747 | ) | (6,291 | ) | (4,857 | ) | ||||||
| Net cash (used in) provided by investing activities | (3,636 | ) | (100,949 | ) | 24,901 | |||||||
| Cash Flows From Financing Activities: | ||||||||||||
| Net increase (decrease) in noninterest-bearing demand deposits | 22,824 | 15,158 | (302 | ) | ||||||||
| Net increase in interest-bearing demand and savings deposits | 23,536 | 39,766 | 32,645 | |||||||||
| Net decrease in time deposits | (18,075 | ) | (19,221 | ) | (13,555 | ) | ||||||
| Net (decrease) increase in accounts and drafts payable | (78,169 | ) | 111,475 | 21,192 | ||||||||
| Cash dividends paid | (9,697 | ) | (9,337 | ) | (8,510 | ) | ||||||
| Purchase of common shares for treasury | (10,951 | ) | (1,848 | ) | – | |||||||
| Other financing activities, net | (488 | ) | (814 | ) | (1,083 | ) | ||||||
| Net cash (used in) provided by financing activities | (71,020 | ) | 135,179 | 30,387 | ||||||||
| Net (decrease) increase in cash and cash equivalents | (41,163 | ) | 69,073 | 84,174 | ||||||||
| Cash and cash equivalents at beginning of year | 294,335 | 225,262 | 141,088 | |||||||||
| Cash and cash equivalents at end of year | $ | 253,172 | $ | 294,335 | $ | 225,262 | ||||||
| Supplemental information: | ||||||||||||
| Cash paid for interest | $ | 2,133 | $ | 2,491 | $ | 2,855 | ||||||
| Cash paid for income taxes | 8,190 | 8,476 | 8,265 | |||||||||
See accompanying notes to consolidated financial statements.
33
CASS INFORMATION
SYSTEMS, INC. AND SUBSIDIARIES
CONSOLIDATED STATEMENTS OF SHAREHOLDERS’ EQUITY
| Accumulated | |||||||||||||||||||||||
| Additional | Other | ||||||||||||||||||||||
| Common | Paid-in | Retained | Treasury | Comprehensive | |||||||||||||||||||
| (In thousands except per share data) | Stock | Capital | Earnings | Stock | Income (Loss) | Total | |||||||||||||||||
| Balance, December 31, 2012 | $ | 5,966 | $ | 125,086 | $ | 60,952 | $ | (11,896 | ) | $ | (6,093 | ) | $ | 174,015 | |||||||||
| Net income | 23,497 | 23,497 | |||||||||||||||||||||
| Cash dividends ($.74 per share) | (8,510 | ) | (8,510 | ) | |||||||||||||||||||
| Issuance of 30,407 common shares pursuant | |||||||||||||||||||||||
| to stock-based compensation plan, net | (755 | ) | 508 | (247 | ) | ||||||||||||||||||
| Exercise of stock options and SARs | (1,244 | ) | 408 | (836 | ) | ||||||||||||||||||
| Stock-based compensation expense | 1,975 | 1,975 | |||||||||||||||||||||
| Other comprehensive income | 533 | 533 | |||||||||||||||||||||
| Balance, December 31, 2013 | $ | 5,966 | $ | 125,062 | $ | 75,939 | $ | (10,980 | ) | $ | (5,560 | ) | $ | 190,427 | |||||||||
| Net income | 24,033 | 24,033 | |||||||||||||||||||||
| Cash dividends ($.81 per share) | (9,337 | ) | (9,337 | ) | |||||||||||||||||||
| Issuance of 22,629 common shares pursuant | |||||||||||||||||||||||
| to stock-based compensation plan, net | (594 | ) | (38 | ) | (632 | ) | |||||||||||||||||
| Exercise of SARs | (340 | ) | 159 | (181 | ) | ||||||||||||||||||
| Stock-based compensation expense | 2,041 | 2,041 | |||||||||||||||||||||
| Purchase of 39,502 common shares | (1,848 | ) | (1,848 | ) | |||||||||||||||||||
| Other comprehensive loss | (4,071 | ) | (4,071 | ) | |||||||||||||||||||
| Balance, December 31, 2014 | $ | 5,966 | $ | 126,169 | $ | 90,635 | $ | (12,707 | ) | $ | (9,631 | ) | $ | 200,432 | |||||||||
| Net income | 23,056 | 23,056 | |||||||||||||||||||||
| Cash dividends ($.85 per share) | (9,697 | ) | (9,697 | ) | |||||||||||||||||||
| Issuance of 42,786 common shares pursuant | |||||||||||||||||||||||
| to stock-based compensation plan, net | (1,250 | ) | 797 | (453 | ) | ||||||||||||||||||
| Exercise of SARs | (687 | ) | 293 | (394 | ) | ||||||||||||||||||
| Stock-based compensation expense | 2,058 | 2,058 | |||||||||||||||||||||
| Purchase of 216,412 common shares | (10,591 | ) | (10,591 | ) | |||||||||||||||||||
| Other comprehensive income | 2,967 | 2,967 | |||||||||||||||||||||
| Balance, December 31, 2015 | $ | 5,966 | $ | 126,290 | $ | 103,994 | $ | (22,208 | ) | $ | (6,664 | ) | $ | 207,378 | |||||||||
See accompanying notes to consolidated financial statements.
34
NOTES TO CONSOLIDATED FINANCIAL STATEMENTS
Note
1
Summary of Significant
Accounting Policies
Summary of Operations Cass Information Systems, Inc. (the “Company”) provides payment and information services, which include processing and payment of transportation, energy, telecommunications and environmental invoices. These services include the acquisition and management of data, information delivery and financial exchange. The consolidated balance sheet captions, “Accounts and drafts payable” and “Payments in excess of funding,” represent the Company’s resulting financial position related to the payment services that are performed for customers. The Company also provides a full range of banking services to individual, corporate and institutional customers through Cass Commercial Bank (the “Bank”), its wholly owned bank subsidiary.
Basis of Presentation The accounting and reporting policies of the Company and its subsidiaries conform to U.S. generally accepted accounting principles. The consolidated financial statements include the accounts of the Company and its wholly owned subsidiaries after elimination of intercompany transactions. Certain amounts in the 2014 and 2013 consolidated financial statements have been reclassified to conform to the 2015 presentation. Such reclassifications have no effect on previously reported net income or shareholders’ equity.
Use of Estimates In preparing the consolidated financial statements, Company management is required to make estimates and assumptions which significantly affect the reported amounts in the consolidated financial statements.
Cash and Cash Equivalents For purposes of the consolidated statements of cash flows, the Company considers cash and due from banks, interest-bearing deposits in other financial institutions, federal funds sold and other short-term investments as segregated in the accompanying consolidated balance sheets to be cash equivalents.
Investment in Debt Securities The Company classifies its debt marketable securities as available-for-sale. Securities classified as available-for-sale are carried at fair value. Unrealized gains and losses, net of the related tax effect, are excluded from earnings and reported in accumulated other comprehensive income, a component of shareholders’ equity. A decline in the fair value of any available-for-sale security below cost that is deemed other than temporary results in a charge to earnings and the establishment of a new cost basis for the security. To determine whether impairment is other than temporary, the Company considers guidance provided in the Financial Accounting Standards Board (“FASB”) Accounting Standards Codification (“ASC”) Topic 320, Investments –Debt and Equity Securities. When determining whether a debt security is other-than-temporarily impaired, the Company assesses whether it has the intent to sell the security and whether it is more likely than not that the Company will be required to sell prior to recovery of the amortized cost basis. Evidence considered in this assessment includes the reasons for impairment, the severity and duration of the impairment, changes in value subsequent to year-end and forecasted performance of the investee. Premiums and discounts are amortized or accreted to interest income over the estimated lives of the securities using the level-yield method. Interest income is recognized when earned. Gains and losses are calculated using the specific identification method.
Allowance for Loan Losses (ALLL) The ALLL is increased by provisions charged to expense and is available to absorb charge-offs, net of recoveries. Management utilizes a systematic, documented approach in determining the appropriate level of the ALLL. Management’s approach provides for estimated credit losses on individually evaluated loans in accordance with FASB ASC 310, “Allowance for Credit Losses” (“ASC 310”). These estimates are based upon a number of factors, such as payment history, financial condition of the borrower, expected future cash flows and discounted collateral exposure.
Estimated credit losses inherent in the remainder of the portfolio are estimated in accordance with FASB ASC 450, “Contingencies.” These loans are segmented into groups based on similar risk characteristics. Historical loss rates for each risk group, which are updated quarterly, are generally quantified using all recorded loan charge-offs and recoveries over a prescribed look-back period. These historical loss rates for each risk group are used as the starting point to determine the level of the allowance. The Company’s methodology incorporates an estimated loss emergence period for each risk group. The loss emergence period is the period of time from when a borrower experiences a loss event and when the actual loss is recognized in the financial statements, generally at the time of initial charge-off of the loan balance. The Company’s methodology also includes qualitative risk factors that allow management to adjust its estimates of losses based on the most recent information available and to address other limitations in the quantitative component that is based on historical loss rates. Such risk factors are generally reviewed and updated quarterly, as appropriate, and are adjusted to reflect changes in national and local economic conditions and developments, the volume and severity of delinquent and internally classified loans, loan concentrations, assessment of trends in collateral values, assessment of changes in borrowers’ financial stability, and changes in lending policies and procedures, including underwriting standards and collections, charge-off and recovery practices.
Management believes the ALLL is adequate to absorb probable losses in the loan portfolio. Additionally, various regulatory agencies, as an integral part of their examination process, periodically review the Company’s ALLL. Such agencies may require the Company to increase the ALLL based on their judgments and interpretations about information available to them at the time of their examinations.
35
Premises and Equipment Premises and equipment are stated at cost less accumulated depreciation and amortization. Depreciation is computed over the estimated useful lives of the assets, or the respective lease terms for leasehold improvements, using straight-line and accelerated methods. Estimated useful lives do not exceed 40 years for buildings, the lesser of 10 years or the life of the lease for leasehold improvements and range from 3 to 7 years for software, equipment, furniture and fixtures. Maintenance and repairs are charged to expense as incurred.
Intangible Assets Cost in excess of fair value of net assets acquired has resulted from business acquisitions. Goodwill and intangible assets with indefinite useful lives are not amortized, but instead are tested for impairment at least annually. Intangible assets with definite useful lives are amortized on a straight-line basis over their respective estimated useful lives.
Periodically, the Company reviews intangible assets for events or changes in circumstances that may indicate that the carrying amount of the assets may not be recoverable. Based on those reviews, adjustments of recorded amounts have not been required.
Non-marketable Equity Investments The Company accounts for non-marketable equity investments, in which it holds less than a 20% ownership, under the cost method. Under the cost method of accounting, investments are carried at cost and are adjusted only for other than temporary declines in fair value, distributions of earnings and additional investments. The Company periodically evaluates whether any declines in fair value of its investments are other than temporary. In performing this evaluation, the Company considers various factors including any decline in market price, where available, the investee's financial condition, results of operations, operating trends and other financial ratios. Non-marketable equity investments are included in other assets on the consolidated balance sheets.
Foreclosed Assets Real estate acquired as a result of foreclosure is initially recorded at fair value less estimated selling costs. Fair value is generally determined through the receipt of appraisals. Any write down to fair value at the time the property is acquired is recorded as a charge-off to the allowance for loan losses. Any decline in the fair value of the property subsequent to acquisition is recorded as a charge to non-interest expense.
Treasury Stock Purchases of the Company’s common stock are recorded at cost. Upon reissuance, treasury stock is reduced based upon the average cost basis of shares held.
Comprehensive Income Comprehensive income consists of net income, changes in net unrealized gains (losses) on available-for-sale securities and pension liability adjustments and is presented in the accompanying consolidated statements of shareholders' equity and consolidated statements of comprehensive income.
Loans Interest on loans is recognized based upon the principal amounts outstanding. It is the Company’s policy to discontinue the accrual of interest when there is reasonable doubt as to the collectability of principal or interest. Subsequent payments received on such loans are applied to principal if there is any doubt as to the collectability of such principal; otherwise, these receipts are recorded as interest income. The accrual of interest on a loan is resumed when the loan is current as to payment of both principal and interest and/or the borrower demonstrates the ability to pay and remain current. Loan origination and commitment fees on originated loans, net of certain direct loan origination costs, are deferred and amortized to interest income using the level-yield method over the estimated lives of the related loans.
Impairment of Loans A loan is considered impaired when it is probable that a creditor will be unable to collect all amounts due, both principal and interest, according to the contractual terms of the loan agreement. When measuring impairment, the expected future cash flows of an impaired loan are discounted at the loan's effective interest rate. Alternatively, impairment could be measured by reference to an observable market price, if one exists, or the fair value of the collateral for a collateral-dependent loan. Regardless of the historical measurement method used, the Company measures impairment based on the fair value of the collateral when the Company determines foreclosure is probable. Additionally, impairment of a restructured loan is measured by discounting the total expected future cash flows at the loan's effective rate of interest as stated in the original loan agreement. The Company uses its nonaccrual methods as discussed above for recognizing interest on impaired loans.
Information Services Revenue A majority of the Company’s revenues are attributable to fees for providing services. These services include transportation invoice rating, payment processing, auditing, and the generation of accounting and transportation information. The Company also processes, pays and generates management information from electric, gas, telecommunications, environmental, and other invoices. The specific payment and information processing services provided to each customer are developed individually to meet each customer’s specific requirements. The Company enters into service agreements with customers typically for fixed fees per transaction that are invoiced monthly. Revenues are recognized in the period services are rendered and earned under the service agreements, as long as collection is reasonably assured.
Income Taxes Deferred tax assets and liabilities are recognized for the estimated future tax consequences attributable to differences between the financial statement carrying amounts of existing assets and liabilities and their respective tax bases.
36
Deferred tax assets and liabilities are measured using enacted tax rates in effect for the year in which those temporary differences are expected to be recovered or settled. Deferred tax assets are reduced if necessary, by a deferred tax asset valuation allowance. In the event that management determines it is more likely than not that it will not be able to realize all or part of net deferred tax assets in the future, the Company adjusts the recorded value of deferred tax assets, which would result in a direct charge to income tax expense in the period that such determination is made. Likewise, the Company will reverse the valuation allowance when realization of the deferred tax asset is expected. The effect on deferred tax assets and liabilities of a change in tax rates is recognized in income in the period that includes the enactment date.
Earnings Per Share Basic earnings per share is computed by dividing net income by the weighted average number of common shares outstanding. Diluted earnings per share is computed by dividing net income by the sum of the weighted average number of common shares outstanding and the weighted average number of potential common shares outstanding.
Stock-Based Compensation The Company follows FASB ASC 718, “Accounting for Stock Options and Other Stock-based Compensation” (“ASC 718”), which requires that all stock-based compensation be recognized as an expense in the financial statements and that such cost be measured at the fair value of the award. FASB ASC 718 also requires that excess tax benefits related to stock option exercises and restricted stock awards be reflected as financing cash inflows instead of operating cash inflows.
Pension Plans The amounts recognized in the consolidated financial statements related to pension are determined from actuarial valuations. Inherent in these valuations are assumptions including expected return on plan assets, discount rates at which the liabilities could be settled at December 31, 2015, rate of increase in future compensation levels and mortality rates. These assumptions are updated annually and are disclosed in Note 10. The Company follows FASB ASC 715, “Compensation – Retirement Benefits” (“ASC 715”), which requires companies to recognize the overfunded or underfunded status of a defined benefit postretirement plan as an asset or liability in its consolidated balance sheet and to recognize changes in that funded status in the year in which the changes occur through comprehensive income. The funded status is measured as the difference between the fair value of the plan assets and the projected benefit obligation as of the date of its fiscal year-end.
Fair Value Measurements The Company follows the provisions of FASB ASC 820, “Fair Value Measurements and Disclosures”, which defines fair value, establishes a framework for measuring fair value in generally accepted accounting principles, and outlines disclosures about fair value measurements. Fair value is defined as the exchange price that would be received for an asset or paid to transfer a liability (an exit price) in the principal or most advantageous market for the asset or liability in an orderly transaction between market participants on the measurement date. A three-level hierarchy for valuation techniques is used to measure financial assets and financial liabilities at fair value. This hierarchy is based on whether the valuation inputs are observable or unobservable. Financial instrument valuations are considered Level 1 when they are based on quoted prices in active markets for identical assets or liabilities. Level 2 financial instrument valuations use quoted prices for similar assets or liabilities, quoted prices in markets that are not active, or other inputs that are observable or can be corroborated by observable market data. Financial instrument valuations are considered Level 3 when they are determined using pricing models, discounted cash flow methodologies or similar techniques and at least one significant model assumption or input is unobservable, and when determination of the fair value requires significant management judgment or estimation. The Company records securities available for sale at their fair values on a recurring basis using Level 2 valuations. Additionally, the Company records impaired loans and other real estate owned at their fair value on a nonrecurring basis. The nonrecurring fair value adjustments typically involve application of lower-of-cost-or-market accounting or impairment write-downs of individual assets.
Impact of New and Not Yet Adopted Accounting Pronouncements
The new accounting pronouncements are not applicable to the Company and/or do not materially impact the Company.
Note
2
Capital Requirements and
Regulatory Restrictions
The Company and the Bank are subject to various regulatory capital requirements administered by the federal banking agencies. Failure to meet minimum capital requirements can result in certain mandatory, and possibly additional discretionary actions by regulators that, if undertaken, could have a direct material effect on the Company’s consolidated financial statements. Under capital adequacy guidelines, the Company and the Bank must meet specific capital guidelines that involve quantitative measures of assets, liabilities and certain off-balance sheet items as calculated under regulatory accounting practices. The Company’s and the Bank’s capital amounts and classifications are also subject to qualitative judgments by the regulators about components, risk weightings and other factors.
Quantitative measures established by regulators to ensure capital adequacy require the Company and the Bank to maintain minimum amounts and ratios of total and Tier I capital and common equity Tier I capital to risk-weighted assets, and of Tier I capital to average assets. Management believes that as of December 31, 2015 and 2014, the Company and the Bank met all capital adequacy requirements to which they are subject.
37
Effective July 2, 2013, the Federal Reserve Board approved final rules known as the “Basel III Capital Rules” that substantially revise the risk-based capital and leverage capital requirements applicable to bank holding companies and depository institutions, including the Company and the Bank. The Basel III Capital Rules implement aspects of the Basel III capital framework agreed upon by the Basel Committee and incorporate changes required by the Dodd-Frank Wall Street Reform and Consumer Protection Act. Among other things, the Basel III Capital Rules establish stricter capital requirements and calculation standards, as well as more restrictive risk weightings for certain loans and facilities. The Basel III Capital Rules were effective for the Company and the Bank on January 1, 2015 (subject to a phase-in period).
The Bank is also subject to the regulatory framework for prompt corrective action. As of December 31, 2015, the most recent notification from the regulatory agencies categorized the Bank as well-capitalized. To be categorized as well-capitalized, the Bank must maintain minimum total risk-based, common equity Tier I risk-based, Tier I risk-based, and Tier I leverage ratios as set forth in the table below. There are no conditions or events since that notification that management believes have changed the Bank’s category.
Subsidiary dividends can be a significant source of funds for payment of dividends by the Company to its shareholders. At December 31, 2015, unappropriated retained earnings of $24,208,000 were available at the Bank for the declaration of dividends to the Company without prior approval from regulatory authorities. However, dividends paid by the Bank to the Company would be prohibited if the effect thereof would cause the Bank’s capital to be reduced below applicable minimum capital requirements.
There were no restricted funds on deposit used to meet regulatory reserve requirements at December 31, 2015 and 2014.
The Company’s and the Bank’s actual and required capital amounts and ratios are as follows (2015 Basel III rules and 2014 Basel I rules):
| Capital | Requirement to be | |||||||||||||||||
| Actual | Requirements | Well-Capitalized | ||||||||||||||||
| (In thousands) | Amount | Ratio | Amount | Ratio | Amount | Ratio | ||||||||||||
| At December 31, 2015 | ||||||||||||||||||
| Total capital (to risk-weighted assets) | ||||||||||||||||||
| Cass Information Systems, Inc. | $ | 212,717 | 23.31 | % | $ | 72,994 | 8.00 | % | $ | N/A | N/A | % | ||||||
| Cass Commercial Bank | 99,872 | 16.90 | 47,281 | 8.00 | 59,102 | 10.00 | ||||||||||||
| Common Equity Tier I Capital (to risk- | ||||||||||||||||||
| weighted assets) | ||||||||||||||||||
| Cass Information Systems, Inc. | 201,312 | 22.06 | 41,059 | 4.50 | N/A | N/A | ||||||||||||
| Cass Commercial Bank | 92,470 | 15.65 | 26,596 | 4.50 | 38,416 | 6.50 | ||||||||||||
| Tier I capital (to risk-weighted assets) | ||||||||||||||||||
| Cass Information Systems, Inc. | 201,312 | 22.06 | 54,746 | 6.00 | N/A | N/A | ||||||||||||
| Cass Commercial Bank | 92,470 | 15.65 | 35,461 | 6.00 | 47,281 | 8.00 | ||||||||||||
| Tier I capital (to average assets) | ||||||||||||||||||
| Cass Information Systems, Inc. | 201,312 | 13.88 | 43,496 | 3.00 | N/A | N/A | ||||||||||||
| Cass Commercial Bank | 92,470 | 13.15 | 21,093 | 3.00 | 35,155 | 5.00 | ||||||||||||
| At December 31, 2014 | ||||||||||||||||||
| Total capital (to risk-weighted assets) | ||||||||||||||||||
| Cass Information Systems, Inc. | $ | 207,468 | 21.91 | % | $ | 75,761 | 8.00 | % | $ | N/A | N/A | % | ||||||
| Cass Commercial Bank | 91,249 | 15.88 | 45,977 | 8.00 | 57,472 | 10.00 | ||||||||||||
| Common Equity Tier I Capital (to risk- | ||||||||||||||||||
| weighted assets) | ||||||||||||||||||
| Cass Information Systems, Inc. | 195,630 | 20.66 | 37,880 | 4.00 | N/A | N/A | ||||||||||||
| Cass Commercial Bank | 84,049 | 14.62 | 22,989 | 4.00 | 34,483 | 6.00 | ||||||||||||
| Tier I capital (to risk-weighted assets) | ||||||||||||||||||
| Cass Information Systems, Inc. | 195,630 | 20.66 | 37,880 | 4.00 | N/A | N/A | ||||||||||||
| Cass Commercial Bank | 84,049 | 14.62 | 22,989 | 4.00 | 34,483 | 6.00 | ||||||||||||
| Tier I capital (to average assets) | ||||||||||||||||||
| Cass Information Systems, Inc. | 195,630 | 13.42 | 43,742 | 3.00 | N/A | N/A | ||||||||||||
| Cass Commercial Bank | 84,049 | 11.94 | 21,124 | 3.00 | 35,207 | 5.00 | ||||||||||||
38
Note
3
Investment in
Securities
Investment securities available-for-sale are recorded at fair value on a recurring basis. The Company’s investment securities available-for-sale at December 31, 2015 and 2014 are measured at fair value using Level 2 valuations. The market evaluation utilizes several sources which include “observable inputs” rather than “significant unobservable inputs” and therefore falls into the Level 2 category. The table below presents the balances of securities available-for-sale measured at fair value on a recurring basis. The amortized cost, gross unrealized gains, gross unrealized losses and fair value of debt and equity securities are summarized as follows:
| December 31, 2015 | ||||||||||||
| Gross | Gross | |||||||||||
| Amortized | Unrealized | Unrealized | ||||||||||
| (In thousands) | Cost | Gains | Losses | Fair Value | ||||||||
| State and political subdivisions | $ | 356,531 | $ | 12,552 | $ | 13 | $ | 369,070 | ||||
| Certificates of deposit | 6,626 | – | – | 6,626 | ||||||||
| Total | $ | 363,157 | $ | 12,552 | $ | 13 | $ | 375,696 | ||||
| December 31, 2014 | ||||||||||||
| Gross | Gross | |||||||||||
| Amortized | Unrealized | Unrealized | ||||||||||
| (In thousands) | Cost | Gains | Losses | Fair Value | ||||||||
| State and political subdivisions | $ | 338,469 | $ | 14,120 | $ | 198 | $ | 352,391 | ||||
| Certificates of deposit | 3,750 | – | – | 3,750 | ||||||||
| Total | $ | 342,219 | $ | 14,120 | $ | 198 | $ | 356,141 | ||||
The fair values of securities with unrealized losses are as follows:
| December 31, 2015 | ||||||||||||||||||
| Less than 12 months | 12 months or more | Total | ||||||||||||||||
| Estimated | Unrealized | Estimated | Unrealized | Estimated | Unrealized | |||||||||||||
| (In thousands) | Fair Value | Losses | Fair Value | Losses | Fair value | Losses | ||||||||||||
| State and political subdivisions | $ | 3,638 | $ | 5 | $ | 1,208 | $ | 8 | $ | 4,846 | $ | 13 | ||||||
| Certificates of deposit | – | – | – | – | – | – | ||||||||||||
| Total | $ | 3,638 | $ | 5 | $ | 1,208 | $ | 8 | $ | 4,846 | $ | 13 | ||||||
| December 31, 2014 | ||||||||||||||||||
| Less than 12 months | 12 months or more | Total | ||||||||||||||||
| Estimated | Unrealized | Estimated | Unrealized | Estimated | Unrealized | |||||||||||||
| (In thousands) | Fair Value | Losses | Fair Value | Losses | Fair value | Losses | ||||||||||||
| State and political subdivisions | $ | 8,700 | $ | 15 | $ | 13,833 | $ | 183 | $ | 22,533 | $ | 198 | ||||||
| Certificates of deposit | – | – | – | – | – | – | ||||||||||||
| Total | $ | 8,700 | $ | 15 | $ | 13,833 | $ | 183 | $ | 22,533 | $ | 198 | ||||||
There were 5 securities, or 1% of the total, (1 greater than 12 months) in an unrealized loss position as of December 31, 2015 compared to 20 securities (12 greater than 12 months) in an unrealized loss position as of December 31, 2014. All unrealized losses are reviewed to determine whether the losses are other than temporary. Management believes that all unrealized losses are temporary since they are market driven, the Company does not have the intent to sell the security, and it is more likely than not that the Company will not be required to sell prior to recovery of the amortized basis.
The amortized cost and fair value of debt and equity securities by contractual maturity are shown in the following table. Expected maturities may differ from contractual maturities because borrowers have the right to prepay obligations with or without prepayment penalties.
| December 31, 2015 | ||||||
| (In thousands) | Amortized Cost | Fair Value | ||||
| Due in 1 year or less | $ | 30,621 | $ | 30,951 | ||
| Due after 1 year through 5 years | 76,500 | 79,205 | ||||
| Due after 5 years through 10 years | 139,680 | 145,780 | ||||
| Due after 10 years | 116,356 | 119,760 | ||||
| No stated maturity | – | – | ||||
| Total | $ | 363,157 | $ | 375,696 | ||
The premium related to the purchase of state and political subdivisions was $5,443,000 and $5,085,000 in 2015 and 2014, respectively.
39
The amortized cost of debt securities pledged to secure public deposits, securities sold under agreements to repurchase and for other purposes at December 31, 2015 and 2014 was $3,750,000 and $3,750,000, respectively.
Proceeds from sales of debt securities classified as available-for-sale were $99,347,000 in 2015, $587,000 in 2014, and $95,742,000 in 2013. Gross realized gains on the sales in 2015, 2014 and 2013 were $2,910,000, $23,000, and $4,295,000, respectively. Gross realized losses on sales in 2015, 2014 and 2013 were $0, $0, and $271,000, respectively.
Note 4
Loans
The Company originates commercial, industrial and real estate loans to businesses and churches throughout the metropolitan St. Louis, Missouri area, Orange County, California and other selected cities in the United States. The Company does not have any particular concentration of credit in any one economic sector; however, a substantial portion of the commercial and industrial loans is extended to privately-held commercial companies in these market areas, and are generally secured by the assets of the business. The Company also has a substantial portion of real estate loans secured by mortgages that are extended to churches in its market area and selected cities in the United States.
A summary of loan categories is as follows:
| December 31, | ||||||
| (In thousands) | 2015 | 2014 | ||||
| Commercial and industrial | $ | 193,430 | $ | 203,350 | ||
| Real estate | ||||||
| Commercial: | ||||||
| Mortgage | 108,836 | 117,754 | ||||
| Construction | 1,182 | – | ||||
| Church, church-related: | ||||||
| Mortgage | 306,728 | 305,887 | ||||
| Construction | 28,957 | 18,612 | ||||
| Industrial Revenue Bonds | 19,831 | 23,348 | ||||
| Other | 91 | 395 | ||||
| Total loans | $ | 659,055 | $ | 669,346 | ||
The following table presents the aging of loans by loan categories at December 31, 2015:
| Performing | Nonperforming | |||||||||||||||||
| 90 Days | ||||||||||||||||||
| 30-59 | 60-89 | and | Non- | Total | ||||||||||||||
| (In thousands) | Current | Days | Days | Over | accrual | Loans | ||||||||||||
| Commercial and industrial | $ | 193,430 | $ | – | $ | – | $ | – | $ | – | $ | 193,430 | ||||||
| Real estate | ||||||||||||||||||
| Commercial: | ||||||||||||||||||
| Mortgage | 105,804 | – | – | – | 3,032 | 108,836 | ||||||||||||
| Construction | 1,182 | – | – | – | – | 1,182 | ||||||||||||
| Church, church-related: | ||||||||||||||||||
| Mortgage | 306,625 | – | – | – | 103 | 306,728 | ||||||||||||
| Construction | 28,957 | – | – | – | – | 28,957 | ||||||||||||
| Industrial Revenue Bonds | 19,831 | – | – | – | – | 19,831 | ||||||||||||
| Other | 91 | – | – | – | – | 91 | ||||||||||||
| Total | $ | 655,920 | $ | – | $ | – | $ | – | $ | 3,135 | $ | 659,055 | ||||||
The following table presents the aging of loans by loan categories at December 31, 2014:
| Performing | Nonperforming | |||||||||||||||||
| 90 Days | ||||||||||||||||||
| 30-59 | 60-89 | and | Non- | Total | ||||||||||||||
| (In thousands) | Current | Days | Days | Over | accrual | Loans | ||||||||||||
| Commercial and industrial | $ | 203,350 | $ | – | $ | – | $ | – | $ | – | $ | 203,350 | ||||||
| Real estate | ||||||||||||||||||
| Commercial: | ||||||||||||||||||
| Mortgage | 117,393 | – | – | – | 361 | 117,754 | ||||||||||||
| Construction | – | – | – | – | – | – | ||||||||||||
| Church, church-related: | ||||||||||||||||||
| Mortgage | 305,760 | — | — | — | 127 | 305,887 | ||||||||||||
| Construction | — | — | — | — | ||||||||||||||
| 18,612 | 18,612 | |||||||||||||||||
| Industrial Revenue Bonds | 23,348 | — | — | — | — | 23,348 | ||||||||||||
| Other | 395 | — | — | — | — | 395 | ||||||||||||
| Total | $ | 668,858 | $ | — | $ | — | $ | — | $ | 488 | $ | 669,346 |
40
The following table presents the credit exposure of the loan portfolio by internally assigned credit grade as of December 31, 2015:
| Loans | Performing | Nonperforming | ||||||||||
| Subject to | Loans Subject to | Loans Subject | ||||||||||
| Normal | Special | to Special | ||||||||||
| (In thousands) | Monitoring1 | Monitoring2 | Monitoring2 | Total Loans | ||||||||
| Commercial and industrial | $ | 190,303 | $ | 3,127 | $ | — | $ | 193,430 | ||||
| Real estate | ||||||||||||
| Commercial: | ||||||||||||
| Mortgage | 104,642 | 1,162 | 3,032 | 108,836 | ||||||||
| Construction | 1,182 | — | — | 1,182 | ||||||||
| Church, church-related: | ||||||||||||
| Mortgage | 299,135 | 7,490 | 103 | 306,728 | ||||||||
| Construction | 28,957 | — | — | 28,957 | ||||||||
| Industrial Revenue Bonds | 19,831 | — | — | 19,831 | ||||||||
| Other | 91 | — | — | 91 | ||||||||
| Total | $ | 644,141 | $ | 11,779 | $ | 3,135 | $ | 659,055 | ||||
| 1 |
Loans subject to normal monitoring involve borrowers of acceptable-to-strong credit quality and risk, who have the apparent ability to satisfy their loan obligation. |
| 2 |
Loans subject to special monitoring possess some credit deficiency or potential weakness which requires a high level of management attention. |
The following table presents the credit exposure of the loan portfolio by internally assigned credit grade as of December 31, 2014:
| Loans | Performing | Nonperforming | ||||||||||
| Subject to | Loans Subject to | Loans Subject to | ||||||||||
| Normal | Special | Special | Total | |||||||||
| (In thousands) | Monitoring1 | Monitoring2 | Monitoring2 | Loans | ||||||||
| Commercial and industrial | $ | 199,837 | $ | 3,513 | $ | — | $ | 203,350 | ||||
| Real estate | ||||||||||||
| Commercial: | ||||||||||||
| Mortgage | 103,097 | 14,296 | 361 | 117,754 | ||||||||
| Construction | — | — | — | — | ||||||||
| Church, church-related: | ||||||||||||
| Mortgage | 304,219 | 1,541 | 127 | 305,887 | ||||||||
| Construction | 18,612 | — | — | 18,612 | ||||||||
| Industrial Revenue Bonds | 23,348 | — | — | 23,348 | ||||||||
| Other | 395 | — | — | 395 | ||||||||
| Total | $ | 649,508 | $ | 19,350 | $ | 488 | $ | 669,346 | ||||
| 1 |
Loans subject to normal monitoring involve borrowers of acceptable-to-strong credit quality and risk, who have the apparent ability to satisfy their loan obligation. |
| 2 |
Loans subject to special monitoring possess some credit deficiency or potential weakness which requires a high level of management attention. |
Impaired loans consist primarily of nonaccrual loans, loans greater than 90 days past due and still accruing interest and troubled debt restructurings, both performing and non-performing. Troubled debt restructuring involves the granting of a concession to a borrower experiencing financial difficulty resulting in the modification of terms of the loan, such as changes in payment schedule or interest rate. The ALLL related to impaired loans was $1,142,000 and $127,000 at December 31, 2015 and 2014, respectively. Nonaccrual loans were $3,135,000 and $488,000 at December 31, 2015 and 2014, respectively. Loans delinquent 90 days or more and still accruing interest were $0 at December 31, 2015 and 2014. At December 31, 2015 and 2014, there were no loans classified as troubled debt restructuring. The average balances of impaired loans during 2015, 2014 and 2013 were $3,188,000, $1,262,000 and $1,381,000, respectively. Income that would have been recognized on non-accrual loans under the original terms of the contract was $390,000, $108,000 and $180,000 for 2015, 2014 and 2013, respectively. Income that was recognized on nonaccrual loans was $34,000, $77,000 and $131,000 for 2015, 2014 and 2013 respectively. There were no foreclosed assets as of December 31, 2015 and December 31, 2014.
41
The following table presents the recorded investment and unpaid principal balance for impaired loans at December 31, 2015:
| Related | |||||||||
| Unpaid | Allowance | ||||||||
| Recorded | Principal | for Loan | |||||||
| In thousands) | Investment | Balance | Losses | ||||||
| Commercial and industrial: | |||||||||
| Nonaccrual | $ | — | $ | — | $ | — | |||
| Real estate | |||||||||
| Commercial – Mortgage: | |||||||||
| Nonaccrual | 3,032 | 3,032 | 1,039 | ||||||
| Church – Mortgage: | |||||||||
| Nonaccrual | 103 | 103 | 103 | ||||||
| Total impaired loans | $ | 3,135 | $ | 3,135 | $ | 1,142 | |||
The following table presents the recorded investment and unpaid principal balance for impaired loans at December 31, 2014:
| Related | |||||||||
| Unpaid | Allowance | ||||||||
| Recorded | Principal | for Loan | |||||||
| (In thousands) | Investment | Balance | Losses | ||||||
| Commercial and industrial: | |||||||||
| Nonaccrual | $ | — | $ | — | $ | — | |||
| Real estate | |||||||||
| Commercial – Mortgage: | |||||||||
| Nonaccrual | 361 | 361 | — | ||||||
| Church – Mortgage: | |||||||||
| Nonaccrual | 127 | 127 | 127 | ||||||
| Total impaired loans | $ | 488 | $ | 488 | $ | 127 | |||
The Company does not record loans at fair value on a recurring basis. Once a loan is identified as impaired, management measures impairment in accordance with FASB ASC 310. At December 31, 2015, all impaired loans were evaluated based on the fair value of the collateral or present value of expected future cash flow. The fair value of the collateral is based upon an observable market price or current appraised value and therefore, the Company classifies these assets as nonrecurring Level 3.
A summary of the activity in the allowance for loan losses is as follows:
| December 31, | Charge- | December 31, | ||||||||||||||
| (In thousands) | 2014 | Offs | Recoveries | Provision | 2015 | |||||||||||
| Commercial and industrial | $ | 3,515 | $ | 30 | $ | 610 | $ | (1,012 | ) | $ | 3,083 | |||||
| Real estate | ||||||||||||||||
| Commercial: | ||||||||||||||||
| Mortgage | 3,060 | — | 8 | (265 | ) | 2,803 | ||||||||||
| Construction | — | — | — | 9 | 9 | |||||||||||
| Church, church-related: | ||||||||||||||||
| Mortgage | 4,016 | — | 2 | 64 | 4,082 | |||||||||||
| Construction | 140 | — | — | 77 | 217 | |||||||||||
| Industrial Revenue Bond | 394 | — | — | (74 | ) | 320 | ||||||||||
| Other | 769 | — | 1 | 351 | 1,121 | |||||||||||
| Total | $ | 11,894 | $ | 30 | $ | 621 | $ | (850 | ) | $ | 11,635 | |||||
As of December 31, 2015, there were no loans to affiliates of executive officers or directors.
42
Note 5
Premises and
Equipment
A summary of premises and equipment is as follows:
| December 31, | ||||||
| (In thousands) | 2015 | 2014 | ||||
| Land | $ | 873 | $ | 873 | ||
| Buildings | 13,079 | 12,541 | ||||
| Leasehold improvements | 2,112 | 2,112 | ||||
| Furniture, fixtures and equipment | 12,320 | 10,762 | ||||
| Purchased software | 13,198 | 10,274 | ||||
| Internally developed software | 2,527 | 2,527 | ||||
| 44,109 | 39,089 | |||||
| Less accumulated depreciation | 24,461 | 22,180 | ||||
| Total | $ | 19,648 | $ | 16,909 | ||
Total depreciation charged to expense in 2015, 2014 and 2013 amounted to $3,008,000, $2,613,000 and $2,361,000, respectively.
The Company and its subsidiaries lease various premises and equipment under operating lease agreements which expire at various dates through 2023. Rental expense for 2015, 2014 and 2013 was $1,387,000, $1,405,000 and $1,222,000, respectively. The following is a schedule, by year, of future minimum rental payments required under operating leases that have initial or remaining non-cancelable lease terms in excess of one year as of December 31, 2015:
| (In thousands) | Amount | ||
| 2016 | $ | 1,336 | |
| 2017 | 1,346 | ||
| 2018 | 1,107 | ||
| 2019 | 845 | ||
| 2020 | 814 | ||
| 2021-2023 | 1,423 | ||
| Total | $ | 6,871 | |
Note 6
Acquired Intangible Assets
The Company accounts for intangible assets in accordance with FASB ASC 350, “Goodwill and Other Intangible Assets” (“ASC 350”), which requires that intangibles with indefinite useful lives be tested annually for impairment and those with finite useful lives be amortized over their useful lives. Details of the Company’s intangible assets are as follows:
| December 31, 2015 | December 31, 2014 | |||||||||||||
| Gross Carrying | Accumulated | Gross Carrying | Accumulated | |||||||||||
| (In thousands) | Amount | Amortization | Amount | Amortization | ||||||||||
| Assets eligible for amortization: | ||||||||||||||
| Customer Lists | $ | 3,933 | $ | (2,023 | ) | $ | 3,933 | $ | (1,705 | ) | ||||
| Patent | 72 | (4 | ) | 23 | (1 | ) | ||||||||
| Non-compete agreements | 261 | (209 | ) | 261 | (157 | ) | ||||||||
| Software | 234 | (234 | ) | 234 | (234 | ) | ||||||||
| Other | 500 | (125 | ) | 500 | (92 | ) | ||||||||
| Unamortized intangible assets: | ||||||||||||||
| Goodwill1 | 11,817 | (227 | ) | 11,817 | (227 | ) | ||||||||
| Total intangible assets | $ | 16,817 | $ | (2,822 | ) | $ | 16,768 | $ | (2,416 | ) | ||||
| 1 |
Amortization through December 31, 2001 prior to adoption of FASB ASC 350. |
The customer lists are amortized over seven and ten years; the patents over eight years, the non-compete agreements over five years, software over three years and other intangible assets over fifteen years. Amortization of intangible assets amounted to $408,000, $483,000 and $535,000 for the years ended December 31, 2015, 2014 and 2013, respectively. Estimated future amortization of intangibles is as follows: $408,000 in 2016, $356,000 in each of 2017, 2018, 2019 and 2020.
43
Note 7
Interest-Bearing
Deposits
Interest-bearing deposits consist of the following:
| December 31, | ||||||||
| (In thousands) | 2015 | 2014 | ||||||
| Interest-bearing demand deposits | $ | 386,203 | $ | 354,511 | ||||
| Savings deposits | 16,758 | 24,914 | ||||||
| Time deposits: | ||||||||
| Less than $100 | 4,758 | 6,956 | ||||||
| $100 to less than $250 | 43,178 | 57,284 | ||||||
| $250 or more | 13,764 | 15,535 | ||||||
| Total | $ | 464,661 | $ | 459,200 | ||||
| Weighted average interest rate | .51 | % | .58 | % | ||||
Interest on deposits consists of the following:
| December 31, | |||||||||
| (In thousands) | 2015 | 2014 | 2013 | ||||||
| Interest-bearing demand deposits | $ | 1,392 | $ | 1,564 | $ | 1,737 | |||
| Savings deposits | 65 | 87 | 138 | ||||||
| Time deposits: | |||||||||
| Less than $100 | 346 | 472 | 600 | ||||||
| $100 to less than $250 | 119 | 135 | 145 | ||||||
| $250 or more | 189 | 202 | 212 | ||||||
| Total | $ | 2,111 | $ | 2,460 | $ | 2,832 | |||
The scheduled maturities of time deposits are summarized as follows:
| December 31, | ||||||||||||
| 2015 | 2014 | |||||||||||
| Percent | Percent | |||||||||||
| (In thousands) | Amount | of Total | Amount | of Total | ||||||||
| Due within: | ||||||||||||
| One year | $ | 55,350 | 89.7 | % | $ | 66,436 | 83.3 | % | ||||
| Two years | 2,690 | 4.4 | 10,759 | 13.5 | ||||||||
| Three years | 1,566 | 2.5 | 1,148 | 1.4 | ||||||||
| Four years | 83 | .1 | 1,250 | 1.6 | ||||||||
| Five years | 2,011 | 3.3 | 182 | .2 | ||||||||
| Total | $ | 61,700 | 100.0 | % | $ | 79,775 | 100.0 | % | ||||
Note 8
Unused Available Lines of
Credit
As of December 31, 2015, the Bank had unsecured lines of credit at correspondent banks to purchase federal funds up to a maximum of $78,000,000 at the following banks: Bank of America, $10,000,000; US Bank, $20,000,000; Wells Fargo Bank, $15,000,000; PNC Bank, $12,000,000; Frost National Bank, $10,000,000; JPM Chase Bank, $6,000,000; and UMB Bank $5,000,000. As of December 31, 2015, the Bank had secured lines of credit with the Federal Home Loan Bank (“FHLB”) of $170,195,000 collateralized by commercial mortgage loans. There were no amounts outstanding under any of the lines of credit discussed above at December 31, 2015 or 2014. At December 31, 2015, the Company had a line of credit from UMB Bank of $50,000,000 and First Tennessee Bank of $50,000,000 collateralized by state and political subdivision securities.
Note 9
Common Stock and Earnings per Share
The table below shows activity in the outstanding shares of the Company’s common stock during 2015.
| 2015 | |||
| Shares outstanding at January 1 | 11,502,575 | ||
| Issuance of common stock: | |||
| Employee restricted stock grants | 26,542 | ||
| Employee SARs exercised | 12,154 | ||
| Directors’ compensation | 7,675 | ||
| Shares repurchased | (216,412 | ) | |
| Shares forfeited | (262 | ) | |
| Shares outstanding at December 31 | 11,332,272 | ||
44
Basic earnings per share is computed by dividing net income by the weighted average number of common shares outstanding. Diluted earnings per share is computed by dividing net income by the sum of the weighted average number of common shares outstanding and the weighted average number of potential common shares outstanding. Under the treasury stock method, stock appreciation rights (“SARs”) are dilutive when the average market price of the Company’s common stock, combined with the effect of any unamortized compensation expense, exceeds the SAR price during a period. Anti-dilutive shares are those SARs with prices in excess of the current market value.
The calculations of basic and diluted earnings per share are as follows:
| December 31, | |||||||||
| (In thousands except share and per share data) | 2015 | 2014 | 2013 | ||||||
| Basic: | |||||||||
| Net income | $ | 23,056 | $ | 24,033 | $ | 23,497 | |||
| Weighted average common shares outstanding | 11,358,609 | 11,479,025 | 11,441,158 | ||||||
| Basic earnings per share | $ | 2.03 | $ | 2.09 | $ | 2.05 | |||
| Diluted: | |||||||||
| Net income | $ | 23,056 | $ | 24,033 | $ | 23,497 | |||
| Weighted average common shares outstanding | 11,358,609 | 11,479,025 | 11,441,158 | ||||||
| Effect of dilutive restricted stock and SARs | 159,819 | 164,954 | 199,581 | ||||||
| Weighted average common shares outstanding | |||||||||
| assuming dilution | 11,518,428 | 11,643,979 | 11,640,739 | ||||||
| Diluted earnings per share | $ | 2.00 | $ | 2.06 | $ | 2.02 | |||
Note 10
Employee Benefit
Plans
Defined Benefit
Plan
The Company has a
noncontributory defined-benefit pension plan (the “Plan”), which covers most of
its employees. The Company accrues and makes contributions designed to fund
normal service costs on a current basis using the projected unit credit with
service proration method to amortize prior service costs arising from
improvements in pension benefits and qualifying service prior to the
establishment of the Plan over a period of approximately 30 years.
A summary of the activity in the Plan’s projected benefit obligation, assets, funded status and amounts recognized in the Company’s consolidated balance sheets is as follows:
| (In thousands) | 2015 | 2014 | ||||||
| Projected benefit obligation: | ||||||||
| Balance, January 1 | $ | 81,342 | $ | 63,439 | ||||
| Service cost | 3,795 | 3,003 | ||||||
| Interest cost | 3,178 | 3,037 | ||||||
| Actuarial (gain) loss | (8,358 | ) | 13,349 | |||||
| Benefits paid | (1,588 | ) | (1,486 | ) | ||||
| Balance, December 31 | $ | 78,369 | $ | 81,342 | ||||
| Plan assets: | ||||||||
| Fair value, January 1 | $ | 72,972 | $ | 70,627 | ||||
| Actual return | (210 | ) | 3,831 | |||||
| Employer contribution | — | — | ||||||
| Benefits paid | (1,588 | ) | (1,486 | ) | ||||
| Fair value, December 31 | $ | 71,174 | $ | 72,972 | ||||
| Funded status: | ||||||||
| Accrued pension liability | $ | (7,195 | ) | $ | (8,370 | ) | ||
The following represent the major assumptions used to determine the projected benefit obligation of the Plan. For 2015, 2014 and 2013, the Plan’s expected benefit cash flows were discounted using the Citibank Above Median Curve. For 2015, the RP-2014 Mortality Table and the MP-2015 Mortality Improvement Table were used. For 2014 and 2013, the RP-2014 Mortality Table and MP-2014 Mortality Improvement Table were used.
45
| 2015 | 2014 | 2013 | ||||
| Weighted average discount rate | 4.50% | 4.00% | 5.00% | |||
| Rate of increase in compensation levels | (a) | (a) | 3.75% |
| (a) |
6.0% graded down to 3.25% over the first seven years of service |
The accumulated benefit obligation was $68,321,000 and $69,420,000 as of December 31, 2015 and 2014, respectively. The Company does not expect to make a contribution to the Plan in 2016. The following pension benefit payments, which reflect expected future service, as appropriate, are expected to be paid by the Plan:
| Amount | |||
| 2016 | $ | 2,064,000 | |
| 2017 | 2,302,000 | ||
| 2018 | 2,630,000 | ||
| 2019 | 2,799,000 | ||
| 2020 | 3,023,000 | ||
| 2021-2025 | 20,160,000 | ||
The Plan’s pension cost included the following components:
| For the Year Ended | ||||||||||||
| December 31, | ||||||||||||
| (In thousands) | 2015 | 2014 | 2013 | |||||||||
| Service cost – benefits earned during the year | $ | 3,796 | $ | 3,003 | $ | 3,452 | ||||||
| Interest cost on projected benefit obligations | 3,178 | 3,037 | 2,819 | |||||||||
| Expected return on plan assets | (4,864 | ) | (4,711 | ) | (4,469 | ) | ||||||
| Net amortization and deferral | 1,542 | 244 | 1,729 | |||||||||
| Net periodic pension cost | $ | 3,652 | $ | 1,573 | $ | 3,531 | ||||||
The following represent the major assumptions used to determine the net pension cost of the Plan:
| 2015 | 2014 | 2013 | ||||
| Weighted average discount rate | 4.00% | 5.00% | 4.25% | |||
| Rate of increase in compensation levels | (a) | 3.75% | 3.75% | |||
| Expected long-term rate of return on assets | 6.75% | 6.75% | 7.25% |
| (a) |
6.0% graded down to 3.25% over the first seven years of service |
For 2015, the RP-2014 Mortality Table and the MP-2015 Mortality Improvement Table were used. For 2014, the RP-2014 Mortality Tables were used. For 2013, the RP-2000 Employees Mortality Table, RP-2000 Healthy Annuitant Mortality Table, and RP-2000 Disabled Mortality Table were used.
The investment objective for the Plan is to maximize total return with a tolerance for average risk. Asset allocation is a balance between fixed income and equity investments, with a target allocation of approximately 50% fixed income, 34% U.S. equity and 16% non-U.S. equity. Due to volatility in the market, this target allocation is not always desirable and asset allocations can fluctuate between acceptable ranges. The fixed income component is invested in pooled investment grade securities. The equity components are invested in pooled large cap, small/mid cap and non-U.S. stocks. The expected one-year nominal returns and annual standard deviations are shown by asset class below:
| One-Year Nominal | Annual Standard | ||||||||||||||
| Asset Class | % of Total Portfolio | Return | Deviation | ||||||||||||
| Core Fixed Income | 50 | % | 4.84 | % | 4.64 | % | |||||||||
| Large Cap U.S. Equities | 10 | % | 7.42 | % | 16.14 | % | |||||||||
| Large Cap U.S. Growth Equities | 8.5 | % | 8.14 | % | 18.35 | % | |||||||||
| Large Cap U.S. Value Equities | 8.5 | % | 7.29 | % | 16.27 | % | |||||||||
| Small Cap U.S. Equities | 7 | % | 8.42 | % | 20.02 | % | |||||||||
| International (Developed) | 15 | % | 8.80 | % | 19.35 | % | |||||||||
| International (Emerging) | 1 | % | 10.49 | % | 27.66 | % | |||||||||
Applying appropriate correlation factors between each of the asset classes the long-term rate of return on assets is estimated to be 6.75%.
46
A summary of the fair value measurements by type of asset is as follows:
| Fair Value Measurements as of December 31, | ||||||||||||||||||
| 2015 | 2014 | |||||||||||||||||
| Quoted Prices | Quoted Prices | |||||||||||||||||
| in Active | in Active | |||||||||||||||||
| Markets for | Significant | Markets for | Significant | |||||||||||||||
| Identical | Observable | Identical | Observable | |||||||||||||||
| Assets | Inputs | Assets | Inputs | |||||||||||||||
| (In thousands) | Total | (Level 1) | (Level 2) | Total | (Level 1) | (Level 2) | ||||||||||||
| Cash | $ | 283 | $ | 283 | $ | — | $ | 268 | $ | 268 | $ | — | ||||||
| Equity securities | ||||||||||||||||||
| U.S. Large Cap Growth | 6,507 | — | 6,507 | 7,165 | — | 7,165 | ||||||||||||
| U.S. Large Cap Value | 6,401 | — | 6,401 | 7,066 | — | 7,066 | ||||||||||||
| U.S. Small/Mid Cap Growth | 2,769 | — | 2,769 | 2,950 | — | 2,950 | ||||||||||||
| U.S. Small/Mid Cap Value | 2,649 | — | 2,649 | 2,721 | — | 2,721 | ||||||||||||
| Non-U.S. Core | 10,474 | — | 10,474 | 10,317 | — | 10,317 | ||||||||||||
| U.S. Large Cap Passive | 7,153 | — | 7,153 | 7,192 | — | 7,192 | ||||||||||||
| Emerging Markets | 599 | — | 599 | 703 | — | 703 | ||||||||||||
| Fixed Income | ||||||||||||||||||
| U.S. Core | 23,881 | — | 23,881 | 24,019 | — | 24,019 | ||||||||||||
| U.S. Passive | 9,328 | — | 9,328 | 9,275 | — | 9,275 | ||||||||||||
| Opportunistic | 1,130 | 1,130 | 1,296 | — | 1,296 | |||||||||||||
| Total | $ | 71,174 | $ | 283 | $ | 70,891 | $ | 72,972 | $ | 268 | $ | 72,704 | ||||||
Supplemental Executive
Retirement Plan
The Company
also has an unfunded supplemental executive retirement plan (“SERP”) which
covers key executives of the Company. The SERP is a noncontributory plan in
which the Company’s subsidiaries make accruals designed to fund normal service
costs on a current basis using the same method and criteria as the Plan.
A summary of the activity in the SERP’s projected benefit obligation, funded status and amounts recognized in the Company’s consolidated balance sheets is as follows:
|
December 31, | ||||||||
| (In thousands) | 2015 | 2014 | ||||||
| Benefit obligation: | ||||||||
| Balance, January 1 | $ | 9,403 | $ | 8,048 | ||||
| Service cost | 140 | 136 | ||||||
| Interest cost | 348 | 377 | ||||||
| Benefits paid | (243 | ) | (236 | ) | ||||
| Actuarial (gain) loss | (900 | ) | 1,078 | |||||
| Balance, December 31 | $ | 8,748 | $ | 9,403 | ||||
The following represent the major assumptions used to determine the projected benefit obligation of the SERP. For 2015, 2014 and 2013, the SERP’s expected benefit cash flows were discounted using the Citigroup Above Median Curve.
| 2015 | 2014 | 2013 | ||||
| Weighted average discount rate | 4.25% | 3.75% | 4.75% | |||
| Rate of increase in compensation levels | (a) | (a) | 3.75% |
| (a) |
6.00% graded down to 3.25% over the first seven years of service. |
The accumulated benefit obligation was $7,482,000 and $7,622,000 as of December 31, 2015 and 2014, respectively. Since this is an unfunded plan there are no plan assets. Benefits paid were $243,000 in 2015, $236,000 in 2014 and $236,000 in 2013. Expected future benefits payable by the Company over the next ten years are as follows:
| Amount | |||
| 2016 | $ | 247,000 | |
| 2017 | 246,000 | ||
| 2018 | 311,000 | ||
| 2019 | 310,000 | ||
| 2020 | 308,000 | ||
| 2021-2025 | 3,236,000 | ||
47
The SERP’s pension cost included the following components:
| For the Year Ended December 31, | |||||||||
| (In thousands) | 2015 | 2014 | 2013 | ||||||
| Service cost – benefits earned during the year | $ | 140 | $ | 136 | $ | 144 | |||
| Interest cost on projected benefit obligations | 348 | 377 | 335 | ||||||
| Net amortization and deferral | 654 | 431 | 551 | ||||||
| Net periodic pension cost | $ | 1,142 | $ | 944 | $ | 1,030 | |||
The pretax amounts in accumulated other comprehensive loss as of December 31 were as follows:
| The Plan | SERP | |||||||||||
| (In thousands) | 2015 | 2014 | 2015 | 2014 | ||||||||
| Prior service cost | $ | — | $ | — | $ | — | $ | — | ||||
| Net actuarial loss | 20,637 | 25,464 | 2,169 | 3,723 | ||||||||
| Total | $ | 20,637 | $ | 25,464 | $ | 2,169 | $ | 3,723 | ||||
The estimated pretax prior service cost and net actuarial loss in accumulated other comprehensive loss at December 31, 2015 expected to be recognized as components of net periodic benefit cost in 2016 for the Plan are $0 and $1,200,000, respectively. The estimated pretax prior service cost and net actuarial loss in accumulated other comprehensive loss at December 31, 2015 expected to be recognized as components of net periodic benefit cost in 2016 for the SERP are $0 and $295,000, respectively.
The Company also maintains a noncontributory profit sharing program, which covers most of its employees. Employer contributions are calculated based upon formulas which relate to current operating results and other factors. Profit sharing expense recognized in the consolidated statements of income in 2015, 2014 and 2013 was $5,211,000, $5,298,000, and $5,065,000, respectively.
The Company also sponsors a defined contribution 401(k) plan to provide additional retirement benefits to substantially all employees. Contributions under the 401(k) plan for 2015, 2014 and 2013 were $623,000, $584,000, and $591,000, respectively.
Note 11
Stock-based
Compensation
The Amended and Restated Omnibus Stock and Performance Compensation Plan (the “Omnibus Plan”) provides incentive opportunities for key employees and non-employee directors and to align the personal financial interests of such individuals with those of the Company’s shareholders. The Omnibus Plan permits the issuance of up to 1,500,000 shares of the Company’s common stock in the form of stock options, SARs, restricted stock, restricted stock units and performance awards.
Restricted Stock
Restricted shares granted
prior to April 16, 2013 are amortized to expense over the three-year vesting
period. Beginning on April 16, 2013, restricted shares granted to Company
employees are amortized to expense over the three-year vesting period whereas
restricted shares granted to members of the Board of Directors are amortized to
expense over a one-year service period with the exception of those shares
granted in lieu of cash payment for retainer fees which are expensed in the
period earned. Changes in restricted shares outstanding for the year ended
December 31, 2015 were as follows:
| Weighted Average | |||||
| Grant Date | |||||
| Shares | Fair Value | ||||
| Balance at December 31, 2014 | 51,161 | $48.13 | |||
| Granted | 42,786 | $51.04 | |||
| Vested | (24,644 | ) | $44.18 | ||
| Forfeited | (262 | ) | $52.63 | ||
| Balance at December 31, 2015 | 69,041 | $51.33 | |||
During 2014 and 2013, 22,629 and 30,407 shares, respectively, were granted with weighted average per share market values at date of grant of $58.89 in 2014 and $42.21 in 2013. The fair value of such shares, which is based on the market price on the date of grant, is amortized to expense over the three-year vesting period whereas restricted shares granted to members of the Board of Directors are amortized to expense over a one-year period. Amortization of the restricted stock bonus awards totaled $1,514,000 for 2015, $1,250,000 for 2014 and $1,176,000 for 2013. As of December 31, 2015, the total unrecognized compensation expense related to non-vested restricted stock awards was $1,734,000 and the related weighted average period over which it is expected to be recognized is approximately 0.68 years. The total fair value of shares vested during the years ended December 2015, 2014, and 2013 was $1,089,000, $1,066,000, and $822,000, respectively.
48
SARs
There were no SARs granted
during the year ended December 31, 2015. The Company uses the Black-Scholes
option-pricing model to determine the fair value of the SARs at the date of
grant.
During 2015, the Company recognized SARs expense of $545,000. As of December 31, 2015, the total unrecognized compensation expense related to SARs was $265,000, and the related weighted average period over which it is expected to be recognized is .50 years. Changes in SARs outstanding for the year ended December 31, 2015 were as follows:
| SARs | Weighted Average Exercise Price | ||||
| Balance at December 31, 2014 | 353,955 | $35.52 | |||
| Exercised | (45,428 | ) | $27.92 | ||
| Forfeited | (1,204 | ) | $53.96 | ||
| Balance at December 31, 2015 | 307,323 | $36.57 | |||
| Exercisable at December 31, 2015 | 254,816 | $33.56 | |||
The total intrinsic value of SARs exercised during 2015 and 2014 was $1,268,000 and $716,000, respectively. The average remaining contractual term for SARs outstanding as of December 31, 2015 was 5.99 years, and the aggregate intrinsic value was $4,577,000. The average remaining contractual term for SARs exercisable as of December 31, 2014 was 6.77 years, and the aggregate intrinsic value was $6,277,000.
The total compensation cost for share-based payment arrangements was $2,059,000, $2,042,000, and $1,976,000 in 2015, 2014, and 2013, respectively.
Note 12
Other Operating
Expense
Details of other operating expense are as follows:
| For the Years Ended December 31, | |||||||||
| (In thousands) | 2015 | 2014 | 2013 | ||||||
| Postage and supplies | $ | 1,954 | $ | 2,008 | $ | 2,066 | |||
| Promotional expense | 2,268 | 2,049 | 2,024 | ||||||
| Professional fees | 1,690 | 1,566 | 1,340 | ||||||
| Outside service fees | 2,848 | 2,876 | 3,046 | ||||||
| Data processing services | 357 | 338 | 367 | ||||||
| Telecommunications | 1,068 | 1,045 | 955 | ||||||
| Other | 1,185 | 1,647 | 1,347 | ||||||
| Total other operating expense | $ | 11,370 | $ | 11,529 | $ | 11,145 | |||
Note 13
Income
Taxes
The components of income tax expense (benefit) are as follows:
| For the Years Ended December 31, | |||||||||||
| (In thousands) | 2015 | 2014 | 2013 | ||||||||
| Current: | |||||||||||
| Federal | $ | 6,825 | $ | 7,189 | $ | 6,729 | |||||
| State | 1,290 | 1,191 | 448 | ||||||||
| Deferred: | |||||||||||
| Federal | (84 | ) | (585 | ) | 39 | ||||||
| State | (53 | ) | (36 | ) | 18 | ||||||
| Total income tax expense | $ | 7,978 | $ | 7,759 | $ | 7,234 | |||||
49
A reconciliation of expected income tax expense (benefit), computed by applying the effective federal statutory rate of 35% for each of 2015, 2014 and 2013 to income before income tax expense is as follows:
| For the Years Ended December 31, | ||||||||||||
| (In thousands) | 2015 | 2014 | 2013 | |||||||||
| Expected income tax expense | $ | 10,862 | $ | 11,127 | $ | 10,756 | ||||||
| (Reductions) increases resulting from: | ||||||||||||
| Tax-exempt income | (3,704 | ) | (3,896 | ) | (3,297 | ) | ||||||
| State taxes, net of federal benefit | 804 | 751 | 303 | |||||||||
| Other, net | 16 | (223 | ) | (528 | ) | |||||||
| Total income tax expense | $ | 7,978 | $ | 7,759 | $ | 7,234 | ||||||
The tax effects of temporary differences which give rise to significant portions of the deferred tax assets and deferred tax liabilities are presented below:
|
December 31, | ||||||||
| (In thousands) | 2015 | 2014 | ||||||
| Deferred tax assets: | ||||||||
| Allowance for loan losses | $ | 4,251 | $ | 4,441 | ||||
| ASC 715 pension funding liability | 8,438 | 10,887 | ||||||
| Net operating loss carryforward1 | 212 | 255 | ||||||
| Supplemental executive retirement plan accrual | 1,690 | 1,392 | ||||||
| Other | 553 | 509 | ||||||
| Total deferred tax assets | $ | 15,144 | $ | 17,484 | ||||
| Deferred tax liabilities: | ||||||||
| Premises and equipment | (2,081 | ) | (976 | ) | ||||
| Pension | (4,181 | ) | (5,636 | ) | ||||
| Stock compensation | (510 | ) | (394 | ) | ||||
| Intangible/assets | (1,314 | ) | (1,153 | ) | ||||
| Unrealized gain on investment in securities available-for-sale | (4,658 | ) | (5,172 | ) | ||||
| Other | (452 | ) | (407 | ) | ||||
| Total deferred tax liabilities | $ | (13,196 | ) | $ | (13,738 | ) | ||
| Net deferred tax assets | $ | 1,948 | $ | 3,746 | ||||
| 1 |
As of December 31, 2015, the Company had approximately $606,000 of net operating loss carry forwards as a result of the acquisition of Franklin Bancorp. The utilization of the net operating loss carry forward is subject to Section 382 of the Internal Revenue Code and limits the Company’s use to approximately $122,000 per year during the carry forward period, which expires in 2020. |
A valuation allowance would be provided on deferred tax assets when it is more likely than not that some portion of the assets will not be realized. The Company has not established a valuation allowance at December 31, 2015 or 2014, due to management’s belief that all criteria for recognition have been met, including the existence of a history of taxes paid sufficient to support the realization of deferred tax assets.
The reconciliation of the beginning unrecognized tax benefits balance to the ending balance is presented in the following table:
| In thousands) | 2015 | 2014 | 2013 | |||||||||
| Balance at January 1 | $ | 1,117 | $ | 1,208 | $ | 1,885 | ||||||
| Changes in unrecognized tax benefits as a result of tax | ||||||||||||
| positions taken during a prior year | 10 | (107 | ) | (666 | ) | |||||||
| Changes in unrecognized tax benefits as a result of tax | ||||||||||||
| position taken during the current year | 277 | 267 | 374 | |||||||||
| Decreases in unrecognized tax benefits relating to | ||||||||||||
| settlements with taxing authorities | ¯ | ¯ | ¯ | |||||||||
| Reductions to unrecognized tax benefits as a result of a | ||||||||||||
| lapse of the applicable statute of limitations | (210 | ) | (251 | ) | (385 | ) | ||||||
| Balance at December 31 | $ | 1,194 | $ | 1,117 | $ | 1,208 | ||||||
At December 31, 2015, 2014 and 2013, the balance of the Company’s unrecognized tax benefits which would, if recognized, affect the Company’s effective tax rate was $861,000, $819,000 and $861,000, respectively. These amounts are net of the offsetting benefits from other taxing jurisdictions.
As of December 31, 2015, 2014 and 2013, the Company had $54,000, $45,000 and $41,000, respectively, in accrued interest related to unrecognized tax benefits. During 2015 and 2014, the Company recorded a net increase (reduction) in accrued interest of $9,000 and $4,000, respectively, as a result of settlements with taxing authorities and other prior-year adjustments.
50
The Company believes it is reasonably possible that the total amount of tax benefits will decrease by approximately $374,000 over the next twelve months. The reduction primarily relates to the anticipated lapse in the statute of limitations. The unrecognized tax benefits relate primarily to apportionment of taxable income among various state tax jurisdictions.
The Company is subject to income tax in the U.S. federal jurisdiction, numerous state jurisdictions, and a foreign jurisdiction. The Company’s federal income tax returns for tax years 2012 through 2014 remain subject to examination by the Internal Revenue Service. In addition, the Company is subject to state tax examinations for the tax years 2011 through 2014.
Note
14
Contingencies
The Company and its subsidiaries are not involved in any pending proceedings other than ordinary routine litigation incidental to their businesses. Management believes none of these proceedings, if determined adversely, would have a material effect on the business or financial condition of the Company or its subsidiaries.
Note 15
Disclosures about Fair
Value of Financial Instruments
The Company is party to financial instruments with off-balance sheet risk in the normal course of business to meet the financing needs of its customers. These financial instruments include commitments to extend credit, commercial letters of credit and standby letters of credit. The Company’s maximum potential exposure to credit loss in the event of nonperformance by the other party to the financial instrument for commitments to extend credit, commercial letters of credit and standby letters of credit is represented by the contractual amounts of those instruments. At December 31, 2015 and 2014, no amounts have been accrued for any estimated losses for these instruments.
Commitments to extend credit are agreements to lend to a customer as long as there is no violation of any condition established in the contract. Commercial and standby letters of credit are conditional commitments issued by the Company to guarantee the performance of a customer to a third party. These off-balance sheet financial instruments generally have fixed expiration dates or other termination clauses and may require payment of a fee. The approximate remaining terms of commercial and standby letters of credit range from less than one to five years. Since these financial instruments may expire without being drawn upon, the total amounts do not necessarily represent future cash requirements. Commitments to extend credit and letters of credit are subject to the same underwriting standards as those financial instruments included on the consolidated balance sheets. The Company evaluates each customer’s credit-worthiness on a case-by-case basis. The amount of collateral obtained, if deemed necessary upon extension of the credit, is based on management’s credit evaluation of the borrower. Collateral held varies, but is generally accounts receivable, inventory, residential or income-producing commercial property or equipment. In the event of nonperformance, the Company may obtain and liquidate the collateral to recover amounts paid under its guarantees on these financial instruments.
The following table shows conditional commitments to extend credit, standby letters of credit and commercial letters:
| December 31, | ||||||
| (In thousands) | 2015 | 2014 | ||||
| Conditional commitments to extend credit | $ | 11,755 | $ | 19,066 | ||
| Standby letters of credit | 11,581 | 12,693 | ||||
| Commercial letters of credit | 1,857 | 2,571 | ||||
The fair value of commitments to extend credit and standby letters of credit is estimated using the fees currently charged to enter into similar agreements, taking into account the remaining terms of the agreements, the likelihood of the counterparties drawing on such financial instruments and the present credit worthiness of such counterparties. The Company believes such commitments have been made at terms which are competitive in the markets in which it operates; however, no premium or discount is offered thereon.
Following is a summary of the carrying amounts and fair values of the Company’s financial instruments:
| December 31, | ||||||||||||
| 2015 | 2014 | |||||||||||
| Carrying | Carrying | |||||||||||
| (In thousands) | Amount | Fair Value | Amount | Fair Value | ||||||||
| Balance sheet assets: | ||||||||||||
| Cash and cash equivalents | $ | 253,172 | $ | 253,172 | $ | 294,335 | $ | 294,335 | ||||
| Investment in securities | 375,696 | 375,696 | 356,141 | 356,141 | ||||||||
| Loans, net | 647,420 | 649,161 | 657,452 | 663,247 | ||||||||
| Accrued interest receivable | 6,647 | 6,647 | 6,521 | 6,521 | ||||||||
| Total | $ | 1,282,935 | $ | 1,284,676 | $ | 1,314,449 | $ | 1,320,244 | ||||
| Balance sheet liabilities: | ||||||||||||
| Deposits | $ | 646,484 | $ | 646,892 | $ | 618,199 | $ | 618,199 | ||||
| Accounts and drafts payable | 577,259 | 577,259 | 655,428 | 655,428 | ||||||||
| Accrued interest payable | 35 | 35 | 57 | 57 | ||||||||
| Total | $ | 1,223,778 | $ | 1,224,186 | $ | 1,273,684 | $ | 1,273,684 | ||||
51
The following methods and assumptions were used to estimate the fair value of each class of financial instruments for which it is practicable to estimate that value:
Cash and Cash Equivalents The carrying amount approximates fair value.
Investment in Securities The fair value is measured on a recurring basis using Level 2 valuations. Refer to Note 3, “Investment in Securities,” for fair value and unrealized gains and losses by investment type.
Loans The fair value is estimated using present values of future cash flows discounted at risk-adjusted interest rates for each loan category designated by management and is therefore a Level 3 valuation. Management believes that the risk factor embedded in the interest rates along with the allowance for loan losses results in a fair valuation.
Impaired loans are valued using the fair value of the collateral which is based upon an observable market price or current appraised value and therefore, the fair value is a nonrecurring Level 3 valuation.
Accrued Interest Receivable The carrying amount approximates fair value.
Deposits The fair value of demand deposits, savings deposits and certain money market deposits is the amount payable on demand at the reporting date. The fair value of fixed-maturity certificates of deposit is estimated using the rates currently offered for deposits of similar remaining maturities and therefore, is a Level 2 valuation. The fair value estimates above do not include the benefit that results from the low-cost funding provided by the deposit liabilities compared to the cost of borrowing funds in the market or the benefit derived from the customer relationship inherent in existing deposits.
Accounts and Drafts Payable The carrying amount approximates fair value.
Accrued Interest The carrying amount approximates fair value.
Limitations Fair value estimates are based on existing on- and off-balance sheet financial instruments without attempting to estimate the value of anticipated future business and the value of assets and liabilities that are not considered financial instruments. Other significant assets or liabilities that are not considered financial assets or liabilities include premises and equipment and the benefit that results from the low-cost funding provided by the deposit liabilities compared to the cost of borrowing funds in the market (core deposit intangible). In addition, tax ramifications related to the realization of the unrealized gains and losses can have a significant effect on fair value estimates and have not been considered in any of the estimates.
Note
16
Industry Segment
Information
The services provided by the Company are classified into two reportable segments: Information Services and Banking Services. Each of these segments provides distinct services that are marketed through different channels. They are managed separately due to their unique service, processing and capital requirements. The Information Services segment provides transportation, energy, telecommunication, and environmental invoice processing and payment services to large corporations. The Banking Services segment provides banking services primarily to privately held businesses and churches.
The Company’s accounting policies for segments are the same as those described in Note 1 of this report. Management evaluates segment performance based on net income after allocations for corporate expenses and income taxes. Transactions between segments are accounted for at what management believes to be fair value.
Substantially all revenue originates from and all long-lived assets are located within the United States, and no revenue from any customer of any segment exceeds 10% of the Company’s consolidated revenue. Assets represent actual assets owned by Information Services and Banking Services and there is no allocation methodology used. Loans are sold by Banking Services to Information Services to create liquidity when the Bank’s loan to deposit ratio is greater than 100%. Segment interest from customers is the actual interest earned on the loans owned by Information Services and Banking Services, respectively.
52
Summarized information about the Company’s operations in each industry segment for the years ended December 31, 2015, 2014 and 2013, is as follows:
| Corporate, | ||||||||||||||
| Information | Banking | Eliminations | ||||||||||||
| (In thousands) | Services | Services | and Other | Total | ||||||||||
| 2015 | ||||||||||||||
| Fee revenue and other income: | ||||||||||||||
| Income from customers | $ | 82,144 | $ | 1,224 | $ | — | $ | 83,368 | ||||||
| Intersegment income (expense) | 10,078 | 1,648 | (11,726 | ) | — | |||||||||
| Net interest income (expense) after provision | ||||||||||||||
| for loan losses: | ||||||||||||||
| Income from customers | 14,598 | 22,851 | — | 37,449 | ||||||||||
| Intersegment income (expense) | 12 | (12 | ) | — | — | |||||||||
| Depreciation and amortization | 3,164 | 151 | 101 | 3,416 | ||||||||||
| Income taxes | 2,818 | 5,160 | — | 7,978 | ||||||||||
| Net income | 14,635 | 8,421 | — | 23,056 | ||||||||||
| Goodwill | 11,454 | 136 | — | 11,590 | ||||||||||
| Other intangible assets, net | 2,405 | — | — | 2,405 | ||||||||||
| Total assets | $ | 702,491 | $ | 761,739 | $ | (8,724 | ) | $ | 1,455,506 | |||||
| 2014 | ||||||||||||||
| Fee revenue and other income: | ||||||||||||||
| Income from customers | $ | 78,773 | $ | 1,134 | $ | — | $ | 79,907 | ||||||
| Intersegment income (expense) | 9,210 | 1,504 | (10,714 | ) | — | |||||||||
| Net interest income (expense) after provision | ||||||||||||||
| for loan losses: | ||||||||||||||
| Income from customers | 15,678 | 21,621 | — | 37,299 | ||||||||||
| Intersegment income (expense) | 12 | (12 | ) | — | — | |||||||||
| Depreciation and amortization | 2,795 | 182 | 119 | 3,096 | ||||||||||
| Income taxes | 3,006 | 4,753 | — | 7,759 | ||||||||||
| Net income | 16,379 | 7,654 | — | 24,033 | ||||||||||
| Goodwill | 11,454 | 136 | — | 11,590 | ||||||||||
| Other intangible assets, net | 2,762 | — | — | 2,762 | ||||||||||
| Total assets | $ | 782,844 | $ | 755,400 | $ | (37,513 | ) | $ | 1,500,731 | |||||
| 2013 | ||||||||||||||
| Fee revenue and other income: | ||||||||||||||
| Income from customers | $ | 75,010 | $ | 1,216 | $ | 346 | $ | 76,572 | ||||||
| Intersegment income (expense) | 9,637 | 1,479 | (11,116 | ) | — | |||||||||
| Net interest income (expense) after provision | ||||||||||||||
| for loan losses: | ||||||||||||||
| Income from customers | 15,986 | 22,259 | — | 38,245 | ||||||||||
| Intersegment income (expense) | 11 | (11 | ) | — | — | |||||||||
| Depreciation and amortization | 2,638 | 143 | 115 | 2,896 | ||||||||||
| Income taxes | 2,232 | 5,002 | — | 7,234 | ||||||||||
| Net income | 15,237 | 8,133 | 127 | 23,497 | ||||||||||
| Goodwill | 11,454 | 136 | — | 11,590 | ||||||||||
| Other intangible assets, net | 3,222 | — | — | 3,222 | ||||||||||
| Total assets | $ | 657,604 | $ | 679,357 | $ | (10,941 | ) | $ | 1,326,020 | |||||
Note
17
Subsequent Events
In accordance with FASB ASC 855, “Subsequent Events,” the Company has evaluated subsequent events after the consolidated balance sheet date of December 31, 2015, and there were no events identified that would require additional disclosures to prevent the Company’s consolidated financial statements from being misleading.
53
Note
18
Condensed Financial
Information of Parent Company
Following are the condensed balance sheets of the Company (parent company only) and the related condensed statements of income and cash flows.
| Condensed Balance Sheets | ||||||
| December 31, | ||||||
| (In thousands) | 2015 | 2014 | ||||
| Assets | ||||||
| Cash and due from banks | $ | 30,165 | $ | 32,399 | ||
| Short-term investments | 50,689 | 107,932 | ||||
| Securities available-for-sale, at fair value | 373,946 | 356,141 | ||||
| Loans, net | 87,615 | 115,958 | ||||
| Investments in subsidiaries | 91,770 | 82,688 | ||||
| Premises and equipment, net | 18,886 | 16,030 | ||||
| Other assets | 150,135 | 166,235 | ||||
| Total assets | $ | 803,206 | $ | 877,383 | ||
| Liabilities and Shareholders’ Equity | ||||||
| Liabilities: | ||||||
| Accounts and drafts payable | $ | 576,919 | $ | 655,358 | ||
| Other liabilities | 18,732 | 21,511 | ||||
| Total liabilities | 595,651 | 676,869 | ||||
| Total shareholders’ equity | 207,555 | 200,514 | ||||
| Total liabilities and shareholders’ equity | $ | 803,206 | $ | 877,383 | ||
| Condensed Statements of Income | |||||||||
| For the Years Ended December 31, | |||||||||
| (In thousands) | 2015 | 2014 | 2013 | ||||||
| Income from subsidiaries: | |||||||||
| Interest | $ | 12 | $ | 12 | $ | 12 | |||
| Management fees | 2,201 | 2,058 | 2,119 | ||||||
| Income from subsidiaries | 2,213 | 2,070 | 2,131 | ||||||
| Information services revenue | 78,488 | 77,064 | 70,503 | ||||||
| Net interest income after provision | 13,948 | 14,986 | 15,069 | ||||||
| Gain on sales of investment securities | 2,910 | 23 | 3,677 | ||||||
| Other income | 613 | 1,323 | 527 | ||||||
| Total income | 98,172 | 95,466 | 91,907 | ||||||
| Expenses: | |||||||||
| Salaries and employee benefits | 63,475 | 59,885 | 59,004 | ||||||
| Other expenses | 16,580 | 15,587 | 15,027 | ||||||
| Total expenses | 80,055 | 75,472 | 74,031 | ||||||
| Income before income tax and equity in undistributed income | |||||||||
| of subsidiaries | 18,117 | 19,994 | 17,876 | ||||||
| Income tax expense | 2,950 | 3,125 | 2,381 | ||||||
| Income before undistributed income of subsidiaries | 15,167 | 16,869 | 15,495 | ||||||
| Equity in undistributed income of subsidiaries | 7,889 | 7,164 | 7,530 | ||||||
| Intercompany elimination | — | — | 472 | ||||||
| Net income | $ | 23,056 | $ | 24,033 | $ | 23,497 | |||
54
| Condensed Statements of Cash Flows | ||||||||||||
| For the Years Ended December 31, | ||||||||||||
| (In thousands) | 2015 | 2014 | 2013 | |||||||||
| Cash flows from operating activities: | ||||||||||||
| Net income | $ | 23,056 | $ | 24,033 | $ | 23,497 | ||||||
| Adjustments to reconcile net income to net cash provided | ||||||||||||
|
by (used in) operating activities: |
||||||||||||
| Equity in undistributed income of subsidiaries | (7,889 | ) | (7,164 | ) | (7,530 | ) | ||||||
| Net change in other assets | 16,100 | (44,879 | ) | (8,420 | ) | |||||||
| Net change in other liabilities | (2,779 | ) | 534 | (2,729 | ) | |||||||
| Amortization of stock-based awards | 1,504 | 1,250 | 1,177 | |||||||||
| Other, net | 10,389 | 13,487 | (4,180 | ) | ||||||||
| Net cash provided by (used in) operating activities | 40,381 | (12,739 | ) | 1,815 | ||||||||
| Cash flows from investing activities: | ||||||||||||
| Net increase in securities | (23,472 | ) | (35,128 | ) | (15,385 | ) | ||||||
| Net decrease in loans | 28,343 | 9,358 | 31,619 | |||||||||
| Purchases of premises and equipment, net | (5,708 | ) | (8,941 | ) | (4,050 | ) | ||||||
| Net cash (used in) provided by investing activities | (837 | ) | (34,711 | ) | 12,184 | |||||||
| Cash flows from financing activities: | ||||||||||||
| Net (decrease) increase in accounts and drafts payable | (78,439 | ) | 111,405 | 21,192 | ||||||||
| Cash dividends paid | (9,697 | ) | (9,337 | ) | (8,510 | ) | ||||||
| Purchase of common shares for treasury | (10,951 | ) | (1,848 | ) | — | |||||||
| Other financing activities | 66 | (21 | ) | (513 | ) | |||||||
| Net cash provided by (used in) financing activities | (99,021 | ) | 100,199 | 12,169 | ||||||||
| Net (decrease) increase in cash and cash equivalents | (59,477 | ) | 52,749 | 26,168 | ||||||||
| Cash and cash equivalents at beginning of year | 140,331 | 87,582 | 61,414 | |||||||||
| Cash and cash equivalents at end of year | $ | 80,854 | $ | 140,331 | $ | 87,582 | ||||||
Note
19
SUPPLEMENTARY FINANCIAL
INFORMATION
(Unaudited)
| First | Second | Third | Fourth | ||||||||||||||
| (In thousands except per share data) | Quarter | Quarter | Quarter | Quarter | YTD | ||||||||||||
| 2015 | |||||||||||||||||
| Fee revenue and other income | $ | 20,832 | $ | 20,838 | $ | 21,514 | $ | 20,184 | $ | 83,368 | |||||||
| Interest income | 9,552 | 9,803 | 9,581 | 9,774 | 38,710 | ||||||||||||
| Interest expense | 591 | 521 | 498 | 501 | 2,111 | ||||||||||||
| Net interest income | 8,961 | 9,282 | 9,083 | 9,273 | 36,599 | ||||||||||||
| Provision for loan losses | — | — | — | (850 | ) | (850 | ) | ||||||||||
| Operating expense | 22,308 | 22,640 | 22,634 | 22,201 | 89,783 | ||||||||||||
| Income tax expense | 1,946 | 1,932 | 2,083 | 2,017 | 7,978 | ||||||||||||
| Net income | $ | 5,539 | $ | 5,548 | $ | 5,880 | $ | 6,089 | $ | 23,056 | |||||||
| Net income per share: | |||||||||||||||||
| Basic earnings per share | $ | .48 | $ | .49 | $ | .52 | $ | .54 | $ | 2.03 | |||||||
| Diluted earnings per share | .48 | .48 | .51 | .53 | 2.00 | ||||||||||||
| 2014 | |||||||||||||||||
| Fee revenue and other income | $ | 19,575 | $ | 19,952 | $ | 20,223 | $ | 20,157 | $ | 79,907 | |||||||
| Interest income | 9,772 | 9,975 | 9,991 | 10,021 | 39,759 | ||||||||||||
| Interest expense | 625 | 628 | 604 | 603 | 2,460 | ||||||||||||
| Net interest income | 9,147 | 9,347 | 9,387 | 9,418 | 37,299 | ||||||||||||
| Provision for loan losses | — | — | — | — | — | ||||||||||||
| Operating expense | 21,025 | 21,306 | 21,196 | 21,887 | 85,414 | ||||||||||||
| Income tax expense | 1,886 | 1,958 | 2,013 | 1,902 | 7,759 | ||||||||||||
| Net income | $ | 5,811 | $ | 6,035 | $ | 6,401 | $ | 5,786 | $ | 24,033 | |||||||
| Net income per share: | |||||||||||||||||
| Basic earnings per share | $ | .51 | $ | .52 | $ | .56 | $ | .50 | $ | 2.09 | |||||||
| Diluted earnings per share | .50 | .52 | .55 | .49 | 2.06 | ||||||||||||
55
Report of Independent Registered Public Accounting Firm
The Board of Directors and
Shareholders
Cass Information Systems, Inc.:
We have audited the accompanying consolidated balance sheets of Cass Information Systems, Inc. and subsidiaries (the Company) as of December 31, 2015 and 2014, and the related consolidated statements of income, comprehensive income, cash flows, and shareholders’ equity for each of the years in the three year period ended December 31, 2015. These consolidated financial statements are the responsibility of the Company’s management. Our responsibility is to express an opinion on these consolidated financial statements based on our audits.
We conducted our audits in accordance with the standards of the Public Company Accounting Oversight Board (United States). Those standards require that we plan and perform the audit to obtain reasonable assurance about whether the financial statements are free of material misstatement. An audit includes examining, on a test basis, evidence supporting the amounts and disclosures in the financial statements. An audit also includes assessing the accounting principles used and significant estimates made by management, as well as evaluating the overall financial statement presentation. We believe that our audits provide a reasonable basis for our opinion.
In our opinion, the consolidated financial statements referred to above present fairly, in all material respects, the financial position of Cass Information Systems, Inc. and subsidiaries as of December 31, 2015 and 2014, and the results of their operations and their cash flows for each of the years in the three year period ended December 31, 2015, in conformity with U.S. generally accepted accounting principles.
We also have audited, in accordance with the standards of the Public Company Accounting Oversight Board (United States), the Company’s internal control over financial reporting as of December 31, 2015, based on criteria established in Internal Control – Integrated Framework (2013) issued by the Committee of Sponsoring Organizations of the Treadway Commission (COSO), and our report dated March 7, 2016 expressed an unqualified opinion on the effectiveness of the Company’s internal control over financial reporting.
/s/ KPMG LLP
St. Louis,
Missouri
March 7, 2016
56
| ITEM 9. | CHANGES IN AND DISAGREEMENTS WITH ACCOUNTANTS ON ACCOUNTING AND FINANCIAL DISCLOSURE |
None.
ITEM 9A. CONTROLS AND PROCEDURES
Conclusion Regarding the Effectiveness of Disclosure Controls and Procedures
Under the supervision and with the participation of our management, including our principal executive officer and principal financial officer, we conducted an evaluation of our disclosure controls and procedures, as such term is defined in Rules 13a-15(e) and 15d-15(e) under the Securities Exchange Act of 1934, as amended (the “Exchange Act”), as of December 31, 2015. Based on this evaluation, our principal executive officer and our principal financial officer concluded that our disclosure controls and procedures were effective as of December 31, 2015.
Management’s Report on Internal Control Over Financial Reporting
Our management is responsible for establishing and maintaining adequate internal control over financial reporting, as such term is defined in Exchange Act Rules 13a-15(f) and 15d-15(f). All internal control systems, no matter how well designed, have inherent limitations. Therefore, even those systems determined to be effective can provide only reasonable assurance with respect to financial statement preparation and presentations.
Under the supervision and with the participation of our management, including our principal executive officer and principal financial officer, we conducted an evaluation of the effectiveness of our internal control over financial reporting based on the framework in Internal Control – Integrated Framework (2013) issued by the Committee of Sponsoring Organizations of the Treadway Commission. Based on our evaluation under this framework, our management concluded that our internal control over financial reporting was effective as of December 31, 2015.
There have not been changes in our internal control over financial reporting that occurred during our fourth fiscal quarter that have materially affected or are reasonably likely to materially affect our internal control over financial reporting.
The effectiveness of our internal control over financial reporting as of December 31, 2015 has been audited by KPMG LLP, our independent registered public accounting firm. KPMG LLP’s report, which expresses an unqualified opinion on the effectiveness of our internal control over financial reporting as of December 31, 2015, is included below.
57
Report of Independent Registered Public Accounting Firm
The Board of Directors and
Shareholders
Cass Information Systems, Inc.:
We have audited Cass Information Systems, Inc. and subsidiaries’ (the Company) internal control over financial reporting as of December 31, 2015, based on criteria established in Internal Control – Integrated Framework (2013) issued by the Committee of Sponsoring Organizations of the Treadway Commission (COSO). The Company’s management is responsible for maintaining effective internal control over financial reporting and for its assessment of the effectiveness of internal control over financial reporting, included in the accompanying Management’s Report on Internal Control Over Financial Reporting. Our responsibility is to express an opinion on the Company’s internal control over financial reporting based on our audit.
We conducted our audit in accordance with the standards of the Public Company Accounting Oversight Board (United States). Those standards require that we plan and perform the audit to obtain reasonable assurance about whether effective internal control over financial reporting was maintained in all material respects. Our audit included obtaining an understanding of internal control over financial reporting, assessing the risk that a material weakness exists, and testing and evaluating the design and operating effectiveness of internal control based on the assessed risk. Our audit also included performing such other procedures as we considered necessary in the circumstances. We believe that our audit provides a reasonable basis for our opinion.
A company’s internal control over financial reporting is a process designed to provide reasonable assurance regarding the reliability of financial reporting and the preparation of financial statements for external purposes in accordance with generally accepted accounting principles. A company’s internal control over financial reporting includes those policies and procedures that (1) pertain to the maintenance of records that, in reasonable detail, accurately and fairly reflect the transactions and dispositions of the assets of the company; (2) provide reasonable assurance that transactions are recorded as necessary to permit preparation of financial statements in accordance with generally accepted accounting principles, and that receipts and expenditures of the company are being made only in accordance with authorizations of management and directors of the company; and (3) provide reasonable assurance regarding prevention or timely detection of unauthorized acquisition, use, or disposition of the company’s assets that could have a material effect on the financial statements.
Because of its inherent limitations, internal control over financial reporting may not prevent or detect misstatements. Also, projections of any evaluation of effectiveness to future periods are subject to the risk that controls may become inadequate because of changes in conditions, or that the degree of compliance with the policies or procedures may deteriorate.
In our opinion, the Company maintained, in all material respects, effective internal control over financial reporting as of December 31, 2015, based on criteria established in Internal Control – Integrated Framework (2013) issued by the Committee of Sponsoring Organizations of the Treadway Commission (COSO).
We also have audited, in accordance with the standards of the Public Company Accounting Oversight Board (United States), the consolidated balance sheets of Cass Information Systems, Inc. and subsidiaries as of December 31, 2015 and 2014, and the related consolidated statements of income, comprehensive income, cash flows, and shareholders’ equity for each of the years in the three-year period ended December 31, 2015, and our report dated March 7, 2016 expressed an unqualified opinion on those consolidated financial statements..
/s/ KPMG LLP
St. Louis,
Missouri
March 7, 2016
58
None.
ITEM 10. DIRECTORS, EXECUTIVE OFFICERS AND CORPORATE GOVERNANCE
Certain information required by this Item 10 is incorporated herein by reference to the following sections of the Company’s definitive Proxy Statement for its 2016 Annual Meeting of Shareholders (“2016 Proxy Statement”), a copy of which will be filed with the SEC no later than 120 days after the close of the fiscal year: “Election of Directors – Proposal 1,” “Executive Compensation and Related Information,” and “Beneficial Ownership of Securities.”
The Company has adopted a Code of Conduct and Business Ethics policy, applicable to all Company directors, executive officers and employees. The policy is publicly available and can be viewed on the Company’s website at www.cassinfo.com. The Company intends to satisfy the disclosure requirement under Item 5.05 of Form 8-K regarding the amendment to, or a waiver of, a provision of this policy that applies to the Company’s principal executive officer, principal financial officer, principal accounting officer or controller, or persons performing similar functions, and that relates to any element of the code of ethics definition enumerated in Item 406(b) of Regulation S-K by posting such information on its website.
There were no material changes to the procedures by which shareholders may recommend nominees to the Board during the fourth quarter of fiscal 2016.
ITEM 11. EXECUTIVE COMPENSATION
Certain information required pursuant to this Item 11 is incorporated herein by reference to the sections entitled “Election of Directors – Proposal 1” and “Executive Compensation and Related Information” of the Company’s 2016 Proxy Statement, a copy of which will be filed with the SEC no later than 120 days after the close of the fiscal year.
| ITEM 12. | SECURITY OWNERSHIP OF CERTAIN BENEFICIAL OWNERS AND MANAGEMENT AND RELATED STOCKHOLDER MATTERS |
Information required pursuant to this Item 12 is incorporated herein by reference to the section entitled “Beneficial Ownership of Securities” of the Company’s 2016 Proxy Statement, a copy of which will be filed with the SEC no later than 120 days after the close of the fiscal year.
Securities Authorized for Issuance under Equity Compensation Plans
The following information is as of December 31, 2015:
| Number of securities | ||||||
| remaining available for | ||||||
| Weighted-average | future issuance under | |||||
| Number of securities to | exercise price of | equity compensation | ||||
| be issued upon exercise | outstanding | plans (excluding | ||||
| of outstanding options, | options, warrants | securities reflected in | ||||
| warrants and rights | and rights | column (a)) | ||||
| Plan Category | (a) | (b) | (c) | |||
| Equity compensation plans | 376,364 | $39.28 | 626,263 | |||
| approved by security | ||||||
| holders (1) | ||||||
| Equity compensation plans | — | — | — | |||
| not approved by security | ||||||
| holders | ||||||
| Total | 376,364 | $39.28 | 626,263 | |||
| (1) | Amount disclosed relates to the Amended and Restated Omnibus Stock and Performance Compensation Plan (the “Omnibus Plan”). |
Refer to Note 11 to the consolidated financial statements for information concerning the Omnibus Plan.
59
ITEM 13. CERTAIN RELATIONSHIPS AND RELATED TRANSACTIONS, AND DIRECTOR INDEPENDENCE
Information required by this Item 13 is incorporated herein by reference to the section entitled “Election of Directors – Proposal 1” of the Company’s 2016 Proxy Statement, a copy of which will be filed with the SEC no later than 120 days after the close of the fiscal year.
ITEM 14. PRINCIPAL ACCOUNTANT FEES AND SERVICES
Information concerning our principal accountant’s fees and services is incorporated herein by reference to the section entitled “Ratification of Appointment of Independent Registered Public Accounting Firm – Proposal 2” of the Company’s 2016 Proxy Statement, a copy of which will be filed with the SEC no later than 120 days after the close of the fiscal year.
ITEM 15. EXHIBITS AND FINANCIAL STATEMENT SCHEDULES
| (a) | The following documents are incorporated by reference in or filed as an exhibit to this report: | |||
| (1) and (2) | Financial Statements and Financial Statement Schedules | |||
| Included in Item 8 of this report. | ||||
| (3) | Exhibits listed under (b) of this Item 15. | |||
| (b) | Exhibits | |||
| 3.1 | Restated Articles of Incorporation of Registrant, incorporated by reference to Exhibit 4.1 to Form S-8 Registration Statement No. 333-44499, filed with the SEC on January 20, 1998. | |||
| 3.2 | Amendment to Restated Articles of Incorporation, incorporated by reference to Exhibit 3.1 to the current report on Form 8-K, filed with the SEC on April 19, 2013. | |||
| 3.3 | Articles of Merger of Cass Commercial Corporation, incorporated by reference to Exhibit 3.1 to the quarterly report on Form 10-Q for the quarter ended September 30, 2006. | |||
| 3.4 | Second Amended and Restated Bylaws of Registrant, incorporated by reference to Exhibit 3.1 to the current report on Form 8-K, filed with the SEC on April 18, 2007. | |||
| 10.1 | 1995 Restricted Stock Bonus Plan, as amended on January 19, 1999, including form of Restriction Agreement, incorporated by reference to Exhibit 4.3 to Post-Effective Amendment No. 2 to Form S-8 Registration Statement No. 33-91456, filed with the SEC on February 16, 1999.* | |||
| 10.2 | 1995 Performance-Based Stock Option Plan, as amended on January 19, 1999, including forms of Option Agreements, incorporated by reference to Exhibit 4.3 to Post-Effective Amendment No. 2 to Form S-8 Registration Statement No. 33-91568, filed with the SEC on February 16, 1999.* | |||
| 10.3 | Form of Directors’ Indemnification Agreement, incorporated by reference to Exhibit 10.1 to the quarterly report on Form 10-Q for the quarter ended March 31, 2003.* | |||
| 10.4 | Amended and Restated Omnibus Stock and Performance Compensation Plan, incorporated by reference to Exhibit 10.1 to the current report on Form 8-K, filed with the SEC on April 19, 2013.* | |||
| 10.5 | Amendment and Restatement of the Supplemental Executive Retirement Plan, incorporated by reference to Exhibit 10.2 to the quarterly report on Form 10-Q for the quarter ended September 30, 2007.* | |||
| 10.6 | Form of Restricted Stock Agreement, incorporated by reference to Exhibit 10.1 to the quarterly report on Form 10-Q for the quarter ended March 31, 2013.* | |||
60
| 10.7 | Form of Stock Appreciation Rights Award Agreement, incorporated by reference to Exhibit 10.4 to the quarterly report on Form 10-Q for the quarter ended September 30, 2007.* | ||
| 10.8 | Description of Cass Information Systems, Inc. Profit Sharing Program | ||
| 21 | Subsidiaries of registrant. | ||
| 23 | Consent of Independent Registered Public Accounting Firm. | ||
| 31.1 | Certification Pursuant to Section 302 of the Sarbanes-Oxley Act of 2002. | ||
| 31.2 | Certification Pursuant to Section 302 of the Sarbanes-Oxley Act of 2002. | ||
| 32 .1 | Certification Pursuant to 18 U.S.C. Section 1350, as Adopted Pursuant to Section 906 of the Sarbanes-Oxley Act of 2002. | ||
| 32 .2 | Certification Pursuant to 18 U.S.C. Section 1350, as Adopted Pursuant to Section 906 of the Sarbanes-Oxley Act of 2002. |
____________________
(c) None.
61
Pursuant to the requirements of the Securities Exchange Act of 1934, this report has been signed below by the following persons on behalf of the registrant and in the capacities and on the dates indicated.
| CASS INFORMATION SYSTEMS, INC. | ||||
| Date: March 7, 2016 | By | /s/ | Eric H. Brunngraber | |
| Eric H. Brunngraber | ||||
| Chairman, President and Chief Executive Officer | ||||
| (Principal Executive Officer) | ||||
| Date: March 7, 2016 | By | /s/ | P. Stephen Appelbaum | |
| P. Stephen Appelbaum | ||||
| Executive Vice President and Chief Financial Officer | ||||
| (Principal Financial and Accounting Officer) | ||||
Pursuant to the requirements of the Securities Exchange Act of 1934, this report has been signed below on the dates indicated by the following persons on behalf of the registrant and in their capacity as a member of the Board of Directors of the Company.
| Date: March 7, 2016 | By | /s/ | Eric H. Brunngraber | |
| Eric H. Brunngraber | ||||
| Date: March 7, 2016 | By | /s/ | Ralph W. Clermont | |
| Ralph W. Clermont | ||||
| Date: March 7, 2016 | By | /s/ | Lawrence A. Collett | |
| Lawrence A. Collett | ||||
| Date: March 7, 2016 | By | /s/ | Robert A. Ebel | |
| Robert A. Ebel | ||||
| Date: March 7, 2016 | By | /s/ | Benjamin F. Edwards, IV | |
| Benjamin F. Edwards, IV | ||||
| Date: March 7, 2016 | By | /s/ | Wayne J. Grace | |
| Wayne J. Grace | ||||
| Date: March 7, 2016 | By | /s/ | James J. Lindemann | |
| James J. Lindemann | ||||
| Date: March 7, 2016 | By | /s/ | Randall L. Schilling | |
| Randall L. Schilling | ||||
| Date: March 7, 2016 | By | /s/ | Franklin D. Wicks, Jr. | |
| Franklin D. Wicks, Jr. | ||||
62