Attached files
| file | filename |
|---|---|
| EX-32.1 - EXHIBIT 32.1 - MOCON INC | ex32-1.htm |
| EX-21.1 - EXHIBIT 21.1 - MOCON INC | ex21-1.htm |
| EX-31.1 - EXHIBIT 31.1 - MOCON INC | ex31-1.htm |
| EX-23.1 - EXHIBIT 23.1 - MOCON INC | ex23-1.htm |
| EX-23.2 - EXHIBIT 23.2 - MOCON INC | ex23-2.htm |
| EX-32.2 - EXHIBIT 32.2 - MOCON INC | ex32-2.htm |
| EX-10.21 - EXHIBIT 10.21 - MOCON INC | ex10-21.htm |
| EX-10.19 - EXHIBIT 10.19 - MOCON INC | ex10-19.htm |
| EX-10.20 - EXHIBIT 10.20 - MOCON INC | ex10-20.htm |
| EX-31.2 - EXHIBIT 31.2 - MOCON INC | ex31-2.htm |
UNITED STATES
SECURITIES AND EXCHANGE COMMISSION
Washington, D.C. 20549
______________________________
FORM 10-K
(Mark one)
☒ ANNUAL REPORT UNDER SECTION 13 OR 15(d) OF THE SECURITIES EXCHANGE ACT OF 1934
For the fiscal year ended December 31, 2015
☐ TRANSITION REPORT UNDER SECTION 13 OR 15(d) OF THE SECURITIES EXCHANGE ACT OF 1934
For the transition period from ________________ to __________________.
Commission File No.: 000-09273
____________________
Mocon, inc.
(Exact name of registrant as specified in its charter)
|
Minnesota (State or other jurisdiction of incorporation or organization)
|
41-0903312 (I.R.S. Employer Identification No.) |
|
7500 Mendelssohn Avenue North Minneapolis, Minnesota (Address of principal executive offices) |
55428 (Zip Code) |
Registrant’s telephone number, including area code: (763) 493-6370
Securities registered under Section 12(b) of the Act:
|
Title of each class |
Name of each exchange on which registered |
|
Common Stock, par value $0.10 per share |
The NASDAQ Stock Market LLC (NASDAQ Global Market) |
Securities registered under Section 12(g) of the Act: None
____________________
Indicate by check mark if the registrant is a well-known seasoned issuer, as defined in Rule 405 of the Securities Act.
YES ☐ NO ☒
Indicate by check mark if the registrant is not required to file reports pursuant to Section 13 or Section 15(d) of the Act.
YES ☐ NO ☒
Indicate by check mark whether the registrant (1) has filed all reports required to be filed by Section 13 or 15(d) of the Securities Exchange Act of 1934 during the preceding 12 months (or for such shorter period that the registrant was required to file such reports), and (2) has been subject to such filing requirements for the past 90 days. YES ☒ NO ☐
Indicate by check mark whether the Registrant has submitted electronically and posted on its corporate Web site, if any, every Interactive Data File required to be submitted and posted pursuant to Rule 405 of Regulation S-T (§232.405 of this chapter) during the preceding 12 months (or for such shorter period that the Registrant was required to submit and post such files). Yes ☒ No ☐
Indicate by check mark if disclosure of delinquent filers pursuant to Item 405 of Regulation S-K (§229.405 of this chapter) is not contained herein, and will not be contained, to the best of registrant’s knowledge, in definitive proxy or information statements incorporated by reference in Part III of this Form 10-K or any amendment to this Form 10-K. ☒
Indicate by check mark whether the registrant is a large accelerated filer, an accelerated filer, a non-accelerated filer, or a smaller reporting company. See the definitions of “large accelerated filer,” “accelerated filer,” and “smaller reporting company” in Rule 12b-2 of the Exchange Act. Large accelerated filer ☐ Accelerated filer ☒ Non-accelerated filer (do not check if a smaller reporting company) ☐ Smaller reporting company ☐
Indicate by check mark whether registrant is a shell company (as defined in Rule 12b-2 of the Act). YES ☐ NO ☒
The aggregate market value of the registrant’s common stock, excluding outstanding shares beneficially owned by directors and executive officers, computed by reference to the price at which the common stock was last sold as of June 30, 2015 (the last business day of the registrant’s second quarter) as reported by the Nasdaq Global Market System, was $85,797,902.
As of February 26, 2016, 5,792,126 shares of common stock of the registrant were deemed outstanding.
DOCUMENTS INCORPORATED BY REFERENCE
Part III of this annual report on Form 10-K incorporates by reference information (to the extent specific sections are referred to herein) from the registrant’s Proxy Statement for its 2016 Annual Meeting of Shareholders to be held May 26, 2016.
part i
This annual report on Form 10-K contains or incorporates by reference not only historical information, but also forward-looking statements within the meaning of Section 27A of the Securities Act of 1933, as amended, and Section 21E of the Securities Exchange Act of 1934, as amended, and are subject to the safe harbor created by those sections. We refer you to the information under the heading “Part I. Item 1. Business – Forward-Looking Statements.”
As used in this annual report on Form 10-K, references to “MOCON,” the “Company,” “we,” “our” or “us,” unless the context otherwise requires, refer to MOCON, Inc. and our subsidiaries.
All trademarks or trade names referred to in this report are the property of their respective owners.
|
Item 1. |
BUSINESS |
MOCON, Inc. designs, manufactures, markets and services products, and provides consulting services, primarily in the test and measurement, analytical instrument and services markets. Our products include instruments that detect, measure and monitor gases and other chemical compounds which help our customers improve the quality of their products, as well as develop new products.
Our gas and vapor permeation instruments were first used in the food packaging industry, starting in the 1970s, to measure small amounts of moisture which can adversely affect dry cereals and other food packaging. Today our core business is involved in, the detection, measurement and analysis of vapors and gases, serves industries far beyond food packaging. Our products serve markets such as foods, beverages, pharmaceuticals and consumer products, oil and gas exploration and industrial and environmental safety.
Our principal business strategy is to employ our product development and technological capabilities, manufacturing processes and revenue and marketing skills where we can successfully penetrate the market and become a leader in the segment. Our management team continually emphasizes product innovation, product performance, quality improvements, cost reductions and other value-adding activities. We seek growth opportunities through technological and product improvement, by acquiring and developing new products, by acquiring companies or new product lines, or by purchasing the rights to existing technologies.
MOCON, Inc. was incorporated as a Minnesota corporation in February 1966 as Modern Controls, Inc., and was initially involved in the commercialization of technology developed for the measurement of water vapor permeating through food packaging materials. Today, the key drivers in the industries we serve are food and beverage product safety and quality, improving workplace safety, supplying testing equipment for oil and gas exploration, and analyzing the quality of air both indoors and outdoors as well as water.
Our current plans for growth include continued substantial funding for research and development to foster new product development and to pursue strategic acquisitions and investments where appropriate.
Our principal executive offices and worldwide headquarters are located at 7500 Mendelssohn Avenue North, Minneapolis, Minnesota 55428, USA, and our telephone number is (763) 493-6370. Our website address is www.mocon.com. The information contained on our website or connected to our website is not incorporated by reference into this annual report on Form 10-K and should not be considered part of this report.
We make available, free of charge on our website, our annual reports on Form 10-K, quarterly reports on Form 10-Q, current reports on Form 8-K, and amendments to those reports filed or furnished pursuant to Section 13(a) or 15(d) of the Securities Exchange Act of 1934, as amended, as soon as reasonably practicable after we electronically file such material with, or furnish it to, the Securities and Exchange Commission. We also make available, free of charge and through our website, to any shareholder who requests, the charters of our Board committees and our Code of Ethics. Requests for copies can be directed to our Chief Financial Officer at the address and phone number above.
Products and Services
We develop, manufacture, market and service test and measurement, analytical and monitoring instruments and systems used to detect, measure and analyze gases and other chemical compounds, as well as provide related consulting services. Please see our consolidated financial statements beginning on page F-1 for financial information concerning our business, including our revenue, net income and net assets.
Package Testing Products and Services
We manufacture and sell three primary products in this group: headspace analyzers, leak detection equipment and gas mixers. Our headspace analyzer products are used to analyze the amount and type of gas present in the headspace of flexible and rigid packages, as applied to gas flushing in modified or controlled atmosphere packaging. The principal market for these products consists of packagers of foods, beverages and pharmaceuticals. Our headspace analyzer products include the PAC CHECK®, CheckMateTM and CheckPointTM series of off-line headspace analyzers and the MAP Check 3TM series of on-line analyzers for continuous and intermittent monitoring of Modified Atmosphere Packaging (MAP) and other gas flushing operations.
Our leak detection products detect leaks in sterile medical trays, food pouches, blister packs and a wide range of other sealed packages. We currently manufacture three types of leak detection instruments. The first type is a non-destructive leak detector that senses small amounts of carbon dioxide escaping from a package or tray. The second type of instrument detects leaks and checks for seal integrity by applying and measuring pressure within a package. The third type pulls a vacuum on a package and looks for vacuum or gas flow changes. The principal markets for these products are packagers of sterile medical items, pharmaceuticals and food products. Our leak detection products include the LeakMatic IITM and LeakPointer IITM series of instruments.
Our gas mixers are used in the food production environment to assure that the package has been properly flushed with the correct mixture of gases. Our gas mixer products include the MAP Mix Provectus and MAP Mix 9001 on-line instruments.
Our package testing products and services group accounted for 43 percent, 44 percent and 44 percent of our consolidated revenue in 2015, 2014 and 2013, respectively.
Permeation Products and Services
Our permeation products consist of systems and services that measure the rate at which various gases and vapors transmit through a variety of materials. These products perform measurements under precise temperature, pressure and relative humidity conditions. The principal market for these products consists of manufacturers of packaging materials, including manufacturers of papers, plastic films, coatings and containers and the users of such packaging materials, such as companies in the food, beverage, pharmaceutical and consumer product industries. Other customers include manufacturers of flat panel displays, solar panels, electronics, and many other sophisticated materials.
We also provide certain laboratory testing services to companies that have a need for permeation data. These services consist primarily of testing film and package permeation for companies that:
|
|
● |
wish to outsource their testing needs to us; |
|
|
● |
are interested in evaluating our instrumentation prior to purchase; or |
|
|
● |
have purchased our products but have a need for additional capacity. |
Our permeation products and services accounted for approximately 41 percent, 36 percent and 38 percent of our consolidated revenue in 2015, 2014 and 2013, respectively. Permeation instruments that we currently manufacture include OX-TRAN® systems for oxygen transmission rates, PERMATRAN-W® systems for water vapor transmission rates, and PERMATRAN-C® systems for carbon dioxide transmission rates. Our AQUATRAN® ultra-high sensitivity, trace moisture permeation analyzer has been increasingly accepted as the standard test instrument of choice in the flat panel, solar cell and electronics industries. Our systems are available in a wide range of options for our customers, including high or low throughput, price, sensitivity and ease of use. They are primarily marketed to research and development departments, as well as production and quality assurance groups.
Industrial Analyzer Products and Services
We manufacture and distribute advanced gas analysis and monitoring instrumentation used in applications such as oil and gas exploration, process and beverage gas analysis, industrial hygiene, safety, environmental air monitoring and indoor air quality.
In this group, we manufacture and sell two types of gas analyzer instruments: gas chromatographs (GCs) and total hydrocarbon analyzers (THAs). These instruments are typically installed in fixed locations at the monitoring sites and perform their functions of detecting and measuring various gases continually or at regular intervals. We also make miniaturized gas sensors and detectors which are sold to original equipment manufacturers (OEMs) of mobile gas safety equipment.
Our industrial analyzer products, sensors and detectors are for use in industrial hygiene (detection of hazardous gases in the workplace), hydrocarbon gas analysis for oil and gas exploration, contaminant detection in the manufacture of specialty gases, and environmental monitoring (tracking the release, or the presence, of toxic substances). Our newest GC offering measures trace levels of contaminants in beverage grade carbon dioxide which is used to carbonate soft drinks, beer and water.
Revenue for our Industrial Analyzer business’ products accounted for approximately 16 percent, 20 percent and 18 percent of our consolidated revenue in each of the years 2015, 2014 and 2013. We market some of these products under the names PetroAlert®, piD-TECH®, and BevAlert®.
Microbial Detection Products
Our microbial detection products are designed to rapidly detect microbial growth in food and beverage samples. Using the total viable count (TVC) method, our GreenLight® series of instruments perform rapid and precise measurements to determine the presence or absence of aerobic bacteria in food products or ingredients. There are two models of the GreenLight product line currently available; the Greenlight 930 and the Greenlight 910. While revenue for these two models are increasing, for the year ended December 31, 2015, revenue from these products do not contribute to our total revenue at a meaningful level.
Competition
We have several competitors for all of our products and services in both foreign and domestic markets. The principal competitive factors for our products and services are:
|
|
● |
product quality and performance; |
|
|
● |
product reliability; |
|
|
● |
product support; and |
|
|
● |
price. |
We compete with a variety of companies in each market in which we sell our products. Some of our competitors have greater assets and resources than we do, and some are smaller than we are. To remain competitive, we must continue to invest in research and development, marketing, customer service and support, and manage our operating expenses. We believe that we have strategies in place to develop technological and other advantages that will give us a competitive advantage over our competitors. However, there can be no assurance that we will have sufficient resources to execute these strategies, or that our competitors will not develop new technologies or other advantages which would require us to reduce our prices, result in lost orders or otherwise adversely affect our financial results.
Manufacturing and Supplies
Our manufacturing capabilities include electro-mechanical assembly, testing, integration of components and systems, calibration and validation of systems. Certain components that we use in our products are currently purchased from single source suppliers. Although we maintain an inventory of these components, an interruption or delay in supply from one of these sources could result in delays in our production while we locate an alternative supplier, which in turn could result in a loss of sales and income.
Patents, Trademarks and Other Intellectual Property Rights
We believe that the protection afforded us by our patent rights is important to our business, and we will continue to seek patent protection for our technology and products. We require all of our employees and consultants to assign to us all inventions that are conceived and developed during their employment, except to the extent prohibited by applicable law. To protect our proprietary information, we have entered into confidentiality and non-compete agreements with those of our employees and consultants who have access to sensitive information. We hold both U.S. and international patents and have U.S. and international patents pending. We currently hold 47 active U.S. patents and 66 foreign patents which will expire during the period from 2016 through 2034, and have another 55 patents pending. We do not believe that the expiration of our patents on their scheduled expiration dates will have a material adverse effect on our business.
We own, have the right to use, or have applied for certain trademarks which protect and identify our products. Our trademarks and service marks include the following: MOCON®, APCHECK®, AQUATRACE®, AQUATRAN, AROMATRAN®, AROMATRAX®, BASELINE®, BEVALERT, CALCARD®, CAL-SMART®, CheckPoint, CMV-2, COULOX®, DANSENSOR®, FLO SMART®, GREENLIGHT, HERSCH®, IMPULSE®, ISM-3, LeakMatic, LeakPointer, LIPPKE®, LUXCEL, MAP Check 3, MAP Mix, MICROANALYTICS®, MULTICHECK®, OPTECH®, OX-TRAN, PAC CHECK, PAC GUARD®, PERMATRAN-C, PERMATRAN-W, PETROALERT, piD-TECH, QUICK START®, SKYE®, TRU SEAL® and VOC-TRAQ®. Our trademarks and service marks have a life of 5 to 20 years, and are subject to periodic maintenance which may be extended in accordance with applicable law.
Marketing and Customers; Distribution Methods
We market our products and services throughout the United States and in over 60 foreign markets. We use a direct sales force of approximately 35 employees and 100 independent sales representatives and distributors to market and sell our products and services to end users throughout the world. To our knowledge, none of our independent sales representatives sell a material amount of product manufactured by any of our competitors.
For information concerning our export sales by geographic area, see Note 14 of the notes to consolidated financial statements. We market products and services to research laboratories, production departments and quality control groups in the life science, medical, food, pharmaceutical, plastics, paper, electronics, oil and gas and other industries. We do not believe that the loss of any single customer would have a material adverse effect on our business or financial performance.
Backlog
As of December 31, 2015, our total backlog was $5.3 million for all of our products as compared to $7.6 million and $7.0 million, as of December 31, 2014 and 2013, respectively. We anticipate shipping substantially all of the December 31, 2015 backlog in 2016.
Research and Development
We are committed to an ongoing engineering program dedicated to innovating new products and improving the quality and performance of our existing products. Our engineering expenses are primarily incurred in connection with the improvement of existing products, cost reduction efforts, and the development of new products that may have additional applications or represent extensions of existing product lines. None of these costs are borne directly by our customers.
We incurred expenses of approximately $4.3 million, $4.2 million and $4.0 million during the fiscal years ended December 31, 2015, 2014 and 2013, respectively, for research and development (R&D) of our products. These amounts were 6 percent to 7 percent of our consolidated revenue for each of those three fiscal years. On an annual basis, we currently intend to spend 6 percent to 8 percent of our consolidated revenue on R&D in the future.
Working Capital Practices
We strive to maintain a level of inventory that is appropriate given our projected revenue. Our domestic and international payment terms vary, however, generally ranging between 30 and 90 days. International revenue is, in some cases, transacted pursuant to letters of credit.
Seasonality
Our business is not seasonal in nature.
Employees
As of December 31, 2015, we had approximately 256 full-time employees. Included in this total are approximately 25 scientists and engineers who research and develop potential new products. None of our employees are represented by a labor union, and we consider our employee relations to be satisfactory.
Executive Officers of the Registrant
Our executive officers, their ages and their offices held, as of March 4, 2016 are as follows:
|
Name |
Age |
Title |
|
Robert L. Demorest |
70 |
Chairman of the Board, President and Chief Executive Officer, MOCON, Inc. |
|
Donald N. DeMorett |
57 |
Chief Operating Officer, MOCON, Inc. |
|
Elissa Lindsoe |
49 |
Chief Financial Officer, MOCON, Inc. |
There are no family relationships among any of our directors and executive officers. Information regarding the business experience of our executive officers is set forth below.
Mr. Robert L. Demorest has been our President, Chief Executive Officer, and Chairman of the Board since April 2000. Mr. Demorest is also a director of Marten Transport, Ltd., a publicly traded company located in Mondovi, Wisconsin, and is a member of its audit committee.
Mr. Donald N. DeMorett has been our Chief Operating Officer since January 2013. Prior to that time, Mr. DeMorett had been the President and Chief Executive Officer of GearGrid Corporation, a manufacturer of commercial storage systems, for more than five years.
Ms. Elissa Lindsoe has been our Chief Financial Officer since October 2014. Ms. Lindsoe was previously the CFO of Galil Medical Ltd., a private equity owned medical device manufacturing firm.
Forward-Looking Statements
This Annual Report on Form 10-K contains or incorporates by reference not only historical information, but also forward-looking statements within the meaning of Section 27A of the Securities Act of 1933, as amended, and Section 21E of the Securities Exchange Act of 1934, as amended, and are subject to the safe harbor created by those sections. In addition, we or others on our behalf may make forward-looking statements from time to time in oral presentations, including telephone conferences and/or web casts open to the public, in press releases or reports, on our website or otherwise. All statements other than statements of historical facts included in this Annual Report on Form 10-K that address activities, events or developments that we expect, believe or anticipate will or may occur in the future are forward-looking statements including, in particular, the statements about our plans, objectives, strategies and prospects regarding, among other things, our financial condition, results of operations, addressable market size estimates and business. We have identified some of these forward-looking statements with words like “believe,” “may,” “could,” “might,” “forecast,” “possible,” “potential,” “project,” “will,” “should,” “expect,” “intend,” “plan,” “predict,” “anticipate,” “estimate,” “approximate” or “continue” and other words and terms of similar meaning. These forward-looking statements may be contained in the notes to our consolidated financial statements and elsewhere in this Annual Report on Form 10-K, including under the heading “Management’s Discussion and Analysis of Financial Condition and Results of Operations.”
Forward-looking statements involve risks and uncertainties. These uncertainties include factors that affect all businesses as well as matters specific to us. The following are some of the uncertainties and factors known to us that could cause our actual results to differ materially from what we have anticipated in our forward-looking statements: realizing the expected financial benefits from the acquisition of Dansensor and the Realignment Plan; general economic conditions; failing to comply with the terms of our credit agreement; restrictions in our credit agreement, growth in the markets we serve, successfully competing against competitors; the decline in the value of the Euro and the price of oil; factors impacting the stock market and share price; ability of the Company’s manufacturing facilities to meet customer demand; regulatory matters; timing and success of new product introductions; adequate protection of intellectual property rights; and currency and other economic risks inherent in selling products internationally.
For more information regarding these and other uncertainties and factors that could cause our actual results to differ materially from what we have anticipated in our forward-looking statements or otherwise could materially adversely affect our business, financial condition or operating results, refer to this Annual Report on Form 10-K under Part I, Item 1A, “Risk Factors.”
All forward-looking statements included in this Annual Report on Form 10-K are expressly qualified in their entirety by the foregoing cautionary statements. We wish to caution readers not to place undue reliance on any forward-looking statement that speaks only as of the date made and to recognize that forward-looking statements are predictions of future results, which may not occur as anticipated. Actual results could differ materially from those anticipated in the forward-looking statements and from historical results, due to the risks and uncertainties described in this Annual Report on Form 10-K under the heading “Item 1A. Risk Factors” below, as well as others that we may consider immaterial or do not anticipate at this time. Although we believe that the expectations reflected in our forward-looking statements are reasonable, we do not know whether our expectations will prove correct. The expectations reflected in our forward-looking statements can be affected by inaccurate assumptions we might make or by known or unknown risks and uncertainties, including those described below under the heading “Item 1A. Risk Factors.” The risks and uncertainties described under the heading “Item 1A. Risk Factors” below are not exclusive and further information concerning us and our business, including factors that potentially could materially affect our financial results or condition, may emerge from time to time. We assume no obligation to update forward-looking statements to reflect actual results or changes in factors or assumptions affecting such forward-looking statements. We advise you, however, to consult any further disclosures we make on related subjects in our quarterly reports on Form 10-Q and current reports on Form 8-K we file with or furnish to the Securities and Exchange Commission.
|
ITEM 1A. |
RISK FACTORS |
The following are significant factors known to us that could have material adverse effects on our business, financial condition or operating results and should be considered carefully in connection with any evaluation of an investment in our common stock. Additionally, the following risk factors could cause our actual results to materially differ from those reflected in any forward-looking statements.
If economic conditions decline, this could adversely affect our business, operating results and financial condition.
Our operations and performance depend significantly on worldwide economic conditions. Uncertainty about global economic conditions poses a risk as consumers and businesses postpone spending in response to tighter credit, unemployment, negative financial news and/or declines in income or asset values, which could have a material negative effect on demand for our products and services. Our customers include pharmaceutical, food, medical and chemical companies, laboratories, government agencies and public and private research institutions. The capital spending of these entities can have a significant effect on the demand for our products. Decreases in capital spending by any of these customer groups could have a material adverse effect on our revenue, business and results of operations.
Further, our customers’ and independent representatives’ ability to borrow money from their existing lenders or to obtain credit from other sources to purchase our products may be impaired. Although we maintain allowances for doubtful accounts for estimated losses resulting from the inability of our customers to make required payments and such losses have historically been within our expectations and the provisions established, we cannot guarantee that we will continue to experience the same loss rates that we have in the past, especially given the current turmoil in the worldwide economy. A significant change in the liquidity or financial condition of our customers could cause unfavorable trends in our receivable collections and additional allowances may be required, which could adversely affect our operating results. If investors have concerns that our business, operating results and financial condition will be negatively impacted by a worldwide economic downturn, our share price could decrease.
If we violate the terms of our credit agreement and financial covenants, it could cause our lender to demand immediate repayment of our credit facilities.
We have a credit agreement with Wells Fargo Bank, our primary lender, with which we entered into a line of credit through August 26, 2018. Our credit agreement with Wells Fargo Bank includes various financial and restrictive covenants. Our current internal projections indicate that we will be in compliance with our financial and restrictive covenants for the next 12 months. However, unforeseen circumstances may develop which could result in us violating our loan covenants. If we violate the terms of our credit agreement, including our financial and restrictive covenants, Wells Fargo Bank could deem us to be in default and require us to immediately repay the entire outstanding balance of our credit facilities. If we do not have the funds available to repay the credit facilities or we cannot find another source of financing, we may fail to meet the terms of our agreement which could decrease the value of our common stock or have other material adverse consequences for us.
Some of the markets in which we operate have experienced minimal growth in recent years, and in the case of the oil and gas market has experienced declines, and our ability to increase our revenue will depend in part on our ability to develop new products, develop new applications for our existing products or acquire complementary businesses and product lines.
We have identified a number of strategies that we believe will allow us to grow our business and increase our revenue in markets experiencing minimal growth. This includes developing new products and technologies, entering new markets such as food safety, developing new applications for our technologies, acquiring complementary businesses and product lines, and strengthening our sales force. However, we can make no assurance that we will be able to successfully implement these strategies, or that these strategies will result in the growth of our business or an increase in our revenue. Acquisitions that we may find attractive may be subject to the consent of Wells Fargo Bank under the credit agreement we have executed with them.
If we fail to attract and retain qualified managerial and technical personnel, we may fail to remain competitive.
Our future success depends, in significant part, upon the continued service and performance of our senior management and other key personnel. We rely on knowledgeable, experienced and skilled technical personnel, particularly engineers, scientists and service personnel, to design, assemble, sell and service our products. The loss of the services of our management team, some of whom have significant experience in our industry, and other key personnel could impair our ability to effectively manage our company and to carry out our business plan. Our inability to attract or retain qualified personnel could have a significant negative effect and thereby materially harm our business.
We face risks of technological changes that may render our products obsolete.
The markets for our products and services are characterized by technological change and evolving industry standards. As a result of such changes and evolving standards, our products may become noncompetitive or obsolete and we may have to develop new products in order to maintain or increase our revenue. New product introductions that are responsive to these factors require significant planning, design, development and testing at the technological, product and manufacturing process levels, and we may not be able to timely develop new products. In addition, industry acceptance of new technologies that we may develop may be slow due to, among other things, existing regulations or standards written specifically for older technologies and general unfamiliarity of users with new technologies. As a result, any new products that we may develop may not generate any meaningful revenue or profits for us for a number of years, if at all.
A significant portion of our revenue is generated from foreign countries and selling in foreign countries entails a number of risks which could result in a decrease in our revenue or an increase in our operating expenses.
Revenue outside the United States accounted for approximately 66 percent of our revenue in 2015, 69 percent in 2014 and 67 percent in 2013, and we expect that foreign revenue will continue to account for a significant portion of our revenues in the future. Revenue to customers in foreign countries are subject to a number of risks including, among others:
● agreements may be difficult to enforce;
● receivables may be difficult to collect;
● certain regions may experience political unrest and conflict and economic instability;
● foreign customers may have longer payment cycles;
● the countries into which we sell may impose tariffs or adopt other restrictions on foreign trade;
● currency fluctuations could reduce reported profitability in future periods;
● fluctuations in exchange rates may affect product demand;
● legal and regulatory requirements may be difficult to monitor and comply with, especially if inconsistent with U.S. laws and regulations;
● customizing products for foreign countries and managing and staffing international operations may lead to increased costs; and
● protection of intellectual property in foreign countries may be more difficult to enforce.
If any of these risks were to materialize, our revenue into foreign countries could decline, or our operating costs could increase, which would adversely affect our financial results.
A portion of our revenue is derived from third party distributors and a disruption to our relationship with them could adversely impact our business. In addition, a portion of our international revenue is derived through third party distributors. As a result, we are dependent upon the financial health of our distributors. We also are dependent upon the compliance of our distributors with foreign laws and the U.S. Foreign Corrupt Practices Act, or the FCPA. If a distributor were to go out of business, it would take substantial time, cost and resources to find a suitable replacement.
We hold a majority of our cash outside the United States and we could incur costs and additional tax liability if we were to bring this cash into the United States.
A significant amount of our cash was generated from our activities outside of the United States and is being held outside of the United States. If these funds were repatriated to the United States or used for operations in the United States in 2016, the amount would be subject to taxation within the United States. Should we require more cash in the United States than is generated by our United States operations, we could elect to repatriate this cash and pay the associated taxes, seek additional borrowing capacity in the United States or seek to raise additional capital in the United States. These alternatives could result in higher effective income tax rates, additional interest expense or other negative impacts to our earnings.
The recent decline in the value of the Euro against the United States dollar has caused a decline in our reported revenue and earnings.
A substantial portion of our revenue outside the United States is generated in Europe. Some of our sales in Europe are denominated in U.S. dollars. For customers that are located in Europe to whom we sell products priced in U.S. dollars, the recent decline in the value of the Euro against the United States dollar will make our products more expensive to these customers which often use their native currency (Euros) to purchase U.S. dollars to pay for our products, and the additional Euros that it will take to pay for our products is an effective price increase to these customers. This could reduce the demand or increase pressure to reduce prices by these customers for our products.
We also have sales to customers located in Europe and elsewhere that are denominated in Euros. For purposes of preparing our consolidated financial statements, these amounts are converted into U.S. dollars and the decrease in the value of the Euro relative to the U.S. dollar means that we will receive less in U.S. dollars from the sales than before the decrease in the exchange rate, which has negatively impacted our operating results. Although some of our costs are denominated in Euros which are also converted into U.S. dollars for purposes of preparing our consolidated financial statements, the reduction in costs on an as converted basis has not offset the reduction in revenue on an as converted basis which has lowered our earnings.
In addition to the decline in the value of the Euro, other fluctuations in foreign currency exchange rates could result in declines in our reported revenue and earnings.
Because the functional currency of our foreign operations is the applicable local currency, we are exposed to foreign currency transaction risk arising from transactions in the normal course of business, such as revenue to third party customers and purchases from suppliers denominated in foreign currencies. From time to time, we have elected to engage in hedging activity to mitigate our risk in this area. At December 31, 2015, there were no forward contract hedge instruments in place in our foreign operations.
Some of our competitors have greater resources than we do, which may provide our competitors with an advantage in the development and marketing of new products.
We currently encounter, and expect to continue to encounter, competition in the sale of our products. We believe that the principal competitive factors affecting the market for our products include product quality and performance, price, reliability and customer service. Our competitors include large multinational corporations. Some of our competitors have substantially greater financial, marketing and other resources than we do. As a result, they may be able to adapt more quickly to new or emerging technologies and changes in customer requirements, or to devote greater resources to the promotion and sale of their products than we can. In addition, competition could increase if new companies enter the market or if existing competitors expand their product lines or intensify efforts within existing product lines. Our current products, products under development and our ability to discover new technologies may be insufficient to enable us to compete effectively with our competitors.
Our reliance upon patents, domestic trademark laws, trade secrets and contractual provisions to protect our proprietary rights may not be sufficient to protect our intellectual property from others who may sell similar products.
We hold patents relating to various aspects of our products and believe that proprietary technical know-how is critical to many of our products. Proprietary rights relating to our products are protected from unauthorized use by third parties only to the extent that they are covered by valid and enforceable patents or are maintained in confidence as trade secrets. We cannot be certain that we will be issued any patents from any pending or future patent applications owned by or licensed to us or that the claims allowed under any issued patents will be sufficiently broad enough to protect our technology. In the absence of patent protection, we may be vulnerable to competitors who attempt to copy our products or gain access to our trade secrets and proprietary know-how. Our competitors may initiate litigation to challenge the validity of our patents, or they may use their resources to design comparable products that do not infringe our patents. We may incur substantial costs if our competitors initiate litigation to challenge the validity of our patents or if we initiate any proceedings to protect our proprietary rights. If the outcome of any such litigation is unfavorable to us, it could have a material adverse effect on our business and results of operations. There may also be pending or issued patents held by parties not affiliated with us that relate to our products or technologies and we may need to acquire licenses to any such patents to continue selling some or all of our products. If we are required to obtain any such license in order to be able to continue to sell some or all of our products, we may not be able to do so on terms that are favorable to us, if at all.
In addition, we rely on trade secrets and proprietary know-how that we seek to protect, in part, by confidentiality agreements with our collaborators, employees and consultants. These agreements may be breached and we may not have adequate remedies for any such breach. Even if these confidentiality agreements are not breached, our trade secrets may otherwise become known or be independently developed by competitors.
The market price of our common stock has fluctuated significantly in the past, and will likely continue to do so in the future, and any broad market fluctuations may materially adversely affect the market price of our common stock.
The market price of our common stock has been volatile in the past, with closing prices ranging from a high of $17.99 and a low of $13.03 during 2015. Several factors could cause the price to fluctuate substantially in the future. Some of these factors include:
● announcements of new products by us or our competitors;
● quarterly fluctuations in our financial results;
● merger and acquisition activity in our industry segment;
● customer contract awards;
● a change to the rates at which we have historically paid dividends, which could be impacted by our credit agreement with Wells Fargo Bank;
● changes in regulation; and
● general economic and political conditions in the various markets where our products are sold.
In addition, the share prices of instrumentation companies have experienced significant fluctuations that often have been unrelated to the operating performance of such companies. This market volatility may adversely affect the market price of our common stock.
Complying with securities laws and regulations is costly for us.
Changing laws, regulations and standards relating to corporate governance and public disclosure, including regulations promulgated by the SEC and Nasdaq, are creating particular challenges for smaller publicly-held companies like us. We are committed to maintaining high standards of corporate governance and public disclosure. As a result, our efforts to comply with evolving laws, regulations and standards have resulted in, and are likely to continue to result in, increased general and administrative expenses and a diversion of management time and attention from revenue-generating activities to compliance activities.
We are exposed to risks relating to its evaluation of its internal control over financial reporting as required by Section 404 of the Sarbanes-Oxley Act.
Our efforts to comply with Section 404 of the Sarbanes-Oxley Act of 2002 and the related regulations regarding our assessment of its internal control over financial reporting have required and will continue to require the expenditure of significant financial and managerial resources. Although our management has concluded that our internal control over financial reporting was effective as of December 31, 2015 and our independent registered public accounting firm agreed, no assurance can be provided that our management or independent registered public accounting firm will reach a similar conclusion as of any later date. Our failure to maintain effective internal control over financial reporting may have an adverse effect on our stock price.
If we experience any increase in the cost of raw materials or supplies, we may experience a decrease in profit margins.
In the past, the overall cost of the materials that we purchase has not risen much more than the rate of inflation. We believe that the price of our products and the prices of our competitors’ products is a significant factor affecting our customers’ buying decisions and consequently, we may not be able to pass along any cost increases in raw materials and supplies in the form of price increases or sustain profit margins that we have achieved in prior years.
We have spent significant resources to develop new products, and the realized revenue from these products may be minimal for a time frame after each new product is being introduced to the marketplace.
In recent years we began to market new products including next generation of existing products such as the OX-TRAN 2/22 and the PERMATRAN-W 3/34. We believe that there are significant markets for our new products and while we believe these products are superior in many respects to similar products being sold by our competitors, each one is new to the marketplace and may not gain the market acceptance necessary to allow us to capitalize on what we believe will be an increasing demand in the industries for which products are utilized. While we have realized increasing revenue of products introduced in the marketplace historically, there can be no assurance that revenue of these products will continue. While we believe our recent new product offerings represent a dramatic improvement over existing technology being used in the respective applications, for some of them, we have not realized significant revenue to date.
If we are not able to successfully market new products, we will not recover the significant research and development and other expenses we have incurred to bring these products to market.
Declining oil prices have resulted in decreased revenue in our Industrial Analyzers and Other segment and may continue to put pressure on this business segment.
Increased oil and gas drilling activity in periods prior to 2015 had been a positive driver for our revenue of monitoring instruments. Worldwide oil prices have recently declined which has led to a decrease in drilling and other exploration activities, which has negatively affected demand for our gas analyzers, sensors and detectors. A further decrease in oil prices may also lead to our customers further decreasing capital spending in anticipation of decreased profitability which could also further negatively affect demand for these products. As a result of decreased spending in the oil and gas drilling markets, our Industrial Analyzers and Other segment experienced a decline in revenue in 2015 and in recent periods and if revenue in this segment continues to decline, our share price could decline.
We recently implemented a realignment plan (“Realignment Plan”), which may result in additional or unanticipated non-recurring charges, and we may not be able to achieve the cost savings expected from these realignment efforts.
Throughout 2015, we completed an initiative to reduce the number of legal entities by merging those entities into other legal entities we have. This initiative is intended to reduce the complexity and administrative burden and cost of maintaining those legal entities. Further, to improve our profitability, during the fourth quarter of 2015, we brought the Package Testing and Permeation segment sales and marketing functions under common leadership and decreased our U.S. headcount by 5 percent. These changes were also designed to strengthen our market presence and provide a cost-effective approach to achieving our objectives.
However, we may not be able to achieve the level of benefits that we expect to realize from these or any future realignment activities, within expected timeframes, or at all. Changes in the amount, timing and character of charges related to our current or future realignment activities and the failure to complete, or a substantial delay in completing, our current and any future realignment plan could have a material adverse effect on our financial results.
|
ITEM 1B. |
UNRESOLVED STAFF COMMENTS |
Not applicable.
|
Item 2. |
PROPERTIES |
We lease an aggregate of 113,175 square feet of office, engineering, laboratory and production space in Minnesota, Texas, Germany, Denmark, Spain, Italy, France and China. We believe that all of our facilities are generally adequate for their present operations and that suitable space is readily available if any of our leases are not extended.
In March 2011, we signed a 15-year lease for our Minneapolis headquarters and operations center. The lease commenced July 1, 2011 and is for a location consisting of approximately 60,000 square feet of space. This space is leased until October 2025. This location is our corporate headquarters from which a portion of all reporting segments conduct operations.
Dansensor A/S, based in Denmark, and operating subsidiaries located in Germany, France, Spain, and Italy lease an aggregate of approximately 39,000 square feet. These buildings are leased through various dates until December 2021. These properties are utilized for the operations of the Package Testing segment.
Our operations located in Neuwied, Germany occupy approximately 8,075 square feet. This space is leased until July 2018. This property is utilized for the operations of the Permeation segment.
The MOCON (Shanghai) Trading Co., Ltd. operations are located in Shanghai, China, and occupy approximately 1,000 square feet. This space is leased until December 2016. This property is utilized in the operations of the Permeation segment.
In addition to our leased facilities described above, we own approximately two acres of land and a building located near Boulder, Colorado that consists of approximately 9,300 square feet of office and production space for our Industrial Analyzers and Other segment.
|
Item 3. |
LEGAL PROCEEDINGS |
There are no material pending legal, governmental, administrative or other proceedings to which we are a party or of which any of our property is the subject.
|
ITEM 4. |
MINE SAFETY DISCLOSURES |
Not applicable.
PART II
|
Item 5. |
MARKET FOR REGISTRANT’S COMMON EQUITY, RELATED ShareHOLDER MATTERS AND ISSUER PURCHASES OF EQUITY SECURITIES |
Market Information and Dividends
Our common stock is quoted on the Nasdaq Global Market System under the symbol MOCO. The following table sets forth, for the fiscal periods indicated, the high and low closing sales prices for our common stock as reported by the Nasdaq Global Market System. These quotations reflect inter-dealer prices, without retail mark-up, mark-down or commission and may not necessarily represent actual transactions. The following table also sets forth, for the fiscal periods indicated, the amount of cash dividends declared on our common stock:
| 2015 | 2014 | |||||||||||||||||||||||
|
Fiscal Period |
High |
Low |
Dividend |
High |
Low |
Dividend |
||||||||||||||||||
|
1st Quarter |
$ | 17.29 | $ | 15.86 | $ | 0.11 | $ | 17.43 | $ | 15.72 | $ | 0.11 | ||||||||||||
|
2nd Quarter |
$ | 17.99 | $ | 15.90 | $ | 0.11 | $ | 17.12 | $ | 15.07 | $ | 0.11 | ||||||||||||
|
3rd Quarter |
$ | 16.25 | $ | 13.03 | $ | 0.11 | $ | 16.44 | $ | 14.88 | $ | 0.11 | ||||||||||||
|
4th Quarter |
$ | 15.20 | $ | 13.54 | $ | 0.11 | $ | 18.50 | $ | 13.00 | $ | 0.11 | ||||||||||||
We have been consistently paying dividends since 1984. Cash dividends paid in 2015, 2014 and 2013 were approximately $2.5 million, $2.5 million and $2.4 million, respectively. Our Board of Directors monitors and evaluates our dividend practice quarterly, and the Board may elect at any time to increase, decrease or not pay a dividend on our common stock based upon our financial condition, results of operations, cash requirements and future prospects and other factors deemed relevant by the Board. Under the loan agreement we have with Wells Fargo Bank, we are required to maintain certain financial ratios. One of these ratios will be impacted by the amount of dividends we pay. If paying dividends at our historical rate were to cause us to be out of compliance with this ratio, or otherwise cause us to be in breach of our covenants under our loan agreement with Wells Fargo Bank, we may be required to reduce or eliminate dividends until such time as we are able to repay our loan, regain compliance with the financial ratios and other covenants in the loan agreement, or negotiate a waiver or amendment with Wells Fargo Bank.
For information concerning securities authorized for issuance under equity compensation plans, please see Part III – Item 12.
Holders
As of February 26, 2016, there were approximately 309 holders of record and 3,400 beneficial holders of our common stock.
Issuer Repurchases of Equity Securities
Other than the withholding of 56,601 shares of our common stock in connection with the cashless net exercise of stock options to pay the exercise price of such options, we did not repurchase any shares of our common stock or other equity securities of MOCON registered pursuant to Section 12 of the Securities Exchange Act of 1934, as amended, during the fourth quarter ended December 31, 2015. We currently are not authorized by our Board of Directors to make repurchases of our common stock, and we are restricted from doing so under our credit agreement with Wells Fargo Bank.
Recent Sales of Unregistered Securities
During the fourth quarter and year ended December 31, 2015, we did not issue or sell any shares of our common stock or other equity securities of MOCON without registration under the Securities Act of 1933, as amended.
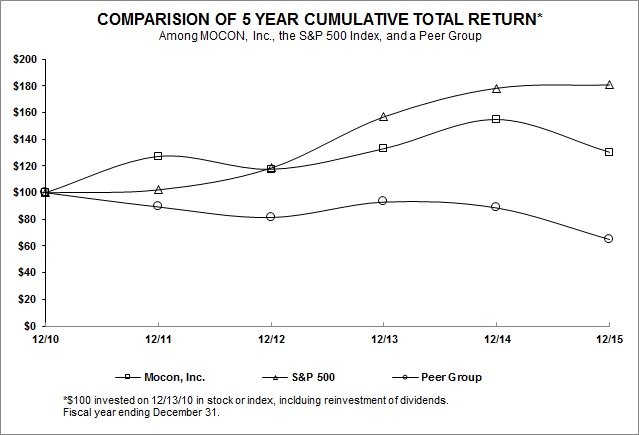
Stock Performance Graph
The following graph compares the cumulative shareholder return on MOCON’s common stock to the S&P 500 Index and a peer group consisting of five companies with a market capitalization similar to MOCON. The peer companies were selected from the scientific and technical instruments industry within the technology sector. The graph compares the performance for the last five fiscal years, assuming an investment of $100 on December 31, 2010, including the reinvestment of all dividends. The peer group consists of the following companies: CyberOptics Corporation, eMagin Corporation, Perceptron, Inc., Sypris Solutions, Inc. and Transcat, Inc. We chose these five companies because they operate in similar technology sectors that we do and have a market capitalization similar to ours.
|
12/10 |
12/11 |
12/12 |
12/13 |
12/14 |
12/15 |
|||||||||||||||||||
|
Mocon, Inc. |
100.00 | 127.17 | 117.54 | 132.99 | 154.83 | 130.28 | ||||||||||||||||||
|
S&P 500 |
100.00 | 102.11 | 118.45 | 156.82 | 178.29 | 180.75 | ||||||||||||||||||
|
Peer Group |
100.00 | 89.33 | 81.40 | 92.99 | 88.52 | 64.93 | ||||||||||||||||||
Source: Research Data Group, Inc.
|
Item 6. |
SELECTED FINANCIAL DATA |
| Years Ended December 31, | ||||||||||||||||||||
|
2015 |
2014 |
2013 |
2012 |
2011 |
||||||||||||||||
|
(in thousands, except per share data) |
||||||||||||||||||||
|
CONSOLIDATED STATEMENTS OF INCOME DATA: |
||||||||||||||||||||
|
Revenue |
$ | 61,224 | $ | 64,475 | $ | 57,108 | $ | 49,941 | $ | 37,361 | ||||||||||
|
Net income |
2,972 | 1,536 | 3,461 | 2,002 | 5,451 | |||||||||||||||
|
Net income per common share: |
||||||||||||||||||||
|
Basic |
0.52 | 0.27 | 0.62 | 0.37 | 1.02 | |||||||||||||||
|
Diluted |
0.51 | 0.27 | 0.61 | 0.35 | 0.98 | |||||||||||||||
|
Cash dividends declared per share |
0.44 | 0.44 | 0.44 | 0.42 | 0.40 | |||||||||||||||
| As of December 31, | ||||||||||||||||||||
|
2015 |
2014 |
2013 |
2012 |
2011 |
||||||||||||||||
|
(in thousands) |
||||||||||||||||||||
|
CONSOLIDATED BALANCE SHEET DATA: |
||||||||||||||||||||
|
Current assets |
$ | 24,702 | $ | 27,501 | $ | 27,570 | $ | 26,913 | $ | 23,357 | ||||||||||
|
Total assets |
47,419 | 52,509 | 58,704 | 57,220 | 39,705 | |||||||||||||||
|
Current liabilities |
9,600 | 15,449 | 16,935 | 16,494 | 6,140 | |||||||||||||||
|
Noncurrent liabilities |
4,348 | 2,587 | 4,300 | 6,845 | 325 | |||||||||||||||
|
Shareholders' equity |
33,471 | 34,473 | 37,469 | 33,881 | 33,240 | |||||||||||||||
|
Item 7. |
MANAGEMENT’S DISCUSSION AND ANALYSIS OF FINANCIAl CONDITION AND RESULTS OF OPERATIONS |
This Management’s Discussion and Analysis provides material historical and prospective disclosures intended to enable investors and other users to assess our financial condition and results of operations. Statements that are not historical are forward-looking and involve risks and uncertainties including those discussed under the heading “Item 1A. Risk Factors” and elsewhere in this Annual Report on Form 10-K. For more information, see “Part I Item 1 Business — Forward-Looking Statements” of this Annual Report on Form 10-K. The following discussion of the results of the operations and financial condition of MOCON should be read in conjunction with our consolidated financial statements and the related notes thereto included elsewhere in this Annual Report on Form 10-K.
Overview
MOCON, Inc. designs, manufactures, markets and services products and provides consulting and testing services primarily in the measurement and analytical instrument and services markets. Our products include instruments that detect, measure and monitor gases and chemical compounds. We continually seek growth opportunities through technological and product improvement, by developing new products, and by acquiring new companies, new product lines, or rights to technologies.
We are headquartered in Minnesota and have operating locations in Minnesota, Denmark, and Colorado. We have offices and laboratories in Texas, Germany, France, Italy, Spain and China. We use a mix of a direct sales force and independent sales representatives to market our products and services in the United States, Canada, Europe and China, and we use a network of independent sales representatives and distributors to market and service our products and services in most other foreign countries.
Our ongoing plans for growth include continued substantial funding for research and development to drive new product introductions, together with strategic acquisitions and investments where appropriate.
Significant Transactions and Financial Trends
Throughout these financial sections, you will read about significant transactions or events that materially contribute to, or reduce our earnings, and materially affect our financial results and financial position.
Our research and development costs were approximately 6 percent to 7 percent of our consolidated revenue in 2015, 2014 and 2013. On an annual basis, we intend to spend 6 percent to 8 percent of our revenue on research and development in the future.
During 2015, we implemented a series of initiatives, including a reduction in workforce and simplification of business structures (“Realignment Plan”). Substantially all Realignment Plan activities were completed by December 31, 2015. These actions are intended to increase operating efficiencies and provide additional resources to execute our long-term growth strategy.
In January 2016, we entered into an agreement to sell substantially all the assets of the business formerly known as Microanalytics which is located in Round Rock, Texas. The sale is expected to be finalized and closed during the first half of 2016. The assets of this business primarily consists of lab equipment used in the analytical chemistry services, formulation, product development and consulting services focused on the identification of odors and aromas. The revenue related to this business was $0.7 million, $0.9 million and $0.8 million for the years ended December 31, 2015, 2014 and 2013, respectively. The gross profit contribution related to the Microanalytics business was $0.2 million, $0.4 million and $0.3 million for the years ended December 31, 2015, 2014 and 2013, respectively.
While these items are important in understanding and evaluating our financial results, certain trends, such as our international revenue accounting for a significant portion of our revenue, and other transactions or events such as those discussed later in this Management’s Discussion and Analysis, may also have a material impact on our financial results.
Critical Accounting Policies
Our significant accounting policies are described in Note 1 to our consolidated financial statements included in Item 8 of this Annual Report on Form 10-K. This Management’s Discussion and Analysis of Financial Condition and Results of Operations is based upon our consolidated financial statements, which have been prepared in accordance with accounting principles generally accepted in the United States of America. The preparation of these consolidated financial statements requires management to make estimates and judgments that affect the reported amount of assets, liabilities, revenues and expenses, and related disclosure of contingent assets and liabilities. The Securities and Exchange Commission has defined a company’s most critical accounting policies as those that are most important to the portrayal of its financial condition and results of operations, and which require us to make its most difficult and subjective judgments, often as a result of the need to make estimates of matters that are inherently uncertain. Based on this definition, we have identified the following critical accounting policies. Although we believe that our estimates and assumptions are reasonable, they are based upon information available when they are made. Actual results may differ significantly from these estimates under different assumptions or conditions.
Revenue Recognition
We recognize revenue when it is realized or realizable and earned. We consider product revenue realized or realizable when persuasive evidence of an arrangement exists, the product has been shipped or the services have been provided to the customer, title and risk of loss of products has passed to the customer, the sales price is fixed or determinable, and collectability is reasonably assured. We recognize service and consulting revenue upon delivery of the services. The revenue recognition policy does not differ among the various product lines, the marketing venues, or various geographic destinations. We do not have distributors who stock our equipment. We do not offer rebates, price protection, or other similar incentives, and discounts when offered, are recorded as a reduction in revenue. We record revenue net of sales tax charged to the customer.
Revenue for service arrangements such as maintenance, repair, technical support are recognized either as the service is provided or ratably over the defined contractual period for service maintenance. Revenue for preventive maintenance agreements is recognized on a per visit basis and extended warranties on a straight-line basis over the life of the contracts. Unearned revenue related to these contracts is recorded in current liabilities in the consolidated balance sheets.
Periodically, we have shipments of products to customers where we are required to recognize revenue under the accounting guidance related to multiple element arrangements. This guidance provides that the overall arrangement fee will be allocated to each element (both delivered and undelivered items) based on their relative selling price, as demonstrated by vendor-specific objective evidence (VSOE) or third-party evidence (TPE). Where VSOE or TPE is not available, revenue will be assigned using an estimated selling price.
Reserve for Doubtful Accounts and Returns
Our allowance for doubtful accounts and returns is for accounts receivable balances that are estimated to be uncollectible as well as anticipated returns. The reserve is based on a number of factors, including: (1) an analysis of customer accounts and (2) our historical experience with accounts receivable write-offs and returns. The analysis includes the age of the receivable, the financial condition of a customer or industry and general economic conditions. We believe our financial results could be materially different if historical trends are not predictive of future results or if economic conditions worsened for our customers. In the event we determined that a smaller or larger allowance for doubtful accounts is appropriate, we would record a credit or charge to selling, general and administrative expense in the period that we made such a determination. As of December 31, 2015 and 2014, we had approximately $141,000 and $181,000, respectively, reserved against our accounts receivable for doubtful accounts and returns.
Accrual for Excess and Obsolete Inventories
We perform an analysis to identify excess and obsolete inventory. We record a charge to cost of revenue for amounts identified. Our analysis includes inventory levels, the nature of the components and their inherent risk of obsolescence, and the on-hand quantities relative to the sales history of that component. We believe that our financial results could be materially different if historical trends are not predictive of future results or if demand for our products decreased because of economic or competitive conditions or otherwise. As of December 31, 2015 and 2014, we had approximately $511,000 and $526,000, respectively, accrued for excess and obsolete inventories.
Recoverability of Long-Lived Assets
We assess the recoverability of definite-lived intangibles and other long-lived assets periodically whenever events or changes in circumstances indicate that expected future undiscounted cash flows might not be sufficient to support the carrying amount of an asset. We deem an asset to be impaired if a forecast of undiscounted future operating cash flows is less than an asset’s carrying amount. If an asset is determined to be impaired, the loss is measured as the amount by which the carrying value of the asset exceeds its fair value. Changes in our business strategies, changes in the economic environment in which we operate, competitive conditions, and other factors could result in future impairment charges.
During 2014 we identified an impairment indicator and concluded that the carrying value of our investment in an affiliated company, Luxcel Biosciences Limited (Luxcel) exceeded its fair value. The impairment was determined to be other-than-temporary. As a result, a non-cash, non-tax deductible impairment charge of $3.2 million, representing 100 percent of the carrying value, has been recognized within operating expenses of the consolidated statements of income in 2014.
Goodwill
We assess the recoverability of goodwill on our annual measurement date or whenever events or changes in circumstances indicate that expected future undiscounted cash flows might not be sufficient to support the carrying amount of an asset. Goodwill is considered to be impaired if it is determined that the carrying amount of the reporting unit exceeds its fair value. Assessing the impairment of goodwill requires us to make judgments regarding the fair value of the net assets of our reporting units and the allocation of the carrying amount of shared assets to the reporting units. Our annual assessment included comparison of the carrying amount of the net assets of a reporting unit, including goodwill, to the fair value of the reporting unit. A significant change in our market capitalization or in the carrying amount of net assets of a reporting unit could result in an impairment charge in future periods. We performed our annual 2015 assessment during the fourth quarter, and determined there was no impairment of goodwill for any of our reporting units as their related fair values were in excess of their carrying values.
Income Taxes
In the preparation of our consolidated financial statements, management is required to estimate income taxes in each of the jurisdictions in which we operate. This process involves estimating actual current tax exposures together with assessing temporary differences resulting from differing treatment of items for tax and accounting purposes. These differences result in deferred tax assets and liabilities, which are included in our Consolidated Balance Sheets.
Management reviews the deferred tax assets for recoverability on a quarterly basis and assesses the need for valuation allowances. These deferred tax assets are evaluated by considering historical levels of income, estimates of future taxable income streams and the impact of tax planning strategies. A valuation allowance is recorded to reduce deferred tax assets when it is determined that it is more likely than not that we would not be able to realize all or part of our deferred tax assets. We provided a valuation allowance in the amount of $1.3 million at December 31, 2015 and 2014, against our net deferred tax assets.
Financial Accounting Standards Board (“FASB”) Accounting Standards Codification (“ASC”) 740 requires application of a more-likely-than-not threshold to the recognition and de-recognition of uncertain tax positions. Under ASC 740, once the more-likely-than-not threshold is met, the amount of benefit to be recognized is the largest amount of tax benefit that is greater than 50 percent likely of being ultimately realized upon settlement. It further requires that a change in judgment related to the expected ultimate resolution of uncertain tax positions be recognized in earnings in the period of such a change. We have unrecognized tax benefits in the amount of $201,000 and $357,000 in 2015 and 2014, respectively, for estimated exposures associated with uncertain tax positions. However, due to the complexity of some of these uncertainties, the ultimate settlement may result in payments that are different from our current estimate of tax liabilities, resulting in the recognition of additional charges or benefits to income tax expense.
Results of Operations
The following table sets forth the relationship between various components of our results of operations, stated as a percent of revenue, for fiscal years ended December 31, 2015, 2014 and 2013. Our historical financial data were derived from our consolidated financial statements and related notes included in Item 8 of this Annual Report on Form 10-K.
|
Percent of Revenue |
||||||||||||
|
2015 |
2014 |
2013 |
||||||||||
|
Revenue |
100.0 | 100.0 | 100.0 | |||||||||
|
Cost of revenue |
45.7 | 44.0 | 45.2 | |||||||||
|
Gross profit |
54.3 | 56.0 | 54.8 | |||||||||
|
Selling, general and administrative expenses |
38.3 | 38.8 | 39.3 | |||||||||
|
Research and development expenses |
7.1 | 6.5 | 7.1 | |||||||||
|
Realignment Expense |
1.7 | - | - | |||||||||
|
Impairment of investment in affiliated company |
- | 4.9 | - | |||||||||
|
Operating income |
7.2 | 5.8 | 8.4 | |||||||||
|
Other income (expense), net |
0.1 | (0.5 | ) | (0.6 | ) | |||||||
|
Income before income taxes |
7.3 | 5.3 | 7.8 | |||||||||
|
Income taxes |
2.4 | 3.0 | 1.7 | |||||||||
|
Net income |
4.9 | 2.3 | 6.1 | |||||||||
The following table summarizes total revenue by segment for 2015, 2014 and 2013 (expressed in thousands):
| Years Ended December 31, | ||||||||||||
|
2015 |
2014 |
2013 |
||||||||||
|
Package Testing |
$ | 26,583 | $ | 28,071 | $ | 25,241 | ||||||
|
Permeation |
25,069 | 23,380 | 21,395 | |||||||||
|
Industrial Analyzers and Other |
9,572 | 13,024 | 10,472 | |||||||||
|
Total revenue |
$ | 61,224 | $ | 64,475 | $ | 57,108 | ||||||
The following table sets forth the relationship between various components of domestic and foreign revenue for 2015, 2014 and 2013 (expressed in thousands):
| Years Ended December 31, | ||||||||||||
|
2015 |
2014 |
2013 |
||||||||||
|
Domestic revenue |
$ | 20,872 | $ | 19,836 | $ | 19,052 | ||||||
|
Foreign revenue: |
||||||||||||
|
Europe |
23,673 | 26,324 | 23,966 | |||||||||
|
Asia |
12,762 | 14,166 | 10,481 | |||||||||
|
Other |
3,917 | 4,149 | 3,609 | |||||||||
|
Total foreign revenue |
40,352 | 44,639 | 38,056 | |||||||||
|
Total revenue |
$ | 61,224 | $ | 64,475 | $ | 57,108 | ||||||
Revenue
Fiscal 2015 vs. Fiscal 2014
Revenue in 2015 was $61.2 million, a decrease of 5 percent compared to $64.5 million for 2014. Foreign currency translation had an unfavorable impact of $5.3 million compared to the prior year. When excluding the effect of the currency rate impact, revenue grew 3 percent and continues to meet growth targets for the Package Testing and Permeation segments. The growth in our Package Testing and Permeation segments on a constant currency basis was offset by the decline in revenue for our Industrial Analyzers and Other segment. We believe future revenue results depend primarily upon our ability to continue to introduce new products, retain and attract market demand and grow in the markets we serve, including oil and gas markets.
Package Testing Products and Services
Revenue in our Package Testing segment accounted for 43 percent and 44 percent of our consolidated revenue in each of 2015 and 2014, respectively. Revenue decreased 5 percent in the year ended December 31, 2015 to $26.6 million compared to same period in 2014. Revenue in our Package Testing segment was negatively impacted by $4.4 million during 2015 due to currency rate fluctuations as compared to the prior year. Excluding the impact of the currency rate fluctuations, revenue for our Package Testing segment grew 11 percent compared to the prior year. This growth on a constant currency basis is a result of a continued revenue increase in our headspace and mixer products as we increase our market share. Revenue to foreign destinations comprised 74 percent and 77 percent of total revenue in this segment for the years ended December 31, 2015 and 2014, respectively.
Permeation Testing Products and Services
Revenue in our Permeation segment increased 7 percent for the current year as compared to the prior year, and accounted for 41 percent and 36 percent of our consolidated revenue for the years ended December 31, 2015 and 2014, respectively. Permeation segment revenue was negatively impacted by $897,000 due to currency rate fluctuations compared to the prior year. Excluding the impact of the currency rate fluctuations, revenue for our Permeation segment grew 11 percent compared to the prior year. This increase is due to strong demand for our new generation of oxygen permeation instrumentation. Foreign revenue comprised 63 percent of the revenue in this segment in 2015, compared to 70 percent from the prior year.
Industrial Analyzer Products and Services and Other
Revenue in our Industrial Analyzers and Other segment accounted for 16 percent and 20 percent of our consolidated revenue for the years ended December 31, 2015 and 2014, respectively. Revenue decreased 27 percent to $9.6 million during the year ended December 31, 2015 compared to $13.0 million for the same period in 2014. The decline in revenue compared to the prior year is primarily due to a 77 percent, or $3.9 million, decline in instrument revenue from the oil and gas exploration markets partially offset by an increase in demand from the environmental monitoring, in which instrument sales were up 5 percent, and beverage safety markets. Revenue to foreign destinations comprised 49 percent and 50 percent of total revenue in this segment for the years ended December 31, 2015 and 2014, respectively.
Fiscal 2014 vs. Fiscal 2013
Revenue for 2014 was $64.5 million, an increase of 13 percent compared to $57.1 million for 2013. The increase was driven by strong performance across all of our business segments, with the largest increases in foreign markets. Package Testing segment revenue increased 11 percent due primarily to strong demand for our leak detection and headspace analyzers in the food packaging industry. In addition, revenue generated from our Permeation segment increased 9 percent compared to 2013 due primarily to steady demand in foreign countries for our recently introduced next generation instruments. Our Industrial Analyzers and Other segment grew 24 percent over 2013. This strong demand was driven by oil and gas exploration and improved performance for our environmental monitoring and beverage gas analyzer businesses. We believe future revenue results depend upon our ability to continue to introduce new products and retain and attract market demand.
Package Testing Products and Services
Revenue in our Package Testing segment accounted for 44 percent of our consolidated revenue in each of 2014 and 2013. Revenue increased 11 percent in the year ended December 31, 2014 compared to same period in 2013. Improved revenue of leak detection and headspace analyzers both contributed to the growth in 2014. Revenue to foreign destinations comprised 77 percent of total revenue in this segment for the years ended December 31, 2014 and 2013, respectively.
Permeation Testing Products and Services
Revenue of our Permeation testing products and services, which accounted for 36 percent and 38 percent of our consolidated revenue in 2014 and 2013, respectively, increased 9 percent in 2014 compared to 2013. This increase is due to the strengthening international markets and strong demand for our recently introduced next generation instruments OX-TRAN 2/22 and PERMATRAN-W 3/34. Foreign revenue comprised 70 percent of the revenue in this segment in 2014, compared to 65 percent from the prior year.
Industrial Analyzer Products and Services and Other
Revenue in our Industrial Analyzers and Other segment accounted for 20 percent and 18 percent of our consolidated revenue for the years ended December 31, 2014 and 2013, respectively. Revenue increased 24 percent during the year ended December 31, 2014 compared to the same period in 2013. Revenue of gas chromatographs and hydrocarbon analyzers accounted for the majority of the increase as demand increased in the oil and gas exploration, environmental monitoring and beverage gas analyzer markets. Revenue of OEM sensors and detectors for worker safety applications also contributed to strong growth. Revenue to foreign destinations comprised 50 percent and 49 percent of total revenue in this segment for the years ended December 31, 2014 and 2013, respectively.
Gross Profit
Fiscal 2015 vs. Fiscal 2014
Our overall gross profit was 54 percent and 56 percent of revenue during 2015 and 2014, respectively. Gross profit as a percentage of revenue in our Package Testing segment increased five percentage points to 54 percent in 2015 from 49 percent in 2014 due to an increase in the revenue volume from headspace and accessory products which have a higher level of gross profit. The gross profit as a percentage of revenue in our Permeation segment decreased by six percentage points to 58 percent in the current year from 64 percent in 2014 due to foreign exchange pricing impacts on instruments made in the U.S.A. and sold in foreign currencies and additional production costs related to the new generation of instruments. The gross profit as a percentage of revenue in our Industrial Analyzers and Other segment declined by ten percentage points to 46 percent in 2015 compared to 56 percent in 2014. The decline in gross profit as a percent of revenue is due to decrease in volume to absorb semi-variable and fixed production related costs and an increase in warranty costs for a quality issue with sensor components in the latest release of gas chromatograph instruments.
Fiscal 2014 vs. Fiscal 2013
Our overall gross profit was 56 percent and 55 percent of revenue during 2014 and 2013, respectively. Gross profit as a percentage of revenue in our Package Testing segment increased two percentage points from 47 percent in 2013 to 49 percent in 2014. The primary reason for the increase comes from increased capacity utilization. The gross profit as a percentage of revenue in our Permeation segment increased by one percentage point from 63 percent in 2013 to 64 percent in 2014. The primary reason for the increase comes from product mix with a higher level of gross profit coming from instruments. The gross profit as a percentage of revenue in our Industrial Analyzers and Other segment declined slightly by one percentage point to 56 percent in 2014 compared to 57 percent in 2013. The decline in gross profit as a percent of revenue is due to an increase in production capacity some of which was not fully utilized in 2014, to support our future revenue growth in the Industrial Analyzers and Other Segment. We expect future gross profit percentages to fluctuate depending on the mix of product, service and consulting revenue.
Selling, General and Administrative Expenses
Fiscal 2015 vs. Fiscal 2014
Selling, general and administrative expenses were approximately $23.4 million and $25.0 million, or 38 and 39 percent of revenue for 2015 and 2014, respectively. During 2015, selling, general and administrative expenses included an increase in domestic commissions due to an increase in domestic revenue and additional personnel costs due to increased headcount, offset by a decline in the foreign currency rates when compared to the prior year.
Fiscal 2014 vs. Fiscal 2013
Selling, general and administrative expenses were approximately $25.0 million and $22.4 million, or 39 percent of revenue in both 2014 and 2013, respectively. The overall increase in the current year was primarily related to higher professional fees for audit and Sarbanes-Oxley (SOX) compliance consulting, increased commissions, and higher compensation related expenses resulting from increased headcount and incentive compensation.
Research and Development Expenses
Fiscal 2015 vs. Fiscal 2014
Research and development (R&D) expenses were approximately $4.3 million and $4.2 million in 2015 and 2014, or 7 percent of revenue in each year. For the foreseeable future, we intend to continue spending 6 percent to 8 percent of revenue to R&D. We believe continued R&D expenditures are necessary as we develop new products to expand revenue opportunities in our niche markets to remain competitive.
Fiscal 2014 vs. Fiscal 2013
R&D expenses were approximately $4.2 million and $4.0 million in 2014 and 2013, or 7 percent of revenue in each year. For the foreseeable future, we intend to continue to allocate on an annual basis 6 percent to 8 percent of revenue to R&D.
Realignment expenses
During 2015, we implemented a series of activities including the Realignment Plan in order to simplify our business structure by reducing the number of legal entities and by combining the sales and marketing teams of our Permeation and Package Testing segments under common leadership. The realignment expenses incurred in 2015 were $1.0 million. There were no realignment expenses in 2014 or 2013. Substantially all realignment activities were complete by December 31, 2015. The Realignment Plan included:
|
|
● |
The elimination of approximately 10 positions across all areas |
|
|
● |
Significant costs associated with legal and professional fees of $414,000 |
|
|
● |
Significant separation costs of $635,000 |
Impairment of investment in affiliated company
In January 2010, we acquired a minority equity ownership interest in Luxcel Biosciences Limited (Luxcel) based in Cork, Ireland. The investment of €2.5 million amounted to a 16.9 percent equity interest in Luxcel. During 2014 we became aware of a triggering event that indicated possible impairment. After further analysis, we determined that the investment was other than temporarily impaired, and as a result, recorded a non-cash, non-tax deductible charge of $3.2 million to fully impair the asset. No impairment was recorded during the year ended December 31, 2013.
Other Income (Expense), Net
Other income (expense), net for 2015, 2014 and 2013 was as follows (expressed in thousands):
| Years Ended December 31, | ||||||||||||
|
2015 |
2014 |
2013 |
||||||||||
|
Interest income |
$ | 2 | $ | 3 | $ | 22 | ||||||
|
Interest expense |
(119 | ) | (186 | ) | (299 | ) | ||||||
|
Foreign currency exchange gain (loss) |
209 | (136 | ) | (83 | ) | |||||||
|
Other |
1 | 13 | 1 | |||||||||
|
Total other income (expense), net |
$ | 93 | $ | (306 | ) | $ | (359 | ) | ||||
Fiscal 2015 vs. Fiscal 2014
Interest income stayed consistent in 2015, as compared to 2014, due to similar levels of cash. The interest expense in 2015 is primarily related to the debt incurred in connection with the line of credit, and the foreign currency exchange gain was primarily due to revaluing the foreign currency contract and related note payable to fair value. Interest expense decrease in 2015 compared to 2014 due to the net pay-down on total debt by $1.6 million year over year.
Fiscal 2014 vs. Fiscal 2013
Interest income decreased in 2014, as compared to 2013, due to lower average invested balances of cash and marketable securities. The interest expense in 2014 is primarily related to the debt incurred in connection with the Dansensor acquisition, and the foreign currency exchange loss was primarily due to revaluing the foreign currency contract and related note payable to fair value. Interest expense decrease in 2014 compared to 2013 due to the net pay-down on total debt by $3.7 million year over year.
Income Tax Expense
Fiscal 2015 vs. Fiscal 2014
Our provision for income taxes in 2015 was $1.5 million, or 33 percent of income before income taxes, compared to $1.9 million, or 56 percent of income before income taxes for 2014. The current year effective tax rate is lower than the expected statutory rate due to the effect of foreign operations where we generally experience lower tax rates, and the research credit and domestic manufacturing deduction for 2015 partially offset by discrete items recognized in 2015.
Fiscal 2014 vs. Fiscal 2013
Our provision for income taxes in 2014 was $1.9 million, or 56 percent of income before income taxes, compared to $963,000, or 22 percent of income before income taxes for 2013. The current year effective tax rate is higher than the expected statutory rate due to the effect of the $3.2 million impairment of our investment in an affiliated company and the corresponding valuation allowance offset by income tax rates in foreign operations, where we generally experience lower tax rates and the research credit and domestic manufacturing deduction for the current year. The valuation allowance recognized related to the impairment of investment in an affiliated company is $1.1 million, or 33 percent of income before income taxes for the year ended December 31, 2014.
Inflation
We do not believe that inflation has had a material effect on our results of operations in recent years; however, there can be no assurance that our business will not be adversely affected by inflation in the future.
Liquidity and Capital Resources
Total cash and cash equivalents remained consistent at $6.3 million at both December 31, 2015 and 2014. Of the $6.3 million in cash and cash equivalents as of December 31, 2015, $4.8 million was held at banks located primarily in Germany and Denmark. Cash provided by operating activities was approximately $6.4 million in 2015 compared to $9.7 million in 2014. Cash flows provided by operating activities in the U.S. were offset by cash used to pay down our debt in the amount of $1.6 million, dividends paid totaling $2.5 million, and payment to acquire property, plant and equipment for $1.6 million.
At December 31, 2015, we had $3.0 million in total debt compared to $4.6 million on December 31, 2014. Total debt on December 31, 2015 is comprised of:
|
● |
$2.8 million outstanding on the line of credit compared to $3.3 million at December 31, 2014. The secured line of credit has availability up to a maximum of $10.0 million and expires August 26, 2018. Effective August 26, 2015, we entered into the fourth amendment to the related line of credit agreement which increased the available principal on the line to $10.0 million. In addition, Dansensor has an available line of credit totaling 10 million DKK (approximately $1.5 million) at a Danish bank, of which no amounts were outstanding as of December 31, 2015 and 2014. |
|
● |
The term note with Wells Fargo was paid off as of September 2015. No balance was outstanding at December 31, 2015 compared to $1.2 million on December 31, 2014. |
|
● |
The note in connection with the Dansensor acquisition was paid off as of April 2015. No balance was outstanding at December 31, 2015 compared to $95,000 on December 31, 2014. |
Our working capital as of December 31, 2015 increased approximately $3.0 million to $15.1 million, compared to $12.1 million at December 31, 2014. This increase was primarily due to a decrease in accounts payable, a decrease in current maturities of long-term notes payable and reclassifying the line of credit as long term, partially offset by a reduction in trade accounts receivable, a reduction in inventory and an increase in realignment expenses.
During 2015, we implemented a Realignment Plan which is expected to reduce our cost structure by approximately $1.7 million annually by decreasing our U.S.A. headcount by 5 percent, including elimination of vacant positions. In addition, during 2015 we undertook an initiative to reduce the number of legal entities that we have. These activities were substantially complete as of December 31, 2015 and resulted in a non-recurring charge of $1.0 million during 2015. The total cash paid during 2015 for these activities was $0.4 million and an additional $0.6 million will be paid during 2016.
One of our strategic objectives is, as market and business conditions warrant, to consider acquisitions of, or investments in, businesses, products and/or technologies. If we wish to pursue one or more additional acquisition opportunities, this may require the consent of the Bank under the credit agreement we have executed, and we may need to fund such activities with a portion of our cash balances and debt or equity financing. If we need to raise additional capital, an equity-based or equity-linked financing may be used which could be dilutive to existing shareholders. If we raise additional funds by issuing debt, we may be subject to additional restrictive covenants that could limit our operational flexibility and higher interest expense could dilute earnings per share.
We may invest a portion of our available cash in highly liquid marketable securities consisting primarily of certificates of deposits, municipal bonds, and money market funds. Our investment policy is to manage these assets to preserve principal, maintain adequate liquidity at all times, and maximize returns subject to investment guidelines we maintain.
A significant amount of our earnings are generated outside the U.S.A. and are indefinitely reinvested in non-U.S.A. subsidiaries, resulting in the majority of our cash being held outside the U.S.A. which is available for use by our non-U.S.A. operations. If these funds were repatriated to the U.S.A. or used for U.S.A. operations, the amount would be subject to U.S.A. taxes. Therefore, we continue to accumulate earnings outside of the U.S.A. and use the cash generated from U.S.A. operations as well as borrowings to meet our U.S.A. cash needs. Should we require more capital in the U.S.A. than is generated by our U.S.A. operations, we could elect to repatriate earnings from our non-U.S.A. subsidiaries, seek additional borrowing capacity or seek to raise additional capital in the U.S.A. These alternatives could result in higher effective income tax rates, additional interest expense or other dilution of our earnings.
We believe that a combination of our existing cash and cash equivalents, funds available under the revolving credit facility, and an expected continuation of cash flow from operations, will continue to be adequate to fund our operations and working capital, capital expenditures, required payments on indebtedness, costs of realignment expenses and declared dividend payments.
Cash Flow
Cash Flows from Operating Activities
Our primary source of funds has historically been cash provided by operating activities. Cash flow from operating activities totaled $6.4 million, $9.7 million and $3.6 million in 2015, 2014 and 2013, respectively. The decrease in 2015 was driven by a reduction in cash provided by accounts receivable of $615,000, which is at a lesser rate than 2014, with a decrease of $3.3 million in 2015 revenue compared to 2014 along with a decrease in accounts payable of $1.3 million and overall operating income. The increase in 2014 was primarily due to the decrease in accounts receivable from 2013, partially offset by increases in inventories. Working capital requirements typically will increase or decrease with changes in the level of revenue. In addition, the timing of certain accrued payments will affect cash flow from reporting period to reporting period. Income tax payments and any employee incentive payments affect the timing of our operating cash flow as they are accrued throughout the year but paid on a quarterly, semi-annual or annual basis.
Cash Flows from Investing Activities
Cash flows used in investing activities totaled $1.7 million in 2015 as compared to $1.5 million in 2014 and $3.2 million provided by in 2013, respectively. The primary uses of cash for investing activities in 2015 were for purchase of property, plant and equipment of $1.6 million and cash paid for intangible assets of $218,000. These uses were partially offset by proceeds from the sale of property, plant and equipment and cash surrender value of line insurance in the amount of $56,000 and $96,000 respectively. The primary uses of cash for investing activities in 2014 were for purchase of property, plant and equipment of $1.3 million and cash paid for intangible assets of $540,000. These uses were partially offset by proceeds from the sale of marketable securities and property, plant and equipment in the amount of $205,000 and $154,000 respectively. The primary reasons for cash provided in 2013 were the net proceeds from maturities of marketable securities of $5.5 million, partially offset by purchase of property, plant and equipment of $1.5 million and cash paid for intangible assets of $951,000. We do not believe that any major property, plant and equipment expenditures are required to accommodate our current level of operations.
Cash Flows from Financing Activities
Cash used in financing activities totaled approximately $4.0 million in 2015, due primarily to the pay-down of term loans in the amount of $704,000, the net reduction of the line of credit totaling $1.1 million and dividends paid in the amount of $2.5 million. These uses were partially offset by the proceeds from the exercise of stock options in the amount of $315,000. Cash used in financing activities in 2014 was $5.4 million, due primarily to the pay-down of term loans in the amount of $2.7 million, the net reduction of the line of credit totaling $1.0 million, and dividend payments in the amount of $2.5 million. These uses were partially offset by the proceeds from the exercise of stock options in the amount of $702,000. Cash used in financing activities in 2013 was $5.2 million, due primarily to the pay-down of term loans in the amount of $2.5 million, the net reduction of the line of credit totaling $1.1 million, and dividend payments in the amount of $2.4 million.
Contractual Obligations
The following table summarizes our future contractual cash obligations as of December 31, 2015 (expressed in thousands):
|
Payments Due By Period |
||||||||||||||||||||
|
Total |
Less than 1 year |
1-3 years |
4-5 years |
After 5 years |
||||||||||||||||
|
Line of credit |
$ | 2,793 | $ | - | $ | 2,793 | $ | - | $ | - | ||||||||||
|
Operating and capital leases |
6,034 | 1,037 | 1,480 | 1,064 | 2,453 | |||||||||||||||
|
Purchase obligations |
6,730 | 6,730 | - | - | - | |||||||||||||||
|
Realignment Accrual |
620 | 620 | - | - | - | |||||||||||||||
|
Total contractual cash obligations |
$ | 16,177 | $ | 8,387 | $ | 4,273 | $ | 1,064 | $ | 2,453 | ||||||||||
We lease space in Minneapolis, Minnesota which services as our headquarters and operations center. The lease commenced on June 1, 2011 and is for a 15 year term. The required future minimum lease payments, starting at $367,000 per year and subject to annual increases, have been included in the above table.
Dansensor has operating lease agreements for company automobiles as well as the buildings occupied by each subsidiary location in Germany, Spain, Italy, France, and Denmark. The required minimum lease payments range from the low thousands of dollars up to $0.5 million per year and are included in the table above. The leases have various maturity dates through December 2021.
We have a secured line of credit with availability up to a maximum of $10.0 million that expires August 26, 2018 of which $2.8 million was outstanding at December 31, 2015. On August 26, 2015, we entered into the fourth amendment to the Credit Agreement which increased the available principal on the line to $10.0 million and extended the maturity date. In addition, Dansensor has a DKK 10 million (approximately $1.5 million) available line of credit of which no amount was outstanding as of December 31, 2015. The outstanding line of credit amount is included in the above table.
We have entered into a capital lease agreement on August 27, 2015 for a new phone system. The lease term is 3 years with an imputed interest rate of 1.70 percent per annum. The present value of the minimum lease payments was $162,000 at inception.
In relation to our accrual for uncertain tax positions, we have approximately $201,000 and $357,000 accrued at December 31, 2015 and 2014, respectively. The timing of any payments which could result from these unrecognized tax benefits will depend on a number of factors. Accordingly, we cannot make reasonably reliable estimates of the period of potential cash settlement, if any, with taxing authorities. Due to the uncertainty regarding the timing of these liabilities, we have excluded these amounts from the contractual obligations table.
We have a severance agreement with four of our executive officers and two divisional officers which provides for the payment to the officer of a lump sum amount upon the occurrence of certain termination events. The payment could amount to one or two times the officer’s current annual salary depending on the reason for termination. In connection with our Realignment Plan, we expect to make separation benefit payments of approximately $620,000 in 2016. These amounts are included in the contractual obligations table, and are accrued at December 31, 2015.
Off-Balance Sheet Arrangements
We do not have any off-balance sheet arrangements, as defined by the rules and regulations of the SEC, that have or are reasonably likely to have a material effect on our financial condition, changes in financial condition, revenues or expenses, results of operations, liquidity, capital expenditures or capital resources. As a result, we are not materially exposed to any financing, liquidity, market or credit risk that could arise if we had engaged in these arrangements.
Recently Issued Accounting Guidance
Revenue from Contracts with Customers
In May 2014, the Financial Accounting Standards Board issued new accounting requirements for the recognition of revenue from contracts with customers. The requirements of the new standard are effective for annual reporting periods beginning after December 15, 2017, and interim periods within those annual periods. We are currently evaluating the impact of this guidance on our results of operations and financial position.
Inventory – Simplifying the Measurement of Inventory
In July 2015, the Financial Accounting Standards Board issued new accounting guidance in an effort to simplify the measurement of inventory. The requirements of the new standard are effective for annual reporting periods beginning after December 15, 2016, and interim periods within those annual periods. We are currently evaluating the impact of this guidance on our results of operations and financial position.
Deferred Taxes
In November 2015, the Financial Accounting Standards Board (“FASB”) issued ASU No. 2015-17, Income Taxes (Topic 740): Balance Sheet Classification of Deferred Taxes, which amends the guidance requiring companies to simplify the classification of deferred income tax liabilities and assets into current and non-current amounts in a classified statement of financial position. This accounting guidance simplifies the presentation of deferred income taxes, such that deferred tax liabilities and assets be classified as non-current in a classified statement of financial position. This accounting guidance is effective for us beginning in the first quarter of 2017, but we have elected to adopt this guidance prospectively as of December 31, 2015. As a result, we have classified all deferred tax liabilities and assets as non-current in the Consolidated Balance Sheet at December 31, 2015.
Leases
In February 2016, the FASB issued ASU 2016-02, Leases. ASU 2016-02 requires that lease arrangements longer than 12 months result in an entity recognizing an asset and liability. The new guidance is effective for interim and annual periods beginning after December 15, 2018. Early adoption of the update is permitted. We are currently evaluating the impact of this guidance on our results of operations and financial position.
|
ITEM 7.A |
Quantitative and Qualitative disclosures about market risk |
Interest Rate Risk
Our principal financial market risks are sensitivities to interest rates and foreign currency exchange rates. Our market risk on interest rates relates primarily to LIBOR-based short-term debt from commercial banks and interest-bearing cash equivalents and short-term investments which are generally instruments with maturities of three months or less. Based on our average debt balances during 2015, a 100 basis point change in interest rates would potentially increase or decrease interest expense, net of offsetting impacts in interest income, by approximately $41,000.
Foreign Currency Exchange Risk
Today, nearly 66 percent of our consolidated revenue is generated from international customers. In our U.S. operations, we invoice most of these customers in U.S. dollars, so we do not have significant exposure to foreign currency transaction risk for revenue transacted by the U.S. operation. In our European based operations, we have some exposure to foreign currency fluctuations as we invoice our customers primarily in euros and Danish krone. The revenue impact due to foreign currency fluctuations has been material at $5.3 million during 2015. In addition, we have some exposure due to foreign exchange pricing impacts on instruments made in the U.S.A. and sold in foreign currencies by non-U.S. operations. However, because we also pay a number of our employees, international suppliers and service providers in their local foreign currency, the negative impact to revenue due to the strong U.S. dollar is naturally hedged resulting in minimal impact to our operating income. However, the net transactional gains or losses resulting from the revenue and expense transactions denominated in foreign currencies have not been material in the past.
We experienced a net $209,000 foreign currency transactional gain during the year ended December 31, 2015 primarily due to the weakening of European currencies. Our balance sheet related translation income (loss) is recorded in accumulated other comprehensive income (loss) on the consolidated balance sheets.
Our investments in foreign subsidiaries translated into U.S. dollars are not hedged. Any changes in foreign currency exchange rates are reflected as a foreign currency translation adjustment, a component of accumulated other comprehensive income (loss) in shareholders’ equity, and would not impact our net income.
|
ITEM 8. |
FINANCIAL STATEMENTS AND SUPPLEMENTARY DATA |
Our consolidated financial statements and Report of Independent Registered Public Accounting Firms are included beginning on page F-1 of this Annual Report on Form 10-K and are incorporated herein by reference.
SELECTED QUARTERLY FINANCIAL DATA (UNAUDITED)
(in thousands, except per share data)
| Quarter | ||||||||||||||||
|
1st |
2nd |
3rd |
4th |
|||||||||||||
|
2015: |
||||||||||||||||
|
Revenue |
$ | 15,360 | $ | 15,049 | $ | 15,492 | $ | 15,323 | ||||||||
|
Gross profit |
8,479 | 8,025 | 8,318 | 8,402 | ||||||||||||
|
Net income |
908 | 646 | 1,152 | 266 | ||||||||||||
|
Net income per common share: |
||||||||||||||||
|
Basic |
$ | 0.16 | $ | 0.11 | $ | 0.20 | $ | 0.05 | ||||||||
|
Diluted |
0.16 | 0.11 | 0.20 | 0.05 | ||||||||||||
|
2014: |
||||||||||||||||
|
Revenue |
$ | 15,313 | $ | 15,574 | $ | 16,650 | $ | 16,938 | ||||||||
|
Gross profit |
8,389 | 8,722 | 9,562 | 9,441 | ||||||||||||
|
Net income (loss) |
730 | 1,165 | 1,674 | (2,033 | ) | |||||||||||
|
Net income (loss) per common share: |
||||||||||||||||
|
Basic |
$ | 0.13 | $ | 0.21 | $ | 0.30 | $ | (0.36 | ) | |||||||
|
Diluted |
0.13 | 0.20 | 0.29 | (0.36 | ) | |||||||||||
|
Note: |
The sum of the quarterly amounts above may not agree with annual amounts due to rounding. |
|
ITEM 9. |
CHANGES IN AND DISAGREEMENTS WITH ACCOUNTANTS ON ACCOUNTING AND FINANCIAL DISCLOSURE |
|
a) |
Dismissal of Independent Registered Public Accounting Firm |
On July 13, 2015, the Audit Committee of the Board of Directors of MOCON, Inc. (the “Audit Committee” and the “Company,” respectively) notified KPMG LLP (“KPMG”) that KPMG had been dismissed as the Company’s independent registered public accounting firm, effective immediately. The dismissal of KPMG was approved by the Audit Committee.
The audit reports of KPMG on the Company’s consolidated financial statements for the years ended December 31, 2014 and 2013 did not contain an adverse opinion or a disclaimer of opinion and were not qualified or modified as to uncertainty, audit scope or accounting principles.
During the fiscal years ended December 31, 2014 and 2013 and the subsequent interim periods through July 13, 2015, there were no disagreements (within the meaning of Item 304(a)(1)(iv) of Regulation S-K) between the Company and KPMG on any matter of accounting principles or practices, financial statement disclosure or auditing scope or procedures, which disagreements, if not resolved to the satisfaction of KPMG, would have caused KPMG to make reference to the matter in their report on the Company’s consolidated financial statements.
During the fiscal years ended December 31, 2014 and 2013 and the subsequent interim periods through July 13, 2015, there were no “reportable events” (as defined in Item 304(a)(1)(v) of Regulation S-K), except that for the Company’s fiscal year ended December 31, 2013 and the quarters ended March 31, 2014, June 30, 2014 and September 30, 2014, the Company’s internal control over financial reporting was not effective due to the existence of a material weakness in the Company’s internal control over financial reporting. As disclosed in the Company’s Annual Report on Form 10-K and Quarterly Reports on Form 10-Q for the above referenced periods:
The Company did not design process level management review controls that operated at a sufficient level of precision, and did not maintain appropriate controls over reviewing development and change management processes for our general information technology control environment, relating to the recognition and measurement of sales, inventories and income taxes.
KPMG discussed this above matter with the Audit Committee.
The Company previously provided KPMG with a copy of the disclosure it is making herein in response to Item 304(a) of Regulation S-K and requested that KPMG furnish the Company with a copy of its letter addressed to the Securities and Exchange Commission (the “SEC”), pursuant to Item 304(a)(3) of Regulation S-K, stating whether or not KPMG agrees with the statements related to them made by the Company in this report. A copy of KPMG’s letter to the SEC dated July 13, 2015 is attached as Exhibit 16.1 to this report.
|
b) |
Engagement of Independent Registered Public Accounting Firm |
In July 13, 2015 the Audit Committee approved the appointment of RSM US LLP (“RSM”) as the Company’s independent registered public accounting firm, effective immediately. During the fiscal years ended December 31, 2014 and 2013 and any subsequent interim period through July 13, 2015, neither the Company, nor anyone on its behalf, consulted RSM regarding either (i) the application of accounting principles to a specified transaction, either completed or proposed, or the type of audit opinion that might be rendered on the Company’s consolidated financial statements, or (ii) any matter that was either the subject of disagreement (as defined in Item 304(a)(1)(iv) of Regulation S-K and related instructions) or a “reportable event” (as defined in Item 304(a)(1)(v) of Regulation S-K)
|
ITEM 9A. |
CONTROLS AND PROCEDURES |
|
(a) |
Evaluation of Disclosure Controls and Procedures |
Based on an evaluation under the supervision and with the participation of our management, including our Chief Executive Officer and Chief Financial Officer, our Chief Executive Officer and Chief Financial Officer have concluded that our disclosure controls and procedures as defined in Rules 13a-15(e) and 15d-15(e) under the Exchange Act were effective as of the end of the period covered by this Annual Report on Form 10-K to ensure that information required to be disclosed by us in reports that we file or submit under the Exchange Act is (i) recorded, processed, summarized and reported within the time periods specified in the SEC’s rules and forms and (ii) accumulated and communicated to our management, including our Chief Executive Officer and Chief Financial Officer, as appropriate to allow timely decisions regarding required disclosure.
|
(b) |
Management’s Report on Internal Control over Financial Reporting |
Our management is responsible for establishing and maintaining adequate internal control over financial reporting, as defined in Exchange Act Rules 13a-15(f) and 15d-15(f). Our internal control system is designed to provide reasonable assurance to our management, Board of Directors and shareholders regarding the reliability of financial reporting and the preparation and fair presentation of our consolidated financial statements for external reporting purposes.
It should be noted that any system of controls, however well designed and operated, can provide only reasonable, and not absolute, assurance that the objectives of the system will be met. In designing and operating a control system, one must consider the potential benefits of controls relative to their costs and the reality of limited resources available to allocate to control activities, particularly in smaller companies. In addition, the design of any control system is based in part upon certain assumptions about the likelihood of future events and there can be no assurance that any control will meet its objectives under all potential future conditions. Because of such inherent limitations in any control system, there can be no absolute assurance that control issues, misstatements, and/or fraud will be prevented or detected.
Under the supervision and with the participation of our Chief Executive Officer and Chief Financial Officer, our management conducted an evaluation of the effectiveness of our internal control over financial reporting as of December 31, 2015 based on the framework in Internal Control — Integrated Framework (2013) issued by the Committee of Sponsoring Organizations of the Treadway Commission (COSO). Based on that evaluation, our management concluded that our internal control over financial reporting was effective as of December 31, 2015. In May of 2013, COSO adopted an updated framework, which we adopted in 2015.
RSM US LLP, an independent registered public accounting firm, has issued an auditors’ report on management’s assessment of our internal control over financial reporting as of December 31, 2015, which is included elsewhere in this Form 10-K.
|
(c) |
Inherent Limitations of Disclosure Controls and Procedures and Internal Control over Financial Reporting |
Because of its inherent limitations, internal control over financial reporting may not prevent or detect misstatements. Projections of any evaluation of effectiveness to future periods are subject to the risk that controls may become inadequate because of changes in conditions, or that the degree of compliance with the policies may deteriorate.
|
(d) |
Changes in Internal Control over Financial Reporting |
There were no changes in internal control over financial reporting that occurred during the quarter ended December 31, 2015 that have materially affected, or are reasonably likely to materially affect, our internal control over financial reporting.
|
ITEM 9B. |
OTHER INFORMATION |
None.
PART III
|
Item 10. |
DIRECTORS AND EXECUTIVE OFFICERS AND CORPORATE GOVERNANCE |
The information required under Item 10 of this Annual Report on Form 10-K is to be contained under the headings “Proposal One – Election of Directors — Information About Board Nominees,” “Proposal One – Election of Directors — Additional Information About Board Nominees,” “Corporate Governance — Information About our Board and its Committees” and “Section 16(a) Beneficial Ownership Reporting Compliance” in our definitive proxy statement to be filed with the SEC with respect to our next annual meeting of shareholders, which involves the election of directors and is incorporated herein by reference, or, if such proxy statement is not filed with the SEC within 120 days after the end of the fiscal year covered by this report, such information will be filed as part of an amendment to this report not later than the end of the 120-day period.
The information concerning our executive officers is included in this Annual Report under Item 1, “Executive Officers” and is incorporated herein by reference.
During the fourth quarter 2015, we made no material changes to the procedures by which shareholders may recommend nominees to the board of directors, as described in our most recent proxy statement.
Our Code of Ethics applies to all of our officers, directors and employees, including our principal executive officer and principal financial officer, and meets the requirements of the rules and regulations of the Securities and Exchange Commission. We will disclose any amendments to, and any waivers from a provision of, our Code of Ethics on a Form 8-K filed with the Securities and Exchange Commission. We make available, free of charge and through our website, to any shareholder who requests, the charters of our board committees and our Code of Ethics. Our website is www.mocon.com.
To request a copy of the charters of our board committees or our Code of Ethics, write to us at:
MOCON, Inc.
7500 Mendelssohn Avenue North
Minneapolis, Minnesota 55428
Attention: Chief Financial Officer
|
Item 11. |
EXECUTIVE COMPENSATION |
The information required under Item 11 of this Annual Report on Form 10-K is to be contained under the headings “Director Compensation,” “Executive Compensation,” “Compensation Committee Interlocks and Insider Participation” and “Compensation Committee Report” in our definitive proxy statement to be filed with the SEC with respect to our next annual meeting of shareholders, which involves the election of directors and is incorporated herein by reference, or, if such proxy statement is not filed with the SEC within 120 days after the end of the fiscal year covered by this report, such information will be filed as part of an amendment to this report not later than the end of the 120-day period.
|
ITem 12. |
SECURITY OWNERSHIP OF CERTAIN BENEFICIAL OWNERS AND MANAGEMENT AND RELATED shareHOLDER MATTERS |
The information required under Item 12 of this Annual Report on Form 10-K is to be contained under the headings “Principal Shareholders and Beneficial Ownership of Management” in our definitive proxy statement to be filed with the SEC with respect to our next annual meeting of shareholders, which involves the election of directors and is incorporated herein by reference, or, if such proxy statement is not filed with the SEC within 120 days after the end of the fiscal year covered by this report, such information will be filed as part of an amendment to this report not later than the end of the 120-day period.
The following table summarizes outstanding options under our equity compensation plans as of December 31, 2015. Our only equity compensation plans as of December 31, 2015 were the MOCON, Inc. 2015 Equity Incentive Plan, MOCON, Inc. 2006 Stock Incentive Plan, as amended, the MOCON, Inc. 1998 Stock Option Plan and the 2015 Employee Stock Purchase Plan. The MOCON, Inc. 2006 Stock Incentive Plan and MOCON, Inc. 1998 Stock Option Plan have terminated with respect to future grants. Options and other stock incentive awards to be granted in the future under the MOCON, Inc. 2015 Equity Incentive Plan are within the discretion of our Board of Directors and the Compensation Committee of our Board of Directors and therefore cannot be ascertained at this time.
|
Plan Category |
Number of Securities to be Issued upon Exercise of Outstanding Options, Warrants and Rights |
Weighted Average Exercise Price of Outstanding Options, Warrants and Rights |
Number of Securities Remaining Available for Future Issuance Under Equity Compensation Plans (Excluding Securities Reflected in First Column) |
|||||||||
|
Equity compensation plans approved by security holders |
797,378 | $ | 14.91 | 410,989 | ||||||||
|
Equity compensation plans not approved by security holders |
— | — | — | |||||||||
|
Total |
797,378 | 410,989 | ||||||||||
|
Item 13. |
CERTAIN RELATIONSHIPS AND RELATED TRANSACTIONS AND DIRECTOR INDEPENDENCE |
The information required under Item 13 of this Annual Report on Form 10-K is to be contained under the heading “Related Party Relationships and Transactions” and “Corporate Governance – Director Independence” in our definitive proxy statement to be filed with the SEC with respect to our next annual meeting of shareholders, which involves the election of directors and is incorporated herein by reference, or, if such proxy statement is not filed with the SEC within 120 days after the end of the fiscal year covered by this report, such information will be filed as part of an amendment to this report not later than the end of the 120-day period.
|
Item 14. |
PRINCIPAL ACCOUNTANT FEES AND SERVICES |
The information required under Item 14 of this Annual Report on Form 10-K is to be contained under the headings “Proposal Five – Ratification of Selection of Independent Registered Public Accounting Firm” in our definitive proxy statement to be filed with the SEC with respect to our next annual meeting of shareholders, which involves the election of directors and is incorporated herein by reference, or, if such proxy statement is not filed with the SEC within 120 days after the end of the fiscal year covered by this report, such information will be filed as part of an amendment to this report not later than the end of the 120-day period.
PART IV
|
Item 15. |
EXHIBITS AND FINANCIAL STATEMENT SCHEDULES |
(a) 1. Financial Statements
The following consolidated financial statements of MOCON, Inc. and its subsidiaries are included herein:
| Page | |
|
Report of Independent Registered Public Accounting Firms |
F-1 |
|
Consolidated Balance Sheets as of December 31, 2015 and 2014 |
F-4 |
|
Consolidated Statements of Income for the years ended December 31, 2015, 2014 and 2013 |
F-5 |
|
Consolidated Statements of Comprehensive Income (Loss) for the years ended December 31, 2015, 2014 and 2013 |
F-6 |
|
Consolidated Statements of Shareholders’ Equity for the years ended December 31, 2015, 2014 and 2013 |
F-7 |
|
Consolidated Statements of Cash Flows for the years ended December 31, 2015, 2014 and 2013 |
F-8 |
|
Notes to Consolidated Financial Statements |
F-9 |
2. Financial Statement Schedule
The following financial statement schedule is included herein and should be read in conjunction with the consolidated financial statements referred to above:
| Schedule II: Valuation and Qualifying Accounts | S-1 |
3. Exhibits
The exhibits to this Annual Report on Form 10-K are listed in the Exhibit Index.
|
A. |
MOCON, Inc. 1998 Stock Option Plan, as amended, (incorporated by reference to our Definitive Proxy Statement on Form DEF-14A filed on April 9, 2002 (File No. 000-09273)). |
|
B. |
MOCON, Inc. 2006 Stock Incentive Plan, as amended and restated (incorporated by reference to Exhibit 10.1 to our Current Report on Form 8-K filed on June 1, 2011 (File No. 000-09273)). |
|
C. |
Form of Incentive Stock Option Agreement between MOCON, Inc. and its Executive Officers under the MOCON, Inc. 2006 Stock Incentive Plan (incorporated by reference to Exhibit 10.2 to our Current Report on Form 8-K filed on May 23, 2006 (File No. 000-09273)). |
|
D. |
Form of Non-Statutory Stock Option Agreement between MOCON, Inc. and its Non-Employee Directors and Executive Officers under the MOCON, Inc. 2006 Stock Incentive Plan (incorporated by reference to Exhibit 10.3 to our Current Report on Form 8-K filed on May 23, 2006 (File No. 000-09273)). |
|
E. |
MOCON, Inc. 2015 Equity Incentive Plan, as amended and restated (incorporated by reference to Exhibit 5.1 to Form S-8 filed on August 7, 2015 (File No. 333-206212)). |
|
F. |
MOCON, Inc. 2015 Stock Purchase Plan (incorporated by reference to Exhibit 5.1 to Form S-8 filed on August 7, 2015 (File No. 333-206211)). |
|
G. |
Form of Executive Severance Agreement (incorporated by reference to Exhibit 10.11 to our Annual Report on Form 10-K for the fiscal year ended December 31, 2007 (File No. 000-09273)). |
|
H. |
MOCON, Inc. Incentive Pay Plan (incorporated by reference to Exhibit 10.1 to our Current Report on Form 8-K filed on December 29, 2014 (File No. 000-09273)). |
|
I. |
Description of Non-Employee Director Retirement Plan (incorporated by reference to Exhibit 10.20 to our Annual Report on Form 10-K for the fiscal year ended December 31, 2004 (File No. 000-09273)). |
|
J. |
Description of Non-Employee Director Compensation Arrangements (filed herewith). |
|
K. |
Description of Executive Officer Compensation Arrangements (filed herewith). |
| L. |
Amendment to Executive Severance Agreement (filed herewith). |
|
(b) |
Exhibits |
The exhibits to this Annual Report on Form 10-K are listed in the Exhibit Index.
|
(c) |
Financial Statement Schedule |
See Item 15(a)(2) above for the financial statement schedule filed herewith.
SIGNATURES
Pursuant to the requirements of Section 13 or 15(d) of the Securities Exchange Act of 1934, the Registrant has duly caused this report to be signed on its behalf by the undersigned, thereunto duly authorized.
|
Date: March 4, 2016 |
MOCON, Inc. |
|
By:/s/ Robert L. Demorest____________ Robert L. Demorest, Chairman of the Board, President and Chief Executive Officer (principal executive officer) | |
|
By:/s/ Elissa Lindsoe________________ Elissa Lindsoe, Chief Financial Officer, (principal financial and accounting officer) | |
Pursuant to the requirements of the Securities Exchange Act of 1934, this report has been signed below by the following persons on behalf of the Registrant and in the capacities indicated and on March 4, 2016.
|
Signature and Title |
|
|
|
/s/ Robert L. Demorest |
|
Robert L. Demorest, Chairman of the Board, President and Chief Executive Officer |
|
|
|
/s/ Donald N. DeMorett |
|
Donald N. DeMorett, Director |
|
/s/ Robert F. Gallagher |
|
Robert F. Gallagher, Director |
|
/s/ Bradley D. Goskowicz |
|
Bradley D. Goskowicz, Director |
|
/s/ Kathleen Iverson |
|
Kathleen Iverson, Director |
|
/s/ Daniel W. Mayer |
|
Daniel W. Mayer, Director |
|
/s/ Tom C. Thomas |
|
Tom C. Thomas, Director |
|
/s/ David J. Ward |
|
David J. Ward, Director |
|
/s/ Paul R. Zeller |
|
Paul R. Zeller, Director |
MOCON, INC. AND SUBSIDIARIES
Consolidated Financial Statements
December 31, 2015, 2014 and 2013
Table of Contents
| Page | |
|
Report of Independent Registered Public Accounting Firms |
F-1 |
|
Consolidated Balance Sheets |
F-4 |
|
Consolidated Statements of Income |
F-5 |
| Consolidated Statements of Comprehensive Income (Loss) | F-6 |
|
Consolidated Statements of Shareholders’ Equity |
F-7 |
|
Consolidated Statements of Cash Flows |
F-8 |
|
Notes to Consolidated Financial Statements |
F-9 |
Report of Independent Registered Public Accounting Firm
The Board of Directors and Shareholders
MOCON, Inc.:
We have audited MOCON, Inc. and subsidiaries’ internal control over financial reporting as of December 31, 2015, based on criteria established in Internal Control — Integrated Framework (2013) issued by the Committee of Sponsoring Organizations of the Treadway Commission. MOCON, Inc. and subsidiaries’ management is responsible for maintaining effective internal control over financial reporting and for its assessment of the effectiveness of internal control over financial reporting included in the accompanying Management's Report on Internal Control over Financial Reporting. Our responsibility is to express an opinion on the company's internal control over financial reporting based on our audit.
We conducted our audit in accordance with the standards of the Public Company Accounting Oversight Board (United States). Those standards require that we plan and perform the audit to obtain reasonable assurance about whether effective internal control over financial reporting was maintained in all material respects. Our audit included obtaining an understanding of internal control over financial reporting, assessing the risk that a material weakness exists, and testing and evaluating the design and operating effectiveness of internal control based on the assessed risk. Our audit also included performing such other procedures as we considered necessary in the circumstances. We believe that our audit provides a reasonable basis for our opinion.
A company's internal control over financial reporting is a process designed to provide reasonable assurance regarding the reliability of financial reporting and the preparation of financial statements for external purposes in accordance with generally accepted accounting principles. A company's internal control over financial reporting includes those policies and procedures that (a) pertain to the maintenance of records that, in reasonable detail, accurately and fairly reflect the transactions and dispositions of the assets of the company; (b) provide reasonable assurance that transactions are recorded as necessary to permit preparation of financial statements in accordance with generally accepted accounting principles, and that receipts and expenditures of the company are being made only in accordance with authorizations of management and directors of the company; and (c) provide reasonable assurance regarding prevention or timely detection of unauthorized acquisition, use, or disposition of the company's assets that could have a material effect on the financial statements.
Because of its inherent limitations, internal control over financial reporting may not prevent or detect misstatements. Also, projections of any evaluation of effectiveness to future periods are subject to the risk that controls may become inadequate because of changes in conditions, or that the degree of compliance with the policies or procedures may deteriorate.
In our opinion, MOCON, Inc. and subsidiaries maintained, in all material respects, effective internal control over financial reporting as of December 31, 2015, based on criteria established in Internal Control — Integrated Framework (2013) issued by the Committee of Sponsoring Organizations of the Treadway Commission.
We have also audited, in accordance with the standards of the Public Company Accounting Oversight Board (United States), the consolidated financial statements of MOCON, Inc. and subsidiaries as of and for the year ended December 31, 2015, and our report dated March 4, 2016 expressed an unqualified opinion.
/s/ RSM US LLP
Minneapolis, Minnesota
March 4, 2016
Report of Independent Registered Public Accounting Firm
The Board of Directors and Shareholders
MOCON, Inc.:
We have audited the accompanying consolidated balance sheet of MOCON, Inc. and subsidiaries as of December 31, 2015, and the related consolidated statements of income, comprehensive income (loss), shareholders' equity, and cash flows for the year then ended. Our audit also included the financial statement schedule II. These financial statements and financial statement schedule are the responsibility of the Company's management. Our responsibility is to express an opinion on these financial statements and schedule based on our audit.
We conducted our audit in accordance with the standards of the Public Company Accounting Oversight Board (United States). Those standards require that we plan and perform the audit to obtain reasonable assurance about whether the financial statements are free of material misstatement. An audit includes examining, on a test basis, evidence supporting the amounts and disclosures in the financial statements. An audit also includes assessing the accounting principles used and significant estimates made by management, as well as evaluating the overall financial statement presentation. We believe that our audit provides a reasonable basis for our opinion.
In our opinion, the consolidated financial statements referred to above present fairly, in all material respects, the financial position of MOCON, Inc. and subsidiaries as of December 31, 2015, and the results of their operations and their cash flows for the year then ended, in conformity with U.S. generally accepted accounting principles. Also, in our opinion, the related financial statement schedule, when considered in relation to the basic consolidated financial statements taken as a whole, presents fairly in all material respects the information set forth therein.
We have also audited, in accordance with the standards of the Public Company Accounting Oversight Board (United States), MOCON, Inc.’s and subsidiaries’ internal control over financial reporting as of December 31, 2015, based on criteria established in Internal Control — Integrated Framework (2013) issued by the Committee of Sponsoring Organizations of the Treadway Commission, and our report dated March 4, 2016 expressed an unqualified opinion on the effectiveness of MOCON, Inc. and subsidiaries’ internal control over financial reporting.
/s/ RSM US LLP
Minneapolis, Minnesota
March 4, 2016
Report of Independent Registered Public Accounting Firm
The Board of Directors and shareholders
MOCON, Inc.:
We have audited the accompanying consolidated balance sheet of MOCON, Inc. and subsidiaries as of December 31, 2014, and the related consolidated statements of income, comprehensive income (loss), shareholders’ equity, and cash flows for each of the years in the two-year period ended December 31, 2014. In connection with our audits of the consolidated financial statements, we also have audited financial statement schedule II. These consolidated financial statements and financial statement schedule are the responsibility of the Company’s management. Our responsibility is to express an opinion on these consolidated financial statements and financial statement schedule based on our audits.
We conducted our audits in accordance with the standards of the Public Company Accounting Oversight Board (United States). Those standards require that we plan and perform the audit to obtain reasonable assurance about whether the financial statements are free of material misstatement. An audit includes examining, on a test basis, evidence supporting the amounts and disclosures in the financial statements. An audit also includes assessing the accounting principles used and significant estimates made by management, as well as evaluating the overall financial statement presentation. We believe that our audits provide a reasonable basis for our opinion.
In our opinion, the consolidated financial statements referred to above present fairly, in all material respects, the financial position of MOCON, Inc. and subsidiaries as of December 31, 2014, and the results of their operations and their cash flows for each of the years in the two-year period ended December 31, 2014, in conformity with U.S. generally accepted accounting principles. Also in our opinion, the related financial statement schedule, when considered in relation to the basic consolidated financial statements taken as a whole, presents fairly, in all material respects, the information set forth therein.
/s/ KPMG LLP
Minneapolis, Minnesota
March 4, 2016
MOCON, INC. AND SUBSIDIARIES
Consolidated Balance Sheets
December 31, 2015 and 2014
(expressed in thousands, except share amounts)
|
|
2015 |
2014 |
||||||
| Assets | ||||||||
|
Current assets: |
||||||||
|
Cash and cash equivalents |
$ | 6,344 | $ | 6,332 | ||||
|
Trade accounts receivable, less allowance for doubtful accounts of $141 in 2015 and $181 in 2014 |
8,786 | 9,877 | ||||||
|
Other receivables |
326 | 148 | ||||||
|
Inventories |
7,790 | 8,705 | ||||||
|
Prepaid income taxes |
559 | 771 | ||||||
|
Prepaid expenses, other |
897 | 902 | ||||||
| Deferred income taxes | - | 766 | ||||||
|
Total current assets |
24,702 | 27,501 | ||||||
|
Property, plant, and equipment, net of accumulated depreciation of $8,154 in 2015 and $7,874 in 2014 |
5,995 | 5,562 | ||||||
|
Goodwill |
7,437 | 8,147 | ||||||
|
Intangible assets, net |
8,986 | 10,831 | ||||||
|
Other assets |
88 | 194 | ||||||
|
Deferred income taxes |
211 | 274 | ||||||
|
Total assets |
$ | 47,419 | $ | 52,509 | ||||
|
Liabilities and Shareholders’ Equity |
||||||||
|
Current liabilities: |
||||||||
|
Current maturities of long-term notes payable |
$ | 65 | $ | 983 | ||||
|
Line of credit |
- | 3,300 | ||||||
|
Accounts payable |
3,033 | 4,402 | ||||||
|
Accrued compensation and related expenses |
3,969 | 4,120 | ||||||
|
Other accrued expenses |
811 | 731 | ||||||
|
Accrued product warranties |
223 | 285 | ||||||
|
Dividends payable |
637 | 631 | ||||||
|
Deferred revenue |
862 | 997 | ||||||
|
Total current liabilities |
9,600 | 15,449 | ||||||
|
Line of credit |
2,793 | - | ||||||
|
Notes payable |
93 | 307 | ||||||
|
Obligations to former employees |
34 | 67 | ||||||
|
Deferred income taxes |
1,227 | 1,856 | ||||||
|
Accrued income taxes |
201 | 357 | ||||||
|
Total noncurrent liabilities |
4,348 | 2,587 | ||||||
|
Total liabilities |
13,948 | 18,036 | ||||||
|
Commitments and contingencies (Note 6) |
||||||||
|
Shareholders’ equity: |
||||||||
|
Capital stock – undesignated. Authorized 3,000,000 shares; none issued and outstanding in 2015 and 2014 |
- | - | ||||||
|
Common stock – $0.10 par value. Authorized 22,000,000 shares; issued and outstanding 5,792,126 shares in 2015 and 5,732,505 shares in 2014 |
579 | 573 | ||||||
|
Additional paid-in capital |
7,412 | 6,427 | ||||||
|
Retained earnings |
30,700 | 30,265 | ||||||
|
Accumulated other comprehensive loss |
(5,220 | ) | (2,792 | ) | ||||
|
Total shareholders’ equity |
33,471 | 34,473 | ||||||
|
Total liabilities and shareholders' equity |
$ | 47,419 | $ | 52,509 | ||||
See accompanying notes to consolidated financial statements.
MOCON, INC. AND SUBSIDIARIES
Consolidated Statements of Income
Years ended December 31, 2015, 2014 and 2013
(expressed in thousands, except per share amounts)
|
2015 |
2014 |
2013 |
||||||||||
|
Revenue: |
||||||||||||
|
Products |
$ | 48,302 | $ | 50,694 | $ | 44,848 | ||||||
|
Services |
9,956 | 10,658 | 9,126 | |||||||||
|
Consulting |
2,966 | 3,123 | 3,134 | |||||||||
|
Total revenue |
61,224 | 64,475 | 57,108 | |||||||||
|
Cost of revenue: |
||||||||||||
|
Products |
21,778 | 22,174 | 20,036 | |||||||||
|
Services |
4,205 | 4,188 | 3,936 | |||||||||
|
Consulting |
2,017 | 1,999 | 1,867 | |||||||||
|
Total cost of revenue |
28,000 | 28,361 | 25,839 | |||||||||
|
Gross profit |
33,224 | 36,114 | 31,269 | |||||||||
|
Selling, general and administrative expenses |
23,468 | 24,988 | 22,454 | |||||||||
|
Research and development expenses |
4,341 | 4,191 | 4,032 | |||||||||
|
Realignment expenses |
1,049 | — | — | |||||||||
|
Impairment of investment in affiliated company |
— | 3,171 | — | |||||||||
|
Operating income |
4,366 | 3,764 | 4,783 | |||||||||
|
Other income (expense), net |
93 | (306 | ) | (359 | ) | |||||||
|
Income before income taxes |
4,459 | 3,458 | 4,424 | |||||||||
|
Income taxes |
1,487 | 1,922 | 963 | |||||||||
|
Net income |
$ | 2,972 | $ | 1,536 | $ | 3,461 | ||||||
|
Net income per common share: |
||||||||||||
|
Basic |
$ | 0.52 | $ | 0.27 | $ | 0.62 | ||||||
|
Diluted |
$ | 0.51 | $ | 0.27 | $ | 0.61 | ||||||
|
Weighted average common shares outstanding: |
||||||||||||
|
Basic |
5,753 | 5,665 | 5,545 | |||||||||
|
Diluted |
5,818 | 5,754 | 5,640 | |||||||||
|
Dividends declared per common share |
$ | 0.44 | $ | 0.44 | $ | 0.44 | ||||||
See accompanying notes to consolidated financial statements.
MOCON, INC. AND SUBSIDIARIES
Consolidated Statements of Comprehensive Income (Loss)
Years ended December 31, 2015, 2014 and 2013
(expressed in thousands)
|
2015 |
2014 |
2013 |
||||||||||
|
Net income |
$ | 2,972 | $ | 1,536 | $ | 3,461 | ||||||
|
Other comprehensive income (loss): |
||||||||||||
|
Cumulative translation adjustment |
(2,429 | ) | (3,405 | ) | 1,240 | |||||||
|
Comprehensive income (loss) |
$ | 543 | $ | (1,869 | ) | $ | 4,701 | |||||
See accompanying notes to consolidated financial statements.
MOCON, INC. AND SUBSIDIARIES
Consolidated Statements of Shareholders’ Equity
Years ended December 31, 2015, 2014 and 2013
(expressed in thousands, except share amounts)
|
Accumulated |
||||||||||||||||||||||||
|
Common stock |
Additional |
other |
||||||||||||||||||||||
|
Number |
paid-in |
Retained |
comprehensive |
|||||||||||||||||||||
|
of shares |
Amount |
capital |
earnings |
income (loss) |
Total |
|||||||||||||||||||
|
Balance, January 1, 2013 |
5,517,966 | $ | 552 | $ | 3,739 | $ | 30,218 | $ | (627 | ) | $ | 33,882 | ||||||||||||
|
Stock options exercised, net of surrendered shares |
112,231 | 11 | 761 | — | — | 772 | ||||||||||||||||||
|
Dividends declared ($0.42 per share) |
— | — | — | (2,450 | ) | — | (2,450 | ) | ||||||||||||||||
|
Share-based compensation expense |
— | — | 512 | — | — | 512 | ||||||||||||||||||
|
Tax benefit on stock plans |
— | — | 52 | — | — | 52 | ||||||||||||||||||
|
Net income |
— | — | — | 3,461 | — | 3,461 | ||||||||||||||||||
|
Cumulative translation adjustment |
— | — | — | — | 1,240 | 1,240 | ||||||||||||||||||
|
Balance, December 31, 2013 |
5,630,197 | 563 | 5,064 | 31,229 | 613 | 37,469 | ||||||||||||||||||
|
Stock options exercised, net of surrendered shares |
102,308 | 10 | 692 | — | — | 702 | ||||||||||||||||||
|
Dividends declared ($0.44 per share) |
— | — | — | (2,500 | ) | — | (2,500 | ) | ||||||||||||||||
|
Share-based compensation expense |
— | — | 591 | — | — | 591 | ||||||||||||||||||
|
Tax benefit on stock plans |
— | — | 80 | — | — | 80 | ||||||||||||||||||
|
Net income |
— | — | — | 1,536 | — | 1,536 | ||||||||||||||||||
|
Cumulative translation adjustment |
— | — | — | — | (3,405 | ) | (3,405 | ) | ||||||||||||||||
|
Balance, December 31, 2014 |
5,732,505 | 573 | 6,427 | 30,265 | (2,792 | ) | 34,473 | |||||||||||||||||
|
Stock options exercised, net of surrendered shares |
59,621 | 6 | 309 | — | — | 315 | ||||||||||||||||||
|
Dividends declared ($0.44 per share) |
— | — | — | (2,536 | ) | — | (2,536 | ) | ||||||||||||||||
|
Share-based compensation expense |
— | — | 668 | — | — | 668 | ||||||||||||||||||
|
Tax benefit on stock plans |
— | — | 8 | — | — | 8 | ||||||||||||||||||
|
Net income |
— | — | — | 2,972 | — | 2,972 | ||||||||||||||||||
|
Cumulative translation adjustment |
— | — | — | — | (2,429 | ) | (2,429 | ) | ||||||||||||||||
|
Balance, December 31, 2015 |
5,792,126 | $ | 579 | $ | 7,412 | $ | 30,700 | $ | (5,220 | ) | $ | 33,471 | ||||||||||||
See accompanying notes to consolidated financial statements.
MOCON, INC. AND SUBSIDIARIES
Consolidated Statements of Cash Flows
Years ended December 31, 2015, 2014 and 2013
(expressed in thousands)
|
2015 |
2014 |
2013 |
||||||||||
|
Cash flows from operating activities: |
||||||||||||
|
Net income |
$ | 2,972 | $ | 1,536 | $ | 3,461 | ||||||
|
Adjustments to reconcile net income to net cash provided by operating activities: |
||||||||||||
|
Share-based compensation expense |
668 | 591 | 512 | |||||||||
|
Change in other receivable |
(3 | ) | 186 | 26 | ||||||||
|
Loss (gain) on disposition of long-term assets |
16 | 34 | (64 | ) | ||||||||
|
Depreciation and amortization |
2,460 | 2,555 | 2,433 | |||||||||
|
Impairment of investment in affiliated company |
- | 3,171 | - | |||||||||
|
Deferred income taxes |
457 | (147 | ) | (533 | ) | |||||||
|
Excess tax benefit from employee stock plans |
(8 | ) | (80 | ) | (52 | ) | ||||||
|
Changes in operating assets and liabilities: |
||||||||||||
|
Trade accounts receivable |
615 | 1,727 | (1,678 | ) | ||||||||
|
Other receivables |
(194 | ) | (68 | ) | 51 | |||||||
|
Inventories |
725 | (1,557 | ) | (1,007 | ) | |||||||
|
Prepaid income taxes |
162 | (279 | ) | (139 | ) | |||||||
|
Prepaid expenses |
61 | 296 | 11 | |||||||||
|
Accounts payable |
(1,349 | ) | 519 | 292 | ||||||||
|
Accrued compensation and related expenses |
71 | 625 | 166 | |||||||||
|
Other accrued expenses |
84 | (18 | ) | (100 | ) | |||||||
|
Accrued product warranties |
(49 | ) | (32 | ) | 88 | |||||||
|
Accrued income taxes |
(205 | ) | 211 | (15 | ) | |||||||
|
Deferred revenue |
(111 | ) | 400 | 144 | ||||||||
|
Net cash provided by operating activities |
6,372 | 9,670 | 3,596 | |||||||||
|
Cash flows from investing activities: |
||||||||||||
|
Proceeds from maturities of marketable securities |
- | 205 | 5,501 | |||||||||
|
Purchases of property, plant and equipment |
(1,617 | ) | (1,349 | ) | (1,513 | ) | ||||||
|
Proceeds from sale of property and equipment |
56 | 154 | 161 | |||||||||
|
Cash paid for intangible assets |
(218 | ) | (540 | ) | (951 | ) | ||||||
|
Other |
96 | (3 | ) | (3 | ) | |||||||
|
Net cash (used in) provided by investing activities |
(1,683 | ) | (1,533 | ) | 3,195 | |||||||
|
Cash flows from financing activities: |
||||||||||||
|
Proceeds from the line of credit |
21,974 | 23,552 | 11,157 | |||||||||
|
Payments on the line of credit |
(23,065 | ) | (24,507 | ) | (12,233 | ) | ||||||
|
Payments on term notes payable and seller financed note payable |
(704 | ) | (2,709 | ) | (2,490 | ) | ||||||
|
Proceeds from the exercise of stock options |
315 | 702 | 772 | |||||||||
|
Excess tax benefit from employee stock plans |
8 | 80 | 52 | |||||||||
|
Dividends paid |
(2,530 | ) | (2,489 | ) | (2,409 | ) | ||||||
|
Net cash used in financing activities |
(4,002 | ) | (5,371 | ) | (5,151 | ) | ||||||
|
Effect of exchange rate changes on cash and cash equivalents |
(675 | ) | (567 | ) | 78 | |||||||
|
Net increase in cash and cash equivalents |
12 | 2,199 | 1,718 | |||||||||
|
Cash and cash equivalents: |
||||||||||||
|
Beginning of year |
6,332 | 4,133 | 2,415 | |||||||||
|
End of year |
$ | 6,344 | $ | 6,332 | $ | 4,133 | ||||||
|
Supplemental disclosures of cash flow information: |
||||||||||||
|
Cash paid during the year for income taxes |
$ | 1,256 | $ | 2,184 | $ | 1,629 | ||||||
|
Cash paid during the year for interest |
$ | 124 | $ | 206 | $ | 315 | ||||||
|
Supplemental schedule of noncash investing and financing activities: |
||||||||||||
|
Dividends accrued |
$ | 637 | $ | 631 | $ | 619 | ||||||
|
Purchases of prepaid expenses, fixed assets and intangibles in accounts payable |
$ | 109 | $ | 204 | $ | 620 | ||||||
|
Transfer of inventory to fixed assets |
$ | 130 | $ | 18 | $ | - | ||||||
|
Purchases of fixed assets in notes payable |
$ | 162 | $ | - | $ | - | ||||||
|
Transfer of notes payable balance to line of credit |
$ | 585 | $ | - | $ | - | ||||||
See accompanying notes to consolidated financial statements.
MOCON, INC. AND SUBSIDIARIES
Notes to Consolidated Financial Statements
December 31, 2015, 2014 and 2013
|
|
|
(1) |
Summary of Significant Accounting Policies |
MOCON Inc. and its subsidiaries develops, manufacturers and markets measurement, analytical, monitoring and consulting products for customers in the barrier packaging, food, pharmaceutical, consumer products, industrial hygiene, air quality monitoring, oil and gas exploration and other industries throughout the world.
We report our operating segments in accordance with Financial Accounting Standards Board (“FASB”) Accounting Standards Codification (“ASC”) 280, Segment Reporting. Our operating segments are Permeation Products and Services (“Permeation”), Package Testing Products and Services (“Package Testing”), and Industrial Analyzer Products and Services and Other (“Industrial Analyzers and Other”) for financial reporting purposes.
The following is a summary of the significant accounting policies used in the preparation of our consolidated financial statements.
|
(a) |
Principles of Consolidation |
The consolidated financial statements include our accounts and our wholly-owned subsidiaries. All material intercompany balances and transactions have been eliminated in consolidation.
|
(b) |
Foreign Currency Translation |
The financial statements for operations outside the United States are maintained in their local currencies. All assets and liabilities of our foreign subsidiaries are translated to United States dollars at period-end exchange rates, while revenue and expense accounts are translated at the average exchange rates during the period transactions occurred. Translation adjustments arising from the use of differing exchange rates are included in accumulated other comprehensive income (loss) in shareholders’ equity. Gains and losses on foreign currency transactions are included in other income (expense).
|
(c) |
Cash and Cash Equivalents |
We consider all highly liquid investments purchased with an original maturity of three months or less to be cash equivalents. Cash equivalents consist of short-term investments which are readily convertible to cash.
|
(d) |
Trade Accounts Receivable |
Credit is granted to customers in the normal course of business. Receivables are recorded at original carrying value, which approximates fair value, less reserves for estimated uncollectible amounts and sales returns. We evaluate our estimates and assumptions on an ongoing basis using historical experience and other factors that management believes to be reasonable under the circumstances, including the current economic environment. When facts and circumstances dictate, we may need to adjust our estimates and assumptions.
|
(e) |
Inventories |
Inventories are stated at the lower of cost or market. Cost is determined by the first-in, first-out (FIFO) method, and market represents the lower of replacement cost or estimated net realizable value. We record an estimate for excess and obsolete inventory which is based on historical usage and sales history.
MOCON, INC. AND SUBSIDIARIES
Notes to Consolidated Financial Statements
December 31, 2015, 2014 and 2013
|
(f) |
Property, Plant and Equipment |
Property, plant and equipment are carried at cost. Depreciation and amortization are typically computed using the straight-line method. When assets are retired or otherwise disposed of, the cost and related accumulated depreciation are removed from the accounts, and any resulting gain or loss is recognized in income for the period. The cost of maintenance and repairs is charged to income as incurred and significant renewals and betterments are capitalized. The present value of capital lease obligations are classified as long-term debt and the related assets are included in property, plant and equipment. Amortization of equipment under capital leases is included in depreciation expense.
|
(g) |
Goodwill and Other Intangible Assets |
As of December 31, 2015 and 2014, we have recorded approximately $7.4 million and $8.1 million of goodwill, respectively. We test goodwill at least annually for impairment. We completed our annual impairment test of goodwill and concluded that no impairment existed as of December 31, 2015 and 2014.
Intangible assets consist of developed technology, customer relationships, patents, trademarks and other intangibles. Developed technology, patents, trademarks and other intangibles are carried at cost less accumulated amortization. Costs incurred in connection with applications for new patents are deferred until a final determination, with respect to the application, is made by appropriate regulatory agencies. Costs of patents abandoned are charged to income in the period of abandonment. Developed technologies and customer relationships are amortized over 10 years. Patent costs and trademarks are amortized over the lesser of 17 years or their estimated useful lives using the straight-line method. Tradenames are amortized over the lesser of 20 years or their estimated useful lives using the straight-line method. Other intangibles are amortized over 3 to 5 years.
|
(h) |
Software Development Costs |
We capitalize certain software development costs related to software that is essential to the hardware within certain instruments we sell. Capitalized software development costs consist primarily of purchased materials and services. Software development costs are expensed as incurred until technological feasibility has been established, at which time future costs incurred are capitalized until the product is available for general release to the public. Based on our product development process, technological feasibility is generally established once product and detailed program designs have been completed, uncertainties related to high-risk development issues have been resolved through coding and testing, and we have established that the necessary skills, hardware, and software technology are available for production of the product. Once a software product is available for general release to the public, capitalized development costs associated with that product will begin to be amortized to cost of revenue over the product’s estimated economic life, using the greater of straight-line or a method that results in cost recognition in future periods that is consistent with the anticipated timing of product revenue recognition.
MOCON, INC. AND SUBSIDIARIES
Notes to Consolidated Financial Statements
December 31, 2015, 2014 and 2013
Our capitalized software development costs are included in intangible assets on the consolidated balance sheets and are subject to an ongoing assessment of recoverability, which is impacted by estimates and assumptions of future revenues and expenses for these software products, as well as other factors such as changes in product technologies. Any portion of unamortized capitalized software development costs that are determined to be in excess of net realizable value will be expensed in the period such a determination is made. As of December 31, 2015 and 2014 approximately $1.1 million of software development costs are being amortized over 7 to 10 years. Amortization expense was approximately $108,000, $46,000 and $0 for the years ended December 31, 2015, 2014 and 2013, respectively.
The Company capitalizes direct costs of materials and services used in the development and purchase of internal-use software. Amounts capitalized are amortized on a straight-line basis over a period of five years and are reported as a component of property, plant and equipment on the consolidated balance sheets. Depreciation expense was approximately $221,000, $213,000 and $172,000 for the years ended December 31, 2015, 2014 and 2013, respectively.
|
(i) |
Impairment of Long-Lived Assets and Long-Lived Assets to be Disposed of |
We review our long-lived assets and certain identifiable intangibles for impairment annually or whenever events or changes in circumstances indicate that the carrying amount of an asset may not be recoverable. Recoverability of assets to be held and used is measured by a comparison of the carrying amount of an asset to future undiscounted net cash flows expected to be generated by the asset. If such assets are considered to be impaired, the impairment to be recognized is measured by the amount by which the carrying amount of the assets exceeds the fair value of the assets. Fair value is determined through various valuation techniques including, but not limited to, discounted cash flow models, quoted market values and third-party independent appraisals. Assets to be disposed of are reported at the lower of the carrying amount or fair value less costs to sell.
During 2014 we identified an impairment indicator related to our investment in affiliated company, Luxcel Biosciences Limited (Luxcel) and concluded that the carrying value of Luxcel exceeded its fair value. The impairment was determined to be other-than-temporary. As a result, an impairment of $3.2 million, or 100 percent of the carrying value, was recognized within operating expenses of the consolidated statements of income in 2014. The investment in Luxcel has been reported in our unallocated-corporate reporting segment. Likewise, the impairment loss is allocated therein as well.
|
(j) |
Warranty |
We have a liability recorded for estimated warranty claims at the time of sale. The amount of the liability is based on the trend in the historical ratio of claims to sales, the historical length of time between the sale and resulting claim, new product introductions and other factors. In the event we determine that its current or future product repair and replacement costs exceed our estimates, an adjustment to these reserves would be charged to earnings in the period such determination is made.
MOCON, INC. AND SUBSIDIARIES
Notes to Consolidated Financial Statements
December 31, 2015, 2014 and 2013
|
(k) |
Use of Estimates |
The preparation of the consolidated financial statements, in accordance with generally accepted principles in the United States of America, requires management to make estimates and assumptions that affect the amounts reported in the financial statements and accompanying notes. Significant items subject to such estimates and assumptions include the useful lives of property, valuation of plant and equipment, valuation of investment in affiliated company, goodwill and intangible assets, inventory reserves, allowance for doubtful accounts, uncertain tax positions and warranty reserves. Actual results could differ from those estimates.
|
(l) |
Income Taxes |
Deferred tax assets and liabilities are recognized for the estimated future tax consequences attributable to differences between the financial statement carrying amounts of existing assets and liabilities and their respective tax bases. Deferred tax assets and liabilities are measured using enacted tax rates in effect for the year in which those temporary differences are expected to be recovered or settled. The effect on deferred tax assets and liabilities of a change in tax rates is recognized in income in the period that includes the enactment date. A valuation allowance is provided to offset deferred tax assets if, based on the available evidence, it is more likely than not that some or all of the deferred tax asset will not be realized. Based on our prospective adoption of ASU 2015-17, as of December 31, 2015 deferred tax asset and liability is classified as non current.
In the ordinary course of business there is inherent uncertainty in quantifying our income tax positions. We assess our income tax positions and record tax benefits for all years subject to examination based upon management’s evaluation of the facts, circumstances, and information available at the reporting dates. For those tax positions where it is more likely than not that a tax benefit will be sustained, we have recorded the largest amount of tax benefit with a greater than 50 percent likelihood of being realized upon ultimate settlement with a taxing authority that has full knowledge of all relevant information. For those income tax positions where it is not more likely than not that a tax benefit will be sustained, no tax benefit has been recognized in the financial statements. Potential accrued interest and penalties related to unrecognized tax benefits are recognized as a component of income tax expense.
|
(m) |
Fair Value of Financial Instruments |
Our financial instruments are recorded in the consolidated balance sheets. The carrying amount for cash and cash equivalents, accounts receivable, line of credit, accounts payable and accrued liabilities approximates fair value due to the immediate or short-term maturity of these financial instruments.
There are three levels within the fair value hierarchy that may be used to measure fair value:
Level 1: Values based on unadjusted quoted prices in active markets that are accessible at the measurement date for identical assets or liabilities.
Level 2: Values based on quoted prices for similar instruments in active markets, quoted prices for identical or similar instruments in markets that are not active, or model-based valuation techniques for which all significant assumptions are observable in the market.
MOCON, INC. AND SUBSIDIARIES
Notes to Consolidated Financial Statements
December 31, 2015, 2014 and 2013
Level 3: Values generated from model-based techniques that use significant assumptions not observable in the market. These unobservable assumptions reflect the Company’s own estimates of assumptions that market participants would use in pricing the asset or liability. Valuation techniques include use of option pricing models, discounted cash flow models and similar techniques.
|
(n) |
Revenue Recognition |
We recognize revenue when it is realized or realizable and earned. We consider revenue realized or realizable when persuasive evidence of an arrangement exists, the product has been shipped or the services have been provided to the customer, title and risk of loss of products has passed to the customer, the sales price is fixed or determinable, and collectability is reasonably assured. The revenue recognition policy does not differ among the various product lines, the marketing venues, or various geographic destinations. We do not have distributors who stock our equipment. We do not offer rebates, price protection, or other similar incentives, and discounts when offered are recorded as a reduction in revenue.
Revenue for service arrangements such as maintenance, repair, technical support are recognized either as the service is provided or ratably over the defined contractual period for service maintenance as noted in the paragraph below. Revenue for preventive maintenance agreements is recognized on a per visit basis and extended warranties on a straight-line basis over the life of the contracts. Unearned revenue related to these contracts is recorded in current liabilities in the consolidated balance sheets.
We periodically have shipments of products to customers in which revenue is recognized under the accounting guidance related to multiple element arrangements. We allocate the overall arrangement fee to each element (both delivered and undelivered items) based on their relative selling price, as demonstrated by vendor – specific evidence (VSOE) or third –party evidence (TPE). Where VSOE or TPE is not available, revenue is allocated using an estimated selling price.
Shipping and handling fees billed to customers are reported within revenue in the consolidated statements of income, and the related costs are included in cost of revenue in the consolidated statements of income.
Revenue is recorded net of taxes collected from customers that are remitted to governmental authorities with the collected taxes recorded as current liabilities in the consolidated balance sheets.
|
(o) |
Advertising Costs |
We incur advertising costs associated with trade shows, print advertising and brochures. Such costs are charged to expense as incurred. Advertising expense was approximately $646,000, $845,000 and $831,000 for the years ended December 31, 2015, 2014 and 2013, respectively.
|
(p) |
Research and Development Costs |
Research and development costs associated with new products or enhancements are charged to expenses from operations as incurred.
MOCON, INC. AND SUBSIDIARIES
Notes to Consolidated Financial Statements
December 31, 2015, 2014 and 2013
|
(q) |
Net Income Per Common Share |
Basic net income per common share is computed by dividing net income by the weighted average of common shares outstanding during the year. Diluted net income per share is computed by dividing net income by the weighted average of common and potential dilutive common shares outstanding during the year.
|
(r) |
Share-Based Compensation |
Share-based compensation expense is calculated and recognized primarily on a straight-line basis over the vesting periods of the related share-based reward. We generally provide for the vesting of stock options in equal annual installments over a four-year period commencing on the one-year anniversary of the date of grant, or over a one-year period with one-fourth of the underlying shares vesting at the end of each three-month period following the grant date.
The fair value of each option grant is estimated on the date of grant using the Black-Scholes option-pricing model (Black-Scholes). We use historical data to estimate the expected price volatility, expected option life and expected forfeiture rate. We base our estimate of expected volatility for awards granted in 2015, 2014 and 2013 on daily historical trading data of its common stock for a period equivalent to the expected term of the award. The risk-free interest rate is based on the U.S. Treasury yield curve in effect at the time of grant for the estimated life of the option. We estimated the expected term consistent with historical exercise and cancellation activity of its previous share-based grants with a seven-year contractual term. Forfeitures were based on historical experience. The dividend yield is calculated based upon the dividend payments made during the prior four quarters as a percent of the average share price for that period. See Note 9 for additional information on share-based compensation.
|
(2) |
Inventories |
The major components of inventories at December 31, 2015 and 2014 were as follows (expressed in thousands):
|
2015 |
2014 |
|||||||
|
Finished products |
$ | 1,366 | $ | 1,628 | ||||
|
Work-in-process |
2,375 | 2,574 | ||||||
|
Raw materials |
4,049 | 4,503 | ||||||
| Total inventory | $ | 7,790 | $ | 8,705 | ||||
MOCON, INC. AND SUBSIDIARIES
Notes to Consolidated Financial Statements
December 31, 2015, 2014 and 2013
|
|
|
(3) |
Property, Plant and Equipment |
Property, plant and equipment at December 31, 2015 and 2014 consisted of the following (dollar amounts expressed in thousands):
|
Estimated |
|||||||||||||
|
2015 |
2014 |
useful lives (years) |
|||||||||||
|
Land |
$ | 200 | $ | 200 | — | ||||||||
|
Buildings |
786 | 786 | 27 | ||||||||||
|
Machinery and equipment |
5,178 | 4,924 | 3 | to | 10 | ||||||||
|
Office equipment |
5,436 | 4,846 | 2 | to | 15 | ||||||||
|
Leasehold improvements |
2,125 | 2,186 | 1 | to | 15 | ||||||||
|
Vehicles |
424 | 494 | 3 | to | 5 | ||||||||
|
Total property, plant and equipment |
14,149 | 13,436 | |||||||||||
|
Less accumulated depreciation |
(8,154 | ) | (7,874 | ) | |||||||||
|
Net property, plant and equipment |
$ | 5,995 | $ | 5,562 | |||||||||
Depreciation of property, plant and equipment was approximately $1.3 million, $1.3 million and $1.2 million for the years ended December 31, 2015, 2014 and 2013, respectively.
|
(4) |
Goodwill and Other Intangible Assets |
Goodwill
As of December 31, 2015 and 2014, goodwill amounted to approximately $7.4 million and $8.1 million, respectively. We test goodwill for impairment annually at the reporting unit level using a fair value approach, in accordance with the provisions of ASC 350, Goodwill and Other. We completed our annual impairment tests during the fourth quarter 2015 and 2014 and determined there was no impairment.
The changes in the carrying amount of goodwill for the year ended December 31, 2015 is as follows (expressed in thousands):
|
Package |
Industrial |
|||||||||||||||
|
Testing |
Permeation |
Analyzers & Other |
Total |
|||||||||||||
|
Balance as of December 31, 2013 |
$ | 6,175 | $ | 2,249 | $ | 610 | $ | 9,034 | ||||||||
|
Foreign currency translation |
(667 | ) | (220 | ) | - | (887 | ) | |||||||||
|
Balance as of December 31, 2014 |
5,508 | 2,029 | 610 | 8,147 | ||||||||||||
|
Foreign currency translation |
(541 | ) | (169 | ) | - | (710 | ) | |||||||||
|
Balance as of December 31, 2015 |
$ | 4,967 | $ | 1,860 | $ | 610 | $ | 7,437 | ||||||||
MOCON, INC. AND SUBSIDIARIES
Notes to Consolidated Financial Statements
December 31, 2015, 2014 and 2013
Other Intangible Assets
Other intangible assets (all of which are being amortized except projects in process) are as follows (expressed in thousands):
| As of December 31, 2015 | ||||||||||||
|
Accumulated |
||||||||||||
|
Cost |
Amortization |
Net |
||||||||||
|
Patents |
$ | 1,844 | $ | (439 | ) | $ | 1,405 | |||||
|
Trademarks and trade names |
3,321 | (751 | ) | 2,570 | ||||||||
|
Developed technology |
6,121 | (2,551 | ) | 3,570 | ||||||||
|
Customer relationships |
716 | (298 | ) | 418 | ||||||||
|
Internally developed software |
1,085 | (154 | ) | 931 | ||||||||
|
Other intangibles |
214 | (122 | ) | 92 | ||||||||
| $ | 13,301 | $ | (4,315 | ) | $ | 8,986 | ||||||
| As of December 31, 2014 | ||||||||||||
|
Accumulated |
||||||||||||
|
Cost |
Amortization |
Net |
||||||||||
|
Patents |
$ | 1,719 | $ | (416 | ) | $ | 1,303 | |||||
|
Trademarks and trade names |
3,676 | (644 | ) | 3,032 | ||||||||
|
Developed technology |
6,843 | (2,091 | ) | 4,752 | ||||||||
|
Customer relationships |
800 | (245 | ) | 555 | ||||||||
|
Internally developed software |
1,085 | (46 | ) | 1,039 | ||||||||
|
Other intangibles |
255 | (105 | ) | 150 | ||||||||
| $ | 14,378 | $ | (3,547 | ) | $ | 10,831 | ||||||
Amortization expense was approximately $1.2 million, $1.3 million and $1.2 million for the years ended December 31, 2015, 2014 and 2013, respectively.
Estimated amortization expense for the fiscal years ending December 31, 2016 to 2020, and 2021 and thereafter is approximately $1.2 million, $1.1 million, $1.1 million, $1.1 million, $1.1 million and $2.8 million, respectively.
|
|
|
(5) |
Warranties |
We provide warranties for most of our products. Warranties are for periods ranging from ninety days to one year, and cover parts and labor for non-maintenance repairs, at our location. Operator abuse, improper use, alteration, damage resulting from accident, or failure to follow manufacturer’s directions are excluded from warranty coverage.
Warranty expense is accrued at the time of sale based on historical claims experience. Warranty reserves are also accrued for special rework campaigns for known major product modifications. We also offer extended warranty service contracts for select products when the factory warranty period expires.
MOCON, INC. AND SUBSIDIARIES
Notes to Consolidated Financial Statements
December 31, 2015, 2014 and 2013
Warranty provisions and claims for the years ended December 31, 2015, 2014 and 2013 were as follows (expressed in thousands):
|
Description |
Balance at Beginning of Year |
Warranty Provisions |
Warranty Claims |
Balance at End of Year |
||||||||||||
|
Year ended December 31, 2015: |
||||||||||||||||
|
Allowance for product warranties |
$ | 285 | 288 | 350 | $ | 223 | ||||||||||
|
Year ended December 31, 2014: |
||||||||||||||||
|
Allowance for product warranties |
$ | 336 | 297 | 348 | $ | 285 | ||||||||||
|
Year ended December 31, 2013: |
||||||||||||||||
|
Allowance for product warranties |
$ | 241 | 442 | 347 | $ | 336 | ||||||||||
|
|
|
(6) |
Commitments and Contingencies |
|
(a) |
Leases |
We lease our facilities and certain equipment pursuant to operating and capital leases. The facility leases expire at various times through October 2025 and require us to pay operating costs, including real estate taxes. Equipment under capital lease consists of service vehicles and a phone system, net of accumulated depreciation totaling approximately $195,000 and $58,000 for the years ended December 31, 2015 and 2014, respectively.
Rental expense for operating leases, including charges for operating costs, were approximately $1.1 million, $1.2 million and $1.1 million for years ended December 31, 2015, 2014 and 2013, respectively.
The following is a schedule of future minimum lease payments, excluding charges for operating costs, as of December 31, 2015 (expressed in thousands):
|
Year Ending December 31: |
||||||||
|
Operating Leases |
Capital Leases |
|||||||
|
2016 |
$ | 969 | $ | 67 | ||||
|
2017 |
742 | 58 | ||||||
|
2018 |
644 | 37 | ||||||
|
2019 |
546 | - | ||||||
|
2020 |
518 | - | ||||||
|
2021 and thereafter |
2,453 | - | ||||||
| $ | 5,872 | 162 | ||||||
|
Less amounts representing interest |
4 | |||||||
|
Present value of minimum lease commitments |
$ | 158 | ||||||
MOCON, INC. AND SUBSIDIARIES
Notes to Consolidated Financial Statements
December 31, 2015, 2014 and 2013
|
(b) |
Severance Agreements |
We have severance agreements with our three executive officers and two of our divisional executives which provides for the payment to the officer of a lump sum amount upon the occurrence of certain termination events.
On September 9, 2014, we entered into a Confidential Separation and Release Agreement (“Separation Agreement”) with Darrell B. Lee, the Chief Financial Officer at that time. In connection with the Separation Agreement, we recognized approximately $107,000 in expense during the year ended December 31, 2014 related to severance costs. As of December 31, 2014, approximately $72,000 is included in accrued compensation and related expenses on the consolidated balance sheets. This balance was paid in full in 2015.
|
(c) |
Inventory Purchase Obligations |
At December 31, 2015, we had approximately $6.7 million of purchase order commitments to our suppliers for delivery of inventory primarily during 2016.
|
(7) |
Realignment Expenses |
During 2015, we implemented a Realignment Plan in order to simplify our business structure by reducing the number of legal entities and by combining the sales and marketing teams of our Package Testing and Permeation segments under common leadership. The realignment expenses incurred in 2015 were $1.0 million. Substantially all Realignment Plan activities were complete by December 31, 2015. The realignment plan included:
|
● |
The elimination of approximately 10 positions across all areas |
|
● |
Significant costs associated with legal and professional fees of $414,000 |
|
● |
Significant separation costs of $635,000 |
These expenses are recognized in the consolidated income statements as Realignment expenses. As of December 31, 2015, approximately $483,000 is included in Accrued compensation and approximately $137,000 is included in Accounts payable and related expenses on the consolidated balance sheets and is expected to be paid by December 31, 2016.
|
(8) |
Income Taxes |
Income before income taxes was as follows (expressed in thousands):
|
2015 |
2014 |
2013 |
||||||||||
|
Income before income taxes: |
||||||||||||
|
Domestic |
$ | 2,314 | $ | 968 | $ | 3,072 | ||||||
|
Foreign |
2,145 | 2,490 | 1,352 | |||||||||
|
Total |
$ | 4,459 | $ | 3,458 | $ | 4,424 | ||||||
MOCON, INC. AND SUBSIDIARIES
Notes to Consolidated Financial Statements
December 31, 2015, 2014 and 2013
The provision (benefit) for income taxes consists of the following (expressed in thousands):
|
2015 |
2014 |
2013 |
||||||||||
|
Current tax expense: |
||||||||||||
|
Federal |
$ | 1,208 | $ | 1,076 | $ | 806 | ||||||
|
State |
48 | 95 | 80 | |||||||||
|
Foreign |
1,009 | 893 | 525 | |||||||||
|
Total current expense |
2,265 | 2,064 | 1,411 | |||||||||
|
Deferred tax expense (benefit): |
||||||||||||
|
Federal |
(508 | ) | 171 | 19 | ||||||||
|
State |
(15 | ) | (27 | ) | (3 | ) | ||||||
|
Foreign |
(255 | ) | (286 | ) | (464 | ) | ||||||
|
Total deferred expense (benefit) |
(778 | ) | (142 | ) | (448 | ) | ||||||
|
Provision for income taxes |
$ | 1,487 | $ | 1,922 | $ | 963 | ||||||
The effective income tax rate varies from the federal statutory tax rate for the following reasons:
|
Percentage of pretax income for years ended December 31, |
||||||||||||
|
2015 |
2014 |
2013 |
||||||||||
|
Tax at statutory federal income tax rate |
34.0 |
% |
34.0 |
% |
34.0 |
% | ||||||
|
Increases (reductions) in taxes resulting from: |
||||||||||||
|
State income taxes, net of federal benefit |
0.8 | 0.4 | 1.2 | |||||||||
|
Change in valuation allowance |
0.9 | 32.8 | (0.3 | ) | ||||||||
|
Domestic manufacturing deduction |
(1.8 | ) | (3.5 | ) | (2.3 | ) | ||||||
|
Capitalized acquisition costs |
- | - | - | |||||||||
|
Effect of foreign operations |
(2.3 | ) | (7.0 | ) | (8.5 | ) | ||||||
|
Foreign dividend income |
- | - | - | |||||||||
|
Tax-exempt interest |
- | - | - | |||||||||
|
Changes in unrecognized tax benefits |
(2.6 | ) | - | 0.9 | ||||||||
|
Stock option compensation |
2.9 | 3.0 | 1.8 | |||||||||
|
Research credit |
(4.7 | ) | (4.3 | ) | (5.7 | ) | ||||||
|
Other, including provision to return adjustments |
6.3 | (0.2 | ) | 0.7 | ||||||||
|
Effective income tax rate |
33.5 |
% |
55.6 |
% |
21.8 |
% | ||||||
MOCON, INC. AND SUBSIDIARIES
Notes to Consolidated Financial Statements
December 31, 2015, 2014 and 2013
The tax effect of significant temporary differences representing deferred tax assets and liabilities at December 31, 2015 and 2014 were as follows (expressed in thousands):
|
2015 |
2014 |
|||||||
|
Deferred tax assets: |
||||||||
|
Allowance for doubtful accounts |
$ | 3 | $ | 22 | ||||
|
Inventory items |
576 | 421 | ||||||
|
Reserves and accruals |
413 | 664 | ||||||
|
Compensation expense - stock options |
274 | 224 | ||||||
|
Foreign tax credit carryover |
170 | 325 | ||||||
|
R&D credit carryover |
171 | 105 | ||||||
|
Impairment |
1,123 | 1,135 | ||||||
|
Other |
220 | 278 | ||||||
|
Subtotal |
2,950 | 3,174 | ||||||
|
Less: Valuation allowance |
(1,294 | ) | (1,266 | ) | ||||
|
Total deferred tax assets |
1,656 | 1,908 | ||||||
|
Deferred tax liabilities: |
||||||||
|
Fixed assets |
(1,071 | ) | (881 | ) | ||||
|
Intangibles |
(1,601 | ) | (1,843 | ) | ||||
|
Total deferred tax liabilities |
(2,672 | ) | (2,724 | ) | ||||
|
Net deferred tax liability |
$ | (1,016 | ) | $ | (816 | ) | ||
As of December 31, 2015, we have determined that establishing a valuation allowance against certain deferred tax assets is required since it is more likely than not that they will not be realized through generating taxable income of a proper character. This includes approximately $1.1 million from an unrealized capital loss carryover related to the impairment of an investment in an affiliated company, and approximately $171,000 from the carryover of state R&D tax credits which will begin to expire in 2028. However, we believe that it is more likely than not that the remainder of our deferred tax assets at December 31, 2015 will be realized, primarily through generation of future taxable income and tax; this includes approximately $170,000 of foreign tax credit carryover, which begins to expire in 2020 if unutilized.
As of December 31, 2015, there was approximately $4.4 million of accumulated undistributed earnings remaining at the foreign subsidiaries. Management has deemed that the tax impact of undistributed earnings is impracticable to calculate. No deferred tax liability has been provided on the remaining foreign earnings. If they were remitted to the U.S., applicable U.S. Federal and foreign withholding taxes would be partially offset by available foreign tax credits. The Company plans to remit earnings in 2017 in a transaction giving rise to a U.S. tax benefit, as such no deferred taxes have been provided.
MOCON, INC. AND SUBSIDIARIES
Notes to Consolidated Financial Statements
December 31, 2015, 2014 and 2013
A reconciliation of the beginning and ending amount of gross unrecognized tax benefits is as follows (expressed in thousands):
|
2015 |
2014 |
2013 | ||||||||||
|
Balance at January 1 |
$ | 302 | $ | 264 | $ | 233 | ||||||
|
Additions based on tax positions related to the current year |
- | 61 | 20 | |||||||||
|
Additions based on tax positions related to the prior year |
- | - | 11 | |||||||||
|
Reductions due to closing of statute of limitations |
(25 | ) | (23 | ) | - | |||||||
|
Reductions based on tax positions related to the prior year |
(90 | ) | - | - | ||||||||
|
Balance at December 31 |
$ | 187 | $ | 302 | $ | 264 | ||||||
All unrecognized tax benefits, if recognized, would affect the effective tax rate on income before income taxes. The difference between this amount and the corresponding amount of gross unrecognized tax benefits related primarily to the deferred federal benefit for state income tax related amounts.
We do not anticipate that the total amount of unrecognized tax benefits will change significantly in the next twelve months.
We recognize accrued interest and penalties related to unrecognized tax benefits as a component of income tax expense. Total accrued interest and penalties amounted to approximately $13,000 and $55,000 on a gross basis at December 31, 2015 and 2014, respectively, and are excluded from the reconciliation of unrecognized tax benefits presented above. During 2015, $42,000 was released and recognized in income tax expense.
We file income tax returns in the U.S. federal jurisdiction, several state jurisdictions, China, France, Germany, Denmark, Italy, Luxembourg, Spain and the Netherlands. With limited exceptions, we are no longer subject to income tax examinations by taxing authorities for taxable years before 2011. In early 2013, the State of Minnesota completed its examination of the four years 2008 through 2011 which resulted in an immaterial adjustment.
|
|
|
(9) |
Share-Based Compensation |
As of December 31, 2015, we have reserved 360,989 shares of common stock for options and other share-based incentive awards that are still available for grant under our 2006 and 2015 stock incentive plans, and 797,378 shares for options that have been granted under either our 1998, 2006 or 2015 stock incentive plans but have not yet been exercised. We issue new shares of common stock upon exercise of stock options.
Under our share-based incentive plans, option exercise prices are 100 percent of the market value of the common stock at the date of grant, except if incentive options granted under the 1998, 2006 and 2015 plans were granted to persons owning more than 10 percent of our stock, in which case the option price would be 110 percent of the market value. Exercise periods are generally for seven years. The plans allow for the granting of nonqualified stock options. Upon the exercise of these nonqualified options, we may realize a compensation deduction allowable for income tax purposes. The after-tax effect of these tax deductions is included in the accompanying consolidated financial statements as an addition to additional paid-in capital.
MOCON, INC. AND SUBSIDIARIES
Notes to Consolidated Financial Statements
December 31, 2015, 2014 and 2013
Share-based compensation expense recognized in the consolidated financial statements for 2015, 2014 and 2013 was as shown below (expressed in thousands):
|
Years Ended December 31, |
||||||||||||
|
2015 |
2014 |
2013 |
||||||||||
|
Total cost of share-based compensation |
$ | 668 | $ | 591 | $ | 512 | ||||||
|
Amount of income tax benefit recognized in earnings |
(39 | ) | (104 | ) | (100 | ) | ||||||
|
Amount charged against net income |
$ | 629 | $ | 487 | $ | 412 | ||||||
The following assumptions were used to estimate the fair value of options granted during 2015, 2014 and 2013 using the Black-Scholes model:
|
2015 |
2014 |
2013 |
||||||||||
|
Dividend yield |
2.8 | % | 3.4 | % | 2.7 | % | ||||||
|
Expected volatility |
32 | % | 37 | % | 42 | % | ||||||
|
Risk-free interest rate |
1.6 | % | 1.7 | % | 1.0 | % | ||||||
|
Expected lives (in years) |
6.8 | 6.4 | 5.6 | |||||||||
Information regarding our stock option plans for 2013, 2014 and 2015 is as follows:
|
Weighted |
||||||||||||||||
|
Weighted |
Average |
Aggregate |
||||||||||||||
|
Average |
Remaining |
Intrinsic |
||||||||||||||
|
Exercise |
Contractual |
Value |
||||||||||||||
|
Shares |
Price |
Term |
(in thousands) |
|||||||||||||
|
Options outstanding, December 31, 2012 |
838,662 | $ | 11.84 | 3.9 | $ | 2,346 | ||||||||||
|
Granted |
10,000 | 14.16 | ||||||||||||||
|
Exercised |
(206,675 | ) | 10.23 | |||||||||||||
|
Cancelled or expired |
(19,687 | ) | 14.12 | |||||||||||||
|
Options outstanding, December 31, 2013 |
622,300 | 12.34 | 3.7 | 2,175 | ||||||||||||
|
Granted |
298,500 | 16.60 | ||||||||||||||
|
Exercised |
(175,800 | ) | 10.97 | |||||||||||||
|
Cancelled or expired |
(22,325 | ) | 15.04 | |||||||||||||
|
Options outstanding, December 31, 2014 |
722,675 | 14.35 | 4.6 | 2,555 | ||||||||||||
|
Granted |
206,300 | 14.30 | ||||||||||||||
|
Exercised |
(115,922 | ) | 10.24 | |||||||||||||
|
Cancelled or expired |
(15,675 | ) | 15.51 | |||||||||||||
|
Options outstanding, December 31, 2015 |
797,378 | $ | 14.91 | 4.7 | $ | 453 | ||||||||||
|
Options exercisable, December 31, 2015 |
507,978 | $ | 14.90 | 3.6 | $ | 380 | ||||||||||
MOCON, INC. AND SUBSIDIARIES
Notes to Consolidated Financial Statements
December 31, 2015, 2014 and 2013
The weighted average grant date fair value based on the Black-Scholes model for options granted in 2015, 2014 and 2013 was $3.40, $4.28 and $4.45, respectively. The total intrinsic value of options exercised was $585,000, $979,000 and $824,000 during the years ended December 31, 2015, 2014 and 2013, respectively. The aggregate intrinsic values are based upon the closing price of our common stock on the last day of the respective fiscal year.
A summary of the status of our unvested option shares as of December 31, 2015 is as follows:
|
Weighted |
||||||||
|
Average |
||||||||
|
Number of |
Grant Date |
|||||||
|
Shares |
Fair Value |
|||||||
|
Unvested at December 31, 2014 |
227,400 | $ | 4.35 | |||||
|
Options granted |
206,300 | 3.40 | ||||||
|
Options cancelled |
(12,825 | ) | 3.71 | |||||
|
Options vested |
(131,475 | ) | 4.79 | |||||
|
Unvested at December 31, 2015 |
289,400 | $ | 3.48 | |||||
As of December 31, 2015, there was $955,000 of total unrecognized compensation cost related to unvested share-based compensation granted under our plans. That cost is expected to be recognized over a weighted-average period of 1.9 years. The total fair value of option shares vested during the years 2015, 2014 and 2013 was $630,000, $550,000 and $513,000, respectively.
Employee Stock Purchase Plan
On May 27, 2015, our shareholders approved the 2015 Employee Stock Purchase Plan (“Purchase Plan”) whereby 50,000 shares of common stock will be available for future sale. The first offering period will begin January 1, 2016 and provides participants an option to purchase shares of our common stock at a price per share equal to 85 percent of the value of the share of common stock at the beginning or end of the offering period (whichever is less).
|
(10) |
Other Income (Expense), net |
Other income (expense), net for 2015, 2014 and 2013 was as follows (expressed in thousands):
| Years Ended December 31, | ||||||||||||
|
2015 |
2014 |
2013 |
||||||||||
|
Interest income |
$ | 2 | $ | 3 | $ | 22 | ||||||
|
Interest expense |
(119 | ) | (186 | ) | (299 | ) | ||||||
|
Foreign currency exchange gain (loss) |
209 | (136 | ) | (83 | ) | |||||||
|
Other |
1 | 13 | 1 | |||||||||
|
Total other income (expense), net |
$ | 93 | $ | (306 | ) | $ | (359 | ) | ||||
MOCON, INC. AND SUBSIDIARIES
Notes to Consolidated Financial Statements
December 31, 2015, 2014 and 2013
|
(11) |
Net Income per Common Share |
The following table presents a reconciliation of the denominators used in the computation of net income per common share – basic and net income per common share – diluted for the years ended December 31, 2015, 2014 and 2013 (expressed in thousands):
| Years Ended December 31, | ||||||||||||
|
2015 |
2014 |
2013 |
||||||||||
|
Weighted shares of common stock outstanding - basic |
5,753 | 5,665 | 5,545 | |||||||||
|
Dilutive impact of share-based awards |
65 | 89 | 95 | |||||||||
|
Weighted shares of common stock outstanding - diluted |
5,818 | 5,754 | 5,640 | |||||||||
Outstanding stock options totaling 610,153, 147,100 and 251,150 options for years ended December 31, 2015, 2014 and 2013, respectively, were excluded from the net income per share calculation because the shares would be anti-dilutive.
|
|
|
(12) |
Savings and Retirement Plan |
We have a 401(k) Savings and Retirement Plan covering our U.S. employees and several defined contribution pension plans covering certain employees outside of the U.S. We provide matching contributions in accordance with the plans. Our contributions to these plans in 2015, 2014 and 2013 were approximately $925,000, $882,000 and $886,000, respectively.
|
(13) |
Debt |
Long-term notes payable consists of the following (expressed in thousands):
|
December 31, 2015 |
December 31, 2014 |
|||||||
|
Note payable to bank, which was paid off on August 26, 2015 |
$ | - | $ | 1,166 | ||||
|
Seller financed note payable (Seller Note), which was paid off on April 2, 2015 |
- | 95 | ||||||
|
Capital leases (Note 6) |
158 | 29 | ||||||
|
Total long-term notes payable |
158 | 1,290 | ||||||
|
Less current portion of long-term notes payable |
65 | 983 | ||||||
|
Total long-term notes payable |
$ | 93 | $ | 307 | ||||
MOCON, INC. AND SUBSIDIARIES
Notes to Consolidated Financial Statements
December 31, 2015, 2014 and 2013
In the U.S., we have a $10.0 million secured line of credit which was amended on August 28, 2015 with a maturity date of August 26, 2018. As of December 31, 2015 the outstanding balance is classified as a noncurrent liability. The amendment increased the principal amount from $6.0 million to $10.0 million, modified the maturity date, decreased the interest rate from 1.75 basis plus one-month LIBOR to 1.50 basis plus one-month LIBOR and revised certain debt covenants. Interest is charged monthly at one-month LIBOR (0.24 percent) plus 1.50 basis points which totaled 1.74 percent and 2.00 percent at December 31, 2015 and 2014, respectively. The line of credit is secured by our assets with the exception of the number of Dansensor shares of outstanding stock that exceeds 65 percent of the total shares outstanding. We had $2.8 million and $3.3 million outstanding on the line of credit at December 31, 2015 and December 31, 2014. Additionally, Dansensor has a DKK 10 million (approximately $1.5 million) available line of credit of which no amount was outstanding as of December 31, 2015 and 2014. Outstanding borrowings are charged interest at a fixed rate of 4.35 percent per year.
We are subject to various financial and restrictive covenants in the bank Credit Agreement, including maintaining certain financial ratios and limits on incurring additional indebtedness, acquisitions, making capital and lease expenditures and making share repurchases. We are in compliance with our debt covenants at December 31, 2015 and expect to remain in compliance through 2016.
As of December 31, 2015, the future minimum principal payments of the long-term notes payable for each fiscal year thereafter is as follows (expressed in thousands):
|
2016 |
$ | 65 | ||
|
2017 |
56 | |||
|
2018 |
37 | |||
|
Total |
$ | 158 |
|
|
|
(14) |
Business Segments |
We have four operating segments, structured by differences in products and services, that are regularly reviewed by our chief operating decision maker to make decisions about allocating resources and assessing segment performance. The segment performance is evaluated at segment operating income which is defined as gross profit less selling, general and administrative expenses and research and development expenses. General corporate expenses, including costs associated with various support functions such as human resources, information technology, finance and accounting, and general and administrative costs, are allocated to the reportable segments primarily on the basis of segment gross margin. Our four operating segments have been aggregated into three reportable segments based on the authoritative guidance. We aggregated our Other Products and Services operating segment into the Industrial Analyzers Products and Services segment based on minimal business activity and materiality.
The Package Testing segment provides customers with the ability to assess package performance, shelf-life, package improvement, cost reduction, sustainability and product safety using Modified Atmosphere Packaging and other technologies. The Permeation segment includes instruments and services that measure the rate at which various gases and vapors permeate through a variety of materials. The Industrial Analyzers and Other segment includes advanced gas analysis and monitoring instrumentation used in applications such as oil and gas exploration, beverage and specialty gas analysis, industrial hygiene and safety, food safety, environmental air monitoring and homeland security.
MOCON, INC. AND SUBSIDIARIES
Notes to Consolidated Financial Statements
December 31, 2015, 2014 and 2013
The accounting policies of the reportable segments are the same as those described in Note 1. There were no significant intersegment revenue for the years ended December 31, 2015, 2014 and 2013.
Segment information for the years ended December 31, 2015, 2014 and 2013 are as follows (expressed in thousands):
|
Package Testing |
Permeation |
Industrial Analyzers and Other |
Unallocated - Corporate |
Consolidated |
||||||||||||||||
|
December 31, 2015: |
||||||||||||||||||||
|
Revenue |
$ | 26,583 | $ | 25,069 | $ | 9,572 | $ | - | $ | 61,224 | ||||||||||
|
Gross profit |
14,445 | 14,415 | 4,364 | - | 33,224 | |||||||||||||||
|
Income/(Loss) before income taxes |
2,703 | 4,527 | (1,722 | ) | (1,049 | ) | 4,459 | |||||||||||||
|
Capital expenditures |
951 | 517 | 149 | - | 1,617 | |||||||||||||||
|
Depreciation and amortization |
1,545 | 789 | 126 | - | 2,460 | |||||||||||||||
|
Interest expense |
119 | - | - | - | 119 | |||||||||||||||
|
Intangible assets, net |
7,053 | 1,869 | 64 | - | 8,986 | |||||||||||||||
|
December 31, 2014: |
||||||||||||||||||||
|
Revenue |
$ | 28,071 | $ | 23,380 | $ | 13,024 | $ | - | $ | 64,475 | ||||||||||
|
Gross profit |
13,850 | 14,985 | 7,279 | - | 36,114 | |||||||||||||||
|
Income/(Loss) before income taxes |
1,515 | 4,296 | 818 | (3,171 | ) | 3,458 | ||||||||||||||
|
Capital expenditures |
630 | 653 | 132 | - | 1,415 | |||||||||||||||
|
Depreciation and amortization |
1,715 | 730 | 110 | - | 2,555 | |||||||||||||||
|
Interest expense |
186 | - | - | - | 186 | |||||||||||||||
|
Intangible assets, net |
8,781 | 1,954 | 96 | - | 10,831 | |||||||||||||||
|
December 31, 2013: |
||||||||||||||||||||
|
Revenue |
$ | 25,241 | $ | 21,395 | $ | 10,472 | $ | - | $ | 57,108 | ||||||||||
|
Gross profit |
11,919 | 13,438 | 5,912 | - | 31,269 | |||||||||||||||
|
Income/(Loss) before income taxes |
679 | 3,338 | 407 | - | 4,424 | |||||||||||||||
|
Capital expenditures |
667 | 970 | 167 | - | 1,804 | |||||||||||||||
|
Depreciation and amortization |
1,689 | 629 | 115 | - | 2,433 | |||||||||||||||
|
Interest expense |
299 | - | - | - | 299 | |||||||||||||||
|
Intangible assets, net |
10,986 | 1,656 | 76 | - | 12,718 | |||||||||||||||
|
Total assets as of December 31, 2015 |
$ | 27,918 | $ | 15,648 | $ | 3,853 | $ | - | $ | 47,419 | ||||||||||
|
Total assets as of December 31, 2014 |
$ | 25,633 | $ | 21,071 | $ | 5,805 | $ | - | $ | 52,509 | ||||||||||
MOCON, INC. AND SUBSIDIARIES
Notes to Consolidated Financial Statements
December 31, 2015, 2014 and 2013
Property, Plant and Equipment, net of accumulated depreciation, by geographic location as of December 31, 2015, 2014 and 2013 is as follows (expressed in thousands):
|
2015 |
2014 |
2013 |
||||||||||
|
United States |
$ | 4,232 | $ | 4,010 | $ | 4,035 | ||||||
|
Foreign countries: |
||||||||||||
|
Germany |
285 | 336 | 309 | |||||||||
|
Denmark |
1,353 | 1,020 | 1,049 | |||||||||
|
Other European counties |
125 | 196 | 334 | |||||||||
|
Total foreign countries |
1,763 | 1,552 | 1,692 | |||||||||
|
Consolidated total |
$ | 5,995 | $ | 5,562 | $ | 5,727 | ||||||
The following table summarizes total revenue, based upon the region to which revenue to external customers were made for fiscal years 2015, 2014 and 2013 (expressed in thousands).
|
Years Ended December 31, |
||||||||||||
|
2015 |
2014 |
2013 |
||||||||||
|
Domestic revenue |
$ | 20,872 | $ | 19,836 | $ | 19,052 | ||||||
|
Foreign revenue: |
||||||||||||
|
Europe |
23,673 | 26,324 | 23,966 | |||||||||
|
Asia |
12,762 | 14,166 | 10,481 | |||||||||
|
Other |
3,917 | 4,149 | 3,609 | |||||||||
|
Total foreign revenue |
40,352 | 44,639 | 38,056 | |||||||||
|
Total revenue |
$ | 61,224 | $ | 64,475 | $ | 57,108 | ||||||
Our products are marketed outside of North America through our offices in foreign locations and various independent representatives.
|
|
|
(15) |
Subsequent Event |
On January 14, 2016, the Company entered into an Asset Purchase Agreement (the “Agreement”) with Volatile Analysis Corporation (“VAC”) pursuant to which the Company agreed to sell to VAC the assets exclusively used in its business of providing equipment and analytical chemistry services and related formulation, product development, and consulting services, primarily focused on identification of odors and aromas. This business was conducted from the Company’s Round Rock, Texas facility. The purchase and sale of the assets is expected to be finalized and closed during the first half of 2016, at an aggregate purchase price of $1.3 million. The pending sale of this business does not qualify for discontinued operations or available for sale treatment since it does not represent a strategic shift that had or will have a major effect on the Company’s operations and financial results.
MOCON, INC.
EXHIBIT INDEX TO ANNUAL REPORT ON FORM 10-K
FOR THE YEAR ENDED DECEMBER 31, 2015
|
Exhibit No. |
Exhibit |
Method of Filing | |
|
3.1 |
Restated Articles of Incorporation of MOCON, Inc. |
Incorporated by reference to Exhibit 3.1 to our Annual Report on Form 10-K for the fiscal year ended December 31, 2006 (File No. 000-09273) | |
|
3.2 |
Third Restated Bylaws of MOCON, Inc. |
Incorporated by reference to Exhibit 3.2 to our Annual Report on Form 10-K for the fiscal year ended December 31, 2012 (File No. 000-09273) | |
|
10.1 |
Office/Warehouse Lease, dated March 9, 2010, by and between MOCON, Inc. and Minnesota Industrial Properties Limited Partnership |
Incorporated by reference to Exhibit 10.4 to our Annual Report on Form 10-K for the fiscal year ended December 31, 2009 (File No. 000-09273) | |
|
10.2 |
MOCON, Inc. 2006 Stock Incentive Plan |
Incorporated by reference to Exhibit 10.1 to our Current Report on Form 8-K filed on June 1, 2011 (File No. 000-09273) | |
|
10.3 |
Form of Incentive Stock Option Agreement between MOCON, Inc. and its Executive Officers under the MOCON, Inc. 2006 Stock Incentive Plan |
Incorporated by reference to Exhibit 10.2 to our Current Report on Form 8-K filed on May 23, 2006 (File No. 000-09273) | |
|
10.4 |
Form of Non-Statutory Stock Option Agreement between MOCON, Inc. and its Non-Employee Directors and Executive Officers under the MOCON, Inc. 2006 Stock Incentive Plan |
Incorporated by reference to Exhibit 10.3 to our Current Report on Form 8-K filed on May 23, 2006 (File No. 000-09273) | |
|
10.5 |
MOCON, Inc. 2015 Equity Incentive Plan |
Incorporated by reference to Exhibit 5.1 to Form S-8 filed on August 7, 2015 (File No. 333-206212) |
| Exhibit
No. |
Exhibit | Method of Filing | |
|
10.6 |
MOCON, Inc. 2015 Employee Stock Purchase Plan |
Incorporated by reference to Exhibit 5.1 to Form S-8 filed on August 7, 2015 (File No. 333-206211) | |
|
10.7 |
Form of Executive Severance Agreement |
Incorporated by reference to Exhibit 10.11 to our Annual Report on Form 10-K for the fiscal year ended December 31, 2007 (File No. 000-09273) | |
|
|
|||
|
10.8 |
MOCON Inc. Incentive Pay Plan |
Incorporated by reference to Exhibit 10.1 to our Current Report on Form 8-K filed on December 29, 2014 (File No. 000-09273) | |
|
10.9 |
Description of Non-Employee Director Retirement Plan |
Incorporated by reference to Exhibit 10.20 to our Annual Report on Form 10-K for the fiscal year ended December 31, 2004 (File No. 000-09273) | |
|
10.10 |
Subscription and Shareholders Agreement dated December 21, 2009 among MOCON, Inc., Luxcel Biosciences, Enterprise Ireland, Glanbia Enterprise Fund, and certain other parties named therein |
Incorporated by reference to Exhibit 10.1 to our Current Report on Form 8-K filed December 23, 2009 (File No. 000-09273) | |
|
10.11 |
Credit Agreement dated as of March 28, 2012 by and between MOCON, Inc. and Wells Fargo Bank, National Association. |
Incorporated by reference to Exhibit 10.1 to our Current Report on Form 8-K filed on April 3, 2012 (File No. 000-09273) | |
|
10.12 |
Security Agreement: Equipment dated as of March 28, 2012 executed by MOCON, Inc. in favor of Wells Fargo Bank, National Association. |
Incorporated by reference to Exhibit 10.2 to our Current Report on Form 8-K filed on April 3, 2012 (File No. 000-09273) | |
|
10.13 |
Continuing Security Agreement: Rights to Payment and Inventory dated as of March 28, 2012 executed by MOCON, Inc. in favor of Wells Fargo Bank, National Association. |
Incorporated by reference to Exhibit 10.3 to our Current Report on Form 8-K filed on April 3, 2012 (File No. 000-09273) | |
|
10.14 |
Amendment No. 2 to the Credit Agreement dated March 28, 2012, by and between MOCON, Inc., and Wells Fargo Bank, National Association. |
Incorporated by reference to Exhibit 10.1 to our Current Report on Form 8-K filed on April 3, 2014 (File No. 000-09273) | |
|
10.15 |
Amendment No. 3 to the Credit Agreement dated March 28, 2012, by and between MOCON, Inc., and Wells Fargo Bank, National Association. |
10.1 to our Current Report on Form 8-K filed on January 14, 2015 (File No. 000-0973) | |
|
10.16 |
Amendment No. 4 to the Credit Agreement dated March 28, 2012, by and between MOCON, Inc., and Wells Fargo Bank, National Association. |
10.1 to our Current Report on Form 8-K filed on August 26, 2015 (File No. 000-0973) |
| Exhibit
No. |
Exhibit | Method of Filing | |
|
10.17 |
Offer Letter between MOCON, Inc. and Don DeMorett |
Incorporated by reference to Exhibit 10.1 to our Current Report on Form 8-K filed on January 10, 2013 (File No. 000-09273) | |
|
10.18 |
Offer Letter between MOCON, Inc. and Elissa Lindsoe
|
Incorporated by reference to Exhibit10.2 to our Current Report on Form 8-K filed on September 10, 2014 (File No. 000-09273) | |
|
10.19 |
Description of Non-Employee Director Compensation Arrangements |
Filed herewith | |
|
10.20 |
Description of Executive Officer Compensation Arrangements |
Filed herewith | |
|
10.21 |
Amendment to Executive Severance Agreement |
Filed herewith | |
|
21.1 |
Subsidiaries of MOCON, Inc. |
Filed herewith | |
|
23.1 |
Consent of Independent Registered Public Accounting Firm |
Filed herewith | |
| 23.2 | Consent of Independent Registered Public Accounting Firm | Filed herewith | |
|
31.1 |
Principal Executive Officer Certification Pursuant to Section 302 of the Sarbanes-Oxley Act of 2002 |
Filed herewith | |
|
31.2 |
Principal Financial Officer Certification Pursuant to Section 302 of the Sarbanes-Oxley Act of 2002 |
Filed herewith | |
|
32.1 |
Certification Pursuant to Section 906 of the Sarbanes-Oxley Act of 2002 (Chief Executive Officer) |
Filed herewith | |
|
32.2 |
Certification Pursuant to Section 906 of the Sarbanes-Oxley Act of 2002 (Chief Financial Officer) |
Filed herewith | |
|
101.INS |
XBRL Instance Document |
Filed herewith | |
|
101.SCH |
XBRL Taxonomy Extension Schema Document |
Filed herewith | |
|
101.CAL |
XBRL Taxonomy Extension Calculation Linkbase Document |
Filed herewith | |
|
101.DEF |
XBRL Taxonomy Extension Definition Linkbase Document |
Filed herewith | |
|
101.LAB |
XBRL Taxonomy Extension Label Linkbase Document |
Filed herewith | |
|
101.PRE |
XBRL Taxonomy Extension Presentation Linkbase Document |
Filed herewith |
1 Confidential treatment has been requested by the issuer with respect to designated portions contained within document. Such portions have been omitted and filed separately with the Securities and Exchange Commission pursuant to Rule 24b-2 of the Securities and Exchange Act of 1934, as amended.
Financial Statement Schedule:
II - Valuation and Qualifying Accounts
All other schedules are omitted as the required information is inapplicable or the information is presented in our consolidated financial statements or related notes. (expressed in thousands):
|
Description |
Balance at Beginning of Year |
Charged to Costs and Expenses |
Charged to Other Accounts |
Deductions |
Balance at End of Year |
|||||||||||||||
|
Year ended December 31, 2015: |
||||||||||||||||||||
|
Allowance for doubtful accounts and returns |
$ | 181 | (28 | ) | - | 12 | $ | 141 | ||||||||||||
|
Year ended December 31, 2014: |
||||||||||||||||||||
|
Allowance for doubtful accounts and returns |
$ | 316 | (85 | ) | - | 50 | $ | 181 | ||||||||||||
|
Year ended December 31, 2013: |
||||||||||||||||||||
|
Allowance for doubtful accounts and returns |
$ | 304 | 156 | - | 144 | $ | 316 | |||||||||||||
S-1