Attached files
| file | filename |
|---|---|
| EX-31.1 - EX-31.1 - UNITED ONLINE INC | a2227403zex-31_1.htm |
| EX-32.2 - EX-32.2 - UNITED ONLINE INC | a2227403zex-32_2.htm |
| EX-10.22 - EX-10.22 - UNITED ONLINE INC | a2227403zex-10_22.htm |
| EX-23.1 - EX-23.1 - UNITED ONLINE INC | a2227403zex-23_1.htm |
| EX-10.21 - EX-10.21 - UNITED ONLINE INC | a2227403zex-10_21.htm |
| EX-32.1 - EX-32.1 - UNITED ONLINE INC | a2227403zex-32_1.htm |
| EX-21.1 - EX-21.1 - UNITED ONLINE INC | a2227403zex-21_1.htm |
| EX-31.2 - EX-31.2 - UNITED ONLINE INC | a2227403zex-31_2.htm |
Use these links to rapidly review the document
TABLE OF CONTENTS
PART IV
INDEX TO CONSOLIDATED FINANCIAL STATEMENTS
UNITED STATES
SECURITIES AND EXCHANGE COMMISSION
Washington, D.C. 20549
FORM 10-K
| (Mark One) | ||
ý |
ANNUAL REPORT PURSUANT TO SECTION 13 OR 15(d) OF THE SECURITIES EXCHANGE ACT OF 1934 |
|
For the Fiscal Year Ended December 31, 2015 |
||
Or |
||
o |
TRANSITION REPORT PURSUANT TO SECTION 13 OR 15(d) OF THE SECURITIES EXCHANGE ACT OF 1934 |
|
For the transition period from to |
||
Commission file number 000-33367
UNITED ONLINE, INC.
(Exact name of Registrant as specified in its charter)
| Delaware (State or other jurisdiction of incorporation or organization) |
77-0575839 (I.R.S. Employer Identification No.) |
|
21255 Burbank Boulevard, Suite 400 Woodland Hills, California (Address of principal executive office) |
91367 (Zip Code) |
(818) 287-3000
(Registrant's telephone number, including area code)
Securities registered pursuant to Section 12(b) of the Act:
| Title of Each Class | Name of Exchange on Which Registered | |
|---|---|---|
| Common Stock, par value $0.0001 per share | The Nasdaq Stock Market LLC (Nasdaq Global Select Market) |
Securities registered pursuant to Section 12(g) of the Act: None
Indicate by check mark if the Registrant is a well-known seasoned issuer, as defined in Rule 405 of the Securities Act. Yes o No ý
Indicate by check mark if the Registrant is not required to file reports pursuant to Section 13 or Section 15(d) of the Act. Yes o No ý
Indicate by check mark whether the registrant (1) has filed all reports required to be filed by Section 13 or 15(d) of the Securities Exchange Act of 1934 during the preceding 12 months (or for such shorter period that the registrant was required to file such reports), and (2) has been subject to such filing requirements for the past 90 days. Yes ý No o
Indicate by check mark whether the registrant has submitted electronically and posted on its corporate website, if any, every Interactive Data File required to be submitted and posted pursuant to Rule 405 of Regulation S-T (§232.405 of this chapter) during the preceding 12 months (or for such shorter period that the registrant was required to submit and post such files). Yes ý No o
Indicate by check mark if disclosure of delinquent filers pursuant to Item 405 of Regulation S-K is not contained herein, and will not be contained, to the best of Registrant's knowledge, in definitive proxy or information statements incorporated by reference in Part III of this Form 10-K or any amendment to this Form 10-K. ý
Indicate by check mark whether the Registrant is a large accelerated filer, an accelerated filer, a non-accelerated filer, or a smaller reporting company. See definitions of "large accelerated filer," "accelerated filer" and "smaller reporting company" in Rule 12b-2 of the Exchange Act. (Check one):
| Large accelerated filer o | Accelerated filer ý | Non-accelerated filer o (Do not check if a smaller reporting company) |
Smaller reporting company o |
Indicate by check mark whether the Registrant is a shell company (as defined in Rule 12b-2 of the Act). Yes o No ý
At June 30, 2015, the aggregate market value of voting stock held by non-affiliates of the Registrant, based on the last reported sales price of the Registrant's common stock on such date reported by The Nasdaq Global Select Market, was $228,181,573 (calculated by excluding shares directly or indirectly held by directors and officers).
At February 26, 2016, there were 14,942,456 shares of the Registrant's common stock outstanding.
DOCUMENTS INCORPORATED BY REFERENCE
The information required by Part III of this Form 10-K, to the extent not set forth herein, is incorporated herein by reference to the Registrant's definitive proxy statement relating to the 2016 annual meeting of stockholders, or an amendment on Form 10-K/A, to be filed with the Securities and Exchange Commission not later than 120 days after the end of the Registrant's fiscal year ended December 31, 2015.
UNITED ONLINE, INC.
INDEX TO FORM 10-K
For the Year Ended December 31, 2015
In this document, "United Online," "UOL," the "Company," "we," "us" and "our" refer to United Online, Inc. and its subsidiaries.
This Annual Report on Form 10-K and the documents incorporated herein by reference contain certain forward-looking statements within the meaning of Section 27A of the United States Securities Act of 1933, as amended, and Section 21E of the Securities Exchange Act of 1934, as amended, which are subject to the "safe harbor" created by those sections. Forward-looking statements are based on our current expectations, estimates and projections about our operations, industry, financial condition, performance, results of operations, and liquidity. Statements containing words such as "may," "believe," "anticipate," "expect," "intend," "plan," "project," "projections," "business outlook," "estimate," or similar expressions constitute forward-looking statements. These forward-looking statements include, but are not limited to, statements about the expected benefits of our acquisitions, dispositions and restructuring activities; our strategies; our pursuit of long-term growth initiatives; our future financial performance and results, revenues, segment metrics, operating expenses, market trends, liquidity, cash flows and uses of cash, dividends, capital
2
expenditures, depreciation and amortization, tax payments, foreign currency exchange rates, and hedging arrangements; our ability to invest in initiatives; our plans for services and products, pricing, and marketing efforts; competition; the impact of actions by stockholder activists; the outcome of legal matters; and the impact of accounting pronouncements. These statements involve known and unknown risks, uncertainties and other factors that may cause our actual results, performance, time frames or achievements to be materially different from those set forth or contemplated in the forward-looking statements, including, among others, the factors disclosed in the section entitled "Risk Factors" in this Annual Report on Form 10-K and additional factors that accompany the related forward-looking statements in this Annual Report on Form 10-K and our other filings with the Securities and Exchange Commission. Readers are cautioned not to place undue reliance on these forward-looking statements, which reflect our estimates and assumptions only as of the date hereof. Such forward-looking statements are not guarantees of future performance or results and reported results should not be considered an indication of future performance. We undertake no obligation to update these forward-looking statements to reflect the impact of events or circumstances arising after the date hereof, unless required by law.
3
Overview
United Online, through its operating subsidiaries, provides consumer services and products over the Internet under a number of brands, including NetZero, Juno, MyPoints, StayFriends, and Trombi.
United Online, Inc. is a Delaware corporation, headquartered in Woodland Hills, California, that commenced operations in 2001 following the merger of dial-up Internet access providers NetZero, Inc. ("NetZero") and Juno Online Services, Inc. ("Juno"). In 2004, we acquired Classmates Online, Inc. (whose name was changed to Classmates, Inc. in December 2013, "Classmates"), a provider of social networking services, and in 2006, we acquired MyPoints.com, Inc. ("MyPoints"), a provider of a loyalty marketing service. In 2008, we acquired FTD Group, Inc., a provider of floral, gift and related products and services to consumers and retail florists, as well as to other retail locations offering floral, gift and related products and services under the FTD and Interflora brands. In June 2012, we acquired schoolFeed, Inc. ("schoolFeed"), an online high school social network that enables members to reconnect and interact with their former classmates, which became part of our former Classmates business. On November 1, 2013, United Online, Inc. consummated the separation of FTD Companies, Inc. (together with its subsidiaries, including FTD Group, Inc., "FTD") from United Online, Inc. through a tax-free distribution of all FTD Companies, Inc. common stock held by United Online, Inc. to United Online, Inc.'s stockholders (the "FTD Spin-Off Transaction"). As a result, FTD's financial results are presented as discontinued operations in our consolidated financial statements.
Effective in the first quarter of 2015, we modified how we report segment information to our Chief Operating Decision Maker ("CODM") as the information regularly reviewed by the CODM had changed. As a result of the changes, we now report three operating segments to the CODM, including the Communications segment, as well as separately reporting the operating results of the Commerce & Loyalty and Social Media segments (which, in prior periods, were reported to the CODM together as the Content & Media segment). This change has been reflected through a retroactive revision of prior-period segment information to conform to the newly-defined segment information.
On August 11, 2015, we completed the sale of all of the stock of our wholly-owned subsidiary, Classmates, Inc. to Intelius Holdings, Inc. The purchase price received for the Classmates domestic business unit was $30.6 million in cash. The Stock Purchase Agreement for the sale included customary representations, warranties and covenants of each party, some of which survive the closing of the transaction for a period of time. Accordingly, the results of operations, the financial condition and the cash flows of the Classmates domestic business unit have been presented as discontinued operations for all periods presented.
We report our businesses in three reportable segments:
Segment
|
Services and Products | |
|---|---|---|
Communications |
Internet access services and devices, including dial-up, mobile broadband, DSL, email, Internet security, and web hosting | |
Commerce & Loyalty |
Loyalty marketing service, shopping through online portals, apps and browser extensions |
|
Social Media |
Social networking services and products |
4
We generate revenues from three primary sources:
- •
- Services revenues. Services revenues in our
Communications and Social Media segments are derived from selling subscriptions to consumers, who are typically billed in advance for the entire subscription term.
- •
- Products revenues. Products revenues in our
Communications segment are derived from the sale of mobile broadband devices, as well as the related shipping and handling fees. Products revenues in our Social Media segment are derived from the sale
of yearbooks, including the related shipping and handling fees.
- •
- Advertising and other revenues. Advertising and other revenues are primarily derived from various advertising, marketing and media-related initiatives in all of our segments. Advertising and other revenues in our Commerce & Loyalty segment also include fees generated when members complete online transactions, when emails are transmitted to members and when members respond to emails and revenues from the sale of physical gift cards and electronic gift codes.
Communications Segment
Our principal Communications pay service is Internet access, offered under the NetZero and Juno brands. Internet access includes dial-up service, mobile broadband and DSL. We also offer email, Internet security, web hosting services, and other services. In total, we had 403,000 Communications pay accounts at December 31, 2015, of which 229,000 were Internet access pay accounts and 174,000 were pay accounts subscribed to our other Communications services, including email, Internet security and web hosting services. The majority of our Communications revenues are derived from dial-up Internet access, DSL and other Communications services. In addition, our Communications services generate advertising revenues from search placements, display advertisements and online market research associated with our Internet access and email services.
Internet Access Services. Our Internet access services consist of dial-up, mobile broadband and, to a much lesser extent, DSL services. Our dial-up Internet access services are provided on both a free and pay basis, with the free services subject to hourly and other limitations. Basic pay dial-up Internet access services include Internet access and an email account. In addition, we offer accelerated dial-up Internet access services which can significantly reduce the time required for certain web pages to load during Internet browsing when compared to our basic dial-up Internet access services. Our accelerated dial-up Internet access services are also bundled with additional benefits, including antivirus software and enhanced email storage, although we also offer each of these features and certain other value-added features as stand-alone pay services. Our dial-up Internet access services are available in more than 12,000 cities across the U.S. and Canada. We also generate revenues from the resale of telecommunications to third parties. Our Internet access services have typically experienced a higher rate of new member registrations during the quarter ending March 31 when compared to other quarters, though there can be no assurance that these seasonal trends will continue in the future.
In 2012, we began offering our mobile broadband service as part of a wholesale agreement with Clearwire. In January 2014, we expanded the coverage area to include the Sprint 3G network. In November 2014, we expanded coverage to include the Sprint 4G LTE network. In November 2015, we discontinued service under the Clearwire agreement. We offer consumers the option to access the service by purchasing either a USB modem to connect a single device such as a PC or a Mac® computer, a personal hotspot or a hotspot-enabled tablet, both of which can connect multiple Wi-Fi enabled devices simultaneously. USB modem, hotspot and hotspot-enabled tablet customers are able to connect to our mobile broadband service using a variety of devices, including a PC, Mac® computer, iPad® mobile digital device and other tablets, netbooks and smartphones. Our mobile broadband service is generally available for use in the home, at the office or on the go by customers across the U.S.
5
Voice Services. In November 2014, we began a test phase offering voice services as part of our wholesale agreement with Sprint. We offered consumers the option to access the services by purchasing a mobile phone from NetZero or by bringing their own mobile device to use on our service. We offered a variety of plans, which include talk, text and data. In November 2015, we discontinued new sales of voice services.
Industry Background—The U.S. market for consumer Internet access services has evolved significantly, primarily due to increased availability and consumer adoption of high-speed broadband or mobile broadband connections. As a result, the percentage of Americans who access the Internet via dial-up has declined each year since 2002, according to Pew Internet & American Life Project. We anticipate that such percentage will continue to decline.
Broadband Internet access services are now available to most of the U.S. population at competitive prices, although market pricing varies based on the geographic region and speed of the broadband service, among other factors. Broadband continues to have a much lower penetration rate in rural areas when compared to urban and suburban areas and, according to an estimate released by the Federal Communications Commission in November 2014, approximately 15 million Americans lack access to fixed broadband service in rural areas. Many broadband providers, including cable companies such as Comcast and local exchange carriers such as AT&T, market broadband Internet access offerings that are "bundled" with telephone, entertainment or other services, which generally results in lower prices than stand-alone services. At the same time, the maturity of the dial-up Internet access market has led the largest dial-up service providers in the U.S., including AOL, EarthLink, and us through NetZero and Juno, to significantly reduce marketing spending and operate their dial-up Internet access businesses primarily for profitability and cash flows.
There are numerous dial-up Internet access providers in the U.S., although a small number of national providers account for a significant majority of the U.S. dial-up market. As the industry has matured, the average tenure of dial-up Internet access pay accounts has increased significantly, which has generally resulted in a reduction in subscriber churn since longer tenured pay accounts, on average, exhibit greater retention characteristics than newer pay accounts.
Competition—The U.S. market for broadband services is highly competitive and forecasted to grow over the next several years. We compete with numerous providers of broadband services, as well as other dial-up Internet access providers. Our principal competitors for broadband services include, among others, local exchange carriers, wireless and satellite service providers, cable service providers, and broadband resellers. These competitors include established providers such as AT&T, Verizon, Sprint and T-Mobile. Our principal dial-up Internet access competitors include established online service and content providers, such as AOL and MSN, and independent national Internet service providers, such as EarthLink and its PeoplePC subsidiary. We believe the primary competitive factors in the Internet access industry are speed, price, coverage area, ease of use, scope of services, quality of service, and features. Our dial-up Internet access services do not compete favorably with broadband services with respect to certain of these factors, including, but not limited to, speed. When compared to other dial-up Internet access services, we believe our dial-up Internet access services compete favorably. Our mobile broadband service and our DSL service compete favorably with other broadband services with respect to certain factors, although some of our competitors have an advantage over us with respect to certain other factors, such as price. For additional information, see "Risk Factors", which appears in Item 1A of this Annual Report on Form 10-K.
Commerce & Loyalty Segment
Our Commerce & Loyalty segment offers a loyalty marketing service under the MyPoints brand. MyPoints connects advertisers with its members by allowing members to earn rewards points for engaging in online and offline activities. MyPoints is a free service for consumers who register and
6
provide certain identifying information to receive direct email marketing and other loyalty promotions. Members earn points for responding to email offers, shopping online at the MyPoints website (www.mypoints.com), taking market research companies' surveys, playing online games with MyPoints partners, searching the Internet on a dedicated MyPoints' landing page and using the MyPoints-branded browser extension as a reminder service for members to shop and earn. In addition to these point earning opportunities, MyPoints also offers a credit card with the ability to earn points through both online and offline shopping. Reward points can be earned from over 1,900 affiliated retailers, which are redeemable for third-party gift cards and electronic gift cards currently from approximately 85 merchants or for PayPal credit, as well as the option to redeem in the form of a charitable donation. Gift cards are also available for purchase on the MyPoints website.
MyPoints provides advertisers with an effective means to reach a large online audience. MyPoints uses a variety of criteria, including personal interests, purchasing behavior and demographic profiles, to create targeted promotions for advertisers. These marketing campaigns are tailored to meet the goals of the specific advertiser, which are most commonly to generate incremental sales of an advertiser's products or services but may also include objectives that do not involve purchase transactions, such as generating sales leads or increased traffic to an advertiser's website. In many cases, MyPoints sends personalized email marketing messages, called BonusMail®, that are directed specifically to individual MyPoints members to showcase a single advertiser or offer. MyPoints members benefit not only from attractive discounts and other benefits featured in BonusMail® offers but also can receive points for purchases and, in some cases, for clicking through the media links in BonusMail® to the advertiser's website, as well as for other actions taken within a limited time period. We believe the limited-time nature of the BonusMail® offers adds a sense of urgency to the promotion for the consumer.
The advertising revenues generated from our loyalty marketing service revenues are classified as advertising and other revenues. Advertisers pay us primarily based on performance measures that include when our MyPoints emails are transmitted to members, when members respond to emails and when members complete transactions. Advertising and other revenues also include revenues generated from the sale of physical and electronic gift cards. Loyalty marketing advertising revenues and operating results tend to be higher in the quarter ending December 31 when compared to other quarters, though there can be no assurance that these seasonal trends will continue in the future.
Industry Background—U.S. online retail sales are expected to grow from $334 billion in 2015 to $480 billion by 2019, a compound annual growth rate of 10%, according to an online retail sales forecast from Forrester Research Inc. In addition, U.S. advertisers' spending on digital advertising is expected to grow from $57 billion in 2014 to $103 billion in 2019 representing 36% of all ad spending, according to Forrester's latest estimates based on its ForecastView model. As advertisers seek methods to target, reach and retain online consumers, loyalty marketing presents an attractive option.
According to the February 2015 Colloquy Loyalty Census, loyalty memberships in the United States have more than tripled since 2000, when there were 973 million memberships. The loyalty census indicates that membership growth shows no signs of slowing, with 3.32 billion loyalty members in 2014, compared with 2.65 billion in 2012. This confluence of growth in online shopping and advertising, and in loyalty memberships offers significant opportunities for MyPoints as our loyalty marketing business is poised to realize its potential by exploiting current assets including: strong relationships with a variety of retailers and clients, a large and engaged member base, a variety of engagement activities to serve member needs and interests, and the ability to provide loyalty incentives to drive consumer action. Loyalty marketing programs are generally designed to reward consumers with points that accumulate based on their activities and which may be redeemed for cash, gift cards, or products and services from participating vendors. Some loyalty marketing programs use points as an incentive for members to opt in to receiving certain email offers or to update their personal interest profiles, which provide useful information that helps advertisers target consumers interested in purchasing the advertisers' products and services. While these programs have long been popular with airlines, credit card vendors, hotels,
7
and retailers, in recent years, loyalty marketing programs have expanded into a comprehensive direct marketing and targeted advertising strategy for companies in a wide range of industries.
Loyalty marketing programs and similar services enable advertisers to target consumers in ways that are generally impractical with traditional offline direct marketing channels. Loyalty marketing programs can also easily measure click-through rates on display advertising and response rates to email campaigns, providing rapid feedback for advertisers that can be used to identify potential customers and create new targeted offers. In addition, a loyalty marketing program that has attracted a large, responsive and loyal member base helps to improve returns on advertisers' marketing investments. Furthermore, advertisers may prefer to work with loyalty marketing programs that offer performance-based pricing, which helps advertisers achieve specific performance objectives within budget.
Competition—The market for loyalty marketing services is highly competitive, and we expect competition to significantly increase in the future as loyalty marketing programs continue to grow in popularity and expand to mobile platforms. Our MyPoints loyalty marketing business faces competition for members from other online loyalty marketing programs, such as Ebates and Mr. Rebates, as well as offline loyalty marketing programs that have a significant online presence, such as those operated by credit card, airline and hotel companies. In addition, we also face competition for members from online providers of discounted offerings and coupons, such as Groupon and LivingSocial. We believe the primary competitive factors in the loyalty marketing industry are the number, type and popularity of the participating merchants, the attractiveness of the rewards offered, the value awarded for various actions, the ease and speed of earning rewards, and the ability to offer members a robust, user-friendly shopping experience. We believe that we compete favorably in many of these areas, although some of our competitors have an advantage over us in some or all of these areas. For additional information, see "Risk Factors", which appears in Item 1A of this Annual Report on Form 10-K.
For additional information regarding our segments, see Note 2, "Segment Information" of the Notes to the Consolidated Financial Statements, which appears in Part II, Item 8 of this Annual Report on Form 10-K.
Social Media Segment
Our Social Media segment provides social networking services and products under the StayFriends and Trombi brands. We operate our social networking services as a platform to enable users to locate and interact with acquaintances from their past, with high school affiliations as the primary focus. Our social networking services comprise a large and diverse population of users, with approximately 32 million registered accounts at December 31, 2015. We also provide advertising opportunities to marketers with both brand and direct response objectives through a full suite of display, search, email, and text-link opportunities across our various properties.
We operate five international websites that offer social networking services, primarily as a social networking platform to reconnect with friends and acquaintances from high school. We operate StayFriends in Germany, Sweden, Austria, and Switzerland (www.stayfriends.de, www.stayfriends.se, www.stayfriends.at, and www.stayfriends.ch, respectively), and Trombi in France (www.trombi.com). Each international website includes free and paid memberships.
Industry Background—The Internet continues to evolve and grow as a platform to enable, among other things, social interaction, consumer engagement, the sale of goods and services, and advertising. We believe that as people age, many develop a strong interest in reconnecting with people and events from their past.
Competition—As consumers continue to spend more time and money online, the competition for their time and engagement has continued to intensify. Consumers have a great number of options for
8
online content and entertainment, including, by way of example, games, websites offering news and current events, movies, television shows, videos, information about any and virtually every topic, and the opportunity to communicate, socialize and interact with acquaintances and others. Facebook, in particular, has become a dominant platform for finding and interacting with people online, including both past and present acquaintances. Our services continue to provide a platform for social networking activities and communications, especially related to the high school experience. Visitors to the websites can interact with our archive of class photos, which can facilitate new forms of social connections, such as sharing memorable content with friends and acquaintances or posting comments on the website or on Facebook. Certain aspects of the value proposition of our social networking services compete with major social networking platforms such as Facebook, as well as Internet search engines such as Google. Many of our competitors offer their content and services free of charge. We believe the primary competitive factors are price, features, functionality, size and engagement of the user base, and quantity, quality and scope of the content. We believe we compete favorably with respect to certain of these areas, although many competitors have a significant advantage over us in certain other areas. For additional information, see "Risk Factors", which appears in Item 1A of this Annual Report on Form 10-K.
Technology
Each of our services, including our social networking services, our loyalty marketing service, and our Internet access service operates on a separate and distinct technology platform. Each of our services is generally provided through a combination of internally-developed and third-party software, industry standard hardware and outsourced network services. We maintain the web properties that power these services. We also have developed software to enhance the functionality of certain components of our services, including connectivity, web services, billing, email, customer support, data analysis, customer loyalty applications, and targeted advertising. We maintain data centers in multiple locations in the U.S. and Europe. In many cases, we have redundant systems to provide high levels of service availability and connectivity. We host the majority of our data center services in outsourced, third-party co-location facilities and we outsource all of our bandwidth and managed modem services.
We license from third parties a number of our software applications and components, including applications for our billing, customer support, advertising, and database systems, our client and server applications, and portions of our dial-up Internet access accelerator services. These licenses generally have terms ranging from a year to perpetual.
Customer Support and Retention
We believe reliable customer service and technical support are important to retaining our customers. Our businesses generally offer a variety of online and offline tools designed to provide solutions and answers to frequently asked questions. These tools are also designed to assist our members and customers in verifying and updating their account information. In addition, we offer traditional email support and certain of our services provide live telephone support as well.
Our customer relationship management and support infrastructure includes employees at our facilities in Woodland Hills, California; Hyderabad, India; San Francisco, California; Schaumburg, Illinois; and Berlin, Germany. We also outsource to third parties substantially all of our telephone and email customer support for our Communications services. We monitor the effectiveness of our customer support functions and measure performance metrics such as average hold time and first call resolution and abandonment rates. Communications with our customers are logged and categorized to enable us to recognize and act on trends.
9
Government Regulations
We are subject to a number of international, federal, state, and local laws and regulations, including, without limitation, those relating to taxation, bulk email or "spam," advertising, user privacy and data protection, consumer protection, antitrust, export, and unclaimed property. In addition, proposed laws and regulations relating to some or all of the foregoing, as well as to other areas affecting our businesses, are continuously debated and considered for adoption in the U.S. and other countries, and such laws and regulations could be adopted in the future. For additional information, see "Risk Factors," which appears in Item 1A of this Annual Report on Form 10-K.
Proprietary Rights
Our trade names, trademarks, service marks, patents, copyrights, domain names, trade secrets, and other intellectual property are important to the success of our businesses. In particular, we view our primary trademarks as critical to our success. We principally rely upon patent, trademark, copyright, trade secret, domain name, and contract laws to protect our intellectual property and proprietary rights. We continuously assess whether to seek patent and other intellectual property protections for those aspects of our businesses and technologies that we believe constitute innovations providing competitive advantages. We generally enter into confidentiality or license agreements with our employees, consultants and corporate partners, and generally control access to, and distribution of, our technologies, documentation and other proprietary information. We consider our trademarks, including our United Online, NetZero, Juno, MyPoints, and StayFriends trademarks, to be very valuable assets, and most of these trademarks have been registered in the U.S. or, in certain cases, in other countries.
International Operations
We have international operations in India and Germany. Our operations in India primarily handle software development and operations, quality assurance and email customer support. Our operations in Germany provide social networking services in Germany, Sweden, France, Austria, and Switzerland. We do not generate revenues directly from our operations in India.
Geographic information for revenues was as follows (in thousands):
| |
Year Ended December 31, | |||||||||
|---|---|---|---|---|---|---|---|---|---|---|
| |
2015 | 2014 | 2013 | |||||||
United States |
$ | 128,237 | $ | 135,483 | $ | 143,865 | ||||
Germany |
18,924 | 24,592 | 26,730 | |||||||
Europe, excluding Germany |
3,957 | 5,644 | 6,536 | |||||||
| | | | | | | | | | | |
Consolidated revenues |
$ | 151,118 | $ | 165,719 | $ | 177,131 | ||||
| | | | | | | | | | | |
| | | | | | | | | | | |
| | | | | | | | | | | |
For information regarding risks associated with our international operations, see "Risk Factors," which appears in Item 1A of this Annual Report on Form 10-K. For information regarding long-lived assets, see Note 2, "Segment Information" of the Notes to the Consolidated Financial Statements, which appears in Part II, Item 8 of this Annual Report on Form 10-K.
Segment Financial Information
For information regarding segment revenues, profit or loss and assets, see Note 1, "Description of Business, Basis of Presentation, Accounting Policies, and Recent Accounting Pronouncements" and Note 2, "Segment Information" of the Notes to the Consolidated Financial Statements, which appear in Part II, Item 8 of this Annual Report on Form 10-K.
10
Employees
At December 31, 2015, we had 384 employees, 145 of which were located in the U.S., 152 of which were located in India, and 87 of which were located in Europe. None of these employees are subject to a collective bargaining agreement, and we consider our relationship with our employees to be good.
Executive Officers
See Part III, Item 10 "Directors, Executive Officers and Corporate Governance" of this Annual Report on Form 10-K for information about executive officers of the Registrant.
Available Information
Our corporate website is www.unitedonline.com. On this website, we make available, free of charge, our annual, quarterly and current reports (including all amendments to such reports), changes in the stock ownership of our directors and executive officers, our code of ethics, and other documents filed with, or furnished to, the Securities and Exchange Commission ("SEC"), as soon as reasonably practicable after such documents are filed with, or furnished to, the SEC.
The public may read and copy any materials we file with the SEC at the SEC's Public Reference Room at 100 F Street, NE, Washington, DC 20549. The public may obtain information on the operation of the Public Reference Room by calling the SEC at 1-800-SEC-0330. The SEC also maintains a website that contains reports, proxy and information statements and other information regarding the Company that we file electronically with the SEC at www.sec.gov.
By referring to our websites, including, without limitation, www.unitedonline.com, www.mypoints.com, www.stayfriends.de, www.stayfriends.se, www.trombi.com, www.stayfriends.at, and, www.stayfriends.ch, we do not incorporate these websites or their contents into this Annual Report on Form 10-K.
RISKS RELATING TO OUR BUSINESS GENERALLY
New business initiatives, services, products, features, applications, or functionality may not be successful, which could adversely impact our business, financial condition, results of operations, and cash flows.
We have expended, and may continue to expend, significant resources in developing, integrating and implementing new business initiatives, services, products, features, applications, and functionality. Such development, integration and implementation involves a number of uncertainties, including unanticipated delays and expenses and technological problems. New business initiatives, services, products, features, applications, or functionality also may not be accepted by consumers or be commercially successful. We cannot assure you that we will be successful in such development, integration and implementation efforts, or that any new business initiatives, services, products, features, applications, or functionality will be accepted by consumers or be commercially successful. If our development, integration and implementation efforts are not successful, or such new business initiatives, services, products, features, applications, or functionality are not accepted by consumers or commercially successful, our business, financial condition, results of operations, and cash flows could be materially and adversely impacted.
Failure to successfully implement strategies that align our service and product offerings with technology advances and trends could result in significant costs to us and otherwise adversely affect our business.
If we fail to successfully implement strategies that align our service and product offerings with technology advances and trends, we may be required to make significant capital expenditures to
11
develop or acquire new equipment or technology in order to replace aging or technologically obsolete equipment, and our business, financial condition, results of operations, and cash flows could be materially and adversely affected. For example, consumers increasingly connect to the Internet through sources other than the personal computer, including mobile phones, smartphones, handheld computers such as netbooks and tablets, video game consoles, and television set-top devices, and their use to access the Internet will likely continue to increase. Our business will be adversely affected if we do not have a successful strategy that aligns with such trends. As new devices and applications and other software for such devices are continually being released, it is difficult to predict the problems we may encounter in adapting our services and products and developing competitive new services and products. Our social networking services and loyalty marketing service have a limited mobile presence, and we only began offering mobile broadband service in March 2012. We may devote significant resources to the creation, support and maintenance of services and products across multiple platforms. If we are slow to develop services, products and technologies that are more compatible with alternative devices and changes in their operating systems and other software, we will fail to capture the opportunities available as consumers and advertisers transition to a dynamic, multi-screen environment.
Current or future economic conditions may have a material and adverse impact on our business, financial condition, results of operations, and cash flows.
Our services and products are dependent upon levels of consumer spending. Consumer spending patterns are difficult to predict and are sensitive to, among other factors, the general economic climate, consumers' levels of disposable income, consumer debt, and overall consumer confidence. Challenging economic conditions have adversely impacted certain aspects of our businesses in a number of ways, including reduced demand, more aggressive pricing for similar services and products by our competitors, decreased spending by advertisers, increased credit risks, increased credit card failures, a loss of customers, and increased use of discounted pricing for certain of our services and products. Challenging economic conditions may adversely impact our key vendors and customers. Such economic conditions and decreased consumer spending have, in certain cases, resulted in, and may in the future result in, a variety of negative effects such as a reduction in revenues, increased costs, lower gross margin and operating margin percentages, increased allowances for doubtful accounts and write-offs of accounts receivable, increased provisions for excess and obsolete inventories, and recognition of impairments of assets, including goodwill and other intangible and long-lived assets. Any of the above factors could have a material adverse effect on our business, financial condition, results of operations, and cash flows.
We may be unable to maintain or grow our advertising revenues. Reduced advertising revenues may reduce our profits.
Advertising revenues are a key component of revenues and profitability for our Communications and Commerce & Loyalty segments. Factors that have caused, or may cause in the future, our advertising revenues to fluctuate include, without limitation, changes in the number of visitors to our websites, active accounts or consumers purchasing our services and products, the effect of, changes to, or terminations of key advertising relationships, changes to our websites and advertising inventory, changes in applicable laws, regulations or business practices, including those related to behavioral or targeted advertising, user privacy, and taxation, changes in business models, changes in the online advertising market, changes in the economy, advertisers' budgeting and buying patterns, competition, and changes in usage of our services. Decreases in our advertising revenues are likely to adversely impact our profitability.
Advertising revenues generated by our Communications and Commerce & Loyalty segments have been fluctuating and may decline in the future as a result of various factors, including, without limitation, the risks and uncertainties discussed above, in other risk factors, and elsewhere in this
12
Annual Report on Form 10-K. Any or all of the above factors have caused, and could continue to cause, our advertising revenues and profits to significantly decline in the future.
Our business is subject to quarterly fluctuations.
Our results of operations and changes in our key business metrics from period to period have varied in the past and may fluctuate significantly in the future due to a variety of factors, many of which are outside of our control and difficult to predict. Each of the risk factors discussed in this Item 1A and the other factors described elsewhere in this Annual Report on Form 10-K and in our other filings with the SEC may affect us from period to period and may affect our long-term performance. As a result, you should not rely on current results and period-to-period comparisons as an indication of our future performance. In addition, these factors and challenging economic conditions create difficulties with respect to our ability to forecast our financial performance and business metrics accurately. We believe that these difficulties in forecasting present even greater challenges for financial analysts who publish their own estimates of our future financial results and business metrics. We cannot assure you that we will achieve the expectations of, or projections made by, our management or the financial analysts. In the event we do not achieve such expectations or projections, our financial results and the price of our common stock could be adversely affected.
Governmental regulation of the collection and use of personal information or our failure to comply with these regulations could harm our businesses.
The FTC has regulations regarding the collection and use of personal information obtained from individuals when accessing websites, with particular emphasis on access by minors. In addition, other governmental authorities have regulations to govern the collection and use of personal information that may be obtained from individuals when accessing websites. These regulations include requirements that procedures be established to disclose and notify users of our websites or mobile apps of our privacy and security policies, obtain consent from users for collection and use of personal information, and provide users with the ability to access, correct, or delete personal information that we store. In addition, the FTC and other governmental authorities have made inquiries and investigations of companies' practices with respect to their users' personal information collection and dissemination practices to confirm these are consistent with stated privacy policies and to determine whether precautions are taken to secure consumers' personal information. The FTC and certain state agencies also have made inquiries, and, in a number of situations, brought actions against companies to enforce the privacy policies of these companies, including policies relating to security of consumers' personal information.
Regulatory and enforcement efforts of the FTC, a state agency, or other governmental authority could have a material adverse effect on our ability to collect demographic and personal information from users, which, in turn, could have a material adverse effect on our marketing efforts, business, financial condition, results of operations, and cash flows. In addition, the adverse publicity regarding the existence or results of an investigation could have an adverse impact on our reputation and customers' willingness to use our websites and services and thus could adversely impact our business and future revenues.
Our international businesses must also comply with applicable international data protection and privacy laws and regulations. If we or any of the third-party services on which we rely fail to transmit customer information and payment details in a secure manner, or otherwise fail to protect customer privacy in online transactions or transfer personal information without complying with certain required conditions or applicable laws, then we risk being exposed to civil and criminal liability, as well as claims from individuals alleging damages as a result of the alleged non-compliance. We may also be required to alter our data collection and use practices. These foreign laws and regulations are constantly evolving and can be subject to significant change. As a result, the application, interpretation, and
13
enforcement of these laws and regulations are often uncertain, particularly in the new and rapidly evolving industry in which we operate, and may be interpreted and applied inconsistently from country to country and inconsistently with our current policies and practices. Any of the foregoing could have a material adverse effect on our reputation, business, financial condition, results of operations, and cash flows.
Our business is subject to online security risks and a security breach or inappropriate access to, or use of, our networks, computer systems or services or those of third-party vendors could expose us to liability, claims and a loss of revenue.
Our industry is prone to cyber attacks, with third parties seeking unauthorized access to our data or members' data. The success of our business depends on the security of our networks and, in part, on the security of the network infrastructures of our third-party vendors (including vendors providing cloud computing and data storage services). In connection with conducting our business in the ordinary course, we store and transmit member information, including personally identifiable information. Unauthorized or inappropriate access to, or use of, our networks, computer systems or services (or the networks, computer systems or services of our third-party vendors), whether intentional, unintentional or as a result of criminal activity, could potentially jeopardize the security of confidential information, including credit card information, of our members and of third parties. A number of other websites have publicly disclosed breaches of their security, some of which have involved sophisticated and highly targeted attacks on portions of their sites. Because the techniques used to obtain unauthorized access, disable or degrade service, or sabotage systems change frequently and often are not recognized until launched against a target, we may be unable to anticipate these techniques or to implement adequate preventative measures. If an actual or perceived breach of our security occurs, the perception of the effectiveness of our security measures could be harmed and we could lose members or vendors. A party that is able to circumvent our security measures could misappropriate our proprietary information or the information of our members, cause interruption in our operations, or damage our computers or other devices or those of our members.
A significant number of our members authorize us to bill their payment card accounts (credit or debit) directly for all amounts charged by us. These members provide payment card information and other personally identifiable information which, depending on the particular payment plan, may be maintained to facilitate future payment card transactions. We rely on third-party and internally-developed encryption and authentication technology to provide the security and authentication to effectively secure transmission of confidential information, including payment card information. Advances in computer capabilities, new discoveries in the field of cryptography, or other developments may result in the technology used by us to protect transaction data being breached or compromised. Non-technical methods, for example, actions by an employee, can also result in a data breach. Under payment card rules and our contracts with our card processors, if there is a breach of payment card information that we store, we could be liable to the banks that issue the payment cards for their related expenses and penalties. In addition, if we fail to follow payment card industry security standards, even if there is no compromise of customer information, we could incur significant fines or lose our ability to give our members and customers the option of using payment cards. If we were unable to accept payment cards, our businesses would be seriously harmed.
We may need to expend significant resources to protect against security breaches or to address problems caused by breaches. Security breaches, including any breach related to us or the parties with which we have commercial relationships, could damage our reputation and expose us to a risk of loss, litigation and liability. We cannot assure you that the security measures we take will be effective in preventing these types of activities. We also cannot assure you that the security measures of our third-party vendors, including network providers, providers of customer and billing support services, and other vendors, will be adequate. In addition, the coverage and limits of our insurance policies may not
14
be adequate to reimburse us for losses caused by security breaches. In addition to potential legal liability, these matters may adversely impact our reputation or our revenues and may interfere with our ability to provide our services and products, all of which could adversely impact our business, financial condition, results of operations, and cash flows.
Our marketing efforts may not be successful or may become more expensive, either of which could increase our costs and adversely impact our business, financial condition, results of operations, and cash flows.
We spend significant resources marketing our brands, services, and products. We rely on relationships with a wide variety of third parties, including Internet search providers such as Google, social networking platforms such as Facebook, Internet advertising networks, co-registration partners, retailers, distributors, television advertising agencies, and direct marketers, to source new members and to promote or distribute our services and products. In addition, in connection with the launch of new services or products, we may spend a significant amount of resources on marketing. With any of our brands, services, and products, if our marketing activities are inefficient or unsuccessful, if important third-party relationships or marketing strategies, such as Internet search engine marketing and search engine optimization, become more expensive or unavailable, or are suspended, modified, or terminated, for any reason, if there is an increase in the proportion of consumers visiting our websites or purchasing our services and products by way of marketing channels with higher marketing costs as compared to channels that have lower or no associated marketing costs, or if our marketing efforts do not result in our services and products being prominently ranked in Internet search listings, our business, financial condition, results of operations, and cash flows could be materially and adversely impacted.
Our ability to operate our business could be seriously harmed if we lose members of our senior management team or other key employees or we are not able to attract, integrate and retain qualified new personnel.
Our business is largely dependent on the efforts and abilities of our senior management and other key personnel. Any of our officers or employees can terminate his or her employment relationship at any time. For example, Francis Lobo, our former President and Chief Executive Officer, Gail Shulman, our former Executive Vice President and General Counsel, and Robert J. Taragan, the former President of our Communications Segment, all departed our company in 2015. A lack of management continuity could impact our results of operations and stock price and may make recruiting for future management positions more difficult. In addition, changes in key management positions may temporarily affect our financial performance and results of operations as new management becomes familiar with our business. Furthermore, we do not carry key-person life insurance on any of our employees. The loss of any of our key officers or other employees, or our inability to attract, integrate and retain qualified employees, could require us to dedicate significant financial and other resources to such personnel matters, disrupt our operations and seriously harm our operations and business.
Significant problems with our key systems or those of our third-party vendors could have a material adverse effect on our business, financial condition, results of operations, and cash flows.
The systems underlying the operations of each of our business segments are complex and diverse, and must efficiently integrate with third-party systems, such as credit card processors. Key systems include, without limitation, billing, website and database management, customer support, telecommunications network management, advertisement serving and management systems, and internal financial systems. Some of these systems, such as customer support for our Internet access and loyalty marketing businesses are outsourced to third parties, and other systems are not redundant. In addition, some of our backup systems have never been operated as a primary system. We have experienced systems problems in the past. In addition, we or our third-party vendors may experience problems in the future. All information technology and communication systems are subject to reliability issues,
15
integration and compatibility concerns, and security-threatening intrusions. The continued and uninterrupted performance of our key systems is critical to our success. Unanticipated problems affecting these systems could cause interruptions in our services. In addition, if our third-party vendors face financial or other difficulties, our business could be adversely impacted. Any significant errors, damage, failures, interruptions, delays, or other problems with our systems, our backup systems or our third-party vendors or their systems could adversely impact our ability to satisfy our customers or operate our websites, and could have a material adverse effect on our business, financial condition, results of operations, and cash flows.
In addition, our Communications business outsources a significant portion of its live customer support functions. We rely on customer support vendors, and we maintain only a small number of internal customer support personnel for our businesses. Our internal customer support personnel are not equipped to provide the necessary range of customer support functions in the event that our vendors unexpectedly become unable or unwilling to provide these services to us. Any significant problems with our customer support vendors or our internal customer support personnel could adversely impact our ability to satisfy our customers, and could have a material adverse effect on our business, financial condition, results of operations, and cash flows.
Legal actions or investigations could subject us to substantial liability, require us to change our business practices, and adversely affect our business, financial condition, results of operations, and cash flows.
We are currently, and have been in the past, party to various legal actions and investigations. These actions may include, without limitation, claims by private parties in connection with consumer protection and other laws, claims that we infringe third-party patents, trademarks, copyrights, or other intellectual property or proprietary rights, securities laws claims, claims involving marketing practices or unfair competition, claims in connection with employment practices, breach of contract claims, and other business-related claims. The nature of our business could subject us to additional claims for similar matters, as well as a wide variety of other claims, including, without limitation, claims for defamation, right of publicity, negligence, and privacy and security matters. The failure to successfully defend against these and other types of claims, including claims relating to our business practices, could result in us incurring significant liabilities related to judgments or settlements or require us to change our business practices. Infringement claims may also result in our being required to obtain licenses from third parties, which licenses may not be available on acceptable terms, if at all. Both the cost of defending claims, as well as the effect of settlements and judgments, could cause our results of operations to fluctuate significantly from period to period and could materially and adversely affect our business, financial condition, results of operations, and cash flows. In addition, we also file actions against third parties from time to time for various reasons, including, without limitation, to protect our intellectual property rights, to enforce our contractual rights, or to make other business-related claims. The legal fees, costs, and expenses associated with these actions may be significant, and if we were to lose these actions, we may be required to pay the other party's legal fees, costs and expenses, which also may be significant and could materially and adversely affect our business, financial condition, results of operations, and cash flows.
Various governmental agencies have asserted claims, instituted legal actions, inquiries, or investigations, or imposed obligations relating to our business practices, such as our marketing, billing, customer retention, renewal, cancelation, refund, or disclosure practices, and they may continue to do so in the future. We have received civil investigative demands and subpoenas, as applicable, from the Federal Trade Commission, or the FTC, and the Attorneys General of various states, primarily regarding their respective investigations into certain former post-transaction sales practices and certain of our marketing, billing, renewal, and privacy practices and disclosures. However, the outcome of these or any other governmental investigations or their potential implications for our business are uncertain. We may not prevail in existing or future claims and any judgment against us or settlement or resolution
16
of such claims may involve the payment of significant sums, including damages, fines, penalties, or assessments, or changes to our business practices. Defending against lawsuits, inquiries, and investigations also involves significant expense and diversion of management's attention and resources from other matters.
We cannot assure you that additional governmental investigations or other legal actions will not be instituted in connection with our former post-transaction sales practices or other current or former business practices. Enforcement actions or changes in enforcement policies and procedures could result in changes to our business practices, as well as significant damages, fines, penalties, or assessments, which could decrease our revenues or increase the costs of operating our business. To the extent that our services or business practices change as a result of claims or actions by governmental agencies or private parties (including in connection with settlement agreements related to such claims), or we are required to pay significant sums, including damages, fines, penalties, or assessments, our business, financial condition, results of operations, and cash flows could be materially and adversely affected. For more information, see Note 12, "Commitments and Contingencies—Legal Matters" of the Notes to Consolidated Financial Statements included in Part II, Item 8 of this Annual Report on Form 10-K.
We may be unsuccessful at acquiring additional businesses, services or technologies. Even if we complete an acquisition, it may not improve our results of operations and may also adversely impact our business, financial condition and cash flows.
Acquisitions may not improve our results of operations and may also adversely impact our business, financial condition and cash flows.
We may evaluate a wide variety of potential strategic transactions that we believe may complement our existing businesses. However, we may not realize the anticipated benefits and synergies of an acquisition, and our attempts at integrating an acquired business may not be successful. Acquiring a business, service or technology involves many operational and financial risks, including risks relating to:
- •
- disruption of our ongoing business and significant diversion of resources and management time from day-to-day responsibilities;
- •
- acquisition financings that involve the issuance of potentially dilutive equity or the incurrence of debt;
- •
- reduction of cash and other resources available for operations and other uses;
- •
- exposure to risks specific to the acquired business, service or technology to which we are not currently exposed;
- •
- risks of entering markets in which we have little or no direct prior experience;
- •
- unforeseen obligations or liabilities, including future indemnification obligations;
- •
- difficulty assimilating the acquired customer bases, technologies and operations;
- •
- difficulty assimilating and retaining management and employees of the acquired business;
- •
- potential impairment of relationships with users, customers or vendors as a result of changes in management of the acquired business
or other factors;
- •
- large write-offs either at the time of the acquisition or in the future, the incurrence of restructuring and other exit costs, the
amortization of identifiable intangible assets, and the impairment of amounts capitalized as goodwill, intangible assets and other long-lived assets; and
- •
- lack of, or inadequate, controls, policies and procedures appropriate for a public company, and the time, cost and difficulties related to the implementation of such controls, policies and procedures or the remediation of any deficiencies.
17
In addition, an acquisition of a foreign business involves risks in addition to those set forth above, including risks associated with foreign currency exchange rates, potentially unfamiliar economic, political and regulatory environments, and integration difficulties due to language, cultural, and geographic differences. Any of these risks could harm our business, financial condition, results of operations, and cash flows.
Changes in laws and regulations and new laws and regulations may adversely affect our business, financial condition, results of operations, and cash flows.
We are subject to a variety of international, federal, state, and local laws and regulations, including, without limitation, those relating to taxation, bulk email or "spam," advertising, including, without limitation, targeted or behavioral advertising, user privacy and data protection, consumer protection, antitrust, export, and unclaimed property. Compliance with the various laws and regulations, which in many instances are unclear or unsettled, is complex. New laws and regulations, such as those being considered or recently enacted by certain states, the federal government, or international authorities related to automatic-renewal practices, spam, user privacy, targeted or behavioral advertising, and taxation, could impact our revenues or certain of our business practices or those of our advertisers. Any changes in the laws and regulations applicable to us, the enactment of any additional laws or regulations, or the failure to comply with, or increased enforcement activity by regulators of, such laws and regulations, could significantly impact our services and products, our costs, or the manner in which we or our advertisers conduct business, all of which could adversely impact our business, financial condition, results of operations, and cash flows and cause our business to suffer.
Our social networking and loyalty marketing services rely heavily on email campaigns, and any disruptions or restrictions on the sending of emails or increase in the associated costs could adversely affect our business, financial condition, results of operations, and cash flows.
Our emails have historically generated the majority of the traffic on our social networking websites and are a key driver of member activity for our loyalty marketing service. A significant number of members of our social networking and loyalty marketing services elect to opt-out of receiving certain types of emails. New laws may impact our ability to email some of our members, the types of emails we send to them or the content that we include in our emails to them. Without the ability to email these members, we have very limited means of inducing these members to return to our websites and utilize our services. In addition, each month, a significant number of email addresses for members of our social networking and loyalty marketing services become invalid. This disrupts our ability to email these members and also prevents our social networking members from being able to contact these members, which is one of the reasons why members use our services. An increase in the number of members to whom we are not able to send emails, or who elect to not receive, are unable to receive, or do not open, our emails could adversely affect our business, financial condition, results of operations, and cash flows. From time to time, Internet service providers block bulk email transmissions, classify as "spam" emails that have low opening rates, or otherwise experience technical difficulties that result in our inability to successfully deliver emails to our members. Certain email service providers, such as Google's Gmail service, segregate marketing and promotional emails from other types of emails, which may impact the effectiveness of our email campaigns. Google's Gmail service also simplifies the opt-out process by including an "unsubscribe" link at the top of each marketing email, which allows the consumer to unsubscribe from future marketing emails from the particular marketer without first being redirected to the marketer's website. Third parties may also block, impose restrictions on, or start to charge for, the delivery of emails through their email systems. Due to the importance of email to our businesses, any disruption or restriction on the distribution of emails or increase in the associated costs could materially and adversely affect our business, financial condition, results of operations, and cash flows.
18
Our intellectual property and proprietary rights are important to our businesses, and such rights may be challenged, invalidated, infringed, misappropriated or be inadequate for the conduct of our businesses. The inability to protect such rights may adversely affect our business, financial condition, results of operations, and cash flows.
Our trade names, trademarks, service marks, patents, copyrights, domain names, trade secrets, and other intellectual property are important to the success of our businesses. In particular, we view our primary trademarks as critical to our success. We principally rely upon patent, trademark, copyright, trade secret, and domain name laws in the U.S. and similar laws in other countries, as well as licenses and other agreements with our employees, members, consumers, suppliers, and other parties, to establish and maintain our intellectual property and proprietary rights in the technology, services, products, and content used in our operations. These laws and agreements may not guarantee that our proprietary rights will be protected and our intellectual property and proprietary rights could be challenged or invalidated. We have applied for the registration of, and have been issued, trademark registrations for trademarks and service marks used in our businesses in the U.S. and various foreign countries; however, there could be certain pre-existing and potentially conflicting trademark registrations held by third parties. The steps we have taken to obtain and to protect our intellectual property and proprietary rights may not be adequate, and other third parties may infringe or misappropriate our intellectual property and proprietary rights. This could have a material adverse effect on our business, financial condition, results of operations, and cash flows.
Furthermore, the validity, enforceability, and scope of protection of intellectual property in Internet-related industries are uncertain and still evolving. The protection of our intellectual property and proprietary rights may require the expenditure of significant financial and internal resources. We cannot assure you that we have taken adequate steps to prevent infringement or misappropriation of our intellectual property and proprietary rights. Our failure to adequately protect our intellectual property and proprietary rights could adversely affect our brands and could harm our business. We are also subject to the risk of claims alleging that our business practices infringe on the intellectual property rights of others. These claims could result in lengthy and costly litigation. Moreover, resolution of any such claim against us may require us or one of our subsidiaries to obtain a license to use the intellectual property rights at issue or possibly to cease using those rights altogether. Any of those events could have a material adverse effect on our business, financial condition, results of operations, and cash flows.
Fluctuations in foreign currency exchange rates could adversely affect comparisons of our operating results.
We transact business in various foreign currencies and may be exposed to market risk resulting from fluctuations in foreign currency exchange rates. Our primary currency exposures are the Euro and Indian Rupee, and to a much lesser extent, the Swedish Krona and Swiss Franc. International revenues and expenses denominated in foreign currencies translate into higher or lower revenues and expenses in U.S. Dollars as the U.S. Dollar weakens or strengthens against such other currencies. Substantially all of the revenues of our international businesses are received, and substantially all expenses are incurred, in currencies other than the U.S. Dollar, which increases or decreases the related U.S. Dollar-reported revenues and expenses depending on the fluctuations in foreign currency exchange rates. Certain of our key business metrics, such as the average monthly revenue per pay account (which we also refer to as ARPU), are similarly affected by such foreign currency exchange rate fluctuations. Changes in global economic conditions, market factors, and governmental actions, among other factors, can affect the value of these currencies in relation to the U.S. Dollar. A strengthening of the U.S. Dollar compared to these currencies and, in particular, to the Euro, has had, and in future periods could have, an adverse effect on the comparisons of our revenues and operating income against prior periods. We cannot accurately predict the impact of future foreign currency exchange rate fluctuations on our operating results, and such fluctuations could negatively impact the comparisons of such results
19
against prior periods as well as our business, financial condition, results of operations, and cash flows. We use derivative instruments, such as foreign currency forward contracts, to hedge certain exposures to fluctuations in foreign currency exchange rates. The use of such instruments may not offset any, or more than a portion, of the adverse financial effects of unfavorable movements in foreign currency exchange rates.
Foreign, state and local governments may attempt to impose additional income taxes, sales and use taxes, value added taxes or other taxes on our business activities and Internet-based transactions, including our past sales, which could decrease our ability to compete, reduce our sales, or have a material adverse effect on our business, financial condition, results of operations, and cash flows.
We are subject to income and various other taxes in the U.S. and numerous foreign jurisdictions. Significant judgment is required in evaluating our consolidated provision for income taxes. During the ordinary course of business, there are many transactions for which the ultimate tax determination is uncertain. In addition, our effective income tax rates could be adversely affected by earnings being less than anticipated in countries where we have lower statutory rates and more (or determined to be more by a particular taxing jurisdiction) than anticipated in countries where we have higher statutory rates, by changes in the valuation of our deferred tax assets and liabilities, by increases in the applicable tax rates, or by, among other factors, changes in the relevant tax, accounting and other laws, regulations, principles, and interpretations. We are under audit and subject to audit in various jurisdictions, and such jurisdictions may assess additional income and other taxes against us. Any audit which, if finally determined in an unfavorable manner, could result in a significant liability. Although we believe our tax estimates are reasonable, the final determination of tax audits and any related litigation could be materially different from our historical income tax provisions, and our historical recognition of other tax matters. The results of an audit or litigation could have a material adverse effect on our business, financial condition, results of operations, and cash flows.
In connection with our Internet-based transactions, a number of states, including California, have adopted or have been considering legislation or policy initiatives, including those that would facilitate a finding of nexus to exist between Internet companies and the states, aimed at expanding the reach of sales and use taxes or imposing state income or other taxes on various innovative theories, including agency attribution from independent third-party service providers. Such legislation or initiatives could result in the imposition of additional sales and use taxes, or the payment of state income or other taxes, on certain transactions conducted over the Internet. Our costs may increase as a result of our activities related to advertisers and other third parties, and advertisers and other third parties may choose to not do business with us or limit their business activities, in order to avoid nexus with certain states. If such legislation is enacted, or such initiatives are instituted, and unless overturned by the courts, the legislation or initiatives could subject us to substantially increased tax liabilities for past and future sales or state income or other taxes, require us to collect additional sales and use taxes, cause our future sales to decrease, or otherwise negatively impact our business, financial condition, results of operations, and cash flows, and thus have a material adverse effect on us.
Our certificate of incorporation, our bylaws, and Delaware law contain provisions that could delay or discourage takeover attempts that stockholders may consider favorable or beneficial.
Certain provisions of our certificate of incorporation, our bylaws, and Delaware law limit the ability of our stockholders to elect directors and take other corporate actions. These provisions could have the effect of delaying or discouraging takeover attempts that our stockholders may consider favorable or beneficial because of the premium price that would be offered by a potential acquirer. In addition, although our previous stockholder rights plan expired in 2011, we cannot assure you that our Board of Directors will not implement a new stockholder rights plan in the future.
20
Our business could be negatively affected as a result of actions of activist stockholders.
The actions of activist stockholders could adversely affect our business. Specifically:
- •
- responding to common actions of an activist stockholder, such as public proposals and requests for special meetings, potential
nominations of candidates for election to our board of directors, requests to pursue a strategic combination or other transaction or other special requests, could disrupt our operations, be costly and
time-consuming or divert the attention of our management and employees;
- •
- perceived uncertainties as to our future direction in relation to the actions of an activist stockholder may result in the loss of
potential business opportunities or the perception that we are unstable and need to make changes, which may be exploited by our competitors and make it more difficult to attract and retain key
personnel as well as consumers and service providers; and
- •
- actions of an activist stockholder may cause fluctuations in our stock price based on speculative market perceptions or other factors that do not necessarily reflect the underlying fundamentals and prospects of our business.
We may not realize the benefits associated with our assets and may be required to record a significant charge to earnings if we are required to expense certain costs or impair our assets.
We have capitalized goodwill and identifiable intangible assets in connection with our acquisitions and certain business initiatives. We perform an impairment test of our goodwill annually during the fourth quarter of our fiscal year or when events occur or circumstances change that would more likely than not indicate that goodwill or any such assets might be permanently impaired. If our acquisitions or business initiatives are not commercially successful or, if due to economic or other conditions, our assumptions regarding the performance of our businesses or business initiatives are not achieved, we would likely be required to record impairment charges which would negatively impact our financial condition and results of operations. We have experienced impairment charges in the past. Given the current economic and competitive environment and the uncertainties regarding the impact on our businesses, we cannot assure you that our estimates and assumptions regarding the duration of the challenging economic conditions, or the period or strength of recovery, made for purposes of our goodwill and identifiable intangible assets impairment testing will prove to be accurate predictions of the future. If our assumptions regarding forecasted revenues or growth rates of certain reporting units or other factors are not achieved or are revised downward, we may be required to record additional impairment charges in future periods. If our operating segments change in the future, such change may result in changes to our reporting units for impairment testing purposes, which may result in additional impairment charges. In addition, from time to time, we record tangible or intangible assets on our balance sheet that, due to changes in value or in our strategy, may have to be expensed in future periods. Write-downs or impairments of assets, whether tangible or intangible, could adversely and materially impact our financial condition and results of operations.
We face risks relating to operating and doing business internationally that could adversely affect our businesses and results of operations.
Our businesses operate in a number of countries outside the U.S. Conducting international operations involves risks and uncertainties, including:
- •
- adverse fluctuations in foreign currency exchange rates;
- •
- potentially adverse tax consequences, including the complexities of foreign value added taxes and restrictions on the repatriation of earnings;
21
- •
- increased financial accounting, tax, and reporting burdens and complexities;
- •
- lack of familiarity with, and unexpected changes in, foreign regulatory requirements;
- •
- difficulties in managing and staffing international operations;
- •
- the burdens of complying with a wide variety of foreign laws, regulations, and legal and regulatory standards;
- •
- political, social, and economic instability abroad, terrorist attacks, and security concerns in general; and
- •
- reduced or varied protection for intellectual property and proprietary rights.
The occurrence of any one of these risks could negatively affect our international operations, which could adversely affect our business, financial condition, results of operations, and cash flows.
Our stock price has been highly volatile and may continue to be volatile.
The market price of our common stock has fluctuated significantly and it may continue to be volatile with extreme trading volume fluctuations. The market price of our common stock may be influenced by many factors, including the risks and uncertainties set forth in this report, many of which are outside of our control. In January 2014, we announced that our Board of Directors has determined to discontinue cash dividend payments. Immediately following such announcement, the market price of our common stock declined significantly and has remained volatile. Furthermore, the market price of our common stock may fluctuate significantly based on announcements or actions by stockholder activists and to the extent we are added to or removed from certain stock market indices. Stocks of other companies traded on the Nasdaq Global Select Market have also experienced substantial price and trading volume fluctuations. The broad market and industry factors that influence or affect such fluctuations may harm the market price of our common stock, regardless of our actual operating performance. As a result of these or other reasons, we have experienced and may continue to experience significant volatility in the market price of our common stock.
Our businesses could be shut down or severely impacted by a catastrophic event.
Our businesses could be materially and adversely affected by a catastrophic event. A disaster such as a fire, earthquake, flood, power loss, terrorism, or other similar event, affecting any of our facilities, data centers or computer systems, or those of our third-party vendors, or a system interruption or delay that slows down the Internet or makes the Internet or our websites temporarily unavailable, could result in a significant and extended disruption of our operations and services. Any prolonged disruption of our services due to these or other events would severely impact our businesses. The property, business interruption, and other insurance we carry may not be sufficient to cover, if at all, losses that may occur as a result of any events which cause interruptions in our services.
We cannot predict our future capital needs and we may not be able to secure additional financing, which could adversely impact us.
We may need to raise additional funds in the future to fund our operations, for acquisitions of businesses, services or technologies, or for other purposes. Additional financing may not be available in a timely manner, on terms favorable to us, or at all. The current volatility of, and disruption in, the securities and credit markets may restrict our ability to raise any such additional funds. If adequate funds are not available or not available when required and in sufficient amounts or on acceptable terms, our businesses and future prospects may suffer.
22
Divestitures or other dispositions could negatively impact our business.
On an ongoing basis, we assess opportunities for improved operational effectiveness and efficiency and may divest, spin-off, split-off, or otherwise dispose of businesses that are deemed not to fit with our strategic plan or are not achieving the desired return on investment. For example, we completed the spin-off of FTD in November 2013 and sold our Classmates domestic business unit in August 2015. These transactions pose risks and challenges that could negatively impact our business. For example, when we decide to sell or otherwise dispose of a business or assets, the sale is typically subject to satisfaction of pre-closing conditions which may not become satisfied. In addition, divestitures or other dispositions may dilute our earnings per share, have other adverse financial and accounting impacts, distract management, disrupt our business, negatively impact market perception of our prospects and involve the loss of key employees, and disputes may arise with buyers. In addition, we have retained responsibility for and/or have agreed to indemnify buyers against some known and unknown contingent liabilities related to a number of businesses we have sold or disposed, which could have a material effect on our financial statements. In addition, divestitures may result in significant asset impairment charges, including those related to goodwill and other intangible assets, which could have a material adverse effect on our financial condition and results of operations. We cannot assure you that divestiture or other disposition efforts will be successful in generating improved operating efficiencies. In addition, past disposition activities may not be a good indication of future disposition opportunities, and any divestiture or other disposition of any business may leave us with reduced financial and marketing resources to develop products and services to compete against our competitors.
There are a number of risks associated with our sale of Classmates and they may have a material and adverse impact on our business, financial condition, results of operations, and cash flows.
On August 11, 2015, we completed the sale of our Classmates business unit. There are a number of risks associated with the sale of the Classmates domestic business unit, including, without limitation, the following:
- •
- we are smaller and less diversified as compared to immediately prior to the consummation of the sale of the Classmates domestic
business unit. This could cause our cash flow and growth prospects to be more volatile and make us more vulnerable to focused competition;
- •
- the sale of the Classmates domestic business unit reduces revenues, operating income and cash flows. With this reduction in revenues
and cash flows, the sale could also have an adverse effect on our results of operations and financial position; and
- •
- we agreed to indemnify the purchaser for certain liabilities, and have retained responsibility for certain legal proceedings relating to the Classmates domestic business unit. Certain indemnities that we provided to the purchaser are not subject to any limits on the aggregate amount of the liability, may be significant and could negatively impact our business.
Any of the foregoing, in addition to any other risks related to the transaction that are not specifically described above, could materially and adversely affect our business, financial condition, results of operations, and cash flows.
ADDITIONAL RISKS RELATING TO OUR COMMUNICATIONS SEGMENT
We compete against much larger companies, many of whom have significantly more financial and marketing resources than we do, and our business will suffer if we are unable to compete successfully.
We compete with numerous providers of broadband, mobile broadband and DSL services, as well as other dial-up Internet access providers, many of whom are much larger and have significantly more financial and marketing resources. Our principal competitors for our mobile broadband and DSL services include, among others, local exchange carriers, wireless and satellite service providers, and
23
cable service providers. These competitors include established providers such as AT&T, Verizon, Sprint, and T-Mobile. Our principal dial-up Internet access competitors include established online service and content providers, such as AOL and MSN, and independent national Internet service providers, such as EarthLink and its PeoplePC subsidiary. Dial-up Internet access services do not compete favorably with broadband services with respect to connection speed and do not have a significant, if any, price advantage over certain broadband services. Many broadband providers, including cable companies and local exchange carriers, bundle their offerings with telephone, entertainment or other services, which may result in lower prices than standalone services. In addition, there are a number of mobile virtual network operators, some of which focus on pricing as their main selling point. Certain portions of the U.S., primarily rural areas, currently have limited or no access to broadband services. However, the U.S. government has indicated its intention to facilitate the provision of broadband services to such areas. Such expansion of the availability of broadband services will increase the competition for Internet access subscribers in such areas and will likely adversely affect our business. In addition to competition from broadband, mobile broadband, and DSL providers, competition among dial-up Internet access service providers is intense and neither our pricing nor our features provides us with a significant competitive advantage, if any, over certain of our dial-up Internet access competitors. We expect that competition, particularly with respect to price, for broadband, mobile broadband, and DSL services, as well as dial-up Internet access services, will continue and may materially and adversely impact our business, financial condition, results of operations, and cash flows.
Our dial-up and DSL pay accounts may decline faster than expected and adversely impact our Communications business.
A significant portion of our Communications segment revenues and profits come from our dial-up Internet and DSL access services and related services and advertising revenues. Our dial-up and DSL Internet access pay accounts and revenues have been declining and are expected to continue to decline due to the continued maturation of the market for dial-up and DSL Internet access. Consumers continue to migrate to broadband access, primarily due to the faster connection and download speeds provided by broadband access. Advanced applications such as online gaming, music downloads, and videos require greater bandwidth for optimal performance, which adds to the demand for broadband access. The pricing for basic broadband services has been declining as well, making it a more viable option for consumers. In addition, the popularity of accessing the Internet through tablets and mobile devices has been growing and may accelerate the migration of consumers away from dial-up Internet access. The number of dial-up Internet access pay accounts has been adversely impacted by both a decrease in the number of new pay accounts signing up for our services, as well as the impact of subscribers canceling their accounts, which we refer to as "churn." Churn has increased from time to time and may increase in the future. We also experience an increase in the percentage of credit card failures from time to time. For example, a large-scale security breach at a retailer may result in the cancelation and re-issuance of the affected credit cards by the issuing banks, which would impact our ability to charge our members on their old credit cards and if our members do not update their credit card information with us, their accounts will terminate. Any change in the degree of credit card failures could have a material impact on our churn rate. If we experience a higher than expected level of churn, it will make it more difficult for us to increase or maintain the number of pay accounts, which could adversely affect our business, financial condition, results of operations, and cash flows.
We expect our dial-up and DSL Internet access pay accounts to continue to decline. As a result, Communications services revenues and the profitability of this segment may decline. The rate of decline in Communications services revenues has accelerated in some periods and may continue to accelerate.
Although we have reduced our expenses in order to manage the profitability of our Communications segment, we will not be able to continue making the same level of expense reductions
24
in the future. Continued declines in Communications revenues, particularly if such declines accelerate, will materially and adversely impact the profitability of this segment.
Failure to increase or maintain the number of subscribers for our Communications services could have a negative impact on advertising revenues and profitability.
Our Communications services generate advertising revenues from search placements, display advertisements and online market research associated with our Internet access and email services. The success of our Communications services, including our ability to generate advertising revenues for our services, depends in part upon our ability to increase or maintain the number of subscribers for our services. A decline in the number of subscribers using our services could result in decreased advertising revenues, and decreases in our advertising revenues would adversely impact our profitability. The failure to increase or maintain the number of subscribers for our Communications services could have a material adverse effect on our advertising revenues and profitability.
Our mobile broadband service may not be commercially successful.
We started offering a mobile broadband service in March 2012. However, this service may not be accepted by consumers or commercially successful. We have been testing various marketing initiatives, including offering discounts on our devices, but we cannot assure you that such initiatives will increase the number of accounts. The free version of the mobile broadband service is limited to a set term and these accounts are automatically terminated upon the expiration of such service term if they do not upgrade to one of the paid subscription plans. We cannot assure you that we will be successful in upgrading these accounts before they terminate. Some of our competitors have longer operating histories, greater name and brand recognition, larger user bases, wider coverage areas, and significantly greater financial, technical, sales, and marketing resources than we do. If our mobile broadband service fails to be commercially successful, such failure could materially and adversely impact our business, financial condition, results of operations, and cash flows.
Our Internet access business is dependent on the availability of telecommunications services and compatibility with third-party systems and products.
Our Internet access business substantially depends on the availability, capacity, affordability, reliability, and security of our telecommunications networks. Only a limited number of telecommunications providers offer the network and data services we currently require, and we purchase most of our telecommunications services from a few providers. Some of our telecommunications services are provided pursuant to short-term agreements that the providers can terminate or elect not to renew. In addition, some telecommunications providers may cease to offer network services for certain less populated areas, which would reduce the number of providers from which we may purchase services and may entirely eliminate our ability to purchase services for certain areas. Currently, our mobile broadband service is entirely dependent upon services acquired from one service provider, and the devices required by the provider can be used for only such provider's service. If we are unable to maintain, renew or obtain a new agreement with the telecommunications provider on acceptable terms, or the provider discontinues its services, our business, financial condition, results of operations, and cash flows could be materially and adversely affected. Sprint, which owns Clearwire, ceased using WiMAX technology on the Clearwire network. This affected our mobile broadband subscribers that utilized the Clearwire network.
Our dial-up Internet access services also rely on their compatibility with other third-party systems, products and features, including operating systems. Incompatibility with third-party systems and products could adversely affect our ability to deliver our services or a user's ability to access our services and could also adversely impact the distribution channels for our services. Our dial-up Internet access services are dependent on dial-up modems and an increasing number of computer
25
manufacturers, including certain manufacturers with whom we have distribution relationships, do not pre-load their new computers with dial-up modems, requiring the user to separately acquire a modem to access our services. We cannot assure you that, as the dial-up Internet access market declines and new technologies emerge, we will be able to continue to effectively distribute and deliver our services.
ADDITIONAL RISKS RELATING TO OUR COMMERCE & LOYALTY AND SOCIAL MEDIA SEGMENTS
We face intense competition that could result in the failure of our social networking services and loyalty marketing service to be commercially successful.
As consumers continue to spend more time and money online, the competition for their time and engagement has continued to intensify. Consumers have a great number of options for online content and entertainment, including, by way of example, games, websites offering news and current events, movies, television shows, videos, information about any and virtually every topic, and the opportunity to communicate, socialize, and interact with acquaintances and others. Certain aspects of our social networking services compete with major social networking platforms, such as Facebook, as well as Internet search engines such as Google. Many of our competitors offer their content and services free of charge.
The market for loyalty marketing services is highly competitive, and we expect competition to significantly increase in the future as loyalty marketing programs continue to grow in popularity and expand to mobile platforms. Our MyPoints loyalty marketing service faces competition for members from other loyalty marketing programs, such as Ebates, as well as offline loyalty marketing programs that have a significant online presence, such as those operated by credit card, airline, and hotel companies. In addition, we also face competition for members from online providers of discounted offerings and coupons, such as Groupon and LivingSocial.
Some of our competitors have longer operating histories, greater name and brand recognition, larger user bases, significantly greater financial, technical, sales, and marketing resources, and engage in more extensive research and development than we do. Some of our competitors also have lower customer acquisition costs than we do, offer a wider variety of services, have more compelling websites with more extensive user-generated or third-party content, or offer their services or content free to their users. Some of our competitors have been more successful than we have been in attracting and retaining visitors and members, and our ability to attract visitors to our websites and maintain a large and growing member base has been adversely affected by such competition. In particular, Facebook's membership base currently far exceeds that of any of its competitors. If our competitors provide services similar to our social networking services for free, we may not be able to charge for our social networking services or we may need to reduce our membership fees. We rely on some of our competitors, such as Facebook, to promote our services and for new member acquisitions. Any changes to such competitors' rules or policies or any other changes implemented by such competitor could adversely affect our business or our strategies. Competition has adversely affected our subscription revenues from social networking services, as well as our advertising revenues from our social networking services and loyalty marketing service. More intense competition could also require us to increase our marketing or other expenditures. As a result of competition, our business, financial condition, results of operations, and cash flows have been, and may continue to be, adversely affected.
Continued declines in the number of pay accounts for our social networking services and our ability to accurately project the decline could cause our business, financial condition, results of operations, and cash flows to suffer.
Pay accounts are critical to our business model. Only a small percentage of users visiting our websites or initially registering for our social networking services sign up for a paid subscription at the
26
time of registration. As a result, our ability to generate subscription revenues is highly dependent on our ability to attract visitors to our websites, register them as free members, encourage them to return to our websites, and convince them to become pay accounts in order to access the pay features of our websites. In addition, changes to our registration or renewal processes, such as the changes required for our international social networking services to implement the Single Euro Payments Area (or SEPA) initiative, could adversely affect our churn rate.
A number of our pay account subscriptions each month are not renewed or are canceled, which we refer to as "churn." The level of churn we experience fluctuates from quarter to quarter due to a variety of factors, including our mix of subscription terms, which affects the timing of subscription expirations, as well as the degree of credit card failures. To maintain or reduce the level of churn, we must continually add new pay accounts both to replace pay accounts who churn and to grow our business beyond our current pay account base. We expect that our churn rate will continue to fluctuate from period to period. A significant majority of our pay accounts are on plans that automatically renew at the end of their subscription period and we have received complaints with respect to our renewal policies and practices. Any change in our renewal policies or practices, or in the degree of credit card failures, could have a material impact on our churn rate. If we experience a higher than expected level of churn, it will make it more difficult for us to increase or maintain the number of pay accounts, which could reduce our revenues and adversely affect our business, financial condition, results of operations, and cash flows.
Our pay accounts and free active accounts have been decreasing, and we anticipate that Social Media pay accounts and revenues will continue to decline year over year, at least in the near term. If we are not able to attract visitors to our websites and convert a significant portion to pay accounts, the number of pay accounts for our social networking services and related advertising revenues will continue to decline and the business, financial condition, results of operations, and cash flows of our Social Media segment will be adversely affected.
Failure to increase or maintain the number of visitors to our websites and members for our loyalty marketing services or the activity level of these visitors and members could cause our business and financial results to suffer.
The success of our loyalty marketing services depends upon our ability to increase or maintain the number of visitors to our websites, our base of members, and the level of activity of those visitors and members. A decline in the number of visitors or members, or a decline in the activity of those members, could result in decreased advertising revenues. We have experienced a decline in our number of active members. The failure to increase or maintain the number of visitors to our websites, our base of members, or the failure to convince our members to actively participate in our websites or services, could have a material adverse effect on our business, financial condition, results of operations, and cash flows.
Failure to maintain our standard pricing could have adverse effects on our financial results.
For competitive and other reasons, we have been offering discounted pricing plans on a promotional basis. In general, these discounted pricing plans offer a subscription term at a significant discount compared to the standard pricing for such subscription term. Any increases in the percentage of pay accounts under a discounted pricing plan and any increases in the level of the discounts will likely result in a decrease in subscription revenues and ARPU, in particular, if such increases continue. Although these discounted pricing plans, by their terms, renew at the then-current standard pricing for such subscription term upon the expiration of the initial term, we cannot determine the number of pay accounts that will renew at the then-current standard pricing or at all. Our continued use of discounted pricing plans may result in our becoming dependent on offering such plans in order to obtain new pay
27
accounts and retain existing pay accounts and may result in our having to reduce our standard pricing, which would adversely impact our financial results.
RISKS RELATING TO THE FTD SPIN-OFF TRANSACTION
If the FTD Spin-Off Transaction were to fail to qualify as a tax-free transaction for U.S. federal income tax purposes, then the FTD Spin-Off Transaction could result in significant tax liabilities.
United Online, Inc. received a private letter ruling from the IRS, substantially to the effect that, for U.S. federal income tax purposes, the FTD Spin-Off Transaction qualifies as a tax-free transaction for U.S. federal income tax purposes under Section 355 of the Internal Revenue Code of 1986, as amended. In addition, prior to the consummation of the FTD Spin-Off Transaction, United Online, Inc. received a legal opinion, substantially to the effect that the FTD Spin-Off Transaction so qualifies. The IRS ruling and the tax opinion rely on certain facts, assumptions and undertakings, and certain representations from United Online, Inc. and FTD, regarding the past and future conduct of both respective businesses and other matters, and the tax opinion relies on the IRS ruling. Notwithstanding the IRS ruling and the tax opinion, the IRS could determine that the FTD Spin-Off Transaction should be treated as a taxable transaction if it determines that any of these facts, assumptions, representations, or undertakings is not correct, or that the FTD Spin-Off Transaction should be taxable for other reasons, including if the IRS were to disagree with the conclusions in the tax opinion that are not covered by the IRS ruling.
If the FTD Spin-Off Transaction ultimately is determined to be taxable, then a stockholder of United Online, Inc. that received shares of FTD common stock in the FTD Spin-Off Transaction would be treated as having received a distribution of property in an amount equal to the fair market value of such shares on the distribution date and could incur significant income tax liabilities. Such distribution would be taxable to such stockholder as a dividend to the extent of United Online's current and accumulated earnings and profits. Any amount that exceeded United Online's earnings and profits would be treated first as a non-taxable return of capital to the extent of such stockholder's tax basis in its shares of United Online, Inc. stock with any remaining amount being taxed as a capital gain. In addition, United Online would recognize a taxable gain in an amount equal to the excess, if any, of the fair market value of the shares of common stock of FTD held by United Online, Inc. on the distribution date over United Online, Inc.'s tax basis in such shares.
In connection with the FTD Spin-Off Transaction, FTD indemnified us for certain liabilities and we indemnified FTD for certain liabilities. This indemnity may not be sufficient to insure us against the full amount of the liabilities assumed by FTD and FTD may be unable to satisfy its indemnification obligations to us in the future.
Pursuant to the Separation and Distribution Agreement and certain other agreements with FTD, FTD agreed to indemnify us for certain liabilities, and we agreed to indemnify FTD for certain liabilities, in certain cases, for unlimited amounts. We cannot assure you that the indemnity from FTD will be sufficient to protect us against the full amount of such liabilities, or that FTD will be able to fully satisfy its indemnification obligations. Third-parties could also seek to hold us responsible for any of the liabilities that FTD has agreed to assume. Even if we ultimately succeed in recovering from FTD any amounts for which we are held liable, we may be temporarily required to bear these losses ourselves. In addition, certain indemnities that we may be required to provide to FTD are not subject to any limits on the aggregate amount of the liability, may be significant and could negatively impact our business. Each of these risks could negatively affect our business, financial condition, results of operations, and cash flows.
28
ITEM 1B. UNRESOLVED STAFF COMMENTS
None.
Our corporate headquarters, which includes space for the Communications segment, is located in Woodland Hills, California and consists of leased space of approximately 30,000 square feet. Our Communications segment leases office space in Fort Lee, New Jersey; our Commerce & Loyalty segment leases office space in San Francisco, California and Schaumburg, Illinois; and our Social Media segment leases office space in Erlangen, Germany and Berlin, Germany. We also lease office space in Hyderabad, India, which is used to provide services to our segments.
We believe that our existing facilities are adequate to meet our current requirements and that suitable additional or substitute space will be available, as needed, to accommodate any physical expansion of our corporate and operational facilities. For additional information regarding our obligations under leases, see Note 12, "Commitments and Contingencies—Leases" of the Notes to Consolidated Financial Statements, which appears in Part II, Item 8 of this Annual Report on Form 10-K.
For a description of our material pending legal proceedings, please refer to Note 12, "Commitments and Contingencies—Legal Matters" of the Notes to the Consolidated Financial Statements included in Part II, Item 8 of this Annual Report on Form 10-K.
ITEM 4. MINE SAFETY DISCLOSURES
Not applicable.
29
ITEM 5. MARKET FOR REGISTRANT'S COMMON EQUITY, RELATED STOCKHOLDER MATTERS AND ISSUER PURCHASES OF EQUITY SECURITIES
Our common stock has been quoted on The Nasdaq Global Select Market ("NASDAQ") under the symbol "UNTD" since September 26, 2001. Prior to that, NetZero common stock had been quoted on NASDAQ under the symbol "NZRO" since September 23, 1999. The following table sets forth, for the quarters indicated, the high and low sales prices per share of our common stock as reported on NASDAQ:
| |
2014 | 2015 | |||||||||||
|---|---|---|---|---|---|---|---|---|---|---|---|---|---|
| |
High | Low | High | Low | |||||||||
First Quarter |
$ | 15.88 | $ | 9.20 | $ | 18.15 | $ | 13.13 | |||||
Second Quarter |
$ | 12.44 | $ | 9.59 | $ | 18.00 | $ | 15.00 | |||||
Third Quarter |
$ | 13.17 | $ | 9.38 | $ | 16.32 | $ | 9.69 | |||||
Fourth Quarter |
$ | 15.00 | $ | 10.27 | $ | 12.29 | $ | 9.50 | |||||
At February 26, 2016, there were 177 holders of record of our common stock.
Dividends
United Online, Inc.'s Board of Directors declared quarterly cash dividends of $0.70 per share of common stock, as adjusted to reflect the one-for-seven reverse stock split, in January, April and July 2013. The dividends were paid on February 28, May 31 and August 30, 2013 and totaled $9.4 million, $9.7 million and $9.7 million, respectively, including dividend equivalents paid on nonvested restricted stock units. In November 2013, United Online, Inc.'s Board of Directors declared a quarterly cash dividend of $0.15 per share of common stock. The dividends were paid on November 29, 2013 and totaled $2.2 million, including dividend equivalents paid on nonvested restricted stock units.
In January 2014, we announced that United Online, Inc.'s Board of Directors determined to discontinue cash dividend payments in order to provide financial flexibility to support anticipated long-term growth initiatives. We currently intend to retain any future earnings for use in the operation of our business and, as a result, do not intend to declare or pay any cash dividends in the foreseeable future. Any further determination to pay dividends on our capital stock will be at the discretion of our Board of Directors, subject to applicable laws, and will depend on our financial condition, results of operations, capital requirements, general business conditions and other factors that our Board of Directors considers relevant.
Common Stock Repurchases
In May 2001, the Company's Board of Directors authorized a common stock repurchase program (the "Program") that allows the Company to repurchase shares of its common stock through open market or privately negotiated transactions based on prevailing market conditions and other factors. From time to time since then, the Board of Directors has increased the amount authorized for repurchase under this Program and has extended the Program, which was recently extended by the Board of Directors (in December 2015) through December 31, 2018. From August 2001 through December 2014, the Company had repurchased $150.2 million of its common stock under the Program. There were no repurchases under the Program during the year ended December 31, 2015 and, at December 31, 2015, the authorization remaining under the Program was $80.0 million.
Shares withheld upon the vesting of restricted stock units and upon the issuance of stock awards to pay minimum statutory employee withholding taxes are considered common stock repurchases, but are not counted as purchases against the Program. Upon vesting of most restricted stock units or issuance
30
of stock awards, we currently do not collect the minimum statutory withholding taxes from employees. Instead, we automatically withhold, from the restricted stock units that vest and from the stock awards that are issued, the portion of those shares with a fair market value equal to the amount of the minimum statutory employee withholding taxes due, which is accounted for as a repurchase of common stock. We then pay the minimum statutory employee withholding taxes in cash.
Common stock repurchases during the quarter ended December 31, 2015 were as follows (in thousands, except per share amounts):
Period
|
Total Number of Shares Purchased |
Average Price Paid per Share |
Total Number of Shares Purchased as Part of a Publicly Announced Program |
Maximum Approximate Dollar Value that May Yet be Purchased Under the Program |
|||||||||
|---|---|---|---|---|---|---|---|---|---|---|---|---|---|
October 1 – October 31, 2015 |
— | $ | — | — | $ | 80,000 | |||||||
November 1 – November 30, 2015 |
24 | $ | 10.73 | — | $ | 80,000 | |||||||
December 1 – December 31, 2015 |
— | $ | — | — | $ | 80,000 | |||||||
Performance Graph
This performance graph shall not be deemed "filed" for purposes of Section 18 of the Securities Exchange Act of 1934, as amended (the "Exchange Act"), or otherwise subject to the liabilities under that Section and shall not be deemed to be incorporated by reference into any filing of United Online, Inc. under the Securities Act of 1933, as amended, or the Exchange Act.
The following graph compares, for the five-year period ended December 31, 2015, the cumulative total stockholder return for the Company's common stock, The Nasdaq Composite Index (the "Nasdaq Composite") and the First Trust DJ Internet Index Fund ("FDN"). Measurement points are the last trading day of each of the Company's fiscal years ended December 31, 2010, 2011, 2012, 2013, 2014, and 2015. The graph assumes that $100 was invested on December 31, 2010 in the common stock of United Online, Inc., the Nasdaq Composite and the FDN and assumes reinvestment of any dividends.
31
The stock price performance on the following graph is not necessarily indicative of future stock price performance.
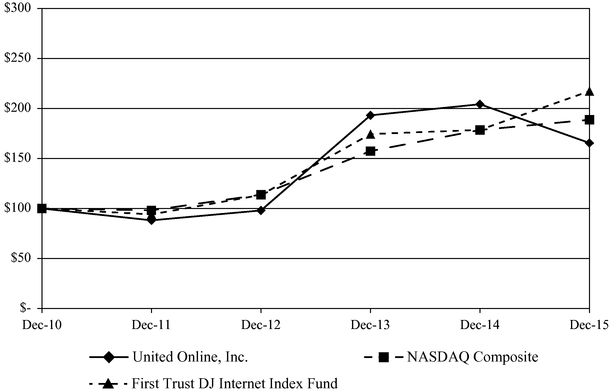
| |
Dec-10 | Dec-11 | Dec-12 | Dec-13 | Dec-14 | Dec-15 | |||||||||||||
|---|---|---|---|---|---|---|---|---|---|---|---|---|---|---|---|---|---|---|---|
United Online, Inc. |
$ | 100.00 | $ | 88.17 | $ | 98.06 | $ | 193.19 | $ | 204.28 | $ | 165.53 | |||||||
Nasdaq Composite |
$ | 100.00 | $ | 98.20 | $ | 113.82 | $ | 157.44 | $ | 178.53 | $ | 188.75 | |||||||
First Trust DJ Internet Index Fund |
$ | 100.00 | $ | 94.11 | $ | 113.55 | $ | 174.42 | $ | 178.67 | $ | 217.40 | |||||||
32
ITEM 6. SELECTED FINANCIAL DATA
The following selected consolidated financial data should be read in conjunction with our consolidated financial statements and related notes and Management's Discussion and Analysis of Financial Condition and Results of Operations included elsewhere in this Annual Report on Form 10-K.
The following table presents the consolidated statements of operations data for the years ended December 31, 2015, 2014 and 2013, and the consolidated balance sheet data at December 31, 2015 and 2014. Such financial data are derived from our audited consolidated financial statements included elsewhere in this Annual Report on Form 10-K. The table also presents the consolidated statements of operations data for the years ended December 31, 2012 and 2011 and the consolidated balance sheet data at December 31, 2013, 2012 and 2011, which have been derived from our consolidated financial statements, as recast for discontinued operations, that are not included in this Annual Report on Form 10-K.
The following amounts are in thousands, except per share data:
| |
Year Ended December 31, | |||||||||||||||
|---|---|---|---|---|---|---|---|---|---|---|---|---|---|---|---|---|
| |
2015(1) | 2014 | 2013(2)(3)(4) | 2012(5) | 2011 | |||||||||||
Consolidated Statements of Operations Data: |
||||||||||||||||
Revenues |
$ | 151,118 | $ | 165,719 | $ | 177,131 | $ | 191,394 | $ | 222,604 | ||||||
Cost of revenues |
$ | 62,806 | $ | 61,101 | $ | 62,035 | $ | 63,380 | $ | 59,464 | ||||||
Operating income (loss) |
$ | 7,086 | $ | 3,506 | $ | (39,582 | ) | $ | (9,826 | ) | $ | 39,808 | ||||
Income (loss) from continuing operations |
$ | 4,507 | $ | 3,558 | $ | (85,716 | ) | $ | (11,783 | ) | $ | 31,519 | ||||
Income (loss) from discontinued operations, net of tax |
$ | 25,466 | $ | (8,987 | ) | $ | (2,559 | ) | $ | 23,999 | $ | 21,280 | ||||
Net income (loss) |
$ | 29,973 | $ | (5,429 | ) | $ | (88,275 | ) | $ | 12,216 | $ | 52,799 | ||||
Net income (loss) attributable to common stockholders |
$ | 28,811 | $ | (5,089 | ) | $ | (89,470 | ) | $ | 10,991 | $ | 50,760 | ||||
Income (loss) from continuing operations per common share—basic |
$ | 0.23 | $ | 0.28 | $ | (6.55 | ) | $ | (1.01 | ) | $ | 2.33 | ||||
Income (loss) from continuing operations per common share—diluted |
$ | 0.23 | $ | 0.28 | $ | (6.55 | ) | $ | (1.01 | ) | $ | 2.33 | ||||
Net income (loss) per common share—basic |
$ | 1.96 | $ | (0.36 | ) | $ | (6.75 | ) | $ | 0.85 | $ | 4.02 | ||||
Net income (loss) per common share—diluted |
$ | 1.96 | $ | (0.36 | ) | $ | (6.75 | ) | $ | 0.85 | $ | 4.01 | ||||
| |
December 31, | |||||||||||||||
|---|---|---|---|---|---|---|---|---|---|---|---|---|---|---|---|---|
| |
2015(1) | 2014 | 2013(2)(3)(4) | 2012(5) | 2011 | |||||||||||
Consolidated Balance Sheet Data: |
||||||||||||||||
Total assets |
$ | 198,210 | $ | 208,595 | $ | 213,258 | $ | 1,010,068 | $ | 1,041,631 | ||||||
Non-current liabilities |
$ | 21,666 | $ | 23,101 | $ | 27,818 | $ | 334,051 | $ | 367,296 | ||||||
Cash dividends declared and paid per common share |
$ | — | $ | — | $ | 2.25 | $ | 2.80 | $ | 2.80 | ||||||
- (1)
- On August 11, 2015, we completed the sale of all of the stock of our wholly-owned subsidiary, Classmates, Inc. to Intelius Holdings, Inc. Accordingly, the results of operations, financial condition and cash flows of the Classmates domestic business unit have been presented as discontinued operations for all periods presented.
33
- (2)
- During
the year ended December 31, 2013, we recorded a valuation allowance against our deferred tax assets totaling $37.5 million.
- (3)
- On
November 1, 2013, we consummated the FTD Spin-Off Transaction, a tax-free distribution of all FTD Companies, Inc. common stock held by
United Online, Inc. to United Online, Inc.'s stockholders. Immediately prior to the FTD Spin-Off Transaction, we implemented a one-for-seven reverse stock split of shares of United
Online, Inc. common stock. Accordingly, the results of operations and financial condition of FTD Companies, Inc. have been presented as discontinued operations for all periods presented.
Further, all common stock share information and related per share amounts have been adjusted to reflect the one-for-seven reverse stock split.
- (4)
- During
the year ended December 31, 2013, we recorded a goodwill asset impairment charge totaling $37.8 million related to our Social Media
reporting unit.
- (5)
- During the year ended December 31, 2012, we recorded a goodwill and intangible asset impairment charge totaling $26.9 million ($16.7 million, net of tax) related to our MyPoints reporting unit.
ITEM 7. MANAGEMENT'S DISCUSSION AND ANALYSIS OF FINANCIAL CONDITION AND RESULTS OF OPERATIONS
Forward-Looking Statements
The following discussion of our financial condition and results of operations should be read in conjunction with the consolidated financial statements and notes to consolidated financial statements included elsewhere in this Annual Report on Form 10-K. This discussion contains forward-looking statements that involve risks and uncertainties. When reviewing the discussion below, you should keep in mind the substantial risks and uncertainties that characterize our business. In particular, we encourage you to review the risks and uncertainties described in Part I, Item 1A "Risk Factors" included elsewhere in this report. These risks and uncertainties could cause actual results to differ materially from those projected in forward-looking statements contained in this report or implied by past results and trends.
Overview
United Online, through its operating subsidiaries, provides consumer services and products over the Internet under a number of brands, including NetZero, Juno, MyPoints, StayFriends, and Trombi.
Effective in the first quarter of 2015, we modified how we report segment information to our Chief Operating Decision Maker ("CODM") as the information regularly reviewed by the CODM had changed. As a result of the changes, we now report three operating segments to the CODM, including the Communications segment, as well as separately reporting the operating results of the Commerce & Loyalty and Social Media segments (which, in prior periods, were reported to the CODM together as the Content & Media segment). This change has been reflected through a retroactive revision of prior-period segment information to conform to the newly-defined segment information.
On August 11, 2015, we completed the sale of all of the stock of our wholly-owned subsidiary, Classmates, Inc. to Intelius Holdings, Inc. The purchase price received for the Classmates domestic business unit was $30.6 million in cash. The Stock Purchase Agreement for the sale included customary representations, warranties and covenants of each party, some of which survive the closing of the transaction for a period of time. Accordingly, the results of operations, the financial condition and the cash flows of the Classmates domestic business unit have been presented as discontinued operations for all periods presented.
34
Our three reportable segments consist of the following:
Segment
|
Services and Products | |
|---|---|---|
Communications |
Internet access services and devices, including dial-up, mobile broadband, DSL, email, Internet security, and web hosting | |
Commerce & Loyalty |
Loyalty marketing service, shopping through online portals, apps and browser extensions |
|
Social Media |
Social networking services and products |
We generate revenues from three primary sources:
- •
- Services revenues. Services revenues in our
Communications and Social Media segments are derived from selling subscriptions to consumers, who are typically billed in advance for the entire subscription term.
- •
- Products revenues. Products revenues in our
Communications segment are derived from the sale of mobile broadband devices, as well as the related shipping and handling fees. Products revenues in our Social Media segment are derived from the sale
of yearbooks, including the related shipping and handling fees.
- •
- Advertising and other revenues. Advertising and other revenues are primarily derived from various advertising, marketing and media-related initiatives in all of our segments. Advertising and other revenues in our Commerce & Loyalty segment also include fees generated when members complete online transactions, when emails are transmitted to members and when members respond to emails and revenues from the sale of physical gift cards and electronic gift codes.
Key Business Metrics
We review a number of key business metrics to help us monitor our performance and trends affecting our businesses, and to develop forecasts and budgets. These key measures include the following:
Pay Accounts. We generate a significant portion of our revenues from our pay accounts, which represent one of the most important drivers of our business model. A pay account is defined as a member who has paid for a subscription to a Communications or Social Media service, and whose subscription has not terminated or expired. A subscription provides the member with access to our service for a specific term (for example, a month or a year) and may be renewed upon the expiration of each term. One-time purchases of our services, with the exception of our free and prepaid mobile broadband service, are not considered subscriptions and thus, are not included in the pay accounts metric. A pay account does not equate to a unique subscriber because one subscriber could have several pay accounts. In addition, at any point in time, our pay account base includes customers who previously purchased prepaid mobile broadband service and have been inactive for 90 days or less, as well as a number of accounts receiving a free period of service as either a promotion or retention tool, such as the subscribers receiving our free mobile broadband service, and a number of accounts that have notified us that they are terminating their service but whose service remains in effect. In general, the key business metrics that affect our revenues from our pay accounts base include the number of pay accounts and the average monthly revenue per pay account. A pay account generally becomes a free account following the expiration or termination of the related subscription.
ARPU. We monitor average monthly revenue per pay account ("ARPU"), which is calculated by dividing services revenues generated from the pay accounts of our Communications or Social Media segment, as applicable, for a period (after translation into U.S. Dollars) by the average number of
35
segment pay accounts for that period, divided by the number of months in that period. The average number of pay accounts is the simple average of the number of pay accounts at the beginning and the end of a period. ARPU may fluctuate significantly from period to period as a result of a variety of factors, including, but not limited to, the extent to which promotional, discounted or retention pricing is used to attract new, or retain existing, paying subscribers; changes in the mix of pay services and the related pricing plans; increases or decreases in the price of our services; the timing of pay accounts being added or removed during a period; and for the Social Media segment, the average foreign currency exchange rate between the U.S. Dollar and the Euro.
Churn. To evaluate the retention characteristics of our membership base, we also monitor the percentage of pay accounts that terminate or expire, which we refer to as our average monthly churn rate. Our average monthly churn rate for a period is calculated as the total number of pay accounts that terminated or expired in a period divided by the average number of pay accounts for that period, divided by the number of months in that period. Our average monthly churn percentage may fluctuate from period to period due to our mix of subscription terms, which affects the timing of subscription expirations, and other factors. We make certain normalizing adjustments to the calculation of our churn percentage for periods in which we add a significant number of pay accounts due to acquisitions. For our Communications segment, our churn calculation does not include accounts canceled during the first 30 days of service other than dial-up accounts that have upgraded from free accounts, but the calculation does include customers who previously purchased prepaid mobile broadband service and, at any time during the period, reached 90 consecutive days of inactivity. A number of such accounts nevertheless will be included in our pay account totals at any given measurement date. Subscribers who cancel one pay service but subscribe to another pay service are not necessarily considered to have canceled a pay account depending on the services and, as such, our segment churn rates are not necessarily indicative of the percentage of subscribers canceling any particular service.
Active Accounts. We monitor the number of active accounts among our membership base. Communications segment active accounts include all Communications segment pay accounts as of the date presented combined with the number of free dial-up Internet access and email accounts that logged on to our services at least once during the preceding 31 days. Social Media segment active accounts are defined as the sum of all pay accounts as of the date presented; and the monthly average for the period of all free accounts who have visited our social networking websites at least once during the period. Segment active accounts for six-month, nine-month and annual periods are calculated as a simple average of the quarterly active accounts for each respective segment.
In general, we count and track pay accounts and free accounts by unique member identifiers. Users have the ability to register for separate services under separate brands and member identifiers independently. We do not track whether a pay account has purchased more than one of our services unless the account uses the same member identifier. As a result, total active accounts may not represent total unique users.
The pay accounts, churn and ARPU metrics for the Communications segment may fluctuate significantly from period to period due to various factors, including, but not limited to, the number of mobile broadband pay accounts, which have a higher churn rate and ARPU.
The pay accounts and ARPU metrics for the Social Media segment may fluctuate significantly from period to period due to various factors, including, but not limited to, the extent to which discounted pricing is offered in prior and current periods, and the churn rate.
Gross Merchandise Sales. Gross merchandise sales is the total dollar value of Commerce & Loyalty member purchases during the reporting period, excluding applicable taxes and net of refunds, directly on the MyPoints site, on third-party sites accessed through the MyPoints portal, or on other Commerce & Loyalty properties. We include the purchases and refunds that are reported by our
36
partners on or before the 15th calendar day following the end of the reporting period, to allow our partners to report purchases completed within the reporting period. We consider this metric to be an important indicator of member engagement with our Commerce & Loyalty properties.
The following table sets forth our key business metrics:
| |
Quarter Ended | Year Ended December 31, | |||||||||||||||||||||||
|---|---|---|---|---|---|---|---|---|---|---|---|---|---|---|---|---|---|---|---|---|---|---|---|---|---|
| |
December 31, 2015 |
September 30, 2015 |
June 30, 2015 |
March 31, 2015 |
December 31, 2014 |
2015 | 2014 | 2013 | |||||||||||||||||
Consolidated: |
|||||||||||||||||||||||||
Revenues (in thousands) |
$ | 40,107 | $ | 36,289 | $ | 37,562 | $ | 37,160 | $ | 41,813 | $ | 151,118 | $ | 165,719 | $ | 177,131 | |||||||||
Communications: |
|||||||||||||||||||||||||
Segment revenues (in thousands) |
$ | 21,289 | $ | 21,466 | $ | 23,208 | $ | 24,264 | $ | 26,001 | $ | 90,227 | $ | 103,165 | $ | 100,858 | |||||||||
% of consolidated revenues |
53 | % | 59 | % | 62 | % | 65 | % | 62 | % | 60 | % | 62 | % | 57 | % | |||||||||
Pay accounts (in thousands): |
|||||||||||||||||||||||||
Internet access |
229 | 256 | 274 | 294 | 301 | 229 | 301 | 346 | |||||||||||||||||
Other |
174 | 177 | 179 | 184 | 189 | 174 | 189 | 207 | |||||||||||||||||
| | | | | | | | | | | | | | | | | | | | | | | | | | |
Total pay accounts |
403 | 433 | 453 | 478 | 490 | 403 | 490 | 553 | |||||||||||||||||
Segment churn |
3.4 | % | 2.8 | % | 3.0 | % | 3.1 | % | 2.8 | % | 3.1 | % | 3.0 | % | 2.8 | % | |||||||||
ARPU |
$ | 10.72 | $ | 11.30 | $ | 11.54 | $ | 11.56 | $ | 11.14 | $ | 11.45 | $ | 10.85 | $ | 9.37 | |||||||||
Segment active accounts (in millions) |
0.9 | 1.0 | 1.0 | 1.0 | 1.0 | 1.0 | 1.1 | 1.2 | |||||||||||||||||
Commerce & Loyalty: |
|||||||||||||||||||||||||
Segment revenues (in thousands) |
$ | 13,442 | $ | 9,175 | $ | 8,260 | $ | 7,145 | $ | 9,098 | $ | 38,022 | $ | 32,218 | $ | 42,884 | |||||||||
% of consolidated revenues |
34 | % | 25 | % | 22 | % | 19 | % | 22 | % | 25 | % | 19 | % | 24 | % | |||||||||
Gross merchandise sales (in thousands) |
$ | 75,825 | $ | 52,771 | $ | 54,436 | $ | 50,669 | $ | 68,284 | $ | 233,701 | $ | 210,930 | $ | 205,565 | |||||||||
Social Media: |
|||||||||||||||||||||||||
Segment revenues (in thousands) |
$ | 5,386 | $ | 5,648 | $ | 6,094 | $ | 5,751 | $ | 6,714 | $ | 22,879 | $ | 30,236 | $ | 33,269 | |||||||||
% of consolidated revenues |
13 | % | 16 | % | 16 | % | 15 | % | 16 | % | 15 | % | 18 | % | 19 | % | |||||||||
Pay accounts (in thousands) |
1,028 | 1,063 | 1,095 | 1,127 | 1,162 | 1,028 | 1,162 | 1,289 | |||||||||||||||||
Segment churn |
2.1 | % | 1.9 | % | 2.0 | % | 2.3 | % | 2.1 | % | 2.1 | % | 2.2 | % | 2.4 | % | |||||||||
ARPU |
$ | 1.64 | $ | 1.65 | $ | 1.60 | $ | 1.60 | $ | 1.79 | $ | 1.62 | $ | 1.90 | $ | 1.90 | |||||||||
Segment active accounts (in millions) |
2.7 | 2.9 | 3.2 | 3.3 | 3.2 | 3.0 | 3.7 | 4.4 | |||||||||||||||||
Average currency exchange rate: |
|||||||||||||||||||||||||
EUR to USD |
1.10 | 1.11 | 1.11 | 1.13 | 1.25 | 1.11 | 1.33 | 1.33 | |||||||||||||||||
Critical Accounting Policies, Estimates and Assumptions
General
Our discussion and analysis of our financial condition and results of operations is based upon our audited consolidated financial statements, which have been prepared in accordance with accounting principles generally accepted in the United States of America ("GAAP") and with the instructions for the Annual Report on Form 10-K. The preparation of financial statements in accordance with GAAP requires management to make estimates and assumptions that affect the reported amounts of assets and liabilities, disclosure of contingent liabilities and the reported amounts of revenues and expenses. Actual results could differ from those estimates and assumptions. Management believes that the following accounting policies, estimates and assumptions made by management thereunder are the most critical to aid in fully understanding and evaluating our reported financial results. These estimates and assumptions require management's most difficult, subjective or complex judgment and may be based on matters, the effects of which are inherently uncertain.
37
Revenue Recognition
We apply the provisions of Accounting Standards Codification ("ASC") 605, Revenue Recognition, which provides guidance on the recognition, presentation and disclosure of revenue in financial statements filed with the Securities and Exchange Commission (the "SEC"). ASC 605 outlines the basic criteria that must be met to recognize revenue and provides guidance for disclosure related to revenue recognition policies. We recognize revenue when persuasive evidence of an arrangement exists, delivery has occurred or services have been rendered, the fee is fixed or determinable, no significant Company obligations remain, and collectibility is reasonably assured. Revenues exclude sales taxes collected.
Our revenues are comprised of services revenues, which are derived primarily from fees charged to pay accounts; advertising and other revenues; and products revenues, which are derived primarily from the sale of yearbooks, including the related shipping and handling fees; the sale of mobile broadband devices and mobile phones, including the related activation fees and shipping and handling fees; and from the sale of third-party merchandise.
Service revenues for our Communications services and social networking services are derived primarily from fees charged to pay accounts and are recognized in the period in which fees are fixed or determinable and the related services are provided to the customer. Our pay accounts generally pay in advance for their services by credit card, PayPal, automated clearinghouse, or check, and revenues are then recognized ratably over the service period. Advance payments from pay accounts are recorded on the consolidated balance sheets as deferred revenue. We offer alternative payment methods to credit cards for certain Communications pay service plans. These alternative payment methods currently include payment by money order or payment through a local telephone company. In circumstances where payment is not received in advance, revenues are only recognized if collectibility is reasonably assured.
Advertising revenues from our Communications services and from our social networking services consist primarily of amounts from our Internet search provider that are generated as a result of users utilizing such provider's Internet search services, amounts generated from display advertisements, and amounts generated from referring members to third-party websites or services. We recognize such advertising revenues in the period in which the advertisement is displayed or, for performance-based arrangements, when the related performance criteria are met. In determining whether an arrangement exists, we ensure that a written contract is in place, such as a standard insertion order or a customer-specific agreement. We assess whether performance criteria have been met and whether the fees are fixed or determinable based on a reconciliation of the performance criteria and the payment terms associated with the transaction. The reconciliation of the performance criteria generally includes a comparison of our internally-tracked performance data to the contractual performance obligation and, when available, to third-party or customer-provided performance data.
Advertising and other revenues for our loyalty marketing service consist primarily of fees generated when emails are transmitted to members, when members respond to emails and when members complete online transactions. Each of these activities is a discrete, independent activity, which generally is specified in the agreement with each advertising customer. As the earning activities take place, activity measurement data (examples include the number of emails delivered and the number of responses received) is accumulated and the related revenues are recorded. Our loyalty marketing service also generates revenues from the sale of gift cards.
Our Communications products revenues are generated from the sale of mobile broadband service devices and mobile phones, including the related activation fees and shipping and handling fees, and are recognized upon delivery of such devices as this is considered a separate earnings process from the sale of Communications services. Sales of mobile broadband service devices bundled with free service plans and paid service plans, and activation fees, are allocated using the relative selling price method in accordance with the multiple-element arrangement provisions of ASC 605. The selling prices of our
38
mobile broadband paid service plans are determined by vendor specific objective evidence, which is based upon the monthly stand-alone selling price of each plan. The selling prices of the mobile broadband service devices and free service plans are determined by management's best estimate of selling price, which considers market and economic conditions, internal costs, pricing, and discounting practices. The revenues allocated to the free service plans are recognized ratably over the service period. Activation fees received upfront in excess of the amount allocated to mobile broadband devices are deferred and recognized as services revenues over the estimated service period.
Our social networking products revenues are derived from the sale of yearbooks, including the related shipping and handling fees. Products revenues from the sale of yearbooks are recognized upon delivery to the customer. Shipping and handling fees charged to customers are recognized at the time the related products revenues are recognized and are included in products revenues. Shipping costs are included in cost of revenues.
Probability of collection is assessed based on a number of factors, including past transaction history with the customer and the creditworthiness of the customer. If it is determined that collectibility is not reasonably assured, revenue is not recognized until collectibility becomes reasonably assured, which is generally upon receipt of cash.
Goodwill
Goodwill represents the excess of the purchase price of an acquired entity over the fair value of the net tangible and intangible assets acquired. Indefinite-lived intangible assets acquired in a business combination are initially recorded at management's estimate of their fair values. We account for goodwill in accordance with ASC 350, Intangibles—Goodwill and Other, which among other things, addresses financial accounting and reporting requirements for acquired goodwill. ASC 350 prohibits the amortization of goodwill and requires us to test goodwill at the reporting unit level for impairment at least annually.
We test the goodwill of our reporting units for impairment annually during the fourth quarter of our fiscal year and whenever events occur or circumstances change that would more likely than not indicate that the goodwill might be impaired. Events or circumstances which could trigger an impairment review include, but are not limited to, a significant adverse change in legal factors or in the business climate, an adverse action or assessment by a regulator, unanticipated competition, a loss of key management or other personnel, significant changes in the manner of our use of the acquired assets or the strategy for the acquired business or our overall business, significant and sustained decline in market capitalization, significant negative industry or economic trends, or significant underperformance relative to expected historical or projected future results of operations.
The determination of whether or not goodwill is impaired involves a significant level of judgment in the assumptions underlying the approaches used to determine the estimated fair values of our reporting units. The determination of the fair values of our reporting units generally includes a study of market comparables, including the selection of appropriate valuation multiples and discounted cash flow models based on our internal forecasts and projections. The estimated fair value of each of our reporting units is typically determined using a combination of the income approach and the market approach. The income approach is weighted at 75%, unless a meaningful base of market data is unavailable, in which case, the market approach is not used.
We operate three reportable segments, in accordance with ASC 280, Segment Reporting, and we have identified three reporting units—Communications, MyPoints and Social Media—for purposes of evaluating goodwill. These reporting units each constitute a business or group of businesses for which discrete financial information is available and is regularly reviewed by segment management. The goodwill related to our acquired businesses is specific to each reporting unit and the goodwill amounts are assigned as such.
39
Testing goodwill for impairment involves a two-step quantitative process. However, prior to performing the two-step quantitative goodwill impairment test, we have the option to first assess qualitative factors to determine whether or not it is necessary to perform the two-step quantitative goodwill impairment test for selected reporting units. If we choose the qualitative option, we are not required to perform the two-step quantitative goodwill impairment test unless we have determined, based on the qualitative assessment, that it is more likely than not that the fair value of a reporting unit is less than its carrying amount. If the two-step quantitative impairment test is required or chosen, the first step of the impairment test involves comparing the estimated fair value of a reporting unit with its respective carrying amount, including goodwill. If the estimated fair value of a reporting unit exceeds its carrying amount, including goodwill, goodwill is considered not to be impaired and no additional steps are necessary. If, however, the estimated fair value of a reporting unit is less than its carrying amount, including goodwill, then the carrying amount of the goodwill is compared with its implied fair value, and an impairment loss is recognized in an amount equal to the excess.
We performed the annual quantitative goodwill impairment assessment for all of our reporting units in the fourth quarter of 2015. The first step of the quantitative goodwill impairment test resulted in the determination that the fair values of our Communications and Social Media reporting units substantially exceeded their carrying amounts, including goodwill. The fair value of our MyPoints reporting unit exceeded its carrying amount, including goodwill, by approximately 22%. Accordingly, the second step was not required for any of our reporting units.
The determination of whether or not goodwill is impaired involves a significant level of judgment in the assumptions underlying the approaches used to determine the estimated fair value of our reporting units. We believe our analysis included sufficient tolerance for sensitivity in key assumptions. The determination of the fair value of our reporting units included a study of market comparables, including the selection of appropriate valuation multiples and discounted cash flow models based on our internal forecasts and projections. Based on our impairment testing in the fourth quarter of 2015 for our MyPoints reporting unit, an increase or decrease of 100 basis points in the discount rate or the terminal growth rate or a 1,000 basis point increase or decrease in the weighting of the market approach, with a corresponding decrease or increase in the weighting of the income approach, would not have resulted in any goodwill impairment. We believe the assumptions and rates used in our impairment assessment are reasonable, but they are judgmental, and variations in any assumptions could result in materially different calculations of fair value and, if applicable, the impairment amount.
Finite-Lived Intangible Assets and Other Long-Lived Assets
We account for identifiable intangible assets and other long-lived assets in accordance with ASC 360, Property, Plant and Equipment, which addresses financial accounting and reporting for the impairment and disposition of identifiable intangible assets and other long-lived assets. Intangible assets acquired in a business combination are initially recorded at management's estimate of their fair values. We evaluate the recoverability of identifiable intangible assets and other long-lived assets for impairment when events occur or circumstances change that would indicate that the carrying amount of an asset may not be recoverable. Events or circumstances that may indicate that an asset is impaired include, but are not limited to, significant decreases in the market value of an asset, significant underperformance relative to expected historical or projected future operating results, a change in the extent or manner in which an asset is used, shifts in technology, loss of key management or other personnel, significant negative industry or economic trends, changes in our operating model or strategy, and competitive forces. In determining if an impairment exists, we estimate the undiscounted cash flows to be generated from the use and ultimate disposition of these assets. If an impairment is indicated based on a comparison of the assets' carrying amounts and the undiscounted cash flows, the impairment loss is measured as the amount by which the carrying amounts of the assets exceed the respective fair values of the assets. Definite-lived intangible assets are amortized on either a
40
straight-line basis or an accelerated basis over their estimated useful lives, ranging from two to ten years. Our identifiable intangible assets were acquired primarily in connection with business combinations.
The process of evaluating the potential impairment of long-lived intangible assets is subjective and requires significant judgment on matters such as, but not limited to, the asset group to be tested for recoverability. We are also required to make estimates that may significantly impact the outcome of the analyses. Such estimates include, but are not limited to, future operating performance and cash flows, cost of capital, terminal values, and remaining economic lives of assets.
Member Redemption Liability
Member redemption liability for loyalty marketing service points represents the estimated costs associated with the obligation of MyPoints to redeem outstanding points accumulated by its loyalty marketing service members, less an allowance for points expected to expire prior to redemption. The estimated cost of points is primarily presented in cost of revenues, except for the portion related to member acquisition activities, internal marketing surveys and other non-revenue generating activities, which are presented in sales and marketing expenses. The member redemption liability is recognized when members earn points, less an allowance for points expected to expire, and is reduced when members redeem accumulated points upon reaching required redemption thresholds.
MyPoints members may redeem points for third-party gift cards and other rewards. Members earn points when they respond to direct marketing offers delivered by MyPoints, purchase goods or services from advertisers, engage in certain promotional campaigns of advertisers, or engage in other specified activities.
The member redemption liability is estimated based upon the weighted-average cost and number of points that may be redeemed in the future. The weighted-average cost of points is calculated by taking the total cost of items fulfilled divided by total points redeemed. MyPoints purchases gift cards and other awards from merchants at a discount and sets redemption levels for its members. The discounts and points needed to redeem awards vary by merchant and award denomination. MyPoints has the ability to adjust the number of points required to redeem awards to reflect changes in the cost of awards.
MyPoints accounts for and reduces the gross points issued by an estimate of points that will never be redeemed by its members. This reduction is calculated based on an analysis of historical point-earning trends, redemption activities and individual member account activity. MyPoints' historical analysis takes into consideration the total points in members' accounts that have been inactive for six months or longer, less an estimated reactivation rate, plus an estimate for future cancelations of points that have not yet been outstanding for 180 days. Changes in, among other factors, the net number of points issued, redemption activities and members' activity levels could materially impact the member redemption liability. A 100 basis point increase or decrease in the estimate of points that will never be redeemed would increase or decrease our member redemption liability at December 31, 2015 by approximately $51,000.
Points in active MyPoints accounts do not expire; however, unredeemed points expire after 12 consecutive months of inactivity. For purposes of the member redemption liability, "inactive" means a lack of all of the following: email response; survey completion; profile update; and any point-earning or point-redeeming transaction. The canceling or disabling of inactive MyPoints accounts would have no impact on our consolidated financial statements, as we fully consider inactive MyPoints accounts when establishing the member redemption liability, as discussed above.
41
The following table sets forth, for the periods presented, a reconciliation of the changes in the member redemption liability (in thousands):
| |
Year Ended December 31, |
||||||
|---|---|---|---|---|---|---|---|
| |
2015 | 2014 | |||||
Beginning balance |
$ | 18,647 | $ | 20,927 | |||
Accruals for points earned |
11,031 | 10,515 | |||||
Reduction for redeemed points |
(11,988 | ) | (11,805 | ) | |||
Changes in allowance for points expected to expire and weighted-average cost of points |
413 | (990 | ) | ||||
| | | | | | | | |
Ending balance |
$ | 18,103 | $ | 18,647 | |||
| | | | | | | | |
| | | | | | | | |
| | | | | | | | |
Income Taxes
We apply the provisions of ASC 740, Income Taxes. Under ASC 740, deferred tax assets and liabilities are determined based on differences between the financial reporting and tax bases of assets and liabilities and are measured using the enacted tax rates and laws that will be in effect when the differences are expected to reverse. We record a valuation allowance to reduce our deferred tax assets to the amount that is more likely than not to be realized. In evaluating our ability to recover our deferred tax assets, we consider all available positive and negative evidence, including our operating results, ongoing tax planning and forecasts of future taxable income on a jurisdiction-by-jurisdiction basis. In accordance with ASC 740, we recognize, in our consolidated financial statements, the impact of our tax positions that are more likely than not to be sustained upon examination based on the technical merits of the positions. The Company recognizes interest and penalties for uncertain tax positions in income tax expense.
Legal Contingencies
We are currently involved in certain legal proceedings and investigations. We record liabilities related to pending matters when an unfavorable outcome is deemed probable and management can reasonably estimate the amount or range of loss. As additional information becomes available, we continually assess the potential liability related to such pending matters.
Financial Statement Presentation
Revenues
Services Revenues
Communications services revenues consist of amounts charged to pay accounts for dial-up Internet access, mobile broadband, DSL, email, Internet security, web hosting, voice services, and other services. Social Media services revenues primarily consist of amounts charged to pay accounts for social networking services. Our Communications and Social Media services revenues are primarily dependent on two factors: the average number of pay accounts for a period and ARPU. In general, we charge our pay accounts in advance of providing a service, which results in the deferral of services revenue to the period in which the services are provided. Communications services revenues also include revenues generated from the resale of telecommunications to third parties.
Products Revenues
Communications products revenues consist of revenues generated from the sale of mobile broadband devices to our mobile broadband customers and to our retail partners and from the sale of
42
mobile phones, as well as the related shipping and handling fees. Social Media products revenues consist of revenues generated from the sale of yearbooks, including the related shipping and handling fees, and from reselling third-party merchandise.
Advertising and Other Revenues
Our Communications services generate advertising revenues from search placements, display advertisements and online market research associated with our Internet access and email services. Advertising revenues also include intercompany commissions from the Commerce & Loyalty segment which are included in reported segment results and are eliminated upon consolidation.
We provide advertising opportunities to marketers with both brand and direct response objectives through a full suite of display, search, email, and text-link opportunities across our various properties. Our social networking services generate advertising revenues primarily from display advertisements on our websites. Advertising inventory on our social networking websites includes text and graphic placements on the user home page, profile page, class list page, and most other pages on our websites. Our loyalty marketing service's advertising and other revenues are derived from advertising fees, consisting primarily of fees based on performance measures, that are generated when emails are transmitted to members, when members respond to emails, when members complete online transactions, and when members engage in a variety of other online activities, including, but not limited to, games, Internet searches and market research surveys. Our loyalty marketing service's advertising and other revenues also include revenues generated from the sale of physical and electronic gift cards.
Cost of Revenues
Communications cost of revenues includes telecommunications and data center costs; personnel and overhead-related costs associated with operating our networks and data centers; depreciation of network computers and equipment; license fees; costs related to providing customer support; costs related to customer billing and billing support for our pay accounts; fees associated with the storage and processing of customer credit cards and associated bank fees; domain name registration fees; and the costs associated with the sale of mobile broadband devices and mobile phones, including the related shipping and handling costs.
Commerce & Loyalty cost of revenues includes costs of points earned by members of our loyalty marketing service; costs related to the sale of gift cards; depreciation of network computers and equipment; data center costs; fees associated with the storage and processing of customer credit cards and associated bank fees; costs related to providing customer support; personnel-related costs; and costs related to third-party merchandise.
Social Media cost of revenues includes depreciation of network computers and equipment; data center costs; amortization of content purchases; fees associated with the storage and processing of customer credit cards and associated bank fees; costs related to providing customer support; personnel and overhead-related costs; costs associated with the sale of yearbooks, including the related shipping and handling costs; license fees; and domain name registration fees.
Sales and Marketing
Sales and marketing expenses include expenses associated with promoting our brands, services and products and with generating advertising revenues. Expenses associated with promoting our brands, services and products include advertising and promotion expenses; fees paid to distribution partners, third-party advertising networks and co-registration partners to acquire new pay and free accounts; personnel and overhead-related expenses for marketing, merchandising, customer service, and sales personnel; and telemarketing costs incurred to acquire and retain pay accounts and up-sell pay accounts to additional services. Expenses associated with generating advertising revenues include sales
43
commissions and personnel-related expenses. We have expended significant amounts on sales and marketing, including branding and customer acquisition campaigns consisting of television, Internet, public relations, sponsorships, print, and outdoor advertising, and on retail and other performance-based distribution relationships. Marketing and advertising costs to promote our services and products are expensed in the period incurred. Advertising and promotion expenses include media, agency and promotion expenses. Media production costs are expensed the first time the advertisement is run. Media and agency costs are expensed over the period the advertising runs.
Technology and Development
Technology and development expenses include expenses for product development, maintenance of existing software, technology and websites, and development of new or improved software and technology, including personnel-related expenses for our technology group in various locations. Costs incurred by us to manage and monitor our technology and development activities are expensed as incurred.
General and Administrative
General and administrative expenses, which include unallocated corporate expenses, consist of personnel-related expenses for executive, finance, legal, human resources, facilities, internal audit, investor relations, internal customer support personnel and personnel associated with operating our corporate network systems. In addition, general and administrative expenses include, among other costs, professional fees for legal, accounting and financial services; insurance; occupancy and other overhead-related costs; office relocation costs; non-income taxes; gains and losses on the sale of assets; bad debt expense; and reserves or expenses incurred as a result of settlements, judgments, fines, penalties, assessment, or other resolutions related to litigation, arbitration, investigations, disputes, or similar matters. General and administrative expenses also include expenses resulting from actual or potential transactions such as business combinations, mergers, acquisitions, dispositions, spin offs, financing transactions, and other strategic transactions, including, without limitation, expenses for advisors and representatives such as investment bankers, consultants, attorneys, and accounting firms.
Amortization of Intangible Assets
Amortization of intangible assets includes amortization of acquired pay accounts and free accounts; certain acquired trademarks and trade names; acquired rights, content and intellectual property; and other acquired identifiable intangible assets.
Restructuring and Other Exit Costs
Restructuring and other exit costs consist of costs associated with the realignment and reorganization of our operations and other employee termination events. Restructuring and other exit costs include employee termination costs, facility closure and relocation costs, and contract termination costs. The timing of associated cash payments is dependent upon the type of exit cost and can extend over a 12-month period. We record restructuring and other exit cost liabilities in accrued liabilities or other liabilities in the consolidated balance sheets.
Interest Income
Interest income primarily consists of earnings on our cash and cash equivalents.
Interest Expense
Interest expense primarily consists of interest incurred related to tax and other regulatory filings.
44
Other Income, Net
Other income, net, consists of gains and losses on foreign currency exchange rate transactions; realized and unrealized gains and losses on certain forward foreign currency exchange contracts; gains or losses related to ineffectiveness of certain derivative instruments; and other non-operating income and expenses.
Results of Operations
The following tables set forth selected historical consolidated statements of operations and segment information data, which should be read in conjunction with Critical Accounting Policies, Estimates and Assumptions, Liquidity and Capital Resources, Contractual Obligations, and Other Commitments included in this Item 7, as well as Quantitative and Qualitative Disclosures About Market Risk and the Consolidated Financial Statements and Notes thereto included elsewhere in this Annual Report on Form 10-K.
Consolidated statement of operations information was as follows (in thousands):
| |
Year Ended December 31, | |||||||||
|---|---|---|---|---|---|---|---|---|---|---|
| |
2015 | 2014 | 2013 | |||||||
Revenues |
$ | 151,118 | $ | 165,719 | $ | 177,131 | ||||
Operating expenses: |
||||||||||
Cost of revenues |
62,806 | 61,101 | 62,035 | |||||||
Sales and marketing |
27,396 | 32,030 | 38,518 | |||||||
Technology and development |
14,865 | 17,219 | 18,305 | |||||||
General and administrative |
37,088 | 48,388 | 58,508 | |||||||
Amortization of intangible assets |
409 | 421 | 399 | |||||||
Restructuring and other exit costs |
1,468 | 3,054 | 1,192 | |||||||
Impairment of goodwill, intangible assets and long-lived assets |
— | — | 37,756 | |||||||
| | | | | | | | | | | |
Total operating expenses |
144,032 | 162,213 | 216,713 | |||||||
| | | | | | | | | | | |
Operating income (loss) |
7,086 | 3,506 | (39,582 | ) | ||||||
Interest income |
448 | 388 | 260 | |||||||
Interest expense |
— | — | (12 | ) | ||||||
Other income, net |
932 | 505 | 213 | |||||||
| | | | | | | | | | | |
Income (loss) before income taxes |
8,466 | 4,399 | (39,121 | ) | ||||||
Provision for income taxes |
3,959 | 841 | 46,595 | |||||||
| | | | | | | | | | | |
Income (loss) from continuing operations |
4,507 | 3,558 | (85,716 | ) | ||||||
Income (loss) from discontinued operations, net of tax |
25,466 | (8,987 | ) | (2,559 | ) | |||||
| | | | | | | | | | | |
Net income (loss) |
$ | 29,973 | $ | (5,429 | ) | $ | (88,275 | ) | ||
| | | | | | | | | | | |
| | | | | | | | | | | |
| | | | | | | | | | | |
45
Information for our three reportable segments, which excludes depreciation and amortization of intangible assets, was as follows (in thousands):
| |
Communications | Commerce & Loyalty | Social Media | |||||||||||||||||||||||||
|---|---|---|---|---|---|---|---|---|---|---|---|---|---|---|---|---|---|---|---|---|---|---|---|---|---|---|---|---|
| |
Year Ended December 31, | Year Ended December 31, | Year Ended December 31, | |||||||||||||||||||||||||
| |
2015 | 2014 | 2013 | 2015 | 2014 | 2013 | 2015 | 2014 | 2013 | |||||||||||||||||||
Revenues |
$ | 90,227 | $ | 103,165 | $ | 100,858 | $ | 38,022 | $ | 32,218 | $ | 42,884 | $ | 22,879 | $ | 30,236 | $ | 33,269 | ||||||||||
Operating expenses: |
||||||||||||||||||||||||||||
Cost of revenues |
35,685 | 40,412 | 33,865 | 22,844 | 14,941 | 22,421 | 1,991 | 2,786 | 2,670 | |||||||||||||||||||
Sales and marketing |
12,232 | 14,425 | 16,617 | 9,287 | 9,933 | 12,784 | 5,878 | 7,666 | 9,053 | |||||||||||||||||||
Technology and development |
6,778 | 8,259 | 7,419 | 2,256 | 2,719 | 4,006 | 2,036 | 2,557 | 2,847 | |||||||||||||||||||
General and administrative |
7,776 | 10,496 | 10,576 | 3,838 | 4,340 | 5,238 | 3,438 | 3,967 | 3,842 | |||||||||||||||||||
Restructuring and other exit costs |
1,105 | 379 | — | (2 | ) | 1,457 | 1,192 | — | — | — | ||||||||||||||||||
Impairment of goodwill, intangible assets and long-lived assets |
— | — | — | — | — | — | — | — | 37,756 | |||||||||||||||||||
| | | | | | | | | | | | | | | | | | | | | | | | | | | | | |
Total operating expenses |
63,576 | 73,971 | 68,477 | 38,223 | 33,390 | 45,641 | 13,343 | 16,976 | 56,168 | |||||||||||||||||||
| | | | | | | | | | | | | | | | | | | | | | | | | | | | | |
Segment income (loss) from operations |
$ | 26,651 | $ | 29,194 | $ | 32,381 | $ | (201 | ) | $ | (1,172 | ) | $ | (2,757 | ) | $ | 9,536 | $ | 13,260 | $ | (22,899 | ) | ||||||
| | | | | | | | | | | | | | | | | | | | | | | | | | | | | |
| | | | | | | | | | | | | | | | | | | | | | | | | | | | | |
| | | | | | | | | | | | | | | | | | | | | | | | | | | | | |
Year Ended December 31, 2015 compared to Year Ended December 31, 2014
Consolidated Results
Revenues
| |
Year Ended December 31, |
Change | |||||||||||
|---|---|---|---|---|---|---|---|---|---|---|---|---|---|
| |
2015 | 2014 | $ | % | |||||||||
| |
(in thousands, except percentages) |
||||||||||||
Revenues |
$ | 151,118 | $ | 165,719 | $ | (14,601 | ) | (9 | )% | ||||
Revenues as a percentage of total segment revenues: |
|||||||||||||
Communications |
59.7 | % | 62.3 | % | |||||||||
Commerce & Loyalty |
25.2 | % | 19.5 | % | |||||||||
Social Media |
15.1 | % | 18.3 | % | |||||||||
The decrease in consolidated revenues was primarily due to a $12.9 million decrease in revenues from our Communications segment and a $7.4 million decrease in revenues from our Social Media segment, partially offset by a $5.8 million increase in revenues from our Commerce & Loyalty segment.
Cost of Revenues
| |
Year Ended December 31, |
Change | |||||||||||
|---|---|---|---|---|---|---|---|---|---|---|---|---|---|
| |
2015 | 2014 | $ | % | |||||||||
| |
(in thousands, except percentages) |
||||||||||||
Cost of revenues |
$ | 62,806 | $ | 61,101 | $ | 1,705 | 3 | % | |||||
Cost of revenues as a percentage of total segment cost of revenues: |
|||||||||||||
Communications |
59.0 | % | 69.5 | % | |||||||||
Commerce & Loyalty |
37.7 | % | 25.7 | % | |||||||||
Social Media |
3.3 | % | 4.8 | % | |||||||||
The increase in consolidated cost of revenues was due to a $7.9 million increase in cost of revenues associated with our Commerce & Loyalty segment, significantly offset by a $4.7 million decrease in cost of revenues associated with our Communications segment, a $0.8 million decrease in
46
cost of revenues associated with our Social Media segment and a $0.5 million decrease in depreciation expense.
Sales and Marketing
| |
Year Ended December 31, |
Change | |||||||||||
|---|---|---|---|---|---|---|---|---|---|---|---|---|---|
| |
2015 | 2014 | $ | % | |||||||||
| |
(in thousands, except percentages) |
||||||||||||
Sales and marketing |
$ | 27,396 | $ | 32,030 | $ | (4,634 | ) | (14 | )% | ||||
Sales and marketing expenses as a percentage of total segment sales and marketing expenses: |
|||||||||||||
Communications |
44.6 | % | 45.0 | % | |||||||||
Commerce & Loyalty |
33.9 | % | 31.0 | % | |||||||||
Social Media |
21.5 | % | 23.9 | % | |||||||||
The decrease in consolidated sales and marketing expenses was due to a $2.2 million decrease in sales and marketing expenses associated with our Communications segment, a $1.8 million decrease in sales and marketing expenses associated with our Social Media segment and a $0.6 million decrease in sales and marketing expenses associated with our Commerce & Loyalty segment.
Technology and Development
| |
Year Ended December 31, |
Change | |||||||||||
|---|---|---|---|---|---|---|---|---|---|---|---|---|---|
| |
2015 | 2014 | $ | % | |||||||||
| |
(in thousands, except percentages) |
||||||||||||
Technology and development |
$ | 14,865 | $ | 17,219 | $ | (2,354 | ) | (14 | )% | ||||
Technology and development expenses as a percentage of total segment technology and development expenses: |
|||||||||||||
Communications |
61.2 | % | 61.0 | % | |||||||||
Commerce & Loyalty |
20.4 | % | 20.1 | % | |||||||||
Social Media |
18.4 | % | 18.9 | % | |||||||||
The decrease in consolidated technology and development expenses was primarily due to a $1.5 million decrease in technology and development expenses associated with our Communications segment, a $0.5 million decrease in technology and development expenses associated with our Social Media segment and a $0.5 million decrease in technology and development expenses associated with our Commerce & Loyalty segment.
General and Administrative
| |
Year Ended December 31, |
Change | |||||||||||
|---|---|---|---|---|---|---|---|---|---|---|---|---|---|
| |
2015 | 2014 | $ | % | |||||||||
| |
(in thousands, except percentages) |
||||||||||||
General and administrative |
$ | 37,088 | $ | 48,388 | $ | (11,300 | ) | (23 | )% | ||||
General and administrative expenses as a percentage of total segment general and administrative expenses: |
|||||||||||||
Communications |
51.7 | % | 55.8 | % | |||||||||
Commerce & Loyalty |
25.5 | % | 23.1 | % | |||||||||
Social Media |
22.8 | % | 21.1 | % | |||||||||
47
The decrease in consolidated general and administrative expenses was due to a $7.9 million decrease in unallocated corporate general and administrative expenses, a $2.7 million decrease in general and administrative expenses associated with our Communications segment, a $0.5 million decrease in general and administrative expenses associated with our Social Media segment, and a $0.5 million decrease in general and administrative expenses associated with our Commerce & Loyalty segment, partially offset by a $0.3 million increase in depreciation expense.
Amortization of Intangible Assets
| |
Year Ended December 31, |
Change | |||||||||||
|---|---|---|---|---|---|---|---|---|---|---|---|---|---|
| |
2015 | 2014 | $ | % | |||||||||
| |
(in thousands, except percentages) |
||||||||||||
Amortization of intangible assets |
$ | 409 | $ | 421 | $ | (12 | ) | (3 | )% | ||||
Consolidated amortization of intangible assets was essentially flat for the year ended December 31, 2015, compared to the year ended December 31, 2014.
Restructuring and Other Exit Costs
| |
Year Ended December 31, |
Change | |||||||||||
|---|---|---|---|---|---|---|---|---|---|---|---|---|---|
| |
2015 | 2014 | $ | % | |||||||||
| |
(in thousands, except percentages) |
||||||||||||
Restructuring and other exit costs |
$ | 1,468 | $ | 3,054 | $ | (1,586 | ) | (52 | )% | ||||
Consolidated restructuring and other exit costs for the year ended December 31, 2015 included $1.1 million of employee termination costs in the Communications segment, as well as $0.4 million of employee termination costs in unallocated corporate expenses. These restructuring charges were a result of management's decision to streamline segment operations and increase profitability. At December 31, 2015, accrued restructuring and other exit costs totaled $0.1 million.
Consolidated restructuring and other exit costs for the year ended December 31, 2014 included $1.1 million and $0.4 million of employee termination costs and facility closure and relocation costs, respectively, in the Commerce & Loyalty segment, as well as $1.2 million of employee termination costs in unallocated corporate expenses and $0.4 million of employee termination costs in the Communications segment. These restructuring charges were a result of management's decision to streamline segment operations and increase profitability. At December 31, 2014, accrued restructuring and other exit costs totaled $0.2 million.
Interest Income
| |
Year Ended December 31, |
Change | |||||||||||
|---|---|---|---|---|---|---|---|---|---|---|---|---|---|
| |
2015 | 2014 | $ | % | |||||||||
| |
(in thousands, except percentages) |
||||||||||||
Interest income |
$ | 448 | $ | 388 | $ | 60 | 15 | % | |||||
Consolidated interest income was relatively flat for the year ended December 31, 2015, compared to the year ended December 31, 2014.
48
Other Income, Net
| |
Year Ended December 31, |
Change | |||||||||||
|---|---|---|---|---|---|---|---|---|---|---|---|---|---|
| |
2015 | 2014 | $ | % | |||||||||
| |
(in thousands, except percentages) |
||||||||||||
Other income, net |
$ | 932 | $ | 505 | $ | 427 | 85 | % | |||||
The increase in consolidated other income, net, was primarily due to $0.8 million of transition services income earned in the year ended December 31, 2015, partially offset by a $0.4 million decrease in gains related to forward foreign currency exchange contracts.
Provision for Income Taxes
| |
Year Ended December 31, |
||||||
|---|---|---|---|---|---|---|---|
| |
2015 | 2014 | |||||
| |
(in thousands, except percentages) |
||||||
Provision for income taxes |
$ | 3,959 | $ | 841 | |||
Effective income tax rate |
46.8 | % | 19.1 | % | |||
For the year ended December 31, 2015, we recorded a provision for income taxes totaling $4.0 million on pre-tax income totaling $8.5 million, compared to a provision for income taxes totaling $0.8 million on pre-tax income totaling $4.4 million for the year ended December 31, 2014. The change in the effective income tax rate was primarily due to the increase in the deferred tax liability related to our indefinite-lived intangible assets and a valuation allowance reserve recorded against our domestic deferred tax assets in the year ended December 31, 2015, compared to a valuation allowance release recognized against our domestic deferred tax assets in the year ended December 31, 2014.
Communications Segment Results
Communications Revenues
| |
Year Ended December 31, |
Change | |||||||||||
|---|---|---|---|---|---|---|---|---|---|---|---|---|---|
| |
2015 | 2014 | $ | % | |||||||||
| |
(in thousands, except percentages and ARPU) |
||||||||||||
Services |
$ | 62,196 | $ | 68,727 | $ | (6,531 | ) | (10 | )% | ||||
Products |
4,832 | 6,254 | (1,422 | ) | (23 | )% | |||||||
Advertising |
23,199 | 28,184 | (4,985 | ) | (18 | )% | |||||||
| | | | | | | | | | | | | | |
Total Communications revenues |
$ | 90,227 | $ | 103,165 | $ | (12,938 | ) | (13 | )% | ||||
| | | | | | | | | | | | | | |
| | | | | | | | | | | | | | |
| | | | | | | | | | | | | | |
ARPU |
$ | 11.45 | $ | 10.85 | $ | 0.60 | 6 | % | |||||
Average number of pay accounts |
447 | 522 | (75 | ) | (14 | )% | |||||||
The decrease in Communications services revenues was due to a $6.4 million decrease in dial-up and DSL services revenues attributed to lower dial-up and DSL subscribers, partially offset by an increase in ARPU for these services; and a $0.6 million decrease in add-on services, partially offset by a $0.6 million increase in mobile broadband services revenues driven by an increase in ARPU. The decrease in Communications advertising revenues was due to decreases in advertising and search impressions from the decline in active accounts. The decrease in Communications products revenues was due to lower mobile broadband sign-ups.
49
Communications Cost of Revenues
| |
Year Ended December 31, |
Change | |||||||||||
|---|---|---|---|---|---|---|---|---|---|---|---|---|---|
| |
2015 | 2014 | $ | % | |||||||||
| |
(in thousands, except percentages) |
||||||||||||
Communications cost of revenues |
$ | 35,685 | $ | 40,412 | $ | (4,727 | ) | (12 | )% | ||||
Communications cost of revenues as a percentage of Communications revenues |
39.6 | % | 39.2 | % | |||||||||
The decrease in Communications cost of revenues was primarily due to a $1.9 million decrease in costs due to lower DSL and dial-up subscribers, a $1.8 million decrease attributable to lower mobile broadband device costs, a $0.5 million decrease in personnel and overhead-related costs, a $0.3 million decrease in costs associated with our lower advertising sales and a performance credit from an advertising services provider, and a $0.3 million decrease in costs of add-on services of dial-up and DSL subscribers.
Communications Sales and Marketing
| |
Year Ended December 31, |
Change | |||||||||||
|---|---|---|---|---|---|---|---|---|---|---|---|---|---|
| |
2015 | 2014 | $ | % | |||||||||
| |
(in thousands, except percentages) |
||||||||||||
Communications sales and marketing |
$ | 12,232 | $ | 14,425 | $ | (2,193 | ) | (15 | )% | ||||
Communications sales and marketing expenses as a percentage of Communications revenues |
13.6 | % | 14.0 | % | |||||||||
The decrease in Communications sales and marketing expenses was primarily due to a $1.4 million decrease in advertising expenses resulting from cost savings initiatives and a $0.8 million decrease in personnel and overhead-related costs primarily from restructuring initiatives.
Communications Technology and Development
| |
Year Ended December 31, |
Change | |||||||||||
|---|---|---|---|---|---|---|---|---|---|---|---|---|---|
| |
2015 | 2014 | $ | % | |||||||||
| |
(in thousands, except percentages) |
||||||||||||
Communications technology and development |
$ | 6,778 | $ | 8,259 | $ | (1,481 | ) | (18 | )% | ||||
Communications technology and development expenses as a percentage of Communications revenues |
7.5 | % | 8.0 | % | |||||||||
The decrease in Communications technology and development expenses was primarily due to a decrease in personnel and overhead-related costs from restructuring initiatives.
Communications General and Administrative
| |
Year Ended December 31, |
Change | |||||||||||
|---|---|---|---|---|---|---|---|---|---|---|---|---|---|
| |
2015 | 2014 | $ | % | |||||||||
| |
(in thousands, except percentages) |
||||||||||||
Communications general and administrative |
$ | 7,776 | $ | 10,496 | $ | (2,720 | ) | (26 | )% | ||||
Communications general and administrative expenses as a percentage of Communications revenues |
8.6 | % | 10.2 | % | |||||||||
50
The decrease in Communications general and administrative expenses was primarily due to a $1.5 million decrease in personnel and overhead-related costs from restructuring initiatives, a $0.8 million decrease in reserves for a separation settlement with a former executive officer and a $0.3 million decrease in professional services and consulting fees.
Communications Restructuring and Other Exit Costs
| |
Year Ended December 31, |
Change | |||||||||||
|---|---|---|---|---|---|---|---|---|---|---|---|---|---|
| |
2015 | 2014 | $ | % | |||||||||
| |
(in thousands, except percentages) |
||||||||||||
Communications restructuring and other exit costs |
$ | 1,105 | $ | 379 | $ | 726 | 192 | % | |||||
Communications restructuring and other exit costs for the years ended December 31, 2015 and 2014 consisted primarily of employee termination costs.
Commerce & Loyalty Segment Results
Commerce & Loyalty Revenues
| |
Year Ended December 31, |
Change | |||||||||||
|---|---|---|---|---|---|---|---|---|---|---|---|---|---|
| |
2015 | 2014 | $ | % | |||||||||
| |
(in thousands, except percentages) |
||||||||||||
Advertising and other |
$ | 38,022 | $ | 32,218 | $ | 5,804 | 18 | % | |||||
The increase in Commerce & Loyalty advertising and other revenues was primarily due to a $6.6 million increase in gift card revenues, including Swappable gift card desktop and mobile app revenues and a $0.2 million increase in display advertising revenues. These increases were partially offset by a $0.8 million decrease in market research revenues.
Commerce & Loyalty Cost of Revenues
| |
Year Ended December 31, |
Change | |||||||||||
|---|---|---|---|---|---|---|---|---|---|---|---|---|---|
| |
2015 | 2014 | $ | % | |||||||||
| |
(in thousands, except percentages) |
||||||||||||
Commerce & Loyalty cost of revenues |
$ | 22,844 | $ | 14,941 | $ | 7,903 | 53 | % | |||||
Commerce & Loyalty cost of revenues as a percentage of Commerce & Loyalty revenues |
60.1 | % | 46.4 | % | |||||||||
The increase in Commerce & Loyalty cost of revenues was due to a $7.7 million increase in costs related to the sale of gift cards and a $1.1 million increase in point costs, partially offset by a $0.5 million decrease in personnel and overhead-related costs due to our restructuring initiatives in April 2014 and a $0.4 million decrease in hosting and software-related fees.
51
Commerce & Loyalty Sales and Marketing
| |
Year Ended December 31, |
Change | |||||||||||
|---|---|---|---|---|---|---|---|---|---|---|---|---|---|
| |
2015 | 2014 | $ | % | |||||||||
| |
(in thousands, except percentages) |
||||||||||||
Commerce & Loyalty sales and marketing |
$ | 9,287 | $ | 9,933 | $ | (646 | ) | (7 | )% | ||||
Commerce & Loyalty sales and marketing expenses as a percentage of Commerce & Loyalty revenues |
24.4 | % | 30.8 | % | |||||||||
The decrease in Commerce & Loyalty sales and marketing expenses was primarily due to a decrease in personnel and overhead-related costs as a result of our restructuring initiatives in April 2014.
Commerce & Loyalty Technology and Development
| |
Year Ended December 31, |
Change | |||||||||||
|---|---|---|---|---|---|---|---|---|---|---|---|---|---|
| |
2015 | 2014 | $ | % | |||||||||
| |
(in thousands, except percentages) |
||||||||||||
Commerce & Loyalty technology and development |
$ | 2,256 | $ | 2,719 | $ | (463 | ) | (17 | )% | ||||
Commerce & Loyalty technology and development expenses as a percentage of Commerce & Loyalty revenues |
5.9 | % | 8.4 | % | |||||||||
The decrease in Commerce & Loyalty technology and development expenses was the result of a decrease in personnel and overhead-related costs as a result of our restructuring initiatives in April 2014.
Commerce & Loyalty General and Administrative
| |
Year Ended December 31, |
Change | |||||||||||
|---|---|---|---|---|---|---|---|---|---|---|---|---|---|
| |
2015 | 2014 | $ | % | |||||||||
| |
(in thousands, except percentages) |
||||||||||||
Commerce & Loyalty general and administrative |
$ | 3,838 | $ | 4,340 | $ | (502 | ) | (12 | )% | ||||
Commerce & Loyalty general and administrative expenses as a percentage of Commerce & Loyalty revenues |
10.1 | % | 13.5 | % | |||||||||
The decrease in Commerce & Loyalty general and administrative expenses was primarily due to a decrease in personnel and overhead-related costs as a result of our restructuring initiatives in April 2014.
Commerce & Loyalty Restructuring and Other Exit Costs
| |
Year Ended December 31, |
Change | |||||||||||
|---|---|---|---|---|---|---|---|---|---|---|---|---|---|
| |
2015 | 2014 | $ | % | |||||||||
| |
(in thousands, except percentages) |
||||||||||||
Commerce & Loyalty restructuring and other exit costs |
$ | (2 | ) | $ | 1,457 | $ | (1,459 | ) | (100 | )% | |||
Restructuring and other exit costs for the year ended December 31, 2014 consisted of employee termination costs and facility closure and relocation costs. These restructuring charges were a result of management's decision to streamline operations, prioritize resources for growth initiatives and increase profitability.
52
Social Media Segment Results
Social Media Revenues
| |
Year Ended December 31, |
Change | |||||||||||
|---|---|---|---|---|---|---|---|---|---|---|---|---|---|
| |
2015 | 2014 | $ | % | |||||||||
| |
(in thousands, except percentages and ARPU) |
||||||||||||
Services |
$ | 21,304 | $ | 27,926 | $ | (6,622 | ) | (24 | )% | ||||
Products |
689 | 814 | (125 | ) | (15 | )% | |||||||
Advertising and other |
886 | 1,496 | (610 | ) | (41 | )% | |||||||
| | | | | | | | | | | | | | |
Total Social Media revenues |
$ | 22,879 | $ | 30,236 | $ | (7,357 | ) | (24 | )% | ||||
| | | | | | | | | | | | | | |
| | | | | | | | | | | | | | |
| | | | | | | | | | | | | | |
ARPU |
$ | 1.62 | $ | 1.90 | $ | (0.28 | ) | (15 | )% | ||||
Average pay accounts |
1,095 | 1,225 | (130 | ) | (11 | )% | |||||||
The decrease in Social Media services revenues was primarily due to a decrease in ARPU due to a weaker Euro versus the U.S. Dollar, as well as a decrease in average pay accounts. The decrease in Social Media advertising revenues was attributable to lower active accounts and a decrease in advertising impressions delivered. Adjusting for the unfavorable impact of foreign currency exchange rates due to a weaker Euro versus the U.S. Dollar, Social Media revenues decreased by $2.8 million, or 9%. We anticipate revenues and pay accounts will continue to decline year over year in 2016.
Social Media Cost of Revenues
| |
Year Ended December 31, |
Change | |||||||||||
|---|---|---|---|---|---|---|---|---|---|---|---|---|---|
| |
2015 | 2014 | $ | % | |||||||||
| |
(in thousands, except percentages) |
||||||||||||
Social Media cost of revenues |
$ | 1,991 | $ | 2,786 | $ | (795 | ) | (29 | )% | ||||
Social Media cost of revenues as a percentage of Social Media revenues |
8.7 | % | 9.2 | % | |||||||||
The decrease in Social Media cost of revenues was primarily due to a $0.3 million decrease in hosting fees, a $0.2 million decrease in personnel and overhead-related costs and a $0.2 million decrease in bank service charges. Adjusting for the favorable impact of foreign currency exchange rates due to a weaker Euro versus the U.S. Dollar, Social Media cost of revenues decreased by $0.4 million, or 14%.
Social Media Sales and Marketing
| |
Year Ended December 31, |
Change | |||||||||||
|---|---|---|---|---|---|---|---|---|---|---|---|---|---|
| |
2015 | 2014 | $ | % | |||||||||
| |
(in thousands, except percentages) |
||||||||||||
Social Media sales and marketing |
$ | 5,878 | $ | 7,666 | $ | (1,788 | ) | (23 | )% | ||||
Social Media sales and marketing expenses as a percentage of Social Media revenues |
25.7 | % | 25.4 | % | |||||||||
The decrease in Social Media sales and marketing expenses was primarily due to reduced spending on customer acquisition. Adjusting for the favorable impact of foreign currency exchange rates due to a weaker Euro versus the U.S. Dollar, Social Media sales and marketing expenses decreased by $0.6 million, or 8%.
53
Social Media Technology and Development
| |
Year Ended December 31, |
Change | |||||||||||
|---|---|---|---|---|---|---|---|---|---|---|---|---|---|
| |
2015 | 2014 | $ | % | |||||||||
| |
(in thousands, except percentages) |
||||||||||||
Social Media technology and development |
$ | 2,036 | $ | 2,557 | $ | (521 | ) | (20 | )% | ||||
Social Media technology and development expenses as a percentage of Social Media revenues |
8.9 | % | 8.5 | % | |||||||||
Adjusting for the favorable impact of foreign currency exchange rates due to a weaker Euro versus the U.S. Dollar, Social Media technology and development expenses were relatively flat for the year ended December 31, 2015, compared to the year ended December 31, 2014.
Social Media General and Administrative
| |
Year Ended December 31, |
Change | |||||||||||
|---|---|---|---|---|---|---|---|---|---|---|---|---|---|
| |
2015 | 2014 | $ | % | |||||||||
| |
(in thousands, except percentages) |
||||||||||||
Social Media general and administrative |
$ | 3,438 | $ | 3,967 | $ | (529 | ) | (13 | )% | ||||
Social Media general and administrative expenses as a percentage of Social Media revenues |
15.0 | % | 13.1 | % | |||||||||
Adjusting for the favorable impact of foreign currency exchange rates due to a weaker Euro versus the U.S. Dollar, Social Media general and administrative expenses increased by $0.2 million, or 4%.
Unallocated Corporate Results
Corporate Revenues
| |
Year Ended December 31, |
Change | |||||||||||
|---|---|---|---|---|---|---|---|---|---|---|---|---|---|
| |
2015 | 2014 | $ | % | |||||||||
| |
(in thousands, except percentages) |
||||||||||||
Corporate revenues |
$ | — | $ | 100 | $ | (100 | ) | (100 | )% | ||||
Corporate revenues for the year ended December 31, 2014 were related to transition services provided to FTD in connection with the FTD Spin-Off Transaction.
Unallocated Corporate Cost of Revenues
| |
Year Ended December 31, |
Change | |||||||||||
|---|---|---|---|---|---|---|---|---|---|---|---|---|---|
| |
2015 | 2014 | $ | % | |||||||||
| |
(in thousands, except percentages) |
||||||||||||
Unallocated corporate cost of revenues |
$ | 77 | $ | 230 | $ | (153 | ) | (67 | )% | ||||
Unallocated corporate cost of revenues consist of indirect cost of revenues associated with our former Classmates domestic business unit, which were not included in the results of discontinued operations. The decrease in unallocated corporate cost of revenues was primarily due to a decrease in personnel and overhead-related costs.
54
Unallocated Corporate Technology and Development
| |
Year Ended December 31, |
Change | |||||||||||
|---|---|---|---|---|---|---|---|---|---|---|---|---|---|
| |
2015 | 2014 | $ | % | |||||||||
| |
(in thousands, except percentages) |
||||||||||||
Unallocated corporate technology and development |
$ | 889 | $ | 894 | $ | (5 | ) | (1 | )% | ||||
Unallocated corporate technology and development expenses consist of indirect technology and development associated with our former Classmates domestic business unit, which were not included in the results of discontinued operations. Unallocated corporate technology and development expenses were flat for the year ended December 31, 2015 compared to the year ended December 31, 2014.
Unallocated Corporate General and Administrative
| |
Year Ended December 31, |
Change | |||||||||||
|---|---|---|---|---|---|---|---|---|---|---|---|---|---|
| |
2015 | 2014 | $ | % | |||||||||
| |
(in thousands, except percentages) |
||||||||||||
Unallocated corporate general and administrative |
$ | 20,567 | $ | 28,425 | $ | (7,858 | ) | (28 | )% | ||||
The decrease in unallocated corporate general and administrative expenses, excluding depreciation, was primarily due to a $6.7 million decrease in personnel and overhead-related costs due to our restructuring initiatives, including lower facilities-related costs in connection with moving our corporate headquarters, a $1.3 million decrease in professional services and consulting fees and a $0.3 million decrease in reserves recorded for legal settlements. These decreases were partially offset by a $0.4 million increase in transaction-related costs. Unallocated corporate general and administrative expenses associated with our former Classmates domestic business unit totaled $1.3 million and $2.0 million for the years ended December 31, 2015 and 2014, respectively. We anticipate unallocated corporate general and administrative expenses will continue to decline year over year in 2016.
Unallocated Corporate Restructuring and Other Exit Costs
| |
Year Ended December 31, |
Change | |||||||||||
|---|---|---|---|---|---|---|---|---|---|---|---|---|---|
| |
2015 | 2014 | $ | % | |||||||||
| |
(in thousands, except percentages) |
||||||||||||
Unallocated corporate restructuring and other exit costs |
$ | 365 | $ | 1,218 | $ | (853 | ) | (70 | )% | ||||
Unallocated corporate restructuring and other exit costs for the years ended December 31, 2015 and 2014, consisted of employee termination costs.
55
Year Ended December 31, 2014 compared to Year Ended December 31, 2013
Consolidated Results
Revenues
| |
Year Ended December 31, |
Change | |||||||||||
|---|---|---|---|---|---|---|---|---|---|---|---|---|---|
| |
2014 | 2013 | $ | % | |||||||||
| |
(in thousands, except percentages) |
||||||||||||
Revenues |
$ | 165,719 | $ | 177,131 | $ | (11,412 | ) | (6 | )% | ||||
Revenues as a percentage of total segment revenues: |
|||||||||||||
Communications |
62.3 | % | 57.0 | % | |||||||||
Commerce & Loyalty |
19.5 | % | 24.2 | % | |||||||||
Social Media |
18.3 | % | 18.8 | % | |||||||||
The decrease in consolidated revenues was primarily due to a $10.7 million decrease in revenues from our Commerce & Loyalty segment and a $3.0 million decrease in revenues from our Social Media segment, partially offset by a $2.3 million increase in revenues from our Communications segment.
Cost of Revenues
| |
Year Ended December 31, |
Change | |||||||||||
|---|---|---|---|---|---|---|---|---|---|---|---|---|---|
| |
2014 | 2013 | $ | % | |||||||||
| |
(in thousands, except percentages) |
||||||||||||
Cost of revenues |
$ | 61,101 | $ | 62,035 | $ | (934 | ) | (2 | )% | ||||
Cost of revenues as a percentage of total segment cost of revenues: |
|||||||||||||
Communications |
69.5 | % | 57.4 | % | |||||||||
Commerce & Loyalty |
25.7 | % | 38.0 | % | |||||||||
Social Media |
4.8 | % | 4.5 | % | |||||||||
The decrease in consolidated cost of revenues was primarily due to a $7.5 million decrease in cost of revenues associated with our Commerce & Loyalty segment and a $0.2 million decrease in depreciation expense, significantly offset by a $6.5 million increase in cost of revenues associated with our Communications segment.
Sales and Marketing
| |
Year Ended December 31, |
Change | |||||||||||
|---|---|---|---|---|---|---|---|---|---|---|---|---|---|
| |
2014 | 2013 | $ | % | |||||||||
| |
(in thousands, except percentages) |
||||||||||||
Sales and marketing |
$ | 32,030 | $ | 38,518 | $ | (6,488 | ) | (17 | )% | ||||
Sales and marketing expenses as a percentage of total segment sales and marketing expenses: |
|||||||||||||
Communications |
45.0 | % | 43.2 | % | |||||||||
Commerce & Loyalty |
31.0 | % | 33.2 | % | |||||||||
Social Media |
23.9 | % | 23.5 | % | |||||||||
The decrease in consolidated sales and marketing expenses was primarily due to a $2.9 million decrease in sales and marketing expenses associated with our Commerce & Loyalty segment, a $2.2 million decrease in sales and marketing expenses associated with our Communications segment and a $1.4 million decrease in sales and marketing expenses associated with our Social Media segment.
56
Technology and Development
| |
Year Ended December 31, |
Change | |||||||||||
|---|---|---|---|---|---|---|---|---|---|---|---|---|---|
| |
2014 | 2013 | $ | % | |||||||||
| |
(in thousands, except percentages) |
||||||||||||
Technology and development |
$ | 17,219 | $ | 18,305 | $ | (1,086 | ) | (6 | )% | ||||
Technology and development expenses as a percentage of total segment technology and development expenses: |
|||||||||||||
Communications |
61.0 | % | 52.0 | % | |||||||||
Commerce & Loyalty |
20.1 | % | 28.1 | % | |||||||||
Social Media |
18.9 | % | 19.9 | % | |||||||||
The decrease in consolidated technology and development expenses was primarily due to a $1.3 million decrease in technology and development expenses associated with our Commerce & Loyalty segment, a $0.4 million decrease in unallocated corporate technology and development expenses and a $0.3 million decrease in technology and development expenses associated with our Social Media segment. These decreases were partially offset by a $0.8 million increase in technology and development expenses associated with our Communications segment.
General and Administrative
| |
Year Ended December 31, |
Change | |||||||||||
|---|---|---|---|---|---|---|---|---|---|---|---|---|---|
| |
2014 | 2013 | $ | % | |||||||||
| |
(in thousands, except percentages) |
||||||||||||
General and administrative |
$ | 48,388 | $ | 58,508 | $ | (10,120 | ) | (17 | )% | ||||
General and administrative expenses as a percentage of total segment general and administrative expenses: |
|||||||||||||
Communications |
55.8 | % | 53.8 | % | |||||||||
Commerce & Loyalty |
23.1 | % | 26.6 | % | |||||||||
Social Media |
21.1 | % | 19.5 | % | |||||||||
The decrease in consolidated general and administrative expenses was primarily due to a $9.3 million decrease in unallocated corporate general and administrative expenses, as well as a $0.9 million decrease in general and administrative expenses associated with our Commerce & Loyalty segment.
Amortization of Intangible Assets
| |
Year Ended December 31, |
Change | |||||||||||
|---|---|---|---|---|---|---|---|---|---|---|---|---|---|
| |
2014 | 2013 | $ | % | |||||||||
| |
(in thousands, except percentages) |
||||||||||||
Amortization of intangible assets |
$ | 421 | $ | 399 | $ | 22 | 6 | % | |||||
Consolidated amortization of intangible assets was essentially flat for the year ended December 31, 2014, compared to the year ended December 31, 2013.
57
Restructuring and Other Exit Costs
| |
Year Ended December 31, |
Change | |||||||||||
|---|---|---|---|---|---|---|---|---|---|---|---|---|---|
| |
2014 | 2013 | $ | % | |||||||||
| |
(in thousands, except percentages) |
||||||||||||
Restructuring and other exit costs |
$ | 3,054 | $ | 1,192 | $ | 1,862 | 156 | % | |||||
Consolidated restructuring and other exit costs for the year ended December 31, 2014 included $1.1 million and $0.4 million of employee termination costs and facility closure and relocation costs, respectively, in the Commerce & Loyalty segment, as well as $1.2 million of employee termination costs in unallocated corporate expenses and $0.4 million of employee termination costs in the Communications segment. These restructuring charges were a result of management's decision to streamline segment operations and increase profitability.
Consolidated restructuring and other exit costs for the year ended December 31, 2013 included $1.2 million of employee termination costs recorded in our Commerce & Loyalty segment.
Impairment of Goodwill, Intangible Assets and Long-Lived Assets
| |
Year Ended December 31, |
Change | |||||||||||
|---|---|---|---|---|---|---|---|---|---|---|---|---|---|
| |
2014 | 2013 | $ | % | |||||||||
| |
(in thousands, except percentages) |
||||||||||||
Impairment of goodwill, intangible assets and long-lived assets |
$ | — | $ | 37,756 | $ | (37,756 | ) | (100 | )% | ||||
Goodwill impairment charges totaling $37.8 million were recorded in the year ended December 31, 2013 due to a material reduction in the fair value of the Social Media reporting unit.
Interest Income
| |
Year Ended December 31, |
Change | |||||||||||
|---|---|---|---|---|---|---|---|---|---|---|---|---|---|
| |
2014 | 2013 | $ | % | |||||||||
| |
(in thousands, except percentages) |
||||||||||||
Interest income |
$ | 388 | $ | 260 | $ | 128 | 49 | % | |||||
The increase in consolidated interest income was primarily due to higher invested cash balances at our India subsidiary.
Interest Expense
| |
Year Ended December 31, |
Change | |||||||||||
|---|---|---|---|---|---|---|---|---|---|---|---|---|---|
| |
2014 | 2013 | $ | % | |||||||||
| |
(in thousands, except percentages) |
||||||||||||
Interest expense |
$ | — | $ | 12 | $ | (12 | ) | (100 | )% | ||||
Interest expense was immaterial for the years ended December 31, 2014 and 2013.
58
Other Income, Net
| |
Year Ended December 31, |
Change | |||||||||||
|---|---|---|---|---|---|---|---|---|---|---|---|---|---|
| |
2014 | 2013 | $ | % | |||||||||
| |
(in thousands, except percentages) |
||||||||||||
Other income, net |
$ | 505 | $ | 213 | $ | 292 | 137 | % | |||||
The increase in consolidated other income, net, was primarily due to an increase in realized and unrealized gains related to forward currency exchange contracts, partially offset by a decrease in gains associated with foreign exchange remeasurement.
Provision for Income Taxes
| |
Year Ended December 31, |
||||||
|---|---|---|---|---|---|---|---|
| |
2014 | 2013 | |||||
| |
(in thousands, except percentages) |
||||||
Provision for income taxes |
$ | 841 | $ | 46,595 | |||
Effective income tax rate |
19.1 | % | (119.1 | )% | |||
For the year ended December 31, 2014, we recorded a provision for income taxes totaling $0.8 million on a pre-tax income totaling $4.4 million, compared to a provision for income taxes totaling $46.6 million on a pre-tax loss totaling $39.1 million for the year ended December 31, 2013. The change in the effective income tax rate was primarily due to the valuation allowance release recognized against our domestic deferred tax assets in the year ended December 31, 2014, compared to a valuation allowance reserve recorded against our domestic deferred tax assets, the effect of the goodwill impairment charge and uncertain tax positions recorded in the year ended December 31, 2013.
Communications Segment Results
Communications Revenues
| |
Year Ended December 31, |
Change | |||||||||||
|---|---|---|---|---|---|---|---|---|---|---|---|---|---|
| |
2014 | 2013 | $ | % | |||||||||
| |
(in thousands, except percentages and ARPU) |
||||||||||||
Services |
$ | 68,727 | $ | 68,599 | $ | 128 | — | % | |||||
Products |
6,254 | 3,537 | 2,717 | 77 | % | ||||||||
Advertising |
28,184 | 28,722 | (538 | ) | (2 | )% | |||||||
| | | | | | | | | | | | | | |
Total Communications revenues |
$ | 103,165 | $ | 100,858 | $ | 2,307 | 2 | % | |||||
| | | | | | | | | | | | | | |
| | | | | | | | | | | | | | |
| | | | | | | | | | | | | | |
ARPU |
$ | 10.85 | $ | 9.37 | $ | 1.48 | 16 | % | |||||
Average number of pay accounts |
522 | 602 | (80 | ) | (13 | )% | |||||||
The increase in Communications revenues consisted primarily of a $2.7 million increase in products revenues driven by the sale of mobile broadband devices from higher signups and lower discounting on devices. The increase in Communications services revenues was due to an $11.3 million increase in mobile broadband services revenues driven by the increase in the number of mobile broadband subscribers, largely offset by a $10.7 million decrease in dial-up and DSL services revenues. The increase in ARPU was due to a higher percentage of mobile broadband subscribers, which have higher ARPUs, as well as an increase in mobile broadband ARPU. The decrease in advertising
59
revenues was due to a decline in active accounts, partially offset by an increase in advertising revenues due to higher advertising rates.
Communications Cost of Revenues
| |
Year Ended December 31, |
Change | |||||||||||
|---|---|---|---|---|---|---|---|---|---|---|---|---|---|
| |
2014 | 2013 | $ | % | |||||||||
| |
(in thousands, except percentages) |
||||||||||||
Communications cost of revenues |
$ | 40,412 | $ | 33,865 | $ | 6,547 | 19 | % | |||||
Communications cost of revenues as a percentage of Communications revenues |
39.2 | % | 33.6 | % | |||||||||
The increase in Communications cost of revenues was primarily due to a $9.7 million increase in costs associated with our mobile broadband service due to increased mobile broadband subscribers. The increase was partially offset by a $1.8 million decrease in costs associated with our DSL service due to a decrease in the number of DSL subscribers, as well as a $0.7 million decrease in telecommunications costs and a $0.6 million decrease in customer support and billing-related costs due to a decrease in the number of dial-up Internet access pay accounts. In addition, costs associated with our email and Internet security services decreased by $0.4 million. Included in the cost associated with our mobile broadband services was a provision for excess inventory and obsolescence, as well as a markdown of mobile broadband service inventory-related balances totaling $1.1 million.
Communications Sales and Marketing
| |
Year Ended December 31, |
Change | |||||||||||
|---|---|---|---|---|---|---|---|---|---|---|---|---|---|
| |
2014 | 2013 | $ | % | |||||||||
| |
(in thousands, except percentages) |
||||||||||||
Communications sales and marketing |
$ | 14,425 | $ | 16,617 | $ | (2,192 | ) | (13 | )% | ||||
Communications sales and marketing expenses as a percentage of Communications revenues |
14.0 | % | 16.5 | % | |||||||||
The decrease in Communications sales and marketing expenses was primarily due to a $1.5 million decrease in mobile broadband marketing costs across Sprint's 3G Network, which expanded the potential subscriber base for mobile broadband services and a $0.5 million decrease in marketing costs associated with our dial-up services due to a decrease in demand for dial-up Internet access.
Communications Technology and Development
| |
Year Ended December 31, |
Change | |||||||||||
|---|---|---|---|---|---|---|---|---|---|---|---|---|---|
| |
2014 | 2013 | $ | % | |||||||||
| |
(in thousands, except percentages) |
||||||||||||
Communications technology and development |
$ | 8,259 | $ | 7,419 | $ | 840 | 11 | % | |||||
Communications technology and development expenses as a percentage of Communications revenues |
8.0 | % | 7.4 | % | |||||||||
The increase in Communications technology and development expenses was due to an increase in personnel and overhead-related costs.
60
Communications General and Administrative
| |
Year Ended December 31, |
Change | |||||||||||
|---|---|---|---|---|---|---|---|---|---|---|---|---|---|
| |
2014 | 2013 | $ | % | |||||||||
| |
(in thousands, except percentages) |
||||||||||||
Communications general and administrative |
$ | 10,496 | $ | 10,576 | $ | (80 | ) | (1 | )% | ||||
Communications general and administrative expenses as a percentage of Communications revenues |
10.2 | % | 10.5 | % | |||||||||
The decrease in Communications general and administrative expenses was primarily due to a $0.8 million decrease in personnel and overhead-related costs and a $0.1 million decrease in professional services and consulting fees, largely offset by a $0.9 million increase in legal amounts recorded attributable to the mutual agreement to terminate the employment of an executive officer.
Communications Restructuring and Other Exit Costs
| |
Year Ended December 31, |
Change | |||||||||
|---|---|---|---|---|---|---|---|---|---|---|---|
| |
2014 | 2013 | $ | % | |||||||
| |
(in thousands, except percentages) |
||||||||||
Communications restructuring and other exit costs |
$ | 379 | $ | — | $ | 379 | N/A | ||||
Communications restructuring and other exit costs for the year ended December 31, 2014 consisted primarily of employee termination costs.
Commerce & Loyalty Segment Results
Commerce & Loyalty Revenues
| |
Year Ended December 31, |
Change | |||||||||||
|---|---|---|---|---|---|---|---|---|---|---|---|---|---|
| |
2014 | 2013 | $ | % | |||||||||
| |
(in thousands, except percentages and ARPU) |
||||||||||||
Products |
$ | — | $ | 597 | $ | (597 | ) | (100 | )% | ||||
Advertising and other |
32,218 | 42,287 | (10,069 | ) | (24 | )% | |||||||
| | | | | | | | | | | | | | |
Total Commerce & Loyalty revenues |
$ | 32,218 | $ | 42,884 | $ | (10,666 | ) | (25 | )% | ||||
| | | | | | | | | | | | | | |
| | | | | | | | | | | | | | |
| | | | | | | | | | | | | | |
The decrease in Commerce & Loyalty advertising and other revenues was primarily due to restructuring initiatives, which resulted in a $4.3 million decrease in display advertising revenues, a $3.4 million decrease in gift card revenues, a $0.9 million decrease in market research revenues, a $0.6 million decrease in games revenues, and a $0.3 million decrease in search revenues. The decrease in Commerce & Loyalty products revenues was due to a decrease in revenues generated from the sale of third-party merchandise.
61
Commerce & Loyalty Cost of Revenues
| |
Year Ended December 31, |
Change | |||||||||||
|---|---|---|---|---|---|---|---|---|---|---|---|---|---|
| |
2014 | 2013 | $ | % | |||||||||
| |
(in thousands, except percentages) |
||||||||||||
Commerce & Loyalty cost of revenues |
$ | 14,941 | $ | 22,421 | $ | (7,480 | ) | (33 | )% | ||||
Commerce & Loyalty cost of revenues as a percentage of Commerce & Loyalty revenues |
46.4 | % | 52.3 | % | |||||||||
The decrease in Commerce & Loyalty cost of revenues was primarily due to a $3.4 million decrease in costs related to the sale of gift cards, a $2.4 million decrease in point costs, a $1.1 million decrease in personnel and overhead-related costs due to our restructuring initiatives in April 2014, and a $0.5 million decrease in costs associated with the sale of third-party merchandise.
Commerce & Loyalty Sales and Marketing
| |
Year Ended December 31, |
Change | |||||||||||
|---|---|---|---|---|---|---|---|---|---|---|---|---|---|
| |
2014 | 2013 | $ | % | |||||||||
| |
(in thousands, except percentages) |
||||||||||||
Commerce & Loyalty sales and marketing |
$ | 9,933 | $ | 12,784 | $ | (2,851 | ) | (22 | )% | ||||
Commerce & Loyalty sales and marketing expenses as a percentage of Commerce & Loyalty revenues |
30.8 | % | 29.8 | % | |||||||||
The decrease in Commerce & Loyalty sales and marketing expenses was due to a $2.6 million decrease in personnel and overhead-related costs as a result of our restructuring initiatives in April 2014 and a $0.2 million decrease in online loyalty marketing spend.
Commerce & Loyalty Technology and Development
| |
Year Ended December 31, |
Change | |||||||||||
|---|---|---|---|---|---|---|---|---|---|---|---|---|---|
| |
2014 | 2013 | $ | % | |||||||||
| |
(in thousands, except percentages) |
||||||||||||
Commerce & Loyalty technology and development |
$ | 2,719 | $ | 4,006 | $ | (1,287 | ) | (32 | )% | ||||
Commerce & Loyalty technology and development expenses as a percentage of Commerce & Loyalty revenues |
8.4 | % | 9.3 | % | |||||||||
The decrease in Commerce & Loyalty technology and development expenses was the result of a decrease in personnel and overhead-related costs due to our restructuring initiatives in April 2014.
Commerce & Loyalty General and Administrative
| |
Year Ended December 31, |
Change | |||||||||||
|---|---|---|---|---|---|---|---|---|---|---|---|---|---|
| |
2014 | 2013 | $ | % | |||||||||
| |
(in thousands, except percentages) |
||||||||||||
Commerce & Loyalty general and administrative |
$ | 4,340 | $ | 5,238 | $ | (898 | ) | (17 | )% | ||||
Commerce & Loyalty general and administrative expenses as a percentage of Commerce & Loyalty revenues |
13.5 | % | 12.2 | % | |||||||||
The decrease in Commerce & Loyalty general and administrative expenses was primarily due to a $0.7 million decrease in personnel and overhead-related costs as a result of our restructuring initiatives in April 2014, as well as a $0.3 million decrease in bad debt expense.
62
Commerce & Loyalty Restructuring and Other Exit Costs
| |
Year Ended December 31, |
Change | |||||||||||
|---|---|---|---|---|---|---|---|---|---|---|---|---|---|
| |
2014 | 2013 | $ | % | |||||||||
| |
(in thousands, except percentages) |
||||||||||||
Commerce & Loyalty restructuring and other exit costs |
$ | 1,457 | $ | 1,192 | $ | 265 | 22 | % | |||||
Commerce & Loyalty restructuring and other exit costs for the year ended December 31, 2014 consisted primarily of employee termination costs and facility closure and relocation costs. Restructuring and other exit costs for the year ended December 31, 2013 consisted primarily of employee termination costs. These restructuring charges were a result of management's decision to streamline operations, prioritize resources for growth initiatives and increase profitability.
Social Media Segment Results
Social Media Revenues
| |
Year Ended December 31, |
Change | |||||||||||
|---|---|---|---|---|---|---|---|---|---|---|---|---|---|
| |
2014 | 2013 | $ | % | |||||||||
| |
(in thousands, except percentages and ARPU) |
||||||||||||
Services |
$ | 27,926 | $ | 30,792 | $ | (2,866 | ) | (9 | )% | ||||
Products |
814 | 716 | 98 | 14 | % | ||||||||
Advertising and other |
1,496 | 1,761 | (265 | ) | (15 | )% | |||||||
| | | | | | | | | | | | | | |
Total Social Media revenues |
$ | 30,236 | $ | 33,269 | $ | (3,033 | ) | (9 | )% | ||||
| | | | | | | | | | | | | | |
| | | | | | | | | | | | | | |
| | | | | | | | | | | | | | |
ARPU |
$ | 1.90 | $ | 1.90 | $ | — | — | % | |||||
Average pay accounts |
1,225 | 1,348 | (123 | ) | (9 | )% | |||||||
Social Media services revenues decreased due to a decrease in average pay accounts. The decrease in Social Media advertising revenues was attributable to lower active accounts and a decrease in advertising impressions delivered.
Social Media Cost of Revenues
| |
Year Ended December 31, |
Change | |||||||||||
|---|---|---|---|---|---|---|---|---|---|---|---|---|---|
| |
2014 | 2013 | $ | % | |||||||||
| |
(in thousands, except percentages) |
||||||||||||
Social Media cost of revenues |
$ | 2,786 | $ | 2,670 | $ | 116 | 4 | % | |||||
Social Media cost of revenues as a percentage of Social Media revenues |
9.2 | % | 8.0 | % | |||||||||
Social Media cost of revenues was relatively flat for the year ended December 31, 2014, compared to the year ended December 31, 2013.
63
Social Media Sales and Marketing
| |
Year Ended December 31, |
Change | |||||||||||
|---|---|---|---|---|---|---|---|---|---|---|---|---|---|
| |
2014 | 2013 | $ | % | |||||||||
| |
(in thousands, except percentages) |
||||||||||||
Social Media sales and marketing |
$ | 7,666 | $ | 9,053 | $ | (1,387 | ) | (15 | )% | ||||
Social Media sales and marketing expenses as a percentage of Social Media revenues |
25.4 | % | 27.2 | % | |||||||||
The decrease in Social Media sales and marketing expenses was primarily due to $1.8 million in reduced spending on customer acquisition, partially offset by a $0.4 million increase in personnel and overhead-related costs.
Social Media Technology and Development
| |
Year Ended December 31, |
Change | |||||||||||
|---|---|---|---|---|---|---|---|---|---|---|---|---|---|
| |
2014 | 2013 | $ | % | |||||||||
| |
(in thousands, except percentages) |
||||||||||||
Social Media technology and development |
$ | 2,557 | $ | 2,847 | $ | (290 | ) | (10 | )% | ||||
Social Media technology and development expenses as a percentage of Social Media revenues |
8.5 | % | 8.6 | % | |||||||||
The decrease in Social Media technology and development expenses was due to a decrease in personnel and overhead-related costs.
Social Media General and Administrative
| |
Year Ended December 31, |
Change | |||||||||||
|---|---|---|---|---|---|---|---|---|---|---|---|---|---|
| |
2014 | 2013 | $ | % | |||||||||
| |
(in thousands, except percentages) |
||||||||||||
Social Media general and administrative |
$ | 3,967 | $ | 3,842 | $ | 125 | 3 | % | |||||
Social Media general and administrative expenses as a percentage of Social Media revenues |
13.1 | % | 11.5 | % | |||||||||
Social Media general and administrative expenses were relatively flat for the year ended December 31, 2014, compared to the year ended December 31, 2013.
Unallocated Corporate Results
Corporate Revenues
| |
Year Ended December 31, |
Change | |||||||||||
|---|---|---|---|---|---|---|---|---|---|---|---|---|---|
| |
2014 | 2013 | $ | % | |||||||||
| |
(in thousands, except percentages) |
||||||||||||
Corporate revenues |
$ | 100 | $ | 145 | $ | (45 | ) | (31 | )% | ||||
Corporate revenues for the years ended December 31, 2014 and 2013 were related to transition services provided to FTD in connection with the FTD Spin-Off Transaction.
64
Unallocated Corporate Cost of Revenues
| |
Year Ended December 31, |
Change | |||||||||||
|---|---|---|---|---|---|---|---|---|---|---|---|---|---|
| |
2014 | 2013 | $ | % | |||||||||
| |
(in thousands, except percentages) |
||||||||||||
Unallocated corporate cost of revenues |
$ | 230 | $ | 134 | $ | 96 | 72 | % | |||||
Unallocated corporate cost of revenues consist of indirect cost of revenues associated with our former Classmates domestic business unit, which were not included in the results of discontinued operations. Unallocated corporate cost of revenues were relatively flat for the year ended December 31, 2014, compared to the year ended December 31, 2013.
Unallocated Corporate Sales and Marketing
| |
Year Ended December 31, |
Change | |||||||||||
|---|---|---|---|---|---|---|---|---|---|---|---|---|---|
| |
2014 | 2013 | $ | % | |||||||||
| |
(in thousands, except percentages) |
||||||||||||
Unallocated corporate sales and marketing |
$ | — | $ | 85 | $ | (85 | ) | (100 | )% | ||||
Unallocated corporate sales and marketing expenses consist of indirect sales and marketing associated with our former Classmates domestic business unit, which were not included in the results of discontinued operations. Unallocated corporate sales and marketing expenses were relatively flat for the year ended December 31, 2014, compared to the year ended December 31, 2013.
Unallocated Corporate Technology and Development
| |
Year Ended December 31, |
Change | |||||||||||
|---|---|---|---|---|---|---|---|---|---|---|---|---|---|
| |
2014 | 2013 | $ | % | |||||||||
| |
(in thousands, except percentages) |
||||||||||||
Unallocated corporate technology and development |
$ | 894 | $ | 1,329 | $ | (435 | ) | (33 | )% | ||||
Unallocated corporate technology and development expenses consist of indirect technology and development associated with our former Classmates domestic business unit, which were not included in the results of discontinued operations. The decrease in unallocated corporate technology and development expenses was primarily due to a decrease in personnel and overhead-related costs.
Unallocated Corporate General and Administrative
| |
Year Ended December 31, |
Change | |||||||||||
|---|---|---|---|---|---|---|---|---|---|---|---|---|---|
| |
2014 | 2013 | $ | % | |||||||||
| |
(in thousands, except percentages) |
||||||||||||
Unallocated corporate general and administrative |
$ | 28,425 | $ | 37,764 | $ | (9,339 | ) | (25 | )% | ||||
The decrease in unallocated corporate general and administrative expenses, excluding depreciation, was primarily due to an $8.3 million decrease in transaction-related costs, as well as a $2.3 million decrease in personnel and overhead-related costs due to our restructuring initiatives, including lower facilities-related costs in connection with moving our corporate headquarters. These decreases were partially offset by a $0.8 million increase in professional services and consulting fees and a $0.4 million increase in reserves recorded for legal settlements. Unallocated corporate general and administrative
65
expenses associated with our former Classmates domestic business unit totaled $2.0 million and $1.4 million for the years ended December 31, 2014 and 2013, respectively.
Unallocated Corporate Restructuring and Other Exit Costs
| |
Year Ended December 31, |
Change | |||||||||||
|---|---|---|---|---|---|---|---|---|---|---|---|---|---|
| |
2014 | 2013 | $ | % | |||||||||
| |
(in thousands, except percentages) |
||||||||||||
Unallocated corporate restructuring and other exit costs |
$ | 1,218 | $ | — | $ | 1,218 | N/A | ||||||
Unallocated corporate restructuring and other exit costs for the year ended December 31, 2014 consisted of employee termination costs.
Liquidity and Capital Resources
Our summary cash flows for the periods presented were as follows (in thousands):
| |
Year Ended December 31, | |||||||||
|---|---|---|---|---|---|---|---|---|---|---|
| |
2015 | 2014 | 2013 | |||||||
Net cash provided by operating activities |
$ | 5,279 | $ | 17,929 | $ | 13,769 | ||||
Net cash used for investing activities |
$ | (5,427 | ) | $ | (7,713 | ) | $ | (5,559 | ) | |
Net cash provided by (used for) financing activities |
$ | 1,312 | $ | (1,366 | ) | $ | (26,043 | ) | ||
Year Ended December 31, 2015 Compared to Year Ended December 31, 2014
Our total cash and cash equivalents balance increased by $26.2 million, or 33%, to $104.8 million at December 31, 2015, compared to $78.6 million at December 31, 2014.
Net cash provided by operating activities from continuing operations decreased by $12.7 million, or 71%. The decrease was primarily driven by:
- •
- an $8.0 million unfavorable change in accounts payable and accrued liabilities due to a $6.4 million settlement with the
Internal Revenue Service accrued in a prior period and paid in 2015; a $1.0 million unfavorable change in personnel-related cost liabilities due to our restructuring initiatives; a
$0.9 million separation settlement with a former executive officer accrued in 2014 and paid in 2015; and an unfavorable change in accrued costs related to our Communications services. These
unfavorable changes were partially offset by favorable changes in income taxes payable and accrued legal fees;
- •
- a $4.7 million unfavorable change in other assets primarily due to income taxes receivable; a receivable recorded from a
supplier related to our mobile broadband service; a $0.7 million receivable recorded in connection with the sale of our former Classmates domestic business unit; and an unfavorable change in
other receivables;
- •
- a $3.4 million unfavorable change in accounts receivable primarily due to declines in advertising revenues;
- •
- a $2.9 million unfavorable change in inventories due to an increase in gift card inventory held at December 31, 2015,
compared to December 31, 2014, driven by increased gift card sales for our Commerce & Loyalty segment;
- •
- a $3.2 million favorable change due to an increase in income from continuing operations, net of non-cash reconciling items;
66
- •
- a $1.7 million favorable change in member redemption liability primarily due to a decline in online loyalty marketing revenues
in 2014 and an increase in such revenues in 2015; and
- •
- a $1.3 million favorable change in other liabilities primarily due to a decrease, in 2014, in reserves for uncertain tax positions.
Net cash used for investing activities from continuing operations decreased by $2.3 million, or 30% primarily due to a decrease in purchases of property and equipment.
- •
- Capital expenditures for the year ended December 31, 2015 totaled $5.7 million. At December 31, 2015 and 2014, we had $0.2 million and $2.6 million, respectively, of property and equipment that was not yet paid for and was included in accounts payable and other liabilities in the consolidated balance sheets. We currently anticipate that our total capital expenditures for 2016 will be in the range of $4.0 million to $5.0 million, which includes the aforementioned $0.2 million of purchases on account at December 31, 2015. The actual amount of future capital expenditures may fluctuate due to a number of factors, which are difficult to predict. Technological advances may require us to make capital expenditures to develop or acquire new equipment or technology in order to replace aging or technologically obsolete equipment.
Net cash provided by financing activities from continuing operations increased by $2.7 million, or 196%. The increase was primarily due to a $1.7 million increase in proceeds from exercises of stock options and a $1.1 million decrease in repurchases of common stock.
Future cash flows from financing activities may be affected by our repurchases of shares of our common stock. Our Board of Directors authorized a common stock repurchase program (the "Program") that allows us to repurchase shares of our common stock through open market or privately-negotiated transactions based on prevailing market conditions and other factors. Our Board of Directors has approved and ratified the Program through December 31, 2015, which date was recently extended by the Board of Directors (in December 2015) to December 31, 2018. There were no repurchases under the Program during the years ended December 31, 2015, 2014, or 2013 and, at December 31, 2015, the authorization remaining under the Program was $80.0 million.
Cash flows from financing activities may also be impacted by the withholding of a portion of shares underlying the restricted stock units we grant to employees. In general, we currently do not collect the minimum statutory employee withholding taxes from employees upon vesting of restricted stock units. Instead, we automatically withhold, from the restricted stock units that vest, the portion of those shares with a fair market value equal to the amount of the minimum statutory employee withholding taxes due. We then pay the minimum statutory withholding taxes in cash. The withholding of these shares, although accounted for as a common stock repurchase, does not reduce the amount available under the Program. Similar to repurchases of common stock under the Program, the net effect of such withholding will adversely impact our cash flows from financing activities. The amounts remitted in the years ended December 31, 2015, 2014, and 2013, were $1.7 million, $2.8 million and $4.3 million, respectively, for which we withheld 0.1 million, 0.3 million and 0.3 million shares of common stock, respectively, that were underlying the restricted stock units that vested. The amount we pay in future periods will vary based on our stock price and the number of applicable restricted stock units vesting during the period.
On an ongoing basis, we assess opportunities for improved operational effectiveness and efficiency, which may result in restructuring. Although restructuring efforts may reduce expenses and generate improved operating efficiencies, there can be no assurances that our restructuring efforts will be successful. In addition, past restructuring activities may not be a good indication of future restructuring opportunities, and any restructuring of our businesses may leave us with reduced financial and marketing resources to develop products and services to compete against our competitors. We recorded restructuring and other exit costs totaling $1.5 million in the year ended December 31, 2015, which
67
consisted of employee termination costs. During the year ended December 31, 2015, we paid $1.5 million of restructuring and other exit costs. At December 31, 2015, accrued restructuring and other exit costs totaled $0.1 million, which will be paid within 12 months.
Based on our current projections, we expect to continue to generate positive cash flows from operations, at least for the next 12 months. We may use our existing cash balances and future cash generated from operations to fund, among other things, long-term growth initiatives, which may include optimizing our current product offerings to enhance our consumer value proposition, expanding new product development efforts to drive new revenue growth, and pursuing acquisitions, new strategic partnerships and other opportunities to expand our scope and reach; the repurchase of our common stock underlying restricted stock units to pay the minimum statutory employee withholding taxes due on vested restricted stock units; the repurchase of our common stock under the Program; future capital expenditures; and future acquisitions of intangible assets, including rights, content and intellectual property.
In March 2015, we reached an audit settlement with the Internal Revenue Service and, in connection with such settlement, we remitted $6.4 million to the Internal Revenue Service in the quarter ended June 30, 2015, for which we had previously established a reserve. Additionally, as discussed in Note 12, "Contingencies—Legal Matters" of the Notes to Consolidated Financial Statements included in Part II, Item 8 of this Annual Report on Form 10-K, Classmates, Inc. cooperated with a Multistate Work Group of Attorneys General in connection with their investigations of our former post-transaction sales practices and certain other current or former business practices. In May 2015, Classmates, Inc. executed settlement agreements with each member of the Multistate Work Group, and in July 2015, we remitted $8.2 million in connection with the settlements, which was included in discontinued operations in the consolidated statement of operations. In October 2015, we received insurance proceeds in the amount of $4.2 million related to the Multistate Work Group inquiry and accompanying legal fees. Of this amount, $2.8 million was allocated to United Online, Inc., which was included in cash flows from discontinued operations, and $1.4 million was allocated to FTD, which was remitted to FTD in October 2015.
If we need to raise additional capital through public or private debt or equity financings, strategic relationships or other arrangements, this capital might not be available to us in a timely manner, on acceptable terms, or at all. Our failure to raise sufficient capital when needed could severely constrain or prevent us from, among other factors, long-term growth initiatives, which may include optimizing our current product offerings to enhance our consumer value proposition, expanding new product development efforts to drive new revenue growth, and pursuing new strategic partnerships and other opportunities to expand our scope and reach; the repurchase of our common stock underlying restricted stock units to pay the minimum statutory employee withholding taxes due on vested restricted stock units; the repurchase of our common stock under the Program; future capital expenditures; and future acquisitions of intangible assets, including rights, content and intellectual property, and may have a material adverse effect on our business, financial position, results of operations, and cash flows, as well as impair our ability to pay future dividends and our ability to service our debt obligations. If additional funds were raised through the issuance of equity or convertible debt securities, the percentage of stock owned by the then-current stockholders could be reduced. Furthermore, such equity or any debt securities that we issue might have rights, preferences or privileges senior to holders of our common stock. In addition, trends in the securities and credit markets may restrict our ability to raise any such additional funds, at least in the near term.
68
Year Ended December 31, 2014 Compared to Year Ended December 31, 2013
Net cash provided by operating activities from continuing operations increased by $4.2 million, or 30%. The increase was primarily driven by:
- •
- an $8.1 million favorable change due to an increase in income from continuing operations, net of non-cash reconciling items;
- •
- a $5.6 million favorable change in accounts receivable due to a decline in Communications advertising revenues, as well as a
decline in Commerce & Loyalty revenues in 2014 primarily as a result of our restructuring initiatives in the year ended December 31, 2014;
- •
- a $1.0 million favorable change in inventories due to a $3.1 million favorable change from our Communications segment as
a result of a decrease in mobile broadband device inventory in the year ended December 31, 2014, coupled with an increase in inventory in the year ended December 31, 2013. These
favorable changes were significantly offset by a $2.1 million unfavorable change from our Commerce & Loyalty segment due to a slight gift card inventory decrease in the year ended
December 31, 2014, compared to a $2.2 million decrease in the year ended December 31, 2013;
- •
- a $5.1 million unfavorable change in accounts payable and accrued liabilities primarily due to a $6.2 million tax
accrual established in 2013 for a settlement with the Internal Revenue Service, and the timing of payments;
- •
- a $3.2 million unfavorable change in other assets primarily due to a $2.8 million unfavorable change in income taxes
receivable;
- •
- a $1.8 million unfavorable change in other liabilities due to a decrease in reserves for uncertain tax positions in the year
ended December 31, 2014; and
- •
- a $0.6 million unfavorable change in member redemption liability primarily due to a decline in Commerce & Loyalty revenues in 2014 as a result of restructuring initiatives in the year ended December 31, 2014.
Net cash used for investing activities from continuing operations increased by $2.2 million, or 39%. The increase was primarily due to a $2.5 million increase in purchases of property and equipment, partially offset by a $0.3 million increase in proceeds from sales of investments.
Net cash used for financing activities from continuing operations decreased by $24.7 million, or 95%. The decrease in net cash used for financing activities was due to a $31.0 million decrease in payments of dividends and dividend equivalents on nonvested restricted stock units and a $1.5 million decrease in repurchase of common stock. These decreases were partially offset by a $5.1 million decrease in proceeds from exercises of stock options, a $1.6 million decrease in proceeds from employee stock purchase plans, and a $1.1 million decrease in excess tax benefits from equity awards.
69
Contractual Obligations
Contractual obligations at December 31, 2015 were as follows (in thousands):
| |
Total | Less than 1 Year |
1 Year to Less than 3 Years |
3 Years to Less than 5 Years |
More than 5 Years |
|||||||||||
|---|---|---|---|---|---|---|---|---|---|---|---|---|---|---|---|---|
Member redemption liability |
$ | 18,103 | $ | 6,781 | $ | 6,215 | $ | 2,580 | $ | 2,527 | ||||||
Noncancelable operating leases |
11,453 | 3,222 | 4,250 | 3,683 | 298 | |||||||||||
Purchase obligations |
1,197 | 1,197 | — | — | — | |||||||||||
Other liabilities |
1,283 | 1,263 | 10 | 10 | — | |||||||||||
| | | | | | | | | | | | | | | | | |
Total |
$ | 32,036 | $ | 12,463 | $ | 10,475 | $ | 6,273 | $ | 2,825 | ||||||
| | | | | | | | | | | | | | | | | |
| | | | | | | | | | | | | | | | | |
| | | | | | | | | | | | | | | | | |
At December 31, 2015, we had liabilities for uncertain tax positions totaling $4.8 million, of which $1.3 million was included in other liabilities in the contractual obligations table above and, at December 31, 2015, was expected to be due in less than one year. We are not able to reasonably estimate when or if cash payments for long-term liabilities related to uncertain tax positions will occur.
Commitments under letters of credit at December 31, 2015 were scheduled to expire as follows (in thousands):
| |
Total | Less than 1 year |
1 Year to Less than 3 Years |
3 Years to Less than 5 Years |
More than 5 Years |
|||||||||||
|---|---|---|---|---|---|---|---|---|---|---|---|---|---|---|---|---|
Letters of credit |
$ | 465 | $ | — | $ | — | $ | — | $ | 465 | ||||||
Letters of credit are maintained pursuant to certain of our lease arrangements and contractual obligations. The letters of credit remain in effect at varying levels through the terms of the related agreements.
Other Commitments
In the ordinary course of business, we may provide indemnifications of varying scope and terms to customers, vendors, lessors, sureties and insurance companies, business partners, and other parties with respect to certain matters, including, but not limited to, losses arising out of our breach of such agreements, services to be provided by us, or from intellectual property infringement claims made by third parties. For example, we agreed to indemnify the purchaser of our former Classmates domestic business unit for certain liabilities and have retained responsibility for certain legal proceedings relating to the Classmates domestic business unit. In addition, we have entered into indemnification agreements with our directors and certain of our officers and employees that will require us, among other things, to indemnify them against certain liabilities that may arise by reason of their status or service as directors, officers or employees. We have also agreed to indemnify certain former officers, directors and employees of acquired companies in connection with the acquisition of such companies. We maintain director and officer insurance, which may cover certain liabilities, including those arising from our obligation to indemnify our directors and certain of our officers and employees, and former officers, directors and employees of acquired companies, in certain circumstances.
It is not possible to determine the maximum potential amount of exposure under these indemnification agreements due to the limited history of prior indemnification claims and the unique facts and circumstances involved in each particular agreement. Such indemnification agreements may not be subject to maximum loss clauses.
70
Off-Balance Sheet Arrangements
At December 31, 2015, we did not have any off-balance sheet arrangements (as defined in Item 303(a)(4)(ii) of Regulation S-K) that have, or are reasonably likely to have, a current or future material effect on our consolidated financial condition, results of operations, liquidity, capital expenditures, or capital resources.
Recent Accounting Pronouncements
See Note 1, "Description of Business, Basis of Presentation, Accounting Policies, and Recent Accounting Pronouncements" of the Notes to Consolidated Financial Statements included in Part II, Item 8 of this Annual Report on Form 10-K for a description of recent accounting pronouncements, including the expected dates of adoption and estimated effects on our financial condition, results of operations and cash flows.
Inflation
Inflation did not have a material impact on our consolidated revenues and results of operations during the years ended December 31, 2015, 2014 and 2013.
ITEM 7A. QUANTITATIVE AND QUALITATIVE DISCLOSURES ABOUT MARKET RISK
We are exposed to certain market risks arising from transactions in the normal course of business, principally risk associated with interest rate and foreign currency exchange rate fluctuations.
Interest Rate Risk
While we do not currently maintain any short-term investments, we do invest in money market funds and time deposits, which are classified as cash and cash equivalents in our consolidated balance sheets. Therefore, our interest income is sensitive to changes in the general level of U.S. and certain foreign interest rates. At December 31, 2015, we did not have any fixed or floating rate debt obligations.
Foreign Currency Exchange Risk
We transact business in foreign currencies, and we are exposed to risk resulting from fluctuations in foreign currency exchange rates, particularly the Euro ("EUR") and the Indian Rupee ("INR") and, to a much lesser extent, the Swedish Krona ("SEK") and the Swiss Franc ("CHF"), which may result in gains or losses reported in our results of operations. The volatilities in EUR, INR, SEK, and CHF (and all other applicable foreign currencies) are monitored by us throughout the year. We face two risks related to foreign currency exchange rates—translation risk and transaction risk. Amounts invested in our foreign operations are translated into U.S. Dollars using the current rate method. The resulting translation adjustments are recorded as a component of accumulated other comprehensive loss in the consolidated balance sheets. Revenues and expenses in foreign currencies translate into higher or lower revenues and expenses in U.S. Dollars as the U.S. Dollar weakens or strengthens against other currencies. Substantially all of the revenues of our foreign subsidiaries are received, and substantially all expenses are incurred, in currencies other than the U.S. Dollar, which increases or decreases the related U.S. Dollar-reported revenues and expenses depending on the exchange rate trend in currencies. Therefore, changes in foreign currency exchange rates may negatively affect our consolidated revenues and net income (loss).
We currently utilize forward foreign currency exchange contracts to protect the value of our net investments in certain foreign subsidiaries and certain forecasted cash flows denominated in currencies other than the U.S. Dollar. These contracts are designated as hedges of net investments in foreign
71
entities and hedges of cash flows. At December 31, 2015, the notional value of open forward foreign currency exchange contracts accounted for as net investment hedges totaled $5.5 million. At December 31, 2015, we had no outstanding forward foreign currency exchange contracts accounted for as cash flow hedges.
We considered the historical trends in currency exchange rates and determined that it was reasonably possible that changes in exchange rates of 10% for our foreign currency exchange contracts could be experienced in the near term. If the U.S. dollar weakened or strengthened by 10%, the impact on accumulated other comprehensive loss would have been immaterial at December 31, 2015.
Periodically, we enter into forward foreign currency exchange contracts, which are not designated as hedging instruments for accounting purposes. We enter into these derivative instruments to hedge intercompany transactions and partially offset the economic effect of fluctuations in foreign currency exchange rates. At December 31, 2015, we did not have any open forward foreign currency exchange contracts that did not qualify for hedge accounting.
We may, in the future and in accordance with our investment and foreign exchange policies, also use other derivative financial instruments, if it is determined that such hedging activities are appropriate to reduce risk.
ITEM 8. FINANCIAL STATEMENTS AND SUPPLEMENTARY DATA
For our Consolidated Financial Statements and Schedule II, see the Index to Consolidated Financial Statements on page F-1.
ITEM 9. CHANGES IN AND DISAGREEMENTS WITH ACCOUNTANTS ON ACCOUNTING AND FINANCIAL DISCLOSURE
None.
ITEM 9A. CONTROLS AND PROCEDURES
Disclosure Controls and Procedures
Our management, with the participation of our Interim Chief Executive Officer and Chief Financial Officer, has evaluated the effectiveness of the Company's disclosure controls and procedures (as such term is defined in Rules 13a-15(e) and 15d-15(e) under the Securities Exchange Act of 1934, as amended) as of the end of the period covered by this report. Based on such evaluation, our Interim Chief Executive Officer and Chief Financial Officer have concluded that, as of the end of such period, the Company's disclosure controls and procedures are effective in recording, processing, summarizing, and reporting, within the time periods specified in the SEC's rules and forms, information required to be disclosed by the Company in the reports that it files or submits under the Exchange Act and are effective in ensuring that information required to be disclosed by the Company in the reports that it files or submits under the Exchange Act is accumulated and communicated to the Company's management, including the Company's Interim Chief Executive Officer and Chief Financial Officer, as appropriate to allow timely decisions regarding required disclosure.
Management's Report on Internal Control Over Financial Reporting
The Company's management is responsible for establishing and maintaining adequate internal control over financial reporting. The Company's internal control over financial reporting has been designed to provide reasonable assurance regarding the reliability of financial reporting and the preparation of financial statements for external purposes in accordance with generally accepted accounting principles.
72
The Company's internal control over financial reporting includes policies and procedures that: (i) pertain to the maintenance of records that, in reasonable detail, accurately and fairly reflect transactions and dispositions of assets of the Company; (ii) provide reasonable assurance that transactions are recorded as necessary to permit preparation of financial statements in accordance with generally accepted accounting principles, and that receipts and expenditures are being made only in accordance with authorization of management and directors of the Company; and (iii) provide reasonable assurance regarding prevention or timely detection of unauthorized acquisition, use or disposition of the Company's assets that could have a material effect on the Company's consolidated financial statements.
Because of its inherent limitations, internal control over financial reporting may not prevent or detect misstatements. Also, projections of any evaluation of the effectiveness of internal control over financial reporting to future periods are subject to the risk that controls may become inadequate because of changes in conditions, or that the degree of compliance with the policies or procedures may deteriorate.
Management assessed the effectiveness of the Company's internal control over financial reporting at December 31, 2015. In making this assessment, management used the criteria set forth by the Committee of Sponsoring Organizations of the Treadway Commission ("COSO") in Internal Control—Integrated Framework (2013). Based on that assessment under those criteria, management has determined that, at December 31, 2015, the Company's internal control over financial reporting was effective.
The effectiveness of the Company's internal control over financial reporting at December 31, 2015 has been audited by PricewaterhouseCoopers LLP, an independent registered public accounting firm, as stated in their report which appears herein.
Changes in Internal Control Over Financial Reporting
There were no changes in our internal control over financial reporting (as defined in Rules 13a-15(f) and 15d-15(f) under the Exchange Act) that occurred during the quarter ended December 31, 2015 that has materially affected, or is reasonably likely to materially affect, our internal control over financial reporting.
None.
73
ITEM 10. DIRECTORS, EXECUTIVE OFFICERS AND CORPORATE GOVERNANCE
The information required by Item 10 is included in our definitive proxy statement relating to our 2016 annual meeting of stockholders, or in an amendment on Form 10-K/A, to be filed with the SEC within 120 days after the end of our fiscal year ended December 31, 2015 and is incorporated herein by reference.
ITEM 11. EXECUTIVE COMPENSATION
The information required by Item 11 is included in our definitive proxy statement relating to our 2016 annual meeting of stockholders, or in an amendment on Form 10-K/A, to be filed with the SEC within 120 days after the end of our fiscal year ended December 31, 2015 and is incorporated herein by reference.
ITEM 12. SECURITY OWNERSHIP OF CERTAIN BENEFICIAL OWNERS AND MANAGEMENT AND RELATED STOCKHOLDER MATTERS
The information required by Item 12 is included in our definitive proxy statement relating to our 2016 annual meeting of stockholders, or in an amendment on Form 10-K/A, to be filed with the SEC within 120 days after the end of our fiscal year ended December 31, 2015 and is incorporated herein by reference.
ITEM 13. CERTAIN RELATIONSHIPS AND RELATED TRANSACTIONS, AND DIRECTOR INDEPENDENCE
The information required by Item 13 is included in our definitive proxy statement relating to our 2016 annual meeting of stockholders, or in an amendment on Form 10-K/A, to be filed with the SEC within 120 days after the end of our fiscal year ended December 31, 2015 and is incorporated herein by reference.
ITEM 14. PRINCIPAL ACCOUNTING FEES AND SERVICES
The information required by Item 14 is included in our definitive proxy statement relating to our 2016 annual meeting of stockholders, or in an amendment on Form 10-K/A, to be filed with the SEC within 120 days after the end of our fiscal year ended December 31, 2015 and is incorporated herein by reference.
74
ITEM 15. EXHIBITS, FINANCIAL STATEMENT SCHEDULES
- (a)
- The following documents are filed as part of this report:
|
1. | Consolidated Financial Statements: |
|||||||
| |
|
|
Page | |
|||||
|---|---|---|---|---|---|---|---|---|---|
|
Report of Independent Registered Public Accounting Firm |
F-2 | |||||||
|
Consolidated Balance Sheets |
F-3 | |||||||
|
Consolidated Statements of Operations |
F-4 | |||||||
|
Consolidated Statements of Comprehensive Income (Loss) |
F-5 | |||||||
|
Consolidated Statements of Stockholders' Equity |
F-6 | |||||||
|
Consolidated Statements of Cash Flows |
F-7 | |||||||
|
Notes to Consolidated Financial Statements |
F-8 | |||||||
|
2. |
Financial Statement Schedules: |
|
||||||
| |
|
|
Page | |
|||||
|
Schedule II—Valuation and Qualifying Accounts |
F-49 | |||||||
All other schedules have been omitted because the information required to be set forth therein is not applicable, not required or is shown in the consolidated financial statements or notes related thereto.
- 3.
- Exhibits:
- (b)
- Exhibits
See the Exhibit Index following the signature page to this Annual Report on Form 10-K for a list of exhibits filed or furnished with this report, which Exhibit Index is incorporated herein by reference.
The agreements included as exhibits to this Annual Report on Form 10-K contain representations and warranties by each of the parties to the applicable agreement. These representations and warranties have been made solely for the benefit of the other parties to the applicable agreement and:
- •
- should not be treated as categorical statements of fact, but rather as a way of allocating the risk to one of
the parties if those statements prove to be inaccurate;
- •
- may have been qualified in such agreement by disclosures that were made to the other party in connection with
the negotiation of the applicable agreement;
- •
- may apply contract standards of "materiality" that are different from "materiality" under the applicable
securities laws; and
- •
- were made only as of the date of the applicable agreement or such other date or dates as may be specified in the agreement.
The Company acknowledges that, notwithstanding the inclusion of the foregoing cautionary statements, it is responsible for considering whether additional specific disclosures of material information regarding material contractual provisions are required to make the statements in this Annual Report on Form 10-K not misleading.
Additional information about the Company may be found elsewhere in this Annual Report on Form 10-K and in the Company's other public filings, which are available without charge through the SEC's website at www.sec.gov.
- (c)
- Financial Statement Schedules
The financial statement schedules required by Regulation S-X and Item 8 of this Annual Report on Form 10-K are listed in Item 15(a)(2) of this Annual Report on Form 10-K.
75
Pursuant to the requirements of Section 13 or 15(d) of the Securities Exchange Act of 1934, the Registrant has duly caused this report to be signed on its behalf by the undersigned, thereunto duly authorized.
| Date: March 3, 2016 | UNITED ONLINE, INC. | |||
By: |
/s/ JEFFREY GOLDSTEIN Jeffrey Goldstein Interim Chief Executive Officer |
|||
KNOW ALL PERSONS BY THESE PRESENT, that each person whose signature appears below constitutes and appoints Jeffrey Goldstein and Edward K. Zinser, as his or her attorneys-in-fact, each with the power of substitution, for him or her in any and all capacities, to sign any amendment to this Annual Report on Form 10-K, and to file the same, with exhibits thereto and other documents in connection therewith with the Securities and Exchange Commission, hereby ratifying and confirming all that each of said attorneys-in-fact, or his substitute or substitutes, may do or cause to be done by virtue hereof.
Pursuant to the requirements of the Securities Exchange Act of 1934, this report has been signed below by the following persons on behalf of the Company and in the capacities and on the dates indicated below.
Signature
|
Title
|
Date
|
||
|---|---|---|---|---|
| /s/ JEFFREY GOLDSTEIN Jeffrey Goldstein |
Interim Chief Executive Officer and Director (Principal Executive Officer and Director) | March 3, 2016 | ||
/s/ EDWARD K. ZINSER Edward K. Zinser |
Executive Vice President and Chief Financial Officer (Principal Financial Officer) |
March 3, 2016 |
||
/s/ MICHELLE D. STALICK Michelle D. Stalick |
Senior Vice President and Chief Accounting Officer (Principal Accounting Officer) |
March 3, 2016 |
||
/s/ JAMES T. ARMSTRONG James T. Armstrong |
Director |
March 3, 2016 |
||
/s/ ROBERT BERGLASS Robert Berglass |
Director |
March 3, 2016 |
76
Signature
|
Title
|
Date
|
||
|---|---|---|---|---|
| /s/ KENNETH L. COLEMAN Kenneth L. Coleman |
Director | March 3, 2016 | ||
/s/ KENNETH D. DENMAN Kenneth D. Denman |
Director |
March 3, 2016 |
||
/s/ ANDREW D. MILLER Andrew D. Miller |
Director |
March 3, 2016 |
||
/s/ HOWARD G. PHANSTIEL Howard G. Phanstiel |
Chairman and Director |
March 3, 2016 |
||
/s/ CAROL A. SCOTT Carol A. Scott |
Director |
March 3, 2016 |
77
| |
|
|
Incorporated by Reference to | ||||||||||||
|---|---|---|---|---|---|---|---|---|---|---|---|---|---|---|---|
| No. | Exhibit Description | Filed with this Form 10-K |
Form | Exhibit No. | File No. | Date Filed | |||||||||
| 2.1 | Separation and Distribution Agreement by and between United Online, Inc. and FTD Companies, Inc., dated as of October 31, 2013 | 8-K | 2.1 | 000-33367 | 11/6/2013 | ||||||||||
2.2 |
Amendment No. 1 to Separation and Distribution Agreement by and between United Online, Inc. and FTD Companies, Inc., dated as of May 20, 2015 |
10-Q |
2.1 |
000-33367 |
8/6/2015 |
||||||||||
2.3 |
Stock Purchase Agreement by and among Intelius Holdings, Inc., the Registrant and Classmates Media Corporation, dated as of August 11, 2015 |
10-Q |
2.3 |
000-33367 |
11/6/2015 |
||||||||||
3.1 |
Amended and Restated Certificate of Incorporation (As Amended Effective October 31, 2013) |
10-K |
3.1 |
000-33367 |
3/13/2014 |
||||||||||
3.2 |
Amended and Restated Bylaws (As Amended Effective December 17, 2013) |
10-K |
3.2 |
000-33367 |
3/13/2014 |
||||||||||
10.1 |
* |
Form of Indemnification Agreement |
10-Q |
10.32 |
000-33367 |
11/10/2008 |
|||||||||
10.2 |
* |
2001 Stock Incentive Plan |
10-Q |
10.2 |
000-33367 |
8/9/2007 |
|||||||||
10.3 |
* |
2010 Incentive Compensation Plan |
10-Q |
10.1 |
000-33367 |
8/6/2010 |
|||||||||
10.4 |
* |
Amended and Restated 2010 Incentive Compensation Plan (As Amended and Restated as of June 13, 2013) |
10-Q |
10.1 |
000-33367 |
8/5/2013 |
|||||||||
10.5 |
* |
Amended and Restated 2010 Incentive Compensation Plan (As Amended and Restated as of June 13, 2013 and as Amended as of April 23, 2015) |
10-Q |
10.1 |
000-33367 |
8/6/2015 |
|||||||||
10.6 |
* |
2010 Employee Stock Purchase Plan |
10-K |
10.5 |
000-33367 |
3/2/2015 |
|||||||||
10.7 |
* |
2010 Employee Stock Purchase Plan (As Amended as of April 23, 2015) |
10-Q |
10.2 |
000-33367 |
8/6/2015 |
|||||||||
78
| |
|
|
Incorporated by Reference to | ||||||||||||
|---|---|---|---|---|---|---|---|---|---|---|---|---|---|---|---|
| No. | Exhibit Description | Filed with this Form 10-K |
Form | Exhibit No. | File No. | Date Filed | |||||||||
| 10.8 | * | 2001 Supplemental Stock Incentive Plan (As Amended and Restated Effective September 26, 2001) | 10-Q | 10.5 | 000-33367 | 8/9/2007 | |||||||||
10.9 |
* |
Classmates Online, Inc. 2004 Stock Plan (Amended and Restated as of April 22, 2005) |
10-Q |
10.8 |
000-33367 |
5/10/2005 |
|||||||||
10.10 |
* |
Form of Stock Option Agreement for 2001 Stock Incentive Plan |
10-Q |
10.3 |
000-33367 |
10/27/2004 |
|||||||||
10.11 |
* |
Form of Restricted Stock Unit Issuance Agreement for 2010 Incentive Compensation Plan (non-employee directors—initial grant) |
10-K |
10.10 |
000-33367 |
2/28/2011 |
|||||||||
10.12 |
* |
Form of Restricted Stock Unit Issuance Agreement for 2010 Incentive Compensation Plan (non-employee directors—annual grant) |
10-K |
10.11 |
000-33367 |
2/28/2011 |
|||||||||
10.13 |
* |
Form of Restricted Stock Unit Issuance Agreement for 2010 Incentive Compensation Plan (officers) |
10-K |
10.12 |
000-33367 |
2/28/2011 |
|||||||||
10.14 |
* |
Form of Notice of Grant and Stock Option Agreement for 2010 Incentive Compensation Plan (officers version I) |
10-K |
10.14 |
000-33367 |
2/28/2011 |
|||||||||
10.15 |
* |
Form of Notice of Grant and Stock Option Agreement for 2010 Incentive Compensation Plan (officers version II) |
10-K |
10.15 |
000-33367 |
2/28/2011 |
|||||||||
10.16 |
* |
Form of Restricted Stock Unit Issuance Agreement for Amended and Restated 2010 Incentive Compensation Plan (officer with employment agreement) |
10-K |
10.16 |
000-33367 |
3/13/2014 |
|||||||||
10.17 |
* |
Form of Restricted Stock Unit Issuance Agreement for Amended and Restated 2010 Incentive Compensation Plan (U.S. employees) |
10-K |
10.17 |
000-33367 |
3/13/2014 |
|||||||||
79
| |
|
|
Incorporated by Reference to | ||||||||||||
|---|---|---|---|---|---|---|---|---|---|---|---|---|---|---|---|
| No. | Exhibit Description | Filed with this Form 10-K |
Form | Exhibit No. | File No. | Date Filed | |||||||||
| 10.18 | * | Form of Notice of Grant and Stock Option Agreement for Amended and Restated 2010 Incentive Compensation Plan (officer with employment agreement) | 10-K | 10.18 | 000-33367 | 3/13/2014 | |||||||||
10.19 |
* |
Amended and Restated United Online, Inc. Severance Benefit Plan (As Amended Effective May 1, 2014) |
10-Q |
10.2 |
000-33367 |
5/6/2014 |
|||||||||
10.20 |
* |
Employment Agreement between the Registrant and Francis Lobo |
10-K |
10.21 |
000-33367 |
3/13/2014 |
|||||||||
10.21 |
* |
General Release and Agreement between the Registrant and Kesa Tsuda, dated November 18, 2015 |
X |
||||||||||||
10.22 |
* |
Offer Letter between the Registrant and Jeff Goldstein, dated January 11, 2016 |
X |
||||||||||||
10.23 |
* |
Offer Letter between the Registrant and Mark Harrington, dated as of July 20, 2015 |
10-Q |
10.1 |
000-33367 |
11/6/2015 |
|||||||||
10.24 |
* |
Amended and Restated Offer Letter between the Registrant and Shahir Fakiri, dated March 10, 2015 |
10-Q |
10.4 |
000-33367 |
5/7/2015 |
|||||||||
10.25 |
* |
Offer Letter between the Registrant and Edward K. Zinser, effective May 14, 2014 |
10-Q |
10.2 |
000-33367 |
8/18/2014 |
|||||||||
10.26 |
* |
Change in Control Policy for Executives |
10-Q |
10.1 |
000-33367 |
5/7/2015 |
|||||||||
10.27 |
* |
2015 Management Bonus Plan |
10-Q |
10.2 |
000-33367 |
5/7/2015 |
|||||||||
10.28 |
Office Lease between LNR Warner Center, LLC and NetZero, Inc. |
10-Q |
10.11 |
000-33367 |
5/3/2004 |
||||||||||
10.29 |
Office Lease between LNR Warner Center IV, LLC and United Online, Inc., dated as of May 14, 2014 |
8-K |
10.1 |
000-33367 |
5/22/2014 |
||||||||||
10.30 |
* |
Transition Services Agreement by and between United Online, Inc. and FTD Companies, Inc., dated as of October 31, 2013 |
8-K |
10.1 |
000-33367 |
11/6/2013 |
|||||||||
80
| |
|
|
Incorporated by Reference to | ||||||||||||
|---|---|---|---|---|---|---|---|---|---|---|---|---|---|---|---|
| No. | Exhibit Description | Filed with this Form 10-K |
Form | Exhibit No. | File No. | Date Filed | |||||||||
| 10.31 | * | Amendment No. 1 to Transition Services Agreement by and between United Online, Inc. and FTD Companies, Inc., dated as of January 2, 2014 | 10-K | 10.49 | 000-33367 | 3/13/2014 | |||||||||
10.32 |
* |
Employee Matters Agreement by and between United Online, Inc. and FTD Companies, Inc., dated as of October 31, 2013 |
8-K |
10.2 |
000-33367 |
11/6/2013 |
|||||||||
10.33 |
Tax Sharing Agreement by and between United Online, Inc. and FTD Companies, Inc., dated as of October 31, 2013 |
8-K |
10.3 |
000-33367 |
11/6/2013 |
||||||||||
21.1 |
List of Subsidiaries |
X |
|||||||||||||
23.1 |
Consent of Independent Registered Public Accounting Firm |
X |
|||||||||||||
24.1 |
Power of Attorney (see signature page to this Annual Report on Form 10-K) |
X |
|||||||||||||
31.1 |
Certification of the Chief Executive Officer pursuant to Section 302 of the Sarbanes-Oxley Act of 2002 |
X |
|||||||||||||
31.2 |
Certification of the Chief Financial Officer pursuant to Section 302 of the Sarbanes-Oxley Act of 2002 |
X |
|||||||||||||
32.1 |
Certification of the Chief Executive Officer pursuant to Section 906 of the Sarbanes-Oxley Act of 2002 |
X |
|||||||||||||
32.2 |
Certification of the Chief Financial Officer pursuant to Section 906 of the Sarbanes-Oxley Act of 2002 |
X |
|||||||||||||
101.INS |
XBRL Instance Document |
X |
|||||||||||||
101.SCH |
XBRL Taxonomy Extension Schema Document |
X |
|||||||||||||
101.CAL |
XBRL Taxonomy Calculation Linkbase Document |
X |
|||||||||||||
81
| |
|
|
Incorporated by Reference to | ||||||||||||
|---|---|---|---|---|---|---|---|---|---|---|---|---|---|---|---|
| No. | Exhibit Description | Filed with this Form 10-K |
Form | Exhibit No. | File No. | Date Filed | |||||||||
| 101.LAB | XBRL Taxonomy Label Linkbase Document | X | |||||||||||||
101.PRE |
XBRL Taxonomy Presentation Linkbase Document |
X |
|||||||||||||
101.DEF |
XBRL Taxonomy Extension Definition Document |
X |
|||||||||||||
- *
- Management contract or compensatory plan or arrangement.
82
UNITED ONLINE, INC.
INDEX TO CONSOLIDATED FINANCIAL STATEMENTS
F-1
Report of Independent Registered Public Accounting Firm
To the Board of Directors and Stockholders of United Online, Inc.
In our opinion, the consolidated financial statements listed in the index appearing under Item 15(a)(1) present fairly, in all material respects, the financial position of United Online, Inc. and its subsidiaries at December 31, 2015 and 2014, and the results of their operations and their cash flows for each of the three years in the period ended December 31, 2015 in conformity with accounting principles generally accepted in the United States of America. In addition, in our opinion, the financial statement schedule listed in the index appearing under Item 15(a)(2) presents fairly, in all material respects, the information set forth therein when read in conjunction with the related consolidated financial statements. Also in our opinion, the Company maintained, in all material respects, effective internal control over financial reporting as of December 31, 2015, based on criteria established in Internal Control—Integrated Framework (2013) issued by the Committee of Sponsoring Organizations of the Treadway Commission (COSO). The Company's management is responsible for these financial statements and financial statement schedule, for maintaining effective internal control over financial reporting and for its assessment of the effectiveness of internal control over financial reporting, included in Management's Report on Internal Control Over Financial Reporting appearing under Item 9A. Our responsibility is to express opinions on these financial statements, on the financial statement schedule, and on the Company's internal control over financial reporting based on our integrated audits. We conducted our audits in accordance with the standards of the Public Company Accounting Oversight Board (United States). Those standards require that we plan and perform the audits to obtain reasonable assurance about whether the financial statements are free of material misstatement and whether effective internal control over financial reporting was maintained in all material respects. Our audits of the financial statements included examining, on a test basis, evidence supporting the amounts and disclosures in the financial statements, assessing the accounting principles used and significant estimates made by management, and evaluating the overall financial statement presentation. Our audit of internal control over financial reporting included obtaining an understanding of internal control over financial reporting, assessing the risk that a material weakness exists, and testing and evaluating the design and operating effectiveness of internal control based on the assessed risk. Our audits also included performing such other procedures as we considered necessary in the circumstances. We believe that our audits provide a reasonable basis for our opinions.
A company's internal control over financial reporting is a process designed to provide reasonable assurance regarding the reliability of financial reporting and the preparation of financial statements for external purposes in accordance with generally accepted accounting principles. A company's internal control over financial reporting includes those policies and procedures that (i) pertain to the maintenance of records that, in reasonable detail, accurately and fairly reflect the transactions and dispositions of the assets of the company; (ii) provide reasonable assurance that transactions are recorded as necessary to permit preparation of financial statements in accordance with generally accepted accounting principles, and that receipts and expenditures of the company are being made only in accordance with authorizations of management and directors of the company; and (iii) provide reasonable assurance regarding prevention or timely detection of unauthorized acquisition, use, or disposition of the company's assets that could have a material effect on the financial statements.
Because of its inherent limitations, internal control over financial reporting may not prevent or detect misstatements. Also, projections of any evaluation of effectiveness to future periods are subject to the risk that controls may become inadequate because of changes in conditions, or that the degree of compliance with the policies or procedures may deteriorate.
/s/
PRICEWATERHOUSECOOPERS LLP
Los Angeles, California
March 3, 2016
F-2
UNITED ONLINE, INC.
CONSOLIDATED BALANCE SHEETS
(in thousands, except per share amounts)
| |
December 31, 2015 |
December 31, 2014 |
|||||
|---|---|---|---|---|---|---|---|
Assets |
|||||||
Current assets: |
|||||||
Cash and cash equivalents |
$ | 104,832 | $ | 78,634 | |||
Accounts receivable, net of allowance of $744 and $1,288 at December 31, 2015 and 2014, respectively |
13,424 | 14,112 | |||||
Inventories, net |
6,878 | 5,413 | |||||
Deferred tax assets, net |
— | 192 | |||||
Other current assets |
10,241 | 6,415 | |||||
Assets of discontinued operations |
— | 5,672 | |||||
| | | | | | | | |
Total current assets |
135,375 | 110,438 | |||||
Property and equipment, net |
13,256 | 15,040 | |||||
Deferred tax assets, net |
1,514 | 1,549 | |||||
Goodwill |
46,660 | 46,862 | |||||
Intangible assets, net |
335 | 734 | |||||
Other assets |
1,070 | 1,161 | |||||
Assets of discontinued operations |
— | 32,811 | |||||
| | | | | | | | |
Total assets |
$ | 198,210 | $ | 208,595 | |||
| | | | | | | | |
| | | | | | | | |
| | | | | | | | |
Liabilities and Stockholders' Equity |
|||||||
Current liabilities: |
|||||||
Accounts payable |
$ | 8,460 | $ | 9,707 | |||
Accrued liabilities |
10,252 | 18,545 | |||||
Member redemption liability |
6,781 | 7,287 | |||||
Deferred revenue |
13,431 | 16,168 | |||||
Deferred tax liabilities, net |
— | 529 | |||||
Liabilities of discontinued operations |
— | 31,545 | |||||
| | | | | | | | |
Total current liabilities |
38,924 | 83,781 | |||||
Member redemption liability |
11,322 | 11,360 | |||||
Deferred revenue |
17 | 17 | |||||
Deferred tax liabilities, net |
4,621 | 805 | |||||
Other liabilities |
5,706 | 5,766 | |||||
Liabilities of discontinued operations |
— | 5,153 | |||||
| | | | | | | | |
Total liabilities |
60,590 | 106,882 | |||||
| | | | | | | | |
Commitments and contingencies (see Note 12) |
|||||||
Stockholders' equity: |
|||||||
Preferred stock, $0.0001 par value; 5,000 shares authorized; no shares issued or outstanding at December 31, 2015 and 2014 |
|||||||
Common stock, $0.0001 par value; 42,857 shares authorized; 14,850 and 14,289 shares issued and outstanding at December 31, 2015 and 2014, respectively |
1 | 1 | |||||
Additional paid-in capital |
222,164 | 215,302 | |||||
Accumulated other comprehensive loss |
(4,086 | ) | (3,158 | ) | |||
Accumulated deficit |
(80,459 | ) | (110,432 | ) | |||
| | | | | | | | |
Total stockholders' equity |
137,620 | 101,713 | |||||
| | | | | | | | |
Total liabilities and stockholders' equity |
$ | 198,210 | $ | 208,595 | |||
| | | | | | | | |
| | | | | | | | |
| | | | | | | | |
The accompanying notes are an integral part of these consolidated financial statements.
F-3
UNITED ONLINE, INC.
CONSOLIDATED STATEMENTS OF OPERATIONS
(in thousands, except per share amounts)
| |
Year Ended December 31, | |||||||||
|---|---|---|---|---|---|---|---|---|---|---|
| |
2015 | 2014 | 2013 | |||||||
Revenues |
$ | 151,118 | $ | 165,719 | $ | 177,131 | ||||
Operating expenses: |
||||||||||
Cost of revenues |
62,806 | 61,101 | 62,035 | |||||||
Sales and marketing |
27,396 | 32,030 | 38,518 | |||||||
Technology and development |
14,865 | 17,219 | 18,305 | |||||||
General and administrative |
37,088 | 48,388 | 58,508 | |||||||
Amortization of intangible assets |
409 | 421 | 399 | |||||||
Restructuring and other exit costs |
1,468 | 3,054 | 1,192 | |||||||
Impairment of goodwill, intangible assets and long-lived assets |
— | — | 37,756 | |||||||
| | | | | | | | | | | |
Total operating expenses |
144,032 | 162,213 | 216,713 | |||||||
| | | | | | | | | | | |
Operating income (loss) |
7,086 | 3,506 | (39,582 | ) | ||||||
Interest income |
448 | 388 | 260 | |||||||
Interest expense |
— | — | (12 | ) | ||||||
Other income, net |
932 | 505 | 213 | |||||||
| | | | | | | | | | | |
Income (loss) before income taxes |
8,466 | 4,399 | (39,121 | ) | ||||||
Provision for income taxes |
3,959 | 841 | 46,595 | |||||||
| | | | | | | | | | | |
Income (loss) from continuing operations |
4,507 | 3,558 | (85,716 | ) | ||||||
Income (loss) from discontinued operations, net of tax |
25,466 | (8,987 | ) | (2,559 | ) | |||||
| | | | | | | | | | | |
Net income (loss) |
$ | 29,973 | $ | (5,429 | ) | $ | (88,275 | ) | ||
| | | | | | | | | | | |
| | | | | | | | | | | |
| | | | | | | | | | | |
Income allocated to participating securities |
(1,162 | ) | 340 | (1,195 | ) | |||||
| | | | | | | | | | | |
Net income (loss) attributable to common stockholders |
$ | 28,811 | $ | (5,089 | ) | $ | (89,470 | ) | ||
| | | | | | | | | | | |
| | | | | | | | | | | |
| | | | | | | | | | | |
Basic net income (loss) per common share: |
||||||||||
Continuing operations |
$ | 0.23 | $ | 0.28 | $ | (6.55 | ) | |||
Discontinued operations |
1.73 | (0.64 | ) | (0.20 | ) | |||||
| | | | | | | | | | | |
Basic net income (loss) per common share |
$ | 1.96 | $ | (0.36 | ) | $ | (6.75 | ) | ||
| | | | | | | | | | | |
| | | | | | | | | | | |
| | | | | | | | | | | |
Shares used to calculate basic net income (loss) per common share |
14,673 | 14,115 | 13,261 | |||||||
| | | | | | | | | | | |
| | | | | | | | | | | |
| | | | | | | | | | | |
Diluted net income (loss) per common share: |
||||||||||
Continuing operations |
$ | 0.23 | $ | 0.28 | $ | (6.55 | ) | |||
Discontinued operations |
1.73 | (0.64 | ) | (0.20 | ) | |||||
| | | | | | | | | | | |
Diluted net income (loss) per common share |
$ | 1.96 | $ | (0.36 | ) | $ | (6.75 | ) | ||
| | | | | | | | | | | |
| | | | | | | | | | | |
| | | | | | | | | | | |
Shares used to calculate diluted net income (loss) per common share |
14,727 | 14,119 | 13,261 | |||||||
| | | | | | | | | | | |
| | | | | | | | | | | |
| | | | | | | | | | | |
Dividends paid per common share |
$ | — | $ | — | $ | 2.25 | ||||
| | | | | | | | | | | |
| | | | | | | | | | | |
| | | | | | | | | | | |
The accompanying notes are an integral part of these consolidated financial statements.
F-4
UNITED ONLINE, INC.
CONSOLIDATED STATEMENTS OF COMPREHENSIVE INCOME (LOSS)
(in thousands)
| |
Year Ended December 31, | |||||||||
|---|---|---|---|---|---|---|---|---|---|---|
| |
2015 | 2014 | 2013 | |||||||
Net income (loss) |
$ | 29,973 | $ | (5,429 | ) | $ | (88,275 | ) | ||
Other comprehensive income (loss): |
||||||||||
Cash flow hedges: |
||||||||||
Changes in net gains (losses) on derivatives, net of tax provision of $—, $— and $8 for the years ended December 31, 2015, 2014 and 2013, respectively |
4 | (33 | ) | 13 | ||||||
Derivative settlement (gains) losses reclassified into earnings, net of tax benefit of $—, $— and $126 for the years ended December 31, 2015, 2014 and 2013, respectively |
45 | (23 | ) | 205 | ||||||
Other hedges: |
||||||||||
Changes in net gains on derivatives, net of tax provision of $—, $— and $39 for the years ended December 31, 2015, 2014 and 2013, respectively |
45 | 168 | 62 | |||||||
Foreign currency translation. |
(1,022 | ) | (995 | ) | (2,402 | ) | ||||
| | | | | | | | | | | |
Other comprehensive loss |
(928 | ) | (883 | ) | (2,122 | ) | ||||
| | | | | | | | | | | |
Comprehensive income (loss) |
$ | 29,045 | $ | (6,312 | ) | $ | (90,397 | ) | ||
| | | | | | | | | | | |
| | | | | | | | | | | |
| | | | | | | | | | | |
The accompanying notes are an integral part of these consolidated financial statements.
F-5
UNITED ONLINE, INC.
CONSOLIDATED STATEMENTS OF STOCKHOLDERS' EQUITY
(in thousands)
| |
Common Stock | |
Accumulated Other Comprehensive Loss |
Retained Earnings (Accumulated Deficit) |
|
||||||||||||||
|---|---|---|---|---|---|---|---|---|---|---|---|---|---|---|---|---|---|---|---|
| |
Additional Paid-In Capital |
Total Stockholders' Equity |
|||||||||||||||||
| |
Shares | Amount | |||||||||||||||||
Balance at December 31, 2012 |
13,013 | $ | 1 | $ | 500,777 | $ | (22,968 | ) | $ | 2,996 | $ | 480,806 | |||||||
Exercises of stock options |
271 | — | 5,124 | — | — | 5,124 | |||||||||||||
Issuance of common stock through employee stock purchase plan |
229 | — | 2,997 | — | — | 2,997 | |||||||||||||
Vesting of restricted stock units |
233 | — | — | — | — | — | |||||||||||||
Repurchases of common stock |
— | — | (4,290 | ) | — | — | (4,290 | ) | |||||||||||
Dividends and dividend equivalents paid on shares outstanding and restricted stock units |
— | — | (11,258 | ) | — | (19,724 | ) | (30,982 | ) | ||||||||||
Stock-based compensation |
— | — | 13,569 | — | — | 13,569 | |||||||||||||
Tax benefits from equity awards |
— | — | 1,526 | — | — | 1,526 | |||||||||||||
Other comprehensive loss |
— | — | — | (2,122 | ) | — | (2,122 | ) | |||||||||||
Spin off of FTD Companies, Inc. |
— | — | (300,146 | ) | 22,815 | — | (277,331 | ) | |||||||||||
Net loss |
— | — | — | — | (88,275 | ) | (88,275 | ) | |||||||||||
| | | | | | | | | | | | | | | | | | | | |
Balance at December 31, 2013 |
13,746 | 1 | 208,299 | (2,275 | ) | (105,003 | ) | 101,022 | |||||||||||
Issuance of common stock through employee stock purchase plan |
142 | — | 1,397 | — | — | 1,397 | |||||||||||||
Vesting of restricted stock units |
401 | — | — | — | — | — | |||||||||||||
Repurchases of common stock |
— | — | (2,796 | ) | — | — | (2,796 | ) | |||||||||||
Stock-based compensation |
— | — | 8,557 | — | — | 8,557 | |||||||||||||
Tax shortfalls from equity awards |
— | — | (155 | ) | — | — | (155 | ) | |||||||||||
Other comprehensive loss |
— | — | — | (883 | ) | — | (883 | ) | |||||||||||
Net loss |
— | — | — | — | (5,429 | ) | (5,429 | ) | |||||||||||
| | | | | | | | | | | | | | | | | | | | |
Balance at December 31, 2014 |
14,289 | 1 | 215,302 | (3,158 | ) | (110,432 | ) | 101,713 | |||||||||||
Exercises of stock options |
144 | — | 1,699 | — | — | 1,699 | |||||||||||||
Issuance of common stock through employee stock purchase plan |
132 | — | 1,308 | — | — | 1,308 | |||||||||||||
Vesting of restricted stock units |
285 | — | — | — | — | — | |||||||||||||
Repurchases of common stock |
— | — | (1,695 | ) | — | — | (1,695 | ) | |||||||||||
Stock-based compensation |
— | — | 5,550 | — | — | 5,550 | |||||||||||||
Other comprehensive loss |
— | — | — | (928 | ) | — | (928 | ) | |||||||||||
Net income |
— | — | — | — | 29,973 | 29,973 | |||||||||||||
| | | | | | | | | | | | | | | | | | | | |
Balance at December 31, 2015 |
14,850 | $ | 1 | $ | 222,164 | $ | (4,086 | ) | $ | (80,459 | ) | $ | 137,620 | ||||||
| | | | | | | | | | | | | | | | | | | | |
| | | | | | | | | | | | | | | | | | | | |
| | | | | | | | | | | | | | | | | | | | |
The accompanying notes are an integral part of these consolidated financial statements.
F-6
UNITED ONLINE, INC.
CONSOLIDATED STATEMENTS OF CASH FLOWS
(in thousands)
| |
Year Ended December 31, | |||||||||
|---|---|---|---|---|---|---|---|---|---|---|
| |
2015 | 2014 | 2013 | |||||||
Cash flows from operating activities: |
||||||||||
Net income (loss) |
$ | 29,973 | $ | (5,429 | ) | $ | (88,275 | ) | ||
Less: Income (loss) from discontinued operations, net of tax |
25,466 | (8,987 | ) | (2,559 | ) | |||||
| | | | | | | | | | | |
Income (loss) from continuing operations |
4,507 | 3,558 | (85,716 | ) | ||||||
Adjustments to reconcile income (loss) from continuing operations to net cash provided by operating activities: |
||||||||||
Depreciation and amortization |
7,002 | 7,109 | 7,140 | |||||||
Stock-based compensation |
5,386 | 7,511 | 9,020 | |||||||
Provision for doubtful accounts receivable |
32 | 54 | 359 | |||||||
Impairment of goodwill, intangible assets and long-lived assets |
— | — | 37,756 | |||||||
Deferred taxes, net |
3,404 | (1,321 | ) | 40,079 | ||||||
Tax benefits (shortfalls) from equity awards |
— | (83 | ) | 1,411 | ||||||
Excess tax benefits from equity awards |
— | (33 | ) | (1,108 | ) | |||||
Other, net |
392 | 765 | 482 | |||||||
Changes in operating assets and liabilities, net of effects of acquisitions and discontinued operations: |
||||||||||
Accounts receivable, net |
501 | 3,929 | (1,664 | ) | ||||||
Inventories, net |
(1,927 | ) | 975 | (53 | ) | |||||
Other assets |
(2,995 | ) | 1,667 | 4,874 | ||||||
Accounts payable and accrued liabilities |
(8,802 | ) | (788 | ) | 4,335 | |||||
Member redemption liability |
(544 | ) | (2,280 | ) | (1,648 | ) | ||||
Deferred revenue |
(1,617 | ) | (1,798 | ) | (2,009 | ) | ||||
Other liabilities |
(60 | ) | (1,336 | ) | 511 | |||||
| | | | | | | | | | | |
Net cash provided by operating activities from continuing operations |
5,279 | 17,929 | 13,769 | |||||||
| | | | | | | | | | | |
Cash flows from investing activities: |
||||||||||
Purchases of property and equipment |
(5,663 | ) | (8,093 | ) | (5,558 | ) | ||||
Purchases of rights, content and intellectual property |
(16 | ) | — | — | ||||||
Purchases of investments |
— | (44 | ) | (155 | ) | |||||
Proceeds from sales of investments |
252 | 394 | 87 | |||||||
Proceeds from sales of assets, net |
— | 30 | 67 | |||||||
| | | | | | | | | | | |
Net cash used for investing activities from continuing operations |
(5,427 | ) | (7,713 | ) | (5,559 | ) | ||||
| | | | | | | | | | | |
Cash flows from financing activities: |
||||||||||
Proceeds from exercises of stock options |
1,699 | — | 5,124 | |||||||
Proceeds from employee stock purchase plans |
1,308 | 1,397 | 2,997 | |||||||
Repurchases of common stock |
(1,695 | ) | (2,796 | ) | (4,290 | ) | ||||
Dividends and dividend equivalents paid on outstanding shares and restricted stock units |
— | — | (30,982 | ) | ||||||
Excess tax benefits from equity awards |
— | 33 | 1,108 | |||||||
| | | | | | | | | | | |
Net cash provided by (used for) financing activities from continuing operations |
1,312 | (1,366 | ) | (26,043 | ) | |||||
| | | | | | | | | | | |
Effect of foreign currency exchange rate changes on cash and cash equivalents |
(1,421 | ) | (1,923 | ) | (290 | ) | ||||
Net cash provided by (used for) discontinued operations: |
||||||||||
Operating activities |
520 | 8,579 | 23,077 | |||||||
Investing activities |
25,775 | (5,029 | ) | (16,135 | ) | |||||
Financing activities |
— | 4 | (33,457 | ) | ||||||
Effect of a change in cash and cash equivalents of discontinued operations |
160 | 106 | 43,966 | |||||||
| | | | | | | | | | | |
Net cash from discontinued operations |
26,455 | 3,660 | 17,451 | |||||||
| | | | | | | | | | | |
Change in cash and cash equivalents |
26,198 | 10,587 | (672 | ) | ||||||
Cash and cash equivalents, beginning of period |
78,634 | 68,047 | 68,719 | |||||||
| | | | | | | | | | | |
Cash and cash equivalents, end of period |
$ | 104,832 | $ | 78,634 | $ | 68,047 | ||||
| | | | | | | | | | | |
| | | | | | | | | | | |
| | | | | | | | | | | |
The accompanying notes are an integral part of these consolidated financial statements.
F-7
UNITED ONLINE, INC.
NOTES TO CONSOLIDATED FINANCIAL STATEMENTS
1. DESCRIPTION OF BUSINESS, BASIS OF PRESENTATION, ACCOUNTING POLICIES, AND RECENT ACCOUNTING PRONOUNCEMENTS
Description of Business
United Online, Inc. (together with its subsidiaries, "United Online" or the "Company"), through its operating subsidiaries, provides consumer services and products over the Internet under a number of brands, including NetZero, Juno, MyPoints, StayFriends, and Trombi.
On November 1, 2013, United Online, Inc. consummated the separation of FTD Companies, Inc. (together with its subsidiaries, including FTD Group, Inc., "FTD") from United Online, Inc. through a tax-free distribution of all FTD Companies, Inc. common stock held by United Online, Inc. to United Online, Inc.'s stockholders (the "FTD Spin-Off Transaction"). As a result, FTD's financial results are presented as discontinued operations in the Company's consolidated financial statements.
Effective in the first quarter of 2015, the Company modified how it reports segment information to the Company's Chief Operating Decision Maker ("CODM") because the information regularly reviewed by the CODM had changed. As a result of the changes, the Company now reports three operating segments to the CODM, including the Communications segment, as well as separately reporting the operating results of the Commerce & Loyalty and Social Media segments (which in prior periods were reported to the CODM together as the Content & Media segment). This change has been reflected through a retroactive revision of prior-period segment information to conform to the newly-defined segment information.
As discussed above, the Company reports its business in three reportable segments: Communications, Commerce & Loyalty and Social Media. The Company's primary Communications service is Internet access. The Company's Commerce & Loyalty segment promotes commerce and user engagement through its loyalty marketing service and provides a complete web, browser and mobile shopping experience through a portfolio of online portals, apps, and browser extensions. The Company's Social Media segment provides social networking services and products. On a combined basis, the Company's web properties attract a significant number of Internet users and the Company offers a broad array of Internet marketing services for advertisers.
In August 2015, the Company consummated the sale of its Classmates domestic business unit to Intelius Holdings, Inc. The purchase price received for Classmates domestic business unit was $30.6 million in cash. The Stock Purchase Agreement for the sale included customary representations, warranties and covenants of each party, some of which survive the closing of the transaction for a period of time. Accordingly, the results of operations, the financial condition and the cash flows of Classmates domestic business unit have been presented as discontinued operations for all periods presented.
The Company's corporate headquarters are located in Woodland Hills, California, and the Company also maintains offices in San Francisco, California; Schaumburg, Illinois; Fort Lee, New Jersey; Erlangen, Germany; Berlin, Germany; and Hyderabad, India.
Basis of Presentation
The Company's consolidated financial statements for the years ended December 31, 2015, 2014 and 2013 have been prepared in accordance with accounting principles generally accepted in the United States of America ("GAAP"). All significant intercompany accounts and transactions have been
F-8
UNITED ONLINE, INC.
NOTES TO CONSOLIDATED FINANCIAL STATEMENTS (Continued)
1. DESCRIPTION OF BUSINESS, BASIS OF PRESENTATION, ACCOUNTING POLICIES, AND RECENT ACCOUNTING PRONOUNCEMENTS (Continued)
eliminated in consolidation. The results of operations for such periods are not necessarily indicative of the results expected for any future periods.
The preparation of financial statements in accordance with GAAP requires management to make estimates and assumptions that affect the reported amounts of assets and liabilities, disclosure of contingent liabilities and the reported amounts of revenues and expenses. Actual results could differ from these estimates and assumptions.
The most significant areas of the consolidated financial statements that require management judgment include the Company's revenue recognition, goodwill, definite-lived intangible assets and other long-lived assets, member redemption liability, income taxes, contingent consideration, and legal contingencies. The accounting policies for these areas are discussed elsewhere in these consolidated financial statements.
The Company believes that its existing cash and cash equivalents and cash generated from operations will be sufficient to fund its working capital requirements, capital expenditures, and other obligations through at least the next 12 months.
Accounting Policies
Segments—The Company complies with the reporting requirements of Financial Accounting Standards Board ("FASB") Accounting Standards Codification ("ASC") 280, Segment Reporting. Management measures and reviews segment performance for internal reporting purposes in accordance with the "management approach" defined in ASC 280. The reportable segments identified in Note 2 below are the segments of the Company for which separate financial information is available and for which segment results are regularly reviewed by the Company's chief operating decision maker in deciding how to allocate resources and assess performance. Management has determined that segment income from operations, which excludes depreciation and amortization of intangible assets, is the appropriate measure for assessing performance of its segments and for allocating resources among segments.
As discussed above, effective in the first quarter of 2015, the Company modified how it reports segment information to the Company's CODM as the information regularly reviewed by the CODM had changed. As a result of the changes, the Company now reports three operating segments to the CODM, including the Communications segment, as well as separately reporting the operating results of the Commerce & Loyalty and Social Media segments (which, in prior periods, were reported to the CODM together as the Content & Media segment). Further, as a result of the August 2015 sale of the Company's Classmates domestic business unit, the Social Media segment results exclude the Classmates domestic business unit (which, in prior periods, was reported as part of the Social Media segment). These changes have been reflected through a retroactive revision of prior-period segment information to conform to the newly-defined segment information.
Cash and Cash Equivalents—The Company considers cash equivalents to be only those investments which are highly liquid, readily convertible to cash and which have a maturity date within three months from the date of purchase.
F-9
UNITED ONLINE, INC.
NOTES TO CONSOLIDATED FINANCIAL STATEMENTS (Continued)
1. DESCRIPTION OF BUSINESS, BASIS OF PRESENTATION, ACCOUNTING POLICIES, AND RECENT ACCOUNTING PRONOUNCEMENTS (Continued)
At December 31, 2015 and 2014, the Company's cash and cash equivalents were maintained primarily with major financial institutions and brokerage firms in the United States ("U.S."), Germany and India. Deposits with these institutions and firms generally exceed the amount of insurance provided on such deposits.
Accounts Receivable—The Company's accounts receivable are derived primarily from revenues earned from advertising customers located in the U.S. and pay accounts. The Company extends credit based upon an evaluation of the customer's financial condition and, generally, collateral is not required. The Company maintains an allowance for doubtful accounts receivable based upon the expected collectibility of accounts receivable and, to date, such losses have been within management's expectations.
The Company evaluates specific accounts receivable where information exists that the customer may have an inability to meet its financial obligations. In these cases, based on the best available facts and circumstances, a specific allowance is recorded for that customer against amounts due to reduce the receivable to the amount that is expected to be collected. These specific allowances are re-evaluated and adjusted as additional information is received that impacts the amount of the allowance. Also, an allowance is established for all customers based on the aging of the receivables. If circumstances change (i.e., higher than expected delinquencies or an unexpected material adverse change in a customer's ability to meet its financial obligations), the estimates of the recoverability of amounts due to the Company are adjusted.
At December 31, 2015, one customer comprised approximately 19% of the Company's consolidated accounts receivable balance. At December 31, 2014, one customer comprised approximately 15% of the Company's consolidated accounts receivable balance. For the years ended December 31, 2015, 2014 and 2013, the Company did not have any individual customers that comprised more than 10% of total revenues.
Inventories—Inventories consist of finished goods, including gift cards related to the Company's member redemption liability, mobile broadband service devices, and modems. Inventories are stated at the lower of cost or market value. Inventories are valued using the first-in-first-out ("FIFO") method. Inventories also consist of work-in-process mobile broadband service devices, which have not yet been loaded with Company firmware required for functionality. The Company's management regularly assesses the valuation of inventory and reviews inventory quantities on hand and, if necessary, records a provision for excess and obsolete inventory based primarily on the age of the inventory and forecasts of product demand, as well as markdowns for the excess of cost over the amount the Company expects to realize from the sale of certain inventory. The Company recorded charges totaling $0.5 million, $1.1 million and a $0.6 million for the markdown of mobile broadband service inventory-related balances during the years ended December 31, 2015, 2014, and 2013, respectively.
Property and Equipment—Property and equipment are stated at historical cost less accumulated depreciation and amortization. Depreciation is computed using the straight-line method over the estimated useful lives of the assets, which is generally three to five years for computer software and equipment and three to seven years for furniture and fixtures. Leasehold improvements, which are included in furniture and fixtures, are amortized using the straight-line method over the shorter of the lease term or seven years. Upon the sale or retirement of property or equipment, the cost and related
F-10
UNITED ONLINE, INC.
NOTES TO CONSOLIDATED FINANCIAL STATEMENTS (Continued)
1. DESCRIPTION OF BUSINESS, BASIS OF PRESENTATION, ACCOUNTING POLICIES, AND RECENT ACCOUNTING PRONOUNCEMENTS (Continued)
accumulated depreciation or amortization is removed from the Company's consolidated financial statements with the resulting gain or loss reflected in the Company's consolidated statements of operations. Repairs and maintenance costs are expensed as incurred.
Derivative Instruments—The Company applies the provisions of ASC 815, Derivatives and Hedging. The Company enters into forward foreign currency exchange contracts to reduce the risk that its cash flows and earnings will be adversely affected by foreign currency exchange rate fluctuations. The Company records derivative instruments in other current assets or accrued liabilities in the consolidated balance sheets at fair value. The Company records changes in the fair value (i.e., gains or losses) of derivatives as other income, net, or technology and development expenses in the consolidated statements of operations or in accumulated other comprehensive loss in the consolidated balance sheets. The forward foreign currency exchange contracts do not contain any credit risk-related contingent features. The Company's hedging program is not designed for trading or speculative purposes.
Net Investment Hedges—For derivative instruments that are designated and qualify as a hedge of a net investment, the gain or loss is reported in accumulated other comprehensive loss in the consolidated balance sheets to the extent the hedge is effective, with the related amounts due to or from counterparties included in accrued liabilities or other current assets, respectively. The Company utilizes the forward-rate method of assessing hedge effectiveness. Gains or losses related to any ineffective portions of net investment hedges are recognized in other income, net in the consolidated statements of operations. The Company presents the cash flows of net investment hedges in investing activities in the consolidated statements of cash flows.
Cash Flow Hedges—The Company enters into forward foreign currency exchange contracts designated as cash flow hedges to hedge certain forecasted expense transactions occurring up to 12 months in the future and denominated in currencies other than the U.S. Dollar. The Company initially reports the gains or losses related to the effective portion of the hedges as a component of accumulated other comprehensive loss in the consolidated balance sheets and subsequently reclassifies the forward foreign currency exchange contracts' gains or losses to technology and development expenses when the hedged transactions are recorded in earnings. The Company excludes the change in the time value of the forward foreign currency exchange contracts from its assessment of their hedge effectiveness. Gains or losses related to the change in time value of the forward foreign currency exchange contracts are immediately recognized in other income, net, along with any ineffectiveness. The Company presents the cash flows from cash flow hedges in the same category in the consolidated statements of cash flows as the category for the cash flows from the hedged items.
Other Derivatives—Other derivatives not designated as hedging instruments consist of forward foreign currency exchange contracts that the Company uses to hedge intercompany transactions and partially offset the economic effect of fluctuations in foreign currency exchange rates. The Company recognizes realized and unrealized gains and losses on these contracts in other income, net. The Company presents the cash flows of other derivatives in investing activities in the consolidated statements of cash flows.
For additional information related to derivative instruments, see Note 5—"Derivative Instruments".
F-11
UNITED ONLINE, INC.
NOTES TO CONSOLIDATED FINANCIAL STATEMENTS (Continued)
1. DESCRIPTION OF BUSINESS, BASIS OF PRESENTATION, ACCOUNTING POLICIES, AND RECENT ACCOUNTING PRONOUNCEMENTS (Continued)
Fair Value of Financial Instruments—ASC 820, Fair Value Measurements and Disclosures, establishes a three-tiered hierarchy that draws a distinction between market participant assumptions based on (i) quoted prices (unadjusted) in active markets for identical assets and liabilities (Level 1); (ii) inputs other than quoted prices in active markets that are observable either directly or indirectly (Level 2); and (iii) unobservable inputs that require the Company to use present value and other valuation techniques in the determination of fair value (Level 3). In accordance with ASC 820, the Company maximizes the use of observable inputs and minimizes the use of unobservable inputs when developing fair value measurements. When available, the Company uses quoted market prices to measure fair value. If market prices are not available, fair value measurement is based upon models that use primarily market-based or independently-sourced market parameters. If market observable inputs for model-based valuation techniques are not available, the Company will be required to make judgments about assumptions market participants would use in estimating the fair value of the financial instrument. Fair values of cash and cash equivalents, short-term accounts receivable, accounts payable, and accrued liabilities approximate their carrying amounts because of their short-term nature. Time deposits, which are included in cash equivalents, are valued at amortized cost, which approximates fair value. Derivative instruments are recognized in the consolidated balance sheets at their fair values based on third-party inputs. The fair values of the forward foreign currency exchange contracts are calculated based on income approach observable market inputs adjusted for counterparty risk of nonperformance. The key assumptions used in calculating the fair value of these derivative instruments are the forward foreign currency exchange rates and discount rate.
Goodwill—Goodwill represents the excess of the purchase price of an acquired entity over the fair value of the net tangible and intangible assets acquired. The Company accounts for goodwill in accordance with ASC 350, Intangibles—Goodwill and Other, which among other things, addresses financial accounting and reporting requirements for acquired goodwill. ASC 350 prohibits the amortization of goodwill and requires the Company to test goodwill at the reporting unit level for impairment at least annually.
The Company tests the goodwill of its reporting units for impairment annually during the fourth quarter of its fiscal year and whenever events occur or circumstances change that would more likely than not indicate that the goodwill might be impaired. Events or circumstances which could trigger an impairment review include, but are not limited to, a significant adverse change in legal factors or in the business climate, an adverse action or assessment by a regulator, unanticipated competition, a loss of key management or other personnel, significant changes in the manner of the Company's use of the acquired assets or the strategy for the acquired business or the Company's overall business, significant negative industry or economic trends, or significant underperformance relative to expected historical or projected future results of operations.
Testing goodwill for impairment involves a two-step quantitative process. However, prior to performing the two-step quantitative goodwill impairment test, the Company has the option to first assess qualitative factors to determine whether or not it is necessary to perform the two-step quantitative goodwill impairment test for selected reporting units. If the Company chooses the qualitative option, the Company is not required to perform the two-step quantitative goodwill impairment test unless it has determined, based on the qualitative assessment, that it is more likely than not that the fair value of a reporting unit is less than its carrying amount. If the two-step
F-12
UNITED ONLINE, INC.
NOTES TO CONSOLIDATED FINANCIAL STATEMENTS (Continued)
1. DESCRIPTION OF BUSINESS, BASIS OF PRESENTATION, ACCOUNTING POLICIES, AND RECENT ACCOUNTING PRONOUNCEMENTS (Continued)
quantitative impairment test is required or chosen, the first step of the impairment test involves comparing the estimated fair value of a reporting unit with its carrying amount, including goodwill. If the estimated fair value of a reporting unit exceeds its carrying amount, including goodwill, goodwill is considered not to be impaired and no additional steps are necessary. If, however, the estimated fair value of a reporting unit is less than its carrying amount, including goodwill, then the carrying amount of the goodwill is compared with its implied fair value, which is determined by deducting the aggregate fair value of the reporting unit's identifiable assets and liabilities from the fair value of the reporting unit, and an impairment loss is recognized in an amount equal to the excess.
The process of estimating the fair value of goodwill is subjective and requires the Company to make estimates that may significantly impact the outcome of the analyses. The estimated fair value for each reporting unit is determined using a combination of the income approach and the market approach. The income approach is weighted at 75%, unless a meaningful base of market data is unavailable, in which case, the market approach is not used. Under the income approach, each reporting unit's fair value is estimated based on the discounted cash flow method. The discounted cash flow method is dependent upon a number of factors, including projections of the amounts and timing of future revenues and cash flows, assumed discount rates and other assumptions. Under the market approach, using the guideline company method, each reporting unit's fair value was estimated by multiplying the reporting unit's assessed sustainable level of revenues and normalized earnings before interest, taxes, depreciation, and amortization ("EBITDA") by selected revenue and EBITDA multiples based on market statistics of identified public companies comparable to the respective reporting unit.
Finite-Lived Intangible Assets and Other Long-Lived Assets—The Company accounts for identifiable intangible assets and other long-lived assets in accordance with ASC 360, Property, Plant and Equipment, which addresses financial accounting and reporting for the impairment and disposition of identifiable intangible assets and other long-lived assets. Intangible assets acquired in a business combination are initially recorded at management's estimate of their fair values. The Company evaluates the recoverability of identifiable intangible assets and other long-lived assets for impairment when events occur or circumstances change that would indicate that the carrying amount of an asset may not be recoverable. Events or circumstances that may indicate that an asset is impaired include, but are not limited to, significant decreases in the market value of an asset, significant underperformance relative to expected historical or projected future operating results, a change in the extent or manner in which an asset is used, shifts in technology, loss of key management or other personnel, significant negative industry or economic trends, changes in the Company's operating model or strategy, and competitive forces. In determining if an impairment exists, the Company estimates the undiscounted cash flows to be generated from the use and ultimate disposition of these assets. If an impairment is indicated based on a comparison of the assets' carrying amounts and the undiscounted cash flows, the impairment loss is measured as the amount by which the carrying amounts of the assets exceed the respective fair values of the assets. Definite-lived intangible assets are amortized on either a straight-line basis or an accelerated basis over their estimated useful lives, ranging from two to ten years.
Member Redemption Liability—Member redemption liability for loyalty marketing service points represents the estimated costs associated with the obligation of MyPoints.com, Inc. ("MyPoints") to redeem outstanding points accumulated by its loyalty marketing service members, less an allowance for points expected to expire prior to redemption. The estimated cost of points is primarily presented in
F-13
UNITED ONLINE, INC.
NOTES TO CONSOLIDATED FINANCIAL STATEMENTS (Continued)
1. DESCRIPTION OF BUSINESS, BASIS OF PRESENTATION, ACCOUNTING POLICIES, AND RECENT ACCOUNTING PRONOUNCEMENTS (Continued)
cost of revenues, except for the portion related to member acquisition activities, internal marketing surveys and other non-revenue generating activities, which are presented in sales and marketing expenses. The member redemption liability is recognized when members earn points, less an allowance for points expected to expire, and is reduced when members redeem accumulated points upon reaching required redemption thresholds.
MyPoints members may redeem points for third-party gift cards and other rewards. Members earn points when they respond to direct marketing offers delivered by MyPoints, purchase goods or services from advertisers, engage in certain promotional campaigns of advertisers, or engage in other specified activities.
The member redemption liability is estimated based upon the weighted-average cost and number of points that may be redeemed in the future. The weighted-average cost of points is calculated by taking the total cost of items fulfilled divided by total points redeemed. MyPoints purchases gift cards and other awards from merchants at a discount and sets redemption levels for its members. The discounts and points needed to redeem awards vary by merchant and award denomination. MyPoints has the ability to adjust the number of points required to redeem awards to reflect changes in the cost of awards.
MyPoints accounts for and reduces the gross points issued by an estimate of points that will never be redeemed by its members. This reduction is calculated based on an analysis of historical point-earning trends, redemption activities and individual member account activity. MyPoints' historical analysis takes into consideration the total points in members' accounts that have been inactive for six months or longer, less an estimated reactivation rate, plus an estimate for future cancelations of points that have not yet been outstanding for 180 days. Changes in, among other factors, the net number of points issued, redemption activities and members' activity levels could materially impact the member redemption liability.
Points in active MyPoints accounts do not expire; however, unredeemed points expire after 12 consecutive months of inactivity. For purposes of the member redemption liability, "inactive" means a lack of all of the following: email response; survey completion; profile update; and any point-earning or point-redeeming transaction. The canceling or disabling of inactive MyPoints accounts would have no impact on the Company's consolidated financial statements, as the Company fully considers inactive MyPoints accounts when establishing the member redemption liability, as discussed above.
Revenue Recognition—The Company applies the provisions of ASC 605, Revenue Recognition, which provides guidance on the recognition, presentation and disclosure of revenue in financial statements filed with the Securities and Exchange Commission ("SEC"). ASC 605 outlines the basic criteria that must be met to recognize revenue and provides guidance for disclosure related to revenue recognition policies. The Company recognizes revenues when persuasive evidence of an arrangement exists, delivery has occurred or services have been rendered, the fee is fixed or determinable, no significant Company obligations remain, and collectibility is reasonably assured. Revenues exclude sales taxes collected.
Revenues are comprised of services revenues, which are derived primarily from fees charged to pay accounts; advertising and other revenues; and products revenues, which are derived primarily from the sale mobile broadband service devices and mobile phones, including the related shipping and handling
F-14
UNITED ONLINE, INC.
NOTES TO CONSOLIDATED FINANCIAL STATEMENTS (Continued)
1. DESCRIPTION OF BUSINESS, BASIS OF PRESENTATION, ACCOUNTING POLICIES, AND RECENT ACCOUNTING PRONOUNCEMENTS (Continued)
fees; from the sale of yearbooks, including the related shipping and handling fees; and from the sale of third-party merchandise.
Service revenues for the Company's Communications services and for its social networking services are derived primarily from fees charged to pay accounts and are recognized in the period in which fees are fixed or determinable and the related services are provided to the customer. The Company's pay accounts generally pay in advance for their services by credit card, PayPal, automated clearinghouse or check, and revenues are then recognized ratably over the service period. Advance payments from pay accounts are recorded on the consolidated balance sheets as deferred revenue. The Company offers alternative payment methods to credit cards for certain Communications pay service plans. These alternative payment methods currently include payment by money order or payment through a local telephone company. In circumstances where payment is not received in advance, revenues are only recognized if collectibility is reasonably assured.
Advertising revenues from the Company's Communications services and from its social networking services consist primarily of amounts from its Internet search partner that are generated as a result of users utilizing the partner's Internet search services, amounts generated from display advertisements, and amounts generated from referring members to third-party websites or services. The Company recognizes such advertising revenues in the period in which the advertisement is displayed or, for performance-based arrangements, when the related performance criteria are met. In determining whether an arrangement exists, the Company ensures that a written contract is in place, such as a standard insertion order or a customer-specific agreement. The Company assesses whether performance criteria have been met and whether the fees are fixed or determinable based on a reconciliation of the performance criteria and the payment terms associated with the transaction. The reconciliation of the performance criteria generally includes a comparison of the Company's internally-tracked performance data to the contractual performance obligation and, when available, to third-party or customer-provided performance data.
The Company's Communications products revenues are generated from the sale of mobile broadband service devices and mobile phones, as well as the related activation fees and shipping and handling fees and are recognized upon delivery of such devices as this is considered a separate earnings process from the sale of Communications services. Sales of mobile broadband service devices bundled with free service plans and paid service plans, and activation fees, are allocated using the relative selling price method in accordance with the multiple-element arrangement provisions of ASC 605. The selling prices of the Company's mobile broadband paid service plans are determined by vendor specific objective evidence, which is based upon the monthly stand-alone selling price of each plan. The selling prices of the mobile broadband service devices and free service plans are determined by management's best estimate of selling price, which considers market and economic conditions, internal costs, pricing, and discounting practices. The revenues allocated to the free service plans are recognized ratably over the service period. Activation fees received up front in excess of the amount allocated to the mobile broadband devices are deferred and recognized as service revenues over the estimated service period.
Advertising and other revenues for the Company's loyalty marketing service consist primarily of fees generated when email offers are transmitted to members, when members respond to email offers and when members complete online transactions. Each of these activities is a discrete, independent activity, which generally is specified in the agreement with each advertising customer. As the earning
F-15
UNITED ONLINE, INC.
NOTES TO CONSOLIDATED FINANCIAL STATEMENTS (Continued)
1. DESCRIPTION OF BUSINESS, BASIS OF PRESENTATION, ACCOUNTING POLICIES, AND RECENT ACCOUNTING PRONOUNCEMENTS (Continued)
activities take place, activity measurement data (examples include the number of emails delivered and the number of responses received) is accumulated and the related revenues are recorded. The Company's loyalty marketing service also generates revenues from the sale of gift cards.
The Company's social networking products revenues are derived from the sale of yearbooks, including the related shipping and handling fees. Products revenues from the sale of yearbooks are recognized upon delivery to the customer. Shipping and handling fees charged to customers are recognized at the time the related products revenues are recognized and are included in products revenues. Shipping costs are included in cost of revenues.
Probability of collection is assessed based on a number of factors, including past transaction history with the customer and the creditworthiness of the customer. If it is determined that collectibility is not reasonably assured, revenue is not recognized until collectibility becomes reasonably assured, which is generally upon receipt of cash.
Cost of Revenues—Cost of revenues primarily includes product costs; shipping and delivery costs; printing and postage costs; costs of points earned by members of the Company's loyalty marketing service; telecommunications and data center costs; depreciation of network computers and equipment; license fees; costs related to providing customer support; costs related to customer billing and billing support for the Company's pay accounts; domain name registration fees; and personnel and overhead-related costs associated with operating the Company's networks and data centers.
Sales and Marketing—Sales and marketing expenses include expenses associated with promoting the Company's brands, services and products and with generating advertising revenues. Expenses associated with promoting the Company's brands, services and products include advertising and promotion expenses; fees paid to distribution partners, third-party advertising networks and co-registration partners to acquire new pay and free accounts; personnel and overhead-related expenses for marketing, merchandising, customer service, and sales personnel; and telemarketing costs incurred to acquire and retain pay accounts and up-sell pay accounts to additional services. Expenses associated with generating advertising revenues include sales commissions and personnel-related expenses. The Company has expended significant amounts on sales and marketing, including branding and customer acquisition campaigns consisting of television, Internet, public relations, sponsorships, print, and outdoor advertising, and on retail and other performance-based distribution relationships. Marketing and advertising costs to promote the Company's services and products are expensed in the period incurred. Advertising and promotion expenses include media, agency and promotion expenses. Media production costs are expensed the first time the advertisement is run. Media and agency costs are expensed over the period the advertising runs. Advertising and promotion expenses for the years ended December 31, 2015, 2014 and 2013 were $12.8 million, $15.5 million and $20.2 million, respectively. At December 31, 2015, and 2014, the Company did not have any prepaid advertising and promotion expenses.
Technology and Development—Technology and development expenses include expenses for product development, maintenance of existing software, technology and websites, and development of new or improved software and technology, including personnel-related expenses for the Company's technology group in various office locations. Costs incurred by the Company to manage and monitor the Company's technology and development activities are expensed as incurred.
F-16
UNITED ONLINE, INC.
NOTES TO CONSOLIDATED FINANCIAL STATEMENTS (Continued)
1. DESCRIPTION OF BUSINESS, BASIS OF PRESENTATION, ACCOUNTING POLICIES, AND RECENT ACCOUNTING PRONOUNCEMENTS (Continued)
Software Development Costs—The Company accounts for costs incurred to develop software for internal use in accordance with ASC 350, which requires such costs be capitalized and amortized over the estimated useful life of the software. The Company capitalizes costs associated with customized internal-use software systems that have reached the application development stage. Such capitalized costs include external direct costs utilized in developing or obtaining the applications and payroll and payroll-related expenses for employees who are directly associated with the applications. Capitalization of such costs begins when the preliminary project stage is complete and ceases at the point in which the project is substantially complete and ready for its intended purpose. The Company capitalized costs associated with internal-use software totaling $3.7 million and $4.3 million in the years ended December 31, 2015 and 2014, respectively, which are being depreciated on a straight-line basis over each project's estimated useful life, which is generally three years. Capitalized internal-use software is included in the computer software and equipment category within property and equipment, net, in the consolidated balance sheets.
General and Administrative—General and administrative expenses, which include unallocated corporate expenses, consist of personnel-related expenses for executive, finance, legal, human resources, facilities, internal audit, investor relations, internal customer support personnel, and personnel associated with operating the Company's corporate network systems. In addition, general and administrative expenses include, among other costs, professional fees for legal, accounting and financial services; insurance; occupancy and other overhead-related costs; office relocation costs; non-income taxes; gains and losses on sales of assets; bad debt expense; and reserves or expenses incurred as a result of settlements, judgments, fines, penalties, assessments, or other resolutions related to litigation, arbitration, investigations, disputes, or similar matters. General and administrative expenses also include expenses resulting from actual or potential transactions such as business combinations, mergers, acquisitions, dispositions, spin offs, financing transactions, and other strategic transactions, including, without limitation, expenses for advisors and representatives such as investment bankers, consultants, attorneys, and accounting firms.
Restructuring and Other Exit Costs—Restructuring and other exit costs consist of costs associated with the realignment and reorganization of the Company's operations and other employee termination events. Restructuring and other exit costs include employee termination costs, facility closure and relocation costs, and contract termination costs. The timing of associated cash payments is dependent upon the type of exit cost and can extend over a 12-month period. The Company records restructuring and other exit costs liabilities in accrued liabilities in the consolidated balance sheets.
Stock-Based Compensation—The Company follows the provisions of ASC 718, Compensation—Stock Compensation, which requires the measurement and recognition of compensation expense for all share-based payment awards made to employees and directors including restricted stock units, stock awards, stock options, and employee stock purchases. ASC 718 requires companies to estimate the fair value of share-based payment awards on the grant date using an option-pricing model. The Company values its restricted stock units based on the grant-date closing price of the Company's common stock. The Company uses the Black-Scholes option-pricing model for valuing stock options. The Company's assumptions about stock price volatility are based on the Company's historical volatility for periods approximating the expected life of options granted. The expected term was estimated using the simplified method because the Company does not have adequate historical data to estimate expected
F-17
UNITED ONLINE, INC.
NOTES TO CONSOLIDATED FINANCIAL STATEMENTS (Continued)
1. DESCRIPTION OF BUSINESS, BASIS OF PRESENTATION, ACCOUNTING POLICIES, AND RECENT ACCOUNTING PRONOUNCEMENTS (Continued)
term. The risk-free interest rate is based on the U.S. Treasury yield curve in effect at the time of grant. The value of the portion of the award that is ultimately expected to vest is recognized as an expense over the requisite service periods on a straight-line basis in the Company's consolidated statements of operations. ASC 718 also requires forfeitures to be estimated at the time of grant in order to calculate the amount of share-based payment awards ultimately expected to vest. The Company uses the "with and without" approach in determining the order in which tax attributes are utilized. As a result, the Company only recognizes a tax benefit from share-based payment awards in additional paid-in capital in the consolidated balance sheets if an incremental tax benefit is realized after all other tax attributes currently available to the Company have been utilized. In addition, the Company accounts for the indirect effects of share-based payment awards on other tax attributes in the consolidated statements of operations.
Comprehensive Income—The Company follows the provisions of ASC 220, Comprehensive Income, which establishes standards for reporting comprehensive income and its components in financial statements. Comprehensive income, as defined, includes all changes in equity during a period from non-owner sources. For the Company, comprehensive income primarily consists of its reported net income, changes in unrealized gains or losses on derivatives, net of tax, and foreign currency translation.
Foreign Currency Translation—The Company accounts for foreign currency translation in accordance with ASC 830, Foreign Currency Matters. The functional currency of each of the Company's international subsidiaries is its respective local currency. The financial statements of these subsidiaries are translated to U.S. Dollars using period-end rates of exchange for assets and liabilities, historical rates of exchange for equity, and average rates of exchange for the period for revenues and expenses. Translation gains and losses are recorded in accumulated other comprehensive loss as a component of stockholders' equity in the consolidated balance sheets.
Income Taxes—The Company applies the provisions of ASC 740, Income Taxes. Under ASC 740, deferred tax assets and liabilities are determined based on differences between the financial reporting and tax bases of assets and liabilities and are measured using the enacted tax rates and laws that will be in effect when the differences are expected to reverse. The Company records a valuation allowance to reduce its deferred tax assets to the amount that is more likely than not to be realized. In evaluating the Company's ability to recover its deferred tax assets, the Company considers all available positive and negative evidence, including its operating results, ongoing tax planning and forecasts of future taxable income on a jurisdiction-by-jurisdiction basis. In accordance with ASC 740, the Company recognizes, in its consolidated financial statements, the impact of the Company's tax positions that are more likely than not to be sustained upon examination based on the technical merits of the positions. The Company recognizes interest and penalties for uncertain tax positions in income tax expense.
In connection with the FTD Spin-Off Transaction, the Company entered into a Tax Sharing Agreement with FTD. The Tax Sharing Agreement generally will govern the Company's and FTD's respective rights, responsibilities, and obligations after the consummation of the FTD Spin-Off Transaction with respect to taxes, including ordinary course of business taxes and taxes, if any, incurred as a result of any failure of the distribution to qualify as tax-free for U.S. federal income tax purposes within the meaning of Section 355 of the Internal Revenue Code of 1986, as amended (the "Code"), including as a result of Section 355(e) of the Code. Under the Tax Sharing Agreement, with certain
F-18
UNITED ONLINE, INC.
NOTES TO CONSOLIDATED FINANCIAL STATEMENTS (Continued)
1. DESCRIPTION OF BUSINESS, BASIS OF PRESENTATION, ACCOUNTING POLICIES, AND RECENT ACCOUNTING PRONOUNCEMENTS (Continued)
exceptions, FTD generally will be responsible for the payment of all income and non-income taxes attributable to its operations or the operations of its subsidiaries, and FTD will indemnify the Company for these taxes. With certain exceptions, the Company generally will be responsible for the payment of all other income and non-income taxes, including consolidated U.S. federal income taxes of the United Online tax reporting group for which FTD is severally liable, and the Company will indemnify FTD for these taxes. The Company and FTD generally will be jointly responsible for any taxes that arise from the failure of the FTD Spin-Off Transaction to qualify as tax-free for U.S. federal income tax purposes within the meaning of Section 355 of the Code, if such failure is for any reason for which neither the Company nor FTD is responsible.
Earnings Per Share—The Company computes earnings per share in accordance with ASC 260, Earnings Per Share. ASC 260 provides that unvested share-based payment awards that contain non-forfeitable rights to dividends are participating securities and shall be included in the computation of earnings per share pursuant to the two-class method. The two-class method of computing earnings per share is an earnings allocation formula that determines earnings per share for common stock and any participating securities according to dividends declared (whether paid or unpaid) and participation rights in undistributed earnings. Certain of the Company's restricted stock units are considered participating securities because they contain non-forfeitable rights to dividends irrespective of whether the awards ultimately vest.
Legal Contingencies—The Company is currently involved in certain legal proceedings and investigations. The Company records liabilities related to pending matters when an unfavorable outcome is deemed probable and management can reasonably estimate the amount or range of loss. As additional information becomes available, the Company continually assesses the potential liability related to such pending matters.
Operating Leases—The Company leases office space, data centers, and certain office equipment under operating lease agreements with original lease periods of up to ten years. Certain of the lease agreements contain rent holidays and rent escalation provisions. Rent holidays and rent escalation provisions are considered in determining straight-line rent expense to be recorded over the lease term. The lease term begins on the date of initial possession of the leased property for purposes of recognizing lease expense on a straight-line basis over the term of the lease.
Recent Accounting Pronouncements
In April 2014, the Financial Accounting Standards Board ("FASB") issued Accounting Standards Update ("ASU") No. 2014-08, Presentation of Financial Statements and Property, Plant and Equipment: Reporting Discontinued Operations and Disclosures of Disposals of Components of an Entity. The core principle of the guidance raises the threshold for a disposal to qualify as a discontinued operation and requires new disclosures of both discontinued operations and certain other disposals that do not meet the new definition of a discontinued operation. The amendments in this ASU are effective prospectively for disposals (or classifications as held for sale) of components of an entity that occur within annual periods beginning on or after December 15, 2014, and interim periods within those years. Early adoption is permitted but only for disposals (or classifications as held for sale) that have not been reported in financial statements previously issued or available for issuance. The Company adopted the standard with no material impact on its consolidated financial statements.
F-19
UNITED ONLINE, INC.
NOTES TO CONSOLIDATED FINANCIAL STATEMENTS (Continued)
1. DESCRIPTION OF BUSINESS, BASIS OF PRESENTATION, ACCOUNTING POLICIES, AND RECENT ACCOUNTING PRONOUNCEMENTS (Continued)
In May 2014, the FASB issued ASU No. 2014-09, Revenue from Contracts with Customers. The core principle of the guidance is that an entity should recognize revenue to depict the transfer of promised goods or services to customers in an amount that reflects the consideration to which the entity expects to be entitled in exchange for those goods or services. The amendments in this ASU will be effective for annual reporting periods beginning after December 15, 2016, including interim periods within that reporting period. Early adoption is not permitted. The amendments should be applied retrospectively. In July 2015, the FASB approved a one-year deferral of the effective date with early adoption permitted. The Company intends to adopt the standard effective January 1, 2018 and is currently assessing the impact of this update on its consolidated financial statements.
In June 2014, the FASB issued ASU No. 2014-12, Compensation—Stock Compensation: Accounting for Share-Based Payments When the Terms of an Award Provide That a Performance Target Could Be Achieved after the Requisite Service Period. The core principle of the guidance requires that a performance target that affects vesting and that could be achieved after the requisite service period should be treated as a performance condition. The amendments in this ASU are effective for annual periods and interim periods within those annual periods beginning after December 15, 2015. Early adoption is permitted. Entities may apply the amendments in ASU No. 2014-12 either: (a) prospectively to all awards granted or modified after the effective date; or (b) retrospectively to all awards with performance targets that are outstanding as of the beginning of the earliest annual period presented in the financial statements and to all new or modified awards thereafter. The Company does not expect this update to have a material impact on its consolidated financial statements.
In August 2014, the FASB issued ASU No. 2014-15, Presentation of Financial Statements—Going Concern (Subtopic 205-40): Disclosure of Uncertainties about an Entity's Ability to Continue as a Going Concern. The update provides GAAP guidance on management's responsibility in evaluating whether there is substantial doubt about a company's ability to continue as a going concern and about related footnote disclosures. The amendments in this update are effective for annual periods ending after December 15, 2016, and for annual periods and interim periods thereafter. Early adoption is permitted. The Company does not expect this update to have a material impact on its consolidated financial statements.
In April 2015, the FASB issued ASU No. 2015-05, Intangibles—Goodwill and Other—Internal-Use Software (Subtopic 350-40): Customer's Accounting for Fees Paid in a Cloud Computing Arrangement. The update provides GAAP guidance on evaluating the accounting for fees paid by a customer in a cloud computing arrangement. The amendments in this update also provide a basis for evaluating whether a cloud computing arrangement includes a software license. The amendments in this update are effective for annual periods, including interim periods within those annual periods, beginning after December 15, 2015. Early adoption is permitted. The Company is currently assessing the impact of this update on its consolidated financial statements.
In June 2015, the FASB issued ASU No. 2015-10, Technical Corrections and Improvements. The update contains amendments that will affect a wide variety of topics in the Codification. The amendments in this update represent changes to clarify the Codification, correct unintended application of guidance, or make minor improvements to the Codification that are not expected to have a significant effect on current accounting practice or create a significant administrative cost to most
F-20
UNITED ONLINE, INC.
NOTES TO CONSOLIDATED FINANCIAL STATEMENTS (Continued)
1. DESCRIPTION OF BUSINESS, BASIS OF PRESENTATION, ACCOUNTING POLICIES, AND RECENT ACCOUNTING PRONOUNCEMENTS (Continued)
entities. The Company does not expect this update to have a material impact on its consolidated financial statements.
In July 2015, the FASB issued ASU No. 2015-11, Inventory (Topic 330): Simplifying the Measurement of Inventory. The amendments in this update more closely align the measurement of inventory in GAAP with the measurement of inventory in International Financial Reporting Standards (IFRS). The amendments in this update are effective for fiscal years beginning after December 15, 2016, including interim periods within those fiscal years. The amendments in this update should be applied prospectively with earlier application permitted as of the beginning of an interim or annual reporting period. The Company is currently assessing the impact of this update on its consolidated financial statements.
In November 2015, the FASB issued ASU No. 2015-17, Income Taxes (Topic 740): Balance Sheet Classification of Deferred Taxes. The amendments in this update require that deferred tax liabilities and assets be classified as noncurrent in a classified statement of financial position. The amendments in this update are effective for fiscal years beginning after December 15, 2016, including interim periods within those annual periods. The amendments in this Update may be applied either prospectively to all deferred tax liabilities and assets or retrospectively to all periods presented. The Company early adopted the standard for the year ended December 31, 2015 and applied it prospectively. As such, no adjustment was made to prior periods.
2. SEGMENT INFORMATION
Segment revenues and segment income (loss) from operations (which excludes depreciation and amortization of intangible assets) were as follows (in thousands):
| |
Year Ended December 31, 2015 | ||||||||||||
|---|---|---|---|---|---|---|---|---|---|---|---|---|---|
| |
Communications | Commerce & Loyalty |
Social Media |
Total | |||||||||
Services revenues |
$ | 62,196 | $ | — | $ | 21,304 | $ | 83,500 | |||||
Products revenues |
4,832 | — | 689 | 5,521 | |||||||||
Advertising and other revenues |
23,199 | 38,022 | 886 | 62,107 | |||||||||
| | | | | | | | | | | | | | |
Total segment revenues |
$ | 90,227 | $ | 38,022 | $ | 22,879 | $ | 151,128 | |||||
| | | | | | | | | | | | | | |
| | | | | | | | | | | | | | |
| | | | | | | | | | | | | | |
Segment income (loss) from operations |
$ | 26,651 | $ | (201 | ) | $ | 9,536 | $ | 35,986 | ||||
| | | | | | | | | | | | | | |
| | | | | | | | | | | | | | |
| | | | | | | | | | | | | | |
| |
Year Ended December 31, 2014 | ||||||||||||
|---|---|---|---|---|---|---|---|---|---|---|---|---|---|
| |
Communications | Commerce & Loyalty |
Social Media |
Total | |||||||||
Services revenues |
$ | 68,727 | $ | — | $ | 27,926 | $ | 96,653 | |||||
Products revenues |
6,254 | — | 814 | 7,068 | |||||||||
Advertising and other revenues |
28,184 | 32,218 | 1,496 | 61,898 | |||||||||
| | | | | | | | | | | | | | |
Total segment revenues |
$ | 103,165 | $ | 32,218 | $ | 30,236 | $ | 165,619 | |||||
| | | | | | | | | | | | | | |
| | | | | | | | | | | | | | |
| | | | | | | | | | | | | | |
Segment income (loss) from operations |
$ | 29,194 | $ | (1,172 | ) | $ | 13,260 | $ | 41,282 | ||||
| | | | | | | | | | | | | | |
| | | | | | | | | | | | | | |
| | | | | | | | | | | | | | |
F-21
UNITED ONLINE, INC.
NOTES TO CONSOLIDATED FINANCIAL STATEMENTS (Continued)
2. SEGMENT INFORMATION (Continued)
| |
Year Ended December 31, 2013 | ||||||||||||
|---|---|---|---|---|---|---|---|---|---|---|---|---|---|
| |
Communications | Commerce & Loyalty |
Social Media |
Total | |||||||||
Services revenues |
$ | 68,599 | $ | — | $ | 30,792 | $ | 99,391 | |||||
Products revenues |
3,537 | 597 | 716 | 4,850 | |||||||||
Advertising and other revenues |
28,722 | 42,287 | 1,761 | 72,770 | |||||||||
| | | | | | | | | | | | | | |
Total segment revenues |
$ | 100,858 | $ | 42,884 | $ | 33,269 | $ | 177,011 | |||||
| | | | | | | | | | | | | | |
| | | | | | | | | | | | | | |
| | | | | | | | | | | | | | |
Segment income (loss) from operations |
$ | 32,381 | $ | (2,757 | ) | $ | (22,899 | ) | $ | 6,725 | |||
| | | | | | | | | | | | | | |
| | | | | | | | | | | | | | |
| | | | | | | | | | | | | | |
A reconciliation of segment revenues to consolidated revenues was as follows (in thousands):
| |
Year Ended December 31, | |||||||||
|---|---|---|---|---|---|---|---|---|---|---|
| |
2015 | 2014 | 2013 | |||||||
Segment revenues: |
||||||||||
Communications |
$ | 90,227 | $ | 103,165 | $ | 100,858 | ||||
Commerce & Loyalty |
38,022 | 32,218 | 42,884 | |||||||
Social Media |
22,879 | 30,236 | 33,269 | |||||||
| | | | | | | | | | | |
Total segment revenues |
151,128 | 165,619 | 177,011 | |||||||
Corporate |
— | 100 | 145 | |||||||
Intersegment eliminations |
(10 | ) | — | (25 | ) | |||||
| | | | | | | | | | | |
Consolidated revenues |
$ | 151,118 | $ | 165,719 | $ | 177,131 | ||||
| | | | | | | | | | | |
| | | | | | | | | | | |
| | | | | | | | | | | |
A reconciliation of segment operating expenses (which excludes depreciation and amortization of intangible assets) to consolidated operating expenses was as follows (in thousands):
| |
Year Ended December 31, | |||||||||
|---|---|---|---|---|---|---|---|---|---|---|
| |
2015 | 2014 | 2013 | |||||||
Segment operating expenses: |
||||||||||
Communications |
$ | 63,576 | $ | 73,971 | $ | 68,477 | ||||
Commerce & Loyalty |
38,223 | 33,390 | 45,641 | |||||||
Social Media |
13,343 | 16,976 | 56,168 | |||||||
| | | | | | | | | | | |
Total segment operating expenses |
115,142 | 124,337 | 170,286 | |||||||
Depreciation |
6,593 | 6,688 | 6,741 | |||||||
Amortization of intangible assets |
409 | 421 | 399 | |||||||
Unallocated corporate expenses |
21,898 | 30,767 | 39,312 | |||||||
Intersegment eliminations |
(10 | ) | — | (25 | ) | |||||
| | | | | | | | | | | |
Consolidated operating expenses |
$ | 144,032 | $ | 162,213 | $ | 216,713 | ||||
| | | | | | | | | | | |
| | | | | | | | | | | |
| | | | | | | | | | | |
F-22
UNITED ONLINE, INC.
NOTES TO CONSOLIDATED FINANCIAL STATEMENTS (Continued)
2. SEGMENT INFORMATION (Continued)
A reconciliation of segment income (loss) from operations (which excludes depreciation and amortization of intangible assets) to consolidated income (loss) before income taxes was as follows (in thousands):
| |
Year Ended December 31, | |||||||||
|---|---|---|---|---|---|---|---|---|---|---|
| |
2015 | 2014 | 2013 | |||||||
Segment income (loss) from operations: |
||||||||||
Communications |
$ | 26,651 | $ | 29,194 | $ | 32,381 | ||||
Commerce & Loyalty |
(201 | ) | (1,172 | ) | (2,757 | ) | ||||
Social Media |
9,536 | 13,260 | (22,899 | ) | ||||||
| | | | | | | | | | | |
Total segment income from operations |
35,986 | 41,282 | 6,725 | |||||||
Corporate revenues |
— | 100 | 145 | |||||||
Depreciation |
(6,593 | ) | (6,688 | ) | (6,741 | ) | ||||
Amortization of intangible assets |
(409 | ) | (421 | ) | (399 | ) | ||||
Unallocated corporate expenses |
(21,898 | ) | (30,767 | ) | (39,312 | ) | ||||
Interest income |
448 | 388 | 260 | |||||||
Interest income |
— | — | (12 | ) | ||||||
Other income, net |
932 | 505 | 213 | |||||||
| | | | | | | | | | | |
Income (loss) before income taxes |
$ | 8,466 | $ | 4,399 | $ | (39,121 | ) | |||
| | | | | | | | | | | |
| | | | | | | | | | | |
| | | | | | | | | | | |
Depreciation expense by segment was as follows (in thousands):
| |
Year Ended December 31, | |||||||||
|---|---|---|---|---|---|---|---|---|---|---|
| |
2015 | 2014 | 2013 | |||||||
Communications |
$ | 2,982 | $ | 3,006 | $ | 3,354 | ||||
Commerce & Loyalty |
1,511 | 1,661 | 1,771 | |||||||
Social Media |
1,438 | 1,553 | 1,302 | |||||||
Unallocated corporate |
662 | 468 | 314 | |||||||
| | | | | | | | | | | |
Total depreciation expense |
$ | 6,593 | $ | 6,688 | $ | 6,741 | ||||
| | | | | | | | | | | |
| | | | | | | | | | | |
| | | | | | | | | | | |
Amortization of intangible assets by segment was as follows (in thousands):
| |
Year Ended December 31, 2015 |
|||||||||
|---|---|---|---|---|---|---|---|---|---|---|
| |
2015 | 2014 | 2013 | |||||||
Commerce & Loyalty |
$ | 285 | $ | 284 | $ | 263 | ||||
Social Media |
124 | 137 | 136 | |||||||
| | | | | | | | | | | |
Total amortization expense |
$ | 409 | $ | 421 | $ | 399 | ||||
| | | | | | | | | | | |
| | | | | | | | | | | |
| | | | | | | | | | | |
F-23
UNITED ONLINE, INC.
NOTES TO CONSOLIDATED FINANCIAL STATEMENTS (Continued)
2. SEGMENT INFORMATION (Continued)
Geographic revenues are attributed to countries based on the principal location of the Company's entities from which those revenues were generated. Geographic information for revenues was as follows (in thousands):
| |
Year Ended December 31, | |||||||||
|---|---|---|---|---|---|---|---|---|---|---|
| |
2015 | 2014 | 2013 | |||||||
United States |
$ | 128,237 | $ | 135,483 | $ | 143,865 | ||||
Germany |
18,924 | 24,592 | 26,730 | |||||||
Europe, excluding Germany |
3,957 | 5,644 | 6,536 | |||||||
| | | | | | | | | | | |
Consolidated revenues |
$ | 151,118 | $ | 165,719 | $ | 177,131 | ||||
| | | | | | | | | | | |
| | | | | | | | | | | |
| | | | | | | | | | | |
Geographic information for long-lived assets, which consist of property and equipment and other assets, was as follows (in thousands):
| |
December 31, | ||||||
|---|---|---|---|---|---|---|---|
| |
2015 | 2014 | |||||
United States |
$ | 11,236 | $ | 13,042 | |||
Germany |
2,861 | 2,928 | |||||
Other |
229 | 231 | |||||
| | | | | | | | |
Total long-lived assets |
$ | 14,326 | $ | 16,201 | |||
| | | | | | | | |
| | | | | | | | |
| | | | | | | | |
Segment assets are not reported to, or used by, the Company's CODM to allocate resources to, or assess performance of, the segments and therefore, total segment assets have not been disclosed.
3. BALANCE SHEET COMPONENTS
Inventories, Net
Inventories, net, consisted of the following (in thousands):
| |
December 31, | ||||||
|---|---|---|---|---|---|---|---|
| |
2015 | 2014 | |||||
Work-in-process |
$ | — | $ | 411 | |||
Finished goods |
6,878 | 5,002 | |||||
| | | | | | | | |
Total |
$ | 6,878 | $ | 5,413 | |||
| | | | | | | | |
| | | | | | | | |
| | | | | | | | |
F-24
UNITED ONLINE, INC.
NOTES TO CONSOLIDATED FINANCIAL STATEMENTS (Continued)
3. BALANCE SHEET COMPONENTS (Continued)
Other Current Assets
Other current assets consisted of the following (in thousands):
| |
December 31, | ||||||
|---|---|---|---|---|---|---|---|
| |
2015 | 2014 | |||||
Income taxes receivable |
$ | 3,599 | $ | 881 | |||
Prepaid expenses |
1,738 | 2,154 | |||||
Prepaid insurance |
1,287 | 1,319 | |||||
Other |
3,617 | 2,061 | |||||
| | | | | | | | |
Total |
$ | 10,241 | $ | 6,415 | |||
| | | | | | | | |
| | | | | | | | |
| | | | | | | | |
Property and Equipment, Net
Property and equipment, net, consisted of the following (in thousands):
| |
December 31, | ||||||
|---|---|---|---|---|---|---|---|
| |
2015 | 2014 | |||||
Computer software and equipment |
$ | 75,619 | $ | 80,846 | |||
Furniture and fixtures |
6,444 | 6,254 | |||||
| | | | | | | | |
|
82,063 | 87,100 | |||||
Less: accumulated depreciation and leasehold improvements amortization |
(68,807 | ) | (72,060 | ) | |||
| | | | | | | | |
Total |
$ | 13,256 | $ | 15,040 | |||
| | | | | | | | |
| | | | | | | | |
| | | | | | | | |
Depreciation expense for the years ended December 31, 2015, 2014 and 2013 was $6.6 million, $6.7 million and $6.7 million, respectively.
Accrued Liabilities
Accrued liabilities consisted of the following (in thousands):
| |
December 31, | ||||||
|---|---|---|---|---|---|---|---|
| |
2015 | 2014 | |||||
Employee compensation and related liabilities |
$ | 7,628 | $ | 10,927 | |||
Income taxes payable |
756 | 5,204 | |||||
Non-income taxes payable |
463 | 527 | |||||
Accrued restructuring and other exit costs |
123 | 200 | |||||
Customer deposits |
106 | 79 | |||||
Reserves for legal settlements |
105 | 30 | |||||
Separation payments for an executive officer |
— | 859 | |||||
Other |
1,071 | 719 | |||||
| | | | | | | | |
Total |
$ | 10,252 | $ | 18,545 | |||
| | | | | | | | |
| | | | | | | | |
| | | | | | | | |
F-25
UNITED ONLINE, INC.
NOTES TO CONSOLIDATED FINANCIAL STATEMENTS (Continued)
3. BALANCE SHEET COMPONENTS (Continued)
Other Liabilities
Other liabilities consisted of the following (in thousands):
| |
December 31, | ||||||
|---|---|---|---|---|---|---|---|
| |
2015 | 2014 | |||||
Income taxes payable |
$ | 3,528 | $ | 3,571 | |||
Other |
2,178 | 2,195 | |||||
| | | | | | | | |
Total |
$ | 5,706 | $ | 5,766 | |||
| | | | | | | | |
| | | | | | | | |
| | | | | | | | |
4. GOODWILL, INTANGIBLE ASSETS AND OTHER LONG-LIVED ASSETS
Goodwill
The changes in goodwill by reportable segment were as follows (in thousands):
| |
Communications | Commerce & Loyalty |
Social Media |
Total | |||||||||
|---|---|---|---|---|---|---|---|---|---|---|---|---|---|
Balance at December 31, 2013: |
|||||||||||||
Goodwill (excluding impairment charges) |
$ | 13,227 | $ | 49,122 | $ | 54,636 | $ | 116,985 | |||||
Accumulated impairment charges |
(5,738 | ) | (26,606 | ) | (37,756 | ) | (70,100 | ) | |||||
| | | | | | | | | | | | | | |
Goodwill at December 31, 2013 |
7,489 | 22,516 | 16,880 | 46,885 | |||||||||
| | | | | | | | | | | | | | |
Foreign currency translation |
— | — | (23 | ) | (23 | ) | |||||||
| | | | | | | | | | | | | | |
Balance at December 31, 2014: |
|||||||||||||
Goodwill (excluding impairment charges) |
13,227 | 49,122 | 54,613 | 116,962 | |||||||||
Accumulated impairment charges |
(5,738 | ) | (26,606 | ) | (37,756 | ) | (70,100 | ) | |||||
| | | | | | | | | | | | | | |
Goodwill at December 31, 2014 |
7,489 | 22,516 | 16,857 | 46,862 | |||||||||
| | | | | | | | | | | | | | |
Foreign currency translation |
— | — | (202 | ) | (202 | ) | |||||||
| | | | | | | | | | | | | | |
Balance at December 31, 2015: |
|||||||||||||
Goodwill (excluding impairment charges) |
13,227 | 49,122 | 54,411 | 116,760 | |||||||||
Accumulated impairment charges |
(5,738 | ) | (26,606 | ) | (37,756 | ) | (70,100 | ) | |||||
| | | | | | | | | | | | | | |
Goodwill at December 31, 2015 |
$ | 7,489 | $ | 22,516 | $ | 16,655 | $ | 46,660 | |||||
| | | | | | | | | | | | | | |
| | | | | | | | | | | | | | |
| | | | | | | | | | | | | | |
2014 Goodwill Impairment Assessment
The Company performed its annual goodwill impairment assessment for all of its reporting units during the quarter ended December 31, 2014. The Company did not perform a qualitative assessment to determine whether it is more likely than not that goodwill is impaired. The first step of the quantitative goodwill impairment test resulted in the determination that the estimated fair values of the Company's reporting units substantially exceeded their respective carrying amounts, including goodwill. Accordingly, the second step was not required.
F-26
UNITED ONLINE, INC.
NOTES TO CONSOLIDATED FINANCIAL STATEMENTS (Continued)
4. GOODWILL, INTANGIBLE ASSETS AND OTHER LONG-LIVED ASSETS (Continued)
2015 Goodwill Impairment Assessment
The Company performed a goodwill impairment assessment for the Social Media reporting unit during the quarter ended September 30, 2015 as a result of the sale of Classmates, Inc. The first step of the quantitative goodwill impairment test resulted in the determination that the estimated fair values of the Company's reporting units substantially exceeded their respective carrying amounts, including goodwill. Accordingly, the second step was not required.
The Company performed the annual quantitative goodwill impairment assessment for all of its reporting units in the fourth quarter of 2015. The first step of the quantitative goodwill impairment test resulted in the determination that the fair values of the Company's Communications and Social Media reporting units substantially exceeded their carrying amounts, including goodwill. The fair value of the Company's MyPoints reporting unit exceeded its carrying amount, including goodwill, by approximately 22%. Accordingly, the second step was not required for any of the Company's reporting units.
Intangible Assets, Net
Intangible assets, net, consisted of the following (in thousands):
| |
December 31, 2015 | |||||||||
|---|---|---|---|---|---|---|---|---|---|---|
| |
Gross Value |
Accumulated Amortization |
Net | |||||||
Pay accounts and free accounts |
$ | 56,419 | $ | (56,172 | ) | $ | 247 | |||
Customer contracts and relationships |
7,900 | (7,900 | ) | — | ||||||
Trademarks and trade names |
11,548 | (11,476 | ) | 72 | ||||||
Software and technology |
5,072 | (5,072 | ) | — | ||||||
Rights, content and intellectual property |
2,707 | (2,691 | ) | 16 | ||||||
| | | | | | | | | | | |
Total |
$ | 83,646 | $ | (83,311 | ) | $ | 335 | |||
| | | | | | | | | | | |
| | | | | | | | | | | |
| | | | | | | | | | | |
| |
December 31, 2014 | |||||||||
|---|---|---|---|---|---|---|---|---|---|---|
| |
Gross Value |
Accumulated Amortization |
Net | |||||||
Pay accounts and free accounts |
$ | 56,473 | $ | (56,096 | ) | $ | 377 | |||
Customer contracts and relationships |
7,900 | (7,900 | ) | — | ||||||
Trademarks and trade names |
11,548 | (11,191 | ) | 357 | ||||||
Software and technology |
5,079 | (5,079 | ) | — | ||||||
Rights, content and intellectual property |
2,703 | (2,703 | ) | — | ||||||
| | | | | | | | | | | |
Total |
$ | 83,703 | $ | (82,969 | ) | $ | 734 | |||
| | | | | | | | | | | |
| | | | | | | | | | | |
| | | | | | | | | | | |
Amortization expense related to intangible assets was $0.4 million for each of the years ended December 31, 2015, 2014 and 2013.
F-27
UNITED ONLINE, INC.
NOTES TO CONSOLIDATED FINANCIAL STATEMENTS (Continued)
4. GOODWILL, INTANGIBLE ASSETS AND OTHER LONG-LIVED ASSETS (Continued)
Estimated future intangible assets amortization expense at December 31, 2015 was as follows (in thousands):
| |
|
Year Ending December 31, | |
|||||||||||||||||||
|---|---|---|---|---|---|---|---|---|---|---|---|---|---|---|---|---|---|---|---|---|---|---|
| |
Total | 2016 | 2017 | 2018 | 2019 | 2020 | Thereafter | |||||||||||||||
Estimated amortization of intangible assets |
$ | 335 | $ | 180 | $ | 83 | $ | 63 | $ | 2 | $ | 2 | $ | 5 | ||||||||
5. DERIVATIVE INSTRUMENTS
The fair and notional values of outstanding derivative instruments were as follows (in thousands):
| |
|
Fair Value of Derivative Instruments |
Notional Value of Derivative Instruments |
||||||||||||
|---|---|---|---|---|---|---|---|---|---|---|---|---|---|---|---|
| |
|
December 31, | December 31, | ||||||||||||
| |
Balance Sheet Location | ||||||||||||||
| |
2015 | 2014 | 2015 | 2014 | |||||||||||
Derivative assets |
Other current assets | $ | 45 | $ | 149 | $ | 5,480 | $ | 1,594 | ||||||
Derivative liabilities |
Accrued liabilities | $ | — | $ | 18 | $ | — | $ | 867 | ||||||
The effect of derivatives designated as cash flow hedging instruments on accumulated other comprehensive loss, other income, net, and technology and development expenses was as follows (in thousands):
| |
Change in Gains (Losses) Recognized in Accumulated Other Comprehensive Loss on Derivatives Before Tax |
|||||||||
|---|---|---|---|---|---|---|---|---|---|---|
| |
Year Ended December 31, |
|||||||||
Derivatives Designated as Cash Flow Hedging Instruments
|
2015 | 2014 | 2013 | |||||||
Forward foreign currency exchange contracts |
$ | 52 | $ | (56 | ) | $ | 130 | |||
At December 31, 2015, the effective portion, before tax effect, of the Company's forward foreign currency exchange contracts designated as cash flow hedging instruments was $0.
| |
|
Gains Recognized in Earnings on Derivatives (Amount Excluded from Effectiveness Testing) |
||||||||||
|---|---|---|---|---|---|---|---|---|---|---|---|---|
| |
|
Year Ended December 31, |
||||||||||
Derivatives Designated as Cash Flow Hedging Instruments
|
Location | 2015 | 2014 | 2013 | ||||||||
Forward foreign currency exchange contracts |
Other income, net | $ | 23 | $ | 118 | $ | 100 | |||||
F-28
UNITED ONLINE, INC.
NOTES TO CONSOLIDATED FINANCIAL STATEMENTS (Continued)
5. DERIVATIVE INSTRUMENTS (Continued)
There was no ineffectiveness related to the Company's cash flow hedging instruments in the year ended December 31, 2015 and 2014. The ineffectiveness related to the Company's cash flow hedging instruments was $(8,000) in the year ended December 31, 2013.
| |
|
(Gains) Losses Reclassified from Accumulated Other Comprehensive Loss into Earnings (Effective Portion) |
||||||||||
|---|---|---|---|---|---|---|---|---|---|---|---|---|
| |
|
Year Ended December 31, |
||||||||||
Derivatives Designated as Cash Flow Hedging Instruments
|
Location | 2015 | 2014 | 2013 | ||||||||
Forward foreign currency exchange contracts |
Technology and development expenses | $ | 45 | $ | (23 | ) | $ | 323 | ||||
The effect of derivative instruments designated as net investment hedging instruments on accumulated other comprehensive loss was as follows (in thousands):
| |
Change in Gains Recognized in Accumulated Other Comprehensive Loss on Derivatives Before Tax |
|||||||||
|---|---|---|---|---|---|---|---|---|---|---|
| |
Year Ended December 31, |
|||||||||
Derivatives Designated as Net Investment Hedging Instruments
|
2015 | 2014 | 2013 | |||||||
Forward foreign currency exchange contracts |
$ | 45 | $ | 168 | — | |||||
There was no ineffectiveness related to the Company's forward foreign currency exchange contracts designated as net investment hedging instruments for the years ended December 31, 2015, 2014 and 2013.
The effect of derivative instruments not designated as hedging instruments was as follows (in thousands):
| |
|
Gains (Losses) Recognized in Earnings on Derivatives |
||||||||||
|---|---|---|---|---|---|---|---|---|---|---|---|---|
| |
|
Year Ended December 31, |
||||||||||
Derivatives Not Designated as Hedging Instruments
|
Location | 2015 | 2014 | 2013 | ||||||||
Forward foreign currency exchange contracts |
Other income, net | $ | 105 | $ | 369 | $ | 44 | |||||
For additional information related to derivative instruments, see Note 1, "Description of Business, Basis of Presentation, Accounting Policies, and Recent Accounting Pronouncements, Accounting Policies—Derivative Instruments".
F-29
UNITED ONLINE, INC.
NOTES TO CONSOLIDATED FINANCIAL STATEMENTS (Continued)
6. FAIR VALUE MEASUREMENTS
Financial Assets and Derivative Instruments
The following table presents information about financial assets and derivative instruments that were required to be measured at fair value on a recurring basis (in thousands):
| |
Estimated Fair Value | |||||||||
|---|---|---|---|---|---|---|---|---|---|---|
| |
December 31, 2015 | |||||||||
Description
|
Level 1 | Level 2 | Total | |||||||
Assets: |
||||||||||
Money market funds |
$ | 65,809 | $ | — | $ | 65,809 | ||||
Derivative assets |
— | 45 | 45 | |||||||
| | | | | | | | | | | |
Total |
$ | 65,809 | $ | 45 | $ | 65,854 | ||||
| | | | | | | | | | | |
| | | | | | | | | | | |
| | | | | | | | | | | |
| |
Estimated Fair Value | |||||||||
|---|---|---|---|---|---|---|---|---|---|---|
| |
December 31, 2014 | |||||||||
Description
|
Level 1 | Level 2 | Total | |||||||
Assets: |
||||||||||
Money market funds |
$ | 42,741 | $ | — | $ | 42,741 | ||||
Time deposits |
— | 8,041 | 8,041 | |||||||
Derivative assets |
— | 149 | 149 | |||||||
| | | | | | | | | | | |
Total |
$ | 42,741 | $ | 8,190 | $ | 50,931 | ||||
| | | | | | | | | | | |
| | | | | | | | | | | |
| | | | | | | | | | | |
Liabilities: |
||||||||||
Derivative liabilities |
$ | — | $ | 18 | $ | 18 | ||||
| | | | | | | | | | | |
Total |
$ | — | $ | 18 | $ | 18 | ||||
| | | | | | | | | | | |
| | | | | | | | | | | |
| | | | | | | | | | | |
Social Media Goodwill
During the year ended December 31, 2013, the Company recorded goodwill impairment charges related to the Social Media reporting unit totaling $37.8 million. Accordingly, such goodwill was required to be measured at fair value on a non-recurring basis and, at September 30, 2013, the estimated fair value was as follows (in thousands):
| |
Estimated Fair Value |
|||
|---|---|---|---|---|
Description
|
Total (Level 3) |
|||
Assets: |
||||
Social Media reporting unit goodwill |
$ | 16,876 | ||
The Company estimated the fair value of the Social Media reporting unit using the income approach, as a meaningful base of market data was not available to use the market approach. The inputs for the fair value calculations of the reporting unit included a 3% growth rate to calculate the terminal value and a discount rate of 16%. In addition, the Company assumed revenue growth and applied margin and other cost assumptions consistent with the reporting unit's historical trends.
F-30
UNITED ONLINE, INC.
NOTES TO CONSOLIDATED FINANCIAL STATEMENTS (Continued)
7. STOCKHOLDERS' EQUITY
Preferred Stock
United Online, Inc. has 5.0 million shares of preferred stock authorized with a par value of $0.0001. At December 31, 2015 and 2014, United Online, Inc. had no preferred shares issued or outstanding.
Reverse Stock Split
On October 31, 2013, United Online, Inc. effected a one-for-seven reverse stock split of shares of United Online, Inc. common stock. United Online, Inc. common stock share information and related per share amounts prior to October 31, 2013 have been adjusted to reflect the one-for-seven reverse stock split of shares of United Online, Inc.
Dividends
Dividends are paid on shares of common stock outstanding as of the record date. In addition, dividend equivalents are generally paid on nonvested restricted stock units outstanding as of the record date.
In January, April, and July 2013, United Online, Inc.'s Board of Directors declared quarterly cash dividends of $0.70 per share of common stock, as adjusted to reflect the one-for-seven reverse stock split. The dividends were paid on February 28, 2013, May 31, 2013, and August 30, 2013 and totaled $9.4 million, $9.7 million, and $9.7 million, respectively, including dividend equivalents paid on nonvested restricted stock units. In November 2013, United Online, Inc.'s Board of Directors declared a quarterly cash dividend of $0.15 per share of common stock. The dividends were paid on November 29, 2013 and totaled $2.2 million, including dividend equivalents paid on nonvested restricted stock units.
In January 2014, the Company announced that United Online, Inc.'s Board of Directors determined to discontinue cash dividend payments in order to provide financial flexibility to support anticipated long-term growth initiatives. The Company currently intends to retain any future earnings for use in the operation of our business and, as a result, does not intend to declare or pay any cash dividends in the foreseeable future. Any further determination to pay dividends on the Company's capital stock will be at the discretion of the Company's Board of Directors, subject to applicable laws, and will depend on the Company's financial condition, results of operations, capital requirements, general business conditions and other factors that the Company's Board of Directors considers relevant.
Common Stock Repurchases
In May 2001, the Company's Board of Directors authorized a common stock repurchase program (the "Program") that allows the Company to repurchase shares of its common stock through open market or privately negotiated transactions based on prevailing market conditions and other factors. From time to time since then, the Board of Directors has increased the amount authorized for repurchase under this Program and has extended the Program, which was recently extended by the Board of Directors (in December 2015) through December 31, 2018. From August 2001 through December 2014, the Company had repurchased $150.2 million of its common stock under the Program. There were no repurchases under the Program during the year ended December 31, 2015 and, at December 31, 2015, the authorization remaining under the Program was $80.0 million.
F-31
UNITED ONLINE, INC.
NOTES TO CONSOLIDATED FINANCIAL STATEMENTS (Continued)
7. STOCKHOLDERS' EQUITY (Continued)
Shares withheld upon the vesting of restricted stock units and upon the issuance of stock awards to pay minimum statutory employee withholding taxes are considered common stock repurchases, but are not counted as purchases against the Program. Upon vesting of most restricted stock units or issuance of stock awards, the Company currently does not collect the minimum statutory withholding taxes from employees. Instead, the Company automatically withholds, from the restricted stock units that vest and from the stock awards that are issued, the portion of those shares with a fair market value equal to the amount of the minimum statutory employee withholding taxes due, which is accounted for as a repurchase of common stock. The Company then pays the minimum statutory employee withholding taxes in cash. The amounts remitted in the year ended December 31, 2015, 2014 and 2013 were $1.7 million, $2.8 million and $4.3 million respectively, for which the Company withheld 0.1 million, 0.3 million and 0.3 million shares of common stock, respectively, that were underlying the restricted stock units that vested.
Accumulated Other Comprehensive Loss
The components of accumulated other comprehensive loss were as follows (in thousands):
| |
Gains (Losses) on Cash Flow Hedging Instruments, Net of Tax |
Gains on Other Hedging Instruments, Net of Tax |
Foreign Currency Translation |
Accumulated Other Comprehensive Loss |
|||||||||
|---|---|---|---|---|---|---|---|---|---|---|---|---|---|
Balance at December 31, 2013 |
$ | 7 | $ | — | $ | (2,282 | ) | $ | (2,275 | ) | |||
Other comprehensive loss before reclassifications |
(33 | ) | 168 | (995 | ) | (860 | ) | ||||||
Amounts reclassified from accumulated other comprehensive loss |
(23 | ) | — | — | (23 | ) | |||||||
| | | | | | | | | | | | | | |
Other comprehensive loss |
(56 | ) | 168 | (995 | ) | (883 | ) | ||||||
| | | | | | | | | | | | | | |
Balance at December 31, 2014 |
(49 | ) | 168 | (3,277 | ) | (3,158 | ) | ||||||
Other comprehensive loss before reclassifications |
4 | 45 | (1,022 | ) | (973 | ) | |||||||
Amounts reclassified from accumulated other comprehensive loss |
45 | — | — | 45 | |||||||||
| | | | | | | | | | | | | | |
Other comprehensive loss |
49 | 45 | (1,022 | ) | (928 | ) | |||||||
| | | | | | | | | | | | | | |
Balance at December 31, 2015 |
$ | — | $ | 213 | $ | (4,299 | ) | $ | (4,086 | ) | |||
| | | | | | | | | | | | | | |
| | | | | | | | | | | | | | |
| | | | | | | | | | | | | | |
All amounts reclassified from accumulated other comprehensive loss were related to losses on derivatives classified as cash flow hedges. These reclassifications impacted technology and development expenses in the consolidated statements of operations.
8. STOCK-BASED COMPENSATION PLANS
The Company has one active equity plan, the 2010 Incentive Compensation Plan, as amended and restated as of June 13, 2013 (the "Plan"), under which, in general, the Company is authorized to grant restricted stock units, stock awards and stock options.
Restricted stock units granted to employees generally vest over a one-to four-year period under a variety of vesting schedules and are canceled upon termination of employment. Restricted stock units
F-32
UNITED ONLINE, INC.
NOTES TO CONSOLIDATED FINANCIAL STATEMENTS (Continued)
8. STOCK-BASED COMPENSATION PLANS (Continued)
granted to non-employee members of United Online, Inc.'s Board of Directors generally vest annually over a one-year period.
Stock options granted to employees generally vest over a three-or four-year period under a variety of vesting schedules and are canceled upon termination of employment. Stock option grants expire after ten years unless canceled earlier due to termination of employment.
Upon the exercise of a stock option award, the vesting of a restricted stock unit or the award of common stock or restricted stock, shares of common stock are issued from authorized but unissued shares. Pursuant to the Plan, each restricted stock unit and stock award granted decreases shares available for grant by three shares and cancelations of such shares increase the shares available for grant by three shares.
At December 31, 2015, there were 16.1 million aggregate shares reserved for issuance and 11.7 million shares available for grant under the Plan.
Stock-Based Compensation
The following table summarizes the stock-based compensation that has been included in the following line items within the consolidated statements of operations (in thousands):
| |
Year Ended December 31, | |||||||||
|---|---|---|---|---|---|---|---|---|---|---|
| |
2015 | 2014 | 2013 | |||||||
Operating expenses: |
||||||||||
Cost of revenues |
$ | 134 | $ | 174 | $ | 107 | ||||
Sales and marketing |
374 | 481 | 560 | |||||||
Technology and development |
679 | 804 | 919 | |||||||
General and administrative |
4,199 | 6,052 | 7,434 | |||||||
| | | | | | | | | | | |
Total stock-based compensation |
$ | 5,386 | $ | 7,511 | $ | 9,020 | ||||
| | | | | | | | | | | |
| | | | | | | | | | | |
| | | | | | | | | | | |
Tax benefit recognized(a) |
$ | 1,831 | $ | 2,629 | $ | 3,067 | ||||
| | | | | | | | | | | |
| | | | | | | | | | | |
| | | | | | | | | | | |
- (a)
- Income tax benefit is presented prior to consideration of the Company's deferred tax asset valuation allowance. See Note 9, "Income Taxes".
F-33
UNITED ONLINE, INC.
NOTES TO CONSOLIDATED FINANCIAL STATEMENTS (Continued)
8. STOCK-BASED COMPENSATION PLANS (Continued)
Restricted Stock Units
The following table summarizes activity for restricted stock units:
| |
Restricted Stock Units |
Weighted-Average Grant Date Fair Value |
|||||
|---|---|---|---|---|---|---|---|
| |
(in thousands) |
|
|||||
Nonvested at December 31, 2014 |
805 | $ | 11.34 | ||||
Granted |
272 | $ | 15.19 | ||||
Vested |
(412 | ) | $ | 11.57 | |||
Forfeited/canceled |
(263 | ) | $ | 12.20 | |||
| | | | | | | | |
Nonvested at December 31, 2015 |
402 | $ | 13.15 | ||||
| | | | | | | | |
| | | | | | | | |
| | | | | | | | |
The weighted-average grant date fair value of restricted stock units granted during the years ended December 31, 2015, 2014 and 2013 was $15.19, $11.26 and $11.71, respectively. The fair value of restricted stock units that vested during the years ended December 31, 2015, 2014 and 2013 was $5.6 million, $7.7 million and $10.8 million, respectively. At December 31, 2015, the intrinsic value of nonvested restricted stock units was $4.7 million. At December 31, 2015, nonvested restricted stock units expected to vest totaled 0.4 million with an intrinsic value totaling $4.4 million. At December 31, 2015, total unrecognized compensation cost related to nonvested restricted stock units, net of expected forfeitures, was $3.3 million and was expected to be recognized over a weighted-average period of 0.9 years.
Stock Options
The following table summarizes stock option activity:
| |
Options Outstanding |
Weighted-Average Exercise Price |
Weighted-Average Remaining Contractual Life |
Aggregate Intrinsic Value |
|||||||||
|---|---|---|---|---|---|---|---|---|---|---|---|---|---|
| |
(in thousands) |
|
(in years) |
(in thousands) |
|||||||||
Outstanding at December 31, 2014 |
947 | $ | 12.28 | ||||||||||
Granted |
548 | $ | 14.74 | ||||||||||
Exercised |
(144 | ) | $ | 11.77 | |||||||||
Forfeited/canceled |
(508 | ) | $ | 14.53 | |||||||||
| | | | | | | | | | | | | | |
Outstanding at December 31, 2015 |
843 | $ | 12.61 | 7.2 | $ | 355 | |||||||
| | | | | | | | | | | | | | |
| | | | | | | | | | | | | | |
| | | | | | | | | | | | | | |
Exercisable at December 31, 2015 |
328 | $ | 11.41 | 4.3 | $ | 212 | |||||||
| | | | | | | | | | | | | | |
| | | | | | | | | | | | | | |
| | | | | | | | | | | | | | |
Expected to vest at December 31, 2015 |
485 | $ | 13.35 | 9.0 | $ | 137 | |||||||
| | | | | | | | | | | | | | |
| | | | | | | | | | | | | | |
| | | | | | | | | | | | | | |
The weighted-average grant date fair value of stock options granted during the year ended December 31, 2015 and 2014 was $14.74 and $5.39, respectively. The Company did not grant any stock options during the year ended December 31, 2013. The total intrinsic value of stock options exercised during the years ended December 31, 2015, 2014 and 2013 was $0.6 million, $0 and $1.5 million, respectively. Cash received from the exercise of stock options for the years ended December 31, 2015, 2014 and 2013 was $1.7 million, $0 and $5.1 million, respectively. Tax benefits realized from stock
F-34
UNITED ONLINE, INC.
NOTES TO CONSOLIDATED FINANCIAL STATEMENTS (Continued)
8. STOCK-BASED COMPENSATION PLANS (Continued)
options exercised in the years ended December 31, 2015, 2014 and 2013 were $0.2 million, $0 and $1.2 million, respectively, prior to consideration of the Company's deferred tax asset valuation allowance. At December 31, 2015, total unrecognized compensation cost related to unvested stock options, net of expected forfeitures, was $2.6 million and was expected to be recognized over a weighted-average period of 1.0 years.
The fair value of stock options granted during the year ended December 31, 2015 was estimated using the Black-Scholes option pricing model with the following weighted-average assumptions:
| |
Year Ended December 31, |
||||||
|---|---|---|---|---|---|---|---|
| |
2015 | 2014 | |||||
Risk-free interest rate |
1.71 | % | 1.87 | % | |||
Expected term (in years) |
5.83 | 5.96 | |||||
Dividend yield |
0 | % | 0 | % | |||
Volatility |
45.65 | % | 48.93 | % | |||
Employee Stock Purchase Plans
In 2010, the Company adopted the 2010 Employee Stock Purchase Plan to replace the 2001 Employee Stock Purchase Plan. The Company's 2001 Employee Stock Purchase Plan expired in 2011 following the completion of the final purchase thereunder. In November 2013, the Company adopted a revised 2010 Employee Stock Purchase Plan, which was amended in April 2015. This plan had 1.0 million shares of the common stock reserved and available for issuance at December 31, 2015.
Under the employee stock purchase plans, each eligible employee may authorize payroll deductions of up to 15% of his or her compensation to purchase shares of United Online, Inc.'s common stock on two purchase dates each year at a purchase price per share equal to 85% of the lower of (i) the closing market price per share of United Online, Inc.'s common stock on the employee's entry date into the two-year offering period in which the purchase date occurs or (ii) the closing market price per share of United Online, Inc.'s common stock on the purchase date. Each offering period has a 24-month duration and purchase intervals of six months.
The fair value of employee stock purchase plan shares was estimated using the Black-Scholes option pricing model with the following weighted-average assumptions:
| |
Year Ended December 31, | |||||||||
|---|---|---|---|---|---|---|---|---|---|---|
| |
2015 | 2014 | 2013 | |||||||
Risk-free interest rate |
0.3 | % | 0.2 | % | 0.2 | % | ||||
Expected term (in years) |
0.5 – 2.0 | 0.5 – 2.0 | 0.5 – 2.0 | |||||||
Dividend yield |
0 | % | 1.0 | % | 8.1 | % | ||||
Volatility |
48.8 | % | 43.7 | % | 40.4 | % | ||||
F-35
UNITED ONLINE, INC.
NOTES TO CONSOLIDATED FINANCIAL STATEMENTS (Continued)
8. STOCK-BASED COMPENSATION PLANS (Continued)
The assumptions presented in the table above represent the weighted average of the applicable assumptions used to value employee stock purchase plan shares. The Company calculates expected volatility based on historical volatility of United Online, Inc.'s common stock. The expected term represents the amount of time remaining in the 24-month offering period. The risk-free interest rate assumed in valuing the employee stock purchase plan shares is based on the U.S. Treasury yield curve in effect at the time of grant for the expected term. The Company determines the expected dividend yield percentage by dividing the expected annual dividend by the closing market price of United Online, Inc.'s common stock at the date of grant. At December 31, 2015, total unrecognized compensation cost related to the 2010 Employee Stock Purchase Plan was $0.5 million and was expected to be recognized over a weighted-average period of 0.7 years.
9. INCOME TAXES
Income (loss) from continuing operations before income taxes was comprised of the following (in thousands):
| |
Year Ended December 31, | |||||||||
|---|---|---|---|---|---|---|---|---|---|---|
| |
2015 | 2014 | 2013 | |||||||
Domestic |
$ | (514 | ) | $ | (7,863 | ) | $ | (15,487 | ) | |
Foreign |
8,980 | 12,262 | (23,634 | ) | ||||||
| | | | | | | | | | | |
Income (loss) before income taxes |
$ | 8,466 | $ | 4,399 | $ | (39,121 | ) | |||
| | | | | | | | | | | |
| | | | | | | | | | | |
| | | | | | | | | | | |
The provision for income taxes from continuing operations was comprised of the following (in thousands):
| |
Year Ended December 31, | |||||||||
|---|---|---|---|---|---|---|---|---|---|---|
| |
2015 | 2014 | 2013 | |||||||
Current: |
||||||||||
Federal |
$ | (583 | ) | $ | (1,673 | ) | $ | 1,591 | ||
State |
696 | 40 | 1,054 | |||||||
Foreign |
2,875 | 3,760 | 4,197 | |||||||
| | | | | | | | | | | |
|
2,988 | 2,127 | 6,842 | |||||||
| | | | | | | | | | | |
Deferred: |
||||||||||
Federal |
873 | (1,616 | ) | 40,602 | ||||||
State |
(36 | ) | 64 | 485 | ||||||
Foreign |
134 | 266 | (1,334 | ) | ||||||
| | | | | | | | | | | |
|
971 | (1,286 | ) | 39,753 | ||||||
| | | | | | | | | | | |
Provision for income taxes from continuing operations |
$ | 3,959 | $ | 841 | $ | 46,595 | ||||
| | | | | | | | | | | |
| | | | | | | | | | | |
| | | | | | | | | | | |
For the year ended December 31, 2015, the Company generated a domestic net operating loss. The Company recorded a federal income tax receivable of $2.2 million as the benefit is expected to be realized through a net operating loss carryback. The benefit related to this net operating loss carryback was recognized in the year ended December 31, 2014.
F-36
UNITED ONLINE, INC.
NOTES TO CONSOLIDATED FINANCIAL STATEMENTS (Continued)
9. INCOME TAXES (Continued)
The provision for income taxes from continuing operations reconciled to the amount computed by applying the statutory federal rate to income (loss) from continuing operations before taxes was as follows:
| |
Year Ended December 31, | |||||||||
|---|---|---|---|---|---|---|---|---|---|---|
| |
2015 | 2014 | 2013 | |||||||
Federal statutory rate |
34.0 | % | 35.0 | % | 34.0 | % | ||||
State taxes, net |
3.1 | 9.8 | 0.6 | |||||||
Nondeductible compensation |
0.1 | 16.5 | — | |||||||
Deferred tax adjustment—U.K. statutory rate reduction |
— | — | 3.6 | |||||||
Effects of foreign income |
(3.6 | ) | (15.5 | ) | 1.8 | |||||
Foreign distribution |
3.3 | 56.9 | — | |||||||
Foreign tax credit |
— | — | 9.3 | |||||||
Changes in uncertain tax positions |
4.2 | (9.9 | ) | (16.7 | ) | |||||
Capital loss |
(26.3 | ) | — | — | ||||||
Tax effect of goodwill impairment |
— | — | (32.8 | ) | ||||||
Transaction expense |
1.2 | — | — | |||||||
Indefinite-lived asset |
16.3 | 19.1 | — | |||||||
Tax settlements |
(9.0 | ) | 6.2 | — | ||||||
Valuation allowance |
24.5 | (96.3 | ) | (109.9 | ) | |||||
Benefit from discontinued operations |
(1.1 | ) | — | — | ||||||
Other differences, net |
0.1 | (2.7 | ) | (9.0 | ) | |||||
| | | | | | | | | | | |
Effective tax rate |
46.8 | % | 19.1 | % | (119.1 | )% | ||||
| | | | | | | | | | | |
| | | | | | | | | | | |
| | | | | | | | | | | |
F-37
UNITED ONLINE, INC.
NOTES TO CONSOLIDATED FINANCIAL STATEMENTS (Continued)
9. INCOME TAXES (Continued)
The significant components of net deferred tax balances were as follows (in thousands):
| |
December 31, | ||||||
|---|---|---|---|---|---|---|---|
| |
2015 | 2014 | |||||
Deferred tax assets: |
|||||||
Net operating loss and tax credit carryforwards |
$ | 37,430 | $ | 38,877 | |||
Member redemption liability |
4,850 | 5,326 | |||||
Capital loss |
2,223 | — | |||||
Stock-based compensation |
1,325 | 1,450 | |||||
Amortization of acquired intangible assets |
— | 1,206 | |||||
Other, net |
3,036 | 4,430 | |||||
| | | | | | | | |
Total gross deferred tax assets |
48,864 | 51,289 | |||||
Less: valuation allowance |
(44,234 | ) | (48,207 | ) | |||
| | | | | | | | |
Total deferred tax assets after valuation allowance |
4,630 | 3,082 | |||||
| | | | | | | | |
Deferred tax liabilities: |
|||||||
Depreciation and amortization |
(3,567 | ) | (2,675 | ) | |||
European unrepatriated earnings and profits |
(3,189 | ) | — | ||||
Amortization of acquired intangible assets |
(981 | ) | — | ||||
| | | | | | | | |
Total deferred tax liabilities |
(7,737 | ) | (2,675 | ) | |||
| | | | | | | | |
Net deferred tax assets (liabilities) |
$ | (3,107 | ) | $ | 407 | ||
| | | | | | | | |
| | | | | | | | |
| | | | | | | | |
| |
December 31, | ||||||
|---|---|---|---|---|---|---|---|
| |
2015 | 2014 | |||||
Current deferred tax assets, net |
$ | — | $ | 192 | |||
Non-current deferred tax assets, net |
1,514 | 1,549 | |||||
Current deferred tax liabilities, net |
— | (529 | ) | ||||
Non-current deferred tax liabilities, net |
(4,621 | ) | (805 | ) | |||
| | | | | | | | |
Net deferred tax assets (liabilities) |
$ | (3,107 | ) | $ | 407 | ||
| | | | | | | | |
| | | | | | | | |
| | | | | | | | |
Realization of the net deferred tax assets is primarily dependent upon the Company having sufficient taxable income within the carryback and carryforward periods to obtain a benefit from the reversal of net deductible temporary differences, utilization of tax credit carryforwards, and utilization of net operating loss carrybacks and carryforwards for federal and state income tax purposes. The determination of whether the deferred tax assets will actually be realized is subjective and requires management's judgment and evaluation of both positive and negative evidence, including taxable income in prior carryback years, future reversals of existing taxable temporary differences, applicable tax planning strategies, and forecasts of future income, including the consideration of carryback availability as a source of taxable income to realize deferred tax assets.
In assessing the realization of net deferred tax assets at December 31, 2015, based on the carryback availability, the Company believes that it was more likely than not that the Company will not realize benefits related to its domestic deductible differences. All of the remaining domestic net deferred tax assets, excluding indefinite-lived assets, will be subject to a valuation allowance as they are
F-38
UNITED ONLINE, INC.
NOTES TO CONSOLIDATED FINANCIAL STATEMENTS (Continued)
9. INCOME TAXES (Continued)
not expected to be realized. Therefore, a valuation allowance totaling $44.2 million for net unrealizable deferred tax assets, excluding indefinite-lived assets, was recorded at December 31, 2015.
Subsequent to the FTD Spin-Off Transaction in the quarter ended December 31, 2013, the Company performed an extensive evaluation for a valuation allowance against its net deferred tax assets, excluding indefinite-lived assets. In its evaluation of positive and negative evidence, the Company determined that the negative evidence was more persuasive, which led the Company to record a full valuation allowance against its domestic net deferred tax assets, excluding indefinite-lived assets and net operating loss carryback. The Company had a valuation allowance totaling $44.2 million and $48.2 million at December 31, 2015 and 2014, respectively, to reduce domestic net deferred tax assets to an amount that is more likely than not to be realized in future periods. The valuation allowance relates to domestic net deferred tax assets, including federal and state net operating loss carryforwards, member redemption liability and foreign tax credit carryforwards.
At December 31, 2015 and 2014, the Company had gross unrecognized tax benefits totaling $2.8 million and $8.6 million, respectively, all of which would have an impact on the Company's effective income tax rate, if recognized. The effective income tax rate impact is inclusive of changes in valuation allowance resulting from recognition of previously unrecognized tax benefits. A reconciliation of the beginning and ending amounts of gross unrecognized tax benefits (before federal impact of state items), excluding interest and penalties, was as follows (in thousands):
| |
Year Ended December 31, | |||||||||
|---|---|---|---|---|---|---|---|---|---|---|
| |
2015 | 2014 | 2013 | |||||||
Beginning balance |
$ | 8,625 | $ | 9,037 | $ | 4,218 | ||||
Additions for current year tax positions |
115 | 119 | 324 | |||||||
Reductions for current year tax positions |
— | (625 | ) | (268 | ) | |||||
Additions for prior year tax positions |
— | 895 | 5,565 | |||||||
Reductions for prior year tax positions |
(75 | ) | (737 | ) | (440 | ) | ||||
Reductions related to settlements with taxing authorities |
(5,816 | ) | (64 | ) | (286 | ) | ||||
Reductions due to lapse in statutes of limitations |
— | — | (76 | ) | ||||||
| | | | | | | | | | | |
Ending balance |
$ | 2,849 | $ | 8,625 | $ | 9,037 | ||||
| | | | | | | | | | | |
| | | | | | | | | | | |
| | | | | | | | | | | |
The Company files income tax returns in the U.S., various state and local jurisdictions, Germany, and certain other foreign jurisdictions. The Company is currently under audit by certain state and local, and foreign tax authorities. The audits are in varying stages of completion. The Company evaluates its tax positions and establishes liabilities for uncertain tax positions that may be challenged by tax authorities. Uncertain tax positions are reviewed on an ongoing basis and are adjusted in light of changing facts and circumstances, including progress of tax audits, case law developments and closing of statutes of limitations. Such adjustments are reflected in the provision for income taxes, as appropriate. Tax years prior to 2010 are generally not subject to examination by the IRS and state, local and foreign jurisdictions, except for items involving tax attributes that have been carried forward to tax years whose statute of limitations remains open.
F-39
UNITED ONLINE, INC.
NOTES TO CONSOLIDATED FINANCIAL STATEMENTS (Continued)
9. INCOME TAXES (Continued)
At December 31, 2015, the Company believes it is reasonably possible that its gross liabilities for unrecognized tax benefits may decrease by approximately $1.3 million within the next 12 months due to audit settlements and expiration of statute of limitations.
The Company had accrued $1.9 million and $2.7 million for interest and penalties relating to uncertain tax positions at December 31, 2015 and 2014, respectively, all of which was included in income taxes payable. The Company recorded $0.2 million, $(0.1) million and $1.3 million of interest and penalty expenses related to uncertain tax positions, which was included in provision for income taxes, for the years ended December 31, 2015, 2014 and 2013, respectively.
At December 31, 2015 and 2014, U.S. income taxes were not provided on $6.4 million and $7.8 million, respectively, of undistributed earnings of the Company's foreign subsidiaries because such earnings have been permanently reinvested in foreign operations. If these earnings were repatriated to the U.S., the Company would not expect to owe additional U.S. income taxes due to the utilization of net operating loss and foreign tax credit carryovers.
For the years ended December 31, 2015, 2014 and 2013, net income tax benefits (shortfalls) attributable to stock-based compensation from continuing operations that were allocated to stockholders' equity totaled $0, $(0.2) million and $1.3 million, respectively.
At December 31, 2015, the Company had federal, state and foreign net operating loss carryforwards totaling $87.5 million, $56.9 million and $4.0 million, respectively. The federal net operating loss carryforwards will begin to expire in 2019, the state net operating loss carryforwards begin to expire in 2016 and the foreign net operating loss carryforwards generally have an indefinite life. These carryforwards have been adjusted to reflect the Company's estimate of limitations under Section 382 of the Internal Revenue Code of 1986, as amended. At December 31, 2015, the Company had $3.2 million of foreign tax credit carryovers, which will begin to expire in 2019. Of the total FTC carryforward, $0.3 million related to the excess tax benefits from employee stock compensation, which will increase stockholders' equity by $0.3 million if and when such excess tax benefits are ultimately realized. Due to the ownership change provisions under Section 382, use of a portion of the Company's domestic net operating loss and tax credit carryforwards may be limited in future periods in the event of another ownership change. At December 31, 2015, the Company had federal and state capital loss of approximately $6.1 million and $3.5 million carryover, respectively, which will expire in 2020.
On October 31, 2013, the Company entered into a Tax Sharing Agreement with FTD. The Tax Sharing Agreement specifies the portion of tax liabilities for which the Company and FTD will each bear responsibility, and the Company and FTD have agreed to indemnify each other against amounts for which the other is not responsible. Although the Tax Sharing Agreement was entered into by the Company and FTD, the Tax Sharing Agreement is not binding on the IRS or any other taxing authority.
F-40
UNITED ONLINE, INC.
NOTES TO CONSOLIDATED FINANCIAL STATEMENTS (Continued)
10. NET INCOME (LOSS) PER COMMON SHARE
The following table sets forth the computation of basic and diluted net income (loss) per common share (in thousands, except per share amounts):
| |
Year Ended December 31, | |||||||||
|---|---|---|---|---|---|---|---|---|---|---|
| |
2015 | 2014 | 2013 | |||||||
Numerator: |
||||||||||
Income (loss) from continuing operations |
$ | 4,507 | $ | 3,558 | $ | (85,716 | ) | |||
Income allocated to participating securities |
(1,162 | ) | 340 | (1,195 | ) | |||||
| | | | | | | | | | | |
Income (loss) from continuing operations available to common stockholders |
3,345 | 3,898 | (86,911 | ) | ||||||
Income (loss) from discontinued operations, net of tax available to common stockholders |
25,466 | (8,987 | ) | (2,559 | ) | |||||
| | | | | | | | | | | |
Net income (loss) attributable to common stockholders |
$ | 28,811 | $ | (5,089 | ) | $ | (89,470 | ) | ||
| | | | | | | | | | | |
| | | | | | | | | | | |
| | | | | | | | | | | |
Denominator: |
||||||||||
Weighted-average common shares |
14,673 | 14,115 | 13,261 | |||||||
Add: Dilutive effect of non-participating securities |
54 | 4 | — | |||||||
| | | | | | | | | | | |
Shares used to calculate diluted net income (loss) per common share |
14,727 | 14,119 | 13,261 | |||||||
| | | | | | | | | | | |
| | | | | | | | | | | |
| | | | | | | | | | | |
Basic net income (loss) per common share: |
||||||||||
Continuing operations |
$ | 0.23 | $ | 0.28 | $ | (6.55 | ) | |||
Discontinued operations |
1.73 | (0.64 | ) | (0.20 | ) | |||||
| | | | | | | | | | | |
Basic net income (loss) per common share |
$ | 1.96 | $ | (0.36 | ) | $ | (6.75 | ) | ||
| | | | | | | | | | | |
| | | | | | | | | | | |
| | | | | | | | | | | |
Diluted net income (loss) per common share: |
||||||||||
Continuing operations |
$ | 0.23 | $ | 0.28 | $ | (6.55 | ) | |||
Discontinued operations |
1.73 | (0.64 | ) | (0.20 | ) | |||||
| | | | | | | | | | | |
Diluted net income (loss) per common share |
$ | 1.96 | $ | (0.36 | ) | $ | (6.75 | ) | ||
| | | | | | | | | | | |
| | | | | | | | | | | |
| | | | | | | | | | | |
The diluted net income (loss) per common share computations exclude stock options and restricted stock units which are antidilutive. Weighted-average antidilutive shares for the years ended December 31, 2015, 2014 and 2013 were 1.0 million, 1.2 million and 1.1 million, respectively.
11. RESTRUCTURING AND OTHER EXIT COSTS
Restructuring and other exit costs were a result of management's decision to streamline operations, prioritize resources for growth initiatives and increase profitability. The following tables summarize restructuring and other exit costs (in thousands):
Accrued restructuring and other exit costs at December 31, 2014 |
$ | 200 | ||
Restructuring and other exit costs |
1,468 | |||
Cash paid for restructuring and other exit costs |
(1,545 | ) | ||
| | | | | |
Accrued restructuring and other exit costs at December 31, 2015 |
$ | 123 | ||
| | | | | |
| | | | | |
| | | | | |
F-41
UNITED ONLINE, INC.
NOTES TO CONSOLIDATED FINANCIAL STATEMENTS (Continued)
11. RESTRUCTURING AND OTHER EXIT COSTS (Continued)
| |
Year Ended December 31, 2015 | ||||||||||||
|---|---|---|---|---|---|---|---|---|---|---|---|---|---|
| |
Communications | Commerce & Loyalty |
Corporate | Total | |||||||||
Restructuring and other exit costs: |
|||||||||||||
Employee termination costs |
$ | 1,105 | $ | (2 | ) | $ | 365 | $ | 1,468 | ||||
| | | | | | | | | | | | | | |
Total restructuring and other exit costs |
$ | 1,105 | $ | (2 | ) | $ | 365 | $ | 1,468 | ||||
| | | | | | | | | | | | | | |
| | | | | | | | | | | | | | |
| | | | | | | | | | | | | | |
| |
Year Ended December 31, 2014 | ||||||||||||
|---|---|---|---|---|---|---|---|---|---|---|---|---|---|
| |
Communications | Commerce & Loyalty |
Corporate | Total | |||||||||
Restructuring and other exit costs: |
|||||||||||||
Employee termination costs |
$ | 370 | $ | 1,099 | $ | 1,218 | $ | 2,687 | |||||
Facility closure and relocation costs |
9 | 358 | — | 367 | |||||||||
| | | | | | | | | | | | | | |
Total restructuring and other exit costs |
$ | 379 | $ | 1,457 | $ | 1,218 | $ | 3,054 | |||||
| | | | | | | | | | | | | | |
| | | | | | | | | | | | | | |
| | | | | | | | | | | | | | |
12. COMMITMENTS AND CONTINGENCIES
Leases
Future minimum lease payments at December 31, 2015 under noncancelable operating leases with initial lease terms in excess of one year were as follows (in thousands):
| |
|
Year Ending December 31, | ||||||||||||||||||||
|---|---|---|---|---|---|---|---|---|---|---|---|---|---|---|---|---|---|---|---|---|---|---|
| |
Total | 2016 | 2017 | 2018 | 2019 | 2020 | Thereafter | |||||||||||||||
Noncancelable operating leases |
$ | 11,453 | $ | 3,222 | $ | 2,323 | $ | 1,927 | $ | 1,950 | $ | 1,733 | $ | 298 | ||||||||
The Company leases certain office space, data centers, and office equipment under operating leases expiring at various periods through 2021. Certain of the Company's operating leases include rent holidays, as well as rent escalation provisions. The Company records rent expense on a straight-line basis over the lease term. Rent expense under operating leases for the years ended December 31, 2015, 2014 and 2013 was $3.5 million, $6.1 million and $8.3 million, respectively.
Letters of Credit
Letters of credit are maintained pursuant to certain of the Company's lease arrangements and contractual obligations. The amounts of letters of credit are subject to change based on the terms of the related agreements. Certificates of deposit totaling $0.5 million and $0.6 million at December 31, 2015 and 2014, respectively, were maintained by the Company in connection with certain of these letters of credit and were included in other current assets and other assets in the consolidated balance sheets. Commitments under letters of credit at December 31, 2015 were scheduled to expire as follows (in thousands):
| |
|
Year Ending December 31, | ||||||||||||||||||||
|---|---|---|---|---|---|---|---|---|---|---|---|---|---|---|---|---|---|---|---|---|---|---|
| |
Total | 2016 | 2017 | 2018 | 2019 | 2020 | Thereafter | |||||||||||||||
Letters of credit |
$ | 465 | $ | — | $ | — | $ | — | $ | — | $ | — | $ | 465 | ||||||||
F-42
UNITED ONLINE, INC.
NOTES TO CONSOLIDATED FINANCIAL STATEMENTS (Continued)
12. COMMITMENTS AND CONTINGENCIES (Continued)
Other Commitments
At December 31, 2015, the Company had $1.2 million of purchase obligations and $1.3 million of other liabilities. At December 31, 2015, the Company had liabilities for uncertain tax positions totaling $4.8 million, of which $1.3 million, at December 31, 2015, was expected to be due in less than one year and is included in the $1.3 million of other liabilities discussed above. The Company is not able to reasonably estimate when or if cash payments for long-term liabilities related to uncertain tax positions will occur.
In the ordinary course of business, the Company may provide indemnifications of varying scope and terms to customers, vendors, lessors, sureties and insurance companies, business partners, and other parties with respect to certain matters, including, but not limited to, losses arising out of the Company's breach of such agreements, services to be provided by the Company, or from intellectual property infringement claims made by third parties. For example, the Company agreed to indemnify the purchaser of the Company's former Classmates domestic business unit for certain liabilities and have retained responsibility for certain legal proceedings relating to the Classmates domestic business unit. In addition, the Company has entered into indemnification agreements with the Company's directors and certain of the Company's officers and employees that will require the Company, among other things, to indemnify them against certain liabilities that may arise by reason of their status or service as directors, officers or employees. The Company has also agreed to indemnify certain former officers, directors and employees of acquired companies in connection with the acquisition of such companies. The Company maintains director and officer insurance, which may cover certain liabilities, including those arising from the Company's obligation to indemnify its directors and certain of its officers and employees, and former officers, directors and employees of acquired companies, in certain circumstances.
It is not possible to determine the maximum potential amount of exposure under these indemnification agreements due to the limited history of prior indemnification claims and the unique facts and circumstances involved in each particular agreement. Such indemnification agreements may not be subject to maximum loss clauses.
Legal Matters
In June 2011, Memory Lane, Inc., a California corporation, filed a complaint in United States District Court, Central District of California, against Classmates International, Inc., Classmates Online, Inc. and Classmates, Inc. (then known as Memory Lane, Inc.) ("Classmates"), alleging false designation of origin under the Lanham Act, 15 U.S.C. section 1125, and state and common law unfair competition. The complaint included requests for an award of damages and for preliminary and permanent injunctive relief. Notwithstanding the request for preliminary injunctive relief, no motion for such relief was filed. Classmates responded to the complaint in September 2011. In October 2011, the plaintiff amended its complaint to, among other things, dismiss Classmates International, Inc. and add United Online, Inc. as a defendant. In February 2014, the jury issued a verdict for the defendants, concluding that the defendants did not infringe plaintiff's trademark and the court entered judgment in favor of the defendants. In March 2014, plaintiff filed a notice of appeal of the judgment in favor of defendants. The plaintiff's appeal brief was filed in November 2014. Classmates' opposition brief was filed in December 2014. Plaintiff's reply brief was filed in March 2015. Classmates' reply brief was filed in April 2015 and oral arguments on the appeal are scheduled for March 2016.
F-43
UNITED ONLINE, INC.
NOTES TO CONSOLIDATED FINANCIAL STATEMENTS (Continued)
12. COMMITMENTS AND CONTINGENCIES (Continued)
In 2010, Classmates, Inc., and Florists' Transworld Delivery, Inc. and FTD.COM Inc. (together, the "FTD Parties") received subpoenas from the Attorney General for the State of Kansas and the Attorney General for the State of Maryland, respectively. These subpoenas were issued on behalf of a Multistate Work Group that consists of the Attorneys General for the following states: Alabama, Alaska, Delaware, Florida, Idaho, Illinois, Kansas, Maine, Maryland, Michigan, Nebraska, New Mexico, New Jersey, North Dakota, Ohio, Oregon, Pennsylvania, South Dakota, Texas, Vermont, Washington and Wisconsin (the "Multistate Work Group"). The inquiry concerned certain post-transaction sales practices in which these companies previously engaged with certain third-party vendors and certain auto-renewal practices of Classmates, Inc. In May 2015, Classmates, Inc. and the FTD Parties entered into settlement agreements with each member of the Multistate Work Group. Under the terms of the settlement agreements, Classmates, Inc. and the FTD Parties denied all wrong-doing and agreed to certain injunctive relief and to two areas of monetary relief: (1) a payment from Classmates, Inc. and the FTD Parties in the aggregate amount of $8 million to be distributed amongst the states in the Multistate Work Group (with approximately $5.18 million to be paid by Classmates, Inc. and approximately $2.82 million to be paid by the FTD Parties); and (2) Classmates, Inc. funding a $3 million restitution program covering eligible consumers in the states in the Multistate Work Group, with any restitution not paid to consumers being paid to such states. The Classmates, Inc. portion of the payments described above relating to the settlement agreements was paid by Classmates, Inc. in July 2015. In October 2015, the Company received insurance proceeds in the amount of $4.2 million related to the Multistate Work Group inquiry and accompanying legal fees. Of this amount, $2.8 million was allocated to United Online, Inc. and $1.4 million was allocated to FTD, which was remitted to FTD in October 2015.
The Company cannot predict the outcome of these or any other legal actions or governmental investigations or their potential implications for its business. In addition, the Company, at times, has negotiated resolutions related to certain legal actions and governmental investigations. There are no assurances that additional legal actions or governmental investigations will not be instituted in connection with the Company's current or former business practices.
The Company records a liability when it believes that it is both probable that a loss will be incurred, and the amount of loss can be reasonably estimated. The Company evaluates, at least quarterly, developments in its legal matters that could affect the amount of liability that has been previously accrued, and makes adjustments as appropriate. Significant judgment is required to determine both probability and the estimated amount. The Company may be unable to estimate a possible loss or range of possible loss due to various reasons, including, among others: (i) if the damages sought are indeterminate; (ii) if the proceedings are in early stages; (iii) if there is uncertainty as to the outcome of pending appeals, motions, or settlements; (iv) if there are significant factual issues to be determined or resolved; and (v) if there are novel or unsettled legal theories presented. In such instances, there is considerable uncertainty regarding the ultimate resolution of such matters, including a possible eventual loss, if any. At December 31, 2015, the Company had reserves totaling $0.1 million for estimated losses related to legal matters. With respect to the legal matters described above that are ongoing, the Company has determined, based on its current knowledge, that the amount of possible loss or range of loss, including any reasonably possible losses in excess of amounts already accrued, is not reasonably estimable. However, legal matters are inherently unpredictable and subject to significant uncertainties, some of which are beyond the Company's control. As such, even though the Company intends to vigorously defend itself with respect to its legal matters, there can be no assurance that the
F-44
UNITED ONLINE, INC.
NOTES TO CONSOLIDATED FINANCIAL STATEMENTS (Continued)
12. COMMITMENTS AND CONTINGENCIES (Continued)
final outcome of these matters will not materially and adversely affect the Company's business, financial condition, results of operations, or cash flows.
13. SUPPLEMENTAL CASH FLOW INFORMATION
The following table sets forth supplemental cash flow disclosures (in thousands):
| |
Year Ended December 31, | |||||||||
|---|---|---|---|---|---|---|---|---|---|---|
| |
2015 | 2014 | 2013 | |||||||
Cash paid for interest |
$ | — | $ | — | $ | 7,762 | ||||
Cash paid for income taxes, net |
$ | 8,902 | $ | 3,412 | $ | 13,599 | ||||
At December 31, 2015 and 2014 non-cash investing items from continuing operations included $0.2 million and $2.6 million, respectively, of property and equipment that was not yet paid for and was included in accounts payable and other liabilities in the Company's consolidated balance sheets. During the year ended December 31, 2013, in accordance with the FTD Spin-Off Transaction, the Company made a non-cash distribution to stockholders through a tax-free dividend, which reduced the Company's stockholders' equity by $277.3 million.
14. DISCONTINUED OPERATIONS
On November 1, 2013, United Online, Inc. completed the FTD Spin-Off Transaction. In August 2015, the Company consummated the sale of its Classmates domestic business unit to Intelius Holdings, Inc. The Classmates domestic business unit was previously included as part of the Social Media segment results. Accordingly, the results of operations, financial condition and cash flows of FTD Companies, Inc. and the Classmates domestic business unit have been presented as discontinued operations for all periods presented.
F-45
UNITED ONLINE, INC.
NOTES TO CONSOLIDATED FINANCIAL STATEMENTS (Continued)
14. DISCONTINUED OPERATIONS (Continued)
Revenues and income (loss) from discontinued operations were as follows (in thousands):
| |
Year Ended December 31, | |||||||||
|---|---|---|---|---|---|---|---|---|---|---|
| |
2015 | 2014 | 2013 | |||||||
Revenues |
$ | 31,523 | $ | 52,416 | $ | 573,893 | ||||
Operating expenses: |
||||||||||
Cost of revenues |
5,488 | 9,813 | 337,867 | |||||||
Sales and marketing |
12,696 | 20,007 | 106,874 | |||||||
Technology and development |
5,678 | 10,599 | 26,485 | |||||||
General and administrative |
1,714 | 15,416 | 52,776 | |||||||
Amortization of intangible assets |
988 | 5,203 | 25,020 | |||||||
Contingent consideration—fair value adjustment |
— | — | (5,124 | ) | ||||||
Restructuring and other exit costs |
3 | 502 | 1,308 | |||||||
Impairment of goodwill, intangible assets and long-lived assets |
— | — | 17,684 | |||||||
| | | | | | | | | | | |
Total operating expenses |
26,567 | 61,540 | 562,890 | |||||||
| | | | | | | | | | | |
Operating income (loss) |
4,956 | (9,124 | ) | 11,003 | ||||||
Interest income |
1 | 1 | 536 | |||||||
Interest expense |
— | — | (10,926 | ) | ||||||
Other income, net |
— | (88 | ) | 304 | ||||||
Gain on disposal of discontinued operations |
20,787 | — | — | |||||||
| | | | | | | | | | | |
Income (loss) from discontinued operations before income taxes |
25,744 | (9,211 | ) | 917 | ||||||
Provision for (benefit from) income taxes |
278 | (224 | ) | 3,476 | ||||||
| | | | | | | | | | | |
Income (loss) from discontinued operations, net of tax |
$ | 25,466 | $ | (8,987 | ) | $ | (2,559 | ) | ||
| | | | | | | | | | | |
| | | | | | | | | | | |
| | | | | | | | | | | |
The Company recorded $1.7 million of transaction-related costs in the year ended December 31, 2013 in connection with the FTD Spin-Off Transaction, which were included in discontinued operations in the consolidated statements of operations. The Company recorded $0.3 million of transaction-related costs in the year ended December 31, 2015 in connection with the sale of the Classmates domestic business unit, which was included in discontinued operations in the consolidated statement of operations. During the year ended December 31, 2015, the Company recorded an insurance recovery gain of $2.8 million related to the Classmates' portion of the Multistate Work Group inquiry and accompanying legal fees, which was included in discontinued operations in the consolidated statement of operations.
F-46
UNITED ONLINE, INC.
NOTES TO CONSOLIDATED FINANCIAL STATEMENTS (Continued)
14. DISCONTINUED OPERATIONS (Continued)
The major classes of assets and liabilities included in discontinued operations related to the Classmates domestic business unit at December 31, 2014 were as follows (in thousands):
Assets |
||||
Current assets: |
||||
Cash and cash equivalents |
$ | 161 | ||
Accounts receivable, net |
397 | |||
Inventory, net |
3 | |||
Deferred tax assets |
3,746 | |||
Other current assets |
1,365 | |||
| | | | | |
Total current assets |
5,672 | |||
Property and equipment, net |
7,740 | |||
Goodwill |
16,152 | |||
Intangible assets, net |
8,714 | |||
Other assets |
205 | |||
| | | | | |
Total assets |
$ | 38,483 | ||
| | | | | |
| | | | | |
| | | | | |
Liabilities |
||||
Current liabilities: |
||||
Accounts payable |
$ | 2,591 | ||
Accrued liabilities |
12,284 | |||
Deferred revenue |
16,670 | |||
| | | | | |
Total current liabilities |
31,545 | |||
Deferred revenue |
1,897 | |||
Deferred tax liabilities, net |
3,256 | |||
| | | | | |
Total liabilities |
$ | 36,698 | ||
| | | | | |
| | | | | |
| | | | | |
F-47
UNITED ONLINE, INC.
NOTES TO CONSOLIDATED FINANCIAL STATEMENTS (Continued)
15. QUARTERLY FINANCIAL DATA (UNAUDITED)
| |
Quarter Ended | ||||||||||||
|---|---|---|---|---|---|---|---|---|---|---|---|---|---|
| |
December 31 | September 30 | June 30 | March 31 | |||||||||
| |
(in thousands, except per share data) |
||||||||||||
Year ended December 31, 2015: |
|||||||||||||
Revenues |
$ | 40,107 | $ | 36,289 | $ | 37,562 | $ | 37,160 | |||||
Cost of revenues |
$ | 18,417 | $ | 14,735 | $ | 14,654 | $ | 15,000 | |||||
Operating income (loss) |
$ | 3,043 | $ | 2,695 | $ | 2,170 | $ | (822 | ) | ||||
Income (loss) from continuing operations |
$ | 2,182 | $ | 1,881 | $ | 1,562 | $ | (1,118 | ) | ||||
Income from discontinued operations, net of income tax |
$ | 342 | $ | 24,070 | $ | 795 | $ | 259 | |||||
Net income (loss) |
$ | 2,524 | $ | 25,951 | $ | 2,357 | $ | (859 | ) | ||||
Net income (loss) attributable to common stockholders |
$ | 2,446 | $ | 24,989 | $ | 2,261 | $ | (859 | ) | ||||
Income (loss) from continuing operations per common share—basic |
$ | 0.14 | $ | 0.06 | $ | 0.10 | $ | (0.08 | ) | ||||
Income (loss) from continuing operations per common share—diluted |
$ | 0.14 | $ | 0.06 | $ | 0.10 | $ | (0.08 | ) | ||||
Net income (loss) per common share—basic |
$ | 0.17 | $ | 1.69 | $ | 0.15 | $ | (0.06 | ) | ||||
Net income (loss) per common share—diluted |
$ | 0.16 | $ | 1.69 | $ | 0.15 | $ | (0.06 | ) | ||||
| |
Quarter Ended | ||||||||||||
|---|---|---|---|---|---|---|---|---|---|---|---|---|---|
| |
December 31 | September 30 | June 30 | March 31 | |||||||||
| |
(in thousands, except per share data) |
||||||||||||
Year ended December 31, 2014: |
|||||||||||||
Revenues |
$ | 41,813 | $ | 39,989 | $ | 41,661 | $ | 42,256 | |||||
Cost of revenues |
$ | 15,252 | $ | 14,615 | $ | 14,553 | $ | 16,681 | |||||
Operating income (loss) |
$ | 3,066 | $ | 2,173 | $ | 3,297 | $ | (5,030 | ) | ||||
Income (loss) from continuing operations |
$ | 7,848 | $ | 989 | $ | 1,509 | $ | (6,788 | ) | ||||
Loss from discontinued operations, net of income tax |
$ | (846 | ) | $ | (783 | ) | $ | (3,759 | ) | $ | (3,599 | ) | |
Net income (loss) |
$ | 7,002 | $ | 206 | $ | (2,250 | ) | $ | (10,387 | ) | |||
Net income (loss) attributable to common stockholders |
$ | 6,606 | $ | 194 | $ | (2,109 | ) | $ | (10,387 | ) | |||
Income (loss) from continuing operations per common share—basic |
$ | 0.52 | $ | 0.07 | $ | 0.12 | $ | (0.49 | ) | ||||
Income (loss) from continuing operations per common share—diluted |
$ | 0.52 | $ | 0.07 | $ | 0.12 | $ | (0.49 | ) | ||||
Net income (loss) per common share—basic |
$ | 0.46 | $ | 0.01 | $ | (0.15 | ) | $ | (0.75 | ) | |||
Net income (loss) per common share—diluted |
$ | 0.46 | $ | 0.01 | $ | (0.15 | ) | $ | (0.75 | ) | |||
F-48
UNITED ONLINE, INC.
SCHEDULE II—VALUATION AND QUALIFYING ACCOUNTS
(in thousands)
| |
Balance at Beginning of Period |
Additions Charged to Expense |
Charged to Other Accounts |
Charges Utilized (Write-offs) |
Balance at End of Period |
|||||||||||
|---|---|---|---|---|---|---|---|---|---|---|---|---|---|---|---|---|
Accounts receivable allowance: |
||||||||||||||||
Year ended December 31, 2015 |
$ | 1,288 | $ | 32 | $ | 355 | $ | (931 | ) | $ | 744 | |||||
Year ended December 31, 2014 |
$ | 1,560 | $ | 54 | $ | 770 | $ | (1,096 | ) | $ | 1,288 | |||||
Year ended December 31, 2013 |
$ | 1,373 | $ | 359 | $ | 526 | $ | (698 | ) | $ | 1,560 | |||||
Note: Additions to the allowance for doubtful accounts are charged to expense. Additions to the allowance for sales credits are credited against revenues.
| |
Balance at Beginning of Period |
Tax Valuation Allowance Charged to Income Tax Provision |
Tax Valuation Allowance Credited to Income Tax Provision |
Balance at End of Period |
|||||||||
|---|---|---|---|---|---|---|---|---|---|---|---|---|---|
Valuation allowance for deferred tax assets: |
|||||||||||||
Year ended December 31, 2015 |
$ | 48,207 | $ | 2,629 | (a) | $ | (6,602 | )(b) | $ | 44,234 | |||
Year ended December 31, 2014 |
$ | 43,841 | $ | 5,268 | (c) | $ | (902 | )(d) | $ | 48,207 | |||
Year ended December 31, 2013 |
$ | 6,295 | $ | 40,515 | (e) | $ | (2,969 | )(f) | $ | 43,841 | |||
- (a)
- The
increase in the valuation allowance relates primarily to the capital loss carryover generated in the year ended December 31, 2015, the benefit
for which is not currently recognizable due to the uncertainty regarding its realization.
- (b)
- The
decrease in the valuation allowance relates to a reduction in the foreign tax credit carryover, a reduction in the net deferred tax assets related to
discontinued operations and the liability related to the unrepatriated earnings of foreign subsidiaries that are not permanently reinvested (excluding the liability related to indefinite-lived
assets).
- (c)
- Includes
the increase in valuation allowance due to foreign tax credits and federal and state net operating loss and credit carryforwards, as well as the
net domestic deferred tax assets (excluding the liability related to indefinite-lived assets), the benefit of which is not currently recognizable due to uncertainty regarding realization.
- (d)
- Includes
the release of valuation allowance for the utilization of foreign and state losses, refund of foreign tax withholdings and adjustments to the
foreign tax credit carryover balance.
- (e)
- Includes
the increase in valuation allowance due to foreign tax credits and state net operating loss and credit carryforwards, the benefit of which is not
currently recognizable due to uncertainty regarding realization.
- (f)
- Includes the release of valuation allowance for the utilization of foreign losses.
F-49