Attached files
UNITED STATES
SECURITIES AND EXCHANGE COMMISSION
WASHINGTON, DC 20549
________________________________________________________________________________________________________________________
FORM 10-K
________________________________________________________________________________________________________________________
(Mark One)
ý | ANNUAL REPORT PURSUANT TO SECTION 13 OR 15(d) OF THE SECURITIES EXCHANGE ACT OF 1934 |
For the fiscal year ended December 31, 2015
OR
¨ | TRANSITION REPORT PURSUANT TO SECTION 13 OR 15(d) OF THE SECURITIES EXCHANGE ACT OF 1934 |
Commission File No. 001-36550
________________________________________________________________________________________________________________________
PAR PACIFIC HOLDINGS, INC.
(Exact name of registrant as specified in its charter)
________________________________________________________________________________________________________________________
Delaware | 84-1060803 |
(State or other jurisdiction of | (I.R.S. Employer |
incorporation or organization) | Identification No.) |
800 Gessner Road, Suite 875 | |
Houston, Texas | 77024 |
(Address of principal executive offices) | (Zip Code) |
Registrant’s telephone number, including area code: (281) 899-4800
Securities registered under Section 12(b) of the Act:
Title of each class | Name of Exchange on which registered | |
Common stock, par value $0.01 per share | NYSE MKT LLC | |
Securities registered under to Section 12(g) of the Act: None
Indicate by check mark if the registrant is a well-known seasoned issuer, as defined in Rule 405 of the Securities Act. Yes ¨ No ý
Indicate by check mark if the registrant is not required to file reports pursuant to Section 13 or Section 15(d) of the Act. Yes ¨ No ý
Indicate by check mark whether the registrant (1) has filed all reports required to be filed by Section 13 or 15(d) of the Securities Exchange Act of 1934 during the preceding 12 months (or for such shorter period that the registrant was required to file such reports), and (2) has been subject to such filing requirements for the past 90 days. Yes ý No ¨
Indicate by check mark whether the registrant has submitted electronically and posted on its corporate Website, if any, every Interactive Data File required to be submitted and posted pursuant to Rule 405 of Regulation S-T (§232.405 of this chapter) during the preceding 12 months (or for such shorter period that the registrant was required to submit and post such files). Yes ý No ¨
Indicate by check mark if disclosure of delinquent filers pursuant to Item 405 of Regulation S-K is not contained herein, and will not be contained, to the best of registrant’s knowledge, in definitive proxy or information statements incorporated by reference in Part III of this Form 10-K or any amendment to this Form 10-K. ¨
Indicate by check mark whether the registrant is a large accelerated filer, an accelerated filer, a non-accelerated filer, or smaller reporting company. See definitions of “large accelerated filer,” “accelerated filer” and “smaller reporting company” in Rule 12b-2 of the Exchange Act.
Large accelerated filer | ¨ | Accelerated filer | ý | |
Non-accelerated filer | ¨ | (Do not check if a smaller reporting company) | Smaller reporting company | ¨ |
Indicate by check mark whether the registrant is a shell company (as defined in Rule 12b-2 of the Act). Yes ¨ No ý
Indicate by check mark whether the registrant has filed all document and reports required to be filed by Sections 12, 13 or 15 (d) of the Securities Exchange Act of 1934 subsequent to the distribution of securities under a plan confirmed by a court. Yes ý No ¨
The aggregate market value of voting common equity held by non-affiliates of the registrant was approximately $297,357,803 based on the closing sales price of the common stock on the NYSE MKT as of June 30, 2015. As of February 26, 2016, 41,078,097 shares of registrant’s Common Stock, $0.01 par value, were issued and outstanding.
Documents Incorporated By Reference
Certain information required to be disclosed in Part III of this report is incorporated by reference from the registrant's definitive proxy statement or an amendment to this report, which will be filed with the SEC not later than 120 days after the end of the fiscal year covered by this report.
TABLE OF CONTENTS
PAGE | |
PART I | |
Item 1. BUSINESS | |
Item 1A. RISK FACTORS | |
Item 1B. UNRESOLVED STAFF COMMENTS | |
Item 2. PROPERTIES | |
Item 3. LEGAL PROCEEDINGS | |
Item 4. MINE SAFETY DISCLOSURES | |
PART II | |
Item 5. MARKET FOR REGISTRANT’S COMMON EQUITY, RELATED STOCKHOLDER MATTERS AND ISSUER PURCHASES OF EQUITY SECURITIES | |
Item 6. SELECTED FINANCIAL DATA | |
Item 7. MANAGEMENT’S DISCUSSION AND ANALYSIS OF FINANCIAL CONDITION AND RESULTS OF OPERATIONS | |
Item 7A. QUANTITATIVE AND QUALITATIVE DISCLOSURES ABOUT MARKET RISK | |
Item 8. FINANCIAL STATEMENTS AND SUPPLEMENTARY DATA | |
Item 9. CHANGES IN AND DISAGREEMENTS WITH ACCOUNTANTS ON ACCOUNTING AND FINANCIAL DISCLOSURE | |
Item 9A. CONTROLS AND PROCEDURES | |
Item 9B. OTHER INFORMATION | |
PART III | |
Item 10. DIRECTORS, EXECUTIVE OFFICERS AND CORPORATE GOVERNANCE | |
Item 11. EXECUTIVE COMPENSATION | |
Item 12. SECURITY OWNERSHIP OF CERTAIN BENEFICIAL OWNERS AND MANAGEMENT AND RELATED STOCKHOLDER MATTERS | |
Item 13. CERTAIN RELATIONSHIPS AND RELATED TRANSACTIONS AND DIRECTOR INDEPENDENCE | |
Item 14. PRINCIPAL ACCOUNTING FEES AND SERVICES | |
PART IV | |
Item 15. EXHIBITS, FINANCIAL STATEMENT SCHEDULES | |
i
Glossary of Selected Industry Terms
Unless otherwise noted or indicated by context, the following terms used in this Annual Report on Form 10- K have the following meanings:
"Alaska North Slope" or "ANS" refers to a medium sour Alaskan crude oil characterized by an API gravity of 32 degrees and a sulfur content of approximately 0.9% by weight.
"barrel" or "bbl" refers to a common unit of measure in the oil industry, which equates to 42 gallons.
"blendstocks" refers to various compounds that are combined with gasoline or diesel from the crude oil refining process to make finished gasoline and diesel; these may include natural gasoline, FCC unit gasoline, ethanol, reformate or butane, among others.
“bpd” refers to an abbreviation for barrels per day.
"Brent" refers to a light, sweet North Sea crude oil, characterized by an API gravity of 38 degrees and a sulfur content of approximately 0.4 percent by weight that is used as a benchmark for other crude oils.
"cardlock" refers to automated unattended fueling sites that are open all day and are designed for commercial fleet vehicles.
"catalyst" refers to a substance that alters, accelerates or instigates chemical changes, but is not produced as a product of the refining process.
"CO2" refers to carbon dioxide.
"condensate" refers to light hydrocarbons which are in gas form underground, but are a liquid at normal temperatures and pressure.
"crack spread" refers to a simplified calculation that measures the difference between the price for light products and crude oil. For example, we reference the 4-1-2-1 crack spread, which is a general industry standard that approximates the per barrel refining margin resulting from processing four barrels of crude oil to produce one barrel of gasoline, two barrels of distillate (diesel and jet fuel) and one barrel of fuel oil.
"distillates" refers primarily to diesel, heating oil, kerosene and jet fuel.
"ethanol" refers to a clear, colorless, flammable oxygenated liquid. Ethanol is typically produced chemically from ethylene or biologically from fermentation of various sugars from carbohydrates found in agricultural crops and cellulosic residues from crops or wood. It is used in the United States as a gasoline octane enhancer and oxygenate.
"feedstocks" refers to crude oil and partially refined petroleum products that are processed and blended into refined products.
"GHG" refers to greenhouse gas.
"jobber" refers to a petroleum marketer.
"LSFO" refers to low sulfur fuel oil.
"MBbls" refers to thousand barrels.
"Mbpd" refers to thousand barrels per day.
"MMcf" refers to million cubic feet of natural gas.
"MMCFD" refers to million cubic feet per day.
"MMcfe" refers to million cubic feet equivalent which is determined by using the ratio of six Mcf of natural gas to one Bbl of crude oil.
“MMBTU” refers to million British thermal units.
"MW" refers to megawatt.
"NGL" refers to natural gas liquid.
ii
"NOx" refers to nitrogen oxides.
"refined products" refers to petroleum products, such as gasoline, diesel and jet fuel, that are produced by a refinery.
"throughput" refers to the volume processed through a unit or refinery.
"turnaround" refers to a periodically required standard procedure to inspect, refurbish, repair and maintain a refinery. This process involves the shutdown and inspection of major processing units and typically occurs every four to five years.
"single-point mooring" - also known as a single buoy mooring, refers to a loading buoy that is anchored offshore and serves as an interconnect for tankers loading or offloading crude oil and refined products.
"SO2" refers to sulfur dioxide
"WTI" refers to West Texas Intermediate crude oil, a light, sweet crude oil, typically characterized by an API gravity between 38 degrees and 40 degrees and a sulfur content of approximately 0.3% by weight that is used as a benchmark for other crude oils.
"yield" refers to the percentage of refined products that is produced from crude oil and other feedstocks.
iii
PART I
Item 1. BUSINESS
OVERVIEW
We are a growth-oriented company based in Houston, Texas that manages and maintains interests in energy and infrastructure businesses. We were created through the successful reorganization of Delta Petroleum Corporation ("Delta") in August 2012. The reorganization converted approximately $265 million of unsecured debt to equity and allowed us to preserve significant tax attributes. We changed our name from Par Petroleum Corporation to Par Pacific Holdings, Inc. effective October 20, 2015.
Our business is organized into three primary operating segments:
1) Refining - Our refinery in Kapolei, Hawaii produces ultra-low sulfur diesel, gasoline, jet fuel, marine fuel and other associated refined products primarily for consumption in Hawaii.
2) Retail - Our retail outlets sell gasoline, diesel and retail merchandise throughout the island of Oahu as well as the neighboring islands of Maui, Hawaii and Kauai. Our retail network includes Tesoro and "76" branded retail sites, company-operated convenience stores, sites operated in cooperation with 7-Eleven and other sites operated by third parties.
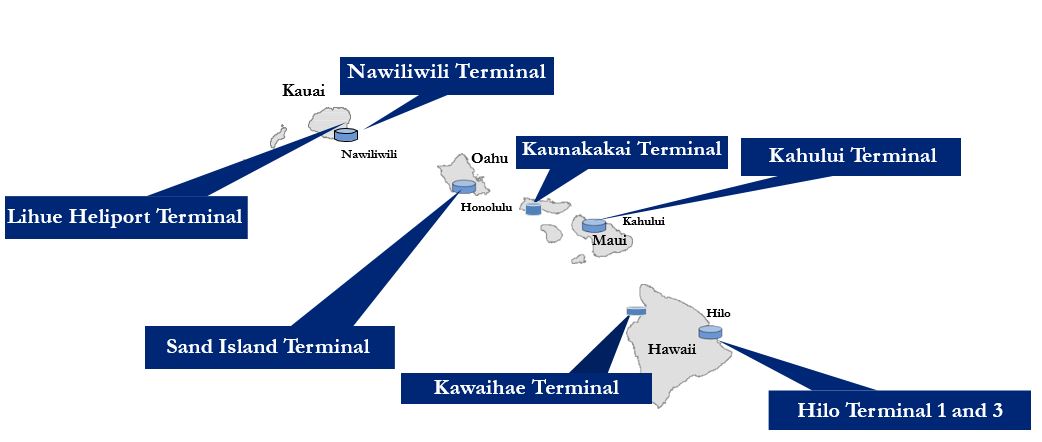
3) Logistics - We own and operate terminals, pipelines, a single-point mooring and trucking operations to distribute refined products throughout the island of Oahu as well as the neighboring islands of Maui, Hawaii, Molokai and Kauai.
We also own an equity investment in Laramie Energy, LLC ("Laramie Energy," formerly known as Piceance Energy, LLC), a joint venture entity focused on producing natural gas in Garfield, Mesa and Rio Blanco Counties, Colorado. On December 17, 2015, we entered into an equity commitment letter with Laramie Energy, pursuant to which we agreed to purchase certain membership interests of Laramie Energy for an aggregate cash purchase price of $55 million, subject to certain financing commitments by various lenders and additional equity investors, in connection with the closing of a purchase and sale agreement whereby Laramie Energy agreed to acquire certain properties in the Piceance Basin for $157.5 million, subject to customary purchase price adjustments. The transaction closed on March 1, 2016 and, upon the closing of the transaction, Laramie Energy assumed ownership and operatorship of the purchased properties and our ownership interest in Laramie Energy increased from 32.4% to 42.3%.
The refining, retail and logistics segments were established through the acquisition of Par Hawaii Refining, LLC ("PHR," formerly Hawaii Independent Energy, LLC) from Tesoro Corporation ("Tesoro") on September 25, 2013 for approximately $75 million in cash, plus net working capital and inventories, certain contingent earn-out payments of up to $40 million and the funding of certain start-up expenses and overhaul costs prior to closing. During 2014, we successfully completed the integration of PHR, terminated a transition services agreement with Tesoro and greatly reduced our reliance on third-party service providers in operating our business.
On April 1, 2015, we completed the acquisition of Par Hawaii, Inc. ("PHI," formerly Koko’oha Investments, Inc.), a Hawaii corporation that owns 100% of the outstanding membership interests of Mid Pac Petroleum, LLC (“Mid Pac”), for cash consideration of approximately $74.4 million and the assumption of $45.3 million of debt. The results of operations of Mid Pac are included in our refining, retail and logistics segments effective April 1, 2015. Mid Pac distributes gasoline and diesel through over 80 locations across the State of Hawaii and owns four terminals. In conjunction with the acquisition, we also obtained the exclusive rights to the "76" brand in Hawaii through 2024.
In addition to the three operating segments described above, we have two additional reportable segments: (i) Texadian (formerly the "Commodity Marketing and Logistics segment") and (ii) Corporate and Other. Texadian focuses on sourcing, marketing, transporting and distributing crude oil and refined products in the U.S. and Canada. Corporate and Other includes administrative costs and several small non-operated oil and gas interests that were owned by our predecessor.
Recent developments
On December 17, 2015, we entered into a credit agreement (the "KeyBank Credit Agreement") in the form of a revolving credit facility up to $5 million ("KeyBank Revolving Credit Facility"), which provides for revolving loans and for the issuance of letters of credit and a term loan agreement (“KeyBank Term Loans”), which provided term loans totaling $110 million. As of December 31, 2015, we had not made any borrowings under the KeyBank Revolving Credit Facility.
1
During 2015, we changed our reportable segments to separate our retail and logistics operations from our refining operations due to a change in senior leadership, organizational structure, the acquisition of Mid Pac and to reflect how we currently make financial decisions and allocate resources. We have five reportable segments: (i) Refining, (ii) Retail, (iii) Logistics, (iv) Texadian and (v) Corporate and Other. We previously reported results for the following three business segments: (i) Refining, Distribution and Marketing, (ii) Natural Gas and Oil Production, and (iii) Commodity Marketing and Logistics. Additionally, beginning in 2015 we have included all general and administrative costs in our Corporate and Other segment because we manage those costs on a consolidated basis. We have recast the segment information for the years ended December 31, 2014 and 2013 to conform to the current period presentation. Please read Note 19—Segment Information to our consolidated financial statements included in this Annual Report on Form 10-K for detailed information on our operating results by segment.
Corporate Information
Our common stock is listed and trades on the NYSE MKT under the ticker symbol “PARR.” Our principal executive office is located at 800 Gessner Road, Suite 875, Houston, Texas 77024 and our telephone number is (281) 899-4800. Throughout this Annual Report on Form 10-K, the terms “Par,” “we,” “our,” and “us” refer to Par Pacific Holdings, Inc. and its consolidated subsidiaries unless the context suggests otherwise.
Available Information
Our website address is www.parpacific.com. Information contained on our website is not part of this Annual Report on Form 10-K. Our annual reports on Form 10-K, quarterly reports on Form 10-Q, current reports on Form 8-K and any other materials filed with (or furnished to) the U.S. Securities and Exchange Commission ("SEC") by us are available on our website (under “Investors”) free of charge, as soon as reasonably practicable after such reports are filed with or furnished to, the SEC. Alternatively, you may access these reports at the SEC’s website at http://www.sec.gov.
HAWAII OPERATIONS
Refining
Our refinery is located in Kapolei, Hawaii on the Island of Oahu on approximately 130 fee-owned acres about 20 miles west of Honolulu and is rated at 94 thousand barrels per day throughput. We source our crude oil from North America, South America, Southeast Asia, the Middle East, Russia and other sources. The refinery's major processing units include crude distillation, vacuum distillation, visbreaking, hydrocracking, naphtha hydrotreating and reforming units, which produce ultra-low sulfur diesel, gasoline, jet fuel, marine fuel, LSFO and other associated refined products. We believe the configuration of our refinery uniquely meets the demands of the Hawaii market.
Crude oil is transported to Hawaii in tankers, which discharge through our single-point mooring. Our three underwater pipelines from the single-point mooring allow crude oil and refined products to be transferred to and from the refinery.
Crude oil is received into the refinery tank farm, which consists of 2.4 million barrels of total crude oil storage. Following crude oil receipt, we process the crude oil through the various refining units into products and store them in the refinery’s 2.5 million barrels of product tankage. The refinery storage capacity allows us to manage the various product requirements of the State of Hawaii.
We have a Supply and Offtake Agreement with J. Aron & Company ("J. Aron") that allows us to finance our hydrocarbon inventories. Under the Supply and Offtake Agreement, J. Aron holds title to all crude oil and refined product stored in tankage at the refinery. We purchase crude oil from J. Aron on a daily basis at market prices and sell refined products to J. Aron as they are produced. We repurchase these refined products from J. Aron prior to selling them to third parties.
2
Set forth below is a summary of the capacity of our refinery:
Refining Unit | Capacity (MBPD) | |
Crude Unit | 94 | |
Vacuum Distillation Unit | 40 | |
Hydrocracker | 18 | |
Catalytic Reformer | 13 | |
Visbreaker | 11 | |
Hydrogen Plant (MMCFD) | 18 | |
Naphtha Hydrotreater | 13 | |
Co-generation Turbine Unit (MW) | 20 | |
The refinery operated at an average throughput of 77 thousand barrels per day, or 82% utilization, for the year ended December 31, 2015. Below is a summary of our throughput percentage by type of crude oil and the product yield percentage for the years ended December 31, 2015, 2014 and 2013:
Year Ended December 31, | ||||||||
2015 | 2014 | 2013 | ||||||
Total crude oil throughput (Mbpd) | 77.3 | 68.2 | 64.2 | |||||
Source of crude oil: | ||||||||
North America | 47.7 | % | 48.8 | % | — | % | ||
Asia | 33.0 | % | 1.3 | % | 35.9 | % | ||
Africa | 8.3 | % | 3.7 | % | 15.8 | % | ||
Latin America | 8.0 | % | 23.4 | % | 7.1 | % | ||
Middle East | 2.1 | % | 22.8 | % | 41.2 | % | ||
Europe | 0.9 | % | — | % | — | % | ||
Total | 100.0 | % | 100.0 | % | 100.0 | % | ||
Yield (% of total throughput): | ||||||||
Gasoline and gasoline blendstocks | 26.2 | % | 24.5 | % | 26.6 | % | ||
Distillates | 44.1 | % | 38.9 | % | 49.0 | % | ||
Fuel oils | 22.0 | % | 30.7 | % | 21.3 | % | ||
Other products | 4.7 | % | 2.9 | % | 0.2 | % | ||
Total yield | 97.0 | % | 97.0 | % | 97.1 | % | ||
Our refining business sells refined products through our logistics network to wholesale and bulk customers and to our retail business. Wholesale customers include jobbers and other non-end users, as well as 37 fueling stations where operations and consumer pricing are controlled by third parties. Bulk customers include utilities, military bases, marine vessels, industrial end-users and exports.
The profitability of our refining business is heavily influenced by crack spreads in both the Singapore and U.S. West Coast markets. These markets reflect the closest, liquid market alternatives to source refined products for Hawaii. We believe the Singapore 4-1-2-1 and Mid Pacific 4-1-2-1 crack spreads (or four barrels of Brent converted into one barrel of gasoline, two barrels of distillate (jet fuel and diesel) and one barrel of fuel oil) best reflect a market indicator for our operations. During the course of 2015, both markets exhibited significant volatility with lows reached during the late second and early third quarters. The Singapore 4-1-2-1 crack spread averaged $6.88 per barrel during 2015 with a low of $5.44 per barrel in the fourth quarter and a high of $8.24 per barrel in the second quarter. The Mid Pacific 4-1-2-1 crack spread averaged $8.31 per barrel during 2015 with a low of $6.50 per barrel in the fourth quarter and a high of $9.76 per barrel in the second quarter.
3
Below is a summary of average crack spreads for the years ended December 31, 2015, 2014 and 2013:
Year Ended December 31, | |||||||||||
2015 | 2014 | 2013 | |||||||||
4-1-2-1 Mid Pacific Crack Spread (1) | $ | 8.31 | $ | 7.16 | $ | 7.33 | |||||
4-1-2-1 Singapore Crack Spread | $ | 6.88 | $ | 6.25 | $ | 5.59 | |||||
_______________________________________________________
(1) Calculated using a ratio of 80% Singapore and 20% San Francisco indexes.
During a declining crude oil market, we tend to benefit from expanding crack spreads as our product portfolio pricing terms tend to lag our crude oil pricing terms ("pricing lag effect"). A good portion of our contracts typically price at least one week in arrears and some of our utility customer contracts have at least a one month lag in the pricing terms. Our overall crack spreads benefited from the pricing lag effect as the crude oil market experienced a decline in prices throughout the year. During the fourth quarter of 2015, we began economically hedging the pricing lag effect.
Competition
All facets of the energy industry are highly competitive. Our competitors include major integrated, national and independent energy companies. Many of these competitors have greater financial and technical resources and staffs which may allow them to better withstand and react to changing and adverse market conditions.
Our refining business sources and obtains all of our crude oil from third-party sources and competes globally for crude oil and feedstocks. Our refinery, through our facility with J. Aron, has access to a large variety of markets for crude oil imports and product exports. Please read “Item 7. — Management's Discussion and Analysis of Financial Condition and Results of Operations — Commitments and Contingencies — Supply and Offtake Agreements”.
Our refined product sales, outside the Hawaii market, typically target the Eastern Asia and U.S. West Coast markets.
Retail
The retail segment includes 91 locations where the Company sets the price to the retail consumer. Of these 91 locations, 39 are outlets operated by our personnel and include various sizes of kiosks, snack shops or convenience stores. The remaining 52 locations are unmanned cardlocks stations or sites operated by third parties where we retain ownership of the fuel and set retail pricing.
The Company holds exclusive licenses within the state of Hawaii to utilize both the Tesoro and the “76” brands for retail locations. All of the manned locations (and one cardlock) are currently operated under one of those brands (see chart below). The initial term of the Tesoro license expires in September 2017 and we have two one-year extension options. The “76” license agreement expires September 24, 2024, unless extended by mutual agreement.
4
The following table shows our owned and leased retail outlets by location and type:
Location and Channel of Trade | "76" Brand | Tesoro Brand | Unbranded | Total | ||||||||
Oahu | ||||||||||||
Company operated | 4 | 18 | — | 22 | ||||||||
7-Eleven alliance | 26 | 2 | — | 28 | ||||||||
Fee operated | 7 | — | — | 7 | ||||||||
Cardlock | — | 1 | 3 | 4 | ||||||||
Oahu total | 37 | 21 | 3 | 61 | ||||||||
Big Island | ||||||||||||
Company operated | 5 | 4 | — | 9 | ||||||||
Fee operated | 3 | — | — | 3 | ||||||||
Big Island total | 8 | 4 | — | 12 | ||||||||
Maui | ||||||||||||
Company operated | 2 | 3 | — | 5 | ||||||||
Fee operated | 2 | — | — | 2 | ||||||||
Maui total | 4 | 3 | — | 7 | ||||||||
Kauai | ||||||||||||
Company operated | 3 | — | — | 3 | ||||||||
Cardlock | — | — | 8 | 8 | ||||||||
Kauai total | 3 | — | 8 | 11 | ||||||||
Total for all locations | 52 | 28 | 11 | 91 | ||||||||
Competition
Competitive factors that affect our retail performance include product price, station appearance, location and brand awareness and our competitors include an increasing number of national retailers.
Logistics
Our logistics network extends throughout the state of Hawaii. On Oahu, the system begins with our single-point mooring (“SPM”) located 1.7 miles offshore of our refinery. This SPM allows for the safe, reliable and efficient receipt of crude shipments to the refinery, as well as both the receipt and export of finished products. Connecting the SPM to the refinery are three undersea pipelines: a 30-inch line for crude oil and a 20-inch line and a 16-inch line, both for the import or export of refined products. From the refinery gate, we distribute refined products through our logistics network throughout the Island of Oahu as well as the neighboring islands of Maui, Hawaii, Molokai and Kauai.
The Oahu logistics network also includes a 27-mile wholly-owned and operated pipeline network that transports refined products from our refinery to delivery locations. The majority of our Oahu refined product volumes are distributed through the Honolulu Products Pipeline to (i) our leased and operated Sand Island terminal, (ii) the Honolulu International Airport, (iii) interconnections to Navy and Air Force fuel facilities and (iv) a third-party terminal in Honolulu Harbor. In addition to the Honolulu Products Pipeline, we own four proprietary pipelines connecting our refinery to Kalaeloa Barbers Point Harbor, approximately three miles from the refinery. The four pipelines deliver refined products to barges for distribution to the neighboring islands or export, as well as interconnecting with the other local refinery, the local utility pipeline and storage network and another third-party terminal on the west side of Oahu. The Oahu pipeline network is generally configured to be bidirectional, allowing for both delivery and receipt of products.
Our terminal facilities on Oahu include our Sand Island facility that comprises two tanks with a total capacity of 30,000 barrels, as well as contractual rights to utilize strategically located third-party facilities both near the refinery and at Honolulu Harbor near downtown.
We also operate a proprietary trucking business on Oahu to distribute gasoline and road diesel to the final point of sale.
Our logistics network for the neighboring islands consists of leased barge equipment and refined product tankage and proprietary trucking operations on the islands of Maui, Hawaii, Molokai and Kauai. Specifically, we charter two barges to serve
5
our neighbor island markets. This includes the Nale with 86,000 barrels of capacity and the Ne’ena with 50,000 barrels of capacity. In addition to neighbor island deliveries, the Ne’ena is utilized to service our bunker fuel customers, such as passenger cruise ships and container vessels.
The barges deliver to and product is dispensed from a neighbor island network of seven petroleum terminals, with the approximate locations depicted below:
Competition
Currently, substantially all of our revenues from our logistics segment represent intercompany transactions that are eliminated in consolidation.
Hawaii Market
The Hawaii economy continues to grow. The Hawaii State Department of Business, Economic Development and Tourism (“DBEDT”) reported a population increase of 3% from 2013 to 2015. Real personal income growth is projected by DEBDT to be 3% for 2016. The number of visitors arriving by air also increased. During 2015, visitor arrivals increased 4.1% and continued growth is forecasted.
Demand for jet fuel is somewhat higher in Hawaii during the winter months than during the summer months as tourism increases. Refining margins remain volatile and our results of operations may not reflect these historical seasonal trends.
OTHER OPERATIONS
Laramie Energy
We currently own an equity investment in Laramie Energy as a result of the contribution of certain natural gas and oil interests to a partnership with Laramie Energy II, LLC ("Laramie Energy II") in conjunction with our corporate reorganization in August 2012 and cash contributions made in 2015.
On December 17, 2015, we entered into an equity commitment letter with Laramie Energy, pursuant to which we agreed to purchase certain membership interests of Laramie Energy for an aggregate cash purchase price of $55 million, subject to certain financing commitments by various lenders and additional equity investors, in connection with the closing of a purchase and sale agreement whereby Laramie Energy agreed to acquire certain properties in the Piceance Basin for $157.5 million, subject to customary purchase price adjustments. The transaction closed on March 1, 2016 and, upon the closing of the transaction, Laramie Energy assumed ownership and operatorship of the purchased properties and our ownership interest in Laramie Energy increased from 32.4% to 42.3%. Laramie Energy's assets are located in Garfield, Mesa and Rio Blanco Counties, Colorado. These properties
6
produce primarily from the Mesaverde Formation and, to a lesser extent, the Mancos Formation. The majority of the acreage that will be acquired is adjacent to Laramie Energy's existing assets.
As of December 31, 2015, the estimated proved reserves of Laramie Energy and the estimated proved reserves we own indirectly through Laramie Energy are the following:
Natural Gas (MMcf) | Oil (MBbls) | NGLs (MBbls) | Total (MMcfe) (1) | ||||||||
Laramie Energy: | |||||||||||
Proved developed | 202,164 | 765 | 5,961 | 242,520 | |||||||
Proved undeveloped | 210,042 | 786 | 6,524 | 253,902 | |||||||
Total | 412,206 | 1,551 | 12,485 | 496,422 | |||||||
Company's share of Laramie Energy; | |||||||||||
Proved developed | 65,499 | 248 | 1,931 | 78,573 | |||||||
Proved undeveloped | 68,054 | 255 | 2,114 | 82,268 | |||||||
Total | 133,553 | 503 | 4,045 | 160,841 | |||||||
________________________________________________
(1) | MMcfe is computed using a ratio of 6 Mcf to 1 barrel of oil or NGL. |
For more information regarding our proved undeveloped reserves, please read "Item 2 — Properties — Reserves — Proved Undeveloped Reserves".
The following table presents the estimated future net cash flows related to proved developed producing, proved developed non-producing and proved undeveloped reserves that we own indirectly through Laramie Energy as of December 31, 2015 (unaudited, in thousands):
Proved Developed Producing | Proved Developed Non-producing | Proved Undeveloped | Total (1) | ||||||||||||
Estimated future undiscounted net cash flows | $ | 29,809 | $ | 31,221 | $ | 42,273 | $ | 103,303 | |||||||
Standardized measure of discounted future net cash flows | 19,233 | 15,166 | 5,602 | 40,001 | |||||||||||
________________________________________________
(1) | Prices are based on the historical first of the month twelve-month average posted price depending on the area. These prices are adjusted for quality, energy content, regional price differentials and transportation fees. All prices are held constant throughout the lives of the properties. The average adjusted product prices are $42.01 per barrel of oil, $14.47 per barrel of natural gas liquids and $2.59 per Mcf of natural gas. |
Reconciliation of PV-10 to Standardized Measure
PV-10 is the estimated present value of the future net revenues calculated based on our estimated proved reserves before income taxes discounted using a 10% discount rate. PV-10 is considered a non-GAAP financial measure under SEC regulations because it does not include the effects of future income taxes, as is required in computing the standardized measure of discounted future net cash flows. This measure should not be considered a substitute for, or superior to, measures prepared in accordance with U.S. generally accepted accounting principles ("GAAP"). We believe that PV-10 is an important measure that can be used to evaluate the relative significance of our natural gas and oil properties to other companies and that PV-10 is widely used by securities analysts and investors when evaluating oil and gas companies. Because many factors that are unique to each individual company impact the amount of future income taxes to be paid, the use of a pre-tax measure provides greater comparability of assets when evaluating companies. PV-10 is computed on the same basis as the standardized measure of discounted future net cash flows but without deducting income taxes.
7
The following table provides a reconciliation of PV-10 to the standardized measure of discounted future net cash flows at December 31, 2015 (in thousands):
Company's Share of Laramie Energy | ||||
PV-10 | $ | 40,001 | ||
Present value of future income taxes discounted at 10% (1) | — | |||
Standardized measure of discounted future net cash flows | $ | 40,001 | ||
________________________________________________
(1) | There is no present value of future income taxes as we believe we have sufficient net operating loss carryforwards to offset any income. Please read Note 18—Income Taxes to our consolidated financial statements for further information. |
For more information on our natural gas and oil operations, please read “Item 2. — Properties.”
Other non-operated oil and gas interests
We also own other non-operated positions in producing and non-producing natural gas and oil interests, undeveloped leasehold interests and related assets in Colorado and New Mexico and interests in a producing federal unit offshore California. As of December 31, 2015, our estimated proved reserves related to other non-operated natural gas and oil interests of 224 MMcfe represented less than 1% of our total proved reserves owned directly and indirectly through Laramie Energy of 161,065 MMcfe. Please read Note 22—Supplemental Oil and Gas Disclosures (Unaudited) to our consolidated financial statements for further information on our proved reserves related to other non-operated natural gas and oil interests.
Through our non-operated working interests, we have natural gas and oil leases with governmental entities and other third parties who enter into natural gas and oil leases or assignments with us in the regular course of our business.
Competition
The principal markets for natural gas and oil are refineries and transmission companies that have facilities near our producing properties. Natural gas and oil produced from our wells is normally sold to various purchasers. Natural gas wells are connected to pipelines generally owned by the natural gas purchasers. A variety of pipeline transportation charges are usually included in the calculation of the price paid for the natural gas. Crude oil is picked up and transported by the purchaser from the wellhead. In some instances, we are charged a fee for the cost of transporting the crude oil, which is deducted from or accounted for in the price paid for the crude oil.
The natural gas and oil business is highly competitive in the acquisition of natural gas and oil leases, exploration and production capabilities and equipment and personnel required to find and produce reserves. Our competitors may be able to pay more for desirable leases than our financial or personnel resources permit. Because we are a non-operator, our competitors are in a much stronger position than we are to evaluate, bid for and purchase properties and to explore for and produce natural gas and oil.
Texadian
We operate an integrated sourcing, marketing, transportation and distribution business focused on energy commodities, principally crude oil. We use a variety of transportation modes, which are generally leased, to transport products, including pipelines. We also lease a fleet of approximately 150 railcars. We purchase and resell crude oil primarily from the Western U.S. and Canada to customers in the Midwest, U.S. Gulf Coast and East Coast regions of the U.S. The principal asset of the Texadian business is its historical shipper status on lines moving Canadian crude oil to the U.S.
Texadian is a commodity-driven business with numerous industry participants. Our competitors include terminal companies, major integrated oil and gas companies and their affiliates, wholesalers and independent marketers. Our success is dependent on pricing and margins dictated by the global supply and demand of commodities.
8
BANKRUPTCY AND PLAN OF REORGANIZATION
Background and Plan Approval
In 2011 and 2012, Delta and its subsidiaries ("Debtors") filed voluntary petitions under Chapter 11 of the U.S. Bankruptcy Code in the U.S. Bankruptcy Court for the District of Delaware ("Bankruptcy Court"). In March 2012, the Debtors obtained approval from the Bankruptcy Court to proceed with Laramie as the sponsor of a plan of reorganization (“Plan”). In June 2012, Delta entered into a contribution agreement (“Contribution Agreement”) with a new joint venture formed by Delta, Laramie and Laramie Energy, to effect the transactions contemplated by the Plan. On August 31, 2012 ("Emergence Date"), Delta emerged from bankruptcy, amended and restated its certificate of incorporation and bylaws, changed its name to Par Petroleum Corporation and contributed the majority of its natural gas and oil properties to Laramie Energy.
General Recovery Trust
On the Emergence Date, the Delta Petroleum General Recovery Trust (“General Trust”) was formed to pursue certain litigation against third parties or causes of action under the U.S. Bankruptcy Code and other claims and potential claims that the Debtors hold against third parties. The General Trust was funded with $1.0 million pursuant to the Plan.
The General Trust is pursuing all bankruptcy causes of action, claim objections and resolutions and is responsible for winding up the bankruptcy. The General Trust is overseen by a three-person General Trust Oversight Board and our General Counsel is currently the trustee (“Recovery Trustee”). Costs, expenses and obligations incurred by the General Trust are charged against assets of the General Trust. To conduct its operations and fulfill its responsibilities under the Plan and the trust agreements, the Recovery Trustee may request additional funding from us. Any litigation pending at the time we emerged from Chapter 11 was transferred to the General Trust for resolution and settlement in accordance with the Plan and the order confirming the Plan. We are the beneficiary of the General Trust, subject to the terms of the trust agreement and the Plan. Since the Emergence Date, the General Trust has filed various claims and causes of action against third parties before the Bankruptcy Court, which actions are ongoing. Upon liquidation of the various claims and causes of action held by the General Trust, the proceeds, less certain administrative reserves and expenses, will be transferred to us. It is unknown at this time what proceeds, if any, we will realize from the General Trust’s litigation efforts.
Through December 31, 2013, the General Trust released approximately $5.2 million to us, which was available for our general use, due to a negotiated reduction in certain fees and claims associated with the bankruptcy, as well as a favorable variance in actual expenses versus budgeted expenses. No funds were released during the years ended December 31, 2015 and 2014.
Shares Reserved for Unsecured Claims
The Plan provides that certain allowed general unsecured claims be paid with shares of our common stock. On the Emergence Date, 112 claims totaling approximately $73.7 million had been filed in the bankruptcy. Pursuant to the Plan, between the Emergence Date and December 31, 2013, the Recovery Trustee settled 84 claims with an aggregate face amount of $33.5 million for approximately $5.7 million in cash and 228,735 shares of common stock. Pursuant to the Plan, during the year ended December 31, 2014, the Recovery Trustee settled one additional claim with an aggregate face amount of $3.7 million for approximately 146 thousand shares of common stock. Pursuant to the Plan, during the year ended December 31, 2015, the Recovery Trustee settled one additional claim with an aggregate face amount of approximately $31 thousand for 1,674 shares of common stock.
As of December 31, 2015, a total of twelve claims totaling approximately $23.1 million remain to be resolved by the Recovery Trustee. We have agreed to settle six of these claims for aggregate consideration of approximately $666 thousand, subject to final documentation and payment, and have filed or will file notices of objection with respect to liability for the other claims.
The largest remaining proof of claim was filed by the U.S. Government for approximately $22.4 million relating to ongoing litigation concerning a plugging and abandonment obligation in Pacific Outer Continental Shelf Lease OCS-P 0320, comprising part of the Sword Unit in the Santa Barbara Channel, California. We believe the probability of issuing stock to satisfy the full claim amount is remote, as the obligations upon which such proof of claim is asserted are joint and several among all working interest owners and Delta, our predecessor, owned an approximate 2.4% working interest in the unit.
The settlement of claims is subject to ongoing litigation and we are unable to predict with certainty how many shares will be required to satisfy all claims. Pursuant to the Plan, allowed claims are settled at a ratio of 54.4 shares per $1,000 of claim. At December 31, 2015, we have reserved approximately $1.1 million representing the estimated value of claims remaining to be settled which are deemed probable and estimable at period end. Please read “Item 7. – Management’s Discussion and Analysis of Financial Condition and Results of Operations – Commitments and Contingencies – Bankruptcy Matters”.
9
ENVIRONMENTAL REGULATIONS
General
Our activities are subject to existing federal, state and local laws and regulations governing environmental quality and pollution control. Although no assurances can be made, we believe that, absent the occurrence of an extraordinary event, compliance with existing federal, state and local laws, regulations and rules regulating the release of materials in the environment or otherwise relating to the protection of human health, safety and the environment will not have a material effect upon our capital expenditures, earnings or competitive position with respect to our existing assets and operations. We cannot predict what effect additional regulation or legislation, enforcement policies and claims for damages to property, employees, other persons and the environment resulting from our operations could have on our activities.
Periodically, we receive communications from various federal, state and local governmental authorities asserting violations of environmental laws and/or regulations. These governmental entities may also propose or assess fines or require corrective actions for these asserted violations. We intend to respond in a timely manner to all such communications and to take appropriate corrective action. We do not anticipate that any such matters currently asserted will have a material impact on our financial condition, results of operations or cash flows.
Refining activities
Like other petroleum refiners, our operations are subject to extensive and periodically changing federal and state environmental regulations governing air emissions, wastewater discharges and solid and hazardous waste management activities. Many of these regulations are becoming increasingly stringent and the cost of compliance can be expected to increase over time. Our policy is to accrue environmental and clean-up related costs of a non-capital nature when it is probable that a liability has been incurred and the amount can be reasonably estimated. Such estimates may be subject to revision in the future as regulations and other conditions change.
Natural gas and oil production
Our activities with respect to exploration and production of natural gas and oil, including the drilling of wells and the operation and construction of pipelines, plants and other facilities for extracting, transporting, processing, treating or storing natural gas, crude oil and other petroleum products, are subject to stringent environmental regulation by state and federal authorities, including the U.S. Environmental Protection Agency ("EPA"). Such regulation can increase the costs of planning, designing, installing and operating such facilities. Although we believe that compliance with environmental regulations will not have a material adverse effect on us, risks of substantial costs and liabilities are inherent in natural gas and oil production, transport and storage operations and there can be no assurance that significant costs and liabilities will not be incurred. Moreover it is possible that other developments, such as spills or other unanticipated releases, stricter environmental laws and regulations and claims for damages to property or persons resulting from oil and gas production, transport or storage would result in substantial costs and liabilities to us. In California, our activities are subject to an additional level of state environmental review.
Climate Change and Regulation of Greenhouse Gases
According to certain scientific studies, emissions of carbon dioxide, methane, nitrous oxide and other gases commonly known as greenhouse gases (“GHG”) may be contributing to global warming of the earth’s atmosphere and to global climate change. In response to the scientific studies, legislative and regulatory initiatives have been underway to limit GHG emissions. The U.S. Supreme Court determined that GHG emissions fall within the federal Clean Air Act ("CAA") definition of an “air pollutant” and in response the EPA promulgated an endangerment finding paving the way for regulation of GHG emissions under the CAA. The EPA has now begun regulating GHG under the CAA. New construction or material expansions that meet certain GHG emissions thresholds will likely require that, among other things, a GHG permit be issued in accordance with the Clean Air Act regulations and we will be required in connection with such permitting to undertake a technology review to determine appropriate controls to be implemented with the project in order to reduce GHG emissions. As currently written and based on current company operations, however, our natural gas and oil exploration and production activities and our existing refining activities are not subject to federal GHG permitting requirements.
Furthermore, the EPA is currently developing refinery-specific GHG regulations and performance standards that are expected to impose GHG emission limits and/or technology requirements. These control requirements may affect a wide range of refinery operations. Any such controls could result in material increased compliance costs, additional operating restrictions for our business and an increase in cost of the products we produce, which could have a material adverse effect on our financial position, results of operations and liquidity.
10
The EPA has also promulgated rules requiring large sources to report their GHG emissions. Reports are being made in connection with our refining business. Sources subject to these reporting requirements also include on and offshore petroleum and natural gas production and onshore natural gas processing and distribution facilities that emit 25,000 metric tons or more of carbon dioxide equivalent per year in aggregate emissions from all site sources. To date, our natural gas and oil exploration and production activities are not subject to GHG reporting requirements.
On September 29, 2015, the EPA announced a final rule updating standards that control toxic air emissions from petroleum refineries, addressing, among other things, flaring operations, fenceline air quality monitoring and additional emission reductions from storage tanks and delayed coking units. Affected existing sources will be required to comply with the new requirements no later than 2018, with certain refiners required to comply earlier depending on the relevant provision and refinery construction date. We do not anticipate that compliance with this rule will have a material impact on our financial condition, results of operations or cash flows.
In 2007, the State of Hawaii passed Act 234, which required that GHG emissions be rolled back on a statewide basis to 1990 levels by the year 2020. Although delayed, the Hawaii Department of Health (“DOH”) has issued regulations that would require each major facility to reduce CO2 emissions by 16% by 2020 relative to a calendar year 2010 baseline (the first year in which GHG emissions were reported to the EPA under 40 CFR Part 98). The final version of the state’s GHG rules included an alternative for facilities to demonstrate that further GHG reductions are not economically viable and an additional provision that authorized the DOH to issue a waiver if GHGs are being effectively controlled as a consequence of other state initiatives and regulations such as the Renewable Portfolio Standard. The refinery’s capacity to further reduce fuel use and GHG emissions is limited. Since Hawaii’s GHG emissions have already been reduced below 2010 levels and are projected to be less than the 1990 levels by 2020, we anticipate the refinery will be able to demonstrate that no further reductions are required to meet the statewide goal. Any reductions imposed by the 16% facility-specific mandate would not be cost-effective and therefore should not be required. Additionally, the regulation allows for “partnering” with other facilities (principally power plants) which have already dramatically reduced greenhouse emissions or are on schedule to reduce CO2 emissions in order to comply with the state’s Renewable Portfolio Standards.
Regulation of GHG emissions is new and highly controversial. Further regulatory, legislative and judicial developments are likely to occur. Such developments may affect how these GHG initiatives will impact us. They may also impact the use of and demand for petroleum products, which could impact our business. Further, apart from these developments, tort claims alleging property damage against GHG emissions sources may be asserted. Due to the uncertainties surrounding the regulation of and other risks associated with GHG emissions, we cannot predict the financial impact of related developments on us.
National Ambient Air Quality Standards
Over the past several years the EPA has adopted a number of new and more stringent National Ambient Air Quality Standards ("NAAQS"). Specifically new NOX and SO2 standards were set in 2010 and a new particulate matter standard was set in 2012. States are required to develop State Implementation Plans and ultimately local air districts are required to adopt rules that will (over time) improve the air quality so that it will be “In Attainment” with the existing and new NAAQS. More stringent air pollutant standards and corresponding rules have already impacted and will continue to cause many refineries to invest heavily in additional air pollution controls. Thus far, Hawaii air quality, particularly on Oahu where our refinery is located, has met even the most recent NAAQS and the refinery itself has not been required to install new controls as result of local rules. Even so, NAAQS could and to a degree have already forced some changes for our customer base. Power plants on the Big Island, where SO2 levels are already elevated due to volcanic activity, are switching from LSFO to diesel fuel and on Oahu, the state’s largest utility frequently cites compliance with NAAQS as one of its justifications for moving towards a cleaner bridge fuel, potentially diesel or LNG before reaching its renewable goals. On October 1, 2015, the EPA adopted rules that would substantially tighten the NAAQS for ground-level ozone. This rule will cause many areas of the country to fall out of attainment and for the affected states to require additional controls and limits on combustion emissions and emissions of volatile organic compounds. We do not currently anticipate that the more stringent NAAQS will impact our Hawaii operations.
11
Regulation of Industrial Customer Base through Mercury Air Toxics Standard
Additional federal regulation of Hawaii-based power plants will likely have an impact on our refinery because a portion of its production capacity and product mix has historically been dedicated to supplying the industrial fuel oil for the islands’ public utilities. On February 16, 2012, the EPA published National Emission Standards for Hazardous Air Pollutants ("NESHAPS") for existing fossil-fuel-fired Electrical Utility Steam Generating Units ("EGU’s") (under 40 CFR 63 Subpart UUUUU). The new regulation, known more commonly as the Mercury Air Toxics Standard ("MATS") was originally focused on limiting the amount of mercury and acid gas from the nation’s coal-fired power plants. However, the regulation extends to oil-fired power plants as well. While our refinery can be tuned, operated and modified to respond to a shift in customer fuel specifications and additional demand for distillates, an on-going surplus of residual fuels, (produced by both Hawaii-based refineries) will likely put pressure on margins and necessitate alternative marketing and distribution strategies.
Fuel Standards
In 2007, the U.S. Congress passed the Energy Independence and Security Act (“EISA”) which, among other things, set a target fuel economy standard of 35 miles per gallon for the combined fleet of cars and light trucks in the U.S. by model year 2020 and contained a second Renewable Fuel Standard (the “RFS2”). In August 2012, the EPA and National Highway Traffic Safety Administration jointly adopted regulations that establish an average industry fuel economy of 54.5 miles per gallon by model year 2025. The RFS2 requires an increasing amount of renewable fuel usage, up to 36.0 billion gallons by 2022. In the near term, we, like many other refiners, plan to satisfy the RSF2 requirement primarily by blending denatured ethanol fuel into gasoline. Since the RFS2 is applicable to diesel fuel as well as gasoline and since we did not blend in any biodiesel in 2014, we satisfied our overall RFS obligation through the acquisition of renewable credits referred to as Renewable Identification Numbering System ("RINS"). The RFS2 may present production and logistics challenges for both the renewable fuels and petroleum refining and marketing industries in that we may have to enter into arrangements with other parties or purchase credits from the EPA to meet our obligations to use advanced biofuels, including biomass-based diesel and cellulosic biofuel, with potentially uncertain supplies of these new fuels or in the alternative RINS.
In October 2010, the EPA issued a partial waiver decision under the CAA to allow for an increase in the amount of ethanol permitted to be blended into gasoline from 10% ("E10") to 15% ("E15") for 2007 and newer light duty motor vehicles. There are numerous issues, including state and federal regulatory issues, which need to be addressed before E15 can be marketed on a large scale for use in traditional gasoline engines. Consequently, unless the federal regulations are revised, qualified RINS will be required to fulfill the federal mandate for renewable fuels. We may experience a decrease in demand for refined petroleum products due to an increase in combined fleet mileage or due to refined petroleum products being replaced by renewable fuels.
In March 2014, the EPA published a final Tier 3 gasoline standard that lowers the allowable sulfur level in gasoline to 10 parts per million ("ppm") and also lowers the allowable benzene, aromatics and olefins content of gasoline. The effective date for the new standard, January 1, 2017, gives refiners nationwide little time to engineer, permit and implement substantial modifications; however, approved small volume refineries have until January 1, 2020 to meet the standard. In September 2015, our refinery was granted small volume refinery status by the EPA. Along with credit and trading options, potential capital upgrades for the refinery are being evaluated.
Beginning on June 30, 2014, new sulfur standards for fuel oil used by marine vessels operating within 200 miles of the U.S. coastline (which includes the entire Hawaiian Island chain) was lowered from 10,000 ppm (1%) to 1,000 ppm (0.1%). The sulfur standards began at the refinery and were phased in so that by January 1, 2015, they were to be fully aligned with the International Marine Organization ("IMO") standards and deadline. The more stringent standards apply universally to both U.S. and foreign flagged ships. Although the marine fuel regulations provided vessel operators with a few compliance options such as installation of on-board pollution controls and demonstration unavailability, many vessel operators will be forced to switch to a distillate fuel while operating within the Emission Control Area ("ECA"). Beyond the 200 mile ECA, large ocean vessels are still allowed to burn marine fuel with up to 3.5% sulfur. Our refinery is capable of producing the 1% sulfur residual fuel oil that was previously required within the ECA. Although our refinery remains in a position to supply vessels traveling to and through Hawaii, the market for 0.1% sulfur distillate fuel and 3.5% sulfur residual fuel is much more competitive.
There will be compliance costs and uncertainties regarding how we will comply with the various requirements contained in the EISA and other fuel-related regulations.
Solid and Hazardous Waste
Several of our businesses generate wastes, including hazardous wastes, which are subject to regulation under the federal Resource Conservation and Recovery Act (“RCRA”) and state statutes. The EPA has limited the disposal options for certain hazardous wastes and state regulation of the handling and disposal of refining and natural gas and oil exploration and production wastes and solid wastes is becoming more stringent. Furthermore, it is possible that certain wastes generated by our natural gas
12
and oil operations which are currently exempt from regulation as “hazardous wastes” may in the future be designated as “hazardous wastes” under RCRA or other applicable statutes and therefore be subject to more rigorous and costly disposal requirements.
Naturally Occurring Radioactive Materials (“NORM”) are radioactive materials that accumulate on production equipment or area soils during oil and natural gas extraction or processing. NORM wastes are regulated under the RCRA framework, although such wastes may qualify for the oil and gas hazardous waste exclusion. Primary responsibility for NORM regulation has been a state function. Standards have been developed for worker protection; treatment, storage and disposal of NORM waste; management of waste piles, containers and tanks; and limitations upon the release of NORM-contaminated land for unrestricted use. We believe that our operations are in material compliance with all applicable NORM standards.
Our natural gas and oil properties have been operated by third parties that controlled the treatment of hydrocarbons or other solid wastes and the manner in which such substances may have been disposed or released. State and federal laws applicable to refineries and to natural gas and oil wastes and properties have gradually become stricter over time. Under these laws, we could be required to remove or remediate previously disposed wastes (including wastes disposed or released by prior owners or operators) or property contamination (including groundwater contamination by prior owners or operators) or to perform remedial operations to prevent future contamination.
Superfund
The Comprehensive Environmental Response, Compensation and Liability Act (“CERCLA”), also known as the “Superfund” law, imposes liability, without regard to fault or the legality of the original conduct, on certain persons with respect to the release or threatened release of a “hazardous substance” into the environment. These persons include the current owner and operator of a site, any former owner or operator who operated the site at the time of a release, transporters and persons that disposed or arranged for the disposal of hazardous substances at a site. CERCLA also authorizes the EPA and, in some cases, third parties to take actions in response to threats to the public health or the environment and to seek to recover from the responsible persons the costs of such action. State statutes impose similar liability.
Under CERCLA, the term “hazardous substance” does not include “petroleum, including crude oil or any fraction thereof,” unless specifically listed or designated and the term does not include natural gas, NGLs, liquefied natural gas or synthetic gas usable for fuel. While this “petroleum exclusion” lessens the significance of CERCLA to our exploration and production operations, we may generate wastes that may fall within CERCLA’s definition of a “hazardous substance” in the course of our ordinary refining and natural gas and oil operations. Although we and, to our knowledge, our predecessors have used operating and disposal practices that were standard in the industry at the time, “hazardous substances” may have been disposed or released on, under, or from the properties currently or historically owned or leased by us or on, under, or from other locations where these wastes have been taken for disposal. At this time, we do not believe that we have any liability associated with any Superfund site and we have not been notified of any claim, liability or damages under CERCLA.
Oil Pollution Act
The Oil Pollution Act of 1990 (“OPA”) and regulations thereunder impose a variety of requirements on “responsible parties” related to the prevention of oil spills and liability for damages resulting from such spills in U.S. waters. A “responsible party” includes the owner or operator of a facility or vessel or the lessee or permittee of the area in which an offshore facility is located. The OPA assigns liability to each responsible party for oil removal costs and a variety of public and private damages. While liability limits apply in some circumstances, a party cannot take advantage of liability limits if the spill was caused by gross negligence or willful misconduct or resulted from violation of a federal safety, construction or operating regulation. If the party fails to report a spill or to cooperate fully in the cleanup, liability limits likewise do not apply. Few defenses exist to the liability imposed by the OPA.
The OPA establishes a liability limit for onshore facilities of $350 million and for offshore facilities of all removal costs plus $33.65 million and lesser limits for some vessels depending upon their size. The U.S. Coast Guard has proposed to increase the onshore liability to $404.6 million based on an inflation adjustment. The regulations promulgated under OPA impose proof of financial responsibility requirements that can be satisfied through insurance, guarantee, indemnity, surety bond, letter of credit, qualification as a self-insurer or a combination thereof. The amount of financial responsibility required depends upon a variety of factors including the type of facility or vessel, its size, storage capacity, oil throughput, proximity to sensitive areas, type of oil handled, history of discharges and other factors. Failure to comply with OPA’s requirements or inadequate cooperation during a spill response action may subject a responsible party to civil or criminal enforcement actions. The federal Bureau of Ocean Energy Management (“BOEM”) has proposed to increase the OPA liability limit for offshore facilities. Further, the U.S. Congress has considered legislation that could increase our obligations and potential liability under the OPA, including by eliminating the current cap on liability for damages and increasing minimum levels of financial responsibility. It is uncertain whether and in what form, such legislation may ultimately be adopted. We are not aware of the occurrence of any action or event that would subject us to
13
liability under OPA and we believe that compliance with OPA’s financial responsibility and other operating requirements will not have a material adverse effect on us.
Discharges
The Clean Water Act (“CWA”) regulates the discharge of pollutants to waters of the U.S., including wetlands and requires a permit for the discharge of pollutants, including petroleum, to such waters. Certain facilities that store or otherwise handle oil are required to prepare and implement Spill Prevention, Control and Countermeasure Plans and Facility Response Plans relating to the possible discharge of oil to surface waters. We are required to prepare and comply with such plans and to obtain and comply with discharge permits. We believe we are in substantial compliance with these requirements and that any noncompliance would not have a material adverse effect on us. The CWA also prohibits spills of oil and hazardous substances to waters of the U.S. in excess of levels set by regulations and imposes liability in the event of a spill.
State laws further regulate discharges of pollutants to surface and groundwaters, require permits that set limits on discharges to such waters and provide civil and criminal penalties and liabilities for spills to both surface and groundwaters. Some states have imposed regulatory requirements to respond to concerns related to potential for groundwater impact from oil and gas exploration and production. For example, the Colorado Oil and Gas Conservation Commission (“COGCC”) approved rules that require sampling of groundwater for hydrocarbons and other indicator compounds both before and after drilling. Sampling results are to be reported to the COGCC, which maintains a water quality database online and available to the public.
Hydraulic Fracturing
Our and Laramie Energy's exploration and production activities may involve the use of hydraulic fracturing techniques to stimulate wells and maximize natural gas production. Citing concerns over the potential for hydraulic fracturing to impact drinking water, human health and the environment and in response to a congressional directive, the EPA has commissioned a study to identify potential risks associated with hydraulic fracturing. In June 2015, the EPA released for public comment and peer review, a draft assessment of the potential impacts of hydraulic fracturing on drinking water resources. Additionally, the draft has generated substantial public comment and the EPA’s Science Advisory Board has scheduled public meetings and teleconferences through at least March 2016 to receive comment on the study. The study’s findings are intended to improve scientific understanding to guide the EPA’s regulatory oversight, guidance and, where appropriate, rulemaking related to hydraulic fracturing. Some states and localities now regulate the utilization of hydraulic fracturing and other states and localities are in the process of developing or are considering development of, such rules. In Colorado and some other states, courts are in the process of determining whether local bans or other regulation of oil and gas exploration and production activity are preempted by statewide regulatory programs. A state ballot initiative has also been introduced in Colorado that, if successful, would amend the state constitution to give local governments control over oil and natural gas drilling in their areas. Depending on the results of the EPA study and other developments related to hydraulic fracturing, our and Laramie Energy's drilling activities could be subjected to new or enhanced federal, state and/or local regulatory requirements governing hydraulic fracturing, including requirements that would restrict the areas in which we are able to operate.
Air Emissions
Our refining operations and our and Laramie Energy's exploration and production operations are subject to local, state and federal regulations for the control of emissions from sources of air pollution. Administrative enforcement actions for failure to comply strictly with air regulations or permits may be resolved by payment of monetary fines and correction of any identified deficiencies. Alternatively, regulatory agencies could impose civil and criminal liability for non-compliance. An agency could require us to forego construction or operation of certain air emission sources. We believe that we are in substantial compliance with air pollution control requirements and that, if a particular permit application were denied, we would have enough permitted or permittable capacity to continue our operations without a material adverse effect on any particular producing field.
Our refining business is subject to very significant state and federal air permitting and pollution control requirements, including some that are the subject of ongoing enforcement activities by the EPA as described in more detail below. The EPA continues to review and, in many cases, tighten ambient air quality standards, which standards, along with the advancement of pollution control technologies, result in new regulatory and permit requirements that will impact our refining activities and involve additional costs.
With respect to our and Laramie Energy's exploration and production activities, the EPA has finalized new rules to limit air emissions from many hydraulically fractured natural gas wells. These regulations require use of equipment to capture gases that come from such wells during the drilling process (so-called green completions). Other new requirements, many effective in 2013, involved tighter standards for emissions associated with natural gas production, storage and transport. In August 2015, the EPA proposed rules to address methane emissions of new oil and gas wells and in January 2016, the BLM proposed new rules to
14
limit flaring on public and tribal lands. While these new requirements increased the cost of natural gas production, neither we nor Laramie Energy were affected any differently than other producers of natural gas.
More stringent regulation may be imposed in the future as a result of public concern about the impacts of increased oil and gas drilling activity and the availability of new information. For example, the Colorado Department of Natural Resources and the Colorado Department of Public Health and the Environment have announced plans for a study of emissions tied to oil and gas development in areas along the northern Front Range of the Rocky Mountains. Due to uncertainties regarding the outcome of such studies and potential new regulatory proposals, we are unable to predict the financial impact of such developments on our company going forward.
Coastal Coordination
There are various federal and state programs that regulate the conservation and development of coastal resources. The federal Coastal Zone Management Act (“CZMA”) was passed to preserve and, where possible, restore the natural resources of the coastal zone of the U.S. The CZMA provides for federal grants for state management programs that regulate land use, water use and coastal development.
Environmental Agreement
On September 25, 2013 (the “Closing Date”), Par Petroleum, LLC (formerly known as Hawaii Pacific Energy; a wholly-owned subsidiary of Par created for purposes of acquiring PHR), Tesoro and PHR entered into an Environmental Agreement (“Environmental Agreement”), which allocated responsibility for known and contingent environmental liabilities related to the acquisition of PHR as follows:
Consent Decree
Tesoro is currently negotiating a consent decree with the EPA and the United States Department of Justice ("DOJ") concerning alleged violations of the federal Clean Air Act related to the ownership and operation of multiple facilities owned or formerly owned by Tesoro and its affiliates (“Consent Decree”), including our refinery. It is anticipated that the Consent Decree will be finalized sometime during 2016 and will require certain capital improvements to our refinery to reduce emissions of air pollutants.
We estimate the cost of compliance with the final decree could be $20 million to $30 million. However, Tesoro is responsible under the Environmental Agreement for reimbursing us for all reasonable third-party capital expenditures incurred for the construction, installation and commissioning of such capital projects and for the payment of any fines or penalties imposed on us arising from the Consent Decree to the extent related to acts or omission of Tesoro or us prior to the Closing Date. Tesoro’s obligation to reimburse us for such fines and penalties is not subject to a monetary limitation; however, the obligation relating to fines and penalties terminates on the third anniversary of the Closing Date.
Indemnification
In addition to its obligation to reimburse us for capital expenditures incurred pursuant to the Consent Decree, Tesoro agreed to indemnify us for claims and losses arising out of related breaches of Tesoro’s representations, warranties and covenants in the Environment Agreement, certain defined “corrective actions” relating to pre-existing environmental conditions, third-party claims arising under environmental laws for personal injury or property damage arising out of or relating to releases of hazardous materials that occurred prior to the Closing Date, any fine, penalty or other cost assessed by a governmental authority in connection with violations of environmental laws by us prior to the Closing Date, certain groundwater remediation work, the replacement of underground storage tanks located at certain retail assets, fines or penalties imposed on us by the Consent Decree related to acts or omissions of Tesoro prior to the Closing Date and related to the Pearl City Superfund Site.
Tesoro’s indemnification obligations are subject to certain limitations as set forth in the Environmental Agreement. These limitations include a deductible of $1 million and a cap of $15 million for certain of Tesoro’s indemnification obligations related to certain pre-existing conditions as well as certain restrictions regarding the time limits for submitting notice and supporting documentation for remediation actions.
Other Government Regulation
Sales and Transportation of Natural Gas
Historically, the transportation and sales for resale of natural gas in interstate commerce have been regulated pursuant to the Natural Gas Act of 1938 (“NGA”), the Natural Gas Policy Act of 1978 (“NGPA”) and Federal Energy Regulatory Commission (“FERC”) regulations. Effective January 1, 1993, the Natural Gas Wellhead Decontrol Act deregulated the price for all “first sales”
15
of natural gas. Thus, all of our sales of gas may be made at market prices, subject to applicable contract provisions. Sales of natural gas are affected by the availability, terms and cost of pipeline transportation. Since 1985, the FERC has implemented regulations intended to make natural gas transportation more accessible to gas buyers and sellers on an open-access, non-discriminatory basis. We cannot predict what further action the FERC will take on these matters. Some of the FERC’s more recent proposals may, however, adversely affect the availability and reliability of interruptible transportation service on interstate pipelines. We do not believe that we will be affected by any action taken materially differently than other natural gas producers, gatherers and marketers with which we compete.
The Outer Continental Shelf Lands Act (“OCSLA”), which was administered by the Bureau of Ocean Energy Management, Regulation and Enforcement (“BOEMRE”) and, after October 1, 2011, its successors, the BOEM and the Bureau of Safety and Environmental Enforcement (“BSEE”) and the FERC, requires that all pipelines operating on or across the shelf provide open-access, non-discriminatory service. There are currently no regulations implemented by the FERC under its OCSLA authority on gatherers and other entities outside the reach of its NGA jurisdiction. Therefore, we do not believe that any FERC, BOEM or BSEE action taken under OCSLA will affect us in a way that materially differs from the way it affects other natural gas producers, gatherers and marketers with which we compete.
Natural gas continues to supply a significant portion of North America’s energy needs and we believe the importance of natural gas in meeting this energy need will continue. The impact of the ongoing economic downturn on natural gas supply and demand fundamentals has resulted in extremely volatile natural gas prices, which is expected to continue.
On August 8, 2005, the Energy Policy Act of 2005 (“2005 EPA”) was signed into law. This comprehensive act contains many provisions that will encourage natural gas and oil exploration and development in the U.S. The 2005 EPA directs the FERC, BOEM and other federal agencies to issue regulations that will further the goals set out in the 2005 EPA. The 2005 EPA amends the NGA to make it unlawful for “any entity”, including otherwise non-jurisdictional producers such as us, to use any deceptive or manipulative device or contrivance in connection with the purchase or sale of natural gas or the purchase or sale of transportation services subject to regulation by the FERC, in contravention of rules prescribed by the FERC. On January 20, 2006, the FERC issued rules implementing this provision. The rules make it unlawful in connection with the purchase or sale of natural gas subject to the jurisdiction of the FERC or the purchase or sale of transportation services subject to the jurisdiction of the FERC, for any entity, directly or indirectly, to use or employ any device, scheme or artifice to defraud; to make any untrue statement of material fact or omit to make any such statement necessary to make the statements made not misleading; or to engage in any act or practice that operates as a fraud or deceit upon any person. The new anti-manipulation rule does not apply to activities that relate only to intrastate or other non-jurisdictional sales or gathering, but does apply to activities of otherwise non-jurisdictional entities to the extent the activities are conducted “in connection with” natural gas sales, purchases or transportation subject to FERC jurisdiction. It therefore reflects a significant expansion of the FERC’s enforcement authority. We do not anticipate we will be affected any differently than other producers of natural gas.
In 2007, the FERC issued a final rule on annual natural gas transaction reporting requirements, as amended by subsequent orders on rehearing (“Order 704”). Under Order 704, wholesale buyers and sellers of more than 2.2 million MMBtu of physical natural gas in the previous calendar year, including interstate and intrastate natural gas pipelines, natural gas gatherers, natural gas processors and natural gas marketers are now required to report, on May 1 of each year, beginning in 2009, aggregate volumes of natural gas purchased or sold at wholesale in the prior calendar year to the extent such transactions utilize, contribute to or may contribute to the formation of price indices. It is the responsibility of the reporting entity to determine which individual transactions should be reported based on the guidance of Order 704. The monitoring and reporting required by these rules have increased our administrative costs. We do not anticipate that we will be affected any differently than other producers of natural gas.
Our sales of crude oil, condensate and natural gas liquids are not currently regulated and are subject to applicable contract provisions made at market prices. In a number of instances, however, the ability to transport and sell such products is dependent on pipelines whose rates, terms and conditions of service are subject to the FERC’s jurisdiction under the Interstate Commerce Act. In other instances, the ability to transport and sell such products is dependent on pipelines whose rates, terms and conditions of service are subject to regulation by state regulatory bodies under state statutes.
The regulation of pipelines that transport crude oil, condensate and natural gas liquids is generally more light-handed than the FERC’s regulation of gas pipelines under the NGA. Regulated pipelines that transport crude oil, condensate and natural gas liquids are subject to common carrier obligations that generally ensure non-discriminatory access. With respect to interstate pipeline transportation subject to regulation by the FERC under the Interstate Commerce Act, rates generally must be cost-based, although market-based rates or negotiated settlement rates are permitted in certain circumstances. Pursuant to FERC Order No. 561, pipeline rates are subject to an indexing methodology. Under this indexing methodology, pipeline rates are subject to changes in the Producer Price Index for Finished Goods, minus one percent. A pipeline can seek to increase its rates above index levels provided that the pipeline can establish that there is a substantial divergence between the actual costs experienced by the pipeline and the rate resulting from application of the index. A pipeline can seek to charge market-based rates if it establishes that it lacks
16
significant market power. In addition, a pipeline can establish rates pursuant to settlement if agreed upon by all current shippers. A pipeline can seek to establish initial rates for new services through a cost-of-service proceeding, a market-based rate proceeding or through an agreement between the pipeline and at least one shipper not affiliated with the pipeline.
Federal Leases
We maintain operations located on federal oil and natural gas leases, which are administered by the BOEMRE, BOEM or BSEE, pursuant to the OCSLA. The BOEMRE and its successors, the BOEM and the BSEE, regulate offshore operations, including engineering and construction specifications for production facilities, safety procedures, plugging and abandonment of wells on offshore California and removal of facilities.
On January 19, 2011, the U.S. Department of the Interior announced that it would divide offshore oil and gas responsibilities among three separate agencies, with the reorganization to be completed in 2011. The Department of the Interior first created the Office of Natural Resources Revenue to manage revenue collection on October 1, 2010. Effective October 1, 2011, the remaining functions of BOEMRE were split into two federal bureaus, the BOEM, which handles offshore leasing, resource evaluation, review and administration of oil and gas exploration and development plans, renewable energy development, NEPA analysis and environmental studies and the BSEE, which is responsible for the safety and enforcement functions of offshore oil and gas operations, including the development and enforcement of safety and environmental regulations, permitting of offshore exploration, development and production activities, inspections, offshore regulatory programs, oil spill response and newly formed training and environmental compliance programs. Consequently, after October 1, 2011, we are required to interact with two newly formed federal bureaus to obtain approval of our exploration and development plans and issuance of drilling permits, which may result in added plan approval or drilling permit delays as the functions of the former BOEMRE are fully divested and implemented in the two federal bureaus. At this time, we cannot predict the impact that this reorganization, or future regulations of enforcement actions taken by the new agencies, may have on our operations. Our federal oil and natural gas leases are awarded based on competitive bidding and contain relatively standardized terms. These leases require compliance with detailed BOEMRE regulations and orders that are subject to interpretation and change by the BOEM or BSEE. The BOEMRE has promulgated other regulations governing the plugging and abandonment of wells located offshore and the installation and removal of all production facilities, structures and pipelines and the BOEM or the BSEE may in the future amend these regulations.
To cover the various obligations of lessees on the Outer Continental Shelf (“OCS”), the BOEMRE and its successors generally require that lessees have substantial net worth or post bonds or other acceptable assurances that such obligations will be satisfied. The cost of these bonds or assurances can be substantial and there is no assurance that they can be obtained in all cases. We are currently exempt from supplemental bonding requirements. As many regulations are being reviewed, we may be subject to supplemental bonding requirements in the future. Under some circumstances, the BOEM may require any of our operations on federal leases to be suspended or terminated. Any such suspension or termination could materially and adversely affect our financial condition and results of operations.
The Office of Natural Resources Revenue (“ONRR”) in the U.S. Department of the Interior administers the collection of royalties under the terms of the OCSLA and the oil and natural gas leases issued thereunder. The amount of royalties due is based upon the terms of the oil and natural gas leases as well as the regulations promulgated by the ONRR.
Federal, State or American Indian Leases
In the event we conduct operations on federal, state or American Indian oil and gas leases, such operations must comply with numerous regulatory restrictions, including various nondiscrimination statutes and certain of such operations must be conducted pursuant to certain on-site security regulations and other appropriate permits issued by the Bureau of Land Management (“BLM”), BOEM or other appropriate federal or state agencies.
The Mineral Leasing Act of 1920 (“Mineral Act”) prohibits direct or indirect ownership of any interest in federal onshore oil and gas leases by a foreign citizen of a country that denies “similar or like privileges” to citizens of the U.S. Such restrictions on citizens of a “non-reciprocal” country include ownership or holding or controlling stock in a corporation that holds a federal onshore oil and gas lease. If this restriction is violated, the corporation’s lease can be cancelled in a proceeding instituted by the U.S. Attorney General. Although the regulations of the BLM (which administers the Mineral Act) provide for agency designations of non-reciprocal countries, there are presently no such designations in effect. We own interests in numerous federal onshore oil and gas leases. It is possible that holders of our equity interests may be citizens of foreign countries, which at some time in the future might be determined to be non-reciprocal under the Mineral Act.
17
State Regulations
Most states regulate the production and sale of oil and natural gas, including:
• | requirements for obtaining drilling permits; |
• | the method of developing new fields; |
• | the spacing and operation of wells; |
• | the prevention of waste of oil and natural gas resources; and |
• | the plugging and abandonment of wells. |
The rate of production may be regulated and the maximum daily production allowable from both oil and natural gas wells may be established on a market demand or conservation basis or both.
We may enter into agreements relating to the construction or operation of a pipeline system for the transportation of natural gas. To the extent that such natural gas is produced, transported and consumed wholly within one state, such operations may, in certain instances, be subject to the jurisdiction of such state’s administrative authority charged with the responsibility of regulating intrastate pipelines. In such an event, the rates that we could charge for gas, the transportation of natural gas and oil and the construction and operation of such pipeline would be subject to the rules and regulations governing such matters, if any, of such administrative authority.
For example, in August 2013, the COGCC implemented new setback rules for oil and natural gas wells and production facilities near occupied buildings. The COGCC increased its setback distance to a uniform 500 feet statewide setback from occupied buildings and a uniform 1,000 feet statewide setback from high occupancy building units. The new setback rules also require operators to utilize increased mitigation measures to limit potential drilling impacts to surface owners and the owners of occupied building units. The new rules also require operators to provide advance notice to surface owners within 500 feet of proposed operations, the owners of occupied buildings within 1,000 feet of proposed operations and local governments prior to the filing of an Application for Permit to Drill or Oil and Gas Location Assessment. The new rules include expanded outreach and communication efforts by an operator.
In January 2013, the COGCC also approved two rules that require operators to sample groundwater for hydrocarbons and other indicator compounds both before and after drilling. The new statewide rule requires sampling of up to four water wells within a half mile radius of a new natural gas and oil well before drilling, two samples between six and 12 months after completion and two more samples between five and six years after completion. The revised rule for the Greater Wattenberg Area (“GWA”) requires operators to sample one water well per quarter governmental section before drilling and between six to 12 months after completion.
Legislative Proposals
In the past, Congress has been very active in the area of natural gas regulation. New legislative proposals in Congress and the various state legislatures, if enacted, could significantly affect the natural gas and oil industry. At the present time it is impossible to predict what proposals, if any, might actually be enacted by Congress or the various state legislatures and what effect, if any, such proposals might have on our operations.
Impact of Dodd-Frank Act Derivatives Regulation
The Dodd-Frank Wall Street Reform and Consumer Protection Act (“Dodd-Frank Act”), which was passed by Congress and signed into law in July 2010, contains significant derivatives regulation, including requirements that certain transactions be cleared on exchanges and that collateral (commonly referred to as “margin”) be posted for such transactions. The Dodd-Frank Act provides for a potential exception from these clearing and collateral requirements for commercial end-users and it includes a number of defined terms used in determining how this exception applies to particular derivative transactions and the parties to those transactions. As required by the Dodd-Frank Act, the Commodities Futures and Trading Commission (“CFTC”) has promulgated numerous rules to define these terms. The CFTC’s final rules establishing position limits for certain derivatives transactions were vacated by the United States District Court for the District of Columbia in September 2012. However, in November 2013, the CFTC proposed new rules that would place limits on certain core futures and equivalent swap contracts for or linked to certain physical commodities, subject to exceptions for certain bona fide hedging transactions. As these new positions limit rules are not yet final, the impact of those provisions on us is uncertain at this time.
It is possible that the CFTC, in conjunction with prudential regulators, may mandate that financial counterparties entering into swap transactions with end-users must do so with credit support agreements in place, which could result in negotiated credit thresholds above which an end-user must post collateral. If this should occur, we intend to manage our credit relationships to minimize collateral requirements.
18
The CFTC’s final rules may also have an impact on our hedging counterparties. For example, our bank counterparties may be required to post collateral and assume compliance burdens resulting in additional costs. We expect that much of the increased costs could be passed on to us, thereby decreasing the relative effectiveness of our hedges and our profitability. To the extent we incur increased costs or are required to post collateral in periods of rising commodity prices, there could be a corresponding decrease in amounts available for our capital investment program.
OSHA
We are subject to the requirements of the federal Occupational Safety and Health Act (“OSHA”) and comparable state statutes. The OSHA hazard communication standard, the EPA community right-to-know regulations under Title III of the federal Superfund Amendments and Reauthorization Act and similar state statutes require us to organize and/or disclose information about hazardous materials used or produced in our operations. Certain of this information must be provided to employees, state and local governmental authorities and local citizens.
SIGNIFICANT CUSTOMERS
We sell a variety of refined products to a diverse customer base. The majority of our refined products are primarily sold through short-term contracts or on the spot market. For the year ended December 31, 2015, no single customer accounted for 10% or more of our revenues. No single customer accounted for 10% or more of our total trade accounts receivable as of December 31, 2015.
EMPLOYEES
At December 31, 2015, we employed 744 people, 147 of which are nonexempt employees at the refinery who are represented by the United Steelworkers Union ("USW"). Our previous collective bargaining agreement expired in January 2015. On March 23, 2015, the union ratified a four-year extension of the collective bargaining agreement. On January 13, 2016, a claim against us was brought to the United States National Labor Relations Board ("NLRB") alleging a refusal to bargain collectively and in good faith. Notwithstanding the pending claim before the NLRB, we consider our relations with our represented and non-represented employees to be satisfactory.
CAUTIONARY STATEMENT REGARDING FORWARD-LOOKING STATEMENTS
Certain statements in this Annual Report may constitute “forward-looking” statements as defined in Section 27A of the Securities Act of 1933 (the "Securities Act"), Section 21E of the Securities Exchange Act of 1934 (the “Exchange Act”), the Private Securities Litigation Reform Act of 1995 (“PSLRA”) or in releases made by the SEC, all as may be amended from time to time. Such forward-looking statements involve known and unknown risks, uncertainties and other important factors that could cause our actual results, performance or achievements to differ materially from any future results, performance or achievements expressed or implied by such forward-looking statements. Statements that are not historical fact are forward-looking statements. Forward-looking statements can be identified by, among other things, the use of forward-looking language, such as the words “plan,” “believe,” “expect,” “anticipate,” “intend,” “estimate,” “project,” “may,” “will,” “would,” “could,” “should,” “seeks,” or “scheduled to,” or other similar words or the negative of these terms or other variations of these terms or comparable language or by discussion of strategy or intentions. These cautionary statements are being made pursuant to the Securities Act, the Exchange Act and the PSLRA with the intention of obtaining the benefits of the “safe harbor” provisions of such laws.
The forward-looking statements contained in this Annual Report are largely based on our expectations, which reflect estimates and assumptions made by our management. These estimates and assumptions reflect our best judgment based on currently known market conditions and other factors. Although we believe such estimates and assumptions to be reasonable, they are inherently uncertain and involve a number of risks and uncertainties that are beyond our control. In addition, management’s assumptions about future events may prove to be inaccurate. All readers are cautioned that the forward-looking statements contained in this Annual Report are not guarantees of future performance and we cannot assure any reader that such statements will be realized or that the forward-looking events and circumstances will occur. Actual results may differ materially from those anticipated or implied in the forward-looking statements due to factors described in “Item 1A. — Risk Factors”, “Item 7. — Management's Discussion and Analysis of Financial Condition and Results of Operations,” and elsewhere in this Annual Report. All forward-looking statements speak only as of the date they are made. We do not intend to update or revise any forward-looking statements as a result of new information, future events or otherwise. These cautionary statements qualify all forward-looking statements attributable to us or persons acting on our behalf.
19
Item 1A. RISK FACTORS
Our businesses involve a high degree of risk. You should consider and read carefully all of the risks and uncertainties described below, together with all of the other information contained in this Annual Report. If any of the following risks, or any risk described elsewhere in this Annual Report, actually occurs, our business, prospects, financial condition, results of operations or cash flows could be materially adversely affected. In any such case, the trading price of our common stock could decline. The risks described below are not the only ones facing our company. Additional risks not currently known to us or that we currently deem immaterial may also adversely affect us.
OPERATING RISKS
Our operations are subject to operational hazards that could expose us to potentially significant losses.
Our operations are subject to potential operational hazards and risks inherent in refining operations, in transporting and storing crude oil and refined products and in producing natural gas and oil. Any of these risks, such as fires, explosions, maritime disasters, security breaches, pipeline ruptures and spills, mechanical failure of equipment and severe weather and natural disasters at our or third-party facilities could result in business interruptions or shutdowns and damage to our properties and the properties of others. A serious accident at our facilities could also result in serious injury or death to our employees or contractors and could expose us to significant liability for personal injury claims and reputational risk. Any such event or unplanned shutdown could have a material adverse effect on our business, financial condition and results of operations.
The volatility of crude oil prices and refined product prices and changes in the demand for such products, may have a material adverse effect on our cash flow and results of operations.
Earnings and cash flows from our refining segment depend on a number of factors, including to a large extent the cost of crude oil and other refinery feedstocks which has fluctuated significantly in recent years. While prices for refined products are influenced by the price of crude oil, the constantly changing margin between the price we pay for crude oil and other refinery feedstocks and the prices we receive for refined products (“crack spread”) also fluctuates significantly. These prices we pay and prices we receive depend on numerous factors beyond our control, including the global supply and demand for crude oil, gasoline and other refined products, which are subject to, among other things:
• | changes in the global economy and the level of foreign and domestic production of crude oil and refined products; |
• | availability of crude oil and refined products and the infrastructure to transport crude oil and refined products; |
• | local factors, including market conditions, the level of operations of other refineries in our markets and the volume and price of refined products imported; |
• | threatened or actual terrorist incidents, acts of war and other global political conditions; |
• | government regulations; and |
• | weather conditions, hurricanes or other natural disasters. |
In addition, we purchase our refinery feedstocks before manufacturing and selling the refined products. Price level changes during the period between purchasing feedstocks and selling the manufactured refined products from these feedstocks could have a significant impact on our financial results. We also purchase refined products manufactured by others for sale to our customers. Price level changes during the periods between purchasing and selling these refined products could also have a material adverse effect on our business, financial condition and results of operations.
Our investment in Laramie Energy is also impacted by changing commodity prices. Laramie Energy primarily sells natural gas and natural gas liquids, and adverse changes in those commodity prices would impact the value of our investment in Laramie Energy.
Instability in the global economic and political environment can lead to volatility in the costs and availability of crude oil and prices for refined products, which could adversely impact our results of operations.
Instability in the global economic and political environment can lead to volatility in the costs and availability of crude oil, and in the prices for refined products. This may place downward pressure on our results of operations. This is particularly true of developments in and relating to oil-producing countries, including terrorist activities, military conflicts, embargoes, internal instability or actions or reactions of the U.S. or foreign governments in anticipation of, or in response to, such developments. Any such events may limit or disrupt markets, which could negatively impact our ability to access global crude oil commodity flows or sell our refined products.
20
Many of our refined products could cause serious injury or death if mishandled or misused by us or our purchasers, or if defects occur during manufacturing.
While we produce, store, transport and deliver all of our refined products in a safe manner, many of our refined products are highly flammable or explosive and could cause significant damage to persons or property if mishandled. Defects in our products (such as gasoline or jet fuel) or misuse by us or by end purchasers could lead to fatalities or serious damage to property. We may be held liable for such occurrences which could have a material adverse effect on our business and results of operations.
Our business is impacted by increased risks of spills, discharges or other releases of petroleum or hazardous substances in our refining and logistics operations and in third-party natural gas and oil production operations in which we have a working interest.
The operation of refineries, pipelines, and refined products terminals and the production of natural gas and oil is subject to increased risks of spills, discharges or other inadvertent releases of petroleum or hazardous substances. These events could occur in connection with the operation of our refinery, pipelines or refined products terminals, or in connection with our Texadian business, or third-party drilling and production activities in which we have a working interest or at third party facilities that receive our wastes or by-products for treatment or disposal. If any of these events occur, or is found to have previously occurred, we could be liable for costs and penalties associated with their remediation under federal, state and local environmental laws or common law, and could be liable for property damage to third parties caused by contamination from releases and spills. The penalties and clean-up costs that we may have to pay for releases or the amounts that we may have to pay to third parties for damages to their property, could be significant and have a material adverse effect on our business, results of operations or financial condition.
We operate in and adjacent to environmentally sensitive coastal waters where tanker, pipeline, and refined product transportation and storage operations are closely regulated by federal, state and local agencies and monitored by environmental interest groups. Operations by third-party drilling and production entities in which we have a working interest that are adjacent to navigable waters such as rivers and lakes are similarly subject to stringent regulations. Transportation and storage of crude oil and refined products over and adjacent to regulated waters involves increased risk subjecting us to the provisions of the federal Oil Pollution Act of 1990, as amended (“OPA”), and state laws in Hawaii and Colorado. Among other things, these laws require us and the owners of tankers that we charter to deliver crude oil to our refinery to demonstrate in some situations the capacity to respond to a spill of up to one million barrels of oil from a tanker and up to 600,000 barrels of oil from an above ground storage tank adjacent to water, which we refer to as a “Worst Case Discharge,” to the maximum extent possible.
We and third-party drilling and production entities in which we have a working interest and the owners of tankers we charter have contracted with various spill response service companies in the areas in which we transport and store crude oil and refined products to meet the requirements of the OPA and applicable state and foreign laws. However, there may be accidents involving tankers, pipelines, railcars or above ground storage tanks transporting or storing crude oil or refined products, and response services may not respond to a Worst Case Discharge in a manner that will adequately contain that discharge, or we may be subject to liability in connection with any unauthorized discharge. Additionally, we cannot ensure that all resources of a contracted response service company could be available for our or a chartered tanker owner’s use at any given time. There are many factors that could inhibit the availability of these resources, including, but not limited to, weather conditions, governmental regulations or moratoria or other global events. State or federal rulings could require that these resources could be diverted to respond to other events.
Our operations, including the operation of underground storage tanks, are also subject to the risk of environmental litigation and investigations which could affect our results of operations.
From time to time we have been and presently are, subject to litigation and investigations with respect to environmental and related matters. We may become involved in further litigation or other proceedings, or we may be held responsible in any existing or future litigation or proceedings, the costs of which could be material.
We operate and have in the past operated retail stations with underground storage tanks in Hawaii used primarily for storing and dispensing refined fuels. In addition, some of our retail stations have been owned by third parties whose operation of the stations was not under our control.
Federal and state regulations and legislation govern the storage tanks and compliance with these requirements can be costly. The operation of underground storage tanks poses certain risks, including leaks. Leaks from underground storage tanks, which may occur at one or more of our retail stations, may impact soil or groundwater and could result in fines or civil liability for us.
21
Our insurance coverage may be inadequate to protect us from the liabilities that could arise in our business.
We carry property, casualty, business interruption and other lines of insurance but we do not maintain insurance coverage against all potential losses. Marine vessel charter agreements do not include indemnity provisions for oil spills so we also carry marine charterer’s liability insurance. We could suffer losses for uninsurable or uninsured risks or in amounts in excess of existing insurance coverage. Claims covered by insurance are subject to deductibles, the aggregate amount of which could be material. Insurance policies are also subject to compliance with certain conditions, the failure of which could lead to a denial of coverage as to a particular claim or the voiding of a particular insurance policy. There also can be no assurance that existing insurance coverage can be renewed at commercially reasonable rates or that available coverage will be adequate to cover future claims. The occurrence of an event that is not fully covered by insurance or failure by one or more insurers to honor its coverage commitments for an insured event could have a material adverse effect on our business, financial condition and results of operations.
We are subject to interruptions of supply and increased costs as a result of our reliance on third-party transportation of crude oil and refined products.
Our refinery receives its crude oil via tankers and transports refined products from Oahu to Hawaii, Maui, Molokai and Kauai via barge. In addition to environmental risks, we could experience an interruption of supply or an increased cost to deliver refined products to market if the ability of the pipelines or vessels to transport crude oil or refined products is disrupted because of accidents, governmental regulation or third-party action. A prolonged disruption of the ability of a pipeline or vessels to transport crude oil or refined products could have a material adverse effect on our business, financial condition and results of operations.
We rely upon certain critical information systems for the operation of our business and the failure of any critical information system, including a cyber security breach, may result in harm to our business.
We are heavily dependent on our technology infrastructure and maintain and rely upon certain critical information systems for the effective operation of our business. These information systems include data network and telecommunications, internet access and our websites and various computer hardware equipment and software applications, including those that are critical to the safe operation of our refinery and our pipelines and terminals. These information systems are subject to damage or interruption from a number of potential sources including natural disasters, software viruses or other malware, power failures, cyber attacks and other events. To the extent that these information systems are under our control, we have implemented measures such as virus protection software and intrusion detection systems, to address the outlined risks. However, security measures for information systems cannot be guaranteed to be failsafe. Any compromise of our data security or our inability to use or access these information systems at critical points in time could unfavorably impact the timely and efficient operation of our business and subject us to additional costs and liabilities, which could adversely affect our results of operations. Finally, federal legislation relating to cyber security threats could impose additional requirements on our operations.
Through Laramie Energy, we are subject to all the risks of natural gas and oil exploration and production.
Through our investment in Laramie Energy and to a lesser extent, through our other non-operated properties, we are exposed to all the risks inherent in natural gas and oil exploration and production, including the risks that:
• | we may not be able to replace production with new reserves; |
• | exploration and development drilling may not result in commercially productive reserves; |
• | title to properties in which we or Laramie Energy has an interest may be impaired by title defects; |
• | the marketability of our natural gas products depends mostly on the availability, proximity and capacity of natural gas gathering systems, pipelines and processing facilities, which are owned by third parties; |
• | we have no long-term contracts to sell natural gas or oil; |
• | compliance with environmental and other governmental requirements could result in increased costs of operation or curtailment, delay or cancellation of development and producing operations; |
• | federal and state legislation and regulatory initiatives relating to hydraulic fracturing could result in increased costs and additional operating restrictions or delays; |
• | changes in the demand for natural gas and oil could adversely affect our financial condition and results of operations; |
• | natural gas drilling and production operations require adequate sources of water to facilitate the fracturing process and the disposal of that water when it flows back to the wellbore. If we are unable to obtain adequate water supplies and dispose of the water we use or remove at a reasonable cost and within applicable environmental rules, our ability to produce natural gas commercially and in commercial quantities would be impaired. |
22
We cannot control activities on properties we do not operate and we are unable to ensure the proper operation and profitability of these non-operated properties.
We are a non-operator with respect to our natural gas and oil properties. Consequently, we have limited ability to exercise influence over and control the risks associated with, the operation of these properties. The success and timing of leasehold acquisition, drilling and development activities therefore will depend upon a number of factors outside of our control, including:
• | timing and amount of capital expenditures; |
• | expertise and diligence in adequately performing operations and complying with applicable agreements; |
• | financial resources; |
• | inclusion of other participants in drilling wells; and |
• | use of technology. |
We also own the equivalent of a 6.07% gross working interest in the Point Arguello Unit and related facilities located offshore California (the "Point A Unit"). We do not operate the Point A Unit, but may nevertheless be responsible for certain costs, including costs related to environmental compliance, associated with the Point A Unit due to our ownership interest.
As a result of any of the above, or any other failure of the operator to act in ways that are in our best interest, our results of operations and financial results could be adversely affected.
Our ability to extract value from our investment in Laramie Energy is limited.
Our 32.4% ownership interest in Laramie Energy is a significant asset. However, the ability of Laramie Energy to make distributions to its owners, including us, is currently prohibited by the terms of the Laramie Energy Credit Facility. In addition, Laramie, which currently has a 52.4% ownership interest in Laramie Energy, controls most decisions affecting Laramie Energy’s operations and we only have veto rights over decisions of Laramie Energy in a limited number of areas.
Information concerning our natural gas and oil reserves is uncertain.
There are numerous uncertainties inherent in estimating quantities of proved reserves and cash flows from such reserves, including factors beyond our control. Reserve engineering is a subjective process of estimating underground accumulations of natural gas and crude oil that cannot be measured in an exact manner. The accuracy of an estimate of quantities of natural gas and crude oil reserves, or of cash flows attributable to such reserves, is a function of the available data, assumptions regarding future natural gas and crude oil prices, availability and terms of financing, expenditures for future development and exploitation activities and engineering and geological interpretation and judgment. Reserves and future cash flows may also be subject to material downward or upward revisions based upon production history, development and exploitation activities, natural gas and crude oil prices and regulatory changes. Actual future production, revenue, taxes, development expenditures, operating expenses, quantities of recoverable reserves and value of cash flows from those reserves may vary significantly from our assumptions and estimates. In addition, reserve engineers may make different estimates of reserves and cash flows based on the same data. Further, the difficult financing environment may inhibit our ability to finance development of our reserves in the future.
The estimated quantities of proved reserves and the discounted present value of future net cash flows attributable to those reserves as of December 31, 2015 included herein were prepared by independent reserve engineers in accordance with the rules of the SEC and are not intended to represent the fair market value of such reserves. As required by the SEC, the estimated discounted present value of future net cash flows from proved reserves is generally based on prices and costs on the date of the estimate, while actual future prices and costs may be materially higher or lower. In addition, the 10% discount factor the SEC requires to be used to calculate discounted future net revenues for reporting purposes is not necessarily the most appropriate discount factor based on the cost of capital in effect from time to time and risks associated with our business and the natural gas and oil industry in general.
REGULATORY RISK
Meeting the requirements of evolving environmental, health and safety laws and regulations including those related to climate change could adversely affect our performance.
Consistent with the experience of other U.S. refiners, environmental laws and regulations have raised operating costs and may require significant capital investments at our refinery. We may be required to address conditions that may be discovered in the future and require a response. Also, potentially material expenditures could be required in the future as a result of evolving environmental, health and safety and energy laws, regulations or requirements that may be adopted or imposed in the future. Future developments in federal and state laws and regulations governing environmental, health and safety and energy matters are especially difficult to predict.
23
Prior to our acquisition of PHR, Tesoro was engaged in negotiations with the EPA regarding a Consent Decree related to all of Tesoro’s refining assets, including PHR. While Tesoro has agreed to reimburse us for capital expenditures arising from the Consent Decree, we will continue to be initially liable for capital expenditures and will be responsible for any operational expense increases brought about by the Consent Decree.
Currently, multiple legislative and regulatory measures to address GHG emissions (including carbon dioxide, methane and nitrous oxides) are in various phases of consideration, promulgation or implementation. These include actions to develop national, statewide or regional programs, each of which could require reductions in our GHG emissions. Requiring reductions in our GHG emissions could result in increased costs to (i) operate and maintain our facilities, (ii) install new emission controls at our facilities and/or (iii) administer and manage any GHG emissions programs, including acquiring emission credits or allotments.
Requiring reductions in our GHG emissions and increased use of renewable fuels which can be supplied by producers and marketers in other industries that supply alternative forms of energy and fuels to satisfy the requirements of our industrial, commercial and individual customers could also decrease the demand for our refined products and could have a material adverse impact on our business, financial condition and results of operations.
Renewable fuels mandates may reduce demand for the petroleum fuels we produce, which could have a material adverse effect on our business results of operations and financial condition.
The EPA has issued Renewable Fuel Standard (“RFS”) mandates, requiring refiners such as us to blend renewable fuels into the petroleum fuels they produce and sell in the U.S. We, and other refiners subject to RFS, may meet the RFS requirements by blending the necessary volumes of renewable fuels produced by us or purchased from third parties. To the extent that refiners will not or cannot blend renewable fuels into the products they produce in the quantities required to satisfy their obligations under the RFS program, those refiners must purchase renewable credits, referred to as renewable identification numbers (“RINs”), to maintain compliance. To the extent that we exceed the minimum volumetric requirements for blending of renewable fuels, we generate our own RINs for which we have the option of retaining the RINs for current or future RFS compliance or selling those RINs on the open market.
Under the RFS program, the volume of renewable fuels that obligated parties are required to blend into their finished petroleum fuels increases annually over time until 2022. Our refinery is subject to compliance with the RFS mandates. On November 30, 2015, the EPA issued final volume mandates for the years 2014 through 2016, which are generally lower than the corresponding statutory mandates for those years.
Existing laws, regulations or regulatory initiatives could change and, notwithstanding that the EPA’s proposed volume mandates for 2014 through 2016 are generally lower than the corresponding statutory mandate for those years, the final minimum volumes of renewable fuels that must be blended with refined petroleum fuels could increase in the future. Despite a decline in RINs prices from relatively higher levels observed during mid-2013, we cannot currently predict the future prices of RINs and, thus, the expenses related to acquiring RINs in the future could increase relative to the cost in prior years. Any increase in the final minimum volumes of renewable fuels that must be blended with refined petroleum fuels, and/or any increase in the cost to acquire RINs has the potential to result in significant costs in connection with RINs compliance for 2014 and future years, which costs could be material and may have a material adverse impact on our business, financial condition, and results of operations. Finally, while there is no current regulatory standard that authenticates RINs that may be purchased on the open market from third parties, we believe that the RINs we purchase are from reputable sources, are valid and serve to demonstrate compliance with applicable RFS requirements.
Potential legislative and regulatory actions addressing climate change could increase our costs, reduce our revenue and cash flow from natural gas and oil sales or otherwise alter the way we conduct our business.
The EPA has issued a notice of finding and determination that emissions of carbon dioxide, methane and other greenhouse gases (“GHG”) present an endangerment to human health and the environment. In response, the EPA has adopted regulations under existing provisions of the federal Clean Air Act (the “CAA”) that, among other things, establish Prevention of Significant Deterioration (“PSD”) construction and Title V operating permit program requiring reviews for GHG emissions from certain large stationary sources. Facilities required to obtain PSD permits for their GHG emissions will also be required to meet “best available control technology” standards, which will be established by the states or, in some instances, by the EPA on a case-by-case basis. Moreover, on December 23, 2010, the EPA entered a settlement agreement with environmental groups requiring the agency to propose by December 10, 2011 GHG New Source Performance Standards (“NSPS”) for refineries and to finalize these rules by November 15, 2012. To date, the EPA has not completed those rulemakings, and we do not know when they will be completed. In addition, the EPA has adopted rules requiring the monitoring and reporting of GHG emissions from specified large GHG emission sources in the U.S., including petroleum refineries and certain onshore petroleum and natural gas production activities, on an annual basis. We monitor for GHG emissions at our refinery, and believe we are in substantial compliance with the applicable
24
GHG reporting requirements. Certain of the third-party drilling and production entities in which we hold a working interest also may be subject to reporting of GHG emissions in the U.S. These EPA policies and rulemakings could adversely affect our operations and restrict or delay our ability to obtain air permits for new or modified facilities.
In addition, from time to time, the U.S. Congress has considered, and may in the future consider and adopt “cap and trade” legislation that would establish an economy-wide cap on GHG emissions in the U.S. and would require most sources of GHG emissions to obtain emission “allowances” corresponding to their annual GHG emissions. For those GHG sources that are unable to meet the required limitations, such legislation could impose substantial financial burdens. Any laws or regulations that may be adopted to restrict or reduce GHG emissions would likely require us to incur increased operating costs and could have an adverse effect on demand for our production. The adoption of any legislation or regulations that limits emissions of GHG from our or such drilling and production entities’ facilities, equipment and operations could require us or such entities to incur costs to reduce emissions of GHG associated with our or such entities operations or could adversely affect demand for the refined petroleum products that we produce or the crude oil or natural gas that such drilling and production entities in which we hold a working interest produce. For example, the EPA proposed in the summer of 2015 and is expected to finalize in 2016 new regulations that will set methane emission standards for new and modified oil and gas production and natural gas processing and transmission facilities as part of the Administration’s efforts to reduce methane emissions from the oil and gas sector by up to 45% from 2012 levels by 2025. Such regulations, if adopted, could increase costs of oil and natural gas operators, including Laramie Energy, in whom we have a non-operating working interest. Finally, it should be noted that some scientists have concluded that increasing concentrations of GHG in the earth’s atmosphere may produce climate changes that have significant physical effects, such as increased frequency and severity of storms, floods and other climatic events; if any such effects were to occur, they could have an adverse effect on our operations as well as on third-party drilling and production activities in which we have a non-operating working interest.
The adoption and implementation of new statutory and regulatory requirements for derivative transactions could have an adverse impact on our ability to manage risks associated with our businesses and increase the working capital requirements to conduct these activities.
The Dodd-Frank Act, which was passed by the U.S. Congress and signed into law in July 2010, provides for new statutory and regulatory requirements for derivative transactions, including oil and natural gas derivative transactions. Among other things, the Dodd-Frank Act provides for the creation of position limits for certain derivatives transactions, as well as requiring certain transactions to be cleared on exchanges for which cash collateral will be required. The Dodd-Frank Act requires the CFTC, the SEC and other regulators to promulgate rules and regulations implementing the Dodd-Frank Act. In October 2011, the CFTC approved final rules that established position limits for futures contracts on 28 physical commodities. These initial CFTC position limits rules were vacated by the U.S. District Court for the District of Columbia in September 2012. However, in November 2013, the CFTC proposed new rules that would place limits on positions in certain core futures and equivalent swaps contracts for or linked to certain physical commodities, subject to exceptions for certain bona fide hedging transactions. As these new position limit rules are not yet final, the impact of those provisions on us is uncertain at this time.
It is not possible at this time to predict with certainty the full effect of the Dodd-Frank Act and CFTC rules on us and the timing of such effects. The Dodd-Frank Act may require us to comply with margin requirements and with certain clearing and trade-execution requirements if we do not satisfy certain specific exceptions. Although we expect to qualify for the end-user exception to the clearing, trade execution and margin requirements for swaps entered to hedge our commercial risks, the application of the requirements to other market participants, such as swap dealers, may change the cost and availability of our derivatives. Depending on the rules adopted by the CFTC or similar rules that may be adopted by other regulatory bodies, we might in the future be required to provide cash collateral for our commodities derivative transactions under circumstances in which we do not currently post cash collateral. Posting of such additional cash collateral could impact liquidity and reduce our cash available for capital expenditures. A requirement to post cash collateral could therefore reduce our ability to execute transactions to reduce commodity price uncertainty and thus protect cash flows.
The full impact of the Dodd-Frank Act and related regulatory requirements upon our business will not be known until all of the regulations are implemented. If we reduce our use of derivatives as a result of the Dodd-Frank Act and regulations, our results of operations may become more volatile and our cash flows may be less predictable. In addition, the Dodd-Frank Act was intended, in part, to reduce the volatility of oil and natural gas prices, which some legislators attributed to speculative trading in derivatives and commodity instruments related to oil and natural gas. Our revenues could therefore be adversely affected if a consequence of the Dodd-Frank Act and regulations is to lower commodity prices.
In addition, the European Union and other non‑U.S. jurisdictions are implementing regulations with respect to the derivatives market. To the extent we transact with counterparties in foreign jurisdictions, we may become subject to such regulations. At this time, the impact of such regulations is not clear.
25
BUSINESS RISKS
The location of our refinery and related assets in the Hawaiian Islands creates an exposure to the risks of the local economy in which we operate and other local adverse conditions. The location of our refinery also creates the risk of lower margins should the supply/demand balance change in the Hawaiian Islands requiring that we deliver refined products to customers outside of the region.
Because our refinery is located in Hawaii, we primarily market our refined products in the Hawaiian Islands, which is a relatively limited geographic area. As a result, we are more susceptible to regional economic conditions than the operations of more geographically diversified competitors and any unforeseen events or circumstances that affect our operating area could also materially adversely affect our revenues and our business and operating results. These factors include, among other things, changes in the economy, weather conditions, demographics and population, increased supply of refined products from competitors and reductions in the supply of crude oil.
Should the supply and demand balance shift in Hawaii, resulting in supply on the islands exceeding demand, we may have to deliver refined products to customers off-island. These sales generally result in lower margins to us relative to on-island sales given the higher cost of freight and typically lower price points.
We must make substantial capital expenditures at our refinery and related assets to maintain their reliability and efficiency. If we are unable to complete capital projects at their expected costs or in a timely manner, or if the market conditions assumed in our project economics deteriorate, our financial condition, results of operations or cash flows could be adversely affected.
Our refinery and related assets have been in operation for many years. Equipment, even if properly maintained, may require significant capital expenditures and expenses to keep it operating at optimum efficiency. These costs do not result in increases in unit capacities, but rather are focused on trying to maintain safe, reliable operations.
Delays or cost increases related to the engineering, procurement and construction of new facilities, or improvements and repairs to our existing facilities and equipment, could have a material adverse effect on our business, financial condition, or results of operations. Such delays or cost increases may arise as a result of unpredictable factors in the marketplace, many of which are beyond our control, including:
• | denial or delay in obtaining regulatory approvals and/or permits; |
• | difficulties in executing the capital projects mandated by the consent decree currently being negotiated by Tesoro; |
• | unplanned increases in the cost of equipment, materials or labor; |
• | disruptions in transportation of equipment and materials; |
• | severe adverse weather conditions, natural disasters or other events (such as equipment malfunctions, explosions, fires or spills) affecting our facilities, or those of our vendors and suppliers; |
• | shortages of sufficiently skilled labor, or labor disagreements resulting in unplanned work stoppages; |
• | market-related increases in a project's debt or equity financing costs; and/or |
• | non-performance or force majeure by, or disputes with, our vendors, suppliers, contractors or sub-contractors. |
Any one or more of these occurrences noted above could have a significant impact on our business. If we were unable to make up the delays or to recover the related costs, or if market conditions change, it could materially and adversely affect our financial position, or results of operations or cash flows.
We are particularly vulnerable to disruptions to our refining operations because our refining operations are concentrated in one facility, which is scheduled for a maintenance turnaround during 2016 that will involve significant expenditures.
Because all of our refining operations are concentrated in the Kapolei refinery, a significant disruption at the Kapolei facility could have a material adverse effect on our business, financial condition or results of operations. Our refining segment comprised approximately 91.7% of our revenues for the year ended December 31, 2015.
We expect to perform a significant maintenance turnaround at the Kapolei refinery during 2016, which will involve anticipated expenditures of $30 to $35 million. All or a portion of our refinery's production may be halted or disrupted during the turnaround and the turnaround, if unsuccessful or delayed, could have a material adverse effect on our business, financial condition or results of operations.
In addition, the Kapolei refinery may require additional unscheduled down time for unanticipated maintenance or repairs that are more frequent than our scheduled turnarounds. Refinery operations may also be disrupted by external factors such as a suspension of feedstock deliveries or an interruption of electricity, natural gas, water treatment or other utilities. Other potentially disruptive factors include natural disasters, severe weather conditions, workplace or environmental accidents, interruptions of
26
supply, work stoppages, losses of permits or authorizations or acts of terrorism. Disruptions to our refining operations could reduce our revenues during the period of time that our processing units are not operating.
If we are unable to obtain our crude oil supply without the benefit of our supply and offtake agreements with J. Aron, the capital required to finance our crude oil supply could negatively impact our liquidity.
All of the crude oil delivered at our refinery is subject to our supply and offtake agreements with J. Aron. If we are unable to obtain our crude oil supply outside these agreements, our exposure to crude oil pricing risks may increase as the number of days between when we pay for the crude oil and when the crude oil is delivered to us increases. Such increased exposure could negatively impact our liquidity position due to the increase in working capital used to acquire crude oil inventory for our refinery.
Our arrangement with J. Aron exposes us to J. Aron related credit and performance risk.
We have supply and offtake agreements with J. Aron, pursuant to which J. Aron will intermediate crude oil supplies and refined product inventories at our refinery. J. Aron will own all of the crude oil in our tanks and substantially all of our refined product inventories prior to our sale of the inventories. Upon termination of the supply and offtake agreements, which may be terminated by J. Aron as early as May 31, 2018, we are obligated to repurchase all crude oil and refined product inventories then owned by J. Aron and located at the specified storage facilities at then current market prices. Relying on J. Aron’s ability to honor its supply and offtake obligations exposes us to J. Aron’s credit and business risks. An adverse change in J. Aron’s business, results of operations, liquidity or financial condition could adversely affect its ability to perform its obligations, which could consequently have a material adverse effect on our business, results of operations or liquidity and, as a result, our business and operating results. In addition, we may be required to use substantial capital to repurchase crude oil and refined product inventories from J. Aron upon termination of the agreements, which could have a material adverse effect on our business, results of operations or financial condition.
Our retail business is vulnerable to risks including changes in consumer preferences and economic conditions, competitive environment, supplier concentration and other trends and factors that could harm our business, financial condition and results of operations.
Our retail business is subject to changes in consumer preferences, national, regional and local economic conditions, demographic trends and consumer confidence in the economy. Factors such as traffic patterns, weather conditions, local demographics and the number and locations of competing retail service stations and convenience stores also affect the performance of our retail stores. Adverse changes in any of these trends or factors could reduce our retail customer traffic or sales, or impose limits on our pricing that could adversely affect our business, financial condition and results of operations.
Cyber security risks, or the failure to maintain the integrity of the data we collect, could expose us to data loss, potential litigation liability and harm to our reputation.
Our retail business collects certain customer data, including credit card numbers, for business purposes. We also maintain certain information about our employees that may be personally identifiable. The integrity and protection of our customer, employee and company data is critical to our business and our customers and employees have a high expectation that we will adequately protect their personal information. The regulatory environment, as well as the requirements imposed on us related to information protection, data security and privacy laws are increasingly demanding and continue to evolve. Maintaining compliance with applicable regulations could increase our operating expenses. Furthermore, a penetrated or compromised data system or the intentional, inadvertent or negligent release or disclosure of data could result in theft, loss, fraudulent or unlawful use of customer, employee or company data, which could harm our reputation, disrupt our operations, or result in fines, lawsuits, or other costs.
We cannot be certain that our net operating loss tax carryforwards will continue to be available to offset our tax liability.
As of December 31, 2015, we estimated that we had approximately $1.4 billion of net operating loss tax carryforwards ("NOLs"). In order to utilize the NOLs, we must generate taxable income that can offset such carryforwards. The availability of NOLs to offset taxable income would be substantially reduced or eliminated if we were to undergo an “ownership change” within the meaning of Section 382 of the Internal Revenue Code of 1986, as amended (the “Code”). We will be treated as having had an “ownership change” if there is more than a 50% increase in stock ownership during any three year “testing period” by “5% shareholders.”
In order to help us preserve our NOLs, our certificate of incorporation contains stock transfer restrictions designed to reduce the risk of an ownership change for purposes of Section 382 of the Code. We expect that the restrictions will remain in place for the foreseeable future. We cannot assure you, however, that these restrictions will prevent an ownership change.
The NOLs will expire in various amounts, if not used, between 2027 through 2033. The Internal Revenue Service (“IRS”) has not audited any of our tax returns for any of the years during the carryforward period including those returns for the years in
27
which the losses giving rise to the NOLs were reported. We cannot assure you that we would prevail if the IRS were to challenge the availability of the NOLs. If the IRS were successful in challenging our NOLs, all or some portion of the NOLs would not be available to offset any future consolidated income which would negatively impact our results of operations and cash flows.
Inadequate liquidity could materially and adversely affect our business operations in the future.
If our cash flow and capital resources are insufficient to fund our obligations, we may be forced to reduce our capital expenditures, seek additional equity or debt capital or restructure our indebtedness. We cannot assure you that any of these remedies could, if necessary, be affected on commercially reasonable terms, or at all. Our liquidity is constrained by our need to satisfy our obligations under our credit agreements and our supply and offtake agreements. The availability of capital when the need arises will depend upon a number of factors, some of which are beyond our control. These factors include general economic and financial market conditions, the crack spread, natural gas and crude oil prices, our credit ratings, interest rates, market perceptions of us or the industries in which we operate, our market value and our operating performance. We may be unable to execute our long-term operating strategy if we cannot obtain capital from these or other sources when the need arises.
Our ability to generate cash and repay our indebtedness or fund capital expenditures depends on many factors beyond our control and any failure to do so could harm our business, financial condition and results of operations.
Our ability to fund future capital expenditures and repay our indebtedness when due will depend on our ability to generate sufficient cash flow from operations, borrowings under our credit agreements and distributions from our subsidiaries. To a certain extent, this is subject to general economic, financial, competitive, legislative and regulatory conditions and other factors that are beyond our control, including the crack spread and the prices we receive for our natural gas and crude oil production.
We cannot assure you that our businesses will generate sufficient cash flow from operations, that our subsidiaries can or will make sufficient distributions to us or that future borrowings will be available to us in an amount sufficient to repay our indebtedness or fund our other liquidity needs. If our cash flow and capital resources are insufficient to fund our needs, we may be forced to reduce our planned capital expenditures, sell assets, seek additional equity or debt capital or restructure our debt. We cannot assure you that any of these remedies could, if necessary, be affected on commercially reasonable terms, or at all, which could cause us to default on our obligations and could impair our liquidity.
Covenants in our existing debt agreements limit our ability to undertake certain types of transactions and may limit our ability to extract value from our subsidiaries.
Our existing credit agreements contain certain negative covenants that limit our ability to undertake certain types of transactions, as well as restrictive financial covenants that require us to maintain compliance with specified financial ratios. We may have to modify or curtail some of our operations to maintain compliance with the covenants in these agreements. These covenants may also limit our ability to extract value from our operating subsidiaries. A violation of any of these covenants could result in a default under our credit agreements, which could permit our lenders to accelerate the repayment of any borrowings then outstanding. A default or acceleration under our credit agreements would result in increased capital costs and could adversely affect our ability to operate our business, our results of operations and our financial condition.
Our level of indebtedness could adversely affect our ability to raise additional capital to fund our operations and limit our ability to react to changes in the economy or our industry.
We have and will continue to have, a significant amount of indebtedness. Our obligation to repay our existing indebtedness will limit our ability to use our capital for other purposes. We may also incur additional indebtedness, including secured indebtedness, or issue preferred stock in order to maintain adequate liquidity and develop our businesses to the extent desired. A higher level of indebtedness and/or the issuance of preferred stock would increase the risk that we may default on our obligations. Our ability to meet our indebtedness depends on our future performance. General economic conditions, the crack spread, natural gas and crude oil prices and financial, business and other factors affect our operations and our future performance. Many of these factors are beyond our control. Factors that will affect our ability to raise cash through an offering of securities or a refinancing of our indebtedness include financial market conditions, the value of our assets and our performance at the time we need capital.
We may incur losses and incur additional costs as a result of our forward-contract activities and derivative transactions.
We enter into derivative contracts from time to time primarily to reduce our exposure to fluctuations in interest rates and in the price of crude oil. If the instruments we use to hedge our exposure are not effective, or if our counterparties are unable to satisfy their obligations to us, we may incur losses. The risk of counterparty default is heightened in a poor economic environment. We may also be required to incur additional costs in connection with future regulation of derivative instruments to the extent such regulation is applicable to us. Additionally, our commodity derivative activities and hedges may produce significant period-to-period earnings volatility that is not necessarily reflective of our underlying operational performance.
28
Our variable rate indebtedness subjects us to interest rate risk, which could cause our debt service obligations to increase significantly.
We will be subject to interest rate risk in connection with borrowings under certain of our credit facilities, which bear interest at variable rates. Interest rate changes will not affect the market value of indebtedness incurred under such facilities, but could affect the amount of our interest payments and accordingly, our future earnings and cash flows, assuming other factors are held constant. A significant increase in prevailing interest rates that results in a substantial increase in the interest rates applicable to our indebtedness could substantially increase our interest expense and have a material adverse effect on our financial condition, results of operations and cash flows.
Increases in interest rates could adversely impact our ability to incur indebtedness for acquisitions or other purposes.
We have historically incurred indebtedness to fund our acquisitions and other working capital needs. Interest rates may increase in the future and, as a result, interest rates on future credit facilities and debt offerings could be higher than current levels, causing our financing costs to increase accordingly. A rising interest rate environment could have an adverse impact, as a result of such increased financing costs, on our ability to incur indebtedness for acquisitions or other purposes.
We may be unable to successfully identify, execute or effectively integrate future acquisitions which may negatively affect our results of operations.
We will continue to pursue acquisitions in the future. Although we regularly engage in discussions with and submit proposals to, acquisition candidates, suitable acquisitions may not be available in the future on reasonable terms. If we do identify an appropriate acquisition candidate, we may be unable to successfully negotiate the terms of an acquisition, finance the acquisition or, if the acquisition occurs, effectively integrate the acquired business into our existing businesses. Negotiations of potential acquisitions and the integration of acquired business operations may require a disproportionate amount of management’s attention and our resources. Even if we complete additional acquisitions, continued acquisition financing may not be available or available on reasonable terms, any new businesses may not generate the anticipated level of revenues, the anticipated cost efficiencies or synergies may not be realized and these businesses may not be integrated successfully or operated profitably. Our inability to successfully identify, execute or effectively integrate future acquisitions may negatively affect our results of operations.
We may be unable to compete effectively with larger companies for acquisitions, which could have a material adverse effect on our businesses, results of operations and financial condition.
The industries in which we operate are intensely competitive and we compete with other companies that have greater resources than we have. Our ability to acquire additional businesses or properties in the future will be dependent upon our ability to evaluate and select suitable businesses or properties for acquisition and to consummate transactions in a highly competitive environment. Many of our larger competitors have refining operations and market petroleum and other products and explore for and produce natural gas and crude oil, on a regional, national or worldwide basis. These companies may be able to pay more for acquisition targets, or evaluate or bid for and purchase a greater number of acquisition targets than our resources permit. Our inability to compete effectively with larger companies for acquisitions could have a material adverse effect on our business, results of operations and financial condition.
If our goodwill or intangible assets become impaired we may be required to record a significant charge to earnings.
Under generally accepted accounting principles, we review our intangible assets for impairment when events or changes in circumstances indicate the carrying value may not be recoverable. Goodwill is required to be tested for impairment at least annually. Factors that may be considered when determining if the carrying value of our goodwill or intangible assets may not be recoverable include a significant decline in our expected future cash flows or a sustained, significant decline in our stock price and market capitalization.
As a result of our acquisitions, we have significant goodwill and intangible assets recorded on our balance sheet. In addition, significant negative industry or economic trends, such as those that have occurred as a result of the recent economic downturn, including reduced estimates of future cash flows or disruptions to our business could indicate that goodwill or intangible assets might be impaired. If, in any period our stock price decreases to the point where our market capitalization is less than our book value, this too could indicate a potential impairment and we may be required to record an impairment charge in that period. Our valuation methodology for assessing impairment requires management to make judgments and assumptions based on projections of future operating performance. We operate in highly competitive environments and projections of future operating results and cash flows may vary significantly from actual results. As a result, we may incur substantial impairment charges to earnings in our financial statements should an impairment of our goodwill or intangible assets be determined resulting in an adverse impact on our results of operations.
29
A substantial portion of our refining workforce is unionized and we may face labor disruptions that would interfere with our operations.
As of December 31, 2015, we employed approximately 744 people, with a collective bargaining agreement covering about 147 of those employees. The union ratified a four-year extension of the collective bargaining agreement on March 23, 2015. On January 13, 2016, a claim against us was brought to the United States National Labor Relations Board alleging a refusal to bargain collectively and in good faith. Accordingly, we may not be able to prevent a strike or work stoppage in the future and any such work stoppage could cause disruptions in our business and have a material adverse effect on our business, financial condition, results of operations and cash flows.
Our disclosure controls and procedures may not prevent or detect all acts of fraud.
Our disclosure controls and procedures are designed to reasonably assure that information required to be disclosed by us in reports we file or submit under the Exchange Act is accumulated and communicated to management, recorded, processed, summarized and reported within the time periods specified in the SEC’s rules and forms.
Our management, including our Chief Executive Officer and Chief Financial Officer, believes that any disclosure controls and procedures or internal controls and procedures, no matter how well conceived and operated, can provide only reasonable, not absolute, assurance that the objectives of the control system are met. Further, the design of a control system must reflect the fact that there are resource constraints and the benefits of controls must be considered relative to their costs. Because of the inherent limitations in all control systems, they cannot provide absolute assurance that all control issues and instances of fraud, if any, within our companies have been prevented or detected. These inherent limitations include the realities that judgments in decision-making can be faulty and that breakdowns can occur because of simple error or mistake. Additionally, controls can be circumvented by the individual acts of some persons, by collusion of two or more people, or by an unauthorized override of the controls. The design of any system of controls also is based in part upon certain assumptions about the likelihood of future events and we cannot assure you that any design will succeed in achieving its stated goals under all potential future conditions. Accordingly, because of the inherent limitations in a cost effective control system, misstatements due to error or fraud may occur and not be detected.
Adverse changes in global economic conditions and the demand for transportation fuels may impact our business and financial condition in ways that we currently cannot predict.
The economic recovery from the recent recession continues to be tenuous and the risk of further significant global economic downturn continues. Further prolonged downturns or failure to recover could result in declines in consumer and business confidence and spending as well as increased unemployment and reduced demand for transportation fuels. This continues to adversely affect the business and economic environment in which we operate. These conditions increase the risks associated with the creditworthiness of our suppliers, customers and business partners. The consequences of such adverse effects could include interruptions or delays in our suppliers’ performance of our contracts, reductions and delays in customer purchases, delays in or the inability of customers to obtain financing to purchase our products and bankruptcy of customers. Any of these events may adversely affect our cash flow, profitability and financial condition.
Adverse results of legal proceedings could materially adversely affect us.
We may be subject to a variety of legal proceedings and claims that arise out of the ordinary conduct of our business. Results of legal proceedings cannot be predicted with certainty. Regardless of its merits, litigation may be both lengthy and disruptive to the company’s operations and may cause significant expenditures and diversion of management attention. We may be faced with significant monetary damages or injunctive relief that could materially adversely affect our business operations or materially and adversely affect our financial position and results of operations should we fail to prevail in certain matters.
Competition from integrated national and international oil companies that produce their own supply of feedstocks, from importers of refined products and from high volume retailers and large convenience store retailing operators who may have greater financial resources, could materially affect our business, financial condition and results of operations.
We compete with a number of integrated national and international oil companies who produce crude oil, some of which is used in their refining operations. Unlike these oil companies, we must purchase all of our crude oil from unaffiliated sources. Because these oil companies benefit from increased commodity prices and have greater access to capital and have stronger capital structures, they are able to better withstand poor and volatile market conditions, such as a lower refining margin environment, shortages of crude oil and other feedstocks or extreme price fluctuations.
We also face strong competition in the fuel and convenience store retailing market for the sale of retail gasoline and convenience store merchandise. Our competitors include service stations operated by integrated major oil companies and well-
30
recognized national high volume retailers or regional large chain convenience store operators, often selling gasoline or merchandise at aggressively competitive prices.
Some of these competitors may have access to greater financial resources, which may provide them with a better ability to bear the economic risks inherent in all phases of our industry. Fundamental changes in the supply dynamics of foreign product imports could lead to reduced margins for the refined products we market, which could have an adverse effect on the profitability of our business.
RISKS RELATED TO OUR COMMON STOCK
Because we have no near term plans to pay cash dividends on our common stock, investors must look solely to stock appreciation for a return on their investment in us.
We have never declared or paid any cash dividends on our common stock. We currently intend to retain all available funds and any future earnings for use in the operation and expansion of our business and do not anticipate declaring or paying any cash dividends on our common stock in the near term. Any future determination as to the declaration and payment of cash dividends will be at the discretion of our board of directors and will depend on then-existing conditions, including our financial condition, results of operations, contractual restrictions, capital requirements, business prospects and other factors that our board of directors considers relevant.
If securities or industry analysts do not publish research or reports about our business, if they adversely change their recommendations regarding our common stock or if our operating results do not meet their expectations, our stock price could decline.
The trading market for our common stock is influenced by the research and reports that industry or securities analysts publish about us or our business. If one or more of these analysts cease coverage of our company or fail to publish reports on us regularly, we could lose visibility in the financial markets, which in turn could cause our stock price or trading volume to decline. Moreover, if one or more of the analysts who cover our company downgrades our common stock or if our operating results do not meet their expectations, our stock price could decline.
The price of our common stock historically has been volatile. This volatility may affect the price at which you could sell your common stock.
The market price for our common stock has varied between a high of $28.31 on November 20, 2015 and a low of $15.80 on January 5, 2015 during the year ended December 31, 2015. This volatility may affect the price at which you could sell your common stock. Our stock price is likely to continue to be volatile and subject to significant price and volume fluctuations in response to market and other factors; variations in our quarterly operating results from our expectations or those of securities analysts or investors; downward revisions in securities analysts’ estimates; and announcement by us or our competitors of significant acquisitions, strategic partnerships, joint ventures or capital commitments.
The market for our common stock has been historically illiquid, which may affect your ability to sell your shares.
The volume of trading in our common stock has historically been low. In addition, a substantial amount of our common stock is held by two investors who have restrictions on their ability to sell the stock. The lack of substantial liquidity can adversely affect the price of our stock at a time when you might want to sell your shares. There is no guarantee that an active trading market for our common stock will develop or be maintained on the NYSE MKT, or that the volume of trading will be sufficient to allow for timely trades. Investors may not be able to sell their shares quickly or at the latest market price if trading in our stock is not active or if trading volume is limited. In addition, if trading volume in our common stock is limited, trades of relatively small numbers of shares may have a disproportionate effect on the market price of our common stock.
31
Delaware law, our charter documents and concentrated stock ownership may impede or discourage a takeover, which could reduce the market price of our common stock.
We are a Delaware corporation, and the anti-takeover provisions of Delaware law impose various impediments to the ability of a third party to acquire control of us, even if a change in control would be beneficial to our existing stockholders. For example, the change in ownership limitations contained in Article 11 of our certificate of incorporation could have the effect of discouraging or impeding an unsolicited takeover proposal. In addition, our board of directors or a committee thereof has the power, without stockholder approval, to designate the terms of one or more series of preferred stock and issue shares of preferred stock. The ability of our board of directors or a committee thereof to create and issue a new series of preferred stock and certain provisions of Delaware law and our certificate of incorporation and bylaws could impede a merger, takeover or other business combination involving us or discourage a potential acquirer from making a tender offer for our common stock, which, under certain circumstances, could reduce the market price of our common stock.
Zell Credit Opportunities Master Fund, L.P. (“ZCOF”) and Whitebox Advisors, LLC (“Whitebox”), together with their respective affiliates, each own or have the right to acquire as of February 16, 2016 approximately 32.4% and 23.7%, respectively, of our outstanding common stock. The level of their combined ownership of shares of our common stock could have the effect of discouraging or impeding an unsolicited acquisition proposal.
We may issue preferred stock with terms that could adversely affect the voting power or value of our common stock.
Our certificate of incorporation authorizes us to issue, without the approval of our stockholders, one or more classes or series of preferred stock having such designations, preferences, limitations and relative rights, including preferences over our common stock respecting dividends and distributions, as our board of directors may determine. The terms of one or more classes or series of preferred stock could adversely impact the voting power or value of our common stock. For example, we might grant holders of preferred stock the right to elect some number of our directors in all events or on the happening of specified events or the right to veto specified transactions. Similarly, the repurchase or redemption rights or liquidation preferences we might assign to holders of preferred stock could adversely affect the residual value of the common stock.
We may issue shares of common stock in satisfaction of general unsecured claims from our predecessor’s bankruptcy that would dilute your ownership of our common stock.
In December 2011 and January 2012, Delta Petroleum Corporation and its subsidiaries filed voluntary petitions under Chapter 11 of the U.S. Bankruptcy Code in the U.S. Bankruptcy Court for the District of Delaware, and in March 2012, obtained approval from the bankruptcy court to proceed with a plan of reorganization. Pursuant to this plan, among other things, certain allowed general unsecured claims may be paid with shares of our common stock. As of December 31, 2015, 12 claims totaling approximately $23.1 million remain to be resolved and we have reserved approximately $1.1 million representing the estimated value of claims remaining to be settled which are deemed probable and estimable at period end. The settlement of claims is subject to ongoing litigation and we are unable to predict with certainty how many shares will be required to satisfy all claims. Pursuant to the plan of reorganization, allowed claims are settled at a ratio of 54.4 shares per $1,000 of claim. Any issuances by us of common stock to satisfy claims would have a dilutive impact on the ownership interest of existing common stockholders and could cause the market price of our common stock to decline.
Future sales of our common stock could reduce our stock price and any additional capital raised by us through the sale of equity or convertible securities may dilute your ownership in us.
We are not restricted from issuing additional shares of common stock, including shares issuable pursuant to securities that are convertible into or exchangeable for, or that represent the right to receive, common stock. We have approximately 41.1 million shares of common stock outstanding as of February 26, 2016.
Subject to the satisfaction of vesting conditions and the requirements of Rule 144 of the Securities Act, shares of our common stock registered under our equity incentive plan are available for resale immediately in the public market without restriction. In addition, subject to the change in ownership limitations contained in Article 11 of our certificate of incorporation and the requirements of Rule 144, up to 24,204,391 shares of our common stock registered under our registration statement on Form S-3 filed on June 1, 2015 are available for resale immediately in the public market without restriction, including 345,135 shares of our common stock that are issuable upon the exercise of common stock warrants at a nominal price.
We cannot predict the size of future issuances of our common stock or securities convertible into or exchangeable for, or that represent the right to receive, common stock or the effect, if any, that future issuances and sales of shares of our common stock will have on the market price of our common stock. Sales of substantial amounts of our common stock (including shares
32
issued in connection with an acquisition), or the perception that such sales could occur, may adversely affect prevailing market prices of our common stock.
RISK RELATED TO ACQUISITIONS
Acquisitions may prove to be worth less than we paid because of uncertainties in evaluating potential liabilities.
We expect acquisitions to be instrumental to our future growth. Successful acquisitions require an assessment of a number of factors, including estimates of potential unknown and contingent liabilities. Such assessments are inexact and their accuracy is inherently uncertain. In connection with our assessments, we perform due diligence reviews of acquired companies and their businesses that we believe are generally consistent with industry practices. However, such reviews will not reveal all existing or potential problems. In addition, our reviews may not permit us to become sufficiently familiar with potential environmental problems or other contingent and unknown liabilities that may exist or arise. As a result, there may be unknown and contingent liabilities related to acquired businesses of which we are unaware. We could be liable for unknown obligations relating to acquisitions for which indemnification is not available, which could materially adversely affect our business, results of operations and cash flow.
The representations, warranties and indemnification obligations of Mid Pac in the merger agreement are limited; as a result, the assumptions on which our estimates of future results contemplated by the merger agreement have been based may prove to be incorrect in a number of material ways, resulting in our not realizing the expected benefits of the Mid Pac acquisition
The representations and warranties of Mid Pac contained in the merger agreement are limited. In addition, the agreement provides limited indemnities. As a result, the assumptions on which our estimates of future results of the transactions contemplated by the merger agreement have been based may prove to be incorrect in a number of material ways and we may not have an adequate remedy under the merger agreement. Consequently, we may not realize the expected benefits of the Mid Pac acquisition.
Item 1B. UNRESOLVED STAFF COMMENTS
None.
Item 2. PROPERTIES
Please read “Item 1. — Business” for the location and general character of the properties used in our refining, retail and logistics segments. Our corporate headquarters are located at 800 Gessner Road, Suite 875, Houston, Texas 77024. We believe that these properties and facilities are adequate for our operations and are maintained in a good state of repair.
Natural Gas and Oil Properties
Laramie Energy
All of the assets held by Laramie Energy are located in Garfield, Mesa and Rio Blanco Counties, Colorado. All of the natural gas and crude oil reserves associated with such assets produce primarily from the Mesaverde Formation and to a lesser extent the Mancos Formation and some of the acreage is contiguous. The geology of the Piceance Basin is characterized as highly consistent and predictable over large areas, which generally equates to reliable timing and cost expectations during drilling and completion activities, as well as minimal well-to-well variance in production and reserves when completed with the same methodology. Laramie Energy considers the Mesaverde Formation within Garfield, Mesa and Rio Blanco Counties, Colorado, to be a single field. Laramie and its predecessor company have drilled over 300 natural gas wells with over a 99% success rate in the Piceance Basin.
33
Other
We have a carried 5% working interest in 21 wells and a 3.872% carried working interest in an additional well in the southern region of the Piceance Basin. These wells are operated by Encana Corporation. We also own the equivalent of a 6.07% gross working interest in the Point Arguello Unit and related facilities located offshore California in the Santa Barbara Channel and a 6.25% working interest in the development of the eastern half of OCS Block 451 in the Rocky Point Unit.
Reserves
For a table presenting the estimated natural gas and crude oil reserves we own indirectly through Laramie Energy, please read “Item 1. — Business — Natural Gas and Oil.” The natural gas and crude oil reserves we own directly are not material.
Internal Controls Over Reserve Estimates, Technical Qualifications and Technologies Used
Our policies regarding internal controls over reserve estimates require reserves to be in compliance with the SEC definitions and guidance and for all reserve estimates to be prepared by an independent third-party reserve engineering firm and reviewed by certain members of senior management. As we do not operate our interests in our natural gas and crude oil assets, we do not have an internal reserve engineering staff and do not prepare any internal reserve estimates. Christopher Micklas, our chief financial officer, reviews the independence and professional qualifications of the third party engineering firms we engage. He also supervises the submission of technical and financial data to third party engineering firms and reviews the prepared reports. Mr. Micklas has more than 11 years of experience in senior financial positions in the oil and gas industry. The reserves estimates shown herein have been independently evaluated by Netherland, Sewell & Associates, Inc. (“NSAI”), a worldwide leader of petroleum property analysis for industry and financial organizations and government agencies. NSAI was founded in 1961 and performs consulting petroleum engineering services under Texas Board of Professional Engineers Registration No. F-2699. Within NSAI, the technical persons primarily responsible for preparing the estimates set forth in the NSAI reserves report incorporated herein are Mr. Dan Paul Smith and Mr. John Hattner. Mr. Smith has been practicing consulting petroleum engineering at NSAI since 1980. Mr. Smith is a Licensed Professional Engineer in the State of Texas (License No. 49093) and has over 30 years of practical experience in petroleum engineering and in the estimation and evaluation of reserves. He graduated from Mississippi State University in 1973 with a Bachelor of Science Degree in Petroleum Engineering. Mr. Hattner has been practicing consulting petroleum geology at NSAI since 1991. Mr. Hattner is a Licensed Professional Geoscientist in the State of Texas, Geology (License No. 559) and has over 30 years of practical experience in petroleum geosciences, with over 20 years of experience in the estimation and evaluation of reserves. He graduated from University of Miami, Florida in 1976 with a Bachelor of Science Degree in Geology; from Florida State University in 1980 with a Master of Science Degree in Geological Oceanography; and from Saint Mary’s College of California in 1989 with a Master of Business Administration Degree. Both technical principals meet or exceed the education, training and experience requirements set forth in the Standards Pertaining to the Estimating and Auditing of Oil and Gas Reserves Information promulgated by the Society of Petroleum Engineers; both are proficient in judiciously applying industry standard practices to engineering and geoscience evaluations as well as applying SEC and other industry reserves definitions and guidelines. The professional qualifications of the individuals at NSAI who were responsible for overseeing the preparation of our reserve estimates as of December 31, 2015 has been filed as a part of Exhibit 99.1 to this Annual Report.
A variety of methodologies were used to determine our proved reserve estimates. The principal methodologies employed are decline curve analysis, analog type curve analysis, log analysis and analogy. Some combination of these methods is used to determine reserve estimates in substantially all of our fields.
Production Volumes, Unit Prices and Costs
All of Laramie Energy's properties are located in Garfield, Mesa and Rio Blanco Counties, Colorado. Over 90% of Laramie Energy's total estimated proved reserves are located in the same geological formation, the Mesaverde Formation, which Laramie Energy considers to be a single field.
34
The following table sets forth certain information regarding volumes of production sold and average prices received associated with our share of Laramie Energy's production and sales of natural gas and crude oil for years ended December 31, 2015, 2014 and 2013.
Year Ended December 31, | |||||||||||
Company's share of Laramie Energy: | 2015 | 2014 | 2013 | ||||||||
Production volumes: | |||||||||||
Oil (MBbls) | 20 | 18 | 16 | ||||||||
NGLs (MBbls) | 149 | 125 | 143 | ||||||||
Natural Gas (MMcf) | 4,745 | 4,831 | 4,030 | ||||||||
Total (MMcfe) | 5,759 | 5,689 | 4,985 | ||||||||
Net average daily production: | |||||||||||
Oil (Bbls) | 55 | 49 | 43 | ||||||||
NGLs (Bbls) | 408 | 342 | 391 | ||||||||
Natural Gas (Mcf) | 13,000 | 13,236 | 11,038 | ||||||||
Average sales price: | |||||||||||
Oil (Per Bbl) | $ | 38.46 | $ | 80.98 | $ | 85.91 | |||||
NGLs (Per Bbl) | 11.76 | 34.73 | 30.08 | ||||||||
Natural Gas (per Mcf) | 2.47 | 4.35 | 3.66 | ||||||||
Hedge gain (loss) (per Mcfe) | 0.33 | 0.36 | (0.05 | ) | |||||||
Lease operating costs—(per Mcfe) | 0.56 | 0.48 | 0.60 | ||||||||
The table above excludes production volumes related to our other non-operated natural gas and oil interests of 311 MMcfe, 716 MMcfe, and 667 MMcfe for the years ended December 31, 2015, 2014, and 2013, respectively. Please read Note 22—Supplemental Oil and Gas Disclosures (Unaudited) to our consolidated financial statements for further information on our proved reserves related to other non-operated natural gas and oil interests.
Proved Undeveloped Reserves
All of our proved undeveloped reserves at December 31, 2015 are held through our minority equity ownership in Laramie Energy. We do not control Laramie Energy and therefore cannot predict or control the development of the properties.
As of December 31, 2015, our share of Laramie Energy’s proved undeveloped reserves totaled 82,268 MMcfe, an approximate 58% decrease from proved undeveloped reserves at December 31, 2014. This decrease was primarily due to wells that have become uneconomic as a result of the decrease in the average price of natural gas and natural gas liquids during 2015.
As of December 31, 2015, Laramie Energy had no proved undeveloped reserves that are expected to remain undeveloped for five years or more after initial booking.
The following table provides information regarding changes in our share of Laramie Energy's proved undeveloped reserves for the year ended December 31, 2015.
Gas | Oil | NGLs | Total | ||||||||
(MMcf) | (MBbl) | (MBbl) | (MMcfe) | ||||||||
Proved undeveloped reserves at December 31, 2014 | 162,895 | 533 | 4,850 | 195,193 | |||||||
Revisions of previous estimates | (118,362 | ) | (378 | ) | (3,466 | ) | (141,426 | ) | |||
Extensions and discoveries | 24,455 | 103 | 762 | 29,645 | |||||||
Conversion to proved developed reserves | (934 | ) | (3 | ) | (32 | ) | (1,144 | ) | |||
Proved undeveloped reserves at December 31, 2015 | 68,054 | 255 | 2,114 | 82,268 | |||||||
35
Productive Wells and Acreage
The table below shows, as of December 31, 2015, our share Laramie Energy's gross and net wells and developed acres. Developed acreage consists of acres spaced or assignable to productive wells.
Productive Wells | ||||||||||||||||||
Oil | Gas (1) | Developed Acres | ||||||||||||||||
Location | Gross (2) | Net (3) | Gross (2) | Net (3) | Gross (2) | Net (3) | ||||||||||||
Colorado (4) | — | — | 581 | 188 | 12,961 | 4,200 | ||||||||||||
_____________________________________________
(1) | Some of the wells classified as “gas” wells also produce minor amounts of crude oil. |
(2) | A “gross well” or “gross acre” is a well or acre in which a working interest is held. The number of gross wells or acres is the total number of wells or acres in which a working interest is owned. |
(3) | A “net well” or “net acre” is deemed to exist when the sum of fractional ownership interests in gross wells or acres equals one. The number of net wells or net acres is the sum of the fractional working interests owned in gross wells or gross acres expressed as whole numbers and fractions thereof. |
(4) | Net wells and net developed acres are reflected as if we owned our interest directly. |
As of December 31, 2015, we also held interests in two productive net oil wells, one productive gas well and 167 developed acres related to our other non-operated natural gas and oil interests.
Undeveloped Acreage
At December 31, 2015, we held undeveloped acreage in through our 32.4% equity ownership in Laramie Energy as set forth below:
Undeveloped Acres (1)(2) | ||||||
Location | Gross | Net | ||||
Colorado (3) | 47,971 | 15,545 | ||||
________________________________________________
(1) | Undeveloped acreage is considered to be those lease acres on which wells have not been drilled or completed to a point that would permit the production of commercial quantities of crude oil and gas, regardless of whether such acreage contains proved reserves. |
(2) | There are no material near-term lease expirations for which the carrying value at December 31, 2015 has not already been impaired in consideration of these expirations or capital budgeted to convert acreage to held by production. |
(3)Net undeveloped acres are reflected as if we owned our interest directly.
Drilling Activity
Laramie Energy completed 24 natural gas wells during the year ended December 31, 2015 that were drilled during 2015 and prior. During 2014, Laramie Energy completed 15 natural gas wells that were drilled during 2013 and prior. During 2013, Laramie Energy completed 9 natural gas wells that were drilled during 2012 and prior. The operators of our other natural gas and oil interests in Colorado and New Mexico did not drill any exploratory or development wells during 2015. The operators of our other natural gas and oil interests in Colorado and New Mexico drilled two oil wells during 2014. The operators of our other natural gas and oil interests in Colorado and New Mexico drilled 13 natural gas wells and three oil wells during 2013.
Delivery Commitments
Our natural gas and oil operations had no material delivery commitments as of December 31, 2015.
Item 3. LEGAL PROCEEDINGS
Kawaihae Loading Rack
On October 9, 2014, Mid Pac received a notice from the EPA alleging that Mid Pac had violated the Clean Air Act at its terminal located in Kawaihae, Hawaii by "failing to equip its loading rack with pollution controls" and by "failing to limit emissions from its loading rack," and advising Mid Pac that the matter had been referred to the DOJ. The DOJ has proposed civil penalties of approximately $700 thousand. Subsequently, Mid Pac and the DOJ entered into a tolling agreement to facilitate settlement
36
discussions. Mid Pac disputes the EPA's allegations. On April 1, 2015, we acquired Mid Pac. Mid Pac, the EPA and the DOJ have tentatively agreed to resolve the fines and penalties for $200 thousand, which agreement is subject to final documentation.
Consent Decree
Tesoro is currently negotiating a Consent Decree with the EPA and the DOJ concerning alleged violations of the federal Clean Air Act related to the ownership and operation of multiple facilities owned or formerly owned by Tesoro and its affiliates, including our refinery. It is anticipated that the Consent Decree will be finalized sometime during 2016 and will require certain capital improvements to the refinery to reduce emissions of air pollutants.
We estimate the cost of compliance with the final Consent Decree could be $20 million to $30 million. However, Tesoro is responsible under the Environmental Agreement for reimbursing us for all reasonable third-party capital expenditures incurred for the construction, installation and commissioning of such capital projects and for the payment of any fines or penalties imposed on us arising from the Consent Decree to the extent related to acts or omissions of Tesoro or us prior to the Closing Date. Tesoro’s obligation to reimburse PHR for such fines is not subject to a monetary limitation; however, this obligation terminates on the third anniversary of the Closing Date. For more information, please read “Part I –Item 1. — Business — Environmental Agreement – Consent Decree.”
Other
From time to time, we may be involved in other litigation relating to claims arising out of our operations in the normal course of our business. As of the date of this Annual Report, no legal proceedings are pending against us that we believe individually or collectively could have a materially adverse effect upon our financial condition, results of operations or cash flows. Any litigation pending at the time we emerged from Chapter 11 was transferred to the General Trust for resolution and settlement. For more information, please read “Part I –Item 1. — Business—Bankruptcy and Plan of Reorganization – General Recovery Trust.”
Item 4. MINE SAFETY DISCLOSURES
Not applicable.
37
PART II
Item 5. MARKET FOR REGISTRANT’S COMMON EQUITY, RELATED STOCKHOLDER MATTERS AND ISSUER PURCHASES OF EQUITY SECURITIES
Market Information
On July 22, 2014, our common stock began trading on the NYSE MKT under the symbol “PARR”. Prior to that date, our common stock was traded on the OTCQB Marketplace under the symbol "PARR".
The high and low sale prices for our common stock for the most recent two fiscal years are shown in the table below. The prices per share of our common stock prior to the 1:10 reverse stock split effective for trading purposes on January 29, 2014 have been adjusted to reflect this stock split on a retroactive basis and may not represent actual transactions.
Quarter Ended | High | Low | ||
2015 | ||||
December 31, 2015 | $28.31 | $20.25 | ||
September 30, 2015 | $21.50 | $17.09 | ||
June 30, 2015 | $25.67 | $18.10 | ||
March 31, 2015 | $23.38 | $15.80 | ||
2014 | ||||
December 31, 2014 | $16.85 | $13.26 | ||
September 30, 2014 | $25.00 | $14.00 | ||
June 30, 2014 | $20.00 | $16.00 | ||
March 31, 2014 | $23.90 | $19.95 | ||
As of February 26, 2016, there were 160 common stockholders of record. On February 26, 2016, the closing price of our common stock was $23.62 per share on the NYSE MKT.
Dividends
We have not paid dividends on our common stock and we do not expect to do so in the foreseeable future. Our current debt agreements restrict the payment of dividends. In addition, as long as any obligations remain outstanding under the Term Loan, we are prohibited from paying dividends.
Stock Performance Graph
The following performance graph and related information shall not be deemed “soliciting material” or “filed” with the SEC, nor shall such information be deemed to be incorporated by reference into any future filings under the Securities Act of 1933 or the Securities Exchange Act of 1934, each as amended.
This performance graph and the related textual information are based on historical data and are not indicative of future performance. The following line graph compares the cumulative total return on an investment in our common stock against the cumulative total return of the S&P 500 Composite Index and an index of peer companies (that we selected) for the periods commencing September 1, 2012, the first day of trading of our common stock, through December 31, 2015. The performance graph of our peer group is weighted by market value at the beginning of the period and our peer group consists of the following companies: Alon USA Energy, Inc., Axiall Corporation, Calumet Specialty Products Partners, L.P., Casey's General Stores, Inc., CVR Energy, Inc., Darling Ingredients Inc., Delek US Holdings, Inc., FutureFuel Corp., Green Plains Inc., Macquarie Infrastructure Corporation, Methanex Corporation, Pacific Ethanol, Inc., Renewable Energy Group, Inc., REX American Resources Corporation, SEACOR Holdings Inc., Stepan Company and Westlake Chemical Corporation. We believe our peer group, which is made up of oil and gas refining and marketing companies, retailers, and companies that are generally similar to our operating segments provides for meaningful comparability to our business as a whole.
38
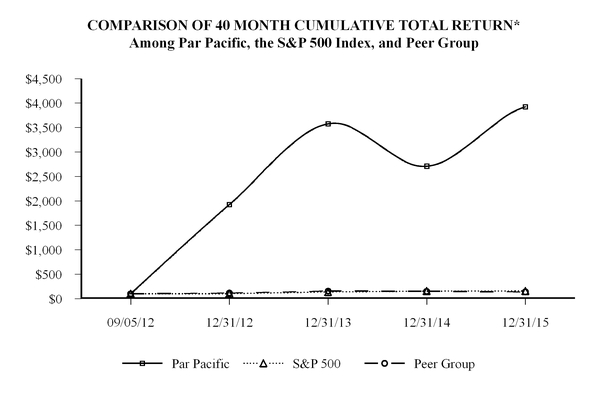
*$100 invested on September 5, 2012 in stock or August 31, 2012 in index, including reinvestment of dividends. Fiscal year ending December 31. |
Recent Sales of Unregistered Securities
During the year ended December 31, 2015, we did not have any sales of securities in transactions that were not registered under the Securities Act that have not been reported in a Form 8-K or Form 10-Q.
Issuer Purchases of Equity Securities
The following table sets forth certain information with respect to repurchases of our common stock during the quarter ended December 31, 2015:
Period | Total number of shares (or units) purchased (1) | Average price paid per share (or unit) | Total number of shares (or units) purchased as part of publicly announced plans or programs | Maximum number (or approximate dollar value) of shares (or units) that may yet be purchased under the plans or programs | |||||||||
October 1 - October 31, 2015 | 442 | $ | 18.07 | — | — | ||||||||
November 1 - November 30, 2015 | 164 | 18.10 | — | — | |||||||||
December 1 - December 31, 2015 | 13,474 | 20.33 | — | — | |||||||||
Total | 14,080 | $ | 20.23 | — | — | ||||||||
________________________________________________
(1) All shares repurchased were surrendered by employees to pay taxes withheld upon the vesting of restricted stock awards.
39
Item 6. SELECTED FINANCIAL DATA
The selected financial information presented below as of December 31, 2015 and 2014 and for the years ended December 31, 2015, 2014 and 2013, was derived from our audited consolidated financial statements included elsewhere in this Annual Report on Form 10-K. The selected financial information presented below as of December 31, 2013, 2012 and 2011 and for the period from September 1 through December 31, 2012, the period from January 1 through August 31, 2012 and the year ended December 31, 2011, was derived from our audited consolidated financial statements not included in this Annual Report on Form 10-K. The selected financial information should be read in conjunction with the consolidated financial statements and related notes and “Item 7. Management’s Discussion and Analysis of Financial Condition and Results of Operations.”
As a result of the application of fresh-start accounting as of September 1, 2012, following our reorganization, the financial statements on or prior to September 1, 2012 are not comparable with the financial statements after September 1, 2012. References to “Successor” refer to the Company after September 1, 2012, after giving effect to the application of fresh-start accounting. References to “Predecessor” refer to the Company on or prior to September 1, 2012.
Successor | Predecessor | ||||||||||||||||||||||||
(in thousands, except per share data) | Year Ended December 31, 2015 (1) | Year Ended December 31, 2014 | Year Ended December 31, 2013 (2) | September 1 through December 31, 2012 | January 1 through August 31, 2012 | Year Ended December 31, 2011 | |||||||||||||||||||
Statement of Operations Data: | |||||||||||||||||||||||||
Operating revenues | $ | 2,066,337 | $ | 3,108,025 | $ | 886,014 | $ | 2,144 | $ | 23,079 | $ | 63,880 | |||||||||||||
Depreciation, depletion and amortization | 19,918 | 14,897 | 5,982 | 401 | 16,041 | 39,088 | |||||||||||||||||||
Impairment expense | 9,639 | — | — | — | 151,347 | 420,402 | |||||||||||||||||||
Trust litigation and settlements | — | — | 6,206 | — | — | — | |||||||||||||||||||
Operating income (loss) | 61,514 | (37,532 | ) | (47,405 | ) | (5,021 | ) | (170,677 | ) | (453,229 | ) | ||||||||||||||
Interest expense and financing costs, net | (20,156 | ) | (17,995 | ) | (13,285 | ) | (1,056 | ) | (6,852 | ) | (32,324 | ) | |||||||||||||
Loss on termination of financing agreements | (19,669 | ) | (1,788 | ) | (6,141 | ) | — | — | — | ||||||||||||||||
Change in value of common stock warrants | (3,664 | ) | 4,433 | (10,159 | ) | (4,280 | ) | — | — | ||||||||||||||||
Change in value of contingent consideration | (18,450 | ) | 2,849 | — | — | — | — | ||||||||||||||||||
Equity earnings (losses) from Laramie Energy, LLC | (55,983 | ) | 2,849 | (2,941 | ) | (1,325 | ) | — | — | ||||||||||||||||
Net loss | (39,911 | ) | (47,041 | ) | (79,173 | ) | (8,839 | ) | (45,437 | ) | (470,111 | ) | |||||||||||||
Loss per common share | (1.06 | ) | (1.44 | ) | (4.01 | ) | (0.56 | ) | (1.57 | ) | (16.30 | ) | |||||||||||||
Balance Sheet Data: | |||||||||||||||||||||||||
Cash and cash equivalents | $ | 167,788 | $ | 89,210 | $ | 38,061 | $ | 6,185 | $ | 1,954 | $ | 12,862 | |||||||||||||
Total current assets | 531,752 | 460,789 | 544,501 | 59,926 | 11,765 | 23,348 | |||||||||||||||||||
Total assets | 892,261 | 735,236 | 801,271 | 189,582 | 210,389 | 387,897 | |||||||||||||||||||
Total current liabilities | 365,040 | 310,806 | 453,388 | 69,977 | 352,859 | 334,165 | |||||||||||||||||||
Total long-term debt (3) | 154,212 | 101,739 | 79,872 | 7,391 | — | 3,507 | |||||||||||||||||||
Total liabilities | 551,650 | 443,077 | 584,949 | 88,825 | 357,273 | 337,672 | |||||||||||||||||||
Total stockholders' equity | 340,611 | 292,159 | 228,264 | 100,757 | (146,884 | ) | 50,225 | ||||||||||||||||||
_________________________________________________________
(1) We completed the acquisition of Mid Pac effective April 1, 2015; therefore the results of Mid Pac are only included subsequent to April 1, 2015. Please read Note 4—Acquisitions to the consolidated financial statements.
(2) We completed the acquisition of PHR effective September 25, 2013; therefore the results of PHR are only included subsequent to September 25, 2013. Please read Note 4—Acquisitions to the consolidated financial statements.
(3) We adopted Accounting Standards Update (“ASU”) 2015-03, Interest – Imputation of Interest: Simplifying the Presentation of Debt Issuance Costs ("ASU 2015-03") during the annual period ended December 31, 2015 and have applied the requirements retrospectively to the year ended December 31, 2014. The adoption of this ASU resulted in the reclassification of $5.8 million of debt issuance costs as of December 31, 2014 from Other long-term assets to Long-term debt, net of current maturities on our consolidated balance sheets.
40
Item 7. MANAGEMENT’S DISCUSSION AND ANALYSIS OF FINANCIAL CONDITION AND RESULTS OF OPERATIONS
Overview
We are a growth-oriented company based in Houston, Texas that manages and maintains interests in energy and infrastructure businesses. We were created through the successful reorganization of Delta Petroleum Corporation ("Delta") in August 2012. The reorganization converted approximately $265 million of unsecured debt to equity and allowed us to preserve significant tax attributes. We changed our name from Par Petroleum Corporation to Par Pacific Holdings, Inc. effective October 20, 2015.
Our business is organized into three primary operating segments:
1) Refining - Our refinery in Kapolei, Hawaii produces ultra-low sulfur diesel, gasoline, jet fuel, marine fuel and other associated refined products primarily for consumption in Hawaii.
2) Retail - Our retail outlets sell gasoline, diesel and retail merchandise throughout the island of Oahu as well as the neighboring islands of Maui, Hawaii and Kauai. Our retail network includes Tesoro and "76" branded retail sites, company-operated convenience stores, sites operated in cooperation with 7-Eleven and other sites operated by third parties.
3) Logistics - We own and operate refined products terminals, pipelines, a single-point mooring and trucking operations to distribute refined products throughout the island of Oahu as well as the neighboring islands of Maui, Hawaii, Molokai and Kauai.
We also own an equity investment in Laramie Energy, a joint venture entity focused on producing natural gas in Garfield, Mesa and Rio Blanco Counties, Colorado. On December 17, 2015, we entered into an equity commitment letter with Laramie Energy, pursuant to which we agreed to purchase certain membership interests of Laramie Energy for an aggregate cash purchase price of $55 million, subject to certain financing commitments by various lenders and additional equity investors, in connection with the closing of a purchase and sale agreement whereby Laramie Energy agreed to acquire certain properties in the Piceance Basin for $157.5 million, subject to customary purchase price adjustments. The transaction closed on March 1, 2016 and, upon the closing of the transaction, Laramie Energy assumed ownership and operatorship of the purchased properties and our ownership interest in Laramie Energy increased from 32.4% to 42.3%.
The refining, retail and logistics segments were established through the acquisition of PHR from Tesoro on September 25, 2013. As a result, our results of operations for any period after September 30, 2013 will not be comparable to any period before September 30, 2013.
During 2015, we changed our reportable segments to separate our retail and logistics operations from our refining operations due to a change in senior leadership, organizational structure, the acquisition of Mid Pac and to reflect how we currently make financial decisions and allocate resources. We have five reportable segments: (i) Refining, (ii) Retail, (iii) Logistics, (iv) Texadian and (v) Corporate and Other. We previously reported results for the following three business segments: (i) Refining, Distribution and Marketing, (ii) Natural Gas and Oil Production and (iii) Commodity Marketing and Logistics. We have recast the segment information for the years ended December 31, 2014 and 2013 to conform to the current period presentation. Please read Note 19—Segment Information to our consolidated financial statements included in this Annual Report on Form 10-K for detailed information on our operating results by segment.
Recent Events
KeyBank Credit Agreement
On December 17, 2015, HIE Retail and Mid Pac entered into a credit agreement with KeyBank in the form of a revolving credit facility with a maximum principal amount of $5 million and term loans in the amount of $110 million. The proceeds of the term loans were used to repay and terminate the existing indebtedness under the HIE Retail and Mid Pac Credit Agreements and to pay transaction fees and expenses and to facilitate a cash distribution to their parent.
41
Registered Direct Offering
On November 25, 2015, we issued an aggregate of 3.4 million shares of our common stock to certain pre-existing investors and other investors in a registered direct offering (the “Offering”) at a purchase price of $22.00 per share. The total gross proceeds from the Offering were approximately $74.8 million, before deducting expenses of approximately $1.0 million, for net proceeds of approximately $73.8 million.
Inventory Financing Agreements
On June 1, 2015, we entered into several agreements with J. Aron & Company ("J. Aron") to support the operations of our refinery (the "Supply and Offtake Agreements"). The Supply and Offtake Agreements have a term of three years with two one-year extension options upon mutual agreement of the parties. The Supply and Offtake Agreements also include a deferred payment arrangement, whereby we can defer payments owed under the agreements up to the lesser of $125 million or 85% of the eligible accounts receivable and inventory.
Upon execution of the Supply and Offtake Agreements, we terminated our Supply and Exchange Agreements with Barclays on June 1, 2015, subject to certain obligations to reimburse Barclays for third-party claims, and the ABL Facility. During the year ended December 31, 2015, we recorded a loss of $19.2 million related to the termination of these financing agreements, which is included in Loss on termination of financing agreements on our consolidated statements of operations. Please read Note 10—Inventory Financing Agreements to our consolidated financial statements for more information.
Mid Pac Acquisition
On April 1, 2015, we completed the acquisition of Mid Pac for cash consideration of $74.4 million. In connection with the acquisition, Mid Pac's pre-existing debt was fully repaid on the closing date for $45.3 million. The acquisition and debt repayment were funded with cash on hand and $55 million of borrowings under the Mid Pac Credit Agreement. The results of operations of Mid Pac are included in our refining, retail and logistics segments effective April 1, 2015. Mid Pac distributes gasoline and diesel through over 80 locations across the State of Hawaii, and owns four terminals. In conjunction with the acquisition, we also obtained the exclusive rights to the "76" brand in Hawaii through 2024. Please read Note 4—Acquisitions to our consolidated financial statements for more information.
Results of Operations
Factors Impacting 2015 Results
During the year ended December 31, 2015, we benefited from favorable market conditions with crack spreads above the five year average which improved our margins and declining crude prices which reduced our operating expenses. We continued the trend of commercial improvements with increased on-island sales mainly resulting from a contract with the military for jet fuel and additional fuel volumes as a result of our acquisition of Par Hawaii.
We also increased our financial flexibility during 2015 with the termination of our supply and exchange agreements with Barclays and entry into supply and offtake agreements with J. Aron. The J. Aron agreement provides us with increased operational and financial flexibility for crude sourcing and managing commodity exposure. Over the course of the year, we became more active in the management of our commodity exposure entering into derivatives to economically hedge our inventory, the impact of price lag on our sales contracts and the cost of the crude we use to run the refinery.
Throughout 2015, we strengthened our balance sheet and simplified our capital structure. In connection with the termination of the Barclays supply and exchange agreements, we terminated the ABL Facility with Deutsche Bank. In the fourth quarter of 2015, we consolidated our Retail credit agreements using a portion of the proceeds to pay off the portion of our Term B loan that was schedule to mature in the first quarter 2016 and completed a stock offering.
42
The following table summarizes our results of operations for the years ended December 31, 2015, 2014 and 2013. The following should be read in conjunction with our consolidated financial statements and notes thereto included elsewhere in this Annual Report.
Year Ended December 31, | |||||||||||
2015 | 2014 | 2013 | |||||||||
Gross Margin | |||||||||||
Refining | $ | 176,933 | $ | 83,850 | $ | (13,632 | ) | ||||
Retail | 68,313 | 44,523 | 9,452 | ||||||||
Logistics (1) | 34,011 | 30,547 | 8,723 | ||||||||
Texadian | (2,308 | ) | 5,649 | 16,666 | |||||||
Corporate and Other | 2,020 | 5,984 | 7,739 | ||||||||
Total gross margin | 278,969 | 170,553 | 28,948 | ||||||||
Operating expense, excluding depreciation, depletion and amortization expense | 141,621 | 146,573 | 32,927 | ||||||||
Depreciation, depletion and amortization | 19,918 | 14,897 | 5,982 | ||||||||
Impairment expense | 9,639 | — | — | ||||||||
(Gain) loss on sale of assets, net | — | 624 | (50 | ) | |||||||
Trust litigation and settlements | — | — | 6,206 | ||||||||
General and administrative expense | 44,271 | 34,304 | 21,494 | ||||||||
Acquisition and integration costs | 2,006 | 11,687 | 9,794 | ||||||||
Total operating expenses | 217,455 | 208,085 | 76,353 | ||||||||
Operating income (loss) | 61,514 | (37,532 | ) | (47,405 | ) | ||||||
Other income (expense) | |||||||||||
Interest expense and financing costs, net | (20,156 | ) | (17,995 | ) | (13,285 | ) | |||||
Loss on termination of financing agreements | (19,669 | ) | (1,788 | ) | (6,141 | ) | |||||
Other income (expense), net | (291 | ) | (312 | ) | 758 | ||||||
Change in value of common stock warrants | (3,664 | ) | 4,433 | (10,159 | ) | ||||||
Change in value of contingent consideration | (18,450 | ) | 2,849 | — | |||||||
Equity earnings (losses) from Laramie Energy, LLC | (55,983 | ) | 2,849 | (2,941 | ) | ||||||
Total other expense, net | (118,213 | ) | (9,964 | ) | (31,768 | ) | |||||
Loss before income taxes | (56,699 | ) | (47,496 | ) | (79,173 | ) | |||||
Income tax benefit | 16,788 | 455 | — | ||||||||
Net loss | $ | (39,911 | ) | $ | (47,041 | ) | $ | (79,173 | ) | ||
________________________________________________________
(1) Our logistics operations consist solely of intercompany transactions which eliminate on a consolidated basis.
43
Below is a summary of key operating statistics for the years ended December 31, 2015, 2014 and 2013:
Year Ended December 31, | |||||||||||
2015 | 2014 | 2013 | |||||||||
Refining segment | |||||||||||
Total Crude Oil Throughput (Mbpd) | 77.3 | 68.2 | 64.2 | ||||||||
Source of Crude Oil: | |||||||||||
North America | 47.7 | % | 48.8 | % | — | % | |||||
Asia | 33.0 | % | 1.3 | % | 35.9 | % | |||||
Africa | 8.3 | % | 3.7 | % | 15.8 | % | |||||
Latin America | 8.0 | % | 23.4 | % | 7.1 | % | |||||
Middle East | 2.1 | % | 22.8 | % | 41.2 | % | |||||
Europe | 0.9 | % | — | % | — | % | |||||
Total | 100.0 | % | 100.0 | % | 100.0 | % | |||||
Yield (% of total throughput) | |||||||||||
Gasoline and gasoline blendstocks | 26.2 | % | 24.5 | % | 26.6 | % | |||||
Distillate | 44.1 | % | 38.9 | % | 49.0 | % | |||||
Fuel oils | 22.0 | % | 30.7 | % | 21.3 | % | |||||
Other products | 4.7 | % | 2.9 | % | 0.2 | % | |||||
Total yield | 97.0 | % | 97.0 | % | 97.1 | % | |||||
Refined product sales volume (Mbpd) | |||||||||||
On-island sales volume | 62.4 | 53.9 | 60.1 | ||||||||
Exports sale volume | 14.4 | 15.2 | 5.9 | ||||||||
Total refined product sales volume | 76.8 | 69.1 | 66.0 | ||||||||
4-1-2-1 Singapore Crack Spread (1) | $ | 6.88 | $ | 6.25 | $ | 5.59 | |||||
4-1-2-1 Mid Pacific Crack Spread (1) | 8.31 | 7.16 | 7.33 | ||||||||
Mid Pacific Crude Oil Differential (2) | (1.50 | ) | (0.99 | ) | (2.04 | ) | |||||
Adjusted refining margin per bbl ($/throughput bbl) (3) | 6.82 | 3.37 | (0.65 | ) | |||||||
Production costs before DD&A expense per barrel ($/throughput bbl) (4) | 3.54 | 4.71 | 3.40 | ||||||||
Net operating margin per bbl ($/throughput bbl) (5) | 3.28 | (1.34 | ) | (4.05 | ) | ||||||
Retail Segment | |||||||||||
Retail sales volumes (thousands of gallons) | 80,649 | 49,484 | 10,274 | ||||||||
Logistics Segment | |||||||||||
Pipeline throughput (Mbpd) | |||||||||||
Crude oil pipelines | 77.7 | 68.2 | 63.9 | ||||||||
Refined product pipelines | 68.9 | 61.5 | 58.1 | ||||||||
Total pipeline throughput | 146.6 | 129.7 | 122.0 | ||||||||
_______________________________________________________
(1) | The profitability of our Hawaii business is heavily influenced by crack spreads in both the Singapore and U.S. West Coast markets. These markets reflect the closest, liquid market alternatives to source refined products for Hawaii. We believe the Singapore 4-1-2-1 and Mid Pacific crack spreads (or four barrels of Brent crude converted into one barrel of gasoline, two barrels of distillate (diesel and jet fuel) and one barrel of fuel oil) best reflect a market |
44
indicator for our operations. The Mid Pacific crack spread is calculated using a ratio of 80% Singapore and 20% San Francisco indexes.
(2) | Weighted average differentials, excluding shipping costs, of a blend of crudes with an API of 31.98 and sulfur weight percentage of 0.65% that is indicative of our typical crude oil mix quality compared to Brent crude. |
(3) | Management uses adjusted refining margin per barrel to evaluate performance and compare profitability to other companies in the industry. There are a variety of ways to calculate adjusted refining margin per barrel; different companies within the industry may calculate it in different ways. We calculate adjusted refining margin per barrel by dividing adjusted refining margin (revenues less feedstocks, purchased refined products, refinery fuel burn, transportation and distribution costs excluding lower of cost or net realizable value adjustments, unrealized gains (losses) on derivatives and our inventory valuation adjustment) by total refining throughput. |
(4) | Management uses production costs before depreciation, depletion and amortization ("DD&A") expense per barrel to evaluate performance and compare efficiency to other companies in the industry. There are a variety of ways to calculate production cost before DD&A expense per barrel; different companies within the industry calculate it in different ways. We calculate production costs before DD&A expense per barrel by dividing all direct production costs by total refining throughput. |
(5) | Calculated as adjusted refining margin less production costs before DD&A expense. |
Non-GAAP Performance Measures
Management uses certain financial measures to evaluate our operating performance that are considered non-GAAP financial measures. These measures should not be considered a substitute for, or superior to, measures of financial performance prepared in accordance with GAAP and our calculations thereof may not be comparable to similarly entitled measures reported by other companies.
Gross Margin
Gross margin is defined as revenues less cost of revenues. We believe gross margin is an important measure of operating performance and provides useful information to investors because it eliminates the gross impact of volatile commodity prices and demonstrates the earnings potential of the business before other fixed and variable costs. In order to assess our operating performance, we compare our gross margin to industry gross margin benchmarks.
Gross margin should not be considered an alternative to operating (loss) income, net cash flows from operating activities or any other measure of financial performance or liquidity presented in accordance with GAAP. Gross margin presented by other companies may not be comparable to our presentation since each company may define this term differently. The following tables present a reconciliation of gross margin to the most directly comparable GAAP financial measure, operating (loss) income, on a historical basis for the periods indicated (in thousands):
45
Year Ended December 31, | |||||||||||
2015 | 2014 | 2013 | |||||||||
Gross Margin | |||||||||||
Refining | $ | 176,933 | $ | 83,850 | $ | (13,632 | ) | ||||
Retail | 68,313 | 44,523 | 9,452 | ||||||||
Logistics (1) | 34,011 | 30,547 | 8,723 | ||||||||
Texadian | (2,308 | ) | 5,649 | 16,666 | |||||||
Corporate and Other | 2,020 | 5,984 | 7,739 | ||||||||
Total gross margin | 278,969 | 170,553 | 28,948 | ||||||||
Operating expense, excluding depreciation, depletion and amortization expense | 136,338 | 140,900 | 27,251 | ||||||||
Lease operating expense | 5,283 | 5,673 | 5,676 | ||||||||
Depreciation, depletion and amortization | 19,918 | 14,897 | 5,982 | ||||||||
Impairment expense | 9,639 | — | — | ||||||||
(Gain) loss on sale of assets, net | — | 624 | (50 | ) | |||||||
Trust litigation and settlements | — | — | 6,206 | ||||||||
General and administrative expense | 44,271 | 34,304 | 21,494 | ||||||||
Acquisition and integration costs | 2,006 | 11,687 | 9,794 | ||||||||
Total operating expenses | 217,455 | 208,085 | 76,353 | ||||||||
Operating income (loss) | $ | 61,514 | $ | (37,532 | ) | $ | (47,405 | ) | |||
________________________________________________________
(1) Our logistics operations consist solely of intercompany transactions which eliminate on a consolidated basis.
Adjusted Refining Margin
Adjusted Refining Margin is used to calculate our adjusted refining margin per barrel, which we use to evaluate the economic performance of our refining business. We calculate adjusted refining margin as gross refining margin excluding (i) lower of cost or market adjustments on inventory owned by the refining segment, (ii) unrealized gains and losses on commodity derivatives held by the refining segment and (iii) the inventory valuation adjustment which adjusts for timing differences to reflect the economics of our inventory financing agreements.
Gross refining margin is reconciled to the most directly comparable GAAP financial measure, operating income (loss) above. The following table presents a reconciliation of Adjusted Refining Margin to gross refining margin on a historical basis for the periods indicated (in thousands).
Year Ended December 31, | |||||||||||
2015 | 2014 | 2013 | |||||||||
Adjusted Refining Margin | $ | 192,395 | $ | 83,850 | $ | (13,632 | ) | ||||
Lower of cost or net realizable value adjustment | (20,137 | ) | — | — | |||||||
Unrealized (gain) loss on derivatives | (10,284 | ) | — | — | |||||||
Inventory valuation adjustment | 14,959 | — | — | ||||||||
Refining margin | $ | 176,933 | $ | 83,850 | $ | (13,632 | ) | ||||
Adjusted Net Income (Loss) and Adjusted EBITDA
Adjusted Net Income (Loss) is defined as net income (loss) excluding changes in the value of contingent consideration and common stock warrants, acquisition and integration expenses, lower of cost or net realizable value adjustments, inventory valuation adjustment which adjusts for timing differences to reflect the economics of our inventory financing agreements, unrealized (gains) losses on derivatives, impairment expense, loss on termination of financing agreements, release of valuation allowance due to Mid Pac acquisition and gains (losses) on sales of assets. Adjusted EBITDA is Adjusted Net Income excluding interest,
46
taxes, depreciation, depletion and amortization and equity (earnings) losses from Laramie Energy. We believe Adjusted Net Income (Loss) and Adjusted EBITDA are useful supplemental financial measures to assess:
• | The financial performance of our assets without regard to financing methods, capital structure or historical cost basis; |
• | The ability of our assets to generate cash to pay interest on our indebtedness; and |
• | Our operating performance and return on invested capital as compared to other companies without regard to financing methods and capital structure. |
Adjusted Net Income (Loss) and Adjusted EBITDA should not be considered in isolation or as a substitute for operating income (loss), net income (loss), cash flows provided by operating, investing and financing activities or other income or cash flow statement data prepared in accordance with GAAP.
The following table presents a reconciliation of Adjusted Net Income (Loss) and Adjusted EBITDA to the most directly comparable GAAP financial measure, net income (loss), on a historical basis for the periods indicated (in thousands):
Year Ended December 31, | |||||||||||
2015 | 2014 | 2013 | |||||||||
Adjusted EBITDA | $ | 110,371 | $ | (9,207 | ) | $ | (30,921 | ) | |||
Income tax benefit | 29 | 455 | — | ||||||||
Equity earnings (losses) from Laramie Energy, LLC | (55,983 | ) | 2,849 | (2,941 | ) | ||||||
Interest expense and financing costs, net | (20,156 | ) | (17,995 | ) | (13,285 | ) | |||||
Depreciation, depletion and amortization | (19,918 | ) | (14,897 | ) | (5,982 | ) | |||||
Adjusted net income (loss) | 14,343 | (38,795 | ) | (53,129 | ) | ||||||
Impairment expense | (9,639 | ) | — | — | |||||||
Change in value of contingent consideration | (18,450 | ) | 2,849 | — | |||||||
Change in value of common stock warrants | (3,664 | ) | 4,433 | (10,159 | ) | ||||||
Loss on termination of financing agreements | (19,669 | ) | (1,788 | ) | (6,141 | ) | |||||
Release of valuation allowance due to Mid Pac Acquisition | 16,759 | — | — | ||||||||
Acquisition and integration expense | (2,006 | ) | (11,687 | ) | (9,794 | ) | |||||
Lower of cost or net realizable value adjustment | (21,648 | ) | (2,444 | ) | — | ||||||
Unrealized (gain) loss on derivatives | (10,896 | ) | 1,015 | — | |||||||
Inventory valuation adjustment | 14,959 | — | — | ||||||||
(Gain) loss on sale of assets, net | — | (624 | ) | 50 | |||||||
Net loss | $ | (39,911 | ) | $ | (47,041 | ) | $ | (79,173 | ) | ||
Year Ended December 31, 2015 Compared to Year Ended December 31, 2014
Refining Gross Margin. For the year ended December 31, 2015, our refining gross margin was approximately $176.9 million, an increase of $93.0 million compared to $83.9 million for the year ended December 31, 2014. The increase is primarily due to an increase in refined product sales volumes of approximately 11%, lower production costs due to lower crude oil prices and improved crack spreads. In addition, our product mix for 2015 had a higher percentage of sales of higher margin products, particularly distillate and gasoline, compared to 2014.
Retail Gross Margin. For the year ended December 31, 2015, our retail gross margin was approximately $68.3 million, an increase of $23.8 million compared to $44.5 million for the year ended December 31, 2014. The increase is primarily due to the acquisition of Mid Pac on April 1, 2015 which contributed to higher sales volumes.
Logistics Gross Margin. For the year ended December 31, 2015, our logistics gross margin was approximately $34.0 million, an increase of $3.5 million when compared to $30.5 million for the year ended December 31, 2014. The increase is primarily due to an increase in crude oil throughput and on-island sales volumes of approximately 14% and 16% in 2015 as compared to 2014, respectively.
Texadian Gross Margin. For the year ended December 31, 2015, our Texadian gross margin was a loss of $2.3 million, a decrease of $7.9 million when compared to $5.6 million for the year ended December 31, 2014. The decrease is primarily due
47
to lower rail car revenues and lower margins available for moving crude oil from Canada to the U.S. Gulf Coast due to market conditions.
Corporate and Other Gross Margin. For the year ended December 31, 2015, our corporate and other gross margin was approximately $2.0 million, a decrease of $4.0 million when compared to $6.0 million for the year ended December 31, 2014. Corporate and other gross margin includes several small non-operated oil and gas interests that were owned by our predecessor. The decrease is primarily related to shutting in operations at the Point Arguello Unit in offshore California during the third quarter of 2015.
Operating Expense. For the year ended December 31, 2015, operating expense was approximately $141.6 million, a decrease of $5.0 million compared to $146.6 million for the year ended December 31, 2014. The decrease is primarily due to lower energy costs resulting from lower crude oil prices, which were partially offset by incremental operating expenses of $16.0 million as a result of the Mid Pac acquisition. Additionally, in 2015, we terminated our post-retirement medical plan and recognized a gain of $5.1 million which is included as a reduction of operating expense on our consolidated statement of operations.
Depreciation, Depletion and Amortization. For the year ended December 31, 2015, DD&A expense was approximately $19.9 million, an increase of $5.0 million compared to $14.9 million for the year ended December 31, 2014. The increase is primarily due to $4.3 million of depreciation, depletion and amortization on assets acquired as part of the Mid Pac acquisition on April 1, 2015, partially offset by lower depletion expense for Point Arguello and lower amortization of intangible assets due to certain assets being fully amortized as of December 31, 2014.
Impairment expense. For the year ended December 31, 2015, we recognized impairment charges of $7.0 million and $2.6 million related to goodwill and intangible assets in our Texadian segment, respectively. There was no impairment expense during the year ended December 31, 2014.
(Gain) Loss on Sale of Assets, Net. For the year ended December 31, 2014, loss on sale of assets, net was approximately $624 thousand. The prior period loss is the result of selling oilfield equipment.
General and Administrative Expense. For the year ended December 31, 2015, general and administrative expense was approximately $44.3 million, an increase of $10.0 million when compared to $34.3 million for the year ended December 31, 2014. The increase is primarily due to an increase in compensation and consulting costs. The increase in compensation costs is due to building our back office support as we exited the transition services agreement with Tesoro. Previously, the costs incurred under the transition services agreement were included in Acquisition and integration expense. In 2014, our consulting costs primarily related to acquisition and integration activities; however, in 2015, our consulting costs are included in general and administrative expense as they primarily relate to system modifications and process improvements related to the Supply and Offtake Agreements.
Acquisition and Integration Costs. For the year ended December 31, 2015, acquisition and integration costs were approximately $2.0 million, a decrease of $9.7 million when compared to $11.7 million for the year ended December 31, 2014. The decrease is primarily due to no costs related to the integration of PHR in the year ended December 31, 2015 partially offset by costs incurred for the Mid Pac acquisition and integration.
Interest Expense and Financing Costs, Net. For the year ended December 31, 2015, our interest expense and financing costs were approximately $20.2 million, compared to $18.0 million for the year ended December 31, 2014. The increase was primarily due to a higher outstanding debt balance during the period as a result of the Mid Pac acquisition on April 1, 2015.
Loss on Termination of Financing Agreements. For the year ended December 31, 2015, our loss on the termination of financing agreements was approximately $19.7 million, which primarily consists of a loss of $17.4 million on the termination of the Barclays Supply and Exchange Agreement and a loss of $1.8 million on the termination of the ABL Facility. The loss of $17.4 million on the termination of the Supply and Exchange Agreement consists of a loss of $13.3 million for the cash settlement value of the liability and recognition of $5.6 million of deferred financing costs, partially offset by a $1.5 million exit fee received from Barclays. The loss on the termination of the ABL Facility consists of the recognition of deferred financing costs. For the year ended December 31, 2014, our loss on the termination of financing agreements was approximately $1.8 million as a result of our termination of our bridge loan agreement entered into in 2014. Please read Note 11—Debt to our consolidated financial statements.
Change in Value of Common Stock Warrants. For the year ended December 31, 2015, the change in value of common stock warrants resulted in a loss of approximately $3.7 million, a change of $8.1 million when compared to a gain of $4.4 million for the year ended December 31, 2014. For the year ended December 31, 2015, our stock price increased from $16.25 per share as of December 31, 2014 to $23.54 per share as of December 31, 2015 which resulted in an increase in the fair value of the common stock warrants. During the year ended December 31, 2014, our stock price decreased from $22.30 per share on December 31, 2013
48
to $16.25 per share on December 31, 2014 which resulted in a decrease in the value of the common stock warrants. Additionally, the number of warrants outstanding has decreased over the two year period due to certain warrant holders exercising their warrants.
Change in Value of Contingent Consideration. For the year ended December 31, 2015, the change in value of our contingent consideration liability resulted in a loss of approximately $18.5 million, a change of $21.3 million when compared to a gain of $2.8 million for the year ended December 31, 2014. The contingent consideration relates to the acquisition of PHR which occurred on September 25, 2013 and the change in value during the year ended December 31, 2015 is due to an increase in our actual and expected cash flows related to PHR during the contingency period based on our actual results.
Equity Earnings (Losses) From Laramie Energy. For the year ended December 31, 2015, losses from Laramie Energy were approximately $56.0 million, a change of $58.8 million compared to earnings of $2.8 million for the year ended December 31, 2014. The decrease is due to losses recognized by Laramie Energy for the year ended December 31, 2015 due lower sales prices for natural gas and condensate and an impairment of $41.1 million on our equity investment in Laramie Energy in 2015. Please read Note 3—Investment in Laramie Energy, LLC to the consolidated financial statements for further discussion.
Income Taxes. For the year ended December 31, 2015, we recorded a benefit for the release of $16.8 million of our valuation allowance as we expect to be able to utilize a portion of our net operating loss ("NOL") carryforwards to offset future taxable income of Mid Pac. Excluding the impact of releasing the valuation allowance related to the Mid Pac deferred tax liability, state tax expense was approximately $29 thousand, compared to $455 thousand of state tax benefit for the year ended December 31, 2014.
Adjusted EBITDA and Adjusted Net Income (Loss). For the year ended December 31, 2015 Adjusted EBITDA was $110.4 million compared to a $9.2 million loss for the year ended December 31, 2014. The change is primarily related to improved crack spreads and lower energy costs resulting from lower crude oil prices.
For the year ended December 31, 2015, Adjusted Net Income (Loss) was $14.3 million compared to a $38.8 million loss for the year ended December 31, 2014. The change is primarily related to improved crack spreads and lower energy costs resulting from lower crude oil prices, offset by a decrease of $58.8 million in our equity earnings (losses) from Laramie Energy, largely due to an impairment of $41.1 million in 2015, higher depreciation, depletion and amortization expenses and higher interest expense and financing costs.
Year Ended December 31, 2014 Compared to Year Ended December 31, 2013
Refining Gross Margin. For the year ended December 31, 2014, our refining gross margin was approximately $83.9 million, an increase of $97.5 million compared to a loss of $13.6 million for the year ended December 31, 2013. The increase is primarily due to the acquisition of PHR in September 2013.
Retail Gross Margin. For the year ended December 31, 2014, our retail gross margin was approximately $44.5 million, an increase of $35.0 million compared to $9.5 million for the year ended December 31, 2013. The increase is primarily due to the acquisition of PHR in September 2013.
Logistics Gross Margin. For the year ended December 31, 2014, our logistics gross margin was approximately $30.5 million, an increase of $21.8 million when compared to $8.7 million for the year ended December 31, 2013. The increase is primarily due to the acquisition of PHR in September 2013.
Texadian Gross Margin. For the year ended December 31, 2014, our Texadian gross margin was approximately $5.6 million, a decrease of $11.1 million when compared to $16.7 million for the year ended December 31, 2013. The decrease is primarily due to lower trading differentials on heavy Canadian crude oil and lower volumes.
Corporate and Other Gross Margin. For the year ended December 31, 2014, our corporate and other gross margin was approximately $6.0 million, a decrease of $1.7 million when compared to $7.7 million for the year ended December 31, 2013. The decrease is primarily due to due lower sales prices for crude oil, natural gas and condensate in 2014 as compared to 2013.
Operating Expense. For the year ended December 31, 2014, operating expense was approximately $146.6 million, an increase of $113.7 million compared to $32.9 million for the year ended December 31, 2013. The increase is primarily due to the acquisition of PHR in September 2013.
Depreciation, Depletion and Amortization. For the year ended December 31, 2014, DD&A expense was approximately $14.9 million, an increase of $8.9 million compared to $6.0 million for the year ended December 31, 2013. The increase is primarily due to the acquisition of PHR in September 2013.
49
Loss (Gain) on Sale of Assets, Net. For the year ended December 31, 2014, the loss on sale of assets, net, was approximately $624 thousand as a result of selling oilfield equipment within our natural gas and oil production segment. There was no significant activity during the year ended December 31, 2013.
Trust Litigation and Settlements. For the year ended December 31, 2014, there was no trust litigation and settlement expense, compared to $6.2 million for the year ended December 31, 2013. There was no significant activity during the year ended December 31, 2014, as we moved further away from the date of our emergence from bankruptcy.
General and Administrative Expense. For the year ended December 31, 2014, general and administrative expense was approximately $34.3 million, an increase of $12.8 million when compared to $21.5 million for the year ended December 31, 2013. The increase is primarily due to higher stock-based compensation expense and consulting expenses related to process improvements and the strengthening of internal controls.
Acquisition and Integration Costs. For the year ended December 31, 2014, acquisition and integration costs were approximately $11.7 million, an increase of $1.9 million when compared to $9.8 million for the year ended December 31, 2013. The increase is primarily due to costs incurred to exit the transition service agreement with Tesoro, further integration efforts related to the acquisition of PHR and approximately $7 million of Mid Pac related costs.
Interest Expense and Financing Costs, Net. For the year ended December 31, 2014, our interest expense and financing costs were approximately $18.0 million, compared to $13.3 million for the year ended December 31, 2013. The increase was primarily due to an increase in outstanding debt balance during 2014 due to additional borrowings under the Delayed Draw Term Loan Credit Agreement. Please read Note 11—Debt to the consolidated financial statements.
Loss on Termination of Financing Agreements. For the year ended December 31, 2014, our loss on termination of financing agreements was approximately $1.8 million, compared to $6.1 million for the year ended December 31, 2013. During 2014, we recognized a loss of $1.8 million due to the termination of the Bridge Loan. During 2013, we recognized a loss of $6.1 million due to the termination of our obligations under the Delayed Draw Term Loan Credit Agreement.
Other Income (Expense), Net. For the year ended December 31, 2014, other expense was approximately $312 thousand, a decrease of $1.1 million when compared to other income of $758 thousand for the year ended December 31, 2013. Other income for the year ended December 31, 2013 included a franchise tax refund and income from a legal settlement that were both nonrecurring. There were no individually significant items during the year ended December 31, 2013.
Change in Value of Common Stock Warrants. For the year ended December 31, 2014, the change in value of common stock warrants resulted in a gain of approximately $4.4 million, a change of $14.6 million when compared to a loss of $10.2 million for the year ended December 31, 2013. During the year ended December 31, 2014, our stock price decreased, which resulted in a decrease in the fair value of the common stock warrants. Conversely, our stock price increased during the year ended December 31, 2013, which resulted in a loss as the value of the common stock warrants also increased.
Change in Value of Contingent Consideration. For the year ended December 31, 2014, the change in value of our contingent consideration liability was approximately $2.8 million. The contingent consideration relates to the acquisition of PHR which occurred on September 25, 2013 and the change in value is due to a decrease in our expected cash flows related to PHR during the contingency period.
Equity Earnings (Losses) From Laramie Energy. For the year ended December 31, 2014, earnings from Laramie Energy were approximately $2.8 million, a change of $5.7 million compared to a loss of $2.9 million for the year ended December 31, 2013. The favorable change is primarily due to higher realized natural gas prices and derivative gains.
Income Taxes. For the year ended December 31, 2014, we recorded approximately $455 thousand of state tax benefit. The 2014 effective tax rate of 1.0% differs from the statutory rate of 35% primarily due to a full valuation allowance against the tax benefit generated by our current operating loss and various state deferred tax activity. The 2013 effective tax rate was 0.0% and differed from the statutory rate primarily due to a full valuation allowance against the tax benefit generated by the operating loss.
Adjusted EBITDA and Adjusted Net Income (Loss). For the year ended December 31, 2014, Adjusted EBITDA was a $9.2 million loss compared to a $30.9 million loss for the year ended December 31, 2013. For the year ended December 31, 2014, Adjusted Net Loss was $38.8 million compared to a $53.1 million loss for the year ended December 31, 2013. The change in Adjusted EBITDA and Adjusted Net Income (loss) is primarily due to the acquisition of PHR in September 2013.
50
Liquidity and Capital Resources
Our liquidity and capital requirements are primarily a function of our debt maturities and debt service requirements, fixed capacity payments and contractual obligations, capital expenditures and working capital needs. Examples of working capital needs include purchases and sales of commodities and associated margin and collateral requirements, facility maintenance costs and other costs such as payroll. Our primary sources of liquidity are cash flows from operations, cash on hand, amounts available under our credit agreements and access to capital markets.
The following tables summarize our liquidity position as of February 26, 2016 and December 31, 2015 (in thousands):
February 26, 2016 | Par Hawaii Refining | HIE Retail | Mid Pac | KeyBank Credit Agreement | Texadian | Corporate and Other | Total | |||||||||||||||||||||
Cash and cash equivalents | $ | 49,108 | $ | 10,567 | $ | 10,090 | $ | — | $ | 18,088 | $ | 31,242 | $ | 119,095 | ||||||||||||||
Revolver availability | — | — | — | 5,000 | — | — | $ | 5,000 | ||||||||||||||||||||
Deferred Payment Arrangement availability (1) | 51,035 | — | — | — | — | — | 51,035 | |||||||||||||||||||||
Total available liquidity | $ | 100,143 | $ | 10,567 | $ | 10,090 | $ | 5,000 | $ | 18,088 | $ | 31,242 | $ | 175,130 | ||||||||||||||
________________________________________________________
(1) Please read Note 10—Inventory Financing Agreements to our consolidated financial statements for further discussion.
December 31, 2015 | Par Hawaii Refining | HIE Retail | Mid Pac | KeyBank Credit Agreement | Texadian | Corporate and Other | Total | |||||||||||||||||||||
Cash and cash equivalents | $ | 46,041 | $ | 7,178 | $ | 7,113 | $ | — | $ | 16,433 | $ | 91,023 | $ | 167,788 | ||||||||||||||
Revolver availability | — | — | — | 5,000 | 28,125 | — | 33,125 | |||||||||||||||||||||
Deferred Payment Arrangement availability (1) | 28,281 | — | — | — | — | — | 28,281 | |||||||||||||||||||||
Total available liquidity | $ | 74,322 | $ | 7,178 | $ | 7,113 | $ | 5,000 | $ | 44,558 | $ | 91,023 | $ | 229,194 | ||||||||||||||
________________________________________________________
(1) Please read Note 10—Inventory Financing Agreements to our consolidated financial statements for further discussion.
The change in our liquidity position from December 31, 2015 to February 26, 2016 was primarily attributable to the expiration of our Texadian credit agreement in February, our investment in Laramie Energy of $55 million in February, increased availability under our J. Aron deferred payment arrangement and operating results and normal working capital changes for the period.
As of December 31, 2015, we had access to the J. Aron Deferred Payment Arrangement, the KeyBank Credit Agreement, the Texadian Uncommitted Credit Agreement and cash on hand of $167.8 million. In addition, we have Supply and Offtake Agreements with J. Aron, which are used to finance the majority of the inventory of our refinery. Generally, the primary uses of our capital resources have been in the operations of our refining segment, our retail segment, our Texadian segment, payments related to the acquisition of Mid Pac, cash capital contributions to Laramie Energy and payments of operating expenses related to our natural gas and crude oil assets.
We believe our cash flows from operations and available capital resources will be sufficient to meet our current capital expenditures, working capital and debt service requirements for the next 12 months. The funds for the $55 million Laramie Energy capital contribution were raised through our November 25, 2015 registered direct offering. The refinery turnaround costs will be funded through operating cash flows. Additionally, we may seek to raise additional debt or equity capital to fund any other significant changes to our business or to refinance existing debt. We cannot offer any assurances that such capital will be available in sufficient amounts or at an acceptable cost.
51
Rights Offering
In July 2014, we issued, at no charge, one transferable subscription right with respect to each share of our common stock then outstanding. Holders of subscription rights were entitled to purchase 0.21 shares of our common stock for each subscription right held at an exercise price of $16.00 per whole share. The rights offering was fully subscribed and we issued approximately 6.4 million shares of our common stock resulting in net proceeds of approximately $101.5 million in August 2014.
Registered Direct Offering
On November 25, 2015, we issued an aggregate of 3.4 million shares of our common stock to certain pre-existing investors and other investors in an offering at a purchase price of $22.00 per share. The total gross proceeds from the offering were approximately $74.8 million, before deducting expenses of approximately $1.0 million, for net proceeds of approximately $73.8 million.
KeyBank Credit Agreement
On December 17, 2015, HIE Retail and Mid Pac entered into the KeyBank Credit Agreement in the form of a revolving credit facility up to $5 million ("KeyBank Revolving Credit Facility"), which provides for revolving loans and for the issuance of letters of credit and a term loan agreement (“KeyBank Term Loans”), which provided term loans totaling $110 million. The proceeds of the KeyBank Term Loans were used to repay existing indebtedness under the HIE Retail, Mid Pac Credit and Term Loan and Bridge Loan Credit Agreements and to pay transaction fees and expenses and to facilitate a cash distribution to their parent. As of December 31, 2015, we have not executed any borrowings under the KeyBank Revolving Credit Facility.
The KeyBank Term Loans mature in seven years and are fully payable on December 17, 2022. Principal on the KeyBank Term Loans will be repaid quarterly over the term of the loans. The KeyBank Revolving Credit Facility matures on December 17, 2020 and no more than seven borrowings of Eurodollar loans may be outstanding at any time. Letters of credit issued under the KeyBank Revolving Credit Facility are not to expire later than 30 days prior to the maturity date of the KeyBank Revolving Credit Facility.
The KeyBank Term Loans and advances under the KeyBank Revolving Credit Facility bear interest at a fluctuating rate equal to (i) during the periods such revolving loan or term loan, as applicable, is a Base Rate Loan, the Base Rate plus the Applicable Margin and (ii) during the periods such revolving loan or term loan, as applicable, is a Eurodollar Loan, the relevant Adjusted Eurodollar Rate for such Eurodollar Loan for the applicable interest period plus the Applicable Margin.
Pursuant to the KeyBank Credit Agreement, we are required to comply with various affirmative and negative covenants affecting our business and operations, including compliance with an interest coverage ratio of less than 2.50 to 1.00, a debt service coverage ratio of less than 1.25 to 1.00, and a maximum leverage ratio.
The loans and letters of credit issued under the KeyBank Credit Agreement are secured by a security interest in and lien on substantially all of the assets of HIE Retail and Mid Pac, a pledge by Par Petroleum, LLC of 100% of its ownership interest in HIE Retail and a pledge by Par Hawaii Inc. of 100% of its ownership interest in Mid Pac.
Please read Note 11—Debt in our consolidated financial statements for additional discussion.
Term Loan
On July 11, 2014, we and certain subsidiaries entered into a Delayed Draw Term Loan and Bridge Loan Credit Agreement ("Credit Agreement"), amending and restating a previous borrowing arrangement with the lenders, to provide us with a term loan of up to $50 million ("Term Loan") and a bridge loan of up to $75 million ("Bridge Loan"). The lenders under the Credit Agreement include ZCOF Par Petroleum Holdings, LLC and Highbridge International, LLC, who are also our stockholders. Proceeds from the Term Loan were used to fund the additional deposit required by the Mid Pac merger agreement, to pay transaction costs, and for working capital and general corporate purposes.
In July 28, 2014, the Credit Agreement was amended and we borrowed an additional $35 million ("Advance") under the Term Loan and on September 10, 2014, we extended the repayment date of the Advance to March 31, 2015.
We had no borrowings under the Bridge Loan and on September 3, 2014, we terminated the Bridge Loan and expensed approximately $1.8 million of financing costs associated with this loan that is included in Loss on termination of financing agreements in our consolidated statement of operations for the year ended December 31, 2014.
52
On March 11, 2015, we entered into a Third Amendment to the Credit Agreement whereby we extended the repayment date of the Advance to March 31, 2016. Upon the execution of the KeyBank Credit Agreement on December 17, 2015, we repaid the full amount outstanding under the Advance on December 22, 2015.
The Term Loan matures on July 11, 2018 and bears interest at either 10% per annum if paid in cash or 12% per annum if paid in kind, at our election and has an original issue discount of 5%. The Term Loan is secured by a lien on substantially all of our assets and our subsidiaries, excluding Texadian, Texadian Energy Canada Limited (“Texadian Canada”), certain of our immaterial subsidiaries and Par Petroleum, LLC and its subsidiaries (collectively “the Guarantors”). All our obligations under the Term Loan are unconditionally guaranteed by the Guarantors.
HIE Retail Credit Agreement
On November 14, 2013, HIE Retail, LLC ("HIE Retail") entered into a Credit Agreement (“Retail Credit Agreement”) in the form of a senior secured loan of up to $30 million and a senior secured revolving line of credit of up to $5 million. On May 15, 2015, HIE Retail entered into an amendment to the Retail Credit Agreement that terminated the retail revolver, extended the maturity date of $22 million of the existing term loan until March 31, 2022, and provided additional term loan borrowings of up to $7.9 million, on the same terms as the previous term loan. We repaid in full and terminated the Retail Credit Agreement in December 2015 upon entering into the KeyBank Credit Agreement and expensed $58 thousand of financing costs associated with the agreement, which is included within Loss on termination of financing agreements on our consolidated statements of operations for the year ended December 31, 2015.
Texadian Uncommitted Credit Agreement
On February 20, 2015, Texadian Energy, Inc. ("TEI") and its wholly-owned subsidiary Texadian Energy Canada Limited, amended and restated their uncommitted credit agreement. The amended agreement increased the uncommitted loans and letters of credit capacity to $200 million and extended the maturity date. The agreement expired in February 2016.
Mid Pac Credit Agreement
On April 1, 2015, PHI and Mid Pac entered into the Mid Pac Credit Agreement in the form of a senior secured term loan in the amount of $50 million and a senior secured revolving line of credit in the aggregate principal amount of up to $5 million scheduled to mature on April 1, 2018. We borrowed the full amount of the loans at the closing. The proceeds of the loans were used to repay certain existing debt of PHI and Mid Pac totaling $45.3 million, pay a portion of the acquisition consideration and for general corporate purposes. We repaid in full and terminated the Mid Pac Credit Agreement upon entering into the KeyBank Credit Agreement and expensed $381 thousand of financing costs associated with the agreement, which is included within Loss on termination of financing agreements on our consolidated statements of operations for the year ended December 31, 2015.
Guarantors
In connection with our shelf registration statement on Form S-3, which was filed with the SEC on June 1, 2015 and declared effective on June 23, 2015 (“Registration Statement”), we may sell non-convertible debt securities and other securities in one or more offerings with an aggregate initial offering price of up to $750 million. Any non-convertible debt securities issued under the Registration Statement may be fully and unconditionally guaranteed (except for customary release provisions), on a joint and several basis, by some or all of our subsidiaries, other than subsidiaries that are “minor” within the meaning of Rule 3-10 of Regulation S-X (the “Guarantor Subsidiaries”). The Company has no “independent assets or operations” within the meaning of Rule 3-10 of Regulation S-X and certain of the Guarantor Subsidiaries may be subject to restrictions on their ability to distribute funds to the Company, whether by cash dividends, loans or advances. On November 25, 2015, we issued 3.4 million shares of common stock in a registered direct offering which reduced the amount of securities available for issuance under the Registration Statement to approximately $675 million.
Cash Flows
The following table summarizes cash activities for the year ended December 31, 2015, 2014 and 2013 (in thousands):
Years Ended December 31, | |||||||||||
2015 | 2014 | 2013 | |||||||||
Net cash provided by (used in) operating activities | $ | 132,358 | $ | (54,604 | ) | $ | (35,677 | ) | |||
Net cash used in investing activities | (114,205 | ) | (24,299 | ) | (564,500 | ) | |||||
Net cash provided by financing activities | 60,425 | 130,052 | 632,053 | ||||||||
53
Net cash provided by operating activities was approximately $132.4 million for the year ended December 31, 2015, which resulted from a net loss of approximately $39.9 million offset by non-cash charges to operations of approximately $133.8 million and net cash provided by changes in operating assets and liabilities of approximately $38.5 million. Net cash used in operating activities was approximately $54.6 million for the year ended December 31, 2014, which resulted from a net loss of approximately $47.0 million offset by non-cash charges to operations of approximately $23.3 million and net cash used for changes in operating assets and liabilities of approximately $30.9 million. Net cash used in operating activities was approximately $35.7 million for the year ended December 31, 2013, which resulted from a net loss of approximately $79.2 million offset by non-cash charges to operations of approximately $37.1 million and net cash provided by changes in operating assets and liabilities of approximately $6.4 million.
For the year ended December 31, 2015, net cash used in investing activities was approximately $114.2 million and primarily related to $64.3 million for the acquisition of Mid Pac, an investment in Laramie Energy of $27.5 million and additions to property and equipment totaling approximately $22.3 million. Net cash used in investing activities was approximately $24.3 million for the year ended December 31, 2014 and was primarily related to the Mid Pac acquisition deposit of $10.0 million and additions to property and equipment of approximately $14.3 million. Net cash used in investing activities was approximately $564.5 million for the year ended December 31, 2013 and was primarily related to the acquisition of PHR for approximately $559.3 million and additions to property and equipment totaling approximately $7.8 million, offset by proceeds from the sale of assets of $2.9 million.
Net cash provided by financing activities for the year ended December 31, 2015 was approximately $60.4 million and consisted primarily of proceeds from the sale of common stock totaling $76.1 million and net proceeds from inventory financing agreements of $13.2 million, offset by net repayments of borrowings and deferred payment arrangement of $20.5 million and deferred loan costs of $7.3 million. Net cash provided by financing activities for the year ended December 31, 2014 of approximately $130.1 million consisted primarily of proceeds from the sale of common stock totaling $103.9 million and $26.0 million of borrowings under the Term Loan which were used to fund the Mid Pac acquisition deposit and general corporate and working capital purposes. Net cash provided by financing activities for the year ended December 31, 2013 of approximately $632.1 million resulted from advances from our supply and exchange agreements totaling approximately $378.2 million, the sale of common stock totaling approximately $199.2 million, additional net borrowings of approximately $35.6 million and the release of approximately $19.0 million from restricted cash held to secure letters of credit.
Capital Expenditures
Our capital expenditures excluding acquisitions for the year ended December 31, 2015 totaled approximately $22.3 million and were primarily related to our refinery and information technology systems. Our capital expenditure budget for 2016, including major maintenance costs, ranges from $45 to $50 million and primarily relates to scheduled turnaround expenditures, as well as projects to improve our refinery reliability and efficiency and upgrades to our information technology systems. We also committed to fund approximately $55 million for investments in Laramie Energy.
Additional capital may be required to maintain our interests at our Point Arguello Unit offshore California, but production is not economic in the current low-price environment and we are not able to estimate the amount of any potential capital requirement. We also continue to seek strategic investments in business opportunities, but the amount and timing of those investments are not predictable.
Contractual Obligations
We have various contractual obligations and financial commitments in the normal course of our operations and financing activities. Contractual obligations include future cash payments required under existing contractual arrangements, such as debt and lease agreements. These obligations may result from both general financing activities and from commercial arrangements that are directly related to our operating activities. The following table summarizes the contractual obligations of the Company and its consolidated subsidiaries as of December 31, 2015. Cash obligations reflected in the table below are not discounted.
54
Total | Less than 1 Year | 1 - 3 Years | 3 - 5 Years | More than 5 Years | ||||||||||||||||
(in thousands) | ||||||||||||||||||||
Long-term debt (including current portion) | $ | 171,349 | $ | 12,230 | $ | 82,119 | $ | 22,000 | $ | 55,000 | ||||||||||
Interest payments on debt | 32,455 | 8,826 | 16,590 | 4,548 | 2,491 | |||||||||||||||
Operating leases | 98,924 | 27,443 | 31,133 | 16,156 | 24,192 | |||||||||||||||
Capital leases | 2,395 | 712 | 1,250 | 433 | — | |||||||||||||||
Purchase commitments | 201,009 | 199,636 | 1,298 | 75 | — | |||||||||||||||
Laramie Energy equity commitment | 55,000 | 55,000 | — | — | — | |||||||||||||||
Long-Term Debt (including Current Portion). Long-term debt includes the scheduled principal payments related to our outstanding debt obligations and letters of credit. Please read Note 11—Debt to our consolidated financial statements for further discussion.
Interest Payments on Debt. Interest payments on debt represent estimated periodic interest payment obligations associated with our outstanding debt obligations using interest rates in effect as of December 31, 2015. Please read Note 11—Debt to our consolidated financial statements for further discussion.
Operating Leases. Operating leases include minimum lease payment obligations associated with certain retail sites, office space and office equipment leases. Also included in operating leases are two charter agreements associated with our logistics operations.
Capital Leases. Capital leases include minimum lease payment obligations associated with certain retail sites.
Purchase Commitments. Primarily consists of contracts executed as of December 31, 2015 for the purchase of crude oil for use at our refinery that are scheduled for delivery in 2016.
Laramie Energy Equity Commitment. On December 17, 2015, we entered into an equity commitment letter with Laramie Energy, pursuant to which we agreed to purchase certain membership interests of Laramie Energy for an aggregate cash purchase price of $55 million in support of an acquisition Laramie Energy completed on March 1, 2016.
Commitments and Contingencies
Inventory Financing Agreements. On June 1, 2015, we entered into several agreements with J. Aron & Company ("J. Aron") to support the operations of our refinery, (the "Supply and Offtake Agreements"). The Supply and Offtake Agreements have a term of three years and two one-year extension options at the mutual agreement of the parties. Please read Note 10—Inventory Financing Agreements to our consolidated financial statements for more information.
Pursuant to the Supply and Offtake Agreements, J. Aron holds title to quantities of crude oil and refined products in exchange for the Company's obligation to legally repurchase the crude oil and refined products at a later date. Substantially all of the crude oil and refined products inventory in the refinery storage tanks are titled to J. Aron. Primarily all of the crude and refined products inventory outside the refinery, except for one location, are owned and titled by the Company. In addition, the Company holds title to inventory contained in the process units during the refining process. The Company purchases the crude oil from J. Aron as it is discharged from the storage tanks into the process units. After processing, J. Aron takes title to the refined products stored in our storage tanks until the products are transferred to our retail locations or to third parties. We currently market and sell the refined product independently to third parties.
While title to the crude oil and certain refined product inventories will reside with J. Aron, the Supply and Offtake Agreements will be accounted for similar to a product financing arrangement; therefore, the crude oil and refined products inventories will continue to be included on our consolidated balance sheet until processed and sold to a third party. Each reporting period, we record a liability in an amount equal to the amount we expect to pay to repurchase the inventory held by J. Aron based on current market prices.
55
Environmental Matters. Our petroleum refining operations and third-party oil and gas exploration and production operations in which we have a working interest are subject to extensive and periodically changing federal, state and local environmental laws and regulations governing air emissions, wastewater discharges and solid and hazardous waste management activities. Many of these laws and regulations are becoming increasingly stringent and the cost of compliance can be expected to increase over time. Our policy is to accrue environmental and clean-up related costs of a non-capital nature when it is probable that a liability has been incurred and the amount can be reasonably estimated. Such estimates may be subject to revision in the future as regulations and other conditions change.
Periodically, we receive communications from various federal, state and local governmental authorities asserting violations of environmental laws and/or regulations. These governmental entities may also propose or assess fines or require corrective actions for these asserted violations. We intend to respond in a timely manner to all such communications and to take appropriate corrective action. We do not anticipate that any such matters currently asserted will have a material impact on our financial condition, results of operations or cash flows.
Regulation of Greenhouse Gases
The EPA has begun regulating GHG under the CAA. New construction or material expansions that meet certain GHG emissions thresholds will likely require that, among other things, a GHG permit be issued in accordance with the Clean Air Act regulations and we will be required in connection with such permitting to undertake a technology review to determine appropriate controls to be implemented with the project in order to reduce GHG emissions.
Furthermore, the EPA is currently developing refinery-specific GHG regulations and performance standards that are expected to impose GHG emission limits and/or technology requirements. These control requirements may affect a wide range of refinery operations. Any such controls could result in material increased compliance costs, additional operating restrictions for our business and an increase in cost of the products we produce, which could have a material adverse effect on our financial position, results of operations and liquidity.
On September 29, 2015, the EPA announced a final rule updating standards that control toxic air emissions from petroleum refineries, addressing, among other things, flaring operations, fenceline air quality monitoring and additional emission reductions from storage tanks and delayed coking units. Affected existing sources will be required to comply with the new requirements no later than 2018, with certain refiners required to comply earlier depending on the relevant provision and refinery construction date. We do not anticipate that compliance with this rule will have a material impact on our financial condition, results of operations or cash flows.
In 2007, the State of Hawaii passed Act 234, which required that GHG emissions be rolled back on a statewide basis to 1990 levels by the year 2020. Although delayed, the Hawaii Department of Health has issued regulations that would require each major facility to reduce CO2 emissions by 16% by 2020 relative to a calendar year 2010 baseline (the first year in which GHG emissions were reported to the EPA under 40 CFR Part 98). Those rules are pending final approval by the Government of Hawaii. The refinery’s capacity to reduce fuel use and GHG emissions is limited. However, the state’s pending regulation allows and we anticipate the refinery will be able to demonstrate, that additional reductions are not cost-effective or necessary in light of the state’s current GHG inventory and future year projections. The pending regulation allows for “partnering” with other facilities (principally power plants) which have already dramatically reduced greenhouse emissions or are on schedule to reduce CO2 emissions in order to comply with the state’s Renewable Portfolio Standards.
Fuel Standards
In 2007, the U.S. Congress passed the Energy Independence and Security Act (“EISA”) which, among other things, set a target fuel economy standard of 35 miles per gallon for the combined fleet of cars and light trucks in the U.S. by model year 2020 and contained a second Renewable Fuel Standard (the “RFS2”). In August 2012, the EPA and National Highway Traffic Safety Administration jointly adopted regulations that establish an average industry fuel economy of 54.5 miles per gallon by model year 2025. The RFS2 requires an increasing amount of renewable fuel usage, up to 36.0 billion gallons by 2022. In the near term, the RFS2 will be satisfied primarily with fuel ethanol blended into gasoline. The RFS2 may present production and logistics challenges for both the renewable fuels and petroleum refining and marketing industries in that we may have to enter into arrangements with other parties or purchase credits from the EPA to meet our obligations to use advanced biofuels, including biomass-based diesel and cellulosic biofuel, with potentially uncertain supplies of these new fuels.
In October 2010, the EPA issued a partial waiver decision under the Clean Air Act to allow for an increase in the amount of ethanol permitted to be blended into gasoline from 10% (“E10”) to 15% (“E15”) for 2007 and newer light duty motor vehicles. In January 2011, the EPA issued a second waiver for the use of E15 in vehicles model years 2001-2006. There are numerous issues, including state and federal regulatory issues, which need to be addressed before E15 can be marketed on a large scale for use in
56
traditional gasoline engines. Consequently, qualified Renewable Identification Numbers (“RINS”) will be required to fulfill the federal mandate for renewable fuels.
In March 2014, the EPA published a final Tier 3 gasoline standard that lowers the allowable sulfur level in gasoline to 10 parts per million ("ppm") and also lowers the allowable benzene, aromatics and olefins content of gasoline. The effective date for the new standard, January 1, 2017, gives refiners nationwide little time to engineer, permit and implement substantial modifications; however, approved small volume refineries have until January 1, 2020 to meet the standard. The American Petroleum Institute and American Fuel and Petrochemical Association may challenge the final regulation. In September 2015, our refinery was granted small volume refinery status by the EPA. Along with credit and trading options, potential capital upgrades for the refinery are being evaluated.
Beginning on June 30, 2014, new sulfur standards for fuel oil used by marine vessels operating within 200 miles of the US coastline (which includes the entire Hawaiian Island chain) was lowered from 10,000 ppm (1%) to 1,000 ppm (0.1%). The sulfur standards began at the refinery and were phased in so that by January 1, 2015, they were to be fully aligned with the International Marine Organization ("IMO") standards and deadline. The more stringent standards apply universally to both US and foreign flagged ships. Although the marine fuel regulations provided vessel operators with a few compliance options such as installation of on-board pollution controls and demonstration unavailability, many vessel operators will be forced to switch to a distillate fuel while operating within the Emission Control Area ("ECA"). Beyond the 200 mile ECA, large ocean vessels are still allowed to burn marine fuel with up to 3.5% sulfur. Our refinery is capable of producing the 1% sulfur residual fuel oil that was previously required within the ECA. Although our refinery remains in a position to supply vessels traveling to and through Hawaii, the market for 0.1% sulfur distillate fuel and 3.5% sulfur residual fuel is much more competitive.
There will be compliance costs and uncertainties regarding how we will comply with the various requirements contained in the EISA and other fuel-related regulations. We may experience a decrease in demand for refined petroleum products due to an increase in combined fleet mileage or due to refined petroleum products being replaced by renewable fuels.
Environmental Agreement. On September 25, 2013 (“Closing Date”), Hawaii Pacific Energy (a wholly-owned subsidiary of Par created for purposes of the acquisition of PHR), Tesoro and PHR entered into an Environmental Agreement (“Environmental Agreement”), which allocated responsibility for known and contingent environmental liabilities related to the acquisition of PHR, including the Consent Decree as described below.
Consent Decree
Tesoro is currently negotiating a Consent Decree with the EPA and the DOJ concerning alleged violations of the federal Clean Air Act related to the ownership and operation of multiple facilities owned or formerly owned by Tesoro and its affiliates ("Consent Decree"), including the Hawaii refinery. It is anticipated that the Consent Decree will be finalized sometime during 2016 and will require certain capital improvements to our refinery to reduce emissions of air pollutants.
We estimate the cost of compliance with the final Consent Decree could be $20 million to $30 million. However, Tesoro is responsible under the Environmental Agreement for reimbursing us for all reasonable third-party capital expenditures incurred for the construction, installation and commissioning of such capital projects and for the payment of any fines or penalties imposed on us arising from the Consent Decree to the extent related to acts or omission of Tesoro or us prior to the Closing Date. Tesoro’s obligation to reimburse us for such fines and penalties is not subject to a monetary limitation; however, the obligation relating to fines and penalties terminates on the third anniversary of the Closing Date.
Indemnification
In addition to its obligation to reimburse us for capital expenditures incurred pursuant to the Consent Decree, Tesoro agreed to indemnify us for claims and losses arising out of related breached of Tesoro’s representations, warranties and covenants in the Environment Agreement, certain defined “corrective actions” relating to pre-existing environmental conditions, third-party claims arising under environmental laws for personal injury or property damage arising out of or relating to releases of hazardous materials that occurred prior to the Closing Date, any fine, penalty or other cost assessed by a governmental authority in connection with violations of environmental laws by us prior to the Closing Date, certain groundwater remediation work, the replacement of underground storage tanks located at certain retail assets and fines or penalties imposed on us by the Consent Decree related to acts or omissions of Tesoro prior to the Closing Date and to the Pearl City Superfund Site.
Tesoro’s indemnification obligations are subject to certain limitations as set forth in the Environmental Agreement. These limitations include a deductible of $1 million and a cap of $15 million for certain of Tesoro’s indemnification obligations related to certain pre-existing conditions as well as certain restrictions regarding the time limits for submitting notice and supporting documentation for remediation actions.
57
Bankruptcy Matters. We emerged from the reorganization of Delta Petroleum on August 31, 2012 ("Emergence Date") when the plan of reorganization ("Plan") was consummated. On the Emergence Date, we formed the Delta Petroleum General Recovery Trust (“General Trust”). The General Trust was formed to pursue certain litigation against third parties, including preference actions, fraudulent transfer and conveyance actions, rights of setoff and other claims or causes of action under the U.S. Bankruptcy Code and other claims and potential claims that the Debtors hold against third parties. The General Trust was funded with $1 million each pursuant to the Plan.
The General Trust is pursuing all bankruptcy causes of action, claim objections and resolutions and all other responsibilities for winding up the bankruptcy. The General Trust is overseen by a three-person General Trust Oversight Board and our General Counsel is currently the trustee (“Recovery Trustee”). Costs, expenses and obligations incurred by the General Trust are charged against assets in the General Trust. To conduct its operations and fulfill its responsibilities under the Plan and the trust agreements, the Recovery Trustee may request additional funding from us. Any litigation pending at the time we emerged from Chapter 11 was transferred to the General Trust for resolution and settlement in accordance with the Plan and the order confirming the Plan. We are the beneficiary of the General Trust, subject to the terms of the trust agreement and the Plan. Since the Emergence Date, the General Trust has filed various claims and causes of action against third parties before the Bankruptcy Court, which actions are ongoing. Upon liquidation of the various claims and causes of action held by the General Trust, the proceeds, less certain administrative reserves and expenses, will be transferred to us. It is unknown at this time what proceeds, if any, we will realize from the General Trust’s litigation efforts.
As of December 31, 2015, a total of twelve claims totaling approximately $23.1 million remain to be resolved by the Recovery Trustee. We have agreed to settle six of these claims for aggregate consideration of approximately $666 thousand, subject to final documentation and payment, and have filed or will file notices of objection with respect to liability for the other claims.
The largest remaining proof of claim was filed by the U.S. Government for approximately $22.4 million relating to ongoing litigation concerning a plugging and abandonment obligation in Pacific Outer Continental Shelf Lease OCS-P 0320, comprising part of the Sword Unit in the Santa Barbara Channel, California. We believe the probability of issuing stock to satisfy the full claim amount is remote, as the obligations upon which such proof of claim is asserted are joint and several among all working interest owners and Delta, our predecessor, owned a working interest in the unit of approximately 2.4% .
The settlement of claims is subject to ongoing litigation and we are unable to predict with certainty how many shares will be required to satisfy all claims. Pursuant to the Plan, allowed claims are settled at a ratio of 54.4 shares per $1,000 of claim. At December 31, 2015, we have reserved approximately $1.1 million representing the estimated value of claims remaining to be settled which are deemed probable and estimable at period end.
Operating Leases. We have various cancelable and noncancelable operating leases related to land, vehicles, office and retail facilities and other facilities used in the storage, transportation and sale of crude oil and refined products. The majority of the future lease payments relate to retail stations and facilities used in the storage, transportation and sale of crude oil and refined products. We have operating leases for most of our retail stations with primary terms of up to 32 years and generally containing renewal options and escalation clauses. Leases for facilities used in the storage, transportation and sale of crude oil and refined products have various expiration dates extending to 2044.
In addition, with our Texadian segment and our logistics segment, we have various agreements to lease storage facilities, primarily along the Mississippi River, railcars, and towboats and other equipment. These leasing agreements have been classified as operating leases for financial reporting purposes and the related rental fees are charged to expense over the lease term as they become payable. The leases generally range in duration of five years or less and contain lease renewal options at fair value. Our railcar leases contain an empty mileage indemnification provision whereby if the empty mileage exceeds the loaded mileage, we are charged for the empty mileage at the rate established by the tariff of the railroad on which the empty miles accrued.
Minimum annual lease payments extending to 2044 for operating leases to which we are legally obligated and having initial or remaining noncancelable lease terms in excess of one year are as follows (in thousands):
2016 | $ | 27,443 | |
2017 | 18,269 | ||
2018 | 12,864 | ||
2019 | 10,351 | ||
2020 | 5,805 | ||
Thereafter | 24,192 | ||
Total minimum rental payments | $ | 98,924 | |
58
Capital Leases. We have capital lease obligations related primarily to the leases of five retail stations with initial terms of 17 years, with four five-year renewal options. Minimum annual lease payments including interest, for capital leases are as follows (in thousands):
2016 | $ | 712 | |
2017 | 672 | ||
2018 | 578 | ||
2019 | 433 | ||
2020 | — | ||
Thereafter | — | ||
Total minimum lease payments | $ | 2,395 | |
Less amount representing interest | 308 | ||
Total minimum rental payments | $ | 2,087 | |
Off-Balance Sheet Arrangements
We have no off-balance sheet arrangements as of December 31, 2015.
Critical Accounting Policies and Estimates
The discussion and analysis of our financial condition and results of operations were based on the consolidated financial statements, which have been prepared in accordance with U.S. GAAP. The preparation of these consolidated financial statements requires us to make estimates and judgments that affect the reported amounts of assets, liabilities, revenues and expenses. Our significant accounting policies are described in Note 2—Summary of Significant Accounting Policies of our audited consolidated financial statements included herein. We have identified certain of these policies as being of particular importance to the portrayal of our financial position and results of operations and which require the application of significant judgment by management. We analyze our estimates on a periodic basis, including those related to fair value, impairments, natural gas and crude oil reserves, bad debts, natural gas and oil properties, income taxes, derivatives, contingencies and litigation and base our estimates on historical experience and various other assumptions that we believe are reasonable under the circumstances. Actual results may differ from these estimates under different assumptions or conditions. We believe the following critical accounting policies affect our more significant judgments and estimates used in the preparation of our consolidated financial statements.
Inventory
Inventories are stated at the lower of cost or net realizable value using the first-in, first-out accounting method. We value merchandise along with spare parts, materials and supplies at average cost. Estimating the net realizable value of our inventory requires management to make assumptions about the timing of sales and the expected proceeds that will be realized for the sales.
Our refining segment acquires substantially all of its crude oil from J. Aron under procurement contracts. The crude oil remains in the legal title of J. Aron and is stored in our storage tanks governed by a storage agreement. Legal title to the crude oil passes to us at the tank outlet. After processing, J. Aron takes title to the refined products stored in our storage tanks until sold to our retail locations or to third parties. We record the inventory owned by J. Aron on our behalf as inventory with a corresponding accrued liability on our balance sheet because we maintain the risk of loss until the refined products are sold to third parties and we have an obligation to repurchase it. The valuation of our repurchase obligation requires that we make estimates of the prices and differentials assuming settlement at the end of the reporting period. Please read Note 10—Inventory Financing Agreements for additional information.
Fair Value Measurements
Fair value is defined as the price that would be received to sell an asset or paid to transfer a liability in an orderly transaction between market participants. In estimating fair value, we use discounted cash-flow projections, recent comparable market transactions, if available or quoted prices. We consider assumptions that third parties would make in estimating fair value, including the highest and best use of the asset. The assumptions used by another party could differ significantly from our assumptions.
We classify fair value balances based on the classification of the inputs used to calculate the fair value of a transaction. The inputs used to measure fair value have been placed in a hierarchy based on priority. The hierarchy gives the highest priority to unadjusted, readily observable quoted prices in active markets for identical assets or liabilities (Level 1 measurement) and the lowest priority to unobservable inputs (Level 3 measurement).
59
Assets and Liabilities Measured at Fair Value on a Nonrecurring Basis. We use a variety of methods to estimate the fair value of assets and liabilities acquired in business combinations and evaluating goodwill and other long-lived assets for impairment. These methods include the cost approach, the sales approach and the income approach. These methods require management to make judgments regarding characteristics of the acquired property, future revenues and expenses. There is a significant amount of judgment involved in cash-flow estimates. Changes in these estimates would result in different amounts allocated to the related assets and liabilities.
At December 31, 2015, we conducted an impairment test related to our equity investment in Laramie Energy. As a result of the decline in commodity prices during 2015, we concluded that our equity investment in Laramie Energy was impaired and recognized an other-than-temporary impairment charge of $41.1 million on our consolidated statement of operations for the year ended December 31, 2015. We primarily used a market approach to determine the fair value of our equity investment in Laramie Energy as of December 31, 2015.
At September 30, 2015, we conducted an interim goodwill impairment test of our Texadian reporting unit due to (i) a reduction in the forecasted results of operations during our annual budgeting process; (ii) the decision to cancel the charter on the barges used to move crude oil from Canada to the U.S. Gulf Coast due to lower forecasted commodity prices and (iii) negative cash flows from the business during 2015. Upon completion of the goodwill impairment test, we determined the goodwill associated with the Texadian reporting unit was fully impaired resulting in a charge of $7.0 million in our consolidated statement of operations for the year ended December 31, 2015. In assessing the value of the reporting unit, we primarily used an income approach with a weighted-average discount rate of 15%.
Assets and Liabilities Recorded at Fair Value on a Recurring Basis. In the valuation of the liability for the contingent consideration to be paid for the acquisition of PHR and of our outstanding warrants, we use simulation models which require management to make estimates of future gross margin, gross margin volatility and expected volatility of our stock price and a present value factor. Different estimates would result in a change in the fair value of the amounts presented in our consolidated financial statements.
Derivatives and Other Financial instruments. We are exposed to commodity price risk related to crude oil and refined products. We manage this exposure through the use of various derivative commodity instruments. These instruments include exchange traded futures and over-the-counter swaps, forwards and options.
For our forward contracts that are derivatives, we have elected the normal purchase normal sale exclusion, as it is our policy to fulfill or accept the physical delivery of the product and we will not net settle. Therefore, we did not recognize the unrealized gains or losses related to these contracts in our consolidated financial statements. We apply the accrual method of accounting to contracts qualifying for the normal purchase and sales exemption.
All derivative instruments not designated as normal purchases or sales, are recorded in the balance sheet as either assets or liabilities measured at their fair values. Changes in the fair value of these derivative instruments are recognized currently in earnings. We have not designated any derivative instruments as cash flow or fair value hedges and therefore, do not apply hedge accounting treatment.
In addition, we may have other financial instruments, such as warrants or embedded debt features, that may be classified as liabilities when either (a) the holders possess rights to net cash settlement, (b) physical or net equity settlement is not in our control or (c) the instruments contain other provisions that cause us to conclude that they are not indexed to our equity. Our former delayed draw term loan facility contained certain puts that were accounted for as embedded derivatives. We have also accounted for our obligation to repurchase crude oil and refined products from J.Aron at the termination of the Supply and Offtake Agreements as an embedded derivative. These liabilities were initially recorded at fair value and subsequently adjusted to fair value at the end of each reporting period through earnings.
60
Asset Retirement Obligations. We record asset retirement obligations (“AROs”) at fair value in the period in which we have a legal obligation, whether by government action or contractual arrangement, to incur these costs and can make a reasonable estimate of the fair value of the liability. Our AROs arise from our refining, retail and logistics operations, as well as plugging and abandonment of wells within our natural gas and crude oil operations. AROs are calculated based on the present value of the estimated removal and other closure costs using our credit-adjusted risk-free rate. When the liability is initially recorded, we capitalize the cost by increasing the book value of the related long-lived tangible asset. The liability is accreted to its estimated settlement value and the related capitalized cost is depreciated over the asset’s useful life and both expenses are recorded in Depreciation, depletion and amortization in the consolidated statements of operations. The difference between the settlement amount and the recorded liability is recorded as a gain or loss on asset disposals in our consolidated statements of operations. We estimate settlement dates by considering our past practice, industry practice, management’s intent and estimated economic lives.
We cannot currently estimate the fair value for certain AROs primarily because we cannot estimate settlement dates (or ranges of dates) associated with these assets. These AROs include hazardous materials disposal (such as petroleum manufacturing by-products, chemical catalysts and sealed insulation material containing asbestos) and removal or dismantlement requirements associated with the closure of our refining facility, terminal facilities, or pipelines, including the demolition or removal of certain major processing units, buildings, tanks, pipelines or other equipment.
Item 7A. QUANTITATIVE AND QUALITATIVE DISCLOSURES ABOUT MARKET RISK
Commodity Price Risk
Our earnings, cash flow and liquidity are significantly affected by commodity price volatility. Our revenues fluctuate with refined product prices and our cost of revenues fluctuates with movements in crude oil and feedstock prices. Assuming all other factors remain constant, a $1 per barrel change in average gross refining margins, based on our year-to-date throughput of 77 thousand barrels per day, would change annualized operating income by approximately $27.8 million. This analysis may differ from actual results.
In order to manage commodity price risks, we utilize exchange-traded futures, options and over-the-counter ("OTC") swaps to manage commodity price risks associated with:
• | the price for which we sell our refined products; |
• | the price we pay for crude oil and other feedstocks; |
• | our refined products inventory outside of the Supply and Offtake Agreements; |
• | our fuel requirements for our refinery; |
• | our exposure to crude oil price volatility in our Texadian segment. |
Our Supply and Offtake Agreements with J.Aron require us to hedge our exposure based on the time spread between the period between crude oil cargo pricing and the expected delivery month. We manage this exposure by entering into swaps with J.Aron. Please read Note 7—Inventory Financing Agreements to our consolidated financial statements for more information.
All of our futures and OTC swaps are executed to economically hedge our physical commodity purchases, sales and inventory. Our open futures and OTC swaps expire at various dates through February 29, 2016. At December 31, 2015, these open commodity derivative contracts represent:
• | futures and OTC swaps purchases of 403 thousand barrels that economically hedge our forecasted sales of refined products; |
• | sold OTC swaps of 95 thousand barrels that economically hedge our refined products inventory; and |
• | futures sales of 239 thousand barrels that economically hedge our physical inventory for our Texadian segment. |
Based on our net open positions at December 31, 2015, a $1 change in the price of crude oil, assuming all other factors remain constant, would have no material change to the fair value of our derivative instruments and cost of revenues.
Our predominant variable operating cost is the cost of fuel consumed in the refining process, which is included in Cost of revenues on our consolidated statement of operations. Assuming normal operating conditions, we consume approximately 77 thousand barrels per day of crude oil during the refining process. We have economically hedged our internally consumed fuel cost using costless collars at a rate of 52 thousand barrels per month through December 2017. These options have a weighted-average strike price ranging from a floor of $55.88 per barrel to a ceiling of $64.18 per barrel. In 2016, we have entered into additional collars to economically hedge the cost of our internally consumed fuel in 2018.
61
Compliance Program Price Risk
We are exposed to market risks related to the volatility in the price of RINs required to comply with the Renewable Fuel Standard. Our overall RINs obligation is based on a percentage of our domestic shipments of on-road fuels as established by the EPA. To the degree we are unable to blend the required amount of biofuels to satisfy our RINs obligation, we must purchase RINs on the open market. To mitigate the impact of this risk on our results of operations and cash flows we may purchase RINs when the price of these instruments is deemed favorable. Some of these contracts are derivative instruments, however, we elect the NPNS exception and do not record these contracts at their fair values.
Interest Rate Risk
As of December 31, 2015, $110 million of outstanding debt was subject to floating interest rates. We also have interest rate exposure in connection with our liability under the J. Aron Supply and Offtake Agreements, for which we pay a charge based on a 3-month LIBOR. An increase of 1% in the variable rate on our indebtedness, after considering the instruments subject to minimum interest rates, would result in an increase to our cost of revenues and interest expense of approximately $2.6 million and $2.0 million per year, respectively. We may enter into interest rate swaps, interest rate caps, interest rate collars or other similar contracts to manage our interest rate risk. As of December 31, 2015, we had no such contracts; however, in February 2016, we entered into interest rate swaps with an aggregate notional amount of $200 million at an average fixed interest rate of 1.1%. The interest rate swaps mature in February 2019 and March 2021.
Credit Risk
We are subject to risk of losses resulting from nonpayment or nonperformance by our counterparties. We will continue to closely monitor the creditworthiness of customers to whom we grant credit and establish credit limits in accordance with our credit policy.
Item 8. FINANCIAL STATEMENTS AND SUPPLEMENTARY DATA
The consolidated financial statements required by this item are set forth beginning on page F-1. There are no financial statement schedules since they are either not applicable or the information is included in the notes to the consolidated financial statements.
Item 9. CHANGES IN AND DISAGREEMENTS WITH ACCOUNTANTS ON ACCOUNTING AND FINANCIAL
DISCLOSURES
None.
Item 9A. CONTROLS AND PROCEDURES
Evaluation of Disclosure Controls and Procedures
Disclosure controls and procedures are designed with the objective of ensuring that all information required to be disclosed in our reports filed under the Securities Exchange Act of 1934, as amended ("Exchange Act"), such as this report, is recorded, processed, summarized and reported within the time periods specified by the SEC. In connection with the preparation of this Annual Report on Form 10-K, as of December 31, 2015, an evaluation was performed under the supervision and with the participation of our management, including our Chief Executive Officer and Chief Financial Officer, of the effectiveness of the design and operation of our disclosure controls and procedures (as defined in Rules 13a-15(e) and 15d-15(e) under the Exchange Act). Based on that evaluation, our Chief Executive Officer and Chief Financial Officer concluded that these disclosure controls and procedures were effective as of December 31, 2015.
Changes in Internal Control over Financial Reporting
During the quarter ended December 31, 2015, we established internal controls for recently enhanced components of the Governance, Risk & Compliance module of our general ledger system. There were no other changes during the quarter ended December 31, 2015 in our internal control over financial reporting that have materially affected, or are reasonably likely to materially affect, our internal control over financing reporting.
62
MANAGEMENT’S REPORT ON INTERNAL CONTROL OVER FINANCIAL REPORTING
The Company’s management is responsible for establishing and maintaining adequate internal control over financial reporting (as defined in Rules 13a-15(f) and 15d-15(f) under the Securities Exchange Act of 1934). The Company’s internal control system was designed to provide reasonable assurance to the company’s management and Board of Directors regarding the reliability of financial reporting and the preparation and fair presentation of published financial statements. All internal control systems, no matter how well designed, have inherent limitations. Therefore, even those systems determined to be effective can provide only reasonable assurance with respect to financial statement preparation and presentation.
The Company’s management assessed the effectiveness of the Company’s internal control over financial reporting as of December 31, 2015. In making this assessment, management used the criteria set forth by the Committee of Sponsoring Organizations of the Treadway Commission (COSO) in Internal Control—Integrated Framework (2013). Based on our assessment we believe that, as of December 31, 2015, the Company’s internal control over financial reporting is effective based on those criteria.
Deloitte & Touche LLP, the Company’s independent registered public accounting firm that audited the Company’s financial statements included in this Annual Report on Form 10-K, has issued an audit report on the effectiveness of the Company’s internal control over financial reporting as of December 31, 2015, which is included herein.
63
REPORT OF INDEPENDENT REGISTERED PUBLIC ACCOUNTING FIRM
To the Board of Directors and Stockholders of
Par Pacific Holdings, Inc.
Houston, Texas
We have audited the internal control over financial reporting of Par Pacific Holdings, Inc. (formerly Par Petroleum Corporation) and subsidiaries (the "Company") as of December 31, 2015, based on criteria established in Internal Control - Integrated Framework (2013) issued by the Committee of Sponsoring Organizations of the Treadway Commission. The Company's management is responsible for maintaining effective internal control over financial reporting and for its assessment of the effectiveness of internal control over financial reporting, included in the accompanying Management’s Report on Internal Control over Financial Reporting. Our responsibility is to express an opinion on the Company's internal control over financial reporting based on our audit.
We conducted our audit in accordance with the standards of the Public Company Accounting Oversight Board (United States). Those standards require that we plan and perform the audit to obtain reasonable assurance about whether effective internal control over financial reporting was maintained in all material respects. Our audit included obtaining an understanding of internal control over financial reporting, assessing the risk that a material weakness exists, testing and evaluating the design and operating effectiveness of internal control based on the assessed risk and performing such other procedures as we considered necessary in the circumstances. We believe that our audit provides a reasonable basis for our opinion.
A company's internal control over financial reporting is a process designed by, or under the supervision of, the company's principal executive and principal financial officers, or persons performing similar functions and effected by the company's board of directors, management and other personnel to provide reasonable assurance regarding the reliability of financial reporting and the preparation of financial statements for external purposes in accordance with generally accepted accounting principles. A company's internal control over financial reporting includes those policies and procedures that (1) pertain to the maintenance of records that, in reasonable detail, accurately and fairly reflect the transactions and dispositions of the assets of the company; (2) provide reasonable assurance that transactions are recorded as necessary to permit preparation of financial statements in accordance with generally accepted accounting principles and that receipts and expenditures of the company are being made only in accordance with authorizations of management and directors of the company; and (3) provide reasonable assurance regarding prevention or timely detection of unauthorized acquisition, use, or disposition of the company's assets that could have a material effect on the financial statements.
Because of the inherent limitations of internal control over financial reporting, including the possibility of collusion or improper management override of controls, material misstatements due to error or fraud may not be prevented or detected on a timely basis. Also, projections of any evaluation of the effectiveness of the internal control over financial reporting to future periods are subject to the risk that the controls may become inadequate because of changes in conditions, or that the degree of compliance with the policies or procedures may deteriorate.
In our opinion, the Company maintained, in all material respects, effective internal control over financial reporting as of December 31, 2015, based on the criteria established in Internal Control - Integrated Framework (2013) issued by the Committee of Sponsoring Organizations of the Treadway Commission.
We have also audited, in accordance with the standards of the Public Company Accounting Oversight Board (United States), the consolidated financial statements as of and for the year ended December 31, 2015 of the Company and our report dated March 3, 2016 expressed an unqualified opinion on those financial statements.
/s/ DELOITTE & TOUCHE LLP
Houston, Texas
March 3, 2016
64
Item 9B. OTHER INFORMATION
None.
PART III
Item 10. DIRECTORS, EXECUTIVE OFFICERS AND CORPORATE GOVERNANCE
The information required by this item is incorporated in this Annual Report on Form 10-K by reference to our definitive proxy statement or an amendment to this Annual Report on Form 10-K to be filed with the Securities and Exchange Commission not later than 120 days after the end of the fiscal year ended December 31, 2015.
Item 11. EXECUTIVE COMPENSATION
The information required by this item is incorporated in this Annual Report on Form 10-K by reference to our definitive proxy statement or an amendment to this Annual Report on Form 10-K to be filed with the Securities and Exchange Commission not later than 120 days after the end of the fiscal year ended December 31, 2015.
Item 12. | SECURITY OWNERSHIP OF CERTAIN BENEFICIAL OWNERS AND MANAGEMENT AND RELATED STOCKHOLDER MATTERS |
The information required by this item is incorporated in this Annual Report on Form 10-K by reference to our definitive proxy statement or an amendment to this Annual Report on Form 10-K to be filed with the Securities and Exchange Commission not later than 120 days after the close of our fiscal year ended December 31, 2015.
Item 13. CERTAIN RELATIONSHIPS AND RELATED TRANSACTIONS AND DIRECTOR INDEPENDENCE
The information required by this item is incorporated in this Annual Report on Form 10-K by reference to our definitive proxy statement or an amendment to this Annual Report on Form 10-K to be filed with the Securities and Exchange Commission not later than 120 days after the end of the fiscal year ended December 31, 2015.
Item 14. PRINCIPAL ACCOUNTANT FEES AND SERVICES
The information required by this item is incorporated in this Annual Report on Form 10-K by reference to our definitive proxy statement or an amendment to this Annual Report on Form 10-K to be filed with the Securities and Exchange Commission not later than 120 days after the end of the fiscal year ended December 31, 2015.
65
PART IV
Item 15. EXHIBITS AND FINANCIAL STATEMENT SCHEDULES
INDEX TO EXHIBITS
2.1 | Third Amended Joint Chapter 11 Plan of Reorganization of Delta Petroleum Corporation and Its Debtor Affiliates dated August 13, 2012. Incorporated by reference to Exhibit 2.1 to the Company's Current Report on Form 8-K filed on September 7, 2012. |
2.2 | Contribution Agreement, dated as of June 4, 2012, among Piceance Energy, LLC, Laramie Energy, LLC and the Company. Incorporated by reference to Exhibit 2.2 to the Company's Current Report on Form 8-K filed on June 8, 2012. |
2.3 | Purchase and Sale Agreement dated as of December 31, 2012, by and among the Company, SEACOR Energy Holdings Inc., SEACOR Holdings Inc. and Gateway Terminals LLC. Incorporated by reference to Exhibit 2.1 to the Company's Current Report on Form 8-K filed on January 3, 2013. |
2.4 | Membership Interest Purchase Agreement dated as of June17, 2013, by and among Tesoro Corporation, Tesoro Hawaii, LLC and Hawaii Pacific Energy, LLC Incorporated by reference to Exhibit 2.4 to the Company's Quarterly Report on Form 10-Q for the quarterly period ended June 30, 2013, filed on August 14, 2013. |
2.5 | Agreement and Plan of Merger dated as of June 2, 2014, by and among the Company, Bogey, Inc., Koko’oha Investments, Inc. and Bill D. Mills, in his capacity as the Shareholders’ Representative. Incorporated by reference to Exhibit 2.5 to the Company's Quarterly Report on Form 10-Q for the quarterly period ended June 30, 2014, filed on August 11, 2014. |
2.6 | Amendment to Agreement and Plan of Merger dated as of September 9, 2014, by and among the Company, Bogey, Inc., Koko’oha Investments, Inc. and Bill D. Mills, in his capacity as the shareholders’ representative. Incorporated by reference to Exhibit 10.2 to the Company’s Current Report on Form 8-K filed on September 10, 2014. |
2.7 | Second Amendment to Agreement and Plan of Merger dated as of December 31, 2014, by and among Par Petroleum Corporation, Bogey, Inc., Koko'oha Investments, Inc. and Bill D. Mills, in his capacity as the shareholder's representative. Incorporated by reference to Exhibit 10.1 to the Company's Current Report on Form 8-K filed on January 7, 2015. |
2.8 | Third Amendment to Agreement and Plan of Merger dated as of March 31, 2015, by and among the Company, Bogey, Inc., Koko’oha Investments, Inc. and Bill D. Mills, in his capacity as the shareholders’ representative. Incorporated by reference to Exhibit 2.4 to the Company’s Current Report on Form 8-K filed on April 2, 2015. |
3.1 | Restated Certificate of Incorporation of the Company dated October 20, 2015. Incorporated by reference to Exhibit 3.2 to the Company's Current Report on Form 8-K filed on October 20, 2015. |
3.2 | Second Amended and Restated Bylaws of the Company dated October 20, 2015. Incorporated by reference to Exhibit 3.3 to the Company's Current Report on Form 8-K filed on October 20, 2015. |
4.1 | Form of the Company's Common Stock Certificate. Incorporated by reference to Exhibit 4.1 to the Company's Annual Report on Form 10-K filed on March 31, 2014. |
4.2 | Registration Rights Agreement effective as of August 31, 2012, by and among the Company, Zell Credit Opportunities Master Fund, L.P., Waterstone Capital Management, L.P., Pandora Select Partners, LP, Iam Mini-Fund 14 Limited, Whitebox Multi-Strategy Partners, LP, Whitebox Credit Arbitrage Partners, LP, HFR RVA Combined Master Trust, Whitebox Concentrated Convertible Arbitrage Partners, LP and Whitebox Asymmetric Partners, LP. Incorporated by reference to Exhibit 4.3 to the Company's Current Report on Form 8-K filed on September 7, 2012. |
4.3 | Warrant Issuance Agreement dated as of August 31, 2012, by and among the Company and WB Delta, Ltd., Waterstone Offshore ER Fund, Ltd., Prime Capital Master SPC, GOT WAT MAC Segregated Portfolio, Waterstone Market Neutral MAC51, Ltd., Waterstone Market Neutral Master Fund, Ltd., Waterstone MF Fund, Ltd., Nomura Waterstone Market Neutral Fund, ZCOF Par Petroleum Holdings, L.L.C. and Highbridge International, LLC. Incorporated by reference to Exhibit 4.4 to the Company's Current Report on Form 8-K filed on September 7, 2012. |
66
4.4 | Form of Common Stock Purchase Warrant dated as of June 4, 2012. Incorporated by reference to Exhibit 4.5 to the Company's Current Report on Form 8-K filed on September 7, 2012. |
4.5 | Par Petroleum Corporation 2012 Long Term Incentive Plan. Incorporated by reference to Exhibit 4.1 to the Company's Registration Statement on Form S-8 filed on December 21, 2012. |
4.6 | Registration Rights Agreement dated as of September 25, 2013, by and among the Company and the Purchasers party thereto. Incorporated by reference to Exhibit 4.1 to the Company's Current Report on Form 8-K filed on September 27, 2013. |
4.7 | Form of Par Petroleum Corporation Shareholder Subscription Rights Certificate. Incorporated by reference to Exhibit 4.1 to the Company's Current Report on Form 8-K filed on July 22, 2014. |
4.8 | Stockholders Agreement dated April 10, 2015. Incorporated by reference to Exhibit 4.1 to the Company’s Current Report on Form 8-K filed on April 13, 2015. |
4.9 | Amendment to Par Pacific Holdings, Inc. 2012 Long Term Incentive Plan. * |
10.1 | Delayed Draw Term Loan and Bridge Loan Credit Agreement dated as of July 11, 2014, by and among the Company, the Guarantors party thereto, the Lenders party thereto and Jefferies Finance LLC, as administrative agent for the Lenders. Incorporated by reference to Exhibit 10.1 to the Company’s Current Report on Form 8-K filed on July 14, 2014. |
10.2 | First Amendment to Delayed Draw Term Loan and Bridge Loan Credit Agreement dated as of July 28, 2014, by and among the Company, the Guarantors party thereto, the Lenders party thereto and Jefferies Finance LLC, as administrative agent for the Lenders. Incorporated by reference to Exhibit 10.1 to the Company’s Current Report on Form 8-K filed on July 28, 2014. |
10.3 | Second Amendment to Delayed Draw Term Loan and Bridge Loan Credit Agreement dated as of September 10, 2014, by and among the Company, the Guarantors party thereto, the Lenders party thereto and Jefferies Finance LLC, as administrative agent for the Lenders. Incorporated by reference to Exhibit 10.1 to the Company’s Current Report on Form 8-K filed on September 10, 2014. |
10.4 | Third Amended and Restated Limited Liability Company Agreement of Laramie Energy, LLC dated February 22, 2016, by and among Laramie Energy II, LLC, Par Piceance Energy Equity LLC and the other members party thereto. * |
10.5 | Credit Agreement dated as of June 4, 2012 among Piceance Energy, LLC, the financial institutions party thereto, JPMorgan Chase Bank, N.A., as administrative agent and Wells Fargo Bank, National Association, as syndication agent. Incorporated by reference to Exhibit 10.3 to the Company’s Current Report on Form 8-K filed on September 7, 2012. |
10.6 | First Amendment to Credit Agreement dated August 31, 2012, by and among Piceance Energy, LLC, the financial institutions party thereto and JPMorgan Chase Bank, N.A. Incorporated by reference to Exhibit 10.4 to the Company’s Current Report on Form 8-K filed on September 7, 2012. |
10.7 | Delta Petroleum General Recovery Trust Agreement dated August 27, 2012, by and among the company, DPCA LLC, Delta Exploration company, Inc., Delta Pipeline, LLC, DLC, Inc., CEC, Inc., Castle Texas Production Limited. Partnership, Amber Resources company of Colorado, Castle Exploration company, Inc. and John T. Young. Incorporated by reference to Exhibit 10.6 to the Company’s Current Report on Form 8-K filed on September 7, 2012. |
10.8 | Pledge Agreement dated August 31, 2012, by Par Piceance Energy Equity LLC in favor of Jefferies Finance LLC. Incorporated by reference to Exhibit 10.7 to the Company’s Current Report on Form 8-K filed on September 7, 2012. |
10.9 | Intercreditor Agreement dated August 31, 2012, by and among JP Morgan Chase Bank, N.A., as administrative agent for the First Priority Secured Parties (as defined therein), Jefferies Finance LLC, as administrative agent for the Second Priority Secured Parties (as defined therein), the Company and Par Piceance Energy Equity LLC. Incorporated by reference to Exhibit 10.8 to the Company’s Current Report on Form 8-K filed on September 7, 2012. |
10.10 | Pledge and Security Agreement, dated August 31, 2012, by the company and certain of its subsidiaries in favor of Jefferies Finance LLC. Incorporated by reference to Exhibit 10.9 to the Company’s Current Report on Form 8-K filed on September 7, 2012. |
10.11 | Form of Indemnification Agreement between the company and its Directors and Executive Officers. Incorporated by reference to Exhibit 10.1 to the Company’s Current Report on Form 8-K filed on October 19, 2012.*** |
67
10.12 | Letter Agreement dated as of September 17, 2013 but effective as of January 1, 2013, by and between Equity Group Investments and the company. Incorporated by reference to Exhibit 10.17 to the Company’s Quarterly Report on Form 10-Q filed on November 14, 2013. |
10.13 | Framework Agreement dated as of September 25, 2013, by and among Hawaii Pacific Energy, LLC, Tesoro Hawaii, LLC and Barclays Bank PLC. Incorporated by reference to Exhibit 10.1 to the Company’s Quarterly Report on Form 8-K filed on September 27, 2013. |
10.14 | Storage and Services Agreement dated as of September 25, 2013, by and among Tesoro Hawaii, LLC and Barclays Bank PLC. Incorporated by reference to Exhibit 10.2 to the Company’s Current Report on Form 8-K filed on September 27, 2013. |
10.15 | Agency and Advisory Agreement dated as of September 25, 2013, by and among Tesoro Hawaii, LLC and Barclays Bank PLC. Incorporated by reference to Exhibit 10.3 to the Company’s Current Report on Form 8-K filed on September 27, 2013. |
10.16 | Inventory First Lien Security Agreement dated as of September 25, 2013, by and among Tesoro Hawaii, LLC and Wells Fargo Bank, N.A, as inventory collateral agent. Incorporated by reference to Exhibit 10.4 to the Company’s Current Report on Form 8-K filed on September 27, 2013. |
10.17 | First Lien Mortgage dated as of September 25, 2013, by and among Tesoro Hawaii, LLC and Wells Fargo Bank, N.A, as inventory collateral agent. Incorporated by reference to Exhibit 10.5 to the Company’s Current Report on Form 8-K filed on September 27, 2013. |
10.18 | Intercreditor Agreement dated as of September 25, 2013, by and among Barclays Bank PLC, Wells Fargo Bank, N.A, as inventory collateral agent, Deutsche Bank AG New York Branch, as ABL loan collateral agent and as administrative agent pursuant to the ABL Credit Agreement, Hawaii Pacific Energy, LLC and Tesoro Hawaii, LLC. Incorporated by reference to Exhibit 10.6 to the Company’s Current Report on Form 8-K filed on September 27, 2013. |
10.19 | Membership Interests First Lien Pledge Agreement dated as of September 25, 2013, by and between Hawaii Pacific Energy, LLC and Wells Fargo Bank, N.A, as inventory collateral agent. Incorporated by reference to Exhibit 10.7 to the Company’s Current Report on Form 8-K filed on September 27, 2013. |
10.20 | ABL Credit Agreement dated as of September 25, 2013, by and among Tesoro Hawaii, LLC and other borrowers party thereto, Hawaii Pacific Energy, LLC, the Lenders party thereto and Deutsche Bank AG New York Branch, as administrative agent and ABL loan collateral agent. Incorporated by reference to Exhibit 10.9 to the Company’s Current Report on Form 8-K filed on September 27, 2013. |
10.21 | ABL Loan Second Lien Security Agreement dated as of September 25, 2013, by and between Tesoro Hawaii, LLC and Wells Fargo Bank, National Association, as inventory collateral agent. Incorporated by reference to Exhibit 10.10 to the Company’s Current Report on Form 8-K filed on September 27, 2013. |
10.22 | ABL Loan First Lien Security Agreement dated as of September 25, 2013, by and between Tesoro Hawaii, LLC and Deutsche Bank AG New York Branch, as ABL loan collateral agent. Incorporated by reference to Exhibit 10.11 to the Company’s Current Report on Form 8-K filed on September 27, 2013. |
10.23 | Second Lien Mortgage dated as of September 25, 2013, by and between Tesoro Hawaii, LLC and Deutsche Bank AG New York Branch, as collateral agent. Incorporated by reference to Exhibit 10.12 to the Company’s Current Report on Form 8-K filed on September 27, 2013. |
10.24 | Membership Interests Second Lien Pledge Agreement dated as of September 25, 2013, by and between Hawaii Pacific Energy, LLC and Deutsche Bank AG New York Branch, as ABL loan collateral agent. Incorporated by reference to Exhibit 10.13 to the Company’s Current Report on Form 8-K filed on September 27, 2013. |
10.25 | Inventory Second Lien Security Agreement dated as of September 25, 2013, by and between Tesoro Hawaii, LLC and Deutsche Bank AG New York Branch, as collateral agent. Incorporated by reference to Exhibit 10.14 to the Company’s Current Report on Form 8-K filed on September 27, 2013. |
10.26 | Environmental Agreement dated as of September 25, 2013, by and among Tesoro Corporation, Tesoro Hawaii, LLC and Hawaii Pacific Energy, LLC. Incorporated by reference to Exhibit 10.16 to the Company’s Quarterly Report on Form 10-Q filed on November 14, 2013. |
10.27 | Credit Agreement dated as of November 14, 2013, by and among the company, the Lenders party thereto and Bank of Hawaii, as administrative agent for the Lenders. Incorporated by reference to Exhibit 10.1 to the Company’s Current Report on Form 8-K filed on November 19, 2013. |
10.28 | Employment Offer Letter with William Monteleone dated September 25, 2013. Incorporated by reference to Exhibit 10.43 to the Company’s Amendment No. 3 to Annual Report on Form 10-K/A filed on July 2, 2014.*** |
68
10.29 | Employment Offer Letter with Christopher Micklas dated December 9, 2013***. |
10.30 | Award Notice of Restricted Stock with William Monteleone dated December 31, 2012. Incorporated by reference to Exhibit 10.46 to the Company’s Amendment No. 3 to Annual Report on Form 10-K/A filed on July 2, 2014.*** |
10.31 | Award Notice of Restricted Stock with William Monteleone dated December 31, 2013. Incorporated by reference to Exhibit 10.49 to the Company’s Amendment No. 3 to Annual Report on Form 10-K/A filed on July 2, 2014.*** |
10.32 | Award Notice of Restricted Stock with Christopher Micklas dated December 9, 2013.*** |
10.33 | Employment Offer Letter with Joseph Israel dated December 12, 2014. Incorporated by reference to Exhibit 10.1 to the Company’s Current Report on Form 8-K filed on December 17, 2014. *** |
10.34 | Award Notice of Restricted Stock with Joseph Israel dated January 5, 2015. Incorporated by reference to Exhibit 10.2 to the Company’s Current Report on Form 8-K filed on January 7, 2015.*** |
10.35 | Nonstatutory Stock Option Agreement with Joseph Israel dated January 5, 2015. Incorporated by reference to Exhibit 10.3 to the Company’s Current Report on Form 8-K filed on January 7, 2015.*** |
10.36 | Form of Subscription and Lock-Up Agreement. Incorporated by reference to Exhibit 10.1 to the Company’s Current Report on Form 8-K filed on July 11, 2014.*** |
10.37 | Form of Award of Restricted Stock (Stock Purchase Plan). Incorporated by reference to Exhibit 10.2 to the Company’s Current Report on Form 8-K filed on July 11, 2014.*** |
10.38 | Form of Nonstatutory Stock Option Agreement (Stock Purchase Plan). Incorporated by reference to Exhibit 10.3 to the Company’s Current Report on Form 8-K filed on July 11, 2014.*** |
10.39 | Par Petroleum Corporation Discretionary Long Term Incentive Plan for 2014 dated June 12, 2014. Incorporated by reference to Exhibit 10.4 to the Company’s Current Report on Form 8-K filed on July 11, 2014.*** |
10.40 | Form of Award of Restricted Stock (Discretionary Long Term Incentive Plan). Incorporated by reference to Exhibit 10.5 to the Company’s Current Report on Form 8-K filed on July 11, 2014.*** |
10.41 | Form of Award of Restricted Stock Units (Discretionary Long Term Incentive Plan). Incorporated by reference to Exhibit 10.6 to the Company’s Current Report on Form 8-K filed on July 11, 2014.*** |
10.42 | Par Petroleum Corporation NAV (Net Asset Value) Unit Plan dated June 12, 2014. Incorporated by reference to Exhibit 10.7 to the Company’s Current Report on Form 8-K filed on July 11, 2014.*** |
10.43 | Form of NAV Units Plan Award. Incorporated by reference to Exhibit 10.8 to the Company’s Current Report on Form 8-K filed on July 11, 2014.*** |
10.44 | Par Petroleum Corporation Directors’ Deferred Compensation Plan dated June 12, 2014. Incorporated by reference to Exhibit 10.9 to the Company’s Current Report on Form 8-K filed on July 11, 2014.*** |
10.45 | Deferral Election Form. Incorporated by reference to Exhibit 10.10 to the Company’s Current Report on Form 8-K filed on July 11, 2014.*** |
10.46 | Amended and Restated Uncommitted Credit Agreement dated as of February 20, 2015, by and among Texadian Energy, Inc., Texadian Energy Canada Limited, BNP Paribas and the other lenders from time to time party thereto and BNP Paribas, as the administrative agent and collateral agent for the lenders and as an issuing bank, daylight overdraft bank and swing line lender. Incorporated by reference to Exhibit 10.10 to the Company’s Current Report on Form 8-K filed on February 25, 2015. |
10.47 | Third Amendment to Delayed Draw Term Loan and Bridge Credit Agreement dated as of March 11, 2015, by and among the Company, the Guarantors party thereto, the Term Lenders party thereto and Jefferies Finance LLC, as administrative agent for the Lenders. Incorporated by reference to Exhibit 10.1 to the Company’s Current Report on Form 8-K filed on March 11, 2015. |
10.48 | Credit Agreement dated as of April 1, 2015, by and among Koko’oha Investments, Inc., Mid Pac Petroleum, LLC, Bank of Hawaii and the other lenders party thereto, and Bank of Hawaii, as administrative agent. Incorporated by reference to Exhibit 10.1 to the Company’s Current Report on Form 8-K filed on April 2, 2015. |
10.49 | Pledge Agreement dated as of April 1, 2015, by Hawaii Pacific Energy, LLC in favor of Jefferies Finance LLC. Incorporated by reference to Exhibit 10.2 to the Company’s Current Report on Form 8-K filed on April 2, 2015. |
69
10.50 | Limited Recourse Guaranty dated as of April 1, 2015, by Hawaii Pacific Energy, LLC. Incorporated by reference to Exhibit 10.3 to the Company’s Current Report on Form 8-K filed on April 2, 2015. |
10.51 | Fourth Amendment to Delayed Draw Term Loan and Bridge Loan Credit Agreement dated as of April 1, 2015, by and among the Company, the Guarantors party thereto, the Term Lenders party thereto and Jefferies Finance LLC, as administrative agent for the lenders. Incorporated by reference to Exhibit 10.4 to the Company’s Current Report on Form 8-K filed on April 2, 2015. |
10.52 | Second Amendment and Waiver to ABL Credit Agreement dated as of March 30, 2015, by and among Hawaii Independent Energy, LLC, Hawaii Pacific Energy, LLC, the Lenders party thereto and Deutsche Bank AG New York Branch, as administrative agent and collateral agent for the Lenders. Incorporated by reference to Exhibit 10.5 to the Company’s Current Report on Form 8-K filed on April 2, 2015. |
10.53 | First Amendment to Credit Agreement dated as of March 30, 2015 among HIE Retail, LLC, Bank of Hawaii, American Savings Bank, F.S.B. and Central Pacific Bank, and Bank of Hawaii, as administrative and collateral agent for the Lenders. Incorporated by reference to Exhibit 10.6 to the Company’s Current Report on Form 8-K filed on April 2, 2015. |
10.54 | Form of Award of Restricted Stock (Discretionary Long Term Incentive Plan). Incorporated by reference to Exhibit 10.2 to the Company’s Current Report on Form 8-K filed on April 2, 2015. *** |
10.55 | Form of Award of Restricted Stock Units (Discretionary Long Term Incentive Plan). Incorporated by reference to Exhibit 10.3 to the Company’s Current Report on Form 8-K filed on April 2, 2015. *** |
10.56 | Form of Nonstatutory Stock Option Agreement (Discretionary Long Term Incentive Plan). Incorporated by reference to Exhibit 10.4 to the Company’s Current Report on Form 8-K filed on April 2, 2015. *** |
10.57 | Termination of Stockholders Agreement dated April 10, 2015 by and among Par Petroleum Corporation, Zell Credit Opportunities Fund, L.P., ZCOF Par Petroleum Holdings, LLC, Pandora Select Partners, LP, Whitebox Multi-Strategy Partners, LP, Whitebox Credit Arbitrage Partners, LP, Whitebox Concentrated Convertible Arbitrage Partners, LP, and Whitebox Asymmetric Partners, LP. Incorporated by reference to Exhibit 10.1 to the Company’s Current Report on Form 8-K filed on April 13, 2015. |
10.58 | Par Petroleum (and subsidiaries) Incentive Compensation Plan. Incorporated by reference to Exhibit 10.1 to the Company’s Current Report on Form 8-K filed on May 12, 2015. *** |
10.59 | Letter Agreement dated as of December 30, 2014, among HIE Retail, LLC, Bank of Hawaii, American Savings Bank, F.S.B. and Central Pacific Bank. Incorporated by reference to Exhibit 10.1 to the Company’s Current Report on Form 8-K filed May 15, 2015. |
10.60 | Second Amendment to Credit Agreement dated as of May 15, 2015, among HIE Retail, LLC, Hawaii Pacific Energy, LLC, Bank of Hawaii, American Savings Bank, F.S.B. and Central Pacific Bank, and Bank of Hawaii, as administrative and collateral agent for the Lenders. Incorporated by reference to Exhibit 10.2 to the Company’s Current Report on Form 8-K filed May 15, 2015. |
10.61 | Supply and Offtake Agreement dated as of June 1, 2015, between Hawaii Independent Energy, LLC and J. Aron & Company. Incorporated by reference to Exhibit 10.1 to the Company’s Current Report on Form 8-K filed June 2, 2015. |
10.62 | Storage Facilities Agreement dated as of June 1, 2015, between Hawaii Independent Energy, LLC and J. Aron & Company. Incorporated by reference to Exhibit 10.2 to the Company’s Current Report on Form 8-K filed June 2, 2015. |
10.63 | Marketing and Sales Agreement dated as of June 1, 2015, between Hawaii Independent Energy, LLC and J. Aron & Company. Incorporated as Exhibit 10.3 to the Company’s Current Report on Form 8-K filed June 2, 2015. |
10.64 | Pledge and Security Agreement dated as of June 1, 2015, between Hawaii Independent Energy, LLC and J. Aron & Company. Incorporated by reference to Exhibit 10.4 to the Company’s Current Report on Form 8-K filed June 2, 2015. |
10.65 | Equity Pledge Agreement dated as of June 1, 2015, between Hawaii Pacific Energy, LLC and J. Aron & Company. Incorporated by reference to Exhibit 10.5 to the Company’s Current Report on Form 8-K filed June 2, 2015. |
70
10.66 | Mortgage, Assignment of Leases and Rents, Security Agreement and Fixture Filing dated as of June 1, 2015, by Hawaii Independent Energy, LLC for the benefit of J. Aron & Company. Incorporated by reference to Exhibit 10.6 to the Company’s Current Report on Form 8-K filed June 2, 2015. |
10.67 | Environmental Indemnity Agreement dated as of June 1, 2015, by Hawaii Independent Energy, LLC in favor of J. Aron & Company. Incorporated by reference to Exhibit 10.7 to the Company’s Current Report on Form 8-K filed June 2, 2015. |
10.68 | Fifth Amendment to Delayed Draw Term Loan and Bridge Loan Credit Agreement dated as of June 1, 2015, by and among of Par Petroleum Corporation, the Guarantors party thereto, the Term Lenders party thereto and Jefferies Finance LLC, as administrative agent for the lenders. Incorporated by reference to Exhibit 10.8 to the Company’s Current Report on Form 8-K filed June 2, 2015. |
10.69 | Employment Offer Letter with William C. Pate dated October 12, 2015. Incorporated by reference to Exhibit 10.1 to the Company's Current Report on Form 8-K filed October 14, 2015. *** |
10.70 | Initial Award with William C. Pate dated October 12, 2015. Incorporated by reference to Exhibit 10.2 to the Company's Current Report on Form 8-K filed October 14, 2015. *** |
10.71 | Amendment to Employment Offer Letter with Joseph Israel dated October 12, 2015. Incorporated by reference to Exhibit 10.3 to the Company's Current Report on Form 8-K filed October 14, 2015. *** |
10.72 | Credit Agreement, dated as of December 17, 2015, among Mid Pac Petroleum, LLC, HIE Retail, LLC, the Subsidiary Guarantors party thereto, the lending institutions named therein, and KeyBank National Association, as the administrative agent and as a letter of credit issuer. Incorporated by reference to Exhibit 10.1 to the Company’s Current Report on Form 8-K filed on December 18, 2015. |
10.73 | Sixth Amendment to Delayed Draw Term Loan and Bridge Loan Credit Agreement dated as of December 17, 2015, among Par Pacific Holdings, Inc., the Guarantors party thereto, the Term Lenders party thereto and Jefferies Finance LLC, as administrative agent for the lenders. Incorporated by reference to Exhibit 10.2 to the Company’s Current Report on Form 8-K filed on December 18, 2015. |
10.74 | Unit Purchase Agreement dated February 22, 2016, by and among Laramie Energy, LLC, Par Piceance Energy Equity LLC, and the other parties thereto. * |
10.75 | Equity Commitment Letter dated December 17, 2015, by and between Par Pacific Holdings, Inc. and Piceance Energy, LLC. * |
14.1 | Par Pacific Holdings, Inc. Code of Business Conduct and Ethics for Employees, Executive Officers and Directors, effective December 3, 2015. * |
21.1 | Subsidiaries of the Registrant.* |
23.1 | Consent of Deloitte & Touche LLP* |
23.2 | Consent of EKS&H LLLP* |
23.3 | Consent of Netherland, Sewell & Associates, Inc.* |
23.4 | Consent of Deloitte & Touche LLP related to the financial statements of Laramie Energy, LLC as of and for the year ended December 31, 2015. * |
31.1 | Certification of Chief Executive Officer Pursuant to Section 302 of the Sarbanes-Oxley Act of 2002. * |
31.2 | Certification of Chief Financial Officer Pursuant to Section 302 of the Sarbanes-Oxley Act of 2002. * |
32.1 | Certification of Chief Executive Officer Pursuant to 18 U.S.C. Section 1350.* |
32.2 | Certification of Chief Financial Officer Pursuant to 18 U.S.C. Section 1350. * |
99.1 | Report of Netherland, Sewell & Associates, Inc. regarding the registrants Proved Reserves as of December 31, 2015.* |
99.2 | Laramie Energy, LLC Financial Statements and Independent Auditors' Report, for the fiscal years ended December 31, 2015, 2014, and 2013. * |
101.INS | XBRL Instance Document.** |
71
101.SCH | XBRL Taxonomy Extension Schema Documents.** |
101.CAL | XBRL Taxonomy Extension Calculation Linkbase Document.** |
101.LAB | XBRL Taxonomy Extension Label Linkbase Document.** |
101.PRE | XBRL Taxonomy Extension Presentation Linkbase Document.** |
101.DEF | XBRL Taxonomy Extension Definition Linkbase Document.** |
* Filed herewith. Schedules and similar attachments to Exhibits 10.4 and 10.74 have been omitted pursuant to Item 601(b)(2) of Regulation S-K. The Company will furnish supplementally a copy of any omitted schedule or similar attachment to the Securities and Exchange Commission upon request.
** These interactive data files are furnished and deemed not filed or part of a registration statement or prospectus for purposes of Sections 11 or 12 of the Securities Act of 1933, as amended, are deemed not filed for purposes of Section 18 of the Securities Exchange Act of 1934, as amended and otherwise are not subject to liability under those sections.
*** Management contract or compensatory plan or arrangement.
72
PAR PACIFIC HOLDINGS, INC. AND SUBSIDIARIES
INDEX TO CONSOLIDATED FINANCIAL STATEMENTS
For the Years Ended December 31, 2015, 2014 and 2013
Page No. | |
Reports of Independent Registered Public Accounting Firms | |
Consolidated Balance Sheets | |
Consolidated Statements of Operations | |
Consolidated Statements of Comprehensive Loss | |
Consolidated Statements of Cash Flows | |
Consolidated Statements of Changes in Stockholders’ Equity | |
Notes to Consolidated Financial Statements | |
F-1
REPORT OF INDEPENDENT REGISTERED PUBLIC ACCOUNTING FIRM
To the Board of Directors and Stockholders of
Par Pacific Holdings, Inc.
Houston, Texas
We have audited the accompanying consolidated balance sheets of Par Pacific Holdings, Inc. (formerly Par Petroleum Corporation) and subsidiaries (the "Company") as of December 31, 2015 and 2014 and the related consolidated statements of operations, comprehensive loss, changes in stockholders’ equity and cash flows for each of the three years in the period ended December 31, 2015. These financial statements are the responsibility of the Company's management. Our responsibility is to express an opinion on the financial statements based on our audits. We did not audit the financial statements of Laramie Energy, LLC, an equity method investee of the Company, as of December 31, 2014 and for the years ended December 31, 2014 and 2013. The Company’s investment in Laramie Energy, LLC constituted 14% of consolidated total assets as of December 31, 2014 and the Company’s interest in the net income (loss) of Laramie Energy, LLC constituted 6% and 4% of consolidated net loss for the years ended December 31, 2014 and 2013, respectively. The financial statements of Laramie Energy, LLC as of December 31, 2014 and for the years ended December 31, 2014 and 2013 were audited by other auditors whose report has been furnished to us and our opinion, insofar as it relates to the amounts included for Laramie Energy, LLC, is based solely on the report of the other auditors.
We conducted our audits in accordance with the standards of the Public Company Accounting Oversight Board (United States). Those standards require that we plan and perform the audit to obtain reasonable assurance about whether the financial statements are free of material misstatement. An audit includes examining, on a test basis, evidence supporting the amounts and disclosures in the financial statements. An audit also includes assessing the accounting principles used and significant estimates made by management, as well as evaluating the overall financial statement presentation. We believe that our audits and the report of the other auditors provide a reasonable basis for our opinion.
In our opinion, based on our audits and the report of the other auditors, such consolidated financial statements present fairly, in all material respects, the financial position of Par Pacific Holdings, Inc. and subsidiaries as of December 31, 2015 and 2014 and the results of their operations and their cash flows for each of the three years in the period ended December 31, 2015, in conformity with accounting principles generally accepted in the United States of America.
We have also audited, in accordance with the standards of the Public Company Accounting Oversight Board (United States), the Company's internal control over financial reporting as of December 31, 2015, based on the criteria established in Internal Control - Integrated Framework (2013) issued by the Committee of Sponsoring Organizations of the Treadway Commission and our report dated March 3, 2016 expressed an unqualified opinion on the Company's internal control over financial reporting.
/s/ DELOITTE & TOUCHE LLP
Houston, Texas
March 3, 2016
F-2
Report of Independent Registered Public Accounting Firm
To the Members of
Laramie Energy, LLC
Denver, Colorado
We have audited the balance sheet of Laramie Energy, LLC (formerly Piceance Energy, LLC) (the “Company”) as of December 31, 2014, and the related statements of operations, members’ equity, and cash flows for each of the two years in the period ended December 31, 2014, and the related notes to the financial statements. These financial statements are the responsibility of the Company’s management. Our responsibility is to express an opinion on these financial statements based on our audit.
We conducted our audit in accordance with the standards of the Public Company Accounting Oversight Board (United States). Those standards require that we plan and perform the audit to obtain reasonable assurance about whether the financial statements are free of material misstatement. The Company is not required to have, nor were we engaged to perform, an audit of its internal control over financial reporting. Our audit included consideration of internal control over financial reporting as a basis for designing audit procedures that are appropriate in the circumstances, but not for the purpose of expressing an opinion on the effectiveness of the Company’s internal control over financial reporting. Accordingly, we express no such opinion. An audit also includes examining, on a test basis, evidence supporting the amounts and disclosures in the financial statements, assessing the accounting principles used and significant estimates made by management, as well as evaluating the overall financial statement presentation. We believe that our audit provides a reasonable basis for our opinion.
In our opinion, the financial statements referred to above present fairly, in all material respects, the financial position of Laramie Energy, LLC as of December 31, 2014 and the results of its operations and its cash flows for each of the two years in the period ended December 31, 2014 in conformity with accounting principles generally accepted in the United States of America.
/s/ EKS&H LLLP
EKS&H LLLP
February 27, 2015, except for Note 1, as to which the date is February 26, 2016
Denver, Colorado
F-3
PAR PACIFIC HOLDINGS, INC. AND SUBSIDIARIES
CONSOLIDATED BALANCE SHEETS
(in thousands, except share amounts)
December 31, 2015 | December 31, 2014 | ||||||
ASSETS | |||||||
Current assets | |||||||
Cash and cash equivalents | $ | 167,788 | $ | 89,210 | |||
Restricted cash | 748 | 749 | |||||
Trade accounts receivable | 68,342 | 111,953 | |||||
Inventories | 219,437 | 243,853 | |||||
Prepaid and other current assets | 75,437 | 15,024 | |||||
Total current assets | 531,752 | 460,789 | |||||
Property and equipment | |||||||
Property, plant and equipment | 220,863 | 123,323 | |||||
Proved oil and gas properties, at cost, successful efforts method of accounting | 1,122 | 1,122 | |||||
Total property and equipment | 221,985 | 124,445 | |||||
Less accumulated depreciation and depletion | (26,845 | ) | (11,510 | ) | |||
Property and equipment, net | 195,140 | 112,935 | |||||
Long-term assets | |||||||
Investment in Laramie Energy, LLC | 76,203 | 104,657 | |||||
Intangible assets, net | 34,368 | 7,506 | |||||
Goodwill | 41,327 | 20,786 | |||||
Other long-term assets | 13,471 | 28,563 | |||||
Total assets | $ | 892,261 | $ | 735,236 | |||
LIABILITIES AND STOCKHOLDERS’ EQUITY | |||||||
Current liabilities | |||||||
Current maturities of long-term debt | $ | 11,000 | $ | 29,100 | |||
Obligations under inventory financing agreements | 237,709 | 197,394 | |||||
Accounts payable | 27,428 | 33,064 | |||||
Current portion of contingent consideration | 19,880 | — | |||||
Other accrued liabilities | 69,023 | 51,248 | |||||
Total current liabilities | 365,040 | 310,806 | |||||
Long-term liabilities | |||||||
Long-term debt, net of current maturities | 154,212 | 101,739 | |||||
Common stock warrants | 8,096 | 12,123 | |||||
Contingent consideration | 7,701 | 9,131 | |||||
Long-term capital lease obligations | 1,175 | 1,295 | |||||
Other liabilities | 15,426 | 7,983 | |||||
Total liabilities | 551,650 | 443,077 | |||||
Commitments and contingencies (Note 14) | |||||||
Stockholders’ equity | |||||||
Preferred stock, $0.01 par value: 3,000,000 shares authorized, none issued | — | — | |||||
Common stock, $0.01 par value; 500,000,000 shares authorized at December 31, 2015 and 2014, 41,009,924 shares and 37,068,886 shares issued at December 31, 2015 and 2014, respectively | 410 | 371 | |||||
Additional paid-in capital | 515,165 | 427,287 | |||||
Accumulated deficit | (174,964 | ) | (135,053 | ) | |||
Accumulated other comprehensive loss | — | (446 | ) | ||||
Total stockholders’ equity | 340,611 | 292,159 | |||||
Total liabilities and stockholders’ equity | $ | 892,261 | $ | 735,236 | |||
See accompanying notes to consolidated financial statements.
F-4
PAR PACIFIC HOLDINGS, INC. AND SUBSIDIARIES
CONSOLIDATED STATEMENTS OF OPERATIONS
(in thousands, except per share amounts)
Year Ended December 31, | |||||||||||
2015 | 2014 | 2013 | |||||||||
Revenues | $ | 2,066,337 | $ | 3,108,025 | $ | 886,014 | |||||
Operating expenses | |||||||||||
Cost of revenues | 1,787,368 | 2,937,472 | 857,066 | ||||||||
Operating expense, excluding depreciation, depletion and amortization expense | 136,338 | 140,900 | 27,251 | ||||||||
Lease operating expense | 5,283 | 5,673 | 5,676 | ||||||||
Depreciation, depletion and amortization | 19,918 | 14,897 | 5,982 | ||||||||
Impairment expense | 9,639 | — | — | ||||||||
Loss (gain) on sale of assets, net | — | 624 | (50 | ) | |||||||
Trust litigation and settlements | — | — | 6,206 | ||||||||
General and administrative expense | 44,271 | 34,304 | 21,494 | ||||||||
Acquisition and integration expense | 2,006 | 11,687 | 9,794 | ||||||||
Total operating expenses | 2,004,823 | 3,145,557 | 933,419 | ||||||||
Operating income (loss) | 61,514 | (37,532 | ) | (47,405 | ) | ||||||
Other income (expense) | |||||||||||
Interest expense and financing costs, net | (20,156 | ) | (17,995 | ) | (13,285 | ) | |||||
Loss on termination of financing agreements | (19,669 | ) | (1,788 | ) | (6,141 | ) | |||||
Other income (expense), net | (291 | ) | (312 | ) | 758 | ||||||
Change in value of common stock warrants | (3,664 | ) | 4,433 | (10,159 | ) | ||||||
Change in value of contingent consideration | (18,450 | ) | 2,849 | — | |||||||
Equity earnings (losses) from Laramie Energy, LLC | (55,983 | ) | 2,849 | (2,941 | ) | ||||||
Total other income (expense), net | (118,213 | ) | (9,964 | ) | (31,768 | ) | |||||
Loss before income taxes | (56,699 | ) | (47,496 | ) | (79,173 | ) | |||||
Income tax benefit | 16,788 | 455 | — | ||||||||
Net loss | $ | (39,911 | ) | $ | (47,041 | ) | $ | (79,173 | ) | ||
Loss per share | |||||||||||
Basic | $ | (1.06 | ) | $ | (1.44 | ) | $ | (4.01 | ) | ||
Diluted | $ | (1.06 | ) | $ | (1.44 | ) | $ | (4.01 | ) | ||
Weighted-average number of shares outstanding | |||||||||||
Basic | 37,678 | 32,739 | 19,740 | ||||||||
Diluted | 37,678 | 32,739 | 19,740 | ||||||||
See accompanying notes to consolidated financial statements.
F-5
PAR PACIFIC HOLDINGS, INC. AND SUBSIDIARIES
CONSOLIDATED STATEMENTS OF COMPREHENSIVE LOSS
(in thousands)
Year Ended December 31, | |||||||||||
2015 | 2014 | 2013 | |||||||||
Net loss | $ | (39,911 | ) | $ | (47,041 | ) | $ | (79,173 | ) | ||
Other comprehensive income (loss): | |||||||||||
Reclassification of other post-retirement benefits loss to net income | 1,082 | — | |||||||||
Other post-retirement benefits loss | (636 | ) | (446 | ) | — | ||||||
Total other comprehensive income (loss) | 446 | (446 | ) | ||||||||
Comprehensive loss | $ | (39,465 | ) | $ | (47,487 | ) | $ | (79,173 | ) | ||
See accompanying notes to consolidated financial statements.
F-6
PAR PACIFIC HOLDINGS, INC. AND SUBSIDIARIES
CONSOLIDATED STATEMENTS OF CASH FLOWS
(in thousands)
Year Ended December 31, | |||||||||||
2015 | 2014 | 2013 | |||||||||
Cash flows from operating activities: | |||||||||||
Net loss | $ | (39,911 | ) | $ | (47,041 | ) | $ | (79,173 | ) | ||
Adjustments to reconcile net income (loss) to cash provided by (used in) operating activities: | |||||||||||
Depreciation, depletion and amortization | 19,918 | 14,897 | 5,982 | ||||||||
Impairment expense | 9,639 | — | — | ||||||||
Loss on termination of financing agreements | 19,669 | 1,788 | 6,141 | ||||||||
Gain on termination of other post-retirement benefits | (5,550 | ) | — | — | |||||||
Non-cash interest expense | 12,449 | 13,470 | 10,601 | ||||||||
Change in value of common stock warrants | 3,664 | (4,433 | ) | 10,159 | |||||||
Change in value of contingent consideration | 18,450 | (2,849 | ) | — | |||||||
Deferred taxes | (16,489 | ) | (257 | ) | 179 | ||||||
Loss (gain) on sale of assets, net | — | 624 | (50 | ) | |||||||
Stock-based compensation | 5,165 | 3,970 | 1,161 | ||||||||
Unrealized loss (gain) on derivative contracts | 10,896 | (1,015 | ) | — | |||||||
Equity (earnings) losses from Laramie Energy, LLC | 55,983 | (2,849 | ) | 2,941 | |||||||
Net changes in operating assets and liabilities: | |||||||||||
Trade accounts receivable | 54,529 | 5,608 | (40,278 | ) | |||||||
Collateral posted with broker for derivative transactions | (20,927 | ) | — | — | |||||||
Prepaid and other assets | (35,697 | ) | (5,966 | ) | (2,569 | ) | |||||
Inventories | 31,913 | 61,529 | 69,211 | ||||||||
Obligations under inventory financing agreements | 34,845 | (112,884 | ) | (38,999 | ) | ||||||
Accounts payable and other accrued liabilities | (26,188 | ) | 20,804 | 19,017 | |||||||
Net cash provided by (used in) operating activities | 132,358 | (54,604 | ) | (35,677 | ) | ||||||
Cash flows from investing activities | |||||||||||
Acquisition of Par Hawaii, Inc., net of cash acquired | (64,331 | ) | (10,000 | ) | — | ||||||
Capital expenditures | (22,345 | ) | (14,300 | ) | (7,768 | ) | |||||
Proceeds from sale of assets | — | 595 | 2,850 | ||||||||
Acquisition of Par Hawaii Refining, LLC, including working capital settlement | — | (582 | ) | (559,279 | ) | ||||||
Investment in Laramie Energy, LLC | (27,529 | ) | (12 | ) | (303 | ) | |||||
Net cash used in investing activities | (114,205 | ) | (24,299 | ) | (564,500 | ) | |||||
Cash flows from financing activities | |||||||||||
Proceeds from sale of common stock, net of offering costs | 76,056 | 103,949 | 199,170 | ||||||||
Proceeds from exercise of common stock warrants | 39 | 5 | 18 | ||||||||
Proceeds from borrowings | 208,158 | 363,620 | 159,800 | ||||||||
Repayments of borrowings | (227,212 | ) | (331,530 | ) | (121,909 | ) | |||||
Net repayments on deferred payment arrangement | (1,436 | ) | — | — | |||||||
Payment of deferred loan costs | (7,335 | ) | (6,045 | ) | (2,264 | ) | |||||
Purchase of common stock for retirement | (1,034 | ) | — | — | |||||||
Proceeds from inventory financing agreements | 271,000 | — | 378,238 | ||||||||
Payments for termination of supply and exchange agreements | (257,811 | ) | — | — | |||||||
Restricted cash released | — | 53 | 19,000 | ||||||||
Net cash provided by financing activities | 60,425 | 130,052 | 632,053 | ||||||||
Net increase in cash and cash equivalents | 78,578 | 51,149 | 31,876 | ||||||||
Cash and cash equivalents at beginning of period | 89,210 | 38,061 | 6,185 | ||||||||
Cash and cash equivalents at end of period | $ | 167,788 | $ | 89,210 | $ | 38,061 | |||||
Supplemental cash flow information: | |||||||||||
Cash received (paid) for: | |||||||||||
Interest | $ | (6,891 | ) | $ | (4,526 | ) | $ | (2,186 | ) | ||
Taxes | 402 | 243 | — | ||||||||
Non-cash investing and financing activities | |||||||||||
Accrued capital expenditures | $ | 2,102 | $ | 2,328 | $ | — | |||||
Stock issued used to settle bankruptcy claims | — | 2,677 | 2,605 | ||||||||
Value of warrants reclassified to equity | 7,691 | 786 | 3,741 | ||||||||
F-7
PAR PACIFIC HOLDINGS, INC. AND SUBSIDIARIES
CONSOLIDATED STATEMENTS OF CHANGES IN STOCKHOLDERS’ EQUITY
(in thousands)
Accumulated | ||||||||||||||||||||||
Additional | Other | |||||||||||||||||||||
Common Stock | Paid-In | Accumulated | Comprehensive | Total | ||||||||||||||||||
Shares | Amount | Capital | Deficit | Loss | Equity | |||||||||||||||||
Balance, January 1, 2013 | 15,008 | $ | 150 | $ | 109,446 | $ | (8,839 | ) | $ | — | $ | 100,757 | ||||||||||
Issuance of common stock, net of offering costs of $830 thousand | 14,388 | 144 | 199,026 | — | — | 199,170 | ||||||||||||||||
Bankruptcy claim settlements | 209 | 2 | 2,603 | — | — | 2,605 | ||||||||||||||||
Exercise of common stock warrants | 184 | 2 | 3,739 | — | — | 3,741 | ||||||||||||||||
Stock-based compensation | 362 | 3 | 1,161 | — | — | 1,164 | ||||||||||||||||
Net loss | — | — | — | (79,173 | ) | — | (79,173 | ) | ||||||||||||||
Balance, December 31, 2013 | 30,151 | 301 | 315,975 | (88,012 | ) | — | 228,264 | |||||||||||||||
Reverse stock split | — | 1 | (1 | ) | — | — | — | |||||||||||||||
Issuance of common stock, net of offering costs of $237 thousand | 6,525 | 65 | 103,884 | — | — | 103,949 | ||||||||||||||||
Bankruptcy claim settlements | 146 | 1 | 2,676 | — | — | 2,677 | ||||||||||||||||
Exercise of common stock warrants | 51 | 1 | 785 | — | — | 786 | ||||||||||||||||
Stock-based compensation | 196 | 2 | 3,968 | — | — | 3,970 | ||||||||||||||||
Other comprehensive loss | — | — | — | — | (446 | ) | (446 | ) | ||||||||||||||
Net loss | — | — | — | (47,041 | ) | — | (47,041 | ) | ||||||||||||||
Balance, December 31, 2014 | 37,069 | 371 | 427,287 | (135,053 | ) | (446 | ) | 292,159 | ||||||||||||||
Issuance of common stock, net of offering costs of $1.0 million | 3,500 | 35 | 76,021 | — | — | 76,056 | ||||||||||||||||
Exercise of common stock warrants | 404 | 4 | 7,726 | — | — | 7,730 | ||||||||||||||||
Stock-based compensation | 98 | 1 | 5,164 | — | — | 5,165 | ||||||||||||||||
Purchase of common stock for retirement | (61 | ) | (1 | ) | (1,033 | ) | — | — | (1,034 | ) | ||||||||||||
Other comprehensive income | — | — | — | — | 446 | 446 | ||||||||||||||||
Net loss | — | — | — | (39,911 | ) | — | (39,911 | ) | ||||||||||||||
Balance, December 31, 2015 | 41,010 | $ | 410 | $ | 515,165 | $ | (174,964 | ) | $ | — | $ | 340,611 | ||||||||||
See accompanying notes to consolidated financial statements.
F-8
PAR PACIFIC HOLDINGS, INC. AND SUBSIDIARIES
Notes to Consolidated Financial Statements
For the Years Ended December 31, 2015, 2014 and 2013
Note 1—Overview
Par Pacific Holdings, Inc. (formerly known as Par Petroleum Corporation) and its wholly owned subsidiaries ("Par" or the "Company") manages and maintains interests in energy and infrastructure businesses. Currently, we operate in three primary business segments:
1) Refining - Our refinery in Kapolei, Hawaii produces ultra-low sulfur diesel, gasoline, jet fuel, marine fuel and other associated refined products primarily for consumption in Hawaii.
2) Retail - Our retail outlets sell gasoline, diesel and retail merchandise throughout the island of Oahu as well as the neighboring islands of Maui, Hawaii and Kauai. Our retail network includes Tesoro and "76" branded retail sites, company-operated convenience stores, sites operated in cooperation with 7-Eleven and other sites operated by third parties.
3) Logistics - We own and operate terminals, pipelines, a single-point mooring and trucking operations to distribute refined products throughout the island of Oahu as well as the neighboring islands of Maui, Hawaii, Molokai and Kauai.
We also own a 32.4% equity investment in Laramie Energy, LLC ("Laramie Energy"), a joint venture entity operated by Laramie Energy II, LLC ("Laramie") and focused on producing natural gas in Garfield, Mesa and Rio Blanco Counties, Colorado.
In addition to the three operating segments described above, we have two additional reportable segments: (i) Texadian (formerly the "Commodity Marketing and Logistics segment") and (ii) Corporate and Other. Texadian focuses on sourcing, marketing, transporting and distributing crude oil and refined products in the U.S. and Canada. Corporate and Other includes administrative costs and several small non-operated oil and gas interests that were owned by our predecessor.
Note 2—Summary of Significant Accounting Policies
Principles of Consolidation and Basis of Presentation
The consolidated financial statements include the accounts of Par Pacific Holdings, Inc. and its subsidiaries. All intercompany balances and transactions have been eliminated in consolidation.
Certain amounts previously reported in our consolidated financial statements for prior periods have been reclassified to conform to the current presentation.
Use of Estimates
The preparation of financial statements in conformity with U.S. generally accepted accounting principles ("GAAP") requires us to make estimates and assumptions that affect the reported amounts of assets, liabilities, revenues and expenses and the related disclosures. Actual amounts could differ from these estimates. Significant estimates include the fair value of assets and liabilities, inventory valuation, derivatives, asset retirement obligations, and contingencies and litigation accruals.
Cash and Cash Equivalents
Cash and cash equivalents consist of all highly liquid investments with original maturities of three months or less. The carrying value of cash equivalents approximates fair value because of the short-term nature of these investments.
Restricted Cash
Restricted cash consists of cash not readily available for general purpose cash needs. Restricted cash relates to bankruptcy matters and cash held at commercial banks to support letter of credit facilities.
Allowance for Doubtful Accounts
We establish provisions for losses on trade receivables if it becomes probable we will not collect all or part of the outstanding balances. We review collectibility and establish or adjust our allowance as necessary using the specific identification method. As of December 31, 2015 and 2014, we did not have a significant allowance for doubtful accounts.
F-9
PAR PACIFIC HOLDINGS, INC. AND SUBSIDIARIES
Notes to Consolidated Financial Statements
For the Years Ended December 31, 2015, 2014 and 2013
Inventories
Commodity inventories are stated at the lower of cost and net realizable value using the first-in, first-out accounting method ("FIFO"). We value merchandise along with spare parts, materials and supplies at average cost.
Beginning in June 2015, our refining segment acquires substantially all of its crude oil from J. Aron & Company ("J.Aron") under supply and offtake agreements as described in Note 10—Inventory Financing Agreements. The crude oil remains in the legal title of J. Aron and is stored in our storage tanks governed by a storage agreement. Legal title to the crude oil passes to us at the tank outlet. After processing, J. Aron takes title to the refined products stored in our storage tanks until sold to our retail locations or to third parties. We record the inventory owned by J. Aron on our behalf as inventory with a corresponding obligation on our balance sheet because we maintain the risk of loss until the refined products are sold to third parties and are obligated to repurchase the inventory.
Prior to the supply and offtake agreements with J. Aron, our refining and distribution segment acquired substantially all of its crude oil from Barclays Bank PLC (“Barclays”) under supply and exchange agreements as described in Note 10—Inventory Financing Agreements.
Investment in Laramie Energy, LLC
We account for our Investment in Laramie Energy, LLC using the equity method as we have the ability to exert significant influence, but do not control its operating and financial policies. Our proportionate share of net income (loss) of this entity is included in Equity earnings (losses) from Laramie Energy, LLC in the consolidated statements of operations. The investment is reviewed for impairment when events or changes in circumstances indicate that there has been an other than temporary decline in the value of the investment. Please read Note 3—Investment in Laramie Energy, LLC.
Property, Plant and Equipment
We capitalize the cost of additions, major improvements and modifications to property, plant and equipment. The cost of repairs and normal maintenance of property, plant and equipment is expensed as incurred. Major improvements and modifications of property, plant and equipment are those expenditures that either extend the useful life, increase the capacity or improve the operating efficiency of the asset or improve the safety of our operations. We compute depreciation of property, plant and equipment using the straight-line method, based on the estimated useful life of each asset as follows:
Assets | Lives in Years | |
Refining | 8 to 47 | |
Logistics | 3 to 30 | |
Retail | 14 to 18 | |
Corporate | 3 to 7 | |
Software | 3 | |
We record property under capital leases at the lower of the present value of minimum lease payments using our incremental borrowing rate or the fair value of the leased property at the date of lease inception. We depreciate leasehold improvements and property acquired under capital leases over the shorter of the lease term or the economic life of the asset.
We review property, plant and equipment and other long-lived assets whenever events or changes in business circumstances indicate the carrying value of the assets may not be recoverable. Impairment is indicated when the undiscounted cash flows estimated to be generated by those assets are less than the assets’ carrying value. If this occurs, an impairment loss is recognized for the difference between the fair value and carrying value. Factors that indicate potential impairment include a significant decrease in the market value of the asset, operating or cash flow losses associated with the use of the asset and a significant change in the asset’s physical condition or use.
Natural Gas and Oil Properties
We account for our natural gas and oil exploration and development activities using the successful efforts method of accounting. Under such method, costs of productive exploratory wells, development dry holes and productive wells and undeveloped leases are capitalized. Natural gas and oil lease acquisition costs are also capitalized. Exploration costs, including personnel costs, certain geological or geophysical expenses and delay rentals for natural gas and oil leases, are charged to expense as incurred. Exploratory drilling costs are initially capitalized, then evaluated quarterly and charged to expense if and when the well is determined not to contain reserves in commercial quantities. The sale of a partial interest in a proved property is accounted for as a cost recovery
F-10
PAR PACIFIC HOLDINGS, INC. AND SUBSIDIARIES
Notes to Consolidated Financial Statements
For the Years Ended December 31, 2015, 2014 and 2013
and no gain or loss is recognized as long as this treatment does not significantly affect the units-of-production depletion rate. A gain or loss is recognized for all other sales of producing properties.
Unproved properties are assessed quarterly on a property-by-property basis and any impairment in value is charged to expense. If the unproved properties are determined to be productive, the related costs are transferred to proved oil and natural gas properties and are depleted. Proceeds from sales of partial interests in unproved leases are accounted for as a recovery of cost without recognizing any gain or loss until all costs have been recovered.
Depletion of capitalized acquisition, exploration and development costs is computed using the units-of-production method by individual fields (common reservoirs) based on proved producing natural gas and crude oil reserves as the related reserves are produced. Associated leasehold costs are depleted using the unit-of-production method based on total proved natural gas and crude oil reserves as the related reserves are produced.
Our natural gas and crude oil assets are reviewed for impairment when events or changes in circumstances indicate that the carrying value of such assets may not be recoverable.
Asset Retirement Obligations
We record asset retirement obligations (“AROs”) in the period in which we have a legal obligation, whether by government action or contractual arrangement, to incur these costs and can make a reasonable estimate of the liability. Our AROs arise from our refining, logistics, and retail operations, as well as plugging and abandonment of wells within our natural gas and crude oil operations. AROs are calculated based on the present value of the estimated removal and other closure costs using our credit-adjusted risk-free rate. When the liability is initially recorded, we capitalize the cost by increasing the book value of the related long-lived tangible asset. The liability is accreted to its estimated settlement value with accretion expense recognized in Depreciation, depletion and amortization ("DD&A") on our consolidated statement of operations and the related capitalized cost is depreciated over the asset’s useful life. The difference between the settlement amount and the recorded liability is recorded as a gain or loss on asset disposals in our consolidated statements of operations. We estimate settlement dates by considering our past practice, industry practice, contractual terms, management’s intent and estimated economic lives.
We cannot currently estimate the fair value for certain AROs primarily because we cannot estimate settlement dates (or range of dates) associated with these assets. These AROs include hazardous materials disposal (such as petroleum manufacturing by-products, chemical catalysts and sealed insulation material containing asbestos) and removal or dismantlement requirements associated with the closure of our refining facility, terminal facilities or pipelines, including the demolition or removal of certain major processing units, buildings, tanks, pipelines or other equipment.
Goodwill and Other Intangible Assets
Goodwill represents the amount the purchase price exceeds the fair value of net assets acquired in a business combination. Goodwill is not amortized, but is tested for impairment annually on October 1. We assess the recoverability of the carrying value of goodwill during the fourth quarter of each year or whenever events or changes in circumstances indicate that the carrying amount of the goodwill of a reporting unit may not be fully recoverable. We first assess qualitative factors to determine whether it is more likely than not that the fair value of the reporting unit is less than its carrying value. If the qualitative assessment indicates that it is more likely than not that the carrying value of a reporting unit exceeds its estimated fair value, a two-step quantitative test is required. If required, we will compare the carrying value of the net assets of the reporting unit to the estimated fair value of the reporting unit. If the carrying value exceeds the estimated fair value of the reporting unit, an impairment indicator exists and an estimate of the impairment loss is calculated.
Our intangible assets include relationships with suppliers and shippers, favorable railcar leases, trade names and trademarks. These intangible assets will be amortized over their estimated useful lives on a straight-line basis. We evaluate the carrying value of our intangible assets when impairment indicators are present. When we believe impairment indicators may exist, projections of the undiscounted future cash flows associated with the use of and eventual disposition of the intangible assets are prepared. If the projections indicate that their carrying values are not recoverable, we reduce the carrying values to their estimated fair values.
Environmental Matters
We capitalize environmental expenditures that extend the life or increase the capacity of facilities as well as expenditures that prevent environmental contamination. We expense costs that relate to an existing condition caused by past operations and that do not contribute to current or future revenue generation. We record liabilities when environmental assessments and/or remedial efforts are probable and can be reasonably estimated. Cost estimates are based on the expected timing and extent of remedial
F-11
PAR PACIFIC HOLDINGS, INC. AND SUBSIDIARIES
Notes to Consolidated Financial Statements
For the Years Ended December 31, 2015, 2014 and 2013
actions required by governing agencies, experience gained from similar sites for which environmental assessments or remediation have been completed and the amount of our anticipated liability considering the proportional liability and financial abilities of other responsible parties. Usually, the timing of these accruals coincides with the completion of a feasibility study or our commitment to a formal plan of action. Estimated liabilities are not discounted to present value and environmental expenses are recorded in Operating expenses in our consolidated statements of operations.
Derivatives and Other Financial instruments
We are exposed to commodity price risk related to crude oil and refined products. We manage this exposure through the use of various derivative commodity instruments. These instruments include exchange traded futures and over-the-counter swaps, forwards and options.
For our forward contracts that are derivatives, we have elected the normal purchase normal sale exclusion, as it is our policy to fulfill or accept the physical delivery of the product and we will not net settle. Therefore, we did not recognize the unrealized gains or losses related to these contracts in our consolidated financial statements. We apply the accrual method of accounting to contracts qualifying for the normal purchase and sales exemption.
All derivative instruments, not designated as normal purchases or sales, are recorded in the balance sheet as either assets or liabilities measured at their fair values. Changes in the fair value of these derivative instruments are recognized currently in earnings. We have not designated any derivative instruments as cash flow or fair value hedges and therefore, do not apply hedge accounting treatment.
In addition, we may have other financial instruments, such as warrants or embedded debt features, that may be classified as liabilities when either (a) the holders possess rights to net cash settlement, (b) physical or net equity settlement is not in our control or (c) the instruments contain other provisions that cause us to conclude that they are not indexed to our equity. Our former delayed draw term loan facility contained certain puts that were accounted for as embedded derivatives. We have also accounted for our obligation to repurchase crude oil and refined products from J.Aron at the termination of the Supply and Offtake Agreements as an embedded derivative. These liabilities were initially recorded at fair value and subsequently adjusted to fair value at the end of each reporting period through earnings.
Please read Note 12—Derivatives and Note 13—Fair Value Measurements for information regarding our derivatives and other financial instruments.
Income Taxes
We use the asset and liability method of accounting for income taxes. Under the asset and liability method, deferred tax assets and liabilities are recognized for the future tax consequences attributable to differences between the financial statement carrying amounts of existing assets and liabilities and their respective tax bases and net operating loss ("NOLs") and tax credit carry forwards. Deferred tax assets and liabilities are measured using enacted income tax rates expected to apply to taxable income in the years in which those differences are expected to be recovered or settled. The effect on deferred tax assets and liabilities of a change in income tax rates is recognized in the results of operations in the period that includes the enactment date. The realizability of deferred tax assets is evaluated quarterly based on a “more likely than not” standard and, to the extent this threshold is not met, a valuation allowance is recorded.
We recognize the impact of an uncertain tax position only if it is more likely than not of being sustained upon examination by the relevant taxing authority based on the technical merits of the position. As a general rule, our open years for Internal Revenue Service (“IRS”) examination purposes are 2012, 2013 and 2014. However, since we have net operating loss carryforwards, the IRS has the ability to make adjustments to items that originate in a year otherwise barred by the statute of limitations in order to re-determine tax for an open year to which those items are carried. Therefore, in a year in which a net operating loss deduction is claimed, the IRS may examine the year in which the net operating loss was generated and adjust it accordingly for purposes of assessing additional tax in the year the net operating loss deductions was claimed. Any penalties or interest as a result of an examination will be recorded in the period assessed.
Stock-Based Compensation
We recognize the cost of share-based payments on a straight-line basis over the period the employee provides service, generally the vesting period and include such costs in General and administrative expense in the consolidated statements of operations. The grant date fair value of restricted stock awards are equal to the market price of our common stock on the date of grant. The fair value of stock options are estimated using the Black-Scholes option-pricing model as of the date of grant.
F-12
PAR PACIFIC HOLDINGS, INC. AND SUBSIDIARIES
Notes to Consolidated Financial Statements
For the Years Ended December 31, 2015, 2014 and 2013
Revenue Recognition
We recognize revenue when it is realized or realizable and earned. Revenue is realized or realizable and earned when persuasive evidence of an arrangement exists, delivery has occurred or services have been rendered, the price to the buyer is fixed or determinable and collectability is reasonably assured. Revenue that does not meet these criteria is deferred until the criteria are met.
Certain transactions include sale and purchase transactions entered into with the same counterparty that are deemed to be in contemplation with one another and are recorded on a net basis and included in Cost of revenues on our consolidated statements of operations.
Refining and Retail
We recognize revenues upon delivery of goods or services to a customer. For goods, this is the point at which title and risk of loss is transferred and when payment has either been received or collection is reasonably assured. Revenues for services are recorded when the services have been provided. We include transportation fees charged to customers in Revenues in our consolidated statements of operations, while the related transportation costs are included in Cost of revenues.
Federal excise and state motor fuel taxes, which are collected from customers and remitted to governmental agencies within our refining and retail segments are excluded from both Revenues and Cost of revenues in our consolidated statements of operations.
Logistics
We recognize revenues as goods or services are provided to a customer. Substantially all of our logistics revenues represent intercompany transactions that are eliminated in consolidation.
Texadian
We earn revenues from the sale and transportation of crude oil and the rental of railcars. Accordingly, revenues and related costs from sales of crude oil are recorded when title transfers to the buyer. Transportation revenues are recognized when title passes to the customer, which is when risk of ownership transfers to the purchaser and physical delivery occurs. Revenues from the rental of railcars are recognized ratably over the lease periods.
Other Post-Retirement Benefits - Medical
On December 31, 2015, we terminated our post-retirement medical plan and extinguished the remaining benefit obligation. Prior to this termination, the plan was unfunded and benefit obligation was recorded within Other long-term liabilities. Changes in the plan's funded status were recognized in Other comprehensive loss in the period the change occurs.
Fair Value Measurements
Fair value is the price that would be received to sell an asset or paid to transfer a liability in an orderly transaction between market participants at the measurement date (exit price). Fair value measurements are categorized with the highest priority given to unadjusted quoted prices in active markets for identical assets or liabilities and the lowest priority given to unobservable inputs. The three levels of the fair value hierarchy are as follows:
Level 1 – | Assets or liabilities for which the item is valued based on quoted prices (unadjusted) for identical assets or liabilities in active markets. |
Level 2 – | Assets or liabilities valued based on observable market data for similar instruments. |
Level 3 – | Assets or liabilities for which significant valuation assumptions are not readily observable in the market; instruments valued based on the best available data, some of which is internally-developed and considers risk premiums that a market participant would require. |
The level in the fair value hierarchy within which the fair value measurement is categorized is based on the lowest level input that is significant to the fair value measurement. Our assessment of the significance of a particular input to the fair value measurement requires judgment and may affect the valuation of the fair value of assets and liabilities and their placement within the fair value hierarchy levels. Our policy is to recognize transfers in and/or out of fair value hierarchy levels as of the end of the reporting period for which the event or change in circumstances caused the transfer. We have consistently applied these valuation techniques for the periods presented. We use data from peers as well as external sources in the determination of the volatility and risk free rates used in the valuation of our common stock warrants and contingent consideration. For these instruments, a sensitivity
F-13
PAR PACIFIC HOLDINGS, INC. AND SUBSIDIARIES
Notes to Consolidated Financial Statements
For the Years Ended December 31, 2015, 2014 and 2013
analysis is performed as well to determine the impact of inputs on the ending fair value estimate. The fair value of the J. Aron repurchase obligation derivative is measured using estimates of the prices and differentials assuming settlement at the end of the reporting period.
Income (Loss) Per Share
Basic income (loss) per share (“EPS”) is computed by dividing net income (loss) by the sum of the weighted-average number of common shares outstanding and the weighted-average number of shares issuable under the warrants. Please read Note 17—Income (Loss) Per Share for further information. The warrants are included in the calculation of basic EPS because they are issuable for minimal consideration. Unvested restricted stock is excluded from the computation of basic EPS as these shares are not considered earned until vesting occurs.
Foreign Currency Transactions
We may, on occasion, enter into transactions denominated in currencies other than the U.S. dollar, which is our functional currency. Gains and losses resulting from changes in currency exchange rates between the functional currency and the currency in which a transaction is denominated are included in Other income (expense), net, in the accompanying consolidated statement of operations in the period in which the currency exchange rates change.
Accounting Principles Not Yet Adopted
In May 2014, the Financial Accounting Standards Board (“FASB”) issued Accounting Standards Update (“ASU”) No. 2014-09, Revenue from Contracts with Customers (Topic 606) (“ASU No. 2014-09”). The FASB’s objective was to provide a more robust framework to improve comparability of revenue recognition practices across entities by removing most industry and transaction specific guidance, align GAAP with International Financial Reporting Standards and provide more useful information to financial statement users. This authoritative guidance changes the way entities recognize revenue to depict the transfer of promised goods or services to customers in an amount that reflects the consideration to which it expects to be entitled in exchange for those goods or services. In August 2015, the FASB issued ASU 2015-14, Revenue from Contracts with Customers (Topic 606): Deferral of the Effective Date ("ASU No. 2015-14"), which defers the effective date of ASU 2015-09 by one year. ASU No. 2014-09 is now effective for interim and annual periods beginning after December 15, 2017 and early adoption is permitted for interim and annual periods beginning after December 15, 2016. ASU No. 2014-09 allows for either full retrospective adoption or modified retrospective adoption. We are in the process of determining the method of adoption and the impact this guidance will have on our financial condition, results of operations and cash flows.
In August 2014, the FASB issued ASU No. 2014-15, Presentation of Financial Statements-Going Concern (Subtopic 205-40): Disclosure of Uncertainties about an Entity’s Ability to Continue as a Going Concern (“ASU 2014-15”). ASU 2014-15 is intended to define management’s responsibility to evaluate whether there is substantial doubt about an organization’s ability to continue as a going concern and to provide related footnote disclosures. The amendments in this ASU are effective for interim and annual periods beginning after December 15, 2016 and early adoption is permitted. We do not expect the adoption of ASU 2014-15 to have a material impact on our financial condition, results of operations and cash flows.
In February 2015, the FASB issued ASU No. 2015-02, Consolidation (Topic 810): Amendments to the Consolidation Analysis ("ASU 2015-02"). ASU 2015-02 changes the consolidation analysis required under GAAP by eliminating the presumption that a general partner should consolidate a limited partnership and modifying the evaluation of whether limited partnerships are Variable Interest Entities ("VIEs") or voting interest entities. Under the amended guidance, limited partners would be required to consolidate a partnership if the limited partner retains certain powers and obligations. The amendments in this ASU are effective for annual periods beginning after December 15, 2016 and interim periods beginning after December 15, 2017. ASU 2015-02 allows for either full retrospective adoption or modified retrospective adoption. Early adoption is permitted, but the guidance must be applied as of the beginning of the annual period containing the adoption date. We are in the process of determining the method of adoption and the impact this guidance will have on our financial condition, results of operations and cash flows.
In February 2016, the FASB issued ASU No. 2016-02, Leases (Topic 842) ("ASU 2016-02"). ASU 2016-02 requires lessees to recognize all leases, including operating leases, on the balance sheet as a lease asset or lease liability, unless the lease is a short-term lease. ASU 2016-02 also requires additional disclosures regarding leasing arrangements. ASU 2016-02 is effective for interim periods and fiscal years beginning after December 15, 2018, and early application is permitted. We are in the process of determining the method of adoption and the impact this guidance will have on our financial condition, results of operations and cash flow.
F-14
PAR PACIFIC HOLDINGS, INC. AND SUBSIDIARIES
Notes to Consolidated Financial Statements
For the Years Ended December 31, 2015, 2014 and 2013
Accounting Principles Adopted
In April 2015, the FASB issued ASU No. 2015-03, Interest – Imputation of Interest: Simplifying the Presentation of Debt Issuance Costs ("ASU 2015-03"). ASU 2015-03 changes the balance sheet classification of debt issuance costs. Under previous GAAP, debt issuance costs were reported on the balance sheet as assets and amortized as interest expense. ASU 2015-03 requires that debt issuance costs be presented as a reduction from the carrying amount of the related debt liability, which is similar to the presentation of debt discounts or premiums. Debt issuance costs will continue to be amortized to interest expense using the effective interest method. In August 2015, the FASB issued ASU No. 2015-15, Interest – Imputation of Interest: Presentation and Subsequent Measurement of Debt Issuance Costs Associated with Line-of-Credit Arrangements ("ASU 2015-15"). ASU 2015-15 clarifies that the guidance in ASU 2015-03 does not apply to debt issuance costs related to line-of-credit arrangements. Debt issuance costs related to line-of-credit arrangements will continue to be presented as an asset. The amendments in this ASU are effective for annual and interim periods beginning after December 15, 2015. ASU 2015-03 should be adopted on a retrospective basis and early adoption is permitted. We adopted this ASU as of December 31, 2015 and have applied the requirements retrospectively to all periods presented. The adoption of this ASU resulted in the reclassification of $5.8 million of debt issuance costs as of December 31, 2014 from Other long-term assets to Long-term debt, net of current maturities on our consolidated balance sheets.
In July 2015, the FASB issued ASU No. 2015-11, Simplifying the Measurement of Inventory ("ASU 2015-11"). ASU 2015-11 changes the inventory measurement principle for entities using the FIFO or average cost methods. For entities utilizing one of these methods, the inventory measurement principle changed from lower of cost or market to the lower of cost and net realizable value. Net realizable value is the estimated selling price in the ordinary course of business, less reasonably predictable costs of completion, disposal and transportation. Subsequent measurement is unchanged for inventory measured using last-in, first-out or the retail inventory method. The amendments in this ASU are effective for annual and interim periods beginning after December 15, 2016. ASU 2015-11 should be adopted prospectively with earlier application permitted as of the beginning of an interim or annual reporting period. We adopted this ASU as of December 31, 2015. The adoption of this ASU did not have a material impact on our financial condition, results of operations and cash flows.
In September 2015, the FASB issued ASU No. 2015-16, Business Combinations (Topic 805): Simplifying the Accounting for Measurement-Period Adjustments ("ASU 2015-16"). ASU 2015-16 requires that an acquirer recognize adjustments to provisional amounts that are identified during the measurement period in the reporting period in which the adjustment amounts are determined. Under ASU 2015-16, the effect on earnings resulting from changes to the provisional amounts, calculated as if the accounting had been completed as of the acquisition date, must be recorded in the reporting period in which the adjustment amounts are determined rather than retrospectively. The amendments in this ASU are effective for annual and interim periods beginning after December 15, 2015. ASU 2015-16 should be adopted prospectively to adjustments to provisional amounts occurring after the effective date of the update and earlier application is permitted for financial statements that have not been issued. We adopted this ASU during the quarter ended September 30, 2015 and applied its amendments to the measurement period adjustments made during the year ended December 31, 2015. Please read Note 4—Acquisitions for further information.
In November 2015, the FASB issued ASU No. 2015-17, Income Taxes (Topic 740): Balance Sheet Classification of Deferred Taxes ("ASU 2015-17"). ASU 2015-17 is part of the FASB's initiative to reduce the complexity in accounting standards. ASU 2015-17 requires entities to present deferred tax assets and deferred tax liabilities as non-current in a classified balance sheet. The amendments in this ASU simplify current guidance in ASC 740-10-45-4 that requires separate presentation of deferred tax assets and liabilities as current and non-current in a classified balance sheet based on the classification of the related asset or liability. ASU 2015-17 is effective for public companies for annual periods beginning after December 15, 2017 and interim periods beginning after December 15, 2018. Earlier application is permitted as of the beginning of an interim or annual reporting period. We adopted this ASU as of December 31, 2015. The adoption of this ASU did not have a material impact on our consolidated balance sheets as of December 31, 2015 and 2014.
Note 3—Investment in Laramie Energy, LLC
We have an ownership interest in Laramie Energy, formerly known as Piceance Energy, LLC, a joint venture entity focused on producing natural gas in Garfield, Mesa and Rio Blanco Counties, Colorado. Laramie Energy has a $400 million revolving credit facility secured by a lien on its natural gas and crude oil properties and related assets with a borrowing base currently set at $110 million. As of December 31, 2015 and 2014, the balance outstanding on the revolving credit facility was approximately $77.3 million and $98 million, respectively. We are guarantors of Laramie Energy’s credit facility, with recourse limited to the pledge of our equity interest of our wholly-owned subsidiary, Par Piceance Energy Equity, LLC. Under the terms of its credit facility, Laramie Energy is generally prohibited from making future cash distributions to its owners, including us.
F-15
PAR PACIFIC HOLDINGS, INC. AND SUBSIDIARIES
Notes to Consolidated Financial Statements
For the Years Ended December 31, 2015, 2014 and 2013
On March 9, 2015, we entered into an amendment to the Limited Liability Company Agreement and made a cash capital contribution of $13.8 million to Laramie Energy. On May 29, 2015, we made an additional cash capital contribution of $13.8 million. As a result of our contributions to Laramie Energy, our ownership interest increased from 33.34% to 34.0%.
On July 31, 2015, an unaffiliated third-party invested an aggregate of $19 million in Laramie Energy in the form of cash and property. As a result of this transaction, our ownership interest decreased from 34.0% to 32.4%.
At December 31, 2015, we conducted an impairment test related to our equity investment in Laramie Energy. As a result of the decline in crude oil prices during 2015, we concluded that our equity investment in Laramie Energy was impaired and recognized an other-than-temporary impairment charge of $41.1 million on our consolidated statement of operations for the year ended December 31, 2015.
The change in our equity investment in Laramie Energy is as follows (in thousands):
Year Ended December 31, | |||||||||||
2015 | 2014 | 2013 | |||||||||
Beginning balance | $ | 104,657 | $ | 101,796 | $ | 104,434 | |||||
Equity earnings (loss) from Laramie Energy | (15,713 | ) | 2,278 | (3,516 | ) | ||||||
Accretion of basis difference | 811 | 571 | 575 | ||||||||
Impairment | (41,081 | ) | — | — | |||||||
Investments | 27,529 | 12 | 303 | ||||||||
Ending balance | $ | 76,203 | $ | 104,657 | $ | 101,796 | |||||
Summarized financial information for Laramie Energy is as follows (in thousands):
December 31, | |||||||
2015 | 2014 | ||||||
Current assets | $ | 8,511 | $ | 13,168 | |||
Non-current assets | 514,206 | 468,379 | |||||
Current liabilities | 18,158 | 17,103 | |||||
Non-current liabilities | 98,624 | 105,774 | |||||
Year Ended December 31, | |||||||||||
2015 | 2014 | 2013 | |||||||||
Natural gas and oil revenues | $ | 42,870 | $ | 80,471 | $ | 61,091 | |||||
Income (loss) from operations | (40,984 | ) | 3,512 | (5,196 | ) | ||||||
Net income (loss) | (49,159 | ) | 6,576 | (8,977 | ) | ||||||
Laramie Energy's net loss for year ended December 31, 2015 includes $24.6 million and $16.6 million of DD&A expense and unrealized losses on derivative instruments, respectively. Additionally, 2015 also includes $12.3 million of impairments of unproved properties. Laramie Energy's net income for the year ended December 31, 2014 includes $32.8 million and $9.8 million of DD&A expense and unrealized gains on derivative instruments, respectively. Laramie Energy's net loss for the year ended December 31, 2013 includes $26.6 million and $1.1 million of DD&A expense and unrealized losses on derivative instruments, respectively.
At December 31, 2015 and 2014, our equity in the underlying net assets of Laramie Energy exceeded the carrying value of our investment by approximately $55.4 million and $14.7 million, respectively. This difference arose due to lack of control and marketability discounts and an other-than-temporary impairment of our equity investment in Laramie Energy. We attributed this difference to natural gas and crude oil properties and are amortizing the difference over 15 years based on the estimated timing of production of proved reserves.
On December 17, 2015, we entered into an equity commitment letter with Laramie Energy, pursuant to which we agreed to purchase certain membership interests of Laramie Energy for an aggregate cash purchase price of $55 million, subject to certain financing commitments by various lenders and additional equity investors and other conditions, in connection with the closing of
F-16
PAR PACIFIC HOLDINGS, INC. AND SUBSIDIARIES
Notes to Consolidated Financial Statements
For the Years Ended December 31, 2015, 2014 and 2013
a purchase and sale agreement whereby Laramie Energy agreed to acquire certain properties in the Piceance Basin for $157.5 million ("Laramie Property Purchase"), subject to customary purchase price adjustments and other conditions. Effective February, 22, 2016, we entered into a Unit Purchase Agreement with Laramie Energy and certain equity investors, which is subject to the closing of the Laramie Property Purchase, pursuant to which certain equity investors made capital contributions of an aggregate $100 million in exchange for an aggregate 208,522 common units and 30,000 preferred units. On the same date, Laramie Energy also amended and restated its limited liability company agreement to reflect the terms and conditions of the Unit Purchase Agreement, revise certain tax provisions, allow for certain consent rights, and provide for the redemption of certain units and grant board appointment rights upon certain terms and conditions. The transaction closed on March 1, 2016 and, upon the closing of the transaction, Laramie Energy assumed ownership and operatorship of the purchased properties and our ownership interest in Laramie Energy increased from 32.4% to 42.3%.
Note 4—Acquisitions
Mid Pac Acquisition
On April 1, 2015, we completed the acquisition of Par Hawaii Inc. ("PHI," formerly Koko’oha Investments, Inc.), a Hawaii corporation that owns 100% of the outstanding membership interests of Mid Pac Petroleum, LLC (“Mid Pac”). Net cash consideration was $74.4 million, including the working capital settlement of $1 million paid in September 2015. The cash consideration includes advance deposits of $15 million, of which $10 million was paid in 2014, prior to closing. In connection with the acquisition, Mid Pac's pre-existing debt was fully repaid on the closing date for $45.3 million. The acquisition and debt repayment were funded with cash on hand and $55 million of borrowings under the Credit Agreement with the Bank of Hawaii ("Mid Pac Credit Agreement"). Please read Note 11—Debt for further discussion.
We accounted for the acquisition of Mid Pac as a business combination whereby the purchase price was allocated to the assets acquired and liabilities assumed based on their estimated fair values on the date of acquisition. Goodwill recognized in the transaction was attributable to opportunities expected to arise from combining our operations with Mid Pac's and utilization of our net operating loss carryforwards, as well as other intangible assets that do not qualify for separate recognition. In addition, we recorded certain other identifiable intangible assets including trade names and customer relationships. These intangible assets will be amortized over their estimated useful lives on a straight-line basis, which approximates their consumptive life. Please read Note 9—Goodwill and Intangible Assets for further discussion. None of the goodwill or intangible assets are expected to be deductible for income tax reporting purposes.
A summary of the preliminary estimated fair value of the assets acquired and liabilities assumed is as follows (in thousands):
Cash | $ | 10,007 | |
Accounts receivable | 9,905 | ||
Inventories | 5,375 | ||
Prepaid and other current assets | 1,444 | ||
Property, plant and equipment | 40,997 | ||
Land | 34,800 | ||
Goodwill (1) | 27,531 | ||
Intangible assets | 33,647 | ||
Other non-current assets | 1,228 | ||
Accounts payable and other current liabilities | (11,331 | ) | |
Deferred tax liability | (16,759 | ) | |
Other non-current liabilities | (7,235 | ) | |
Total | $ | 129,609 | |
________________________________________________________
(1) We allocated $13.8 million, $2.8 million and $11.0 million of goodwill to our refining, retail and logistics reporting units, respectively.
We have recorded a preliminary estimate of the fair value of the assets acquired and liabilities assumed and expect to finalize the purchase price allocation during 2016. The primary areas of the purchase price allocation that are not yet finalized relate to income taxes and contingent liabilities. We incurred $0.8 million and $6.4 million of acquisition costs related to the Mid
F-17
PAR PACIFIC HOLDINGS, INC. AND SUBSIDIARIES
Notes to Consolidated Financial Statements
For the Years Ended December 31, 2015, 2014 and 2013
Pac acquisition for the years ended December 31, 2015 and 2014. These costs are included in acquisition and integration costs on our consolidated statement of operations.
The results of operations of Mid Pac were included in our refining, retail and logistics segments results beginning April 1, 2015. For the year ended December 31, 2015, our results of operations included Mid Pac's revenues of $147.6 million and net income of $10.6 million, respectively. The following unaudited pro forma financial information presents our consolidated revenues and net income (loss) as if the Mid Pac acquisition had been completed on January 1, 2014 (in thousands):
Year Ended December 31, | ||||||||
2015 | 2014 | |||||||
Revenues | $ | 2,093,587 | $ | 3,361,739 | ||||
Net loss | (54,941 | ) | (28,501 | ) | ||||
Par Hawaii Refining Acquisition
On September 25, 2013, we completed the acquisition of Tesoro Hawaii which owned and operated a petroleum refinery in Kapolei, Hawaii, certain pipeline assets, floating pipeline mooring equipment, refined products terminals and retail assets selling fuel products and merchandise on the islands of Oahu, Maui and Hawaii. Following the acquisition, Tesoro Hawaii was renamed Hawaii Independent Energy, LLC (“HIE”). Effective December 28, 2015, HIE was renamed Par Hawaii Refining, LLC ("PHR"). The purchase price was $75 million plus net working capital and inventories at closing plus certain contingent earnout payments of up to $40 million. As a part of the purchase price, we also funded approximately $24.3 million of start-up expenses and for a major overhaul of a co-generation turbine used at the refinery prior to closing. The purchase price was paid with a portion of the net proceeds from the private placement common stock sale (please read Note 15—Stockholders' Equity), amounts received pursuant to the Supply and Exchange Agreements (please read Note 10—Inventory Financing Agreements) and the ABL Facility (please read Note 11—Debt).
The contingent earnout payments, if any, are to be paid annually following each of the three calendar years beginning January 1, 2014 through the year ending December 31, 2016, in an amount equal to 20% of the consolidated annual gross margin of PHR in excess of $165 million during such calendar years, with an annual cap of $20 million. In the event that the refinery ceases operations or we dispose of any facility used in the acquired business, our obligation to make earnout payments could be modified and/or accelerated. As of December 31, 2015, no amounts have been paid related to the contingent earnout and our estimated contingent consideration liability was $27.6 million. In January 2016, we paid $1.0 million related the year ended December 31, 2014.
We accounted for the acquisition of PHR as a business combination whereby the purchase price was allocated to the assets acquired and liabilities assumed based on their estimated fair values on the date of acquisition. Goodwill recognized in the transaction was attributable to opportunities expected to arise from combining our operations with PHR’s and utilization of our net operating loss carryforwards, as well as other intangible assets that do not qualify for separate recognition. In addition, we recorded certain other identifiable intangible assets including trade names and trademarks. These intangible assets will be amortized over their estimated useful lives on a straight-line basis, which approximates their consumptive life.
During 2014, we finalized the acquisition purchase price allocation. The primary purchase price allocation adjustments related to the finalization of the post-retirement medical plan, working capital settlements and allocating value to underground storage tanks installed by Tesoro Corporation in conjunction with the Environmental Agreement. Please read Note 16—Benefit Plans and Note 14—Commitments and Contingencies for additional information. We believe these adjustments did not have a material impact on prior periods.
F-18
PAR PACIFIC HOLDINGS, INC. AND SUBSIDIARIES
Notes to Consolidated Financial Statements
For the Years Ended December 31, 2015, 2014 and 2013
A summary of the final estimated fair value of the assets acquired and liabilities assumed is as follows (in thousands):
Inventory | $ | 418,750 | |
Trade accounts receivable | 59,553 | ||
Prepaid and other current assets | 2,497 | ||
Property, plant and equipment | 59,670 | ||
Land | 39,800 | ||
Goodwill | 13,796 | ||
Intangible assets | 4,596 | ||
Accounts payable and other current liabilities | (18,542 | ) | |
Contingent consideration liability | (11,980 | ) | |
Other non-current liabilities | (7,561 | ) | |
Total | $ | 560,579 | |
The acquisition was partially funded from proceeds totaling approximately $378.2 million from the Supply and Exchange Agreements. Please read Note 10—Inventory Financing Agreements for further information. None of the goodwill or intangible assets are expected to be deductible for income tax reporting purposes. Acquisition costs of approximately $7 million are included in Acquisition and integration expense on our consolidated statement of operations for the year ended December 31, 2013.
The unaudited pro forma financial information for the year ended December 31, 2013 presented below assumes that the acquisition occurred as of January 1, 2013 (in thousands):
Revenues | $ | 2,986,800 | |
Net income | (122,000 | ) | |
Revenue and earnings for PHR subsequent to the acquisition are included in the refining, retail and logistics segments in Note 19—Segment Information.
Note 5—Inventories
Inventories at December 31, 2015 and 2014 consist of the following (in thousands):
Titled Inventory | Supply and Offtake Agreements (1) | Total | |||||||||
December 31, 2015 | |||||||||||
Crude oil and feedstocks | $ | 18,404 | $ | 68,126 | $ | 86,530 | |||||
Refined products and blendstock | 28,023 | 87,608 | 115,631 | ||||||||
Warehouse stock and other | 17,276 | — | 17,276 | ||||||||
Total | $ | 63,703 | $ | 155,734 | $ | 219,437 | |||||
December 31, 2014 | |||||||||||
Crude oil and feedstocks | — | 62,594 | 62,594 | ||||||||
Refined products and blendstock | 47,922 | 118,375 | 166,297 | ||||||||
Warehouse stock and other | 14,962 | — | 14,962 | ||||||||
Total | $ | 62,884 | $ | 180,969 | $ | 243,853 | |||||
_________________________________________________________
(1) Please read Note 10—Inventory Financing Agreements for further information.
F-19
PAR PACIFIC HOLDINGS, INC. AND SUBSIDIARIES
Notes to Consolidated Financial Statements
For the Years Ended December 31, 2015, 2014 and 2013
The reserve for the lower of cost or net realizable value of inventory was $23.7 million and $2.4 million as of December 31, 2015 and December 31, 2014, respectively.
Note 6—Prepaid and Other Current Assets
Prepaid and other current assets at December 31, 2015 and 2014 consist of the following (in thousands):
December 31, | |||||||
2015 | 2014 | ||||||
Advances to suppliers for crude purchases | $ | 36,247 | $ | — | |||
Collateral posted with broker for derivative transactions | 20,926 | — | |||||
Prepaid insurance | 6,773 | 8,188 | |||||
Derivative assets | 4,577 | 1,015 | |||||
Other | 6,914 | 5,821 | |||||
Total | $ | 75,437 | $ | 15,024 | |||
Note 7—Property, Plant and Equipment
Major classes of property, plant and equipment consist of the following (in thousands):
December 31, | |||||||
2015 | 2014 | ||||||
Land | $ | 74,600 | $ | 39,800 | |||
Buildings and equipment | 139,908 | 81,488 | |||||
Other | 6,355 | 2,035 | |||||
Total property, plant and equipment | 220,863 | 123,323 | |||||
Proved oil and gas properties | 1,122 | 1,122 | |||||
Less accumulated depreciation and depletion | (26,845 | ) | (11,510 | ) | |||
Property, plant and equipment, net | $ | 195,140 | $ | 112,935 | |||
Depreciation and depletion expense was approximately $15.3 million, $11.2 million and $3.7 million for the years ended December 31, 2015, 2014 and 2013, respectively.
Note 8—Asset Retirement Obligations
The table below summarizes the changes in our asset retirement obligations (in thousands):
Year Ended December 31, | |||||||||||
2015 | 2014 | 2013 | |||||||||
Beginning balance | $ | 2,580 | $ | 3,172 | $ | 512 | |||||
Obligations acquired | 5,725 | — | 2,601 | ||||||||
Accretion expense | 604 | 239 | 59 | ||||||||
Revision in estimate | — | (831 | ) | — | |||||||
Ending balance | $ | 8,909 | $ | 2,580 | $ | 3,172 | |||||
The revision in estimate during the year ended December 31, 2014 resulted from a revised valuation of the retirement obligation related to the removal of the underground tanks at our retail locations.
F-20
PAR PACIFIC HOLDINGS, INC. AND SUBSIDIARIES
Notes to Consolidated Financial Statements
For the Years Ended December 31, 2015, 2014 and 2013
Note 9—Goodwill and Intangible Assets
During the years ended December 31, 2015 and 2014, the change in the carrying amount of goodwill was as follows (in thousands):
Balance at January 1, 2014 | $ | 20,603 | |
Par Hawaii Refining acquisition purchase price allocation adjustments (1) | 183 | ||
Balance at December 31, 2014 | 20,786 | ||
Acquisition of Mid Pac (1) | 27,531 | ||
Impairment expense | (6,990 | ) | |
Balance at December 31, 2015 | $ | 41,327 | |
________________________________________________________
(1) Please read Note 4—Acquisitions for further discussion.
At September 30, 2015, we conducted an interim goodwill impairment test of our Texadian reporting unit due to (i) a reduction in the forecasted results of operations during our annual budgeting process; (ii) the decision to cancel the charter on the barges used to move crude oil from Canada to the U.S. Gulf Coast due to lower forecasted commodity prices and (iii) negative cash flows from the business during 2015. Upon completion of the goodwill impairment test, we determined the goodwill associated with the Texadian reporting unit was fully impaired resulting in a charge of $7.0 million in our consolidated statement of operations for the year ended December 31, 2015. In assessing the value of the reporting unit, we primarily used an income approach with a weighted-average discount rate of 15%. On October 1, 2015, we conducted an impairment test of the remaining goodwill and intangible assets and found no further impairment necessary.
Intangible assets consist of the following (in thousands):
December 31, | |||||||
2015 | 2014 | ||||||
Intangible assets: | |||||||
Supplier relationships | $ | — | $ | 3,360 | |||
Railcar leases | 3,249 | 3,249 | |||||
Historical shipper status | — | 2,200 | |||||
Trade names and trademarks | 6,267 | 4,689 | |||||
Customer relationships | 32,064 | — | |||||
Total intangible assets | 41,580 | 13,498 | |||||
Accumulated amortization: | |||||||
Supplier relationships | — | (516 | ) | ||||
Railcar leases | (1,950 | ) | (1,301 | ) | |||
Historical shipper status | — | (2,200 | ) | ||||
Trade name and trademarks | (3,540 | ) | (1,975 | ) | |||
Customer relationships | (1,722 | ) | — | ||||
Total accumulated amortization | (7,212 | ) | (5,992 | ) | |||
Net: | |||||||
Supplier relationships | — | 2,844 | |||||
Railcar leases | 1,299 | 1,948 | |||||
Historical shipper status | — | — | |||||
Trade name and trademarks | 2,727 | 2,714 | |||||
Customer relationships | 30,342 | — | |||||
Total intangible assets, net | $ | 34,368 | $ | 7,506 | |||
F-21
PAR PACIFIC HOLDINGS, INC. AND SUBSIDIARIES
Notes to Consolidated Financial Statements
For the Years Ended December 31, 2015, 2014 and 2013
At September 30, 2015, we conducted an impairment test related to the intangible assets in our Texadian reporting unit. As of result of canceling the charter on the barges used to transport crude from Canada to the U.S. Gulf Coast in the Texadian business, we concluded that the supplier relationships intangible asset was fully impaired and recognized an impairment charge of $2.6 million in our consolidated statement of operations for the year ended December 31, 2015.
Amortization expense was approximately $4.4 million, $3.7 million and $2.3 million for the years ended December 31, 2015, 2014 and 2013, respectively. Intangible assets acquired from Mid Pac have an average useful life of 13.6 years. Expected amortization expense for each of the next five years and thereafter is as follows (in thousands):
Year Ended | Amount | |||
2016 | $ | 4,457 | ||
2017 | 3,307 | |||
2018 | 2,658 | |||
2019 | 2,658 | |||
2020 | 2,658 | |||
Thereafter | 18,630 | |||
$ | 34,368 | |||
Note 10—Inventory Financing Agreements
Supply and Offtake Agreements
On June 1, 2015, we entered into several agreements with J. Aron to support the operations of our refinery (the "Supply and Offtake Agreements"). The Supply and Offtake Agreements have a term of three years with two one-year extension options upon mutual agreement of the parties.
During the term of the Supply and Offtake Agreements, we and J. Aron will identify mutually acceptable contracts for the purchase of crude oil from third parties. Per the Supply and Offtake Agreements, J. Aron will provide up to 94 thousand barrels per day of crude oil to our refinery. Additionally, we agreed to sell and J. Aron agreed to buy, at market prices, refined products produced at our refinery. We will then repurchase the refined products from J. Aron prior to selling the refined products to our retail operations or third parties. The agreements also provide for the lease to J. Aron of crude oil and certain refined product storage facilities. Following expiration or termination of the agreements, we are obligated to purchase the crude oil and refined product inventories then owned by J. Aron and located at the leased storage facilities at then current market prices. Our obligations under the agreements are secured by a security interest on substantially all of the assets of PHR, a security interest on the equity interests held by our wholly-owned subsidiary, Par Petroleum, LLC in PHR and a mortgage whereby PHR granted to J. Aron a lien on all real property and improvements owned by PHR, including our refinery.
While title to the crude oil and certain refined product inventories will reside with J. Aron, the Supply and Offtake Agreements will be accounted for similar to a product financing arrangement; therefore, the crude oil and refined products inventories will continue to be included on our consolidated balance sheet until processed and sold to a third party. Each reporting period, we record a liability in an amount equal to the amount we expect to pay to repurchase the inventory held by J. Aron based on current market prices.
For the year ended December 31, 2015, we incurred approximately $6.9 million in handling fees related to the Supply and Offtake Agreements, which are included in Cost of revenues on our consolidated statements of operations. For the year ended December 31, 2015, Interest expense and financing costs, net on our consolidated statements of operations includes approximately $1.5 million of expenses related to the Supply and Offtake Agreements.
The Supply and Offtake Agreements also include a deferred payment arrangement ("Deferred Payment Arrangement") whereby we can defer payments owed under the agreements up to the lesser of $125 million or 85% of the eligible accounts receivable and inventory. Upon execution of the Supply and Offtake Agreements, we paid J. Aron a deferral arrangement fee of $1.3 million. The deferred amounts under the deferred payment arrangement will bear interest at a rate equal to 90-day LIBOR plus 3.75% per annum. We also agreed to pay a deferred payment availability fee equal to 0.75% of the unused capacity under the deferred payment arrangement. Amounts outstanding under the Deferred Payment Arrangement are included in Obligations under inventory financing agreements on our consolidated balance sheets. Changes in the amount outstanding under the Deferred Payment Arrangement are included within Cash flows from financing activities on the consolidated statements of cash flows. As of December 31, 2015, the capacity of the Deferred Payment Arrangement was $63.6 million and we had $35.3 million outstanding.
F-22
PAR PACIFIC HOLDINGS, INC. AND SUBSIDIARIES
Notes to Consolidated Financial Statements
For the Years Ended December 31, 2015, 2014 and 2013
Under the Supply and Offtake Agreements, we pay or receive certain fees from J. Aron based on changes in market prices over time. On September 1, 2015, we entered into an agreement ("Fee Agreement") to fix this market fee for the period from October 1, 2015 through November 30, 2016 whereby J. Aron agreed to pay us a total of $18 million to be settled in fourteen equal monthly payments. The receivable from J. Aron was recorded as a reduction to our Obligations under inventory financing agreements pursuant to our Master Netting Agreement. The $18 million receivable from J. Aron will be recognized in earnings throughout the term of the Fee Agreement. As of December 31, 2015, the receivable was $12.6 million. In February 2016, we entered into another Fee Agreement to fix the market price fee for the remainder of the term of the Supply and Offtake Agreements. The additional amount that J.Aron has agreed to pay is $14.6 million to be settled in eighteen equal monthly payments.
The agreements also provide us with the ability to economically hedge price risk on our inventories and crude oil purchases. Please read Note 12—Derivatives for further information.
Supply and Exchange Agreements
On September 25, 2013, PHR entered into several agreements with Barclays Bank PLC ("Barclays"), referred to collectively as the Supply and Exchange Agreements, for the purpose of managing its working capital and the crude oil and refined product inventory at the refinery. Effective July 31, 2014, we supplemented the Supply and Exchange Agreements by entering into the Refined Product Supply Master Confirmation, pursuant to which Barclays may provide refined product supply and intermediation arrangements to us.
Pursuant to the Supply and Exchange Agreements, Barclays held title to all of the crude oil in the tanks at the refinery and to a majority of our refined product inventory in our tanks at the refinery. Barclays also prepaid us for certain inventory held at locations outside of our refinery. We held title to the inventory during the refining process. Barclays sold the crude oil to us as it was discharged out of the refinery's tanks. We exchanged refined product owned by Barclays stored in our tanks for equal volumes of refined product produced by our refinery when we executed third-party sales of refined product.
For the years ended December 31, 2015, 2014 and 2013, we incurred approximately $6.9 million, $16.5 million and $3.7 million in handling fees related to the Supply and Exchange Agreements, respectively, which are included in Cost of revenues on our consolidated statements of operations. For the years ended December 31, 2015, 2014 and 2013, Interest expense and financing costs, net on our consolidated statements of operations includes approximately $2.3 million, $4.2 million and $1.1 million of expenses related to the Supply and Exchange Agreements, respectively.
Upon execution of the Supply and Offtake Agreements, we terminated the Supply and Exchange Agreements with Barclays, subject to certain obligations to reimburse Barclays for third-party claims. We recognized a loss of $17.4 million on the termination of the agreement which consisted of (i) a loss of $13.3 million for the cash settlement value of the liability which had previously been measured assuming settlement with inventory on hand and (ii) a loss of $5.6 million for the acceleration of deferred financing costs. These losses were partially offset by a $1.5 million exit fee received from Barclays. The net loss of $17.4 million related to the termination of the Supply and Exchange Agreements is included in Loss on termination of financing agreements on our consolidated statements of operations for the year ended December 31, 2015. The cash paid to settle the obligation is included in Payments for termination of supply and exchange agreements in our consolidated statements of cash flows for the year ended December 31, 2015.
F-23
PAR PACIFIC HOLDINGS, INC. AND SUBSIDIARIES
Notes to Consolidated Financial Statements
For the Years Ended December 31, 2015, 2014 and 2013
Note 11—Debt
The following table summarizes our outstanding debt as of December 31, 2015 and 2014 (in thousands):
December 31, | |||||||
2015 | 2014 | ||||||
KeyBank Credit Agreement | $ | 110,000 | $ | — | |||
Term Loan | 60,119 | 89,701 | |||||
HIE Retail Credit Agreement | — | 22,750 | |||||
Texadian Uncommitted Credit Agreement | — | 26,500 | |||||
Principal amount of long-term debt | 170,119 | 138,951 | |||||
Less unamortized discount | (899 | ) | (2,341 | ) | |||
Less deferred financing costs | (4,008 | ) | (5,771 | ) | |||
Total debt, net of unamortized discount and deferred financing costs | 165,212 | 130,839 | |||||
Less current maturities | (11,000 | ) | (29,100 | ) | |||
Long-term debt, net of current maturities | $ | 154,212 | $ | 101,739 | |||
Annual maturities of our long-term debt for the next five years and thereafter are as follows (in thousands):
Year Ended | Amount Due | |||
2016 | $ | 11,000 | ||
2017 | 11,000 | |||
2018 | 71,119 | |||
2019 | 11,000 | |||
2020 | 11,000 | |||
Thereafter | 55,000 | |||
Total | $ | 170,119 | ||
Additionally, as of December 31, 2015, we had approximately $1.2 million in letters of credit outstanding under the Texadian Uncommitted Credit Agreement.
KeyBank Credit Agreement
On December 17, 2015, we entered into the KeyBank Credit Agreement in the form of a revolving credit facility up to $5 million ("KeyBank Revolving Credit Facility"), which provides for revolving loans and for the issuance of letters of credit and a term loan agreement (“KeyBank Term Loans”), which provided term loans totaling $110 million. The proceeds of the KeyBank Term Loans were used to repay in full existing indebtedness under the HIE Retail Credit Agreement and Mid Pac Credit Agreement, to pay transaction fees and expenses and to repay a portion of existing indebtedness under the Term Loan and Bridge Loan Credit Agreement and to facilitate a cash distribution to Par. As of December 31, 2015, we have not made any borrowings under the KeyBank Revolving Credit Facility.
The KeyBank Term Loans mature in seven years and are fully payable on December 17, 2022. Principal on the KeyBank Term loans will be repaid quarterly over the term of the loans. The KeyBank Revolving Credit Facility matures on December 17, 2020 and no more than seven borrowings of Eurodollar loans may be outstanding at any time. Letters of credit issued under the KeyBank Revolving Credit Facility are not to expire later than 30 days prior to the maturity date of the KeyBank Revolving Credit Facility.
The KeyBank Term Loans and advances under the KeyBank Revolving Credit Facility bear interest at a fluctuating rate (i) during the periods such revolving loan or term loan, as applicable, equal to a Base Rate Loan, the Base Rate plus the Applicable Margin (as specified below) and (ii) during the periods such revolving loan or term loan, as applicable, equal to a Eurodollar Loan, the relevant Adjusted Eurodollar Rate for such Eurodollar Loan for the applicable interest period plus the Applicable Margin (as specified below). The effective interest rate for 2015 on the outstanding loan was 3.625%.
F-24
PAR PACIFIC HOLDINGS, INC. AND SUBSIDIARIES
Notes to Consolidated Financial Statements
For the Years Ended December 31, 2015, 2014 and 2013
The applicable margins for the KeyBank Term Loans and advances under the KeyBank Revolving Credit Facility are as specified below:
Applicable Margin for | Applicable Margin for | |||||
Level | Leverage Ratio | Base Rate Loans | Eurodollar Loans | |||
1 | < 3.00x | 1.50% | 2.50% | |||
2 | 3.00x - 3.50x | 1.75% | 2.75% | |||
3 | 3.50x - 4.00x | 2.00% | 3.00% | |||
4 | > 4.00x | 2.25% | 3.25% | |||
We agreed to pay certain fees in connection with the KeyBank Credit Agreement, including usage fees for letters of credit and commitment fees for the unused revolver commitment under the KeyBank Revolving Credit Facility.
Pursuant to the KeyBank Credit Agreement, we are required to comply with various affirmative and negative covenants affecting our business and operations, including compliance with an interest coverage ratio of less than 2.50 to 1.00, a debt service coverage ratio of less than 1.25 to 1.00, and a maximum leverage ratio, calculated on a trailing four-quarters basis, determined as follows:
Period (fiscal quarters) | Maximum Leverage Ratio | |
December 31, 2015 — December 31, 2017 | 4.50 to 1.00 | |
March 31, 2018 — December 31, 2018 | 4.25 to 1.00 | |
March 31, 2019 and each fiscal quarter-end thereafter | 4.00 to 1.00 | |
The loans and letters of credit issued under the KeyBank Credit Agreement are secured by a security interest in and lien on substantially all of the assets of HIE Retail and Mid Pac, a pledge by Par Petroleum, LLC of 100% of its ownership interest in HIE Retail and a pledge by Par Hawaii Inc. of 100% of its ownership interest in Mid Pac.
Term Loan
On July 11, 2014, we and certain subsidiaries entered into a Delayed Draw Term Loan and Bridge Loan Credit Agreement ("Credit Agreement"), amending and restating a previous borrowing arrangement with the lenders, to provide us with a term loan of up to $50 million ("Term Loan") and a bridge loan of up to $75 million ("Bridge Loan"). The lenders under the Credit Agreement include ZCOF Par Petroleum Holdings, LLC and Highbridge International, LLC, who are also our stockholders. Proceeds from the Term Loan were used to fund the additional deposit per the Mid Pac merger agreement, to pay transaction costs, and for working capital and general corporate purposes.
In July 28, 2014, the Credit Agreement was amended and we borrowed an additional $35 million ("Advance") under the Term Loan and on September 10, 2014, we extended the repayment date of the Advance to March 31, 2015.
We had no borrowings under the Bridge Loan and on September 3, 2014, we terminated the Bridge Loan and expensed approximately $1.8 million of financing costs associated with this loan that is included in Loss on termination of financing agreements in our consolidated statement of operations for the year ended December 31, 2014.
On March 11, 2015, we entered into a Third Amendment to the Credit Agreement whereby we extended the repayment date of the Advance to March 31, 2016. Upon the execution of the KeyBank Credit Agreement on December 17, 2015, we repaid the full amount outstanding under the Advance on December 22, 2015.
The Term Loan matures on July 11, 2018 and bears interest at either 10% per annum if paid in cash or 12% per annum if paid in kind, at our election, and has an original issue discount of 5%. The Term Loan is secured by a lien on substantially all of our assets and our subsidiaries, excluding Texadian Energy Inc. ("TEI"), Texadian Energy Canada Limited (“Texadian Canada”), certain of our immaterial subsidiaries and Par Petroleum, LLC and its subsidiaries (collectively “the Guarantors”). All our obligations under the Term Loan are unconditionally guaranteed by the Guarantors.
F-25
PAR PACIFIC HOLDINGS, INC. AND SUBSIDIARIES
Notes to Consolidated Financial Statements
For the Years Ended December 31, 2015, 2014 and 2013
ABL Facility
On September 25, 2013, in connection with the acquisition of PHR, we entered into an asset-based senior secured revolving credit facility (“ABL Facility”) of up to $125 million, of which up to $50 million was available for issuances of letters of credit. The ABL Facility was secured by a lien on substantially all of PHR's assets. We borrowed $15 million on September 25, 2013 under the ABL Facility to fund the acquisition of PHR.
Upon the execution of the Supply and Offtake Agreements in June 2015 (see Note 10—Inventory Financing Agreements), we repaid in full and terminated the ABL Facility and recognized $1.8 million of financing costs associated with the termination of the agreement, which is included within Loss on termination of financing agreements on our consolidated statements of operations for the year ended December 31, 2015.
HIE Retail Credit Agreement
On November 14, 2013, HIE Retail, entered into a Credit Agreement (“Retail Credit Agreement”) in the form of a senior secured loan of up to $30 million and a senior secured revolving line of credit of up to $5 million.
On May 15, 2015, HIE Retail entered into an amendment to the Retail Credit Agreement that terminated the retail revolver, extended the maturity date of $22 million of the existing term loan until March 31, 2022, and provided additional term loan borrowings of up to $7.9 million, on the same terms as the previous term loan.
We repaid in full and terminated the Retail Credit Agreement in December 2015 upon entering into the KeyBank Credit Agreement and expensed $58 thousand of financing costs associated with the Retail Credit Agreement.
Texadian Uncommitted Credit Agreement
On June 12, 2013, TEI and its wholly-owned subsidiary Texadian Canada, entered into an Uncommitted Credit Agreement to provide for loans and letters of credit, on an uncommitted and discretionary basis, in an aggregate amount outstanding not to exceed $50 million. Loans and letters of credit issued under the Uncommitted Credit Agreement were secured by a security interest in and lien on substantially all of TEI's assets, a pledge by TEI of 65% of its ownership interest in Texadian Canada and a pledge by us of 100% of our ownership interest in TEI. The Uncommitted Credit Agreement required TEI to comply with various covenants, including covenants regarding the minimum net working capital and minimum tangible net worth of TEI. The Uncommitted Credit Facility did not permit, at any time, TEI’s consolidated leverage ratio to be greater than 5.00 to 1.00 or its consolidated gross asset coverage to be equal to or less than zero.
On February 20, 2015, the Uncommitted Credit Agreement was amended and restated, increasing the uncommitted loans and letters of credit capacity to $200 million and extending the maturity date. The agreement expired in February 2016.
As of December 31, 2015, we had $2.0 million of letters of credit outstanding related to this agreement.
Mid Pac Credit Agreement
On April 1, 2015, PHI and Mid Pac entered into the Mid Pac Credit Agreement in the form of a senior secured term loan in the amount of $50 million and a senior secured revolving line of credit in the aggregate principal amount of up to $5 million scheduled to mature on April 1, 2018. We borrowed the full amount of the loans at the closing. The proceeds of the loans were used to repay certain existing debt of PHI and Mid Pac totaling $45.3 million, pay a portion of the acquisition consideration and for general corporate purposes. We repaid in full and terminated the Mid Pac Credit Agreement upon entering into the KeyBank Credit Agreement and expensed $381 thousand of financing costs associated with the Mid Pac Credit Agreement, which is included within Loss on termination of financing agreements on our consolidated statements of operations for the year ended December 31, 2015.
Cross Default Provisions
Included within each of our debt agreements are customary cross default provisions that require the repayment of amounts outstanding on demand should an event of default occur and not be cured within the permitted grace period, if any. As of December 31, 2015, we are in compliance with all of our credit agreements.
F-26
PAR PACIFIC HOLDINGS, INC. AND SUBSIDIARIES
Notes to Consolidated Financial Statements
For the Years Ended December 31, 2015, 2014 and 2013
Guarantors
In connection with our shelf registration statement on Form S-3, which was filed with the SEC on June 1, 2015 and declared effective on June 23, 2015 (“Registration Statement”), we may sell non-convertible debt securities and other securities in one or more offerings with an aggregate initial offering price of up to $750 million. Any non-convertible debt securities issued under the Registration Statement may be fully and unconditionally guaranteed (except for customary release provisions), on a joint and several basis, by some or all of our subsidiaries, other than subsidiaries that are “minor” within the meaning of Rule 3-10 of Regulation S-X (the “Guarantor Subsidiaries”). The Company has no “independent assets or operations” within the meaning of Rule 3-10 of Regulation S-X and certain of the Guarantor Subsidiaries may be subject to restrictions on their ability to distribute funds to the Company, whether by cash dividends, loans or advances.
Note 12—Derivatives
We utilize crude oil commodity derivative contracts to manage our price exposure to our inventory positions, future purchases of crude oil and future sales of refined products. The derivative contracts that we execute to manage our price risk include exchange traded futures, options and over-the-counter (“OTC”) swaps. Our futures, options and OTC swaps are marked-to-market and changes in the fair value of these contracts are recognized within Cost of revenues on our consolidated statements of operations.
We are obligated to repurchase the crude oil and refined products from J.Aron at the termination of the Supply and Offtake Agreements. We have determined that this obligation contains an embedded derivative, similar to forward purchase contracts of crude oil and refined products. As such, we have accounted for this embedded derivative at fair value with changes in the fair value recorded in Cost of revenues on our consolidated statement of operations.
We have entered into forward purchase contracts for crude oil and forward sales contracts of refined products. We elect the normal purchases normal sales (“NPNS”) exception for all forward contracts that meet the definition of a derivative and are not expected to net settle. Any gains and losses with respect to these forward contracts designated as NPNS are not reflected in earnings until the delivery occurs. During 2014, we entered into certain physical forward crude oil contracts that did not qualify for or for which we did not elect the NPNS exception. Changes in the fair value of those contracts were recorded in earnings.
We are exposed to interest rate volatility in our outstanding debt and in the Supply and Offtake Agreements. We may enter into interest rate swaps, interest rate caps, interest rate collars or other similar contracts to manage our interest rate risk. As of December 31, 2015, we had not executed such contracts, however in February 2016, we entered into interest rate swaps with an aggregate notional amount of $200 million at an average fixed rate of 1.1%. The interest rate swaps mature in February 2019 and March 2021.
We elect to offset fair value amounts recognized for derivative instruments executed with the same counterparty under a master netting agreement. Our consolidated balance sheets present derivative assets and liabilities on a net basis. Please read Note 13—Fair Value Measurements for the gross fair value and net carrying value of our derivative instruments. Our cash margin that is required as collateral deposits cannot be offset against the fair value of open contracts except in the event of default.
At December 31, 2015, our open commodity derivative contracts represent:
• | futures and OTC swaps purchases of 403 thousand barrels that economically hedge our forecasted sales of refined products; |
• | sold OTC swaps of 95 thousand barrels that economically hedge our refined products inventory; |
• | futures sales of 239 thousand barrels that economically hedge our physical inventory for our Texadian segment; and |
• | option collars of 52 thousand barrels per month through December 2017 that economically hedge our internally consumed fuel. |
F-27
PAR PACIFIC HOLDINGS, INC. AND SUBSIDIARIES
Notes to Consolidated Financial Statements
For the Years Ended December 31, 2015, 2014 and 2013
The following table provides information on the fair value amounts (in thousands) of these derivatives as of December 31, 2015 and 2014 and their placement within our consolidated balance sheets.
December 31, | |||||||||
Balance Sheet Location | 2015 | 2014 | |||||||
Asset (Liability) | |||||||||
Commodity derivatives (1) | Prepaid and other current assets | $ | 4,577 | $ | 1,015 | ||||
Commodity derivatives (1) | Other accrued liabilities | (9,534 | ) | — | |||||
Commodity derivatives (1) | Other liabilities | (4,925 | ) | — | |||||
J. Aron repurchase obligation derivative | Obligations under inventory financing agreements | 9,810 | — | ||||||
_________________________________________________________
(1) Does not include cash collateral of $20.9 million recorded in Prepaid and other current assets and $7.0 million in Other long-term assets as of December 31, 2015.
The following table summarizes the pre-tax gain (loss) recognized in our consolidated statement of operations resulting from changes in fair value of derivative instruments not designated as hedges charged directly to earnings (in thousands):
Year Ended December 31, | |||||||||||||
Statement of Operations Classification | 2015 | 2014 | 2013 | ||||||||||
Commodity derivatives | Cost of revenues | $ | 14,367 | $ | 8,228 | $ | 410 | ||||||
J. Aron repurchase obligation derivative | Cost of revenues | 12,654 | — | — | |||||||||
F-28
PAR PACIFIC HOLDINGS, INC. AND SUBSIDIARIES
Notes to Consolidated Financial Statements
For the Years Ended December 31, 2015, 2014 and 2013
Note 13—Fair Value Measurements
Assets and Liabilities Measured at Fair Value on a Nonrecurring Basis
Purchase Price Allocation of Mid Pac
The fair values of the assets acquired and liabilities assumed as a result of the Mid Pac acquisition were estimated as of the date of the acquisition using valuation techniques described in notes (1) through (7) described below.
Valuation | |||||
Fair Value | Technique | ||||
(in thousands) | |||||
Net working capital | $ | 15,400 | (1) | ||
Property, plant and equipment | 40,997 | (2) | |||
Land | 34,800 | (3) | |||
Goodwill | 27,531 | (4) | |||
Intangible assets | 33,647 | (5) | |||
Other non-current assets | 1,228 | (7) | |||
Deferred tax liability | (16,759 | ) | (6) | ||
Other non-current liabilities | (7,235 | ) | (7) | ||
Total | $ | 129,609 | |||
(1) | Current assets acquired and liabilities assumed were recorded at their net realizable value. |
(2) | The fair value of the property, plant and equipment was estimated using the cost approach. Under the cost approach, the total replacement cost of the property is determined based on industry sources with adjustments for regional factors. The total cost is then adjusted for depreciation based on the physical age of the assets and obsolescence. We consider this to be a Level 3 fair value measurement. |
(3) | The fair value of the land was estimated using the sales comparison approach. Under this approach, the sales prices of similar properties are adjusted to account for differences in land characteristics. We consider this to be a Level 3 fair value measurement. |
(4) | The excess of the purchase price paid over the fair value of the identifiable assets acquired and liabilities assumed is allocated to goodwill. |
(5) | The fair value of customer relationships was estimated using the Excess Earnings Method. Significant inputs used in this model include estimated revenue attributable to the customer relationship and estimated attrition rates. The fair value of the trade names and trademarks was estimated using the Relief from Royalty Method. Significant inputs used in this model include estimated revenue attributable to the trade names and trademarks and a royalty rate. We consider this to be a Level 3 fair value measurement. |
(6) | The deferred tax liability was determined based on the differences between the tax bases of the assets acquired and liabilities assumed and the values of those assets and liabilities recognized on our consolidated balance sheets as of the date of acquisition. |
(7) | Other non-current assets and liabilities were recorded at their estimated net present value. We consider this to be a Level 3 fair value measurement. |
F-29
PAR PACIFIC HOLDINGS, INC. AND SUBSIDIARIES
Notes to Consolidated Financial Statements
For the Years Ended December 31, 2015, 2014 and 2013
Purchase Price Allocation of PHR
The final fair values of the assets acquired and liabilities assumed as a result of the PHR acquisition were estimated as of the date of the acquisition and finalized during the quarter ended September 30, 2014 using valuation techniques described in notes (1) through (7) described below.
Valuation | |||||
Fair Value | Technique | ||||
(in thousands) | |||||
Net working capital | $ | 462,258 | (1) | ||
Property, plant and equipment | 59,670 | (2) | |||
Land | 39,800 | (3) | |||
Goodwill | 13,796 | (4) | |||
Intangible assets | 4,596 | (5) | |||
Contingent consideration liability | (11,980 | ) | (6) | ||
Other non-current liabilities | (7,561 | ) | (7) | ||
Total | $ | 560,579 | |||
(1) | Current assets acquired and liabilities assumed were recorded at their net realizable value. |
(2) | The fair value of the property, plant and equipment was estimated using the cost approach. Under the cost approach, the total replacement cost of the property is determined based on industry sources with adjustments for regional factors. The total cost is then adjusted for depreciation based on the physical age of the assets and obsolescence. We consider this to be a Level 3 fair value measurement. |
(3) | The fair value of the land was estimated using the sales comparison approach. Under this approach, the sales prices of similar properties are adjusted to account for differences in land characteristics. We consider this to be a Level 3 fair value measurement. |
(4) | The excess of the purchase price paid over the fair value of the identifiable assets acquired and liabilities assumed is allocated to goodwill. |
(5) | The fair value of the trade names and trademarks was estimated using a form of the income approach, the Relief from Royalty Method. Significant inputs used in this model include estimated revenue attributable to the trade names and trademarks and a royalty rate. An increase in the estimated revenue or royalty rate would result in an increase in the value attributable to the trade names and trademarks. We consider this to be a Level 3 fair value measurement. |
(6) | The fair value of the liability for contingent consideration was estimated using Monte Carlo simulation. Significant inputs used in the model include estimated future gross margin, annual gross margin volatility and a present value factor. An increase in estimated future gross margin, volatility or the present value factor would result in an increase in the liability. We consider this to be a Level 3 fair value measurement. |
(7) | Other non-current assets and liabilities are recorded at their estimated net present value. |
Investment in Laramie Energy
At December 31, 2015, we conducted an impairment test related to our equity investment in Laramie Energy. As a result of the decline in commodity prices during 2015, we concluded that our equity investment in Laramie Energy was impaired and recognized an other-than-temporary impairment charge of $41.1 million on our consolidated statement of operations for the year ended December 31, 2015. We primarily used a market approach to determine the fair value of our equity investment in Laramie Energy as of December 31, 2015. We used the income approach to corroborate our fair value measurement of Laramie Energy under the market approach. We consider this to be a Level 2 fair value measurement.
F-30
PAR PACIFIC HOLDINGS, INC. AND SUBSIDIARIES
Notes to Consolidated Financial Statements
For the Years Ended December 31, 2015, 2014 and 2013
Assets and Liabilities Measured at Fair Value on a Recurring Basis
Common stock warrants
As of December 31, 2015 and 2014, we had approximately 345 thousand and 749 thousand common stock warrants outstanding, respectively. We estimate the fair value of our outstanding common stock warrants using simulation models, which are considered to be a Level 3 fair value measurement. Significant inputs used in the simulation models include:
December 31, | |||||||
2015 | 2014 | ||||||
Stock price | $ | 23.54 | $ | 16.25 | |||
Weighted-average exercise price | $ | 0.10 | $ | 0.10 | |||
Term (years) | 6.67 | 7.67 | |||||
Risk-free interest rate | 2.04 | % | 2.01 | % | |||
Expected volatility | 43.0 | % | 50.2 | % | |||
The expected volatility is based on the 7-year historical volatilities of comparable public companies. Based on the simulation models, the estimated fair value of the common stock warrants was $23.47 and $16.17 per share as of December 31, 2015 and 2014, respectively. Since the common stock warrants were in the money upon issuance, we do not believe that changes in the inputs to the simulation models will have a significant impact to the value of the common stock warrants other than changes in the value of our common stock. Increases in the value of our common stock will increase the value of the common stock warrants. Likewise, decreases in the value of our common stock will result in a decrease in the value of the common stock warrants.
Derivative instruments
We utilize crude oil commodity derivative contracts to manage our price exposure to our inventory positions, future purchases of crude oil and future sales of refined products. Please read Note 12—Derivatives for further information on derivatives.
We are obligated to repurchase the crude oil and refined products from J.Aron at the termination of the Supply and Offtake Agreements. We have determined that this obligation contains an embedded derivative, similar to forward purchase contracts of crude oil and refined products. As such, we have accounted for this embedded derivative at fair value with changes in the fair value recorded in Cost of revenues on our consolidated statement of operations.
We classify financial assets and liabilities according to the fair value hierarchy. Financial assets and liabilities classified as level 1 instruments are valued using quoted prices in active markets for identical assets and liabilities. These include our exchange traded futures. Level 2 instruments are valued using quoted prices for similar assets and liabilities in active markets and inputs other than quoted prices that are observable for the asset or liability. Our level 2 instruments include OTC swaps and options. These commodity derivatives are valued using market quotations from independent price reporting agencies and commodity exchange price curves that are corroborated with market data. Level 3 instruments are valued using significant unobservable inputs that are not supported by sufficient market activity. The valuation of our J. Aron repurchase obligation derivative requires that we make estimates of the prices and differentials assuming settlement at the end of the reporting period; therefore it is classified as level 3. We do not have other commodity derivatives classified as Level 3 at December 31, 2015 or 2014. Please read Note 12—Derivatives for further information on derivatives.
Contingent consideration
The cash consideration for our acquisition of PHR may be increased pursuant to an earnout provision. The liability is remeasured at the end of each reporting period using an estimate based on actual results to date and a Monte Carlo simulation analysis for future periods. Significant inputs used in the valuation model include estimated future gross margin, annual gross margin volatility and a present value factor. We consider this to be a Level 3 fair value measurement. See Note 14—Commitments and Contingencies for further discussion.
F-31
PAR PACIFIC HOLDINGS, INC. AND SUBSIDIARIES
Notes to Consolidated Financial Statements
For the Years Ended December 31, 2015, 2014 and 2013
Financial Statement Impact
Our assets and liabilities that are measured at fair value on a recurring basis as of December 31, 2015 and 2014 and their placement within our consolidated balance sheet consist of the following (in thousands):
December 31, | |||||||||
Balance Sheet Location | 2015 | 2014 | |||||||
Asset (Liability) | |||||||||
Common stock warrants | Common stock warrants | $ | (8,096 | ) | $ | (12,123 | ) | ||
Contingent consideration | Contingent consideration | (27,581 | ) | (9,131 | ) | ||||
Commodity derivatives (1) | Prepaid and other current assets | 4,577 | 1,015 | ||||||
Commodity derivatives (1) | Other accrued liabilities | (9,534 | ) | — | |||||
Commodity derivatives (1) | Other liabilities | (4,925 | ) | — | |||||
J. Aron repurchase obligation derivative | Obligations under inventory financing agreements | 9,810 | — | ||||||
_________________________________________________________
(1) Does not include cash collateral of $20.9 million included in Prepaid and other current assets and $7.0 million in Other long-term assets as of December 31, 2015.
The following table summarizes the pre-tax gain (loss) recognized in our consolidated statement of operations resulting from changes in fair value of derivative instruments not designated as hedges charged directly to earnings (in thousands):
Year Ended December 31, | |||||||||||||
Statement of Operations Classification | 2015 | 2014 | 2013 | ||||||||||
Common stock warrants | Change in value of common stock warrants | $ | (3,664 | ) | $ | 4,433 | $ | (10,159 | ) | ||||
Contingent consideration | Change in value of contingent consideration | (18,450 | ) | 2,849 | — | ||||||||
Commodity derivatives | Cost of revenues | 14,367 | 8,228 | 410 | |||||||||
J. Aron repurchase obligation derivative | Cost of revenues | 12,654 | — | — | |||||||||
Fair value amounts by hierarchy level as of December 31, 2015 and 2014 are presented gross in the tables below (in thousands):
December 31, 2015 | |||||||||||||||||||||||
Level 1 | Level 2 | Level 3 | Gross Fair Value | Effect of Counter-party Netting | Net Carrying Value on Balance Sheet (1) | ||||||||||||||||||
Assets | |||||||||||||||||||||||
Commodity derivatives | $ | 429 | $ | 33,797 | $ | — | $ | 34,226 | $ | (29,649 | ) | $ | 4,577 | ||||||||||
J. Aron repurchase obligation derivative | — | — | 9,810 | 9,810 | (9,810 | ) | — | ||||||||||||||||
Total | $ | 429 | $ | 33,797 | $ | 9,810 | $ | 44,036 | $ | (39,459 | ) | $ | 4,577 | ||||||||||
Liabilities | |||||||||||||||||||||||
Common stock warrants | $ | — | $ | — | $ | (8,096 | ) | $ | (8,096 | ) | $ | — | $ | (8,096 | ) | ||||||||
Contingent consideration | — | — | (27,581 | ) | (27,581 | ) | — | (27,581 | ) | ||||||||||||||
Commodity derivatives | (396 | ) | (43,712 | ) | — | (44,108 | ) | 29,649 | (14,459 | ) | |||||||||||||
J. Aron repurchase obligation derivative | — | — | — | — | 9,810 | 9,810 | |||||||||||||||||
Total | $ | (396 | ) | $ | (43,712 | ) | $ | (35,677 | ) | $ | (79,785 | ) | $ | 39,459 | $ | (40,326 | ) | ||||||
F-32
PAR PACIFIC HOLDINGS, INC. AND SUBSIDIARIES
Notes to Consolidated Financial Statements
For the Years Ended December 31, 2015, 2014 and 2013
December 31, 2014 | |||||||||||||||||||||||
Level 1 | Level 2 | Level 3 | Gross Fair Value | Effect of Counter-party Netting | Net Carrying Value on Balance Sheet (1) | ||||||||||||||||||
Assets | |||||||||||||||||||||||
Commodity derivatives | $ | 1,015 | $ | — | $ | — | $ | 1,015 | $ | — | $ | 1,015 | |||||||||||
Total | $ | 1,015 | $ | — | $ | — | $ | 1,015 | $ | — | $ | 1,015 | |||||||||||
Liabilities | |||||||||||||||||||||||
Common stock warrants | $ | — | $ | — | $ | (12,123 | ) | $ | (12,123 | ) | $ | — | $ | (12,123 | ) | ||||||||
Contingent consideration | — | — | (9,131 | ) | (9,131 | ) | — | (9,131 | ) | ||||||||||||||
Total | $ | — | $ | — | $ | (21,254 | ) | $ | (21,254 | ) | $ | — | $ | (21,254 | ) | ||||||||
(1) Does not include cash collateral of $28.0 million and $20 thousand as of December 31, 2015 and 2014, respectively included on our consolidated balance sheets.
A roll forward of Level 3 derivative instruments measured at fair value on a recurring basis is as follows (in thousands):
Year Ended December 31, | ||||||||||||
2015 | 2014 | 2013 | ||||||||||
Beginning balance | $ | (21,254 | ) | $ | (29,316 | ) | $ | (10,945 | ) | |||
Settlements | 7,691 | 780 | 3,723 | |||||||||
Acquired | (2,844 | ) | — | (11,980 | ) | |||||||
Total unrealized income (loss) included in earnings | (9,460 | ) | 7,282 | (10,114 | ) | |||||||
Ending balance | $ | (25,867 | ) | $ | (21,254 | ) | $ | (29,316 | ) | |||
The carrying value and fair value of long-term debt and other financial instruments as of December 31, 2015 and 2014 is as follows (in thousands):
Carrying Value | Fair Value (1) | ||||||
December 31, 2015 | |||||||
KeyBank Credit Agreement (2) | $ | 110,000 | $ | 110,000 | |||
Term Loan | 60,119 | 62,037 | |||||
Common stock warrants | 8,096 | 8,096 | |||||
Contingent consideration | 27,581 | 27,581 | |||||
December 31, 2014 | |||||||
Term Loan | $ | 87,360 | $ | 87,068 | |||
HIE Retail Credit Agreement (2) | 22,750 | 22,750 | |||||
Texadian Uncommitted Credit Agreement (2) | 26,500 | 26,500 | |||||
Common stock warrants | 12,123 | 12,123 | |||||
Contingent consideration | 9,131 | 9,131 | |||||
_________________________________________________________
(1) The fair values of these instruments are considered Level 3 measurements in the fair value hierarchy.
(2) Fair value approximates carrying value due to the floating rate interest which approximates a current market value.
We estimate the fair value of the Term Loan using a discounted cash flow analysis and an estimate of the current yield of 9.63% and 14.11% as of December 31, 2015 and 2014, respectively, by reference to market interest rates for term debt of comparable companies.
F-33
PAR PACIFIC HOLDINGS, INC. AND SUBSIDIARIES
Notes to Consolidated Financial Statements
For the Years Ended December 31, 2015, 2014 and 2013
The fair value of all non-derivative financial instruments included in current assets, including cash and cash equivalents, restricted cash and trade accounts receivable, current liabilities and accounts payable approximate their carrying value due to their short term nature.
Note 14—Commitments and Contingencies
In the ordinary course of business, we are a party to various lawsuits and other contingent matters. We establish accruals for specific legal matters when we determine that the likelihood of an unfavorable outcome is probable and the loss is reasonably estimable. It is possible that an unfavorable outcome of one or more of these lawsuits or other contingencies could have a material impact on our liquidity, results of operations or financial condition.
Mid Pac Earnout and Indemnity Dispute
Pursuant to a Stock Purchase Agreement dated August 3, 2011 and amended October 25, 2011 (the “SPA”), Mid Pac purchased all the issued and outstanding stock of Inter Island Petroleum, Inc. (“Inter Island”) from Brian J. and Wendy Barbata (collectively, the “Barbatas”). The SPA provides for an earnout payment to be made to the Barbatas in an amount equal to four times the amount by which the average of Inter Island’s earnings before interest, taxes, depreciation and amortization during the relevant earnout period exceeds $3.5 million. The earnout payment is capped at a maximum of $4.5 million. Mid Pac contends that there are no amounts owed to the Barbatas for the earnout period. By letter dated May 29, 2014, the Barbatas disputed Mid Pac’s computation of the earnout, without explanation of the amount they claim to be owed or refutation of Mid Pac’s analysis. Mid Pac intends to vigorously oppose any such claims.
Any claims by the Barbatas may be offset by Mid Pac’s claims for indemnification under the SPA. By letters dated December 13, 2013 and April 25, 2014, Mid Pac has asserted indemnification claims against the Barbatas exceeding $1 million with respect to environmental losses arising from certain terminals operated by Inter Island and its subsidiaries. The Barbatas have disputed such claims.
Tesoro Earnout Dispute
The cash consideration for our acquisition of PHR is subject to increase pursuant to an earnout provision. For 2014, we contended that there were no amounts owed to Tesoro. Tesoro has disputed our calculation of the 2014 earnout amount and contended that approximately $1 million was owed. Pursuant to the Membership Interest Purchase Agreement dated June 17, 2013, the dispute will be submitted to a mutually acceptable independent accounting firm to be engaged by the parties, as arbiter, to determine the amount owed, if any. In January 2016, the arbiter ruled in favor of Tesoro and we recorded a charge of $1 million during the fourth quarter of 2015.
United Steelworkers Union Dispute
A portion of our employees at the refinery are represented by the United Steelworkers Union (“USW”). On March 23, 2015, the union ratified a four-year extension of the collective bargaining agreement. On January 13, 2016, a claim against us was brought to the United States National Labor Relations Board ("NLRB") alleging a refusal to bargain collectively and in good faith. The Company intends to vigorously oppose such claim.
Environmental Matters
Like other petroleum refiners and exploration and production companies, our operations are subject to extensive and periodically changing federal and state environmental regulations governing air emissions, wastewater discharges and solid and hazardous waste management activities. Many of these regulations are becoming increasingly stringent and the cost of compliance can be expected to increase over time.
Periodically, we receive communications from various federal, state and local governmental authorities asserting violations of environmental laws and/or regulations. These governmental entities may also propose or assess fines or require corrective actions for these asserted violations. We intend to respond in a timely manner to all such communications and to take appropriate corrective action. We do not anticipate that any such matters currently asserted will have a material impact on our financial condition, results of operations or cash flows.
F-34
PAR PACIFIC HOLDINGS, INC. AND SUBSIDIARIES
Notes to Consolidated Financial Statements
For the Years Ended December 31, 2015, 2014 and 2013
Regulation of Greenhouse Gases
The U.S. Environmental Protection Agency ("EPA") has begun regulating greenhouse gases ("GHG") under the Clean Air Act. New construction or material expansions that meet certain GHG emissions thresholds will likely require that, among other things, a GHG permit be issued in accordance with the Clean Air Act regulations and we will be required in connection with such permitting to undertake a technology review to determine appropriate controls to be implemented with the project in order to reduce GHG emissions.
Furthermore, the EPA is currently developing refinery-specific GHG regulations and performance standards that are expected to impose GHG emission limits and/or technology requirements. These control requirements may affect a wide range of refinery operations. Any such controls could result in material increased compliance costs, additional operating restrictions for our business and an increase in cost of the products we produce, which could have a material adverse effect on our financial position, results of operations and liquidity.
On September 29, 2015, the EPA announced a final rule updating standards that control toxic air emissions from petroleum refineries, addressing, among other things, flaring operations, fenceline air quality monitoring and additional emission reductions from storage tanks and delayed coking units. Affected existing sources will be required to comply with the new requirements no later than 2018, with certain refiners required to comply earlier depending on the relevant provision and refinery construction date. We do not anticipate that compliance with this rule will have a material impact on our financial condition, results of operations or cash flows.
In 2007, the State of Hawaii passed Act 234, which required that GHG emissions be rolled back on a statewide basis to 1990 levels by the year 2020. Although delayed, the Hawaii Department of Health has issued regulations that would require each major facility to reduce CO2 emissions by 16% by 2020 relative to a calendar year 2010 baseline (the first year in which GHG emissions were reported to the EPA under 40 CFR Part 98). Those rules are pending final approval by the Government of Hawaii. The refinery’s capacity to reduce fuel use and GHG emissions is limited. However, the state’s pending regulation allows and the refinery should be able to demonstrate, that additional reductions are not cost-effective or necessary in light of the state’s current GHG inventory and future year projections. The pending regulation allows for “partnering” with other facilities (principally power plants) which have already dramatically reduced greenhouse emissions or are on schedule to reduce CO2 emissions in order to comply with the state’s Renewable Portfolio Standards.
Fuel Standards
In 2007, the U.S. Congress passed the EISA, which, among other things, set a target fuel economy standard of 35 miles per gallon for the combined fleet of cars and light trucks in the U.S. States by model year 2020 and contained a second Renewable Fuel Standard (the “RFS2”). In August 2012, the EPA and National Highway Traffic Safety Administration jointly adopted regulations that establish an average industry fuel economy of 54.5 miles per gallon by model year 2025. The RFS2 requires an increasing amount of renewable fuel usage, up to 36 billion gallons by 2022. In the near term, the RFS2 will be satisfied primarily with fuel ethanol blended into gasoline. The RFS2 may present production and logistics challenges for both the renewable fuels and petroleum refining and marketing industries in that we may have to enter into arrangements with other parties or purchase credits from the EPA to meet our obligations to use advanced biofuels, including biomass-based diesel and cellulosic biofuel, with potentially uncertain supplies of these new fuels.
In October 2010, the EPA issued a partial waiver decision under the Clean Air Act to allow for an increase in the amount of ethanol permitted to be blended into gasoline from 10% (“E10”) to 15% (“E15”) for 2007 and newer light duty motor vehicles. In January 2011, the EPA issued a second waiver for the use of E15 in vehicles model years 2001- 2006. There are numerous issues, including state and federal regulatory issues, which need to be addressed before E15 can be marketed on a large scale for use in traditional gasoline engines. Consequently, unless either the state or federal regulations are revised, qualified Renewable Identification Numbers (“RINS”) will be required to fulfill the federal mandate for renewable fuels.
In March 2014, the EPA published a final Tier 3 gasoline standard that lowers the allowable sulfur level in gasoline to 10 parts per million ("ppm") and also lowers the allowable benzene, aromatics and olefins content of gasoline. The effective date for the new standard, January 1, 2017, gives refiners nationwide little time to engineer, permit and implement substantial modifications; however, approved small volume refineries have until January 1, 2020 to meet the standard. In September 2015, our refinery was granted small volume refinery status by the EPA. Along with credit and trading options, potential capital upgrades for the refinery are being evaluated.
There will be compliance costs and uncertainties regarding how we will comply with the various requirements contained in the EISA and other fuel-related regulations. We may experience a decrease in demand for refined petroleum products due to an increase in combined fleet mileage or due to refined petroleum products being replaced by renewable fuels.
F-35
PAR PACIFIC HOLDINGS, INC. AND SUBSIDIARIES
Notes to Consolidated Financial Statements
For the Years Ended December 31, 2015, 2014 and 2013
Environmental Agreement
On September 25, 2013, Hawaii Pacific Energy (a wholly-owned subsidiary of Par created for purposes of the HIE acquisition), Tesoro and PHR entered into an Environmental Agreement (“Environmental Agreement”), which allocated responsibility for known and contingent environmental liabilities related to the acquisition of PHR, including the Consent Decree as described below.
Consent Decree
Tesoro is currently negotiating a consent decree with the EPA and the U.S. Department of Justice concerning alleged violations of the federal Clean Air Act related to the ownership and operation of multiple facilities owned or formerly owned by Tesoro and its affiliates, including the Hawaii refinery. It is anticipated that the Consent Decree will be finalized sometime during 2016 and will require certain capital improvements to our refinery to reduce emissions of air pollutants.
We estimate the cost of compliance with the final decree could be $20 million to $30 million. However, Tesoro is responsible under the Environmental Agreement for reimbursing PHR for all reasonable third-party capital expenditures incurred for the construction, installation and commissioning of such capital projects and for the payment of any fines or penalties imposed on PHR arising from the Consent Decree to the extent related to acts or omission of Tesoro or PHR prior to the Closing Date. Tesoro’s obligation to reimburse PHR for such fines and penalties is not subject to a monetary limitation; however, the obligation relating to fines and penalties terminates on the third anniversary of the Closing Date.
Indemnification
In addition to its obligation to reimburse us for capital expenditures incurred pursuant to the Consent Decree, Tesoro agreed to indemnify us for claims and losses arising out of related breaches of Tesoro’s representations, warranties and covenants in the Environmental Agreement, certain defined “corrective actions” relating to pre-existing environmental conditions, third-party claims arising under environmental laws for personal injury or property damage arising out of or relating to releases of hazardous materials that occurred prior to the Closing Date, any fine, penalty or other cost assessed by a governmental authority in connection with violations of environmental laws by PHR prior to the Closing Date, certain groundwater remediation work, fines or penalties imposed on PHR by the Consent Decree related to acts or omissions of Tesoro prior to the Closing Date and to claims and losses related to the Pearl City Superfund Site.
Tesoro’s indemnification obligations are subject to certain limitations as set forth in the Environmental Agreement. These limitations include a deductible of $1 million and a cap of $15 million for certain of Tesoro’s indemnification obligations related to certain pre-existing conditions as well as certain restrictions regarding the time limits for submitting notice and supporting documentation for remediation actions.
Recovery Trusts
We emerged from the reorganization of Delta Petroleum on August 31, 2012 ("Emergence Date") when the plan of reorganization ("Plan") was consummated. On the Emergence Date, we formed the Delta Petroleum General Recovery Trust (“General Trust”). The General Trust was formed to pursue certain litigation against third parties, including preference actions, fraudulent transfer and conveyance actions, rights of setoff and other claims, or causes of action under the U.S. Bankruptcy Code and other claims and potential claims that the Debtors hold against third parties.
We are the beneficiary of the General Trust, subject to the terms of the respective trust agreement and the Plan. Since the Emergence Date, the General Trust has filed various claims and causes of action against third parties before the Bankruptcy Court, which actions are ongoing. Upon liquidation of the various claims and causes of action held by the General Trust, the proceeds, less certain administrative reserves and expenses, will be transferred to us. It is unknown at this time what proceeds, if any, we will realize from the General Trust’s litigation efforts.
As of December 31, 2015, a total of twelve claims totaling approximately $23.1 million remain to be resolved by the Recovery Trustee. We have agreed to settle six of these claims for aggregate consideration of approximately $666 thousand, subject to final documentation and payment, and have filed or will file notices of objection with respect to liability for the other claims.
The largest remaining proof of claim was filed by the U.S. Government for approximately $22.4 million relating to ongoing litigation concerning a plugging and abandonment obligation in Pacific Outer Continental Shelf Lease OCS-P 0320, comprising part of the Sword Unit in the Santa Barbara Channel, California. We believe the probability of issuing stock to satisfy the full claim amount is remote, as the obligations upon which such proof of claim is asserted are joint and several among all working interest owners and Delta, our predecessor, owned an approximate 2.4% working interest in the unit.
F-36
PAR PACIFIC HOLDINGS, INC. AND SUBSIDIARIES
Notes to Consolidated Financial Statements
For the Years Ended December 31, 2015, 2014 and 2013
The settlement of claims is subject to ongoing litigation and we are unable to predict with certainty how many shares will be required to satisfy all claims. Pursuant to the Plan, allowed claims are settled at a ratio of 54.4 shares per $1,000 of claim. At December 31, 2015, we have reserved approximately $1.1 million representing the estimated value of claims remaining to be settled which are deemed probable and estimable at period end.
Capital Leases
Within our retail segment, we have capital lease obligations related primarily to the leases of five retail stations with initial terms of 17 years and generally five years remaining on the current term, with four five-year renewal options. Minimum annual lease payments including interest, for capital leases are as follows (in thousands):
2016 | $ | 712 | |
2017 | 672 | ||
2018 | 578 | ||
2019 | 433 | ||
2020 | — | ||
Thereafter | — | ||
Total minimum lease payments | 2,395 | ||
Less amount representing interest | 308 | ||
Total minimum rental payments | $ | 2,087 | |
Operating Leases
We have various cancelable and noncancelable operating leases related to land, vehicles, office and retail facilities, railcars and other facilities used in the storage, transportation and sale of crude oil and refined products. The majority of the future lease payments relate to retail stations and facilities used in the storage, transportation and sale of crude oil and refined products. We have operating leases for most of our retail stations with primary terms of up to 50 years with an average of 12 years remaining and generally containing renewal options and escalation clauses. Leases for facilities used in the storage, transportation and sale of crude oil and refined products have various expiration dates extending to 2044.
Our railcar leases contain an empty mileage indemnification provision whereby if the empty mileage exceeds the loaded mileage, we are charged for the empty mileage at the rate established by the tariff of the railroad on which the empty miles accrued.
Minimum annual lease payments for operating leases to which we are legally obligated and having initial or remaining non-cancelable lease terms in excess of one year are as follows (in thousands):
2016 | $ | 27,443 | |
2017 | 18,269 | ||
2018 | 12,864 | ||
2019 | 10,351 | ||
2020 | 5,805 | ||
Thereafter | 24,192 | ||
Total minimum rental payments | $ | 98,924 | |
Rent expense for the years ended December 31, 2015, 2014 and 2013 was approximately $17.7 million, $30.2 million and $6.2 million, respectively.
Major Customers
For the years ended December 31, 2015, 2014 and 2013, no individual customer accounted for more than 10% of our consolidated revenue.
F-37
PAR PACIFIC HOLDINGS, INC. AND SUBSIDIARIES
Notes to Consolidated Financial Statements
For the Years Ended December 31, 2015, 2014 and 2013
Other
On April 22, 2013, Texadian entered into a terminaling and storage agreement whereby the operator would provide storage facilities, access to a marine terminal and pipelines and railcar offloading services. The initial term of the agreement was for a period of four years and Texadian's minimum commitment during the initial term was approximately $28 million. Effective February 1, 2015, Texadian and the counterparty (i) terminated this terminaling and storage agreement and (ii) entered into a new agreement with an initial term of one year. This agreement expired in February 2016.
Note 15—Stockholders' Equity
Common Stock
Our certificate of incorporation contains restrictions on the transfer of certain of our securities in order to preserve the net operating loss carryovers, capital loss carryovers, general business credit carryovers, alternative minimum tax credit carryovers and foreign tax credit carryovers, as well as any “net unrealized built-in loss” within the meaning of Section 382 of the Internal Revenue Service Code, of us or any direct or indirect subsidiary thereof. These restrictions include provisions regarding approval by our Board of Directors of transfers of common stock by holders of five percent or more of the outstanding common stock. Our debt agreements restrict the payment of dividends.
Effective on January 29, 2014 for trading purposes, we amended our certificate of incorporation to implement a one-for-ten (1:10) reverse stock split of our issued and outstanding common stock, par value $0.01 per share. All references in the financial statements to the number of shares of common stock or warrants, price per share and weighted-average number of common stock shares outstanding prior to the 1:10 reverse stock split have been adjusted to reflect this stock split on a retroactive basis, unless otherwise noted.
On November 25, 2015, we issued an aggregate of 3.4 million shares of our common stock to certain pre-existing investors and other investors in a registered direct offering (the “Offering”) at a purchase price of $22.00 per share. The total gross proceeds from the Offering were approximately $74.8 million, before deducting expenses of approximately $1.0 million, for net proceeds of approximately $73.8 million.
In July 2014, we issued, at no charge, one transferable subscription right with respect to each share of our common stock then outstanding. Holders of subscription rights were entitled to purchase 0.21 shares of our common stock for each subscription right held at an exercise price of $16.00 per whole share. The rights offering was fully subscribed and we issued approximately 6.4 million shares of our common stock resulting in net proceeds of approximately $101.5 million in August 2014. We incurred approximately $237 thousand of offering costs which are included as a reduction of Additional paid-in capital on our consolidated balance sheet.
On September 25, 2013, we completed a private placement transaction and issued approximately 14.4 million shares of common stock resulting in net proceeds of approximately $199.2 million. We incurred approximately $830 thousand of offering costs which are included as a reduction of Additional paid-in capital on our consolidated balance sheet.
Registration Rights Agreements
In connection with our emergence from bankruptcy on August 31, 2012, we entered into a registration rights agreement (“Registration Rights Agreement”) providing the stockholders party thereto (“Stockholders”) with certain registration rights.
The Registration Rights Agreement states that at any time after the consummation of a qualified public offering, any Stockholder or group of Stockholders that, together with its or their affiliates, holds more than fifteen percent of the Registrable Shares (as defined in the Registration Rights Agreement), will have the right to require us to file with the SEC a registration statement for a public offering of all or part of its Registrable Shares (each a “Demand Registration”), by delivery of written notice to the company (each, a “Demand Request”).
Within 90 days after receiving the Demand Request, we must file with the SEC the registration statement with respect to the Demand Registration, subject to certain limitations as set forth in the Registration Rights Agreement. We are required to use commercially reasonable efforts to cause the registration statement to be declared effective as soon as practicable after such filing.
In addition, subject to certain exceptions, if we propose to register any class of common stock for sale to the public, we are required, subject to certain conditions, to include all Registrable Shares with respect to which we have received written requests for inclusion.
F-38
PAR PACIFIC HOLDINGS, INC. AND SUBSIDIARIES
Notes to Consolidated Financial Statements
For the Years Ended December 31, 2015, 2014 and 2013
In connection with the closing of a private placement, we entered into an additional registration rights agreement with the purchasers of the shares. Under this registration rights agreement, we agreed to file a registration statement relating to the shares of common stock with the SEC within 60 days after the closing date of the sale which would be declared effective within 180 days of the closing date of the sale. We also agreed to use commercially reasonable efforts to keep the registration statement effective until the earliest to occur of (i) the disposition of all registrable securities, (ii) the availability under Rule 144 of the Securities Act of 1933, as amended, for each holder of registrable securities to immediately freely resell such registrable securities without volume restrictions or (iii) the third anniversary of the effective date of the registration statement.
This registration rights agreement also provides the right for a holder or group of holders of more than $50 million of registrable securities to demand that we conduct an underwritten public offering of the registrable securities. However, the demanding holders are limited to a total of three such underwritten offerings, with no more than one demand request for an underwritten offering made in any 365 day period. Additionally, this registration rights agreement contains customary indemnification rights and obligations for both us and the holders of registrable securities.
If this registration statement does not remain effective for the applicable effectiveness period described above then from the that date until cured, we must pay, as liquidated damages and not as a penalty, an amount in cash equal to 0.25% of the purchaser’s allocated purchase price per calendar month, not to exceed 0.75% of the allocated purchase price.
The registration rights granted in each rights agreement are subject to customary indemnification and contribution provisions, as well as customary restrictions such as suspension periods and, if a registration is for an underwritten offering, limitations on the number of shares to be included in the underwritten offering imposed by the managing underwriter.
Incentive Plans
Our incentive compensation plans are described below.
Long Term Incentive Plan
On December 20, 2012, our Board of Directors (“Board”) approved the Par Petroleum Corporation 2012 Long Term Incentive Plan (“Incentive Plan”). Under the Incentive Plan, the Board, or a committee of the Board, may grant incentive stock options, nonstatutory stock options, restricted stock and restricted stock units to directors and other employees or those of our subsidiaries. The maximum number of shares that may be granted under the 2012 Incentive Plan is 1.6 million shares of common stock. At December 31, 2015, 120 thousand shares were available for future grants and awards.
In the fourth quarter of 2015, our Board authorized an increase in the number of shares issuable under the Incentive Plan to 4.0 million shares of common stock. This authorization is subject to shareholder approval.
Restricted stock and restricted stock units awarded under the Incentive Plan are subject to restrictions, terms and conditions, including forfeitures, as may be determined by the Board. During the period in which such restrictions apply, unless specifically provided otherwise in accordance with the terms of the Incentive Plan, the recipient of the restricted stock or stock unit would be the record owner of the shares and have all of the rights of a stockholder with respect to the shares, including the right to vote and the right to receive dividends or other distributions made or paid with respect to the shares. The fair value of the restricted stock and stock units is generally determined based upon the quoted market price of our common stock on the date of grant. These awards generally vest ratably over a four-year period.
Stock options are issued with an exercise price equal to the fair market value of our common stock on the date of grant and are subject to such other terms and conditions as may be determined by the Board. The options generally expire eight years from the grant date, unless granted by the Board for a shorter term. Option grants generally vest ratably over a four-year period.
Stock Purchase Plan
On June 12, 2014, the Board adopted a Stock Purchase Plan (as amended, the “SPP”) plan. The SPP is limited to the Company’s qualifying executive officers and directors who qualify as accredited investors under Rule 501(a) of the Securities Act of 1933, as amended. The SPP provides that each participant may, subject to compliance with securities laws and other regulations and only during “window periods” as described in our insider trading policy as in effect from time to time, until the later to occur of (a) December 31, 2015 or (b) the eighteen month anniversary of the date that the participant commenced his or her employment or service with us, purchase, in a single transaction, up to $1 million of shares of our common stock ("the SPP Shares") at a per share purchase price equal to the closing price of the common stock on the date of purchase. The sale or transfer of the SPP Shares by such participant would be limited for the earlier of (i) two years from the date of purchase or (ii) the termination of the participant’s service with us or any affiliates for any reason. Additionally, the SPP provides that each purchasing participant will be granted a number of shares of restricted common stock under the Incentive Plan equal to 20% of the SPP Shares purchased with 50% of the
F-39
PAR PACIFIC HOLDINGS, INC. AND SUBSIDIARIES
Notes to Consolidated Financial Statements
For the Years Ended December 31, 2015, 2014 and 2013
restricted common stock vesting on each of the two annual anniversaries of the date of grant. Each purchasing participant will also be granted nonstatutory stock options with a 5-year term to purchase a number of shares of common stock under the Incentive Plan (with an exercise price equal to the Fair Market Value as defined in the Incentive Plan on the date of grant) equal to certain specified percentages of the SPP Shares purchased based on a Black Scholes model with 50% of the options vesting on each of the two annual anniversaries of the date of grant. Such percentages are as follows: 50% for a non-employee chairman of the Board, 35% for non-employee members of the Board and 50% - 70% for executive officers.
Restricted Stock Awards
The following table summarizes our restricted stock activity (in thousands, except per share amounts):
Shares | Weighted- Average Grant Date Fair Value | |||||
Unvested balance at January 1, 2013 | 219 | $ | 12.00 | |||
Granted | 356 | 18.32 | ||||
Vested | (51 | ) | 12.00 | |||
Forfeited | — | — | ||||
Unvested balance at December 31, 2013 | 524 | 16.29 | ||||
Granted | 239 | 18.49 | ||||
Vested | (196 | ) | 15.04 | |||
Forfeited | — | — | ||||
Unvested balance at December 31, 2014 | 567 | 17.65 | ||||
Granted | 214 | 18.24 | ||||
Vested | (229 | ) | 17.29 | |||
Forfeited | (114 | ) | 19.51 | |||
Unvested balance at December 31, 2015 | 438 | $ | 18.84 | |||
For the years ended December 31, 2015, 2014 and 2013, we recognized compensation costs of approximately $3.7 million, $4.8 million and $1.2 million, respectively in General and administrative expenses within our consolidated statements of operations related to restricted stock awards under our Incentive Plan. As of December 31, 2015, 2014 and 2013, there was approximately $7.1 million, $7.5 million and $8.1 million, of total unrecognized compensation costs related to restricted stock awards, which are expected to be recognized on a straight-line basis over a weighted-average period of 2.91 years, 3.75 years and 4.37 years, respectively.
On September 8, 2014, we entered into a separation agreement with our former chief operating officer and he retired. Pursuant to the separation agreement, we agreed to vest approximately 110 thousand shares of unvested restricted common stock issued under the Incentive Plan as follows: (i) approximately 27 thousand shares vested on December 31, 2014 and (ii) approximately 83 thousand shares vested upon the closing of the Mid Pac acquisition. Such shares would have been forfeited under the original terms of the restricted stock grant. As a result of this modification, we recorded $1.7 million of compensation costs during the year ended December 31, 2014.
F-40
PAR PACIFIC HOLDINGS, INC. AND SUBSIDIARIES
Notes to Consolidated Financial Statements
For the Years Ended December 31, 2015, 2014 and 2013
Stock Option Grants
The fair value of each option is estimated on the grant date using the Black-Scholes option-pricing model. The expected term represents the period of time that options are expected to be outstanding and is based upon the term of the option. The expected volatility represents the extent to which our stock price is expected to fluctuate between the grant date and the expected term of the award. We do not use an expected dividend yield in our fair value measurement as we are restricted from payment of dividends. The risk-free rate is the implied yield available on U.S. Treasury securities with a remaining term equal to the expected term of the option at the date of grant. The weighted-average assumptions used to measure stock options granted during 2015 and 2014 are presented below.
2015 | 2014 | ||
Expected life from date of grant (years) | 6.4 | 5.0 | |
Expected volatility | 35.0% | 35.0% | |
Expected dividend yield | —% | —% | |
Risk-free interest rate | 1.81% | 1.76% | |
The following table summarizes our stock option activity (in thousands, except per share amounts):
Number of Options | Weighted-Average Exercise Price | Weighted-Average Remaining Contractual Term in Years | Aggregate Intrinsic Value | |||||||||
Outstanding balance at January 1, 2015 | 401 | $ | 16.18 | 5.5 | $ | — | ||||||
Issued | 257 | 20.68 | ||||||||||
Forfeited / canceled | (17 | ) | 15.12 | |||||||||
Outstanding balance at December 31, 2015 | 641 | $ | 17.77 | 4.9 | $ | 2.5 | ||||||
Exercisable, end of year | 175 | $ | 1.4 | |||||||||
For the years ended December 31, 2015 and 2014, we recognized compensation costs of approximately $1.5 million and $0.2 million, respectively in General and administrative expenses within our consolidated statements of operations. There were no stock options granted during the year ended December 31, 2013. The estimated weighted-average grant-date fair value per share of options granted during the year ended December 31, 2015 and 2014 was $8.36 and $5.91, respectively.
As of December 31, 2015 and 2014, there was approximately $2.8 million and $2.2 million, respectively of total unrecognized compensation costs related to stock option awards, which are expected to be recognized on a straight-line basis over a weighted-average period of 1.93 years and 2.0 years, respectively.
In the fourth quarter of 2015, we issued an aggregate 1.05 million options to our new President and Chief Executive Officer, our Chairman and our Vice Chairman of our board of directors, each with an exercise price of $21.44.These option grants are subject to shareholder approval and therefore are not considered granted.
F-41
PAR PACIFIC HOLDINGS, INC. AND SUBSIDIARIES
Notes to Consolidated Financial Statements
For the Years Ended December 31, 2015, 2014 and 2013
Note 16—Benefit Plans
Defined Contribution Plan
We maintain several defined contribution plans for our employees. Eligible employees can enter the plans either immediately or after one year of service, depending on the plan. The plans permit employee contributions up to the IRS limits per year. For some plans, we contribute 3% of the employee’s eligible compensation to the plan regardless of the employee’s contribution. On all plans, we match a portion of all the employee’s contributions up to 6% depending on the plan. In addition, we have a money purchase pension plan for certain eligible employees. Under this plan, we make contributions to employee directed investment accounts ranging from 5.5% to 8.5% of eligible compensation depending on the employee’s age. For the years ended December 31, 2015, 2014 and 2013, we made contributions to the plans totaling approximately $1.4 million, $1.2 million and $502 thousand, respectively.
Other Post-Retirement Benefits - Medical
Prior to December 31, 2015, we sponsored a post-retirement medical plan to provide health care coverage continuation from the date of retirement to age 65 for qualifying employees. Employees hired before 2006 were generally eligible to participate in the plan after five years of service and reaching the age of 55 and would have paid 20% of the monthly insurance premium. Employees hired after 2006 were generally eligible to participate in the plan after five years of service and reaching the age of 55 and were required to pay 100% of the monthly insurance premium; however, after 10 years of service, they were only required to pay 50% of the monthly insurance premium.
On December 31, 2015, we terminated our post-retirement medical plan and extinguished the remaining benefit obligation of $6.6 million. The plan termination gain of $5.6 million is included as a reduction of Operating expense, excluding depreciation, depletion and amortization expense on our consolidated statement of operations for the year ended December 31, 2015.
The changes in the benefit obligation of our post-retirement medical plan as of and for the years ended December 31, 2015, 2014 and 2013 were as follows (in thousands):
Year Ended December 31, | |||||||||||
2015 | 2014 | 2013 | |||||||||
Benefit obligation at the beginning of year | $ | 5,414 | $ | 4,505 | $ | — | |||||
Acquisition of Par Hawaii Refining | — | — | 4,385 | ||||||||
Service cost | 370 | 260 | 69 | ||||||||
Interest cost | 212 | 194 | 52 | ||||||||
Plan amendments | — | 48 | — | ||||||||
Plan termination | (6,632 | ) | — | — | |||||||
Actuarial loss (gain) | 636 | 407 | (1 | ) | |||||||
Projected benefit obligation at end of year | $ | — | $ | 5,414 | $ | 4,505 | |||||
The post-retirement medical plan was an unfunded plan and therefore had no plan assets as of or during for the years ended December 31, 2015, 2014 and 2013.
The weighted-average discount rates used to determine the benefit obligations as of December 31, 2014 and 2013 were 3.50% and 4.50% respectively. The discount rates were selected by comparing the expected plan cash flows to the December 31, 2014 and 2013 Citigroup Pension Discount Curve. The weighted-average discount rate used to determine net periodic benefit costs for the years ended December 31, 2015, 2014 and 2013 was 3.5%, 4.5% and 4.5%, respectively.
F-42
PAR PACIFIC HOLDINGS, INC. AND SUBSIDIARIES
Notes to Consolidated Financial Statements
For the Years Ended December 31, 2015, 2014 and 2013
Note 17—Income (Loss) Per Share
Basic loss per share is computed by dividing net loss by the sum of the weighted-average number of common shares outstanding and the weighted-average number of shares issuable under the common stock warrants, representing 344 thousand shares, 749 thousand shares and 791 thousand shares as of December 31, 2015, 2014, and 2013, respectively. The common stock warrants are included in the calculation of basic loss per share because they are issuable for minimal consideration. The following table sets forth the computation of basic and diluted earnings per share (in thousands, except per share amounts):
Year Ended December 31, | |||||||||||
2015 | 2014 | 2013 | |||||||||
Net loss | $ | (39,911 | ) | $ | (47,041 | ) | $ | (79,173 | ) | ||
Basic weighted-average common stock shares outstanding | 37,678 | 32,739 | 19,740 | ||||||||
Add dilutive effects of common stock equivalents (1) | — | — | — | ||||||||
Diluted weighted-average common stock shares outstanding | 37,678 | 32,739 | 19,740 | ||||||||
Basic and diluted loss per common share | $ | (1.06 | ) | $ | (1.44 | ) | $ | (4.01 | ) | ||
________________________________________________________
(1) | Entities with a net loss from continuing operations are prohibited from including potential common shares in the computation of diluted per share amounts. We have utilized the basic shares outstanding to calculate both basic and diluted loss per share. |
For the years ended December 31, 2015, 2014 and 2013, our weighted-average potentially dilutive securities excluded from the calculation of diluted shares outstanding consisted of 27 thousand, 27 thousand and 135 thousand common stock equivalents related to unvested restricted stock and 50 thousand and 3 thousand common stock equivalents related to stock options, respectively. There were no potentially dilutive stock options for the year ended December 31, 2013.
Note 18—Income Taxes
We have approximately $1.4 billion in net operating loss carryforwards ("NOL carryforwards"); however, we currently have a full valuation allowance against this tax asset. In assessing the realizability of deferred tax assets, management considers whether it is more likely than not that some portion or all of the deferred tax assets will not be realized. The ultimate realization of deferred tax assets is dependent upon the generation of future taxable income during the periods in which those temporary differences become deductible. Management considers the scheduled reversal of deferred tax liabilities, projected future results of operations and tax planning strategies in making this assessment. Based upon the level of historical taxable income, significant book losses during the current and prior periods and projections for future results of operations over the periods in which the deferred tax assets are deductible, among other factors, management concluded that we did not meet the “more likely than not” requirement of ASC 740 in order to recognize deferred tax assets and a valuation allowance has been recorded for the full amount of our net deferred tax assets at December 31, 2015 and 2014.
In connection with our emergence from bankruptcy on August 31, 2012, we experienced an ownership change as defined under Section 382 of the Code. Section 382 generally places a limit on the amount of NOL carryforwards and other tax attributes arising before an ownership change that may be used to offset taxable income after an ownership change. We believe that we have qualified for an exception to the general limitation rules. This exception under Code Section 382(l) (5) provides for substantially less restrictive limitations on our NOL carryforwards; however, the NOL carryforwards would have been eliminated if we had experienced another ownership change within the three year period following our Bankruptcy. Our amended and restated certificate of incorporation places restrictions upon the ability of the certain equity interest holders to transfer their ownership interest us. These restrictions are designed to provide us with the maximum assurance that another ownership change does not occur that could adversely impact our NOL carryforwards.
During the years ended December 31, 2015, 2014 and 2013, no adjustments were recognized for uncertain tax benefits.
Our net taxable income must be apportioned to various states based upon the income tax laws of the states in which we derive our revenue. Our NOL carryforwards will not always be available to offset taxable income apportioned to the various states. The states from which our refining, retail and logistics revenues are derived are not the same states in which our NOLs were incurred; therefore we expect to incur state tax liabilities on the net income of refining, retail and logistics operations.
F-43
PAR PACIFIC HOLDINGS, INC. AND SUBSIDIARIES
Notes to Consolidated Financial Statements
For the Years Ended December 31, 2015, 2014 and 2013
During 2015, we recorded a benefit for the release of $16.8 million of our valuation allowance as we expect to be able to utilize a portion of our net operating loss ("NOL") carryforwards to offset future taxable income of Mid Pac. During 2016 and thereafter, we will continue to assess the realizability of our deferred tax assets based on consideration of actual and projected operating results and tax planning strategies. Should actual operating results improve, the amount of the deferred tax asset considered more likely than not to be realizable could be increased.
Income (loss) before income taxes related to our foreign operations was a loss of $0.9 million, $1.4 million and $0.1 million for the years ended December 31, 2015, 2014, and 2013, respectively.
Income tax expense (benefit) consisted of the following (in thousands):
Year Ended December 31, | |||||||||||
2015 | 2014 | 2013 | |||||||||
Current: | |||||||||||
U.S.—Federal | $ | — | $ | — | $ | — | |||||
U.S.—State | — | (264 | ) | (179 | ) | ||||||
Foreign | (299 | ) | (80 | ) | — | ||||||
Deferred: | |||||||||||
U.S.—Federal | (14,685 | ) | (14 | ) | (14 | ) | |||||
U.S.—State | (1,804 | ) | (177 | ) | 193 | ||||||
Foreign | — | 80 | — | ||||||||
Total | $ | (16,788 | ) | $ | (455 | ) | $ | — | |||
Income tax expense was different from the amounts computed by applying U.S. Federal income tax rate of 35% to pretax income as a result of the following:
Year Ended December 31, | ||||||||
2015 | 2014 | 2013 | ||||||
Federal statutory rate | 35.0 | % | 35.0 | % | 35.0 | % | ||
State income taxes, net of federal benefit | 3.2 | % | 1.3 | % | (0.1 | )% | ||
Expiration of capital loss carryover | (25.5 | )% | — | % | — | % | ||
Change in valuation allowance | 25.3 | % | (38.8 | )% | (23.1 | )% | ||
Permanent items | (7.6 | )% | 3.6 | % | (3.7 | )% | ||
Provision to return adjustments | (0.8 | )% | (0.1 | )% | (8.1 | )% | ||
Actual income tax rate | 29.6 | % | 1.0 | % | — | % | ||
F-44
PAR PACIFIC HOLDINGS, INC. AND SUBSIDIARIES
Notes to Consolidated Financial Statements
For the Years Ended December 31, 2015, 2014 and 2013
Deferred tax assets (liabilities) are comprised of the following (in thousands):
December 31, | |||||||
2015 | 2014 | ||||||
Deferred tax assets: | |||||||
Net operating loss | $ | 522,541 | $ | 528,782 | |||
State deferred tax assets | 9,160 | 7,885 | |||||
Capital loss carryforwards | 12,193 | 26,141 | |||||
Property and equipment | 27,372 | 31,116 | |||||
Investment in Laramie Energy | 42,986 | 31,334 | |||||
Contingent consideration | 9,653 | 3,196 | |||||
Other | 9,234 | 6,112 | |||||
Total deferred tax assets | 633,139 | 634,566 | |||||
Valuation allowance | (621,220 | ) | (631,599 | ) | |||
Net deferred tax assets | 11,919 | 2,967 | |||||
Deferred tax liabilities: | |||||||
Property and equipment | $ | — | $ | — | |||
Intangible assets | 9,834 | 1,677 | |||||
Other | 2,023 | 1,272 | |||||
State liabilities | 62 | 57 | |||||
Total deferred tax liabilities | 11,919 | 3,006 | |||||
Total deferred tax liability, net | $ | — | $ | (39 | ) | ||
We have NOL carryforwards as of December 31, 2015 of $1.4 billion for federal income tax purposes. If not utilized, the NOL carryforwards will expire during 2027 through 2033. Our capital loss carryovers as of December 31, 2015 are $34.8 million. If not utilized, these carryovers will expire during 2016. We also have Alternative Minimum Tax Credit Carryovers of $785 thousand. These credits do not expire; however, we must first generate regular taxable income before they can be used.
F-45
PAR PACIFIC HOLDINGS, INC. AND SUBSIDIARIES
Notes to Consolidated Financial Statements
For the Years Ended December 31, 2015, 2014 and 2013
Note 19—Segment Information
During 2015, we changed our reportable segments to separate our retail and logistics operations from our refining operations due to a change in senior leadership, organizational structure, the acquisition of Mid Pac and to reflect how we currently make financial decisions and allocate resources. During 2015, we also began including all general and administrative and acquisition and integration costs in our Corporate and Other segment because we manage those costs on a consolidated basis. Additionally, effective in the fourth quarter of 2015, the crude oil and natural gas operations are included within the Corporate and Other reportable segment. Currently we report the results for the following five business segments: (i) Refining, (ii) Retail, (iii) Logistics, (iv) Texadian and (v) Corporate and Other. The carrying value of our equity investment in Laramie Energy is included in our Corporate and Other segment. Through December 31, 2015, substantially all of our revenues from our logistics segment represent intercompany transactions that are eliminated in consolidation.
We previously reported results for the following three business segments: (i) Refining, Distribution and Marketing, (ii) Natural Gas and Oil Production and (iii) Commodity Marketing and Logistics. We have recast the segment information for the years ended December 31, 2014 and 2013 to conform to the current period presentation. Summarized financial information concerning reportable segments consists of the following (in thousands):
For the year ended December 31, 2015 | Refining | Logistics | Retail | Texadian | Corporate, Eliminations and Other (1) | Total | ||||||||||||||||||
Revenues | $ | 1,895,662 | $ | 82,671 | $ | 283,507 | $ | 132,472 | $ | (327,975 | ) | $ | 2,066,337 | |||||||||||
Costs of revenue | 1,718,729 | 48,660 | 215,194 | 134,780 | (329,995 | ) | 1,787,368 | |||||||||||||||||
Operating expense, excluding DD&A | 95,588 | 5,433 | 35,317 | — | — | 136,338 | ||||||||||||||||||
Lease operating expenses | — | — | — | — | 5,283 | 5,283 | ||||||||||||||||||
Depreciation, depletion and amortization | 9,522 | 3,117 | 5,421 | 854 | 1,004 | 19,918 | ||||||||||||||||||
Impairment expense | — | — | — | 9,639 | — | 9,639 | ||||||||||||||||||
General and administrative expense | — | — | — | — | 44,271 | 44,271 | ||||||||||||||||||
Acquisition and integration costs | — | — | — | — | 2,006 | 2,006 | ||||||||||||||||||
Operating income (loss) | $ | 71,823 | $ | 25,461 | $ | 27,575 | $ | (12,801 | ) | $ | (50,544 | ) | $ | 61,514 | ||||||||||
Interest expense and financing costs, net | (20,156 | ) | ||||||||||||||||||||||
Loss on termination of financing agreements | (19,669 | ) | ||||||||||||||||||||||
Other expense, net | (291 | ) | ||||||||||||||||||||||
Change in value of common stock warrants | (3,664 | ) | ||||||||||||||||||||||
Change in value of contingent consideration | (18,450 | ) | ||||||||||||||||||||||
Equity losses from Laramie Energy, LLC | (55,983 | ) | ||||||||||||||||||||||
Loss before income taxes | (56,699 | ) | ||||||||||||||||||||||
Income tax benefit | 16,788 | |||||||||||||||||||||||
Net loss | $ | (39,911 | ) | |||||||||||||||||||||
Total assets | $ | 516,482 | $ | 53,158 | $ | 115,544 | $ | 29,929 | $ | 177,148 | $ | 892,261 | ||||||||||||
Goodwill | 13,765 | 11,012 | 16,550 | — | — | 41,327 | ||||||||||||||||||
Capital expenditures | 8,573 | 6,089 | 3,643 | 108 | 3,932 | 22,345 | ||||||||||||||||||
________________________________________________________
(1) | Includes eliminations of intersegment revenues and cost of revenues of $330.0 million for the year ended December 31, 2015. |
F-46
PAR PACIFIC HOLDINGS, INC. AND SUBSIDIARIES
Notes to Consolidated Financial Statements
For the Years Ended December 31, 2015, 2014 and 2013
For the year ended December 31, 2014 | Refining | Logistics | Retail | Texadian | Corporate, Eliminations and Other (1) | Total | ||||||||||||||||||
Revenues | $ | 2,816,667 | $ | 70,457 | $ | 231,673 | $ | 189,160 | $ | (199,932 | ) | $ | 3,108,025 | |||||||||||
Costs of revenue | 2,732,817 | 39,910 | 187,150 | 183,511 | (205,916 | ) | 2,937,472 | |||||||||||||||||
Operating expense, excluding DD&A | 111,261 | 4,524 | 25,115 | — | — | 140,900 | ||||||||||||||||||
Lease operating expenses | — | — | — | — | 5,673 | 5,673 | ||||||||||||||||||
Depreciation, depletion and amortization | 6,008 | 1,881 | 2,353 | 2,018 | 2,637 | 14,897 | ||||||||||||||||||
Loss on sale of assets, net | — | — | — | — | 624 | 624 | ||||||||||||||||||
General and administrative expense | — | — | — | — | 34,304 | 34,304 | ||||||||||||||||||
Acquisition and integration costs | — | — | — | — | 11,687 | 11,687 | ||||||||||||||||||
Operating income (loss) | $ | (33,419 | ) | $ | 24,142 | $ | 17,055 | $ | 3,631 | $ | (48,941 | ) | $ | (37,532 | ) | |||||||||
Interest expense and financing costs, net | (17,995 | ) | ||||||||||||||||||||||
Loss on termination of financing agreements | (1,788 | ) | ||||||||||||||||||||||
Other expense, net | (312 | ) | ||||||||||||||||||||||
Change in value of common stock warrants | 4,433 | |||||||||||||||||||||||
Change in value of contingent consideration | 2,849 | |||||||||||||||||||||||
Equity earnings from Laramie Energy, LLC | 2,849 | |||||||||||||||||||||||
Loss before income taxes | (47,496 | ) | ||||||||||||||||||||||
Income tax benefit | 455 | |||||||||||||||||||||||
Net loss | $ | (47,041 | ) | |||||||||||||||||||||
Total assets | $ | 396,760 | $ | 19,070 | $ | 42,389 | $ | 87,695 | $ | 189,322 | $ | 735,236 | ||||||||||||
Goodwill | — | — | 13,796 | 6,990 | — | 20,786 | ||||||||||||||||||
Capital expenditures | 8,720 | 3,259 | 487 | 300 | 1,534 | 14,300 | ||||||||||||||||||
________________________________________________________
(1) | Includes eliminations of intersegment revenues and cost of revenues of $205.9 million for the year ended December 31, 2014. |
F-47
PAR PACIFIC HOLDINGS, INC. AND SUBSIDIARIES
Notes to Consolidated Financial Statements
For the Years Ended December 31, 2015, 2014 and 2013
For the year ended December 31, 2013 | Refining | Logistics | Retail | Texadian | Corporate, Eliminations and Other (1) | Total | ||||||||||||||||||
Revenues | $ | 755,406 | $ | 19,798 | $ | 48,913 | $ | 100,149 | $ | (38,252 | ) | $ | 886,014 | |||||||||||
Costs of revenue | 769,038 | 11,075 | 39,461 | 83,483 | (45,991 | ) | 857,066 | |||||||||||||||||
Operating expense, excluding DD&A | 20,440 | 988 | 5,823 | — | — | 27,251 | ||||||||||||||||||
Lease operating expenses | — | — | — | — | 5,676 | 5,676 | ||||||||||||||||||
Depreciation, depletion and amortization | 1,222 | 468 | 577 | 2,009 | 1,706 | 5,982 | ||||||||||||||||||
Gain on sale of assets, net | — | — | — | — | (50 | ) | (50 | ) | ||||||||||||||||
Trust litigation and settlements | — | — | — | — | 6,206 | 6,206 | ||||||||||||||||||
General and administrative expense | — | — | — | — | 21,494 | 21,494 | ||||||||||||||||||
Acquisition and integration costs | — | — | — | — | 9,794 | 9,794 | ||||||||||||||||||
Operating (income) loss | $ | (35,294 | ) | $ | 7,267 | $ | 3,052 | $ | 14,657 | $ | (37,087 | ) | $ | (47,405 | ) | |||||||||
Interest expense and financing costs, net | (13,285 | ) | ||||||||||||||||||||||
Loss on termination of financing agreements | (6,141 | ) | ||||||||||||||||||||||
Other income, net | 758 | |||||||||||||||||||||||
Change in value of common stock warrants | (10,159 | ) | ||||||||||||||||||||||
Equity earnings from Laramie Energy, LLC | (2,941 | ) | ||||||||||||||||||||||
Loss before income taxes | (79,173 | ) | ||||||||||||||||||||||
Income tax benefit | — | |||||||||||||||||||||||
Net loss | $ | (79,173 | ) | |||||||||||||||||||||
Capital expenditures | $ | 7,328 | $ | 242 | $ | 483 | $ | (1,300 | ) | $ | 1,015 | $ | 7,768 | |||||||||||
________________________________________________________
(1) | Includes eliminations of intersegment revenues and cost of revenues of $46.0 million for the year ended December 31, 2013. |
Note 20—Related Party Transactions
Term Loan
Certain of our stockholders, or affiliates of our stockholders, are the lenders under our Term Loan. In previous years, they received common stock warrants exercisable for shares of common stock in connection with the origination of the Term Loan. Please read Note 11—Debt for further information.
Equity Group Investments ("EGI") and Whitebox - Service Agreements
On September 17, 2013, we entered into letter agreements (“Services Agreements”) with Equity Group Investments (“EGI”), an affiliate of Zell Credit Opportunities Fund, LP ("ZCOF") and Whitebox Advisors, LLC, ("Whitebox") each of which own 10% or more of our common stock directly or through affiliates. Pursuant to the Services Agreements, EGI and Whitebox agreed to provide us with ongoing strategic, advisory and consulting services that may include (i) advice on financing structures and our relationship with lenders and bankers, (ii) advice regarding public and private offerings of debt and equity securities, (iii) advice regarding asset dispositions, acquisitions or other asset management strategies, (iv) advice regarding potential business acquisitions, dispositions or combinations involving us or our affiliates, or (v) such other advice directly related or ancillary to the above strategic, advisory and consulting services as may be reasonably requested by us.
EGI and Whitebox will not receive a fee for the provision of the strategic, advisory or consulting services set forth in the Services Agreements, but may be periodically reimbursed by us, upon request, for (i) travel and out-of-pocket expenses, provided that in the event that such expenses exceed $50 thousand in the aggregate with respect to any single proposed matter, EGI or Whitebox, as applicable, will obtain our consent prior to incurring additional costs and (ii) provided that we provide prior consent to their engagement with respect to any particular proposed matter, all reasonable fees and disbursements of counsel, accountants
F-48
PAR PACIFIC HOLDINGS, INC. AND SUBSIDIARIES
Notes to Consolidated Financial Statements
For the Years Ended December 31, 2015, 2014 and 2013
and other professionals incurred in connection with EGI’s or Whitebox’s, as applicable, services under the Services Agreements. In consideration of the services provided by EGI and Whitebox under the Services Agreements, we agreed to indemnify each of them for certain losses incurred by them relating to or arising out of the Services Agreements or the services provided thereunder.
The Services Agreements have a term of one year and will be automatically extended for successive one-year periods unless terminated by either party at least 60 days prior to any extension date. For the year ended December 31, 2015, $180 thousand in costs were incurred related to these agreements. There were no significant costs incurred related to these agreements during the years ended December 31, 2014 and 2013.
In October 2015, the Company terminated the Services Agreement with Whitebox.
Note 21—Quarterly Financial Data (Unaudited)
Summarized quarterly data for the years ended December 31, 2015 and 2014 consist of the following (in thousands, except per share amounts):
Year Ended December 31, 2015 | |||||||||||||||||
Q1 | Q2 | Q3 | Q4 | ||||||||||||||
Revenues | $ | 543,611 | $ | 583,759 | $ | 495,503 | $ | 443,464 | |||||||||
Operating income (loss) | 17,857 | 27,460 | 26,274 | (10,077 | ) | ||||||||||||
Net income (loss) | 462 | 11,723 | 14,740 | (66,836 | ) | (1) | |||||||||||
Net income (loss) per share | |||||||||||||||||
Basic | $ | 0.01 | $ | 0.31 | $ | 0.39 | $ | (1.72 | ) | ||||||||
Diluted | $ | 0.01 | $ | 0.31 | $ | 0.39 | $ | (1.72 | ) | ||||||||
Year Ended December 31, 2014 | |||||||||||||||||
Q1 | Q2 | Q3 | Q4 | ||||||||||||||
Revenues | $ | 743,246 | $ | 802,137 | $ | 854,286 | $ | 708,356 | |||||||||
Operating income (loss) | (14,802 | ) | (24,380 | ) | (36,598 | ) | 38,428 | ||||||||||
Net income (loss) | (14,568 | ) | (24,677 | ) | (39,456 | ) | 31,660 | ||||||||||
Net income (loss) per share | |||||||||||||||||
Basic | $ | (0.48 | ) | $ | (0.81 | ) | $ | (1.19 | ) | $ | 0.86 | ||||||
Diluted | $ | (0.48 | ) | $ | (0.81 | ) | $ | (1.19 | ) | $ | 0.84 | ||||||
________________________________________________________
(1) | During the fourth quarter of 2015, we recognized an impairment of $41.1 million on our equity investment in Laramie Energy. Please read Note 3—Investment in Laramie Energy, LLC. |
F-49
PAR PACIFIC HOLDINGS, INC. AND SUBSIDIARIES
Notes to Consolidated Financial Statements
For the Years Ended December 31, 2015, 2014 and 2013
Note 22—Supplemental Oil and Gas Disclosures (Unaudited)
Capitalized costs related to oil and gas activities are as follows (in thousands):
December 31, | |||||||
2015 | 2014 | ||||||
Company: | |||||||
Unproved properties | $ | — | $ | — | |||
Proved properties | 1,122 | 1,122 | |||||
1,122 | 1,122 | ||||||
Accumulated depreciation and depletion | (862 | ) | (824 | ) | |||
$ | 260 | $ | 298 | ||||
Company’s share of Laramie Energy: | |||||||
Unproved properties | $ | 9,253 | $ | 15,872 | |||
Proved properties | 202,195 | 183,937 | |||||
211,448 | 199,809 | ||||||
Accumulated depreciation and depletion | (56,241 | ) | (49,666 | ) | |||
$ | 155,207 | $ | 150,143 | ||||
Costs incurred in oil and gas activities including costs associated with assets retirement obligations, are as follows (in thousands):
Year Ended December 31, | |||||||||||
2015 | 2014 | 2013 | |||||||||
Company: | |||||||||||
Development costs incurred on proved undeveloped reserves | $ | — | $ | — | $ | — | |||||
Development costs—other | — | 102 | 142 | ||||||||
Total | $ | — | $ | 102 | $ | 142 | |||||
Company’s share of Laramie Energy: | |||||||||||
Unproved properties acquisition costs | $ | — | $ | — | $ | — | |||||
Development costs—other | 21,747 | 15,599 | 6,380 | ||||||||
Total | $ | 21,747 | $ | 15,599 | $ | 6,380 | |||||
For the years ended December 31, 2015, 2014 and 2013, neither we nor Laramie Energy incurred exploratory well costs so no amounts were capitalized or expensed during these respective periods. Accordingly, there were no suspended exploratory well costs at 2015, 2014 and 2013 that were being evaluated.
F-50
PAR PACIFIC HOLDINGS, INC. AND SUBSIDIARIES
Notes to Consolidated Financial Statements
For the Years Ended December 31, 2015, 2014 and 2013
A summary of the results of operations for oil and gas producing activities, excluding general and administrative costs, is as follows (in thousands):
Year Ended December 31, | |||||||||||
2015 | 2014 | 2013 | |||||||||
Company: | |||||||||||
Revenue | |||||||||||
Oil and gas revenues | $ | 2,019 | $ | 5,984 | $ | 7,739 | |||||
Expenses | |||||||||||
Production costs | 5,283 | 5,673 | 5,696 | ||||||||
Depletion and amortization | 42 | 2,376 | 1,593 | ||||||||
Exploration | — | — | — | ||||||||
Abandoned and impaired properties | — | — | — | ||||||||
Results of operations of oil and gas producing activities | $ | (3,306 | ) | $ | (2,065 | ) | $ | 450 | |||
Company’s share of Laramie Energy: | |||||||||||
Revenue | |||||||||||
Oil and gas revenues | $ | 14,217 | $ | 26,829 | $ | 20,364 | |||||
Expenses | |||||||||||
Production costs | 11,047 | 11,225 | 9,362 | ||||||||
Impairment of unproved properties | 3,977 | — | — | ||||||||
Depletion and amortization | 8,226 | 10,921 | 8,855 | ||||||||
Results of operations of oil and gas producing activities | $ | (9,033 | ) | $ | 4,683 | $ | 2,147 | ||||
Total results of operations of oil and gas producing activities | $ | (12,339 | ) | $ | 2,618 | $ | 2,597 | ||||
Oil and Gas Reserve Information
There are numerous uncertainties inherent in estimating quantities of proved crude oil and natural gas reserves. Crude oil and natural gas reserve engineering is a subjective process of estimating underground accumulations of crude oil and natural gas that cannot be precisely measured. The accuracy of any reserve estimate is a function of the quality of available data and of engineering and geological interpretation and judgment. Results of drilling, testing and production subsequent to the date of the estimate may justify revision of such estimate. Accordingly, reserve estimates are often different from the quantities of crude oil and natural gas that are ultimately recovered.
Estimates of our crude oil and natural gas reserves and present values as of December 31, 2015, 2014 and 2013, were prepared by Netherland, Sewell & Associates, Inc., independent reserve engineers.
F-51
PAR PACIFIC HOLDINGS, INC. AND SUBSIDIARIES
Notes to Consolidated Financial Statements
For the Years Ended December 31, 2015, 2014 and 2013
A summary of changes in estimated quantities of proved reserves for the years ended December 31, 2015, 2014 and 2013 is as follows:
Gas | Oil | NGLS | Total | ||||||||
(MMcf) | (MBbl) | (MBbl) | (MMcfe) (1) | ||||||||
Company: | |||||||||||
Balance at January 1, 2013 | 446 | 286 | — | 2,163 | |||||||
Revisions of quantity estimate | 460 | 16 | — | 557 | |||||||
Extensions and discoveries | 9 | 3 | — | 25 | |||||||
Production | (253 | ) | (69 | ) | — | (667 | ) | ||||
Balance at December 31, 2013(2) | 662 | 236 | — | 2,078 | |||||||
Revisions of quantity estimate | 65 | (67 | ) | 21 | (211 | ) | |||||
Extensions and discoveries | 8 | 1 | — | 14 | |||||||
Production | (134 | ) | (93 | ) | (4 | ) | (716 | ) | |||
Balance at December 31, 2014(3) | 601 | 77 | 17 | 1,165 | |||||||
Revisions of quantity estimate | (330 | ) | (35 | ) | (15 | ) | (630 | ) | |||
Extensions and discoveries | — | — | — | — | |||||||
Production | (83 | ) | (36 | ) | (2 | ) | (311 | ) | |||
Balance at December 31, 2015(4) | 188 | 6 | — | 224 | |||||||
Company’s share of Laramie Energy: | |||||||||||
Balance at January 1, 2013 | 122,650 | 831 | 6,345 | 165,706 | |||||||
Revisions of quantity estimate | (3,944 | ) | (404 | ) | (1,589 | ) | (15,900 | ) | |||
Extensions and discoveries | 71,921 | 173 | 2,788 | 89,688 | |||||||
Production | (4,030 | ) | (16 | ) | (143 | ) | (4,985 | ) | |||
Balance at December 31, 2013(2) | 186,597 | 584 | 7,401 | 234,509 | |||||||
Revisions of quantity estimate | 8,876 | 34 | (1,689 | ) | (1,054 | ) | |||||
Extensions and discoveries | 21,108 | 128 | 489 | 24,808 | |||||||
Production | (4,831 | ) | (18 | ) | (125 | ) | (5,689 | ) | |||
Balance at December 31, 2014(3) | 211,750 | 728 | 6,076 | 252,574 | |||||||
Revisions of quantity estimate | (99,548 | ) | (316 | ) | (2,718 | ) | (117,752 | ) | |||
Extensions and discoveries | 32,041 | 131 | 1,007 | 38,869 | |||||||
Acquisitions and divestures | (5,945 | ) | (20 | ) | (171 | ) | (7,091 | ) | |||
Production | (4,745 | ) | (20 | ) | (149 | ) | (5,759 | ) | |||
Balance at December 31, 2015(4) | 133,553 | 503 | 4,045 | 160,841 | |||||||
Total at December 31, 2015 | 133,741 | 509 | 4,045 | 161,065 | |||||||
__________________________________________________
(1) | MMcfe is based on a ratio of 6 Mcf to 1 barrel. |
(2) | During 2013, the Company's estimated proved reserves, inclusive of the Company's share of Laramie Energy's estimated proved reserves, increased by 68,718 MMcfe or approximately 41%. Extensions and discoveries related to our share of Laramie Energy's estimated proved reserves resulted in an increase of 89,688 MMcfe from the beginning of year reserves. These extensions and discoveries are primarily associated with successful completions by Laramie Energy. |
(3) | During 2014, the Company's estimated proved reserves, inclusive of the Company's share of Laramie Energy's estimated proved reserves, increased by 17,152 MMcfe or approximately 7%. Extensions and discoveries related to our share of Laramie Energy's estimated proved reserves resulted in an increase of 24,808 MMcfe from the beginning of year reserves. These extensions and discoveries are primarily associated with successful completions by Laramie Energy. |
(4) | During 2015, the Company's estimated proved reserves, inclusive of the Company's share of Laramie Energy's estimated proved reserves, decreased by 92,674 MMcfe or approximately 36.5%. Revisions of quantity estimate related to our share of Laramie Energy's estimated proved reserves resulted in a decrease of 117,752 MMcfe from the beginning of year reserves. These revisions of quantity estimate are primarily associated with wells becoming uneconomic during 2015. |
F-52
PAR PACIFIC HOLDINGS, INC. AND SUBSIDIARIES
Notes to Consolidated Financial Statements
For the Years Ended December 31, 2015, 2014 and 2013
Gas | Oil | NGLS | Total | ||||||||
(MMcf) | (MBbl) | (MBbl) | (MMcfe) (1) | ||||||||
December 31, 2013 | |||||||||||
Proved developed reserves | |||||||||||
Company | 662 | 236 | — | 2,078 | |||||||
Company's share of Laramie Energy | 45,072 | 165 | 1,627 | 55,829 | |||||||
Total | 45,734 | 401 | 1,627 | 57,907 | |||||||
Proved undeveloped reserves | |||||||||||
Company | — | — | — | — | |||||||
Company's share of Laramie Energy | 141,525 | 419 | 5,774 | 178,680 | |||||||
Total | 141,525 | 419 | 5,774 | 178,680 | |||||||
December 31, 2014 | |||||||||||
Proved developed reserves | |||||||||||
Company | 601 | 77 | 17 | 1,165 | |||||||
Company's share of Laramie Energy | 48,855 | 195 | 1,226 | 57,381 | |||||||
Total | 49,456 | 272 | 1,243 | 58,546 | |||||||
Proved undeveloped reserves | |||||||||||
Company | — | — | — | — | |||||||
Company's share of Laramie Energy | 162,895 | 533 | 4,850 | 195,193 | |||||||
Total | 162,895 | 533 | 4,850 | 195,193 | |||||||
December 31, 2015 | |||||||||||
Proved developed reserves | |||||||||||
Company | 188 | 6 | — | 224 | |||||||
Company's share of Laramie Energy | 65,499 | 248 | 1,931 | 78,573 | |||||||
Total | 65,687 | 254 | 1,931 | 78,797 | |||||||
Proved undeveloped reserves | |||||||||||
Company | — | — | — | — | |||||||
Company's share of Laramie Energy | 68,054 | 255 | 2,114 | 82,268 | |||||||
Total | 68,054 | 255 | 2,114 | 82,268 | |||||||
__________________________________________________
(1) | MMcfe is based on a ratio of 6 Mcf to 1 barrel. |
F-53
PAR PACIFIC HOLDINGS, INC. AND SUBSIDIARIES
Notes to Consolidated Financial Statements
For the Years Ended December 31, 2015, 2014 and 2013
CIG per MMbtu | WTI per Bbl | ||||||
Base pricing, before adjustments for contractual differentials (Company and Laramie Energy): (1) | |||||||
December 31, 2013 | $ | 3.53 | $ | 96.91 | |||
December 31, 2014 | 4.36 | 94.99 | |||||
December 31, 2015 | 2.39 | 50.28 | |||||
______________________________________________
(1) | Proved reserves are required to be calculated based on the 12-month, first day of the month historical average price in accordance with SEC rules. The prices shown above are base index prices to which adjustments are made for contractual deducts and other factors. |
Future net cash flows presented below are computed using applicable prices (as summarized above) and costs and are net of all overriding royalty revenue interests.
December 31, | |||||||||||
2015 | 2014 | 2013 | |||||||||
(in thousands) | |||||||||||
Company: | |||||||||||
Future net cash flows | $ | 690 | $ | 10,452 | $ | 26,861 | |||||
Future costs | |||||||||||
Production | 345 | 7,760 | 21,999 | ||||||||
Development and abandonment | 25 | 37 | 319 | ||||||||
Income taxes (1) | — | — | — | ||||||||
Future net cash flows | 320 | 2,655 | 4,543 | ||||||||
10% discount factor | (128 | ) | (889 | ) | (1,006 | ) | |||||
Discounted future net cash flows | $ | 192 | $ | 1,766 | $ | 3,537 | |||||
Company’s share of Laramie Energy: | |||||||||||
Future net cash flows | $ | 425,596 | $ | 1,268,704 | $ | 984,205 | |||||
Future costs | |||||||||||
Production | 249,831 | 539,796 | 430,506 | ||||||||
Development and abandonment | 72,462 | 236,027 | 234,905 | ||||||||
Income taxes (1) | — | — | — | ||||||||
Future net cash flows | 103,303 | 492,881 | 318,794 | ||||||||
10% discount factor | (63,302 | ) | (322,282 | ) | (229,469 | ) | |||||
Discounted future net cash flows | $ | 40,001 | $ | 170,599 | $ | 89,325 | |||||
Total discounted future net cash flows | $ | 40,193 | $ | 172,365 | $ | 92,862 | |||||
(1) No income tax provision is included in the standardized measure of discounted future net cash flows calculation shown above as we do not project to be taxable or pay cash income taxes based on its available tax assets and additional tax assets generated in the development of its reserves because the tax basis of its oil and gas properties and NOL carryforwards exceeds the amount of discounted future net earnings.
F-54
PAR PACIFIC HOLDINGS, INC. AND SUBSIDIARIES
Notes to Consolidated Financial Statements
For the Years Ended December 31, 2015, 2014 and 2013
The principal sources of changes in the standardized measure of discounted net cash flows for the years ended December 31, 2015, 2014 and 2013 are as follows (in thousands):
Company | Company's Share of Laramie Energy | Total | |||||||||
Balance at January 1, 2013 | $ | 8,010 | $ | 71,959 | $ | 79,969 | |||||
Sales of oil and gas production during the period, net of production costs | (2,044 | ) | (10,478 | ) | (12,522 | ) | |||||
Net change in prices and production costs | (3,833 | ) | (2,588 | ) | (6,421 | ) | |||||
Changes in estimated future development costs | — | 8,831 | 8,831 | ||||||||
Extensions, discoveries and improved recovery | 147 | 15,471 | 15,618 | ||||||||
Revisions of previous quantity estimates, estimated timing of development and other | 395 | (4,948 | ) | (4,553 | ) | ||||||
Previously estimated development and abandonment costs incurred during the period | — | 3,142 | 3,142 | ||||||||
Other | 61 | 740 | 801 | ||||||||
Accretion of discount | 801 | 7,196 | 7,997 | ||||||||
Balance at December 31, 2013 | 3,537 | 89,325 | 92,862 | ||||||||
Sales of oil and gas production during the period, net of production costs | (1,288 | ) | (3,763 | ) | (5,051 | ) | |||||
Net change in prices and production costs | (31 | ) | 35,837 | 35,806 | |||||||
Changes in estimated future development costs | 118 | (6,292 | ) | (6,174 | ) | ||||||
Extensions, discoveries and improved recovery | 85 | 4,914 | 4,999 | ||||||||
Revisions of previous quantity estimates, estimated timing of development and other | (1,111 | ) | 27,632 | 26,521 | |||||||
Previously estimated development and abandonment costs incurred during the period | 102 | 14,013 | 14,115 | ||||||||
Other | — | — | — | ||||||||
Accretion of discount | 354 | 8,933 | 9,287 | ||||||||
Balance at December 31, 2014 | 1,766 | 170,599 | 172,365 | ||||||||
Sales of oil and gas production during the period, net of production costs | (479 | ) | (5,753 | ) | (6,232 | ) | |||||
Acquisitions and divestitures | — | (4,789 | ) | (4,789 | ) | ||||||
Net change in prices and production costs | (679 | ) | (153,564 | ) | (154,243 | ) | |||||
Changes in estimated future development costs | 8 | 788 | 796 | ||||||||
Extensions, discoveries and improved recovery | — | 9,273 | 9,273 | ||||||||
Revisions of previous quantity estimates, estimated timing of development and other | (601 | ) | (8,621 | ) | (9,222 | ) | |||||
Previously estimated development and abandonment costs incurred during the period | — | 15,008 | 15,008 | ||||||||
Other | — | — | — | ||||||||
Accretion of discount | 177 | 17,060 | 17,237 | ||||||||
Balance at December 31, 2015 | $ | 192 | $ | 40,001 | $ | 40,193 | |||||
F-55
SIGNATURES
Pursuant to the requirements of Section 13 or 15(d) of the Securities Exchange of Act of 1934, the registrant has duly caused this report to be signed on its behalf by the undersigned, thereunto duly authorized on March 3, 2016.
PAR PACIFIC HOLDINGS, INC. | ||
By: | /s/ William Pate | |
William Pate | ||
President and Chief Executive Officer | ||
By: | /s/ Christopher Micklas | |
Christopher Micklas | ||
Chief Financial Officer | ||
Pursuant to the requirements of the Securities Exchange Act of 1934, this Form 10-K has been signed below by the following persons on our behalf and in the capacities indicated and on March 3, 2016.
Signature | Title |
/s/ WILLIAM PATE | President and Chief Executive Officer (Principal Executive Officer) |
William Pate | |
/s/ CHRISTOPHER MICKLAS | Chief Financial Officer (Principal Financial Officer) |
Christopher Micklas | |
/s/ KELLY ROSSER | Vice President and Chief Accounting Officer (Principal Accounting Officer) |
Kelly Rosser | |
/s/ MELVYN N. KLEIN | Chairman of the Board of Directors |
Melvyn N. Klein | |
/s/ ROBERT S. SILBERMAN | Vice Chairman of the Board |
Robert S. Silberman | |
/s/ WILLIAM MONTELEONE | Director |
William Monteleone | |
/s/ TIMOTHY CLOSSEY | Director |
Timothy Clossey | |
/s/ L. MELVIN COOPER | Director |
L. Melvin Cooper | |
/s/ CURTIS ANASTASIO | Director |
Curtis Anastasio | |
/s/ WALTER A. DODS, JR. | Director |
Walter A. Dods, Jr. | |
/s/ JOSEPH ISRAEL | Director |
Joseph Israel | |