Attached files
| file | filename |
|---|---|
| 10-K - FIRST FARMERS & MERCHANTS CORP | ff-form10k.htm |
| EX-31 - FIRST FARMERS & MERCHANTS CORP | exhibit31-2.htm |
| EX-31 - FIRST FARMERS & MERCHANTS CORP | exhibit31-1.htm |
| EX-32 - FIRST FARMERS & MERCHANTS CORP | exhibit32-1.htm |
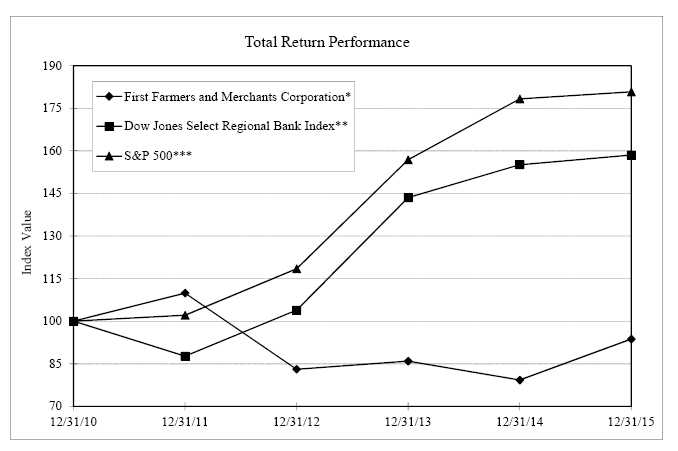
COMPARATIVE PERFORMANCE
Set forth below is a graph comparing the yearly change in the cumulative total shareholder return on the common stock of First Farmers and Merchants Corporation (FF&M in the graph) against the cumulative total return of the S&P 500 Index and the Dow Jones Select Regional Bank Index for the five-year period commencing December 31, 2010 and ending December 31, 2015.
| Period Ending | ||||||
| Index | 12/31/10 | 12/31/11 | 12/31/12 | 12/31/13 | 12/31/14 | 12/31/15 |
| First Farmers and Merchants Corporation(1) | 100.00 | 109.90 | 83.07 | 85.89 | 79.27 | 93.72 |
| Dow Jones Select Regional Bank Index(2) | 100.00 | 87.66 | 103.86 | 143.51 | 155.06 | 158.46 |
| S&P 500(3) | 100.00 | 102.11 | 118.45 | 156.82 | 178.28 | 180.75 |
| (1) | Assumes that the value of the investment in FF&M was $100 on December 31, 2010, with all dividends reinvested. |
| (2) | Assumes that the value of the investment in the index was $100 on December 31, 2010, with all dividends reinvested. |
| (3) | Assumes that the value of the investment in the index was $100 on December 31, 2010, with all dividends reinvested. |
1
MANAGEMENT’S DISCUSSION AND ANALYSIS OF FINANCIAL CONDITION AND RESULTS OF OPERATIONS
FORWARD-LOOKING STATEMENTS
Certain statements contained in this Annual Report to Shareholders may not be based on historical facts and are “forward-looking statements” within the meaning of Section 27A of the Securities Act of 1933, as amended, and Section 21E of the Securities Exchange Act of 1934, as amended. These forward-looking statements may be identified by, among other things, the use of forward-looking terminology such as “believes,” “expects,” “hopes,” “may,” “plans,” “will,” or “anticipates,” or the negatives of such terms. We caution you not to place undue reliance on such forward-looking statements in this Annual Report to Shareholders because results could differ materially from those anticipated as a result of a variety of factors. These forward-looking statements include, without limitation, those relating to the quality of service provided to customers, reduction in net loans, the effect of fluctuating interest rates on net interest income, the stability of market rates, adequate access to capital to meet liquidity needs, capital expenditures, the completion of a new branch, cash dividends, cash flows on impaired loans, the present value of servicing income, deferred tax assets, potential issuance of shares, the fair value of bonds, impairment of securities, lease commitments, troubled debt restructurings, repayment of loans by borrowers, legal claims, capital adequacy requirements, fair value valuation methodologies, fair value of other assets, valuation of financial instruments, post-retirement benefit payments, interest rate sensitivity and risk, diversification of the loan portfolio, gross interest income, the adequacy of allowance for loan and lease losses, loan concentrations, expected maturity of investment securities, intent of management to hold certain loans until maturity or payoff, the value of underlying collateral and the impact of accounting standards on the financial statements. Factors that could affect our results include, but are not limited to, changes in economic conditions; fluctuations in prevailing interest rates and the effectiveness of our risk monitoring systems; our ability to maintain credit quality; our ability to provide market competitive products and services; laws and regulations affecting financial institutions in general; our ability to operate and integrate new technology; the effectiveness of our interest rate hedging strategies; government fiscal and monetary policies; changes in our operating or expansion strategy; changes in our assumptions or estimation methodologies; the availability of and costs associated with maintaining and/or obtaining adequate and timely sources of liquidity; limitations on our ability to pay dividends and to meet our cash obligations; assumptions and judgments about the collectability of our loan portfolio; and our ability to compete with other financial services companies and other factors generally understood to affect the financial results of financial services companies. Except as otherwise required by law, the Company undertakes no obligation to update its forward-looking statements to reflect events or circumstances that occur after the date of this annual report on Form 10-K.
EXECUTIVE OVERVIEW
General
First Farmers and Merchants Corporation (the “Company”) was incorporated on March 31, 1982 as a Tennessee corporation. As of December 31, 2015, the only direct subsidiary of the Company was First Farmers and Merchants Bank (the “Bank”), which conducts the principal business of the consolidated company. The Bank was organized as a national bank in 1954 as a successor to a state bank that was organized in 1909. The Bank remained a national bank until July 5, 2005, when it converted back to a state-chartered bank and changed its name from First Farmers and Merchants National Bank to First Farmers and Merchants Bank. The Bank has direct and indirect subsidiaries through which it holds F&M West, Inc., Maury Tenn, Inc. and Maury Tenn Properties, Inc. The principal executive offices of the Company are located at 816 South Garden Street, Columbia, Maury County, Tennessee. Management of the Company evaluates the financial condition of the Company in terms of the Bank’s operations within its service area.
Financial Condition
The Company’s assets consist primarily of its investment in the Bank and other smaller investments. Its primary activities are conducted through the Bank. The Bank is committed to providing quality services in diverse markets and a changing interest rate environment. Management hopes to provide Bank customers the quality service of a community bank and the safety and strength of a regional institution.
At December 31, 2015, the Company’s consolidated total assets were $1.260 billion, its consolidated net loans were $722.6 million, its total deposits were $1.104 billion and its total shareholders’ equity was $117.8 million. The economic climate in the Company’s market area of Middle Tennessee continued to be stable in 2015, as evidenced by
2
Financial Condition, (continued)
the Company’s loan volume, an increase of 12.2% in net loans at December 31, 2015 compared to December 31, 2014. Total deposits increased by 8.2% and total shareholders’ equity increased by 2.8% over the same period.
Results of Operations
Consolidated net income in 2015 totaled $10.3 million, a 0.6% increase from $10.2 million in 2014 and a 7.2% increase from $9.6 million in 2013. Net interest income increased 6.1% from 2014 and 5.8% from 2013. Although short-term interest rates increased during December 2015, we continue to experience falling loan yields as new volume was added at lower rates. On a per common share basis, net income totaled $2.13 for 2015 versus $2.06 for 2014 and $1.88 for 2013.
The accompanying tables and the discussion and financial information are presented to aid in understanding the Company’s financial position and results of operations. The emphasis of this discussion is on the years ended December 31, 2015, 2014 and 2013; however, financial information for prior years will also be presented where appropriate or required. This discussion should be read in conjunction with the Consolidated Financial Statements and the Notes to Consolidated Financial Statements included elsewhere in this Annual Report to Shareholders.
CRITICAL ACCOUNTING ESTIMATES
The accounting and reporting policies followed by the Company conform, in all material respects, to GAAP and to general practices within the financial services industry. The preparation of financial statements in conformity with GAAP requires management to make estimates and assumptions that affect the amounts reported in the financial statements and accompanying notes. In connection with the application of those principles, the Company’s management has made judgments and estimates that, in the case of determining the ALLL, the recognition of deferred income tax assets and the assessment of impairment of intangibles has been critical to the determination of the Company’s financial position, results of operations and cash flows.
Allowance for Loan and Lease Losses
Our management assesses the adequacy of the allowance for loan and lease losses at the end of each calendar quarter. This assessment includes procedures to estimate the allowance and test the adequacy and appropriateness of the resulting balance. The level of the allowance is based upon management's evaluation of the loan portfolio, past loan loss experience, current asset quality trends, known and inherent risks in the portfolio, adverse situations that may affect the borrowers’ ability to repay the loans (including the timing of future payment), the estimated value of any underlying collateral, composition of the loan portfolio, economic conditions, industry and peer bank loan quality indications and other pertinent factors, including regulatory recommendations. The allowance maintained is believed by management to be adequate to absorb probable losses inherent in the loan portfolio at December 31, 2015. The allowance is increased by provisions charged to expense and decreased by charge-offs, net of recoveries of amounts previously charged-off. Allocation of the allowance may be made for specific loans, but the entire allowance is available for any loan that, in management's judgment, is deemed to be uncollectible.
In assessing the adequacy of the allowance, we also consider the results of our ongoing independent loan review process. We undertake this process both to ascertain those loans in the portfolio with elevated credit risk and to assist in our overall evaluation of the risk characteristics of the entire loan portfolio. Our loan review process includes the judgment of management, independent internal credit analysts, and reviews that may have been conducted by third-party reviewers including regulatory examiners. We incorporate relevant loan review results in the loan impairment determination and the adequacy of the allowance.
3
Allowance for Loan and Lease Losses, (continued)
Our allowance for loan and lease losses is composed of the result of two independent analyses pursuant to the provisions of Accounting Standards Codification (“ASC”) 450-20, Loss Contingencies and ASC 310-10-35, Receivables. The ASC 450-20 analysis is intended to quantify the inherent risk in our performing loan portfolio. The component of the allowance generated by ASC 310-10-35 is the result of an analysis of loans that have been specifically identified as impaired.
The ASC 450-20 component of the allowance for loan and lease losses begins with a process of estimating the probable losses based on our internal system of risk ratings and historical loss data for our risk rated portfolio. Loss estimates are derived from the Bank’s historical loss data by loan categories and compared to peer institutions. As of June 30, 2014 and prior, the look-back period for historical loss data was the prior eight quarters. Subsequently, we have increased our look-back period each quarter to include the most recent quarters’ loss history for a total of 10 quarters as of December 31, 2015.
The allowance allocation for non risk-rated portfolios is based on consideration of our actual historical loss rates and industry loss rates for those particular segments. Non risk-rated loans are evaluated as a group by category rather than on an individual loan basis because these loans are smaller and homogeneous. We weight the allocation methodologies for the non risk-rated loan portfolio and determine a weighted average allocation for these portfolios.
The estimated loan loss allocation for all loan segments is then adjusted for management’s estimate of probable losses for a number of environmental factors. The allocation for environmental factors is particularly subjective and does not lend itself to exact mathematical calculation. This amount represents estimated probable inherent credit losses which exist, but have not yet been identified, as of the balance sheet date, and is based upon quarterly trend assessments in delinquent and nonaccrual loans, unanticipated charge-offs, credit concentration changes, prevailing economic conditions, changes in lending personnel experience, changes in lending policies or procedures and other influencing factors. These environmental factors are considered for each of the five loan segments, and the allowance allocation, as determined by the processes noted above for each segment, is increased or decreased based on the incremental assessment of these various environmental factors.
The second component of the allowance for loan and lease losses is determined pursuant to ASC 310-10-35. Loans are impaired when, based on current information and events, it is probable that we will be unable to collect all amounts due according to the contractual terms of the loan agreement. Collection of all amounts due according to the contractual terms means that both the interest and principal payments of a loan will be collected as scheduled in the loan agreement. This evaluation is inherently subjective as it requires material estimates including the amounts and timing of future cash flows expected to be received on impaired loans that may be susceptible to significant change. Loan losses are charged off when management believes that the full collectability of the loan is unlikely. A loan may be partially charged-off after a “confirming event” has occurred which serves to validate that full repayment pursuant to the terms of the loan is unlikely.
An impairment allowance is recognized if the fair value of the loan is less than the recorded investment in the loan (recorded investment in the loan is the principal balance plus any accrued interest, net of deferred loan fees or costs and unamortized premium or discount). The impairment is recognized through the provision for loan and lease losses and is a component of the allowance. Loans that are impaired are recorded at the present value of expected future cash flows discounted at the loan's effective interest rate, or if the loan is collateral dependent, at the fair value of the collateral, less estimated disposal costs. If the loan is collateral dependent, the principal balance of the loan is charged-off in an amount equal to the impairment measurement. The fair value of collateral dependent loans is derived primarily from collateral appraisals performed by independent third-party appraisers. Management believes it follows appropriate accounting and regulatory guidance in determining impairment and accrual status of impaired loans.
Pursuant to the guidance set forth in Accounting Standards Update (“ASU”) No. 2011-02, A Creditor’s Determination of Whether a Restructuring is a Troubled Debt Restructuring, the above impairment methodology is also applied to those loans identified as troubled debt restructurings.
4
Allowance for Loan and Lease Losses, (continued)
Management tests the resulting total allowance for loan and lease losses by comparing the balance in the allowance to historical trends and industry and peer information. Our management then evaluates the result of the procedures performed, including the results of our testing, and decides on the appropriateness of the balance of the allowance in its entirety. Our board of directors reviews and approves the assessment prior to the filing of quarterly and annual financial information.
While our policies and procedures used to estimate the allowance for loan and lease losses, as well as the resultant provision for loan and lease losses charged to operations, are considered adequate by management and are reviewed from time to time by our regulators, they are inherently imprecise. There are factors beyond our control, such as conditions in the local and national economy, a local real estate market or particular industry conditions which may negatively impact materially our asset quality and the adequacy of our allowance for loan and lease losses and thus the resulting provision for loan losses. See notes 1, 4 and 5 in the consolidated financial statements for more information on the allowance for loan and lease losses.
The following table sets forth the allocation of the allowance to types of loans and the percentage of loans in each category to total loans:
| December 31, | ||||||||||
| 2015 | 2014 | |||||||||
| (dollars in thousands) | ||||||||||
| Balance at end of period applicable to: | Amount | Percent | Amount | Percent | ||||||
| Commercial | $ | 7,402 | 58.5 | % | $ | 6,719 | 58.7 | % | ||
| Residential real estate | 1,061 | 35.7 | % | 1,053 | 35.2 | % | ||||
| Consumer and other retail | 171 | 5.8 | % | 162 | 6.1 | % | ||||
| Total loans | $ | 8,634 | 100.0 | % | $ | 7,934 | 100.0 | % | ||
Deferred Income Tax Assets
Deferred income tax assets consist mainly of the tax effect of excess provisions for loan and lease losses over actual losses incurred, the unrealized loss on available-for-sale securities and deferred compensation. Management believes that it is more likely than not that these assets will be realized in future years.
Impairment of Intangible Assets
Long-lived assets, including purchased intangible assets subject to amortization are reviewed for impairment whenever events or changes in circumstances indicate that the carrying amount of an asset may not be recoverable. Recoverability of assets to be held and used is measured by a comparison of the carrying amount of an asset to estimated undiscounted future cash flows expected to be generated by the asset. If the carrying amount of an asset exceeds its estimated future cash flows, an impairment charge is recognized by the amount by which the carrying amount of the asset exceeds the fair value of the asset. Assets to be disposed of would be separately presented in the balance sheet and reported at the lower of the carrying amount or fair value less costs to sell, and are no longer depreciated. There were no such assets to be disposed of at December 31, 2015.
Goodwill is evaluated for impairment annually and more frequently if events and circumstances indicate that the asset might be impaired. An impairment loss is recognized to the extent that the carrying amount exceeds the asset’s fair value. As of December 31, 2015, the fair value of our goodwill exceeded the carrying value.
5
FINANCIAL CONDITION
Net Interest Margin
Net interest margin is defined as the difference between the revenue from earning assets (primarily interest income) and interest expense related to interest bearing liabilities. Net interest margin is a function of the average balances of earning assets and interest bearing liabilities and the yields earned and rates paid on those balances. In order to succeed in the banking industry, it is critical to maintain the net interest margin at a level that, when coupled with non-interest revenues, exceeds additions to the allowance for loan and lease losses, non-interest expenses and income taxes and yields an acceptable profit.
The Company plans the Bank’s operations with the goal of maintaining a satisfactory spread between the yields on earning assets and the related cost of interest bearing funds. The gross interest spread is determined by comparing the taxable equivalent gross interest margin to average earning assets before deducting the allowance for loan and lease losses. This spread reflects the overall profitability of earning assets, including both those funded by interest bearing sources and those that do not generate interest (primarily non-interest bearing demand deposits). This spread is most often used when analyzing a banking institution’s overall gross margin profitability compared to that of other financial institutions. Management uses calculations and similar ratios to assist in pricing decisions for interest-related products. Table A on the following page presents the average daily balances, the components of the gross interest margin (on a taxable equivalent basis), the yield or rate, and the incremental and gross interest spread for each of the last three years by major categories of assets and liabilities.
6
Net Interest Margin, (continued)
TABLE A - Distribution of Assets, Liabilities, Shareholders’ Equity, Interest Rates and Interest Differential
| Year ended December 31, | ||||||||||||||||||
| 2015 | 2014 | 2013 | ||||||||||||||||
| (Dollars in thousands) |
Average balance3 |
Rate/ yield |
Interest |
Average |
Rate/ |
Interest |
Average balance3 |
Rate/ |
Interest | |||||||||
| ASSETS | ||||||||||||||||||
| Interest earning assets | ||||||||||||||||||
| Loans, net2 | $ | 683,319 | 4.56 | % | $ | 31,139 | $ | 607,957 | 4.72 | % | $ | 28,673 | $ | 572,913 | 5.05 | % | $ | 28,949 |
| Bank deposits | 11,766 | 0.28 | % | 33 | 23,423 | 0.27 | % | 64 | 21,706 | 1.73 | % | 375 | ||||||
| Taxable securities1 | 340,630 | 1.73 | % | 5,891 | 329,621 | 1.79 | % | 5,911 | 311,796 | 1.82 | % | 5,677 | ||||||
| Tax-exempt securities1,2 | 75,220 | 4.47 | % | 3,361 | 69,427 | 5.71 | % | 3,963 | 78,138 | 5.97 | % | 4,667 | ||||||
| Federal funds sold | 6,609 | 0.27 | % | 18 | 7,598 | 0.25 | % | 19 | 12,732 | 0.25 | % | 32 | ||||||
| TOTAL EARNING ASSETS | 1,117,544 | 3.62 | % | $ | 40,442 | 1,038,026 | 3.72 | % | $ | 38,630 | 997,285 | 3.98 | % | $ | 39,700 | |||
| Non-interest earning assets | ||||||||||||||||||
| Cash and due from banks | 19,292 | 18,715 | 16,775 | |||||||||||||||
| Bank premises and equipment | 25,790 | 24,972 | 25,795 | |||||||||||||||
| Other assets | 50,814 | 40,127 | 47,632 | |||||||||||||||
| TOTAL ASSETS | $ | 1,213,440 | $ | 1,121,840 | $ | 1,087,487 | ||||||||||||
| LIABILITES AND | ||||||||||||||||||
| SHAREHOLDERS' EQUITY | ||||||||||||||||||
| Interest bearing liabilities | ||||||||||||||||||
| Time and savings deposits: | ||||||||||||||||||
| NOW and money market accounts | $ | 522,586 | 0.12 | % | $ | 624 | $ | 457,027 | 0.13 | % | $ | 608 | $ | 432,853 | 0.15 | % | $ | 630 |
| Savings | 89,925 | 0.04 | % | 33 | 95,637 | 0.04 | % | 42 | 89,453 | 0.05 | % | 47 | ||||||
| Time up to $100 | 103,342 | 0.56 | % | 576 | 111,931 | 0.65 | % | 733 | 122,947 | 0.75 | % | 916 | ||||||
| Time over $100 | 118,421 | 0.76 | % | 898 | 122,557 | 0.80 | % | 975 | 119,130 | 0.92 | % | 1,101 | ||||||
| TOTAL INTEREST BEARING | ||||||||||||||||||
| DEPOSITS | 834,274 | 0.26 | % | 2,131 | 787,152 | 0.30 | % | 2,358 | 764,383 | 0.35 | % | 2,694 | ||||||
| Federal funds purchased and securities | ||||||||||||||||||
| sold under agreements to repurchase | 25,992 | 0.34 | % | 89 | 21,716 | 0.32 | % | 70 | 19,855 | 0.31 | % | 62 | ||||||
| Other borrowings | 1,880 | 0.27 | % | 5 | - | - | - | 3,868 | 3.90 | % | 151 | |||||||
| TOTAL INTEREST BEARING | ||||||||||||||||||
| LIABILITIES | 862,146 | 0.26 | % | $ | 2,225 | 808,868 | 0.30 | % | $ | 2,428 | 788,106 | 0.37 | % | $ | 2,907 | |||
| Non-interest bearing liabilities | ||||||||||||||||||
| Demand deposits | 219,732 | 187,053 | 173,648 | |||||||||||||||
| Other liabilities | 13,080 | 16,083 | 14,800 | |||||||||||||||
| TOTAL LIABILITIES | 1,094,958 | 1,012,004 | 976,554 | |||||||||||||||
| Shareholders' equity | 118,482 | 109,836 | 110,933 | |||||||||||||||
| TOTAL LIABILITIES AND | ||||||||||||||||||
| SHAREHOLDERS' EQUITY | $ | 1,213,440 | $ |
1,121,840
|
$ |
1,087,487
|
||||||||||||
| Spread between combined rate earned and | ||||||||||||||||||
| combined rates paid* | 3.36 | % | 3.42 | % | 3.61 | % | ||||||||||||
| Net yield on interest-earning assets* | 3.43 | % | 3.49 | % | 3.69 | % | ||||||||||||
* Taxable equivalent adjustments for the periods ending December 31, 2015, December 31, 2014 and December 31, 2013 were $1.8 million, $1.9 million and $2.3 million, respectively.
Notes:
| 1. | U.S. government (agency, state and political subdivision), and corporate debt securities plus equity securities in the available-for-sale and held-to-maturity categories are taxable securities. Most municipal debt securities are nontaxable. |
| 2. | The taxable equivalent adjustment has been computed based on a 34% federal income tax rate and has given effect to the disallowance of interest expense, for federal income tax purposes, related to certain tax-free assets. Loans include nonaccrual loans for all years presented. |
| 3. | The average balances of the amortized cost of available-for-sale securities were used in the calculations in this table. |
7
Net Interest Margin, (continued)
Table B below sets forth, for the periods indicated, a summary of consolidated changes in interest earned and interest paid, reflected by the interest generated by volume changes and the interest generated by changes in the yield or rate. On a tax equivalent basis, net interest income increased $2.4 million for the year ended December 31, 2015 compared to the year ended December 31, 2014 primarily because of increased loan volume. Interest paid on interest bearing deposits was down in 2015 compared to 2014 primarily because of lower average interest rates.
TABLE B - Volume and Yield/Rate Variances
(Taxable Equivalent Basis)
| ` |
2015 compared to 2014 |
2014 compared to 2013 |
||||||||||||||||
|
Volume |
Yield |
Net |
Volume |
Yield |
Net |
|||||||||||||
| Revenue earned on | ||||||||||||||||||
| Loans, net2 | $ | 3,434 | $ | (968 | ) | $ | 2,466 | $ | 1,770 | $ | (2,046 | ) | $ | (276 | ) | |||
| Bank deposits | (32 | ) | 1 | (31 | ) | 30 | (341 | ) | (311 | ) | ||||||||
| Investment securities: | ||||||||||||||||||
| Taxable securities3 | 190 | (211 | ) | (21 | ) | 324 | (90 | ) | 234 | |||||||||
| Tax-free securities2 | 259 | (860 | ) | (601 | ) | (520 | ) | (184 | ) | (704 | ) | |||||||
| Federal funds sold | (3 | ) | 2 | (1 | ) | (13 | ) | - | (13 | ) | ||||||||
| Total interest earning assets | 3,848 | (2,036 | ) | 1,812 | 1,591 | (2,661 | ) | (1,070 | ) | |||||||||
| Interest paid on | ||||||||||||||||||
| NOW and money market accounts | 79 | (63 | ) | 16 | 39 | (61 | ) | (22 | ) | |||||||||
| Savings deposits | (2 | ) | (7 | ) | (9 | ) | 3 | (8 | ) | (5 | ) | |||||||
| Time deposits up to $100 | (48 | ) | (109 | ) | (157 | ) | (83 | ) | (100 | ) | (183 | ) | ||||||
| Time deposits over $100 | (31 | ) | (46 | ) | (77 | ) | 32 | (158 | ) | (126 | ) | |||||||
| Federal funds purchased and securities | ||||||||||||||||||
| sold under agreements to repurchase | 15 | 4 | 19 | 6 | 2 | 8 | ||||||||||||
| Other borrowings | 5 | - | 5 | (151 | ) | - | (151 | ) | ||||||||||
| Total interest-bearing funds | 18 | (221 | ) | (203 | ) | (154 | ) | (325 | ) | (479 | ) | |||||||
| Net interest earnings | $ | 3,830 | $ | (1,815 | ) | $ | 2,015 | $ | 1,745 | $ | (2,336 | ) | $ | (591 | ) | |||
Notes:
1. The change in interest earned or paid resulting from both volume and rate or yield has been allocated accordingly in proportion to the relationship of the absolute amounts of the change in each. Loans include nonaccrual loans for all years presented.
2. The computation of the taxable equivalent adjustment has given effect to the disallowance of interest expense, for federal income tax purposes, related to certain tax-exempt assets.
3. U.S. government (agency, state and political subdivision), and corporate debt securities plus equity securities in the available-for-sale and held-to-maturity categories are taxable securities.
Overview of Assets and Liabilities
Average earning assets increased 7.7% in 2015 compared to 2014 and increased 4.1% in 2014 compared to 2013. As a financial institution, the Company’s primary earning assets are loans made by the Bank. In 2015, average net loans represented 61.1% of average earning assets compared to 58.6% of average earnings assets in 2014. Average net loans increased 12.4% in 2015 compared to 2014 and increased 6.1% in 2014 compared to 2013. We anticipate average net loans will increase throughout 2016 because of the strong loan demand momentum experienced in 2015.
8
Overview of Assets and Liabilities, (continued)
Average investment securities, which comprised 37.2% of average earning assets in 2015, increased 4.2% from 2014 compared to a 2.3% increase in 2014 from 2013. We anticipate average investment securities to decline as a percentage of average earnings assets in 2016. Average total assets increased 8.2% in 2015 compared to a 3.2% increase in 2014 from 2013.
The Bank’s average interest-bearing deposits increased 6.0% in 2015 compared to 2014. Most of the increase is attributable to money market accounts, in which the average balance increased 14.3% from 2015 compared to 2014. Time deposits up to $100,000 decreased 7.7% as of December 31, 2015 compared to December 31, 2014 and time deposits over $100,000 decreased 3.4% over the same period. Average savings deposits decreased 6.0% in 2015 compared to 2014. Savings deposits have historically been steady providers of a core, low cost source of funding.
Customer relationship development helped maintain a relatively stable base in non-interest bearing deposits during 2015. The Bank’s non-interest bearing deposits have remained strong and were 20.9% of average total deposits in 2015, 19.2% of average total deposits in 2014 and 18.5% of average total deposits in 2013. Average non-interest bearing deposits increased 17.5% for 2015 and 7.7% for 2014.
The Bank has a Blanket Agreement for Advances and Security Agreement with the Federal Home Loan Bank (“FHLB”) for term debt or other obligations. For more information, see Note 10 of the Notes to Consolidated Financial Statements included elsewhere in this Annual Report to Shareholders.
Loans and Loan Quality
The Bank’s loan portfolio is the largest component of earning assets and, therefore, provides the highest amount of revenue. The loan portfolio also contains the highest exposure to risk, as a result of credit quality. When analyzing potential loans, management assesses both interest rate objectives and credit quality objectives in determining whether to authorize a given loan and the appropriate pricing for that loan. The Bank maintains a diversified portfolio in order to spread its risk and reduce its exposure to economic downturns that may occur in different segments of the economy or in particular industries. The composition of the loan portfolio is disclosed in detail in Note 4 in the Notes to Consolidated Financial Statements included elsewhere in this Annual Report to Shareholders.
The following table presents the maturities of the Bank’s loans by category as of December 31, 2015:
| One to five | ||||||||
| Within one year | years | After five years | Total | |||||
|
(dollars in thousands) |
||||||||
| Commercial: | ||||||||
| Commercial and industrial | $ | 32,100 | $ | 62,863 | $ | 32,936 | $ | 127,899 |
| Non-farm, nonresidential real estate | 7,462 | 73,939 | 79,608 | 161,009 | ||||
| Construction and development | 31,015 | 15,301 | 5,014 | 51,330 | ||||
| Commercial loans secured by real estate | 5,141 | 14,338 | 8,612 | 28,091 | ||||
| Other commercial | 721 | 4,228 | 55,376 | 60,325 | ||||
| Total commercial | 76,439 | 170,669 | 181,546 | 428,654 | ||||
| Retail: | ||||||||
| Consumer | 3,175 | 6,117 | 622 | 9,914 | ||||
| Single family residential | 2,673 | 23,527 | 234,054 | 260,254 | ||||
| Other retail | 1,475 | 7,741 | 23,228 | 32,444 | ||||
| Total retail | 7,323 | 37,385 | 257,904 | 302,612 | ||||
| Total loans | $ | 83,762 | $ | 208,054 | $ | 439,450 | $ | 731,266 |
9
Loan and Loan Quality, (continued)
The lending activities of the Bank are subject to written underwriting standards and policies established by the Bank’s Board of Directors and management that include loan review procedures and approvals. Depending primarily on the dollar amount of the loan, there are various approval levels required, including that of the Executive Committee of the Bank’s Board of Directors.
The composition of the Bank’s loan and lease portfolio for the years presented were as follows:
| 2015 |
Percentage of total |
2014 | 2013 | 2012 | 2011 | |||||||
| (dollars in thousands) | ||||||||||||
| Commercial: | ||||||||||||
| Commercial and industrial | $ | 127,899 | 17.5 | % | $ | 99,788 | $ | 94,702 | $ | 83,631 | $ | 60,448 |
| Non-farm, non-residential real estate | 161,009 | 22.0 | % | 163,461 | 176,213 | 167,565 | 140,147 | |||||
| Construction and development | 51,330 | 7.0 | % | 50,424 | 29,938 | 36,323 | 29,042 | |||||
| Commercial loans secured by real estate | 28,091 | 3.8 | % | 27,937 | 26,940 | 23,983 | 4,095 | |||||
| Other commercial | 60,325 | 8.2 | % | 41,185 | 26,582 | 24,423 | 47,696 | |||||
| Total commercial | 428,654 | 58.5 | % | 382,795 | 354,375 | 335,925 | 281,428 | |||||
| Retail: | ||||||||||||
| Consumer | 9,914 | 1.4 | % | 9,536 | 10,957 | 11,621 | 14,297 | |||||
| Single family residential | 260,254 | 35.7 | % | 229,559 | 213,763 | 196,349 | 196.913 | |||||
| Other retail | 32,444 | 4.4 | % | 30,162 | 27,671 | 23,264 | 25,700 | |||||
| Total retail | 302,612 | 41.5 | % | 269,257 | 252,391 | 231,234 | 236,910 | |||||
| Total loans | $ | 731,266 | 100.0 | % | $ | 652,052 | $ | 606,766 | $ | 567,159 | $ | 518,338 |
The composition of the Bank’s outstanding loans by Tennessee County for the quarters presented were as follows:
| Loan Balances by County: | 2015 | 2014 | 2013 | 2012 | 2011 | |||||
| (dollars in thousands) | ||||||||||
| Davidson | $ | 63,958 | $ | 16,131 | $ | - | $ | - | $ | - |
| Dickson | 4,514 | 4,463 | 5,095 | 5,730 | 7,253 | |||||
| Giles | 55,554 | 48,458 | 38,848 | 42,209 | 31,313 | |||||
| Hickman | 28,912 | 29,109 | 28,756 | 23,563 | 23,097 | |||||
| Lawrence | 114,980 | 111,202 | 114,386 | 101,103 | 101,319 | |||||
| Marshall | 23,679 | 22,017 | 21,256 | 24,130 | 25,948 | |||||
| Maury | 320,734 | 308,987 | 291,156 | 284,844 | 266,999 | |||||
| Williamson | 118,935 | 111,685 | 107,269 | 85,580 | 61,873 | |||||
| $ | 731,266 | $ | 652,052 | $ | 606,766 | $ | 567,159 | $ | 517,802 | |
10
Loan and Loan Quality, (continued)
Loan demand showed solid momentum in 2015, mainly due to commercial and residential mortgage lending. Commercial loans grew 12.0%% from the previous year. Residential mortgage loans grew 13.4% from the previous year. Portfolio growth and asset quality remain strong. The bank will continue to diligently review its pricing structure and to seek out new lending opportunities and bank relationships within our market footprint.
The Bank has a credit administration function that is responsible for assisting loan officers in underwriting new loans, reviewing problem loans, monitoring the status of problem loans from period to period, and assisting in their resolution. This review process also includes semi-annual reviews by an outside party to assess the quality of the loan portfolio independently. Management has concluded that this independent review has served to strengthen underwriting practices. The analysis and review by the Bank’s credit administration department also includes a formal review that is prepared quarterly to assess the risk in the loan portfolio and to determine the adequacy of the allowance for loan and lease losses (“ALLL”). Loan reviews of all relationships aggregating $750,000 and greater are completed on an annual schedule.
Loans that are impaired and not accruing interest were actively monitored in 2015 to determine those for which more aggressive action plans should be taken. The Bank ended 2015 with $670,000, or 0.10% in net recoveries.
11
Loan and Loan Quality, (continued)
Table D below summarizes average loan balances and reconciles the ALLL for each of the last five years.
Additions or reductions to the allowance, which are included in operating expenses, are also included.
| TABLE D - Loan Portfolio | |||||||||||||||
| December 31, | |||||||||||||||
| (Dollars in thousands) | 2015 | 2014 | 2013 | 2012 | 2011 | ||||||||||
| Average amount of gross loans outstanding | $ | 691,697 | $ | 616,467 | $ | 581,596 | $ | 526,973 | $ | 543,203 | |||||
| Balance of allowance for possible loan | |||||||||||||||
| and lease losses at beginning of year | 7,934 | 8,595 | 8,809 | 9,200 | 9,420 | ||||||||||
| Loans charged off | |||||||||||||||
| Commercial loans | - | 739 | 222 | 1,690 | 3,353 | ||||||||||
| Residential real estate loans | 34 | 41 | 27 | 176 | 52 | ||||||||||
| Loans to individuals | 13 | 11 | 49 | 19 | 147 | ||||||||||
| TOTAL CHARGE-OFFS | 47 | 791 | 298 | 1,885 | 3,552 | ||||||||||
| Recoveries of loans previously charged off | |||||||||||||||
| Commercial loans | 683 | 99 | 53 | 364 | 103 | ||||||||||
| Residential real estate loans | 12 | 10 | 2 | 2 | - | ||||||||||
| Loans to individuals | 22 | 21 | 29 | 8 | 104 | ||||||||||
| TOTAL RECOVERIES | 717 | 130 | 84 | 374 | 207 | ||||||||||
| NET CHARGE-OFFS (RECOVERIES) | (670 | ) | 661 | 214 | 1,511 | 3,345 | |||||||||
| Provision charged | |||||||||||||||
| to operating expenses | 30 | - | - | 1,120 | 3,125 | ||||||||||
| BALANCE AT END OF YEAR | $ | 8,634 | $ | 7,934 | $ | 8,595 | $ | 8,809 | $ | 9,200 | |||||
| Ratio of net charge-offs (recoveries) to | |||||||||||||||
| average gross loans outstanding | (0.10 | %) | 0.11 | % | 0.04 | % | 0.29 | % | 0.62 | % | |||||
In reviewing the Bank’s loan portfolio, management categorizes certain loans as “classified assets,” which consist of substandard, doubtful and loss categories of loans, and “special mention,” which is a less severe category of loans that do not warrant an adverse classification. The Bank closed 2015 with $3.0 million in classified assets compared to $10.8 million in 2014; of these amounts, none of the loans were classified as doubtful at December 31, 2015 and December 31, 2014, there were $3.0 million and $10.8 million in loans classified as substandard at December 31, 2015 and 2014, respectively, and $62,000 and $5,000 were classified as OREO at December 31, 2015 and 2014, respectively. At December 31, 2015, loans totaling $269,000, or 0.04% of the portfolio, were classified as “special mention” loans. This compares to loans totaling $1.1 million so classified at December 31, 2014, representing a decrease of $859,000.
Loans having recorded investments of $2.3 million and $9.4 million at December 31, 2015 and 2014, respectively, have been identified as impaired. Loans amounting to $3.0 million and $5.4 million at December 31, 2015 and 2014, respectively, were not accruing interest. These loans are considered nonaccrual loans and represented 0.3% and 0.8% of gross loans as of December 31, 2015 and 2014, respectively. Interest received on nonaccrual loans during 2015, 2014 and 2013 were $242,000, $319,000 and $326,000, respectively. The Bank had no loans that were 90 days or more past due that were not included in nonaccrual loans as of December 31, 2015. The Bank had three loans amounting to $97,000 that were 90 days or more past due that were not included in nonaccrual loans as of December 31, 2014.
12
Loan and Loan Quality, (continued)
The Bank had $1.1 million and $3.5 million that qualified as “troubled debt restructurings” as defined in ASC Topic 310-40 as of December 31, 2015 and 2014, respectively. Troubled debt restructurings are loans for which the Bank, for economic or legal reasons related to a borrower’s financial difficulties, grants a concession to the borrower which would otherwise not be considered. For a loan to be classified as a troubled debt restructuring, the borrower must be experiencing financial difficulties (even if the borrower is not currently in default on any of its indebtedness), and because of those difficulties the Bank must have made a concession that would otherwise not be granted. These concessions can take many forms, including but not limited to granting temporary payment relief, restructuring a loan to extend the amortization or lower the required payment amount, and forgiveness of principal. Likewise, the financial difficulty being experienced by a borrower can take many forms, including but not limited to:
- Being in default on any existing indebtedness;
- Declaring, or being in the process of declaring, bankruptcy;
- Significant doubt as to whether an existing business can continue to operate as a going concern;
- Historically demonstrating, or forecasting, insufficient cash flows with which to service all debt in a timely manner; or
- Absent the modification, the borrower cannot continue to keep all payments on indebtedness current.
Once loans are identified as a troubled debt restructuring, the Bank will track these loans and periodically report to the Board of Directors the aggregate balances thereof. Please refer to Note 1 and Note 4 in the Notes to Consolidated Financial Statements that are included elsewhere in this Annual Report to Shareholders for more information on the Bank’s policy regarding loan impairment and troubled debt restructuring.
The provision for loan and lease losses represents a charge to earnings necessary to establish an allowance for loan and lease losses that management believes to be adequate to provide coverage for the inherent losses on outstanding loans. The provision for loan and lease losses amounted to approximately $30,000, $0, and $0 for the years ended December 31, 2015, 2014, and 2013, respectively.
Several factors including the change in outstanding loan balances, the level of charge-offs and recoveries, the changes in the amount of impaired loans, changes in the risk ratings assigned to our loans, results of regulatory examinations, credit quality comparison to peer banks, the industry at large, and, ultimately, the results of our quarterly assessment of the inherent risks of our loan portfolio including past loan loss experience impact the ALLL.
Based upon management's assessment of the loan portfolio, we adjust our allowance for loan and lease losses to an amount deemed appropriate to adequately cover probable losses in the loan portfolio. Improving net-recoveries, particularly in our commercial real estate loan portfolio, and decreased non-performing assets positively affected our provision for loan and lease losses in 2015 and 2014. Our allowance for loan and lease losses as a percentage of loans decreased to 1.18% at December 31, 2015 from 1.22% at December 31, 2014. Based upon our evaluation of the loan portfolio, we believe the ALLL to be adequate to absorb our estimate of probable losses existing in the loan portfolio at December 31, 2015. While our policies and procedures used to estimate the ALLL, as well as the resultant provision for loan losses charged to operations, are considered adequate by management, they are inherently imprecise. There are factors beyond our control, such as conditions in the local and national economy, local real estate market or a particular industry or borrower which may negatively impact, materially, our asset quality and the adequacy of our allowance for loan and lease losses and, thus, the resulting provision for loan and lease losses.
13
RESULTS OF OPERATIONS
Interest Income and Expense
Total interest income increased 5.2% during 2015 as a result of increased loan volume. Interest and fees earned on loans totaled 78.9% of gross interest income during 2015 and increased 7.9% from 2014 as a result of increased loan volume. Interest earned on securities and other investments totaled 21.1% of total interest income during 2015 and decreased 3.8% from 2014 primarily due to the repricing of higher yielding tax-exempt municipal securities at lower yielding rates.
Total interest expense decreased 8.4% in 2015 compared to a 16.5% decrease in 2014 and a 24.3% decrease in 2013. Decreases in the average interest rate paid on interest bearing liabilities contributed to the lower interest expense. The cost of interest bearing deposits is monitored monthly by the Bank’s Asset Liability Management Committee (“ALCO”). The net interest margin (tax equivalent net interest income divided by average earning assets) was 3.43%, 3.49% and 3.69% for years ended December 31, 2015, 2014 and 2013, respectively.
Net interest income on a fully taxable equivalent basis is influenced primarily by changes in the volume and mix of earning assets and sources of funding and market rates of interest. The impact of some of these factors can be controlled by management policies and actions. External factors can also have a significant impact on changes in net interest income from one period to another. Some examples of such factors include the strength of credit demands by customers, Federal Reserve Board monetary policy, and fiscal and debt management policies of the federal government, including changes in tax laws. For the twelve months ended December 31, 2015, net interest income was $36.5 million compared to $34.4 million and $34.5 million for the twelve months ended December 31, 2014 and 2013, respectively.
|
Non-interest Income and Expenses |
|||||||
| The components of non-interest income were as follows: | |||||||
| 2015 | 2014 | 2013 | |||||
|
(dollars in thousands) |
|||||||
| Trust department income | $ | 2,530 | $ | 2,491 | $ | 2,298 | |
| Service fees on deposit accounts | 6,616 | 6,470 | 6,479 | ||||
| Mortgage banking income (gains of loans sold) | 270 | 294 | 437 | ||||
| Earnings on bank owned life insurance | 376 | 398 | 497 | ||||
| Gain on sale of available-for-sale securities | 534 | 652 | 829 | ||||
| Gain (loss) on foreclosed property | 33 | 516 | (308 | ) | |||
| Other | 1,084 | 906 | 884 | ||||
| $ | 11,443 | $ | 11,727 | $ | 11,116 | ||
Non-interest income decreased 2.4% in 2015 compared to 2014 and increased 5.5% in 2014 compared to 2013. There was a $534,000 gain on sale of available-for-sale securities in 2015 compared to a $652,000 gain in 2014. Income from service charges on accounts increased 2.3% in 2015 compared to 2014 representing 57.8% of total non-interest income. Income from fiduciary services offered in the Bank’s Trust department increased 1.6% in 2015 compared to 2014 representing 22.1% of total non-interest income. Stability in the equity and bond markets impacted the market value of the assets managed by the Trust Department and the related investment fees earned by the Bank.
| The components of non-interest expense were as follows: | ||||||
| 2015 | 2014 | 2013 | ||||
| (dollars in thousands) | ||||||
| Salaries and employee benefits | $ | 18,897 | $ | 17,557 | $ | 18,331 |
| Occupancy | 2,192 | 2,032 | 2,581 | |||
| Depreciation | 1,489 | 1,441 | 1,397 | |||
| Other | 11,621 | 11,235 | 10,934 | |||
| $ | 34,199 | $ | 32,265 | $ | 33,243 | |
14
Non-interest Income and Expense, (continued)
Non-interest expense increased 6.0% in 2015 compared to 2014. A 7.6% increase in salaries and employee benefits was a contributor to this increase, due mainly to increased employee health insurance expenses for the year. Additionally, increased legal and professional fees of $441,000 in 2015 compared to 2014 also contributed to the increase in non-interest expense. Non-interest expense decreased 2.9% in 2014 compared to 2013.
Income Tax Expense
Applicable income taxes on 2015 earnings amounted to $3.3 million, resulting in an effective tax rate of 24.4% compared to $3.6 million, or 25.8%, in 2014. The effective tax rate for 2015 and 2014 is a function of the net income earned, the effect of having a real estate investment trust structure, which results in having limited Tennessee excise tax expense and the effects of interest earned on tax-exempt loans and securities.
Net Income
Net income was 0.6% higher in 2015 than in 2014. Higher levels of non-interest income and reductions in non-interest expense were the primary reasons for the increase in net income. The Bank’s annualized net recoveries ended the year at 0.10%, an increase from net charge-offs of 0.11% in 2014. Total non-performing assets, including other real estate owned, experienced a cumulative decrease of $3.2 million, or 58.8% from 2015 to 2014. Net income was 6.6% higher in 2014 than in 2013.
15
LIQUIDITY AND CAPITAL RESOURCES
The Bank uses a formal asset and liability management process to ensure adequate liquidity and control interest rate risk. The Bank’s goal of liquidity management is to provide adequate funds to meet loan demand and any potential unexpected deposit withdrawals. The Bank accomplishes this goal by striving for consistent core deposit growth, holding adequate liquid assets and maintaining unused capacity to borrow funds. The Bank’s objective of interest rate risk management is to maintain reasonable stability in the gross interest margin despite changes in the level of interest rates and the spread among interest rates.
Liquidity
Most of the capital needs of the Bank historically have been financed with earnings, and the Company’s primary source of liquidity has been dividends received. The Bank’s Board of Directors has adopted a liquidity policy that outlines specific liquidity target balances and ratios. Compliance with this policy is reviewed quarterly by the Bank’s Asset Liability management committee and results are reported to the Bank’s Board of Directors. At December 31, 2015, available liquidity was $169.5 million compared to $290.6 million as of December 31, 2014.
Management believes that the Company’s traditional sources of cash generated from the Bank’s operating activities are adequate to meet the Company’s liquidity needs for normal ongoing operations; however, the Bank also has access to additional sources of funds, if necessary, through additional advances from the FHLB.
The consolidated statements of cash flows for the year ended December 31, 2015 detail cash flows from operating, investing and financing activities. At December 31, 2015, net cash provided by financing and operating activities was $77.2 million and $13.2 million, respectively, most of which was offset by net cash used in investing activities of $58.4 million, resulting in a net increase in cash and cash equivalents of $31.9 million to $62.2 million.
Interest Rate Risk
Interest rates play a major part in the net interest income of a financial institution. The sensitivity to rate changes is known as “interest rate risk.” The repricing of interest-earning assets and interest-bearing liabilities can influence the changes in net interest income. The Bank’s ALCO reviews the actual dollar change in net interest income for different interest rate movements. ALCO has oversight over the asset-liability management of the Bank. This committee regularly reviews interest rate risk by forecasting the impact of alternative interest rate environments on net income and the market value of portfolio equity.
The Bank uses simulation analysis to monitor changes in net interest income due to changes in market interest rates. The simulation of rising, declining and flat interest rate scenarios allows management to monitor and adjust interest rate sensitivity to minimize the impact of market interest rate swings. The impact on net interest income over a twelvemonth period of a shock of a 100, 200, and 300 basis point increase or decrease in market rates is analyzed on a quarterly basis. The Bank also monitors regulatory required interest rate risk analysis, which simulates more dramatic changes to rates.
The following table shows the results of our projections as of December 31, 2015 for net interest income expressed as a percentage change over net interest income in a flat rate scenario for an immediate change or “shock” in market interest rates over a twelve month period. Due to the historically low level of interest rates, the Bank does not believe downward shocks greater than 100 basis points are relevant.
| Market rate | Effect on net interest | |||
| change | income | |||
| +300 | 1.7 | % | ||
| +200 | 1.4 | % | ||
| +100 | 0.7 | % | ||
| (100) | (5.7) | % | ||
16
Interest Rate Risk, (continued)
Net interest income of the Bank on a fully taxable equivalent basis is influenced primarily by changes in:
| (1) | the volume and mix of earning assets and sources of funding; |
| (2) | market rates of interest; and |
| (3) | income tax rates. |
The impact of some of these factors can be controlled by management policies and actions. External factors also can have a significant impact on changes in net interest income from one period to another. Some examples of such factors are:
| (1) | the strength of credit demands by customers; |
| (2) | Federal Reserve Board monetary policy; and |
| (3) | fiscal and debt management policies of the federal government, including changes in tax laws. |
Another tool used to monitor the Bank’s overall interest rate sensitivity is a gap analysis (the difference between the earning asset and interest bearing liability amounts scheduled to be re-priced to current market rates in subsequent periods). Table C below shows the Bank’s rate-sensitive position at December 31, 2015, as measured by the gap analysis. Non-maturing balances such as money market, savings and NOW accounts have no contractual or stated maturities. Management has attempted to use historical data (pricing history) on these categories to best determine the impact of these non-maturing balances on the net interest margin as interest rates change. Management anticipates that rates will gradually increase through 2016 and has determined that the Bank is in an acceptable rate risk position. Table A under the heading “Net Interest Margin” above provides additional information regarding the largest components of interest-bearing liabilities.
TABLE C - Rate Sensitivity of Earning Assets and Interest-Bearing Liabilities
| (Dollars in thousands) | Three months | Three to six |
Six to twelve |
Over one | |||||||||
| As of December 31, 2015 | or less | months |
months |
year |
Total |
||||||||
| Earning assets | |||||||||||||
| Bank time deposits | $ | 42,775 | $ | - | $ | - | $ | - | $ | 42,775 | |||
| Taxable investment securities | 753 | 1,252 | 3,689 | 316,005 | 321,699 | ||||||||
| Tax-exempt investment securities | - | 475 | - | 76,904 | 77,379 | ||||||||
| Loans and leases, net of deferred fees | 33,307 | 29,622 | 59,544 | 600,159 | 722,632 | ||||||||
|
Total earning assets |
$ | 76,835 | $ | 31,349 | $ | 63,233 | $ | 993,068 | $ | 1,164,485 | |||
| Interest-bearing liabilities | |||||||||||||
| NOW and money market accounts | $ | 179,768 | $ | - | $ | - | $ | 364,171 | $ | 543,939 | |||
| Savings | - | - | - | 109,340 | 109,340 | ||||||||
| Time up to $100 | 21,919 | 25,470 | 30,290 | 21,610 | 99,289 | ||||||||
| Time over $100 | 24,805 | 29,437 | 41,010 | 16,755 | 112,007 | ||||||||
| Other short-term debt | 24,177 | - | - | - | 24,177 | ||||||||
|
Total interest-bearing liabilities |
$ | 250,669 | $ | 54,907 | $ | 71,300 | $ | 511,876 | $ | 888,752 | |||
| Period gap | $ | (173,834 | ) | $ | (23,558 | ) | $ | (8,067 | ) | $ | 481,192 | $ | 275,733 |
| Cumulative gap | $ | (173,834 | ) | $ | (197,392 | ) | $ | (205,459 | ) | $ | 275,733 | ||
17
Capital Expenditures
Historically, internal liquidity has financed the capital needs of the Bank. In 2015, the Bank began construction on a new branch location in Williamson County, Tennessee.
Contractual Obligations
The following table summarizes the Company’s contractual obligations as of December 31, 2015:
| (dollars in thousands) | Payment due by period | |||||||||
| Less than 1 | More than | |||||||||
| Contractual obligations | Total | year | 1-3 years | 3-5 years | 5 years | |||||
| Operating lease obligations | $ | 4,745 | $ | 358 | $ | 614 | $ | 586 | $ | 3,187 |
| Repurchase agreements and time | ||||||||||
| deposits | 235,473 | 197,108 | 24,028 | 14,327 | 10 | |||||
| Total | $ | 240,218 | $ | 197,466 | $ | 24,642 | $ | 14,913 | $ | 3,197 |
Dividends
Cash dividends declared in 2015 were 34.3% of net income compared to 35.5% of net income for 2014. The Company plans to continue an average annual payout ratio over 20% while continuing to maintain a capital to asset ratio reflecting financial strength and consistent with regulatory guidelines.
Regulatory Capital
Please refer to Note 18 in the Notes to Consolidated Financial Statements included elsewhere in this Annual Report to Shareholders for more information on the capital strength of the Company and the Bank.
18
OFF-BALANCE SHEET ARRANGEMENTS
As of December 31, 2015, the Bank was a party to financial instruments with off-balance sheet risk in the normal course of business to meet the financing needs of its customers. These financial instruments included commitments to extend credit and standby letters of credit. Please refer to Note 11 of the Notes to Consolidated Financial Statements included elsewhere in this Annual Report to Shareholders for more information on the Bank’s commitments and contingencies.
SHAREHOLDER INFORMATION
The 4,739,502 shares of common stock of the Company outstanding at December 31, 2015 had an estimated market value of $129.3 million, held by 1,960 shareholders, using a valuation of $27.29 per share based on transactions reported by unaffiliated, third parties to the Company or its transfer agent. A small number of shareholders are not identified individually because some nominees, including the Bank’s Trust Department, are listed as record owners when, in fact, these holdings represent more than one beneficial owner. No single shareholder’s ownership exceeded 5% at December 31, 2015.
There is no established public trading market for shares of the Company’s common stock. The table below shows the high and low price of the Company’s common stock taken from reported prices by those buyers and sellers willing to disclose this information. This table also shows the semi-annual dividend declared per share of common stock, in each of the last two years. In 2015, the Company repurchased 161,074 shares of its common stock in several privately negotiated transactions.
| High | Low | Dividend | |||||
| 2015 | First Quarter | $ | 26.50 | $ | 25.15 | $ | - |
| Second Quarter | 26.50 | 25.00 | 0.370 | ||||
| Third Quarter | 27.00 | 26.02 | - | ||||
| Fourth Quarter | 29.00 | 26.50 | 0.370 | ||||
| 2014 | First Quarter | $ | 25.00 | $ | 25.00 | $ | - |
| Second Quarter | 27.00 | 25.00 | 0.370 | ||||
| Third Quarter | 26.00 | 25.00 | - | ||||
| Fourth Quarter | 25.50 | 25.00 | 0.370 | ||||
ADDITIONAL FINANCIAL DATA
The following table presents consolidated comparative data for the Company for the years shown:
|
December 31, |
||||||||||
|
2015 |
2014 |
2013 |
2012 |
2011 |
||||||
|
(dollars in thousands) |
||||||||||
| Total assets |
$ |
1,260,310 |
$ |
1,170,995 |
$ |
1,092,874 |
$ |
1,091,487 |
$ |
1,017,808 |
| Average assets |
1,213,440 |
1,121,840 |
1,087,487 |
1,054,316 |
975,671 |
|||||
| Average loans (net) |
683,319 |
607,957 |
572,913 |
518,158 |
534,841 |
|||||
| Average deposits |
1,054,006 |
974,205 |
938,032 |
893,486 |
820,250 |
|||||
| Return on average assets |
0.85% |
0.91% |
0.88% |
0.90% |
0.72% |
|||||
| Return on average equity |
8.70% |
9.32% |
8.66% |
8.22% |
6.21% |
|||||
| Tier 1 capital to average assets |
8.87% |
9.67% |
9.53% |
9.69% |
10.24% |
|||||
19
| ADDITIONAL FINANCIAL DATA, (CONTINUED) | |||||||||||
| Selected Financial Information | |||||||||||
| 2015 | 2014 | 2013 | 2012 | 2011 | |||||||
|
(dollars in thousands, except per share data) |
|||||||||||
| Interest income | |||||||||||
| Interest and fees on loans | $ | 30,522 | $ | 28,300 | $ | 28,653 | $ | 27,951 | $ | 29,838 | |
| Income on investment securities | |||||||||||
| Taxable interest | 5,713 | 5,738 | 5,501 | 4,967 | 4,219 | ||||||
| Exempt from federal income tax | 2,218 | 2,473 | 2,913 | 3,106 | 3,616 | ||||||
| Dividends | 178 | 186 | 197 | 207 | 197 | ||||||
| 8,109 | 8,397 | 8,611 | 8,280 | 8,032 | |||||||
| Other interest income | 51 | 83 | 97 | 153 | 98 | ||||||
| Total interest income | 38,682 | 36,780 | 37,361 | 36,384 | 37,968 | ||||||
| Interest expense | |||||||||||
| Interest on deposits | 2,131 | 2,358 | 2,694 | 3,343 | 4,223 | ||||||
| Interest on other short term borrowings | 94 | 70 | 213 | 498 | 719 | ||||||
| Total interest expense | 2,225 | 2,428 | 2,907 | 3,841 | 4,942 | ||||||
| Net interest income | 36,457 | 34,352 | 34,454 | 32,543 | 33,026 | ||||||
| Provision for possible loan and lease losses | 30 | - | - | 1,120 | 3,125 | ||||||
| Net interest income after provision | |||||||||||
| for loan losses | 36,427 | 34,352 | 34,454 | 31,423 | 29,901 | ||||||
| Non-interest income | |||||||||||
| Trust department income | 2,530 | 2,491 | 2,298 | 2,119 | 1,999 | ||||||
| Service fees on deposit accounts | 6,616 | 6,470 | 6,479 | 6,689 | 6,784 | ||||||
| Other service fees, commissions, and fees | 540 | 436 | 563 | 610 | 584 | ||||||
| Other operating income | 1,223 | 1,678 | 947 | (81 | ) | 147 | |||||
| Securities gains | 534 | 652 | 829 | 2,294 | 1,458 | ||||||
| Total non-interest income | 11,443 | 11,727 | 11,116 | 11,631 | 10,972 | ||||||
| Non-interest expense | |||||||||||
| Salaries and employee benefits | 18,897 | 17,557 | 18,331 | 16,486 | 18,836 | ||||||
| Net occupancy expense | 2,192 | 2,032 | 2,581 | 2,528 | 2,488 | ||||||
| Depreciation expense | 1,489 | 1,441 | 1,397 | 1,334 | 1,224 | ||||||
| Other operating expenses | 11,637 | 11,251 | 10,950 | 10,262 | 10,585 | ||||||
| Total non-interest expense | 34,215 | 32,281 | 33,259 | 30,610 | 33,133 | ||||||
| Income before provision for income | |||||||||||
| taxes | 13,655 | 13,798 | 12,311 | 12,444 | 7,740 | ||||||
| Provision for income taxes | 3,349 | 3,556 | 2,700 | 3,040 | 744 | ||||||
| Net income | $ | 10,306 | $ | 10,242 | $ | 9,611 | $ | 9,404 | $ | 6,996 | |
| Earnings per common share | $ | 2.13 | $ | 2.06 | $ | 1.88 | $ | 1.77 | $ | 1.30 | |
| Weighted average shares outstanding | 4,832,217 | 4,963,826 | 5,110,849 | 5,315,634 | 5,400,063 | ||||||
| Dividends per common share | $ | 0.74 | $ | 0.74 | $ | 0.74 | $ | 0.74 | $ | 0.74 | |
20

Report of Independent Registered Public Accounting Firm
Audit Committee, Board of Directors
and Shareholders
First Farmers and Merchants Corporation
Columbia, Tennessee
We have audited the accompanying consolidated balance sheets of First Farmers and Merchants Corporation (Corporation) as of December 31, 2015 and 2014, and the related consolidated statements of income, comprehensive income (loss), changes in shareholders’ equity and cash flows for each of the years in the three-year period ended December 31, 2015. The Corporation’s management is responsible for these financial statements. Our responsibility is to express an opinion on these financial statements based on our audits.
We conducted our audits in accordance with the standards of the Public Company Accounting Oversight Board (United States). Those standards require that we plan and perform the audits to obtain reasonable assurance about whether the financial statements are free of material misstatement. Our audits included examining, on a test basis, evidence supporting the amounts and disclosures in the financial statements, assessing the accounting principles used and significant estimates made by management and evaluating the overall financial statement presentation. We believe that our audits provide a reasonable basis for our opinion.
In our opinion, the consolidated financial statements referred to above present fairly, in all material respects, the financial position of the Corporation as of December 31, 2015 and 2014, and the results of its operations and its cash flows for each of the years in the three-year period ended December 31, 2015, in conformity with accounting principles generally accepted in the United States of America.
We also have audited, in accordance with the standards of the Public Company Accounting Oversight Board (United States), the Corporation’s internal control over financial reporting as of December 31, 2015, based on criteria established in Internal Control - Integrated Framework (2013) issued by the Committee of Sponsoring Organizations of the Treadway Commission (COSO) and our report dated March 1, 2016, expressed an unqualified opinion on the effectiveness of the Corporation’s internal control over financial reporting.
//s//BKD, LLP
Louisville, Kentucky
March 1, 2016

21
FIRST FARMERS AND MERCHANTS CORPORATION
COLUMBIA, TENNESSEE
Management’s Report on Internal Control Over Financial Reporting
The management of First Farmers and Merchants Corporation is responsible for the preparation, integrity, and fair presentation of its published financial statements and all other information presented in its annual report. The consolidated financial statements have been prepared in accordance with U.S. generally accepted accounting principles and, as such, include amounts based on informed judgments, assumptions and estimates made by management.
The management of First Farmers and Merchants Corporation is responsible for establishing and maintaining adequate internal control over financial reporting. The Corporation’s internal control system was designed to provide reasonable assurance to the Corporation’s management and board of directors regarding the preparation and fair presentation of published financial statement. All internal control systems, no matter how well designed, have inherent limitations. Therefore, even those systems determined to be effective can provide only reasonable assurance with respect to financial statement preparation and presentation.
The Corporation’s management assessed the effectiveness of the Corporation’s internal control over financial reporting as of December 31, 2015. In making this assessment, it used the criteria set forth by the Committee of Sponsoring Organizations of the Treadway Commission (“COSO”) in the “Internal Control-Integrated Framework for 2013. Based on our assessment we believe that, as of December 31, 2015, the Corporation’s internal control over financial reporting is effective based on those criteria.
BKD, LLP, the independent registered public accounting firm that audited the consolidated financial statements of the Corporation included in this annual report, has issued an attestation report on the effectiveness of the Corporation’s internal control over financial reporting as of December 31, 2015. The report, which expresses an unqualified opinion on the effectiveness of the Corporation’s internal control over financial reporting as of December 31, 2015, is included in this annual report.
| Date: | March 1, 2016 | By: | /s/ T. Randy Stevens |
| T. Randy Stevens | |||
| Chief Executive Officer | |||
| (Principal Executive Officer) | |||
| Date: | March 1, 2016 | By: | /s/ Robert E. Krimmel |
| Robert E. Krimmel | |||
| Chief Financial Officer | |||
| (Principal Financial and Accounting Officer) | |||
22
Report of Independent Registered Public Accounting Firm
Audit Committee, Board of Directors
and Shareholders
First Farmers and Merchants Corporation
Columbia, Tennessee
We have audited First Farmers and Merchants Corporation’s (Corporation) internal control over financial reporting as of December 31, 2015, based on criteria established in Internal Control -Integrated Framework (2013) issued by the Committee of Sponsoring Organizations of the Treadway Commission (COSO). The Corporation’s management is responsible for maintaining effective internal control over financial reporting and for its assessment of the effectiveness of internal control over financial reporting, included in the accompanying management report on internal control over financial reporting. Our responsibility is to express an opinion on the Corporation’s internal control over financial reporting based on our audit.
We conducted our audit in accordance with the standards of the Public Company Accounting Oversight Board (United States). Those standards require that we plan and perform the audit to obtain reasonable assurance about whether effective internal control over financial reporting was maintained in all material respects. Our audit included obtaining an understanding of internal control over financial reporting, assessing the risk that a material weakness exists and testing and evaluating the design and operating effectiveness of internal control based on the assessed risk. Our audit also included performing such other procedures, as we considered necessary in the circumstances. We believe that our audit provides a reasonable basis for our opinion.
A company’s internal control over financial reporting is a process designed to provide reasonable assurance regarding the reliability of financial reporting and the preparation of financial statements for external purposes in accordance with generally accepted accounting principles. A company’s internal control over financial reporting includes those policies and procedures that (1) pertain to the maintenance of records that, in reasonable detail, accurately and fairly reflect the transactions and dispositions of the assets of the company, (2) provide reasonable assurance that transactions are recorded as necessary to permit preparation of financial statements in accordance with generally accepted accounting principles and that receipts and expenditures of the company are being made only in accordance with authorizations of management and directors of the company and (3) provide reasonable assurance regarding prevention or timely detection of unauthorized acquisition, use or disposition of the company’s assets that could have a material effect on the financial statements.
Because of its inherent limitations, internal control over financial reporting may not prevent or detect misstatements. Also, projections of any evaluation of effectiveness to future periods are subject to the risk that controls may become inadequate because of changes in conditions or that the degree of compliance with the policies or procedures may deteriorate.
In our opinion, the Corporation maintained, in all material respects, effective internal control over financial reporting as of December 31, 2015, based on criteria established in Internal Control -Integrated Framework (2013) issued by the Committee of Sponsoring Organizations of the Treadway Commission (COSO).
We have also audited, in accordance with the standards of the Public Company Accounting Oversight Board (United States), the consolidated financial statements of the Corporation and our report dated March 1, 2016, expressed an unqualified opinion thereon.
//s//BKD, LLP
Louisville, Kentucky
March 1, 2016
23
|
FIRST FARMERS AND MERCHANTS CORPORATION AND SUBSIDIARIES |
|||||||
| CONSOLIDATED BALANCE SHEETS | |||||||
| (Dollars in thousands) | |||||||
| December 31, | December 31, | ||||||
| 2015 | 2014 | ||||||
| ASSETS | Cash and due from banks | $ | 19,453 | $ | 18,511 | ||
| Interest-bearing deposits | 18,299 | 10,086 | |||||
| Federal funds sold | 24,476 | 1,700 | |||||
| Total cash and cash equivalents | 62,228 | 30,297 | |||||
| Securities: | |||||||
| Available-for-sale | 395,019 | 397,886 | |||||
| Held-to-maturity (fair market value $4,089 | |||||||
| and $22,263 as of December 31, 2015 and December 31, 2014, | |||||||
| respectively) | 4,059 | 21,985 | |||||
| Total securities | 399,078 | 419,871 | |||||
| Loans, net of deferred fees | 731,266 | 652,052 | |||||
| Allowance for loan and lease losses | (8,634 | ) | (7,934 | ) | |||
| Net loans | 722,632 | 644,118 | |||||
| Bank premises and equipment, net | 25,518 | 25,773 | |||||
| Other real estate owned | 62 | 5 | |||||
| Bank owned life insurance | 26,552 | 26,176 | |||||
| Goodwill | 9,018 | 9,018 | |||||
| Other assets | 15,222 | 15,737 | |||||
|
TOTAL ASSETS |
$ | 1,260,310 | $ | 1,170,995 | |||
| LIABILITIES | Deposits: | ||||||
| Noninterest-bearing | $ | 239,226 | $ | 204,358 | |||
| Interest-bearing | 864,575 | 815,597 | |||||
| Total deposits | 1,103,801 | 1,019,955 | |||||
| Securities sold under agreements to repurchase | 24,177 | 22,834 | |||||
| Accounts payable and accrued liabilities | 14,542 | 13,622 | |||||
|
TOTAL LIABILITIES |
1,142,520 | 1,056,411 | |||||
| Commitments and contingencies (Note 11) | |||||||
| SHAREHOLDERS’ | Common stock - $10 par value per share, 8,000,000 shares | ||||||
| EQUITY | authorized; 4,739,502 and 4,900,576 shares issued | ||||||
| and outstanding as of December 31, 2015 and | |||||||
| December 31, 2014, respectively | 47,395 | 49,006 | |||||
| Retained earnings | 71,583 | 67,609 | |||||
| Accumulated other comprehensive loss | (1,283 | ) | (2,126 | ) | |||
| TOTAL SHAREHOLDERS’ EQUITY BEFORE | |||||||
| NONCONTROLLING INTEREST – PREFERRED STOCK | |||||||
| OF SUBSIDIARY | 117,695 | 114,489 | |||||
| Noncontrolling interest – preferred stock of subsidiary | 95 | 95 | |||||
|
TOTAL SHAREHOLDERS’ EQUITY |
117,790 | 114,584 | |||||
|
TOTAL LIABILITIES AND SHAREHOLDERS’ EQUITY |
$ | 1,260,310 | $ | 1,170,995 | |||
|
The accompanying notes are an integral part of the consolidated financial statements. |
|||||||
24
| FIRST FARMERS AND MERCHANTS CORPORATION AND SUBSIDIARIES | ||||||||
| CONSOLIDATED STATEMENTS OF INCOME | ||||||||
| For the Years ended December 31, 2015, 2014 and 2013 | ||||||||
| (Dollars in thousands, except per share data) | ||||||||
| Years ended December 31, | ||||||||
| 2015 | 2014 | 2013 | ||||||
| INTEREST AND | Interest and fees on loans | $ | 30,522 | $ | 28,300 | $ | 28,653 | |
| DIVIDEND | Income on investment securities | |||||||
| INCOME | Taxable interest | 5,713 | 5,738 | 5,501 | ||||
| Exempt from federal income tax | 2,218 | 2,473 | 2,913 | |||||
| Dividends | 229 | 269 | 294 | |||||
| Total interest income | 38,682 | 36,780 | 37,361 | |||||
| INTEREST | Interest on deposits | 2,131 | 2,358 | 2,694 | ||||
| EXPENSE | Interest on other borrowings | 94 | 70 | 213 | ||||
| Total interest expense | 2,225 | 2,428 | 2,907 | |||||
| Net interest income | 36,457 | 34,352 | 34,454 | |||||
| Provision for loan and lease losses | 30 | - | - | |||||
| Net interest income after provision | 36,427 | 34,352 | 34,454 | |||||
| NON-INTEREST | Gains on loans sold | 270 | 294 | 437 | ||||
| INCOME | Trust department income | 2,530 | 2,491 | 2,298 | ||||
| Service fees on deposit accounts | 6,616 | 6,470 | 6,479 | |||||
| Brokerage fees | 540 | 410 | 361 | |||||
| Earnings on bank owned life insurance | 376 | 398 | 497 | |||||
| Gain on sales of available-for-sale securities | 534 | 652 | 829 | |||||
| Gain (loss) on foreclosed property | 33 | 516 | (308 | ) | ||||
| Other non-interest income | 544 | 496 | 523 | |||||
| Total non-interest income | 11,443 | 11,727 | 11,116 | |||||
| NON-INTEREST | Salaries and employee benefits | 18,897 | 17,557 | 18,331 | ||||
| EXPENSE | Net occupancy expense | 2,192 | 2,032 | 2,581 | ||||
| Depreciation expense | 1,489 | 1,441 | 1,397 | |||||
| Data processing expense | 2,506 | 2,321 | 2,288 | |||||
| Legal and professional fees | 1,301 | 860 | 1,037 | |||||
| Stationary and office supplies | 289 | 304 | 293 | |||||
| Advertising and promotions | 1,163 | 1,352 | 1,090 | |||||
| FDIC insurance premium expense | 587 | 589 | 728 | |||||
| Other real estate expense | 3 | 68 | 128 | |||||
| Other non-interest expense | 5,772 | 5,741 | 5,370 | |||||
| Total non-interest expenses | 34,199 | 32,265 | 33,243 | |||||
| Income before provision for income taxes | 13,671 | 13,814 | 12,327 | |||||
| Provision for income taxes | 3,349 | 3,556 | 2,700 | |||||
| Net income before noncontrolling interest – dividends on | ||||||||
| preferred stock of subsidiary | 10,322 | 10,258 | 9,627 | |||||
| Noncontrolling interest – dividends on preferred stock | ||||||||
| subsidiary | 16 | 16 | 16 | |||||
| Net income for common shareholders | $ | 10,306 | $ | 10,242 | $ | 9,611 | ||
| Weighted average shares outstanding | 4,832,217 | 4,963,826 | 5,110,849 | |||||
| Earnings per share | $ | 2.13 | $ | 2.06 | $ | 1.88 | ||
| The accompanying notes are an integral part of the consolidated financial statements. | ||||||||
25
| FIRST FARMERS AND MERCHANTS CORPORATION AND SUBSIDIARIES | |||||||||
| CONSOLIDATED STATEMENTS OF COMPREHENSIVE INCOME (LOSS) | |||||||||
| For the Years Ended December 31, 2015, 2014 and 2013 | |||||||||
| (Dollars in thousands) | |||||||||
| Years ended December 31, | |||||||||
| 2015 | 2014 | 2013 | |||||||
| Net income for common shareholders | $ | 10,306 | $ | 10,242 | $ | 9,611 | |||
| Other comprehensive income (loss) | |||||||||
| Unrealized appreciation (depreciation) on available-for-sale securities, net of taxes of | |||||||||
| $685, $4,742, and ($8,507), respectively | 1,097 | 7,571 | (13,589 | ) | |||||
| Reclassification adjustment for realized gains included in net income, net of taxes of | |||||||||
| ($206), ($251) and ($319), respectively | (328 | ) | (401 | ) | (510 | ) | |||
| Change in unfunded portion of post-retirement benefit obligations, net of taxes of | |||||||||
| $47, ($185) and $2,102, respectively | 74 | (295 | ) | 3,360 | |||||
| Other comprehensive income (loss) | 843 | 6,875 | (10,739 | ) | |||||
| Total comprehensive income (loss) | $ | 11,149 | $ | 17,117 | $ | (1,128 | ) | ||
| The accompanying notes are an integral part of the consolidated financial statements. | |||||||||
26
|
FIRST FARMERS AND MERCHANTS CORPORATION AND SUBSIDIARIES |
||||||||||||||
| CONSOLIDATED STATEMENTS OF CHANGES IN SHAREHOLDERS’ EQUITY | ||||||||||||||
|
For the Years Ended December 31, 2015, 2014 and 2013 |
||||||||||||||
| (Dollars in thousands, except per share data) | ||||||||||||||
| Accumulated | ||||||||||||||
| other | ||||||||||||||
| Shares of | Preferred | Common | Retained | comprehensive | ||||||||||
| stock | stock | stock | earnings | income (loss) | Total | |||||||||
| Balance at December 31, 2012 | 5,180,000 | $ | 95 | $ | 51,800 | $ | 59,162 | $ | 1,738 | $ | 112,795 | |||
| Net income before dividends on preferred stock of | ||||||||||||||
| subsidiary | 9,627 | 9,627 | ||||||||||||
| Other comprehensive loss | (10,739 | ) | (10,739 | ) | ||||||||||
| Repurchase of common stock | (158,988 | ) | (1,590 | ) | (2,132 | ) | (3,722 | ) | ||||||
| Cash dividends declared, $0.74 per share | (3,741 | ) | (3,741 | ) | ||||||||||
| Cash dividends – preferred stock of subsidiary | (16 | ) | (16 | ) | ||||||||||
| Balance at December 31, 2013 | 5,021,012 | 95 | 50,210 | 62,900 | (9,001 | ) | 104,204 | |||||||
| Net income before dividends on preferred stock of | ||||||||||||||
| subsidiary | 10,258 | 10,258 | ||||||||||||
| Other comprehensive income | 6,875 | 6,875 | ||||||||||||
| Repurchase of common stock | (120,436 | ) | (1,204 | ) | (1,893 | ) | (3,097 | ) | ||||||
| Cash dividends declared, $0.74 per share | (3,640 | ) | (3,640 | ) | ||||||||||
| Cash dividends – preferred stock of subsidiary | (16 | ) | (16 | ) | ||||||||||
| Balance at December 31, 2014 | 4,900,576 | 95 | 49,006 | 67,609 | (2,126 | ) | 114,584 | |||||||
| Net income before dividends on preferred stock of | ||||||||||||||
| subsidiary | 10,322 | 10,322 | ||||||||||||
| Other comprehensive income | 843 | 843 | ||||||||||||
| Repurchase of common stock | (161,074 | ) | (1,611 | ) | (2,797 | ) | (4,408 | ) | ||||||
| Cash dividends declared, $0.74 per share | (3,535 | ) | (3,535 | ) | ||||||||||
| Cash dividends – preferred stock of subsidiary | (16 | ) | (16 | ) | ||||||||||
| Balance at December 31, 2015 | 4,739,502 | $ | 95 | $ | 47,395 | $ | 71,583 | $ | (1,283 | ) $ | 117,790 | |||
| The accompanying notes are an integral part of the consolidated financial statements. | ||||||||||||||
27
| FIRST FARMERS AND MERCHANTS CORPORATION AND SUBSIDIARIES | ||||||||||
| CONSOLIDATED STATEMENTS OF CASH FLOWS | ||||||||||
| (Dollars in thousands) | ||||||||||
| Years ended December 31, | ||||||||||
| 2015 | 2014 | 2013 | ||||||||
| OPERATING | Net income available for common shareholders | $ | 10,306 |
$ |
10,242 |
$ |
9,611 | |||
| ACTIVITIES | Adjustments to reconcile net income to net cash provided | |||||||||
| by operating activities | ||||||||||
| Provision for loan and lease losses | 30 | - | - | |||||||
| Depreciation of premises and equipment | 1,489 | 1,441 | 1,543 | |||||||
| Deferred tax benefit expense | 614 | 545 | 1,785 | |||||||
| Net gains on sales of available-for-sale securities | (534 | ) | (652 | ) | (829 | ) | ||||
| Gains on loans sold | (270 | ) | (294 | ) | (437 | ) | ||||
| Proceeds from sale of mortgage loans held for sale | 15,455 | 13,105 | 21,047 | |||||||
| Funding of mortgage loans held for sale | (14,831 | ) | (12,838 | ) | (18,481 | ) | ||||
| (Gain) loss on other real estate owned | (33 | ) | (516 | ) | 308 | |||||
| Gain on sale of assets | - | - | 38 | |||||||
| Amortization of investment security premiums, | ||||||||||
| net of accretion of discounts | 1,196 | 1,100 | 1,312 | |||||||
| Increase in cash surrender value of life insurance | ||||||||||
| contracts | (376 | ) | (398 | ) | (497 | ) | ||||
| Changes in: | ||||||||||
| Other assets | 821 | (8 | ) | 1,243 | ||||||
| Other liabilities | (701 | ) | 435 | 143 | ||||||
| Net cash provided by operating activities | 13,166 | 12,162 | 16,786 | |||||||
| INVESTING | Proceeds from sales of available-for-sale securities | 79,119 | 47,798 | 137,150 | ||||||
| Proceeds from maturities and calls of available-for-sale | ||||||||||
| ACTIVITIES | securities | 31,967 | 30,072 | 44,908 | ||||||
| Proceeds from maturities and calls of held-to-maturity | ||||||||||
| securities | 19,940 | 5,398 | 3,890 | |||||||
| Purchases of available-for-sale | ||||||||||
| investment securities | (107,655 | ) | (134,373 | ) | (189,436 | ) | ||||
| Purchases of held-to-maturity investment securities | (1,991 | ) | - | - | ||||||
| Net increase in loans | (78,634 | ) | (45,952 | ) | (38,267 | ) | ||||
| Proceeds from sale of other real estate owned | 66 | 1,466 | 2,378 | |||||||
| Proceeds from sale of assets | - | - | 799 | |||||||
| Purchases of premises and equipment | (1,234 | ) | (2,346 | ) | (831 | ) | ||||
| Purchase of life insurance policies | - | (175 | ) | (258 | ) | |||||
| Proceeds from redemption of life insurance policy | - | 264 | - | |||||||
| Net cash used in investing activities | (58,422 | ) | (97,848 | ) | (39,667 | ) | ||||
| FINANCING | Net increase in deposits | 83,846 | 62,618 | 24,488 | ||||||
| Net increase in securities sold under agreements to | ||||||||||
| ACTIVITIES | repurchase | 1,343 | 4,739 | 1,027 | ||||||
| Payments to FHLB borrowings | - | - | (10,100 | ) | ||||||
| Repurchase of common stock | (4,408 | ) | (3,097 | ) | (3,722 | ) | ||||
| Cash dividends paid on common stock | (3,594 | ) | (3,685 | ) | (3,800 | ) | ||||
| Net cash provided by financing activities | 77,187 | 60,575 | 7,893 | |||||||
| Increase (decrease) in cash and cash equivalents | 31,931 | (25,111 | ) | (14,988 | ) | |||||
| Cash and cash equivalents at beginning of period | 30,297 | 55,408 | 70,396 | |||||||
| Cash and cash equivalents at end of period | $ | 62,228 |
$ |
30,297 |
$ |
55,408 | ||||
28
| FIRST FARMERS AND MERCHANTS CORPORATION AND SUBSIDIARIES | |||||||
| CONSOLIDATED STATEMENTS OF CASH FLOWS (Continued) | |||||||
| (Dollars in thousands) | |||||||
| Years ended December 31, | |||||||
| Supplemental disclosures of cash flow information: | 2015 | 2014 | 2013 | ||||
| Cash paid during the period for: | |||||||
| Interest on deposits and borrowed funds | $ | 2,335 |
$ |
2,479 |
$ |
2,816 | |
| Income taxes | 3,241 | 3,094 | 2,072 | ||||
| Loans to facilitate sale of other real estate owned | - | - | 1,905 | ||||
| Real estate acquired in settlement of loans | 90 | 5 | 312 | ||||
|
The accompanying notes are an integral part of the consolidated financial statements. |
|||||||
29
FIRST FARMERS AND MERCHANTS CORPORATION AND SUBSIDIARIES
NOTES TO CONSOLIDATED FINANCIAL STATEMENTS
NOTE 1 – GENERAL AND SUMMARY OF SIGNIFICANT ACCOUNTING POLICIES
Accounting Policies
The accounting principles followed and the methods of applying those principles conform with accounting principles generally accepted in the United States (“GAAP”) and to general practices in the banking industry. The significant accounting policies applicable to First Farmers and Merchants Corporation (the “Company”) are summarized as follows.
Nature of Operations
The Company is a bank holding company whose principal activity is the ownership and management of its wholly-owned subsidiary, First Farmers and Merchants Bank (the “Bank”). The Bank is primarily engaged in providing a full range of banking and financial services, including lending, investing of funds, obtaining deposits, trust and wealth management operations, and other financing activities to individual and corporate customers in the Middle Tennessee area. The Bank is subject to competition from other financial institutions. The Company and Bank are subject to the regulation of certain federal and state agencies and undergo periodic examinations by those regulatory authorities.
On November 20, 2015, the Company announced its Board of Directors approved a corporate reorganization plan (the “Plan”) providing for the termination of the Company’s reporting obligations under the Securities Exchange Act of 1934 (the “Exchange Act”). Under the Plan, holders of fewer than 400 shares of Company common stock will receive cash in exchange for their shares in an amount determined based on a valuation by an independent third party. Shareholders owning 400 or more shares will be unaffected by the Plan. The Plan will be considered and voted upon by its shareholders at the Company’s 2016 annual meeting.
Basis of Presentation
The accompanying consolidated financial statements present the accounts of the Company and its wholly-owned subsidiary, First Farmers and Merchants Bank. The Bank has the following direct and indirect subsidiaries: F&M West, Inc., Maury Tenn, Inc., and Maury Tenn Properties, Inc. Noncontrolling interests consist of preferred shares in Maury Tenn Properties, Inc. that are owned by third parties and Maury Tenn, Inc. The preferred shares in Maury Tenn Properties, Inc. receive dividends, which are included in the consolidated statements of income. Intercompany accounts and transactions have been eliminated in consolidation.
Certain items in prior financial statements have been reclassified to conform to the current presentation. These reclassifications had no effect on net income.
Use of Estimates in the Preparation of Financial Statements
The preparation of financial statements in conformity with GAAP requires management of the Company and the Bank to make estimates and assumptions that affect the reported amounts of assets and liabilities. Those estimates and assumptions also affect disclosure of contingent assets and liabilities at the date of the financial statements and the reported amounts of revenues and expenses during the reporting period. Actual results could differ from those estimates. Material estimates that are particularly susceptible to significant change in the near-term relate to the determination of the allowance for loan and lease losses, the fair value of financial instruments, the valuation of foreclosed real estate, valuation of goodwill, valuation of deferred tax assets and the liability related to post-retirement benefits.
30
FIRST FARMERS AND MERCHANTS CORPORATION AND SUBSIDIARIES
NOTES TO CONSOLIDATED FINANCIAL STATEMENTS
NOTE 1 – GENERAL AND SUMMARY OF SIGNIFICANT ACCOUNTING POLICIES, (CONTINUED)
Accounting Policies, (continued)
Concentrations of Credit Risk
The Company’s banking activities include granting commercial, residential, and consumer loans to customers primarily located in Middle Tennessee and northern Alabama. The Company manages its portfolio and product mix in a manner to reduce economic risk. Concentrations of credit, as defined for regulatory purposes, are reviewed quarterly by management to ensure that internally established limits are not exceeded. At December 31, 2015, our concentrations of commercial real estate, rental and leasing loans were 130.1% of Tier 1 Capital plus the allowance for loan and lease losses. Health care and social assistance loans were 39.1%. Construction loans were 46.6%. Construction loans were 27.7%. Wholesale trade credits were 28.0%. These percentages are within our internally established limits regarding concentrations of credit.
Loans secured by non-farm, non-residential real estate comprised 22.0% of the loan portfolio at December 31, 2015. Management remains comfortable with the real estate exposure levels within the commercial loan portfolio. Management believes the commercial real estate portion remains well diversified across several different property types and several different geographic markets.
Cash and Due From Banks
Included in cash and due from banks are reserve amounts that are required to be maintained in the form of cash and/or balances due from the Federal Reserve Bank and other banks. At December 31, 2015, the Bank’s required reserve was $2.4 million at the Federal Reserve. From time to time throughout the year, the Bank’s balances due from other financial institutions exceeded Federal Deposit Insurance Corporation (FDIC) insurance limits. The Bank had $24.5 million of federal funds sold as of December 31, 2015. Federal funds sold are essentially uncollateralized loans to other financial institutions.
Cash Equivalents
The Company considers all liquid investments with original maturities of three months or less to be cash equivalents. Cash equivalents include cash on hand, cash due from banks and federal funds sold. Federal funds are sold for one-day periods.
Securities
Certain debt securities that management has the intent and ability to hold to maturity are classified as “held-to-maturity” and recorded at amortized cost. Securities not classified as held-to-maturity are classified as “available-for-sale” and recorded at fair value, with unrealized gains and losses excluded from earnings and reported in other comprehensive income, net of tax. Purchase premiums and discounts are recognized in interest income using the interest method over the terms of the securities. Gains and losses on the sale of securities are recorded on the trade date and are determined using the specific identification method.
For debt securities with fair value below amortized cost which the Company does not intend to sell, and it is more likely than not the Company will not have to sell the security before recovery of its cost basis, the Company recognizes the credit component of an other-than-temporary impairment of a debt security in earnings and the remaining portion in other comprehensive income. For held-to-maturity debt securities, the amount of an other-than-temporary impairment recorded in other comprehensive income for the noncredit portion of a previous other-than-temporary impairment is amortized prospectively over the remaining life of the security on the basis of the timing of future estimated cash flows of the security.
31
FIRST FARMERS AND MERCHANTS CORPORATION AND SUBSIDIARIES
NOTES TO CONSOLIDATED FINANCIAL STATEMENTS
NOTE 1 – GENERAL AND SUMMARY OF SIGNIFICANT ACCOUNTING POLICIES, (CONTINUED)
Securities, (continued)
If declines in fair value are other-than-temporary, the carrying value of the securities is written down to fair value as a realized loss with a charge to income for the portion attributable to credit losses and a charge to other comprehensive income for the portion that is not credit related. For available-for-sale and held-to-maturity debt securities that management has no intent to sell and believes that the Company more likely than not will not be required to sell prior to recovery, only the credit loss component of the impairment is recognized in earnings, while the noncredit loss is recognized in accumulated other comprehensive income. The credit loss component recognized in earnings is identified as the amount of principal cash flows not expected to be received over the remaining term of the security based on cash flow projections.
Loans
Loans that management has the intent and ability to hold for the foreseeable future or until maturity or payoff is reported at their outstanding principal balances adjusted for unearned income, charge-offs, the allowance for loan and lease losses, any unamortized deferred fees or costs on originated loans and unamortized premiums or discounts on purchased loans.
For loans amortized at cost, interest income is accrued based on the unpaid principal balance. Loan origination fees, net of certain direct origination costs, as well as premiums and discounts, are deferred and amortized as a level yield adjustment over the respective term of the loan.
The accrual of interest on mortgage and commercial loans is discontinued at the time the loan is 90 days past due unless the credit is well-secured and in process of collection. Past-due status is based on contractual terms of the loan. In all cases, loans are placed on nonaccrual or charged off at an earlier date if collection of principal or interest is considered doubtful.
All interest accrued but not collected for loans that are placed on nonaccrual or charged off is reversed against interest income. The interest on these loans is accounted for on the cash-basis or cost-recovery method, until qualifying for return to accrual. Loans are returned to accrual status when all the principal and interest amounts contractually due are brought current and future payments are reasonably assured.
Discounts and premiums on purchased commercial loans are amortized to income using the interest method over the remaining period to contractual maturity and adjusted for anticipated prepayments.
Allowance for Loan and Lease Losses
The allowance for loan and lease losses is established through provisions for loan and lease losses charged against income. Loan losses are charged against the allowance when management determines that the uncollectibility of a loan has been confirmed. Subsequent recoveries, if any, are credited to the allowance account in the period received.
The adequacy of the allowance for loan and lease losses is evaluated quarterly in conjunction with loan review reports and evaluations that are discussed in meetings with loan officers, credit administration and the Bank’s Board of Directors. The Bank’s past loan loss experience, known and inherent risks in the portfolio, adverse situations that may affect a borrower’s ability to repay (including the timing of future payments), the estimated value of any underlying collateral, composition of the loan portfolio, current economic conditions and other relevant factors are considered in this evaluation. This process is inherently subjective as it requires material estimates that are susceptible to significant change, including the amounts and timing of future cash flows expected to be received on impaired loans. The allowance for loan and lease losses is maintained at a level believed by management to be adequate to absorb estimated losses inherent in the loan portfolio.
32
FIRST FARMERS AND MERCHANTS CORPORATION AND SUBSIDIARIES
NOTES TO CONSOLIDATED FINANCIAL STATEMENTS
NOTE 1 – GENERAL AND SUMMARY OF SIGNIFICANT ACCOUNTING POLICIES, (CONTINUED)
Allowance for Loan and Lease Losses, (continued)
A loan is considered impaired when it is probable that the Bank will be unable to collect all amounts due (principal and interest) according to the contractual terms of the loan agreement. Factors considered by management in determining impairment include payment status, collateral value and the probability of collecting scheduled principal and interest payments when due. Loans that experience insignificant payment delays and payment shortfalls generally are not classified as impaired. Management determines the significance of payment delays and payment shortfalls on a case-by-case basis, taking into consideration all of the circumstances surrounding the loan and the borrower, including the length of the delay, the reasons for the delay, the borrower’s prior payment record and the amount of the shortfall in relation to the principal and interest owed. Impairment is measured on a loan-by-loan basis for commercial and commercial real estate loans by either the present value of expected future cash flows discounted at the loan’s effective interest rate, the loan’s obtainable market price, or the fair value of the collateral if the loan is collateral dependent.
Groups of loans with similar risk characteristics are collectively evaluated for impairment based on the group’s historical loss experience adjusted for changes in trends, conditions and other relevant factors that affect repayment of the loans. Accordingly, the Bank does not separately identify individual consumer and residential loans for impairment measurements, unless such loans are the subject of a restructuring agreement due to financial difficulties of the borrower.
When any secured commercial loan is considered uncollectable, whether past due or not, a current assessment of the value of the underlying collateral is made. If the balance of the loan exceeds the fair value of the collateral, the loan is placed on nonaccrual and the loan is charged down to the value of the collateral less estimated cost to sell or a specific reserve equal to the difference between book value of the loan and the fair value assigned to the collateral is created until such time as the loan is foreclosed. When the foreclosed collateral has been legally assigned to the Bank, a charge off is taken, if necessary, in order that the remaining balance reflects the fair value estimated less costs to sell the collateral then transferred to other real estate owned or other repossessed assets. When any unsecured commercial loan is considered uncollectable the loan is charged off no later than at 90 days past due.
All closed-end consumer loans (excluding conventional 1-4 family residential loans and installment and revolving loans secured by real estate) are charged off upon reaching no later than 120 days (4 monthly payments) delinquent. If a loan is considered uncollectable, it is charged off earlier than 120 days delinquent. For conventional 1-4 family residential loans and installment and revolving loans secured by real estate, when a loan is 90 days past due, a current assessment of the value of the real estate is made. If the balance of the loan exceeds the fair value of the property, the loan is placed on nonaccrual and foreclosure proceedings are initiated. When the foreclosed property has been legally assigned to the Bank, a charge-off is taken with the remaining balance, reflecting the fair value less estimated costs to sell, transferred to other real estate owned.
Loans Held for Sale
Mortgage loans originated and intended for sale in the secondary market are carried at the lower of cost or fair value in the aggregate. Net unrealized losses, if any, are recognized through a valuation allowance by charges to non-interest income. Gains and losses on loan sales are recorded in non-interest income. The Company does not retain servicing rights on loans sold. There were no loans held for sale at December 31, 2015. Loans held for sale at December 31, 2014 totaled $354,000.
33
FIRST FARMERS AND MERCHANTS CORPORATION AND SUBSIDIARIES
NOTES TO CONSOLIDATED FINANCIAL STATEMENTS
NOTE 1 – GENERAL AND SUMMARY OF SIGNIFICANT ACCOUNTING POLICIES, (CONTINUED)
Other Real Estate
Assets acquired through, or in lieu of, loan foreclosure are held for sale and are initially recorded at fair value less cost to sell at the date of foreclosure, establishing a new cost basis. Subsequent to foreclosure, valuations are periodically performed by management and the assets are carried at the lower of carrying amount or fair value less cost to sell. Revenue and expenses from operations and changes in the valuation allowance are included in net income or expense from foreclosed assets.
When foreclosed properties are acquired current appraisals are obtained on the properties. Additionally, periodic updated appraisals are obtained on unsold foreclosed properties. When an updated appraisal reflects a market value below the current book value, a charge is booked to current earnings to reduce the property to its new market value less expected selling costs. Our policy for determining the frequency of periodic reviews is based upon consideration of the specific properties and the known or perceived market fluctuations in a particular market and is typically between 12 and 24 months.
Premises and Equipment
Premises and equipment are stated at cost, less accumulated depreciation and amortization. The provision for depreciation is computed principally on an accelerated method over the estimated useful life of an asset, which ranges from 15 to 39 years for buildings and from three to 25 years for equipment. Costs of major additions and improvements are capitalized. Expenditures for maintenance and repairs are charged to operations as incurred. Gains or losses from the disposition of property are reflected in operations, and the asset accounts and related allowances for depreciation are reduced.
Federal Reserve and Federal Home Loan Bank Stock
Federal Reserve and Federal Home Loan Bank stock are required investments for institutions that are members of the Federal Reserve and Federal Home Loan Bank systems. The required investment in the common stock is based on a predetermined formula, carried at cost and evaluated for impairment. At December 31, 2015 and 2014 Federal Reserve and Federal Home Loan Bank stock totaled $3.9 million.
Goodwill
Goodwill is evaluated annually for impairment. Quantitative and qualitative assessments are performed to determine whether the existence of events or circumstances leads to a determination that it is more likely than not the fair value is less than the carrying amount, including goodwill. If, based on the evaluation, it is determined to be more likely than not that the fair value is less than the carrying value, then goodwill is tested further for impairment. If the implied fair value of goodwill is lower than its carrying amount, a goodwill impairment is indicated and goodwill is written down to its implied fair value. Subsequent increases in goodwill value are not recognized in the financial statements.
Transfers of Financial Assets
Transfers of financial assets are accounted for as sales when control over the assets has been surrendered. Control over transferred assets is deemed to be surrendered when (1) the assets have been isolated from the Company—put presumptively beyond the reach of the transferor and its creditors, even in bankruptcy or other receivership, (2) the transferee obtains the right (free of conditions that constrain it from taking advantage of that right) to pledge or exchange the transferred assets and (3) the Company does not maintain effective control over the transferred assets through an agreement to repurchase them before their maturity or the ability to unilaterally cause the holder to return specific assets.
34
FIRST FARMERS AND MERCHANTS CORPORATION AND SUBSIDIARIES
NOTES TO CONSOLIDATED FINANCIAL STATEMENTS
NOTE 1 – GENERAL AND SUMMARY OF SIGNIFICANT ACCOUNTING POLICIES, (CONTINUED)
Income Taxes
The Company files consolidated income tax returns with its subsidiaries. The Company accounts for income taxes in accordance with income tax accounting guidance (ASC 740, Income Taxes). The income tax accounting guidance requires two components of income tax expense which are current and deferred. Current income tax expense reflects taxes to be paid or refunded for the current period by applying the provisions of the enacted tax law to the taxable income or excess of deductions over revenues. The Company determines deferred income taxes using the liability (or balance sheet) method. Under this method, the net deferred tax asset or liability is based on the tax effects of the differences between the book and tax bases of assets and liabilities, and enacted changes in tax rates and laws are recognized in the period in which they occur. Deferred income tax expense results from changes in deferred tax assets and liabilities between periods. Deferred tax assets are reduced by a valuation allowance if, based on the weight of evidence available, it is more likely than not that some portion or all of a deferred tax asset will not be realized.
Tax positions are recognized if it is more likely than not, based on the technical merits, that the tax position will be realized or sustained upon examination. The term more likely than not means a likelihood of more than 50 percent; the terms examined and upon examination also include resolution of the related appeals or litigation processes, if any. A tax position that meets the more-likely-than-not recognition threshold is initially and subsequently measured as the largest amount of tax benefit that has a greater than 50 percent likelihood of being realized upon settlement with a taxing authority that has full knowledge of all relevant information. The determination of whether or not a tax position has met the more-likely-than-not recognition threshold considers the facts, circumstances and information available at the reporting date and is subject to management’s judgment. With a few exceptions, the Company is no longer subject to U.S. federal tax examinations and state and local tax examinations by tax authorities for years before 2012.
The Company recognizes interest and penalties on income taxes as a component of income tax expense. As of December 31, 2015, the Company has accrued no interest and no penalties related to uncertain tax positions.
Securities Sold Under Agreements to Repurchase
Securities sold under agreements to repurchase, which are classified as secured borrowings, generally mature within one to four days from the transaction date. Securities sold under agreements to repurchase are reflected at the amount of cash received in connection with the transaction.
Fair Value Measurements
Financial Accounting Standards Board (“FASB”) ASC Topic 820, “Fair Value Measurements and Disclosures,” defines fair value, establishes a framework for measuring fair value in generally accepted accounting principles, and requires certain disclosures about fair value measurements. See Note 12 – Fair Value Measurement. In general, fair values of financial instruments are based upon quoted market prices, where available. If such quoted market prices are not available, fair value is based upon internally developed models that primarily use, as input, observable market-based parameters. Valuation adjustments may be made to ensure that financial instruments are recorded at fair value. These adjustments may include amounts to reflect counterparty credit quality and the Company’s creditworthiness, among other things, as well as unobservable parameters. Any such valuation adjustments are applied consistently over time.
35
FIRST FARMERS AND MERCHANTS CORPORATION AND SUBSIDIARIES
NOTES TO CONSOLIDATED FINANCIAL STATEMENTS
NOTE 1 – GENERAL AND SUMMARY OF SIGNIFICANT ACCOUNTING POLICIES, (CONTINUED)
Earnings Per Share
Earnings per share represents income available to shareholders divided by the weighted average number of shares of Company common stock outstanding during the period. Fully diluted earnings per share is not presented as there are no common stock equivalents.
The following is a summary of the earnings per share calculation for the periods presented:
| Years ended December 31, | ||||||
| 2015 | 2014 | 2013 | ||||
| (dollars in thousands, expect per share data) | ||||||
| Earnings per share calculation: | ||||||
| Numerator – Net income available to common shareholders | $ | 10,306 | $ | 10,242 | $ | 9,611 |
| Denominator – Weighted average common shares outstanding | 4,832,217 | 4,963,826 | 5,110,849 | |||
| Net income per common share available to common shareholders | $ | 2.13 | $ | 2.06 | $ | 1.88 |
In 2015, the Company renewed a plan to repurchase shares of its common stock. The plan allowed the purchase of up to 200,000 shares. The Company purchased 161,074, 120,436, and 158,988 shares in 2015, 2014, and 2013, respectively.
Accumulated Other Comprehensive Income (Loss)
Comprehensive income (loss) consists of net income and other comprehensive income (loss), net of applicable income tax expenses or benefits. Other comprehensive income (loss) includes unrealized appreciation or depreciation on available-for-sale securities and changes in the net actuarial gain or loss of the post-retirement benefit obligation.
The components of accumulated other comprehensive loss, included in shareholder’s equity, are as follows:
| Years ended December 31, | |||||||||
|
2015 |
2014 | 2013 | |||||||
| (dollars in thousands) | |||||||||
| Net unrealized losses | |||||||||
| on available-for-sale securities | $ | (4,269 | ) | $ | (5,517 | ) | $ | (17,178 | ) |
| Net actuarial gain on unfunded portion | |||||||||
| of post-retirement benefit obligation | 2,183 | 2,062 | 2,542 | ||||||
| (2,086 | ) | (3,455 | ) | (14,636 | ) | ||||
| Tax benefit | 803 | 1,329 | 5,635 | ||||||
| Accumulated other comprehensive loss | $ | (1,283 | ) | $ | (2,126 | ) | $ | (9,001 | ) |
36
FIRST FARMERS AND MERCHANTS CORPORATION AND SUBSIDIARIES
NOTES TO CONSOLIDATED FINANCIAL STATEMENTS
NOTE 1 – GENERAL AND SUMMARY OF SIGNIFICANT ACCOUNTING POLICIES, (CONTINUED)
Transfers Between Fair Value Hierarchy Levels
Transfers in and out of Level 1 (quoted market prices), Level 2 (other significant observable inputs) and Level 3 (significant unobservable inputs) are recognized on the period end date.
Segment Reporting
Management analyzes the operations of the Company assuming one operating segment, community lending services.
Recent Accounting Pronouncements
In May 2014, the Financial Accounting Standards Board (“FASB”) issued ASU 2014-09, Revenue from Contracts with Customers, (Topic 606). ASU 2014-09 states a company will recognize revenue when it transfers promised goods or services to customers in an amount that reflects the consideration to which the company expects to be entitled in exchange for those goods or services. In doing so, companies will need to use more judgment and make more estimates than under existing guidance. These may include identifying performance obligations in the contract, estimating the amount of variable consideration to include in the transaction price and allocating the transaction price to each separate performance obligation. In August of 2015, the FASB issued ASU 2015-14, Revenue from Contracts with Customers, (Topic 606): Deferral of the Effective Date. ASU 2015-14 defers the effective date of Update 2014-09 for all entities by one year. As such, ASU 2014-09 is effective for annual reporting periods beginning after December 15, 2017, including interim periods within that reporting period. The amendments can be applied retrospectively to each prior reporting period or retrospectively with the cumulative effect of initially applying this update recognized at the date of initial application. The Company is currently evaluating the impact of adopting the new guidance on the consolidated financial statements, but the Company does not expect it to have a material impact.
In June 2014, the FASB issued ASU 2014-11, Repurchase-to-Maturity Transactions, Repurchase Financings, and Disclosures. ASU 2014-11 aligns the accounting for repurchase-to-maturity transactions and repurchase agreements executed as repurchase financings with the accounting for other typical repurchase agreements. Going forward, these transactions would all be accounted for as secured borrowings. The guidance eliminates sale accounting for repurchase-to-maturity transactions and supersedes the guidance under which a transfer of a financial asset and a contemporaneous repurchase financing could be accounted for on a combined basis as a forward agreement, which has resulted in outcomes referred to as off-balance-sheet accounting. The amendments in ASU 2014-11 require a new disclosure for transactions economically similar to repurchase agreements in which the transferor retains substantially all of the exposure to the economic return on the transferred financial assets throughout the term of the transaction. The amendments in ASU 2014-11 also require expanded disclosures about the nature of collateral pledged in repurchase agreements and similar transactions accounted for as secured. The Company adopted the amendments in this ASU 2014-11 effective January 1, 2015. As of December 31, 2015, all of the Company's repurchase agreements were typical in nature (i.e., not repurchase-to-maturity transactions or repurchase agreements executed as a repurchase financing) and are accounted for as secured borrowings. As such, the adoption of ASU 2014-11 did not have a material impact on the Company's Consolidated Financial Statements.
37
FIRST FARMERS AND MERCHANTS CORPORATION AND SUBSIDIARIES
NOTES TO CONSOLIDATED FINANCIAL STATEMENTS
NOTE 1 – GENERAL AND SUMMARY OF SIGNIFICANT ACCOUNTING POLICIES, (CONTINUED)
Recent Accounting Pronouncements, (continued)
ASU 2014-14, Receivables – Troubled Debt Restructurings by Creditors (Subtopic 310-40). ASU 2014-14 applies to creditors that hold government-guaranteed mortgage loans, including those guaranteed by the FHA and the VA. The amendments in this Update require that a mortgage loan be derecognized and that a separate other receivable be recognized upon foreclosure if the following conditions are met: (1) the loan has a government guarantee that is not separable from the loan before foreclosure. (2) at the time of foreclosure, the creditor has the intent to convey the real estate property to the guarantor and make a claim on the guarantee, and the creditor has the ability to recover under that claim. (3) at the time of foreclosure, any amount of the claim that is determined on the basis of the fair value of the real estate is fixed. Upon foreclosure, the separate other receivable should be measured based on the amount of the loan balance (principal and interest) expected to be recovered from the guarantor. ASU 2014-14 was effective for public business entities for annual periods, and interim periods within those annual periods, beginning after December 15, 2014. The adoption of ASU 2014-14 did not have a material impact on the Company’s Consolidated Financial Statements.
ASU 2016-1, Financial Instruments – Overall (Subtopic 825-10): Recognition and Measurement of Financial Assets and Financial Liabilities. ASU 2016-1, among other things, (i) requires equity investments, with certain exceptions, to be measured at fair value with changes in fair value recognized in net income, (ii) simplifies the impairment assessment of equity investments without readily determinable fair values by requiring a qualitative assessment to identify impairment, (iii) eliminates the requirement for public business entities to disclose the methods and significant assumptions used to estimate the fair value that is required to be disclosed for financial instruments measured at amortized cost on the balance sheet, (iv) requires public business entities to use the exit price notion when measuring the fair value of financial instruments for disclosure purposes, (v) requires an entity to present separately in other comprehensive income the portion of the total change in the fair value of a liability resulting from a change in the instrument-specific credit risk when the entity has elected to measure the liability at fair value in accordance with the fair value option for financial instruments, (vi) requires separate presentation of financial assets and financial liabilities by measurement category and form of financial asset on the balance sheet or the accompanying notes to the financial statements and (viii) clarifies that an entity should evaluate the need for a valuation allowance on a deferred tax asset related to available-for-sale. ASU 2016-1 will be effective for the Company on January 1, 2018 and is not expected to have a significant impact on our financial statements.
ASU 2016-2, Leases (Topic 842). ASU 2016-2, among other things, requires lessees to recognize the following for all leases (with the exception of short-term leases) at the commencement date: (i) a lease liability, which is a lessee’s obligation to make lease payments arising from a lease, measured on a discounted basis and (ii) a right-of-use asset, which is an asset that represents the lessee’s right to use, or control the use of, a specified asset for the lease term. Under the new guidance, lessor accounting is largely unchanged. Certain targeted improvements were made to align, where necessary, lessor accounting with the lessee accounting model and Topic 606, Revenue from Contracts with Customers. ASU 2016-2 will be effective for public business entities for fiscal years beginning after December 15, 2018, including interim periods within those fiscal years. Nonpublic business entities should apply the amendments for fiscal years beginning after December 15, 2019 and interim periods within fiscal years beginning after December 15, 2020. Early application is permitted for all public business entities and all nonpublic entities upon issuance. The Company is currently evaluating the impact of adopting the new guidance on the consolidated financial statements, but the Company does not expect it to have a material impact.
38
FIRST FARMERS AND MERCHANTS CORPORATION AND SUBSIDIARIES
NOTES TO CONSOLIDATED FINANCIAL STATEMENTS
NOTE 2 – RECLASSIFICATIONS FROM ACCUMULATED OTHER COMPREHENSIVE INCOME (LOSS) (“AOCI”)
Amounts reclassified from AOCI and the affected line items in the statements of income during the periods presented are as follows:
| Amounts reclassified from AOCI | ||||||||||
| Years ended | ||||||||||
|
December 31, 2015 |
December 31, 2014 |
December 31, 2013 |
Affected line item in the Statements of income |
|||||||
| Unrealized gains on available-for-sale | Realized gain on sale of | |||||||||
| securities | $ | 534 | $ | 652 | $ | 829 | securities | |||
| (206 | ) | (251 | ) | (319 | ) | Tax expense | ||||
| $ | 328 | $ | 401 | $ | 510 | Net reclassified amount | ||||
| Amortization of defined benefit | ||||||||||
| pension items | $ | 160 | $ | 188 | $ | (190 | ) | |||
| Actuarial gains (losses) | (62 | ) | (72 | ) | 73 | Tax (expense) benefit | ||||
| $ | 98 | $ | 116 | $ | (117 | ) | Net reclassified amount | |||
| Total reclassifications out of AOCI | $ | 426 | $ | 517 | $ | 393 | ||||
NOTE 3 – SECURITIES
The amortized cost and fair value of securities available-for-sale and held-to-maturity at December 31, 2015 and 2014 are summarized as follows:
| Gross | Gross | ||||||||
| Amortized | unrealized | unrealized | Fair | ||||||
| cost | gains | losses | value | ||||||
| December 31, 2015: | (dollars in thousands) | ||||||||
| Available-for-sale securities: | |||||||||
| U.S. government sponsored agencies | $ | 132,543 | $ | 40 | $ | (1,526 | ) | $ | 131,057 |
| U.S. government sponsored agency mortgage backed | 171,620 | 6 | (4,559 | ) | 167,067 | ||||
| securities | |||||||||
| States and political subdivisions | 71,493 | 1,916 | (90 | ) | 73,319 | ||||
| Corporate bonds | 23,632 | 54 | (110 | ) | 23,576 | ||||
| $ | 399,288 | $ | 2,016 | $ | (6,285 | ) | $ | 395,019 | |
| Held-to-maturity securities: | |||||||||
| States and political subdivisions | $ | 4,059 | $ | 33 | $ | (3 | ) | $ | 4,089 |
| December 31, 2014: | |||||||||
| Available-for-sale securities: | |||||||||
| U.S. government sponsored agencies | $ | 162,289 | $ | 50 | $ | (3,085 | ) | $ | 159,254 |
| U.S. government sponsored agency mortgage backed | |||||||||
| securities | 172,035 | 64 | (4,129 | ) | 167,970 | ||||
| State and political subdivisions | 51,374 | 1,658 | (150 | ) | 52,882 | ||||
| Corporate bonds | 17,705 | 129 | (54 | ) | 17,780 | ||||
| $ | 403,403 | $ | 1,901 | $ | (7,418 | ) | $ | 397,886 | |
| Held-to-maturity securities: | |||||||||
| States and political subdivisions | $ | 21,985 | $ | 278 | $ | - | $ | 22,263 | |
39
FIRST FARMERS AND MERCHANTS CORPORATION AND SUBSIDIARIES
NOTES TO CONSOLIDATED FINANCIAL STATEMENTS
NOTE 3 – SECURITIES, (CONTINUED)
Certain investments in debt securities are reported in the financial statements at an amount less than their historical cost. Total fair value of these investments at December 31, 2015 and 2014 was approximately $306.3 million and $326.0 million, which was approximately 77% and 78%, respectively, of the Company’s available-for-sale and held-to-maturity investment portfolio. The Company evaluates its investment portfolio on a quarterly basis for impairment.
The analysis performed as of December 31, 2015 and December 31, 2014 indicated that all impairment was considered temporary, market driven due primarily to fluctuations in market interest rates and not credit-related.
The following table shows the Company’s investments’ gross unrealized losses and fair value of the Company’s investments with unrealized losses that were not deemed to be other-than-temporarily impaired, aggregated by investment class and length of time that individual securities had been in a continuous unrealized loss position at December 31, 2015 and 2014:
| Less than 12 months | 12 months or more | Total | |||||||||||||
| Fair | Unrealized | Fair | Unrealized | Fair | Unrealized | ||||||||||
| value | losses | value | losses | value | losses | ||||||||||
| (dollars in thousands) | |||||||||||||||
| ` | |||||||||||||||
| Available-for-sale securities: | |||||||||||||||
| U.S. government sponsored agencies | $ | 70,454 | $ | (425 | ) | $ | 43,080 | $ | (1,101 | ) | $ | 113,534 | $ | (1,526 | ) |
| U.S. government sponsored agency | |||||||||||||||
| mortgage backed securities | 74,860 | (1,073 | ) | 90,125 | (3,486 | ) | 164,985 | (4,559 | ) | ||||||
| States and political subdivisions | 8,472 | (64 | ) | 2,556 | (26 | ) | 11,028 | (90 | ) | ||||||
| Corporate bonds | 14,504 | (87 | ) | 1,854 | (23 | ) | 16,358 | (110 | ) | ||||||
| $ | 168,290 | $ | (1,649 | ) | $ | 137,615 | $ | (4,636 | ) | $ | 305,905 | $ | (6,285 | ) | |
| Held-to-maturity securities: | |||||||||||||||
| States and political subdivisions | $ | 438 | $ | (3 | ) | $ | - | $ | - | $ | 438 | $ | (3 | ) | |
| December 31, 2014: | |||||||||||||||
| Available-for-sale securities: | |||||||||||||||
| U.S. government sponsored agencies | $ | 46,977 | $ | (219 | ) | $ | 104,815 | $ | (2,866 | ) | $ | 151,792 | $ | (3,085 | ) |
| U.S. government sponsored agency | |||||||||||||||
| mortgage backed securities | 21,339 | (77 | ) | 128,935 | (4,052 | ) | 150,274 | (4,129 | ) | ||||||
| States and political subdivisions | 14,539 | (142 | ) | 1,418 | (8 | ) | 15,957 | (150 | ) | ||||||
| Corporate bonds | 4,783 | (17 | ) | 3,207 | (37 | ) | 7,990 | (54 | ) | ||||||
| $ | 87,638 | $ | (455 | ) | $ | 238,375 | $ | (6,963 | ) | $ | 326,013 | $ | (7,418 | ) | |
40
FIRST FARMERS AND MERCHANTS CORPORATION AND SUBSIDIARIES
NOTES TO CONSOLIDATED FINANCIAL STATEMENTS
NOTE 3 – SECURITIES, (CONTINUED)
As shown in the tables above, at December 31, 2015, the Company had approximately $6.3 million in unrealized losses on $306.3 million of securities. The unrealized loss positions are most significant in two types of securities sectors which are U.S. government agencies and U.S. government sponsored agency mortgage backed securities. The unrealized losses associated with these investment securities are driven by changes in interest rates and the unrealized loss is recorded as a component of equity. These securities will continue to be monitored as a part of our ongoing impairment analysis, but are expected to perform even if the rating agencies reduce the credit rating of the bond issuers. Management evaluates the financial performance of the issuers on a quarterly basis to determine if it is probable that the issuers can make all contractual principal and interest payments. If a shortfall in future cash flows is identified, a credit loss will be deemed to have occurred and will be recognized as a change to earnings and a new cost basis for the security will be established.
The amortized cost and fair value of available-for-sale and held-to-maturity securities at December 31, 2015 and 2014, by contractual maturity, are shown below. Expected maturities will differ from contractual maturities because issuers may have the right to call or prepay obligations with or without call or prepayment penalties.
| Available-for-sale | Held-to-maturity | |||||||
| Amortized | Fair | Amortized | Fair | |||||
| December 31, 2015 | cost | value | cost | value | ||||
| (dollars in thousands) | ||||||||
| Within one year | $ | 5,678 | $ | 5,695 | $ | 475 | $ | 476 |
| One to five years | 132,685 | 131,605 | 984 | 997 | ||||
| Five to ten years | 49,992 | 50,396 | 610 | 611 | ||||
| After ten years | 39,313 | 40,256 | 1,990 | 2,005 | ||||
| Mortgage-backed securities | 171,620 | 167,067 | - | - | ||||
| $ | 399,288 | $ | 395,019 | $ | 4,059 | $ | 4,089 | |
The carrying value of securities pledged as collateral to secure public deposits and for other purposes was $253.6 million at December 31, 2015 and $217.2 million at December 31, 2014.
The book value of securities sold under agreements to repurchase amounted to $30.5 million and $35.0 million at December 31, 2015 and 2014, respectively.
| Years ended December 31, | |||||||||
| 2015 | 2014 | 2013 | |||||||
| (dollars in thousands) | |||||||||
| Gross gains recognized on sales of securities | $ | 579 | $ | 737 | $ | 1,026 | |||
| Gross losses recognized on sales of securities | (45 | ) | (85 | ) | (197 | ) | |||
| Net realized gains on sales of securities available-for-sale | $ | 534 | $ | 652 | $ | 829 | |||
During 2014, the Company transferred one held-to-maturity bond with a net carrying value of $450,000 to available-for-sale classification. Under ASC 320-10-26-6, the Company had concluded that there was sufficient evidence of deteriorating credit worthiness. Immediately following the reclassification, the Company sold the bond recognizing a realized gain of $5,000.
41
FIRST FARMERS AND MERCHANTS CORPORATION AND SUBSIDIARIES
NOTES TO CONSOLIDATED FINANCIAL STATEMENTS
NOTE 4 – LOANS
The following table presents the Bank’s loans by category as of the periods presented:
| December 31, | December 31, | |||||
| 2015 | 2014 | |||||
| Commercial | (dollars in thousands) | |||||
| Commercial and industrial | $ | 127,899 | $ | 99,788 | ||
| Non-farm, nonresidential real estate | 161,009 | 163,461 | ||||
| Construction and development | 51,330 | 50,424 | ||||
| Commercial loans secured by real estate | 28,091 | 27,937 | ||||
| Other commercial | 60,325 | 41,185 | ||||
| Total commercial | 428,654 | 382,795 | ||||
| Residential | ||||||
| Consumer loans | 9,914 | 9,536 | ||||
| Single family residential | 260,254 | 229,559 | ||||
| Other retail | 32,444 | 30,162 | ||||
| Total residential and consumer | 302,612 | 269,257 | ||||
| $ | 731,266 | $ | 652,052 | |||
| Less: | ||||||
| Allowance for possible loan and lease losses | (8,634 | ) | (7,934 | ) | ||
| Total net loans | $ | 722,632 | $ | 644,118 | ||
The amount of capitalized fees and costs calculated in accordance with ASC 310-20 included in the above loan totals were $941,000 and $932,000 at December 31, 2015 and December 31, 2014, respectively.
Loan Origination/Risk Management. The Company has certain lending policies and procedures in place that are designed to maximize loan income within an acceptable level of risk. Management reviews and approves these policies and procedures on a regular basis. A reporting system supplements the review process by providing management with frequent reports related to loan production, loan quality, concentrations of credit, loan delinquencies and non-performing and potential problem loans. Diversification in the loan portfolio is a means of managing risk associated with fluctuations in economic conditions.
Commercial and industrial loans are underwritten after evaluating and understanding the borrower’s ability to operate profitably and prudently expand its business. Underwriting standards are designed to promote relationship banking rather than transactional banking. Once it is determined that the borrower’s management possesses sound ethics and solid business acumen, the Company’s management examines current and projected cash flows to determine the ability of the borrower to repay their obligations as agreed. Commercial and industrial loans are primarily made based on the identified cash flows of the borrower and secondarily on the underlying collateral provided by the borrower. The cash flows of borrowers, however, may not be as expected and the collateral securing these loans may fluctuate in value. Most commercial and industrial loans are secured by the assets being financed or other business assets such as accounts receivable or inventory and may incorporate a personal guarantee; however, some short-term loans may be made on an unsecured basis. In the case of loans secured by accounts receivable, the availability of funds for the repayment of these loans may be substantially dependent on the ability of the borrower to collect amounts due from its customers.
42
FIRST FARMERS AND MERCHANTS CORPORATION AND SUBSIDIARIES
NOTES TO CONSOLIDATED FINANCIAL STATEMENTS
NOTE 4 – LOANS, (CONTINUED)
Commercial real estate loans are subject to underwriting standards and processes similar to commercial and industrial loans, in addition to those of real estate loans. These loans are viewed primarily as loans secured by real estate. Commercial real estate lending typically involves higher loan principal amounts and the repayment of these loans is largely dependent on the successful operation of the property securing the loan or the business conducted on the property securing the loan. Commercial real estate loans may be more adversely affected by conditions in the real estate markets or in the general economy. Management monitors and evaluates commercial real estate loans based on collateral, geography and risk grade criteria. As a general rule, the Company avoids financing single-purpose projects unless other underwriting factors are present to help mitigate risk. The Company also utilizes third-party experts to provide insight and guidance about economic conditions and trends affecting market areas it serves. In addition, management tracks the level of owner-occupied commercial real estate loans versus non-owner occupied loans.
At December 31, 2015, approximately 55% of the outstanding principal balance of the Company’s commercial real estate loans was secured by owner-occupied properties, compared to 45% at December 31, 2014.
With respect to loans to developers and builders that are secured by non-owner occupied properties that the Company may originate from time to time, the Company generally requires the borrower to have had an existing relationship with the Company and have a proven record of success. Construction loans are underwritten utilizing feasibility studies, independent appraisal reviews, sensitivity analysis of absorption and lease rates and financial analysis of the developers and property owners. Construction loans are generally based upon estimates of costs and value associated with the complete project. These estimates may be inaccurate. Construction loans often involve the disbursement of substantial funds with repayment substantially dependent on the success of the ultimate project. Sources of repayment for these types of loans may be pre-committed permanent loans from approved long-term lenders, sales of developed property or an interim loan commitment from the Company until permanent financing is obtained. These loans are closely monitored by on-site inspections and are considered to have higher risks than other real estate loans due to their ultimate repayment being sensitive to interest rate changes, governmental regulation of real property, general economic conditions and the availability of long-term financing.
The Company originates residential and consumer loans utilizing a computer-based credit scoring analysis to supplement the underwriting process. To monitor and manage consumer loan risk, policies and procedures are developed and modified, as needed, jointly by line and staff personnel. This activity, coupled with relatively small loan amounts that are spread across many individual borrowers, minimizes risk. Additionally, trend and outlook reports are reviewed by management on a regular basis. Underwriting standards for home equity loans are heavily influenced by statutory requirements, which include, but are not limited to, a maximum loan-to-value percentage of 80%, collection remedies, the number of such loans a borrower can have at one time and documentation requirements.
The Company contracts with a third party vendor to perform loan reviews. The Company reviews and validates the credit risk program on an annual basis. Results of these reviews are presented to management. The loan review process complements and reinforces the risk identification and assessment decisions made by lenders and credit personnel, as well as the Company’s policies and procedures.
The goal of the bank is to diversify loans to avoid a concentration of credit in a specific industry, person, entity, product, service, or any area vulnerable to a tax law change or an economic event. A concentration of credit occurs when obligations, direct or indirect, of the same or affiliated interests represent 15% or more of the Bank’s capital structure. Commercial real estate rental and leasing represented the highest concentration at 120% of tier 1 capital. The Board of Directors recognizes that the Bank’s geographic trade area imposes some limitations regarding loan diversification if the bank is to perform the function for which it has been chartered. Specifically, lending to qualified borrowers within the Bank’s trade area will naturally cause concentrations of real estate loans in the primary communities served by the Bank and loans to employees of major employers in the area.
43
FIRST FARMERS AND MERCHANTS CORPORATION AND SUBSIDIARIES
NOTES TO CONSOLIDATED FINANCIAL STATEMENTS
NOTE 4 – LOANS, (CONTINUED)
The following table provides details regarding the aging of the Bank’s loan portfolio:
| 30-59 | 60-89 | 90 days | Total | ||||||||||
| days | days | and greater | past | Total | |||||||||
| December 31, 2015 | past due | past due | past due | due | Current | Loans | |||||||
|
(dollars in thousands) |
|||||||||||||
| Commercial: | |||||||||||||
| Commercial and industrial | $ | 245 | $ | 25 | $ | 245 | $ | 515 | $ | 127,384 | $ | 127,899 | |
| Non-farm, non-residential real estate | 2,486 | 123 | 279 | 2,888 | 158,121 | 161,009 | |||||||
| Construction and development | 7 | - | - | 7 | 51,323 | 51,330 | |||||||
| Commercial loans secured by estate | |||||||||||||
| real estate | 24 | 8 | 163 | 195 | 27,896 | 28,091 | |||||||
| Other commercial | - | - | - | - | 60,325 | 60,325 | |||||||
| Total commercial loans | 2,762 | 156 | 687 | 3,605 | 425,049 | 428,654 | |||||||
| Retail: | |||||||||||||
| Consumer | 43 | 36 | 7 | 86 | 9,828 | 9,914 | |||||||
| Single family residential | 1,918 | 664 | 164 | 2,746 | 257,508 | 260,254 | |||||||
| Other retail | 160 | 148 | 54 | 362 | 32,082 | 32,444 | |||||||
| Total retail loans | 2,121 | 848 | 225 | 3,194 | 299,418 | 302,612 | |||||||
| Total | $ | 4,883 | $ | 1,004 | $ | 912 | $ | 6,799 | $ | 724,467 | $ | 731,266 | |
| 30-59 | 60-89 | 90 days | Total | ||||||||||
| days | days | and greater | past | Total | |||||||||
| December 31, 2014 | past due | past due | past due | due | Current | loans | |||||||
| (dollars in thousands) | |||||||||||||
| Commercial: | |||||||||||||
| Commercial and industrial | $ | 263 | $ | 63 | $ | 1,428 | $ | 1,754 | $ | 98,034 | $ | 99,788 | |
| Non-farm, non-residential real estate | 413 | 145 | 330 | 888 | 162,573 | 163,461 | |||||||
| Construction and development | - | - | - | - | 50,424 | 50,424 | |||||||
| Commercial loans secured by estate | |||||||||||||
| real estate | 92 | 56 | 172 | 320 | 27,617 | 27,937 | |||||||
| Other commercial | 10 | - | 1,092 | 1,102 | 40,083 | 41,185 | |||||||
| Total commercial loans | 778 | 264 | 3,022 | 4,064 | 378,731 | 382,795 | |||||||
| Retail: | |||||||||||||
| Consumer | 72 | 7 | 42 | 121 | 9,415 | 9,536 | |||||||
| Single family residential | 2,361 | 395 | 464 | 3,220 | 226,339 | 229,559 | |||||||
| Other retail | - | - | - | - | 30,162 | 30,162 | |||||||
| Total retail loans | 2,433 | 402 | 506 | 3,341 | 265,916 | 269,257 | |||||||
| Total | $ | 3,211 | $ | 666 | $ | 3,528 | $ | 7,405 | $ | 644,647 | $ | 652,052 | |
A loan is considered impaired, in accordance with the impairment accounting guidance (ASC 310-10-35-16), when based on current information and events, it is probable the Company will be unable to collect all amounts due from the borrower in accordance with the contractual terms of the loan. Impaired loans include non-performing commercial loans but also include loans modified in troubled debt restructurings.
44
FIRST FARMERS AND MERCHANTS CORPORATION AND SUBSIDIARIES
NOTES TO CONSOLIDATED FINANCIAL STATEMENTS
NOTE 4 – LOANS, (CONTINUED)
The following table summarizes the impaired loans by loan type:
|
Unpaid contractual principal balance |
Recorded investment with no allowance |
Recorded investment with allowance |
Total recorded investment |
Related allowance |
Average recorded investment year to date |
Interest received |
Interest accrued |
||||||||||
| December 31, 2015 | |||||||||||||||||
| (dollars in thousands) | |||||||||||||||||
| Commercial: | |||||||||||||||||
| Commercial and industrial | $ | 432 | $ | 60 | $ | 262 | $ | 322 | $ | 28 | $ | 344 | $ | 17 | $ | 22 | |
| Non-farm, non-residential real estate | 469 | 401 | - | 401 | - | 428 | 17 | 24 | |||||||||
| Commercial loans secured by real estate | 192 | - | 163 | 163 | 29 | 169 | 6 | 13 | |||||||||
| Other commercial | - | - | - | - | - | - | - | - | |||||||||
|
Commercial total |
1,093 | 461 | 425 | 886 | 57 | 941 | 40 | 59 | |||||||||
| Retail: | |||||||||||||||||
| Single family residential | 1,612 | 510 | 830 | 1,340 | 102 | 1,415 | 81 | 83 | |||||||||
| Other retail | 130 | 74 | - | 74 | - | 79 | 6 | 7 | |||||||||
|
Retail total |
1,742 | 584 | 830 | 1,414 | 102 | 1,494 | 87 | 90 | |||||||||
| Total | $ | 2,835 | $ | 1,045 | $ | 1,255 | $ | 2,300 | $ | 159 | $ | 2,435 | $ | 127 | $ | 149 | |
|
Unpaid contractual principal balance |
Recorded investment with no allowance |
Recorded investment with allowance |
Total recorded investment |
Related allowance |
Average recorded investment year to date |
Interest received |
Interest accrued |
||||||||||
| December 31, 2014 | |||||||||||||||||
|
(dollars in thousands) |
|||||||||||||||||
| Commercial: | |||||||||||||||||
| Commercial and industrial | $ | 3,760 | $ | 2,734 | $ | 217 | $ | 2,951 | $ | 9 | $ | 3,230 | $ | 97 | $ | 207 | |
| Non-farm, non-residential real estate | 3,720 | 3,241 | - | 3,241 | - | 3,570 | 213 | 212 | |||||||||
| Commercial loans secured by real estate | 1,053 | 564 | 166 | 730 | 33 | 826 | 67 | 77 | |||||||||
| Other commercial | 1,256 | 1,092 | - | 1,092 | - | 1,171 | 89 | 84 | |||||||||
|
Commercial total |
9,789 | 7,631 | 383 | 8,014 | 42 | 8,797 | 466 | 580 | |||||||||
| Retail: | |||||||||||||||||
| Single family residential | 1,094 | 539 | 439 | 978 | 10 | 786 | 44 | 42 | |||||||||
| Other retail | 425 | 411 | - | 411 | - | 369 | 17 | 19 | |||||||||
|
Retail total |
1,519 | 950 | 439 | 1,389 | 10 | 1,155 | 61 | 61 | |||||||||
| Total | $ | 11,308 | $ | 8,581 | $ | 822 | $ | 9,403 | $ | 52 | $ | 9,952 | $ | 527 | $ | 641 | |
45
FIRST FARMERS AND MERCHANTS CORPORATION AND SUBSIDIARIES
NOTES TO CONSOLIDATED FINANCIAL STATEMENTS
NOTE 4 – LOANS, (CONTINUED)
| Unpaid | Recorded | Recorded | Average | |||||||||||||
| contractual | investment | investment | Total | recorded | ||||||||||||
| principal | with no | with | recorded | Related | investment | Interest | Interest | |||||||||
| December 31, 2013 | balance | allowance | allowance | investment | allowance | year to date | received | accrued | ||||||||
| Commercial: | ||||||||||||||||
| Commercial and industrial | $ | 2,190 | $ | 1,338 | $ | 234 | $ | 1,572 | $ | 16 | $ | 1,620 | $ | 23 | $ | 134 |
| Non-farm, non-residential real estate | 3,236 | 1,155 | 1,551 | 2,706 | 282 | 2,819 | 157 | 168 | ||||||||
| Construction and development | 461 | 461 | - | 461 | 44 | 556 | 30 | 30 | ||||||||
| Other commercial | 3,834 | 3,310 | 178 | 3,488 | - | 3,704 | 225 | 241 | ||||||||
| Commercial total | 9,721 | 6,264 | 1,963 | 8,227 | 342 | 8,699 | 435 | 573 | ||||||||
| Retail: | ||||||||||||||||
| Single family residential | 1,121 | 568 | 419 | 987 | 118 | 1,044 | 52 | 55 | ||||||||
| Other retail | 11 | - | 11 | 11 | 11 | 11 | - | - | ||||||||
| Retail total | 1,132 | 568 | 430 | 998 | 129 | 1,055 | 52 | 55 | ||||||||
| Total | $ | 10,853 | $ | 6,832 | $ | 2,393 | $ | 9,225 | $ | 471 | $ | 9,754 | $ | 487 | $ | 628 |
46
FIRST FARMERS AND MERCHANTS CORPORATION AND SUBSIDIARIES
NOTES TO CONSOLIDATED FINANCIAL STATEMENTS
NOTE 4 – LOANS, (CONTINUED)
Non-accrual loans, segregated by class of loans, were as follows:
| December 31, 2015 | December 31, 2014 | |||
| Commercial | (dollars in thousands) | |||
| Commercial and industrial | $ | 322 | $ | 1,428 |
| Non-farm, nonresidential real estate | 401 | 409 | ||
| Commercial loans secured by real estate | 163 | 172 | ||
| Other commercial | - | 1,092 | ||
| Total commercial loans | 886 | 3,101 | ||
| Residential | ||||
| Consumer loans | 74 | 42 | ||
| Single family residential | 1,237 | 2,237 | ||
| Total residential loans | 1,311 | 2,279 | ||
| Total non-accrual loans | $ | 2,197 | $ | 5,380 |
Included in certain loan categories of impaired loans are certain loans that have been modified in a troubled debt restructuring where economic concessions have been granted to borrowers who have experienced financial difficulties. These concessions typically result from our loss mitigation activities and could include reductions in the interest rate, payment extensions, forgiveness of principal, forbearance or other actions. Modifications of terms for our loans and their inclusion as troubled debt restructurings are based on individual facts and circumstances. Loan modifications that are included as troubled debt restructurings may involve either an increase or reduction of the interest rate, extension of the term of the loan, or deferral of principal and/or interest payments, regardless of the period of the modification. All of the loans identified as troubled debt restructuring were modified due to financial stress of the borrower. In order to determine if a borrower is experiencing financial difficulty, an evaluation is performed to determine the probability that the borrower will be in payment default on any of its debt in the foreseeable future with the modification. This evaluation is performed under the Company’s internal underwriting policy.
When the Company modifies loans in a troubled debt restructuring, the Company evaluates any possible impairment similar to other impaired loans based on the present value of expected future cash flows, discounted at the contractual interest rate of the original loan or lease agreement, or the current fair value of the collateral, less selling costs for collateral dependent loans. If the Company determined that the value of the modified loan is less than the recorded investment in the loan, impairment is recognized through an allowance estimate or a charge-off to the allowance. In periods subsequent to modification, the Company evaluates all troubled debt restructurings, including those that have payment defaults, for possible impairment and recognize impairment through the allowance.
As of December 31, 2015, the Company did not have any commitments to extend additional funds to borrowers with loans modified and included as a troubled debt restructuring.
During 2015, certain loans were modified in troubled debt restructurings, where economic concessions were granted to borrowers consisting of reductions in the interest rates, payment extensions, forgiveness of principal, and forbearances.
47
FIRST FARMERS AND MERCHANTS CORPORATION AND SUBSIDIARIES
NOTES TO CONSOLIDATED FINANCIAL STATEMENTS
NOTE 4 – LOANS, (CONTINUED)
Presented below, segregated by class of loans, are troubled debt restructurings:
| Twelve months ended December 31, 2015 | ||||||
| Post- | Net | |||||
| Number | modification | charge-offs | ||||
| of | outstanding | resulting in | ||||
| modifications | balance | modifications | ||||
|
(dollars in thousands) |
||||||
| Retail: | ||||||
| Single family residential | 2 | $ | 111 | $ | - | |
| Total | 2 | $ | 111 | $ | - | |
| Twelve months ended December 31, 2014 | ||||||
| Post- | Net | |||||
| Number | modification | charge-offs | ||||
| of | outstanding | resulting in | ||||
| modifications | balance | modifications | ||||
| (dollars in thousands) | ||||||
| Commercial: | ||||||
| Nonfarm nonresidential | 1 | $ | 4,357 | - | ||
| Retail: | ||||||
| Single family residential | 1 | 316 | 3 | |||
| Total | 2 | $ | 4,673 | $ | 3 | |
The loan’s accrual status is assessed at the time of its modification. As a result of the assessment, the accrual status may be modified. Commercial and consumer loans modified in a troubled debt restructuring are closely monitored for delinquency as an early indicator of possible future default. If loans modified in a troubled debt restructuring subsequently default, the Company evaluates the loan for possible further impairment. The allowance for loan losses may be increased, adjustments may be made in the allocation of the allowance, or partial charge-offs may be taken to further write-down the carrying value of the loan. The Company considers a loan in default when it is 90 days or more past due or transferred to non-accrual.
As of December 31, 2015 and 2014, the Company did not have any loans that were modified in troubled debt restructurings during the past twelve months that have subsequently defaulted.
As of December 31, 2015, the Company held one foreclosed residential real estate property that was the result of obtaining physical possession in accordance with ASC 310-40. The carrying value was $62,000. In addition, the Company had no consumer mortgage loans secured by residential real estate properties for which formal foreclosure proceedings are in process according to location requirement of the applicable jurisdiction.
Credit Quality Indicators. As part of the on-going monitoring of the credit quality of the Company’s loan portfolio, management tracks certain credit quality indicators including trends related to (i) the weighted-average risk grade of commercial loans, (ii) the level of classified commercial loans, (iii) net charge-offs, (iv) non-performing loans and (v) the general economic conditions in the State of Tennessee.
48
FIRST FARMERS AND MERCHANTS CORPORATION AND SUBSIDIARIES
NOTES TO CONSOLIDATED FINANCIAL STATEMENTS
NOTE 4 – LOANS, (CONTINUED)
The Company uses a risk grading matrix to assign a risk grade to each of its commercial loans. Loans are graded on a scale of 1 through 8. A description of the general characteristics of the eight risk grades is as follows:
Risk Rating 1 – Minimal Risk – Loans in this category are secured by a cash deposit and are substantially risk free.
Risk Rating 2 – Modest Risk – Loans in this category have borrowers that show profitability, liquidity, and capitalization better than industry norms and a strong market position in the region. The borrower of these loans have a proven history of profitability and financial stability, along with an abundance of financeable assets available to protect the Bank’s position.
Risk Rating 3 – Average Risk – Loans in this category have borrowers that show a stable earnings history and financial condition in line with industry norms. The borrower’s liquidity and leverage are in line with industry norms. The credit extension is considered sound, however, elements may be present which suggest the borrower may not be free from temporary impairments in the future.
Risk Rating 4 – Acceptable Risk – Loans in this category have sound risk profiles, in which the borrower shows satisfactory asset quality and liquidity, good debt capacity and coverage and good management in critical positions.
Risk Rating 5 – Pass/Watch – Loans in this category require a heightened level of supervision. The borrower may exhibit declining earnings, strained cash flow, increasing leverage or weakening market positions that indicate a trend toward an unacceptable risk. The borrowers liquidity, leverage and earnings performance is below or trending below industry norms.
Risk Rating 6 – Special Mention – Loans in this category are not currently adequate. These loans have potential weaknesses that deserve management’s close attention. If left uncorrected, these potential weaknesses may result in deterioration of the repayment prospects for the asset or in the institution’s credit position at some future date. Special mention loans are not adversely classified and do not expose an institution to sufficient risk to warrant adverse classification.
Risk Rating 7 – Substandard – Loans in this category are inadequately protected by the current sound worth and paying capacity of the obligor of the collateral pledged, if any. Loans so classified must have a well-defined weakness, or weaknesses, that jeopardize the liquidation of the debt. They are characterized by the distinct possibility that the Bank will sustain some loss if the deficiencies are not corrected.
Risk Rating 8 – Doubtful – Loans in this category have all the weaknesses inherent in one classified substandard with the added characteristic that the weaknesses make collection or liquidation in full, on the basis of currently existing facts, conditions, and values, highly questionable and improbable.
49
FIRST FARMERS AND MERCHANTS CORPORATION AND SUBSIDIARIES
NOTES TO CONSOLIDATED FINANCIAL STATEMENTS
NOTE 4 – LOANS, (CONTINUED)
The following table presents risk grades and classified loans by class:
| December 31, 2015 | |||||||||||||
| Commercial loan portfolio: Credit | Non-farm, non- | Construction | Commercial | ||||||||||
| risk profile by internally assigned | Commercial | residential real | and | loans secured | Other | Commercial | |||||||
| grade | and industrial | estate | development | by real estate | commercial | loan totals | |||||||
|
(dollars in thousands) |
|||||||||||||
| Risk rating 1 - minimal risk | $ | 1,263 | $ | 312 | $ | - | $ | 103 | $ | 77 | $ | 1,755 | |
| Risk rating 2 - modest risk | 5,633 | 295 | - | - | 49,017 | 54,945 | |||||||
| Risk rating 3 - average risk | 54,952 | 43,253 | 9,328 | 2,529 | 6,004 | 116,066 | |||||||
| Risk rating 4 - acceptable risk | 60,922 | 105,014 | 40,604 | 24,895 | 5,066 | 236,501 | |||||||
| Risk rating 5 - pass/watch | 4,793 | 11,532 | 1,398 | 471 | - | 18,194 | |||||||
| Risk rating 6 - special mention | - | 108 | - | - | 161 | 269 | |||||||
| Risk rating 7 - substandard | 336 | 495 | - | 93 | - | 924 | |||||||
| Risk rating 8 - doubtful | - | - | - | - | - | - | |||||||
| TOTALS | $ | 127,899 | $ | 161,009 | $ | 51,330 | $ | 28,091 | $ | 60,325 | $ | 428,654 | |
| Retail loan portfolio: Credit risk | |||||||||||||
| profiles based on delinquency status | Single family | Retail loan | |||||||||||
| classification | Consumer | residential** | Other retail | totals | |||||||||
| (dollars in thousands) | |||||||||||||
| Performing - risk ratings 1 - 6 | $ | 9,896 | $ | 258,216 | $ | 32,388 | $ | 300,500 | |||||
| Risk rated 7* | 18 | 2,038 | 56 | 2,112 | |||||||||
| TOTALS | $ | 9,914 | $ | 260,254 | $ | 32,444 | $ | 302,612 | |||||
*Loans are classified as nonperforming loans and are automatically placed on nonaccrual status once they reach 90 days past due. For the purposes of this table, the total includes all risk rated 7 loans, of which may be performing or non-performing.
**Single family residential loans includes first mortgages, closed-end second mortgages, residential construction loans, and home equity lines of credit (HELOCs).
50
FIRST FARMERS AND MERCHANTS CORPORATION AND SUBSIDIARIES
NOTES TO CONSOLIDATED FINANCIAL STATEMENTS
NOTE 4 – LOANS, (CONTINUED)
| December 31, 2014 | |||||||||||||
| Commercial loan portfolio: Credit | Non-farm, non- | Construction | Commercial | ||||||||||
| risk profile by internally assigned | Commercial | residential real | and | loans secured | Other | Commercial | |||||||
| grade | and industrial | estate | development | by real estate | commercial | loan totals | |||||||
| (dollars in thousands) | |||||||||||||
| Risk rating 1 - minimal risk | $ | 1,004 | $ | 466 | $ | - | $ | 113 | $ | 1 | $ | 1,584 | |
| Risk rating 2 - modest risk | 3,908 | 314 | - | 30,408 | 34,630 | ||||||||
| Risk rating 3 - average risk | 47,047 | 46,784 | 18,903 | 4,700 | 5,712 | 123,146 | |||||||
| Risk rating 4 - acceptable risk | 42,116 | 101,809 | 29,808 | 21,682 | 3,802 | 199,217 | |||||||
| Risk rating 5 - pass/watch | 3,143 | 9,763 | 1,713 | 1,115 | - | 15,734 | |||||||
| Risk rating 6 - special mention | - | 958 | - | - | 170 | 1,128 | |||||||
| Risk rating 7 - substandard | 2,570 | 3,367 | - | 327 | 1,092 | 7,356 | |||||||
| Risk rating 8 - doubtful | - | - | - | - | - | - | |||||||
| TOTALS | $ | 99,788 | $ | 163,461 | $ | 50,424 | $ | 27,937 | $ | 41,185 | $ | 382,795 | |
| Retail loan portfolio: Credit risk | |||||||||||||
| profiles based on delinquency status | Single family | Retail loan | |||||||||||
| classification | Consumer | residential** | Other retail | totals | |||||||||
|
(dollars in thousands) |
|||||||||||||
| Risk ratings 1 - 6 | $ | 9,494 | $ | 226,637 | $ | 29,683 | $ | 265,814 | |||||
| Nonperforming - risk rating 7* | 42 | 2,922 | 479 | 3,443 | |||||||||
| TOTALS | $ | 9,536 | $ | 229,559 | $ | 30,162 | $ | 269,257 | |||||
*Loans are classified as nonperforming loans and are automatically placed on nonaccrual status once they reach 90 days past due. For the purposes of this table, the total includes all risk rated 7 loans, of which may be performing or non-performing.
**Single family residential loans includes first mortgages, closed-end second mortgages, residential construction loans, and home equity lines of credit (HELOCs).
51
FIRST FARMERS AND MERCHANTS CORPORATION AND SUBSIDIARIES
NOTES TO CONSOLIDATED FINANCIAL STATEMENTS
NOTE 5 – ALLOWANCE FOR LOAN AND LEASE LOSSES
Allowance for Loan and Lease Losses. The allowance for loan and lease losses (“ALLL”) is a reserve established through a provision for possible loan losses charged to expense, which represents management’s best estimate of probable losses that have been incurred within the existing portfolio of loans. The allowance, in the judgment of management, is necessary to reserve for estimated loan losses and risks inherent in the loan portfolio. The Company’s allowance for possible loan loss methodology includes allowance allocations calculated in accordance with ASC Topic 310, “Receivables” and allowance allocations calculated in accordance with ASC Topic 450, “Contingencies.” Accordingly, the methodology is based on historical loss experience by type of credit and internal risk grade, specific homogeneous risk pools and specific loss allocations, with adjustments for current events and conditions. The Company’s process for determining the appropriate level of the allowance for possible loan losses is designed to account for credit deterioration as it occurs. The provision for possible loan losses reflects loan quality trends, including the levels of and trends related to nonaccrual loans, past due loans, potential problem loans, criticized loans and net charge-offs or recoveries, among other factors. The provision for possible loan losses also reflects the totality of actions taken on all loans for a particular period. In other words, the amount of the provision reflects not only the necessary increases in the allowance for possible loan losses related to newly identified criticized loans, but it also reflects actions taken related to other loans including, among other things, any necessary increases or decreases in required allowances for specific loans or loan pools.
The level of the allowance reflects management’s continuing evaluation of industry concentrations, specific credit risks, loan loss experience, current loan portfolio quality, present economic, political and regulatory conditions and unidentified losses inherent in the current loan portfolio. Portions of the allowance may be allocated for specific credits; however, the entire allowance is available for any credit that, in management’s judgment, should be charged off. While management utilizes its best judgment and information available, the ultimate adequacy of the allowance is dependent upon a variety of factors beyond the Company’s control, including, among other things, the performance of the Company’s loan portfolio, the economy, changes in interest rates and the view of the regulatory authorities toward loan classifications.
The Company’s allowance for possible loan losses consists of three elements: (i) specific valuation allowances determined in accordance with ASC Topic 310 based on probable losses on specific loans; (ii) historical valuation allowances determined in accordance with ASC Topic 450 based on historical loan loss experience for similar loans with similar characteristics and trends, adjusted, as necessary, to reflect the impact of current conditions; and (iii) general valuation allowances determined in accordance with ASC Topic 450 based on general economic conditions and other qualitative risk factors both internal and external to the Company.
The allowances established for probable losses on specific loans are based on a regular analysis and evaluation of problem loans. Commercial loans are classified based on an internal credit risk grading process that evaluates, among other things: (i) the obligor’s ability to repay; (ii) the underlying collateral, if any; and (iii) the economic environment and industry in which the borrower operates. This analysis is performed at the relationship manager level for all commercial loans. When a loan has a calculated grade of 7 or higher, a special assets officer analyzes the loan to determine whether the loan is impaired and, if impaired, the need to specifically allocate a portion of the allowance for possible loan losses to the loan. Specific valuation allowances are determined by analyzing the borrower’s ability to repay amounts owed, collateral deficiencies, the relative risk grade of the loan and economic conditions affecting the borrower’s industry, among other things.
Historical valuation allowances are calculated based on the historical loss experience of specific types of loans and the internal risk grade of such loans at the time they were charged-off. The Company calculates historical loss ratios for pools of similar loans with similar characteristics based on the proportion of actual charge-offs experienced to the total population of loans in the pool. The historical loss ratios are periodically updated based on actual charge-off experience. A historical valuation allowance is established for each pool of similar loans based upon the product of the historical loss ratio and the total dollar amount of the loans in the pool. The Company’s pools of similar loans include similarly risk-graded groups of commercial and industrial loans, commercial real estate loans, consumer real estate loans and consumer and other loans.
52
FIRST FARMERS AND MERCHANTS CORPORATION AND SUBSIDIARIES
NOTES TO CONSOLIDATED FINANCIAL STATEMENTS
NOTE 5 – ALLOWANCE FOR LOAN AND LEASE LOSSES, (CONTINUED)
The components of the general valuation allowance include (i) the additional reserves allocated to specific loan portfolio segments as a result of applying an environmental risk adjustment factor to the base historical loss allocation and (ii) the additional reserves that are not allocated to specific loan portfolio segments including allocations for groups of similar loans with risk characteristics that exceed certain concentration limits established by management.
Included in the general valuation allowances are allocations for groups of similar loans with risk characteristics that exceed certain concentration limits established by management. Concentration risk limits have been established, among other things, for certain industry concentrations, large balance and highly leveraged credit relationships that exceed specified risk grades, and loans originated with policy exceptions that exceed specified risk grades.
The allowance for loan losses is maintained at a level considered adequate to provide for the losses that can be reasonably anticipated. Management’s periodic evaluation of the adequacy of the allowance is based on the Company’s past loan loss experience, know and inherent risks in the portfolio, adverse situations that may affect the borrower’s ability to repay, the estimated value of any underlying collateral, composition of the loan portfolio, current economic conditions and other relevant factors. This evaluation is inherently subjective as it requires material estimates that may be susceptible to change. The Company uses a rolling ten quarters historic loss period for all segments when estimating the historic charge off rates calculated in accordance with ASC Topic 450 and incorporates environmental factors for various components such as economic conditions, trends in delinquencies, loan review assessments, credit concentrations and level of underperforming ratios.
General valuation allowances are based on general economic conditions and other qualitative risk factors both internal and external to the Company. In general, such valuation allowances are determined by evaluating, among other things: (i) the experience, ability and effectiveness of the bank’s lending management and staff; (ii) the effectiveness of the Company’s loan policies, procedures and internal controls; (iii) changes in asset quality; (iv) changes in loan portfolio volume; (v) the composition and concentrations of credit; (vi) the impact of competition on loan structuring and pricing; (vii) the effectiveness of the internal loan review function; (viii) the impact of environmental risks on portfolio risks; and (ix) the impact of changes to interest rates on portfolio risk. Management evaluates the degree of risk that each one of these components has on the quality of the loan portfolio on a quarterly basis. Each component is determined to have either a high, moderate or low degree of risk. The results are then input into a “general allocation matrix” to determine an appropriate general valuation allowance.
Included in the general valuation allowances are allocations for groups of similar loans with risk characteristics that exceed certain concentration limits established by management. Concentration risk limits have been established, among other things, for certain industry concentrations, large balance and highly leveraged credit relationships that exceed specified risk grades, and loans originated with policy exceptions that exceed specified risk grades.
Loans identified as losses by management and internal loan review are charged off. Furthermore, consumer loan accounts are charged off automatically based on regulatory requirements.
53
FIRST FARMERS AND MERCHANTS CORPORATION AND SUBSIDIARIES
NOTES TO CONSOLIDATED FINANCIAL STATEMENTS
NOTE 5 – ALLOWANCE FOR LOAN AND LEASE LOSSES, (CONTINUED)
The following table summarizes the allocation in the ALLL by loan segment:
| Residential real | Consumer and | |||||||||||
| December 31, 2015 | Commercial | estate | other retail | Totals | ||||||||
| (dollars in thousands) | ||||||||||||
| Beginning balance | $ | 6,719 | $ | 1,053 | $ | 162 | $ | 7,934 | ||||
| Less: charge-offs | - | (34 | ) | (13 | ) | (47 | ) | |||||
| Add: recoveries | 683 | 12 | 22 | 717 | ||||||||
| Add: provisions | - | 30 | - | 30 | ||||||||
| Ending balance | $ | 7,402 | $ | 1,061 | $ | 171 | $ | 8,634 | ||||
| Residential real | Consumer and | |||||||||||
| December 31, 2014 | Commercial | estate | other retail | Totals | ||||||||
| (dollars in thousands) | ||||||||||||
| Beginning balance | $ | 7,359 | $ | 1,084 | $ | 152 | $ | 8,595 | ||||
| Less: charge-offs | (739 | ) | (41 | ) | (11 | ) | (791 | ) | ||||
| Add: recoveries | 99 | 10 | 21 | 130 | ||||||||
| Add: provisions | - | - | - | - | ||||||||
| Ending balance | $ | 6,719 | $ | 1,053 | $ | 162 | $ | 7,934 | ||||
| Residential real | Consumer and | |||||||||||
| December 31, 2013 | Commercial | estate | other retail | Totals | ||||||||
| (dollars in thousands) | ||||||||||||
| Beginning balance | $ | 7,528 | $ | 1,109 | $ | 172 | $ | 8,809 | ||||
| Less: charge-offs | (222 | ) | (27 | ) | (49 | ) | (298 | ) | ||||
| Add: recoveries | 53 | 2 | 29 | 84 | ||||||||
| Add: provisions | - | - | - | - | ||||||||
| Ending balance | $ | 7,359 | $ | 1,084 | $ | 152 | $ | 8,595 | ||||
54
FIRST FARMERS AND MERCHANTS CORPORATION AND SUBSIDIARIES
NOTES TO CONSOLIDATED FINANCIAL STATEMENTS
NOTE 5 – ALLOWANCE FOR LOAN AND LEASE LOSSES, (CONTINUED)
The following tables detail the amount of the ALLL allocated to each portfolio segment as of December 31, 2015, 2014 and 2013, disaggregated on the basis of the Company’s impairment methodology:
| Residential | Consumer and | |||||||
| December 31, 2015 | Commercial | real estate | other retail | Totals | ||||
| (dollars in thousands) | ||||||||
| Loans individually evaluated for impairment | $ | 57 | $ | 102 | $ | - | $ | 159 |
| Loans collectively evaluated for impairment | 7,345 | 959 | 171 | 8,475 | ||||
| Ending balance | $ | 7,402 | $ | 1,061 | $ | 171 | $ | 8,634 |
| Residential | Consumer and | |||||||
| December 31, 2014 | Commercial | real estate | other retail | Totals | ||||
| (dollars in thousands) | ||||||||
| Loans individually evaluated for impairment | $ | 42 | $ | 10 | $ | - | $ | 52 |
| Loans collectively evaluated for impairment | 6,677 | 1,043 | 162 | 7,882 | ||||
| Ending balance | $ | 6,719 | $ | 1,053 | $ | 162 | $ | 7,934 |
| Residential | Consumer and | |||||||
| December 31, 2013 | Commercial | real estate | other retail | Totals | ||||
| (dollars in thousands) | ||||||||
| Loans individually evaluated for impairment | $ | 342 | $ | 118 | $ | 11 | $ | 471 |
| Loans collectively evaluated for impairment | 7,017 | 966 | 141 | 8,124 | ||||
| Ending balance | $ | 7,359 | $ | 1,084 | $ | 152 | $ | 8,595 |
The following table shows loans as of December 31, 2015, 2014 and 2013 related to each balance in the allowance for possible loan losses by portfolio segment and disaggregated on the basis of the Company’s impairment methodology:
| Residential | Consumer and | |||||||
| December 31, 2015 | Commercial | real estate | other retail | Totals | ||||
| (dollars in thousands) | ||||||||
| Loans individually evaluated for impairment | $ | 886 | $ | 1,340 | $ | 74 | $ | 2,300 |
| Loans collectively evaluated for impairment | 427,768 | 258,914 | 42,284 | 728,966 | ||||
| Ending balance | $ | 428,654 | $ | 260,254 | $ | 42,358 | $ | 731,266 |
| Residential | Consumer and | |||||||
| December 31, 2014 | Commercial | real estate | other retail | Totals | ||||
| (dollars in thousands) | ||||||||
| Loans individually evaluated for impairment | $ | 8,014 | $ | 978 | $ | 411 | $ | 9,403 |
| Loans collectively evaluated for impairment | 374,781 | 228,170 | 39,698 | 642,649 | ||||
| Ending balance | $ | 382,795 | $ | 229,148 | $ | 40,109 | $ | 652,052 |
| Residential | Consumer and | |||||||
| December 31, 2013 | Commercial | real estate | other retail | Totals | ||||
| (dollars in thousands) | ||||||||
| Loans individually evaluated for impairment | $ | 8,227 | $ | 987 | $ | 11 | $ | 9,225 |
| Loans collectively evaluated for impairment | 346,148 | 212,776 | 38,617 | 597,541 | ||||
| Ending balance | $ | 354,375 | $ | 213,763 | $ | 38,628 | $ | 606,766 |
55
FIRST FARMERS AND MERCHANTS CORPORATION AND SUBSIDIARIES
NOTES TO CONSOLIDATED FINANCIAL STATEMENTS
NOTE 6 – PREMISES AND EQUIPMENT
The following table presents the Company’s assets by category:
| 2015 | 2014 | |||||
| (dollars in thousands) | ||||||
| Land | $ | 9,296 | $ | 9,152 | ||
| Premises | 22,951 | 22,858 | ||||
| Furniture and equipment | 10,375 | 9,722 | ||||
| Leasehold improvements | 1,846 | 1,859 | ||||
| Construction in progress | 278 | 16 | ||||
| 44,746 | 43,607 | |||||
| Less accumulated depreciation | (19,228 | ) | (17,834 | ) | ||
| $ | 25,518 | $ | 25,773 | |||
NOTE 7 – RELATED PARTY TRANSACTIONS
Certain related parties (primarily directors and officers of the Company or the Bank, including their affiliates, families and companies in which they hold 10% or more ownership) were customers of, and had loans and other transactions with, the Bank in the ordinary course of business. An analysis of the activity with respect to such loans are shown in the table below. These totals exclude loans made in the ordinary course of business to other companies with which neither the Company nor the Bank had a relationship other than the association of one of its directors in the capacity of officer or director. These loan transactions were made on substantially the same terms as those prevailing at the time for comparable loans to other persons. They did not involve more than the normal risk of collectability or present other unfavorable features. No related party loans were charged off in 2015 or 2014.
Activity for related party transactions for the periods presented are:
| 2015 | 2014 | |||||
| (dollars in thousands) | ||||||
| Related party extensions of credit, beginning of period | $ | 4,774 | $ | 3,822 | ||
| New loans | 879 | 2,081 | ||||
| Repayments | (1,393 | ) | (1,129 | ) | ||
| Related party extension of credit, end of period | $ | 4,260 | $ | 4,774 | ||
The aggregate balances of related party deposits at December 31, 2015 and 2014 were $22.4 million and $24.5 million, respectively.
The aggregate balances of related party repurchase agreements at December 31, 2015 and 2014 were $13.8 million and $13.1 million, respectively.
The Company and Bank utilize various services and purchased goods provided by certain related parties. Payments to directors for services provided during 2015 and 2014 totaled $151,000 and $170,000, respectively.
56
FIRST FARMERS AND MERCHANTS CORPORATION AND SUBSIDIARIES
NOTES TO CONSOLIDATED FINANCIAL STATEMENTS
NOTE 8 – LEASES
Real property for three of the Bank’s office locations and certain equipment are leased under noncancelable operating leases expiring at various times through 2034. In most cases, the leases provide for one or more renewal options of five to ten years under the same or similar terms. In addition, various items of office equipment are leased under cancelable operating leases. Total rental expense incurred under all operating leases, including short-term leases with terms of less than one month, amounted to approximately $30,000, $27,0000 and $18,000 for equipment leases and approximately $380,000, $304,000 and $264,000 for building leases in 2015, 2014 and 2013, respectively. Future minimum lease commitments as of December 31, 2015 under all noncancelable operating leases with initial terms of one year or more are shown in the following table:
| Year | Lease payments | |
| (dollars in thousands) | ||
| 2016 | $ | 358 |
| 2017 | 320 | |
| 2018 | 294 | |
| 2019 | 291 | |
| 2020 | 295 | |
| Thereafter | 3,187 | |
| Total | $ | 4,745 |
57
FIRST FARMERS AND MERCHANTS CORPORATION AND SUBSIDIARIES
NOTES TO CONSOLIDATED FINANCIAL STATEMENTS
NOTE 9 – FEDERAL AND STATE INCOME TAXES
The following table presents components of income tax expense attributable to continuing operations:
| 2015 | 2014 | 2013 | |||||||
| Current | $ | 2,735 | $ | 3,011 | $ | 915 | |||
| Deferred | 614 | 545 | 1,785 | ||||||
| Total provision for income taxes | 3,349 | $ | 3,556 | $ | 2,700 | ||||
| Deferred tax effects of principal temporary differences | 2015 | 2014 | 2013 | ||||||
| Allowance for possible loan and lease losses | $ | 3,324 | $ | 3,055 | $ | 3,309 | |||
| Deferred compensation | 2,563 | 2,557 | 2,516 | ||||||
| Write down of other real estate | - | 9 | 314 | ||||||
| Deferred gain on OREO sale | - | - | 188 | ||||||
| Amortization of core deposit intangible | (1,747 | ) | (1,577 | ) | (272 | ) | |||
| Recognition of nonaccrual loan income | 119 | 129 | 111 | ||||||
| Unrealized losses on available-for-sale securities | 1,644 | 2,124 | 6,613 | ||||||
| Post-retirement benefit obligation | 841 | 986 | 890 | ||||||
| Accelerated depreciation | (691 | ) | (973 | ) | (822 | ) | |||
| Amortization of goodwill | (1,229 | ) | (1,109 | ) | (2,591 | ) | |||
| Dividend income - F&M West | - | - | (372 | ) | |||||
| Prepaid expenses | (135 | ) | (135 | ) | (178 | ) | |||
| Other | (733 | ) | 31 | 240 | |||||
| Net deferred tax asset | $ | 3,956 | $ | 5,097 | $ | 9,946 | |||
Reconciliation of total income taxes reported with the amount of income taxes computed at the
| Federal statutory rate (34% each year) | 2015 | 2014 | 2013 | ||||||
| Tax expense at statutory rate | $ | 4,643 | $ | 4,692 | $ | 4,191 | |||
| Increase (decrease) in taxes resulting from: | |||||||||
| Tax-exempt interest | (1,226 | ) | (1,060 | ) | (1,144 | ) | |||
| Nondeductible interest expense | 19 | 14 | 18 | ||||||
| Employee benefits | (80 | ) | (128 | ) | (196 | ) | |||
| Other nondeductible expenses | |||||||||
| (nontaxable income) - net | 28 | 38 | 11 | ||||||
| State income taxes net of federal tax benefit | 106 | - | - | ||||||
| Dividend income exclusion | - | - | - | ||||||
| Other | (141 | ) | - | (180 | ) | ||||
| Total provision for income taxes | $ | 3,349 | $ | 3,556 | $ | 2,700 | |||
| Effective tax rate | 24.4 | % | 25.8 | % | 21.9 | % | |||
58
FIRST FARMERS AND MERCHANTS CORPORATION AND SUBSIDIARIES
NOTES TO CONSOLIDATED FINANCIAL STATEMENTS
NOTE 9 – FEDERAL AND STATE INCOME TAXES, (CONTINUED)
The Company and its subsidiaries file consolidated income tax returns with the Internal Revenue Service and State of Tennessee. The Company is not subject to U.S. federal, state and local, or non-U.S. income tax examinations by tax authorities for years before 2012. There was no valuation allowance for deferred tax assets at December 31, 2015 and 2014.
In assessing the realizability of deferred tax assets, management considers whether it is more likely than not that some portion or all of the deferred tax assets will not be realized. The ultimate realization of deferred tax assets is dependent upon the generation of future taxable income during the periods in which those temporary differences become deductible. Management considers the scheduled reversal of deferred tax liabilities, projected future taxable income and tax planning strategies in making this assessment. Based upon the level of historical taxable income and projections for future taxable income over the periods in which the deferred tax assets are deductible, management believes it is more likely than not the Company will realize the benefits of these deductible differences at December 31, 2015.
NOTE 10 – BORROWED FUNDS
The Bank is a party to the Blanket Agreement for Advances and Security Agreement (the “Blanket Agreement”) with the Federal Home Loan Bank of Cincinnati (the “FHLB”). Advances made to the Bank under the Blanket Agreement are collateralized by the FHLB stock and qualifying residential mortgage loans totaling 150% of the outstanding amount borrowed. These collateralization matters are outlined in the Blanket Agreement dated June 20, 2006 between the Bank and the FHLB. There were no outstanding advances at December 31, 2015 and 2014.
Stock held in the FHLB totaling $3.0 million at December 31, 2015 and 2014 is carried at cost. The stock is restricted and can only be sold back to the FHLB at par. There were no FHLB borrowings outstanding at December 31, 2015 or 2014.
The Company enters into agreements under which it sells securities subject to an obligation to repurchase the same or similar securities. Under these arrangements, the Company may transfer legal control over the assets but still retain effective control through an agreement that both entitles and obligates the Company to repurchase the assets. As a result, these repurchase agreements are accounted for as secured borrowings and not as a sale and subsequent repurchase of securities. The obligation to repurchase the securities is reflected as a liability in the Company's consolidated statements of condition, while the securities underlying the repurchase agreements remain in the respective investment securities asset accounts. As a result, there is no offsetting or netting of the investment securities assets with the repurchase agreement liabilities. In addition, as the Company does not enter into reverse repurchase agreements, there is no such offsetting to be done with the repurchase agreements.
The right of offset for a repurchase agreement resembles a secured borrowing, whereby the collateral pledged by the Company would be used to settle the fair value of the repurchase agreement should the Company be in default (e.g., fails to make an interest payment to the counterparty). For private institution repurchase agreements, if the private institution counterparty were to default (e.g., declare bankruptcy), the Company could cancel the repurchase agreement (i.e., cease payment of principal and interest), and attempt collection on the amount of collateral value in excess of the repurchase agreement fair value. The collateral is held by a third party financial institution in the counterparty's custodial account. The Company has the right to sell or repledge the investment securities. The Company is required by the counterparty to maintain adequate collateral levels. In the event the collateral fair value falls below stipulated levels, the Company will pledge additional securities. The Company closely monitors collateral levels to ensure adequate levels are maintained, while mitigating the potential risk of over-collateralization in the event of counterparty default.
59
FIRST FARMERS AND MERCHANTS CORPORATION AND SUBSIDIARIES
NOTES TO CONSOLIDATED FINANCIAL STATEMENTS
NOTE 10 – BORROWED FUNDS, (CONTINUED)
The following table presents the remaining contractual maturities of the Company’s repurchase agreements as of December 31, 2015, disaggregated by the class of collateral pledged.
| Overnight and | ||
| December 31, 2015 | Continuous | |
| (dollars in thousands) | ||
| Class of collateral pledged: | ||
| U.S. government agencies | $ | 24,177 |
| U.S. government sponsored agency mortgage backed securities | - | |
| States and political subdivisions | - | |
| Corporate bonds | - | |
| $ | 24,177 | |
| Overnight and | ||
| December 31, 2014 | Continuous | |
| (dollars in thousands) | ||
| Class of collateral pledged: | ||
| U.S. government agencies | $ | 22,834 |
| U.S. government sponsored agency mortgage backed securities | - | |
| States and political subdivisions | - | |
| Corporate bonds | - | |
| $ | 22,834 | |
Securities sold under agreements to repurchase consist of obligations of the Bank to other parties. The obligations are secured by investment securities and such collateral is held in safekeeping by a third party. The maximum amount of outstanding agreements at any month end during 2015 and 2014 totaled $26.4 million and $24.8 million, respectively, and the monthly average of such agreements totaled $25.1 million and $21.4 million for 2015 and 2014, respectively. The agreements at December 31, 2015, mature January 4, 2016.
60
FIRST FARMERS AND MERCHANTS CORPORATION AND SUBSIDIARIES
NOTES TO CONSOLIDATED FINANCIAL STATEMENTS
NOTE 11 – SIGNIFICANT ESTIMATES, COMMITMENTS AND CONTINGENCIES
Accounting principles generally accepted in the United States of America require disclosure of certain significant estimates and current vulnerabilities due to certain concentrations. Estimates related to the ALLL are reflected in the footnote regarding loans. Other significant estimates and concentrations not discussed in those footnotes include:
General Litigation
The Company is subject to claims and lawsuits that arise primarily in the ordinary course of business. It is the opinion of management that the disposition or ultimate resolution of such claims and lawsuits will not have a material adverse effect on the consolidated financial position, results of operations and cash flows of the Company.
Pension and Other Post-retirement Benefit Obligations
The Company has a noncontributory defined benefit post-retirement health care plan whereby it agrees to provide certain post-retirement benefits to eligible employees. The benefit obligation is the actuarial present value of all benefits attributed to service rendered prior to the valuation date based on the projected unit credit cost method. It is reasonably possible that events could occur that would change the estimated amount of this liability materially in the near term.
Current Economic Conditions
The current economic climate continues to present financial institutions with circumstances and challenges which in some cases have resulted in large and unanticipated declines in the fair values of investments and other assets, constraints on liquidity and capital and significant credit quality problems, including volatility in the valuation of real estate and other collateral supporting loans.
The accompanying financial statements have been prepared using values and information currently available to the Company.
Given the volatility of current economic conditions, the values of assets and liabilities recorded in the financial statements could change rapidly, resulting in material future adjustments in asset values, the ALLL and capital that could negatively impact the Company’s ability to meet regulatory capital requirements and maintain sufficient liquidity. Furthermore, the Company’s regulators could require material adjustments to asset values or the allowance for loan losses for regulatory capital purposes that could affect the Company’s measurement of regulatory capital and compliance with the capital adequacy guidelines under the regulatory framework for prompt corrective action.
Commitments and Credit Risk
The Company grants commercial, consumer and residential loans to customers throughout the State of Tennessee. The Bank is a party to financial instruments with off-balance sheet risk in the normal course of business to meet the financing needs of its customers. These financial instruments include commitments to extend credit and standby letters of credit. Those instruments involve, to varying degrees, elements of credit risk in excess of the amount recognized in the balance sheet. The contract or notional amounts of those instruments reflect the extent of involvement the Bank has in those particular financial instruments.
Commitments to Originate Loans
Commitments to originate loans are agreements to lend to a customer as long as there is no violation of any condition established in the contract. Commitments generally have fixed expiration dates or other termination clauses and may require payment of a fee. Since a portion of the commitments may expire without being drawn upon, the total commitment amounts do not necessarily represent future cash requirements. Each customer’s creditworthiness is evaluated on a case-by-case basis. The amount of collateral obtained, if deemed necessary, is based on management’s credit evaluation of the counterparty. Collateral held varies, but may include accounts receivable, inventory, property, plant and equipment, commercial real estate and residential real estate.
61
FIRST FARMERS AND MERCHANTS CORPORATION AND SUBSIDIARIES
NOTES TO CONSOLIDATED FINANCIAL STATEMENTS
NOTE 11 – SIGNIFICANT ESTIMATES, COMMITMENTS AND CONTINGENCIES, (CONTINUED)
Mortgage loans in the process of origination represent amounts that the Company plans to fund within a normal period of 30 to 90 days, and which are intended for sale to investors in the secondary market. Total mortgage loans in process of origination were $1.1 million and $3.3 million, at December 31, 2015 and 2014, respectively. Total mortgage loans held for sale amounted to $0 and $354,000, at December 31, 2015 and 2014, respectively.
Standby Letters of Credit
Standby letters of credit are irrevocable conditional commitments issued by the Company to guarantee the performance of a customer to a third party. Financial standby letters of credit are primarily issued to support public and private borrowing arrangements, including commercial paper, bond financing and similar transactions. Performance standby letters of credit are issued to guarantee performance of certain customers under nonfinancial contractual obligations. The credit risk involved in issuing standby letters of credit is essentially the same as that involved in extending loans to customers. Should the Company be obligated to perform under the standby letters of credit, the Company may seek recourse from the customer for reimbursement of amounts paid.
The Company had total outstanding standby letters of credit amounting to $12.3 million and $13.5 million, at December 31, 2015 and 2014, respectively, with terms ranging from seven days to 24 months.
Lines of Credit
Lines of credit are agreements to lend to a customer as long as there is no violation of any condition established in the contract. Lines of credit generally have fixed expiration dates. Since a portion of the line may expire without being drawn upon, the total unused lines do not necessarily represent future cash requirements. Each customer’s creditworthiness is evaluated on a case-by-case basis. The amount of collateral obtained, if deemed necessary, is based on management’s credit evaluation of the counterparty. Collateral held varies but may include accounts receivable, inventory, property, plant and equipment, commercial real estate and residential real estate. Management uses the same credit policies in granting lines of credit as it does for on-balance-sheet instruments.
At December 31, 2015, the Company had granted unused lines of credit to borrowers aggregating approximately $44.6 million and $159.5 million for commercial lines and open-end consumer lines, respectively. At December 31, 2014, unused lines of credit to borrowers aggregated approximately $41.0 million for commercial lines and $104.4 million for open-end consumer lines.
62
FIRST FARMERS AND MERCHANTS CORPORATION AND SUBSIDIARIES
NOTES TO CONSOLIDATED FINANCIAL STATEMENTS
NOTE 12 – FAIR VALUE MEASUREMENT
The fair value of an asset or liability is the price that would be received to sell that asset or paid to transfer that liability in an orderly transaction occurring in the principal market (or most advantageous market in the absence of a principal market) for such asset or liability. Fair value measurement must maximize the use of observable inputs and minimize the use of unobservable inputs. In estimating fair value, the Company utilizes valuation techniques that are consistent with the market approach, the income approach and/or the cost approach. Such valuation techniques are consistently applied. Inputs to valuation techniques include the assumptions that market participants would use in pricing an asset or liability. FASB ASC Topic 820, “Fair Value Measurements and Disclosures” establishes a fair value hierarchy for valuation inputs that gives the highest priority to quoted prices in active markets for identical assets or liabilities and the lowest priority to unobservable inputs. The fair value hierarchy is as follows:
- Level 1 Inputs - Unadjusted quoted prices in active markets for identical assets or liabilities.
- Level 2 Inputs - Inputs other than quoted prices included in Level 1 that are observable for the asset or liability, either directly or indirectly. These might include quoted prices for similar assets or liabilities in active markets, quoted prices for identical or similar assets or liabilities in markets that are not active, inputs other than quoted prices that are observable for the asset or liability (such as interest rates, volatilities, market consensus, prepayment speeds, credit risks, etc.) or inputs that are derived principally from or corroborated by market data by correlation or other means.
- Level 3 Inputs - Unobservable inputs for determining the fair values of assets or liabilities that reflect an entity’s own assumptions about the assumptions that market participants would use in pricing the assets or liabilities.
Transfers between levels of the fair value hierarchy are recognized on the actual date of the event or circumstances that caused the transfer, which generally coincides with the Company’s monthly and/or quarterly valuation process.
Recurring Measurements
The following table summarizes financial assets measured at fair value on a recurring basis by the level within the fair value hierarchy utilized to measure fair value:
| Recurring fair value measurements at | |||||||||
| December 31, 2015 | |||||||||
|
Total carrying value |
Level 1 | Level 2 | Level 3 | ||||||
|
(dollars in thousands) |
|||||||||
| Assets | |||||||||
| Available-for-sale investment securities: | |||||||||
| U.S. government sponsored agencies | $ | 131,057 | $ | - | $ | 131,057 | $ | - | |
| U.S. government sponsored agency | |||||||||
| mortgage backed securities | 167,067 | - | 167,067 | - | |||||
| State and political subdivision | 73,319 | - | 73,319 | - | |||||
| Corporate bonds | 23,576 | - | 23,576 | - | |||||
| Total assets at fair value | $ | 395,019 | $ | - | $ | 395,019 | $ | - | |
63
FIRST FARMERS AND MERCHANTS CORPORATION AND SUBSIDIARIES
NOTES TO CONSOLIDATED FINANCIAL STATEMENTS
NOTE 12 – FAIR VALUE MEASUREMENT, (CONTINUED)
| Recurring fair value measurements at | |||||||||
| December 31, 2014 | |||||||||
|
Total carrying value |
Level 1 | Level 2 | Level 3 | ||||||
| (dollars in thousands) | |||||||||
| Assets | |||||||||
| Available-for-sale investment securities: | |||||||||
| U.S. government sponsored agencies | $ | 159,254 | $ | - | $ | 159,254 | $ | - | |
| U.S. government sponsored agency | |||||||||
| mortgage backed securities | 167,970 | - | 167,970 | - | |||||
| State and political subdivision | 52,882 | - | 52,882 | - | |||||
| Corporate bonds | 17,780 | - | 17,780 | - | |||||
| Total assets at fair value | $ | 397,886 | $ | - | $ | 397,886 | $ | - | |
The following is a description of the valuation methodologies and inputs used for assets measured at fair value on a recurring basis and recognized in the accompanying balance sheets, as well as the general classification of such assets pursuant to the valuation hierarchy. There have been no significant changes in the valuation techniques during the year ended December 31, 2015.
Available-for-Sale Securities
Where quoted market prices are available in an active market, securities are classified within Level 1 of the valuation hierarchy. If quoted market prices are not available, the Company obtains fair value measurements from an independent pricing service, such as Interactive Data, which utilizes pricing models to determine fair value measurement. The Company reviews the pricing quarterly to verify the reasonableness of the pricing. The fair value measurements consider observable data that may include dealer quotes, market spreads, cash flows, the U.S. Treasury yield curve, live trading levels, trade execution data, market consensus prepayment speeds, credit information and the bond’s terms and conditions, among other factors. U.S. government agencies, state and political subdivisions, U.S. government sponsored agency mortgage-backed securities and corporate bonds are classified as Level 2 inputs.
Nonrecurring Measurements
The following table summarizes financial assets measured at fair value on a nonrecurring basis as of December 31, 2015 and December 31, 2014, by the level within the fair value hierarchy utilized to measure fair value:
| December 31, 2015 |
Level 1 |
Level 2 | Level 3 | Total | ||||
| (dollars in thousands) | ||||||||
|
Impaired loans (collateral-dependent) |
$ | - | $ | - | $ | 672 |
$ |
672 |
| December 31, 2014 |
Level 1 |
Level 2 | Level 3 | Total | ||||
|
(dollars in thousands) |
||||||||
|
Impaired loans (collateral-dependent) |
$ | - | $ | - | $ | 1,184 |
$ |
1,184 |
64
FIRST FARMERS AND MERCHANTS CORPORATION AND SUBSIDIARIES
NOTES TO CONSOLIDATED FINANCIAL STATEMENTS
NOTE 12 – FAIR VALUE MEASUREMENT, (CONTINUED)
Impaired Loans (Collateral-Dependent)
The estimated fair value of collateral-dependent impaired loans is based on the appraised fair value of the collateral, less estimated cost to sell. Collateral-dependent impaired loans are classified within Level 3 of the fair value hierarchy.
The Company considers the appraisal or evaluation as the starting point for determining fair value and then considers other factors and events in the environment that may affect the fair value. Appraisals of the collateral underlying collateral-dependent loans are obtained when the loan is determined to be collateral-dependent and subsequently as deemed necessary by the Chief Credit Officer. Appraisals are reviewed for accuracy and consistency by the Chief Credit Officer. Appraisers are selected from the list of approved appraisers maintained by management. The appraised values are reduced by discounts to consider lack of marketability and estimated cost to sell if repayment or satisfaction of the loan is dependent on the sale of the collateral. These discounts and estimates are developed by the Chief Credit Officer by comparison to historical results. Fair value adjustments were approximately $178,000 at December 31, 2015 and $287,000 at December 31, 2014.
Loans considered impaired under ASC 310-35, “Impairment of a Loan,” are loans for which, based on current information and events, it is probable that the creditor will be unable to collect all amounts due according to the contractual terms of the loan agreement. Impaired loans are subject to nonrecurring fair value adjustments to reflect (1) subsequent partial write-downs that are based on the observable market price or current appraised value of the collateral or (2) the full charge-off of the loan carrying value.
Other Real Estate Owned
Other real estate owned (“OREO”) is initially recorded at fair value at the time of acquisition, as determined by independent appraisal or evaluation by the Company, less costs to sell when the real estate is acquired in settlement of loans. Quarterly evaluations of OREO are performed to determine if there have been any subsequent decline in the value of OREO properties. OREO is classified within Level 3 of the fair value hierarchy. OREO assets are subject to nonrecurring fair value adjustments to reflect subsequent partial write-downs that are based on the observable market price or current appraised value of the collateral less selling costs. Fair value adjustments were approximately $12,000 in the aggregate at December 31, 2015. There were no fair value adjustments at December 31, 2014.
Appraisals of OREO are obtained when the real estate is acquired and subsequently as deemed necessary by the Chief Credit Officer. Appraisals are required annually and reviewed for accuracy and consistency by the Chief Credit Officer. The appraised values are reduced by discounts to consider lack of marketability and estimated costs to sell. Appraisers are selected from the list of approved appraisers maintained by management.
65
FIRST FARMERS AND MERCHANTS CORPORATION AND SUBSIDIARIES
NOTES TO CONSOLIDATED FINANCIAL STATEMENTS
NOTE 12 – FAIR VALUE MEASUREMENT, (CONTINUED)
Unobservable (Level 3) Inputs
The following table presents quantitative information about unobservable inputs used in nonrecurring Level 3 fair value measurements:
| Quantitative information about Level 3 fair value measurements | |||||
| Range | |||||
| Valuation | Unobservable |
(weighted |
|||
| December 31, 2015 | Fair value | technique(s) | input | average) | |
| (dollars in thousands) | |||||
| Impaired loans (collateral-dependent) | $ | 672 |
Market comparable properties |
Marketability discount |
25.0% - 46.0% (41.0%) |
| Quantitative Information about Level 3 fair value measurements | |||||
|
Range |
|||||
| Valuation | Unobservable | (weighted | |||
| December 31, 2014 | Fair value | technique(s) | input | average) | |
| (dollars in thousands) | |||||
| Impaired loans (collateral-dependent) | $ | 1,184 |
Market comparable properties |
Marketability discount |
5.0% - 10.0%
(7%) |
ASC Topic 825, “Financial Instruments,” requires disclosure of the fair value of financial assets and liabilities, including those financial assets and liabilities that are not measured and reported at fair value on a recurring basis or non-recurring basis.
The following methods and assumptions were used to estimate the fair value of each class of financial instruments for which it is practicable to estimate that value:
Cash and due from banks – The carrying amount approximates fair value.
Interest bearing deposits in other banks – The carrying amount approximates fair value.
Federal funds sold – The carrying amount approximates fair value.
Securities held-to-maturity – Fair values are based on quoted market prices, if available. If a quoted price is not available, fair value is estimated using quoted prices for similar securities. The fair value estimate is provided to management from a third party using modeling assumptions specific to each type of security that are reviewed and approved by management. Quarterly sampling of fair values provided by additional third parties supplement the fair value review process.
Loans held for sale – The fair value is predetermined at origination based on sale price.
Loans (net of the allowance for loan losses) – The fair value of fixed rate loans and variable rate mortgage loans is estimated by discounting the future cash flows using current rates at which similar loans would be made to borrowers with similar credit ratings and for the same remaining maturities. For other variable rate loans, the carrying amount approximates fair value.
66
FIRST FARMERS AND MERCHANTS CORPORATION AND SUBSIDIARIES
NOTES TO CONSOLIDATED FINANCIAL STATEMENTS
NOTE 12 – FAIR VALUE MEASUREMENT, (CONTINUED)
Federal Home Loan Bank stock – The carrying value of FHLB stock approximates fair value based on the redemption provisions of the FHLB.
Federal Reserve Bank stock – The carrying value of Federal Reserve Bank stock approximates fair value based on the redemption provisions of the Federal Reserve Bank.
Accrued interest receivable – The carrying amount approximates fair value.
Deposits – The fair value of fixed maturity time deposits is estimated by discounting the future cash flows using the rates currently offered for deposits of similar remaining maturities. For deposits including demand deposits, savings accounts, NOW accounts, and certain money market accounts, the carrying value approximates fair value.
Repurchase agreements – The fair value is estimated by discounting future cash flows using current rates.
Accrued interest payable – The carrying amount approximates fair value.
Commitments to extend credit and letters of credit – The fair value of commitments to originate loans is estimated using the fees currently charged to enter into similar agreements, taking into account the remaining terms of the agreements and the present creditworthiness of the counterparties. For fixed-rate loan commitments, fair value also considers the difference between current levels of interest rates and the committed rates. The fair values of letters of credit and lines of credit are based on fees currently charged for similar agreements or on the estimated cost to terminate or otherwise settle the obligations with the counterparties at the reporting date. The fair values of these commitments are not material.
67
FIRST FARMERS AND MERCHANTS CORPORATION AND SUBSIDIARIES
NOTES TO CONSOLIDATED FINANCIAL STATEMENTS
NOTE 12 – FAIR VALUE MEASUREMENT, (CONTINUED)
The following tables present estimated fair values of the Company’s financial instruments indicate the levels within the fair value hierarchy of the valuation techniques:
| Fair value measurements at December 31, 2015 using | ||||||||
| Quoted prices | Significant | |||||||
| in active | other | |||||||
| markets for | observable | Significant | ||||||
| Carrying | identical assets | inputs | unobservable | |||||
| amount | (Level 1) | (Level 2) | inputs (Level 3) | |||||
| (dollars in thousands) | ||||||||
| Financial assets | ||||||||
| Cash and due from banks | $ | 19,453 | $ | 19,453 | $ | - | $ | - |
| Interest-bearing deposits in other banks | 18,299 | 18,299 | - | - | ||||
| Federal funds sold | 24,476 | 24,476 | - | - | ||||
| Federal Home Loan Bank and Federal Reserve Bank | ||||||||
| stock | 3,879 | - | 3,879 | - | ||||
| Securities available-for-sale | 395,019 | - | 395,019 | - | ||||
| Securities held-to-maturity | 4,059 | - | 4,089 | - | ||||
| Loans, net | 722,632 | - | - | 718,956 | ||||
| Accrued interest receivable | 4,540 | - | 4,540 | - | ||||
| Financial liabilities | ||||||||
| Non-interest bearing deposits | 239,226 | 239,226 | - | - | ||||
| Interest bearing deposits | 864,575 | - | 864,036 | - | ||||
| Repurchase agreements | 24,177 | - | 24,177 | - | ||||
| Accrued interest payable | 503 | - | 503 | - | ||||
| Off-balance sheet credit related instruments: | ||||||||
| Commitments to extend credit and letters of credit | - | - | - | - | ||||
68
FIRST FARMERS AND MERCHANTS CORPORATION AND SUBSIDIARIES
NOTES TO CONSOLIDATED FINANCIAL STATEMENTS
NOTE 12 – FAIR VALUE MEASUREMENT, (CONTINUED)
|
Fair value measurements at December 31, 2014 using |
||||||||
| Quoted prices | Significant | |||||||
| in active | other | |||||||
| markets for | observable | Significant | ||||||
| Carrying | identical assets | inputs | unobservable | |||||
| amount | (Level 1) | (Level 2) | inputs (Level 3) | |||||
| (dollars in thousands) | ||||||||
| Financial assets | ||||||||
| Cash and due from banks | $ | 18,511 | $ | 18,511 | $ | - | $ | - |
| Interest-bearing deposits in other banks | 10,086 | 10,086 | - | - | ||||
| Federal funds sold | 1,700 | 1,700 | - | - | ||||
| Federal Home Loan Bank and Federal Reserve Bank | ||||||||
| stock | 3,879 | - | 3,879 | - | ||||
| Securities available-for-sale | 397,886 | - | 397,886 | - | ||||
| Securities held-to-maturity | 21,985 | - | 22,263 | - | ||||
| Loans held for sale | 354 | 354 | - | - | ||||
| Loans, net | 644,118 | - | - | 650,770 | ||||
| Accrued interest receivable | 4,337 | - | 4,337 | - | ||||
| Financial liabilities | ||||||||
| Non-interest bearing deposits | 204,358 | 204,358 | - | - | ||||
| Interest bearing deposits | 815,597 | - | 816,022 | - | ||||
| Repurchase agreements | 22,834 | - | 22,834 | - | ||||
| Accrued interest payable | 613 | - | 613 | - | ||||
| Off-balance sheet credit related instruments: | ||||||||
| Commitments to extend credit and letters of credit | - | - | - | - | ||||
69
FIRST FARMERS AND MERCHANTS CORPORATION AND SUBSIDIARIES
NOTES TO CONSOLIDATED FINANCIAL STATEMENTS
NOTE 13 – QUARTERLY RESULTS OF OPERATIONS (Unaudited)
The following table presents unaudited quarterly interim financial information for the Company for the periods presented:
| March 31, | June 30, | September 30, | December 31, | |||||||
| 2015 | 2015 | 2015 | 2015 | Total | ||||||
| (dollars in thousands) | ||||||||||
| Interest income | $ | 9,303 | $ | 9,720 | $ | 9,817 | $ | 9,842 | $ | 38,682 |
| Interest expense | 565 | 556 | 556 | 548 | 2,225 | |||||
| Net interest income | 8,738 | 9,164 | 9,261 | 9,294 | 36,457 | |||||
| Provision for possible loan and lease losses, net | - | - | - | 30 | 30 | |||||
| Non-interest income | 2,885 | 2,774 | 2,907 | 2,877 | 11,443 | |||||
| Non-interest expenses | 8,030 | 8,559 | 8,524 | 9,102 | 34,215 | |||||
| Income before income taxes | 3,593 | 3,379 | 3,644 | 3,039 | 13,655 | |||||
| Income taxes | 976 | 677 | 925 | 771 | 3,349 | |||||
| Net income | $ | 2,617 | $ | 2,702 | $ | 2,719 | $ | 2,268 | $ | 10,306 |
| Basic earnings per share | $ | 0.53 | $ | 0.56 | $ | 0.57 | $ | 0.48 | $ | 2.13 |
| Weighted average shares outstanding | 4,897,245 | 4,853,265 | 4,808,352 | 4,771,648 | 4,832,217 | |||||
| March 31, | June 30, | September 30, | December 31, | |||||||
| 2015 | 2015 | 2015 | 2015 | Total | ||||||
| (dollars in thousands) | ||||||||||
| Interest income | $ | 9,042 | $ | 9,103 | $ | 9,351 | $ | 9,284 | $ | 36,780 |
| Interest expense | 620 | 623 | 605 | 580 | 2,428 | |||||
| Net interest income | 8,422 | 8,480 | 8,746 | 8,704 | 34,352 | |||||
| Provision for possible loan and lease losses, net | - | - | - | - | - | |||||
| Non-interest income | 2,651 | 3,091 | 3,177 | 2,808 | 11,727 | |||||
| Non-interest expenses | 8,098 | 8,033 | 8,166 | 7,984 | 32,281 | |||||
| Income before income taxes | 2,975 | 3,538 | 3,757 | 3,528 | 13,798 | |||||
| Income taxes | 713 | 941 | 1,031 | 871 | 3,556 | |||||
| Net income | $ | 2,262 | $ | 2,597 | $ | 2,726 | $ | 2,657 | $ | 10,242 |
| Basic earnings per share | $ | 0.45 | $ | 0.52 | $ | 0.55 | $ | 0.54 | $ | 2.06 |
| Weighted average shares outstanding | 5,017,789 | 4,977,506 | 4,934,815 | 4,909,910 | 4,963,826 | |||||
70
FIRST FARMERS AND MERCHANTS CORPORATION AND SUBSIDIARIES
NOTES TO CONSOLIDATED FINANCIAL STATEMENTS
NOTE 14 – DEPOSITS
The Bank does not have any foreign offices and all deposits are serviced in its 19 domestic offices. Maturities of time deposits of $100,000 or more at December 31, 2015 and 2014 are as follows:
| 2015 | 2014 | |||
| (dollars in thousands) | ||||
| Under 3 months | $ | 24,805 | $ | 29,629 |
| 3 to 12 months | 70,447 | 71,489 | ||
| Over 12 months | 16,755 | 18,399 | ||
| Total | $ | 112,007 | $ | 119,517 |
At December 31, 2015 and 2014, the Bank had $47.1 million and $53.3 million, respectively, of interest-bearing time deposits of $250,000 or more. At December 31, 2015 and 2014, the Bank had $223,000 and $152,000, respectively, of deposit accounts in overdraft status and thus have been reclassified to loans in the accompanying consolidated balance sheets.
The following table presents maturities of interest-bearing time deposits as of December 31, 2015:
|
(dollars in thousands) |
||
| 2016 | $ | 172,931 |
| 2017 | 17,972 | |
| 2018 | 6,056 | |
| 2019 | 6,237 | |
| 2020 | 8,090 | |
| Thereafter | 10 | |
| Total | $ | 211,296 |
71
FIRST FARMERS AND MERCHANTS CORPORATION AND SUBSIDIARIES
NOTES TO CONSOLIDATED FINANCIAL STATEMENTS
NOTE 15 – CONDENSED FINANCIAL INFORMATION OF THE CORPORATION
The following tables present the condensed balance sheets, statements of income, comprehensive income (loss), and cash flows of the Company:
CONDENSED BALANCE SHEETS
| As of December 31, | ||||||
| 2015 | 2014 | |||||
| (dollars in thousands) | ||||||
| Cash | $ | 310 | $ | 271 | ||
| Investment in bank subsidiary | 114,655 | 111,512 | ||||
| Investment in credit life insurance company | 54 | 54 | ||||
| Investment in other securities | 17 | 17 | ||||
| Dividends receivable from bank subsidiary | 1,754 | 1,813 | ||||
| Cash surrender value - life insurance | 4,546 | 4,474 | ||||
| Total assets | $ | 121,336 | $ | 118,141 | ||
| Liabilities | ||||||
| Accrued liabilities | $ | 1,887 | $ | 1,839 | ||
| Dividends payable | 1,754 | 1,813 | ||||
| Total liabilities | 3,641 | 3,652 | ||||
| Shareholders' equity | ||||||
| Common stock - $10 par value, 8,000,000 shares authorized; | ||||||
| 4,739,502 and 4,900,576 shares issued and outstanding, | ||||||
| as of December 31, 2015 and December 31, 2014, respectively | 47,395 | 49,006 | ||||
| Retained earnings | 71,583 | 67,609 | ||||
| Accumulated other comprehensive loss | (1,283 | ) | (2,126 | ) | ||
| Total shareholders' equity | 117,695 | 114,489 | ||||
| Total liabilities and shareholders' equity | $ | 121,336 | $ | 118,141 | ||
72
FIRST FARMERS AND MERCHANTS CORPORATION AND SUBSIDIARIES
NOTES TO CONSOLIDATED FINANCIAL STATEMENTS
NOTE 15 – CONDENSED FINANCIAL INFORMATION OF THE CORPORATION, (CONTINUED)
CONDENSED STATEMENTS OF INCOME
| Years ended December 31, | |||||||||
| 2015 | 2014 | 2013 | |||||||
| Operating income | (dollars in thousands) | ||||||||
| Dividends from bank subsidiary | $ | 8,002 | $ | 7,038 | $ | 7,663 | |||
| Other dividend income | - | 8 | 15 | ||||||
| Other | 72 | 65 | 65 | ||||||
| Operating expenses | (308 | ) | (279 | ) | (238 | ) | |||
| Income before equity in undistributed net | |||||||||
| income of bank subsidiary | 7,766 | 6,832 | 7,505 | ||||||
| Equity in undistributed net income of bank subsidiary | 2,540 | 3,410 | 2,106 | ||||||
| Net income | $ | 10,306 | $ | 10,242 | $ | 9,611 | |||
| CONDENSED STATEMENTS OF COMPREHENSIVE INCOME (LOSS) | |||||||||
| Year ended December 31, | |||||||||
| 2015 | 2014 | 2013 | |||||||
|
(dollars in thousands) |
|||||||||
| Net income for common shareholders | $ | 10,306 | $ | 10,242 | $ | 9,611 | |||
| Other comprehensive income (loss) | |||||||||
| Unrealized appreciation (depreciation) on available-for-sale securities, net of taxes | |||||||||
| of 685, $4,742, and ($8,507), respectively | 1,097 | 7,571 | (13,589 | ) | |||||
| Reclassification adjustment for realized gains included in net income, net of taxes of | |||||||||
| ($206), ($251) and ($319), respectively | (328 | ) | (401 | ) | (510 | ) | |||
| Change in unfunded portion of post-retirement benefit obligations, net of taxes of | |||||||||
| $47, ($185) and $2,102, respectively | 74 | (295 | ) | 3,360 | |||||
| Other comprehensive income (loss) | 843 | 6,875 | (10,739 | ) | |||||
| Total comprehensive income (loss) | $ | 11,149 | $ | 17,117 | $ | (1,128 | ) | ||
73
FIRST FARMERS AND MERCHANTS CORPORATION AND SUBSIDIARIES
NOTES TO CONSOLIDATED FINANCIAL STATEMENTS
NOTE 15 – CONDENSED FINANCIAL INFORMATION OF THE CORPORATION, (CONTINUED)
CONDENSED STATEMENTS OF CASH FLOWS
| Years ended December 31, | |||||||||
| 2015 | 2014 | 2013 | |||||||
| (dollars in thousands) | |||||||||
| Operating activities | |||||||||
| Net income for the year | $ | 10,306 | $ | 10,242 | $ | 9,611 | |||
| Adjustments to reconcile net income to net cash | |||||||||
| provided by operating activities | |||||||||
| Equity in undistributed net income of bank subsidiary | (2,540 | ) | (3,410 | ) | (2,106 | ) | |||
| Increase in cash surrender value of life insurance | |||||||||
| contracts | (72 | ) | (65 | ) | (65 | ) | |||
| Increase (decrease) in other assets | 59 | 245 | (90 | ) | |||||
| Increase in payables | 288 | 18 | 134 | ||||||
| Total adjustments | (2,265 | ) | (3,212 | ) | (2,127 | ) | |||
| Net cash provided by operating activities | 8,041 | 7,030 | 7,484 | ||||||
| Financing activities | |||||||||
| Payment to repurchase common stock | (4,408 | ) | (3,097 | ) | (3,722 | ) | |||
| Cash dividends paid | (3,594 | ) | (3,685 | ) | (3,800 | ) | |||
| Net cash used by financing activities | (8,002 | ) | (6,782 | ) | (7,522 | ) | |||
| Decrease in cash | 39 | 248 | (38 | ) | |||||
| Cash at beginning of year | 271 | 23 | 61 | ||||||
| Cash at end of year | $ | 310 | $ | 271 | $ | 23 | |||
NOTE 16 – EMPLOYEE BENEFIT PLANS
The Bank contributes to a qualified profit-sharing plan covering employees who meet participation requirements. To be eligible to participate, employees must complete 1,000 hours of service within the twelve month time period following their date of hire. Employees must be age twenty or older. The amount of the contribution is at the discretion of the Bank’s Board of Directors, up to the maximum deduction allowed for federal income tax purposes. Contributions to the plan, which amounted to approximately $885,000, $1.0 million and $1.6 million in 2015, 2014 and 2013, respectively, are included in salaries and employee benefits expense.
The Bank formalized a nonqualified salary continuation agreement for a key officer. In connection with this agreement, the value of the single premium universal life insurance policies (approximately $996,000 at December 31, 2015 and approximately $986,000 at December 31, 2014) purchased in 1993 to fund the related liability (approximately $40,000 at December 31, 2015 and $56,000 at December 31, 2014) were included in other assets and other liabilities, respectively. The principal cost of this agreement is accrued over the anticipated remaining period of active employment, based on the present value of the expected retirement benefit.
The Company and Bank implemented a deferred compensation plan that permits directors to defer their director’s fees and earn interest on the deferred amount in the amount of the wall street journal prime rate plus three percent. The agreements provide for a lump sum payment or 120 month payments of deferred fees plus accrued interest after retirement, separation from service, or death. The liability accrued for this plan totaled $6.6 million at December 31, 2015 and 2014.. The charge to expense for the agreements was $738,000, $715,000 and $722,000 for the years ended December 31 2015, 2014 and 2013, respectively.
74
FIRST FARMERS AND MERCHANTS CORPORATION AND SUBSIDIARIES
NOTES TO CONSOLIDATED FINANCIAL STATEMENTS
NOTE 17 – POST RETIREMENT BENEFIT PLAN
Effective July 1, 2013, the Company revised its retiree medical benefit plan for employees who were hired before March 27, 2007. Newly retiring employees will no longer be offered medical, dental or life insurance coverage. Instead, qualified retirees will receive a post retirement bonus. The Company will pay a post retirement bonus equal to $20,000 to employees (i) who were hired prior to March 20, 2007; (ii) who retire on or after July 1, 2013; (iii) who are at least age 59 ½ at the time of retirement; and (iv) who have at least twenty-five years of service to the Company as of retirement. The bonus will be paid in a lump sum cash payment (subject to applicable tax withholding requirements) within 60 days after the employee’s retirement, provided such retirement constitutes a “separation from service” under section 409A of the Internal Revenue Code. The Company still sponsors a defined benefit post-retirement health care plan for retirees who retired prior to July 1, 2007. Under this plan, premiums paid by retirees and spouses depend on date of retirement, age and coverage election.
The Company funding policy is to make the minimal annual contribution that is required by applicable regulations, plus such amounts as the Company may determine to be appropriate from time to time. The Company expects to contribute $161,000 to the plan in 2016.
The following table provides further information about the plan:
| Post-retirement benefits | ||||||
| 2015 | 2014 | |||||
| (dollars in thousands) | ||||||
| Change in benefit obligation | ||||||
| Benefit obligation at beginning of year | $ | 2,560 | $ | 2,313 | ||
| Service cost | 36 | 33 | ||||
| Interest cost | 105 | 111 | ||||
| Expected benefits paid | (174 | ) | (183 | ) | ||
| Actuarial gain (loss) | (286 | ) | 286 | |||
| Benefit obligation at end of year | $ | 2,241 | $ | 2,560 | ||
| Change in fair value of assets | ||||||
| Fair value of plans assets at beginning of year | $ | - | $ | - | ||
| Employer contribution | 174 | 183 | ||||
| Benefits paid | (174 | ) | (183 | ) | ||
| Fair value of plan assets at end of year | $ | - | $ | - | ||
| Reconciliation of funded status to benefit costs recognized | ||||||
| Projected benefit obligation, end of year | $ | (2,241 | ) | $ | (2,560 | ) |
| Fair value of assets, end of year | - | - | ||||
| Funded status, end of year | $ | (2,241 | ) | $ | (2,560 | ) |
75
FIRST FARMERS AND MERCHANTS CORPORATION AND SUBSIDIARIES
NOTES TO CONSOLIDATED FINANCIAL STATEMENTS
NOTE 17 – POST RETIREMENT BENEFIT PLAN, (CONTINUED)
Amounts recognized in accumulated other comprehensive income not yet recognized as components of net periodic benefit cost consist of:
| 2015 | 2014 | |||||
| (dollars in thousands) | ||||||
| Unrecognized net actuarial gain | $ | (2,142 | ) | $ | (2,016 | ) |
| Unrecognized prior service cost | (41 | ) | (46 | ) | ||
| $ | (2,183 | ) | $ | (2,062 | ) | |
| Amounts recognized in statement of financial position are as follows: | ||||||
| 2015 | 2014 | |||||
| (dollars in thousands) | ||||||
| Current liability | $ | - | $ | - | ||
| Noncurrent liability | (2,241 | ) | (2,560 | ) | ||
| $ | (2,241 | ) | $ | (2,560 | ) | |
A reconciliation of other comprehensive income is as follows:
| Post-retirement benefits | |||||||||
| 2015 | 2014 | 2013 | |||||||
| (dollars in thousands) | |||||||||
| Accumulated other comprehensive income (loss) beginning of year | $ | (2,062 | ) | $ | (2,542 | ) | $ | 2,920 | |
| Amortization of net actuarial gain (loss) | 160 | 188 | (190 | ) | |||||
| Negative plan amendment gain | - | - | (2,662 | ) | |||||
| (Gain) loss incurred in current year | (286 | ) | 287 | (2,558 | ) | ||||
| Prior service cost established in current year | 5 | 5 | (52 | ) | |||||
| Other comprehensive income (loss) | (121 | ) | 480 | (5,462 | ) | ||||
| Ending balance (before tax effects) | $ | (2,183 | ) | $ | (2,062 | ) | $ | (2,542 | ) |
| Post-retirement benefits | |||||||||
| 2015 | 2014 | 2013 | |||||||
| Components of net periodic benefit cost |
(dollars in thousands) |
||||||||
| Service cost | $ | 36 | $ | 34 | $ | 138 | |||
| Interest cost | 105 | 111 | 292 | ||||||
| Amortization of prior service cost | (5 | ) | (5 | ) | - | ||||
| Recognized net actuarial (gain) loss | (160 | ) | (188 | ) | 190 | ||||
| Net periodic benefit income (cost) | $ | (24 | ) | $ | (48 | ) | $ | 620 | |
The estimated net gain for the defined benefits post-retirement plan that will be amortized from accumulated other comprehensive income into net periodic benefit cost over the next fiscal year is $174,000.
76
FIRST FARMERS AND MERCHANTS CORPORATION AND SUBSIDIARIES
NOTES TO CONSOLIDATED FINANCIAL STATEMENTS
NOTE 17 – POST RETIREMENT BENEFIT PLAN, (CONTINUED)
| Post-retirement benefits | ||||
| Weighted-average assumption used to determine benefit obligation: | 2015 | 2014 | ||
| Discount rate | 4.25 | % | 4.25 | % |
| Rate of compensation increase | NA | NA | ||
|
Post-retirement benefits |
||||
| Weighted-average assumptions used to determine benefit costs: | 2015 | 2014 | ||
| Discount rate | 4 | % | 5 | % |
The following table gives the Health Care Cost Trend, which is applied to gross charges, net claims and retiree paid premiums to reflect the Company’s past practice and stated ongoing intention to maintain relatively constant cost sharing between the Company and retirees:
| Health care trend rate | 2015 | 2014 | ||
| Initial | ||||
| Pre-65 | 9 | % | 9 | % |
| Post-65 | 8 | % | 8 | % |
| Ultimate (pre and post-65) | 5 | % | 5 | % |
| Years to ultimate | ||||
| Pre-65 | 8 | 8 | ||
| Post-65 | 6 | 6 | ||
The following benefit payments, which reflect expected future service, as appropriate, are expected to be paid, net of participant contributions:
| FYE | Company benefits | |
| (dollars in thousands) | ||
| 2016 | $ | 161 |
| 2017 | 154 | |
| 2018 | 165 | |
| 2019 | 163 | |
| 2020 | 160 | |
| 2021-2026 | 975 | |
| $ | 1,778 |
Assumed health care cost trend rates have a significant effect on the amounts reported for the health care plans.
A one-percentage-point change in assumed health care cost trend rates would have the following effects:
| 1-percentage-point | 1-percentage-point | ||||
| increase | decrease | ||||
| (dollars in thousands) | |||||
| Effect on total of service and interest cost | $ | 13 | $ | (6 | ) |
| Effect on post-retirement benefit obligation | 245 | (146 | ) | ||
77
FIRST FARMERS AND MERCHANTS CORPORATION AND SUBSIDIARIES
NOTES TO CONSOLIDATED FINANCIAL STATEMENTS
NOTE 18 – REGULATORY CAPITAL
The Company and the Bank are each required to comply with applicable capital adequacy standards established by the Federal Reserve Board. The current risk-based capital standards applicable to the Company and the Bank, parts of which are currently in the process of being phased-in, are based on the December 2010 final capital framework for strengthening international capital standards, known as Basel III, of the Basel Committee on Banking Supervision (the “Basel Committee”).
Prior to January 1, 2015, the risk-based capital standards applicable to the Company and the Bank (the “general risk-based capital rules”) were based on the 1988 Capital Accord, known as Basel I, of the Basel Committee. In July 2013, the federal bank regulators approved final rules (the “Basel III Capital Rules”) implementing the Basel III framework as well as certain provisions of the Dodd-Frank Act. The Basel III Capital Rules substantially revised the risk-based capital requirements applicable to bank holding companies and their depository institution subsidiaries, including the Company and the Bank, as compared to the general risk-based capital rules. The Basel III Capital Rules became effective for the Company and the Bank on January 1, 2015 (subject to a phase-in period for certain provisions).
The Basel III Capital Rules, among other things, (i) introduce a new capital measure called “Common Equity Tier 1” (“CET1”), (ii) specify that Tier 1 capital consists of CET1 and “Additional Tier 1 capital” instruments meeting certain revised requirements, (iii) define CET1 narrowly by requiring that most deductions/adjustments to regulatory capital measures be made to CET1 and not to the other components of capital, and (iv) expand the scope of the deductions/adjustments to capital as compared to existing regulations.
Under the Basel III Capital Rules, the minimum capital ratios effective as of January 1, 2015 are:
- 4.5% CET1 to risk-weighted assets;
- 6.0% Tier 1 capital (that is, CET1 plus Additional Tier 1 capital) to risk-weighted assets;
- 8.0% Total capital (that is, Tier 1 capital plus Tier 2 capital) to risk-weighted assets; and
- 4.0% Tier 1 capital to average consolidated assets as reported on consolidated financial statements (known as the “leverage ratio”).
The Basel III Capital Rules also introduced a new “capital conservation buffer”, composed entirely of CET1, on top of these minimum risk-weighted asset ratios. The implementation of the capital conservation buffer began on January 1, 2016 at the 0.625% level and will increase by 0.625% on each subsequent January 1, until it reaches 2.5% on January 1, 2019. The Basel III Capital Rules also provide for a “countercyclical capital buffer” that is only applicable to certain covered institutions and does not have any current applicability to the Company or the Bank. Banking institutions with a ratio of CET1 to risk-weighted assets below the effective minimum (4.5% plus the capital conservation buffer and, if applicable, the countercyclical capital buffer) will face constraints on dividends, equity repurchases and compensation based on the amount of the shortfall.
When fully phased in on January 1, 2019, the Basel III Capital Rules will require the Company and the Bank to maintain an additional capital conservation buffer of 2.5% of CET1, effectively resulting in minimum ratios of (i) CET1 to risk-weighted assets of at least 7%, (ii) Tier 1 capital to risk-weighted assets of at least 8.5%, (iii) a minimum ratio of Total capital to risk-weighted assets of at least 10.5%; and (iv) a minimum leverage ratio of 4%.
The Basel III Capital Rules also provide for a number of deductions from and adjustments to CET1. These include, for example, the requirement that certain deferred tax assets and significant investments in non-consolidated financial entities be deducted from CET1 to the extent that any one such category exceeds 10% of CET1 or all such items, in the aggregate, exceed 15% of CET1. Implementation of the deductions and other adjustments to CET1 began on January 1, 2015 and will be phased-in over a 4-year period (beginning at 40% on January 1, 2015 and an additional 20% per year thereafter).
78
FIRST FARMERS AND MERCHANTS CORPORATION AND SUBSIDIARIES
NOTES TO CONSOLIDATED FINANCIAL STATEMENTS
NOTE 18 – REGULATORY CAPITAL, (CONTINUED)
In addition, under the general risk-based capital rules, the effects of accumulated other comprehensive income items included in capital were excluded for the purposes of determining regulatory capital ratios. Under the Basel III Capital Rules, the effects of certain accumulated other comprehensive income items are not excluded; however, non-advanced approaches banking organizations, including the Company and the Bank, are able to make a one-time permanent election to continue to exclude these items. Both the Company and the Bank have made this election in order to avoid significant variations in the level of capital depending upon the impact of interest rate fluctuations on the fair value of their available-for-sale securities portfolio.
The Basel III Capital Rules prescribe a standardized approach for risk weightings that expanded the risk-weighting categories from the general risk-based capital rules to a much larger and more risk-sensitive number of categories, depending on the nature of the assets, generally ranging from 0% for U.S. government and agency securities, to 600% for certain equity exposures, and resulting in higher risk weights for a variety of asset categories.
Management believes that, as of December 31, 2015, the Company and the Bank would meet all capital adequacy requirements under the Basel III Capital Rules on a fully phased-in basis as if such requirements had been in effect.
Actual capital amounts and ratios are presented in the table below. Management believes, as of December 31, 2015, that the Company and the Bank met the guidelines to which they were subject.
| Minimum | Minimum to be | |||||||||||
|
(Dollars in thousands) |
Actual | capital requirement | well capitalized | |||||||||
|
As of December 31, 2015 |
Amount | Ratio | Amount | Ratio | Amount | Ratio | ||||||
| Common equity Tier 1 (to Risk | ||||||||||||
| weighted assets) Consolidated | $ | 109,960 | 13.3 | % | $ | 37,256 | 4.5 | % | $ | - | - | |
| Bank | 106,918 | 12.9 | % | 37,177 | 4.5 | % | 53,699 | 6.5 | % | |||
| Total capital (to Risk weighted | ||||||||||||
| Assets) Consolidated | 118,594 | 14.3 | % | 66,234 | 8.0 | % | - | - | ||||
| Bank | 115,552 | 14.0 | % | 66,092 | 8.0 | % | 82,615 | 10.0 | % | |||
| Tier 1 capital (to Risk weighted | ||||||||||||
| assets) Consolidated | 109,960 | 13.3 | % | 49,675 | 6.0 | % | - | - | ||||
| Bank | 106,918 | 12.9 | % | 49,569 | 6.0 | % | 66,092 | 8.0 | % | |||
| Tier 1 capital (to average | ||||||||||||
| assets) Consolidated | 109,960 | 8.9 | % | 49,599 | 4.0 | % | - | - | ||||
| Bank | 106,918 | 8.7 | % | 49,420 | 4.0 | % | 61,775 | 5.0 | % | |||
|
As of December 31, 2014 |
||||||||||||
| Total Capital (to Risk weighted | ||||||||||||
| assets) Consolidated | $ | 115,532 | 14.8 | % | $ | 62,628 | 8.0 | % | $ | - | - | |
| Bank | 112,554 | 14.4 | % | 62,628 | 8.0 | % | 78,285 | 10.0 | % | |||
| Tier 1 Capital (to Risk weighted | ||||||||||||
| assets) Consolidated | 107,598 | 13.7 | % | 31,314 | 4.0 | % | - | - | ||||
| Bank | 104,620 | 13.4 | % | 31,314 | 4.0 | % | 46,971 | 6.0 | % | |||
| Tier 1 Capital (to average | ||||||||||||
| assets) Consolidated | 107,598 | 9.7 | % | 44,513 | 4.0 | % | - | - | ||||
| Bank | 104,620 | 9.2 | % | 45,707 | 4.0 | % | 57,133 | 5.0 | % | |||
The Bank is subject to certain restrictions on the amount of dividends that it may declare without prior regulatory approval. At December 31, 2015, approximately $8,056 of retained earnings were available for dividend declaration without prior approval.
79
FIRST FARMERS AND MERCHANTS CORPORATION AND SUBSIDIARIES
NOTES TO CONSOLIDATED FINANCIAL STATEMENTS
NOTE 19 – SUBSEQUENT EVENTS
FASB ASC Topic 855, “Subsequent Events”, established general standards of accounting for a disclosure of events that occur after the balance sheet date but before financial statements are issued. The Company evaluated all events or transactions that occurred after December 31, 2015, through the date of the issued financial statements. During this period there were no material recognizable subsequent events that required recognition or disclosures in the December 31, 2015 financial statements.
80