Attached files
| file | filename |
|---|---|
| 8-K - 8-K - CrossAmerica Partners LP | capl2016form8-kmarchinvest.htm |

Investor Update March 2016
Investor Update March 2016 Safe Harbor Statements 2 Statements contained in this presentation that state the Partnership’s or management’s expectations or predictions of the future are forward-looking statements. The words “believe,” “expect,” “should,” “intends,” “estimates,” “target” and other similar expressions identify forward-looking statements. It is important to note that actual results could differ materially from those projected in such forward-looking statements. For more information concerning factors that could cause actual results to differ from those expressed or forecasted, see CrossAmerica's Forms 10-Q or Form 10-K filed with the Securities and Exchange Commission and available on CrossAmerica's website at www.crossamericapartners.com. If any of these factors materialize, or if our underlying assumptions prove to be incorrect, actual results may vary significantly from what we projected. Any forward-looking statement you see or hear during this presentation reflects our current views as of the date of this presentation with respect to future events. We assume no obligation to publicly update or revise these forward-looking statements for any reason, whether as a result of new information, future events, or otherwise.

Investor Update March 2016 Partnership Overview • Leading motor fuel wholesale distributor, convenience store lessor and c-store operator – Distributes annually over 1 billion gallons – Annual gross rental income of approximately $50 million – Operates over 100 convenience stores – 17.5% equity interest in CST Brands’ wholesale fuels business • Comprised of approximately 1.9 billion gallons of annual fuel supply • Over 1,100 locations(1) – 524 Lessee Dealers – 370 Independent Dealers – 116 Company Operated Sites – 67 Commission Agents – 68 Non-fuel Real Estate Sites • Equity market capitalization of $769 million and enterprise value of $1.13 billion(1) (1) As of February 26, 2016 3

Investor Update March 2016 Investment Highlights • Serial acquirer and integrator of convenience store and fuel distribution assets with a proven track record of executing on accretive transactions – $475.6 million of acquisitions in 2015 – Pending $48.5 million acquisition to close in first quarter 2016 • Significant pipeline of fuel supply assets from general partner sponsor – CST Brands – 82.5% of CST US fuel supply business remaining – Representing approximately $78 million of net profit margin – With inherent growth potential due to CST’s new build strategy • Strong financial position, with potential to continue growth in 2016 without accessing equity markets 4 2012 2013 2014 2015 $74,400 $42,500 $166,500 $475,600 Acquisitions Completed since IPO in 4Q12 (in thousands)

Investor Update March 2016 Investment Highlights • Solid business fundamentals and core competencies – Long term, substantial relationships with major fuel suppliers – Prime real estate in high traffic regions – Stable cash flow from Rental Income, Wholesale Distribution and Retail Operations – Business is more diversified than ever, both geographically and across operating segments • Strong and experienced management team – Years of industry knowledge and experience in wholesale, real estate and retail operations – Seasoned M&A team with strong track record of growth – Integration-focused organization with commitment to fast implementation, synergy capture and EBITDA growth 5 Top 10 Distributor for:

Investor Update March 2016 6 Full Year Results Summary (in millions, except for per unit amounts) KEY METRICS Full Year 2015 2014 % Change Gross Profit $157.5 $115.6 36% Adjusted EBITDA $90.3 $61.4 47% Distributable Cash Flow $69.7 $44.1 58% Weighted Avg. Diluted Units 29.1 19.9* 46% DCF per LP Unit $2.3975 $2.2105 8% Distribution Paid per LP Unit $2.2300 $2.0800 7% Distribution Coverage 1.08x 1.06x 2% *Amount includes approximately 6,000 diluted units that are not included in the calculation of diluted earnings per unit on the face of the income statement because to do so would be anti-dilutive Note: See the Appendix for definitions and a reconciliation of EBITDA, Adjusted EBITDA and Distributable Cash Flow (or “DCF”) to net income.
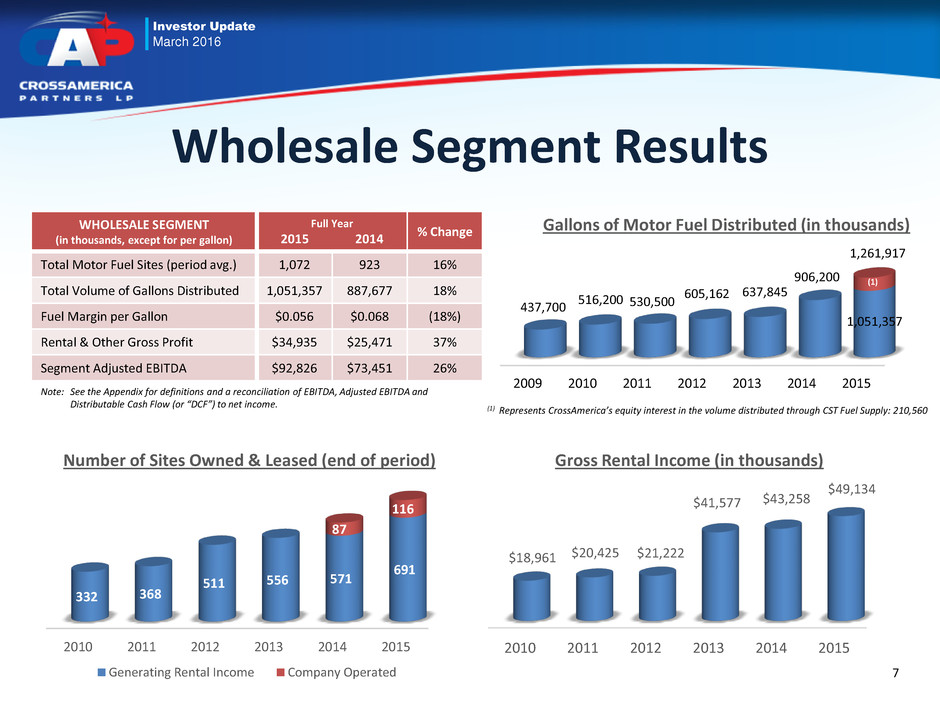
Investor Update March 2016 2009 2010 2011 2012 2013 2014 2015 437,700 516,200 530,500 605,162 637,845 906,200 1,051,357 (1) Wholesale Segment Results WHOLESALE SEGMENT (in thousands, except for per gallon) Full Year 2015 2014 % Change Total Motor Fuel Sites (period avg.) 1,072 923 16% Total Volume of Gallons Distributed 1,051,357 887,677 18% Fuel Margin per Gallon $0.056 $0.068 (18%) Rental & Other Gross Profit $34,935 $25,471 37% Segment Adjusted EBITDA $92,826 $73,451 26% Note: See the Appendix for definitions and a reconciliation of EBITDA, Adjusted EBITDA and Distributable Cash Flow (or “DCF”) to net income. 7 Gallons of Motor Fuel Distributed (in thousands) 1,261,917 (1) Represents CrossAmerica’s equity interest in the volume distributed through CST Fuel Supply: 210,560 2010 2011 2012 2013 2014 2015 332 368 511 556 571 691 87 116 Number of Sites Owned & Leased (end of period) Generating Rental Income Company Operated 2010 2011 2012 2013 2014 2015 $18,961 $20,425 $21,222 $41,577 $43,258 $49,134 Gross Rental Income (in thousands)
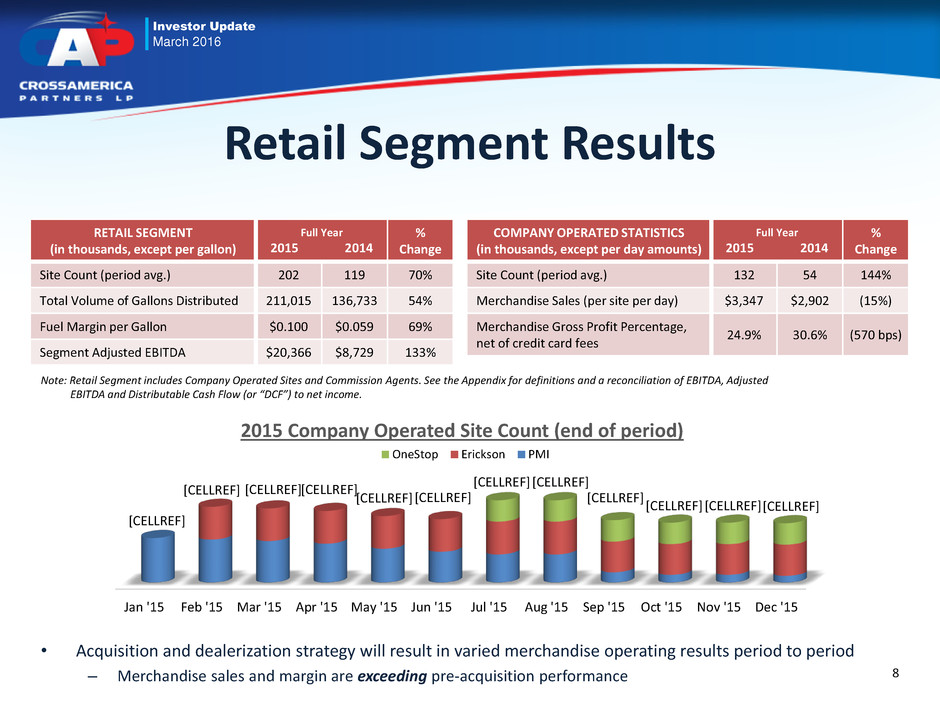
Investor Update March 2016 Jan '15 Feb '15 Mar '15 Apr '15 May '15 Jun '15 Jul '15 Aug '15 Sep '15 Oct '15 Nov '15 Dec '15 [CELLREF] [CELLREF] [CELLREF] [CELLREF] [CELLREF] [CELLREF] [CELLREF] [CELLREF] [CELLREF] [CELLREF] [CELLREF] [CELLREF] 2015 Company Operated Site Count (end of period) OneStop Erickson PMI Retail Segment Results RETAIL SEGMENT (in thousands, except per gallon) Full Year 2015 2014 % Change Site Count (period avg.) 202 119 70% Total Volume of Gallons Distributed 211,015 136,733 54% Fuel Margin per Gallon $0.100 $0.059 69% Segment Adjusted EBITDA $20,366 $8,729 133% Note: Retail Segment includes Company Operated Sites and Commission Agents. See the Appendix for definitions and a reconciliation of EBITDA, Adjusted EBITDA and Distributable Cash Flow (or “DCF”) to net income. 8 COMPANY OPERATED STATISTICS (in thousands, except per day amounts) Full Year 2015 2014 % Change Site Count (period avg.) 132 54 144% Merchandise Sales (per site per day) $3,347 $2,902 (15%) Merchandise Gross Profit Percentage, net of credit card fees 24.9% 30.6% (570 bps) • Acquisition and dealerization strategy will result in varied merchandise operating results period to period – Merchandise sales and margin are exceeding pre-acquisition performance

Investor Update March 2016 2014 vs 2015 Adjusted EBITDA Performance (in thousands) $90,314 $61,424 $38,091 ($8,961) $155 ($395) Acquisitions(1) Impact of Supplier Terms Discounts 2014 Adjusted EBITDA 2015 Adjusted EBITDA Net, Misc.(2) Net Opex/G&A Changes, Excluding Acquisitions (1) Acquisitions include third party acquisitions and CST asset drops conducted since Q2 2014 (2) Net, Misc. includes increased IDR distributions, DTW pricing and other miscellaneous items Note: See the Appendix for definitions and a reconciliation of EBITDA, Adjusted EBITDA and Distributable Cash Flow (or “DCF”) to net income. 9 • Contributing to the significant Acquisition EBITDA growth is approximately $2.5 million in ongoing synergies through improved operations, such as leveraging our scale and buying power with our convenience store operations • In addition to Adjusted EBITDA performance, reductions of over $1 million in permanent sustaining capital expenditures contributed to the increase in DCF
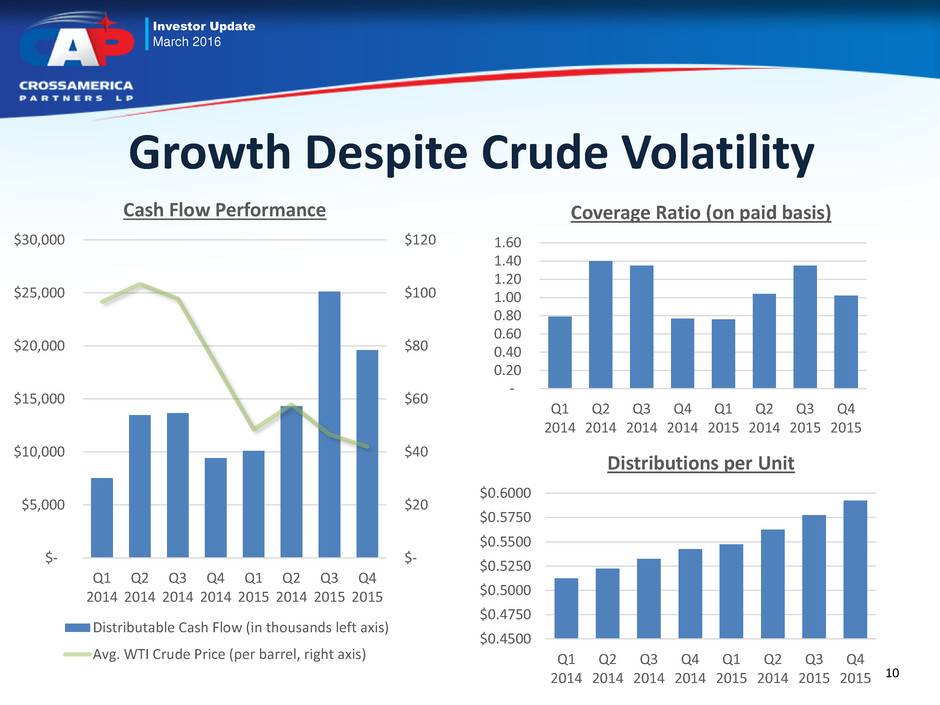
Investor Update March 2016 Growth Despite Crude Volatility $- $20 $40 $60 $80 $100 $120 $- $5,000 $10,000 $15,000 $20,000 $25,000 $30,000 Q1 2014 Q2 2014 Q3 2014 Q4 2014 Q1 2015 Q2 2014 Q3 2015 Q4 2015 Cash Flow Performance Distributable Cash Flow (in thousands left axis) Avg. WTI Crude Price (per barrel, right axis) - 0.20 0.40 0.60 0.80 1.00 1.20 1.40 1.60 Q1 2014 Q2 2014 Q3 2014 Q4 2014 Q1 2015 Q2 2014 Q3 2015 Q4 2015 Coverage Ratio (on paid basis) $0.4500 $0.4750 $0.5000 $0.5250 $0.5500 $0.5750 $0.6000 Q1 2014 Q2 2014 Q3 2014 Q4 2014 Q1 2015 Q2 2014 Q3 2015 Q4 2015 Distributions per Unit 10

Investor Update March 2016 Continuing Accretive Growth • Over 85% owned locations • Located in proximity with FreedomValu stores • Large stores with good inside sales • Holiday franchise brings strong brand recognition 31 Company Operated $48.5 Million Purchase 26 Million Gallons Upper Midwest (MN, WI) Holiday Est. 1Q16 close date Asset Purchase Rationale 58 CrossAmerica company operated – FreedomValu or SuperAmerica 6 CrossAmerica dealer operated – FreedomValu 31 CrossAmerica company operated – Holiday (PENDING) (From SSG Corporation) 11 Note: Site counts are as of February 26, 2016
Investor Update March 2016 Financial Stability 12 • Maintaining a strong Balance Sheet with a Debt-to-EBITDA ratio of less than 4.1x as of December 31, 2015 – Approximately $100 million of available revolver capacity – Well within debt covenant limitations • Maximum leverage capacity under our revolver is 4.5x • Maximum leverage capacity after a material acquisition (i.e., at least $50 million) increases to 5.0x for the 2 financial quarters post-acquisition – Thus, the amount of borrowing capacity available under the revolving credit facility will increase by $5 million for every $1 million of EBITDA added as a result of the material acquisition – Material acquisitions include third party transactions and parent drop downs • Remain positioned to continue accretive growth in 2016 and maintain a strong balance sheet

Investor Update March 2016 Executing with Measured Growth • Declared and paid fourth quarter 2015 distribution of $0.5925 per unit – 1.5 cent per unit increase over third quarter • Grew distributions per unit 8.1% in 2015 over 2014 • Completes our commitment made in 1Q15 to increase distributions 7%-9% for the year – Expect to increase per unit distribution by 5%-7% for 2016 over 2015 • Expect to achieve our long-term goal to maintain a 12-month coverage ratio of 1.1x, remain within our leverage ratio constraints and deliver on our growth targets without issuing any new equity in 2016 – 2016 Distributable Cash Flow growth to come from selective, accretive acquisitions and continued strong operational performance and cost reduction 13 IPO MQD* 1Q13 2Q13 3Q13 4Q13 1Q14 2Q14 3Q14 4Q14 1Q15 2Q15 3Q15 4Q15 $0.4375 $0.4525 $0.4775 $0.5025 $0.5125 $0.5125 $0.5225 $0.5325 $0.5425 $0.5475 $0.5625 $0.5775 $0.5925

Investor Update March 2016 Investment Summary • Stable cash flow business with minimal exposure to commodity market fluctuations, even during historically volatile times • Visible path to continued DCF growth through acquisitions, integration and operational excellence • Unit price remains significantly below intrinsic value, based on demonstrated distribution growth 14 Leader in wholesale fuel distribution and c-store lessor and operator Substantial relationship with the largest fuel suppliers in the industry Diverse geographic and operational footprint Significant real estate ownership provides stable cash flow contribution Serial acquirer with reputation to complete strategic, accretive transactions Acquisition pipeline from general partner sponsor Strong management team and board with experience in MLPs, operations, acquisitions and integration

Investor Update March 2016 Appendix 15

Investor Update March 2016 • Strong margin (5 cpg) with high volume and long-term supply • Leverage existing relationship with Shell • Good rental income • CST operated sites 22 CST Lessee Dealer Sites $41.2 Million Purchase 41 Million Gallons* San Antonio & Austin Shell Jan 8, 2015 close date Asset Purchase Rationale (From Landmark Industries) • Over 90% owned locations • Located in growing market • Unbranded fuel • Large stores with inside sales growth opportunity • Loyalty/credit card program 64 Company Operated $85 Million Purchase 68 Million Gallons* Upper Midwest (MN, WI, SD, MI) Freedom Valu, SuperAmerica Feb 16, 2015 close date Stock Purchase Rationale • Expand presence in the West Virginia/Virginia market • Establish new fuel brand opportunity with Marathon • Leverage existing relationship with Exxon 41 Company Operated 4 Agents; 9 Dealers; 1 QSR $42 Million Purchase 36 Million Gallons* West Virginia Marathon/Exxon Jul 1, 2015 close date Stock Purchase Rationale 16 Note: Estimated volumes at acquisition Recent Accretive Growth

Investor Update March 2016 • Strong fuel margin (6 cpg) with long-term fuel supply • Good rental income •Minimal expense and CapEx impact • CST operated sites 25 CST Dealer Sites (Fuel Income) 23 CST Fee Sites (Rental Income) $53.6 Million Purchase 40 Million Gallons* Central New York Nice N Easy Nov 1, 2014 close date Asset Purchase Rationale • Large volume network • Strong retail operator with embedded food options at several locations • Recognize synergies with other operations in the area 87 Company Operated Petroleum Products Division $61 Million Purchase 200+ Million Gallons* Virginia, West Virginia, Tennessee, North Carolina Shell, Exxon, BP, Citgo May 1, 2014 close date Stock Purchase Rationale • Long-term fuel supply agreements with average term remaining of approximately 14 years • Expands relationship with BP 55 Dealer Supply Contracts 11 Fee or Leasehold Sites $38.5 Million Purchase 100+ Million Gallons* Chicago Metro BP May 19, 2014 close date Asset Purchase Rationale Recent Accretive Growth (Certain Assets) 17 Note: Estimated volumes at acquisition

Investor Update March 2016 4Q14 vs 4Q15 Adjusted EBITDA Performance (in thousands) $24,708 $14,186 $14,226 ($1,768) $197 ($2,133) Acquisitions(1) Impact of Supplier Terms Discounts Q4 2014 Adjusted EBITDA Q4 2015 Adjusted EBITDA Net, Misc.(2) Net Opex/G&A Changes, Excluding Acquisitions (1) Acquisitions include third party acquisitions and CST asset drops conducted since Q2 2014 (2) Net, Misc. includes increased IDR distributions, DTW pricing and other miscellaneous items Note: See the Appendix for definitions and a reconciliation of EBITDA, Adjusted EBITDA and Distributable Cash Flow (or “DCF”) to net income. 18

Investor Update March 2016 Additional Information: • $0.5031 on an annual basis = $2.01 • $0.5469 on an annual basis = $2.19 • $0.6563 on an annual basis = $2.63 • Q4 2014 Dividend = $0.5325, on an annual basis = $2.13 Incentive Distribution Rights 19 100% 85% 75% 50% 15% 25% 50% up to $0.5031 above $0.5031 up to $0.5469 above $0.5469 up to $0.6563 above $0.6563 M ar gi n al % In te re st in D is tri b u tio n Total Quarterly Distribution per Common and Subordinated Unit • If cash distributions to our unitholders exceed $0.5031 per unit in any quarter, CrossAmerica unitholders and the incentive distribution rights held by CST will receive distributions according to the percentage allocations shown in the chart to the right $0.5031 $0.5469 $0.6563 ↑ Unitholder Distribution IDR Distribution Lower Tier Unitholder Distribution Lower Tier IDR Distribution

Returning Cash to Unitholders CAPL Unit Repurchase Plan • On November 2, 2015, the CrossAmerica Board approved a $25 million unit repurchase program authorizing CrossAmerica to repurchase common units • Unit Purchase Activity: Units Purchased Average Price Per Unit Dollar Amount Spent 4Q 2015 154,158 $23.37 $3.6 million Since Inception to Date (02/17/16) 154,158 $23.37 $3.6 million 20

Returning Cash to Unitholders CST’s CAPL Unit Purchase Plan • Recognizing the attractive investment offered by CAPL common units and reinforcing CST’s continued support of CrossAmerica and its long term business strategies, the CST Board authorized a $50 million unit purchase program on September 21, 2015 • Unit Purchase Activity: Units Purchased Average Price Per Unit Dollar Amount Spent 3Q 2015 170,374 $23.12 $3.9 million 4Q 2015 634,293 $25.04 $15.9 million Since Inception to Date (02/17/16) 804,667 $24.64 $19.8 million 21

Investor Update March 2016 22 Non-GAAP Financial Measures

Investor Update March 2016 23 Non-GAAP Financial Measures
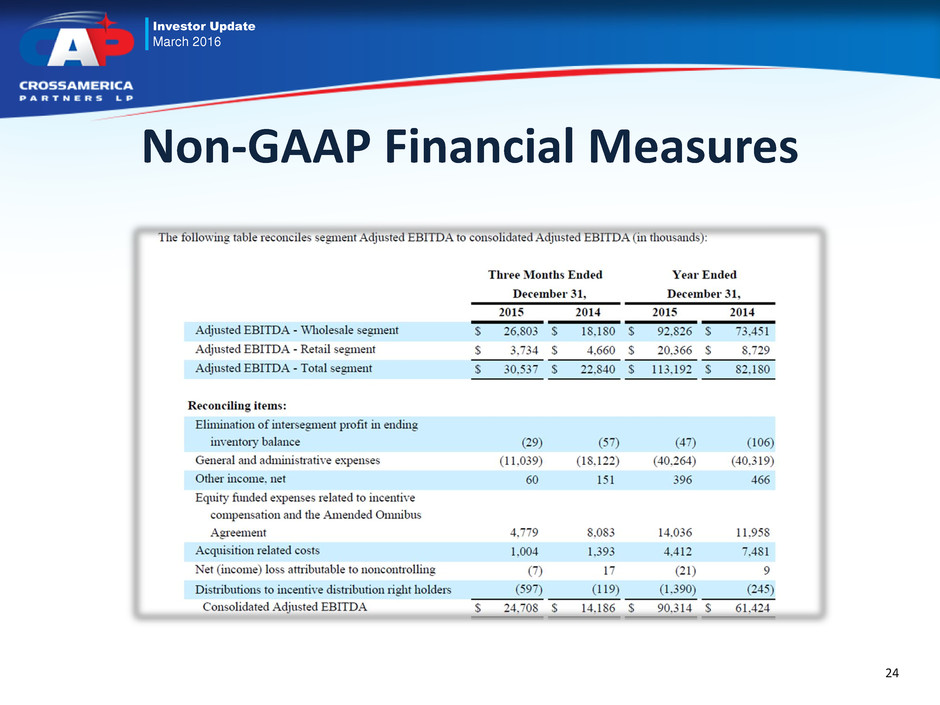
Investor Update March 2016 24 Non-GAAP Financial Measures
