Attached files
| file | filename |
|---|---|
| EX-23.1 - EXHIBIT 23.1 - ARC DOCUMENT SOLUTIONS, INC. | arc-12312015xex231.htm |
| EX-31.2 - EXHIBIT 31.2 - ARC DOCUMENT SOLUTIONS, INC. | arc-12312015xex312.htm |
| EX-31.1 - EXHIBIT 31.1 - ARC DOCUMENT SOLUTIONS, INC. | arc-12312015xex311.htm |
| EX-32.1 - EXHIBIT 32.1 - ARC DOCUMENT SOLUTIONS, INC. | arc-12312015xex321.htm |
| EX-32.2 - EXHIBIT 32.2 - ARC DOCUMENT SOLUTIONS, INC. | arc-12312015xex322.htm |
| EX-21.1 - EXHIBIT 21.1 - ARC DOCUMENT SOLUTIONS, INC. | arc-12312015xex211.htm |
UNITED STATES
SECURITIES AND EXCHANGE COMMISSION
Washington, D.C. 20549
_______________________________________
Form 10-K
_______________________________________
(Mark One)
ý | ANNUAL REPORT PURSUANT TO SECTION 13 OR 15(d) OF THE SECURITIES EXCHANGE ACT OF 1934 |
For the Fiscal Year Ended December 31, 2015
or
¨ | TRANSITION REPORT PURSUANT TO SECTION 13 OR 15(d) OF THE SECURITIES EXCHANGE ACT OF 1934 |
For the transition period from to
Commission File Number: 001-32407
_______________________________________
ARC DOCUMENT SOLUTIONS, INC.
(Exact name of Registrant as specified in its Charter)
_______________________________________
Delaware | 20-1700361 |
(State or other jurisdiction of incorporation or organization) | (I.R.S. Employer Identification No.) |
1981 N. Broadway, Suite 385
Walnut Creek, California 94596
(925) 949-5100
(Address, including zip code, and telephone number, including area code, of Registrant’s principal executive offices)
Securities registered pursuant to Section 12(b) of the Act:
Title of Each Class | Name of Each Exchange on Which Registered | |
Common Stock, par value $0.001 per share | New York Stock Exchange | |
Securities registered pursuant to Section 12(g) of the Act: NONE
Indicate by check mark if the registrant is a well-known seasoned issuer, as defined in Rule 405 of the Securities Act. Yes ¨ No ý
Indicate by check mark if the registrant is not required to file reports pursuant to Section 13 or Section 15(d) of the Act. Yes ¨ No ý
Indicate by check mark whether the registrant (1) has filed all reports required to be filed by Section 13 or 15(d) of the Securities Exchange Act of 1934 during the preceding 12 months (or for such shorter period that the registrant was required to file such reports), and (2) has been subject to such filing requirements for the past 90 days. Yes ý No ¨
Indicate by check mark whether the registrant has submitted electronically and posted on its corporate Web site, if any, every Interactive Data File required to be submitted and posted pursuant to Rule 405 of Regulation S-T (§232.405 of this chapter) during the preceding 12 months (or for such shorter period that the registrant was required to submit and post such files). Yes ý No ¨
Indicate by check mark if disclosure of delinquent filers pursuant to Item 405 of Regulation S-K is not contained herein, and will not be contained, to the best of registrant’s knowledge, in definitive proxy or information statements incorporated by reference in Part III of this Form 10-K or any amendment to this Form 10-K. ý
Indicate by check mark whether the registrant is a large accelerated filer, an accelerated filer, a non-accelerated filer, or a smaller reporting company. See the definitions of “large accelerated filer,” “accelerated filer” and “smaller reporting company” in Rule 12b-2 of the Exchange Act. (Check one):
Large accelerated filer ¨ Accelerated filer ý Non-accelerated filer ¨ Smaller reporting company ¨ (Do not check if a smaller reporting company)
Indicate by check mark whether the registrant is a shell company (as defined in Rule 12b-2 of the Exchange Act). Yes ¨ No ý
Based on the closing price of $7.61 of the registrant’s Common Stock on the New York Stock Exchange on June 30, 2015 (the last business day of the registrant’s most recently completed second fiscal quarter), the aggregate market value of the voting common equity held by non-affiliates of the registrant on that date was approximately $317,943,707.
As of February 24, 2016, there were 47,029,171 shares of the Registrant’s common stock outstanding.
DOCUMENTS INCORPORATED BY REFERENCE
Portions of the Registrant’s definitive Proxy Statement on Form 14A for its April 28, 2016 Annual Meeting of Stockholders are incorporated by reference in this Annual Report on Form 10-K in Part III.
_______________________________________
ARC DOCUMENT SOLUTIONS, INC.
ANNUAL REPORT ON FORM 10-K
For the Fiscal Year Ended December 31, 2015
Table of Contents
Page
PART I | |
Item 1. Business | |
Item 1A. Risk Factors | |
Item 1B. Unresolved Staff Comments | |
Item 2. Properties | |
Item 3. Legal Proceedings | |
Item 4. Mine Safety Disclosures | |
PART II | |
Item 5. Market for Registrant's Common Equity, Related Stockholder Matters and Issuer Purchases of Equity Securities | |
Item 6. Selected Financial Data | |
Item 7. Management's Discussion and Analysis of Financial Condition and Results of Operations | |
Item 7A. Quantitative and Qualitative Disclosures About Market Risk | |
Item 8. Financial Statements and Supplementary Data | |
Item 9. Changes in and Disagreements with Accountants on Accounting and Financial Disclosure | |
Item 9A. Controls and Procedures | |
Item 9B. Other Information | |
PART III | |
Item 10. Directors, Executive Officers and Corporate Governance | |
Item 11. Executive Compensation | |
Item 12. Security Ownership of Certain Beneficial Owners and Management and Related Stockholder Matters | |
Item 13. Certain Relationships and Related Transactions, and Director Independence | |
Item 14. Principal Accountant Fees and Services | |
PART IV | |
Item 15. Exhibits and Financial Statement Schedules | |
Signatures | |
Exhibit 21.1 | |
Exhibit 23.1 | |
Exhibit 31.1 | |
Exhibit 31.2 | |
Exhibit 32.1 | |
Exhibit 32.2 | |
Exhibit 101 INS | |
Exhibit 101 SCH | |
Exhibit 101 CAL | |
Exhibit 101 LAB | |
Exhibit 101 PRE | |
3
ARC DOCUMENT SOLUTIONS, INC.
2015 ANNUAL REPORT ON FORM 10-K
In this Annual Report on Form 10-K, “ARC Document Solutions,” “ARC,” “the Company,” “we,” “us,” and “our” refer to ARC Document Solutions, Inc., a Delaware corporation, and its consolidated subsidiaries, unless the context otherwise dictates.
FORWARD-LOOKING STATEMENTS
This Annual Report on Form 10-K contains forward-looking statements within the meaning of the Private Securities Litigation Reform Act of 1995. When used in this Annual Report on Form 10-K, the words “believe,” “expect,” “anticipate,” “estimate,” “intend,” “plan,” “project,” “target,” “likely,” “will,” “would,” “could,” and variations of such words and similar expressions as they relate to our management or to the Company are intended to identify forward-looking statements. These forward-looking statements involve risks and uncertainties that could cause actual results to differ materially from those contemplated herein. We have described in Part I, Item 1A-“Risk Factors” a number of factors that could cause our actual results to differ from our projections or estimates. These factors and other risk factors described in this report are not necessarily all of the important factors that could cause actual results to differ materially from those expressed in any of our forward-looking statements. Other unknown or unpredictable factors also could harm our results. Consequently, there can be no assurance that the actual results or developments anticipated by us will be realized or, even if substantially realized, that they will have the expected consequences to, or effects on, us. Given these uncertainties, you are cautioned not to place undue reliance on such forward-looking statements.
Except where otherwise indicated, the statements made in this Annual Report on Form 10-K are made as of the date we filed this report with the Securities and Exchange Commission and should not be relied upon as of any subsequent date. All future written and verbal forward-looking statements attributable to us or any person acting on our behalf are expressly qualified in their entirety by the cautionary statements contained or referred to in this section. We undertake no obligation, and specifically disclaim any obligation, to publicly update or revise any forward-looking statements, whether as a result of new information, future events or otherwise. You should, however, consult further disclosures we make in future filings of our Annual Reports on Form 10-K, Quarterly Reports on Form 10-Q, and Current Reports on Form 8-K, and any amendments thereto, as well as our proxy statements.
TRADEMARKS AND TRADE NAMES
We own or have rights to a number of trademarks, service marks, and trade names that we use in conjunction with the operation of our business, including the name and design mark “ARC Document Solutions,” “ARC American Reprographics Company®,” “PlanWell®,” “PlanWell PDS®,” “Riot Creative Imaging®,” and various design marks associated therewith. We have a service mark application pending for “SKYSITE” with the United States Patent and Trademark Office (USPTO). In addition, we own or have rights to various trademarks, service marks, and trade names that we use regionally in conjunction with our operations. This report also includes trademarks, service marks and trade names of other companies.
4
PART I
Item 1. Business
Our Company
ARC Document Solutions, Inc. (“ARC Document Solutions,” “ARC,” “we,” “us,” or “our”) is the nation's leading document solutions provider for the architectural, engineering and construction (“AEC”) industry while also providing document solutions to businesses of all types.
Our customers need us to manage the scale, complexity and workflow of their documents. We help them reduce their costs and increase their efficiency by improving their access and control over documents, and we offer a wide variety of ways to produce, distribute, collaborate on, and store documents.
Our offerings include:
Managed Print Services (“MPS”) - An onsite service where we install a complete document solution platform in our customers’ offices and project sites on an outsourced basis. We use our proprietary software, Abacus, to capture, control, manage, print, account for and store documents. In addition, we provide customers with complete cost recovery programs enabled by Abacus, which allows our customers to capture and pass through their project expenses related to print. We also supply, maintain, and manage entire office printing networks, including printing equipment. We bill for this service on a per-use basis and issue a single consolidated invoice.
Offsite Services - We operate 177 offsite service centers in major metropolitan markets in the U.S. and abroad which offer our MPS customers flexibility and overflow capacity during peak workloads, as well as local support and maintenance staff. Our service centers also provide local customers with high-volume, project-related printing of construction documents, and increasingly support and enhance our customers’ scanning needs in archive and information management (“AIM”) services.
Archive and Information Management (“AIM”) -We enable our customers to store information and intellectual property in a cloud-based and searchable digital archive. We do this by scanning existing paper documents or importing digital documents, organizing them, and storing them in our proprietary content management software. We also offer the ability to add documents to the digital archive as they are printed.
Specialized Color Printing - We operate a nationwide network of production centers focused on color printing, finishing, and assembly of graphic materials for regional and national retailers, franchises, marketing departments, theme parks, and cultural institutions.
Web-Based Document Management Applications - We develop and offer proprietary tools to our customers, such as SKYSITE™, Planwell™ and Abacus™, that facilitate project collaboration, manage print networks, track equipment fleets, create and maintain project document archives, and other document and content management tasks.
Digital Shipping / Managed File Transfer - We enable our customers to “distribute-then-print” documents rather than printing locally and then shipping physical documents to their final destination. Using our cloud-based software, ishipdocs, we save our customers time, money, and support their “green” business practices by digitally transmitting document files closest to their delivery point, and then printing and delivering locally from an ARC service center or from one of our partner locations around the world.
Equipment and Supplies Sales - We sell equipment and supplies primarily to customers in the AEC industry and provide ancillary services such as service and maintenance.
The combination of our services allows us to provide a comprehensive document management ecosystem where any document, anywhere in the enterprise, can be captured, stored, managed, accessed, and distributed anywhere in the world.
Our cloud-based services are administered via a powerful cloud solution hosted by Amazon which provides best-in-class speed, reliability, scalability and security.
We believe we are the largest document solutions provider to the AEC market in North America, and the only national provider offering onsite, offsite and cloud-based document management solutions for regional, national and global customers. We offer comprehensive services across geographical boundaries and frequently bill under a single monthly invoice, consolidating purchasing, vendor relations, and administration for companies seeking a unified document management platform.
We serve our clients' onsite in their offices in approximately 9,000 locations, and offsite or virtually through a combination of 177 service centers globally, a variety of web-based applications and software, and a global network of service partners. We operate in major metropolitan markets across the U.S., with meaningful operations in China, Canada, and the United Kingdom.
5
Our origins lie in the reprographics industry and we still maintain robust reprographics operations. We believe that we are the largest reprographics company in the United States as measured by revenue, number of customers, and number of service centers.
Our base of more than 90,000 customers includes most of the largest AEC firms in North America, and many of the top design and construction companies in the world. Our legacy as the largest reprographics company in the U.S. has allowed us to leverage our relationships, domain expertise, and national presence as we have evolved into a technology-enabled document solutions company.
Our largest customers are served by a corporate sales force called Global Solutions. This sales force is focused on large regional and national customers. Our diverse customer base results in no individual customer accounting for more than 4% of our overall revenue.
ARC was organized as a limited liability company under the name American Reprographics Holdings L.L.C. (“Holdings”) in 1997. In 2005, we reorganized as a Delaware corporation in connection with our initial public offering under the name American Reprographics Company. While our service centers historically marketed their offerings under local brand names, in 2011 we consolidated our operations under a single brand, “ARC,” in order to highlight the scope and scale of our business, and to generate synergies in our overall national marketing efforts to the consolidating AEC market. At the end of 2012 we formally changed our corporate name to “ARC Document Solutions, Inc.,” leaving our New York Stock Exchange ticker symbol “ARC” unchanged. We conduct our operations through our wholly-owned subsidiary, ARC Document Solutions, LLC, a Texas limited liability company, and its affiliates.
Principal Products and Services
We report revenues from our service and product offerings under the following categories:
Construction Document and Information Management (CDIM), which consists of the management, distribution, and production of documents and information related to construction projects, including large-format construction drawings (frequently referred to as “blueprints”), black and white and color signage, specification documents, and marketing material. Primary services include document management, digital document distribution, and black and white and color document production. CDIM services can be managed by our customers through a number of digital tools and services including ARC's SKYSITE™ application, a cloud-based construction document management solution. CDIM sales are driven by the volume of construction and other project-related activity in our local, regional and national markets.
Managed Print Services (MPS), which consists of placement, management, and optimization of print and imaging equipment in our customers' offices, job sites, and other facilities. MPS relieves our customers of the burden of owning and managing print devices and print networks, and shifts their costs to a “per-use” basis. MPS is supported by our proprietary technology, Abacus™, which allows our customers to capture, control, manage, print, and account for their documents. Primary services include the assumption of existing equipment, new equipment placement, and print infrastructure optimization. MPS sales growth is driven by the ongoing print needs of our customers at their facilities, and represents contracted, recurring revenue.
Archiving and Information Management (AIM), which consists of services that facilitate the capture, management, access, workflow and use of documents and information that have been produced in the past. AIM services are enabled by our proprietary technology, PlanWell® Archive. Primary services include the digital capture of hardcopy and digital documents, programming the organization and workflow of such documents, and their cloud-based storage and maintenance. AIM sales are driven by the need to leverage past intellectual property for present or future use, improve business process automation, facilitate cost savings over current hardcopy and digital storage methods, as well as comply with regulatory and records retention requirements.
Equipment and Supplies, which consists of reselling printing, imaging, and related equipment to customers primarily in the AEC industry.
Each of our service offerings is enabled through a suite of supporting proprietary technology and a wide variety of value-added services. In an effort to more closely align our financial presentation to how we market our services and products to our customers, during the first quarter of 2015, we re-categorized our offerings to better report distinct sales recognized from Construction Document Information Management ("CDIM"), Managed Print Services ("MPS"), Archiving and Information Management ("AIM"), and Equipment and Supplies Sales. MPS is a new categorization of sales, which combines our previously reported Onsite Services sales with sales generated from the servicing of equipment, which was previously included in Traditional Reprographics. In addition, sales generated from our AIM services were split out from our previously reported Digital Services category and presented separately. The remaining sales generated from Traditional Reprographics, Color Services and Digital Services were combined into CDIM. Equipment and Supplies sales remained unchanged. We believe the updated presentation of our sales categories reflects the drivers of our consolidated sales and will provide greater insight into the opportunities and risk diversification provided by our portfolio of service and product offerings.
6
Operations
Our products and services are available from any of our 177 service centers around the world, and nearly all of our services can be made available in our customers’ offices. Our geographic presence is concentrated in the U.S., with additional service centers in Canada, China, India, and the United Kingdom. Our corporate headquarters are located in Walnut Creek, California.
Historically, our business grew through acquisitions to expand our share of the reprographics market and enhance our geographic footprint to serve our larger customers. Since our inception we have acquired more than 140 companies. As we have consolidated, diversified our service offerings, and optimized our operations during the past several years, we have limited recent acquisition activity in order to focus on organic sales growth. Our origin as a company was in California, and our early acquisition activity was concentrated there. We still derive approximately 31% of our total revenue from California.
We operate a technology center in Silicon Valley with approximately 20 employees who develop, maintain, and support our software. We operate a similar facility in Kolkata, India, with approximately 140 employees who, in addition to supporting our Silicon Valley team, also support our research and development efforts. All of our production facilities are connected via a high-performance, dedicated, wide-area network, to facilitate data transmissions to and from our customers, our operating facilities and our cloud hosted by Amazon. We employ a combination of proprietary and industry-leading technologies to provide redundancy, backup and security of all data in our systems.
Historically, the majority of our revenue has been derived from customers engaged in the seasonal, non-residential construction market. While our traditional reprographics business, included in CDIM, is still influenced by the non-residential seasonality and building cycles, our other CDIM offerings are less so, color printing services are affected by retail marketing calendars, advertising campaigns, as well as the marketing needs of our architectural and real estate development clients. Our CDIM digital services are influenced primarily by the desire for document workflow improvements and our ability to market our technology-based solutions. MPS is driven by the generation of office documents and our customers' desire to improve business processes and reduce print-related costs. Equipment and Supplies Sales are driven by purchasing cycles of individual customers, as well as by new features and advancements by manufacturers.
As of December 31, 2015, the company employed approximately 2,600 employees.
Our Customers and Markets
We serve both the enterprise and project content management needs of companies primarily within the AEC industry. Our customers include senior management teams, IT and procurement departments, project architects, engineers, general contractors, and others.
The mix of services demanded by the AEC industry continues to shift toward document management for a wide variety of document types provided at customer locations (represented primarily by our MPS revenues), and away from its historical emphasis on printing of large-format black and white construction drawings in our service centers (included in our CDIM revenue line). We believe the market forces of the recent recession and its aftermath are causing our customers in the construction industry to emphasize efficiency in their production and distribution of printed documents, to reduce their dependence on print as it relates to construction projects, and to improve access and control over all the documents related to their business. We also believe that consolidation in the AEC industry is contributing to this trend as companies seek to reduce costs, eliminate redundant business practices, and procure products and services from vendors who can centrally serve their business with a comprehensive offering.
We believe that these trends are advantageous to us for four reasons: first, we are well-positioned to provide our customers with web applications and cloud-based offerings to meet their demand for technology-enabled content management services; second, our diversification into services such as MPS and AIM allow us to capture long-term contracted revenue streams that are less exposed to the volatility and cyclicality of project-related printing; third, as our customers merge, consolidate, and grow larger, we believe ARC becomes a more compelling choice because of our extensive geographic reach and ability to act as a single-source supplier of document solutions; and fourth, our market-leading presence as a traditional reprographer in major metropolitan areas allows us to capture large-format printing and document management work associated with local building projects.
In addition to the AEC industry, we also provide document management and printing services to customers in the retail, technology, entertainment, and healthcare industries, among others. A significant portion of our non-AEC revenues are derived from supplying color printing services to customers with short-run, high quality, frequently updated promotional, advertising and marketing materials. We market these services under a separate brand known as Riot Creative Imaging. Likewise, our digital tools and services appeal to companies outside of the construction industry, but with similar document management needs, including manufacturers, airlines, and healthcare/hospital companies.
7
In general, we address customers based on size and geographic reach. Local markets tend to be highly fragmented with a wide variety of specialized, geographically differentiated business practices. We serve smaller customers in these markets with service offerings aligned with local market expectations. Larger regional, national and international customers often consolidate purchasing and the acquisition of services through a single corporate department, and seek centralized management of document solutions. We serve these customers through our corporate sales force called Global Solutions.
Competition
The level of competition varies in each of the areas in which we provide services. Further, we believe we are unique; that no other company provides the complete portfolio of services and products we provide. We compete with different firms in our different business lines who can provide a portion of our services. However, we do not know of any other firm that can provide a full suite of physical and digital content management services similar to our offering. We believe service levels, breadth of offering, terms and conditions, price, quality, responsiveness, and convenience to the customer are competitive elements in each of the industry segments in which we compete.
In addressing larger local and regional customers, there are several companies that provide MPS and reprographic print services, but in general these companies cannot provide or integrate software or technology that enables the digital management of documents and centralized cost control management that we provide. More specifically, in our local MPS services, we often compete against print equipment resellers. These resellers are limited to enabling customers’ print needs by selling or leasing print equipment to the customer and the customer thereby incurs a fixed cost. In comparison, our customers pay per use and take advantage of our print recovery and document management software, AbacusTM and PlanWellTM. In our CDIM services businesses, local copy shops and self-serve franchises are often aggressive competitors for printing business, but rarely offer the breadth of document management and logistics services we do.
With regard to large national and international customers, there are no other document solutions companies in the U.S. with the national presence and global reach that we have established, but we often compete against equipment manufacturers and business suppliers who offer some of the same products and services we do. Related services are offered by large printing/multifunctional device manufacturers such as Xerox, Canon, Konica Minolta, Ricoh, and Sharp, but most offerings from these companies are focused on selling equipment as opposed to ARC’s offering of comprehensive document management services for both project and enterprise documents. Further, our deep knowledge of the AEC industry document workflows, which is incorporated into our software, provides us an advantage against local printers and national equipment manufacturers.
We believe that we have a strong competitive position in the marketplace for the following reasons:
Strong domain expertise: No other national vendor/service provider possesses the document management and technology expertise that we have in the AEC market. Construction professionals have highly specialized needs in document capture, short-term storage, management, fulfillment, distribution, and archival services. We believe our domain expertise is unmatched thanks to our legacy in reprographics and software development.
Customer relationships in AEC industry: Our relationships with our local customers frequently span generations, and we do business with nearly all of the top 100 AEC companies in the U.S. In addition, our Global Solutions sales force has established long-term contract relationships with 23 of the largest 100 AEC firms. We believe this provides a competitive advantage by leveraging our success through referrals.
Service center footprint: We possess an extensive national network of service centers creating an extraordinary distribution and customer service solution that can cater to both large and small customers. We operate service centers in more than 140 cities in the U.S., and in 37 states. We also have a significant market presence in Canada and China, and growing operations in India and the U.K. We are not aware of any other provider of MPS that has as extensive a network to supplement their MPS services and provide overflow and remote document management and printing capabilities.
Equipment agnostic: We are not required to sell or use any particular brands of equipment, nor do we manufacture equipment. We are free to place the products best suited for the required task in our own service centers or in our customers’ offices, regardless of manufacturer. Additionally, with respect to our MPS Services, as our customers' document management needs evolve over their respective contract terms, we have the ability to replace the equipment previously deployed to ensure that the equipment placed at our customers' sites are best suited for the required tasks. This, combined with the competitive market for printing and imaging products, provides us with an advantage relative to MPS providers owned by equipment manufacturers.
Capabilities in a wide variety of formats: Several equipment manufacturers who also market managed print services do not produce the full range of large- and small-format equipment demanded by the AEC, manufacturing, and building industries. In addition, we are not aware of any manufacturers that provide the breadth of services and technology related to large- and small-format document production that we possess.
Unique combination of Onsite, Offsite, and Cloud-based offerings: We are the only national company that integrates (1) document production at customer sites (Onsite), (2) document production at company service centers (Offsite), and (3) digital
8
management of documents in the cloud. We have proprietary technology built by our own development team that interacts with our production machines. We believe we are the only company that both develops document management software and manages the equipment that produces documents.
Suppliers and Vendors
We purchase or lease equipment for use in our production facilities and at our customers’ sites. We also purchase paper, toner and other consumables for the operation of our and our customers’ production equipment. As a high-volume purchaser, we believe we receive favorable prices as compared to other service providers, and price increases have been historically passed on to customers.
Our primary vendors of equipment, maintenance services, and reprographics supplies include Canon Solutions America (Océ), Azerty, and Veritiv, formerly Xpedx. Purchases from these vendors during 2015 comprised approximately 37% of our total purchases of inventory and supplies. Although there are a limited number of suppliers that could supply our inventory, we believe any shortfalls from existing suppliers would be absorbed from other suppliers on comparable terms.
Research and Development
We conduct research and development to support the design and testing of new technology or enhancements and maintenance to existing technology. Such costs are expensed as incurred and primarily recorded to cost of sales. In total, research and development costs amounted to $5.8 million, $6.3 million, and $5.5 million during the fiscal years ended December 31, 2015, 2014, and 2013, respectively.
Proprietary Rights
We rely on a combination of copyright, trademark and trade secret laws, license agreements, nondisclosure and non-competition agreements, reseller agreements, customer contracts, and technical measures to establish and protect our rights in our proprietary technology. We also rely on a variety of technologies that are licensed from third parties to perform key functions.
We have registered “ARC Document Solutions,” as well as our historical name and logo, “ARC American Reprographics Company,” as service marks in the U.S. with the United States Patent and Trademark Office (USPTO). We have registered “PlanWell,” “PlanWell PDS”, "Riot Creative Imaging", "ABACUS" and "SKYSITE” as trademarks with the USPTO and in other countries. We do not own any other registered trademarks or service marks, or any patents, that are material to our business.
For a discussion of the risks associated with our proprietary rights, see Item 1A — “Risk Factors — Our failure to adequately protect the proprietary aspects of our technology, including SKYSITE, PlanWell, and Abacus, may cause us to lose market share.”
Executive Officers of the Registrant
The following sets forth certain information regarding all of our executive officers as of February 28, 2016:
Name | Age | Position | ||
Kumarakulasingam Suriyakumar | 62 | Chairman, President and Chief Executive Officer Director | ||
Jorge Avalos | 40 | Chief Financial Officer | ||
Rahul K. Roy | 56 | Chief Technology Officer | ||
Dilantha Wijesuriya | 54 | Chief Operating Officer | ||
D. Jeffery Grimes | 52 | Vice President, Senior Corporate Counsel and Corporate Secretary | ||
Kumarakulasingam (“Suri”) Suriyakumar has served as our President and Chief Executive Officer since June 1, 2007, and he served as the Company’s President and Chief Operating Officer from 1991 until his appointment as Chief Executive Officer. On July 24, 2008, Mr. Suriyakumar was appointed Chairman of our Board of Directors. Mr. Suriyakumar served as an advisor of Holdings from March 1998 until his appointment as a director of the Company in October 2004. Mr. Suriyakumar joined Micro Device, Inc. (our predecessor company) in 1989. He became the Vice President of Micro Device, Inc. in 1990. Prior to joining the Company, Mr. Suriyakumar was employed with Aitken Spence & Co. LTD, a highly diversified conglomerate and one of the five largest corporations in Sri Lanka.
Jorge Avalos was appointed Chief Financial Officer of the Company on February 1, 2015. Prior to his appointment to Chief Financial Officer, Mr. Avalos served as Chief Accounting Officer and Vice President Finance of the Company, positions he held
9
since April 14, 2011. Mr. Avalos joined the Company in June 2006 as the Company’s Director of Finance, and became the Company’s Corporate Controller in December 2006, and Vice President, Corporate Controller in December 2010. From March 2005 through June 2006, Mr. Avalos was employed with Vendare Media Group, an online network and social media company, as its controller. From September 1998 through March 2005, Mr. Avalos was employed with PricewaterhouseCoopers LLP, a global professional services firm focusing on audit and assurance, tax and advisory services.
Rahul K. Roy joined Holdings as its Chief Technology Officer in September 2000. Prior to joining the Company, Mr. Roy was the founder, President and Chief Executive Officer of MirrorPlus Technologies, Inc., which developed software for the reprographics industry, from August 1993 until it was acquired by the Company in 1999. Mr. Roy also served as the Chief Operating Officer of InPrint, a provider of printing, software, duplication, packaging, assembly and distribution services to technology companies, from 1993 until it was acquired by the Company in 1999.
Dilantha ("Dilo") Wijesuriya joined Ford Graphics, a former division of the Company, in January 1991. He subsequently became president of that division in 2001, and became a Company regional operations head in 2004, which position he retained until his appointment as the Company’s Senior Vice President, National Operations in August 2008. Mr. Wijesuriya was appointed Chief Operating Officer of the Company on February 25, 2011. Prior to his employment with the Company, Mr. Wijesuriya was a divisional manager with Aitken Spence & Co. LTD, a highly diversified conglomerate and one of the five largest corporations in Sri Lanka.
D. Jeffery Grimes was appointed Vice President, Senior Corporate Counsel and Corporate Secretary in March 2014. Prior to joining the Company, Mr. Grimes was Vice President, Legal Affairs, General Counsel and Corporate Secretary of Aradigm Corporation, a publicly traded specialty pharmaceutical company focused on the development and commercialization of drug products for severe respiratory diseases. From 2000 to 2013, Mr. Grimes worked as in-house counsel for medical device, specialty pharmaceutical, and technology companies serving in various senior corporate legal roles. Mr. Grimes received joint J.D./M.B.A. degrees and a Bachelor's degree in Finance, from University of Colorado at Boulder.
Available Information
ARC Document Solutions, Inc. uses its corporate website, www.e-arc.com, as a channel for routine distribution of important information, including news releases, analyst presentations and financial information. The information on our website is not incorporated by reference into this Annual Report on Form 10-K or in any other report or document we file with the Securities and Exchange Commission. The company files with or furnishes to the SEC Annual Reports on Form 10-K, Quarterly Reports on Form 10-Q, Current Reports on Form 8-K and any amendments to those reports, as well as proxy statements and annual reports to shareholders, and, from time to time, other documents. The reports and other documents filed with or furnished to the SEC are available to investors on or through our corporate website free of charge as soon as reasonably practicable after we electronically file them with or furnish them to the SEC. In addition, the public may read and copy any of the materials we file with the SEC at the SEC’s Public Reference Room at 100 F Street, NE, Washington D.C. 20549. The public may obtain information on the operation of the Public Reference Room by calling the SEC at 1-800-SEC-0330. The SEC maintains an internet site located at http://www.sec.gov that contains reports, proxy and information statements and other information regarding issuers, such as ARC, that file electronically with the SEC. ARC’s SEC filings and other documents pertaining to the conduct of its business can be found on the “Investors” page of its website. These documents are available in print to any shareholder who requests a copy by writing or by calling ARC Document Solutions.
Item 1A. Risk Factors
Our business faces significant risks. The following risk factors could adversely affect our results of operations and financial condition and the price of our common stock. We may encounter risks in addition to those described below. Additional risks and uncertainties not currently known to us or that we currently deem immaterial may also impair or adversely affect our results of operations and financial condition.
We are highly dependent on the architectural, engineering and construction (AEC) industry and any decline in that industry could adversely affect our future revenue and profitability.
We estimate that customers in the AEC industry accounted for approximately 77% of our net sales for the year ended December 31, 2015, therefore our results largely depend on the strength of that industry. Our historical operating results reflect the cyclical and variable nature of the AEC industry. We believe that the industry generally experiences downturns several months after a downturn in the general economy, and that there may be a similar delay in the recovery of the AEC industry following a recovery of the general economy. A downturn in the AEC industry would diminish demand for some of our products and services, and would therefore negatively affect our revenues and have a material adverse effect on our business, operating results and financial condition.
10
Adverse domestic and global economic conditions and disruption of financial and commercial real estate markets could have a material adverse effect on our business and results of operations.
A prolonged economic downturn may adversely affect the ability of our customers and suppliers to obtain financing and to perform their obligations under agreements with us. These restrictions could result in a decrease in, or cancellation of, existing business, could limit new business, and could negatively affect our ability to collect on our accounts receivable on a timely basis, if at all. These events may, in the aggregate, have a material adverse effect on our results of operations and financial condition.
Because a significant portion of our overall costs are fixed, our earnings are highly sensitive to changes in revenue.
Our network of service centers, equipment and related support activities involves substantial fixed costs which cannot be adjusted quickly to respond to declines in demand for our services. We estimate approximately 36% of our overall costs were fixed for the year ended December 31, 2015. As a consequence, our results of operations are subject to relatively high levels of volatility and our earnings could deteriorate rapidly in the face of declining revenues because our ability to reduce fixed costs in the short-term is limited. If we fail to manage our fixed costs appropriately, or to maintain adequate cash reserves to cover such costs, we may suffer material adverse effects on our results of operations and financial condition.
Impairment of goodwill may adversely affect future results of operations.
We have intangible assets, including goodwill and other identifiable acquired intangibles on our balance sheet due to prior acquisitions. At September 30, 2015, we assessed goodwill for impairment and determined that goodwill was not impaired.
The results of our impairment analysis are as of a particular point in time. If our assumptions regarding future forecasted revenue or profitability of our reporting units are not achieved, we may be required to record additional goodwill impairment charges in future periods, if any such change constitutes a triggering event prior to the quarter in which we perform our annual goodwill impairment test.
Competition in our industry and innovation by our competitors may hinder our ability to execute our business strategy and adversely affect our profitability.
The markets for our products and services are highly competitive, with competition primarily at local and regional levels. We compete primarily based on the level and quality of customer service, technological leadership, and price. Our future success depends, in part, on our ability to continue to improve our service and product offerings, and develop and integrate new technology solutions. In addition, current and prospective customers may decide to perform certain services themselves instead of outsourcing these services to us. These competitive pressures could adversely affect our sales and consolidated results of operations.
We also face the possibility that competition will continue to increase, particularly if copy and printing or business services companies choose to compete in lines of business similar to ours. Many of these companies are substantially larger and have significantly greater financial resources than us, which could place us at a competitive disadvantage. In addition, we could encounter competition in the future from large, well-capitalized companies such as equipment dealers and system integrators that can produce their own technology and leverage their existing distribution channels. Any such future competition could adversely affect our business and reduce our future revenue and profitability.
If we are unable to charge for our value-added services to offset declines in print volumes, our long-term revenue could decline.
Our customers value the ability to view and order prints over the internet and print to output devices in their own offices and other locations throughout the country and the world. In 2015, our CDIM sales, which consists of the management, distribution, and production of documents and information related to construction projects, including large-format construction drawings, black and white and color signage, specification documents, and marketing material represented approximately 52% of our total net sales, and our MPS represented approximately 34% of our total net sales. Both categories of revenue are generally derived from a charge per square foot of printed material. Future technology advances may further facilitate and improve our customers’ ability to reduce print and the associated costs thereof. As technology continues to improve, this trend toward printing on an “as needed” basis could result in further decreased printing volumes and sales decline in the longer term. Failure to offset these declines in printing volumes by changing how we charge for our services and develop additional revenue sources could significantly affect our business and reduce our long term revenue, resulting in an adverse effect on our results of operations and financial condition.
11
We derive a significant percentage of net sales from within the State of California and our business could be disproportionately harmed by an economic downturn or natural disaster affecting California.
We derived approximately 31% of our net sales in 2015 from our operations in California. As a result, we are dependent to a large extent upon the AEC industry in California and, accordingly, are sensitive to economic factors affecting AEC activity in California, including general and local economic conditions, macroeconomic trends, political factors affecting commercial and residential real estate development and natural disasters (including drought, earthquakes and wildfires). Any adverse developments affecting California could have a disproportionately negative effect on our results of operations and financial condition.
Our growth strategy depends, in part, on our ability to successfully market and execute several different, but related, service offerings. Failure to do so could impede our future growth and adversely affect our competitive position.
As part of our growth strategy, we intend to continue to offer and grow a variety of service offerings that are relatively new to the company. Our efforts will be affected by our ability to acquire new customers for our new service offerings as well as sell the new service offerings to existing customers. If we fail to procure new customers, our growth may be adversely affected and we may incur operating losses as a result of a failure to realize revenue from investments made in new service offerings.
We are dependent upon our vendors to continue to supply us equipment, parts, supplies, and services at comparable terms and price levels as the business grows.
Our access to equipment, parts, supplies, and services depends upon our relationships with, and our ability to purchase these items on competitive terms from our principal vendors. These vendors are not required to use us to distribute their equipment and are generally free to change the prices and other terms at which they sell to us. In addition, we compete with the selling efforts of some of these vendors. Significant deterioration in relationships with, or in the financial condition of, these significant vendors could have an adverse effect on our ability to sell equipment as well as our ability to provide effective service and technical support. If one of these vendors terminates or significantly curtails its relationship with us, or if one of these vendors ceases operations, we would be forced to expand our relationships with our other existing vendors or seek out new relationships with previously unused vendors.
Our failure to adequately protect the proprietary aspects of our technology, including SKYSITE®, PlanWell® and AbacusTM, may cause us to lose market share.
Our success depends on our ability to protect and preserve the proprietary aspects of our technology products. We rely on a combination of copyright, trademark and trade secret protection, confidentiality agreements, license agreements, non-competition agreements, reseller agreements, customer contracts, and technical measures to establish and protect our rights in our proprietary technologies. These protections, however, may not be adequate to remedy harm we suffer due to misappropriation of our proprietary rights by third parties. However, the laws of certain countries may not protect our proprietary rights to the same extent as the laws of the United States and we may be unable to protect our proprietary technology adequately against unauthorized third-party copying or use, which could adversely affect our competitive position. It is also possible that our intellectual property rights could be challenged, invalidated or circumvented, allowing others to use our intellectual property to our competitive detriment. We also must ensure that all of our products comply with existing and newly enacted regulatory requirements in the countries in which they are sold. Furthermore, we may, from time to time, be subject to intellectual property litigation which can be expensive, a burden on management’s time and our Company’s resources, and the outcome of any such litigation may be uncertain.
Our computer hardware, and software and telecommunications systems are susceptible to damage, breach or interruption.
The management of our business is aided by the uninterrupted operation of our computer and telecommunication systems. These systems are vulnerable to security breaches, natural disasters or other catastrophic events, computer viruses, or other interruptions or damage stemming from power outages, equipment failure or unintended usage by employees. In particular, our employees may have access or exposure to personally identifiable or otherwise confidential information and customer data and systems, the misuse of which could result in legal liability. In addition, we rely on information technology systems to process, transmit and store electronic information and to communicate among our locations around the world and with our clients, partners and consultants. The breadth and complexity of this infrastructure increases the potential risk of security breaches. Security breaches, including cyber-attacks or cyber-intrusions by computer hackers, foreign governments, cyber terrorists or others with grievances against the industry in which we operate or us in particular, may disable or damage the proper functioning of our networks and systems. It is possible that our security controls over personal and other data may not prevent unauthorized access to, or destruction, loss, theft, misappropriation or release of personally identifiable or other proprietary, confidential, sensitive or valuable information of ours or others; this access could lead to potential unauthorized disclosure of confidential Company or client information that others could use to compete against us or for other disruptive, destructive or harmful purposes and outcomes. Any such disclosure or damage to our networks and systems could subject us to third party claims against us and reputational
12
harm. If these events occur, our ability to attract new clients may be impaired or we may be subjected to damages or penalties. In addition, system-wide or local failures of these information technology systems could have a material adverse effect on our business, financial condition, results of operations or cash flows.
In performing our document management services, we handle customers’ confidential information. Our failure to protect our customers’ confidential information against security breaches could damage our reputation, harm our business and adversely affect our results of operations.
Our document management services involve the handling of our customers’ confidential information. Any compromise of security, accidental loss or theft of customer data in our possession could damage our reputation and expose us to risk of liability, which could harm our business and adversely affect our consolidated results of operation.
Added risks are associated with our international operations.
We have international operations in China, India, the United Kingdom, Canada, Hong Kong and Australia. Approximately 15% of our revenues for fiscal 2015 were derived from our international operations, with approximately 7% derived from China. Our future revenues, costs of operations and net income could be adversely affected by a number of factors related to our international operations, including changes in economic conditions from country to country, currency fluctuations, changes in a country’s political condition, trade protection measures, licensing and other legal requirements and local tax issues.
A large percentage of our cash and cash equivalents are held outside of the United States, and we could be subject to repatriation delays and costs which could reduce our financial flexibility.
A large percentage of our cash and cash equivalents are currently held outside the United States. Repatriation of some of the funds could be subject to delay for local country approvals and could have potential adverse tax consequences. As a result of holding cash and cash equivalents outside of the U.S., our financial flexibility may be reduced.
Our business could suffer if we fail to attract, retain, and successfully integrate skilled personnel.
We believe that our ability to attract, retain, and successfully integrate qualified personnel is critical to our success. As we continue to place more emphasis on document management and storage technology, our need to hire and retain software and other technology focused personnel has and can be expected to continue to increase. Competition for such personnel, particularly in the San Francisco Bay Area, is intense. If we lose key personnel and/or are unable to recruit qualified personnel, our ability to manage and grow our business will be adversely affected. In addition, the loss of the services of one or more members of our senior management team would disrupt our business and impede our ability to successfully execute our business strategy.
The market prices of our common stock may be volatile, which could cause the value of an investment in our stock to decline.
The market price of our common stock may fluctuate substantially due to a variety of factors, many of which are beyond our control. Between January 1, 2015 and December 31, 2015, the closing price of our common stock has fluctuated from a low of $4.26 to a high of $10.42 per share. Factors that may contribute to fluctuations in the market prices of our common stock include:
•failure to sustain an active, liquid trading market for our shares;
• | changes in financial estimates or recommendations by securities analysts or failure to meet analysts' performance expectations; |
•changes in market valuations of similar companies;
•changes in our capital structure, such as future issuances of securities or the incurrence of debt;
•sales of our capital stock by our directors or executive officers;
•the gain or loss of significant customers;
• | actual or anticipated developments in our business or our competitors' businesses, such as announcements by us or our competitors of significant contracts, acquisitions or strategic alliances, or in the competitive landscape generally; |
•litigation involving us, our industry or both;
•additions or departures of key personnel;
13
•investors' general perception of us;
•our stock repurchase program; and
•changes in general economic, industry and market conditions.
The stock markets in general have experienced substantial volatility that has often been unrelated to the operating performance of particular companies. These types of broad market fluctuations may adversely affect the trading price of our common stock.
In the past, stockholders have sometimes instituted securities class action litigation against companies following periods of volatility in the market price of their securities. Any similar litigation against us could result in substantial costs, divert management's attention as well as our other resources and could have a material adverse effect on our business, results of operations and financial condition.
Damage or disruption to our facilities, including our technology center, could impair our ability to effectively provide our services and may have a significant effect on our revenues, expenses and financial condition.
Our IT systems are an important part of our operations. We currently store customer data at servers hosted by Amazon and at our technology center located in Silicon Valley near known earthquake fault zones. Although we have redundant systems and offsite backup procedures in place, interruption in service, damage to or destruction of our technology center or a disruption of our data storage processes resulting from sustained process abnormalities, human error, acts of terrorism, violence, war or a natural disaster, such as fire, earthquake or flood, could result in delays, in reduced levels of customer service and have a material adverse effect on the markets in which we operate and on our business operations.
Although we currently maintain general property damage insurance, if we incur losses from uninsured events, we could incur significant expenses which would adversely affect our results of operations and financial condition.
Results of tax examinations may adversely affect our future results of operations.
We are subject to various tax examinations on an ongoing basis. Adverse results of tax examinations for income, payroll, value added, sales-based and other taxes may require future material tax payments if we are unable to sustain our position with the relevant jurisdiction. Where appropriate, we have made accruals for these matters which are reflected in our Consolidated Balance Sheets and Statements of Operations.
Our debt instruments impose certain restrictions on our ability to operate which in turn could negatively affect our ability to respond to business and market conditions and therefore could have adverse effect on our business and results of operations.
As of December 31, 2015, we had $173.0 million in outstanding short and long-term borrowings under term loans, lines of credit, and capital leases, excluding trade payables. The terms of the agreements under which this indebtedness was incurred may limit or restrict, among other things, our ability to incur certain additional debt, make certain restricted payments, consummate certain asset sales, and enter into certain transactions with affiliates.
We are also required to maintain specified financial ratios, including leverage and fixed charge coverage ratios, as outlined in our Term A Credit Agreement. Our inability to meet these ratios could result in the acceleration of the repayment of the related debt, the termination of our revolving line of credit, the increase in our effective cost of funds or the cross-default of other credit arrangements. As a result, our ability to operate may be restricted and our ability to respond to business and market conditions may be limited, which could have an adverse effect on our business and operating results.
We may be exposed to employment-related claims and costs and periodic litigation that could adversely affect our business and results of operations.
We are subject to a number of risks inherent to our status as an employer including without limitation:
• | claims of misconduct or negligence on the part of our employees, discrimination or harassment claims against our employees, or claims by our employees of discrimination or harassment by our clients; |
• | claims relating to violations of wage, hour and other workplace regulations; |
• | claims relating to employee benefits, entitlements to employee benefits, or errors in the calculation or administration of such benefits; and |
14
• | possible claims relating to misuse of customer confidential information, misappropriation of assets or other similar claims. |
If we experience significant incidents involving any of the above-described risk areas we could face substantial out-of-pocket losses, or fines. In addition, such claims may give rise to litigation, which may be time consuming, distracting and costly, and could have a material adverse effect on our business.
We cannot guarantee that our recently announced stock repurchase program will be fully consummated or that our stock repurchase program will enhance long-term shareholder value, and stock repurchases could increase the volatility of the price of our stock.
In February 2016, our board of directors authorized us to repurchase up to $15.0 million of the Company's common stock. Although our board of directors has authorized a stock repurchase program, the stock repurchase program does not obligate the Company to repurchase any specific dollar amount or to acquire any specific number of shares. The stock repurchase program could affect the price of our stock and increase volatility and may be suspended or terminated at any time, which may result in a decrease in the trading price of our stock. For example, the existence of a stock repurchase program could cause our stock price to be higher than it would be in the absence of such a program and could potentially reduce the market liquidity for our stock. Additionally, our stock repurchase program could diminish our cash reserves, which may impact our ability to finance future growth and to pursue possible future strategic opportunities and acquisitions. There can be no assurance that any stock repurchases will enhance stockholder value because the market price of our common stock may decline below the levels at which we determine to repurchase our stock. Although our stock repurchase program is intended to enhance long-term stockholder value, there is no assurance that it will do so and short-term stock price fluctuations could reduce the program’s effectiveness. The amount of stock we are permitted to repurchase is also limited by the terms of our Credit Facility.
Item 1B. Unresolved Staff Comments
None.
Item 2. Properties
At the end of 2015, we operated 177 service centers, of which 156 were in the United States, 9 were in Canada, 10 were in China, 1 was in London, England and 1 was in India. We also occupied technology centers in Silicon Valley, California and Kolkata, India, as well as other facilities, including our executive offices located in Walnut Creek, California.
In total the Company occupied approximately 1.2 million square feet as of December 31, 2015.
We lease nearly all of our service centers, each of our administrative facilities and our technology centers. The two facilities that we own are subject to liens under our credit agreement. In addition to the facilities that are owned, our fixed assets are comprised primarily of machinery and equipment, vehicles, and computer equipment. We believe that our facilities are adequate and appropriate for the purposes for which they are currently used in our operations and are well maintained.
Item 3. Legal Proceedings
On October 21, 2010, a former employee, individually and on behalf of a purported class consisting of all non-exempt employees who work or worked for American Reprographics Company, L.L.C. and American Reprographics Company in the State of California at any time from October 21, 2006 through the present, filed an action against the Company in the Superior Court of California for Orange County. The complaint alleges, among other things, that the Company violated the California Labor Code by failing to (i) provide meal and rest periods, or compensation in lieu thereof, (ii) timely pay wages due at termination, and (iii) that those practices also violate the California Business and Professions Code. The relief sought includes damages, restitution, penalties, interest, costs, and attorneys’ fees and such other relief as the court deems proper. On March 15, 2013, the Company participated in a private mediation session with claimants’ counsel which did not result in resolution of the claim. Subsequent to the mediation session, the mediator issued a proposal that was accepted by both parties. The Company has received preliminary court approval of the settlement, and awaits final court approval. The Company has a liability of $0.9 million as of December 31, 2015 related to the claim, which represents management's best estimate based on information available.
On February 1, 2013, ARC filed a civil complaint against a competitor and a former employee in the Superior Court of California for Orange County, which alleged, among other claims, the misappropriation of ARC trade secrets; namely, proprietary
15
customer lists that were used to communicate with ARC customers in an attempt to unfairly acquire their business. In prior litigation with the competitor based on related facts, in 2007 the competitor entered into a settlement agreement and stipulated judgment, which included an injunction. ARC instituted this suit to stop the defendant from using similar unfair business practices against it in the Southern California market. The case proceeded to trial in May 2014, and a jury verdict was entered for the defendants. In the first quarter of 2015, the Company settled with the defendants and paid $1.0 million, which had been accrued as of December 31, 2014.
In addition to the matters described above, the Company is involved in various additional legal proceedings and other legal matters from time to time in the normal course of business. The Company does not believe that the outcome of any of these matters will have a material effect on its consolidated financial position, results of operations or cash flows.
Item 4. Mine Safety Disclosures
Not applicable.
16
PART II
Item 5. Market for Registrant’s Common Equity, Related Stockholder Matters and Issuer Purchases of Equity Securities
Our common stock, par value $0.001, is listed on the New York Stock Exchange (“NYSE”) under the stock symbol “ARC”. The following table sets forth for the fiscal periods indicated the high and low sales prices per share of our common stock as reported by the NYSE.
2015 | 2014 | |||||||||||||||
High | Low | High | Low | |||||||||||||
First Quarter | $ | 10.42 | $ | 8.00 | $ | 8.51 | $ | 6.59 | ||||||||
Second Quarter | $ | 9.38 | $ | 6.90 | $ | 7.92 | $ | 5.67 | ||||||||
Third Quarter | $ | 7.80 | $ | 5.04 | $ | 8.30 | $ | 5.40 | ||||||||
Fourth Quarter | $ | 6.77 | $ | 4.26 | $ | 10.67 | $ | 8.10 | ||||||||
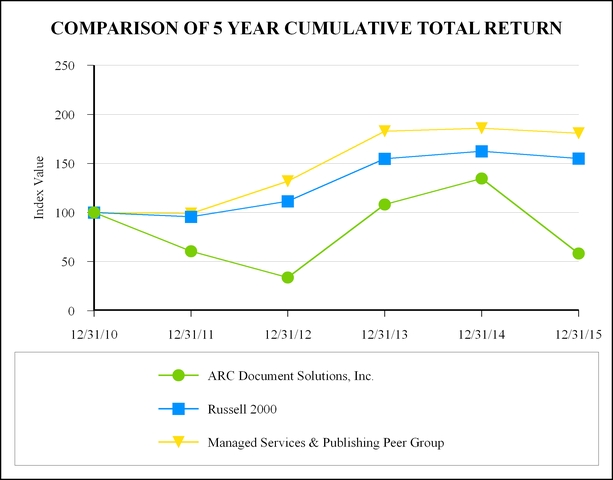
Performance Graph
The following graph compares the cumulative 5-year total return to shareholders of ARC Document Solutions’ common stock relative to the cumulative total returns of (a) the Russell 2000 index, (b) a customized peer group of 13 companies identified as: (1) having a business-to-business focus, (2) offering outsourced/managed services, (3) having a digital or technology service that is significant to their customer offering, and (4) involved in print publishing.
The graph assumes that the value of the investment in the company’s common stock, in the peer group, and the index (including reinvestment of dividends) was $100 on December 31, 2010 and tracks it through December 31, 2015.
17
2010 | 2011 | 2012 | 2013 | 2014 | 2015 | |||||||||||||
ARC Document Solutions, Inc. | 100.00 | 60.47 | 33.73 | 108.30 | 134.65 | 58.23 | ||||||||||||
Russell 2000 | 100.00 | 95.82 | 111.49 | 154.78 | 162.35 | 155.18 | ||||||||||||
Managed Services & Publishing Peer Group | 100.00 | 99.07 | 131.81 | 182.73 | 185.83 | 180.89 | ||||||||||||
The stock price performance included in the graph above is not necessarily indicative of future stock price performance.
Holders
As of February 23, 2016, the approximate number of stockholders of record of our common stock was 120, and the closing price of our common stock was $3.74 per share as reported by the NYSE. Because many of the shares of our common stock are held by brokers and other institutions on behalf of stockholders, we are unable to estimate the total number of beneficial owners represented by these stockholders of record.
Dividends
We have never declared or paid cash dividends on our common stock. We currently intend to retain all available funds and any future earnings for use in the operation of our business and do not anticipate paying any cash dividends in the foreseeable future. Any future determination to declare cash dividends will be made at the discretion of our board of directors, subject to compliance with Delaware corporate law, certain covenants under our debt instruments which restrict or limit our ability to declare or pay dividends, and will depend on our financial condition, results of operations, capital requirements, general business conditions, and other factors that our board of directors may deem relevant.
Securities Authorized for Issuance Under Equity Compensation Plans
Information regarding the securities authorized for issuance under our equity compensation plans can be found under Item 12 of this Annual Report on Form 10-K.
Issuer Purchases of Equity Securities
On February 8, 2016, we announced that the Company's Board of Directors had approved a stock repurchase program that authorizes the Company to purchase up to $15.0 million of the Company's outstanding common stock through December 31, 2017. Under the repurchase program, purchases of shares of common stock may be made from time to time in the open market, or in privately negotiated transactions, in compliance with applicable state and federal securities laws. The timing and amounts of any purchases will be based on market conditions and other factors including price, regulatory requirements, and capital availability. The stock repurchase program does not obligate the company to acquire any specific number of shares in any period, and may be expanded, extended, modified or discontinued at any time without prior notice.
18
Item 6. Selected Financial Data
The selected historical financial data presented below is derived from the audited consolidated financial statements of ARC Document Solutions for the fiscal years ended December 31, 2015, 2014, 2013, 2012, and 2011. The selected historical financial data does not purport to represent what our financial position or results of operations might be for any future period or date. The financial data set forth below should be read in conjunction with “Management’s Discussion and Analysis of Financial Condition and Results of Operations” and our audited consolidated financial statements included elsewhere in this report.
Year Ended December 31, | ||||||||||||||||||||
2015 | 2014 | 2013 | 2012 | 2011 | ||||||||||||||||
(In thousands) | ||||||||||||||||||||
Statement of Operations Data: | ||||||||||||||||||||
Service Sales | $ | 378,638 | $ | 371,884 | $ | 355,358 | $ | 350,260 | $ | 368,213 | ||||||||||
Equipment and Supplies Sales | 50,027 | 51,872 | 51,837 | 55,858 | 54,519 | |||||||||||||||
Total net sales | 428,665 | 423,756 | 407,195 | 406,118 | 422,732 | |||||||||||||||
Cost of sales | 280,541 | 279,478 | 272,858 | 282,599 | 288,434 | |||||||||||||||
Gross profit | 148,124 | 144,278 | 134,337 | 123,519 | 134,298 | |||||||||||||||
Selling, general and administrative expenses | 107,280 | 107,672 | 96,800 | 93,073 | 101,315 | |||||||||||||||
Amortization of intangibles | 5,642 | 5,987 | 6,612 | 11,035 | 18,715 | |||||||||||||||
Goodwill impairment | — | — | — | 16,707 | 65,444 | |||||||||||||||
Restructuring expense | 89 | 777 | 2,544 | 3,320 | — | |||||||||||||||
Income (loss) from operations | 35,113 | 29,842 | 28,381 | (616 | ) | (51,176 | ) | |||||||||||||
Other income, net | (99 | ) | (96 | ) | (106 | ) | (100 | ) | (103 | ) | ||||||||||
Loss on early extinguishment of debt | 282 | 5,599 | 16,339 | — | — | |||||||||||||||
Interest expense, net | 6,974 | 14,560 | 23,737 | 28,165 | 31,104 | |||||||||||||||
Income (loss) before income tax (benefit) provision | 27,956 | 9,779 | (11,589 | ) | (28,681 | ) | (82,177 | ) | ||||||||||||
Income tax (benefit) provision | (69,432 | ) | 2,348 | 2,986 | 2,784 | 50,931 | ||||||||||||||
Net income (loss) | 97,388 | 7,431 | (14,575 | ) | (31,465 | ) | (133,108 | ) | ||||||||||||
(Income) loss attributable to noncontrolling interest | (348 | ) | (156 | ) | (748 | ) | (503 | ) | 21 | |||||||||||
Net income (loss) attributable to ARC Document Solutions | $ | 97,040 | $ | 7,275 | $ | (15,323 | ) | $ | (31,968 | ) | $ | (133,087 | ) | |||||||
Year Ended December 31, | ||||||||||||||||||||
2015 | 2014 | 2013 | 2012 | 2011 | ||||||||||||||||
(In thousands, except per share amounts) | ||||||||||||||||||||
Earnings (loss) per share attributable to ARC shareholders: | ||||||||||||||||||||
Basic | $ | 2.08 | $ | 0.16 | $ | (0.33 | ) | $ | (0.70 | ) | $ | (2.93 | ) | |||||||
Diluted | $ | 2.04 | $ | 0.15 | $ | (0.33 | ) | $ | (0.70 | ) | $ | (2.93 | ) | |||||||
Weighted average common shares outstanding: | ||||||||||||||||||||
Basic | 46,631 | 46,245 | 45,856 | 45,668 | 45,401 | |||||||||||||||
Diluted | 47,532 | 47,088 | 45,856 | 45,668 | 45,401 | |||||||||||||||
19
Year Ended December 31, | ||||||||||||||||||||
2015 | 2014 | 2013 | 2012 | 2011 | ||||||||||||||||
(In thousands) | ||||||||||||||||||||
Other Financial Data: | ||||||||||||||||||||
Depreciation and amortization | $ | 33,661 | $ | 34,135 | $ | 34,745 | $ | 39,522 | $ | 47,876 | ||||||||||
Capital expenditures | $ | 14,245 | $ | 13,269 | $ | 18,191 | $ | 20,348 | $ | 15,553 | ||||||||||
Interest expense, net | $ | 6,974 | $ | 14,560 | $ | 23,737 | $ | 28,165 | $ | 31,104 | ||||||||||
As of December 31, | ||||||||||||||||||||
2015 | 2014 | 2013 | 2012 | 2011 | ||||||||||||||||
(In thousands) | ||||||||||||||||||||
Balance Sheet Data: | ||||||||||||||||||||
Cash and cash equivalents | $ | 23,963 | $ | 22,636 | $ | 27,362 | $ | 28,021 | $ | 25,437 | ||||||||||
Total assets | $ | 476,124 | $ | 414,068 | $ | 409,922 | $ | 415,839 | $ | 441,357 | ||||||||||
Long term obligations | $ | 197,315 | $ | 212,837 | $ | 233,058 | $ | 241,429 | $ | 240,900 | ||||||||||
Total ARC stockholders’ equity | $ | 202,114 | $ | 102,775 | $ | 91,690 | $ | 103,896 | $ | 130,677 | ||||||||||
Working capital | $ | 40,031 | $ | 20,664 | $ | 28,705 | $ | 40,650 | $ | 40,405 | ||||||||||
20
Item 7. Management’s Discussion and Analysis of Financial Condition and Results of Operations
The following discussion should be read in conjunction with the other sections of this Annual Report on Form 10-K, including Part 1, “Item 1 — Business”; Part I, “Item 1A — Risk Factors”; Part II, “Item 6 — Selected Financial Data”; and Part II, “Item 8 — Financial Statements and Supplementary Data.”
Business Summary
ARC Document Solutions, Inc. (“ARC Document Solutions,” “ARC,” “we,” “us,” or “our”) is the nation's leading document solutions provider for the architectural, engineering and construction (“AEC”) industry while also providing document solutions to businesses of all types.
Our customers need us to manage the scale, complexity and workflow of their documents. We help them reduce their costs and increase their efficiency by improving their access and control over documents, and we offer a wide variety of ways to produce, distribute, collaborate on, and store documents.
Each of our service offerings is enabled through a suite of supporting proprietary technology and a wide variety of value-added services. In an effort to more closely align our financial presentation to how we market our services and products to our customers, during the first quarter of 2015, we re-categorized our offerings to better report distinct sales recognized from Construction Document Information Management ("CDIM"), Managed Print Services ("MPS"), Archiving and Information Management ("AIM"), and Equipment and Supplies Sales. MPS is a new categorization of sales, which combines our previously reported Onsite Services sales with sales generated from the servicing of equipment, which was previously included in Traditional Reprographics. In addition, sales generated from our AIM services were split out from our previously reported Digital Services category and presented separately. The remaining sales generated from Traditional Reprographics, Color Services and Digital Services were combined into CDIM. Equipment and Supplies sales remained unchanged. We believe the updated presentation of our sales categories reflects the drivers of our consolidated sales and will provide greater insight into the opportunities and risk diversification provided by our portfolio of service and product offerings.
As noted above, we have categorized our service and product offerings to report distinct sales recognized from:
Construction Document and Information Management (CDIM), which consists of the management, distribution, and production of documents and information related to construction projects, including large-format construction drawings (frequently referred to as “blueprints”), black and white and color signage, specification documents, and marketing material. Primary services include document management, digital document distribution, and black and white and color document production. CDIM services can be managed by our customers through a number of digital tools and services including ARC's SKYSITE™ application, a cloud-based construction document management solution. CDIM sales are driven by the volume of construction and other project-related activity in our local, regional and national markets.
Managed Print Services (MPS), which consists of placement, management, and optimization of print and imaging equipment in our customers' offices, job sites, and other facilities. MPS relieves our customers of the burden of owning and managing print devices and print networks, and shifts their costs to a “per-use” basis. MPS is supported by our proprietary technology, Abacus™, which allows our customers to capture, control, manage, print, and account for their documents. Primary services include the assumption of existing equipment, new equipment placement, and print infrastructure optimization. MPS sales growth is driven by the ongoing print needs of our customers at their facilities, and represents contracted, recurring revenue.
Archiving and Information Management (AIM), which consists of services that facilitate the capture, management, access, workflow and use of documents and information that have been produced in the past. AIM services are enabled by our proprietary technology, PlanWell® Archive. Primary services include the digital capture of hardcopy and digital documents, programming the organization and workflow of such documents, and their cloud-based storage and maintenance. AIM sales are driven by the need to leverage past intellectual property for present or future use, improve business process automation, facilitate cost savings over current hardcopy and digital storage methods, as well as comply with regulatory and records retention requirements.
Equipment and Supplies, which consists of reselling printing, imaging, and related equipment to customers primarily in the AEC industry.
We have expanded our business beyond the services we traditionally provided to the AEC industry in the past and are currently focused on growing MPS, AIM and CDIM, as we believe the mix of services demanded by the AEC industry continues to shift toward document management at customer locations and in the cloud (represented primarily by our MPS and AIM revenues), and away from its historical emphasis on large-format construction drawings produced “offsite” in our service centers (represented primarily by our historical Traditional Reprographics revenues). Based on growth percentage AIM is our fastest-growing service offering and has grown 22.2% in 2015 as compared to 2014. Based on absolute dollars MPS is our largest growth service offering and has grown $2.9 million, or 2.1% in 2015 as compared to 2014.
21
We deliver our services via the cloud, through a nationwide network of service centers, regionally-based technical specialists, locally-based sales executives, and a national/regional sales force known as Global Solutions.
Acquisition activity during the last three years has been minimal and did not materially affect our overall business.
We believe we offer a distinct portfolio of services within the AEC industry, though non-AEC clients continue to show significant interest in many of our offerings. Based on our analysis of our operating results, we estimate that sales to the AEC industry accounted for approximately 77% of our net sales for the year ended December 31, 2015, with the remaining 23% consisting of sales to non-AEC industries.
We identify operating segments based on the various business activities that earn revenue and incur expense. Our operating results are reviewed by the Company's Chief Executive Officer, who is our Company's chief operating decision maker. Since our operating segments have similar products and services, classes of customers, production processes, distribution methods and economic characteristics, we have a single reportable segment. See Note 2 “Summary of Significant Accounting Policies” for further information.
Costs and Expenses.
Our cost of sales consists primarily of materials (paper, toner and other consumables), labor, and “indirect costs” which consist primarily of equipment expenses related to our MPS contracts and our service center facilities. Facilities and equipment expenses include maintenance, repairs, rents, insurance, and depreciation. Paper is the largest component of our material cost; however, paper pricing typically does not significantly affect our operating margins due, in part, to our efforts to pass increased costs on to our customers. We closely monitor material cost as a percentage of net sales to measure volume and waste. We also track labor utilization, or net sales per employee, to measure productivity and determine staffing levels.
We maintain low levels of inventory. Historically, our capital expenditure requirements have varied due to the cost and availability of capital lease lines of credit. Our relationships with credit providers have provided attractive lease rates over the past two years, and as a result, we chose to lease rather than purchase equipment in a significant portion of our engagements.
Research and development costs consist mainly of the salaries, leased building space, and computer equipment that comprises our data storage and development centers in Fremont, California and Kolkata, India. Such costs are primarily recorded to cost of sales.
We believe customers are increasingly (1) adopting technology and digital document management practices, and (2) changing their workflow patterns to reduce their hardcopy document and printing needs. We saw the first material evidence of this in 2012. While there were indications that the non-residential construction market strengthened in 2012, by the third quarter we felt that Traditional Reprographics sales would not likely recover at the same pace due to the factors listed above. To ensure that the Company’s costs and resources were in line with demand for our then-current portfolio of services and products, management initiated a restructuring plan in October of 2012 that was completed by the fourth quarter of 2013. The restructuring plan included the closure or downsizing of 33 of the Company’s service centers in 2012, which represented more than 10% of our total number of service center locations, and an additional 23 service centers in 2013. In addition, as part of the restructuring plan, we reduced headcount and middle management associated with our service center locations, streamlined the senior operational management team, and allocated more resources into growing sales categories such as MPS and AIM. The reduction in the then current headcount totaled approximately 300 full-time employees, which represented approximately 10% of our total workforce.
Non-GAAP Financial Measures.
EBIT, EBITDA and related ratios presented in this report are supplemental measures of our performance that are not required by or presented in accordance with accounting principles generally accepted in the United States of America (“GAAP”). These measures are not measurements of our financial performance under GAAP and should not be considered as alternatives to net income, income from operations, or any other performance measures derived in accordance with GAAP or as an alternative to cash flows from operating, investing or financing activities as a measure of our liquidity.
EBIT represents net income before interest and taxes. EBITDA represents net income before interest, taxes, depreciation and amortization. EBIT margin is a non-GAAP measure calculated by dividing EBIT by net sales. EBITDA margin is a non-GAAP measure calculated by dividing EBITDA by net sales.
We have presented EBIT, EBITDA and related ratios because we consider them important supplemental measures of our performance and liquidity. We believe investors may also find these measures meaningful, given how our management makes use of them. The following is a discussion of our use of these measures.
22
We use EBIT and EBITDA to measure and compare the performance of our operating segments. Our operating segments’ financial performance includes all of the operating activities except debt and taxation which are managed at the corporate level for U.S. operating segments. As a result, we believe EBIT is the best measure of operating segment profitability and the most useful metric by which to measure and compare the performance of our operating segments. We use EBITDA to measure performance for determining consolidated-level compensation. In addition, we use EBIT and EBITDA to evaluate potential acquisitions and potential capital expenditures.
EBIT, EBITDA and related ratios have limitations as analytical tools, and should not be considered in isolation, or as a substitute for analysis of our results as reported under GAAP. Some of these limitations are as follows:
•They do not reflect our cash expenditures, or future requirements for capital expenditures and contractual commitments;
•They do not reflect changes in, or cash requirements for, our working capital needs;
• | They do not reflect the significant interest expense, or the cash requirements necessary, to service interest or principal payments on our debt; |
• | Although depreciation and amortization are non-cash charges, the assets being depreciated and amortized will often have to be replaced in the future, and EBITDA does not reflect any cash requirements for such replacements; and |
• | Other companies, including companies in our industry, may calculate these measures differently than we do, limiting their usefulness as comparative measures. |
Because of these limitations, EBIT, EBITDA, and related ratios should not be considered as measures of discretionary cash available to us to invest in business growth or to reduce our indebtedness. We compensate for these limitations by relying primarily on our GAAP results and using EBIT, EBITDA and related ratios only as supplements.
Our presentation of adjusted net income, adjusted EBITDA, and adjusted cash flows from operations over certain periods is an attempt to provide meaningful comparisons to our historical performance for our existing and future investors. The unprecedented changes in our end markets over the past several years have required us to take measures that are unique in our history and specific to individual circumstances. Comparisons inclusive of these actions make normal financial and other performance patterns difficult to discern under a strict GAAP presentation. Each non-GAAP presentation, however, is explained in detail in the reconciliation tables below.
Specifically, we have presented adjusted net income attributable to ARC and adjusted earnings per share attributable to ARC shareholders for the years ended December 31, 2015, 2014 and 2013 to reflect the exclusion of loss on extinguishment of debt, restructuring expense, trade secret litigation costs, and changes in the valuation allowances related to certain deferred tax assets and other discrete tax items. We have presented adjusted cash flows from operating activities for the years ended December 31, 2015, 2014 and 2013 to reflect the exclusion of cash payments related to trade secret litigation costs, cash payments related to restructuring expenses, and the receipt of a federal income tax refund in 2013 related to the Company's 2009 consolidated federal income tax return. This presentation facilitates a meaningful comparison of our operating results for the years ended December 31, 2015, 2014 and 2013. We believe these charges were the result of the current macroeconomic environment, our capital restructuring, or other items which are not indicative of our actual operating performance.
We have presented adjusted EBITDA for the years ended December 31, 2015, 2014 and 2013 to exclude loss on extinguishment of debt, trade secret litigation costs, stock-based compensation expense, and restructuring expense. The adjustment of EBITDA for these items is consistent with the definition of adjusted EBITDA in our credit agreement; therefore, we believe this information is useful to investors in assessing our financial performance.
23
The following is a reconciliation of cash flows provided by operating activities to EBIT, EBITDA, and net income (loss) attributable to ARC Document Solutions, Inc. shareholders:
Year Ended December 31, | |||||||||||
(In thousands) | 2015 | 2014 | 2013 | ||||||||
Cash flows provided by operating activities | $ | 59,981 | $ | 50,012 | $ | 46,798 | |||||
Changes in operating assets and liabilities, net of effect of business acquisitions | 4,905 | 4,438 | (2,388 | ) | |||||||
Non-cash expenses, including depreciation, amortization and restructuring | 32,502 | (47,019 | ) | (58,985 | ) | ||||||
Income tax (benefit) provision | (69,432 | ) | 2,348 | 2,986 | |||||||
Interest expense, net | 6,974 | 14,560 | 23,737 | ||||||||
Income attributable to the noncontrolling interest | (348 | ) | (156 | ) | (748 | ) | |||||
EBIT | 34,582 | 24,183 | 11,400 | ||||||||
Depreciation and amortization | 33,661 | 34,135 | 34,745 | ||||||||
EBITDA | 68,243 | 58,318 | 46,145 | ||||||||
Interest expense, net | (6,974 | ) | (14,560 | ) | (23,737 | ) | |||||
Income tax benefit (provision) | 69,432 | (2,348 | ) | (2,986 | ) | ||||||
Depreciation and amortization | (33,661 | ) | (34,135 | ) | (34,745 | ) | |||||
Net income (loss) attributable to ARC Document Solutions, Inc. shareholders | $ | 97,040 | $ | 7,275 | $ | (15,323 | ) | ||||
24
The following is a reconciliation of net income (loss) attributable to ARC Document Solutions, Inc. to EBIT, EBITDA and adjusted EBITDA:
Year Ended December 31, | |||||||||||
(In thousands) | 2015 | 2014 | 2013 | ||||||||
Net income (loss) attributable to ARC Document Solutions, Inc. shareholders | $ | 97,040 | $ | 7,275 | $ | (15,323 | ) | ||||
Interest expense, net | 6,974 | 14,560 | 23,737 | ||||||||
Income tax (benefit) provision | (69,432 | ) | 2,348 | 2,986 | |||||||
EBIT | 34,582 | 24,183 | 11,400 | ||||||||
Depreciation and amortization | 33,661 | 34,135 | 34,745 | ||||||||
EBITDA | 68,243 | 58,318 | 46,145 | ||||||||
Loss on extinguishment of debt | 282 | 5,599 | 16,339 | ||||||||
Trade secret litigation costs(1) | 34 | 3,766 | — | ||||||||
Restructuring expense | 89 | 777 | 2,544 | ||||||||
Stock-based compensation | 3,512 | 3,802 | 3,207 | ||||||||
Adjusted EBITDA | $ | 72,160 | $ | 72,262 | $ | 68,235 | |||||
(1) On February 1, 2013, we filed a civil complaint against a competitor and a former employee in the Superior Court of California for Orange County, which alleged, among other claims, the misappropriation of ARC trade secrets; namely, proprietary customer lists that were used to communicate with ARC customers in an attempt to unfairly acquire their business. In prior litigation with the competitor based on related facts, in 2007 the competitor entered into a settlement agreement and stipulated judgment, which included an injunction. We instituted this suit to stop the defendant from using similar unfair business practices against us in the Southern California market. The case proceeded to trial in May 2014, and a jury verdict was entered for the defendants. In the first quarter of 2015, we entered into a settlement and paid the defendant. Legal fees associated with the litigation were recorded as selling, general and administrative expense.
The following is a reconciliation of cash flows provided by operating activities to adjusted cash flows provided by operating activities:
Year Ended December 31, | |||||||||||
(In thousands) | 2015 | 2014 | 2013 | ||||||||
Cash flows provided by operating activities | $ | 59,981 | $ | 50,012 | $ | 46,798 | |||||
Payments related to trade secret litigation costs | 1,033 | 2,744 | — | ||||||||
Payments related to restructuring expenses | 165 | 1,203 | 4,304 | ||||||||
Receipt of federal income tax refund(1) | — | — | (3,762 | ) | |||||||
Adjusted cash flows provided by operating activities | $ | 61,179 | $ | 53,959 | $ | 47,340 | |||||
(1) In March 2013, ARC received a federal income tax refund of $3.8 million related to its 2009 consolidated federal income tax return.
25
The following is a reconciliation of net income (loss) margin attributable to ARC to EBIT margin, EBITDA margin and adjusted EBITDA margin:
Year Ended December 31, | |||||||||
2015 (1) | 2014 | 2013 (1) | |||||||
Net income (loss) margin attributable to ARC | 22.6 | % | 1.7 | % | (3.8 | )% | |||
Interest expense, net | 1.6 | 3.4 | 5.8 | ||||||
Income tax (benefit) provision | (16.2 | ) | 0.6 | 0.7 | |||||
EBIT margin | 8.1 | 5.7 | 2.8 | ||||||
Depreciation and amortization | 7.9 | 8.1 | 8.5 | ||||||
EBITDA margin | 15.9 | 13.8 | 11.3 | ||||||
Loss on extinguishment of debt | 0.1 | 1.3 | 4.0 | ||||||
Trade secret litigation costs | — | 0.9 | — | ||||||
Restructuring expense | — | 0.2 | 0.6 | ||||||
Stock-based compensation | 0.8 | 0.9 | 0.8 | ||||||
Adjusted EBITDA margin | 16.8 | % | 17.1 | % | 16.8 | % | |||
(1) | Column does not foot due to rounding. |
The following is a reconciliation of net income (loss) attributable to ARC Document Solutions, Inc. to adjusted net income attributable to ARC Document Solutions, Inc.:
Year Ended December 31, | ||||||||||||
(In thousands, except per share amounts) | 2015 | 2014 | 2013 | |||||||||
Net income (loss) attributable to ARC Document Solutions, Inc. | $ | 97,040 | $ | 7,275 | $ | (15,323 | ) | |||||
Loss on extinguishment of debt | 282 | 5,599 | 16,339 | |||||||||
Restructuring expense | 89 | 777 | 2,544 | |||||||||
Trade secret litigation costs | 34 | 3,766 | — | |||||||||
Income tax benefit related to above items | (158 | ) | (3,953 | ) | (7,667 | ) | ||||||
Deferred tax valuation allowance and other discrete tax items | (80,513 | ) | (1,657 | ) | 8,245 | |||||||
Adjusted net income attributable to ARC Document Solutions, Inc. | $ | 16,774 | $ | 11,807 | $ | 4,138 | ||||||
Actual: | ||||||||||||
Earnings (loss) per share attributable to ARC Document Solutions, Inc. shareholders: | ||||||||||||
Basic | $ | 2.08 | $ | 0.16 | $ | (0.33 | ) | |||||
Diluted | $ | 2.04 | $ | 0.15 | $ | (0.33 | ) | |||||
Weighted average common shares outstanding: | ||||||||||||
Basic | 46,631 | 46,245 | 45,856 | |||||||||
Diluted | 47,532 | 47,088 | 45,856 | |||||||||
Adjusted: | ||||||||||||
Earnings per share attributable to ARC Document Solutions, Inc. shareholders: | ||||||||||||
Basic | $ | 0.36 | $ | 0.26 | $ | 0.09 | ||||||
Diluted | $ | 0.35 | $ | 0.25 | $ | 0.09 | ||||||
Weighted average common shares outstanding: | ||||||||||||
Basic | 46,631 | 46,245 | 45,856 | |||||||||
Diluted | 47,532 | 47,088 | 46,157 | |||||||||
26
Results of Operations
2015 Versus 2014 | 2014 Versus 2013 | ||||||||||||||||||||||||
Year Ended December 31, | Increase (decrease) | Increase (decrease) | |||||||||||||||||||||||
(In millions, except percentages) | 2015 (1) | 2014(1) | 2013(1) | $(1) | % | $(1) | % | ||||||||||||||||||
CDIM | $ | 221.2 | $ | 219.8 | $ | 216.3 | $ | 1.4 | 0.6 | % | $ | 3.5 | 1.6 | % | |||||||||||
MPS | 144.2 | 141.3 | 128.2 | 2.9 | 2.1 | % | 13.1 | 10.2 | % | ||||||||||||||||
AIM | 13.2 | 10.8 | 10.8 | 2.4 | 22.2 | % | — | — | % | ||||||||||||||||
Total services sales | $ | 378.6 | $ | 371.9 | $ | 355.4 | $ | 6.7 | 1.8 | % | $ | 16.5 | 4.6 | % | |||||||||||
Equipment and Supplies Sales | 50.0 | 51.9 | 51.8 | (1.9 | ) | (3.7 | )% | 0.1 | 0.2 | % | |||||||||||||||
Total net sales | $ | 428.7 | $ | 423.8 | $ | 407.2 | $ | 4.9 | 1.2 | % | $ | 16.6 | 4.1 | % | |||||||||||
Gross profit | $ | 148.1 | $ | 144.3 | $ | 134.3 | $ | 3.8 | 2.6 | % | $ | 10.0 | 7.4 | % | |||||||||||
Selling, general and administrative expenses | $ | 107.3 | $ | 107.7 | $ | 96.8 | $ | (0.4 | ) | (0.4 | )% | $ | 10.9 | 11.3 | % | ||||||||||
Amortization of intangibles | $ | 5.6 | $ | 6.0 | $ | 6.6 | $ | (0.4 | ) | (6.7 | )% | $ | (0.6 | ) | (9.1 | )% | |||||||||
Restructuring expense | $ | 0.1 | $ | 0.8 | $ | 2.5 | $ | (0.7 | ) | (87.5 | )% | $ | (1.7 | ) | (68.0 | )% | |||||||||
Loss on extinguishment of debt | $ | 0.3 | $ | 5.6 | $ | 16.3 | $ | (5.3 | ) | (94.6 | )% | $ | (10.7 | ) | (65.6 | )% | |||||||||
Interest expense, net | $ | 7.0 | $ | 14.6 | $ | 23.7 | $ | (7.6 | ) | (52.1 | )% | $ | (9.1 | ) | (38.4 | )% | |||||||||
Income tax (benefit) provision | $ | (69.4 | ) | $ | 2.3 | $ | 3.0 | $ | (71.7 | ) | (3,117.4 | )% | $ | (0.7 | ) | (23.3 | )% | ||||||||
Net income (loss) attributable to ARC | $ | 97.0 | $ | 7.3 | $ | (15.3 | ) | $ | 89.7 | 1,228.8 | % | $ | 22.6 | (147.7 | )% | ||||||||||
Adjusted net income attributable to ARC | $ | 16.8 | $ | 11.8 | $ | 4.1 | $ | 5.0 | 42.4 | % | $ | 7.7 | 187.8 | % | |||||||||||
Cash flows provided by operating activities | $ | 60.0 | $ | 50.0 | $ | 46.8 | $ | 10.0 | 20.0 | % | $ | 3.2 | 6.8 | % | |||||||||||
Adjusted cash flows provided by operating activities | $ | 61.2 | $ | 54.0 | $ | 47.3 | $ | 7.2 | 13.3 | % | $ | 6.7 | 14.2 | % | |||||||||||
EBITDA | $ | 68.2 | $ | 58.3 | $ | 46.1 | $ | 9.9 | 17.0 | % | $ | 12.2 | 26.5 | % | |||||||||||
Adjusted EBITDA | $ | 72.2 | $ | 72.3 | $ | 68.2 | $ | (0.1 | ) | (0.1 | )% | $ | 4.0 | 5.9 | % | ||||||||||
(1) | Column does not foot due to rounding. |
27
The following table provides information on the percentages of certain items of selected financial data as a percentage of net sales for the periods indicated:
As Percentage of Net Sales | ||||||||
Year Ended December 31, | ||||||||
2015(1) | 2014(1) | 2013(1) | ||||||
Net Sales | 100.0 | % | 100.0 | % | 100.0 | % | ||
Cost of sales | 65.4 | 66.0 | 67.0 | |||||
Gross profit | 34.6 | 34.0 | 33.0 | |||||
Selling, general and administrative expenses | 25.0 | 25.4 | 23.8 | |||||
Amortization of intangibles | 1.3 | 1.4 | 1.6 | |||||
Restructuring expense | — | 0.2 | 0.6 | |||||
Income from operations | 8.2 | 7.0 | 7.0 | |||||
Other income, net | — | — | — | |||||
Loss on extinguishment of debt | 0.1 | 1.3 | 4.0 | |||||
Interest expense, net | 1.6 | 3.4 | 5.8 | |||||
Loss before income tax (benefit) provision | 6.5 | 2.3 | (2.8 | ) | ||||
Income tax (benefit) provision | (16.2 | ) | 0.6 | 0.7 | ||||
Net income (loss) | 22.7 | 1.8 | (3.6 | ) | ||||
Income attributable to the noncontrolling interest | (0.1 | ) | — | (0.2 | ) | |||
Net income (loss) attributable to ARC | 22.6 | % | 1.7 | % | (3.8 | )% | ||
EBITDA | 15.9 | % | 13.8 | % | 11.3 | % | ||
Adjusted EBITDA | 16.8 | % | 17.1 | % | 16.8 | % | ||
(1) | Column does not foot due to rounding. |
Fiscal Year Ended December 31, 2015 Compared to Fiscal Year Ended December 31, 2014
Net Sales
Net sales in 2015 increased 1.2%. The increase in net sales was due to higher sales activity in all service sales categories compared to prior year, as further explained below.
CDIM. CDIM services in 2015 increased $1.4 million, or 0.6%, compared to 2014. The increase is sales was primarily due to growth in our specialized color printing services as a result of our continued focus on the expansion and enhancement of our color service offering to both our AEC and non-AEC customer base. Also contributing to our growth was increased sales in our cloud and mobile document services such as SKYSITE. These increases outpaced sales declines resulting from reduced demand for printed construction drawings driven by the ongoing adoption of technology replacing traditional print-based service offerings. CDIM services represented 52% of total net sales for both the year ended December 31, 2015 and 2014
MPS. MPS services in 2015 increased $2.9 million or 2.1%. Revenues from MPS Services represented approximately 34% of total net sales for 2015, compared to approximately 33% during 2014, respectively. MPS Services revenue is derived from two sources: 1) an engagement with the customer to place primarily large-format equipment, that we own or lease, at a construction site or in our customers’ offices, and 2) an arrangement by which our customers outsource their printing function to us, including all office printing, copying, and reprographics printing. In both cases this is recurring, contracted revenue with most contracts ranging from 3 to 5 years and we are paid a single cost per unit of material used, often referred to as a “click charge.”
The number of MPS accounts has grown to approximately 9,000 as of December 31, 2015, an increase of approximately 500 locations compared to December 31, 2014, due primarily to growth in new MPS placements in which customers outsource their entire printing function to us. We believe over time MPS is a high growth area for us as demonstrated by the adoption of our services by large, multi-national firms in the AEC space over the past several years. However, in 2016, the growth in MPS will be muted as a national account that represented approximately $10.0 million in MPS revenue did not renew their agreement with us following a recent merger.
28
We intend to continue the expansion of our MPS offering through our regional and local sales force and through our national accounts group "Global Solutions". Our Global Solutions sales force has established long-term contract relationships with 23 of the largest 100 AEC firms. As MPS becomes a larger percentage of our sales, our overall sales will be less exposed to the seasonality associated with construction projects. MPS services are driven in large part by the number of customer employees at an office and largely by non-construction project related work such as office printing and copying.
AIM. Year-over-year sales of AIM Services increased by $2.4 million, or 22.2%, in 2015, compared to 2014. The growth in AIM was driven by new customer engagements and the opening of dedicated AIM service centers in various U.S. locations. Achieving growth in AIM is a primary focus of our management, as we believe we have developed a valuable solution to offer our existing AEC customers and non-AEC customers who wish to leverage past intellectual property for present or future use, improve business process automation, facilitate cost savings over current hardcopy and digital storage methods, and to comply with regulatory and records retention requirements.
Equipment and Supplies Sales. Equipment and Supplies Sales decreased by $1.9 million, or 3.7% in 2015, due to a decline in equipment sales in the U.S. during 2015. This decrease was partially offset by a non-recurring increase in equipment sales in the Chinese market. Equipment and Supplies Sales represented approximately 12% of total net sales for both the year ended December 31, 2015 and 2014. Equipment and Supplies Sales derived from UNIS Document Solutions Co. Ltd (“UDS”), our Chinese business venture, were $20.9 million in 2015, as compared to $19.3 million in 2014. Changes in Equipment and Supplies Sales are largely driven by the timing of replacements of aging equipment fleets for customers who prefer to own their equipment. In the long term we do not anticipate growth in Equipment and Supplies Sales in the United States or China, as we are placing more focus on growth in AIM and MPS sales and converting sales contracts to MPS agreements.
Gross Profit
Gross profit and gross margin increased to $148.1 million, and 34.6%, in 2015, compared to $144.3 million, and 34.0%, in 2014, on a sales increase of $4.9 million.
We were able to achieve expansion of our gross margins of 60 basis points in 2015 due primarily to: (1) a decline in material costs driven by a shift in our business mix in 2015, including a decrease in lower-margin equipment and supplies sales, (2) overall increased sales that allow us to better leverage our fixed costs and labor, and (3) margin expansion programs at our service centers and customer MPS locations.
Selling, General and Administrative Expenses
Selling, marketing, general and administrative expenses decreased by $0.4 million or 0.4% in 2015 compared to 2014.
General and administrative expenses in 2015 decreased $0.4 million or 0.7% compared to the same period in 2014. The reduction in expenses was primarily due to trade secret litigation costs incurred in prior year, which were partially offset by investments in general and administrative staff to support our new technology-enabled offerings.
Year-over-year sales and marketing expenses remained consistent in 2015 compared to 2014. Increases in sales and marketing expenses driven by our continued investment in our sales team and sales initiatives, which included: (1) hiring of new sales and sales administrative personnel, (2) expanded training of new and existing sales personnel to implement specific sales initiatives supporting our MPS, AIM, and other technology-enabled offerings and (3) expanded marketing and advertising campaigns to support our newer product offerings such as SKYSITE and AIM were offset by lower sales commissions.
Amortization of Intangibles
Amortization of intangibles of $5.6 million in 2015 had a slight decrease in 2015 compared to 2014, primarily due to the completed amortization of certain customer relationships related to historical acquisitions.
Restructuring Expense
Restructuring expenses totaled $0.1 million in 2015, primarily consisting of revised estimated lease termination and obligation costs resulting from facilities closed in 2013.
For further information, please see Note 3 “Restructuring Expenses” to our Consolidated Financial Statements.
29
Loss on extinguishment of debt
As of December 31, 2015, we have paid $32.0 million in aggregate principal since the inception of our $175.0 million Term Loan Credit Agreement, which was $14.5 million more than the required principal payments for the year ended December 31, 2015. The $14.5 million pay down of the term loan resulted in a loss on the early extinguishment of debt of $0.3 million in 2015.
Interest Expense, Net
Net interest expense totaled $7.0 million in 2015, compared to $14.6 million in 2014. The decrease was primarily due to the refinancing of our previous Term B Loan Facility with an effective interest rate of 6.25% into a Term A Loan Facility in November 2014, which has an effective interest rate of 2.50% at December 31, 2015.
Income Taxes
We recorded an income tax benefit of $69.4 million on pretax income of $28.0 million for 2015.
Our 2015 income tax benefit was primarily due to the reversal of the valuation allowance on certain of our deferred tax assets. At September 30, 2015, as a result of sustained profitability in the U.S. evidenced by three years of earnings and forecasted continuing profitability, we determined it was more likely than not future earnings would be sufficient to realize deferred tax assets in the U.S. Accordingly we reversed most of our U.S.valuation allowance resulting in non-cash income tax benefit of $80.7 million in 2015. We continue to carry a $1.3 million valuation allowance against certain deferred tax assets as of December 31, 2015.
Our 2015 effective income tax rate would have been 39.3% after excluding valuation allowance reversals and certain nondeductible stock based compensation.
Our gross deferred tax assets remain available to us for use in future years until they fully expire. As of December 31, 2015, we had approximately $83.1 million of consolidated federal, $100.6 million of state and $1.9 million of foreign net operating loss and charitable contribution carryforwards available to offset future taxable income, respectively. The federal net operating loss carryforward began in 2011 and will begin to expire in varying amounts between 2031 and 2034. The charitable contribution carryforward began in 2009 and will begin to expire in varying amounts between 2016 and 2020. The state net operating loss carryforwards expire in varying amounts between 2016 and 2034. The foreign net operating loss carryforwards begin to expire in varying amounts beginning in 2016.
Noncontrolling Interest
Net income attributable to noncontrolling interest represents 35% of the income of UDS and its subsidiaries, which together comprise our Chinese operations.
Net Income Attributable to ARC
Net income attributable to ARC was $97.0 million in 2015, as compared to $7.3 million in 2014. The increase in net income attributable to ARC in 2015 versus the prior year period is primarily due to the reversal of a previously established income tax valuation allowance and increased sales.
EBITDA
EBITDA margin increased to 15.9% in 2015, as compared to 13.8% in 2014. Excluding the effect of stock-based compensation, trade secret litigation costs, restructuring expense, and loss on extinguishment of debt, adjusted EBITDA margin decreased to 16.8% in 2015, as compared to 17.1% in 2014. The increase in EBITDA was due primarily to the increase in gross margins described above.
Fiscal Year Ended December 31, 2014 Compared to Fiscal Year Ended December 31, 2013
Net Sales
Net sales in 2014 increased 4.1%. The increase in net sales was primarily due to the higher sales activity for MPS and CDIM Services. In 2014, MPS Services generated the largest percentage of net sales, and it produced the highest percentage change from 2013 (10.2% growth).
CDIM. CDIM sales increased $3.5 million or 1.6% in 2014, and represented approximately 52% of total net sales for 2014, as compared to approximately 53% during 2013.
The increase in sales from CDIM Services is primarily due to additional sales realized from the acquisition of two businesses in the United Kingdom during the second quarter of 2014. Also contributing to our CDIM sales growth is our continued focus on
30
the expansion and enhancement of our color services offerings through our Riot Creative Imaging brand and to our AEC industry customer base. These increases were partially offset by lower volume of printed construction drawings driven by the continuing trend of a greater use of digital processes for document workflow and less reliance on print. Also contributing to the offset were poor weather conditions over much of the US during the early part of the first quarter, as well as increased production of documents on customer sites as opposed to documents being produced at our service centers.
MPS. MPS Services sales increased $13.1 million or 10.2%, in 2014, and represented approximately 33% of total net sales for 2014, as compared to approximately 31% during 2013.
The number of MPS accounts had grown to approximately 8,500 as of December 31, 2014, an increase of approximately 800 locations compared to December 31, 2013, due primarily to growth in new MPS placements.
AIM. AIM Services remained consistent in 2014, compared to 2013. Sales of AIM Services decreased slightly to 2.6% of total net sales for 2014, as compared to 2.7% for 2013, primarily due to a decline in those services related to project-based work performed at our service centers, offset by new digital service offerings which experienced growth.
Equipment and Supplies Sales. Equipment and Supplies Sales increased by $0.1 million or 0.2% in 2014, primarily due to increased equipment sales in the United States during 2014 partially offset by the decline in equipment sales in China. Revenues from Equipment and Supplies Sales represented approximately 12% of total net sales in 2014, compared to approximately 13% in 2013. The growth of equipment sales in the United States in 2014 was driven by large equipment purchases from customers who prefer to own their own equipment. Equipment and Supplies Sales derived from UDS, our Chinese business venture, were $19.3 million in 2014, as compared to $19.9 million in 2013. The decrease in Equipment and Supplies Sales from our Chinese operations was driven by a softening Chinese economy and a corresponding decrease in capital expenditures from several of our largest customers in China.
Gross Profit
Gross profit and gross margin increased to $144.3 million, and 34.0%, in 2014, compared to $134.3 million, and 33.0%, in 2013, on a sales increase of $16.6 million.
We were able to achieve expansion of our gross margins of 100 basis points in 2014 due primarily to (1) increased sales that allow us to better leverage our fixed costs, (2) margin expansion programs at our service centers and customer onsite locations, and (3) expense reductions associated with the Company's restructuring in 2012. Specifically, year-over-year overhead costs as a percentage of sales decreased by approximately 100 basis points in 2014.
Selling, General and Administrative Expenses
Selling, marketing, general and administrative expenses increased by $10.9 million or 11.3% in 2014 compared to 2013.
Year-over-year sales and marketing expenses increased $3.3 million in 2014 , driven by increased sales commissions resulting from an increase in sales year-over-year, as well as our continued investment in our sales team which included: (1) hiring of new sales and sales administrative personnel, and (2) expanded training of new and existing sales personnel to implement specific sales initiatives supporting our MPS, AIM, and other technology-enabled offerings and (3) expanded marketing and advertising campaigns to support our newer product offerings such as SKYSITE and AIM.
General and administrative expenses increased $7.6 million in 2014 primarily due to legal fees related to trade secret litigation during 2014, as well as an increase in accrued incentive bonuses due to an improvement in the Company's financial performance in 2014.
On February 1, 2013, we filed a civil complaint against a competitor and a former employee in the Superior Court of California for Orange County, which alleged, among other claims, the misappropriation of ARC trade secrets; namely, proprietary customer lists that were used to communicate with our customers in an attempt to unfairly acquire their business. In prior litigation with the competitor based on related facts, in 2007 the competitor entered into a settlement agreement and stipulated judgment, which included an injunction. We instituted this suit to stop the defendant from using similar unfair business practices against us in the Southern California market. The case proceeded to trial in May 2014, and a jury verdict was entered for the defendants. In December 2014, the court awarded the defendant attorneys' fees related to the case. In February 2015, we entered into a settlement with the defendant. Legal fees associated with the litigation, including the settlement with the defendant, totaled $3.8 million for the year ended December 31, 2014.
31
Amortization of Intangibles
Amortization of intangibles of $6.0 million in 2014, decreased by $0.6 million or 9.1% compared to 2013, primarily due to the complete amortization of certain customer relationships related to historical acquisitions.
Restructuring Expense
Restructuring expenses totaled $0.8 million in 2014, primarily consisting of revised estimated lease termination and obligation costs resulting from facilities closed in 2013.
For further information, please see Note 3 “Restructuring Expenses” to our Consolidated Financial Statements.
Loss on extinguishment of debt
In November 2014, we entered into a new $175.0 million term loan credit agreement ("Term A Loan Facility") with Wells Fargo Bank, National Association, as administrative agent and the lenders party thereto. The proceeds from the new term loan credit agreement were used to pay in full and terminate our previous term loan credit agreement ("Term B Loan Facility"). The $5.6 million loss on extinguishment of debt is due to the write-down of the unamortized original issue discount and deferred financing fees related to the Term B Loan Facility and previous revolving credit facility.
Interest Expense, Net
Net interest expense totaled $14.6 million in 2014 , compared to $23.7 million in 2013. The decrease was due to the purchase and redemption of all our outstanding 10.5% senior notes in 2013, and the replacement of the notes with the $200.0 million Term B Loan Facility with an effective interest rate of 6.25%. During 2014, we made principal payments on our Term B Loan Facility totaling $25.0 million. In November 2014, we were able to further reduce our effective interest rate on long-term debt by entering into the $175.0 million Term A Loan Facility with an initial effective interest rate of 2.74% at December 31, 2014.
Income Taxes
We recorded an income tax provision of $2.3 million on pretax income of $9.8 million for 2014, which yields an effective income tax rate of 24.0%. Our income tax provision was primarily due to the impact of amortization of tax basis goodwill in a deferred tax liability position. Our income tax provision includes a reduction of our valuation allowance of $3.6 million against certain of our deferred tax assets which included a $1.6 million shortfall in stock based compensation. Excluding the valuation allowance reduction, shortfall in stock based compensation and other nondeductible compensation, our tax provision would have been $3.9 million which yields an effective income tax rate of 39.8%.
Noncontrolling Interest
Net income attributable to noncontrolling interest represents 35% of the income of UDS and its subsidiaries, which together comprise our Chinese operations.
Net Income (Loss) Attributable to ARC
Net income attributable to ARC was $7.3 million in 2014, as compared to a net loss attributable to ARC of $15.3 million in 2013. The net income attributable to ARC in 2014 is primarily due to increased sales and gross margins as noted above, and reductions in loss on extinguishment of debt and interest expense in 2014. This increase was partially offset by the increase in selling, general and administrative expenses, as noted above.
EBITDA
EBITDA margin increase d to 13.8% in 2014, as compared to 11.3% in 2013. Excluding the effect of stock-based compensation, trade secret litigation costs, restructuring expense, and loss on extinguishment of debt, adjusted EBITDA margin increased to 17.1% in 2014 , as compared to 16.8% in 2013. The increases in EBITDA and adjusted EBITDA were due primarily to the increase in gross margins described above partially offset by the increase in selling, marketing, general and administrative expenses.
Quarterly Results of Operations
The following table sets forth certain quarterly financial data for the eight quarters ended December 31, 2015. This quarterly information has been prepared on the same basis as the annual financial statements and, in our opinion, reflects all adjustments necessary for a fair presentation of the information for the periods presented. Operating results for any quarter are not necessarily indicative of results for any future period.
32
Quarter Ended (In thousands, except percentages) | ||||||||||||||||||||||||||||||||
Mar. 31, | June 30, | Sept. 30, | Dec. 31, | Mar. 31, | June 30, | Sept. 30, | Dec. 31, | |||||||||||||||||||||||||
2015 | 2014 | |||||||||||||||||||||||||||||||
CDIM | $ | 54,643 | $ | 58,835 | $ | 54,710 | $ | 52,987 | $ | 53,340 | $ | 57,542 | $ | 55,352 | $ | 53,530 | ||||||||||||||||
MPS | 35,877 | 37,134 | 35,923 | 35,310 | 33,009 | 35,743 | 36,464 | 36,097 | ||||||||||||||||||||||||
AIM | 2,805 | 3,367 | 3,751 | 3,296 | 2,582 | 2,913 | 2,610 | 2,702 | ||||||||||||||||||||||||
Total service revenue | 93,325 | 99,336 | 94,384 | 91,593 | 88,931 | 96,198 | 94,426 | 92,329 | ||||||||||||||||||||||||
Equipment and Supplies Sales | 10,994 | 14,053 | 12,034 | 12,946 | 11,442 | 12,784 | 12,381 | 15,265 | ||||||||||||||||||||||||
Total net sales | $ | 104,319 | $ | 113,389 | $ | 106,418 | $ | 104,539 | $ | 100,373 | $ | 108,982 | $ | 106,807 | $ | 107,594 | ||||||||||||||||
Quarterly sales as a % of annual sales | 24.3 | % | 26.5 | % | 24.8 | % | 24.4 | % | 23.7 | % | 25.7 | % | 25.2 | % | 25.4 | % | ||||||||||||||||
Gross profit | $ | 36,021 | $ | 40,859 | $ | 35,943 | $ | 35,301 | $ | 33,934 | $ | 39,207 | $ | 36,223 | $ | 34,914 | ||||||||||||||||
Gross margin | 34.5 | % | 36.0 | % | 33.8 | % | 33.8 | % | 33.8 | % | 36.0 | % | 33.9 | % | 32.5 | % | ||||||||||||||||
Income from operations | $ | 7,003 | $ | 12,274 | $ | 8,748 | $ | 7,088 | $ | 5,847 | $ | 9,150 | $ | 8,384 | $ | 6,461 | ||||||||||||||||
EBITDA | $ | 15,609 | $ | 20,527 | $ | 17,042 | $ | 15,065 | $ | 14,466 | $ | 17,628 | $ | 16,636 | $ | 9,588 | ||||||||||||||||
Net income (loss) attributable to ARC | $ | 4,436 | $ | 9,257 | $ | 80,286 | $ | 3,061 | $ | 1,396 | $ | 4,545 | $ | 3,661 | $ | (2,327 | ) | |||||||||||||||
Income (loss) per share attributable to ARC shareholders: | ||||||||||||||||||||||||||||||||
Basic | $ | 0.10 | $ | 0.20 | $ | 1.72 | $ | 0.07 | $ | 0.03 | $ | 0.10 | $ | 0.08 | $ | (0.05 | ) | |||||||||||||||
Diluted | $ | 0.09 | $ | 0.19 | $ | 1.69 | $ | 0.06 | $ | 0.03 | $ | 0.10 | $ | 0.08 | $ | (0.05 | ) | |||||||||||||||
The following is a reconciliation of EBITDA to net loss for each respective quarter.
Quarter Ended (In thousands) | ||||||||||||||||||||||||||||||||
Mar. 31, | June 30, | Sept. 30, | Dec. 31, | Mar. 31, | June 30, | Sept. 30, | Dec. 31, | |||||||||||||||||||||||||
2015 | 2014 | |||||||||||||||||||||||||||||||
EBITDA | $ | 15,609 | $ | 20,527 | $ | 17,042 | $ | 15,065 | $ | 14,466 | $ | 17,628 | $ | 16,636 | $ | 9,588 | ||||||||||||||||
Interest expense, net | (1,857 | ) | (1,939 | ) | (1,679 | ) | (1,499 | ) | (3,913 | ) | (3,944 | ) | (3,780 | ) | (2,923 | ) | ||||||||||||||||
Income tax (provision) benefit | (761 | ) | (811 | ) | 73,338 | (2,334 | ) | (664 | ) | (607 | ) | (659 | ) | (418 | ) | |||||||||||||||||
Depreciation and amortization | (8,555 | ) | (8,520 | ) | (8,415 | ) | (8,171 | ) | (8,493 | ) | (8,532 | ) | (8,536 | ) | (8,574 | ) | ||||||||||||||||
Net income (loss) attributable to ARC | $ | 4,436 | $ | 9,257 | $ | 80,286 | $ | 3,061 | $ | 1,396 | $ | 4,545 | $ | 3,661 | $ | (2,327 | ) | |||||||||||||||
We believe that quarterly revenues and operating results may vary significantly in the future and that quarter-to-quarter comparisons of our results of operations are not necessarily indications of future performance. In addition, our quarterly operating results, particularly those of our CDIM offerings, are typically affected by seasonal factors, primarily the number of working days in a quarter and the holiday season in the fourth quarter. Therefore, historically, in regards to our service offerings, our fourth quarter has generally been the slowest and the least profitable. While our CDIM business is still influenced by the nature of building cycles, our remaining offerings are less so. MPS Services are driven by the production of office documents and our customer's desire to improve business processes and reduce print management costs. Due primarily to the quarterly sequential growth of our MPS sales and the impact of inclement weather in the first quarter of 2014, our 2014 fourth quarter sales and Adjusted EBITDA were higher than the first quarter of 2014. We recorded losses on extinguishment of debt in the amount of $0.1 million, $0.1 million, $0.1 million, $5.3 million, $0.3 million during the quarters ended December 31, 2015, September 30, 2015, June 30, 2015, December 31, 2014 and September 30, 2014, respectively. We recorded valuation allowances, net of reversals against certain deferred tax assets of $0.2 million, $(76.1) million, $(3.3) million, and $(1.5) million during the quarters ended December 31, 2015, September 30, 2015, June 30, 2015, and March 31, 2015, respectively. We recorded valuation allowances against certain deferred tax assets of $1.1 million, $(1.6) million, $(1.7) million, and $(1.3) million during the quarters ended December 31, 2014, September 30, 2014, June 30, 2014 and March 31, 2014, respectively.
33
We believe inflation has not had a significant effect on our operations. Price increases for raw materials, such as paper and fuel charges, typically have been, and we expect will continue to be, passed on to customers in the ordinary course of business.
Liquidity and Capital Resources
Our principal sources of cash have been operations and borrowings under our debt and lease agreements. Our recent historical uses of cash have been for ongoing operations, payment of principal and interest on outstanding debt obligations and capital expenditures.
Total cash and cash equivalents as of December 31, 2015 was $24.0 million. Of this amount, $15.1 million was held in foreign countries, with $13.7 million held in China. Repatriation of some of our cash and cash equivalents in foreign countries could be subject to delay for local country approvals and could have potential adverse tax consequences. As a result of holding cash and cash equivalents outside of the U.S., our financial flexibility may be reduced.
Supplemental information pertaining to our historical sources and uses of cash is presented as follows and should be read in conjunction with our Consolidated Statements of Cash Flows and notes thereto included elsewhere in this report.
Year Ended December 31, | ||||||||||||
(In thousands) | 2015 | 2014 | 2013 | |||||||||
Net cash provided by operating activities | $ | 59,981 | $ | 50,012 | $ | 46,798 | ||||||
Net cash used in investing activities | $ | (13,656 | ) | $ | (13,796 | ) | $ | (17,450 | ) | |||
Net cash used in financing activities | $ | (44,207 | ) | $ | (40,771 | ) | $ | (30,284 | ) | |||
Operating Activities
Cash flows from operations are primarily driven by sales and net profit generated from these sales, excluding non-cash charges.
The overall increase in cash flows from operations in 2015 was primarily due to the reduction in our interest expense resulting from both our debt refinancing in 2014, and reduction in principal of our Term A Loan Facility. Days sales outstanding (“DSO”) remained at 52 days as of December 31, 2015 and 2014. We continue our focus on the timely collection of our accounts receivable.
The overall increase in cash flows from operations in 2014 was primarily due the increase in our net income driven by our expansion of adjusted EBITDA of $4.0 million as described above, as well a reduction of cash interest of over $9.0 million due to our long term debt refinancings. These increases were offset, in part, by the income tax refund of $3.8 million received in 2013 related to our 2009 consolidated federal income tax return, cash payments of $2.7 million related to trade secret litigation costs, and increases in accounts receivable, prepaid expenses and other assets.
Investing Activities
Net cash used in investing activities was primarily related to capital expenditures. We incurred capital expenditures totaling $14.2 million, $13.3 million, and $18.2 million in 2015, 2014 and 2013, respectively. The increase in capital expenditures from 2014 to 2015, was primarily due to our decision to purchase more equipment in the second and third quarters of 2015 rather than leasing equipment to take advantage of vendor rebates. The decrease in capital expenditures from 2013 to 2014, was primarily due to our increased reliance on leasing rather than purchasing equipment. As we continue to foster our relationships with credit providers and obtain attractive lease rates, we may increasingly choose to lease rather than purchase equipment in the future.
Financing Activities
Net cash of $44.2 million used in financing activities in 2015 primarily relates to payments on our debt agreements and capital leases. As of December 31, 2015, we have paid $32.0 million in aggregate principal amount since the inception of our $175.0 million Term Loan Credit Agreement, which was $14.5 million above the required principal payments.
Our cash position, working capital, and debt obligations as of December 31, 2015, 2014 and 2013 are shown below and should be read in conjunction with our Consolidated Balance Sheets and notes thereto contained elsewhere in this report.
34
December 31, | |||||||||||
(In thousands) | 2015 | 2014 | 2013 | ||||||||
Cash and cash equivalents | $ | 23,963 | $ | 22,636 | $ | 27,362 | |||||
Working capital | $ | 40,031 | $ | 20,664 | $ | 28,705 | |||||
Borrowings from senior secured credit facility, term loan facility and Notes (1) | $ | 143,000 | $ | 173,000 | $ | 196,000 | |||||
Other debt obligations | 29,978 | 30,885 | 23,728 | ||||||||
Total debt obligations | $ | 172,978 | $ | 203,885 | $ | 219,728 | |||||
(1) | Net of original issue discount of $4,000 at December 31, 2013. |
The increase of $19.4 million in working capital in 2015 was primarily due to the reduction in the current portion of our long-term debt and capital leases of $13.6 million, an increase in cash of $1.3 million, a reduction in accrued expenses of $3.6 million, and a decrease in accounts payable of $2.9 million. These variances were partially offset by a decrease in accounts receivable of $2.0 million. The reduction in the current portion of our long-term debt and capital leases is due to the prepayment of principal on our Term A loan facility. The decrease in accounts receivable was due primarily to the decline in sales of 2.8% in the fourth quarter of 2015, as compared to the same period in the prior year, and the timing of collections on those sales. The decrease in accounts payable and accrued expenses is primarily due to the timing of trade payables, a reduction in accrued employee bonuses, and the timing of interest payments related to our Term A Loan Facility. To manage our working capital, we chiefly focus on our DSO and monitor the aging of our accounts receivable, as receivables are the most significant element of our working capital.
We believe that our current cash and cash equivalents balance of $24.0 million, availability under our revolving credit facility, availability under our equipment lease lines, and cash flows provided by operations should be adequate to cover the next twelve months of working capital needs, debt service requirements consisting of scheduled principal and interest payments, and planned capital expenditures, to the extent such items are known or are reasonably determinable based on current business and market conditions. In addition, we may elect to finance certain of our capital expenditure requirements through borrowings under our revolving credit facility, which had no debt outstanding as of December 31, 2015, other than contingent reimbursement obligations for undrawn standby letters of credit described below that were issued under this facility. See “Debt Obligations” section for further information related to our revolving credit facility.
We generate the majority of our revenue from sales of services and products to the AEC industry. As a result, our operating results and financial condition can be significantly affected by economic factors that influence the AEC industry, such as non-residential and residential construction spending. Additionally, a general economic downturn may adversely affect the ability of our customers and suppliers to obtain financing for significant operations and purchases, and to perform their obligations under their agreements with us. We believe that credit constraints in the financial markets could result in a decrease in, or cancellation of, existing business, could limit new business, and could negatively affect our ability to collect our accounts receivable on a timely basis.
While we have not been actively seeking growth through acquisition during the last three years, the executive team continues to selectively evaluate potential acquisitions.
Debt Obligations
Term A Loan Facility
On November 20, 2014 we entered into a Credit Agreement (the “Term A Credit Agreement”) with Wells Fargo Bank, National Association, as administrative agent and the lenders party thereto.
The Term A Credit Agreement provides for the extension of term loans (“Term Loans”) in an aggregate principal amount of $175.0 million, the entirety of which was disbursed on the Closing Date in order to pay outstanding obligations under the Company’s Term Loan Credit Agreement dated as of December 20, 2013. The Credit Agreement also provides for the extension of revolving loans (“Revolving Loans”) in an aggregate principal amount not to exceed $30.0 million. The Revolving Loan facility under the Term A Credit Agreement replaces the Company’s Credit Agreement dated as of January 27, 2012. The Company may request incremental commitments to the aggregate principal amount of Term Loans and Revolving Loans available under the Credit Agreement by an amount not to exceed $75 million in the aggregate. Unless an incremental commitment to increase the Term Loan or provide a new term loan matures at a later date, the obligations under the Credit Agreement mature on November 20, 2019.
35
Loans borrowed under the Term A Credit Agreement bear interest, in the case of LIBOR rate loans, at a per annum rate equal to the applicable LIBOR rate, plus a margin ranging from 1.50% to 2.50%, based on the Company’s Total Leverage Ratio (as defined in the Term A Credit Agreement). Loans borrowed under the Term A Credit Agreement that are not LIBOR rate loans bear interest at a per annum rate equal to (i) the greatest of (A) the Federal Funds Rate plus 0.50%, (B) the one month LIBOR rate plus 1.00% per annum, and (C) the rate of interest announced, from time to time, by Wells Fargo Bank, National Association as its “prime rate,” plus (ii) a margin ranging from 0.50% to 1.50%, based on our Company’s Total Leverage Ratio.
We will pay certain recurring fees with respect to the credit facility, including administration fees to the administrative agent.
Subject to certain exceptions, including in certain circumstances, reinvestment rights, the loans extended under the Term A Credit Agreement are subject to customary mandatory prepayment provisions with respect to: the net proceeds from certain asset sales; the net proceeds from certain issuances or incurrences of debt (other than debt permitted to be incurred under the terms of the Term A Credit Agreement); the net proceeds from certain issuances of equity securities; and net proceeds of certain insurance recoveries and condemnation events of our Company.
The Term A Credit Agreement contains customary representations and warranties, subject to limitations and exceptions, and customary covenants restricting the ability (subject to various exceptions) of our Company and its subsidiaries to: incur additional indebtedness (including guarantee obligations); incur liens; sell certain property or assets; engage in mergers or other fundamental changes; consummate acquisitions; make investments; pay dividends, other distributions or repurchase equity interest of our Company or its subsidiaries; change the nature of their business; prepay or amend certain indebtedness; engage in certain transactions with affiliates; amend their organizational documents; or enter into certain restrictive agreements. In addition, the Term A Credit Agreement contains financial covenants which requires us to maintain (i) at all times, a Total Leverage Ratio in an amount not to exceed 3.25 to 1.00 through the Company’s fiscal quarter ending September 30, 2016, and thereafter, in an amount not to exceed 3.00 to 1.00; and (ii) a Fixed Charge Coverage Ratio (as defined in the Term A Credit Agreement), as of the last day of each fiscal quarter, in an amount not less than 1.25 to 1.00. The Company was in compliance with its covenants as of December 31, 2015. On February 5, 2016, the Term A Credit Agreement was amended to exclude up to $15.0 million of stock repurchases from the calculation of the Company's Fixed Charge Coverage Ratio, provided that those stock repurchases are consummated in accordance with the other terms and conditions of the agreement.
The Term A Credit Agreement contains customary events of default, including with respect to: nonpayment of principal, interest, fees or other amounts; failure to perform or observe covenants; material inaccuracy of a representation or warranty when made; cross-default to other material indebtedness; bankruptcy, insolvency and dissolution events; inability to pay debts; monetary judgment defaults; actual or asserted invalidity or impairment of any definitive loan documentation, repudiation of guaranties or subordination terms; certain ERISA related events; or a change of control.
The obligations of the Company’s subsidiary that is the borrower under the Credit Agreement are guaranteed by the Company and each other United States domestic subsidiary of the Company. The Credit Agreement and any interest rate protection and other hedging arrangements provided by any lender party to the Credit Facility or any affiliate of such a lender are secured on a first priority basis by a perfected security interest in substantially all of the borrower’s, the Company’s and each guarantor’s assets (subject to certain exceptions).
Term B Loan Facility
On December 20, 2013, we entered into a Term Loan Credit Agreement (the “Term B Loan Credit Agreement”) among ARC, as borrower, JPMorgan Chase Bank., N.A, as administrative agent and as collateral agent, and the lenders party thereto. Concurrently with the Company’s entry into the Term A Credit Agreement described above, the Company paid in full and terminated the Term B Loan Credit Agreement resulting in a loss on early extinguishment of debt of $5.6 million in 2014.
The credit facility provided under the Term B Loan Credit Agreement consisted of an initial term loan facility of $200.0 million, the entirety of which was disbursed in order to pay for the purchase of the Notes that were accepted under a cash tender offer and the subsequent redemption of the remaining outstanding Notes and to pay associated fees and expenses in connection with the cash tender offer and redemption.
By refinancing the Notes with this Term Loan Credit Agreement, we were able to reduce the effective interest rate on our/ long-term debt from 10.5% (or $21.0 million of interest per year on $200.0 million of principal) to 6.25% (or $12.5 million of interest per year on $200.0 million of principal).
10.5% Senior Notes
36
On December 1, 2010, we completed a private placement of 10.5% senior unsecured notes due 2016 (the “Notes”). During the third and fourth quarters of 2013, we repurchased $12.3 million in aggregate principal amount of the Notes in the open market using available cash. In December 2013 we commenced a cash tender offer and consent solicitation for all of the remaining outstanding Notes and accepted for payment all Notes that were validly tendered, followed by a redemption of all Notes which remained outstanding following the tender offer. In addition, we discharged all of our obligations under the indenture governing the Notes by causing to be delivered a notice of redemption to holders of the remaining outstanding Notes and we deposited funds sufficient to pay and discharge all remaining indebtedness on the Notes, including accrued and unpaid interest. The purchase and redemption of the Notes resulted in a loss on early extinguishment of debt of $16.3 million in 2013.
Foreign Credit Agreement
In the third quarter of 2014, in conjunction with its Chinese operations, UNIS Document Solutions Co. Ltd. (“UDS”), the Company’s Chinese business venture with Beijing-based Unisplendour, entered into a revolving credit facility with a term of 12 months. The credit agreement expired in September 2015.
Term Loan Credit Agreement and Senior Secured Credit Facilities
The following table sets forth the outstanding balance, borrowing capacity and applicable interest rate under the term loan credit agreement and senior secured credit facilities.
December 31, 2015 | |||||||||||
Balance | Available Borrowing Capacity | Interest Rate | |||||||||
(Dollars in thousands) | |||||||||||
Term A Loan Facility (1) | $ | 143,000 | $ | 28,119 | 2.50 | % | |||||
(1) Term A loan facility available borrowing capacity, net of $1.9 million of outstanding standby letters of credit as of December 31, 2015
Capital Leases
As of December 31, 2015, we had $29.9 million of capital lease obligations outstanding, with a weighted average interest rate of 5.8% and maturities between 2016 and 2020.
Other Notes Payable
As of December 31, 2015, we had $0.1 million of notes payable outstanding, with an average interest rate of 8.5% and maturities through 2019. These notes are collateralized by equipment previously purchased.
Off-Balance Sheet Arrangements
As of December 31, 2015, we did not have any off-balance-sheet arrangements as defined in Item 303(a)(4)(ii) of Regulation S-K.
Contractual Obligations and Other Commitments
Our future contractual obligations as of December 31, 2015, are as follows:
Total | Less than 1 year | 1 to 3 years | 3 to 5 years | More than 5 years | ||||||||||||||||
(Dollars in thousands) | ||||||||||||||||||||
Debt obligations | $ | 143,112 | $ | 3,112 | $ | 35,000 | $ | 105,000 | $ | — | ||||||||||
Capital lease obligations | 29,866 | 11,262 | 15,471 | 3,133 | — | |||||||||||||||
Interest on long-term debt and capital leases | 16,338 | 5,060 | 8,427 | 2,851 | — | |||||||||||||||
Operating leases | 47,723 | 16,069 | 19,435 | 7,851 | 4,368 | |||||||||||||||
Total | $ | 237,039 | $ | 35,503 | $ | 78,333 | $ | 118,835 | $ | 4,368 | ||||||||||
Operating Leases. We have entered into various non-cancelable operating leases primarily related to our facilities.
37
Contingent Transaction Consideration. We have entered into earnout obligations in connection with prior acquisitions. If the acquired businesses generate sales and/or operating profits in excess of predetermined targets, we are obligated to make additional cash payments in accordance with the terms of such earnout obligations. As of December 31, 2015, we recorded liabilities related to future earnout payments consummated subsequent to the adoption of ASC 805, Business Combinations, of $1.1 million. Liabilities related to future earnout payments are carried at fair value, and any changes in fair value at each reporting period, are recognized in our consolidated statement of operations.
Critical Accounting Policies
Our management prepares financial statements in conformity with GAAP. When we prepare these financial statements, we are required to make estimates and assumptions that affect the reported amounts of assets and liabilities and the disclosure of contingent assets and liabilities at the date of the financial statements and the reported amounts of revenues and expenses during the reporting period. On an on-going basis, we evaluate our estimates and judgments, including those related to accounts receivable, inventories, deferred tax assets, goodwill and intangible assets and long-lived assets. We base our estimates and judgments on historical experience and on various other factors that we believe to be reasonable under the circumstances, the results of which form the basis for our judgments about the carrying values of assets and liabilities that are not readily apparent from other sources. To the extent that there are material differences between these estimates and actual results, our future financial statement presentation, financial condition, results of operations and cash flows will be affected. We believe that the accounting policies discussed below are critical to understanding our historical and future performance, as these policies relate to the more significant areas involving management's judgments and estimates.
Goodwill
In connection with acquisitions, we apply the provisions of ASC 805, Business Combinations, using the acquisition method of accounting. The excess purchase price over the fair value of net tangible assets and identifiable intangible assets acquired is recorded as goodwill.
In accordance with ASC 350, Intangibles - Goodwill and Other, we assess goodwill for impairment annually as of September 30, and more frequently if events and circumstances indicate that goodwill might be impaired.
At September 30, 2015, we performed our preliminary assessment and noted that one reporting unit failed step one of the impairment analysis; however, step two of the analysis was subject to finalization of the implied fair value of goodwill. We completed step two of the analysis in the fourth quarter of 2015 with no change to the previous estimate that there was no goodwill impairment as of September 30, 2015.
Goodwill impairment testing is performed at the reporting unit level. Goodwill is assigned to reporting units at the date the goodwill is initially recorded. Once goodwill has been assigned to reporting units, it no longer retains its association with a particular acquisition, and all of the activities within a reporting unit, whether acquired or internally generated, are available to support the value of the goodwill.
Goodwill impairment testing is a two-step process. Step one involves comparing the fair value of our reporting units to their carrying amount. If the carrying amount of a reporting unit is greater than zero and its fair value is greater than its carrying amount, there is no impairment. If the reporting unit’s carrying amount is greater than the fair value, the second step must be completed to measure the amount of impairment, if any. Step two involves calculating the implied fair value of goodwill by deducting the fair value of all tangible and intangible assets, excluding goodwill, of the reporting unit from the fair value of the reporting unit as determined in step one. The implied fair value of goodwill determined in this step is compared to the carrying value of goodwill. If the implied fair value of goodwill is less than the carrying value of goodwill, an impairment loss is recognized equal to the difference.
We determine the fair value of our reporting units using an income approach. Under the income approach, we determined fair value based on estimated discounted future cash flows of each reporting unit. Determining the fair value of a reporting unit is judgmental in nature and requires the use of significant estimates and assumptions, including revenue growth rates and EBITDA margins, discount rates and future market conditions, among others.
Our projections are driven, in part, by industry data gathered from third parties, including projected growth rates of the AEC industry by segment (i.e., residential and non-residential) and anticipated GDP growth rates, as well as company-specific data such as estimated composition of our customer base (i.e. non-AEC vs. AEC, residential vs. non- residential), historical revenue trends, and EBITDA margin performance of our reporting units. Our revenue projections for each of ARC’s reporting units include the estimated respective customer composition for each reporting unit, year-to-date revenue at the time of the goodwill impairment analysis, and projected growth rates for the related customer types. Although we rely on a variety of internal and external sources in projecting revenue, our relative reliance on each source or trend changes from year to year. In 2012 and into 2013, we noted a
38
continued divergence between our historic revenue growth rates and AEC non-residential construction growth rates, as well as the “dilution” of traditional reprographics as the Company’s dominant business line. Therefore, we increased our reliance upon internal sources for our short-term and long-term revenue forecasts. Once the forecasted revenue was established for each of the reporting units based on the process noted above, using the current year EBITDA margin as a base line, we forecasted future EBITDA margins. In general, our EBITDA margins are significantly affected by (1) revenue trends and (2) cost management initiatives. Revenue trends impact our EBITDA margins because a significant portion of our cost of sales are considered relatively fixed therefore an increase in forecasted revenue (particularly when combined with any cost management or productivity enhancement initiatives) would result in meaningful gross margin expansion. Similarly, a significant portion of our selling, general, and administrative expenses are considered fixed. Hence, in forecasting EBITDA margins, significant reliance was placed on the historical impact of revenue trends on EBITDA margin.
The estimated fair values of our reporting units were based upon their respective projected EBITDA margins, which were anticipated to vary from a slight decline to a 90 basis point increase from 2015 to 2016, followed by year-over-year increases of less than 100 basis points in 2017 and beyond. These cash flows were discounted using a weighted average cost of capital ranging from 10% to 12%, depending upon the size and risk profile of the reporting unit. We considered market information in assessing the reasonableness of the fair value under the income approach described above.
The results of step one of the goodwill impairment test, as of September 30, 2015, were as follows:
(Dollars in thousands) | Number of Reporting Units | Representing Goodwill of | ||||
No goodwill balance | 1 | $ | — | |||
Reporting units failing step one that continue to carry a goodwill balance | 1 | 7,285 | ||||
Fair value of reporting unit exceeds its carrying value by 15%-30% | 2 | 45,946 | ||||
Fair value of reporting unit exceeds its carrying value by more than 70% | 3 | 159,377 | ||||
7 | $ | 212,608 | ||||
Based on the Company's analysis, one of its reporting units that carried a goodwill balance at September 30, 2015 failed step one. The shortfall in step one of the analysis for the reporting unit was primarily related to the increase in its carrying amount driven by the reversal of the Company's valuation allowance against certain of its deferred tax assets at September 30, 2015.
Based upon a sensitivity analysis, a reduction of approximately 50 basis points of projected EBITDA in 2015 and beyond, assuming all other assumptions remain constant, would result in no additional reporting units proceeding to step two of the analysis, and no impairment for the reporting unit failing step one of the analysis.
Based upon a separate sensitivity analysis, a 50 basis point increase to the weighted average cost of capital would result in no additional reporting units proceeding to step two of the analysis, and no impairment for the reporting unit failing step one of the analysis.
Given the current economic environment and the changing document and printing needs of our customers and the uncertainties regarding the effect on our business, there can be no assurance that the estimates and assumptions made for purposes of our goodwill impairment testing in 2015 will prove to be accurate predictions of the future. If our assumptions, including forecasted EBITDA of certain reporting units, are not achieved, we may be required to record additional goodwill impairment charges in future periods, whether in connection with our next annual impairment testing in the third quarter of 2014, or on an interim basis, if any such change constitutes a triggering event (as defined under ASC 350, Intangibles - Goodwill and Other) outside of the quarter when we regularly perform our annual goodwill impairment test. It is not possible at this time to determine if any such future impairment charge would result or, if it does, whether such charge would be material.
Revenue Recognition
We apply the provisions of ASC 605, Revenue Recognition. In general, we recognize revenue when (i) persuasive evidence of an arrangement exists, (ii) shipment of products has occurred or services have been rendered, (iii) the sales price charged is fixed or determinable and (iv) collection is reasonably assured. Net sales include an allowance for estimated sales returns and discounts.
We recognize revenues from CDIM services and MPS services when services have been rendered, while revenues from the sale of equipment and supplies are recognized upon delivery to the customer or upon customer pickup.
39
We recognize revenues from AIM services when such services have been rendered as they relate to scanning services, "digital shipping" and managed file transfer. Revenues derived from our AIM Services include hosted software licensing activities, which are recognized ratably over the term of the license.
We have established contractual pricing for certain large national customer accounts. These contracts generally establish uniform pricing at all service centers for Global Solutions. Revenues earned from our Global Solutions are recognized in the same manner as non-Global Solutions revenues.
Management provides for returns, discounts and allowances based on historic experience and adjusts such allowances as considered necessary. To date, such provisions have been within the range of management’s expectations.
Income Taxes
Deferred tax assets and liabilities reflect temporary differences between the amount of assets and liabilities for financial and tax reporting purposes. Such amounts are adjusted, as appropriate, to reflect changes in tax rates expected to be in effect when the temporary differences reverse. A valuation allowance is recorded to reduce our deferred tax assets to the amount that is more likely than not to be realized. Changes in tax laws or accounting standards and methods may affect recorded deferred taxes in future periods.
In accordance with ASC 740-10, Income Taxes , we evaluate the need for deferred tax asset valuation allowances based on a more likely than not standard. The ability to realize deferred tax assets depends on the ability to generate sufficient taxable income within the carryback or carryforward periods provided for in the tax law for each applicable tax jurisdiction. We consider the following possible sources of taxable income when assessing the realization of deferred tax assets:
•Future reversals of existing taxable temporary differences;
•Future taxable income exclusive of reversing temporary differences and carryforwards
•Taxable income in prior carryback years; and
•Tax-planning strategies.
The assessment regarding whether a valuation allowance is required or should be adjusted also considers all available positive and negative evidence factors, including but not limited to:
•Nature, frequency, and severity of recent losses;
•Duration of statutory carryforward periods;
•Historical experience with tax attributes expiring unused; and
•Near- and medium-term financial outlook.
It is difficult to conclude a valuation allowance is not required when there is significant objective and verifiable negative evidence, such as cumulative losses in recent years. We utilize a rolling three years of actual and current year anticipated results as the primary measure of cumulative losses in recent years. The evaluation of deferred tax assets requires judgment in assessing the likely future tax consequences of events that have been recognized in our financial statements or tax returns and future profitability. Our accounting for deferred tax consequences represents our best estimate of those future events. Changes in our current estimates, due to unanticipated events or otherwise, could have a material effect on our financial condition and results of operations. At September 30, 2015 as a result of sustained profitability in the U.S. evidenced by three years of earnings and forecasted continuing profitability, we determined it was more likely than not future earnings will be sufficient to realize deferred tax assets in the U.S. Accordingly we reversed most of its U.S. valuation allowance resulting in non-cash income tax benefit of $80.7 million for the year ended December 31, 2015. We continue to carry a $1.3 million valuation allowance against certain deferred tax assets as of December 31, 2015.
In future quarters we will continue to evaluate our historical results for the preceding twelve quarters and our future projections to determine whether we will generate sufficient taxable income to utilize our deferred tax assets, and whether a partial or full valuation allowance is required. Should we generate sufficient taxable income, however, we may reverse a portion or all of the then current valuation allowance.
We calculate our current and deferred tax provision based on estimates and assumptions that could differ from the actual results reflected in income tax returns filed in subsequent years. Adjustments based on filed returns are recorded when identified.
Income taxes have not been provided on certain undistributed earnings of foreign subsidiaries because such earnings are considered to be permanently reinvested.
40
The amount of taxable income or loss we report to the various tax jurisdictions is subject to ongoing audits by federal, state and foreign tax authorities. Our estimate of the potential outcome of any uncertain tax issue is subject to management’s assessment of relevant risks, facts, and circumstances existing at that time. We use a more-likely-than-not threshold for financial statement recognition and measurement of tax positions taken or expected to be taken in a tax return. We record a liability for the difference between the benefit recognized and measured and tax position taken or expected to be taken on our tax return. To the extent that our assessment of such tax positions changes, the change in estimate is recorded in the period in which the determination is made. We had no unrecognized tax benefits as of December 31, 2015. We report tax-related interest and penalties as a component of income tax expense.
Recent Accounting Pronouncements
See Note 2, “Summary of Significant Accounting Policies” to our Consolidated Financial Statements for disclosure on recent accounting pronouncements.
41
Item 7A. Quantitative and Qualitative Disclosures About Market Risk
Our primary exposure to market risk is interest rate risk associated with our debt instruments. We use both fixed and variable rate debt as sources of financing. In 2014, we entered into a $175.0 million Term A Credit Agreement. Borrowings under the Term A Credit Agreement bear interest at a rate equal to an applicable margin plus a variable rate. As such, our Term A Credit Agreement exposes us to market risk for changes in interest rates. To manage our exposure to interest rate volatility associated with borrowings under our Term A Credit, we entered into interest rate cap agreements in the first quarter of 2015. We have not, and do not plan to, enter into any derivative financial instruments for trading or speculative purposes.
As of December 31, 2015, we had $173.0 million of total debt and capital lease obligations, of which approximately 17% was at a fixed rate, with the remainder at variable rates. Given our debt position at December 31, 2015, the effect of a 100 basis point increase in LIBOR on our interest expense would be approximately $1.2 million annually.
Although we have international operating entities, our exposure to foreign currency rate fluctuations is not significant to our financial condition or results of operations.
Item 8. Financial Statements and Supplementary Data
Our financial statements and the accompanying notes that are filed as part of this report are listed under “Part IV, Item 15. Financial Statements Schedules and Reports” and are set forth beginning on page F-1 immediately following the signature pages of this Annual Report on Form 10-K, except for our quarterly results of operations, which are included in Item 7 of this Annual Report on Form 10-K.
Item 9. Changes in and Disagreements with Accountants on Accounting and Financial Disclosure
None.
Item 9A. Controls and Procedures
Disclosure Controls and Procedures
We maintain disclosure controls and procedures that are designed to ensure that information required to be disclosed in our reports under the Exchange Act are recorded, processed, summarized, and reported within the time periods specified in the Securities and Exchange Commission’s rules and forms, and that such information is accumulated and communicated to our management, including our Chief Executive Officer and our Chief Financial Officer, as appropriate, to allow timely decisions regarding required disclosures.
Under the supervision and with the participation of our management, including our Chief Executive Officer and Chief Financial Officer we conducted an evaluation of the effectiveness of our disclosure controls and procedures (as defined in Rule 13a-15(e) and 15d-15(e) under the Securities Exchange Act of 1934) as of December 31, 2015. Based on that evaluation, our Chief Executive Officer and our Chief Financial Officer concluded that as of December 31, 2015, our disclosure controls and procedures were effective.
Management’s Report on Internal Control Over Financial Reporting
Management is responsible for establishing and maintaining adequate internal control over financial reporting (as defined in Rule 13a-15(f) or 15(d)-15(f) of the Exchange Act). Under the supervision and with the participation of the Company’s management, including our Chief Executive Officer and President, and our Chief Financial Officer, the Company conducted an evaluation of the effectiveness of its internal control over financial reporting based upon the framework in Internal Control — Integrated Framework (2013) issued by the Committee of Sponsoring Organizations of the Treadway Commission. Based on that evaluation, the Company’s management concluded that its internal control over financial reporting was effective as of December 31, 2015.
Because of its inherent limitations, internal control over financial reporting may not prevent or detect misstatements. Projections of any evaluation of effectiveness to future periods are subject to the risk that controls may become inadequate because of changes in conditions, or that the degree of compliance with the policies or procedures may deteriorate.
42
Changes in Internal Control Over Financial Reporting
There were no changes to internal control over financial reporting during the quarter ended December 31, 2015, that have materially affected, or are reasonably likely to materially affect, our internal control over financial reporting.
Our independent registered public accounting firm has issued an audit report on internal control over financial reporting, which appears below.
43
REPORT OF INDEPENDENT REGISTERED PUBLIC ACCOUNTING FIRM
To the Board of Directors and Stockholders of
ARC Document Solutions, Inc.
Walnut Creek, California
We have audited the internal control over financial reporting of ARC Document Solutions, Inc. and subsidiaries (the “Company”) as of December 31, 2015, based on criteria established in Internal Control - Integrated Framework (2013) issued by the Committee of Sponsoring Organizations of the Treadway Commission. The Company’s management is responsible for maintaining effective internal control over financial reporting and for its assessment of the effectiveness of internal control over financial reporting, included in the accompanying Management’s Report on Internal Control over Financial Reporting. Our responsibility is to express an opinion on the Company’s internal control over financial reporting based on our audit.
We conducted our audit in accordance with the standards of the Public Company Accounting Oversight Board (United States). Those standards require that we plan and perform the audit to obtain reasonable assurance about whether effective internal control over financial reporting was maintained in all material respects. Our audit included obtaining an understanding of internal control over financial reporting, assessing the risk that a material weakness exists, testing and evaluating the design and operating effectiveness of internal control based on the assessed risk, and performing such other procedures as we considered necessary in the circumstances. We believe that our audit provides a reasonable basis for our opinion.
A company's internal control over financial reporting is a process designed by, or under the supervision of, the company's principal executive and principal financial officers, or persons performing similar functions, and effected by the company's board of directors, management, and other personnel to provide reasonable assurance regarding the reliability of financial reporting and the preparation of financial statements for external purposes in accordance with generally accepted accounting principles. A company's internal control over financial reporting includes those policies and procedures that (1) pertain to the maintenance of records that, in reasonable detail, accurately and fairly reflect the transactions and dispositions of the assets of the company; (2) provide reasonable assurance that transactions are recorded as necessary to permit preparation of financial statements in accordance with generally accepted accounting principles, and that receipts and expenditures of the company are being made only in accordance with authorizations of management and directors of the company; and (3) provide reasonable assurance regarding prevention or timely detection of unauthorized acquisition, use, or disposition of the company's assets that could have a material effect on the financial statements.
Because of the inherent limitations of internal control over financial reporting, including the possibility of collusion or improper management override of controls, material misstatements due to error or fraud may not be prevented or detected on a timely basis. Also, projections of any evaluation of the effectiveness of the internal control over financial reporting to future periods are subject to the risk that the controls may become inadequate because of changes in conditions, or that the degree of compliance with the policies or procedures may deteriorate.
In our opinion, the Company maintained, in all material respects, effective internal control over financial reporting as of December 31, 2015, based on the criteria established in Internal Control - Integrated Framework (2013) issued by the Committee of Sponsoring Organizations of the Treadway Commission.
We have also audited, in accordance with the standards of the Public Company Accounting Oversight Board (United States), the consolidated financial statements and financial statement schedule as of and for the year ended December 31, 2015 of the Company and our report dated February 29, 2016 expressed an unqualified opinion on those financial statements and financial statement schedule.
/s/ DELOITTE & TOUCHE LLP
San Francisco, California
February 29, 2016
44
Item 9B. Other Information
None.
PART III
Item 10. Directors, Executive Officers and Corporate Governance
Certain information regarding our executive officers is included in Part I, Item 1, of this Annual Report on Form 10-K under “Executive Officers of the Registrant.” All other information regarding directors, executive officers and corporate governance required by this item is incorporated herein by reference to the applicable information in the proxy statement for our 2016 annual meeting of stockholders, which will be filed with the SEC within 120 days after our fiscal year end of December 31, 2015, and is set forth under “Nominees for Director,” “Corporate Governance Profile,” “Section 16(a) Beneficial Ownership Reporting Compliance,” and in other applicable sections in the proxy statement.
Item 11. Executive Compensation
The information required by this item is incorporated herein by reference to the applicable information in the proxy statement for our 2016 annual meeting of stockholders and is set forth under “Executive Compensation.”
The information in the section of the proxy statement for our 2016 annual meeting captioned “Compensation Committee Report” is incorporated by reference herein but shall be deemed furnished, not filed and shall not be deemed to be incorporated by reference into any filing we make under the Securities Act of 1933 or the Exchange Act.
Item 12. Security Ownership of Certain Beneficial Owners and Management and Related Stockholder Matters
The information required by this item is incorporated herein by reference to the applicable information in the proxy statement for our 2016 annual meeting of stockholders and is set forth under “Beneficial Ownership of Voting Securities” and “Equity Compensation Plan Information.”
Item 13. Certain Relationships and Related Transactions, and Director Independence
The information required by this item is incorporated herein by reference to the applicable information in the proxy statement for our 2016 annual meeting of stockholders and is set forth under “Certain Relationships and Related Transactions” and “Corporate Governance Profile.”
Item 14. Principal Accountant Fees and Services
The information required by this item is incorporated herein by reference to the proxy statement for our 2016 annual meeting of stockholders and is set forth under “Auditor Fees.”
45
PART IV
Item 15. Exhibits and Financial Statement Schedules.
(a) The following documents are filed as part of this Annual Report on Form 10-K:
(1) Financial Statements |
Report of Independent Registered Public Accounting Firm Deloitte & Touche LLP |
Consolidated Balance Sheets as of December 31, 2015 and 2014 |
Consolidated Statements of Operations for the years ended December 31, 2015, 2014 and 2013 |
Consolidated Statements of Comprehensive Income (Loss) for the years ended December 31, 2015, 2014 and 2013 |
Consolidated Statements of Equity for the years ended December 31, 2015, 2014 and 2013 |
Consolidated Statements of Cash Flows for the years ended December 31, 2015, 2014 and 2013 |
Notes to Consolidated Financial Statements |
(2) Financial Statement Schedules |
Schedule II — Valuation and Qualifying Accounts |
All other schedules have been omitted as the required information is not present or is not present in amounts sufficient to require submission of the schedule, or because the information required is included in the Consolidated Financial Statements and notes thereto.
(3) Exhibits
See Item 15(b) below.
(b) Exhibits
The following exhibits are filed herewith as part of this Annual Report on Form 10-K or are incorporated by reference to exhibits previously filed with the SEC:
46
Index to Exhibits
Number | Description | ||
3.1 | Certificate of Ownership and Merger as filed with Secretary of State of the State of Delaware (incorporated by reference to Exhibit 3.1 to the Registrant’s Form 8-K filed December 27, 2012). | ||
3.2 | Restated Certificate of Incorporation, filed March 13, 2013. | ||
3.3 | Second Amended and Restated Bylaws, (incorporated by reference to Exhibit 3.1 to the Registrant’s Form 8-K filed on October 6, 2009). | ||
4.1 | Specimen Stock Certificate (incorporated by reference to Exhibit 4.1 to the Registrant’s Form 10-K filed on March 9, 2011). | ||
4.2 | Registration Rights Agreement, dated December 1, 2010, among ARC Document Solutions, certain subsidiaries of ARC Document Solutions as guarantors thereto, and Merrill Lynch, Pierce, Fenner & Smith Incorporated, as representative of the several initial purchasers (incorporated by reference to Exhibit 4.3 to the Registrant’s Form 8-K filed on December 2, 2010). | ||
10.1 | ARC Document Solutions 2005 Stock Plan (incorporated by reference to Exhibit 10.7 to the Registrant’s Registration Statement on Form S-1 A (Reg. No. 333-119788), as amended on January 13, 2005).^ | ||
10.2 | Amendment No. 1 to ARC Document Solutions 2005 Stock Plan dated May 22, 2007 (incorporated by reference to Exhibit 10.63 to the Registrant’s Form 10-Q filed on August 9, 2007).^ | ||
10.3 | Amendment No. 2 to ARC Document Solutions 2005 Stock Plan dated May 2, 2008 (incorporated by reference to Exhibit 10.3 to the Registrant’s Form 10-Q filed August 8, 2008). ^ | ||
10.4 | Amendment No. 3 to ARC Document Solutions 2005 Stock Plan (incorporated by reference to Exhibit 10.1 to the Registrant’s Form 10-Q filed August 7, 2009). ^ | ||
10.5 | Forms of Stock Option Agreements under the 2005 Stock Plan (incorporated by reference to Exhibit 10.8 to the Registrant’s Registration Statement on Form S-1 (Reg. No. 333-119788), as filed on October 15, 2004).^ | ||
10.6 | Forms of Restricted Stock Award Agreements under 2005 Stock Plan (incorporated by reference to Exhibit 10.27 to the Registrant’s Registration Statement on Form S-1 A (Reg. No. 333-119788), as amended on December 6, 2004).^ | ||
10.7 | Form of Restricted Stock Unit Award Agreement under 2005 Stock Plan (incorporated by reference to Exhibit 10.28 to the Registrant’s Registration Statement on Form S-1 A (Reg. No. 333-119788), as amended on December 6, 2004).^ | ||
10.8 | Form of Stock Appreciation Right Agreement under 2005 Stock Plan (incorporated by reference to Exhibit 10.29 to the Registrant’s Registration Statement on Form S-1 A (Reg. No. 333-119788), as amended on January 13, 2005).^ | ||
10.9 | Form of ARC Document Solutions Stock Option Grant Notice — Non-employee Directors (Discretionary Non-statutory Stock Options) (incorporated by reference to Exhibit 10.1 to the Registrant’s Form 8-K filed on December 16, 2005).^ | ||
47
10.10 | Form of ARC Document Solutions Non-employee Directors Nonstatutory Stock Option Agreement (Discretionary Grants) (incorporated by reference to Exhibit 10.2 to the Registrant’s Form 8-K filed on December 16, 2005).^ | ||
10.11 | Amended and Restated ARC Document Solutions 2005 Employee Stock Purchase Plan amended and restated as of July 30, 2009 (incorporated by reference to Exhibit 10.1 to the Registrant’s Form 10-Q filed on November 9, 2009).^ | ||
10.12 | Lease Agreement, for the premises commonly known as 934 and 940 Venice Boulevard, Los Angeles, CA, dated November 19, 1997, by and between American Reprographics Company, L.L.C. (formerly Ford Graphics Group, L.L.C.) and Sumo Holdings LA, LLC (incorporated by reference to Exhibit 10.10 to the Registrant’s Registration Statement on Form S-1 (Reg. No. 333-119788), as filed on October 15, 2004). | ||
10.13 | Amendment to Lease for the premises commonly known as 934 and 940 Venice Boulevard, Los Angeles, CA, effective as of August 2, 2005, by and between Sumo Holdings LA, LLC, Landlord and American Reprographics Company, L.L.C. (formerly known as Ford Graphics Group, L.L.C.) Tenant (incorporated by reference to Exhibit 10.2 to the Registrant’s Form 10-Q filed on November 14, 2005). | ||
10.14 | Lease Agreement for the premises commonly known as 345 Clinton Street, Costa Mesa, CA, dated September 23, 2003, by and between American Reprographics Company (dba Consolidated Reprographics) and Sumo Holdings Costa Mesa, LLC (incorporated by reference to Exhibit 10.16 to the Registrant’s Registration Statement on Form S-1 (Reg. No. 333-119788), as filed on October 15, 2004). | ||
10.15 | Lease Agreement for the premises commonly known as 616 Monterey Pass Road, Monterey Park, CA, by and dated November 19, 1997, between Dieterich-Post Company and American Reprographics Company, L.L.C. (as successor lessee) (incorporated by reference to Exhibit 10.26 to the Registrant’s Form 10-K filed on March 1, 2007). | ||
10.16 | Indemnification Agreement, dated April 10, 2000, among American Reprographics Company, L.L.C., American Reprographics Holdings, L.L.C., ARC Acquisition Co., L.L.C., Mr. Chandramohan, Mr. Suriyakumar, Micro Device, Inc., Dieterich-Post Company, ZS Ford L.P., and ZS Ford L.L.C. (incorporated by reference to Exhibit 10.19 to the Registrant’s Registration Statement on Form S-1 (Reg. No. 333-119788), as filed on October 15, 2004). | ||
10.17 | Form of Indemnification Agreement between ARC Document Solutions, Inc. and each of its Directors and Executive Officers (incorporated by reference to Exhibit 10.42 to the Registrant's Form 10-K filed on March 13, 2013). | ||
10.18 | Letter Amendment, dated March 13, 2014, by and between ARC Document Solutions, Inc. and Mr. Suriyakumar (incorporated by reference to Exhibit 10.47 to the Registrant's Form 10-K filed on March 14, 2014).^ | ||
10.19 | Amended and Restated Employment Agreement, dated March 13, 2014, between ARC Document Solutions, Inc. and Mr. Kumarakulasingam (incorporated by reference to Exhibit 10.48 to the Registrant's Form 10-K filed on March 14, 2014).^ | ||
10.20 | Executive Employment Agreement, dated May 1, 2014, by and between ARC Document Solutions, Inc. and John Toth (incorporated by reference to Exhibit 10.1 to the Registrant’s Form 8-K filed on May 7, 2014). | ||
48
10.21 | Executive Employment Agreement, dated May 1, 2014, by and between ARC Document Solutions, Inc. and Rahul K. Roy (incorporated by reference to Exhibit 10.2 to the Registrant's Form 8-K filed on May 7, 2014).^ | ||
10.22 | Executive Employment Agreement, dated May 1, 2014, by and between ARC Document Solutions, Inc. and Dilantha Wijesuriya (incorporated by reference to Exhibit 10.3 to the Registrant's Form 8-K filed on May 7, 2014).^ | ||
10.23 | Executive Employment Agreement, dated May 1, 2014, by and between ARC Document Solutions, Inc. and Jorge Avalos (incorporated by reference to Exhibit 10.4 to the Registrant's Form 8-K filed on May 7, 2014).^ | ||
10.24 | ARC Document Solutions, Inc. 2014 Stock Incentive Plan (incorporated by reference to Exhibit 10.1 to the Registrant's Form 8-K filed on May 6, 2014). | ||
10.25 | Amendment No. 1 to ARC Document Solutions, Inc. 2014 Stock Incentive Plan (incorporated by reference to Exhibit 10.2 to the Registrant's Form 8-K filed on May 6, 2014). | ||
10.26 | Amended and Restated Executive Employment Agreement dated May 17, 2014 by and between ARC Document Solutions, Inc. and Mr. Suriyakumar (incorporated by reference to Exhibit 10.1 to the Registrant's Form 8-K filed on May 19, 2014).^ | ||
10.27 | Credit Agreement dated November 20, 2014, among ARC Document Solutions, LLC, Wells Fargo Bank, National Association, as administrative agent, and the lenders party thereto (incorporated by reference to Exhibit 10.1 to the Registrant’s Form 8-K filed on November 21, 2014). | ||
10.28 | Independent Consulting Agreement effective February 2, 2015, by and between ARC Document Solutions, Inc. and John Toth (incorporated by reference to Exhibit 10.1 to the Registrant's Form 8-K filed on January 30, 2015). | ||
10.29 | Amended and Restated Executive Employment Agreement, dated February 1, 2015, by and between ARC Document Solutions, Inc. and Jorge Avalos (incorporated by reference to Exhibit 10.2 to the Registrant's Form 8-K filed on January 30, 2015). ^ | ||
10.30 | Amendment to Credit Agreement, dated June 4, 2015, among ARC Document Solutions, LLC, Wells Fargo Bank, National Association, as administrative agent and the financial institutions party thereto as lenders (incorporated by reference to Exhibit 99.1 to the Registrant's Form 8-K filed on June 5, 2015). | ||
10.31 | Amended and Restated Executive Employment Agreement, dated June 9, 2015, between ARC Document Solutions, Inc. and Jorge Avalos (incorporated by reference to Exhibit 10.1 to the Registrant's Form 8-K filed on June 16, 2015). ^ | ||
10.32 | Amended and Restated Executive Employment Agreement, dated June 9, 2015, between ARC Document Solutions, Inc. and Rahul K. Roy (incorporated by reference to Exhibit 10.2 to the Registrant's Form 8-K filed on June 16, 2015). ^ | ||
10.33 | Amended and Restated Executive Employment Agreement, dated June 9, 2015, between ARC Document Solutions, Inc. and Dilantha Wijesuriya (incorporated by reference to Exhibit 10.3 to the Registrant's Form 8-K filed on June 16, 2015). ^ | ||
10.34 | Amendment Letter, dated as of February 5, 2016, by and among ARC Document Solutions, LLC, the lenders party thereto and Wells Fargo Bank, National Association, as administrative agent (incorporated by reference to Exhibit 99.1 to the Registrant's Form 8-K filed on February 8, 2016). | ||
21.1 | List of Subsidiaries.* | ||
49
Number | Description | ||
23.1 | Consent of Deloitte & Touche LLP, Independent Registered Public Accounting Firm.* | ||
31.1 | Certification of Principal Executive Officer pursuant to Rules 13a-14(a)/15d-14(a) of the Securities Exchange Act of 1934, as adopted pursuant to Section 302 of the Sarbanes-Oxley Act of 2002.* | ||
31.2 | Certification of Principal Financial Officer pursuant to Rules 13a-14(a)/15d-14(a) of the Securities Exchange Act of 1934, as adopted pursuant to Section 302 of the Sarbanes-Oxley Act of 2002.* | ||
32.1 | Certification of Chief Executive Officer pursuant to 18 U.S.C. Section 1350, as adopted pursuant to Section 906 of the Sarbanes-Oxley Act of 2002.* | ||
32.2 | Certification of Chief Financial Officer pursuant to 18 U.S.C. Section 1350, as adopted pursuant to Section 906 of the Sarbanes-Oxley Act of 2002.* | ||
101.INS | XBRL Instance Document * | ||
101.SCH | XBRL Taxonomy Extension Schema * | ||
101.CAL | XBRL Taxonomy Extension Calculation Linkbase * | ||
101.DEF | XBRL Taxonomy Extension Definition Linkbase * | ||
101.LAB | XBRL Taxonomy Extension Label Linkbase * | ||
101.PRE | XBRL Taxonomy Extension Presentation Linkbase * | ||
* | Filed herewith |
^ | Indicates management contract or compensatory plan or agreement |
50
SIGNATURES
Pursuant to the requirements of Section 13 or 15(d) of the Securities Exchange Act of 1934, the Registrant has duly caused this report to be signed on its behalf by the undersigned, thereunto duly authorized.
ARC DOCUMENT SOLUTIONS, INC. | ||
By: | /s/ KUMARAKULASINGAM SURIYAKUMAR | |
Chairman, President and Chief Executive Officer | ||
Date: February 29, 2016
Pursuant to the requirements of the Securities Exchange Act of 1934, this report has been signed below by the following persons on behalf of the registrant in the capacities and on the dates indicated.
Signature | Title | Date | ||
/s/ KUMARAKULASINGAM SURIYAKUMAR Kumarakulasingam Suriyakumar | Chairman, President and Chief Executive Officer and Director (Principal Executive Officer) | February 29, 2016 | ||
/s/ JORGE AVALOS Jorge Avalos | Chief Financial Officer (Principal Financial Officer) | February 29, 2016 | ||
/s/ THOMAS J. FORMOLO Thomas J. Formolo | Director | February 29, 2016 | ||
/s/ ERIBERTO SCOCIMARA Eriberto Scocimara | Director | February 29, 2016 | ||
/s/ DEWITT KERRY MCCLUGGAGE Dewitt Kerry McCluggage | Director | February 29, 2016 | ||
/s/ JAMES F. MCNULTY James F. McNulty | Director | February 29, 2016 | ||
/s/ MARK W. MEALY Mark W. Mealy | Director | February 29, 2016 | ||
/s/ MANUEL PEREZ DE LA MESA Manuel Perez de la Mesa | Director | February 29, 2016 | ||
51
INDEX TO CONSOLIDATED FINANCIAL STATEMENTS
Report of Independent Registered Public Accounting Firm Deloitte & Touche LLP | F-2 | ||
Consolidated Balance Sheets as of December 31, 2015 and 2014 | |||
Consolidated Statements of Operations for the years ended December 31, 2015, 2014 and 2013 | |||
Consolidated Statements of Comprehensive Income (Loss) for the years ended December 31, 2015, 2014 and 2013 | |||
Consolidated Statements of Equity for the years ended December 31, 2015, 2014 and 2013 | |||
Consolidated Statements of Cash Flows for the years ended December 31, 2015, 2014 and 2013 | F-7 | ||
Notes to Consolidated Financial Statements | F-8 | ||
Financial Statement Schedule: | |||
Schedule II — Valuation and Qualifying Accounts | F-29 | ||
F-1
REPORT OF INDEPENDENT REGISTERED PUBLIC ACCOUNTING FIRM
To the Board of Directors and Stockholders of
ARC Document Solutions, Inc.
Walnut Creek, California
We have audited the accompanying consolidated balance sheets of ARC Document Solutions, Inc. and subsidiaries (the "Company") as of December 31, 2015 and 2014, and the related consolidated statements of operations, comprehensive income (loss), equity, and cash flows for each of the three years in the period ended December 31, 2015. Our audits also included the financial statement schedule listed in the Index at Item 15. These financial statements and financial statement schedule are the responsibility of the Company's management. Our responsibility is to express an opinion on the financial statements and financial statement schedule based on our audits.
We conducted our audits in accordance with the standards of the Public Company Accounting Oversight Board (United States). Those standards require that we plan and perform the audit to obtain reasonable assurance about whether the financial statements are free of material misstatement. An audit includes examining, on a test basis, evidence supporting the amounts and disclosures in the financial statements. An audit also includes assessing the accounting principles used and significant estimates made by management, as well as evaluating the overall financial statement presentation. We believe that our audits provide a reasonable basis for our opinion.
In our opinion, such consolidated financial statements present fairly, in all material respects, the financial position of ARC Document Solutions, Inc. and subsidiaries as of December 31, 2015 and 2014, and the results of their operations and their cash flows for each of the three years in the period ended December 31, 2015, in conformity with accounting principles generally accepted in the United States of America. Also, in our opinion, such financial statement schedule, when considered in relation to the basic consolidated financial statements taken as a whole, presents fairly, in all material respects, the information set forth therein.
We have also audited, in accordance with the standards of the Public Company Accounting Oversight Board (United States), the Company’s internal control over financial reporting as of December 31, 2015, based on the criteria established in Internal Control - Integrated Framework (2013) issued by the Committee of Sponsoring Organizations of the Treadway Commission and our report dated February 29, 2016 expressed an unqualified opinion on the Company’s internal control over financial reporting.
/s/ DELOITTE & TOUCHE LLP
San Francisco, California
February 29, 2016
F-2
ARC DOCUMENT SOLUTIONS, INC.
CONSOLIDATED BALANCE SHEETS
(In thousands, except per share data)
December 31, | December 31, | ||||||
2015 | 2014 | ||||||
Assets | |||||||
Current assets: | |||||||
Cash and cash equivalents | $ | 23,963 | $ | 22,636 | |||
Accounts receivable, net of allowances for accounts receivable of $2,094 and $2,413 | 60,085 | 62,045 | |||||
Inventories, net | 16,972 | 16,251 | |||||
Deferred income taxes | — | 278 | |||||
Prepaid expenses | 4,555 | 4,767 | |||||
Other current assets | 4,131 | 6,080 | |||||
Total current assets | 109,706 | 112,057 | |||||
Property and equipment, net of accumulated depreciation of $202,457 and $214,697 | 57,590 | 59,520 | |||||
Goodwill | 212,608 | 212,608 | |||||
Other intangible assets, net | 17,946 | 23,841 | |||||
Deferred financing fees, net | 1,586 | 2,440 | |||||
Deferred income taxes | 74,196 | 1,110 | |||||
Other assets | 2,492 | 2,492 | |||||
Total assets | $ | 476,124 | $ | 414,068 | |||
Liabilities and Equity | |||||||
Current liabilities: | |||||||
Accounts payable | $ | 23,989 | $ | 26,866 | |||
Accrued payroll and payroll-related expenses | 12,118 | 13,765 | |||||
Accrued expenses | 19,194 | 22,793 | |||||
Current portion of long-term debt and capital leases | 14,374 | 27,969 | |||||
Total current liabilities | 69,675 | 91,393 | |||||
Long-term debt and capital leases | 158,604 | 175,916 | |||||
Deferred income taxes | 35,933 | 33,463 | |||||
Other long-term liabilities | 2,778 | 3,458 | |||||
Total liabilities | 266,990 | 304,230 | |||||
Commitments and contingencies (Note 8) | |||||||
Stockholders’ equity: | |||||||
ARC Document Solutions, Inc. stockholders’ equity: | |||||||
Preferred stock, $0.001 par value, 25,000 shares authorized; 0 shares issued and outstanding | — | — | |||||
Common stock, $0.001 par value, 150,000 shares authorized; 47,130 and 46,800 shares issued and 47,029 and 46,723 shares outstanding | 47 | 47 | |||||
Additional paid-in capital | 115,089 | 110,650 | |||||
Retained earnings (deficit) | 89,687 | (7,353 | ) | ||||
Accumulated other comprehensive loss | (2,097 | ) | (161 | ) | |||
202,726 | 103,183 | ||||||
Less cost of common stock in treasury, 101 and 77 shares | 612 | 408 | |||||
Total ARC Document Solutions, Inc. stockholders’ equity | 202,114 | 102,775 | |||||
Noncontrolling interest | 7,020 | 7,063 | |||||
Total equity | 209,134 | 109,838 | |||||
Total liabilities and equity | $ | 476,124 | $ | 414,068 | |||
The accompanying notes are an integral part of these consolidated financial statements.
F-3
ARC DOCUMENT SOLUTIONS, INC.
CONSOLIDATED STATEMENTS OF OPERATIONS
(In thousands, except per share data)
Year Ended December 31, | |||||||||||
2015 | 2014 | 2013 | |||||||||
Service sales | $ | 378,638 | $ | 371,884 | $ | 355,358 | |||||
Equipment and supplies sales | 50,027 | 51,872 | 51,837 | ||||||||
Total net sales | 428,665 | 423,756 | 407,195 | ||||||||
Cost of sales | 280,541 | 279,478 | 272,858 | ||||||||
Gross profit | 148,124 | 144,278 | 134,337 | ||||||||
Selling, general and administrative expenses | 107,280 | 107,672 | 96,800 | ||||||||
Amortization of intangible assets | 5,642 | 5,987 | 6,612 | ||||||||
Restructuring expense | 89 | 777 | 2,544 | ||||||||
Income from operations | 35,113 | 29,842 | 28,381 | ||||||||
Other income, net | (99 | ) | (96 | ) | (106 | ) | |||||
Loss on extinguishment of debt | 282 | 5,599 | 16,339 | ||||||||
Interest expense, net | 6,974 | 14,560 | 23,737 | ||||||||
Income (loss) before income tax (benefit) provision | 27,956 | 9,779 | (11,589 | ) | |||||||
Income tax (benefit) provision | (69,432 | ) | 2,348 | 2,986 | |||||||
Net income (loss) | 97,388 | 7,431 | (14,575 | ) | |||||||
Income attributable to noncontrolling interest | (348 | ) | (156 | ) | (748 | ) | |||||
Net income (loss) attributable to ARC Document Solutions, Inc. shareholders | $ | 97,040 | $ | 7,275 | $ | (15,323 | ) | ||||
Earnings (loss) per share attributable to ARC Document Solutions, Inc. shareholders: | |||||||||||
Basic | $ | 2.08 | $ | 0.16 | $ | (0.33 | ) | ||||
Diluted | $ | 2.04 | $ | 0.15 | $ | (0.33 | ) | ||||
Weighted average common shares outstanding: | |||||||||||
Basic | 46,631 | 46,245 | 45,856 | ||||||||
Diluted | 47,532 | 47,088 | 45,856 | ||||||||
The accompanying notes are an integral part of these consolidated financial statements.
F-4
ARC DOCUMENT SOLUTIONS, INC.
CONSOLIDATED STATEMENTS OF COMPREHENSIVE INCOME (LOSS)
(In thousands, except per share data)
Year Ended December 31, | |||||||||||
2015 | 2014 | 2013 | |||||||||
Net income (loss) | $ | 97,388 | $ | 7,431 | $ | (14,575 | ) | ||||
Other comprehensive (loss) income, net of tax | |||||||||||
Foreign currency translation adjustments | (2,116 | ) | (851 | ) | 190 | ||||||
Fair value adjustment of derivatives, net of tax | (211 | ) | — | — | |||||||
Other comprehensive (loss) income, net of tax | (2,327 | ) | (851 | ) | 190 | ||||||
Comprehensive income (loss) | 95,061 | 6,580 | (14,385 | ) | |||||||
Comprehensive (loss) income attributable to noncontrolling interest | (43 | ) | 100 | 993 | |||||||
Comprehensive income (loss) attributable to ARC Document Solutions, Inc. shareholders | $ | 95,104 | $ | 6,480 | $ | (15,378 | ) | ||||
The accompanying notes are an integral part of these consolidated financial statements.
F-5
ARC DOCUMENT SOLUTIONS, INC.
CONSOLIDATED STATEMENTS OF EQUITY
(In thousands, except per share data)
ARC Document Solutions, Inc. Shareholders | ||||||||||||||||||||||||||||||
Common Stock | Accumulated | |||||||||||||||||||||||||||||
Shares | Par Value | Additional Paid-in Capital | Retained Earnings (Deficit) | Other Comprehensive Income (loss) | Common Stock in Treasury | Noncontrolling Interest | Total | |||||||||||||||||||||||
Balance at December 31, 2012 | 46,274 | $ | 46 | $ | 102,510 | $ | 695 | $ | 689 | $ | (44 | ) | $ | 6,941 | $ | 110,837 | ||||||||||||||
Stock-based compensation | 41 | 3,207 | $ | 3,207 | ||||||||||||||||||||||||||
Issuance of common stock under Employee Stock Purchase Plan | 6 | 30 | $ | 30 | ||||||||||||||||||||||||||
Stock options exercised | 11 | $ | — | 59 | $ | 59 | ||||||||||||||||||||||||
Dividends paid to noncontrolling interest | (485 | ) | $ | (485 | ) | |||||||||||||||||||||||||
Treasury shares | 33 | (124 | ) | $ | (124 | ) | ||||||||||||||||||||||||
Comprehensive (loss) income | (15,323 | ) | (55 | ) | 993 | $ | (14,385 | ) | ||||||||||||||||||||||
Balance at December 31, 2013 | 46,365 | $ | 46 | $ | 105,806 | $ | (14,628 | ) | $ | 634 | $ | (168 | ) | $ | 7,449 | $ | 99,139 | |||||||||||||
Stock-based compensation | 167 | 3,532 | 3,532 | |||||||||||||||||||||||||||
Issuance of common stock under Employee Stock Purchase Plan | 13 | 82 | 82 | |||||||||||||||||||||||||||
Stock options exercised | 223 | 1 | 1,230 | 1,231 | ||||||||||||||||||||||||||
Dividends paid to noncontrolling interest | (486 | ) | (486 | ) | ||||||||||||||||||||||||||
Treasury shares | 32 | (240 | ) | (240 | ) | |||||||||||||||||||||||||
Comprehensive income (loss) | 7,275 | (795 | ) | 100 | 6,580 | |||||||||||||||||||||||||
Balance at December 31, 2014 | 46,800 | $ | 47 | $ | 110,650 | $ | (7,353 | ) | $ | (161 | ) | $ | (408 | ) | $ | 7,063 | $ | 109,838 | ||||||||||||
Stock-based compensation | 131 | 3,783 | 3,783 | |||||||||||||||||||||||||||
Issuance of common stock under Employee Stock Purchase Plan | 21 | 111 | 111 | |||||||||||||||||||||||||||
Stock options exercised | 154 | — | 673 | 673 | ||||||||||||||||||||||||||
Tax deficiency from stock-based compensation | (128 | ) | (128 | ) | ||||||||||||||||||||||||||
Treasury shares | 24 | (204 | ) | (204 | ) | |||||||||||||||||||||||||
Comprehensive income (loss) | 97,040 | (1,936 | ) | (43 | ) | 95,061 | ||||||||||||||||||||||||
Balance at December 31, 2015 | 47,130 | $ | 47 | $ | 115,089 | $ | 89,687 | $ | (2,097 | ) | $ | (612 | ) | $ | 7,020 | $ | 209,134 | |||||||||||||
The accompanying notes are an integral part of these consolidated financial statements.
F-6
ARC DOCUMENT SOLUTIONS, INC.
CONSOLIDATED STATEMENTS OF CASH FLOWS
(In thousands, except per share data)
Year Ended December 31, | |||||||||||
2015 | 2014 | 2013 | |||||||||
Cash flows from operating activities | |||||||||||
Net income (loss) | $ | 97,388 | $ | 7,431 | $ | (14,575 | ) | ||||
Adjustments to reconcile net income (loss) to net cash provided by operating activities: | |||||||||||
Allowance for accounts receivable | 340 | 546 | 636 | ||||||||
Depreciation | 28,019 | 28,148 | 28,133 | ||||||||
Amortization of intangible assets | 5,642 | 5,987 | 6,612 | ||||||||
Amortization of deferred financing costs | 589 | 758 | 1,098 | ||||||||
Amortization of discount on long-term debt | — | 764 | 671 | ||||||||
Stock-based compensation | 3,512 | 3,802 | 3,207 | ||||||||
Deferred income taxes | 10,173 | 5,429 | (4,909 | ) | |||||||
Deferred tax valuation allowance | (80,669 | ) | (3,552 | ) | 7,277 | ||||||
Restructuring expense, non-cash portion | — | — | 244 | ||||||||
Loss on early extinguishment of debt | 282 | 5,599 | 16,339 | ||||||||
Other non-cash items, net | (390 | ) | (462 | ) | (323 | ) | |||||
Changes in operating assets and liabilities, net of effect of business acquisitions: | |||||||||||
Accounts receivable | 729 | (6,898 | ) | (5,133 | ) | ||||||
Inventory | (967 | ) | (2,220 | ) | 376 | ||||||
Prepaid expenses and other assets | 2,296 | (1,830 | ) | 1,966 | |||||||
Accounts payable and accrued expenses | (6,963 | ) | 6,510 | 5,179 | |||||||
Net cash provided by operating activities | 59,981 | 50,012 | 46,798 | ||||||||
Cash flows from investing activities | |||||||||||
Capital expenditures | (14,245 | ) | (13,269 | ) | (18,191 | ) | |||||
Payments for businesses acquired, net of cash acquired | (142 | ) | (342 | ) | — | ||||||
Other | 731 | (185 | ) | 741 | |||||||
Net cash used in investing activities | (13,656 | ) | (13,796 | ) | (17,450 | ) | |||||
Cash flows from financing activities | |||||||||||
Proceeds from stock option exercises | 673 | 1,227 | 59 | ||||||||
Proceeds from issuance of common stock under Employee Stock Purchase Plan | 111 | 82 | 30 | ||||||||
Share repurchases - shares surrendered for tax withholding | (204 | ) | (240 | ) | (124 | ) | |||||
Contingent consideration on prior acquisitions | (413 | ) | — | — | |||||||
Proceeds from borrowings on long-term debt agreements | — | 175,000 | 196,402 | ||||||||
Payments of debt extinguishment costs | — | — | (11,330 | ) | |||||||
Early extinguishment of long-term debt | (14,500 | ) | (194,500 | ) | (200,000 | ) | |||||
Payments on long-term debt agreements and capital leases | (27,329 | ) | (19,217 | ) | (12,379 | ) | |||||
Net (repayments) borrowings under revolving credit facilities | (1,888 | ) | 98 | (237 | ) | ||||||
Payment of deferred financing costs | (25 | ) | (2,735 | ) | (2,220 | ) | |||||
Payment of hedge premium | (632 | ) | — | — | |||||||
Dividends paid to noncontrolling interest | — | (486 | ) | (485 | ) | ||||||
Net cash used in financing activities | (44,207 | ) | (40,771 | ) | (30,284 | ) | |||||
Effect of foreign currency translation on cash balances | (791 | ) | (171 | ) | 277 | ||||||
Net change in cash and cash equivalents | 1,327 | (4,726 | ) | (659 | ) | ||||||
Cash and cash equivalents at beginning of period | 22,636 | 27,362 | 28,021 | ||||||||
Cash and cash equivalents at end of period | $ | 23,963 | $ | 22,636 | $ | 27,362 | |||||
Supplemental disclosure of cash flow information: | |||||||||||
Cash paid for interest | $ | 7,247 | $ | 13,303 | $ | 22,873 | |||||
Income taxes paid (received), net | $ | 721 | $ | 548 | $ | (3,345 | ) | ||||
Noncash financing activities: | |||||||||||
Capital lease obligations incurred | $ | 13,157 | $ | 19,055 | $ | 10,399 | |||||
Liabilities in connection with the acquisition of businesses | $ | — | $ | 1,768 | $ | — | |||||
Liabilities in connection with deferred financing costs | $ | — | $ | 8 | $ | 433 | |||||
The accompanying notes are an integral part of these consolidated financial statements.
F-7
ARC DOCUMENT SOLUTIONS, INC.
NOTES TO CONSOLIDATED FINANCIAL STATEMENTS
(In thousands, except per share data or where otherwise noted)
1. DESCRIPTION OF BUSINESS AND BASIS OF PRESENTATION
ARC Document Solutions, Inc. (“ARC Document Solutions,” “ARC” or the “Company”) is a leading document solutions company serving businesses of all types, with an emphasis on the non-residential segment of the architecture, engineering and construction (“AEC”) industry. ARC offers a variety of services including: Construction Document Information Management ("CDIM"), Managed Print Services ("MPS"), and Archive and Information Management ("AIM"). In addition, ARC also sells Equipment and Supplies. The Company conducts its operations through its wholly-owned operating subsidiary, ARC Document Solutions, LLC, a Texas limited liability company, and its affiliates.
Basis of Presentation
The accompanying Consolidated Financial Statements include the accounts of the Company and its subsidiaries. All material intercompany accounts and transactions have been eliminated in consolidation.
The preparation of financial statements in conformity with accounting principles generally accepted in the United States of America (“GAAP”) requires management to make estimates and assumptions that affect the amounts reported in the Consolidated Financial Statements and accompanying notes. The Company evaluates its estimates and assumptions on an ongoing basis and relies on historical experience and various other factors that it believes to be reasonable under the circumstances to determine such estimates. Actual results could differ from those estimates and such differences may be material to the Consolidated Financial Statements.
Risk and Uncertainties
The Company generates the majority of its revenue from sales of services and products to customers in the AEC industry. As a result, the Company’s operating results and financial condition can be significantly affected by economic factors that influence the AEC industry, such as non-residential construction spending, GDP growth, interest rates, unemployment rates, and office vacancy rates. Reduced activity (relative to historic levels) in the AEC industry would diminish demand for some of ARC’s services and products, and would therefore negatively affect revenues and have a material adverse effect on its business, operating results and financial condition.
As part of the Company’s growth strategy, ARC intends to continue to offer and grow a variety of service offerings that are relatively new to the Company. The success of the Company’s efforts will be affected by its ability to acquire new customers for the Company’s new service offerings, as well as to sell the new service offerings to existing customers. The Company’s inability to successfully market and execute these relatively new service offerings could significantly affect its business and reduce its long term revenue, resulting in an adverse effect on its results of operations and financial condition.
2. SUMMARY OF SIGNIFICANT ACCOUNTING POLICIES
Cash Equivalents
Cash equivalents include demand deposits and short-term investments with a maturity of three months or less when purchased.
The Company maintains its cash deposits at numerous banks located throughout the United States, Canada, India, Australia, the United Kingdom and China, which at times, may exceed federally insured limits. UDS, the Company’s operations in China, held $13.7 million of the Company’s cash and cash equivalents as of December 31, 2015. The Company has not experienced any losses in such accounts and believes it is not exposed to any significant risk on cash and cash equivalents.
Restricted Cash
As of December 31, 2014, the Company had restricted cash of $1.4 million related to a government grant received by UNIS Document Solutions Co. Ltd., (“UDS”), the Company's joint-venture in China, which was included in other current assets. Restrictions on the cash were removed in 2015 upon approval by the governmental agency of project-based expenditures supporting technology investments made by UDS.
Concentrations of Credit Risk and Significant Vendors
Concentrations of credit risk with respect to trade receivables are limited due to a large, diverse customer base. No individual customer represented more than 4% of net sales during the years ended December 31, 2015, 2014 and 2013.
F-8
The Company has geographic concentration risk as sales in California, as a percent of total sales, were approximately 31%, 30% and 31% for the years ended December 31, 2015, 2014 and 2013, respectively.
The Company contracts with various suppliers. Although there are a limited number of suppliers that could supply the Company’s inventory, management believes any shortfalls from existing suppliers would be absorbed from other suppliers on comparable terms. However, a change in suppliers could cause a delay in sales and adversely affect results.
Purchases from the Company’s three largest vendors during the years ended December 31, 2015, 2014 and 2013 comprised approximately 37%, 33%, and 36% respectively, of the Company’s total purchases of inventory and supplies.
Allowance for Doubtful Accounts
The Company performs periodic credit evaluations of the financial condition of its customers, monitors collections and payments from customers, and generally does not require collateral. The Company provides for the possible inability to collect accounts receivable by recording an allowance for doubtful accounts. The Company writes off an account when it is considered uncollectible. The Company estimates the allowance for doubtful accounts based on historical experience, aging of accounts receivable, and information regarding the credit worthiness of its customers. Additionally, the Company provides an allowance for returns and discounts based on historical experience. In 2015, 2014, and 2013 the Company recorded expenses of $0.3 million, $0.5 million and $0.6 million, respectively, related to the allowance for doubtful accounts.
Inventories
Inventories are valued at the lower of cost (determined on a first-in, first-out basis; or average cost) or market. Inventories primarily consist of reprographics materials for use and resale, and equipment for resale. On an ongoing basis, inventories are reviewed and adjusted for estimated obsolescence or unmarketable inventories to reflect the lower of cost or market. Charges to increase inventory reserves are recorded as an increase in cost of sales. Estimated inventory obsolescence has been provided for in the financial statements and has been within the range of management’s expectations. As of December 31, 2015 and 2014, the reserves for inventory obsolescence was $0.9 million.
Income Taxes
Deferred tax assets and liabilities reflect temporary differences between the amount of assets and liabilities for financial and tax reporting purposes. Such amounts are adjusted, as appropriate, to reflect changes in tax rates expected to be in effect when the temporary differences reverse. A valuation allowance is recorded to reduce the Company's deferred tax assets to the amount that is more likely than not to be realized. Changes in tax laws or accounting standards and methods may affect recorded deferred taxes in future periods.
When establishing a valuation allowance, the Company considers future sources of taxable income such as future reversals of existing taxable temporary differences, future taxable income exclusive of reversing temporary differences and carryforwards and tax planning strategies. A tax planning strategy is an action that: is prudent and feasible; an enterprise ordinarily might not take, but would take to prevent an operating loss or tax credit carryforward from expiring unused; and would result in realization of deferred tax assets. In the event the Company determines that its deferred tax assets, more likely than not, will not be realized in the future, the valuation adjustment to the deferred tax assets will be charged to earnings in the period in which the Company makes such a determination.
At September 30, 2015 as a result of sustained profitability in the U.S. evidenced by three years of earnings and forecasted continuing profitability (as defined by Financial Accounting Standards Board (“FASB”) Accounting Standards Codification (“ASC”) 740-10, Income Taxes), the Company determined it was more likely than not future earnings would be sufficient to realize deferred tax assets in the U.S. Accordingly the Company reversed most of its U.S.valuation allowance resulting in non-cash income tax benefit of $80.7 million for the year ended December 31, 2015. The Company continues to carry a $1.3 million valuation allowance against certain deferred tax assets as of December 31, 2015.
In future quarters the Company will continue to evaluate its historical results for the preceding twelve quarters and its future projections to determine whether the Company will generate sufficient taxable income to utilize its deferred tax assets, and whether a valuation allowance is required. Should the Company generate sufficient taxable income, however, a portion or all of the then current valuation allowance may be reversed.
The Company calculates its current and deferred tax provision based on estimates and assumptions that could differ from the actual results reflected in income tax returns filed in subsequent years. Adjustments based on filed returns are recorded when identified.
F-9
Income taxes have not been provided on certain undistributed earnings of foreign subsidiaries because such earnings are considered to be permanently reinvested.
The amount of taxable income or loss the Company reports to the various tax jurisdictions is subject to ongoing audits by federal, state and foreign tax authorities. The Company's estimate of the potential outcome of any uncertain tax issue is subject to management’s assessment of relevant risks, facts, and circumstances existing at that time. The Company uses a more-likely-than-not threshold for financial statement recognition and measurement of tax positions taken or expected to be taken in a tax return. The Company records a liability for the difference between the benefit recognized and measured and tax position taken or expected to be taken on its tax return. To the extent that the Company's assessment of such tax positions changes, the change in estimate is recorded in the period in which the determination is made. The Company reports tax-related interest and penalties as a component of income tax expense.
The Company’s effective income tax rate differs from the statutory tax rate primarily due to the valuation allowance on certain of the Company’s deferred tax assets, state income taxes, stock-based compensation, goodwill and other identifiable intangibles, and other discrete items. See Note 9 “Income Taxes” for further information.
Income tax deficiencies and benefits affecting stockholders’ equity are primarily related to employee stock-based compensation.
Property and Equipment
Property and equipment are stated at cost and are depreciated using the straight-line method over their estimated useful lives, as follows:
Buildings | 10-20 years | |
Leasehold improvements | 10-20 years or lease term, if shorter | |
Machinery and equipment | 3-7 years | |
Furniture and fixtures | 3-7 years | |
Assets acquired under capital lease arrangements are included in machinery and equipment, are recorded at the present value of the minimum lease payments, and are depreciated using the straight-line method over the life of the asset or term of the lease, whichever is shorter. Expenses for repairs and maintenance are charged to expense as incurred, while renewals and betterments are capitalized. Gains or losses on the sale or disposal of property and equipment are reflected in operating income.
The Company accounts for software costs developed for internal use in accordance with ASC 350-40, Intangibles – Goodwill and Other, which requires companies to capitalize certain qualifying costs incurred during the application development stage of the related software development project. The primary use of this software is for internal use and, accordingly, such capitalized software development costs are depreciated on a straight-line basis over the economic lives of the related products not to exceed three years. The Company’s machinery and equipment (see Note 6 “Property and Equipment”) includes $0.6 million and $0.1 million of capitalized software development costs as of December 31, 2015 and 2014, net of accumulated amortization of $17.7 million and $17.5 million as of December 31, 2015 and 2014, respectively. Depreciation expense includes the amortization of capitalized software development costs which amounted to $0.2 million, $0.2 million and $0.3 million during the years ended December 31, 2015, 2014 and 2013, respectively.
Impairment of Long-Lived Assets
The Company periodically assesses potential impairments of its long-lived assets in accordance with the provisions of ASC 360, Accounting for the Impairment or Disposal of Long-lived Assets. An impairment review is performed whenever events or changes in circumstances indicate that the carrying value of the assets may not be recoverable. The Company groups its assets at the lowest level for which identifiable cash flows are largely independent of the cash flows of the other assets and liabilities. The Company has determined that the lowest level for which identifiable cash flows are available is the regional level, which is the operating segment level.
Factors considered by the Company include, but are not limited to, significant underperformance relative to historical or projected operating results; significant changes in the manner of use of the acquired assets or the strategy for the overall business; and significant negative industry or economic trends. When the carrying value of a long-lived asset may not be recoverable based upon the existence of one or more of the above indicators of impairment, the Company estimates the future undiscounted cash flows expected to result from the use of the asset and its eventual disposition. If the sum of the expected future undiscounted cash flows and eventual disposition is less than the carrying amount of the asset, the Company recognizes an impairment loss. An
F-10
impairment loss is reflected as the amount by which the carrying amount of the asset exceeds the fair value of the asset, based on the fair value if available, or discounted cash flows, if fair value is not available. The Company had no long-lived asset impairments in 2015, 2014 or 2013.
Goodwill and Other Intangible Assets
In connection with acquisitions, the Company applies the provisions of ASC 805, Business Combinations, using the acquisition method of accounting. The excess purchase price over the assessed fair value of net tangible assets and identifiable intangible assets acquired is recorded as goodwill.
In accordance with ASC 350, Intangibles – Goodwill and Other, the Company assesses goodwill for impairment annually as of September 30, and more frequently if events and circumstances indicate that goodwill might be impaired.
Goodwill impairment testing is performed at the reporting unit level. Goodwill is assigned to reporting units at the date the goodwill is initially recorded. Once goodwill has been assigned to reporting units, it no longer retains its association with a particular acquisition, and all of the activities within a reporting unit, whether acquired or internally generated, are available to support the value of the goodwill.
Goodwill impairment testing is a two-step process. Step one involves comparing the fair value of the reporting units to its carrying amount. If the carrying amount of a reporting unit is greater than zero and its fair value is greater than its carrying amount, there is no impairment. If the reporting unit’s carrying amount is greater than the fair value, the second step must be completed to measure the amount of impairment, if any. Step two involves calculating the implied fair value of goodwill by deducting the fair value of all tangible and intangible assets, excluding goodwill, of the reporting unit from the fair value of the reporting unit as determined in step one. The implied fair value of goodwill determined in this step is compared to the carrying value of goodwill. If the implied fair value of goodwill is less than the carrying value of goodwill, an impairment loss is recognized equal to the difference.
The Company determines the fair value of its reporting units using an income approach. Under the income approach, the Company determined fair value based on estimated discounted future cash flows of each reporting unit. The cash flows are discounted by an estimated weighted-average cost of capital, which is intended to reflect the overall level of inherent risk of a reporting unit. Determining the fair value of a reporting unit is judgmental in nature and requires the use of significant estimates and assumptions, including revenue growth rates and EBITDA margins, discount rates and future market conditions, among others. The Company considered market information in assessing the reasonableness of the fair value under the income approach outlined above.
Other intangible assets that have finite lives are amortized over their useful lives. Customer relationships are amortized using the accelerated method, based on customer attrition rates, over their estimated useful lives of 13 (weighted average) years.
Deferred Financing Costs
Direct costs incurred in connection with debt agreements are capitalized as incurred and amortized based on the effective interest method for the Company's borrowings under its term loan credit agreement ("Term A Credit Agreement"). At December 31, 2015 and 2014, the Company had deferred financing costs of $1.6 million and $2.4 million, respectively, net of accumulated amortization of $1.0 million and $0.1 million, respectively.
In 2014, the Company added $2.5 million of deferred financing costs related to its Term A Credit Agreement. In addition, the Company wrote off $2.4 million of deferred financing costs due to the extinguishment, in full, of its previous credit agreements.
Derivative Financial Instruments
In January 2015, the Company entered into three interest rate cap contracts to hedge against its exposure to interest rate volatility: (1) $80.0 million notional interest rate cap effective in 2015, (2) $65.0 million notional forward interest rate cap effective in 2016, and (3) $50.0 million notional forward interest rate cap effective in 2017.
As of and for the year ended December 31, 2014 the Company was not party to any derivative or hedging transactions.
Historically, the Company enters into derivative instruments to manage its exposure to changes in interest rates. These instruments allow the Company to raise funds at floating rates and effectively swap them into fixed rates, without the exchange of the underlying principal amount. Such agreements are designated and accounted for under ASC 815, Derivatives and Hedging. Derivative instruments are recorded at fair value as either assets or liabilities in the Consolidated Balance Sheets.
F-11
Fair Values of Financial Instruments
The following methods and assumptions were used by the Company in estimating the fair value of its financial instruments for disclosure purposes:
Cash equivalents: Cash equivalents are time deposits with maturity of three months or less when purchased, which are highly liquid and readily convertible to cash. Cash equivalents reported in the Company’s Consolidated Balance Sheet were $6.3 million and $9.2 million as of December 31, 2015 and 2014, respectively, and are carried at cost and approximate fair value due to the relatively short period to maturity of these instruments.
Interest rate cap contracts: The Company determines the fair value of its interest rate cap contracts based on observable interest rate yield curves and represent the expected discounted cash flows underlying the financial instruments. Interest rate cap contracts reported in the Company's Consolidated Balance Sheet were $0.2 million as of December 31, 2015.
Contingent Liabilities: The Company recognizes liabilities for future earnout obligations on business acquisitions at their fair value based on discounted projected payments on such obligations. The inputs to the valuation, which are level 3 inputs within the fair value hierarchy, are projected sales to be provided by the acquired businesses based on historical sales trends for which earnout amounts are contractually based. Liabilities for future earnout obligations totaled $1.1 million as of December 31, 2015.
Short- and long-term debt: The carrying amount of the Company’s capital leases reported in the Consolidated Balance Sheets approximates fair value based on the Company’s current incremental borrowing rate for similar types of borrowing arrangements. The carrying amount reported in the Company’s Consolidated Balance Sheet as of December 31, 2015 for borrowings under its Term Loan Credit Agreement is $143.0 million. The Company has determined, utilizing observable market quotes, that the fair value of borrowings under its Term Loan Credit Agreement is $143.0 million, as of December 31, 2015.
Insurance Liability
The Company maintains a high deductible insurance policy for a significant portion of its risks and associated liabilities with respect to workers’ compensation. The Company’s deductible is $250 thousand per individual. The accrued liabilities associated with this program are based on the Company’s estimate of the ultimate costs to settle known claims, as well as claims incurred but not yet reported to the Company, as of the balance sheet date. The Company’s estimated liability is not discounted and is based upon an actuarial report obtained from a third party. The actuarial report uses information provided by the Company’s insurance brokers and insurers, combined with the Company’s judgments regarding a number of assumptions and factors, including the frequency and severity of claims, claims development history, case jurisdiction, applicable legislation, and the Company’s claims settlement practices.
The Company is self-insured for healthcare benefits provided to approximately 35% of its employees, with a stop-loss at $250 thousand per individual. Liabilities associated with the risks that are retained by the Company are estimated, in part, by considering historical claims experience, demographic factors, severity factors and other actuarial assumptions. The Company’s results could be materially affected by claims and other expenses related to such plans if future occurrences and claims differ from these assumptions and historical trends. Other employees are covered by other offered healthcare benefits.
Commitments and Contingencies
In the normal course of business, the Company estimates potential future loss accruals related to legal, workers’ compensation, healthcare, tax and other contingencies. These accruals require management’s judgment on the outcome of various events based on the best available information. However, due to changes in facts and circumstances, the ultimate outcomes could differ from management’s estimates.
Revenue Recognition
The Company applies the provisions of ASC 605, Revenue Recognition. In general, the Company recognizes revenue when (i) persuasive evidence of an arrangement exists, (ii) delivery of products has occurred or services have been rendered, (iii) the sales price charged is fixed or determinable and (iv) collection is reasonably assured. Net sales include an allowance for estimated sales returns and discounts.
The Company recognizes service revenue when services have been rendered, while revenues from the resale of equipment and supplies are recognized upon delivery to the customer or upon customer pickup. Revenue from equipment service agreements are recognized over the term of the service agreement.
F-12
The Company has established contractual pricing for certain large national customer accounts (“Global Solutions”). These contracts generally establish uniform pricing at all operating segments for Global Solutions. Revenues earned from the Company’s Global Solutions are recognized in the same manner as non-Global Solutions revenues.
Included in revenues are fees charged to customers for shipping, handling, and delivery services. Such revenues amounted to $11.2 million, $11.6 million, and $12.1 million for the years ended December 31, 2015, 2014 and 2013, respectively.
Revenues from hosted software licensing activities are recognized ratably over the term of the license. Revenues from software licensing activities comprise less than 1% of the Company’s consolidated revenues during the years ended December 31, 2015, 2014 and 2013.
Management provides for returns, discounts and allowances based on historic experience and adjusts such allowances as considered necessary. To date, such provisions have been within the range of management’s expectations.
Comprehensive Income (Loss)
The Company’s comprehensive income (loss) includes foreign currency translation adjustments and the fair value adjustment of derivatives, net of taxes.
In January 2015, the Company entered into three interest rate cap contracts to hedge against its exposure to interest rate volatility: (1) $80.0 million notional interest rate cap effective in 2015, (2) $65.0 million notional forward interest rate cap effective in 2016, and (3) $50.0 million notional forward interest rate cap effective in 2017.
Asset and liability accounts of international operations are translated into the Company’s functional currency, U.S. dollars, at current rates. Revenues and expenses are translated at the weighted-average currency rate for the fiscal year.
Segment and Geographic Reporting
The provisions of ASC 280, Segment Reporting, require public companies to report financial and descriptive information about their reportable operating segments. The Company identifies operating segments based on the various business activities that earn revenue and incur expense, whose operating results are reviewed by the Company's Chief Executive Officer, who is the Company's chief operating decision maker. Because its operating segments have similar products and services, classes of customers, production processes, distribution methods and economic characteristics, the Company operates as a single reportable segment.
Net sales of the Company’s principal services and products were as follows:
Year Ended December 31, | |||||||||||
2015 | 2014 | 2013 | |||||||||
Service Sales | |||||||||||
CDIM | $ | 221,174 | $ | 219,764 | $ | 216,305 | |||||
MPS | 144,244 | 141,313 | 128,205 | ||||||||
AIM | 13,220 | 10,807 | 10,848 | ||||||||
Total services sales | 378,638 | 371,884 | 355,358 | ||||||||
Equipment and Supplies Sales | 50,027 | 51,872 | 51,837 | ||||||||
Total net sales | $ | 428,665 | $ | 423,756 | $ | 407,195 | |||||
The Company recognizes revenues in geographic areas based on the location to which the product was shipped or services have been rendered. Operations outside the United States have been small but growing. See table below for revenues and long-lived assets, net, excluding intangible assets, attributable to the Company’s U.S. operations and foreign operations.
F-13
Year Ended December 31, | ||||||||||||||||||||||||||||||||||||
2015 | 2014 | 2013 | ||||||||||||||||||||||||||||||||||
U.S. | Foreign Countries | Total | U.S. | Foreign Countries | Total | U.S. | Foreign Countries | Total | ||||||||||||||||||||||||||||
Revenues from external customers | $ | 366,082 | $ | 62,583 | $ | 428,665 | $ | 364,382 | $ | 59,374 | $ | 423,756 | $ | 354,995 | $ | 52,200 | $ | 407,195 | ||||||||||||||||||
Long-lived assets, net, excluding intangible assets | $ | 50,777 | $ | 6,813 | $ | 57,590 | $ | 51,826 | $ | 7,694 | $ | 59,520 | $ | 48,319 | $ | 7,862 | $ | 56,181 | ||||||||||||||||||
Advertising and Shipping and Handling Costs
Advertising costs are expensed as incurred and approximated $2.0 million, $1.7 million, and $1.4 million during the years ended December 31, 2015, 2014 and 2013, respectively. Shipping and handling costs incurred by the Company are included in cost of sales.
Stock-Based Compensation
The Company applies the Black-Scholes valuation model in determining the fair value of share-based payments to employees, which is then amortized on a straight-line basis over the requisite service period.
Total stock-based compensation for the years ended December 31, 2015, 2014 and 2013, was $3.5 million, $3.8 million and $3.2 million, respectively and was recorded in selling, general, and administrative expenses, consistent with the classification of the underlying salaries. In accordance with ASC 718, Income Taxes, any excess tax benefit resulting from stock-based compensation, in the Consolidated Statements of Cash Flows, are classified as financing cash inflows.
The weighted average fair value at the grant date for options issued in the fiscal years ended December 31, 2015, 2014 and 2013, was $4.88, $3.69 and $1.57 respectively. The fair value of each option grant was estimated on the date of grant using the Black-Scholes option-pricing model using the following weighted average assumptions for the years ended December 31, 2015 and 2014 and 2013:
Year Ended December 31, | |||||||||
2015 | 2014 | 2013 | |||||||
Weighted average assumptions used: | |||||||||
Risk free interest rate | 1.62 | % | 2.12 | % | 1.36 | % | |||
Expected volatility | 56.2 | % | 57.3 | % | 59.7 | % | |||
Expected dividend yield | — | % | — | % | — | % | |||
Using historical exercise data as a basis, the Company determined that the expected term for stock options issued in 2015, 2014 and 2013 was 6.4 years, 7.1 years and 7.0 years, respectively.
For fiscal years 2015, 2014 and 2013, expected stock price volatility is based on the Company’s historical volatility for a period equal to the expected term. The risk-free interest rate is based on the U.S. Treasury yield curve in effect at the time of grant with an equivalent remaining term. The Company has not paid dividends in the past and does not currently plan to pay dividends in the near future. The Company assumed a forfeiture rate of 4% in 2015, 3% in 2014 and 3% in 2013. The Company’s assumed forfeiture rate is based on the historical forfeiture rate for employees at similar levels in the Company. The Company reviews its forfeiture rate at least on an annual basis.
As of December 31, 2015, total unrecognized stock-based compensation expense related to nonvested stock-based compensation was approximately $3.8 million, which is expected to be recognized over a weighted average period of approximately 2.0 years.
For additional information, see Note 10 “Employee Stock Purchase Plan and Stock Plan.”
Research and Development Expenses
Research and development activities relate to costs associated with the design and testing of new technology or enhancements and maintenance to existing technology. Such costs are expensed as incurred are primarily recorded to cost of sales. In total,
F-14
research and development amounted to $5.8 million, $6.3 million and $5.5 million during the fiscal years ended December 31, 2015, 2014 and 2013, respectively.
Noncontrolling Interest
The Company accounted for its investment in UNIS Document Solutions Co. Ltd., (“UDS”) under the purchase method of accounting, in accordance with ASC 805, Business Combinations. UDS has been consolidated in the Company’s financial statements from the date of acquisition. Noncontrolling interest, which represents the 35 percent non-controlling interest in UDS, is reflected on the Company’s Consolidated Financial Statements.
Sales Taxes
The Company bills sales taxes, as applicable, to its customers. The Company acts as an agent and bills, collects, and remits the sales tax to the proper government jurisdiction. The sales taxes are accounted for on a net basis, and therefore are not included as part of the Company’s revenue.
Earnings Per Share
The Company accounts for earnings per share in accordance with ASC 260, Earnings Per Share. Basic earnings per share are computed by dividing net income attributable to ARC by the weighted-average number of common shares outstanding for the period. Diluted earnings per common share is computed similarly to basic earnings per share except that the denominator is increased to include the number of additional common shares that would have been outstanding if common shares subject to outstanding options and acquisition rights had been issued and if the additional common shares were dilutive. Common share equivalents are excluded from the computation if their effect is anti-dilutive. There were 2.0 million, 1.5 million and 2.1 million common stock options excluded as their effect would have been anti-dilutive for the years ended December 31, 2015, 2014 and 2013, respectively. The Company’s common share equivalents consist of stock options issued under the Company’s Stock Plan.
Basic and diluted weighted average common shares outstanding were calculated as follows for the years ended December 31, 2015, 2014 and 2013:
Year Ended December 31, | ||||||||
2015 | 2014 | 2013 | ||||||
Weighted average common shares outstanding during the period — basic | 46,631 | 46,245 | 45,856 | |||||
Effect of dilutive stock options | 901 | 843 | — | |||||
Weighted average common shares outstanding during the period — diluted | 47,532 | 47,088 | 45,856 | |||||
Recent Accounting Pronouncements
On February 25, 2016, the FASB issued Accounting Standards Codification (“ASC”) 842 (“ASC 842”), Leases. The new guidance replaces the existing guidance in ASC 840, Leases. ASC 842 requires a dual approach for lessee accounting under which a lessee would account for leases as finance leases or operating leases. Both finance leases and operating leases will result in the lessee recognizing a right-of-use (ROU) asset and a corresponding lease liability. For finance leases the lessee would recognize interest expense and amortization of the ROU asset and for operating leases the lessee would recognize a straight-line total lease expense. ASC 842 is effective for fiscal years, and interim periods within those years, beginning after December 15, 2018. The Company is currently in the process of evaluating the impact of the adoption of ASC 842 on its consolidated financial statements.
In November 2015, the FASB issued Accounting Standards Update (“ASU”) 2015-17, Income Taxes (Topic 740): Balance Sheet Classification of Deferred Taxes. The new guidance requires that deferred tax assets and liabilities be classified as noncurrent in a classified balance sheet in order to simplify the presentation of deferred income taxes. ASU 2015-17 is effective for annual reporting periods beginning after December 15, 2016, including interim periods within that reporting period. Early adoption is permitted and the update may be applied either prospectively to all deferred tax assets and liabilities or retrospectively to all periods presented. The Company elected to early adopt ASU 2015-17 as of December 31, 2015 on a prospective basis.
In July 2015, the FASB issued ASU 2015-11, Simplifying the Measurement of Inventory. The new guidance requires that inventory be measured at the lower of cost or net realizable value and amends existing guidance which requires inventory be measured at the lower of cost or market. Replacing the concept of market with the single measurement of net realizable value is intended to create efficiencies for financial statement preparers. ASU 2015-11 is effective for annual reporting periods beginning
F-15
after December 15, 2016, including interim periods within that reporting period. Early adoption is permitted. The Company is currently in the process of evaluating the impact of the adoption of ASU 2015-11 on its consolidated financial statements.
In April 2015, the FASB issued ASU 2015-05, Intangibles-Goodwill and Other-Internal-Use Software (Subtopic 350-40): Customer’s Accounting for Fees Paid in a Cloud Computing Arrangement. The new guidance amends Accounting Standards Codification ("ASC") 350-40, Intangibles - Goodwill and Other, Internal-Use Software, to provide guidance on determining whether a cloud computing arrangement contains a software license that should be accounted for as internal-use software. ASU 2015-05 is effective for annual reporting periods beginning after December 15, 2015, including interim periods within that reporting period. Early adoption is permitted. The Company is currently in the process of evaluating the impact of the adoption of ASU 2015-05 on its consolidated financial statements.
In April 2015, the FASB issued ASU 2015-03, Interest-Imputation of Interest (Subtopic 835-30): Simplifying the Presentation of Debt Issuance Costs, which changes the presentation of deferred financing fees in an entity's financial statements. Under the ASU, deferred financing fees are to be presented in the balance sheet as a direct deduction from the related debt liability rather than as an asset. ASU 2015-03 is effective for annual reporting periods beginning after December 15, 2015, including interim periods within that reporting period. Early adoption is permitted. The Company expects to adopt ASU 2015-03 for the quarterly report on Form 10-Q for the three months ended March 31, 2016.
In May 2014, the FASB issued ASU 2014-09, Revenue from Contracts with Customers (Topic 606), which supersedes the existing revenue recognition requirements in “Revenue Recognition (Topic 605).” The new guidance requires entities to recognize revenues when promised goods or services are transferred to customers in an amount that reflects the consideration that is expected to be received in exchange for those goods or services. ASU 2014-09 is effective for annual reporting periods beginning after December 15, 2017, including interim periods within that reporting period. Early adoption is not permitted. The Company is currently in the process of evaluating the impact of the adoption of ASU 2014-09 on its consolidated financial statements.
3. RESTRUCTURING EXPENSES
To ensure that the Company’s costs and resources were in line with demand for its current portfolio of services and products, management initiated a restructuring plan in the fourth quarter of 2012. Restructuring activities associated with the plan concluded in the fourth quarter of 2013. Through December 31, 2013, the restructuring plan included the closure or downsizing of 56 of the Company’s service centers, which represented more than 25% of its total number of service center locations. In addition, as part of the restructuring plan, the Company reduced headcount and middle management associated with its service center locations, streamlined the senior operational management team, and allocated more resources into growing sales categories such as MPS. The reduction in headcount totaled approximately 300 full-time employees, which represented approximately 10% of the Company’s total workforce. To date, the Company has incurred $6.7 million of expense related to its restructuring plan.
Restructuring expenses include employee termination costs, estimated lease termination and obligation costs, and other restructuring expenses. The Company’s restructuring efforts included service center closures in both 2012 and 2013. The Company closed or downsized 23 service center locations in 2013, in addition to 33 service center locations in 2012. Restructuring expenses in 2015 primarily consisted of revised estimated lease termination and obligation costs resulting from facilities closed in 2013.
The following table summarizes restructuring expenses incurred in 2015, 2014 and 2013:
Year Ended December 31, | |||||||||||
2015 | 2014 | 2013 | |||||||||
Employee termination costs | $ | — | $ | — | $ | 15 | |||||
Estimated lease termination and obligation costs | 89 | 554 | 1,803 | ||||||||
Other restructuring expenses | — | 223 | 726 | ||||||||
Total restructuring expenses | $ | 89 | $ | 777 | $ | 2,544 | |||||
The changes in the restructuring liability from December 31, 2013 through December 31, 2015 are summarized as follows:
F-16
Balance, December 31, 2013 | $ | 539 | |
Restructuring expenses | 777 | ||
Payments | (1,203 | ) | |
Balance, December 31, 2014 | $ | 113 | |
Restructuring expenses | 89 | ||
Payments | (165 | ) | |
Balance, December 31, 2015 | $ | 37 | |
4. ACQUISITIONS
During 2015 the Company had no business acquisitions.
During 2014, the Company acquired five businesses. Consideration for the purchase of the five businesses included earnout liabilities of $2.1 million, of which $0.6 million and $0.3 million were paid in cash in 2015 and 2014, respectively, with a remaining earnout liabilities balance of $1.1 million as of December 31, 2015. The Company's requirement to pay these earnout liabilities is contingent upon the future financial growth of the acquired businesses. The results of operations of the companies acquired have been included in the Consolidated Financial Statements from their respective dates of acquisition. The acquisitions, individually and in aggregate, were not material to the Company's consolidated results of operations.
5. GOODWILL AND OTHER INTANGIBLES RESULTING FROM BUSINESS ACQUISITIONS
In connection with acquisitions, the Company applies the provisions of ASC 805, Business Combinations, using the acquisition method of accounting. The excess purchase price over the assessed fair value of net tangible assets and identifiable intangible assets acquired is recorded as goodwill.
In accordance with ASC 350, Intangibles-Goodwill and Other, the Company assesses goodwill for impairment annually as of September 30, and more frequently if events and circumstances indicate that goodwill might be impaired.
At September 30, 2015, the Company performed its preliminary assessment and noted that one reporting unit failed step one of the impairment analysis; however, step two of the analysis was subject to finalization of the implied fair value of goodwill. The Company completed step two of the analysis in the fourth quarter of 2015 with no change to the previous estimate that there was no goodwill impairment as of September 30, 2015.
Goodwill impairment testing is performed at the reporting unit level. Goodwill is assigned to reporting units at the date the goodwill is initially recorded. Once goodwill has been assigned to reporting units, it no longer retains its association with a particular acquisition, and all of the activities within a reporting unit, whether acquired or internally generated, are available to support the value of the goodwill.
Goodwill impairment testing is a two-step process. Step one involves comparing the fair value of the reporting units to its carrying amount. If the carrying amount of a reporting unit is greater than zero and its fair value is greater than its carrying amount, there is no impairment. If the reporting unit’s carrying amount is greater than the fair value, the second step must be completed to measure the amount of impairment, if any. Step two involves calculating the implied fair value of goodwill by deducting the fair value of all tangible and intangible assets, excluding goodwill, of the reporting unit from the fair value of the reporting unit as determined in step one. The implied fair value of goodwill determined in this step is compared to the carrying value of goodwill. If the implied fair value of goodwill is less than the carrying value of goodwill, an impairment loss is recognized equal to the difference.
The Company determines the fair value of its reporting units using an income approach. Under the income approach, the Company determined fair value based on estimated discounted future cash flows of each reporting unit. The cash flows are discounted by an estimated weighted-average cost of capital, which is intended to reflect the overall level of inherent risk of a reporting unit. Determining the fair value of a reporting unit is judgmental in nature and requires the use of significant estimates and assumptions, including revenue growth rates and EBITDA margins, discount rates and future market conditions, among others. The Company considered market information in assessing the reasonableness of the fair value under the income approach outlined above.
Given the current economic environment, the changing document and printing needs of the Company’s customers, and the
F-17
uncertainties regarding the related impact on the Company’s business, there can be no assurance that the estimates and assumptions made for purposes of the Company’s goodwill impairment testing in 2015 will prove to be accurate predictions of the future. If the Company’s assumptions, including forecasted EBITDA of certain reporting units, are not achieved, the Company may be required to record additional goodwill impairment charges in future periods, whether in connection with the Company’s next annual impairment testing in the third quarter of 2016, or on an interim basis, if any such change constitutes a triggering event (as defined under ASC 350, Intangibles-Goodwill and Other ) outside of the quarter when the Company regularly performs its annual goodwill impairment test. It is not possible at this time to determine if any such future impairment charge would result or, if it does, whether such charge would be material.
There was no change in the carrying amount of goodwill from January 1, 2014 through December 31, 2015.
Other intangible assets that have finite lives are amortized over their useful lives. Customer relationships are amortized using the accelerated method, based on customer attrition rates, over their estimated useful lives of 13 (weighted average) years. The Company acquired five businesses during 2014 and recorded customer relationship intangibles of $2.1 million related to the acquisitions.
The following table sets forth the Company’s other intangible assets resulting from business acquisitions as of December 31, 2015 and December 31, 2014 which continue to be amortized:
December 31, 2015 | December 31, 2014 | ||||||||||||||||||||||
Gross Carrying Amount | Accumulated Amortization | Net Carrying Amount | Gross Carrying Amount | Accumulated Amortization | Net Carrying Amount | ||||||||||||||||||
Amortizable other intangible assets | |||||||||||||||||||||||
Customer relationships | $ | 99,050 | $ | 81,572 | $ | 17,478 | $ | 99,606 | $ | 76,298 | $ | 23,308 | |||||||||||
Trade names and trademarks | 20,329 | 19,861 | 468 | 20,370 | 19,837 | 533 | |||||||||||||||||
$ | 119,379 | $ | 101,433 | $ | 17,946 | $ | 119,976 | $ | 96,135 | $ | 23,841 | ||||||||||||
Based on current information, estimated future amortization expense of other intangible assets for each of the next five fiscal years and thereafter are as follows:
2016 | $ | 4,793 | |
2017 | 4,238 | ||
2018 | 3,829 | ||
2019 | 3,112 | ||
2020 | 1,505 | ||
Thereafter | 469 | ||
$ | 17,946 | ||
6. PROPERTY AND EQUIPMENT
Property and equipment consist of the following:
December 31, | |||||||
2015 | 2014 | ||||||
Machinery and equipment | $ | 241,125 | $ | 254,206 | |||
Buildings and leasehold improvements | 15,833 | 16,399 | |||||
Furniture and fixtures | 3,089 | 3,612 | |||||
260,047 | 274,217 | ||||||
Less accumulated depreciation | (202,457 | ) | (214,697 | ) | |||
$ | 57,590 | $ | 59,520 | ||||
Depreciation expense was $28.0 million, $28.1 million, and $28.1 million for the years ended December 31, 2015, 2014 and 2013, respectively.
F-18
7. LONG-TERM DEBT
Long-term debt consists of the following:
December 31, | |||||||
2015 | 2014 | ||||||
Term A loan facility maturing 2019; 2.50% and 2.74% interest rate at December 31, 2015 and December 31, 2014 | $ | 143,000 | $ | 173,000 | |||
Various capital leases; weighted average interest rate of 5.8% and 6.8% at December 31, 2015 and December 31, 2014; principal and interest payable monthly through November 2020 | 29,866 | 28,789 | |||||
Borrowings from foreign revolving credit facilities; 0.6% interest rate at December 31, 2014 | — | 1,897 | |||||
Various other notes payable with a weighted average interest rate of 8.5% and 6.5% at December 31, 2015 and December 31, 2014; principal and interest payable monthly through November 2019 | 112 | 199 | |||||
172,978 | 203,885 | ||||||
Less current portion | (14,374 | ) | (27,969 | ) | |||
$ | 158,604 | $ | 175,916 | ||||
Term A Loan Facility
On November 20, 2014 the Company entered into a Credit Agreement (the “Term A Credit Agreement”) with Wells Fargo Bank, National Association, as administrative agent and the lenders party thereto.
The Term A Credit Agreement provides for the extension of term loans (“Term Loans”) in an aggregate principal amount of $175.0 million, the entirety of which was disbursed on the Closing Date in order to pay outstanding obligations under the Company’s Term Loan Credit Agreement dated as of December 20, 2013. The Credit Agreement also provides for the extension of revolving loans (“Revolving Loans”) in an aggregate principal amount not to exceed $30.0 million. The Revolving Loan facility under the Term A Credit Agreement replaces the Company’s Credit Agreement dated as of January 27, 2012. The Company may request incremental commitments to the aggregate principal amount of Term Loans and Revolving Loans available under the Term A Credit Agreement by an amount not to exceed $75 million in the aggregate. Unless an incremental commitment to increase the Term Loan or provide a new term loan matures at a later date, the obligations under the Term A Credit Agreement mature on November 20, 2019. As of December 31, 2015, the Company's borrowing availability under the Term A Credit Agreement was $28.1 million, which was the maximum borrowing limit of $30.0 million reduced by outstanding letters of credit of $1.9 million.
Loans borrowed under the Term A Credit Agreement bear interest, in the case of LIBOR rate loans, at a per annum rate equal to the applicable LIBOR rate, plus a margin ranging from 1.50% to 2.50%, based on the Company’s Total Leverage Ratio (as defined in the Term A Credit Agreement). Loans borrowed under the Term A Credit Agreement that are not LIBOR rate loans bear interest at a per annum rate equal to (i) the greatest of (A) the Federal Funds Rate plus 0.50%, (B) the one month LIBOR rate plus 1.00% per annum, and (C) the rate of interest announced, from time to time, by Wells Fargo Bank, National Association as its “prime rate,” plus (ii) a margin ranging from 0.50% to 1.50%, based on our Company’s Total Leverage Ratio.
The Company will pay certain recurring fees with respect to the credit facility, including administration fees to the administrative agent.
Subject to certain exceptions, including in certain circumstances, reinvestment rights, the loans extended under the Term A Credit Agreement are subject to customary mandatory prepayment provisions with respect to: the net proceeds from certain asset sales; the net proceeds from certain issuances or incurrences of debt (other than debt permitted to be incurred under the terms of the Term A Credit Agreement); the net proceeds from certain issuances of equity securities; and net proceeds of certain insurance recoveries and condemnation events of the Company.
The Term A Credit Agreement contains customary representations and warranties, subject to limitations and exceptions, and customary covenants restricting the ability (subject to various exceptions) of the Company and its subsidiaries to: incur additional indebtedness (including guarantee obligations); incur liens; sell certain property or assets; engage in mergers or other fundamental changes; consummate acquisitions; make investments; pay dividends, other distributions or repurchase equity interest of the Company or its subsidiaries; change the nature of their business; prepay or amend certain indebtedness; engage in certain transactions with affiliates; amend their organizational documents; or enter into certain restrictive agreements. In addition, the Term A Credit Agreement contains financial covenants which requires the Company to maintain (i) at all times, a Total Leverage Ratio in an amount not to exceed 3.25 to 1.00 through the Company’s fiscal quarter ending September 30, 2016, and thereafter, in an amount not to exceed 3.00 to 1.00; and (ii) a Fixed Charge Coverage Ratio (as defined in the Term A Credit Agreement), as of the last day of each fiscal quarter, in an amount not less than 1.25 to 1.00. On February 5, 2016, the Term A Credit Agreement
F-19
was amended to exclude up to $15.0 million of stock repurchases from the calculation of the Company's Fixed Charge Coverage Ratio, provided that those stock repurchases are consummated in accordance with the other terms and conditions of the agreement.
The Term A Credit Agreement contains customary events of default, including with respect to: nonpayment of principal, interest, fees or other amounts; failure to perform or observe covenants; material inaccuracy of a representation or warranty when made; cross-default to other material indebtedness; bankruptcy, insolvency and dissolution events; inability to pay debts; monetary judgment defaults; actual or asserted invalidity or impairment of any definitive loan documentation, repudiation of guaranties or subordination terms; certain ERISA related events; or a change of control.
The obligations of the Company’s subsidiary that is the borrower under the Term A Credit Agreement are guaranteed by the Company and each other United States domestic subsidiary of the Company. The Term A Credit Agreement and any interest rate protection and other hedging arrangements provided by any lender party to the Credit Facility or any affiliate of such a lender are secured on a first priority basis by a perfected security interest in substantially all of the borrower’s, the Company’s and each guarantor’s assets (subject to certain exceptions).
As of December 31, 2015, the Company paid $32.0 million in aggregate principal on its $175.0 million Term Loan Credit Agreement, which was $14.5 million above the required principal payments. The $14.5 million early pay down of the term loan resulted in a loss on extinguishment of debt of $0.3 million in 2015.
Term B Loan Facility
On December 20, 2013, we entered into a Term Loan Credit Agreement (the “Term B Loan Credit Agreement”) among ARC, as borrower, JPMorgan Chase Bank., N.A, as administrative agent and as collateral agent, and the lenders party thereto. Concurrently with the Company’s entry into the Term A Credit Agreement described above, the Company paid in full and terminated the Term B Loan Credit Agreement resulting in a loss on early extinguishment of debt of $5.6 million in 2014.
The credit facility provided under the Term B Loan Credit Agreement consisted of an initial term loan facility of $200.0 million, the entirety of which was disbursed in order to pay for the purchase of the Notes that were accepted under a cash tender offer and the subsequent redemption of the remaining outstanding Notes and to pay associated fees and expenses in connection with the cash tender offer and redemption.
10.5% Senior Notes
On December 1, 2010, the Company completed a private placement of 10.5% senior unsecured notes due 2016 (the “Notes”). During the third and fourth quarters of 2013, the Company repurchased $12.3 million in aggregate principal amount of the Notes in the open market using available cash. In December 2013 the Company commenced a cash tender offer and consent solicitation for all of the remaining outstanding Notes and accepted for payment all Notes that were validly tendered, followed by a redemption of all Notes which remained outstanding following the tender offer. In addition, the Company discharged all of its obligations under the indenture governing the Notes by causing to be delivered a notice of redemption to holders of the remaining outstanding Notes and the Company deposited funds sufficient to pay and discharge all remaining indebtedness on the Notes, including accrued and unpaid interest. The purchase and redemption of the Notes resulted in a loss on early extinguishment of debt of $16.3 million in 2013.
Foreign Credit Agreement
In the third quarter of 2014, in conjunction with its Chinese operations, UNIS Document Solutions Co. Ltd. (“UDS”), the Company’s Chinese business venture with Beijing-based Unisplendour, entered into a revolving credit facility with a term of 12 months. The credit agreement expired in September 2015.
Other Notes Payable
Includes notes payable collateralized by equipment previously purchased.
Minimum future maturities of long-term debt and capital lease obligations as of December 31, 2015 are as follows:
F-20
Long-Term Debt | Capital Lease Obligations | ||||||
Year ending December 31: | |||||||
2016 | $ | 3,112 | $ | 11,262 | |||
2017 | 17,500 | 9,164 | |||||
2018 | 17,500 | 6,307 | |||||
2019 | 105,000 | 2,595 | |||||
2020 | — | 538 | |||||
Thereafter | — | — | |||||
$ | 143,112 | $ | 29,866 | ||||
8. COMMITMENTS AND CONTINGENCIES
The Company leases machinery, equipment, and office and operational facilities under non-cancelable operating lease agreements. Certain lease agreements for the Company’s facilities generally contain renewal options and provide for annual increases in rent based on the local Consumer Price Index. The following is a schedule of the Company’s future minimum lease payments as of December 31, 2015:
Third Party | Related Party | Total | ||||||||||
Year ending December 31: | ||||||||||||
2016 | $ | 15,565 | $ | 504 | $ | 16,069 | ||||||
2017 | 11,267 | 504 | 11,771 | |||||||||
2018 | 7,160 | 504 | 7,664 | |||||||||
2019 | 3,992 | 514 | 4,506 | |||||||||
2020 | 2,831 | 514 | 3,345 | |||||||||
Thereafter | 2,826 | 1,542 | 4,368 | |||||||||
$ | 43,641 | $ | 4,082 | $ | 47,723 | |||||||
Total rent expense under operating leases, including month-to-month rentals, amounted to $24.0 million, $23.4 million, and $24.1 million during the years ended December 31, 2015, 2014 and 2013, respectively. Under certain lease agreements, the Company is responsible for other costs such as property taxes, insurance, maintenance, and utilities.
The Company leased several of its facilities under lease agreements with entities owned by certain of its current and former executive officers which expire through December 2023. The rental payments on these facilities amounted to $0.5 million, $0.5 million and $0.9 million during the years ended December 31, 2015, 2014 and 2013, respectively.
The Company has entered into indemnification agreements with each director and named executive officer which provide indemnification under certain circumstances for acts and omissions which may not be covered by any directors’ and officers’ liability insurance. The indemnification agreements may require the Company, among other things, to indemnify its officers and directors against certain liabilities that may arise by reason of their status or service as officers and directors (other than liabilities arising from willful misconduct of a culpable nature), to advance their expenses incurred as a result of any proceeding against them as to which they could be indemnified, and to obtain officers’ and directors’ insurance if available on reasonable terms. There have been no events to date which would require the Company to indemnify its officers or directors.
On October 21, 2010, a former employee, individually and on behalf of a purported class consisting of all non-exempt employees who work or worked for American Reprographics Company, L.L.C. and American Reprographics Company in the State of California at any time from October 21, 2006 through the present, filed an action against the Company in the Superior Court of California for the County of Orange. The complaint alleges, among other things, that the Company violated the California Labor Code by failing to (i) provide meal and rest periods, or compensation in lieu thereof, (ii) timely pay wages due at termination, and (iii) that those practices also violate the California Business and Professions Code. The relief sought includes damages, restitution, penalties, interest, costs, and attorneys’ fees and such other relief as the court deems proper. On March 15, 2013, the Company participated in a private mediation session with claimants’ counsel which did not result in resolution of the claim. Subsequent to the mediation session, the mediator issued a proposal that was accepted by both parties. The Company has received preliminary court approval of the settlement, and awaits final court approval. The Company has a liability $0.9 million as of
F-21
December 31, 2015 related to the claim, which represents management's best estimate based on information available. As such, the ultimate resolution of the claim could result in a loss different than the estimated loss recorded.
On February 1, 2013, ARC filed a civil complaint against a competitor and a former employee in the Superior Court of California for Orange County, which alleged, among other claims, the misappropriation of ARC trade secrets; namely, proprietary customer lists that were used to communicate with ARC customers in an attempt to unfairly acquire their business. In prior litigation with the competitor based on related facts, in 2007 the competitor entered into a settlement agreement and stipulated judgment, which included an injunction. ARC instituted this suit to stop the defendant from using similar unfair business practices against it in the Southern California market. The case proceeded to trial in May 2014, and a jury verdict was entered for the defendants. In the first quarter of 2015, the Company settled with the defendants and paid $1.0 million, which had been accrued as of December 31, 2014.
In addition to the matters described above, the Company is involved in various additional legal proceedings and other legal matters from time to time in the normal course of business. The Company does not believe that the outcome of any of these matters will have a material effect on its consolidated financial position, results of operations or cash flows.
9. INCOME TAXES
The following table includes the consolidated income tax provision for federal, state, and foreign income taxes related to the Company’s total earnings before taxes for 2015, 2014 and 2013:
Year Ended December 31, | ||||||||||||
2015 | 2014 | 2013 | ||||||||||
Current: | ||||||||||||
Federal | $ | 219 | $ | — | $ | — | ||||||
State | 364 | 86 | 264 | |||||||||
Foreign | 481 | 392 | 354 | |||||||||
1,064 | 478 | 618 | ||||||||||
Deferred: | ||||||||||||
Federal | (56,750 | ) | 1,453 | 1,898 | ||||||||
State | (13,705 | ) | 343 | 869 | ||||||||
Foreign | (41 | ) | 74 | (399 | ) | |||||||
(70,496 | ) | 1,870 | 2,368 | |||||||||
Income tax (benefit) provision | $ | (69,432 | ) | $ | 2,348 | $ | 2,986 | |||||
The Company's foreign earnings before taxes were $1.1 million, $0.3 million and $2.3 million for 2015, 2014 and 2013, respectively.
The consolidated deferred tax assets and liabilities consist of the following:
F-22
December 31, | |||||||
2015 | 2014 | ||||||
Deferred tax assets: | |||||||
Financial statement accruals not currently deductible | $ | 3,409 | $ | 3,661 | |||
Accrued vacation | 1,215 | 914 | |||||
Deferred revenue | 280 | 420 | |||||
State taxes | 116 | 62 | |||||
Fixed assets | 7,647 | 8,004 | |||||
Goodwill and other identifiable intangibles | 20,828 | 25,079 | |||||
Stock-based compensation | 5,562 | 5,098 | |||||
Federal tax net operating loss carryforward | 29,089 | 33,005 | |||||
State tax net operating loss carryforward, net | 5,096 | 5,179 | |||||
State tax credits, net | 1,002 | 994 | |||||
Foreign tax credit carryforward | 517 | 506 | |||||
Foreign tax net operating loss carryforward | 380 | 455 | |||||
Federal alternative minimum tax | 222 | — | |||||
Interest rate hedge | 140 | — | |||||
Gross deferred tax assets | 75,503 | 83,377 | |||||
Less: valuation allowance | (1,307 | ) | (81,989 | ) | |||
Net deferred tax assets | 74,196 | 1,388 | |||||
Deferred tax liabilities: | |||||||
Goodwill and other identifiable intangibles | $ | (35,933 | ) | $ | (33,463 | ) | |
Net deferred tax assets (liabilities) | $ | 38,263 | $ | (32,075 | ) | ||
A reconciliation of the statutory federal income tax rate to the Company’s effective tax rate is as follows:
Year Ended December 31, | ||||||||
2015 | 2014 | 2013 | ||||||
Statutory federal income tax rate | 35 | % | 35 | % | 35 | % | ||
State taxes, net of federal benefit | 5 | 4 | 3 | |||||
Foreign taxes | — | 1 | 4 | |||||
Valuation allowance | (289 | ) | (36 | ) | (63 | ) | ||
Non-deductible expenses and other | 1 | 3 | (1 | ) | ||||
Section 162(m) limitation | 1 | 4 | (2 | ) | ||||
Stock-based compensation | — | 16 | (8 | ) | ||||
Discrete item for state taxes | (1 | ) | (4 | ) | 8 | |||
Discrete items for other | — | 1 | (2 | ) | ||||
Effective income tax rate | (248 | )% | 24 | % | (26 | )% | ||
In accordance with ASC 740-10, Income Taxes, the Company evaluates the need for deferred tax asset valuation allowances based on a more likely than not standard. The ability to realize deferred tax assets depends on the ability to generate sufficient taxable income within the carryback or carryforward periods provided for in the tax law for each applicable tax jurisdiction. The Company considers the following possible sources of taxable income when assessing the realization of deferred tax assets:
•Future reversals of existing taxable temporary differences;
•Future taxable income exclusive of reversing temporary differences and carryforwards;
•Taxable income in prior carryback years; and
•Tax-planning strategies.
The assessment regarding whether a valuation allowance is required or should be adjusted also considers all available positive and negative evidence factors, including but not limited to:
F-23
•Nature, frequency, and severity of recent losses;
•Duration of statutory carryforward periods;
•Historical experience with tax attributes expiring unused; and
•Near- and medium-term financial outlook.
It is difficult to conclude a valuation allowance is not required when there is significant objective and verifiable negative evidence, such as cumulative losses in recent years. The Company utilizes a rolling three years of actual and current year anticipated results as the primary measure of cumulative losses in recent years. The evaluation of deferred tax assets requires judgment in assessing the likely future tax consequences of events that have been recognized in the Company's financial statements or tax returns and future profitability. The Company's accounting for deferred tax consequences represents its best estimate of those future events. Changes in the Company's current estimates, due to unanticipated events or otherwise, could have a material effect on its financial condition and results of operations. At September 30, 2015 as a result of sustained profitability in the U.S. evidenced by three years of earnings and forecasted continuing profitability, the Company determined it was more likely than not that future earnings will be sufficient to realize certain of its deferred tax assets in the U.S. Accordingly the Company reversed most of its U.S. valuation allowance, resulting in non-cash income tax benefit of $80.7 million for the year ended December 31, 2015. The Company continues to carry a $1.3 million valuation allowance against certain deferred tax assets as of December 31, 2015.
Based on the Company’s assessment, the remaining net deferred tax assets as of December 31, 2015 are considered more likely than not to be realized. The valuation allowance of $1.3 million may be increased or reduced as conditions change or if the Company is unable to implement certain available tax planning strategies. The realization of the Company’s net deferred tax assets ultimately depend on future taxable income, reversals of existing taxable temporary differences or through a loss carry back. The Company has income tax receivables of $20 thousand as of December 31, 2015 included in other current assets in its Consolidated Balance Sheet primarily related to income tax refunds for prior years.
As of December 31, 2015, the Company had approximately $83.1 million of consolidated federal, $100.6 million of state and $1.9 million of foreign net operating loss and charitable contribution carryforwards available to offset future taxable income, respectively. The federal net operating loss carryforward began in 2011 and will begin to expire in varying amounts between 2031 and 2034. The charitable contribution carryforward began in 2009 and will begin to expire in varying amounts between 2016 and 2020. The state net operating loss carryforwards expire in varying amounts between 2016 and 2034. The foreign net operating loss carryforwards begin to expire in varying amounts beginning in 2016.
The Company or one of its subsidiaries files income tax returns in the U.S. federal jurisdiction, and various states and foreign jurisdictions. With few exceptions, the Company is no longer subject to U.S. federal, state and local, or non-U.S. income tax examinations by tax authorities for years before 2010. In 2010, the IRS commenced an examination of the Company’s U.S. income tax return for 2008, which was completed in February of 2011. The IRS did not propose any adjustments to the Company’s 2008 U.S. income tax return. In 2011, the IRS commenced an examination of the Company’s 2009 and 2010 U.S. income tax returns. The IRS did not propose any significant adjustments to the Company’s 2009 and 2010 U.S. income tax returns as of December 31, 2015.
A reconciliation of the beginning and ending amount of unrecognized tax benefits is as follows:
2014 | 2013 | |||||||
Beginning balance at January 1, | $ | 266 | $ | 266 | ||||
Additions based on tax positions related to the current year | — | — | ||||||
Reductions based on tax positions related to the prior year | (266 | ) | — | |||||
Reductions for tax positions due to expiration of statute of limitations | — | — | ||||||
Ending balance at December 31, | $ | — | $ | 266 | ||||
There were no unrecognized tax benefits as of and for the year ended December 31, 2015.
10. EMPLOYEE STOCK PURCHASE PLAN AND STOCK PLAN
Employee Stock Purchase Plan
Under the Company’s Employee Stock Purchase Plan (the “ESPP”) eligible employees may purchase up to a calendar year maximum per eligible employee of the lesser of (i) 2,500 shares of common stock, or (ii) a number of shares of common stock having an aggregate fair market value of $25 thousand as determined on the date of purchase at 85% of the fair market value of
F-24
such shares of common stock on the applicable purchase date. The compensation expense in connection with the ESPP in 2015, 2014, and 2013 was $19 thousand, $15 thousand and $5 thousand, respectively.
Employees purchased the following shares in the periods presented:
Year Ended December 31, | |||||||||||
2015 | 2014 | 2013 | |||||||||
Shares purchased | 21 | 13 | 6 | ||||||||
Average price per share | $ | 5.40 | $ | 6.24 | $ | 4.90 | |||||
Stock Plan
At the Company's annual meeting of stockholders held on May 1, 2014, the Company's stockholders approved the Company's 2014 Stock Plan (the “2014 Stock Plan”) as adopted by the Company's board of directors. The 2014 Stock Plan replaces the American Reprographics Company 2005 Stock Plan (the "2005 Plan"). The 2014 Stock Plan provides for the grant of incentive and non-statutory stock options, stock appreciation rights, restricted stock, restricted stock units, stock bonuses and other forms of awards granted or denominated in the Company's common stock or units of the Company's common stock, as well as cash bonus awards to employees, directors and consultants of the Company. The 2014 Stock Plan authorizes the Company to issue up to 3.5 million shares of common stock. At December 31, 2015, 2.3 million shares remain available for issuance under the Stock Plan.
Stock options granted under the 2014 Stock Plan generally expire no later than ten years from the date of grant. Options generally vest and become fully exercisable over a period of three to four years from date of award, except that options granted to non-employee directors may vest over a shorter time period. The exercise price of options must be equal to at least 100% of the fair market value of the Company’s common stock on the date of grant. The Company allows for cashless exercises of vested outstanding options.
During the years ended December 31, 2015 and 2014, the Company granted options to acquire a total of 526 thousand shares and 579 thousand shares, respectively, of the Company's common stock to certain key employees with an exercise price equal to the fair market value of the Company’s common stock on the date of grant. The granted stock options vest annually over three to four years from the grant date and expire 10 years after the date of grant.
The following is a further breakdown of the stock option activity under the Stock Plan:
Year Ended December 31, 2015 | ||||||||||||
Shares | Weighted Average Exercise Price | Weighted Average Contractual Life (In years) | Aggregate Intrinsic Value (In thousands) | |||||||||
Outstanding at December 31, 2013 | 3,613 | $ | 5.57 | |||||||||
Granted | 579 | $ | 6.25 | |||||||||
Exercised | (223 | ) | $ | 5.53 | ||||||||
Forfeited/Cancelled | (288 | ) | $ | 7.86 | ||||||||
Outstanding at December 31, 2014 | 3,681 | $ | 5.50 | |||||||||
Granted | 526 | $ | 8.91 | |||||||||
Exercised | (154 | ) | $ | 4.36 | ||||||||
Forfeited/Cancelled | (100 | ) | $ | 11.76 | ||||||||
Outstanding at December 31, 2015 | 3,953 | $ | 5.84 | 6.55 | $ | 2,441 | ||||||
Vested or expected to vest at December 31, 2015 | 3,918 | $ | 5.83 | 6.53 | $ | 2,436 | ||||||
Exercisable at December 31, 2015 | 2,570 | $ | 5.80 | 5.64 | $ | 1,558 | ||||||
The aggregate intrinsic value in the table above represents the total pretax intrinsic value (the difference between the closing stock price on December 31, 2015 and the exercise price, multiplied by the number of in-the-money options) that would have been received by the option holders had all the option holders exercised their options on December 31, 2015. This amount changes based on the fair market value of the common stock. Total intrinsic value of options exercised during the years ended December 31, 2015, 2014 and 2013 was $0.6 million, $0.4 million and $27 thousand, respectively.
F-25
A summary of the Company’s non-vested stock options as of December 31, 2015, and changes during the fiscal year then ended is as follows:
Weighted Average Grant Date | ||||||
Non-vested Options | Shares | Fair Market Value | ||||
Non-vested at December 31, 2014 | 1,803 | $ | 2.43 | |||
Granted | 526 | $ | 4.88 | |||
Vested | (898 | ) | $ | 4.13 | ||
Forfeited/Cancelled | (48 | ) | $ | 6.40 | ||
Non-vested at December 31, 2015 | 1,383 | $ | 5.92 | |||
The following table summarizes certain information concerning outstanding options at December 31, 2015:
Range of Exercise Price | Options Outstanding at December 31, 2015 | |
$2.37 – $3.99 | 1,396 | |
$5.37 – $7.19 | 1,070 | |
$8.20 – $9.09 | 1,467 | |
$35.42 | 20 | |
$2.37 – $35.42 | 3,953 | |
Restricted Stock
The Stock Plan provides for automatic grants of restricted stock awards to non-employee directors of the Company, as of each annual meeting of the Company’s stockholders having a then fair market value equal to $60 thousand.
In 2015, the Company granted 116 thousand shares of restricted stock to certain key employees at a price per share equal to the closing price of the Company's common stock on the date the restricted stock was granted. The restricted stock vests annually over three to four years from the grant date. In addition, the Company granted 7 thousand shares of restricted stock to each of the Company's six non-employee members of its board of directors at a price per share equal to the closing price of the Company's common stock on the date the restricted stock was granted. The restricted stock vests on the one-year anniversary of the grant date.
In 2014, the Company granted 144 thousand shares of restricted stock to the Company's Chief Executive Officer. The restricted stock vests annually over four years after the date of grant. In addition, the Company granted 9 thousand shares of restricted stock to each of the Company's six non-employee members of its board of directors at a price per share equal to the closing price of the Company's common stock on the date the restricted stock was granted. The restricted stock vests on the one-year anniversary of the grant date.
In 2013, the Company granted 15 thousand shares of restricted stock to each of the Company’s six non-employee members of its Board of Directors at a price per share equal to the closing price of the Company’s common stock on the respective dates the restricted stock was granted. The shares of restricted stock granted to the non-employee board members vested on the one-year anniversary of the grant date.
A summary of the Company’s non-vested restricted stock as of December 31, 2015, and changes during the fiscal year then ended is as follows:
Weighted Average Grant Date | ||||||
Non-vested Restricted Stock | Shares | Fair Market Value | ||||
Non-vested at December 31, 2014 | 290 | $ | 7.57 | |||
Granted | 158 | $ | 8.95 | |||
Vested | (179 | ) | $ | 7.67 | ||
Forfeited/Cancelled | (3 | ) | $ | 8.77 | ||
Non-vested at December 31, 2015 | 266 | $ | 8.31 | |||
F-26
The total fair value of restricted stock awards vested during the years ended December 31, 2015, 2014 and 2013 was $1.6 million, $1.8 million and $0.8 million, respectively.
11. RETIREMENT PLANS
The Company sponsors a 401(k) Plan, which covers substantially all employees of the Company who have attained age 21. Under the Company’s 401(k) Plan, eligible employees may contribute up to 75% of their annual eligible compensation (or in the case of highly compensated employees, up to 6% of their annual eligible compensation), subject to contribution limitations imposed by the Internal Revenue Service. During a portion of 2009, the Company made an employer matching contribution equal to 20% of an employee’s contributions, up to a total of 4% of that employee’s compensation. In July 2009, the Company amended its 401(k) Plan to eliminate the mandatory company contribution and to provide for discretionary company contributions. In 2013, the Company reinstated the mandatory company contribution. An independent third party administers the Company’s 401(k) Plan. The Company's total expense under these plans amounted to $0.4 million, $80 thousand and $50 thousand during the years ended December 31, 2015, 2014 and 2013, respectively.
12. DERIVATIVES AND HEDGING TRANSACTIONS
The Company uses derivative financial instruments to hedge its exposure to interest rate volatility related to its Term A Loan Facility. The Company does not use derivative financial instruments for speculative or trading purposes. Such derivatives are designated as cash flow hedges and accounted for under ASC 815, Derivatives and Hedging. Derivative instruments are recorded at fair value as either assets or liabilities in the interim condensed consolidated balance sheets. Changes in fair value of cash flow hedges that are designated as effective hedging instruments are deferred in equity as a component of accumulated other comprehensive loss ("AOCL"). Any ineffectiveness in such cash flow hedges is immediately recognized in earnings. Changes in the fair value of hedges that are not designated as effective hedging instruments are immediately recognized in earnings. Cash flows from the Company’s derivative instruments are classified in the condensed consolidated statements of cash flows in the same category as the items being hedged.
In January 2015, the Company entered into three interest rate cap contracts to hedge against its exposure to interest rate volatility: (1) $80.0 million notional interest rate cap effective in 2015, (2) $65.0 million notional forward interest rate cap effective in 2016, and (3) $50.0 million notional forward interest rate cap effective in 2017. Over the next twelve months, the Company expects to reclassify $0.2 million from AOCL to interest expense.
The following table summarizes the fair value and classification on the Consolidated Balance Sheets of the Company's derivatives as of December 31, 2015:
Fair Value | ||||||
Balance Sheet Classification | December 31, 2015 | |||||
Derivative designated as hedging instrument under ASC 815 | ||||||
Interest rate cap contracts - current portion | Other current assets | $ | 48 | |||
Interest rate cap contracts - long-term portion | Other assets | 191 | ||||
Total derivatives designated as hedging instruments | $ | 239 | ||||
As of and for the year ended December 31, 2014 the Company was not party to any derivative or hedging transactions.
The following table summarizes the loss recognized in AOCL of derivatives, designated and qualifying as cash flow hedges for the year ended December 31, 2015, 2014 and 2013:
Amount of Loss Recognized in AOCL on Derivative | |||||||||||
Year Ended December 31, | |||||||||||
2015 | 2014 | 2013 | |||||||||
Derivative in ASC 815 Cash Flow Hedging Relationship | |||||||||||
Interest rate cap contracts, net of tax | $ | (211 | ) | $ | — | $ | — | ||||
F-27
The following table summarizes the effect of the interest rate cap on the Consolidated Statements of Operations for the year ended December 31, 2015, 2014 and 2013:
Amount of Gain or (Loss) Reclassified from AOCL into Income | Amount of Gain or (Loss) Recognized in Income | ||||||||||||||||||||||
(effective portion) | (ineffective portion) | ||||||||||||||||||||||
Year Ended December 31, | Year Ended December 31, | ||||||||||||||||||||||
2015 | 2014 | 2013 | 2015 | 2014 | 2013 | ||||||||||||||||||
Location of Loss Reclassified from AOCL into Income | |||||||||||||||||||||||
Interest expense | $ | 36 | $ | — | $ | — | $ | — | $ | — | $ | — | |||||||||||
13. FAIR VALUE MEASUREMENTS
In accordance with ASC 820, Fair Value Measurement, the Company has categorized its assets and liabilities that are measured at fair value into a three-level fair value hierarchy as set forth below. If the inputs used to measure fair value fall within different levels of the hierarchy, the categorization is based on the lowest level input that is significant to the fair value measurement. The three levels of the hierarchy are defined as follows:
Level 1-inputs to the valuation methodology are quoted prices (unadjusted) for identical assets or liabilities in active markets.
Level 2-inputs to the valuation methodology include quoted prices for similar assets and liabilities in active markets, and inputs that are observable for the asset or liability, either directly or indirectly, for substantially the full term of the financial instrument.
Level 3-inputs to the valuation methodology are unobservable and significant to the fair value measurement.
The following table summarizes the bases used to measure certain assets and liabilities at fair value on a recurring basis in the consolidated financial statements as of and for the year ended December 31, 2015 and 2014:
Significant Other Unobservable Inputs December 31, | |||||||||||||||||||||||
2015 | 2014 | ||||||||||||||||||||||
Level 2 | Level 3 | Total Losses | Level 2 | Level 3 | Total Losses | ||||||||||||||||||
Recurring Fair Value Measure | |||||||||||||||||||||||
Interest rate cap contracts | $ | 239 | $ | — | $ | — | $ | — | $ | — | $ | — | |||||||||||
Contingent purchase price consideration for acquired businesses | $ | — | $ | 1,059 | $ | — | $ | — | $ | 1,768 | $ | — | |||||||||||
The Company determines the fair value of its interest rate cap contracts based on observable interest rate yield curves and represent the expected discounted cash flows underlying the financial instruments.
The Company recognizes liabilities for future earnout obligations on business acquisitions, or contingent purchase price consideration for acquired businesses, at their fair value based on discounted projected payments on such obligations. The inputs to the valuation, which are level 3 inputs within the fair value hierarchy, are projected sales to be provided by the acquired businesses based on historical sales trends for which earnout amounts are contractually based. Based on the Company's assessment as of December 31, 2015, the estimated contractually required earnout amounts would be achieved.
F-28
The following table presents the change in the Level 3 contingent purchase price consideration liability for the year ended December 31, 2015 and 2014:
Year Ended December 31, 2015 | |||||||
2015 | 2014 | ||||||
Beginning balance | $ | 1,768 | $ | — | |||
Additions related to acquisitions | — | 2,110 | |||||
Payments | (555 | ) | (342 | ) | |||
Adjustments included in earnings | 38 | — | |||||
Foreign currency translation adjustments | (192 | ) | — | ||||
Ending balance | $ | 1,059 | $ | 1,768 | |||
F-29
Schedule II
ARC DOCUMENT SOLUTIONS, INC. AND SUBSIDIARIES
VALUATION AND QUALIFYING ACCOUNTS
(Dollars in thousands)
Balance at Beginning of Period | Charges to Cost and Expenses | Deductions (1) | Balance at End of Period | ||||||||||||
Year ended December 31, 2015 | |||||||||||||||
Allowance for accounts receivable | $ | 2,413 | $ | 340 | $ | (659 | ) | $ | 2,094 | ||||||
Year ended December 31, 2014 | |||||||||||||||
Allowance for accounts receivable | $ | 2,517 | $ | 546 | $ | (650 | ) | $ | 2,413 | ||||||
Year ended December 31, 2013 | |||||||||||||||
Allowance for accounts receivable | $ | 2,634 | $ | 636 | $ | (753 | ) | $ | 2,517 | ||||||
(1) | Deductions represent uncollectible accounts written-off net of recoveries. |
F-30
EXHIBIT INDEX
Number | Description | ||
3.1 | Certificate of Ownership and Merger as filed with Secretary of State of the State of Delaware (incorporated by reference to Exhibit 3.1 to the Registrant’s Form 8-K filed December 27, 2012). | ||
3.2 | Restated Certificate of Incorporation, filed March 13, 2013. | ||
3.3 | Second Amended and Restated Bylaws, (incorporated by reference to Exhibit 3.1 to the Registrant’s Form 8-K filed on October 6, 2009). | ||
4.1 | Specimen Stock Certificate (incorporated by reference to Exhibit 4.1 to the Registrant’s Form 10-K filed on March 9, 2011). | ||
4.2 | Registration Rights Agreement, dated December 1, 2010, among ARC Document Solutions, certain subsidiaries of ARC Document Solutions as guarantors thereto, and Merrill Lynch, Pierce, Fenner & Smith Incorporated, as representative of the several initial purchasers (incorporated by reference to Exhibit 4.3 to the Registrant’s Form 8-K filed on December 2, 2010). | ||
10.1 | ARC Document Solutions 2005 Stock Plan (incorporated by reference to Exhibit 10.7 to the Registrant’s Registration Statement on Form S-1 A (Reg. No. 333-119788), as amended on January 13, 2005).^ | ||
10.2 | Amendment No. 1 to ARC Document Solutions 2005 Stock Plan dated May 22, 2007 (incorporated by reference to Exhibit 10.63 to the Registrant’s Form 10-Q filed on August 9, 2007).^ | ||
10.3 | Amendment No. 2 to ARC Document Solutions 2005 Stock Plan dated May 2, 2008 (incorporated by reference to Exhibit 10.3 to the Registrant’s Form 10-Q filed August 8, 2008). ^ | ||
10.4 | Amendment No. 3 to ARC Document Solutions 2005 Stock Plan (incorporated by reference to Exhibit 10.1 to the Registrant’s Form 10-Q filed August 7, 2009). ^ | ||
10.5 | Forms of Stock Option Agreements under the 2005 Stock Plan (incorporated by reference to Exhibit 10.8 to the Registrant’s Registration Statement on Form S-1 (Reg. No. 333-119788), as filed on October 15, 2004).^ | ||
10.6 | Forms of Restricted Stock Award Agreements under 2005 Stock Plan (incorporated by reference to Exhibit 10.27 to the Registrant’s Registration Statement on Form S-1 A (Reg. No. 333-119788), as amended on December 6, 2004).^ | ||
10.7 | Form of Restricted Stock Unit Award Agreement under 2005 Stock Plan (incorporated by reference to Exhibit 10.28 to the Registrant’s Registration Statement on Form S-1 A (Reg. No. 333-119788), as amended on December 6, 2004).^ | ||
10.8 | Form of Stock Appreciation Right Agreement under 2005 Stock Plan (incorporated by reference to Exhibit 10.29 to the Registrant’s Registration Statement on Form S-1 A (Reg. No. 333-119788), as amended on January 13, 2005).^ | ||
10.9 | Form of ARC Document Solutions Stock Option Grant Notice — Non-employee Directors (Discretionary Non-statutory Stock Options) (incorporated by reference to Exhibit 10.1 to the Registrant’s Form 8-K filed on December 16, 2005).^ | ||
F-31
10.10 | Form of ARC Document Solutions Non-employee Directors Nonstatutory Stock Option Agreement (Discretionary Grants) (incorporated by reference to Exhibit 10.2 to the Registrant’s Form 8-K filed on December 16, 2005).^ | ||
10.11 | Amended and Restated ARC Document Solutions 2005 Employee Stock Purchase Plan amended and restated as of July 30, 2009 (incorporated by reference to Exhibit 10.1 to the Registrant’s Form 10-Q filed on November 9, 2009).^ | ||
10.12 | Lease Agreement, for the premises commonly known as 934 and 940 Venice Boulevard, Los Angeles, CA, dated November 19, 1997, by and between American Reprographics Company, L.L.C. (formerly Ford Graphics Group, L.L.C.) and Sumo Holdings LA, LLC (incorporated by reference to Exhibit 10.10 to the Registrant’s Registration Statement on Form S-1 (Reg. No. 333-119788), as filed on October 15, 2004). | ||
10.13 | Amendment to Lease for the premises commonly known as 934 and 940 Venice Boulevard, Los Angeles, CA, effective as of August 2, 2005, by and between Sumo Holdings LA, LLC, Landlord and American Reprographics Company, L.L.C. (formerly known as Ford Graphics Group, L.L.C.) Tenant (incorporated by reference to Exhibit 10.2 to the Registrant’s Form 10-Q filed on November 14, 2005). | ||
10.14 | Lease Agreement for the premises commonly known as 345 Clinton Street, Costa Mesa, CA, dated September 23, 2003, by and between American Reprographics Company (dba Consolidated Reprographics) and Sumo Holdings Costa Mesa, LLC (incorporated by reference to Exhibit 10.16 to the Registrant’s Registration Statement on Form S-1 (Reg. No. 333-119788), as filed on October 15, 2004). | ||
10.15 | Lease Agreement for the premises commonly known as 616 Monterey Pass Road, Monterey Park, CA, by and dated November 19, 1997, between Dieterich-Post Company and American Reprographics Company, L.L.C. (as successor lessee) (incorporated by reference to Exhibit 10.26 to the Registrant’s Form 10-K filed on March 1, 2007). | ||
10.16 | Indemnification Agreement, dated April 10, 2000, among American Reprographics Company, L.L.C., American Reprographics Holdings, L.L.C., ARC Acquisition Co., L.L.C., Mr. Chandramohan, Mr. Suriyakumar, Micro Device, Inc., Dieterich-Post Company, ZS Ford L.P., and ZS Ford L.L.C. (incorporated by reference to Exhibit 10.19 to the Registrant’s Registration Statement on Form S-1 (Reg. No. 333-119788), as filed on October 15, 2004). | ||
10.17 | Form of Indemnification Agreement between ARC Document Solutions, Inc. and each of its Directors and Executive Officers (incorporated by reference to Exhibit 10.42 to the Registrant's Form 10-K filed on March 13, 2013). | ||
10.18 | Letter Amendment, dated March 13, 2014, by and between ARC Document Solutions, Inc. and Mr. Suriyakumar (incorporated by reference to Exhibit 10.47 to the Registrant's Form 10-K filed on March 14, 2014).^ | ||
10.19 | Amended and Restated Employment Agreement, dated March 13, 2014, between ARC Document Solutions, Inc. and Mr. Kumarakulasingam (incorporated by reference to Exhibit 10.48 to the Registrant's Form 10-K filed on March 14, 2014).^ | ||
10.20 | Executive Employment Agreement, dated May 1, 2014, by and between ARC Document Solutions, Inc. and John Toth (incorporated by reference to Exhibit 10.1 to the Registrant’s Form 8-K filed on May 7, 2014). | ||
10.21 | Executive Employment Agreement, dated May 1, 2014, by and between ARC Document Solutions, Inc. and Rahul K. Roy (incorporated by reference to Exhibit 10.2 to the Registrant's Form 8-K filed on May 7, 2014).^ | ||
F-32
10.22 | Executive Employment Agreement, dated May 1, 2014, by and between ARC Document Solutions, Inc. and Dilantha Wijesuriya (incorporated by reference to Exhibit 10.3 to the Registrant's Form 8-K filed on May 7, 2014).^ | ||
10.23 | Executive Employment Agreement, dated May 1, 2014, by and between ARC Document Solutions, Inc. and Jorge Avalos (incorporated by reference to Exhibit 10.4 to the Registrant's Form 8-K filed on May 7, 2014).^ | ||
10.24 | ARC Document Solutions, Inc. 2014 Stock Incentive Plan (incorporated by reference to Exhibit 10.1 to the Registrant's Form 8-K filed on May 6, 2014). | ||
10.25 | Amendment No. 1 to ARC Document Solutions, Inc. 2014 Stock Incentive Plan (incorporated by reference to Exhibit 10.2 to the Registrant's Form 8-K filed on May 6, 2014). | ||
10.26 | Amended and Restated Executive Employment Agreement dated May 17, 2014 by and between ARC Document Solutions, Inc. and Mr. Suriyakumar (incorporated by reference to Exhibit 10.1 to the Registrant's Form 8-K filed on May 19, 2014).^ | ||
10.27 | Credit Agreement dated November 20, 2014, among ARC Document Solutions, LLC, Wells Fargo Bank, National Association, as administrative agent, and the lenders party thereto (incorporated by reference to Exhibit 10.1 to the Registrant’s Form 8-K filed on November 21, 2014). | ||
10.28 | Independent Consulting Agreement effective February 2, 2015, by and between ARC Document Solutions, Inc. and John Toth (incorporated by reference to Exhibit 10.1 to the Registrant's Form 8-K filed on January 30, 2015). | ||
10.29 | Amended and Restated Executive Employment Agreement, dated February 1, 2015, by and between ARC Document Solutions, Inc. and Jorge Avalos (incorporated by reference to Exhibit 10.2 to the Registrant's Form 8-K filed on January 30, 2015). ^ | ||
10.30 | Amendment to Credit Agreement, dated June 4, 2015, among ARC Document Solutions, LLC, Wells Fargo Bank, National Association, as administrative agent and the financial institutions party thereto as lenders (incorporated by reference to Exhibit 99.1 to the Registrant's Form 8-K filed on June 5, 2015). | ||
10.31 | Amended and Restated Executive Employment Agreement, dated June 9, 2015, between ARC Document Solutions, Inc. and Jorge Avalos (incorporated by reference to Exhibit 10.1 to the Registrant's Form 8-K filed on June 16, 2015). ^ | ||
10.32 | Amended and Restated Executive Employment Agreement, dated June 9, 2015, between ARC Document Solutions, Inc. and Rahul K. Roy (incorporated by reference to Exhibit 10.2 to the Registrant's Form 8-K filed on June 16, 2015). ^ | ||
10.33 | Amended and Restated Executive Employment Agreement, dated June 9, 2015, between ARC Document Solutions, Inc. and Dilantha Wijesuriya (incorporated by reference to Exhibit 10.3 to the Registrant's Form 8-K filed on June 16, 2015). ^ | ||
10.34 | Amendment Letter, dated as of February 5, 2016, by and among ARC Document Solutions, LLC, the lenders party thereto and Wells Fargo Bank, National Association, as administrative agent (incorporated by reference to Exhibit 99.1 to the Registrant's Form 8-K filed on February 8, 2016). | ||
21.1 | List of Subsidiaries.* | ||
F-33
Number | Description | ||
23.1 | Consent of Deloitte & Touche LLP, Independent Registered Public Accounting Firm.* | ||
31.1 | Certification of Principal Executive Officer pursuant to Rules 13a-14(a)/15d-14(a) of the Securities Exchange Act of 1934, as adopted pursuant to Section 302 of the Sarbanes-Oxley Act of 2002.* | ||
31.2 | Certification of Principal Financial Officer pursuant to Rules 13a-14(a)/15d-14(a) of the Securities Exchange Act of 1934, as adopted pursuant to Section 302 of the Sarbanes-Oxley Act of 2002.* | ||
32.1 | Certification of Chief Executive Officer pursuant to 18 U.S.C. Section 1350, as adopted pursuant to Section 906 of the Sarbanes-Oxley Act of 2002.* | ||
32.2 | Certification of Chief Financial Officer pursuant to 18 U.S.C. Section 1350, as adopted pursuant to Section 906 of the Sarbanes-Oxley Act of 2002.* | ||
101.INS | XBRL Instance Document * | ||
101.SCH | XBRL Taxonomy Extension Schema * | ||
101.CAL | XBRL Taxonomy Extension Calculation Linkbase * | ||
101.DEF | XBRL Taxonomy Extension Definition Linkbase * | ||
101.LAB | XBRL Taxonomy Extension Label Linkbase * | ||
101.PRE | XBRL Taxonomy Extension Presentation Linkbase * | ||
* | Filed herewith |
^ | Indicates management contract or compensatory plan or agreement |
F-34