Attached files
| file | filename |
|---|---|
| EX-21 - EX-21 - PHI INC | d111372dex21.htm |
| EX-32.1 - EX-32.1 - PHI INC | d111372dex321.htm |
| EX-23.1 - EX-23.1 - PHI INC | d111372dex231.htm |
| EX-31.2 - EX-31.2 - PHI INC | d111372dex312.htm |
| EX-32.2 - EX-32.2 - PHI INC | d111372dex322.htm |
| EX-31.1 - EX-31.1 - PHI INC | d111372dex311.htm |
Table of Contents
UNITED STATES
SECURITIES AND EXCHANGE COMMISSION
Washington, D.C. 20549
FORM 10-K
(Mark One)
| x | ANNUAL REPORT PURSUANT TO SECTION 13 OR 15(d) OF THE SECURITIES EXCHANGE ACT OF 1934 |
For the fiscal year ended December 31, 2015
or
| ¨ | TRANSITION REPORT PURSUANT TO SECTION 13 OR 15(d) OF THE SECURITIES EXCHANGE ACT OF 1934 |
For the transition period from to
Commission file number 0-9827
PHI, INC.
(Exact name of registrant as specified in its charter)
| Louisiana | 72-0395707 | |
| (State or other jurisdiction of incorporation or organization) |
(I.R.S. Employer Identification No.) |
| 2001 SE Evangeline Thruway Lafayette, Louisiana |
70508 | |
| (Address of principal office) | (Zip Code) |
Registrant’s telephone number including area code: (337) 235-2452
Securities registered pursuant to Section 12(b) of the Act:
| Title of Each Class |
Name of Each Exchange on Which Registered | |
| Voting Common Stock | The NASDAQ Global Market | |
| Non-Voting Common Stock | The NASDAQ Global Market |
Securities registered pursuant to Section 12(g) of the Act: NONE
Indicate by check mark if the registrant is a well-known seasoned issuer, as defined in Rule 405 of the Securities Act. Yes: ¨ No: x
Indicate by check mark if the registrant is not required to file reports pursuant to Section 13 or Section 15(d) of the Act. Yes: ¨ No: x
Indicate by check mark whether the registrant (1) has filed all reports required to be filed by Section 13 or 15(d) of the Securities Exchange Act of 1934 during the preceding 12 months (or for such shorter period that the registrant was required to file such reports), and (2) has been subject to such filing requirements for the past 90 days. Yes: x No: ¨
Indicate by check mark whether the registrant has submitted electronically and posted on its corporate Web site, if any, every Interactive Data File required to be submitted and posted pursuant to Rule 405 of Regulation S-T (§ 232.405 of this chapter) during the preceding 12 months (or for such shorter period that the registrant was required to submit and post such files). Yes: x No: ¨
Indicate by check mark if disclosure of delinquent filers pursuant to Item 405 of Regulation S-K (§ 229.405 of this chapter) is not contained herein and will not be contained, to the best of registrant’s knowledge, in definitive proxy or information statements incorporated by reference in Part III of this Form 10-K or any amendment to this Form 10-K. x
Indicate by check mark whether the registrant is a large accelerated filer, an accelerated filer, non-accelerated filer, or smaller reporting company. See definitions of “large accelerated filer,” “accelerated filer” and “smaller reporting company” in Rule 12b-2 of the Exchange Act.
| Large accelerated filer: | ¨ | Accelerated filer: | x | |||
| Non-accelerated filer: | ¨ | Smaller reporting company: | ¨ | |||
Indicate by check mark whether the registrant is a shell company (as defined in Rule 12b-2 of the Act). Yes: ¨ No: x
The aggregate market value of the voting and non-voting common stock held by non-affiliates of the registrant as of June 30, 2015 was $265,080,759 based upon the last sales prices of the voting and non-voting common stock on June 30, 2015, as reported on the NASDAQ Global Market.
The number of shares outstanding of each of the registrant’s classes of common stock, as of February 22, 2016 was:
| Voting Common Stock | 2,905,757 shares. | |||
| Non-Voting Common Stock | 12,677,707 shares. |
Documents Incorporated by Reference
Portions of the registrant’s definitive Information Statement to be furnished in connection with the 2016 Annual Meeting of Shareholders are incorporated by reference into Part III of this Form 10-K.
Table of Contents
PHI, INC.
i
Table of Contents
Special Note Regarding Forward-Looking Statements
All statements other than statements of historical fact contained in this Annual Report on Form 10-K (the “Annual Report”) and other periodic reports filed by PHI, Inc. (the “Company,” “PHI,” “we” or “our”) under the Securities Exchange Act of 1934, as amended (the “Exchange Act”), and other written or oral statements made by it or on its behalf, are “forward-looking” statements, as defined by (and subject to the “safe harbor” protections under) the federal securities laws. When used herein, the words “anticipates,” “expects,” “believes,” “seeks,” “hopes,” “intends,” “plans,” “projects” and similar words and expressions are intended to identify forward-looking statements. Forward-looking statements are based on a number of judgments and assumptions about future events, many of which are beyond our control. These forward-looking statements, and the assumptions on which they are based, (i) are not guarantees of future events, (ii) are inherently speculative and (iii) are subject to significant risks, uncertainties, and other factors that may cause our actual results to differ materially from the expectations, beliefs, and estimates expressed or implied in such forward-looking statements. Factors that could cause our results to differ materially from the expectations expressed in such forward-looking statements include but are not limited to the following:
| • | reduction in demand for our services due to volatility of oil and gas prices and the level of exploration and production activity in the Gulf of Mexico generally, which depends on several factors outside of our control; |
| • | our dependence on a small number of customers for a significant amount of our revenue and our significant credit exposure within the oil and gas industry; |
| • | any failure to maintain our strong safety record; |
| • | our ability to secure favorable customer contracts or otherwise remain able to profitably deploy our existing fleet of aircraft; |
| • | our ability to receive timely delivery of ordered aircraft and parts from a limited number of suppliers, and the availability of working capital, loans or lease financing to acquire such assets; |
| • | the availability of adequate insurance; adverse changes in the value of our aircraft or our ability to sell them in the secondary markets; |
| • | weather conditions and seasonal factors, including tropical storms and hurricanes; the effects of competition and changes in technology; |
| • | the adverse impact of customers electing to terminate or reduce our services; |
| • | the impact of current or future governmental regulations, including but not limited to the impact of new and pending regulation of healthcare, aviation safety and export controls; |
| • | the special risks of our air medical operations, including collections risks and potential medical malpractice claims; |
| • | political, economic, payment, regulatory and other risks and uncertainties associated with our international operations; |
| • | our substantial indebtedness and operating lease commitments; |
| • | the hazards associated with operating in an inherently risky business, including the possibility that regulators could ground our aircraft for extended periods of time or indefinitely; |
| • | our ability to develop and implement successful business strategies; |
| • | changes in fuel prices; |
| • | the risk of work stoppages and other labor problems; |
| • | changes in our future cash requirements; |
| • | environmental and litigation risks; and |
| • | the effects of more general factors, such as changes in interest rates, operating costs, tax rates, or general economic or geopolitical conditions; and other risks referenced in Item 1A or elsewhere in this Annual Report or other of our filings with the SEC. |
All of our above-described forward-looking statements are expressly qualified in their entirety by the cautionary statements in this paragraph and the Risk Factors disclosures in our SEC filings. Additional factors or risks that we currently deem immaterial, that are not presently known to us or that arise in the future could also cause our actual results to differ materially from our expected results. Given these uncertainties, investors are cautioned not to unduly rely upon our forward-looking statements. PHI undertakes no obligation to update publicly any forward-looking statements, whether as a result of new information, future events, or otherwise. Further, we may make changes to our business strategies and plans (including our capital spending plans) at any time and without notice, based on any changes in the above-listed factors, our assumptions or otherwise, any of which could or will affect our results.
ii
Table of Contents
| ITEM 1. | BUSINESS |
General
Since our incorporation in 1949, our primary business has been the safe and reliable transportation of personnel to, from, and among offshore platforms for customers engaged in the oil and gas exploration, development, and production industry. Although we offer these services in several domestic and international markets, most of our offshore flight operations are concentrated in the Gulf of Mexico, where we are a leading provider of such services. Since late 1997, we have also provided air medical transportation for hospitals and for emergency service agencies where we operate as an independent provider of medical services. In addition, we perform helicopter maintenance and repair services, primarily to existing customers that own their own aircraft. At December 31, 2015, we owned or operated 265 aircraft domestically and internationally, 155 of which were dedicated to our Oil and Gas segment, 104 of which were dedicated to our Air Medical segment, and six of which were dedicated to other operations.
Description of Operations
We operate in three business segments: Oil and Gas, Air Medical, and Technical Services. For financial information regarding our operating segments and the geographic areas in which they operate, see Note 13, Business Segments and Geographic Areas, of the Notes to Consolidated Financial Statements included in this Form 10-K.
Oil and Gas. Our Oil and Gas segment, headquartered in Lafayette, Louisiana, provides helicopter services primarily for the major integrated and independent oil and gas production companies transporting personnel and, to a lesser extent, parts and equipment, to, from and among offshore platforms in the Gulf of Mexico. Our customers include Shell Oil Company, BP America Production Company, ExxonMobil Production Co., and ConocoPhillips Company, with whom we have worked for 35 or more years, and ENI Petroleum, with whom we have worked for more than 20 years. At December 31, 2015, we operated 155 aircraft in this segment.
Oil and gas exploration and production companies and other offshore oil service companies use our services primarily for routine transportation of personnel and equipment, to transport personnel during medical and safety emergencies, and to evacuate personnel during the threat of hurricanes and other adverse weather conditions. Most of our customers have entered into fixed-term contracts with us, although some hire us on an “ad hoc” or “spot” basis.
We generally classify our helicopters as light (generally up to six passengers), medium (generally up to 12 passengers) or heavy (up to 19 passengers), each of which serves a different transportation need of offshore energy companies. Medium and heavy helicopters can fly in a wider variety of operating conditions, travel over longer distances and carry larger payloads than light helicopters. These aircraft are required for crew changes on the large offshore production facilities and drilling rigs in the deepwater region of the Gulf of Mexico. Most of our Oil and Gas aircraft are available for hire by any customer, but some are dedicated to individual customers. Our helicopters have flight ranges up to 570 miles with a 30-minute fuel reserve and thus are capable of servicing many of the deepwater oil and gas operations from 50 to 200 miles offshore. (See Item 2 – Properties, for specific information by aircraft model.)
Our strategic focus in this segment of our business is on providing transport services to the deepwater region of the Gulf of Mexico. As of December 31, 2015, of the 155 aircraft dedicated to our Oil and Gas segment, 83 aircraft were classified as medium or heavy aircraft. Our strategy is to focus more of our business on deepwater operations because we believe they will provide a more stable and profitable source of revenue. Deepwater operations tend to have longer lead times and, consequently, activity levels are generally less susceptible to short term volatility in commodity prices as compared to other offshore operations. The capital commitments are also substantially larger than shallow water operations, and consequently, our client base is more heavily weighted to the major integrated and larger independent oil and gas companies. Finally, the majority of our transportation activity services oil and gas production facilities, which adds stability to our business as these facilities generally operate for longer periods than exploration facilities.
1
Table of Contents
About five years ago, we elected to expand selectively into international markets that we believe have attractive opportunities for growth. As of December 31, 2015, in our oil and gas operations, we had two aircraft in West Africa and five aircraft in the Middle East available for operations.
Operating revenue from our Oil and Gas segment is derived mainly from contracts that include a fixed monthly rate for a particular model of aircraft, plus variable payments based on the amount of flight time. Operating costs for the Oil and Gas segment are primarily aircraft operation costs, including costs for pilots and maintenance personnel. We typically operate under fixed-term contracts with our customers, a substantial portion of which are competitively bid. Our fixed-term contracts have terms generally of one to seven years, with payment in U.S. dollars. In 2015, approximately 92% of our domestic oil and gas-related revenues were from fixed-term customer contracts, with approximately 58% of these revenues from the fixed fee component and 42% from the variable fee component. The remaining 8% of our 2015 domestic oil and gas-related revenues were attributable to work in the spot market and ad hoc flights for contracted customers.
Most of our fixed-term contracts contain provisions permitting early termination by the customer, sometimes with as little as 30 days’ notice for any reason and generally without penalty. In addition, many of our contracts permit our customers to increase or decrease the number of aircraft under contract with a corresponding increase or decrease in the fixed monthly payments, and without a significant penalty for a decrease. Our offshore services contracts generally limit our exposure to increases in fuel costs by passing through to our customers fuel costs in excess of pre-agreed levels. When our contracts expire, we believe that we have an advantage in renewing the contract based on the existing relationship with the customer, detailed knowledge of the specific operating environment, and an established base of equipment and personnel on site.
Operating revenues from the Oil and Gas segment accounted for 57%, 62%, and 57% of consolidated operating revenues during the years ended December 31, 2015, 2014 and 2013, respectively.
Air Medical. In the U.S., we provide air medical transportation services for hospitals and emergency service agencies. At December 31, 2015, we provided these services in 19 states using approximately 98 aircraft at 70 separate locations. We also provide air medical transportation services for a customer in the Middle East, as discussed further below. Our Air Medical segment operates primarily under the independent provider model and, to a lesser extent, under the traditional provider model. Under the independent provider model, we have no contracts, no fixed revenue stream and compete for transport referrals on a daily basis with other independent operators in the area. Under the traditional provider model, we contract directly with the hospital to provide its medical transportation services, with the contracts typically awarded through competitive bidding. Our Air Medical operations are headquartered in Phoenix, Arizona.
As an independent provider, we bill for our services on the basis of a flat rate plus a variable charge per patient-loaded mile, regardless of aircraft model, and are typically compensated by Medicaid, Medicare, private insurance, or directly by the transported patient. Revenues are recorded net of contractual allowances under agreements with third party payors and estimated uncompensated care at the time the services are provided. Contractual allowances and uncompensated care are estimated based on our historical collection rates by payor category (consisting mainly of Medicaid, Medicare, private insurance, and self-pay). Changes in our payor mix, reimbursement rates or uncompensated care rates all directly impact our accounts receivable allowance and financial results for each particular reporting period. For additional information, see Note 1, Summary of Significant Accounting Policies—Revenue Recognition, of the Notes to Consolidated Financial Statements included in this Form 10-K.
We also have a limited number of contracts with hospitals under which we receive a fixed fee component for aircraft availability and a variable fee component for flight time.
Most of our contracts with hospitals contain provisions permitting early termination by the hospital, typically with 180 days’ notice for any reason and generally without penalty. Several of these contracts are issued or renewed based on competitive bidding.
In September 2012, we commenced flight operations under a three-year contract with a customer in the Middle East to provide helicopter emergency medical services. Under the initial three-year contract, we provided emergency medical flight services and a wide range of ancillary services, including base construction, aircraft leasing, personnel training, aircraft maintenance, provisioning and administrative services. The volume of certain of these ancillary services diminished over time as responsibilities were transitioned to the customer’s personnel. The initial three-year contract provided for payments in U.S. dollars based upon a fixed monthly rate and additional variable payments
2
Table of Contents
based upon the number of flight hours. The initial term of the contract expired in September 2015 and has been extended to June 29, 2016. Under this extension, the number of aircraft operated and the scope of our services and obligations have been reduced. We are currently negotiating a five year replacement contract with this customer. Additional information about the agreement is included in Note 1, Summary of Significant Accounting Policies—Revenue Recognition, of the Notes to Consolidated Financial Statements included in this Form 10-K.
In connection with operating our domestic air medical business, we continuously open and close bases in an effort to optimize our service offerings. As of December 31, 2015, our domestic air medical business operated one less base but six more helicopters as compared to December 31, 2014.
Operating revenues from the Air Medical segment accounted for 39%, 36%, and 32% of consolidated operating revenues for the years ended December 31, 2015, 2014 and 2013, respectively.
Technical Services. The Technical Services segment is principally engaged in providing helicopter repair and overhaul services for flight operations customers that own their aircraft. Costs associated with these services are primarily labor, and customers are generally billed at a percentage above our service cost. We also periodically provide flight services to governmental customers under this segment, including our agreement to operate six aircraft for the National Science Foundation in Antarctica, typically in the first and fourth quarters each year. Also included in this segment is our proprietary Helipass operations, which provides software as a service to certain of our Oil and Gas customers for the purpose of passenger check-in and compliance verification.
Operating revenues from the Technical Services segment accounted for 4%, 2%, and 11% of consolidated operating revenues for the years ended December 31, 2015, 2014 and 2013, respectively.
Seasonal Aspects
Seasonality affects our operations in three principal ways: weather conditions are generally poorer in December, January, and February; tropical storms and hurricanes are prevalent in the Gulf of Mexico in late summer and early fall; and reduced daylight hours restrict our operations in winter; all of which may result in reduced flight hours. When a tropical storm or hurricane is about to enter or begins developing in the Gulf of Mexico, flight activity may temporarily increase because of evacuations of offshore workers, but during the storms, we are unable to operate in the area of the storm and can incur significant expense in moving our aircraft, personnel and support equipment to safer locations. For a more detailed discussion of these events, see Item 1A – “Risk Factors – Risks Inherent in our Industry – Our operations are affected by adverse weather conditions and seasonal factors.” Our operating results vary from quarter to quarter, depending on seasonal factors and other factors outside of our control. As a result, full year results are not likely to be a direct multiple of any particular quarter or combination of quarters.
Inventories
We carry a significant inventory of aircraft parts to support the maintenance and repair of our helicopters and other aircraft. Many of these inventory items are parts that have been removed from aircraft, refurbished according to manufacturers and regulatory specifications, and returned to inventory. The cost to refurbish these parts is expensed as incurred. The carrying values of inventory reported in our consolidated financial statements are affected by these various estimates and may change from time to time if our estimated values change. For additional information, see Item 1A – “Risk Factors – Risks Inherent in our Industry – We require aircraft components and parts for the maintenance and repair of our aircraft, and supply constraints or cost increases could adversely affect our business” – and Note 1, Summary of Significant Accounting Policies—Inventories of Spare Parts, of the Notes to Consolidated Financial Statements included in this Annual Report.
Customers
Our principal customers are major integrated energy companies and independent exploration and production companies. We also serve energy service companies, hospitals, medical programs, government agencies, and other aircraft owners and operators. Our five largest customers paid us 44% of our consolidated operating revenues for the year ended December 31, 2015. Our largest customer is in our Oil and Gas segment and accounted for 15%, 17%, and 15% of our consolidated operating revenues for the years ended December 31, 2015, 2014 and 2013, respectively. Also, another customer in our Oil and Gas segment accounted for 11%, 13%, and 12% of our consolidated operating revenues for the years ended December 31, 2015, 2014 and 2013, respectively. Our largest customer in our Air Medical and Technical Services segments accounted for 9% and 10% of our consolidated
3
Table of Contents
operating revenues for the year ended December 31, 2015 and 2014, respectively. We have entered into contracts with most of our established customers for terms of at least one year, although most contracts include provisions permitting earlier termination by the customers. See Note 1, Summary of Significant Accounting Policies – Concentration of Credit Risk, of the Notes to Consolidated Financial Statements in this Annual Report.
Competition
Our business is highly competitive in each of our markets, and many of our contracts are awarded after competitive bidding. Factors that impact competition include safety, reliability, price, availability of appropriate aircraft, experience, and quality of service.
We believe we are a leading operator of helicopters in the Gulf of Mexico. There are two major and several smaller competitors operating in the Gulf of Mexico market, including leasing companies. Although most oil companies traditionally contract for most specialty services associated with offshore operations, including helicopter services, certain of our customers and potential customers in the oil industry operate their own helicopter fleets or have the capability to do so if they so elect.
In the air medical market, we compete against national and regional firms, and there is usually more than one competitor in each local market. In addition, we compete against hospitals that operate their own helicopters and, in some cases, against ground ambulances as well.
For additional information, see Item 1A – “Risk Factors – Risks Inherent in our Industry – The helicopter services business is competitive.”
Employees
As of December 31, 2015, we employed approximately 2,643 full-time employees and 51 part-time employees, including approximately 770 pilots, 845 aircraft maintenance personnel, and 408 medical support staff.
Our domestic pilot workforce is represented by the Office and Professional Employees International Union (“OPEIU”), although we and the union do not currently have an agreed-upon collective bargaining agreement. For additional information, see Item 1A – “Risk Factors – Other Risks Specific to our Company – Our domestic workforce is represented by a union, although we and the union do not have a current agreed upon collective bargaining agreement.”
Governmental Regulation
Our operations and the operations of most of our customers are heavily regulated under various international, federal, state and local laws and regulations.
Our domestic aviation operations are regulated primarily under the Federal Aviation Act of 1958, as amended. Under this act, we cannot operate certain aircraft domestically for hire unless we receive an operating certificate from the Federal Aviation Administration (the “FAA”). The FAA comprehensively regulates our domestic flight operations and exercises broad jurisdiction over our personnel, aircraft, maintenance operations, ground facilities and certain other aspects of our operations, including the authority to impose flight moratoriums. Domestic aircraft accidents are subject to the jurisdiction of the National Transportation Safety Board. Standards relating to the workplace health and safety of our domestic employees are created and monitored through the Occupational Safety and Health Administration.
Foreign flight operations are governed by the local aviation authority. The laws of most countries limit foreign ownership of aviation companies. To comply with these requirements, we have from time to time formed joint ventures, cooperated with one or more local partners or entered into other alternative arrangements.
Our air medical operations are also subject to healthcare-related laws and regulations, including those related to Medicare and Medicaid compliance and the privacy and security rules of the Health Insurance Portability and Accountability Act of 1996, as amended. In addition, as a recipient of funds from state and federal governmental programs, our air medical operations are subject to a variety of stringent state and federal antifraud laws and regulations that impose substantial penalties for false claims, improper payments or improper patient referrals.
4
Table of Contents
Our overseas operations are subject to a variety of U.S. laws and regulations, including (i) the Foreign Corrupt Practices Act of 1977, which generally prohibits us and our intermediaries from making corrupt payments to foreign officials for the purpose of obtaining or retaining business, and (ii) the International Traffic in Arms Regulations, which govern the export and import of defense-related products and services.
We and our customers are also subject to various foreign, federal, state and local environmental laws and regulations. Government moratoriums, restrictions or regulatory changes that adversely impact the operations of our oil and gas or medical customers could materially reduce the demand for our services.
For additional information regarding several regulations applicable to our operations, see Item 1A – “Risk Factors – Risks Relating to Regulatory Matters.”
Environmental Matters
We are subject to foreign, federal, state and local environmental laws and regulations that impose limitations on the discharge of pollutants into the environment and establish standards for the treatment, storage, recycling, and disposal of toxic and hazardous wastes. Operating and maintaining helicopters requires that we use, store, and dispose of materials that are subject to federal and state environmental regulation. We periodically conduct environmental site surveys at certain of our facilities and determine whether there is a need for environmental remediation based on these surveys. For additional information, see Item 1A – “Risk Factors – Risks Inherent in our Industry – Our operations are subject to stringent and comprehensive environmental laws and regulations that may expose us to significant costs and liabilities.” See also Note 12, Commitments and Contingencies, of the Notes to Consolidated Financial Statements included in this Form 10-K.
Corporate Information
The trading symbol for our voting common stock is “PHII,” and the symbol for our non-voting common stock is “PHIIK.”
In September 2001, Al A. Gonsoulin, our Chairman of the Board and Chief Executive Officer, acquired approximately 52% of our outstanding voting common stock from our founder’s family. As of December 31, 2015, Mr. Gonsoulin beneficially owned 70.2% of our outstanding voting common stock and 7.9% of our outstanding non-voting common stock, representing 19.5% of our total outstanding equity. Mr. Gonsoulin has over 35 years of experience in the oil and gas service industry. In 1977, he founded Sea Mar, Inc. (“Sea Mar”), a provider of marine transportation and support services to the oil and gas industry in the Gulf of Mexico and sold it to Pool Energy Services Co. (“Pool”) in 1998. Pool was acquired by Nabors Industries, Inc. in 1999, and Mr. Gonsoulin continued to serve as President of Sea Mar until December 31, 2001.
Our principal executive offices are located at 2001 SE Evangeline Thruway, Lafayette, Louisiana 70508, and our telephone number at that address is (337) 235-2452.
Availability of SEC filings and other information
Our annual reports on Form 10-K, quarterly reports on Form 10-Q, current reports on Form 8-K, and amendments to any of these reports are available free of charge through our web site: www.phihelico.com. These reports are available as soon as reasonably practicable after we file them with the Securities and Exchange Commission (“SEC”). The information found on our website is not a part of this or any of our other reports filed with the SEC.
You may also read and copy any of the materials that we file with the SEC at the SEC’s Public Reference Room at 100 F. Street, N.E., Washington, DC 20549. You may obtain information on the operation of the Public Reference Room by calling the SEC at 1-800-SEC-0330. The SEC also maintains a web site that contains reports, proxy and information statements, and other information regarding issuers that file electronically with the SEC. The SEC’s website address is www.sec.gov.
Unless otherwise indicated, information contained in this Annual Report and other documents filed by us under the federal securities laws concerning our views and expectations regarding the oil and gas or healthcare industries are based on estimates made by us using data from industry sources and on assumptions made by us based on our management’s knowledge and experience in the specific markets in which we operate and these industries generally. You should be aware that we have not independently verified data from industry or other third-party sources and cannot guarantee its accuracy or completeness.
5
Table of Contents
In this and other of our SEC reports, we disclose the number of aircraft allocated to our operating segments. As of any particular date, a portion of these aircraft will be unavailable for service for a variety of reasons, including due to certain aircraft being maintained, refurbished, parked or laid-up pending sale.
| ITEM 1A. | Risk Factors |
The following discussion of “risk factors” identifies the most significant risks or uncertainties that could (i) materially and adversely affect our business, financial condition, results of operations, liquidity or prospects or (ii) cause our actual results to differ materially from our anticipated results or other expectations. You should carefully consider these factors, in addition to the other information set forth in this report, when evaluating our business and whether to purchase, sell or hold our securities. Please note that the following discussion is not intended to comprehensively list all risks or uncertainties faced by us. Our operations or actual results could also be similarly impacted by additional risks and uncertainties that are not currently known to us, that we currently deem to be immaterial, or that are not specific to us or our industry, such as general economic conditions.
Risks Inherent in our Industry
If we fail to maintain our safety record, our ability to attract and retain customers could be seriously harmed.
A favorable safety record is one of the primary factors a customer reviews in selecting an aviation provider. If we fail to maintain our safety and reliability record, our ability to attract new customers and maintain our current customers could be materially adversely affected.
Helicopter operations are inherently risky, and our insurance may be insufficient to cover our losses.
The operation of helicopters inherently involves a high degree of risk. Aircraft accidents, collisions, fire, adverse weather, and other hazards may result in loss of life, serious injury to employees and third parties, damages to equipment or property owned by us or others, loss of revenues, termination of customer contracts, fines, penalties, restrictions on conducting business, increased insurance costs, or damage to our reputation or customer relationships. Accidents involving other helicopter companies could adversely impact us if they (i) cause governmental agencies to impose flight moratoriums or (ii) reduce demand for the specific model of helicopter involved in the accidents or for helicopter services generally.
We maintain hull and liability insurance on our aircraft, which insures us against physical loss of, or damage, to our aircraft and against certain legal liabilities to others. In addition, we carry war risk, expropriation, confiscation and nationalization insurance for our aircraft involved in international operations. In some instances, we are covered by indemnity agreements from our customers in lieu of, or in addition to, our insurance. We do not, however, carry insurance against all types of losses. For instance, we are not insured for loss of use of our aircraft, business interruption, or loss of flight hours.
While we believe that our insurance and indemnification arrangements provide reasonable protection for a substantial portion of our foreseeable losses, they are subject to deductibles, retentions, coverage limits, and coverage exceptions, the aggregate impact of which could be material. Accordingly, our incurrence of severe casualty losses, the expropriation or confiscation of significant assets, or other events that are not partially or fully covered by insurance could materially adversely affect our financial condition, results of operations, access to affordable insurance, or cash flows.
We furnish to and receive from our customers indemnities relating to damages caused or sustained by us in connection with our operations. Our customers’ changing views on risk allocation could cause us to accept greater risk to win new business or could result in us losing business if we are not prepared to take such risks. To the extent that we accept such additional risk, and seek to insure against it, our insurance premiums could rise.
Negative publicity may adversely impact us.
Accidents involving any aircraft operated by us or another operator could cause substantial adverse publicity affecting us specifically or our industry generally. In either case, media coverage and public statements that insinuate improper actions by us or other industry participants, regardless of their factual accuracy or truthfulness,
6
Table of Contents
may result in negative publicity, litigation, governmental investigations, or additional regulation. Addressing negative publicity and any resulting litigation or investigations may distract management, increase costs, and divert resources. Negative publicity may have an adverse impact on our reputation and the morale of our employees, which could adversely affect our business, financial condition, or results of operations. Our aircraft have been involved in accidents in the past, some of which have included the loss of life and property damages. We may experience similar accidents in the future.
Our operations are affected by adverse weather conditions and seasonal factors.
We are subject to weather-related or seasonal factors, including primarily:
| • | poor weather conditions that often prevail during winter but can develop in any season; |
| • | the tropical storm and hurricane season in the Gulf of Mexico; and |
| • | reduced daylight hours during the winter months. |
Poor visibility, high winds and heavy precipitation can affect the operation of helicopters and significantly reduce our flight hours. A significant portion of our operating revenue is dependent on actual flight hours and a substantial portion of our direct costs is fixed. Thus, prolonged periods of adverse weather can materially and adversely affect our operating revenues and net earnings.
In the Gulf of Mexico, the months of December, January and February generally have more days of adverse weather conditions than the other months of the year. Also, June through November is tropical storm and hurricane season in the Gulf of Mexico, with August and September typically being the most active months. During tropical storms, we are unable to operate in the area of the storm and can incur significant expense in moving our aircraft to safer locations. In addition, as most of our facilities are located along the Gulf of Mexico coast, tropical storms and hurricanes may cause substantial damage to our property, including helicopters that we are unable to relocate.
Because the fall and winter months have fewer hours of daylight, our flight hours are generally lower at those times, which typically results in a reduction in operating revenues during those months. Currently, approximately 91% of the helicopters used in our Oil and Gas operations are equipped to fly under instrument flight rules (“IFR”), which enables these aircraft, when manned by IFR-rated pilots and co-pilots, to operate when poor visibility or darkness prevents flight by non-IFR aircraft.
Our helicopters may not always be profitably deployed.
Our helicopters may not always be profitably deployed. Customers often require a specific type of helicopter, which may be different from those in our fleet. The duration of our typical customer contract is generally too short to recover our full cost of purchasing a helicopter, subjecting us to the risk that we will be unable to recoup our investment in the helicopter. Helicopters we acquire may not be covered by customer contracts when they are added to our fleet. Once a new helicopter is delivered to us, we generally spend between two and three months installing mission-specific or customer-specific equipment before we place it into service. As a result, there can be a significant delay between the delivery date for a new helicopter and the time that it is able to generate revenues for us.
As discussed in greater detail elsewhere in this Form 10-K, the recent downturn in the oil and gas industry has reduced the demand for and utilization of our fleet of offshore aircraft.
Moreover, we typically incur substantial fixed costs on our aircraft (including insurance, maintenance, crew wages and benefits, and lease costs, if applicable), regardless of whether they are operating. Accordingly, our inability to deploy aircraft has a substantial detrimental impact on the profitability of our operations.
The market for the sale of used aircraft is limited and volatile.
If we cannot find an acceptably profitable use for a helicopter, or if a helicopter no longer meets our strategic objectives, including due to age, we will frequently seek to sell it. Prices in the used helicopter market have been volatile over time, and we may incur gains or losses from the sale of helicopters. The number of aircraft sales and the amount of gains and losses recorded on these sales depends on a wide variety of factors, and is inherently unpredictable. Moreover, there may be limited or no demand for certain types of used aircraft, especially older medium or heavy helicopters. Recently, the demand for various types of used aircraft has diminished. Our inability to dispose of our aircraft in the secondary markets on acceptable terms or at all may have a material adverse effect on our financial condition, results of operation and cash flow.
7
Table of Contents
Our contracts generally can be terminated or downsized by our customers without penalty.
Most of our fixed-term contracts contain provisions permitting early termination by the customer, sometimes with as little as 30 days’ notice for any reason and generally without penalty. In addition, many of our contracts permit our customers to decrease the number of aircraft under contract with a corresponding decrease in the fixed monthly payments without penalty. In light of weak offshore market conditions, certain of our customers have recently requested reductions in the number of aircraft under contract, pricing concessions or both, and we may receive additional such requests in the future. As a result, you should not place undue reliance on the existence or current terms of our customer contracts.
The helicopter services business is competitive.
All segments of our business are highly competitive. We generally compete on the basis of safety, price, reliability, aircraft availability, experience, fleet configuration and quality of service.
We have two major competitors and several small competitors operating in the Gulf of Mexico, including leasing companies. In addition, most of our customers and potential customers could operate their own helicopter fleets if they chose to do so.
Our Air Medical segment competes for business primarily under the independent provider model and, to a lesser extent, under the traditional provider model. Under the independent provider model, we have no contracts and no fixed revenue stream, but must compete for transport referrals on a daily basis with other independent operators in the area. Under the traditional provider model, we contract directly with the hospital to provide their transportation services, with the contracts typically awarded on a competitive bid basis. Under both models, we compete against national and regional companies, and there is usually more than one competitor in each local market. In addition, we compete against hospitals that operate their own helicopters. Demand for our Air Medical flight services would decrease if more hospitals in our operating areas develop their own aviation capability. Over the past several years, we believe the number of air medical helicopters operating in the U.S. has increased, thereby intensifying competitive pressures.
We depend on our ability to qualify as an eligible bidder under contract criteria and to compete successfully against other qualified bidders in order to obtain certain of our contracts.
Certain of our customers in each of our segments conduct competitive processes for awarding certain contracts pursued by us. We typically face strong competition and pricing pressures for competitively bid contract awards, and we may be required to qualify or continue to qualify under applicable contract criteria. Our inability to qualify as an eligible bidder under contract criteria could preclude us from competing for certain contract awards. In addition, our inability to qualify as an eligible bidder, or to compete successfully when bidding for certain contracts and to win those contracts, could materially adversely affect us.
Our customers might be able to obtain services comparable to ours through other forms of transportation.
In certain markets worldwide, oil and gas companies have elected to transport personnel and equipment to and from their offshore rigs and platforms through the use of marine transportation vessels, especially when such rigs and platforms are located close to shore. Technological improvements that increase the speed or efficiency of these vessels could reduce the demand for our oil and gas flight transportation services. For instance, the development and implementation of equipment that reduces the amount of time necessary to load personnel on and off offshore rigs and platforms could enhance the attractiveness of marine vessels and reduce demand for flight services.
Our Air Medical operations compete in certain markets with ground-based ambulance services. The construction of additional hospitals and medical treatment centers in currently unserved areas would likely increase the ability of ground-based ambulances to provide services currently provided by air medical providers such as us. Consequently, the construction of additional medical facilities in our markets could under certain circumstances reduce demand for our Air Medical flight transportation services.
8
Table of Contents
The offshore helicopter services industry is cyclical.
The offshore helicopter services industry has historically been cyclical and is affected by the volatility of oil and gas price levels. There have been periods of high demand for our offshore services, followed by periods of low demand for our offshore services. Changes in commodity prices can have a significant effect on demand for our offshore services, and periods of low activity intensify price competition in the industry and could result in our aircraft being idle for prolonged periods.
The market value of our offshore fleet of aircraft is cyclical.
The fair market value of each of our offshore aircraft is dependent upon a variety of factors, including:
| • | general economic and market conditions affecting the oil and gas industry, including commodity prices and the level of oil and gas exploration and production; |
| • | the number of comparable aircraft servicing the market; |
| • | the types and sizes of comparable aircraft available; |
| • | the specific age and attributes of the aircraft; |
| • | demand for the aircraft in different industries; and |
| • | changes in regulation or competition from other air transport companies and other modes of transportation. |
As a result of the recent decline of demand for our offshore aircraft and services, the fair market value of our offshore aircraft has declined in recent periods and may decline further in the future. Lower aircraft values can adversely impact us in several ways, including potential asset impairment charges, potential breaches of loan covenants or lower proceeds in the event of aircraft sales.
We depend on a small number of helicopter manufacturers for our supply of new helicopters.
There are a small number of helicopter manufacturers that can meet our needs for new aircraft to expand our fleet or replace aircraft that no longer meet our needs. These manufacturers have a limited capacity to produce new helicopters, particularly heavy helicopters. In addition, there is typically a substantial delay between the order and delivery dates for most new aircraft, especially new medium and heavy helicopters, which makes it more difficult to adjust quickly to changes in industry conditions. Significant unplanned delays could delay the implementation of our business strategies or materially increase our cost of meeting our commitments to our customers. If we are unable to obtain aircraft from these manufacturers with delivery dates, prices and other terms acceptable to us, our profitability and growth prospects could be adversely impacted, and the impact may be material.
We require aircraft components and parts for the maintenance and repair of aircraft, and supply constraints or cost increases could adversely affect our business.
In connection with maintaining and repairing our aircraft, we rely on a few key vendors for the supply and overhaul of components fitted to our aircraft. These vendors have historically worked at or near full capacity supporting the aircraft production lines and the maintenance requirements of a range of customers. From time to time, these vendors may experience backlogs in their delivery schedules, and some parts may be in limited supply. If we are unable to perform timely maintenance and repairs, our aircraft may be unable to meet contract demands or may be underutilized, which could have an adverse impact on our financial performance. Additionally, cost increases for critical aircraft components or repair services could also reduce the profitability of our operations. Supply constraints or cost increases for important aircraft components and services could have a material adverse effect on our results of operations.
Obtaining supplies of aircraft components and parts can be more challenging or costly in our foreign operations. In connection with conducting operations in foreign locations, we typically attempt to store nearby a sufficient amount of key integral parts. If we store too few of these parts, we could incur the type of maintenance and repair delays described above. On the other hand, if we store too many parts in remote locations, a portion of them could become unusable or obsolete, causing us to record impairment charges.
9
Table of Contents
Failure to develop or implement new technologies could affect our results of operations.
Many of the aircraft that we operate are characterized by changing technology and shifting client demands, including technology preferences. Our future growth and financial performance will depend in part upon our ability to develop, market and integrate new services and to accommodate the latest technological advances and client preferences. If we are unable to upgrade our operations or fleet with the latest technological advances in a timely manner, or at all, our business, financial condition and results of operations could be adversely impacted.
Our Air Medical operations expose us to numerous special risks, including collection risks and potential medical malpractice claims.
Our Air Medical operations expose us to a number of risks that we do not encounter in our Oil and Gas operations. For instance, the fees for our Air Medical services generally are paid by insurance companies, government agencies under federal programs such as Medicare and Medicaid, or individual patients. Reimbursement rates vary among payor types, with commercial insurers typically reimbursing us at a higher rate than Medicare, Medicaid, and self-pay reimbursement rates. We respond to calls for Air Medical transport without reviewing the creditworthiness or insurance coverage of the patient and are not permitted to refuse service to patients based on their inability to pay. As a result, the profitability of our Air Medical operations depends not only on our ability to generate an acceptable volume of patient transports, but also on our ability to collect our transport fees. Because our mix of customers is subject to change and their payment rates vary, the collection rates of our Air Medical invoices are more volatile than the collection rates of our Oil and Gas invoices.
Our reliance on our ability to collect air medical transport fees gives rise to several risks. Because the mix of customers is subject to change due to a variety of factors and their payment rates vary significantly, the collection rate for our Air Medical invoices are more volatile than the collection rate of our Oil and Gas invoices. Complexity associated with patient billing typically causes delays in the collection process, which decreases our cash flows and frequently increases the risk of nonpayment. As noted further below, our collection rates are directly impacted by the number of payments we receive from third party payors and the rates they are willing or authorized by law to pay. Our collection rates may decline due to several factors beyond our control, including (i) an aging population that causes more patients to become eligible for Medicare coverage and (ii) continuing federal and state legislative action that increases the number of younger patients eligible for Medicaid coverage.
We employ paramedics, nurses, and other medical professionals for these operations, which can give rise to medical malpractice claims against us, which, if not fully covered by our medical malpractice insurance, could materially adversely affect our financial condition and results of operations. In the normal course of transporting patients, we may come into contact with individuals suffering from an infectious disease, which could be transmitted to our employees or others. These transmissions could give rise to employee shortages, quarantines, or medical malpractice claims, any of which could materially adversely affect our financial condition and results of operations.
Risks Relating to Regulatory Matters
Our operations are heavily regulated, which restricts our flexibility and subjects us to various costs and compliance risks.
Our domestic operations are heavily regulated by a number of federal and state agencies. All of our U.S. flight operations are regulated by the FAA. Aircraft accidents are subject to the jurisdiction of the National Transportation Safety Board. Standards relating to workplace health and safety are monitored by OSHA. We are also subject to various federal and state healthcare, communications, and other laws and regulations.
The FAA has jurisdiction over many aspects of our business, including personnel, aircraft, maintenance and ground facilities, and has the power to suspend or curtail the use of aircraft deemed unsafe. We are required to have an Air Taxi Certificate, granted by the FAA, to transport personnel and property domestically in our helicopters. This certificate contains operating specifications that allow us to conduct our present operations, but it is potentially subject to amendment, suspension, or revocation in accordance with procedures set forth in the Federal Aviation Act of 1958.
FAA regulations currently require that at least 75% of our voting securities be owned or controlled by citizens of the U.S. or one of its possessions, and that our president and at least two-thirds of our directors be U.S. citizens. Currently, our president and each of our directors are U.S. citizens. Moreover, as noted further below under the heading “– Other Risks Specific to our Company – Our articles of incorporation limit the ownership of voting
10
Table of Contents
securities by persons who are not U.S. Citizens, which could have adverse effects,” our charter provides for the automatic reduction in voting power of each share of voting common stock owned or controlled by a non-U.S. citizen if necessary to comply with these regulations.
We are subject to significant regulatory oversight by OSHA and similar state agencies. We are also subject to the Communications Act of 1934 because of our ownership and operation of a radio communications network that we use to communicate with our pilots throughout the Gulf of Mexico.
Numerous other federal statutes and rules extensively regulate our offshore operations and those of our oil and gas customers. Under these statutes and rules, the federal government has broad discretion to establish the terms under which offshore properties are leased and operated, and to suspend, curtail, or modify certain or all offshore operations. A suspension or substantial curtailment of offshore oil and gas operations for any prolonged period would have an immediate and materially adverse effect on us. A substantial modification of offshore operations could adversely affect the economics of such operations and result in reduced demand for our services. For additional related information, see “– Other Risks Specific to our Company” below.
As noted in greater detail in the risk factors below, the healthcare industry is heavily regulated and closely scrutinized by federal, state and local governments. Among other things, these laws and regulations govern our reimbursements from Medicare and Medicaid and the privacy and security of the medical records of patients transported by us. Our Air Medical operations further require us to obtain, maintain and periodically renew various state ambulance licenses. If we cannot timely obtain and thereafter maintain and renew these licenses in our operating markets, our ability to conduct or expand our Air Medical operations could be adversely affected.
Many of the principal governmental agencies that regulate us regularly conduct audits or inspections of our aircraft, facilities, training procedures, records or operations, and, if warranted by their findings, investigations of our affairs. Several of these agencies also require us to file reports confirming our continued compliance with applicable regulations. This continuous monitoring of our operations increases the risk that regulators will allege that we have failed to comply with all applicable laws and regulations.
If we fail to comply with certain of the regulations cited above, we could lose our operating authority or participation rights under one or more of the above-described licenses, certificates, programs or laws. In addition, these detailed regulations increase our operating and compliance costs, limit our operational flexibility, and subject us to the risk of substantial fines and penalties in the event we fail to comply therewith.
Our operations are subject to stringent and comprehensive environmental laws and regulations that may expose us to significant costs and liabilities.
Our operations are subject to stringent laws and regulations relating to environmental protection. Inherent in our business is the risk of incurring significant environmental costs and liabilities due to our (i) handling of petroleum products and generated wastes, (ii) air emissions and wastewater discharges, and (iii) historical operations and waste disposal practices. Environmental laws and regulations generally require us to obtain permits such as air emissions and wastewater permits, require us to remain in compliance with the permits, restrict the types, quantities and concentration of materials that can be released into the environment in connection with regulated activities, and impose substantial liabilities for pollution resulting from operations. Failure to comply with these laws and regulations or the terms or conditions of required environmental permits may result in the assessment of administrative, civil or criminal penalties, the imposition of remedial obligations or corrective actions, and the issuance of injunctions limiting or prohibiting some or all of our operations.
We currently own or lease, and have in the past owned or leased, properties that have been used for many years by us or others for various aviation operational support and maintenance activities. Petroleum products and wastes may have been disposed or released on or under properties owned or leased by us or on or under other locations where we have arranged for such petroleum products or wastes to be taken for disposal or recycling. In addition, many of these properties have been operated by third parties whose treatment and disposal or release of petroleum products or wastes were not under our control. Because operating and maintaining helicopters cause us to generate, handle and dispose of materials that may be classified as “hazardous substances,” “hazardous wastes,” or other types of regulated materials, we may incur joint and several strict liability under applicable federal laws, including the federal Comprehensive Environmental Response, Compensation, and Liability Act, also referred to as the Superfund Law, and the Federal Resource Conservation and Recovery Act, as well as analogous state laws. Under such laws, we could be required to remove or remediate previously disposed wastes or property contamination, restore affected properties, or undertake measures to prevent future contamination. In addition, future spills or releases of regulated
11
Table of Contents
substances or the discovery of currently unknown contamination could expose us to material losses, expenditures and environmental liabilities, including liabilities resulting from lawsuits brought by private litigants or neighboring property owners or operators for personal injury or property damage related to our operations or the land on which our operations are conducted. We generally cannot recover these costs from insurance.
Our Air Medical operations are governed by various federal and state laws and regulations concerning the disposal of medical wastes. Similar to the regulation of other hazardous substances, the regulation of the labeling, transportation and disposal of medical waste is rigorous, and subjects us to substantial potential penalties in the event we fail to comply therewith.
Changes in any of the above-described laws, regulations or enforcement policies could require us to obtain more costly pollution control equipment or subject us to more stringent waste handling, storage, transport, disposal or cleanup requirements or other unforeseen liabilities, any of which could require us to make significant expenditures. For example, the U.S. government and several states have pursued regulatory initiatives designed to restrict the emission of carbon dioxide, methane and other greenhouse gases. Any adoption of laws or regulations that limits emissions of greenhouse gases from equipment or operations could result in increased costs to reduce such emissions from our operations as well as those of our customers and could adversely affect demand for our services.
The healthcare industry is heavily regulated and if we fail to comply with these laws and government regulations, we could incur penalties or be required to make significant changes to our operations.
As noted above, the healthcare industry is heavily regulated and closely scrutinized by various federal, state and local governmental agencies. Comprehensive statutes and regulations govern the manner in which we provide and bill for services, our contractual relationships with our vendors and customers, our marketing activities and other aspects of our operations. Some of these laws are further described below. Failure to comply with these laws can result in civil and criminal penalties such as fines, damages and exclusion from the Medicare and Medicaid programs. The risk of us being found to be in violation of these laws and regulations is increased by the fact that many of them have not been fully interpreted by the regulatory authorities or the courts, and their provisions are sometimes open to a variety of interpretations. Any action against us for violation of these laws or regulations, even if we successfully defend against it, could cause us to incur significant legal expenses and divert our management’s attention from the operation of our business.
In addition, certain state laws or regulations require our Air Medical operations to obtain and maintain accreditation with specified accreditation authorities. The accreditation process is rigorous, and any failure to obtain or maintain accreditation in any particular state could expose us to fines, penalties, loss of contracts or reputational harm.
Recent changes in healthcare laws and regulation could have a material impact on our business.
On March 23, 2010, the Patient Protection and Affordable Care Act (“PPACA”) became law, enacting comprehensive healthcare reform in the United States. The legislation aims to expand health insurance coverage to uninsured Americans and, among several other things, expands the number of Medicaid recipients and assesses fees on employers who do not offer qualifying coverage to employees. The legislation also has provisions aimed at controlling healthcare costs. With respect to our Air Medical operations, we may be adversely affected by any resulting decrease in reimbursement rates per flight from Medicaid, Medicare and commercial insurance payors and by any increase in the number of Medicaid payors, but we may also benefit from any increase in payments from individuals who were previously uninsured. As such, the ultimate impact of the PPACA on our Air Medical operations remains uncertain.
The PPACA also regulates the terms, conditions and cost-sharing of employer-provided health coverage that we offer to our employees. Beginning in 2016, the PHI health plan has lost its status as a “grandfathered health plan,” as defined under PPACA. Because of the loss of grandfathered status, we intend to change some of the terms of our health plan to avoid paying penalties to the government. These changes could result in increased healthcare costs to both PHI and its employees.
Our Air Medical operations are subject to comprehensive and complex laws and rules that govern the manner in which we bill and are paid for our services by third party payors, and our failure to comply with these rules could have serious consequences.
Like most healthcare providers, the majority of our Air Medical services are paid for by private and governmental third party payors, including Medicare and Medicaid. These third party payors typically have differing and complex
12
Table of Contents
billing and documentation requirements that we must meet in order to receive payment for our services. Reimbursement to us is typically conditioned on our providing the correct codes and properly documenting the services, including the level of service provided, the medical necessity for the services, and the site of service.
We must also comply with numerous other laws applicable to our Air Medical documentation and the claims we submit for payment, including but not limited to (1) “coordination of benefits” rules that dictate which payor we must bill first when a patient has potential coverage from multiple payors; (2) requirements that we obtain the signature of the patient or patient representative, or, in certain cases, alternative documentation, prior to submitting a claim; (3) requirements that we repay any payor which pays us more than the amount to which we are entitled; (4) requirements that we bill a hospital, rather than Medicare, for certain ambulance transports provided to Medicare patients of such facilities; (5) requirements that our electronic claims for payment be submitted using certain standardized transaction codes and formats; and (6) laws requiring us to handle all health and financial information of our patients in a manner that complies with specified security and privacy standards. From time to time, the failure of the federal government to timely issue Medicare or Medicaid billing numbers has impeded our potential to expand operations.
Governmental and private third party payors and other enforcement agencies carefully audit and monitor our compliance with these and other applicable rules. Our failure to comply with the billing and other rules applicable to us could result in non-payment for services rendered or refunds of amounts previously paid for such services. In addition, non-compliance with these rules may cause us to incur civil and criminal penalties, including fines and exclusion from government healthcare programs such as Medicare and Medicaid, under a number of state and federal laws.
Changes in the rates or methods of third-party reimbursements may adversely affect Air Medical’s revenue and operations.
Our Air Medical segment derives most of its revenue from billings to third-party payors such as Medicare, Medicaid and private health insurance companies. As a result, any unfavorable changes in the rates or methods of reimbursement for the services we provide could have a significant adverse impact on our revenue and financial results. Over the past several years, the U.S. Congress has taken steps to reduce Medicare and Medicaid spending levels, which has resulted in lower reimbursement rates for our services and constrained our ability to charge higher amounts to cover cost increases. In addition to the above-described changes in reimbursement rates effected pursuant to the PPACA, in 2012 the U.S. Congress adopted legislation implementing “sequestration” reductions in federal spending. Under these “sequestration” budget cuts (as subsequently extended by Congress), Medicare provider payments have been reduced by 2% annually commencing April 1, 2013, and are scheduled to remain in effect through 2023.
We believe that regulatory trends in cost containment will continue, and that additional budget cuts might be imposed in the future. We cannot assure you that we will be able to offset reduced operating margins through cost reductions, increased volume, or otherwise. Future rate reductions could place downward pressure on the rates payable by private health insurance providers. Any such rate reductions could have a material adverse effect on our business, financial condition or results of operations.
Under federal privacy laws, our Air Medical operations are subject to more stringent penalties in the event we improperly use or disclose protected health information regarding our patients.
Certain privacy regulations promulgated under the Health Insurance Portability and Accountability Act of 1996, or HIPAA, contain detailed requirements concerning the use and disclosure of individually identifiable health information by our Air Medical operations. In addition to complying with these privacy requirements, we must implement certain administrative, physical, and technical security standards to protect the integrity, confidentiality and availability of certain electronic health information received, maintained, or transmitted by us or our business associates.
The enactment in 2009 of the Health Information Technology for Economic and Clinical Health (“HITECH”) Act modified HIPAA in a manner that increases both the risk and consequences of enforcement actions. Violations of the HIPAA privacy and security standards, as amended by the HITECH Act, may result in substantial civil and criminal penalties. The civil penalties range up to $50,000 per violation, subject to certain limitations, although a single breach incident can result in violations of multiple standards. We are also subject to certain “breach notification” regulations that require us to promptly notify affected individuals in the case of a breach of “unsecured protected health information” (as defined in such regulations). In addition, we must notify the federal government and the media if a breach affects more than 500 individuals.
13
Table of Contents
Many states in which we operate also have state laws that protect the privacy and security of confidential personal information. These laws may be similar to or even more protective than the federal provisions. Not only may some of these state laws impose fines and penalties upon violators, but some may afford private rights of action to individuals who believe their personal information has been misused. California’s patient privacy laws, for example, provide for substantial penalties and permit injured parties to sue for damages.
Our relationships with our vendors and customers and our marketing practices are subject to the federal Anti-Kickback Statute and similar state laws.
We are subject to the federal Anti-Kickback Statute, which prohibits the knowing and willful offer, payment, solicitation or receipt of any form of “remuneration” in return for, or to induce, the referral of business or ordering of services paid for by Medicare or other federal programs. “Remuneration” has been broadly interpreted to mean anything of value, including, for example, gifts, discounts, credit arrangement and in-kind goods or services, as well as cash. Certain federal courts have held that the Anti-Kickback Statute can be violated if “one purpose” of a payment is to induce referrals. The Anti-Kickback Statute is broad and prohibits many arrangements and practices that are lawful in businesses outside of the healthcare industry. Violations of the Anti-Kickback Statute can result in imprisonment, civil or criminal fines or exclusion from Medicare and other governmental programs. The PPACA amended the Anti-Kickback Statute in a manner that makes it easier for the government to demonstrate intent to violate the statute, which is an element of a violation.
Many states have adopted laws similar to the federal Anti-Kickback Statute. Some of these state prohibitions apply to referral of patients for healthcare items or services reimbursed by any payor, not only the Medicare and Medicaid programs. Exclusions from liability differ from state to state, rendering compliance more difficult and uncertain.
The federal False Claims Act is used frequently by the government and private parties against healthcare providers in challenging the accuracy of their claims for reimbursement and other conduct related to such claims.
The federal False Claims Act imposes liability on any person or entity who, among other things, knowingly presents, or causes to be presented, a false or fraudulent claim for payment by a federal healthcare program. The False Claims Act allows a private individual to bring “qui tam” actions on behalf of the federal government alleging that the defendant has submitted a false claim to the federal government, and to share in any monetary recovery. In recent years, the number of suits brought by private individuals has increased dramatically. In addition, various states have enacted false claim laws analogous to the False Claims Act. Many of these state laws apply where a claim is submitted to any third party payor and not merely a federal healthcare program.
Certain regulations dictate how we have structured our operations, and subject us to various costs and uncertainties.
The U.S. Centers for Medicare and Medicaid Services require us to complete and periodically update enrollment forms in order to obtain and maintain certification to receive reimbursements from Medicare and Medicaid. Under applicable regulations, relatively inconsequential changes in our corporate structure or ownership might require us to provide notice of the changes and to re-enroll or take other steps necessary to maintain our certification to participate in these programs. In addition, certain FAA regulations are designed to ensure that license holders can demonstrate their control of assets, services and competent personnel necessary to provide safe flight services. In response to these regulatory requirements, we have segregated the operations of our different operating segments, which in certain instances has increased our operating and administrative costs. Although we believe our organizational structure is substantially consistent with applicable governmental regulations, we cannot assure you of this.
We are exposed to risks arising out of changing laws, regulations and disclosure standards affecting all U.S. public companies.
Changing laws, regulations and standards relating to corporate governance and public disclosure, including the Sarbanes-Oxley Act adopted in 2002 and the Dodd-Frank Wall Street Reform and Consumer Protection Act adopted in 2010, and related regulations implemented thereunder, have increased our legal and financial compliance costs and made some activities more time consuming. Any failure to successfully or timely complete annual assessments
14
Table of Contents
of our internal controls required by Section 404 of the Sarbanes-Oxley Act could subject us to sanctions or investigation by regulatory authorities. Any such action could adversely affect our financial results or our reputation with investors, lenders and others.
If we are unable to effectively adapt to changes in the healthcare industry, our business may be harmed.
Political, economic and regulatory influences are subjecting the healthcare industry in the United States to fundamental change. As noted above, the long-term impact of the PPACA remains unknown, but could be substantial. We anticipate that Congress and state legislatures will continue to review and assess alternative healthcare delivery and payment systems and may in the future propose and adopt legislation effecting additional fundamental changes in the healthcare delivery system. We cannot assure you as to the ultimate content, timing or effect of changes, nor is it possible at this time to estimate the impact of potential legislation. Similarly, changes in private payor reimbursement programs could lead to adverse changes in government payor programs, which could have a material adverse effect on our business, financial condition or results of operations.
Changes in any of the above-described laws or regulations may limit our ability to plan and could subject us to further costs or constraints.
From time to time, the laws or regulations governing us or our customers, or the government’s policy of enforcing those laws or regulations, have changed frequently and materially, particularly in the recent past with respect to laws applicable to medical operations and environmental protection. The variability of these laws could hamper the ability of us and our customers to plan for the future or establish long-term strategies. Moreover, future changes in these laws or regulations could further increase our operating or compliance costs, or further restrict our operational flexibility, any of which could have a material adverse effect on our results of operations, competitive position, financial condition or prospects.
Risks Related to our Liquidity and Capital Resources
Our substantial indebtedness and operating lease commitments could adversely affect our financial condition and impair our ability to operate our business.
We are a highly leveraged company and, as a result, have significant debt services obligations. We also have significant operating lease commitments and, as a result, have significant rent expense.
As of December 31, 2015, our total indebtedness was $557.5 million, consisting of $500 million of our 5.25% Senior Notes due 2019 and $57.5 million of borrowings outstanding under our $150 million revolving credit facility, which matures in 2017. We have a separate letter of credit facility that had $15.3 million outstanding at December 31, 2015. As of December 31, 2015, we had approximately $292.4 million in aggregate commitments under aircraft and other operating leases, of which approximately $50.3 million are payable through December 31, 2016. The total lease commitments include $277.2 million for aircraft and $15.2 million for facility lease commitments, primarily for our facilities in Lafayette, Louisiana. For additional information on our indebtedness and commitments, please see Items 7 and 8 of this report.
The degree to which we are leveraged or may become leveraged in the future could have important consequences to our equity and debt holders, including:
| • | limiting our ability to access the capital markets; |
| • | hindering our ability to capitalize on business opportunities and to plan for or react to changing market, industry, competitive or economic conditions; |
| • | limiting the amount of cash flow available for use in the business, including for working capital, capital expenditures, aircraft purchases, future operations, acquisitions, expansion or other uses, or to carry out other aspects of our business plan; |
| • | making us more vulnerable to economic or industry downturns, including interest rate increases; |
| • | placing us at a competitive disadvantage compared to less leveraged competitors; |
| • | increasing the risk that we will need to sell securities or assets, possibly on unfavorable terms, to meet payment obligations; or |
15
Table of Contents
| • | increasing the risk that we may not meet the financial covenants contained in our debt agreements or timely make all required debt payments. |
Subject to the limits contained in our existing debt instruments, we may be able to incur substantial additional debt from time to time. If we do so, the effects of each of these factors could be intensified.
Our business requires us to incur substantial capital expenditures.
Our business is capital intensive, and we anticipate that our capital requirements will continue to be significant in the future. Our capital expenditures relate primarily to the purchase of aircraft, including purchases of aircraft under purchase options, as well as capital improvements that enhance the value or safety of our aircraft and related infrastructure or that are necessitated by changes in technology or customer preferences. At December 31, 2015, were committed to pay approximately $27.7 million to purchase aircraft in 2016. If we fail to adequately invest in our aircraft and related infrastructure in the future, the competitiveness of our fleet and service offerings could suffer.
Our ability to meet our debt obligations and other commitments will depend on our future performance, which will be affected by financial, business, economic, regulatory and other factors, many of which we are unable to control.
Our ability to make payments on our indebtedness and under our operating leases and to fund planned capital expenditures will depend on our ability to generate cash in the future. This is subject to conditions in the oil and gas and air medical industries, general economic and financial conditions, the impact of legislative and regulatory actions on how we conduct our business, and several other factors, all or most of which are beyond our control. Our inability to generate sufficient cash flow to satisfy our debt and operating lease obligations, or to obtain alternative financings, could materially and adversely affect our business, financial condition, results of operations and prospects.
Failure to comply with covenants in our debt instruments could adversely affect our business.
Our revolving credit facility and the indenture governing our 5.25% Senior Notes due 2019 limit, among other things, our ability to:
| • | pay cash dividends or distributions on our capital stock or redeem or repurchase our capital stock; |
| • | make certain investments; |
| • | create certain liens on our assets to secure debt; |
| • | consolidate, merge or enter into other business combination transactions; |
| • | issue and sell capital stock of our subsidiaries; |
| • | incur additional indebtedness or issue certain capital stock; |
| • | enter into different lines of business; |
| • | enter into agreements that restrict dividends or other payments from our subsidiaries to us; |
| • | participate in activities through business entities that are not subsidiaries; |
| • | enter into certain transactions with affiliates; and |
| • | transfer or sell assets. |
In addition, our revolving credit facility requires, and our future credit facilities may require, us to maintain specified financial ratios and satisfy certain financial condition tests, and may require us to take action to reduce our debt or take some other action to comply with them. Our ability to meet these financial ratios and tests can be affected by events beyond our control, and we cannot assure you that we will meet them in the future. These restrictions could also limit our ability to obtain future financings, make needed capital expenditures, withstand a downturn in our business or the economy in general, or otherwise conduct necessary corporate activities. We may
16
Table of Contents
also be prevented from taking advantage of business opportunities that arise because of the limitations imposed on us by the restrictive covenants under our revolving credit facility and the above-described indenture governing our 5.25% Senior Notes due 2019.
If we fail to comply with any of the above-described covenants, we could be in default under our revolving credit facility and the indenture governing our 5.25% Senior Notes due 2019, and the principal and accrued interest on our outstanding indebtedness may become due and payable.
Upon a change of control, holders of our public debt securities will have the right to require us to purchase their notes, which could have certain adverse ramifications.
Upon a “Change of Control Repurchase Event” (as defined in the indenture governing our 5.25% Senior Notes due 2019), each holder of our 5.25% Senior Notes due 2019 will have the right to require us to purchase any or all of that holder’s notes. If, due to lack of cash, legal or contractual impediments, or otherwise, we fail to discharge these obligations, such failure could constitute an event of default under such notes, which could in turn constitute a default under other of our agreements relating to our indebtedness outstanding at that time. In addition, actions taken by us to comply with these purchase obligations could constitute a default under our revolving credit facility, unless waived by the lender. Moreover, the existence of these purchase obligations may in certain circumstances make more difficult or discourage a sale or takeover of us or the removal of our incumbent directors.
Any downgrade in the credit ratings for our public debt securities could limit our ability to obtain future financing, increase our borrowing costs and adversely affect the market price of our outstanding debt securities, or otherwise impair our business, financial condition and results of operations.
Credit rating agencies continually review their ratings for the companies that they follow, including us. Credit rating agencies also evaluate the industries in which we and our affiliates operate as a whole and may change their credit rating for us based on their overall view of such industries. There can be no assurance that any rating assigned to our currently outstanding public debt securities will remain in effect for any given period of time or that any such ratings will not be lowered, suspended or withdrawn entirely by a rating agency if, in that rating agency’s judgment, circumstances so warrant.
A downgrade of our credit ratings could, among other things:
| • | limit our access to the capital markets or otherwise adversely affect the availability of other new financing on favorable terms, if at all; |
| • | result in more restrictive covenants in agreements governing the terms of any future indebtedness that we may incur; |
| • | increase our cost of borrowing; |
| • | adversely affect the market price of our 5.25% Senior Notes due 2019; and |
| • | impair our business, financial condition and results of operation. |
We plan to access the debt markets from time to time, and we cannot assure you that these markets will remain free of disruptions.
We have a significant amount of indebtedness that we typically refinance from time to time, principally through the issuance of new debt securities. Moreover, we might seek financing from time to time to fund other cash requirements, such as financing aircraft purchases or paying unanticipated liabilities. Our ability to arrange additional financing will depend on, among other factors, our financial position, performance, and credit ratings, as well as prevailing market conditions and other factors beyond our control. Global financial markets continue to be volatile, particularly with respect to companies engaged in or associated with the oil and gas industry. Prevailing market conditions could be adversely affected by (i) general economic conditions, such as disruptions in domestic or overseas sovereign debt markets, geo-political instabilities, contractions or limited growth in the economy or other similar adverse economic developments in the U.S. or abroad, and (ii) specific conditions in the oil and gas industry, such as the continuation of low commodity prices. Volatility in the global markets, among other factors, could limit our access to the credit markets, leading to higher borrowing costs or our inability to obtain financing on terms that are as favorable as those from which we previously benefitted, on terms that are acceptable to us, or at all. Any such failure to obtain additional financing could jeopardize our ability to repay, refinance or reduce our debt obligations or to meet our other financial commitments.
17
Table of Contents
Other Risks Specific to our Company
We are highly dependent on the offshore oil and gas industry, particularly in the Gulf of Mexico.
Approximately 57% of our 2015 operating revenue was attributable to providing helicopter services for offshore oil and gas exploration and production companies, substantially all of which was in the Gulf of Mexico. Our business is highly dependent on the level of exploration, development and production activity by oil and gas companies, particularly in the Gulf of Mexico. The level of exploration, development and production activity is directly affected by trends in oil and gas prices, which historically have been volatile and difficult to predict. Oil and gas prices are subject to large fluctuations in response to relatively minor changes in supply and demand, economic growth trends, market uncertainty and a variety of other factors beyond our control. Lower oil and natural gas prices generally lead to decreased spending by our customers over time.
The level of prevailing oil and gas prices depends on various factors that we cannot control, including:
| • | the supply of, and demand for, oil and natural gas and market expectations regarding supply and demand; |
| • | the cost of exploring for, developing and producing oil and gas; |
| • | weather-related or other natural causes; |
| • | actions of the Organization of the Petroleum Exporting Countries and Middle Eastern and other oil producing countries to control prices or change production levels; |
| • | changes in exploration, development or production technologies relating to offshore or onshore oil and gas deposits; |
| • | the price and availability of alternative fuels or energy sources; |
| • | the extent to which taxes, tax credits, environmental regulations, auctions of mineral rights, drilling permits, drilling concessions, drilling moratoriums (including actions similar to the moratorium imposed as a result of the Deepwater Horizon accident described below) or other governmental regulations, actions or policies affect the production, cost of production, price or availability of petroleum products and alternative energy sources; |
| • | general economic and political conditions in the United States and worldwide; and |
| • | geo-political instabilities, including those resulting from war, civil unrest or terrorist activities. |
Any substantial or extended decline in the price of oil or natural gas, such as the one we are currently experiencing, depresses the level of helicopter activity in support of exploration and production activity and thus reduces the demand for our offshore flight services.
Moreover, weakness in the oil and gas industry generally weakens the financial position of our customers, which in turn could cause them to fail to pay amounts owed to us in a timely manner or at all. Any of these events could have a material adverse effect on our business, results of operations, financial condition and prospects.
The Gulf of Mexico is generally considered to be a mature area for oil and gas exploration, which may result in a continuing decrease in activity over time. This could materially adversely affect our business, results of operations and financial condition. In addition, the concentrated nature of our operations subjects us to the risk that a regional event could cause a significant interruption in our operations or otherwise have a material effect on our profitability.
Changes in industry conditions that increase the prospects or profitability of onshore drilling, which generally does not require use of our helicopter services, could have an adverse effect on our operations. For instance, if onshore fracking were to meaningfully increase the domestic supply of hydrocarbons, it could potentially reduce the level of activity in the Gulf of Mexico and the demand for our helicopter services.
18
Table of Contents
The implementation of cost-saving measures by our oil and gas customers could result in lower demand for our services.
Companies in the oil and gas exploration and production industry continually seek to implement cost-savings measures, especially when prevailing oil and gas prices are depressed. As part of these measures, oil and gas companies have attempted to improve operating efficiencies with respect to helicopter support services. For example, certain oil and gas companies have pooled helicopter services among operators, reduced staffing levels by using technology to permit unmanned production installations and decreased the frequency of transportation of employees offshore by increasing the lengths of shifts offshore. The continued implementation of such measures or any decision of these companies to initiate their own helicopter support services could reduce demand or prevailing prices for our helicopter services and have a material adverse effect on our business, results of operations and financial condition.
We are heavily dependent on servicing deepwater facilities in the Gulf of Mexico with heavy aircraft.
Approximately 70% of our oil and gas segment revenues for the year ended December 31, 2015 were attributable to our deepwater operations in the Gulf of Mexico. Many of the helicopters we have purchased recently are larger aircraft intended to service deepwater activities, and the margins we earn on these aircraft are generally higher than on smaller aircraft. Consequently, our oil and gas operations are significantly dependent upon the availability of our heavy aircraft. If the FAA, PHI, or PHI’s customers were to deem these aircraft unsafe and suspend or curtail their use, our operating activities, financial position, cash flow and prospects could be materially adversely effected.
Moreover, any reduction in deepwater drilling activities could significantly impact our operations. As a result of the well-publicized sinking of the Deepwater Horizon rig in the Gulf of Mexico in April 2010, the U.S. Department of the Interior imposed a moratorium on deepwater drilling in the Gulf of Mexico from May through October 2010. The moratorium had a significant adverse impact on our business, particularly in the fourth quarter of 2010 and the first half of 2011. Any future accident or development that has a similar adverse impact on deepwater drilling in the Gulf of Mexico could have a material adverse effect on our business.
We depend on a small number of large customers for a significant portion of our revenues.
Our Oil and Gas segment derives a substantial portion of its operating revenues and income from a limited number of major and independent oil and gas companies. Our Air Medical segment derives a significant portion of its operating revenues and income from a single overseas customer. For the year ended December 31, 2015, approximately 35% of our operating revenues were attributable to our two largest Oil and Gas customers and our largest Air Medical customer, in the aggregate. For the same period, approximately 44% of our operating revenues were attributable collectively to our top five largest customers. We cannot assure you that these customers will continue to contract with us on terms or at rates currently in effect, or will not elect to contract with our competitors or perform their own transportation services themselves. The loss of one of our top customers, if not offset by revenues from new or other existing customers, would have a material adverse effect on our business and operations. In addition, our concentration of customers within the oil and gas industry may impact our overall credit risk in that these entities may be similarly affected by changes in economic and other conditions.
Consolidation of our offshore customer base could adversely affect demand for our services and reduce our revenues.
Many of our Oil and Gas customers are international, major integrated or independent oil and gas exploration, development and production companies. In recent years, these companies have undergone substantial consolidation, and additional consolidation is possible. Consolidation results in fewer companies to charter or contract for our offshore services. In the event one of our customers combines with a company that is using services of one of our competitors, the combined company could decide to use the services of that competitor or another provider. Further, merger activity could impact exploration, development and production activity in other ways, particularly if the combined company adopts a combined exploration and development budget that is lower than the total budget of both companies before consolidation.
Our domestic pilot workforce is represented by a union, although we and the union do not have a current agreed upon collective bargaining agreement.
Our domestic pilots are represented by the Office and Professional Employees International Union (the “OPEIU”). We have not had a collective bargaining agreement with the OPEIU in several years, and bargaining was deferred
19
Table of Contents
for years during the pendency of OPEIU’s suit against us, which was terminated in late 2013. At this time, we cannot predict the impact of future negotiations with the OPEIU, or when or whether a new agreement might be reached. If an agreement is reached, such agreement may cause us to incur additional expenses related to our employees, thereby reducing our profits and impacting our financial results negatively. Additionally, if an agreement is not reached and there are labor disputes, including strikes, our operations and flight services could suffer, thereby negatively impacting our financial results.
Our ability to attract and retain key personnel is critical to our future success, and, in certain instances, could be influenced by events beyond our control.
We are materially reliant on the skills, experience and performance of a limited number of senior officers. If we lose the services of key managers and cannot attract equally qualified replacement personnel, our business may be materially adversely affected.
Similarly, our ability to attract and retain qualified pilots, mechanics, technicians, nurses, paramedics, and other highly-trained personnel is an important factor in determining our future success. The market for these experienced and highly-trained personnel is competitive and may become more competitive. Several of our Air Medical operating bases are located in rural areas, which potentially increases the difficulty of locating qualified personnel. Many of our customers require pilots of aircraft that service them to have extremely high levels of flight experience. Accordingly, we cannot be assured that we will be successful in our efforts to attract and retain such personnel in the future. A limited supply of qualified applicants may contribute to wage increases that increase our operating costs.
A substantial portion of our helicopter pilots previously served in the U.S. military. Many of our pilots who served in the Vietnam War are approaching retirement. Following their retirement, there may be a more limited pool of pilots qualified to fly our helicopters, which could adversely impact our ability to provide services or increase the compensation necessary to attract and retain our pilots.
Moreover, several of our pilots are subject, under certain circumstances, to being called upon to provide additional military services or national guard services. If a substantial number of our pilots were called upon within a short period of time or during a time of pilot shortages, our operations could be disrupted or adversely affected.
Our business is subject to potential security breaches or other system failures.
As service providers, we rely on information technology networks and systems, including the Internet, to process, transmit and store electronic information, to bill our customers, to monitor the flights of our aircraft, to communicate with our pilots, employees, suppliers, customers and others, to manage or support a variety of our other business operations, transactions and processes, and to maintain various records, which may include personally identifiable information of customers, employees or other third parties. Additionally, this information may include medical information that is subject to and regulated by privacy laws, as described further in the risk factors referenced above.
System failures could materially disrupt our ability to conduct operations and security breaches could compromise the confidentiality of our data or our customer’s data. We make significant efforts to maintain the integrity and continuity of our systems and to safeguard the security of these types of information, including maintaining contingency plans in the event of security breaches or other system failures. We cannot assure you that our security efforts and measures will prevent service disruptions, unauthorized access to our systems, loss or destruction of data, account takeovers, or other forms of cyber-attacks or similar events, whether caused by mechanical failures, human error, fraud, malice, sabotage or otherwise. The frequency, scope and sophistication of cyber-attacks continue to grow, which increases the possibility that our security measures will be unable to prevent our systems’ improper functioning or the improper disclosure of personally identifiable information (including medical information). Any failure of our information or communications systems, whether caused by attacks, mechanical failures, natural disasters or otherwise, could interrupt our operations, damage our reputation, or subject us to liability claims or regulatory penalties, any of which could materially and adversely affect us. Although we maintain insurance coverage that may, subject to policy terms and conditions (including self-insured deductibles, coverage restrictions and monetary coverage caps), cover certain aspects of our cyber risks, such insurance coverage may be unavailable or insufficient to cover our losses.
20
Table of Contents
Our Chairman of the Board and Chief Executive Officer is also one of our principal shareholders and has voting control of the Company.
As of December 31, 2015, Al A. Gonsoulin, our Chairman of the Board and Chief Executive Officer, beneficially owned stock representing over 70% of the total voting power of our capital stock. As a result, he exercises control over the election of all of our directors and the outcome of all matters requiring a shareholder vote. This ownership also may delay or prevent a change in our management or a change in control of us, even if such changes would benefit our other shareholders and were supported by a majority of our shareholders.
As a “controlled company” within the meaning of the NASDAQ rules, we qualify for exemptions from certain corporate governance requirements designed to protect investors.
As a result of Mr. Gonsoulin’s controlling interest, we are a “controlled company” within the meaning of the corporate governance standards of NASDAQ. As a “controlled company,” we may elect to forego compliance with certain corporate governance requirements, including the requirements that we (i) maintain a board of directors comprised of a majority of independent directors, (ii) maintain a compensation committee comprised entirely of independent directors, and (iii) authorize independent directors to select or recommend our director nominees.
Currently, outside directors are not overseeing our director nomination process. Although currently we voluntarily maintain a board comprised of a majority of independent directors and a compensation committee composed entirely of independent directors, we cannot assure you that this will continue to be the case in the future. Accordingly, you may not have the same protections afforded to shareholders of companies that are subject to all of the corporate governance requirements of NASDAQ.
Our international operations are subject to political, economic and regulatory uncertainty.
Over the past five years, we have commenced operations in several foreign countries. Our international operations represented approximately 10% of our total operating revenues for the year ended December 31, 2015. As of December 31, 2015, we operated two aircraft in West Africa and eleven aircraft in the Middle East.
Our international operations are subject to U.S. and other laws and regulations regarding operations in foreign jurisdictions in which we provide services. These numerous and sometimes conflicting laws and regulations include anti-corruption laws, anti-competition laws, anti-boycott laws, tax laws, immigration laws, privacy laws and accounting requirements. Regulations that require the awarding of contracts to local contractors or the employment of local citizens may adversely affect our competitiveness in these jurisdictions. Local laws and regulations, and their interpretation and enforcement, differ significantly among those jurisdictions, and can change significantly over time. There is a risk that these laws or regulations may materially restrict our ability to deliver services in various foreign jurisdictions or could be breached through inadvertence or mistake, fraudulent or negligent behavior of our employees or agents, failure to comply with certain formal documentation or technical requirements, or otherwise. Violations of these laws and regulations could result in fines and penalties, criminal sanctions against us or our personnel, or prohibitions on the conduct of our business or our ability to operate in one or more countries, any of which could have a material adverse effect on our business, results of operations, financial condition or prospects.
In addition to these international regulatory risks, some of the other risks inherent in conducting business internationally include:
| • | tax, licensing, political or other business restrictions or requirements; |
| • | problems collecting accounts receivable in a timely manner or at all; |
| • | uncertainties concerning import and export restrictions, including the risk of fines or penalties assessed for violating export restrictions by the Office of Foreign Assets Controls of the U.S. Department of Treasury; |
| • | embargoes or other restrictive governmental actions that could limit our ability to operate in foreign countries; |
| • | additional U.S. and other regulation of non-domestic operations, including regulation under the Foreign Corrupt Practices Act, or FCPA, as well as other anti-corruption laws; |
21
Table of Contents
| • | economic, social and political instability, with the attendant risks of terrorism, kidnapping, extortion, civic unrest and potential seizure or nationalization of assets; |
| • | currency and repatriation restrictions and fluctuations in currency exchange rates; |
| • | the ability to secure and maintain the necessary physical infrastructure supporting operations; |
| • | potential submission of disputes to the jurisdiction of a foreign court or arbitration panel; |
| • | the inability to enforce our contract rights, either due to under-developed legal systems or government actions that result in a deprivation of contract rights; |
| • | pandemics or epidemics that disrupt our ability to transport people, fly our aircraft or otherwise conduct operations; |
| • | limitations in the availability, amount or terms of insurance coverage; |
| • | laws, policies or practices that restrict with whom we can contract or otherwise limit the scope of operations that can legally or practicably be conducted within any particular country; |
| • | the imposition of unanticipated or increased taxes, increased environmental and safety regulations or other forms of public or governmental regulation that increase our operating expenses; and |
| • | challenges in staffing and managing foreign operations, including logistical and communication challenges. |
Many of these risks are beyond our control, and we cannot predict the nature or the likelihood of the occurrence or corresponding effect of any such events, each of which could have an adverse effect on our financial condition and results of operations.
We operate in certain international areas through foreign entities that we do not control, which subjects us to a variety of risks.
In order to effectively compete in certain foreign jurisdictions, it is frequently necessary or required to establish joint ventures, strategic alliances or marketing arrangements with local operators, partners or agents. Frequently, we elect or are required by law to hold non-controlling investments in entities governed by foreign laws. As a result of not owning a majority interest in our unconsolidated affiliates, we do not have the ability to control their policies, management or operations, including the scope and quality of the services provided by these affiliates. Moreover, in certain instances, these local operators, partners or agents may have interests that are not always aligned with ours. Reliance on local operators, partners or agents could expose us to the risk of being held liable under the FCPA or other anti-corruption laws for actions taken by our strategic or local partners or agents even though these partners or agents may not themselves be subject to the FCPA or other applicable anti-corruption laws. Any determination that we have violated the FCPA or other anti-corruption laws could have a material adverse effect on our business, results of operations, reputation or prospects.
In certain foreign jurisdictions, we are subject to governmental regulation that limits foreign ownership of aircraft companies in favor of domestic ownership. Based on regulations in various markets in which we operate, our aircraft may be subject to deregistration and we may lose our ability to operate within these countries if certain levels of local ownership are not maintained. Any such actions could materially harm our ability to operate in such jurisdictions.
Regional instability in the Middle East and other of our overseas markets could adversely affect business conditions and disrupt our operations.
We currently operate in several foreign regions, including in the Middle East, the Mediterranean Sea and West Africa. Many of these areas, particularly in the Middle East, have experienced political, economic and social uncertainties. Adjoining or nearby countries have experienced civil war, military campaigns, civil unrest, terrorist activities, political turbulence or other forms of unrest. Any of these forms of unrest in areas in which we operate could adversely impact our operations in several ways, including endangering the safety of our personnel in the region, interfering with our ability to transport parts or personnel to the region, disrupting our operations, increasing our operating costs, and subjecting us to the risk of expropriation or other substantial changes in laws or regulations governing our overseas operations. Any of these could materially and adversely affect our overseas business or operations.
22
Table of Contents
Provisions in our articles of incorporation and by-laws and Louisiana law make it more difficult to effect a change in control of us, which could discourage a takeover of our company and adversely affect the price of our common stock.
Although an attempted hostile takeover of our company is unlikely by virtue of our Chief Executive Officer’s controlling voting interest, there are also provisions in our articles of incorporation and by-laws that may make it more difficult for a third party to acquire control of us, even if a change in control would result in the purchase of our company’s securities at a premium to the market price or would otherwise be beneficial to you. For example, our articles of incorporation authorize our board of directors to issue preferred stock without shareholder approval. If our board of directors elects to issue preferred stock, it could be more difficult for a third party to acquire us.
In addition, provisions of our by-laws, such as giving the board the exclusive right to fill all board vacancies, could make it more difficult for a third party to acquire control of us. For a complete understanding of our by-laws, you should read them in their entirety.
Our articles of incorporation limit the ownership of voting securities by persons who are not U.S. citizens, which could have certain adverse effects.
We must comply with certain securities ownership requirements in order to assure that we will be permitted to hold operating certificates issued by the FAA pursuant to regulations promulgated under the Federal Aviation Act of 1958, as amended. Failure to comply with these requirements could jeopardize our continued ability to hold FAA operating certificates. To assure such compliance, our articles of incorporation (our “Articles”) include certain provisions designed to enable us to regulate the ownership of our capital stock by persons who are not citizens of the United States.
Our Articles provide that if at any time the voting interest of Non-Citizen Owned Shares (as defined in our Articles) exceeds the Permitted Percentage (as defined in our Articles, and which such percentage is currently 24%), then (i) the voting power otherwise attributable to each Non-Citizen Owned Share will be immediately and automatically reduced on a pro rata basis in the manner prescribed therein without any further action by us so that the maximum number of votes that may be cast by the holders of all Non-Citizen Owned Shares shall equal the Permitted Percentage and (ii) the total voting power of any affected class or series of voting securities will also be immediately and automatically reduced without any further action by us to give effect to such above-described change.
These foreign ownership restrictions could limit the trading liquidity of our common stock by reducing our pool of potential shareholders. In addition, if we were to seek to sell any portion of our business that requires holding an FAA operating certificate, we would have fewer potential purchasers, since some potential purchasers might be unable or unwilling to satisfy the foreign ownership restrictions described above. As a result, the sales price for that portion of our business may not attain the amount that could be obtained in an unregulated market.
Our ability to use net operating loss carryforwards to reduce future tax payments may be limited if we experience an ownership change.
As described in Note 8 – Income Taxes of the Notes to Consolidated Financial Statements included in Item 8 of this report, we have substantial net operating loss carryforwards (“NOLs”) available to offset future taxable income. Our ability to use our federal NOLs could be substantially limited if we were to experience an “ownership change” as defined in Section 382 of the Internal Revenue Code (“IRC”). Generally, an ownership change occurs when the percentage of a corporation’s stock (by value) owned by all of the corporation’s 5% shareholders (as determined pursuant to the IRC), as a group, has increased by more than 50 percentage points over the lowest percentage of stock (by value) owned by the 5% shareholders, as a group, at any time during the past three years. A corporation must test to determine whether it has had an ownership change on any date that a 5% shareholder acquires stock. Changes in ownership of our stock are generally not within our control. If an ownership change were to occur, the use of our federal NOLs would be subject to an annual limit, generally equal to the value of the company multiplied by the long-term tax exempt rate, which could substantially limit our ability to use the NOLs each year and could result in NOLs expiring unused. Use of our state NOLs may also be limited by an ownership change.
23
Table of Contents
Tax audits or changes in tax laws could adversely affect us.
Like all large businesses, we are subject to frequent and regular audits by the Internal Revenue Service as well as state and local tax authorities. These audits could subject us to tax liabilities if adverse positions are taken by these tax authorities. We believe that we have adequately provided for tax contingencies. However, our tax audits and examinations may result in tax liabilities that differ materially from those that we have recognized in our consolidated financial statements. Because the ultimate outcomes of all of these matters are uncertain, we can give no assurance as to whether an adverse result from one or more of them will have a material effect on our financial results.
| ITEM 1B. | UNRESOLVED STAFF COMMENTS |
None.
24
Table of Contents
| ITEM 2. | PROPERTIES |
Aircraft
Information regarding our 255 owned or leased aircraft fleet and 10 customer-owned aircraft that we operated as of December 31, 2015 is set forth in the following table:
| Manufacturer |
Type |
Number in Fleet |
Engine |
Maximum Passenger Capacity |
Cruise Speed (mph) |
Approximate Range (miles)(2) |
||||||||||||||
| Light Aircraft |
||||||||||||||||||||
| Bell |
206 / 407 | 89 | Turbine | 4 – 6 | 130 – 150 | 300 – 420 | ||||||||||||||
| Eurocopter |
BK-117 | 5 | Twin Turbine | 4 – 6 | 135 | 255 – 270 | ||||||||||||||
| Eurocopter |
EC-135 (1) / EC-145 | 37 | Twin Turbine | 7 | 143 | 380 | ||||||||||||||
| Eurocopter |
AS350 B2 / B3 | 25 | Turbine | 5 | 140 | 335 – 385 | ||||||||||||||
| Medium Aircraft |
||||||||||||||||||||
| Bell |
212 (1) / 412 (1) | 14 | Twin Turbine | 8 – 13 | 115 – 160 | 300 – 370 | ||||||||||||||
| Sikorsky |
S-76 (1) A++, C+, C++ | 42 | Twin Turbine | 12 | 150 | 400 | ||||||||||||||
| Agusta Westland |
AW-139 (1) | 10 | Twin Turbine | 15 | 160 | 570 | ||||||||||||||
| Heavy Aircraft |
||||||||||||||||||||
| Sikorsky |
S-92A(1) | 35 | Twin Turbine | 19 | 160 | 495 | ||||||||||||||
|
|
|
|||||||||||||||||||
| Total Helicopters | 257 | |||||||||||||||||||
|
|
|
|||||||||||||||||||
| Fixed Wing(3) |
||||||||||||||||||||
| Lear Jet |
31A(1) / 40 | 3 | Turbojet | 8 | 527 | 1,435 | ||||||||||||||
| Beech |
King Air(1) | 5 | Turboprop | 8 | 300 | 1,380 | ||||||||||||||
|
|
|
|||||||||||||||||||
| Total Fixed Wing | 8 | |||||||||||||||||||
|
|
|
|||||||||||||||||||
| Total Aircraft | 265 | |||||||||||||||||||
|
|
|
|||||||||||||||||||
| (1) | Equipped to fly under IFR. All other types listed can only fly under visual flight rules. See Item 1A. “Risk Factors – Risks Inherent in our Industry – Our operations are affected by adverse weather conditions and seasonal factors.” |
| (2) | Based on maintaining a 30-minute fuel reserve. |
| (3) | Includes one Lear Jet 31A and one King Air 050 used for corporate purposes. |
Of the 265 aircraft listed, we own 230 and lease 25. The leased aircraft consist of 21 heavy aircraft currently used in the Oil and Gas segment and four medium aircraft currently used in the Air Medical segment. Additionally, we operate ten aircraft owned by customers also included in the table above (five light aircraft and five medium aircraft).
From time to time, we may sell aircraft when they become obsolete or do not fit into our future fleet plans.
25
Table of Contents
Facilities
Our principal facilities are located on property leased from the Lafayette Airport Commission at Lafayette Regional Airport in Lafayette, Louisiana. The lease covers approximately 28 acres and two buildings, with an aggregate of approximately 256,000 square feet, housing our main operational, executive, and administrative offices and the main repair and maintenance facility. The lease for this facility commenced in 2001, expires in 2021 and grants us three five-year renewal options following the expiration date.
We own our Boothville, Louisiana operating facility. The property has a 23,000 square foot building, a 7,000 square foot hangar, and landing pads for 35 helicopters.
We also lease property for an executive and marketing office in Houston, Texas and 11 additional bases to service the oil and gas industry throughout the Gulf of Mexico. Those bases that represent a significant investment in leasehold improvements and are particularly important to our operations are:
| Facility |
Lease Expiration |
Area |
Facilities |
Comments | ||||
| Morgan City (Louisiana) |
June 30, 2018 | 53 acres | Operational and maintenance facilities, landing pads for 27 helicopters | None | ||||
| Intracoastal City (Louisiana) |
December 31, 2016 | 18 acres | Operational and maintenance facilities, landing pads for 11 helicopters | None | ||||
| Houma-Terrebonne Airport (Louisiana) |
July 31, 2017 | 97 acres (Two Locations) | Two operational and maintenance facilities, landing pads for 57 helicopters total | Facilities under five separate leases, of which two contain options to extend through 2027 | ||||
| Galveston (Texas) |
May 31, 2021 | 11 acres | Operational and maintenance facilities, landing pads for 22 helicopters | Lease period to May 31, 2021 with certain cancellation provisions | ||||
| Fourchon (Louisiana) |
February 28, 2018 | 14 acres | Operational and maintenance facilities, landing pads for 18 helicopters | Facility under three separate leases, of which two contain options to extend through 2026 and 2028. | ||||
Our other domestic offshore operations-related facilities are located at Alexandria, Cameron, Grand Isle, and Lake Charles, Louisiana; Rockport, Texas; and Theodore, Alabama.
We also operate from offshore platforms, use of which are provided without charge by the owners of the platforms, although in certain instances we are required to indemnify the owners against loss in connection with our use of their facilities.
We also lease office and hangar space for our Air Medical operations in Phoenix, Arizona. The two buildings are held under separate leases and collectively provide 7,000 square feet of hangar space and 34,000 square feet of office space. The office space lease has a seven year term expiring April 1, 2019, with a cancellation clause after five years, exercisable by PHI. As of December 31, 2015, we had 48 Air Medical bases located in California, Indiana, Kentucky, Maryland, New Jersey, New Mexico, Tennessee, Texas and Virginia, all of which are leased. Other bases for our international Air Medical operations and our approximately 22 other Air Medical sites are generally furnished by customers.
26
Table of Contents
| ITEM 3. | LEGAL PROCEEDINGS |
From time to time, we are involved in various legal actions incidental to our business, including actions relating to employee claims, actions relating to medical malpractice claims, various tax issues, grievance hearings before labor regulatory agencies, and miscellaneous third party tort actions. The outcome of these proceedings is not predictable. However, based on current circumstances, we do not believe that the ultimate resolution of these proceedings, after considering available defenses and any insurance coverage or indemnification rights, will have a material adverse effect on our financial position, results of operations or cash flows.
For information on our obligations to remediate two of our former plant sites, see Note 12, Commitments and Contingencies, of the Notes to Consolidated Financial Statements included in this Form 10-K.
| ITEM 4. | MINE SAFETY DISCLOSURES |
Not applicable.
27
Table of Contents
| ITEM 5. | MARKET FOR REGISTRANT’S COMMON EQUITY, RELATED SHAREHOLDER MATTERS AND ISSUER PURCHASES OF EQUITY SECURITIES |
Market Information; Holders; Dividends
Our voting and non-voting common stock trades on The NASDAQ Global Market, under the symbols PHII and PHIIK, respectively. The following table sets forth the range of high and low sales prices per share, as reported by NASDAQ, for our voting and non-voting common stock for the fiscal quarters indicated.
| Voting | Non-Voting | |||||||||||||||
| Period |
High | Low | High | Low | ||||||||||||
| January 1, 2015 to March 31, 2015 |
$ | 40.00 | $ | 29.14 | $ | 38.54 | $ | 29.85 | ||||||||
| April 1, 2015 to June 30, 2015 |
35.74 | 29.10 | 38.23 | 29.57 | ||||||||||||
| July 1, 2015 to September 30, 2015 |
32.42 | 19.57 | 31.50 | 18.54 | ||||||||||||
| October 1, 2015 to December 31, 2015 |
24.06 | 15.58 | 23.64 | 16.41 | ||||||||||||
| January 1, 2014 to March 31, 2014 |
$ | 42.25 | $ | 33.50 | $ | 45.28 | $ | 34.31 | ||||||||
| April 1, 2014 to June 30, 2014 |
42.70 | 37.25 | 46.47 | 40.23 | ||||||||||||
| July 1, 2014 to September 30, 2014 |
52.98 | 36.61 | 46.87 | 38.82 | ||||||||||||
| October 1, 2014 to December 31, 2014 |
43.05 | 36.00 | 45.61 | 36.66 | ||||||||||||
Each share of voting common stock entitles the holder to one vote with respect to such share on each matter properly submitted to the Company’s shareholders. Unless otherwise required by law, holders of the non-voting common stock are not entitled to any voting rights. Except with respect to voting rights, each share of voting common stock and non-voting common stock are identical. As of December 31, 2015, Al A. Gonsoulin, our Chairman of the Board and Chief Executive Officer, beneficially owned voting common stock representing approximately 70.2% of our total voting power.
FAA regulations require that at least 75% of our voting securities be owned or controlled by citizens of the United States. Accordingly, our articles of incorporation provide for the automatic reduction in voting power of each share of voting common stock owned or controlled by a non-United States citizen if necessary to comply with these regulations.
The foregoing description of these provisions of our organizational documents is qualified in its entirety by reference to our articles of incorporation and bylaws, as amended, which are filed as exhibits to this report.
We have not paid dividends on either class of our common stock since 1999 and do not expect to pay dividends in the foreseeable future.
The indenture governing our 5.25% Senior Notes due 2019 restricts the payment of dividends. For more information, see Note 7, Long-Term Debt, of the Notes to Consolidated Financial Statements included in this Form 10-K and “Risk Factors – Risks Related to our Liquidity and Capital Resources” appearing in Item 1A of this report.
As of February 22, 2016, there were approximately 767 holders of record of our voting common stock and 59 holders of record of our non-voting common stock.
We maintain a voluntary employee stock repurchase plan under which employees holding PHI shares issued under our equity incentive programs can voluntarily offer to sell their shares to PHI and PHI may accept or reject these offers. For the three-month period ended December 31, 2015, we did not repurchase any of our shares under this plan.
28
Table of Contents
Stock Performance Graph
The following performance graph compares PHI’s cumulative total stockholder return on its voting common stock for the last five years with the cumulative total return on the Russell 2000 Index, the Oil Service Sector Index (“OSX”), and the peer group specified below, assuming the investment of $100 on January 1, 2011, at closing prices on December 31, 2010, and reinvestment of dividends. The Russell 2000 Index consists of a broad range of publicly-traded companies with small market capitalizations of $0.5 billion to $1.07 billion and is published daily in the Wall Street Journal. The OSX is a price-weighted index composed of the common stocks of 15 companies that provide oil drilling and production services, oil field equipment, support services, and geophysical/reservoir services. The peer group companies are Bristow Group, Inc.; Tidewater, Inc.; Gulfmark Offshore, Inc.; Seacor Holdings, Inc.; and Air Methods Corp.
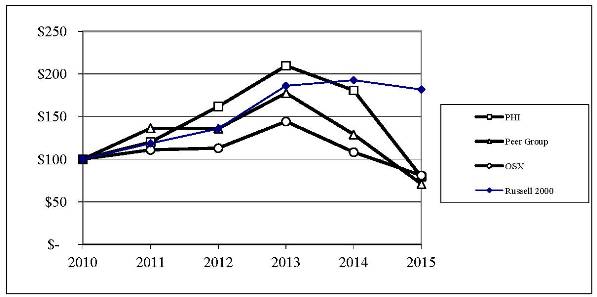
Cumulative Total Returns as of December 31,
| Index |
2010 | 2011 | 2012 | 2013 | 2014 | 2015 | ||||||||||||||||||
| PHI |
100.00 | 120.05 | 161.79 | 209.66 | 180.68 | 79.28 | ||||||||||||||||||
| Peer Group |
100.00 | 136.25 | 135.96 | 177.48 | 128.96 | 70.81 | ||||||||||||||||||
| OSX |
100.00 | 110.95 | 112.95 | 144.17 | 108.18 | 80.92 | ||||||||||||||||||
| Russell 2000 |
100.00 | 118.47 | 135.81 | 186.07 | 192.63 | 181.63 | ||||||||||||||||||
None of the information included under the caption above entitled “Stock Performance Graph” (i) is deemed to be “soliciting material” or to be “filed” with the SEC or subject to Regulation 14A or 14C under the Exchange Act or to the liabilities of Section 18 of the Exchange Act or (ii) will be deemed to be incorporated by reference into any of our filings under the Securities Act of 1933, as amended, or the Exchange Act, except to the extent we specially incorporate it by reference into such a filing.
29
Table of Contents
| ITEM 6. | SELECTED FINANCIAL DATA |
The selected financial data presented below for each of the past five years should be read in conjunction with Management’s Discussion and Analysis of Financial Condition and Results of Operations and the Consolidated Financial Statements and Notes to Consolidated Financial Statements included elsewhere in this Annual Report.
| Year Ended | ||||||||||||||||||||
| December 31, | ||||||||||||||||||||
| 2015 | 2014 | 2013 | 2012 | 2011 | ||||||||||||||||
| (Thousands, except per share amounts) | ||||||||||||||||||||
| Income Statement Data |
||||||||||||||||||||
| Operating revenues |
$ | 804,228 | $ | 836,270 | $ | 856,500 | $ | 646,686 | $ | 539,626 | ||||||||||
| (Loss) gain on disposition of assets, net |
(339 | ) | (848 | ) | 16,604 | (317 | ) | (302 | ) | |||||||||||
| Net earnings (1) (2) |
26,924 | 32,688 | 58,956 | 18,057 | 4,852 | |||||||||||||||
| Net earnings per share |
||||||||||||||||||||
| Basic |
1.73 | 2.11 | 3.81 | 1.17 | 0.32 | |||||||||||||||
| Diluted |
1.72 | 2.08 | 3.77 | 1.17 | 0.31 | |||||||||||||||
| Weighted average shares outstanding |
||||||||||||||||||||
| Basic |
15,566 | 15,483 | 15,474 | 15,418 | 15,312 | |||||||||||||||
| Diluted |
15,642 | 15,685 | 15,639 | 15,488 | 15,497 | |||||||||||||||
| Cash Flow Data |
||||||||||||||||||||
| Net cash provided by operating activities |
$ | 133,918 | $ | 119,519 | $ | 105,096 | $ | 50,550 | $ | 30,352 | ||||||||||
| Net cash used in investing activities |
(149,833 | ) | (245,050 | ) | (98,219 | ) | (91,639 | ) | (43,862 | ) | ||||||||||
| Net cash provided by (used in) financing activities |
12,052 | 130,867 | (8,792 | ) | 38,847 | 14,973 | ||||||||||||||
| Balance Sheet Data (3) |
||||||||||||||||||||
| Current assets |
$ | 521,290 | $ | 466,524 | $ | 354,658 | $ | 363,146 | $ | 277,305 | ||||||||||
| Working capital |
445,158 | 386,012 | 263,253 | 219,676 | 230,557 | |||||||||||||||
| Property and equipment, net |
883,529 | 877,818 | 785,472 | 749,501 | 659,756 | |||||||||||||||
| Total assets |
1,430,332 | 1,376,080 | 1,173,323 | 1,147,894 | 964,132 | |||||||||||||||
| Total debt |
557,500 | 543,000 | 379,000 | 386,755 | 346,047 | |||||||||||||||
| Shareholders’ equity |
626,998 | 597,068 | 559,965 | 499,615 | 477,337 | |||||||||||||||
| (1) | Net earnings in 2015 includes an after-tax charge of $8.6 million related to voluntary early retirement programs. |
| (2) | Net earnings in 2014 includes an after-tax charge of $18.1 million related to the refinancing of our 8.625% Senior Notes. |
| (3) | As of December 31. |
| ITEM 7. | MANAGEMENT’S DISCUSSION AND ANALYSIS OF FINANCIAL CONDITION AND RESULTS OF OPERATIONS |
Management’s Discussion and Analysis of Financial Condition and Results of Operations should be read in conjunction with our Consolidated Financial Statements and the related Notes included elsewhere in this report (which are hereinafter referred to as “Notes”).
As explained further in Item 1 of this report, we are primarily a provider of helicopter services and derive most of our revenue from providing helicopter transport services to the energy and medical industries. Our results of operations are principally driven by the following factors:
| • | The level of offshore oil and gas exploration and production activities in the areas in which we operate, primarily in the Gulf of Mexico. Operating revenues from our Oil and Gas segment relate substantially to operations in the Gulf of Mexico. Many of the helicopters we have recently acquired are larger aircraft intended to service deepwater activities and the margins we earn on these aircraft are generally higher than on smaller aircraft. During periods when the level of offshore activity increases, demand for our offshore flight services typically increases, directly affecting our revenue and profitability. Also, during periods when deepwater offshore activity increases, the demand for our medium and heavy aircraft usually increases, creating a positive impact on revenue and earnings. Conversely, a reduction in offshore oil and gas activities generally, or deepwater offshore activity particularly, negatively impacts our aircraft utilization, flight volumes, and overall demand for our aircraft, thereby creating a negative impact on revenue and earnings. |
30
Table of Contents
| • | Flight volume and patient transports in our Air Medical segment. Our traditional provider programs in our Air Medical segment are typically billed at a fixed monthly contractual rate plus a variable rate for the flight hours. The volume of flight utilization of our aircraft by our customers under these programs has a direct impact on the amount of revenue earned in a period. Traditional provider contracts generated approximately 35%, 39%, and 39% of our Air Medical segment revenues for the years ended December 31, 2015, 2014, and 2013, respectively. In our independent provider programs, our revenue is dependent upon the number of patient transports provided in a given period. |
| • | Payor mix and reimbursement rates in our Air Medical segment. Under our independent provider programs, our revenue recognition, net of allowances, during any particular period is dependent upon the rate at which our various types of customers reimburse us for our Air Medical services, which we refer to as our “payor mix.” Reimbursement rates vary among payor types and typically the reimbursement rate of commercial insurers is higher than Medicare, Medicaid, and self-pay reimbursement rates. Moreover, Medicare and Medicaid reimbursement rates have decreased in recent years and our receipt of payments from these programs is subject to various regulatory and appropriations risks discussed elsewhere in this report. Changes during any particular period in our payor mix, reimbursement rates or uncompensated care rates will have a direct impact on our revenues. |
| • | Direct expenses. Our business is capital-intensive and highly competitive. Salaries and aircraft maintenance comprise a large portion of our operating expenses. Our aircraft must be maintained to a high standard of quality and undergo periodic and routine maintenance procedures. Higher utilization of our aircraft will result in more frequent maintenance, resulting in higher maintenance costs. In periods of low flight activity, we continue to maintain our aircraft, consequently reducing our margins. In addition, we are also dependent upon pilots, mechanics, and medical crew to operate our business. As demand for these skills increases worldwide, we must maintain competitive wages, and we may not be able to recover all of these cost increases through rate increases. |
Since mid-2014, prevailing oil prices have been substantially lower than prices for several years before then. Consequently, several of our oil and gas customers have curtailed their exploration or production levels, lowered their capital expenditures, reduced their staffs or requested arrangements with vendors designed to reduce their operating costs, including flight sharing arrangements and alternative platform staffing rotations. As explained further below, these changes have negatively impacted our oil and gas operations since the first quarter of 2015. Over the past several months, an increasing number of our offshore customers have requested reductions in the number of aircraft under contract, pricing concessions or both, which has further reduced our aircraft utilization rates and intensified pricing pressures. We believe that we may receive additional such requests in the future. Although we can neither control nor predict with any reasonable degree of certainty the length or ultimate severity of the current downturn in the energy industry, we currently expect further reductions in the operating revenues and net profit of our Oil and Gas segment in 2016. These reductions could be quite substantial.
31
Table of Contents
Results of Operations
The following tables present segment operating revenues, expenses and earnings before income taxes, along with certain non-financial operational statistics, for the years ended December 31, 2015, 2014, and 2013.
| Year Ended | Favorable | |||||||||||
| December 31, | (Unfavorable) | |||||||||||
| 2015 | 2014 | |||||||||||
| (Thousands of dollars, except flight hours, patient transports, and aircraft) |
||||||||||||
| Segment operating revenues |
||||||||||||
| Oil and Gas |
$ | 459,611 | $ | 516,909 | $ | (57,298 | ) | |||||
| Air Medical |
312,775 | 300,212 | 12,563 | |||||||||
| Technical Services |
31,842 | 19,149 | 12,693 | |||||||||
|
|
|
|
|
|
|
|||||||
| Total operating revenues |
804,228 | 836,270 | (32,042 | ) | ||||||||
|
|
|
|
|
|
|
|||||||
| Segment direct expenses (1) |
||||||||||||
| Oil and Gas (2) |
411,757 | 411,679 | (78 | ) | ||||||||
| Air Medical |
246,487 | 243,573 | (2,914 | ) | ||||||||
| Technical Services |
29,112 | 14,851 | (14,261 | ) | ||||||||
|
|
|
|
|
|
|
|||||||
| Total direct expenses |
687,356 | 670,103 | (17,253 | ) | ||||||||
| Segment selling, general and administrative expenses |
||||||||||||
| Oil and Gas |
6,511 | 4,615 | (1,896 | ) | ||||||||
| Air Medical |
10,455 | 9,801 | (815 | ) | ||||||||
| Technical Services |
805 | 157 | (648 | ) | ||||||||
|
|
|
|
|
|
|
|||||||
| Total selling, general and administrative expenses |
17,771 | 14,573 | (3,359 | ) | ||||||||
|
|
|
|
|
|
|
|||||||
| Total segment direct and selling, general and administrative expenses |
705,127 | 684,676 | (20,612 | ) | ||||||||
|
|
|
|
|
|
|
|||||||
| Net segment profit |
||||||||||||
| Oil and Gas |
41,343 | 100,615 | (59,272 | ) | ||||||||
| Air Medical |
55,833 | 46,838 | 8,834 | |||||||||
| Technical Services |
1,925 | 4,141 | (2,216 | ) | ||||||||
|
|
|
|
|
|
|
|||||||
| Total |
99,101 | 151,594 | (52,654 | ) | ||||||||
| Other, net (3) |
1,872 | (10,539 | ) | 12,411 | ||||||||
| Unallocated selling, general and administrative expenses (1) |
(28,651 | ) | (28,597 | ) | (1,290 | ) | ||||||
| Interest expense |
(29,066 | ) | (29,510 | ) | 444 | |||||||
| Loss on debt extinguishment |
— | (29,833 | ) | 29,833 | ||||||||
|
|
|
|
|
|
|
|||||||
| Earnings before income taxes |
$ | 43,256 | $ | 53,115 | $ | (11,256 | ) | |||||
|
|
|
|
|
|
|
|||||||
| Flight hours |
||||||||||||
| Oil and Gas |
99,532 | 116,029 | (16,497 | ) | ||||||||
| Air Medical |
35,848 | 34,939 | 909 | |||||||||
| Technical Services |
1,351 | 1,332 | 19 | |||||||||
|
|
|
|
|
|
|
|||||||
| Total |
136,731 | 152,300 | (15,569 | ) | ||||||||
|
|
|
|
|
|
|
|||||||
| Air Medical Transports |
18,768 | 17,876 | 892 | |||||||||
|
|
|
|
|
|
|
|||||||
| Aircraft owned or operated at period end |
||||||||||||
| Oil and Gas |
155 | 166 | ||||||||||
| Air Medical |
104 | 101 | ||||||||||
| Technical Services |
6 | 6 | ||||||||||
|
|
|
|
|
|||||||||
| Total (4) |
265 | 273 | ||||||||||
|
|
|
|
|
|||||||||
32
Table of Contents
| Year Ended | Favorable | |||||||||||
| December 31, | (Unfavorable) | |||||||||||
| 2014 | 2013 | |||||||||||
| (Thousands of dollars, except flight hours, patient transports, and aircraft) |
||||||||||||
| Segment operating revenues |
||||||||||||
| Oil and Gas |
$ | 516,909 | $ | 489,055 | $ | 27,854 | ||||||
| Air Medical |
300,212 | 277,884 | 22,328 | |||||||||
| Technical Services |
19,149 | 89,561 | (70,412 | ) | ||||||||
|
|
|
|
|
|
|
|||||||
| Total operating revenues |
836,270 | 856,500 | (20,230 | ) | ||||||||
|
|
|
|
|
|
|
|||||||
| Segment direct expenses (1) |
||||||||||||
| Oil and Gas (2) |
411,679 | 393,251 | (18,428 | ) | ||||||||
| Air Medical |
243,573 | 231,880 | (11,693 | ) | ||||||||
| Technical Services |
14,851 | 88,221 | 73,370 | |||||||||
|
|
|
|
|
|
|
|||||||
| Total direct expenses |
670,103 | 713,352 | 43,249 | |||||||||
| Segment selling, general and administrative expenses |
||||||||||||
| Oil and Gas |
4,615 | 4,059 | (556 | ) | ||||||||
| Air Medical (5) |
9,801 | 8,875 | (926 | ) | ||||||||
| Technical Services |
157 | 1 | (156 | ) | ||||||||
|
|
|
|
|
|
|
|||||||
| Total selling, general and administrative expenses |
14,573 | 12,935 | (1,638 | ) | ||||||||
|
|
|
|
|
|
|
|||||||
| Total segment direct and selling, general and administrative expenses |
684,676 | 726,287 | 41,611 | |||||||||
|
|
|
|
|
|
|
|||||||
| Net segment profit |
||||||||||||
| Oil and Gas |
100,615 | 91,745 | 8,870 | |||||||||
| Air Medical |
46,838 | 37,129 | 9,709 | |||||||||
| Technical Services |
4,141 | 1,339 | 2,802 | |||||||||
|
|
|
|
|
|
|
|||||||
| Total |
151,594 | 130,213 | 21,381 | |||||||||
| Other, net (3) |
(10,539 | ) | 15,569 | (26,108 | ) | |||||||
| Unallocated selling, general and administrative expenses (1) |
(28,597 | ) | (26,207 | ) | (2,390 | ) | ||||||
| Interest expense |
(29,510 | ) | (29,434 | ) | (76 | ) | ||||||
| Loss on debt extinguishment |
(29,833 | ) | — | (29,833 | ) | |||||||
|
|
|
|
|
|
|
|||||||
| Earnings before income taxes |
$ | 53,115 | $ | 90,141 | $ | (37,026 | ) | |||||
|
|
|
|
|
|
|
|||||||
| Flight hours |
||||||||||||
| Oil and Gas |
116,029 | 114,180 | 1,849 | |||||||||
| Air Medical |
34,939 | 34,386 | 553 | |||||||||
| Technical Services |
1,332 | 1,356 | (24 | ) | ||||||||
|
|
|
|
|
|
|
|||||||
| Total |
152,300 | 149,922 | 2,378 | |||||||||
|
|
|
|
|
|
|
|||||||
| Air Medical Transports |
17,876 | 17,980 | (104 | ) | ||||||||
|
|
|
|
|
|
|
|||||||
| Aircraft owned or operated at period end |
||||||||||||
| Oil and Gas |
166 | 168 | ||||||||||
| Air Medical |
101 | 104 | ||||||||||
| Technical Services |
6 | 6 | ||||||||||
|
|
|
|
|
|||||||||
| Total (4) |
273 | 278 | ||||||||||
|
|
|
|
|
|||||||||
| (1) | Included in direct expense and unallocated selling, general, and administrative costs are the depreciation and amortization expense amounts below: |
| Year Ended December 31, | ||||||||||||
| 2015 | 2014 | 2013 | ||||||||||
| Oil & Gas |
$ | 42,992 | $ | 29,635 | $ | 26,653 | ||||||
| Air Medical |
17,224 | 13,067 | 11,395 | |||||||||
| Technical Services |
518 | 493 | 172 | |||||||||
|
|
|
|
|
|
|
|||||||
| Total |
60,734 | 43,195 | 38,220 | |||||||||
|
|
|
|
|
|
|
|||||||
| Unallocated SG&A |
$ | 12,564 | $ | 7,653 | $ | 4,628 | ||||||
|
|
|
|
|
|
|
|||||||
| (2) | Includes equity in loss of unconsolidated affiliate. |
| (3) | Includes gains on disposition of property and equipment, asset impairments, and other income. |
| (4) | Represents the total number of aircraft available for use, not all of which were deployed in service as of the dates indicated; includes 10 aircraft as of December 31, 2015 and 21 aircraft as of December 31, 2014 and 2013 that were owned or leased by customers but operated by us. |
| (5) | Includes interest expense of $0.3 million for the year ended December 31, 2013. |
33
Table of Contents
Year Ended December 31, 2015 compared with Year Ended December 31, 2014
Combined Operations
Operating Revenues - Operating revenues for the year ended December 31, 2015 were $804.2 million, compared to $836.3 million for the year ended December 31, 2014, a decrease of $32.1 million. Oil and Gas segment operating revenues decreased $57.3 million for the year ended December 31, 2015, related primarily to decreased aircraft flight revenues resulting predominately from less aircraft on contract and decreased flight hours. Operating revenues in our Air Medical segment increased $12.6 million due principally to increased revenues attributable to our independent provider programs, driven principally by increased transports and the full impact of rate increases implemented in the first half of 2014. Technical Services operating revenues increased $12.7 million due to services provided to a third party customer under projects discussed further below.
Total flight hours for the year ended December 31, 2015 were 136,731 compared to 152,300 for the year ended December 31, 2014. Oil and Gas segment’s flight hours decreased 16,497 hours, due principally to decreases in light and medium aircraft flight hours, partially offset by a slight increase in heavy aircraft flight hours. Air Medical segment flight hours increased 909 hours from the year ended December 31, 2014, due to increased flight hours in our independent provider programs. Individual patient transports in the Air Medical segment were 18,768 for the year ended December 31, 2015, compared to 17,876 transports for the year ended December 31, 2014.
Direct Expenses – Direct operating expense was $687.1 million for the year ended December 31, 2015, an increase of $17.1 million, or 3%. Employee compensation expense increased $6.7 million primarily due to a $13.8 million 2015 charge for costs associated with the implementation of a voluntary early retirement program in our Oil and Gas segment, partially offset by compensation decreases due to a reduction in the number of employees in all segments. Employee compensation expense represented approximately 46% of total direct expense for the year ended December 31, 2015 and 2014. In addition, we experienced increases of $4.5 million in aircraft warranty expense (which represents 7% of total direct expense) due to additional aircraft added to the fleet and increased vendor rates, increases of $0.9 million in aircraft rent expense (which represents 7% of total direct expense), and increases of $3.1 million in aircraft depreciation (which represents 5% of total direct expense). We also experienced increases in component repair costs of $6.3 million (which represents 5% of total direct expense), primarily due to scheduled maintenance performed in the current year. Fuel expense (which represents 4% of total direct expense) decreased $16.1 million due to lower per unit fuel costs and the reduction in flight hours. Costs of goods sold increased $11.0 million, primarily related to expanded services provided to an external customer by our Technical Services segment. Base costs, outside services, and other costs increased $0.6 million.
Selling, General, and Administrative Expenses – Selling, general and administrative expenses were $47.8 million for the year ended December 31, 2015, compared to $43.2 million for the year ended December 31, 2014. The $4.6 million increase was primarily attributable to a $2.5 million increase in employee compensation expense related mainly to stock-based compensation and a $1.8 million increase in bad debt expense related to our Ghana accounts receivable. Other selling, general and administrative expenses increased $0.4 million, net.
Loss on Disposal of Assets, net – Loss on asset dispositions was $0.3 million for the year ended December 31, 2015, compared to a loss of $0.8 million for the year ended December 31, 2014. In 2015, we sold or disposed of eight light and six medium aircraft that no longer met our strategic needs. During the year ended December 31, 2014, we sold or disposed of 13 light aircraft and one medium aircraft.
Impairment of Assets – Unlike 2014, when we incurred $10.5 million of asset impairment charges (discussed below), in 2015 we did not incur any asset impairment charges, which favorably impacted our 2015 operating income.
Equity in Loss of Unconsolidated Affiliate – Equity in the loss of our unconsolidated affiliate attributable to our mid-2011 investment in a Ghanaian entity was $0.3 million for December 31, 2015, compared to a loss of $0.1 million for the year ended December 31, 2014, reflecting reduced demand for offshore flight services due to lower oil and gas exploration activities. See Note 15.
Interest Expense – Interest expense was $29.0 million for the year ended December 31, 2015, compared to $29.5 for the year ended December 31, 2014, principally due to lower average outstanding debt balances and lower average interest rates.
34
Table of Contents
Loss on Debt Extinguishment – In 2014, we recorded a pre-tax charge of $29.8 million due to the early retirement of our previously outstanding 8.625% Senior Notes pursuant to a tender offer. This charge consisted of a $26.7 million tender premium and $3.1 million of unamortized issuance costs. For more information, see Note 7.
Other Income, net – Other income was $2.2 million for the year ended December 31, 2015 compared to $0.8 million for the same period in 2014 and represents primarily interest income.
Income Taxes – Income tax expense for the year ended December 31, 2015 was $16.3 million compared to income tax expense of $20.4 million for the year ended December 31, 2014. Our effective tax rate was 37.8% and 39% for the year ended December 31, 2015 and December 31, 2014, respectively. The decrease in income tax expense is primarily attributable to the decrease in earnings. The decrease in our effective tax rate is primarily attributable to the reversal of a valuation allowance on our investment in an unconsolidated subsidiary.
Net Earnings – Net earnings for the year ended December 31, 2015 was $26.9 million compared to net earnings of $32.7 million for the year ended December 31, 2014. Earnings before income taxes for the year ended December 31, 2015 was $43.3 million compared to earnings before income tax of $53.1 million for the same period in 2014. Earnings per diluted share was $1.72 for 2015 compared to earnings per diluted share of $2.08 for 2014. We had 15.6 million and 15.7 million weighted average diluted common shares outstanding during the years ended December 31, 2015 and 2014, respectively. The decrease in earnings is primarily due to the decreased revenues and profitability of our Oil and Gas segment.
Segment Discussion
Oil and Gas – Oil and Gas segment revenues were $459.6 million for the year ended December 31, 2015, compared to $516.9 million for the year ended December 31, 2014, a decrease of $57.3 million. Our Oil and Gas segment revenues are primarily driven by contracted aircraft and flight hours. Costs are primarily fixed based on the number of aircraft operated, with a variable portion that is driven by flight hours.
Oil and Gas segment flight hours were 99,532 for 2015 compared to 116,029 for 2014, a decrease of 16,497 flight hours. The decline in flight hours is attributable to lower flight hours for our light and medium aircraft, partially offset by slightly increased flight hours for our heavy aircraft. The decrease in revenue is primarily due to decreased revenues for most model types, primarily attributable to less aircraft on contract and decreased flight hours for these aircraft in the Gulf of Mexico. Our 2015 heavy aircraft revenues moderately increased over 2014, which was attributable principally to services performed by us in Alaska under a drilling project that has been suspended indefinitely.
The number of aircraft available for use in the segment was 155 at December 31, 2015, compared to 166 at December 31, 2014. We added one new heavy aircraft to our Oil and Gas segment since December 31, 2014. We have sold or disposed of seven light and six medium aircraft in the Oil and Gas segment since December 31, 2014. Changes in customer-owned aircraft and transfers between segments account for the remainder. As noted above, our offshore aircraft utilization rates in 2015 were adversely affected by challenging market conditions.
Direct expense in our Oil and Gas segment was $411.8 million for the year ended December 31, 2015, compared to $411.7 million for the year ended December 31, 2014, an increase of $0.1 million. Employee compensation expenses increased $3.4 million due to a $13.8 million charge for costs associated with the implementation of a voluntary early retirement program applicable to our Oil and Gas segment. The increase was partially offset by compensation decreases due to a reduction in the number of employees in the segment. There were increases in aircraft rent expense of $1.0 million, aircraft depreciation of $3.1 million, aircraft warranty costs of $3.0 million, and component repair costs of $0.8 million, in each case due to the additional heavy aircraft added to the fleet. Aircraft fuel costs decreased $14.4 million due to a reduction in the volume of fuel consumed and lower fuel rates. Base costs and outside services and other items increased $3.2 million, net.
Selling, general and administrative segment expenses were $6.5 million for the year ended December 31, 2015 and $4.6 million for the year ended December 31, 2014. The increase was primarily due to a $1.9 million bad debt change related to our Ghana accounts receivable.
Oil and Gas segment profit was $41.3 million for the year ended December 31, 2015, compared to segment profit of $100.6 million for the prior year period. The decrease in segment profit was due to the decreased revenues and increased expenses detailed above.
35
Table of Contents
Air Medical – Air Medical segment revenues were $312.8 million for the year ended December 31, 2015, compared to $300.2 million for the year ended December 31, 2014, an increase of $12.6 million. Operating revenues in our independent provider programs increased $19.9 million primarily due to increased transports and a full year impact of rate increases implemented in 2014. Patient transports were 18,768 for the year ended December 31, 2015, compared to 17,876 for the prior year. Operating revenues in our traditional provider programs decreased $7.2 million due to the reduction in the scope of our overseas services. Other segment revenue decreased $0.1 million.
The number of aircraft in the segment at December 31, 2015 was 104 compared to 101 at December 31, 2014. During 2015, we added six light aircraft to our Air Medical segment. Changes in customer-owned aircraft and transfers between segments account for the remainder.
Direct expense in our Air Medical segment was $246.5 million for the year ended December 31, 2015, compared to $243.6 million for the year ended December 31, 2014, an increase of $2.9 million. Employee compensation expenses increased $3.6 million due to newly-opened bases and the full year impact of raises awarded in the third quarter of 2014. While this segment did experience a small headcount reduction year over year, the decline in headcount occurred in late 2015. There were also increases in component repair costs of $5.5 million, primarily due to scheduled maintenance for certain model types. We also experienced increases in warranty costs of $1.4 million. In 2014, we terminated the manufacturer’s warranty program for certain aircraft, which resulted in a $0.9 million credit to aircraft warranty expense in the first quarter of 2014. There was a decrease in cost of goods sold of $4.4 million due to a decrease in certain costs attributable to our international operations which we bill on a cost plus basis. We also experienced decreases in (i) aircraft insurance of $1.3 million due to a rate reduction attributable to favorable loss experience, (ii) fuel costs of $1.7 million due to lower flight hours and per unit fuel costs and (iii) property taxes of $0.2 million.
Selling, general and administrative segment expenses were $10.5 million for the year ended December 31, 2015, compared to $9.8 million for the year ended December 31, 2014. The $0.7 million increase was primarily due to an increase of $1.0 million in employee compensation expense, attributable mainly to an increase in equity-based compensation and bonuses. Other items decreased, net $0.3 million on a net basis.
Air Medical segment profit was $55.8 million for the year ended December 31, 2015, compared to a segment profit of $46.8 million for the year ended December 31, 2014. The increase in profit is primarily attributable to the increased revenues described above, partially offset by the increased aircraft operating expenses described above.
As discussed further in Item 1 of this Form 10-K, we have extended the air medical services contract with our customer in the Middle East through late June 2016, and are currently negotiating a five-year replacement contract. Under the extension, the number of aircraft operated and the scope of our services and obligations have been reduced. Consequently, since September 29, 2015, our overseas air medical revenues and operating costs have declined significantly as compared to prior periods.
Technical Services – Technical Services revenues were $31.8 million for the year ended December 31, 2015, compared to $19.1 million for the year ended December 31, 2014. Direct expense increased $14.2 million compared to the prior year. The increase in revenue is due primarily to an increase of technical services provided to a third party customer. The current project for this customer is expected to be completed in the first quarter of 2016, and additional projects are expected to begin and continue through 2016. Technical Services segment profit was $1.9 million for the year ended December 31, 2015, compared to $4.1 million for the year ended December 31, 2014. The decrease of $2.2 million is attributable to a loss on the above-described project attributable to higher than expected labor hours incurred. The added projects with the customer are being priced to accommodate the increased labor required.
For a further description of our Technical Services segment, see the discussion of this segment appearing under Note 13.
36
Table of Contents
Year Ended December 31, 2014 compared with Year Ended December 31, 2013
Combined Operations
Operating Revenues - Operating revenues for the year ended December 31, 2014 decreased $20.2 million compared to the year ended December 31, 2013. Oil and Gas segment revenues increased $27.8 million primarily as a result of higher Gulf of Mexico deepwater drilling activity, which drove higher utilization of our heavy aircraft. Operating revenues in the Air Medical segment increased $22.3 million, primarily due to an expansion of our traditional provider programs, as well as increased revenues from our independent provider programs, driven by an improvement in our payor mix and rate increases implemented in 2014. Technical Services segment revenues decreased $70.4 million primarily due to the 2013 sale of seven aircraft for use by a customer in one of Air Medical’s traditional provider programs in the prior year, which did not recur in 2014.
Flight hours for the year ended December 31, 2014 were 152,300 compared to 149,922 for the year ended December 31, 2013. Oil and Gas segment’s flight hours increased 1,849 hours due to increases in light and heavy aircraft flight hours, partially offset by a decrease in medium aircraft flight hours. Air Medical segment flight hours increased 553 hours due to increased activity in our independent provider programs. Individual patient transports in the Air Medical segment were 17,876 for the year ended December 31, 2014, compared to transports of 17,980 for the year ended December 31, 2013, a decrease of 104 transports.
Direct Expenses – Direct operating expense was $670.1 million for 2014, compared to $713.3 million for 2013, a decrease of $43.2 million, or 6%. Cost of goods sold decreased $77.2 million and is primarily attributable to costs incurred to outfit aircraft that we purchased and resold to a customer in one of Air Medical’s traditional provider programs in 2013. Employee compensation expense increased $21.3 million due to an increase of approximately 53 employees compared to the prior year and compensation increases. Employee compensation expense represented approximately 46% of total direct expense in both 2014 and 2013. In addition, we experienced an increase of $2.7 million in aircraft rent expense, which represents 7% of total direct expenses, and an increase of $4.0 million in aircraft depreciation, which represents 5% of total direct expense, due to additional aircraft added to the fleet. We also experienced increases in aircraft operating costs, including aircraft parts usage of $4.1 million and component repair costs of $2.7 million, each of which represents 5% of total direct expense. Aircraft warranty costs, which represents 6% of total direct expense, decreased $0.7 million, primarily due to a $3.3 million credit recorded in 2014 due to termination of a warranty program. We experienced decreases in fuel expense, which represents 6% of total direct expense, of $1.0 million, primarily due to declining fuel prices, and decreases in aircraft insurance, which represents 2% of total direct expense, of $2.0 million, primarily due to a favorable loss experience and a softening market. Other base costs, such as pilot training, contract services and travel expenses, increased net $2.9 million.
Selling, General and Administrative Expenses – Selling, general and administrative expenses were $43.2 million for 2014, compared to $38.8 million for 2013. The $4.1 million increase was primarily due to increased employee compensation expense of $3.6 million due to additional personnel and compensation rate increases. Legal expenses increased $0.3 million and outside services increased $0.4 million. Other items decreased, net $0.2 million.
Loss (Gain) on Disposal of Assets, net – Losses on asset dispositions were $0.8 million for the year ended December 31, 2014, compared to a gain of $16.6 million for year ended December 31, 2013. This decrease was primarily due to our sale in the second quarter of 2013 of two heavy aircraft that no longer met our strategic needs. See Note 1.
Impairment of Assets – In connection with our normal recurring impairment testing, we recorded an impairment loss in the year ended December 31, 2014 for 13 medium aircraft in our Oil & Gas segment and one medium aircraft in our Air Medical segment. The carrying value of these aircraft was $16.5 million. Following a market analysis, we determined that the market value of these aircraft is $6.0 million. Similarly, we also recorded an impairment loss in the year ended December 31, 2013 for two medium aircraft in our Oil and Gas segment and two medium aircraft in our Air Medical segment. The carrying value of these aircraft was $4.0 million. Following a market analysis, we determined that the market value of these aircraft is $2.4 million. As a result of these analyses, we recorded aggregate non-cash pre-tax impairment losses of $10.5 million and $1.6 million for 2014 and 2013, respectively.
Equity in Loss of Unconsolidated Affiliate – Equity in the loss of our unconsolidated affiliate attributable to our mid-2012 investment in a Ghanaian entity was $0.1 million and $0.3 million for the years ended December 31, 2014 and 2013, respectively. See Note 15.
37
Table of Contents
Interest Expense – Interest expense was $29.5 million for 2014, compared to $29.8 million for 2013 due to an increased average outstanding debt balance, which was almost entirely offset by lower average interest rates applicable to our debt.
Loss on Debt Extinguishment – In 2014, we recorded a pre-tax charge of $29.8 million due to the early redemption of our 8.625% Senior Notes. This charge consists of a $26.7 million tender premium and $3.1 million of unamortized issuance costs. See Note 7.
Other Income, net – Other income was $0.8 million and $0.6 million for the years ended December 31, 2014 and 2013, respectively, and represents primarily interest income.
Income Taxes – Income tax expense was $20.4 million for 2014, compared to $31.2 million for 2013. Our effective tax rate was 38.5% for 2014, compared to 35% for 2013. The 35% rate in 2013 reflected a positive change in the tax rate on deferred items attributable to a decline in the apportionment percentages in the various states in which we operate.
Net Earnings – Net earnings for 2014 were $32.7 million, compared to net earnings of $59.0 million for 2013. Earnings before income taxes for 2014 were $53.1 million compared to $90.1 million in 2013. Earnings per diluted share were $2.08 for 2014 compared to earnings per diluted share of $3.77 for 2013. The decrease in earnings is primarily due to the above-described non-cash pre-tax charge of $29.8 million related to the early retirement of our 8.625% Senior Notes in 2014 and the above-described non-cash pre-tax $10.5 million asset impairment charge in 2014, partially offset by increased profits in each of our segments. Also, 2013 earnings included the above-described gains on asset disposals of $16.6 million, compared to a $0.8 million loss on asset disposals in 2014.
Segment Discussion
Oil and Gas – Oil and Gas segment operating revenues were $516.9 million for 2014, compared to $489.0 million for 2013, an increase of $27.9 million. Our Oil and Gas segment revenues are primarily driven by contracted aircraft and flight hours. Costs are primarily fixed based on the number of aircraft operated, with a variable portion that is driven by flight hours.
Flight hours were 116,029 for 2014, compared to 114,180 for 2013. The increase in flight hours is attributable to higher demand for our light and heavy aircraft, partially offset by a decrease in medium aircraft flight hours. The increase in revenue is primarily due to increased heavy aircraft flight hours, primarily driven by higher Gulf of Mexico deepwater drilling activity, and to incremental rate increases implemented in 2014.
Direct operating expense in our Oil and Gas segment was $411.7 million for 2014, compared to $393.3 million for 2013, an increase of $18.4 million. Employee compensation expenses increased $11.0 million due to increases in personnel and compensation increases. There were increases in aircraft rent expense of $4.2 million and aircraft depreciation of $2.7 million, due to the additional heavy aircraft added to the fleet. We also experienced increases in aircraft operating costs, including higher spare parts costs of $1.1 million, aircraft warranty costs of $0.5 million and component repair costs of $1.4 million, primarily due to additional heavy aircraft added to the fleet. Aircraft warranty costs were reduced in 2014 due to the credit recorded in 2014 for termination of a warranty program. We also experienced decreases in fuel expense of $1.1 million, primarily due to declining fuel prices, and aircraft insurance expense of $1.7 million, primarily due to a favorable loss experience and a softening market. Other direct expense items increased by a net amount of $0.3 million.
Selling, general and administrative segment expenses were $4.6 million for 2014 and $4.0 million for 2013. The increase was primarily related to increased employee compensation expenses due to compensation increases.
Oil and Gas segment profit was $100.6 million for 2014, compared to segment profit of $91.7 million for 2013. The increase in segment profit was due to increased revenues, which were only partially offset by increased direct expenses. These revenue increases resulted from the above-described increases in heavy and light aircraft flight hours and incremental rate increases across all aircraft models implemented in 2014.
Air Medical – Air Medical segment operating revenues were $300.2 million for 2014, compared to $277.9 million 2013, an increase of $22.3 million. Patient transports were 17,876 for 2014, compared to 17,980 for the prior year. Nonetheless, operating revenues in our independent provider programs increased due to improved payor mix, and rate increases implemented in the first half of 2014. Operating revenues in our traditional provider programs increased due to implementing the final expansion phase of our overseas operations under our original three-year contract.
38
Table of Contents
Direct operating expense in our Air Medical segment was $243.6 million for 2014, compared to $231.9 million for 2013, an increase of $11.7 million. Employee compensation expenses increased $10.3 million due to additional personnel in the segment and compensation increases. In addition, there was an increase in spare parts costs, component repair costs, and aircraft depreciation of $3.2 million, $1.2 million, and $1.1 million, respectively, due to additional aircraft added to the fleet. We also experienced decreases in aircraft rent expense of $1.5 million and aircraft warranty costs of $1.3 million. Aircraft warranty costs decreased primarily due to the credit recorded in 2014 for termination of a warranty program. Other direct expense items decreased by a net of $1.3 million.
Selling, general and administrative segment expenses were $9.8 million for 2014, compared to $8.9 million for 2013. The $0.9 million increase was primarily due to an increase in employee compensation expense due to additional personnel and compensation increases.
Air Medical segment profit was $46.8 million for 2014, compared to segment profit of $37.1 million for 2013. The increase in profit is primarily attributable to increased profits from our independent provider programs due to increased revenues resulting from rate increases and an improved payor mix. Profits from our overseas traditional provider programs also increased due to expanded operations, but were partially offset by decreased profits in our U.S.-based traditional provider programs.
Technical Services – Technical Services revenues were $19.1 million for 2014, compared to $89.6 million for 2013, a decrease of $70.5 million. Substantially all of the decrease in our Technical Services segment’s revenue in 2014, as compared to 2013, is attributable to the proceeds associated with selling seven aircraft to a customer on the terms and conditions described further in our previous SEC reports. Direct expenses decreased $73.3 million primarily due to costs associated with outfitting those aircraft prior to sale. Notwithstanding these large non-recurring transactions, profit in this segment increased by $2.8 million, from $1.3 million for 2013 to $4.1 million for 2014 due primarily to an expansion of technical services provided to a third party customer. For a further description of our Technical Services segment, see Note 13.
Liquidity and Capital Resources
General
Our ongoing liquidity requirements arise primarily from the purchase or leasing of aircraft, the maintenance and refurbishment of aircraft, the improvement of facilities, the acquisition of equipment and inventory, and other working capital needs. Our principal sources of liquidity historically have been net cash provided by our operations, borrowings under our revolving credit facility, and the proceeds from periodic senior note offerings. To the extent we do not use cash, short-term investments or borrowings to finance our aircraft acquisitions, we frequently enter into operating leases to fund these acquisitions.
Cash Flow
Liquidity - Our cash position was $2.4 million at December 31, 2015, $6.3 million at December 31, 2014, and $0.9 million at December 31, 2013. Short-term investments were $284.5 million at December 31, 2015, $185.2 million at December 31, 2014, and $85.9 million at December 31, 2013. As of December 31, 2015, 2014 and 2013, we also had $15.3 million, $15.5 million and $14.7 million, respectively, in restricted investments, in each case securing outstanding letters of credit. The primary use of cash during each of the past three years was the funding of capital spending, primarily aircraft purchases.
As noted in greater detail above, the current downturn in the oil and gas industry has negatively impacted our offshore operations since the first quarter of 2015, and we expect further reductions in the operating revenues and net profit of our Oil and Gas segment in 2016. Through December 31, 2015, these negative variances did not materially impact our liquidity or the cash flows reported in our consolidated cash flows statements, as described in further detail below. Nonetheless, if the current oil and gas downturn persists, we expect that it will ultimately have a negative impact on our consolidated operating cash flow and liquidity.
39
Table of Contents
Operating activities - Net cash provided by operating activities was $133.9 million in 2015, $119.5 million in 2014, and $105.1 million in 2013. Net cash provided by operating activities (excluding changes in operating assets and liabilities) contributed $114.0 million of cash flow in 2015, compared to $140.8 million for the same period in 2014, a decrease of $26.8 million, primarily due to the decline in profitability in our Oil and Gas segment. Net changes in operating assets and liabilities in 2015 provided cash of $19.9 million, compared to a net use of cash of $21.3 million in 2014, resulting in an aggregate increase of $41.2 million of cash provided during 2015 compared to 2014. Our cash flow from our Air Medical contract in the Middle East increased $41.9 million in 2015 compared to 2014 due largely to timing of collections. Our net cash provided by operating activities also benefitted in 2015 from $3.2 million of lower warranty payments due to changes in coverage and $4.9 million of lower taxes due to timing of tax payments related to our contract in the Middle East. These increases were partially offset by our use of $9.9 million of cash to fund Voluntary Early Retirement Packages provided to certain employees.
There was an increase of $14.4 million in net cash provided by operations when comparing 2014 to 2013. Net cash provided by operating activities (excluding changes in operating assets and liabilities) increased $31.3 million, primarily due to improved profitability of all three of our segments. There was an increase in the use of cash of $16.9 million when comparing the net changes in operating assets and liabilities for the same periods. This was primarily due to $9.6 million of income taxes paid in 2014 related to our Middle East contract. The remainder was due mainly to a reduction in accounts payable.
Investing activities - Net cash used in investing activities was $149.8 million for 2015, $245.1 million for 2014, and $98.2 million for 2013. Purchases and sales of short-term investments used $102.7 million in cash during 2015, $102.0 million in 2014, and $36.5 million in 2013. Gross proceeds from asset dispositions were $5.2 million for 2015, $10.3 million for 2014, and $42.2 million for 2013. Capital expenditures were $57.1 million for 2015, $157.7 million for 2014, and $102.7 million for 2013. Capital expenditures for aircraft purchases and aircraft improvements accounted for $55.2 million, $150.7 million, and $95.8 million in 2015, 2014, and 2013, respectively. In 2015, we purchased six light aircraft, and we purchased one heavy aircraft pursuant to a purchase option in the aircraft lease contract. The purchases were financed using existing cash on hand and borrowings under our revolving credit facility. In 2014, we purchased four light aircraft, two medium aircraft, and one fixed wing aircraft, and exercised purchase options on two medium aircraft and five heavy aircraft. The purchases were financed using net proceeds from the issuance of our below-described Senior Notes and borrowings under our revolving credit facility. In 2013, we purchased eleven light aircraft and one fixed wing aircraft, and also acquired two medium and two heavy aircraft pursuant to lease purchase options. The purchases for 2013 were financed using existing cash, cash from operations, and our revolving credit facility.
Financing activities – Financing activities for 2015 include net borrowings of $14.5 million of revolving credit facility debt, and $2.4 million paid to purchase shares of our non-voting common stock withheld to satisfy withholding tax obligations of employees in connection with the vesting of their equity incentive awards.
Financing activities for 2014 included the issuance of $500 million of 5.25% Senior Notes on March 17, 2014, as further described below. Net proceeds of $493.8 million from this issuance were used to repurchase all of our $300 million of previously outstanding 8.625% Senior Notes due 2018 pursuant to a contemporaneous tender offer. Our total cost to repurchase those notes was $29.8 million, including the tender premium of $26.7 million and $3.1 million of unamortized issuance costs. We had net payments of $36.0 million on our revolving credit facility during the twelve months ended December 31, 2014.
Financing activities for 2013 included net repayments of $7.8 million of revolving credit facility debt, and $1.0 million relating to the purchase of shares of our non-voting common stock withheld to satisfy withholding tax obligations of employees in connection with the vesting of their equity incentive awards.
Long Term Debt
As of December 31, 2015, our total long-term debt was $557.5 million, consisting of $500 million of our 5.25% Senior Notes due 2019 and $57.5 million borrowed under our revolving credit facility. The carrying value of our variable-rate indebtedness under our revolving credit facility approximates its fair value as of December 31, 2015. The fair value of our 5.25% Senior Notes was $403.1 million at December 31, 2015.
5.25% Senior Notes due 2019 - On March 17, 2014, we privately placed $500 million of 5.25% Senior Notes due March 15, 2019. Proceeds were approximately $493.8 million, net of fees and expenses, and were used to retire all
40
Table of Contents
of our $300 million of previously outstanding 8.625% Senior Notes pursuant to a tender offer, at a total cost of $329.4 million including the tender premium and accrued interest. As a result of our repurchase of 8.625% Senior Notes in March 2014 and April 2014, we recorded during 2014 a pretax charge of $29.8 million, which consisted of $26.7 million of premium and $3.1 million of unamortized issuance costs. Our repurchase of 8.625% Senior Notes in March 2014 and April 2014 resulted in deferred tax benefits of $11.6 million.
We used the remaining proceeds from our 2014 note offering to pay off our revolving credit facility balance in full and for general corporate purposes, including the exercise of purchase options for aircraft previously leased and for the purchase of new aircraft.
In August 2014, we exchanged our privately-placed 5.25% Senior Notes for 5.25% Senior Notes registered under the Securities Act of 1933.
For additional information about the terms of our 5.25% Senior Notes issued on March 17, 2014, see Note 7.
Revolving Credit Facility - We have an amended and restated revolving credit facility (our “credit facility”) that matures on October 1, 2017. Under our credit facility, we can borrow up to $150 million at floating interest rates based on either the London Interbank Offered Rate plus 225 basis points or the prime rate (each as defined in our credit facility), at our option. Our credit facility includes usual and customary covenants and events of default for credit facilities of its type. Our ability to borrow under the credit facility is conditioned upon our continued compliance with such covenants, including, among others, (i) covenants that restrict our ability to engage in certain asset sales, mergers or other fundamental changes, to incur liens or to engage in certain other transactions or activities and (ii) financial covenants that stipulate that PHI will maintain a consolidated working capital ratio of at least 2 to 1, a funded debt to consolidated net worth ratio not greater than 1.5 to 1, a fixed charge coverage ratio of at least 1.1 to 1, and consolidated net worth of at least $450 million (with all such terms or amounts as defined in or determined under the amended and restated revolving credit facility).
At December 31, 2015, we had $57.5 million in borrowings under our credit facility. At the same date in 2014, we had $43.0 million in borrowings under our credit facility. During 2015, $81.5 million was the highest loan balance under our credit facility, with a weighted average balance of $47.8 million. During 2014, $111.9 was the highest loan balance under our credit facility, with a weighted average balance of $64.9 million.
Other - We maintain a separate letter of credit facility described in Note 7 that had $15.3 million of letters of credit outstanding at December 31, 2015.
For additional information on our long term debt, see Note 7.
41
Table of Contents
Contractual Obligations
The table below sets out our contractual obligations as of December 31, 2015 related to our aircraft purchase commitments, aircraft and other operating lease obligations, revolving credit facility, and the 5.25% Senior Notes due 2019. Our obligations under the operating leases are not recorded as liabilities on our balance sheet. Each contractual obligation included in the table contains various terms, conditions, and covenants that, if violated, accelerate the payment of that obligation under certain specified circumstances. We were in compliance with the covenants applicable to these contractual obligations as of December 31, 2015. As of December 31, 2015, we leased 25 aircraft included in the lease obligations below.
| Payment Due by Year | ||||||||||||||||||||||||||||
| Beyond | ||||||||||||||||||||||||||||
| Total | 2016 | 2017 | 2018 | 2019 | 2020 | 2020 | ||||||||||||||||||||||
| (Thousands of dollars) | ||||||||||||||||||||||||||||
| Aircraft purchase commitments (1) |
$ | 27,739 | $ | 27,739 | $ | — | $ | — | $ | — | $ | — | $ | — | ||||||||||||||
| Aircraft lease obligations |
277,200 | 44,988 | 42,699 | 39,018 | 32,365 | 28,526 | 89,604 | |||||||||||||||||||||
| Other lease obligations |
15,191 | 5,305 | 3,193 | 2,552 | 1,983 | 1,413 | 745 | |||||||||||||||||||||
| Long-term debt(2) |
557,500 | — | 57,500 | — | 500,000 | — | — | |||||||||||||||||||||
| Senior notes interest(2) |
91,875 | 26,250 | 26,250 | 26,250 | 13,125 | — | — | |||||||||||||||||||||
|
|
|
|
|
|
|
|
|
|
|
|
|
|
|
|||||||||||||||
| Total |
$ | 969,505 | $ | 104,282 | $ | 129,642 | $ | 67,820 | $ | 547,473 | $ | 29,939 | $ | 90,349 | ||||||||||||||
|
|
|
|
|
|
|
|
|
|
|
|
|
|
|
|||||||||||||||
| (1) | For information about these aircraft purchase commitments, see Note 12. |
| (2) | Actual principal and interest paid in all years may differ due to the possible future refinancing of outstanding debt or the issuance of new debt. |
The table above reflects only contractual obligations as of December 31, 2015 and excludes, among other things, (i) commitments made thereafter, (ii) options to purchase assets, including those described in the next paragraph, (iii) contingent liabilities, (iv) capital expenditures that we plan, but are not committed, to make and (v) open purchase orders.
On January 2, 2015, we purchased one heavy aircraft pursuant to a purchase option in the lease contract for an aggregate purchase price of $17.7 million. As of December 31, 2015, we had options to purchase aircraft under lease becoming exercisable in 2016 through 2020. The aggregate option purchase prices are $67.8 million in 2016, $55.7 million in 2017, $127.0 million in 2018, $150.4 million in 2019, and $22.7 million in 2020. Whether we exercise these options will depend upon several factors, including market conditions and our available cash at the respective exercise dates.
We intend to fund the above contractual obligations through a combination of cash on hand, cash flow from operations, borrowings under our credit facility, and sale-leaseback transactions.
Capital Expenditures
Our capital expenditures relate primarily to the purchase of aircraft and capital improvements that enhance the value or safety of our aircraft and related infrastructure. In addition to our periodic aircraft purchases, we regularly incur capital expenditures on an ongoing basis in order to (i) extend the useful life of our aircraft, (ii) improve and modernize our fleet, (iii) comply with various requirements or standards imposed by insurers or governmental authorities, (iv) upgrade our hangars, landing pads and other operating facilities and (v) acquire or upgrade computer hardware and software. The amount of our capital expenditures is influenced by, among other things, demand for our services, schedules for refurbishing our various aircraft, cash flow generated by our operations, and cash required for other purposes. We estimate our total capital expenditures for 2016 will be approximately $33.1 million, excluding $27.7 million reflected as 2015 aircraft purchase commitments in the chart included in the prior section. For additional information on our recent aircraft purchases, see “– Cash Flow” above.
42
Table of Contents
Tax Obligations
We are currently using federal net operating loss carryforwards to offset our federal taxable income, and we expect that these carryforwards will continue to substantially reduce our cash tax payments for several more years to come. If we forfeit these carryforwards for any reason or deplete them faster than anticipated, our cash tax obligations will increase substantially. For additional information, see Item 1A “– Risk Factors – Risks Specific to Our Company – Our ability to use net operating loss carryforwards to reduce future tax payments may be limited if we experience an ownership change.”
Off Balance Sheet Arrangements
In the normal course of business with customers, vendors, and others, we have entered into various off-balance sheet arrangements. We provide guarantees, performance bonds, and payment bonds pursuant to certain agreements. The aggregate amount of these guarantees and bonds at December 31, 2015 was $1.1 million in surety bonds and $15.3 million in letters of credit. The surety bonds will expire between March 2016 and September 2016. A $9.2 million letter of credit securing an Air Medical traditional provider contract is due to expire during October 2016, but may be extended at the request of the beneficiary for subsequent periods up to one year. The $6.3 million in letters of credit securing our workers compensation policies are evergreen.
Critical Accounting Policies and Estimates
This section of this Form 10-K entitled “Management’s discussion and analysis of our financial condition and results of operations” is based upon our consolidated financial statements, which have been prepared in accordance with accounting principles generally accepted in the United States of America. The preparation of these consolidated financial statements requires us to make estimates and judgments that affect the reported amounts of assets, liabilities, revenues and expenses, and related disclosures of contingent assets and liabilities. On an on-going basis, we evaluate our estimates, including those related to revenue recognition, inventories of spare parts, long-lived assets, income taxes, and self-insurance liabilities. We base our estimates on historical experience and on various other assumptions that we believe to be reasonable under the circumstances, the results of which form the basis for making judgments about the carrying values of assets and liabilities that are not readily apparent from other sources. Our actual results may differ from these estimates and the differences may be material. We believe that the following critical accounting policies affect our more significant judgments and estimates, which we use in preparation of our consolidated financial statements.
Revenue Recognition - Revenues related to our Air Medical services are recorded net of contractual allowances under agreements with third party payors and estimated uncompensated care. We estimate contractual allowances and uncompensated care based on historical collection experience by payor category. The main payor categories are Medicaid, Medicare, private insurance, and self-pay. Changes in payor mix, reimbursement rates, and uncompensated care rates are the factors most subject to sensitivity and variability in calculating our allowances. We compute a historical payment analysis of accounts paid in full by category. The allowance percentages are applied to the payor categories and the revenue allowance is adjusted as necessary. The estimated costs of providing charity services are based on a calculation that applies a ratio of costs to the charges for uncompensated charity care. The ratio of costs to charges is based on the Air Medical segment’s total expenses divided by gross patient service revenue. For certain historical information on our allowances for contractual discounts and uncompensated care, see Note 1, Summary of Significant Accounting Policies, of the Notes to Consolidated Financial Statements included in this Form 10-K.
The allowance estimates for our Air Medical segment’s billing, receivables, and revenue are based on the prior twelve months’ payment history by each individual payor group, which we evaluate on a state by state basis. A percentage of amounts collected compared to the total invoice is determined from this process and applied to the current month’s billings and receivables. If a receivable related to the self-pay category is outstanding a year or longer, we record a reserve equal to 100% of the receivable. Receivables related to other payor categories are scrutinized when they are outstanding nine months or longer and additional allowances are recorded, if warranted.
Inventories of Spare Parts - We maintain a significant parts inventory to service our own aircraft along with the aircraft and components of customers. Portions of that inventory are used parts that are often exchanged with parts removed from aircraft or components, and are reworked to a useable condition. We use systematic procedures to
43
Table of Contents
estimate the valuation of the used parts, which includes consideration of their condition and continuing utility. If our valuation of these parts should be significantly different from amounts ultimately realizable or if we discontinue using or servicing certain aircraft models, we may have to record a write-down of our inventory. We also record provisions against inventory for obsolete and slow-moving parts, relying principally on specific identification of such inventory. If we fail to identify such parts, additional provisions may be necessary.
Property and Equipment - Our principal long-lived assets are aircraft. We review our long-lived assets for impairment annually, or more frequently whenever events or changes in circumstances indicate that the carrying amount of an asset may not be recoverable. We typically evaluate aircraft in our Oil & Gas segment by model type. We review aircraft in our Air Medical segment as one broad asset category since we periodically move aircraft among base locations. We measure recoverability of assets to be held and used by comparing the carrying amount of an asset to the future undiscounted net cash flows that we expect the asset to generate. When we determine that an asset is impaired, we recognize the impairment amount, which is the amount by which the carrying value of the asset exceeds its estimated fair value. Similarly, we record assets that we expect to sell at the lower of the carrying amount or fair value less costs to sell.
Use of Estimates - We must make estimates for our liabilities, expenses, losses, and gains that pertain to self-insured programs, insurance deductibles, and good-experience premium returns. Our group medical insurance program is largely self-insured, and we use estimates to record our periodic expenses related to that program.
Income Taxes - We estimate what our effective tax rate will be for the full year and record a quarterly income tax expense in accordance with the anticipated effective annual tax rate. As the year progresses, we continually refine our estimate based upon actual events and pretax income by jurisdiction during the year. This process may result in a change to our expected effective tax rate for the year. When this occurs, we adjust the income tax expense during the quarter in which the change in estimate occurs so that the year-to-date expense equals the annual rate.
New Accounting Pronouncements
For detailed information, see Note 1 on page 57.
44
Table of Contents
| ITEM 7A. | QUANTITATIVE AND QUALITATIVE DISCLOSURES ABOUT MARKET RISK |
Our earnings are subject to changes in the short-term variable interest rate on our outstanding revolving credit debt. Based on the $57.5 million in borrowings outstanding as of December 31, 2015, a ten percent increase (0.2494%) in the interest rate to 2.743% would have reduced our annual pre-tax earnings by $0.1 million, but would have no impact on the fair market value of this debt.
Our $500 million of outstanding Senior Notes due 2019 bear interest at a fixed rate of 5.25%. Changes in market interest rates do not affect our interest payment obligations on the notes. The fair market value of our 5.25% Senior Notes will vary as changes occur to general market interest rates, the remaining maturity of the 5.25% Senior Notes, and our creditworthiness. A ten percent increase (1.28%) to the current bond yield of 12.84% to 14.12% at December 31, 2015 would have decreased the fair market value of these notes by 3.53%. Consequently, the current fair market value at December 31, 2015 of $403.1 million would be decreased by $14.2 million to $388.9 million.
45
Table of Contents
| ITEM 8. | FINANCIAL STATEMENTS AND SUPPLEMENTARY DATA |
REPORT OF INDEPENDENT REGISTERED PUBLIC ACCOUNTING FIRM
To the Board of Directors and Shareholders of
PHI, Inc.
Lafayette, Louisiana
We have audited the accompanying consolidated balance sheets of PHI, Inc. and subsidiaries (the “Company”) as of December 31, 2015 and 2014, and the related consolidated statements of operations, comprehensive income, shareholders’ equity, and cash flows for each of the three years in the period ended December 31, 2015. Our audits also included the financial statement schedule listed in the Index at Item 15. These financial statements and financial statement schedule are the responsibility of the Company’s management. Our responsibility is to express an opinion on the financial statements and financial statement schedule based on our audits.
We conducted our audits in accordance with the standards of the Public Company Accounting Oversight Board (United States). Those standards require that we plan and perform the audit to obtain reasonable assurance about whether the financial statements are free of material misstatement. An audit includes examining, on a test basis, evidence supporting the amounts and disclosures in the financial statements. An audit also includes assessing the accounting principles used and significant estimates made by management, as well as evaluating the overall financial statement presentation. We believe that our audits provide a reasonable basis for our opinion.
In our opinion, such consolidated financial statements present fairly, in all material respects, the financial position of PHI, Inc. and subsidiaries as of December 31, 2015 and 2014, and the results of their operations and their cash flows for each of the three years in the period ended December 31, 2015, in conformity with accounting principles generally accepted in the United States of America. Also, in our opinion, such financial statement schedule, when considered in relation to the basic consolidated financial statements taken as a whole, presents fairly, in all material respects, the information set forth therein.
We have also audited, in accordance with the standards of the Public Company Accounting Oversight Board (United States), the Company’s internal control over financial reporting as of December 31, 2015, based on the criteria established in Internal Control—Integrated Framework (2013) issued by the Committee of Sponsoring Organizations of the Treadway Commission and our report dated February 29, 2016 expressed an unqualified opinion on the Company’s internal control over financial reporting.
/s/ DELOITTE & TOUCHE LLP
New Orleans, Louisiana
February 29, 2016
46
Table of Contents
CONSOLIDATED BALANCE SHEETS
(Thousands of dollars, except share data)
| December 31, | December 31, | |||||||
| 2015 | 2014 | |||||||
| ASSETS | ||||||||
| Current Assets: |
||||||||
| Cash |
$ | 2,407 | $ | 6,270 | ||||
| Short-term investments |
284,523 | 185,244 | ||||||
| Accounts receivable – net |
||||||||
| Trade |
138,309 | 178,833 | ||||||
| Other |
6,469 | 1,928 | ||||||
| Inventories of spare parts - net |
69,491 | 73,793 | ||||||
| Prepaid expenses |
8,951 | 9,314 | ||||||
| Deferred income taxes |
10,379 | 9,915 | ||||||
| Income taxes receivable |
761 | 1,227 | ||||||
|
|
|
|
|
|||||
| Total current assets |
521,290 | 466,524 | ||||||
| Property and equipment - net |
883,529 | 877,818 | ||||||
| Restricted investments |
15,336 | 15,485 | ||||||
| Other |
10,177 | 16,253 | ||||||
|
|
|
|
|
|||||
| Total assets |
$ | 1,430,332 | $ | 1,376,080 | ||||
|
|
|
|
|
|||||
| LIABILITIES AND SHAREHOLDERS’ EQUITY | ||||||||
| Current Liabilities: |
||||||||
| Accounts payable |
$ | 31,373 | $ | 27,700 | ||||
| Accrued and other current liabilities |
44,759 | 52,812 | ||||||
|
|
|
|
|
|||||
| Total current liabilities |
76,132 | 80,512 | ||||||
| Long-term debt |
557,500 | 543,000 | ||||||
| Deferred income taxes |
153,645 | 140,532 | ||||||
| Other long-term liabilities |
16,057 | 14,968 | ||||||
| Commitments and contingencies (Note 12) |
||||||||
| Shareholders’ Equity: |
||||||||
| Voting common stock – par value of $0.10; 12,500,000 shares authorized, 2,905,757 shares issued and outstanding at December 31, 2015 and 2014 |
291 | 291 | ||||||
| Non-voting common stock – par value of $0.10; 25,000,000 shares authorized, 12,576,916 and 12,458,992 shares issued and outstanding at December 31, 2015 and 2014, respectively |
1,269 | 1,258 | ||||||
| Additional paid-in capital |
304,884 | 301,533 | ||||||
| Accumulated other comprehensive loss |
(567 | ) | (211 | ) | ||||
| Retained earnings |
321,121 | 294,197 | ||||||
|
|
|
|
|
|||||
| Total shareholders’ equity |
626,998 | 597,068 | ||||||
|
|
|
|
|
|||||
| Total liabilities and shareholders’ equity |
$ | 1,430,332 | $ | 1,376,080 | ||||
|
|
|
|
|
|||||
The accompanying notes are an integral part of these consolidated financial statements.
47
Table of Contents
CONSOLIDATED STATEMENTS OF OPERATIONS
(Thousands of dollars and shares, except per share data)
| Year Ended | Year Ended | Year Ended | ||||||||||
| December 31, | December 31, | December 31, | ||||||||||
| 2015 | 2014 | 2013 | ||||||||||
| Operating revenues, net |
$ | 804,228 | $ | 836,270 | $ | 856,500 | ||||||
| Expenses: |
||||||||||||
| Direct expenses |
687,050 | 670,007 | 713,090 | |||||||||
| Selling, general and administrative expenses |
46,422 | 43,171 | 38,820 | |||||||||
|
|
|
|
|
|
|
|||||||
| Total operating expenses |
733,472 | 713,178 | 751,910 | |||||||||
| Loss (gain) on disposition of assets, net |
339 | 848 | (16,604 | ) | ||||||||
| Impairments of assets |
— | 10,508 | 1,648 | |||||||||
| Equity in loss of unconsolidated affiliate |
306 | 96 | 262 | |||||||||
|
|
|
|
|
|
|
|||||||
| Operating income |
70,111 | 111,640 | 119,284 | |||||||||
| Interest expense |
29,066 | 29,510 | 29,756 | |||||||||
| Loss on debt extinguishment |
— | 29,833 | — | |||||||||
| Other income, net |
(2,211 | ) | (818 | ) | (613 | ) | ||||||
|
|
|
|
|
|
|
|||||||
| 26,855 | 58,525 | 29,143 | ||||||||||
|
|
|
|
|
|
|
|||||||
| Earnings before income taxes |
43,256 | 53,115 | 90,141 | |||||||||
| Income tax expense |
16,332 | 20,427 | 31,185 | |||||||||
|
|
|
|
|
|
|
|||||||
| Net earnings |
$ | 26,924 | $ | 32,688 | $ | 58,956 | ||||||
|
|
|
|
|
|
|
|||||||
| Earnings per share: |
||||||||||||
| Basic |
$ | 1.73 | $ | 2.11 | $ | 3.81 | ||||||
| Diluted |
$ | 1.72 | $ | 2.08 | $ | 3.77 | ||||||
| Weighted average shares outstanding: |
||||||||||||
| Basic |
15,566 | 15,483 | 15,474 | |||||||||
| Diluted |
15,642 | 15,685 | 15,639 | |||||||||
The accompanying notes are an integral part of these consolidated financial statements.
48
Table of Contents
CONSOLIDATED STATEMENTS OF COMPREHENSIVE INCOME
(Thousands of dollars)
The following table summarizes the components of total comprehensive income:
| Year Ended | Year Ended | Year Ended | ||||||||||
| December 31, | December 31, | December 31, | ||||||||||
| 2015 | 2014 | 2013 | ||||||||||
| Net earnings |
$ | 26,924 | $ | 32,688 | $ | 58,956 | ||||||
| Net unrealized (loss) gain on short-term investments |
(641 | ) | (285 | ) | 44 | |||||||
| Other unrealized gain (loss) |
24 | (24 | ) | — | ||||||||
| Changes in pension plan assets and benefit obligations |
7 | 17 | (2 | ) | ||||||||
| Tax impact of the above-listed adjustments |
254 | 105 | (15 | ) | ||||||||
|
|
|
|
|
|
|
|||||||
| Total comprehensive income |
$ | 26,568 | $ | 32,501 | $ | 58,983 | ||||||
|
|
|
|
|
|
|
|||||||
The accompanying notes are an integral part of these consolidated financial statements.
49
Table of Contents
CONSOLIDATED STATEMENTS OF SHAREHOLDERS’ EQUITY
(Thousands of dollars and shares)
| Accumulated | Total | |||||||||||||||||||||||||||||||
| Voting | Non-Voting | Additional | Other Com- | Share- | ||||||||||||||||||||||||||||
| Common Stock | Common Stock | Paid-in | prehensive | Retained | Holders’ | |||||||||||||||||||||||||||
| Shares | Amount | Shares | Amount | Capital | Income (Loss) | Earnings | Equity | |||||||||||||||||||||||||
| Balance at December 31, 2012 |
2,853 | 285 | 12,565 | 1,246 | 295,582 | (51 | ) | 202,553 | 499,615 | |||||||||||||||||||||||
| Net earnings |
— | — | — | — | — | — | 58,956 | 58,956 | ||||||||||||||||||||||||
| Unrealized gain on short-term investments |
— | — | — | — | — | 28 | — | 28 | ||||||||||||||||||||||||
| Changes in pension plan assets and benefit obligations |
— | — | — | — | — | (1 | ) | — | (1 | ) | ||||||||||||||||||||||
| Amortization of unearned stock-based compensation |
— | — | — | — | 2,403 | — | — | 2,403 | ||||||||||||||||||||||||
| Issuance of non-voting common stock (upon vesting of restricted stock units) |
— | — | 4 | 17 | — | — | — | 17 | ||||||||||||||||||||||||
| Cancellation of restricted non-voting stock units for tax withholdings on vested shares |
— | — | (1 | ) | (6 | ) | (59 | ) | — | — | (65 | ) | ||||||||||||||||||||
| Issuance of voting common stock (upon vesting of restricted stock units) |
84 | 9 | — | — | — | — | — | 9 | ||||||||||||||||||||||||
| Cancellation of restricted voting stock units for tax withholdings on vested shares |
(31 | ) | (3 | ) | — | — | (994 | ) | — | — | (997 | ) | ||||||||||||||||||||
|
|
|
|
|
|
|
|
|
|
|
|
|
|
|
|
|
|||||||||||||||||
| Balance at December 31, 2013 |
2,906 | $ | 291 | 12,568 | $ | 1,257 | $ | 296,932 | $ | (24 | ) | $ | 261,509 | $ | 559,965 | |||||||||||||||||
| Net earnings |
— | — | — | — | — | — | 32,688 | 32,688 | ||||||||||||||||||||||||
| Unrealized loss on short-term investments |
— | — | — | — | — | (173 | ) | — | (173 | ) | ||||||||||||||||||||||
| Changes in pension plan assets and benefit obligations |
— | — | — | — | — | 10 | — | 10 | ||||||||||||||||||||||||
| Amortization of unearned stock-based compensation |
— | — | — | — | 4,753 | — | — | 4,753 | ||||||||||||||||||||||||
| Issuance of non-voting common stock (upon vesting of restricted stock units) |
— | — | 12 | 1 | — | — | — | 1 | ||||||||||||||||||||||||
| Cancellation of restricted non-voting stock units for tax withholdings on vested shares |
— | — | (4 | ) | — | (178 | ) | — | — | (178 | ) | |||||||||||||||||||||
| Other |
— | — | — | — | 26 | (24 | ) | — | 2 | |||||||||||||||||||||||
|
|
|
|
|
|
|
|
|
|
|
|
|
|
|
|
|
|||||||||||||||||
| Balance at December 31, 2014 |
2,906 | $ | 291 | 12,576 | $ | 1,258 | $ | 301,533 | $ | (211 | ) | $ | 294,197 | $ | 597,068 | |||||||||||||||||
| Net earnings |
— | — | — | — | — | — | 26,924 | 26,924 | ||||||||||||||||||||||||
| Unrealized gain on short-term investments |
— | — | — | — | — | (384 | ) | — | (384 | ) | ||||||||||||||||||||||
| Changes in pension plan assets and benefit obligations |
— | — | — | — | — | 4 | — | 4 | ||||||||||||||||||||||||
| Amortization of unearned stock-based compensation |
— | — | — | — | 5,799 | — | — | 5,799 | ||||||||||||||||||||||||
| Issuance of non-voting common stock (upon vesting of restricted stock units) |
— | — | 179 | 18 | — | — | — | 18 | ||||||||||||||||||||||||
| Cancellation of restricted non-voting stock units for tax withholdings on vested shares |
— | — | (70 | ) | (7 | ) | (2,196 | ) | — | — | (2,203 | ) | ||||||||||||||||||||
| Purchase and retirement of treasury stock |
— | — | — | — | (252 | ) | — | — | (252 | ) | ||||||||||||||||||||||
| Other |
— | — | — | — | — | 24 | — | 24 | ||||||||||||||||||||||||
|
|
|
|
|
|
|
|
|
|
|
|
|
|
|
|
|
|||||||||||||||||
| Balance at December 31, 2015 |
2,906 | $ | 291 | 12,685 | $ | 1,269 | $ | 304,884 | $ | (567 | ) | $ | 321,121 | $ | 626,998 | |||||||||||||||||
|
|
|
|
|
|
|
|
|
|
|
|
|
|
|
|
|
|||||||||||||||||
The accompanying notes are an integral part of these unaudited condensed consolidated financial statements.
50
Table of Contents
CONSOLIDATED STATEMENTS OF CASH FLOWS
(Thousands of dollars)
| Year Ended | Year Ended | Year Ended | ||||||||||
| December 31, | December 31, | December 31, | ||||||||||
| 2015 | 2014 | 2013 | ||||||||||
| Operating activities: |
||||||||||||
| Net earnings |
$ | 26,924 | $ | 32,688 | $ | 58,956 | ||||||
| Adjustments to reconcile net earnings to net cash provided by operating activities: |
||||||||||||
| Depreciation and amortization |
71,618 | 50,848 | 42,848 | |||||||||
| Deferred income taxes |
12,894 | 16,071 | 21,921 | |||||||||
| Loss (gain) on asset dispositions |
339 | 848 | (16,604 | ) | ||||||||
| Equity in loss of unconsolidated affiliate |
306 | 96 | 262 | |||||||||
| Loss on debt extinguishment |
— | 29,833 | — | |||||||||
| Impairment of assets |
— | 10,507 | 1,648 | |||||||||
| Inventory valuation reserves |
3,231 | — | — | |||||||||
| Other |
(1,277 | ) | (96 | ) | 427 | |||||||
| Changes in operating assets and liabilities: |
||||||||||||
| Accounts receivable |
36,579 | (6,758 | ) | (32,123 | ) | |||||||
| Inventories of spare parts |
1,441 | (2,656 | ) | (5,062 | ) | |||||||
| Income taxes receivable |
466 | 644 | (1,015 | ) | ||||||||
| Other assets |
(14,998 | ) | (1,212 | ) | 3,104 | |||||||
| Accounts payable and accrued liabilities |
(3,859 | ) | (10,946 | ) | 27,191 | |||||||
| Other long-term liabilities |
254 | (348 | ) | 3,543 | ||||||||
|
|
|
|
|
|
|
|||||||
| Net cash provided by operating activities |
133,918 | 119,519 | 105,096 | |||||||||
|
|
|
|
|
|
|
|||||||
| Investing activities: |
||||||||||||
| Purchase of property and equipment |
(57,123 | ) | (157,690 | ) | (102,726 | ) | ||||||
| Proceeds from asset dispositions |
5,236 | 10,266 | 42,197 | |||||||||
| Purchase of short-term investments |
(608,649 | ) | (465,094 | ) | (375,503 | ) | ||||||
| Proceeds from sale of short-term investments |
505,966 | 363,110 | 338,970 | |||||||||
| Payments of deposits on aircraft |
(1,273 | ) | (6,948 | ) | (9,318 | ) | ||||||
| Refunds of deposits on aircraft |
6,010 | 11,506 | 8,161 | |||||||||
| Loan to unconsolidated affiliate |
— | (200 | ) | — | ||||||||
|
|
|
|
|
|
|
|||||||
| Net cash used in investing activities |
(149,833 | ) | (245,050 | ) | (98,219 | ) | ||||||
|
|
|
|
|
|
|
|||||||
| Financing activities: |
||||||||||||
| Proceeds from issuance of Senior Notes due 2019 |
— | 500,000 | — | |||||||||
| Repayment of Senior Notes due 2018 |
— | (300,000 | ) | — | ||||||||
| Premium and costs to retire debt early |
— | (26,749 | ) | — | ||||||||
| Debt issuance costs |
— | (6,232 | ) | — | ||||||||
| Repurchase of common stock |
(2,448 | ) | (152 | ) | (1,037 | ) | ||||||
| Proceeds from line of credit |
232,660 | 264,253 | 164,771 | |||||||||
| Payments on line of credit |
(218,160 | ) | (300,253 | ) | (172,526 | ) | ||||||
|
|
|
|
|
|
|
|||||||
| Net cash provided by (used in) financing activities |
12,052 | 130,867 | (8,792 | ) | ||||||||
|
|
|
|
|
|
|
|||||||
| (Decrease) increase in cash |
(3,863 | ) | 5,336 | (1,915 | ) | |||||||
| Cash, beginning of year |
6,270 | 934 | 2,849 | |||||||||
|
|
|
|
|
|
|
|||||||
| Cash, end of year |
$ | 2,407 | $ | 6,270 | $ | 934 | ||||||
|
|
|
|
|
|
|
|||||||
| Supplemental Disclosures Cash Flow Information |
||||||||||||
| Cash paid during the period for: |
||||||||||||
| Interest |
$ | 27,657 | $ | 25,415 | $ | 28,675 | ||||||
|
|
|
|
|
|
|
|||||||
| Income Taxes |
$ | 5,521 | $ | 9,590 | $ | 1,161 | ||||||
|
|
|
|
|
|
|
|||||||
| Accrued payables related to purchases of property and equipment |
$ | 1,339 | $ | 192 | $ | 176 | ||||||
|
|
|
|
|
|
|
|||||||
The accompanying notes are an integral part of these consolidated financial statements.
51
Table of Contents
NOTES TO CONSOLIDATED FINANCIAL STATEMENTS
| (1) | SUMMARY OF SIGNIFICANT ACCOUNTING POLICIES |
Nature of Operations, Basis of Consolidation, and Other General Principles
PHI, Inc. and its subsidiaries (“PHI,” the “Company,” “we,” “us,” or “our”) provide transportation services to, from, and among offshore facilities for customers engaged in the oil and gas exploration, development, and production industry. We provide these offshore services primarily in North America and to a lesser extent in West Africa and the Middle East. We also provide air medical transportation services for hospitals and emergency service agencies, as well as aircraft maintenance and repair services to third parties in North America and the Middle East.
The consolidated financial statements include the accounts of PHI, Inc. and its subsidiaries after the elimination of all intercompany accounts and transactions. We apply the equity method of accounting for investments in entities, if we have the ability to exercise significant influence over the operating and financial policies of the entity. We report our share of earnings or losses of equity investees in the accompanying Consolidated Statements of Operations as equity in earnings (loss) of unconsolidated affiliates.
At December 31, 2015, Al A. Gonsoulin, Chairman of the Board and Chief Executive Officer, beneficially owned stock representing approximately 70.2% of the total voting power. As a result, he exercises control over the election of PHI’s directors and the outcome of matters requiring a shareholder vote.
Use of Estimates
The preparation of financial statements is in conformity with accounting principles generally accepted in the United States of America (“GAAP”), which requires management to make estimates and assumptions that affect the reported amounts of assets and liabilities, the disclosure of contingent assets and liabilities at the date of the consolidated financial statements, and reported amounts of revenues and expenses during the reporting period. Actual results could differ materially from those estimates.
Significant estimates include:
Estimates of contractual allowances applicable to billings in the Air Medical segment,
Inventories of spare parts,
Valuation reserve related to obsolete and excess inventory,
Reserves related to unpaid accounts,
Depreciable lives and salvage values of property and equipment,
Valuation allowance for deferred tax assets,
Income taxes,
Healthcare insurance claims and workers’ compensation liability, and
Impairment of long-lived assets.
Cash and Cash Equivalents
We consider all highly liquid investments with maturities of three months or less, when purchased, to be cash equivalents.
Trade Receivables, net
Trade and other receivables are stated at net realizable value. Air Medical trade receivables are presented net of allowances for contractual discounts and uncompensated care. We estimate contractual allowances and uncompensated care based on historical collection experience by payor category. The main payor categories are Medicare, Medicaid, private insurance, and self-pay. We analyze our historical payment of accounts by payor category on a monthly basis, and adjust our accounts receivable allowance based upon each category’s historical collection percentage.
52
Table of Contents
Provisions for contractual discounts and uncompensated care that we applied to our Air Medical trade receivables (expressed as a percentage of total segment billings) at December 31 were as follows:
| 2015 | 2014 | |||||||
| Allowance for contractual discounts |
56 | % | 53 | % | ||||
| Allowance for uncompensated care |
23 | % | 23 | % | ||||
Short-term Investments
Short-term investments consist of money market funds, commercial paper, debt issued by the U.S. government or its agencies, and corporate bonds and notes, which represent funds available for current operations. In accordance with GAAP, these short-term investments are classified as available for sale. The Company recorded less than $0.9 million in net unrealized losses in 2015. These losses are reflected as a separate component of stockholders’ equity.
Inventories of Spare Parts
The Company’s inventories are stated at average cost and consist primarily of spare aircraft parts. Portions of the Company’s inventories are used parts that are often exchanged with parts removed from aircraft, reworked to a useable condition according to manufacturers’ and FAA specifications, and returned to inventory. Reusable aircraft parts are included in inventory at the average cost of comparable parts. The rework costs are expensed as incurred. The Company also records an allowance for obsolete and slow-moving parts, relying principally on specific identification of such inventory. Valuation reserves related to obsolescence and slow-moving inventory were $15.4 million and $13.5 million at December 31, 2015 and 2014, respectively.
Property and Equipment
The Company records its property and equipment at cost less accumulated depreciation. For financial reporting purposes, the Company uses the straight-line method to compute depreciation based upon estimated useful lives of five to fifteen years for flight equipment and three to ten years for other equipment. Leasehold improvements are amortized over the shorter of the life of the respective asset or the term of the lease agreement and range from six to ten years. The salvage value used in calculating depreciation of aircraft ranges from 25% to 54% of the aircraft’s carrying value, based upon historical aircraft sales data (historical as of 2007). The cost of scheduled inspections and modifications for flight equipment are charged to maintenance expense as incurred. We charge maintenance and repair costs to earnings as the costs are incurred. The cost of certain aircraft components are covered under contractual arrangements with the applicable aircraft manufacturer, commonly referred to as “power-by-the-hour” contracts. Under these agreements, we are charged an agreed amount per hour of flying time. The costs charged under these contractual arrangements are recognized in the period in which the flight hours occur. To the extent that we have not yet been billed for costs incurred under these arrangements, these costs are included in accrued expenses on our consolidated balance sheets. Modifications that enhance the operating performance or extend the useful lives of the aircraft are capitalized and depreciated over the remaining life of the asset. Upon selling or otherwise disposing of property and equipment, the Company removes the cost and accumulated depreciation from the accounts and reflects any resulting gain or loss in earnings at the time of sale or other disposition.
The Company reviews its long-lived assets for impairment annually, or more frequently if events or a change of circumstances indicate that an impairment may have occurred. The Company reviews certain identifiable intangibles for impairment whenever events or changes in circumstances indicate that the carrying amount of any such asset may not be recoverable. In such evaluation, the estimated future undiscounted cash flows generated by a particular asset group are compared with the book value of the asset group to determine if an impairment charge is necessary. Similar aircraft model types are grouped together for impairment testing purposes. The Company measures recoverability of assets to be held and used by comparing the carrying amount of an asset to future undiscounted net cash flows that it expects the asset to generate. When the Company determines that an asset is impaired, the Company recognizes that impairment amount, which is measured by the amount that the carrying value of the asset exceeds its fair value. In addition to the periodic review of its active long-lived assets for impairment when circumstances warrant, the Company also performs a review of its parked aircraft not expected to return to service annually or whenever changes in circumstances indicate the carrying amount of an aircraft may not be recoverable. Management estimates the fair value of each aircraft not expected to return to service by considering items such as the aircraft’s age, length of time parked, likelihood of return to active service, and actual recent sales of similar aircraft. For more significant aircraft carrying values, we obtain an estimate of the fair value of the parked aircraft form third-party appraisers for use in our determination of fair value estimates. The Company records an impairment charge when the carrying value of a parked aircraft not expected to return to active service exceeds its estimated fair market value.
53
Table of Contents
During the twelve months ended December 31, 2015, we sold and disposed of eight light and six medium aircraft previously utilized in our Oil and Gas segment. The carrying value of these assets prior to the sale was $3.7 million. These assets were sold for $3.7 million, which resulted in no gain. These aircraft no longer met our strategic needs. We also sold the associated spare parts inventory for these aircraft, which resulted in a $0.3 million loss.
During the twelve months ended December 31, 2014, we sold nine light and three fixed wing aircraft previously utilized in our Oil and Gas segment. The carrying value of these assets prior to the sale was $5.5 million. These assets were sold for $5.9 million, which resulted in a gain of $0.4 million. We also sold or disposed of one medium and four light aircraft previously utilized in our Air Medical segment. The carrying value of these assets prior to the sale was $10.8 million. These assets were sold for $8.2 million, resulting in a loss of $2.6 million. These aircraft no longer met our strategic needs. Sales and disposals of various ancillary equipment resulted in a gain of $1.4 million.
Impairment Losses
In connection with our normal recurring impairment testing, we recorded an impairment loss in the year ended December 31, 2014 for 13 medium aircraft in our Oil and Gas segment and one medium aircraft in our Air Medical segment. The carrying value of these aircraft was $16.5 million. Following a market analysis, we determined that the market value for these aircraft was $6.0 million. Similarly, we also recorded an impairment loss in the year ended 2013 for two medium aircraft in our Oil and Gas segment and two medium aircraft in our Air Medical segment. The carrying value of these aircraft was $4.0 million. Following a market analysis, we determined that the market value of these aircraft was $2.4 million. As a result of these analyses, we recorded aggregate non-cash pre-tax impairment losses of $10.5 million and $1.6 million for 2014 and 2013, respectively. We did not record an impairment loss in the year ended December 31, 2015. See Note 3 for additional information.
Deferred Financing Costs
Costs incurred to obtain long-term debt financing are deferred and amortized ratably over the term of the related debt agreement.
Self-Insurance
The Company maintains a self-insurance program for a portion of its healthcare costs. Self-insurance costs are accrued based upon the aggregate of the liability for reported claims and the estimated liability for claims incurred but not reported. The Company’s insurance retention was $250,000 per claim through December 31, 2015. As of December 31, 2015 and 2014, the Company had $1.9 million and $1.7 million, respectively, of accrued liabilities related to healthcare claims.
There is also a $0.5 million deductible per incident on our workers’ compensation program. We have accrued $2.6 million and $2.5 million for the years 2015 and 2014, respectively, related to workers’ compensation claims.
The Company owns an offshore insurance company to realize savings in reinsurance costs on its insurance premiums. We paid $1.0 million and $0.9 million, respectively, to this captive company in 2015 and 2014, which were eliminated in consolidation. The results of the captive are fully consolidated in the accompanying consolidated financial statements.
Revenue Recognition
The Company recognizes revenue related to aviation transportation services after the services are performed or the contractual obligations are met. Aircraft maintenance services revenues are recognized at the time the repair or services work is completed. Revenues related to the Company’s Air Medical segment independent provider model services are recorded net of contractual allowances under agreements with third party payors, and also recorded net of uncompensated care allowances when the services are provided.
54
Table of Contents
Revenues generated under the traditional provider model consist of a fixed monthly rate for aircraft availability and an hourly rate for flight time. We estimate contractual allowances and uncompensated care based on historical collection experience by payor category. The main payor categories are Medicaid, Medicare, private insurance, and self-pay. Changes in payor mix, reimbursement rates and uncompensated care rates are the factors most subject to sensitivity and variability in calculating our allowances. We compute a historical payment analysis of accounts by category. The allowance percentages calculated are applied to the payor categories, and the necessary adjustments are made to the revenue allowance. The allowance for contractual discounts against outstanding accounts receivable was $103.6 million, $96.6 million, and $74.7 million as of December 31, 2015, 2014, and 2013, respectively. The allowance for uncompensated care against outstanding accounts receivable was $41.9 million, $41.9 million, and $46.4 million as of December 31, 2015, 2014, and 2013, respectively. Included in the allowance for uncompensated care above is the value of services to patients who are unable to pay when it is determined that they qualify as charity care. The value of these services was $9.3 million, $9.1 million, and $7.9 million for the years ended December 31, 2015, 2014, and 2013, respectively. The estimated cost of providing charity services was $2.0 million, $2.1 million, and $3.0 million for the years ended December 31, 2015, 2014, and 2013, respectively. The estimated costs of providing charity services are based on a calculation that applies a ratio of costs to the charges for uncompensated charity care. The ratio of costs to charges is based on the Air Medical segment’s total expenses divided by gross patient service revenue.
In determining the allowance estimates for our Air Medical segment’s billing, receivables and revenue, we utilize the prior twelve months’ payment history by each individual payor group, which we evaluate on a state by state basis. A percentage of amounts collected compared to the total invoice is determined from this process and applied to the current month’s billings and receivables. If a receivable related to the self-pay category is outstanding nine months or greater, we record a reserve equal to 100% of the receivable. Receivables related to other payor categories are scrutinized when they are outstanding for nine months or longer and additional allowances are recorded if warranted.
Provisions for contractual discounts and estimated uncompensated care that we applied to our Air Medical revenues (expressed as a percentage of total segment billings) were as follows:
| Year Ended December 31, | ||||||||||||
| 2015 | 2014 | 2013 | ||||||||||
| Provision for contractual discounts |
65 | % | 72 | % | 60 | % | ||||||
| Provision for uncompensated care |
8 | % | 2 | % | 10 | % | ||||||
Amounts attributable to Medicaid, Medicare, private insurance, and self-pay as a percentage of net Air Medical revenues were as follows:
| Year Ended December 31, | ||||||||||||
| 2015 | 2014 | 2013 | ||||||||||
| Insurance |
74 | % | 74 | % | 73 | % | ||||||
| Medicare |
17 | % | 18 | % | 19 | % | ||||||
| Medicaid |
8 | % | 8 | % | 7 | % | ||||||
| Self-Pay |
1 | % | 0 | % | 1 | % | ||||||
Under a three-year contract that commenced on September 29, 2012, our Air Medical affiliate provided multiple products and services to a customer in the Middle East, including helicopter leasing, emergency medical helicopter flight services, aircraft maintenance, provision of spare parts and insurance coverage for the customer-owned aircraft, training services, and base construction. The initial contract expired in late September 2015 and has been extended to June 29, 2016 on terms that have reduced the number of aircraft operated by us and the scope of our services and responsibilities. Each of the major deliverables mentioned above qualify as separate units of accounting under the accounting guidance for such arrangements. The selling price for each service was determined based upon third-party evidence and estimates.
55
Table of Contents
Income Taxes
Income taxes are accounted for in accordance with the provisions of Accounting Standards Codification 740, Income Taxes. The Company provides for income taxes using the asset and liability method under which deferred tax assets and liabilities are recognized for the future tax consequences attributable to differences between the financial statement carrying amounts of existing assets and liabilities and their respective tax bases. The deferred tax assets and liabilities measurement uses enacted tax rates that are expected to apply to taxable income in the years in which those temporary differences are expected to be recovered or settled. The Company recognizes the effect of any tax rate changes in income of the period that includes the enactment date. Deferred tax assets are reduced by a valuation allowance when, in the opinion of management, it is more likely than not that some portion of the deferred tax assets will not be realized.
Earnings per Share
Basic earnings per share is computed by dividing earnings (loss) during the period by the weighted average number of voting and non-voting shares outstanding during each period. Diluted earnings per share is computed by dividing net income (loss) during the period by the weighted average number of shares of common stock that would have been outstanding assuming the issuance of potentially dilutive shares of common stock, as if such shares were outstanding during the reporting period, net of shares to be repurchased using the treasury stock method. Dilutive shares for this purpose assumes restricted stock unit awards have vested.
Concentration of Credit Risk
Financial instruments that potentially expose the Company to concentrations of credit risk consist primarily of trade accounts receivables. The Company does not believe significant credit risk existed with respect to these trade accounts receivable at December 31, 2015.
PHI conducts a majority of its business with major and independent oil and gas exploration and production companies with operations in the Gulf of Mexico. The Company also provides services to major medical centers and U.S. governmental agencies. The Company continually evaluates the financial strength of its customers, but generally does not require collateral to secure its customer receivables. The Company establishes an allowance for doubtful accounts based upon factors pertaining to the credit risk of specific customers, current market conditions, and other information. Amounts are charged off as uncollectible when collection efforts have been exhausted. The allowance for doubtful accounts in the Oil and Gas and Technical Services segments was $3.2 million and $0.1 million at December 31, 2015 and 2014, respectively.
Trade receivables representing amounts due pursuant to air medical independent provider model services are carried net of an allowance for estimated contractual adjustments and uncompensated care on unsettled invoices. The Company monitors its collection experience by payor category within the Air Medical segment and updates its estimated collections to be realized as deemed necessary. The allowance for contractual discounts was $103.6 million, $96.6 million, and $74.7 million as of December 31, 2015, 2014, and 2013, respectively. The allowance for uncompensated care was $41.9 million, $41.9 million, and $46.4 million as of December 31, 2015, 2014, and 2013, respectively.
The Company’s two largest oil and gas customers accounted for 26% of consolidated operating revenues for the year ended December 31, 2015, 30% for the year ended December 31, 2014, and 28% for the year ended December 31, 2013. The Company also carried accounts receivable from these same customers totaling 15% and 18% of net trade receivables on December 31, 2015 and 2014, respectively. The Company’s largest Air Medical customer accounted for 9% and 10% of consolidated operating revenues for the years ended December 31, 2015 and 2014, respectively. The Company also carried accounts receivable from this customer totaling 15% and 20% of net trade receivables on December 31, 2015 and 2014, respectively.
Substantially all of the Company’s cash is maintained in one financial institution in amounts that typically exceed federally insured limits. The Company has not experienced any losses in such accounts and based on current circumstances does not believe that it is exposed to significant credit risk.
56
Table of Contents
New Accounting Pronouncements
In May 2014, the Financial Accounting Standards Board (the “FASB”) issued Accounting Standards Update No. 2014-09, Revenue from Contracts with Customers, which provides a single comprehensive model for entities to use in accounting for revenue arising from contracts with customers and will supersede most current revenue recognition guidance. The standard is effective for public entities for annual and interim periods beginning after December 15, 2016. Early adoption is not permitted. The effects of this standard on our financial position, results of operations and cash flows are not yet known.
In August 2014, the FASB issued ASU 2014-15 Presentation of Financial Statements – Going Concern (Subtopic 205-40): Disclosure of Uncertainties about an Entity’s Ability to Continue as a Going Concern. ASU 2014-15 requires management to assess the entity’s ability to continue as a going concern, and to provide related disclosures in certain circumstances. ASU 2014-15 is effective for annual and interim periods beginning after December 15, 2016. The Company believes that the impact of the implementation of this new guidance on its consolidated financial statements and disclosures will not be significant.
In April 2015, the FASB issued ASU No. 2015-03, Simplifying the Presentation of Debt Issuance Costs. This ASU requires that debt issuance costs related to a recognized debt liability be presented on the balance sheet as a direct deduction from the carrying amount of the debt liability, similar to debt discounts. Issuance costs attributable to revolving debt arrangements may continue to be presented as an asset on the balance sheet. This pronouncement is effective for fiscal years, and interim periods beginning after December 15, 2015. We currently recognize debt issuance costs on our balance sheet in Other assets. The balance at December 31, 2015 and December 31, 2014 was $4.0 million and $5.2 million, respectively. We do not believe adoption of this new guidance will have a significant impact on our consolidated financial statements.
In November 2015, the FASB issued ASU 2015-17, Balance Sheet Classification of Deferred Taxes, which amends existing guidance on income taxes to require the classification of all deferred tax assets and liabilities as non-current on the balance sheet. We are required to adopt this ASU no later than January 1, 2018, with early adoption permitted, and the guidance may be applied either prospectively or retrospectively. We do not expect this ASU to have a material impact on our consolidated financial statements.
| (2) | INVESTMENTS |
We classify all of our short term investments as available-for-sale. We carry these at fair value and report unrealized gains and losses, net of taxes, in Accumulated other comprehensive loss (income), which is a separate component of shareholders’ equity in our consolidated balance sheets, and in our consolidated statements of shareholders’ equity. Cost, gains, and losses are determined using the specific identification method. In the years ended December 31, 2015, 2014, and 2013, we received proceeds from the sales of these securities of $506.0 million, $363.1 million, and $339.0 million, respectively. Gains and losses on these sales were negligible and all amounts reclassified from accumulated other comprehensive income were immaterial.
Investments consisted of the following as of December 31, 2015:
| Unrealized | Unrealized | Fair | ||||||||||||||
| Cost Basis | Gains | Losses | Value | |||||||||||||
| (Thousands of dollars) | ||||||||||||||||
| Investments: |
||||||||||||||||
| Money market mutual funds |
$ | 18,181 | $ | — | $ | — | $ | 18,181 | ||||||||
| Commercial paper |
5,986 | — | (5 | ) | 5,981 | |||||||||||
| U.S. government agencies |
11,499 | — | (30 | ) | 11,469 | |||||||||||
| Corporate bonds and notes |
265,069 | — | (841 | ) | 264,228 | |||||||||||
|
|
|
|
|
|
|
|
|
|||||||||
| Subtotal |
300,735 | — | (876 | ) | 299,859 | |||||||||||
| Deferred compensation plan assets included in other assets |
2,294 | — | — | 2,294 | ||||||||||||
|
|
|
|
|
|
|
|
|
|||||||||
| Total |
$ | 303,029 | $ | — | $ | (876 | ) | $ | 302,153 | |||||||
|
|
|
|
|
|
|
|
|
|||||||||
57
Table of Contents
$15.3 million of our investments at December 31, 2015 were long-term and included on the balance sheet as Restricted investments as they are securing outstanding letters of credit with maturities beyond one year.
Investments consisted of the following as of December 31, 2014:
| Unrealized | Unrealized | Fair | ||||||||||||||
| Cost Basis | Gains | Losses | Value | |||||||||||||
| (Thousands of dollars) | ||||||||||||||||
| Investments: |
||||||||||||||||
| Money market mutual funds |
$ | 68,612 | $ | — | $ | — | $ | 68,612 | ||||||||
| Municipal bonds and notes |
1,500 | 2 | — | 1,502 | ||||||||||||
| Corporate bonds and notes |
130,864 | 19 | (268 | ) | 130,615 | |||||||||||
|
|
|
|
|
|
|
|
|
|||||||||
| Subtotal |
200,976 | 21 | (268 | ) | 200,729 | |||||||||||
| Deferred compensation plan assets included in other assets |
2,386 | — | — | 2,386 | ||||||||||||
|
|
|
|
|
|
|
|
|
|||||||||
| Total |
$ | 203,362 | $ | 21 | $ | (268 | ) | $ | 203,115 | |||||||
|
|
|
|
|
|
|
|
|
|||||||||
$15.5 million of our investments at December 31, 2014 were long-term and included on the balance sheet as Restricted investments as they are securing outstanding letters of credit with maturities beyond one year.
The following table presents the cost and fair value of our debt investments based on maturities as of December 31,
| 2015 | 2014 | |||||||||||||||
| Amortized | Fair | Amortized | Fair | |||||||||||||
| Costs | Value | Costs | Value | |||||||||||||
| (Thousands of dollars) | ||||||||||||||||
| Due in one year or less |
$ | 152,444 | $ | 152,212 | $ | 70,180 | $ | 70,169 | ||||||||
| Due within two years |
130,110 | 129,466 | 62,184 | 61,948 | ||||||||||||
|
|
|
|
|
|
|
|
|
|||||||||
| Total |
$ | 282,554 | $ | 281,678 | $ | 132,364 | $ | 132,117 | ||||||||
|
|
|
|
|
|
|
|
|
|||||||||
The following table presents the average coupon rate percentage and the average days to maturity of our debt investments as of December 31,
| 2015 | 2014 | |||||||||||||||
| Average | Average | Average | Average | |||||||||||||
| Coupon | Days To | Coupon | Days To | |||||||||||||
| Rate (%) | Maturity | Rate (%) | Maturity | |||||||||||||
| Commercial paper |
0.553 | 154 | n/a | n/a | ||||||||||||
| U.S. government agencies |
0.865 | 599 | n/a | n/a | ||||||||||||
| Municipal bonds and notes |
n/a | n/a | 0.528 | 134 | ||||||||||||
| Corporate bonds and notes |
1.757 | 331 | 1.828 | 348 | ||||||||||||
The following table presents the fair value and unrealized losses related to our investments that have been in a continuous unrealized loss position for less than twelve months as of December 31,
| 2015 | 2014 | |||||||||||||||
| Unrealized | Unrealized | |||||||||||||||
| Fair Value | Losses | Fair Value | Losses | |||||||||||||
| (Thousands of dollars) | ||||||||||||||||
| Commercial paper |
$ | 5,981 | $ | (5 | ) | $ | — | $ | — | |||||||
| U.S. government agencies |
8,969 | (30 | ) | — | — | |||||||||||
| Corporate bonds and notes |
232,347 | (793 | ) | 100,071 | (268 | ) | ||||||||||
|
|
|
|
|
|
|
|
|
|||||||||
| Total |
$ | 247,297 | $ | (828 | ) | $ | 100,071 | $ | (268 | ) | ||||||
|
|
|
|
|
|
|
|
|
|||||||||
58
Table of Contents
The following table presents the fair value and unrealized losses related to our investments that have been in a continuous unrealized loss position for twelve months or more as of December 31,
| 2015 | 2014 | |||||||||||||||
| Unrealized | Unrealized | |||||||||||||||
| Fair Value | Losses | Fair Value | Losses | |||||||||||||
| (Thousands of dollars) | ||||||||||||||||
| Corporate bonds and notes |
$ | 28,866 | $ | (48 | ) | $ | — | $ | — | |||||||
|
|
|
|
|
|
|
|
|
|||||||||
| Total |
$ | 28,866 | $ | (48 | ) | $ | — | $ | — | |||||||
|
|
|
|
|
|
|
|
|
|||||||||
As noted above, from time to time over the periods covered in our financial statements included herein, our investments have experienced net unrealized losses. We consider these declines in market value to be due to market conditions, and we do not plan to sell these investments prior to maturity. For these reasons, we do not consider any of our investments to be other than temporarily impaired at December 31, 2015 and 2014. The assessment of whether an investment in a debt security has suffered an other-than-temporary impairment is based on whether the Company has the intent to sell or more likely than not will be required to sell the debt security before recovery of its amortized costs. Further, if the Company does not expect to recover the entire amortized cost basis of the debt security, an other-than-temporary impairment is considered to have occurred and it is measured by the present value of cash flows expected to be collected less the amortized cost basis (credit loss). The Company determined it did not have any other-than-temporary impairments relating to credit losses on debt securities for the year ended December 31, 2015 or 2014.
| (3) | FAIR VALUE |
Accounting guidance defines fair value as the price that would be received to sell an asset or transfer a liability in an orderly transaction between market participants at the measurement date. This guidance establishes a hierarchy for inputs used in measuring fair value that maximizes the use of observable inputs and minimizes the use of unobservable inputs by requiring that the most observable inputs be used when available. The hierarchy for inputs is categorized into three levels based on the reliability of inputs as follows:
Level 1: Quoted market prices in active markets for identical assets or liabilities.
Level 2: Observable market based inputs or unobservable inputs that are corroborated by market data.
Level 3: Unobservable inputs that are not corroborated by market data.
The following tables summarize the valuation of our investments and financial instruments by the above pricing levels as of the valuation dates listed:
| December 31, 2015 | ||||||||||||
| Total | (Level 1) | (Level 2) | ||||||||||
| Investments: |
||||||||||||
| Money Market Mutual Funds |
$ | 18,181 | $ | 18,181 | $ | — | ||||||
| Commercial Paper |
5,981 | — | 5,981 | |||||||||
| U.S. Government Agencies |
11,469 | — | 11,469 | |||||||||
| Corporate bonds and notes |
264,228 | — | 264,228 | |||||||||
|
|
|
|
|
|
|
|||||||
| 299,859 | 18,181 | 281,678 | ||||||||||
| Deferred compensation plan assets |
2,294 | 2,294 | — | |||||||||
|
|
|
|
|
|
|
|||||||
| Total |
$ | 302,153 | $ | 20,475 | $ | 281,678 | ||||||
|
|
|
|
|
|
|
|||||||
59
Table of Contents
| December 31, 2014 | ||||||||||||
| Total | (Level 1) | (Level 2) | ||||||||||
| Investments: |
||||||||||||
| Money Market Mutual Funds |
$ | 68,612 | $ | 68,612 | $ | — | ||||||
| Municipal bonds and notes |
1,502 | — | 1,502 | |||||||||
| Corporate bonds and notes |
130,615 | — | 130,615 | |||||||||
|
|
|
|
|
|
|
|||||||
| 200,729 | 68,612 | 132,117 | ||||||||||
| Deferred compensation plan assets |
2,386 | 2,386 | — | |||||||||
|
|
|
|
|
|
|
|||||||
| Total |
$ | 203,115 | $ | 70,998 | $ | 132,117 | ||||||
|
|
|
|
|
|
|
|||||||
The Company holds its short-term investments in an investment fund consisting of high quality money market instruments of governmental and private issuers, which is classified as a short-term investment. Level 1 inputs are quoted prices (unadjusted) for identical assets or liabilities in active markets. These items are traded with sufficient frequency and volume to provide pricing on an ongoing basis. The fair values of the shares of these funds are based on observable market prices, and therefore, have been categorized in Level 1 in the fair value hierarchy. Level 2 inputs reflect quoted prices for identical assets or liabilities that are not active. These items may not be traded daily; examples include corporate bonds and U.S. government agencies. Assets are valued based on prices derived by independent third parties that use inputs such as benchmark yields, reported trades, broker/dealer quotes, and issuer spreads. Prices are reviewed and can be challenged with the independent parties and/or overridden by the Company, if it is believed such would be more reflective of fair value. Investments included in other assets, which relate to the liability for the Officers’ Deferred Compensation Plan, consist mainly of multiple investment funds that are highly liquid and diversified.
Cash, accounts receivable, accounts payable and accrued liabilities all had fair values approximating their carrying amounts at December 31, 2015 and 2014.
In connection with its impairment testing (discussed further in Note 1), the Company estimates cash flows based upon historical data adjusted for the company’s best estimate of expected future market performance. If an asset group fails the undiscounted cash flow test, the Company uses the discounted cash flow method to determine the estimated fair value of each asset group and compares such estimated fair value to the book value of each asset group in order to determine if impairment exists. If impairment exists, the book value of the asset group is reduced to its estimated fair value.
The below table summarizes the combined fair value of the assets that incurred impairments during the years ended December 31, 2015 and 2014, along with the amount of the impairment. The impairment charges were recorded in Impairment of assets.
| Year Ended December 31, | ||||||||
| 2015 | 2014 | |||||||
| (Thousands of dollars) | ||||||||
| Amount of impairment incurred |
$ | — | $ | 10,508 | ||||
| Combined fair value of assets incurring impairment |
$ | — | $ | 6,000 | ||||
60
Table of Contents
| (4) | PROPERTY AND EQUIPMENT |
The following table summarizes the Company’s property and equipment at December 31 of the following years:
| 2015 | 2014 | |||||||
| (Thousands of dollars) | ||||||||
| Flight equipment |
$ | 1,096,986 | $ | 1,053,640 | ||||
| Facility & improvements |
61,330 | 61,246 | ||||||
| Operating equipment |
26,004 | 24,764 | ||||||
| Data processing equipment |
33,178 | 32,374 | ||||||
| Vehicles |
8,461 | 8,133 | ||||||
| Medical equipment |
7,514 | 7,377 | ||||||
| Other |
5,377 | 5,332 | ||||||
|
|
|
|
|
|||||
| 1,238,850 | 1,192,866 | |||||||
| Less accumulated depreciation and amortization |
(355,321 | ) | (315,048 | ) | ||||
|
|
|
|
|
|||||
| Property and equipment, net |
$ | 883,529 | $ | 877,818 | ||||
|
|
|
|
|
|||||
Depreciation expense related to property and equipment was $46.7 million in 2015, $43.7 million in 2014, and $38.9 million in 2013. These amounts are reported as Direct expenses and Selling, general, and administrative expenses in our Consolidated Statements of Operations included elsewhere herein.
| (5) | OTHER ASSETS |
The following table summarizes the Company’s other assets at December 31 of the following years:
| 2015 | 2014 | |||||||
| (Thousands of dollars) | ||||||||
| Deposits on future purchases of aircraft |
$ | 3,568 | $ | 8,305 | ||||
| Deferred financing cost |
3,999 | 5,246 | ||||||
| Investments (Officers’ Deferred Compensation Plan) |
2,294 | 2,386 | ||||||
| Other |
316 | 316 | ||||||
|
|
|
|
|
|||||
| Total |
$ | 10,177 | $ | 16,253 | ||||
|
|
|
|
|
|||||
| (6) | ACCRUED AND OTHER CURRENT LIABILITIES |
Accrued and other current liabilities as of December 31 consisted of the following:
| 2015 | 2014 | |||||||
| (Thousands of dollars) | ||||||||
| Salaries & wages |
$ | 19,955 | $ | 16,203 | ||||
| Incentive compensation |
2,819 | 11,730 | ||||||
| Income taxes |
1,453 | 3,787 | ||||||
| Interest |
7,925 | 7,891 | ||||||
| Vacation payable |
5,801 | 6,112 | ||||||
| Group medical |
1,944 | 1,735 | ||||||
| Transportations tax |
892 | 907 | ||||||
| Operating lease |
814 | 1,227 | ||||||
| Workers compensation |
1,047 | 1,185 | ||||||
| Other |
2,109 | 2,035 | ||||||
|
|
|
|
|
|||||
| Total accrued liabilities |
$ | 44,759 | $ | 52,812 | ||||
|
|
|
|
|
|||||
61
Table of Contents
| (7) | LONG-TERM DEBT |
The components of long-term debt as of December 31 are as follows:
| 2015 | 2014 | |||||||
| (Thousands of dollars) | ||||||||
| Senior Notes issued March 17, 2014, interest only payable semi-annually at 5.25%, maturing March 15, 2019 |
$ | 500,000 | $ | 500,000 | ||||
| Revolving Credit Facility due October 1, 2017 with a group of commercial banks, interest payable at variable rates |
57,500 | 43,000 | ||||||
|
|
|
|
|
|||||
| Total long-term debt |
$ | 557,500 | $ | 543,000 | ||||
|
|
|
|
|
|||||
Listed below is information on our future annual maturities of long-term debt (in thousands):
| 2016 |
$ | — | ||
| 2017 |
57,500 | |||
| 2018 |
— | |||
| 2019 |
500,000 | |||
| 2020 |
— | |||
| Thereafter |
— | |||
|
|
|
|||
| Total |
$ | 557,500 | ||
|
|
|
Senior Notes – The 5.25% Senior Notes (“Notes”) are unconditionally guaranteed on a senior basis by our domestic subsidiaries and are general, unsecured obligations of ours and the subsidiary guarantors. We have the option to redeem some or all of the Notes at any time on or after March 15, 2016 at specified redemption prices, and prior to that time pursuant to certain make-whole provisions. The Notes contain restrictive covenants, including limitations on incurring indebtedness, creating liens, selling assets, and entering into certain transactions with affiliates. The covenants limit our ability to pay cash dividends on common stock, repurchase or redeem common or preferred equity, prepay subordinated debt, and make certain investments. There are no restrictions on dividends from a subsidiary to the parent company, nor any restrictions on distributions from the parent company to a subsidiary. Upon the occurrence of a “Change in Control Repurchase Event” (as defined in the indenture governing the notes), each holder of the Notes will have the right to require us to purchase that holder’s Notes for a cash price equal to 101% of their principal amount. Upon the occurrence of an “Event of Default” (as defined in the indenture), the trustee or the holders of the Notes may declare all of the outstanding Notes to be due and payable immediately. The Company is not aware of any instances of non-compliance with the financial covenants.
Proceeds from our sale of the Notes in 2014 were approximately $493.8 million, net of fees and expenses, and were used to retire all of our $300 million of previously outstanding 8.625% Senior Notes pursuant to a tender offer, at a total cost of $329.4 million, including the tender premium and accrued interest. As a result of our repurchase of 8.625% Senior Notes in 2014, we recorded a pretax charge of $29.8 million, which consisted of $26.7 million of premium and $3.1 million of unamortized issuance costs.
The Notes bear interest at a fixed rate and therefore changes in market interest rates do not affect our interest payment obligations on the notes. The fair market value of the Notes varies as changes occur to general market interest rates, the remaining maturity of the notes, and our credit worthiness. At December 31, 2015, the fair market value of the Notes was $403.1 million, and the carrying value was $500 million. At December 31, 2014, the fair market value of Notes was $425.6 million and the carrying value was $500 million.
Revolving Credit Facility – We have an amended and restated revolving credit facility that matures on October 1, 2017. Under this facility, we can borrow up to $150 million at floating interest rates based on either the London Interbank Offered Rate plus 225 basis points or the prime rate (each as defined in our amended and restated revolving credit facility), at our option. Our revolving credit facility includes usual and customary covenants and events of default for credit facilities of its type. Our ability to borrow under the credit facility is conditioned upon our continued compliance with such covenants, including, among others, (i) covenants that restrict our ability to engage in certain asset sales, mergers or other fundamental
62
Table of Contents
changes, to incur liens or to engage in certain other transactions or activities and (ii) financial covenants that stipulate that PHI will maintain a consolidated working capital ratio of at least 2 to 1, a funded debt to consolidated net worth ratio not greater than 1.5 to 1, a fixed charge coverage ratio of at least 1.1 to 1, and consolidated net worth of at least $450 million (with all such terms or amounts as defined in or determined under the amended and restated revolving credit facility).
For additional information on our revolving credit facility, see “Management’s Discussion and Analysis of Financial Condition and Results of Operations – Liquidity and Capital Resources – Long Term Debt” included in Item 7 of this report.
Other - We maintain a separate letter of credit facility that had $15.3 million in letters of credit outstanding at December 31, 2015, compared to $15.5 million in letters of credit outstanding at December 31, 2014. The letters of credit securing our workers compensation policies, in the amount of $6.1 million, are evergreen. The letter of credit securing an Air Medical traditional provider contract, in the amount of $9.2 million, expires on October 29, 2016, but may be extended at the request of the beneficiary for subsequent periods up to one year.
| (8) | INCOME TAXES |
Income tax expense is composed of the following:
| Year Ended December 31, | ||||||||||||
| 2015 | 2014 | 2013 | ||||||||||
| (Thousands of dollars) | ||||||||||||
| Current |
||||||||||||
| Federal |
$ | — | $ | — | $ | — | ||||||
| State |
284 | 307 | 353 | |||||||||
| Foreign |
3,159 | 4,352 | 9,637 | |||||||||
| Deferred – principally Federal |
12,889 | 15,768 | 21,195 | |||||||||
|
|
|
|
|
|
|
|||||||
| Total |
$ | 16,332 | $ | 20,427 | $ | 31,185 | ||||||
|
|
|
|
|
|
|
|||||||
Income tax expense as a percentage of pre-tax earnings varies from the effective Federal statutory rate of 35% as a result of the following:
| Year Ended | Year Ended | Year Ended | ||||||||||||||||||||||
| December 31, 2015 |
December 31, 2014 |
December 31, 2013 |
||||||||||||||||||||||
| (Thousands of dollars, except percentage amounts) | ||||||||||||||||||||||||
| Amount | Tax Rate % |
Amount | Tax Rate % |
Amount | Tax Rate % |
|||||||||||||||||||
| Income taxes at statutory rate |
$ | 15,140 | 35 | $ | 18,590 | 35 | $ | 31,550 | 35 | |||||||||||||||
| Increase (decrease) in taxes resulting from: |
||||||||||||||||||||||||
| Valuation allowance on foreign tax credits |
— | — | 113 | — | — | — | ||||||||||||||||||
| Valuation allowance reversal–investment in foreign entity |
(456 | ) | (1 | ) | — | — | — | — | ||||||||||||||||
| Change in tax rate on deferred items |
1,078 | 3 | — | — | (3,850 | ) | (4 | ) | ||||||||||||||||
| State income taxes, net of federal benefit |
146 | — | 916 | 2 | 2,161 | 2 | ||||||||||||||||||
| Other items – net |
424 | 1 | 808 | 1 | 1,324 | 2 | ||||||||||||||||||
|
|
|
|
|
|
|
|
|
|
|
|
|
|||||||||||||
| Total |
$ | 16,332 | 38 | $ | 20,427 | 38 | $ | 31,185 | 35 | |||||||||||||||
|
|
|
|
|
|
|
|
|
|
|
|
|
|||||||||||||
The change in tax rate on deferred items relates to the increase in the estimated effective tax rate that will be present at the time the deferred tax assets and liabilities reverse for tax purposes. The increase is attributable to an increase in the apportionment percentages in the various jurisdictions in which we operate as a result of increased operations in certain states.
63
Table of Contents
Deferred income taxes reflect the net tax effects of temporary differences between the carrying amounts of assets and liabilities for financial reporting purposes and the amounts used for income tax purposes. The tax effects of significant items comprising our net deferred tax balance at December 31 are as follows:
| 2015 | 2014 | |||||||
| (Thousands of dollars) | ||||||||
| Deferred tax assets: |
||||||||
| Deferred compensation |
$ | 946 | $ | 1,023 | ||||
| Foreign tax credits |
20,118 | 16,982 | ||||||
| Vacation and bonus accrual |
1,952 | 2,031 | ||||||
| Inventory valuation |
6,808 | 6,093 | ||||||
| Rental accrual |
1,691 | 1,799 | ||||||
| Hurricane relief credit |
1,255 | 1,255 | ||||||
| Stock-based compensation |
3,598 | 2,977 | ||||||
| Other |
3,593 | 2,714 | ||||||
| Net operating losses |
61,611 | 56,305 | ||||||
|
|
|
|
|
|||||
| Total deferred tax assets |
101,572 | 91,179 | ||||||
| Valuation allowance – state NOL carryforwards |
(290 | ) | (219 | ) | ||||
| Valuation allowance – tax credit carryforwards |
(2,047 | ) | (2,047 | ) | ||||
| Valuation allowance – other |
— | (1,466 | ) | |||||
|
|
|
|
|
|||||
| Total deferred tax assets, net |
99,235 | 87,447 | ||||||
|
|
|
|
|
|||||
| Deferred tax liabilities: |
||||||||
| Tax depreciation in excess of book depreciation |
(242,501 | ) | (218,064 | ) | ||||
|
|
|
|
|
|||||
| Total deferred tax liabilities |
(242,501 | ) | (218,064 | ) | ||||
|
|
|
|
|
|||||
| Net deferred tax liabilities |
$ | (143,266 | ) | $ | (130,617 | ) | ||
|
|
|
|
|
|||||
| Current deferred tax assets |
$ | 10,379 | $ | 9,915 | ||||
| Deferred tax liability – long-term |
(153,645 | ) | (140,532 | ) | ||||
|
|
|
|
|
|||||
| Net deferred tax liabilities |
$ | (143,266 | ) | $ | (130,617 | ) | ||
|
|
|
|
|
|||||
As a result of certain realization requirements under GAAP, the Company’s deferred tax assets as of December 31, 2015 in the table above do not include certain deferred tax assets that arose directly from tax deductions related to equity compensation in excess of compensation recognized for financial reporting. Equity is expected to increase by $1.0 million when the deferred tax assets are ultimately realized. The Company uses tax law ordering for purposes of determining when excess tax benefits have been realized.
The Company has U.S. Federal net operating loss carryforwards (“NOLs”) of approximately $158.3 million that, if not used, will expire beginning in 2028 through 2035. Additionally, for state income tax purposes, the Company has NOLs of approximately $160.4 million available to reduce future state taxable income. These NOLs expire in varying amounts through 2035, the majority of which expire in 2024 through 2035. The Company has a valuation allowance of $0.3 million as of December 31, 2015 against certain net operating losses in nine states which we have determined are more likely than not to be forfeited in future years.
During 2015, the Company recorded $0.1 million of valuation allowances on state NOLs.
The Company also has foreign tax credits of approximately $20.1 million which expire beginning in 2016 through 2025. The estimated future U.S. taxable income, after utilization of the available net operating loss carryforwards, will limit the ability of the Company to utilize some of the foreign tax credit carryforwards during their carry forward period and it is not more likely than not that a portion of these credits will be utilized in future years. Therefore, the Company has a valuation allowance of $2.0 million on these credits, of which of $-0- million was recorded in 2015.
64
Table of Contents
The Company files income tax returns in the U.S. federal jurisdiction and in many U.S. state jurisdictions. The tax years 2012 to 2015 remain open to examination by the major taxing jurisdictions in which the Company is subject to tax.
Income taxes paid were approximately $5.5 million, $9.6 million, and $1.1 million for each of the years ended December 31, 2015, 2014, and 2013, respectively.
At December 31, 2015, the Company had no unrecognized tax benefits. It is the Company’s practice to recognize interest and penalties related to income tax expense as part of non-operating expenses.
| (9) | EARNINGS PER SHARE |
The components of basic and diluted earnings per share for the years ended December 31, are as follows:
| 2015 | 2014 | 2013 | ||||||||||
| (in thousands) | ||||||||||||
| Weighted average outstanding shares of common stock, basic |
15,566 | 15,483 | 15,474 | |||||||||
| Dilutive effect of restricted stock units |
76 | 202 | 165 | |||||||||
|
|
|
|
|
|
|
|||||||
| Weighted average outstanding shares of common stock, diluted |
15,642 | 15,685 | 15,639 | |||||||||
|
|
|
|
|
|
|
|||||||
There were no shares of stock that were anti-dilutive to earnings for the years ended December 31, 2015, 2014, and 2013.
| (10) | EMPLOYEE BENEFIT PLANS |
Deferred Compensation Plan
The Company maintains an Officer Deferred Compensation Plan that permits key officers to defer a portion of their compensation. The plan is nonqualified and we are not obligated to fund it. The Company has established a separate bookkeeping account for each participant, which is treated as if invested and reinvested from time to time in investments that the participant selects from a list of available investment choices. These accruals are periodically adjusted for gains and losses to reflect the performance of the hypothetical investments. Earnings and losses on the book reserve accounts accrue to the plan participants. Liabilities for the plan are included in other long-term liabilities, and the corresponding investment accounts funded by voluntary contributions are included in other assets. Aggregate amounts deferred under the plans were $2.3 million and $2.4 million for the years ended December 31, 2015 and 2014, respectively.
Incentive Compensation
The Company has three different incentive compensation plans. The incentive compensation plan for non-executive employees allows the Company to pay up to 8.25% of earnings before tax upon achieving a specified earnings threshold. The Company also has an executive/senior management plan for certain corporate and business unit management employees. Under this plan, the bonus is a percentage of each participating employee’s base salary based upon the Company’s achievement of the financial target established by the Board of Directors at three levels – a threshold level, a target level, and a stretch level, subject to a positive or negative adjustment for the Company’s safety performance. Pursuant to these plans, the Company accrued incentive compensation expense of $3.0 million, $11.7 million, and $11.5 million for the years ended December 31, 2015, 2014, and 2013, respectively. We also have a Safety Incentive Plan related to Occupational Safety and Health Administration recordable incidents, for which we expensed and paid $0.9 million, $1.0 million, and $1.0 million for the years 2015, 2014, and 2013, respectively.
401(k) Plan
We sponsor a 401(k) Plan (“Plan”) for our employees. An employee is eligible to participate in the Plan immediately upon employment and receive a dollar matching contribution up to 6% of his or her base compensation. The vesting for matching contributions is 25% per year beginning at the end of the second year of employment. Employees are fully vested after completing five years of service to the Company. The matching contribution for the years ended December 31, 2015, 2014, and 2013 were $11.8 million, $11.5 million, and $10.5 million, respectively.
65
Table of Contents
| (11) | STOCK-BASED COMPENSATION |
Compensation expense for our stock-based plans was $5.8 million, $4.8 million, and $2.4 million for 2015, 2014, and 2013, respectively.
2012 Long-Term Incentive Plan – Under the PHI Long-Term Incentive Plan, as amended and restated in 2015 (“LTIP”), we are authorized to issue up to 1,500,000 shares of non-voting stock. As of December 31, 2015, 721,572 shares were available for grant. Time-vested restricted stock units granted under the plan generally have forfeiture restrictions that lapse 100% after three years. Performance-based restricted stock units that have been granted under the plan, whose vesting is contingent upon meeting company-wide performance goals, have forfeiture restrictions that lapse, if at all, at the end of a three-year performance period.
Non-Voting Time-Vested Restricted Stock Units – The following table summarizes the activity for non-voting time-vested restricted stock units granted to employees for the year ended December 31, 2015.
| Share Units | Weighted Average Grant-Date Fair Value |
Remaining Average Contractual Life (in years) |
Aggregate Value (in thousands) |
|||||||||||||
| Outstanding at January 1, 2015 |
191,655 | $ | 38.56 | 2.26 | $ | 7,391 | ||||||||||
|
|
|
|
|
|||||||||||||
| Granted |
35,456 | 30.17 | ||||||||||||||
| Forfeited |
(8,026 | ) | (22.81 | ) | ||||||||||||
| Vested and released to participants |
(37,610 | ) | (24.82 | ) | ||||||||||||
|
|
|
|
|
|||||||||||||
| Outstanding at December 31, 2015 |
181,475 | $ | 40.47 | 1.56 | $ | 7,344 | ||||||||||
|
|
|
|
|
|
|
|
|
|||||||||
The weighted average grant-date fair value of time-vested restricted stock units granted during 2015 and 2014 was $30.17 and $43.25 per share, respectively. The total fair value of awards that vested in 2015 was $0.9 million. The total fair value of awards that vested in 2014 was $0.3 million. The total fair value of awards forfeited in 2015 was $0.2 million. There were no forfeitures in 2014. As of December 31, 2015, there was $3.4 million that is expected to be recognized over a weighted average period of 1.56 years.
The following table summarizes the activity for non-voting time-vested restricted stock units granted to non-employee directors for the year ended December 31, 2015.
| Share Units | Weighted Average Grant-Date Fair Value |
Remaining Average Contractual Life (in years) |
Aggregate Value (in thousands) |
|||||||||||||
| Outstanding at January 1, 2015 |
4,488 | $ | 41.19 | 2.48 | $ | 185 | ||||||||||
|
|
|
|
|
|||||||||||||
| Granted |
4,317 | 21.42 | ||||||||||||||
| Forfeited |
— | — | ||||||||||||||
| Vested and released to participants |
— | — | ||||||||||||||
|
|
|
|
|
|||||||||||||
| Outstanding at December 31, 2015 |
8,805 | $ | 31.50 | 2.21 | $ | 277 | ||||||||||
|
|
|
|
|
|
|
|
|
|||||||||
66
Table of Contents
Non-Voting Performance-Based Restricted Stock Units – The following table summarizes the activity for non-voting performance-based restricted stock units for the year ended December 31, 2015.
| Share Units | Weighted Average Grant-Date Fair Value |
Remaining Average Contractual Life (in years) |
Aggregate Value (in thousands) |
|||||||||||||
| Outstanding at January 1, 2015 |
394,669 | $ | 30.07 | 1.78 | $ | 11,878 | ||||||||||
|
|
|
|
|
|||||||||||||
| Granted |
152,331 | 33.41 | ||||||||||||||
| Forfeited |
(10,758 | ) | (22.81 | ) | ||||||||||||
| Vested and released to participants |
(141,286 | ) | (23.04 | ) | ||||||||||||
|
|
|
|
|
|||||||||||||
| Outstanding at December 31, 2015 |
394,956 | $ | 34.07 | 1.83 | $ | 13,456 | ||||||||||
|
|
|
|
|
|
|
|
|
|||||||||
The aggregate value of the awards in the above table reflects the impact of current expectations of achievement through the end of the performance cycle. The weighted average grant-date fair value of performance based restricted stock units granted during 2015 was $33.41 per share. The total fair value of awards that vested in 2015 was $3.3 million. Total fair value of awards forfeited in 2015 was $0.2 million. As of December 31, 2015, there was a total of $7.4 million of unrecognized compensation cost related to the non-vested performance-based restricted stock units that is expected to be recognized over a weighted average period of 1.83 years.
| (12) | COMMITMENTS AND CONTINGENCIES |
Operating Leases
The Company leases certain aircraft, facilities, and equipment used in its operations. The related lease agreements, which include both non-cancelable and month-to-month terms, generally provide for fixed monthly rentals and, for certain real estate leases, renewal options. The Company generally pays all insurance, taxes, and maintenance expenses associated with these aircraft leases and some of these leases contain renewal and purchase options at fair market values. Rental expense incurred under these leases consisted of the following:
| Year Ended | Year Ended | Year Ended | ||||||||||
| December 31, | December 31, | December 31, | ||||||||||
| 2015 | 2014 | 2013 | ||||||||||
| (Thousands of dollars) | ||||||||||||
| Aircraft |
$ | 45,360 | $ | 44,908 | $ | 41,803 | ||||||
| Other |
8,358 | 7,790 | 7,657 | |||||||||
|
|
|
|
|
|
|
|||||||
| Total |
$ | 53,718 | $ | 52,698 | $ | 49,460 | ||||||
|
|
|
|
|
|
|
|||||||
Included in the above rental expense is $-0- million in 2015, $0.5 million in 2014, and $0.6 million in 2013 paid to GE Air, Inc. and Gonsoulin Enterprises, Inc. for the lease of aircraft and real estate. Each of GE Air, Inc. and Gonsoulin Enterprises, Inc. is owned by our Chairman, CEO and majority voting shareholder.
The following table presents the remaining aggregate lease commitments under operating leases having initial non-cancelable terms in excess of one year. The table includes renewal periods on the principal operating facility lease.
| Aircraft | Other | Total | ||||||||||
| (Thousands of dollars) | ||||||||||||
| 2016 |
$ | 44,988 | $ | 5,305 | $ | 50,293 | ||||||
| 2017 |
42,699 | 3,193 | 45,892 | |||||||||
| 2018 |
39,018 | 2,552 | 41,570 | |||||||||
| 2019 |
32,365 | 1,983 | 34,348 | |||||||||
| 2020 |
28,526 | 1,413 | 29,939 | |||||||||
| Thereafter |
89,604 | 745 | 90,349 | |||||||||
|
|
|
|
|
|
|
|||||||
| $ | 277,200 | $ | 15,191 | $ | 292,391 | |||||||
|
|
|
|
|
|
|
|||||||
67
Table of Contents
Purchase Options
In 2015, we purchased one heavy aircraft pursuant to a purchase option in the lease contract for an aggregate purchase price of $17.7 million using proceeds from the sale of short-term investments. As of December 31, 2015, we had options to purchase aircraft under lease becoming exercisable in 2016 through 2020 for the following aggregate purchase prices: $67.8 million in 2016, $55.7 million in 2017, $127.0 million in 2018, $150.4 million in 2019, and $22.7 million in 2020. Whether we exercise these options will depend upon several factors, including market conditions and our available cash at the respective exercise dates.
Guarantees
In the normal course of business with customers, vendors, and others, we provide guarantees, performance, and payment bonds pursuant to certain agreements. The aggregate amount of these guarantees and bonds at December 31, 2015 was $1.1 million.
Purchase Commitments
In 2014, we exercised an option to purchase six additional heavy aircraft for delivery in 2015 and 2016. In 2015, we executed an amendment to terminate the order of four of the heavy aircraft for delivery in 2016. We took delivery of one aircraft in 2015 and expect to take delivery of the final aircraft in the second quarter of 2016.
Total aircraft deposits of $3.6 million were included in Other Assets as of December 31, 2015. This amount represents deposits for aircraft purchase contracts and deposits on future lease buyout options. In the event the buyout options are not exercised, the deposits will be applied as lease payments.
Environmental Matters
We have recorded an aggregate estimated probable liability of $0.2 million as of December 31, 2015 for environmental response costs. We have conducted environmental surveys of our former Lafayette facility located at the Lafayette Regional Airport, which we vacated in 2001, and have determined that limited soil and groundwater contamination exists at two parcels of land at the former facility. We submitted an assessment report for both sites in 2003, updated it in 2006, and received approvals of our remediation plan from the Louisiana Department of Environmental Quality (“LDEQ”) and Louisiana Department of Natural Resources in 2010 and 2011, respectively. Since such time, we have installed groundwater monitoring wells at these sites and furnished periodic reports on contamination levels to the LDEQ. Pursuant to our agreement with the LDEQ, we were providing samples twice a year for both sites and plan to remove underground storage tanks under one of the sites later this year. In response to our request, LDEQ has approved annual sampling from 2015 to 2019, followed by reevaluation of the sampling frequency. Based upon our working relationships and agreements with the LDEQ and the results of our ongoing site monitoring, we believe, based on current circumstances, that our ultimate remediation costs for these sites will not be material to our consolidated financial position, results of operations, or cash flows.
Legal Matters
From time to time, we are involved in various legal actions incidental to our business, including actions relating to employee claims, actions relating to medical malpractice claims, various tax issues, grievance hearings before labor regulatory agencies, and miscellaneous third party tort actions. The outcome of these proceedings is not predictable. However, based on current circumstances, we do not believe that the ultimate resolution of these proceedings, after considering available defenses and any insurance coverage or indemnification rights, will have a material adverse effect on our financial position, results of operations or cash flows.
| (13) | BUSINESS SEGMENTS AND GEOGRAPHIC AREAS |
PHI is primarily a provider of helicopter services, including helicopter maintenance and repair services. The Company has used a combination of factors to identify its reportable segments as required by Accounting Standards Codification 280, “Segment Reporting.” The overriding determination of the
68
Table of Contents
Company’s segments is based on how the chief operating decision-maker of the Company, the Chairman of the Board and Chief Executive Officer, evaluates the Company’s results of operations. The underlying factors include customer bases, types of service, operational management, physical locations, and underlying economic characteristics of the types of work the Company performs.
A segment’s operating profit is its operating revenues less its direct expenses and selling, general and administrative expenses. Each segment has a portion of selling, general and administrative expenses that is charged directly to the segment and a portion that is allocated. Direct charges represent the vast majority of segment selling, general and administrative expenses. Allocated selling, general and administrative expenses is based primarily on total segment costs as a percentage of total operating costs.
The Oil and Gas segment provides helicopter services to oil and gas customers operating in the Gulf of Mexico and two foreign countries. The Air Medical segment provides helicopter services to hospitals and medical programs in several U.S. states, one foreign country, and individuals, in which case the Company is paid by either a commercial insurance company, federal or state agency, or the patient. The Technical Services segment provides helicopter repair and overhaul services for existing flight operations customers that own their own aircraft. Under this segment, the Company periodically provides flight services to governmental customers, including the Company’s agreement to operate six aircraft for the National Science Foundation in Antarctica. Under this segment, we also offer certain software as a service to our Oil and Gas customers.
Air Medical operations are headquartered in Phoenix, Arizona, where the Company maintains significant separate facilities and administrative staff dedicated to this segment. Those costs are charged directly to the Air Medical segment, resulting in a disproportionate share of selling, general and administrative expenses compared to the Company’s other reportable segments.
The customers, individually or considered as a group under common ownership, which accounted for greater than 10% of accounts receivable or 10% of operating revenues during the periods reflected were as follows:
| Accounts Receivable | Operating Revenues | |||||||||||||||||||
| December 31, | Years Ended December 31, | |||||||||||||||||||
| 2015 | 2014 | 2015 | 2014 | 2013 | ||||||||||||||||
| Oil and Gas segment: |
||||||||||||||||||||
| Customer A |
6 | % | 7 | % | 15 | % | 17 | % | 15 | % | ||||||||||
| Customer B |
9 | % | 12 | % | 11 | % | 13 | % | 13 | % | ||||||||||
| Air Medical & |
||||||||||||||||||||
| Technical Services segments: |
||||||||||||||||||||
| Customer C |
15 | % | 20 | % | 9 | % | 10 | % | 17 | % | ||||||||||
69
Table of Contents
The following table shows information about the profit or loss and assets of each of the Company’s reportable segments for the years ended December 31, 2015, 2014, and 2013. The information contains certain allocations, including allocations of depreciation, rents, insurance, and overhead expenses that the Company deems reasonable and appropriate for the evaluation of its results of operations. The Company does not allocate gains on dispositions of property and equipment, other income, interest expense, income taxes, and corporate selling, general, and administrative expenses to the segments. Where applicable, the tables present the unallocated amounts to reconcile the totals to the Company’s consolidated financial statements. Corporate assets are principally cash, short-term investments, other assets, and certain property and equipment.
| Year Ended December 31, | ||||||||||||
| 2015 | 2014 | 2013 | ||||||||||
| (Thousands of dollars) | ||||||||||||
| Segment operating revenues |
||||||||||||
| Oil and Gas |
$ | 459,611 | $ | 516,909 | $ | 489,055 | ||||||
| Air Medical |
312,775 | 300,212 | 277,884 | |||||||||
| Technical Services |
31,842 | 19,149 | 89,561 | |||||||||
|
|
|
|
|
|
|
|||||||
| Total operating revenues |
804,228 | 836,270 | 856,500 | |||||||||
|
|
|
|
|
|
|
|||||||
| Segment direct expenses |
||||||||||||
| Oil and Gas(1) |
411,757 | 411,679 | 393,251 | |||||||||
| Air Medical |
246,487 | 243,573 | 231,880 | |||||||||
| Technical Services |
29,112 | 14,851 | 88,221 | |||||||||
|
|
|
|
|
|
|
|||||||
| Total segment direct expenses |
687,356 | 670,103 | 713,352 | |||||||||
| Segment selling, general and administrative expenses |
||||||||||||
| Oil and Gas |
6,511 | 4,615 | 4,059 | |||||||||
| Air Medical(2) |
10,455 | 9,801 | 8,875 | |||||||||
| Technical Services |
805 | 157 | 1 | |||||||||
|
|
|
|
|
|
|
|||||||
| Total segment selling, general and administrative expenses |
17,771 | 14,573 | 12,935 | |||||||||
|
|
|
|
|
|
|
|||||||
| Total segment expenses |
705,127 | 684,676 | 726,287 | |||||||||
|
|
|
|
|
|
|
|||||||
| Net segment profit |
||||||||||||
| Oil and Gas |
41,343 | 100,615 | 91,745 | |||||||||
| Air Medical |
55,833 | 46,838 | 37,129 | |||||||||
| Technical Services |
1,925 | 4,141 | 1,339 | |||||||||
|
|
|
|
|
|
|
|||||||
| Total |
99,101 | 151,594 | 130,213 | |||||||||
| Other, net (3) |
1,872 | (10,539 | ) | 15,569 | ||||||||
| Unallocated selling, general and administrative expenses |
(28,651 | ) | (28,597 | ) | (26,207 | ) | ||||||
| Interest expense |
(29,066 | ) | (29,510 | ) | (29,434 | ) | ||||||
| Loss on debt extinguishment |
— | (29,833 | ) | — | ||||||||
|
|
|
|
|
|
|
|||||||
| Earnings before income taxes |
$ | 43,256 | $ | 53,115 | $ | 90,141 | ||||||
|
|
|
|
|
|
|
|||||||
| (1) | Includes equity in loss of unconsolidated affiliate. |
| (2) | Includes interest expense $0.3 million for the year ended December 31, 2013. |
| (3) | Includes gains on disposition of property and equipment and other income. |
70
Table of Contents
| Year Ended December 31, | ||||||||||||
| 2015 | 2014 | 2013 | ||||||||||
| (Thousands of dollars) | ||||||||||||
| Expenditures for long-lived assets |
||||||||||||
| Oil and Gas |
$ | 32,501 | $ | 119,235 | $ | 62,934 | ||||||
| Air Medical |
22,685 | 37,317 | 37,728 | |||||||||
| Corporate |
1,389 | 1,153 | 1,928 | |||||||||
|
|
|
|
|
|
|
|||||||
| Total |
$ | 56,575 | $ | 157,705 | $ | 102,590 | ||||||
|
|
|
|
|
|
|
|||||||
| Year Ended December 31, | ||||||||||||
| 2015 | 2014 | 2013 | ||||||||||
| (Thousands of dollars) | ||||||||||||
| Depreciation and Amortization |
||||||||||||
| Oil and Gas |
$ | 42,709 | $ | 29,635 | $ | 26,653 | ||||||
| Air Medical |
18,177 | 13,067 | 11,395 | |||||||||
| Technical Services |
518 | 493 | 172 | |||||||||
| Corporate |
10,214 | 7,653 | 4,628 | |||||||||
|
|
|
|
|
|
|
|||||||
| Total |
$ | 71,618 | $ | 50,848 | $ | 42,848 | ||||||
|
|
|
|
|
|
|
|||||||
| Assets |
||||||||||||
| Oil and Gas |
$ | 704,472 | $ | 726,008 | ||||||||
| Air Medical |
329,484 | 336,510 | ||||||||||
| Technical Services |
7,345 | 7,842 | ||||||||||
| Corporate |
389,031 | 305,720 | ||||||||||
|
|
|
|
|
|||||||||
| Total |
$ | 1,430,332 | $ | 1,376,080 | ||||||||
|
|
|
|
|
|||||||||
The following table presents the Company’s revenues from external customers attributed to operations in the United States and foreign areas and long-lived assets in the United States and foreign areas.
| As of or for Year Ended December 31, | ||||||||||||
| 2015 | 2014 | 2013 | ||||||||||
| (Thousands of dollars) | ||||||||||||
| Operating revenues: |
||||||||||||
| United States |
$ | 722,339 | $ | 747,063 | $ | 699,298 | ||||||
| International |
81,889 | 89,207 | 157,202 | |||||||||
|
|
|
|
|
|
|
|||||||
| Total |
$ | 804,228 | $ | 836,270 | $ | 856,500 | ||||||
|
|
|
|
|
|
|
|||||||
| Long-Lived Assets: |
||||||||||||
| United States |
$ | 773,939 | $ | 846,377 | ||||||||
| International |
109,590 | 31,441 | ||||||||||
|
|
|
|
|
|||||||||
| Total |
$ | 883,529 | $ | 877,818 | ||||||||
|
|
|
|
|
|||||||||
Certain of those foreign customers pay us less promptly and regularly than our domestic customers. To date, these payment delays and irregularities have not resulted in any material losses. Nonetheless, these payment delays and irregularities have, among other things, disrupted our cash flows and exposed us to greater risks of non-payment, and could in the future potentially have a material adverse effect upon our financial position, liquidity, business or results of operations. For additional information on the risks of operating internationally, see our risk factor disclosures contained in Item 1A of this Form 10-K.
71
Table of Contents
| (14) | QUARTERLY FINANCIAL DATA (UNAUDITED) |
The condensed quarterly results of operations for the years ended December 31, 2015 and 2014 (in thousands of dollars, except per share data) were as follows:
| Quarter Ended | ||||||||||||||||
| March 31, | June 30, | September 30, | December 31, | |||||||||||||
| 2015 | 2015 | 2015 | 2015 | |||||||||||||
| (Thousands of dollars, except per share data) | ||||||||||||||||
| Operating revenues |
$ | 204,197 | $ | 198,547 | $ | 214,733 | $ | 186,751 | ||||||||
| Gain (loss) on disposition of assets, net |
7 | 66 | 165 | (577 | ) | |||||||||||
| Earnings (loss) before income taxes |
16,984 | 11,044 | 14,290 | 938 | ||||||||||||
| Net earnings |
10,363 | 6,454 | 7,669 | 2,438 | ||||||||||||
| Net earnings per share |
||||||||||||||||
| Basic |
0.67 | 0.41 | 0.49 | 0.16 | ||||||||||||
| Diluted |
0.66 | 0.41 | 0.49 | 0.16 | ||||||||||||
| Quarter Ended | ||||||||||||||||
| March 31, | June 30, | September 30, | December 31, | |||||||||||||
| 2014 | 2014 | 2014 | 2014 | |||||||||||||
| (Thousands of dollars, except per share data) | ||||||||||||||||
| Operating revenues, net |
$ | 197,071 | $ | 212,145 | $ | 216,294 | $ | 210,760 | ||||||||
| Gain (loss) on disposition of assets, net |
(1,073 | ) | (242 | ) | (56 | ) | 523 | |||||||||
| Earnings (loss) before income taxes |
(8,513 | ) | 21,700 | 28,277 | 11,651 | |||||||||||
| Net earnings (loss) |
(5,321 | ) | 13,368 | 17,249 | 7,392 | |||||||||||
| Net earnings (loss) per share |
||||||||||||||||
| Basic |
(0.34 | ) | 0.86 | 1.11 | 0.48 | |||||||||||
| Diluted |
(0.34 | ) | 0.85 | 1.10 | 0.47 | |||||||||||
| (15) | VARIABLE INTEREST ENTITY |
We account for our West African operations as a variable interest entity, which is defined as an entity that either (a) has insufficient equity to permit the entity to finance its operations without additional subordinated financial support or (b) has equity investors who lack the characteristics of a controlling financial interest. As of December 31, 2015, we had a 49% investment in the common stock of PHI Century Limited (“PHIC”), a Ghanaian entity. We acquired our 49% interest on May 26, 2011, PHIC’s date of incorporation. The purpose of PHIC is to provide oil and gas flight services in Ghana and the West African region. For the year ended December 31, 2015, we recorded a loss in equity of unconsolidated affiliate of $0.3 million relative to our 49% equity ownership. We had $1.5 million of Trade receivables as of December 31, 2015 from PHIC. At December 31, 2015, we recorded an allowance for bad debts against this trade receivables of $1.5 million as we do not anticipate that we will be able to recover them, For the year ended December 31, 2014, we recorded earnings in equity of unconsolidated affiliate of $0.1 million relative to our 49% equity ownership. In addition, we had $2.8 million of Trade receivables and $0.9 million accrued liabilities as of December 31, 2014 from PHIC. Our investment in the common stock of PHIC is included in Other assets on our Condensed Consolidated Balance Sheet and was $-0- million at December 31, 2015 and December 31, 2014. Included in Operating revenues for the years ended December 31, 2015 and December 31, 2014 was $-0- million and $3.4 million of revenues from services provided to PHIC, respectively.
72
Table of Contents
| (16) | SUBSEQUENT EVENTS |
Following three earlier programs in 2015, in January, 2016, we implemented a fourth voluntary employee retirement program (“VERP”) offered to all pilots who have attained age 64. The employees have until February 28, 2016 to accept the offer. Our maximum severance cost exposure under this program is $3.1 million. We also implemented a voluntary furlough program to our oil and gas pilots whereby pilots who elect to participate in the program will receive severance pay and may continue their medical coverage at their current employee-paid premiums. The period for acceptance of the furlough ended on January 27, 2016. Twenty-six pilots accepted the offer with a total severance cost of $0.4 million. Under the terms of the furlough agreement, PHI may provide notice of recall to the employees back to full-time employment no later than November 17, 2016.
| (17) | CONDENSED CONSOLIDATING FINANCIAL INFORMATION – GUARANTOR SUBSIDIARIES |
Our 5.25% Senior Notes are fully and unconditionally guaranteed on a joint and several, senior basis by all of our domestic subsidiaries. All of our domestic subsidiaries are 100% owned.
The following supplemental condensed financial information sets forth, on a consolidated basis, the balance sheet, statement of operations, statement of comprehensive income, and statement of cash flows information for PHI, Inc. (“Parent Company Only”) and the guarantor subsidiaries. The eliminating entries eliminate investments in subsidiaries, intercompany balances, and intercompany revenues and expenses. The condensed consolidating financial statements have been prepared on the same basis as the consolidated financial statements of PHI, Inc. The equity method is followed by the parent company within these condensed consolidating financials.
The transactions reflected in “Due to/from affiliates, net” in the following condensed consolidated statements of cash flows primarily consist of centralized cash management activities between PHI, Inc. and its subsidiaries, pursuant to which cash earned by the guarantor subsidiaries is regularly transferred to PHI, Inc. to be centrally managed. Because these balances are treated as short-term borrowings of the Parent Company, serve as a financing and cash management tool to meet our short-term operating needs, are large, turn over quickly and are payable to the guarantor subsidiaries on demand, we present borrowings and repayments with our affiliates on a net basis within the condensed consolidating statement of cash flows. Net receivables from our affiliates are considered advances and net payables to our affiliates are considered borrowings, and both changes are presented as financing activities in the following condensed consolidating statements of cash flows.
73
Table of Contents
PHI, INC. AND SUBSIDIARIES
CONDENSED CONSOLIDATING BALANCE SHEETS
(Thousands of dollars)
| December 31, 2015 | ||||||||||||||||
| Parent | ||||||||||||||||
| Company | Guarantor | |||||||||||||||
| Only (issuer) | Subsidiaries (1) | Eliminations | Consolidated | |||||||||||||
| ASSETS | ||||||||||||||||
| Current Assets: |
||||||||||||||||
| Cash |
$ | 46 | $ | 2,361 | $ | — | $ | 2,407 | ||||||||
| Short-term investments |
284,523 | — | — | 284,523 | ||||||||||||
| Accounts receivable – net |
70,336 | 74,442 | — | 144,778 | ||||||||||||
| Intercompany receivable |
— | 90,943 | (90,943 | ) | — | |||||||||||
| Inventories of spare parts – net |
60,060 | 9,431 | — | 69,491 | ||||||||||||
| Prepaid expenses |
7,162 | 1,789 | — | 8,951 | ||||||||||||
| Deferred income taxes |
10,379 | — | — | 10,379 | ||||||||||||
| Income taxes receivable |
1,002 | (241 | ) | — | 761 | |||||||||||
|
|
|
|
|
|
|
|
|
|||||||||
| Total current assets |
433,508 | 178,725 | (90,943 | ) | 521,290 | |||||||||||
| Investment in subsidiaries |
330,848 | — | (330,848 | ) | — | |||||||||||
| Property and equipment, net |
632,759 | 250,770 | — | 883,529 | ||||||||||||
| Restricted investments |
15,336 | — | — | 15,336 | ||||||||||||
| Other assets |
9,974 | 203 | — | 10,177 | ||||||||||||
|
|
|
|
|
|
|
|
|
|||||||||
| Total assets |
$ | 1,422,425 | $ | 429,698 | $ | (421,791 | ) | $ | 1,430,332 | |||||||
|
|
|
|
|
|
|
|
|
|||||||||
| LIABILITIES AND SHAREHOLDERS’ EQUITY | ||||||||||||||||
| Current Liabilities: |
||||||||||||||||
| Accounts payable |
$ | 25,512 | $ | 5,861 | $ | — | $ | 31,373 | ||||||||
| Accrued liabilities |
29,138 | 15,621 | — | 44,759 | ||||||||||||
| Intercompany payable |
90,943 | — | (90,943 | ) | — | |||||||||||
|
|
|
|
|
|
|
|
|
|||||||||
| Total current liabilities |
145,593 | 21,482 | (90,943 | ) | 76,132 | |||||||||||
| Long-term debt |
557,500 | — | — | 557,500 | ||||||||||||
| Deferred income taxes and other long-term liabilities |
92,334 | 77,368 | — | 169,702 | ||||||||||||
| Shareholders’ Equity: |
||||||||||||||||
| Common stock and paid-in capital |
306,444 | 79,061 | (79,061 | ) | 306,444 | |||||||||||
| Accumulated other comprehensive loss |
(567 | ) | — | — | (567 | ) | ||||||||||
| Retained earnings |
321,121 | 251,787 | (251,787 | ) | 321,121 | |||||||||||
|
|
|
|
|
|
|
|
|
|||||||||
| Total shareholders’ equity |
626,998 | 330,848 | (330,848 | ) | 626,998 | |||||||||||
|
|
|
|
|
|
|
|
|
|||||||||
| Total liabilities and shareholders’ equity |
$ | 1,422,425 | $ | 429,698 | $ | (421,791 | ) | $ | 1,430,332 | |||||||
|
|
|
|
|
|
|
|
|
|||||||||
| (1) | Foreign subsidiaries represent minor subsidiaries and are included in the guarantor subsidiaries’ amounts. |
74
Table of Contents
PHI, INC. AND SUBSIDIARIES
CONDENSED CONSOLIDATING BALANCE SHEETS
(Thousands of dollars)
| December 31, 2014 | ||||||||||||||||
| Parent | ||||||||||||||||
| Company | Guarantor | |||||||||||||||
| Only (issuer) | Subsidiaries (1) | Eliminations | Consolidated | |||||||||||||
| ASSETS | ||||||||||||||||
| Current Assets: |
||||||||||||||||
| Cash |
$ | 51 | $ | 6,219 | $ | — | $ | 6,270 | ||||||||
| Short-term investments |
185,244 | — | — | 185,244 | ||||||||||||
| Accounts receivable – net |
98,001 | 82,760 | — | 180,761 | ||||||||||||
| Intercompany receivable |
— | 95,399 | (95,399 | ) | — | |||||||||||
| Inventories of spare parts – net |
65,341 | 8,452 | — | 73,793 | ||||||||||||
| Prepaid expenses |
7,610 | 1,704 | — | 9,314 | ||||||||||||
| Deferred income taxes |
9,915 | — | — | 9,915 | ||||||||||||
| Income taxes receivable |
1,068 | 159 | — | 1,227 | ||||||||||||
|
|
|
|
|
|
|
|
|
|||||||||
| Total current assets |
367,230 | 194,693 | (95,399 | ) | 466,524 | |||||||||||
| Investment in subsidiaries and others |
358,080 | — | (358,080 | ) | — | |||||||||||
| Property and equipment, net |
638,437 | 239,381 | — | 877,818 | ||||||||||||
| Restricted investments |
15,485 | — | — | 15,485 | ||||||||||||
| Other assets |
16,055 | 198 | — | 16,253 | ||||||||||||
|
|
|
|
|
|
|
|
|
|||||||||
| Total assets |
$ | 1,395,287 | $ | 434,272 | $ | (453,479 | ) | $ | 1,376,080 | |||||||
|
|
|
|
|
|
|
|
|
|||||||||
| LIABILITIES AND SHAREHOLDERS’ EQUITY | ||||||||||||||||
| Current Liabilities: |
||||||||||||||||
| Accounts payable |
$ | 22,578 | $ | 5,122 | $ | — | $ | 27,700 | ||||||||
| Accrued and other current liabilities |
34,477 | 18,335 | — | 52,812 | ||||||||||||
| Intercompany payable |
95,270 | — | (95,270 | ) | — | |||||||||||
|
|
|
|
|
|
|
|
|
|||||||||
| Total current liabilities |
152,325 | 23,457 | (95,270 | ) | 80,512 | |||||||||||
| Long-term debt |
543,000 | — | — | 543,000 | ||||||||||||
| Deferred income taxes and other long-term liabilities |
102,894 | 52,606 | — | 155,500 | ||||||||||||
| Shareholders’ Equity: |
||||||||||||||||
| Common stock and paid-in capital |
303,082 | 137,647 | (137,647 | ) | 303,082 | |||||||||||
| Accumulated other comprehensive loss |
(211 | ) | — | — | (211 | ) | ||||||||||
| Retained earnings |
294,197 | 220,562 | (220,562 | ) | 294,197 | |||||||||||
|
|
|
|
|
|
|
|
|
|||||||||
| Total shareholders’ equity |
597,068 | 358,209 | (358,209 | ) | 597,068 | |||||||||||
|
|
|
|
|
|
|
|
|
|||||||||
| Total liabilities and shareholders’ equity |
$ | 1,395,287 | $ | 434,272 | $ | (453,479 | ) | $ | 1,376,080 | |||||||
|
|
|
|
|
|
|
|
|
|||||||||
| (1) | Foreign subsidiaries represent minor subsidiaries and are included in the guarantor subsidiaries’ amounts. |
75
Table of Contents
PHI, INC. AND SUBSIDIARIES
CONDENSED CONSOLIDATING STATEMENTS OF OPERATIONS
(Thousands of dollars)
| For the year ended December 31, 2015 | ||||||||||||||||
| Parent | ||||||||||||||||
| Company | Guarantor | |||||||||||||||
| Only (issuer) | Subsidiaries (1) | Eliminations | Consolidated | |||||||||||||
| Operating revenues, net |
$ | 476,969 | $ | 327,259 | $ | — | $ | 804,228 | ||||||||
| Expenses: |
||||||||||||||||
| Direct expenses |
426,239 | 260,829 | (18 | ) | 687,050 | |||||||||||
| Selling, general, and administrative expenses |
35,694 | 10,728 | — | 46,422 | ||||||||||||
|
|
|
|
|
|
|
|
|
|||||||||
| Total operating expenses |
461,933 | 271,557 | (18 | ) | 733,472 | |||||||||||
| Loss on disposition of assets, net |
339 | — | — | 339 | ||||||||||||
| Equity in loss of unconsolidated affiliate |
306 | — | — | 306 | ||||||||||||
|
|
|
|
|
|
|
|
|
|||||||||
| Operating income |
14,391 | 55,702 | 18 | 70,111 | ||||||||||||
| Equity in net earnings of consolidated subsidiaries |
(31,225 | ) | — | 31,225 | — | |||||||||||
| Interest expense |
28,946 | 120 | — | 29,066 | ||||||||||||
| Other income, net |
(2,222 | ) | (7 | ) | 18 | (2,211 | ) | |||||||||
|
|
|
|
|
|
|
|
|
|||||||||
| (4,501 | ) | 113 | 31,243 | 26,855 | ||||||||||||
|
|
|
|
|
|
|
|
|
|||||||||
| Earnings before income taxes |
18,992 | 55,589 | (31,225 | ) | 43,256 | |||||||||||
| Income tax expense |
(8,032 | ) | 24,364 | — | 16,332 | |||||||||||
|
|
|
|
|
|
|
|
|
|||||||||
| Net earnings |
$ | 26,924 | $ | 31,225 | $ | (31,225 | ) | $ | 26,924 | |||||||
|
|
|
|
|
|
|
|
|
|||||||||
| (1) | Foreign subsidiaries represent minor subsidiaries and are included in the guarantor subsidiaries’ amounts. |
76
Table of Contents
PHI, INC. AND SUBSIDIARIES
CONDENSED CONSOLIDATING STATEMENTS OF OPERATIONS
(Thousands of dollars)
| For the year ended December 31, 2014 | ||||||||||||||||
| Parent | ||||||||||||||||
| Company | Guarantor | |||||||||||||||
| Only (issuer) | Subsidiaries (1) | Eliminations | Consolidated | |||||||||||||
| Operating revenues, net |
$ | 504,180 | $ | 332,090 | $ | — | $ | 836,270 | ||||||||
| Expenses: |
||||||||||||||||
| Direct expenses |
411,398 | 258,627 | (18 | ) | 670,007 | |||||||||||
| Selling, general, and administrative expenses |
32,985 | 10,186 | — | 43,171 | ||||||||||||
|
|
|
|
|
|
|
|
|
|||||||||
| Total operating expenses |
444,383 | 268,813 | (18 | ) | 713,178 | |||||||||||
| Loss on disposition of assets, net |
848 | — | — | 848 | ||||||||||||
| Impairment of assets |
10,508 | — | — | 10,508 | ||||||||||||
| Equity in loss of unconsolidated affiliate |
96 | — | — | 96 | ||||||||||||
|
|
|
|
|
|
|
|
|
|||||||||
| Operating income |
48,345 | 63,277 | 18 | 111,640 | ||||||||||||
| Equity in net earnings of consolidated subsidiaries |
(38,740 | ) | — | 38,740 | — | |||||||||||
| Interest expense |
29,510 | — | — | 29,510 | ||||||||||||
| Loss on debt extinguishment |
29,833 | — | — | 29,833 | ||||||||||||
| Other (income) expense, net |
(819 | ) | (17 | ) | 18 | (818 | ) | |||||||||
|
|
|
|
|
|
|
|
|
|||||||||
| 19,784 | (17 | ) | 38,758 | 58,525 | ||||||||||||
|
|
|
|
|
|
|
|
|
|||||||||
| Earnings before income taxes |
28,561 | 63,294 | (38,740 | ) | 53,115 | |||||||||||
| Income tax (benefit) expense |
(4,127 | ) | 24,554 | — | 20,427 | |||||||||||
|
|
|
|
|
|
|
|
|
|||||||||
| Net earnings |
$ | 32,688 | $ | 38,740 | $ | (38,740 | ) | $ | 32,688 | |||||||
|
|
|
|
|
|
|
|
|
|||||||||
| For the year ended December 31, 2013 | ||||||||||||||||
| Parent | ||||||||||||||||
| Company | Guarantor | |||||||||||||||
| Only (issuer) | Subsidiaries (1) | Eliminations | Consolidated | |||||||||||||
| Operating revenues, net |
$ | 564,445 | $ | 292,055 | $ | — | $ | 856,500 | ||||||||
| Expenses: |
||||||||||||||||
| Direct expenses |
468,321 | 244,769 | — | 713,090 | ||||||||||||
| Selling, general, and administrative expenses |
29,885 | 8,935 | — | 38,820 | ||||||||||||
| Management fees |
(11,682 | ) | 11,682 | — | — | |||||||||||
|
|
|
|
|
|
|
|
|
|||||||||
| Total operating expenses |
486,524 | 265,386 | — | 751,910 | ||||||||||||
| (Gain) on disposition of assets, net |
(16,585 | ) | (19 | ) | — | (16,604 | ) | |||||||||
| Impairment of assets |
1,227 | 421 | — | 1,648 | ||||||||||||
| Equity in loss of unconsolidated affiliate |
262 | — | — | 262 | ||||||||||||
|
|
|
|
|
|
|
|
|
|||||||||
| Operating income |
93,017 | 26,267 | — | 119,284 | ||||||||||||
| Equity in net earnings of consolidated subsidiaries |
(15,567 | ) | — | 15,567 | — | |||||||||||
| Interest expense |
29,434 | 322 | — | 29,756 | ||||||||||||
| Other income, net |
(613 | ) | — | — | (613 | ) | ||||||||||
|
|
|
|
|
|
|
|
|
|||||||||
| 13,254 | 322 | 15,567 | 29,143 | |||||||||||||
|
|
|
|
|
|
|
|
|
|||||||||
| Earnings before income taxes |
79,763 | 25,945 | (15,567 | ) | 90,141 | |||||||||||
| Income tax expense |
20,807 | 10,378 | — | 31,185 | ||||||||||||
|
|
|
|
|
|
|
|
|
|||||||||
| Net earnings |
$ | 58,956 | $ | 15,567 | $ | (15,567 | ) | $ | 58,956 | |||||||
|
|
|
|
|
|
|
|
|
|||||||||
| (1) | Foreign subsidiaries represent minor subsidiaries and are included in the guarantor subsidiaries’ amounts. |
77
Table of Contents
PHI, INC. AND SUBSIDIARIES
CONDENSED CONSOLIDATING STATEMENTS OF COMPREHENSIVE INCOME
(Thousands of dollars)
| For the year ended December 31, 2015 | ||||||||||||||||
| Parent | ||||||||||||||||
| Company | Guarantor | |||||||||||||||
| Only | Subsidiaries (1) | Eliminations | Consolidated | |||||||||||||
| Net earnings |
$ | 26,924 | $ | 31,225 | $ | (31,225 | ) | $ | 26,924 | |||||||
| Unrealized gain (loss) on short-term investments |
(641 | ) | — | — | (641 | ) | ||||||||||
| Other unrealized gain (loss) |
24 | — | — | 24 | ||||||||||||
| Changes in pension plan assets and benefit obligations |
7 | — | — | 7 | ||||||||||||
| Tax impact |
254 | — | — | 254 | ||||||||||||
|
|
|
|
|
|
|
|
|
|||||||||
| $ | 26,568 | $ | 31,225 | $ | (31,225 | ) | $ | 26,568 | ||||||||
|
|
|
|
|
|
|
|
|
|||||||||
| For the year ended December 31, 2014 | ||||||||||||||||
| Parent | ||||||||||||||||
| Company | Guarantor | |||||||||||||||
| Only | Subsidiaries (1) | Eliminations | Consolidated | |||||||||||||
| Net earnings |
$ | 32,688 | $ | 38,740 | $ | (38,740 | ) | $ | 32,688 | |||||||
| Unrealized gain (loss) on short-term investments |
(285 | ) | — | — | (285 | ) | ||||||||||
| Other unrealized gain (loss) |
(24 | ) | — | — | (24 | ) | ||||||||||
| Changes in pension plan assets and benefit obligations |
17 | — | — | 17 | ||||||||||||
| Tax impact |
105 | — | — | 105 | ||||||||||||
|
|
|
|
|
|
|
|
|
|||||||||
| $ | 32,501 | $ | 38,740 | $ | (38,740 | ) | $ | 32,501 | ||||||||
|
|
|
|
|
|
|
|
|
|||||||||
| For the year ended December 31, 2013 | ||||||||||||||||
| Parent | ||||||||||||||||
| Company | Guarantor | |||||||||||||||
| Only | Subsidiaries (1) | Eliminations | Consolidated | |||||||||||||
| Net earnings |
$ | 58,956 | $ | 15,567 | $ | (15,567 | ) | $ | 58,956 | |||||||
| Unrealized gain (loss) on short-term investments |
44 | — | — | 44 | ||||||||||||
| Changes in pension plan assets and benefit obligations |
(2 | ) | — | — | (2 | ) | ||||||||||
| Tax impact |
(15 | ) | — | — | (15 | ) | ||||||||||
|
|
|
|
|
|
|
|
|
|||||||||
| $ | 58,983 | $ | 15,567 | $ | (15,567 | ) | $ | 58,983 | ||||||||
|
|
|
|
|
|
|
|
|
|||||||||
| (1) | Foreign subsidiaries represent minor subsidiaries and are included in the guarantor subsidiaries’ amounts. |
78
Table of Contents
PHI, INC. AND SUBSIDIARIES
CONDENSED CONSOLIDATING STATEMENTS OF CASH FLOWS
(Thousands of dollars)
| For the year ended December 31, 2015 | ||||||||||||||||
| Parent | ||||||||||||||||
| Company | Guarantor | |||||||||||||||
| Only (issuer) | Subsidiaries (1) | Eliminations | Consolidated | |||||||||||||
| Net cash provided by operating activities |
$ | 60,241 | $ | 73,677 | $ | — | $ | 133,918 | ||||||||
| Investing activities: |
||||||||||||||||
| Purchase of property and equipment |
(57,123 | ) | — | — | (57,123 | ) | ||||||||||
| Proceeds from asset dispositions |
5,236 | — | — | 5,236 | ||||||||||||
| Purchase of short-term investments |
(608,649 | ) | — | — | (608,649 | ) | ||||||||||
| Proceeds from sale of short-term investments |
505,966 | — | — | 505,966 | ||||||||||||
| Payments of deposits on aircraft |
(1,273 | ) | — | — | (1,273 | ) | ||||||||||
| Refunds on deposits on aircraft |
6,010 | — | — | 6,010 | ||||||||||||
|
|
|
|
|
|
|
|
|
|||||||||
| Net cash used in investing activities |
(149,833 | ) | — | — | (149,833 | ) | ||||||||||
|
|
|
|
|
|
|
|
|
|||||||||
| Financing activities: |
||||||||||||||||
| Repurchase of common stock |
(2,448 | ) | (2,448 | ) | ||||||||||||
| Proceeds on line of credit |
232,660 | — | — | 232,660 | ||||||||||||
| Payments on line of credit |
(218,160 | ) | — | — | (218,160 | ) | ||||||||||
| Due to/from affiliate, net |
77,535 | (77,535 | ) | — | — | |||||||||||
|
|
|
|
|
|
|
|
|
|||||||||
| Net cash provided by financing activities |
89,587 | (77,535 | ) | — | 12,052 | |||||||||||
|
|
|
|
|
|
|
|
|
|||||||||
| Decrease in cash |
(5 | ) | (3,858 | ) | — | (3,863 | ) | |||||||||
| Cash, beginning of year |
51 | 6,219 | — | 6,270 | ||||||||||||
|
|
|
|
|
|
|
|
|
|||||||||
| Cash, end of year |
$ | 46 | $ | 2,361 | $ | — | $ | 2,407 | ||||||||
|
|
|
|
|
|
|
|
|
|||||||||
| (1) | Foreign subsidiaries represent minor subsidiaries and are included in the guarantor subsidiaries’ amounts. |
79
Table of Contents
PHI, INC. AND SUBSIDIARIES
CONDENSED CONSOLIDATING STATEMENTS OF CASH FLOWS
(Thousands of dollars)
| For the year ended December 31, 2014 | ||||||||||||||||
| Parent | ||||||||||||||||
| Company | Guarantor | |||||||||||||||
| Only (issuer) | Subsidiaries (1) | Eliminations | Consolidated | |||||||||||||
| Net cash provided by operating activities |
$ | 51,476 | $ | 68,043 | $ | — | $ | 119,519 | ||||||||
| Investing activities: |
||||||||||||||||
| Purchase of property and equipment |
(157,690 | ) | — | — | (157,690 | ) | ||||||||||
| Proceeds from asset dispositions |
10,266 | — | — | 10,266 | ||||||||||||
| Purchase of short-term investments |
(465,094 | ) | — | — | (465,094 | ) | ||||||||||
| Proceeds from sale of short-term investments |
363,110 | — | — | 363,110 | ||||||||||||
| Refund of deposits on aircraft |
11,506 | — | — | 11,506 | ||||||||||||
| Payments of deposits on aircraft |
(6,948 | ) | — | — | (6,948 | ) | ||||||||||
| Loan to unconsolidated affiliate |
(200 | ) | — | — | (200 | ) | ||||||||||
|
|
|
|
|
|
|
|
|
|||||||||
| Net cash used in investing activities |
(245,050 | ) | — | — | (245,050 | ) | ||||||||||
|
|
|
|
|
|
|
|
|
|||||||||
| Financing activities: |
||||||||||||||||
| Proceeds from issuance of Senior Notes due 2019 |
500,000 | — | — | 500,000 | ||||||||||||
| Repayment of Senior Notes due 2018 |
(300,000 | ) | — | — | (300,000 | ) | ||||||||||
| Premium and cost to retire debt early |
(26,749 | ) | — | — | (26,749 | ) | ||||||||||
| Debt issuance costs |
(6,232 | ) | — | — | (6,232 | ) | ||||||||||
| Proceeds from line of credit |
264,253 | — | — | 264,253 | ||||||||||||
| Payments on line of credit |
(300,253 | ) | — | — | (300,253 | ) | ||||||||||
| Repurchase of common stock |
(152 | ) | — | — | (152 | ) | ||||||||||
| Due to/from affiliate, net |
62,706 | (62,706 | ) | — | — | |||||||||||
|
|
|
|
|
|
|
|
|
|||||||||
| Net cash provided by financing activities |
193,573 | (62,706 | ) | — | 130,867 | |||||||||||
|
|
|
|
|
|
|
|
|
|||||||||
| (Decrease) increase in cash |
(1 | ) | 5,337 | — | 5,336 | |||||||||||
| Cash, beginning of year |
52 | 882 | — | 934 | ||||||||||||
|
|
|
|
|
|
|
|
|
|||||||||
| Cash, end of year |
$ | 51 | $ | 6,219 | $ | — | $ | 6,270 | ||||||||
|
|
|
|
|
|
|
|
|
|||||||||
| (1) | Foreign subsidiaries represent minor subsidiaries and are included in the guarantor subsidiaries’ amounts. |
80
Table of Contents
PHI, INC. AND SUBSIDIARIES
CONDENSED CONSOLIDATING STATEMENTS OF CASH FLOWS
(Thousands of dollars)
| For the year ended December 31, 2013 | ||||||||||||||||
| Parent | ||||||||||||||||
| Company | Guarantor | |||||||||||||||
| Only (issuer) | Subsidiaries (1) (2) | Eliminations | Consolidated | |||||||||||||
| Net cash provided by operating activities |
$ | 82,660 | $ | 22,436 | $ | — | $ | 105,096 | ||||||||
| Investing activities: |
||||||||||||||||
| Purchase of property and equipment |
(102,726 | ) | — | — | (102,726 | ) | ||||||||||
| Proceeds from asset dispositions |
42,197 | — | — | 42,197 | ||||||||||||
| Purchase of short-term investments |
(375,503 | ) | — | — | (375,503 | ) | ||||||||||
| Proceeds from sale of short-term investments |
338,970 | — | — | 338,970 | ||||||||||||
| Payments of deposits on aircraft |
(9,318 | ) | — | — | (9,318 | ) | ||||||||||
| Refunds on deposits on aircraft |
8,161 | — | — | 8,161 | ||||||||||||
|
|
|
|
|
|
|
|
|
|||||||||
| Net cash used in investing activities |
(98,219 | ) | — | — | (98,219 | ) | ||||||||||
|
|
|
|
|
|
|
|
|
|||||||||
| Financing activities: |
||||||||||||||||
| Repurchase of common stock |
(1,037 | ) | (1,037 | ) | ||||||||||||
| Proceeds on line of credit |
164,771 | — | — | 164,771 | ||||||||||||
| Payments on line of credit |
(172,526 | ) | — | — | (172,526 | ) | ||||||||||
| Due to/from affiliate, net |
23,851 | (23,851 | ) | — | — | |||||||||||
|
|
|
|
|
|
|
|
|
|||||||||
| Net cash provided by financing activities |
15,059 | (23,851 | ) | — | (8,792 | ) | ||||||||||
|
|
|
|
|
|
|
|
|
|||||||||
| Decrease in cash |
(500 | ) | (1,415 | ) | — | (1,915 | ) | |||||||||
| Cash, beginning of year |
552 | 2,297 | — | 2,849 | ||||||||||||
|
|
|
|
|
|
|
|
|
|||||||||
| Cash, end of year |
$ | 52 | $ | 882 | $ | — | $ | 934 | ||||||||
|
|
|
|
|
|
|
|
|
|||||||||
| (1) | Foreign subsidiaries represent minor subsidiaries and are included in the guarantor subsidiaries’ amounts. |
| (2) | Cash flows between the Parent Company and guarantor subsidiaries related to the Company’s centralized cash management activities in 2013 have been adjusted to show the effects on net cash provided by operating and financing activities. |
81
Table of Contents
| ITEM 9. | CHANGES IN AND DISAGREEMENTS WITH ACCOUNTANTS ON ACCOUNTING AND FINANCIAL DISCLOSURE |
None.
| ITEM 9A. | CONTROLS AND PROCEDURES |
Disclosure Controls and Procedures
The effectiveness of our or any system of disclosure controls and procedures is subject to certain limitations, including the exercise of judgment in designing, implementing and evaluating the controls and procedures, the assumptions used in identifying the likelihood of future events and the inability to eliminate misconduct completely. As a result, there can be no assurance that our disclosure controls and procedures will detect all errors or fraud. By their nature, our or any system of disclosure controls and procedures can provide only reasonable assurance regarding management’s control objectives.
The Company’s management, with the participation of our Chief Executive Officer and Chief Financial Officer, has evaluated the effectiveness of our disclosure controls and procedures (as defined in Rules 13a-15(e) and 15d-15(e) under the Exchange Act ) as of the end of the period covered by this report. Based on this evaluation, our Chief Executive Officer and Chief Financial Officer have concluded that the design and operation of our disclosure controls and procedures were effective as of such date to provide assurance that information required to be disclosed by the Company in the reports that it files or submits under the Exchange Act is recorded, processed, summarized and reported within the time periods specified in the rules and forms of the SEC, and that such information is accumulated and communicated to management, including our Chief Executive Officer and Chief Financial Officer, as appropriate to allow timely decisions regarding disclosure.
Changes in Internal Control over Financial Reporting
During the last quarter of 2015, there were no changes in our internal control over financial reporting that have materially affected, or are reasonably likely to materially affect, the Company’s internal control over financial reporting.
Management’s Annual Report on Internal Control over Financial Reporting
Our management is responsible for establishing and maintaining adequate internal control over financial reporting as defined in Rules 13a-15(f) and 15d-15(f) under the Exchange Act. Our internal control system was designed to provide reasonable assurance regarding the reliability of financial reporting and preparation of financial statements for external purposes in accordance with generally accepted accounting principles.
Our management assessed the effectiveness of our internal control over financial reporting as of December 31, 2015. In making this assessment, we used the criteria established in Internal Control—Integrated Framework issued by the Committee of Sponsoring Organizations of the Treadway Commission in 2013. Based on this assessment our management concluded that, as of December 31, 2015, our internal control over financial reporting was effective under those criteria.
Deloitte & Touche LLP, our independent registered public accounting firm, has issued a report on the Company’s internal control over financial reporting as of December 31, 2015. This report is included herein.
82
Table of Contents
REPORT OF INDEPENDENT REGISTERED PUBLIC ACCOUNTING FIRM
To the Board of Directors and Shareholders of
PHI, Inc.
Lafayette, Louisiana
We have audited the Internal Control over Financial Reporting of PHI, Inc. and subsidiaries (the “Company”) as of December 31, 2015, based on criteria established in Internal Control—Integrated Framework (2013) issued by the Committee of Sponsoring Organizations of the Treadway Commission. The Company’s management is responsible for maintaining effective internal control over financial reporting and for its assessment of the effectiveness of internal control over financial reporting, included in the accompanying Management’s Annual Report on Internal Control over Financial Reporting. Our responsibility is to express an opinion on the Company’s internal control over financial reporting based on our audit.
We conducted our audit in accordance with the standards of the Public Company Accounting Oversight Board (United States). Those standards require that we plan and perform the audit to obtain reasonable assurance about whether effective internal control over financial reporting was maintained in all material respects. Our audit included obtaining an understanding of internal control over financial reporting, assessing the risk that a material weakness exists, testing and evaluating the design and operating effectiveness of internal control based on the assessed risk, and performing such other procedures as we considered necessary in the circumstances. We believe that our audit provides a reasonable basis for our opinion.
A company’s internal control over financial reporting is a process designed by, or under the supervision of, the company’s principal executive and principal financial officers, or persons performing similar functions, and effected by the company’s board of directors, management, and other personnel to provide reasonable assurance regarding the reliability of financial reporting and the preparation of financial statements for external purposes in accordance with generally accepted accounting principles. A company’s internal control over financial reporting includes those policies and procedures that (1) pertain to the maintenance of records that, in reasonable detail, accurately and fairly reflect the transactions and dispositions of the assets of the company; (2) provide reasonable assurance that transactions are recorded as necessary to permit preparation of financial statements in accordance with generally accepted accounting principles, and that receipts and expenditures of the company are being made only in accordance with authorizations of management and directors of the company; and (3) provide reasonable assurance regarding prevention or timely detection of unauthorized acquisition, use, or disposition of the company’s assets that could have a material effect on the financial statements.
Because of the inherent limitations of internal control over financial reporting, including the possibility of collusion or improper management override of controls, material misstatements due to error or fraud may not be prevented or detected on a timely basis. Also, projections of any evaluation of the effectiveness of the internal control over financial reporting to future periods are subject to the risk that the controls may become inadequate because of changes in conditions, or that the degree of compliance with the policies or procedures may deteriorate.
In our opinion, the Company maintained, in all material respects, effective internal control over financial reporting as of December 31, 2015, based on the criteria established in Internal Control—Integrated Framework (2013) issued by the Committee of Sponsoring Organizations of the Treadway Commission.
We have also audited, in accordance with the standards of the Public Company Accounting Oversight Board (United States), the consolidated financial statements and financial statement schedule as of and for the year ended December 31, 2015 of the Company and our report dated February 29, 2016, expressed an unqualified opinion on those consolidated financial statements and financial statement schedule.
/s/ DELOITTE & TOUCHE LLP
New Orleans, Louisiana
February 29, 2016
83
Table of Contents
| ITEM 9B. | OTHER INFORMATION |
Not Applicable.
| ITEM 10. | DIRECTORS, EXECUTIVE OFFICERS AND CORPORATE GOVERNANCE |
We have adopted a Code of Ethics and Business Conduct Policy that applies to all our employees and is available on our website at phihelico.com. Any substantive amendments to the Code, or any waivers granted for any directors or executive officers, including our principal executive officer, principal financial officer, principal accounting officer or controller, will be disclosed on our website and remain available there for at least 12 months.
Other information concerning directors, executive officers, and corporate governance required by this item will be included in our definitive information statement furnished in connection with our 2016 Annual Meeting of Shareholders and is incorporated herein by reference.
| ITEM 11. | EXECUTIVE COMPENSATION |
Information required by this item will be included in our definitive information statement furnished in connection with our 2016 Annual Meeting of Shareholders and is incorporated herein by reference.
| ITEM 12. | SECURITY OWNERSHIP OF CERTAIN BENEFICIAL OWNERS AND MANAGEMENT AND RELATED STOCKHOLDER MATTERS |
Information required by this item will be included in our definitive information statement furnished in connection with our 2016 Annual Meeting of Shareholders and is incorporated herein by reference.
| ITEM 13. | CERTAIN RELATIONSHIPS AND RELATED TRANSACTIONS AND DIRECTOR INDEPENDENCE |
Information required by this item will be included in our definitive information statement furnished in connection with our 2016 Annual Meeting of Shareholders and is incorporated herein by reference.
| ITEM 14. | PRINCIPAL ACCOUNTING FEES AND SERVICES |
Information required by this item will be included in our definitive information statement furnished in connection with our 2016 Annual Meeting of Shareholders and is incorporated herein by reference.
84
Table of Contents
| ITEM 15. | EXHIBITS AND FINANCIAL STATEMENT SCHEDULES |
| Page | ||||||||
| 1. |
Financial Statements |
| ||||||
| Included in Part II of this report: | ||||||||
| 46 | ||||||||
| Consolidated Balance Sheets – December 31, 2015 and December 31, 2014. |
47 | |||||||
| 48 | ||||||||
| 49 | ||||||||
| 50 | ||||||||
| 51 | ||||||||
| 52 | ||||||||
| 2. |
Financial Statement Schedules |
| ||||||
| 88 | ||||||||
| 3. | Exhibits | |||||
| 3.1 | (i) | Amended and Restated Articles of Incorporation of the Company (incorporated by reference to Exhibit No. 3.1(i) to PHI’s Report on Form 10-Q for the quarterly period ended March 31, 2015, filed May 7, 2015). | ||||
| (ii) | Amended and Restated By-laws of the Company (incorporated by reference to Exhibit 3(ii) to PHI’s Report on Form 10-Q for the quarterly period ended September 30, 2015, filed November 6, 2015). | |||||
| 4.1 | Second Amended and Restated Loan Agreement dated as of September 18, 2013, by and among PHI, Inc., PHI Air Medical, L.L.C., successor to Air Evac Services, Inc., PHI Tech Services, Inc. (formerly Evangeline Airmotive, Inc.), and International Helicopter Transport, Inc. and Whitney National Bank (incorporated by reference to Exhibit 4.1 to PHI’s Report on Form 10-Q for the quarterly period ended September 30, 2013, filed November 8, 2013). | |||||
| 4.2 | First Amendment to Second Amended and Restated Loan Agreement, dated as of March 5, 2014, by and among PHI, Inc., PHI Air Medical, L.L.C., PHI Tech Services, Inc., International Helicopter Transport, Inc. and Whitney National Bank (incorporated by reference to Exhibit 4.1 to PHI’s Report on Form 8-K filed March 6, 2014). | |||||
| 4.3 | Second Amendment to Second Amended and Restated Loan Agreement, dated as of September 26, 2014, by and among PHI, Inc., PHI Air Medical, L.L.C., PHI Tech Services, Inc., International Helicopter Transport, Inc. and Whitney National Bank (incorporated by reference to Exhibit 4.3 to PHI’s Report on Form 10-Q for the quarterly period ended September 30, 2014, filed November 7, 2014). | |||||
| 4.4 | Third Amendment to Second Amended and Restated Loan Agreement, dated as of September 25, 2015, by and among PHI, Inc., PHI Air Medical, L.L.C., PHI Tech Services, Inc., International Helicopter Transport, Inc. and Whitney National Bank (incorporated by reference to Exhibit 4.4 to PHI’s Report on Form 10-Q for the quarterly period ended September 30, 2015, filed November 6, 2015). | |||||
85
Table of Contents
| 4.5 | Indenture, dated as of March 17, 2014, by and among PHI, Inc., the subsidiary guarantors and U.S. Bank National Association, relating to the issuance by PHI, Inc. of its 5.25% Senior Notes due 2019 (incorporated by reference to Exhibit 4.2 to PHI’s Report on Form 8-K filed March 17, 2014). | |||||
| 4.6 | Form of 5.25% Senior Note due 2019 (incorporated by reference to Exhibit 4.2 to PHI’s Report on Form 8-K filed on March 6, 2014). | |||||
| 10.1† | Senior Management Incentive Bonus Plan (incorporated by reference to Exhibit 10.3 to PHI’s Report on Form 10-Q for the quarterly period ended March 31, 2011, filed May 9, 2011). | |||||
| 10.2† | Officer Deferred Compensation Plan II adopted by PHI’s Board effective January 1, 2005 (incorporated by reference to Exhibit 10.5 to PHI’s Report on Form 10-K for the year ended December 31, 2006, filed March 16, 2007). | |||||
| 10.3† | Form of Indemnity Agreement dated November 5, 2015 between PHI, Inc. and each of its directors (incorporated by reference to Exhibit 10.2 to PHI’s Report on Form 10-Q for the quarterly period ended September 30, 2015, filed November 6, 2015). | |||||
| 10.4† | Terms of Employment of Trudy P. McConnaughhay, dated July 6, 2012 (incorporated by reference to Exhibit 10.1 to PHI’s Report on Form 10-Q filed on November 5, 2012). | |||||
| 10.5† | Amended and Restated PHI, Inc. Long-Term Incentive Plan (incorporated by reference to Appendix B to PHI’s Information Statement on Schedule 14C filed April 13, 2015). | |||||
| 10.6† | Form of Time-Vested Restricted Stock Unit Agreement under the PHI, Inc. Long-Term Incentive Plan (incorporated by reference to Exhibit 10.2 to PHI’s Report on Form 10-Q for the quarterly period ended March 31, 2012, filed May 9, 2012). | |||||
| 10.7† | Form of Performance-Based Restricted Stock Unit Agreement under the PHI, Inc. Long-Term Incentive Plan (incorporated by reference to Exhibit 10.3 to PHI’s Report on Form 10-Q for the quarterly period ended March 31, 2012, filed May 9, 2012). | |||||
| 21* | Subsidiaries of the Registrant | |||||
| 23.1* | Consent of Deloitte & Touche LLP | |||||
| 31.1* | Certification pursuant to Section 302 of the Sarbanes-Oxley Act of 2002 by Al A. Gonsoulin, Chief Executive Officer. | |||||
| 31.2* | Certification pursuant to Section 302 of the Sarbanes-Oxley Act of 2002 by Trudy McConnaughhay, Chief Financial Officer. | |||||
| 32.1* | Certification pursuant to Section 906 of the Sarbanes-Oxley Act of 2002 by Al A. Gonsoulin, Chief Executive Officer. | |||||
| 32.2* | Certification pursuant to Section 906 of the Sarbanes-Oxley Act of 2002 by Trudy McConnaughhay, Chief Financial Officer. | |||||
86
Table of Contents
| 101.INS* | XBRL Instance Document | |||||
| 101.SCH* | XBRL Taxonomy Extension Schema | |||||
| 101.CAL* | XBRL Taxonomy Extension Calculation Linkbase | |||||
| 101.DEF* | XBRL Taxonomy Extension Definition Linkbase | |||||
| 101.LAB* | XBRL Taxonomy Extension Label Linkbase | |||||
| 101.PRE* | XBRL Taxonomy Extension Presentation Linkbase | |||||
| * | Filed herewith. |
| † | Indicates management contract or compensatory plan or arrangement. |
87
Table of Contents
Schedule II – Valuation and Qualifying Consolidated Accounts
(Thousands of dollars)
| Additions | ||||||||||||||||
| Balance at | Charged to | Balance at | ||||||||||||||
| Beginning | Costs and | End | ||||||||||||||
| Description |
of Year | Expenses | Deductions (1) | of Year | ||||||||||||
| Year ended December 31, 2015: |
||||||||||||||||
| Allowance for doubtful accounts |
$ | 1,351 | $ | 3,800 | $ | — | $ | 5,151 | ||||||||
| Allowance for inventory |
13,517 | 1,868 | — | 15,385 | ||||||||||||
| Allowance for contractual discounts |
96,590 | 439,991 | 432,980 | 103,601 | ||||||||||||
| Allowance for uncompensated care |
41,858 | 84,470 | 84,404 | 41,924 | ||||||||||||
| Year ended December 31, 2014: |
||||||||||||||||
| Allowance for doubtful accounts |
$ | 1,001 | $ | 350 | $ | — | $ | 1,351 | ||||||||
| Allowance for inventory |
12,292 | 1,225 | — | 13,517 | ||||||||||||
| Allowance for contractual discounts |
74,711 | 408,362 | 386,483 | 96,590 | ||||||||||||
| Allowance for uncompensated care |
46,387 | 79,564 | 84,093 | 41,858 | ||||||||||||
| Year ended December 31, 2013: |
||||||||||||||||
| Allowance for doubtful accounts |
$ | 50 | $ | 951 | $ | — | $ | 1,001 | ||||||||
| Allowance for inventory |
12,361 | — | 69 | 12,292 | ||||||||||||
| Allowance for contractual discounts |
50,389 | 312,927 | 288,605 | 74,711 | ||||||||||||
| Allowance for uncompensated care |
52,168 | 71,011 | 76,792 | 46,387 | ||||||||||||
| (1) | Deductions from provisions represent losses or expenses for which the respective provisions were created. In the case of the provision for contractual discounts and uncompensated care, such deductions are reduced by recoveries of amounts previously written off. |
88
Table of Contents
Pursuant to the requirements of Section 13 or 15(d) of the Securities Exchange Act of 1934, the registrant has caused this report to be signed on its behalf by the undersigned, thereunto duly authorized on February 29, 2016.
| PHI, INC. | ||
| By: | /s/ Trudy McConnaughhay | |
| Trudy McConnaughhay | ||
| Chief Financial Officer | ||
| (Principal Financial and | ||
| Accounting Officer) | ||
Pursuant to requirements of the Securities Exchange Act of 1934, this report has been signed below by the following persons on behalf of the registrant and in the capacities and on the dates indicated.
| Signature |
Title |
Date | ||
| /s/ Al A. Gonsoulin Al A. Gonsoulin |
Chairman of the Board Chief Executive Officer and Director (Principal Executive Officer) |
February 29, 2016 | ||
| /s/ Lance F. Bospflug Lance F. Bospflug |
Director | February 29, 2016 | ||
| /s/ Thomas H. Murphy Thomas H. Murphy |
Director | February 29, 2016 | ||
| /s/ Richard H. Matzke Richard H. Matzke |
Director | February 29, 2016 | ||
| /s/ C. Russell Luigs C. Russell Luigs |
Director | February 29, 2016 | ||
| /s/ Trudy McConnaughhay Trudy McConnaughhay |
Chief Financial Officer (Principal Financial and Accounting Officer) |
February 29, 2016 | ||
89