Attached files
| file | filename |
|---|---|
| EX-31.1 - EXHIBIT 31.1 - IXIA | a2015q410-kxex311.htm |
| EX-21.1 - EXHIBIT 21.1 - IXIA | a2015q410-kxex211.htm |
| EX-31.2 - EXHIBIT 31.2 - IXIA | a2015q410-kxex312.htm |
| EX-10.20 - EXHIBIT 10.20 - IXIA | a2015q410-kxex1020.htm |
| EX-23.1 - EXHIBIT 23.1 - IXIA | a2015q410-kxex231.htm |
| EX-10.5.1 - EXHIBIT 10.5.1 - IXIA | a2015q410-kxex1051.htm |
| EX-10.8 - EXHIBIT 10.8 - IXIA | a2015q410-kxex108.htm |
| EX-10.19 - EXHIBIT 10.19 - IXIA | a2015q410-kxex1019.htm |
| EX-32.1 - EXHIBIT 32.1 - IXIA | a2015q410-kxex321.htm |
UNITED STATES
SECURITIES AND EXCHANGE COMMISSION
Washington, DC 20549
FORM 10-K
(Mark One)
[X] | ANNUAL REPORT PURSUANT TO SECTION 13 OR 15(d) OF THE SECURITIES EXCHANGE ACT OF 1934 |
For the Fiscal Year Ended December 31, 2015
OR
[ ] | TRANSITION REPORT PURSUANT TO SECTION 13 OR 15(d) OF THE SECURITIES EXCHANGE ACT OF 1934 |
For the transition period from ________ to ________
Commission File Number 000-31523
IXIA |
(Exact name of Registrant as specified in its charter) |
California | 95-4635982 |
(State or other jurisdiction of incorporation or organization) | (I.R.S. Employer Identification No.) |
26601 West Agoura Road, Calabasas, CA 91302 |
(Address of principal executive offices, including zip code) |
Registrant’s telephone number, including area code: (818) 871-1800
Securities registered pursuant to Section 12(b) of the Act:
Title of Each Class | Name of Each Exchange on Which Registered |
Common Stock, without par value | The NASDAQ Stock Market LLC |
Securities registered pursuant to Section 12(g) of the Act: None
Indicate by check mark if the Registrant is a well-known seasoned issuer, as defined in Rule 405 of the Securities Act.
Yes [ ] No [X]
Indicate by check mark if the Registrant is not required to file reports pursuant to Section 13 or Section 15(d) of the Exchange Act.
Yes [ ] No [X]
Indicate by check mark whether the Registrant (1) has filed all reports required to be filed by Section 13 or 15(d) of the Securities Exchange Act of 1934 during the preceding 12 months (or for such shorter period that the Registrant was required to file such reports), and (2) has been subject to such filing requirements for the past 90 days. Yes [X] No [ ]
Indicate by check mark whether the Registrant has submitted electronically and posted on its corporate Web site, if any, every Interactive Data File required to be submitted and posted pursuant to Rule 405 of Regulation S-T (§ 232.405 of this chapter) during the preceding 12 months (or for such shorter period that the Registrant was required to submit and post such files).
Yes [X] No [ ]
Indicate by check mark if disclosure of delinquent filers pursuant to Item 405 of Regulation S-K is not contained herein, and will not be contained, to the best of Registrant’s knowledge, in definitive proxy or information statements incorporated by reference in Part III of this Form 10-K or any amendment to this Form 10-K. [ ]
Indicate by check mark whether the Registrant is a large accelerated filer, an accelerated filer, a non-accelerated filer, or a smaller reporting company. See definition of “large accelerated filer,” “accelerated filer” and “smaller reporting company” in Rule 12b-2 of the Exchange Act.
Large accelerated filer [X] | Accelerated filer [ ] | Non-accelerated filer [ ] | Smaller reporting company [ ] |
(Do not check if a smaller reporting company) | |||
Indicate by check mark whether the Registrant is a shell company (as defined in Rule 12b-2 of the Act). Yes [ ] No [X]
The aggregate market value of the shares of the Registrant’s Common Stock held by nonaffiliates of the Registrant as of June 30, 2015, computed by reference to the closing sales price on the Nasdaq Global Select Market on that date, was approximately $759,709,357.
As of February 23, 2016, the number of shares of the Registrant’s Common Stock outstanding was 81,094,535.
DOCUMENTS INCORPORATED BY REFERENCE
Portions of the Registrant’s Proxy Statement to be delivered to shareholders in connection with the Annual Meeting of Shareholders to be held on June 2, 2016 are incorporated by reference into Part III of this Annual Report.
IXIA
FORM 10-K
TABLE OF CONTENTS
Page | ||
PART I | ||
Item 1. | Business | |
Item 1A. | Risk Factors | |
Item 1B. | Unresolved Staff Comments | |
Item 2. | Properties | |
Item 3. | Legal Proceedings | |
Item 4. | Mine Safety Disclosures | |
PART II | ||
Item 5. | Market for Registrant’s Common Equity, Related Shareholder Matters and Issuer Purchases of Equity Securities | |
Item 6. | Selected Financial Data | |
Item 7. | Management’s Discussion and Analysis of Financial Condition and Results of Operations | |
Item 7A. | Quantitative and Qualitative Disclosures About Market Risk | |
Item 8. | Financial Statements and Supplementary Data | |
Item 9. | Changes in and Disagreements with Accountants on Accounting and Financial Disclosure | |
Item 9A. | Controls and Procedures | |
Item 9B. | Other Information | |
PART III | ||
Item 10. | Directors, Executive Officers and Corporate Governance | |
Item 11. | Executive Compensation | |
Item 12. | Security Ownership of Certain Beneficial Owners and Management and Related Shareholder Matters | |
Item 13. | Certain Relationships and Related Transactions, and Director Independence | |
Item 14. | Principal Accounting Fees and Services | |
PART IV | ||
Item 15. | Exhibits, Financial Statement Schedules | |
SIGNATURES | ||
2
PART I
Item 1. Business
Overview
Ixia (the "Company," "we," "us," or "our") was incorporated in 1997 as a California corporation. We help customers validate the performance and security resilience of their applications and networks. Our test, visibility and security products help organizations make customer physical and virtual networks stronger. Enterprises, service providers, network equipment manufacturers, and governments worldwide rely on our solutions to validate new products before shipping, and secure ongoing operation of their networks with better visibility and security. Our product solutions consist of our high performance hardware platforms, software applications and services, including warranty and maintenance offerings.
We help applications perform better through an extensive array of test, security and visibility solutions that validate, secure and optimize networks and applications from engineering concept to live deployment. Our products uncover performance and security blind spots within networks and expose vulnerabilities.
Better performing applications means an improved end-user customer experience. Security resilience means ensuring network durability against ever-growing IT security threats.
We expect that our customers, when asked, would agree that two things are true: applications need to perform even as their network edge has blurred, and security is critical in an environment of exponentially growing IT threats. We are committed to helping our customers' networks perform at their highest level so that our customers' end users get the best performing and most secure application experience available.
We are headquartered in Calabasas, California with operations across the U.S. and in other parts of the world. Our revenues are principally derived from shipments within the U.S. and to the Europe, Middle East and Africa ("EMEA") and Asia Pacific regions. See Note 5 to the consolidated financial statements included in this Annual Report on Form 10-K (this “Form 10-K”) for entity-wide disclosures about products and services, geographic areas and major customers.
Our Solutions
We are a leading provider of physical and virtual network application performance and security resilience solutions. Application performance and security resilience allow network operators to ensure that their priority network functions are validated, secured, and optimized through the network life cycle.
Our solutions help customers address three network goals:
• | Validate the network—test and confirm design in virtual and physical environments |
• | Optimize the network—enhance application performance and visibility across the network |
• | Secure the network—assess and monitor security threats in real-world scenarios |
Enterprises, service providers, network equipment manufacturers, and governments worldwide rely on our solutions to deploy new technologies and achieve efficient, secure, ongoing operation of their networks. Our product solutions consist of our high performance hardware platforms, software applications, and services, including warranty and maintenance offerings.
Our powerful and versatile solutions, expert global support, and professional services equip organizations to exceed their customer expectations and achieve better business outcomes. Our solutions provide organizations with a complete understanding of its user behavior, security vulnerabilities, network capacity, application performance, and information technology (“IT”) resiliency. From the research labs to the network cloud, Ixia solutions ensure application performance and security resilience across network and data center infrastructure. No matter what profession or position in the world, connecting to networked applications quickly and securely – from any location – is paramount to success. The convergence of new technologies is complicating the IT landscape – smartphone ubiquity, cloud proliferation, challenges of big data, demands of the social consumer, pervasive cyber threats – intensifying the challenge of constantly, securely, and quickly connecting users to their applications. The delivery of communications and entertainment applications and services is moving to an always-connected, always-on paradigm. Ixia solutions battle-test wired networks, wireless networks and data center infrastructures, provide seamless access to network & application performance and enable IT leaders to run highly resilient, high performing networks.
3
Our solutions are scalable, easy-to-use, and adaptable, automatically providing companies with comprehensive coverage of the latest applications and security attacks in order to optimize performance and protect against threats. Our goal is to enhance application performance and security resilience by providing comprehensive, easy-to-use, and automated solutions that empower our customers to drive their business forward by taking the guesswork out of network reliability and the application services.
Real-world test solutions must recreate the true behavior of wired and wireless users, at massive scale, with increasing fidelity. Network testing solutions must be highly scalable and capable of generating large amounts of data at high speeds over increasingly complex configurations, and be up to date with the very latest applications and security attacks. Comprehensive, integrated testing must occur throughout network design, development, production, deployment, and operation stages. Because this testing and verification must take place across multiple layers of the network infrastructure and for all network protocols, network testing solutions are also required to be highly flexible, extensible, and modular. This rapid evolution of complex network technologies and protocols – which includes leading-edge technologies such as higher speed Ethernet, LTE and the latest Wi-Fi standards – has resulted in the need for an integrated platform solution that is easy to use, with minimal training and set-up.
Our network visibility solutions intelligently connect data center and network infrastructure with monitoring solutions that ensure application performance and security resilience. Powered by an easy to use, drag-and-drop interface, our advanced packet processing technologies including filtering, load balancing, packet shaping, session correlation, application intelligence, and de-duplication improve the way our customers manage their data centers, prevent network application and service downtime, and maximize return on IT investment. Network visibility is the first step towards a successful security deployment. It is imperative that visibility solutions deliver 100% of the traffic at high speed with advanced processing to ensure effective application security and performance monitoring.
Integrating our technologies across our platforms to bring valuable solutions to market is a key element of our growth strategy. The introduction of our new security product, ThreatARMOR, is an example of how our security expertise and IP from our test solutions drives value across our business. ThreatARMOR decreases the attack surface networks and reduces the load on security devices and resources. It further expands the security capabilities of our visibility architecture by leveraging our proprietary Application Threat Intelligence to identify and block known bad traffic at line rate speeds before it can access the network. In addition, ThreatARMOR can identify and stop infected internal devices from communicating with known botnets.
By leveraging our security technologies across our portfolio, we deliver visibility solutions that enable a secure infrastructure, and make security solutions more efficient and resilient. We believe that an effective visibility architecture should do more than just see the traffic--it also needs to help identify where you are vulnerable, reduce your attack surface and provide intelligence.
Our systems provide our customers with the following key benefits:
• | Versatile High Performance. Our network test solutions generate and receive data traffic at full line rate – the maximum rate that data traffic can be transmitted over a network medium. Our systems provide accurate analysis across multiple layers of the overall network and of individual network components in real time. Our systems can be configured to either generate programmed packets of data or conduct complete sessions. |
Our test systems can analyze each discrete packet of information, thereby allowing our customers to precisely measure the performance of their networks and individual network components. This precision allows customers to accurately measure critical quality of service parameters such as throughput, latency, loss, and jitter. It also verifies data integrity, packet sequencing throughout the network, and quality of service ("QoS").
When used for realistic application sessions or conversations between network endpoints, our test systems emulate highly complex and specialized applications such as transferring electronic mail, browsing the Internet, conveying voice and video information, managing databases, and establishing wireless calls. This emulation allows our customers to accurately measure critical characteristics of their networks such as session setup rate, session tear down rate, and session capacity. By analyzing the content of these sessions, our customers can also accurately measure QoS and media quality.
Our network visibility solutions allow customers to dynamically aggregate, regenerate, distribute, filter, and condition packets from all parts of the network at full line rate. These high performance systems enable broader network visibility and enhance the performance of customers’ monitoring solutions while reducing costs.
4
• | Highly Scalable. Each of our network test interface cards provides one or more ports through which our systems generate and receive data traffic. Each physical port contains its own dedicated logic circuits, with substantial memory and compute resources. Our customers can easily scale the size of their test bed or the amount of data traffic generated by inserting additional interface cards. By connecting multiple chassis and synchronizing hundreds of ports to operate simultaneously, our customers can simulate extremely large networks. Our GPS-based components even allow our chassis to be distributed throughout the world, while maintaining the close time synchronization necessary for precision tests. We believe that our systems can offer our customers one of the highest port density and scalable space efficient systems available. In addition, our client-server architecture allows multiple users in the same or different geographic locations to simultaneously access and operate different ports contained in the same chassis to run independent tests. Customers using our high-density network visibility platform can easily scale their visibility needs through flexible port licensing and modular extensions that can grow with their expanding network monitoring needs. |
• | Highly Modular Hardware Platform. We offer network test hardware platforms with interchangeable interfaces, using a common set of applications and Application Programing Interfaces ("APIs"). Our architectures enable the emulation of millions of network users on scalable platforms, with a mixture of both network and application layer traffic. These architectures offer our customers an integrated test environment that might otherwise require multiple products to cover the same test scenarios. We believe that our network test hardware platform solutions decrease the overall cost while increasing productivity and scalability, and reducing training requirements for our customers. Our network test hardware products consist of stackable and portable chassis which, depending on the chassis model, can be configured with a mix of interface cards. This modular design allows our customers to quickly and easily create realistic, customized test configurations. Our open architecture accelerates the integration of additional network technologies into existing systems through the addition of new interface cards and distributed software. Our modular approach to network visibility allows customers to increase port density, add higher speed links, and/or advanced features – helping customers to future proof their network monitoring and visibility investments. |
• | Flexible. Our customers can easily expand our systems to address changing technologies, protocols, and applications without changing system hardware or replacing interface cards. This protects and optimizes customers’ investments by eliminating the need for “forklift upgrades” or the purchase of additional niche products. Additionally, customers under our Application and Threat Intelligence ("ATI") service receive automatic bi-weekly updates of the latest applications and attacks for use in their real-world testing scenarios. |
• | Automation. Our systems make it easy to create automated tests and network monitoring rules that can run unattended. We offer our customers a growing library of automated tests and monitoring automation scripts that simplify and streamline the test and monitoring processes. The automated tests are repeatable and the results are presented in a structured format for easy analysis. Ixia offers “Click-Thru Automation” that records and repeats interactive operation, providing automation without programming. In addition, Ixia's Tool Command Language ("Tcl") API is a comprehensive programming interface to our hardware, as well as to our software applications. The Tcl API enables libraries of automated scripts to be quickly built with specificity to a customer's environment. We also offer a utility that exports configurations created in our graphical user interface ("GUI") as Tcl scripts. Our visibility solutions can be automated and integrated with monitoring tools using our RESTful API. |
• | Ease of Use. We have designed our systems so that users can install and operate them with minimal training and setup. Our network test systems are easy to use and offer our customers a wide range of readily accessible pre-designed test configurations. These tests include industry standard and use case-specific tests. Users can easily configure and operate our systems to generate and analyze data traffic over any combination of interface cards or ports through our graphical user interface. Once tests are designed in our GUIs, they can be saved for reuse or in Tcl script form for customization and even greater levels of automation. Our network visibility systems also offer customers best in class ease-of-use, with a point-and-click GUI that enables customers to quickly develop complex filtering and packet distribution algorithms with simple, but powerful, drop-down menus. These configurations can be saved for reuse and automated using our RESTful API. |
• | Intelligent. Our products and solutions are designed with high processing capability and intelligence leveraging the deep technical prowess and engineering capabilities at Ixia. These intelligence capabilities manifest themselves in our products in the form of protocol awareness, application context and knowledge of security threat vectors. Ixia continues to be a leader in the market through innovation by making our products more application and security aware and intelligent through analytics so that our customers are presented with relevant and actionable information whether it be test results in a lab environment or resiliency reports for some network equipment or real-time application flow data being sent to a monitoring & security analysis tool. |
5
Our Business Strategy
Our goal is to enable seamless performance, resilience and reliability in application and service delivery over networks by providing the most comprehensive, insightful and easy-to-use test, security and visibility solutions in the industry. Over the past few years, Ixia has taken a number of significant actions to acquire technology and talent that has positioned the Company as a preeminent provider of network test, security and visibility solutions. This has been accomplished by growing our portfolio of products and addressable markets through acquiring technologies, businesses, and assets; expanding our international presence, sales channels and customer base; continuing to deliver high quality products and support to our customers; and developing our employees. Key elements of our strategy to achieve our objective include the following:
• | Continue to Expand our Addressable Markets. We plan to further expand our addressable markets into growth areas for network and application security, next-generation networking technologies, monitoring network applications and services, and more. |
• | Maintain Focus on Technology Leadership. We will continue to focus on research and development in order to maintain our technology leadership position, and to offer solutions that address new and evolving network technologies. We intend to maintain an active role in industry standards committees such as IEEE and the Internet Engineering Task Force ("IETF"), and to continue our active involvement in industry forums, associations and alliances such as the Ethernet Alliance, Metro Ethernet Forum, Open Networking Foundation ("ONF"), Wi-Fi Alliance, International Telecommunications Union ("ITU"), Small Cell Forum, Telecommunications Industry Association ("TIA") and 3GPP. We also plan to continue to work closely with some of our established customers who are developing emerging network technologies, as well as leading edge start-up companies, to enhance the performance and functionality of our existing systems and to design future products that specifically address our customers’ needs as they evolve. |
• | Expand and Further Penetrate Customer Base. We plan to strengthen and further penetrate our existing customer relationships, and expand our reach into new enterprise, government, and service provider customers by: |
◦ | Continuing to develop and offer new and innovative solutions that meet our existing and potential customers’ needs, |
◦ | Expanding our sales and marketing efforts through direct channels and partner relationships to increase penetration in under-represented vertical and geographic market segments, |
◦ | Building upon and further strengthening our reputation and brand name recognition, and |
◦ | Continuing our focus on customer support by maintaining and expanding the capabilities of our highly qualified and specialized internal personnel. |
• | Expand International Market Presence. We will further pursue sales in key international markets, including EMEA, and the Asia Pacific region. In order to pursue sales in these markets, we intend to develop and expand our relationships with key customers, partners, resellers and distributors, as well as expand our direct sales and marketing presence within these markets. |
• | License and Acquire New Products. We will continue our strategy of acquiring products in key technologies that expand our product offerings, address customer needs, and enhance the breadth of our evolving product portfolio. To expand our product portfolio, we may partner with industry leaders, acquire or license technology assets, or acquire other companies. |
We have throughout our existence made acquisitions which have expanded our product portfolio, have grown our end customer base, and have increased our overall total addressable market. Our recent acquisition history includes the following:
• | In July 2011, we acquired VeriWave, Inc. (“VeriWave”), a performance testing company for wireless LAN ("WLAN") and Wi-Fi enabled smart devices. This acquisition expanded our portfolio of supported network media and addresses the need for an end-to-end solution that completely tests converged Wi-Fi, wired, 3G, and 4G/LTE ecosystems. |
• | In June 2012, we acquired Anue Systems, Inc. (“Anue”). Anue solutions provide visibility into live networks and the applications running within them in order to efficiently aggregate and filter traffic. With this acquisition, we expanded our addressable market, broadened our product portfolio and grown our customer base. |
6
• | In August 2012, we acquired BreakingPoint Systems, Inc. (“BreakingPoint”). BreakingPoint is a leader in application and security assessment and testing, and its solutions provide global visibility into emerging threats and applications, along with advance insight into the resiliency of an organization’s network infrastructure. With this acquisition, we expanded our addressable market, broadened our product portfolio and grown our customer base. |
• | In December 2013, we acquired Net Optics, Inc. (“Net Optics”). Net Optics is a leading provider of total application and network visibility solutions. The acquisition of Net Optics solidifies our position as a market leader with a comprehensive product offering including network packet brokers, physical and virtual taps and application aware capabilities. The acquisition expanded our product portfolio, strengthened our service provider and enterprise customer base and broadened our sales channel and partner programs. |
Customers
Today’s networks and data centers are continuously improving their performance and scale in order to accommodate the plethora of applications and services we now rely upon to do business, communicate, capture memories, plan, travel, and more. Applications drive network capacity, influence quality of experience, introduce potential vulnerabilities, and lead to more innovations. Every organization from device manufacturers, to service providers, to enterprise and government organizations seeks to optimize networks and data centers in order to accelerate, secure, and scale the delivery of these applications.
Our solutions provide the insight needed for organizations to make real-time decisions that optimize performance, harden security and increase the scalability of networks facing constantly changing requirements. Our line of hardware, software, and other services cater to the needs of Network Equipment Manufacturers ("NEMs"), Service Providers, and Enterprise and Government organizations. Our solutions provide an end-to-end approach for our customers to test devices and systems prior to deployment, validate the performance and security of networks and data centers after every change, and help them continuously monitor network application and security behavior to manage performance.
We provide solutions and services to each of our customer segments, including those set forth below:
• | NEMs. NEMs provide voice, video, and data and service infrastructure equipment to customer network operators, service providers, and network users. Such users require high standards of functionality, performance, security, and reliability. To meet these higher standards, NEMs must ensure the quality of their products during development and manufacturing (prior to deployment). Failure to ensure the consistent functionality and performance of their products may result in the loss of customers, increased research and development costs, increased support costs, and losses resulting from the return of products. NEMs, for example, use our network test systems to run large-scale subscriber and service emulations, generating extreme traffic loads to verify the performance and capacity of their wired and wireless devices prior to deployment in production networks. Our systems are also used by NEMs in the sales and acceptance process to demonstrate to their customers (e.g., service providers and enterprises) how the NEMs’ products will operate under real-world conditions. In addition, our conformance test suites are used by NEMs to ensure that their devices conform to published standards – ensuring that they will be interoperable with other equipment. These equipment manufacturers are also, in many cases, large enterprises and therefore have the same challenges that can be met using our assessment and monitoring solutions within their own internal network. |
• | Service Providers. Service providers seek to deliver a growing variety of high quality, advanced network services ranging from traditional telecommunications and Internet services, to social networking, cloud storage, and entertainment streaming. Failure to provide a quality experience to the end user can be costly through high subscriber churn rates and reduced revenues. To ensure quality of experience and service assurance, service provider R&D and network engineering groups must verify the performance and functionality of staged networks during equipment selection and network design, prior to deployment and after any change to the production network. Service providers also use our network test systems to emulate millions of mobile (3G/4G/LTE) subscribers to realistically predict end-user quality of experience delivered by providers’ infrastructure and services. Service providers must also ensure security for customers and their own networks, as the keepers of vast amounts of business and personal data. And finally, service providers depend on our monitoring solutions to filter application traffic in order to prioritize, de-duplicate, and optimize wired and wireless data streams. |
7
• | Enterprises and Government. Enterprise and government organizations depend on their networks and data centers to get business done, and they devote enormous resources to ensure applications and services run optimally and securely. These customers rely on our solutions to help evaluate equipment during selection, optimize and harden their network designs in labs prior to roll-out, and once rolled out, continuously monitor the production network to ensure optimal performance and security of the contents flowing through it. Notably, organizations must always be vigilant against the impact of security threats to its business critical network. Using our solutions, they consistently ensure their network and data center are optimized and resilient. Our security solutions are also used by major organizations to train their staff on the new generation of “cyber warfare and mitigation techniques” to recognize and defend against massive cyber-attacks. |
During the year ended December 31, 2015, we received orders from approximately 2,400 new and existing end customers. Based on product shipments for the year ended December 31, 2015, our significant customers by category included:
• | Leading NEMs such as Cisco Systems, Juniper Networks and Alcatel-Lucent; |
• | Voice, broadband and/or wireless service providers such as Verizon, AT&T and NTT; |
• | Enterprises such as Oracle, Wells Fargo and Allstate Insurance; and |
• | Government contractors, departments and agencies such as the U.S. Navy, the U.S. Army and the Department of Homeland Security. |
We do not have long-term or volume purchase contracts that commit our customers to future product purchases, and as a result our customers may reduce or discontinue purchasing from us at any time.
Backlog
Backlog consists of purchase orders that we have received and accepted for products and services. Our backlog includes orders for products scheduled to be shipped and for services scheduled to be delivered to our resellers and customers within 90 days. Purchase orders for products are generally shipped within 90 days after acceptance, unless a later shipment date is requested by the reseller or customer. Services are performed in accordance with our contractual commitments to our customers. Our backlog at December 31, 2015 was approximately $16.9 million, compared with a backlog of approximately $38.9 million at December 31, 2014.
We typically ship our products within the quarter in which the related product orders are received. A substantial portion of our orders is received during the last month of the quarter, and a significant percentage of those orders is received during the last week of that month.
Because our product shipments in any quarter may be affected by our customers’ rescheduling of product delivery dates and changes in and cancellations of orders by our customers (which changes and cancellations can usually be effected prior to shipment without significant penalty), and because a significant portion of our revenue in a quarter is attributable to product orders shipped in the same quarter during which they are received, we do not believe that the amount of our backlog, as of any particular date, is necessarily a meaningful indicator of our future business prospects or financial performance.
Although it is generally our practice to ship and bill for products shortly following our acceptance of an order, we from time to time exercise discretion over the timing of certain product shipments, which can increase or decrease the amount of our backlog and affect the timing of revenue recognition for such shipments. In such cases, we may consider a number of factors, including the degree to which we have achieved our business objectives for the quarter, especially with respect to product orders received late in a quarter. We may also consider our manufacturing and operational capacity to fulfill product orders, delivery dates requested by our resellers and customers, our contractual obligations to our resellers and customers, and the creditworthiness of our resellers and customers. Our ability to ship products shortly following our acceptance of an order may also be adversely impacted by the time required to comply with applicable export laws and regulations.
Timing of revenue recognition for services may vary depending on the contractual service period or when the services are rendered.
8
Product Technology
The design of our products requires a combination of sophisticated technical competencies, including designs utilizing field programmable gate arrays ("FPGAs"), network processors ("NPs"), packet switching ASICS, embedded systems, high speed electrical and optical serial interfaces, high speed and low latency memory technology, large scale system software, and high speed packet and data processing software. FPGAs are integrated circuits that can be repeatedly reprogrammed to perform different sets of functions as required. NPs are special programmable integrated circuits optimized for networking applications. Many of our systems also require high-speed digital hardware design, software engineering and optical and mechanical engineering. We have built an organization of professional staff with skills in all of these areas. The integration of these technical competencies enables us to design and manufacture test systems which are highly scalable to meet the needs of our customers.
Complex Logic Design. Our systems use FPGAs that are programmed by the host computer and therefore can be reconfigured for different applications. Our newest products have high clock frequencies, which are the timing signals that synchronize all components within our system, and logic densities, which are the number of individual switching components, or gates, of more than four million gates per chip. Our customers may obtain updates and enhancements from our website, thereby allowing rapid updates of the system. Almost all of our logic chips are designed in the hardware description language including VHDL and System Verilog, which are unique programming language tailored to the development of logic chips. These languages enables the easy migration of the hardware design to application specific integrated circuits as volumes warrant. We develop code in a modular fashion for reuse in logic design, which comprises a critical portion of our intellectual property. This reusable technology allows us to reduce the time-to-market for our new and enhanced products.
Network Processor Technology. Our patented NP technology enables our products to emulate complex networks and data centers at a very high scale and analyze traffic on live networks in real time in order to take action against security threats or provide the user relevant analytics for network operations departments. The programmability of the NPs allows our customers to remain current with new networking technologies, security threats, and new application types by allowing customers to obtain frequent updates and enhancements from our website.
Application Threat Intelligence ("ATI") Technology. We invest in security research to characterize the ever changing landscape of valid applications and harmful threats that exist in the Internet. This research enables us to produce a database of threat signatures, harmful IP addresses, and valid application signatures that is used across the product portfolio for network test, network security and network visibility. This database is used by our test products to emulate threats and valid applications, used by our security products to block known threats, and used by our visibility products for application level visibility to network operations. Our NP technology embeds ATI technology. The security research team is continuously updating the database and our customers are able to receive these updates via our available ATI subscription service as new threats emerge.
Software Technology. We devote substantial engineering resources to the development of software technology for use in our product lines on both physical appliances and as Virtual Editions to run on Virtual Machines using off-the-shelf compute platforms. We have developed software to control our systems, analyze data collected by our systems, process network traffic and monitor, maintain and self-test our hardware and field programmable gate array subsystems. A majority of our software technology and expertise is focused on the use of object-oriented development techniques to design software subsystems that can be reused across multiple product lines. These objects are client and server independent allowing for distributed network applications. This software architecture allows all of the software tools developed for our existing products to be utilized in all of our new products with very little modification. Another important component of our software technology is our graphical user interface design. Customer experience with our test and visibility products has enabled us to design a simple yet effective method to display complex configurations in clear and concise graphical user interfaces for intuitive use by engineers.
Products and Services
Our product solutions consist of our hardware platforms, such as our chassis, interface cards and appliances, software application tools, and services, including our warranty and maintenance offerings and professional services. Our highly scalable and flexible products enable our customers to configure solutions based on their specific networks and use cases. For example, if our customer wants to analyze the performance of an Ethernet router, the customer could purchase our network test hardware platform, including a chassis and one or more Ethernet interface cards, and our IxNetwork software application.
9
Products
Sales of our network test hardware products typically include a chassis and one or more Ethernet interface cards. Our software applications and APIs allow our customers to create and manage integrated, easy-to-use automated test environments. Our hardware platform consists largely of interchangeable interface cards which fit into multi-slot chassis. Our chassis are metal cases that incorporate a computer, a power supply, and a backplane which connects the interface cards to the chassis. The interface cards generate, receive and analyze a wide variety of traffic types at multiple network layers.
Our primary 12-slot network test chassis (e.g., XGS12 and XG12) provides a high-density, highly-flexible test platform. Operating in conjunction with our software applications, our chassis provide the foundation for a complete, high-performance test environment. A wide array of interface cards is available for our primary chassis. The 12-slot Ixia chassis supports up to 192 Gigabit ports, 384-10GE ports, 48-40GE ports and 24-100GE ports. These interface cards provide the network interfaces and distributed processing resources needed for executing a broad range of data, signaling, voice, video, and application testing for layers 1-7 of the network stack. Each chassis supports an integrated test controller that manages all system and testing resources. Resource ownership down to a per-port level, coupled with hot-swappable interface modules, ensures a highly-flexible, multi-user testing environment. Backward compatibility is maintained with key existing Ixia interface cards and test applications to provide seamless migration from and integration with existing Ixia test installations.
We offer a number of interface cards that operate at speeds of up to 400 gigabit per second. Each one of our interface cards contains multiple independent traffic generation and analysis ports that operate at line rate. Each port on most interface cards has a unique transmit stream engine that is used to generate packets of information and a real-time receive analysis engine capable of analyzing the packets as they are received. The transmit stream engine generates millions of data packets or continuous test sequences at line rate that are transmitted through the network and received by the analysis engine. When data packets have been generated, the analysis engine then measures throughput, latency, loss and jitter, and checks data integrity and packet sequence on a packet-by-packet basis. In addition, our systems measure the effectiveness of networks in prioritizing different types of traffic. Most of our current generation interface cards also include a microprocessor per port to generate and analyze sophisticated routing protocols, such as BGP and MPLS, as well as application traffic such as TCP/IP, HTTP and SSL. Certain of our application and security load modules can recreate more than 35,000 attacks, including exploits, malware, denial of service (DoS), and mobile malware. These load modules provide application and threat assessment solutions at Internet-scale, and create massive-scale, high fidelity simulation and testing conditions for battle-testing infrastructures, devices, applications, and people.
We offer a comprehensive suite of software applications in conjunction with our network test hardware platforms to address specific technologies. These applications measure and analyze the performance, functionality, interoperability, service quality, and conformance of networks, network equipment and applications that run on these networks. These applications enable network equipment manufacturers, service providers, enterprises and governments to evaluate the performance of their equipment and networks during the design, manufacture and pre-deployment stages, as well as after the equipment is deployed in a network. Our technology-specific application test suites are targeted at a wide range of popular application and security performance and conformance requirements across various protocols, interfaces and types of devices. These include automated and targeted delivery, functionality and performance test for technologies and devices including storage, video, voice, intelligent networks, specific applications, routing, switching, Wi-Fi, broadband, wireless, software defined networks and virtual networks and functions. All of these technologies are used in variety of situations including (but not limited to) R&D test environment, change management and scenario planning for production networks.
We also develop virtual versions of our core network test products designed to test virtual assets and environments using trusted technologies that have been used for testing hardware-based network equipment for a decade. These products help accelerate the development of our customer’s virtual products and allow enterprises, service providers and governments to quantify its benefits by using our trusted technologies.
10
Our network visibility products improve the way our enterprise, service provider, and government customers manage their data centers, save valuable IT time, and maximize return on IT investments. Ixia network visibility solutions revolutionize the way customers monitor their network - enabling complete network visibility into physical and virtual networks, and optimizes monitoring tool performance whether out-of-band or in-line. Our network visibility platform ranges from network access test access point ("TAPs"), to solution-specific appliances for smaller implementations to a 100GE, high-density NEBS3 compliant chassis designed for large and complex data centers. These products help our customers monitor their rapidly growing number of 1GE, 10GE, 40GE and 100GE ports with existing monitoring tools. Sales of our network visibility products typically consist of an integrated, purpose-built hardware appliance with proprietary software which includes patented filtering and content handling technology that ensures each monitoring tool gets exactly the right data needed for analysis, all powered by the easy to use, drag-and-drop management system. We also offer advanced processing modules that easily slide into certain of our appliances for additional advanced intelligence and functionality including de-duplication, packet slicing and time-stamping. Our latest advanced feature module is the Application and Threat Intelligence Processor ("ATIP") that delivers real-time application data to monitoring tools to allow customers to make better decisions with respect to identifying unknown network applications, and threats to network infrastructure from suspicious applications and locations.
In addition to our core network visibility functionality, we also have a number of available features that give customers greater flexibility and intelligence for their network visibility implementations. For example, we believe that an effective visibility architecture should do more than just see the traffic--it also needs to help identify where you are vulnerable, reduce your attack surface and provide intelligence. Our new ThreatARMOR product expands the security capabilities of our visibility architecture by decreasing the attack surface of the network and reducing the load on security devices and resources. Customers can deploy our network visibility solutions not only out-of-band in physical networks, but in-line for security applications and in virtual environments with our in-line technologies and Phantom virtual TAP software application, respectively. Another example is the GTP Session Controller that intelligently manages high-scale, session-aware, mobility load balancing deployments. In addition, our ControlTower solution allows customers to deploy, manage and maintain distributed implementations with ease.
Services
Our service revenues primarily consist of our technical support, warranty and software maintenance services. We also offer training and professional services.
We offer technical support, warranty and software maintenance services with the sale of our hardware and software products. Many of our products include up to one year of these services with the initial product purchase. Our customers may choose to extend the services for annual or multi-year periods. Our technical support services are delivered by our global team of technically knowledgeable and responsive customer service and support staff, and include assistance with the set-up, configuration and operation of Ixia products. Our warranty and software maintenance services include the repair or replacement of defective product, bug fixes, and unspecified when and if available software upgrades.
Our technical support and software maintenance services also include our ATI service for our application and security platforms, which provides a comprehensive suite of application protocols, software updates and responsive technical support. The ATI subscription service provides full access to the latest security attacks, global malicious site and geolocation data, and application updates for use in real-world test, visibility, security, and assessment scenarios. Our customers may choose to purchase the ATI service for annual or multi-year periods.
Products in Development
We continue to develop our IP testing capabilities, and we intend to remain focused on improving our position in performance, security, monitoring, functional, interoperability, service quality and conformance in several technology areas. Our product development teams have deep networking, applications and security expertise and understand the incredibly diverse set of problems our customers need to solve today as well as new challenges customers will face as network technologies evolve. Our teams constantly work to improve current solutions as well as push forward into new areas relevant to the markets in which we compete. These technologies include a host of networking, application and security technologies and protocols ranging from faster speeds like 400 GE and beyond to software defined networking and network functions virtualization, to old and new protocols that allow the data to traverse those environments.
We may delay or cancel the introduction of new products to the market as a result of a number of factors, some of which are beyond our control. For more information regarding these factors, see “Business – Research and Development” and “Risk Factors – If we are unable to successfully develop or introduce new products to keep pace with the rapid technological changes that characterize our market, our results of operations will be significantly harmed.”
11
Competition
The market for providing network test and monitoring systems is highly competitive, and we expect this competition to continue in the future. We currently compete with network test and monitoring solution vendors such as Spirent Communications and Gigamon. We also compete either directly or indirectly with large Ethernet switch vendors and network management, analysis, compliance and test tool vendors that offer point solutions that address a subset of the issues that we solve. Additionally, some of our significant customers have developed, or may develop, in-house products for their own use or for sale to others.
We believe that the principal competitive factors in our market include:
• | Breadth of product offerings and features on a single test or monitoring platform, |
• | Timeliness of new product introductions, |
• | Product quality, reliability and performance, |
• | Price and overall cost of product ownership, |
• | Ease of installation, integration and use, |
• | Customer service and technical support, and |
• | Company reputation and size. |
We believe that we compete favorably in the key competitive factors that impact our markets. We intend to remain competitive through ongoing research and development efforts that enhance existing systems and to develop products and features. We will also seek to expand our market presence through marketing and sales efforts.
We expect to continue to experience significant competition from our existing competitors, and from companies that may enter our existing or future markets. And, as we move into new market segments within the broader network test and monitoring arena, we will be challenged by new competitors. These companies may develop similar or substitute solutions that may be more cost-effective or provide better performance or functionality than our systems. Also, as we broaden our product offerings, we may move into new markets in which we will have to compete against companies already established in those markets. Some of our existing and potential competitors have longer operating histories, substantially greater financial, product development, marketing, service, support, technical and other resources, significantly greater name recognition, and a larger installed base of customers than we do. In addition, many of our competitors have well established relationships with our current and potential customers and have extensive knowledge of our industry. It is possible that new competitors or alliances among competitors will emerge and rapidly acquire market share. Moreover, our competitors may consolidate with each other, or with other companies, giving them even greater capabilities with which to compete against us.
To be successful, we must continue to respond promptly and effectively to the challenges of changing customer requirements, technological advances and competitors’ innovations. Accordingly, we cannot predict what our relative competitive position will be as the market evolves for network test and monitoring solutions.
Sales, Marketing and Technical Support
Sales. We use our global direct sales force to market and sell our products and solutions. In addition, we use distributors, value added resellers, system integrators and other partners to complement our direct sales and marketing efforts for certain vertical and geographical markets. We depend on many of our distributors, resellers and other partners to generate sales opportunities and manage the sales process. Our direct sales force maintains close contact with our customers and supports our distributors, resellers and other partners. Another key component of our go-to-market strategy for certain products is strategic relationships with technical partners. These technical partners consist of network monitoring and management companies, including Computer Associates, IBM, Riverbed, Dynatrace, Palo-Alto Networks, FireEye, HP Enterprise, and others to complement their monitoring or security solutions. We work with technical partners in two main ways: (i) through customer referrals and recommendations and (ii) through automation integration/interoperability that provides a differentiated solution for our customers.
12
Marketing. We have a number of ongoing programs to support the sale and distribution of our products and solutions and to inform existing and potential customers, partners and distributors about the capabilities and benefits of our systems. Our marketing efforts also include promoting our business by:
• | Sponsoring technical seminars and webinars that highlight our solutions, |
• | Participating in industry trade shows and technical conferences, |
• | Advertising in digital media publications, |
• | Writing and distribution of various forms of collateral, including brochures, white papers, solution briefs and application notes, |
• | Demonstrating the performance and scalability of our products at our iSimCity proof-of-concept labs, |
• | Communicating through our corporate website and various social media outlets, such as LinkedIn, Twitter and our corporate blog, and |
• | Writing articles for online and print trade journals. |
Ixia Technical Support. Our global team of Technical Support and Field Engineers have a high level of networking and product expertise. We enable our customers to make the best use of Ixia products to accomplish their goals, help answer questions and resolve issues they encounter, and minimize downtime. Customers can reach the Ixia Technical Support Team by phone, email, or website. We have regional support offices in the United States, Europe, and multiple countries in Asia.
Support services our team provides for our customers include:
• | Assist new customers with product installation and licensing, |
• | Provide configuration assistance and expert advice on best practices, |
• | Investigate user issues and work to quickly resolve them, |
• | Quickly respond to reported hardware failures and repair or replace as needed, and |
• | Provide access to our self-service portal where customers can report new cases and access our extensive knowledge base articles. |
We also offer premium support options for customers who require even higher levels of service. We have recently invested in new case management and support phone systems to increase our capability to respond quickly, route customers to the best person, and effectively manage their requests globally.
Manufacturing and Supply Operation
Our manufacturing and supply operations consist primarily of new product introduction, test and manufacturing, test engineering, supply chain management, procurement, quality assurance, order management, final assembly, configuration testing, fulfillment and logistics. We outsource the manufacture, assembly and testing of printed circuit board assemblies, certain interface cards and certain chassis to third party contract manufacturers and assembly companies, the most significant of which is located in Malaysia. This manufacturing process enables us to operate without substantial space and personnel dedicated to solely manufacturing operations. As a result, we can leverage a significant portion of the working capital and capital expenditures that may be required for other operating needs.
We are dependent upon sole or limited source suppliers for some key components and parts used in our systems, including among others, field programmable gate arrays, memory devices, processors, oscillators and optical modules. We and our contract manufacturers forecast consumption and purchase components through purchase orders. We have no guaranteed or long-term supply arrangements with our respective suppliers. In addition, the availability of many components is dependent in part on our ability and the ability of our contract manufacturers and assembly companies to provide suppliers with accurate forecasts of future requirements, as well as the global commodity market. Any extended interruption in the supply of any of the key components currently obtained from a sole or limited source or delay in transitioning to a replacement supplier’s product or replacement component into our systems could disrupt our operations and significantly harm our business in any given period.
13
Lead times for materials and components ordered by us and by our contract manufacturers vary and depend on factors such as the specific supplier, purchase terms, global allocations and demand for a component at a given time. We and our contract manufacturers acquire materials, complete standard subassemblies and assemble fully-configured systems based on sales forecasts and historical purchasing patterns. If orders do not match forecasts or substantially deviate from historical patterns, we and our contract manufacturers and assembly companies may have excess or inadequate supply of materials and components.
Research and Development
We believe that research and development is critical to our business. Our development efforts include anticipating and addressing the network performance, security and monitoring needs of network equipment manufacturers, service providers, enterprises and government customers, and focusing on emerging high growth network technologies.
Our future success depends on our ability to continue to enhance our existing products and to develop new products that address the needs of our customers. We closely monitor changing customer needs by communicating and working directly with our customers, partners and distributors. We also receive input from our active participation in industry groups responsible for establishing technical standards.
Development schedules for technology products are inherently difficult to predict, and there can be no assurance that we will introduce any proposed new products in a timely fashion. Also, we cannot be certain that our product development efforts will result in commercially successful products or that our products will not contain software errors or other performance problems or be rendered obsolete by changing technology or new product announcements by other companies.
We plan to continue to make significant investments in research and development, including investments in certain product initiatives. Our research and development expenses were $113.4 million in 2015, $115.2 million in 2014, and $117.5 million in 2013. These expenses included stock-based compensation expense of $6.6 million in 2015, $6.8 million in 2014 and $8.1 million in 2013.
Intellectual Property and Proprietary Rights
Our success and ability to compete are dependent in part upon our ability to establish, protect and maintain our proprietary rights to our intellectual property. We currently rely on a combination of patent, trademark, trade secret and copyright laws, and restrictions on disclosure and use, to establish, protect, and maintain our intellectual property rights. We have patent applications and existing patents in the United States, the European Union and other jurisdictions. We cannot be certain that these applications will result in the issuance of any patents, or that any such patents, if they are issued, or our existing patents, will be upheld. We also cannot be certain that such patents, if issued, or our existing patents, will be effective in protecting our proprietary technology. We have registered the Ixia name, the Ixia logo and certain other trademarks in the United States, the European Union and other jurisdictions, and have filed for registration of additional trademarks.
We generally enter into confidentiality agreements with our officers, employees, consultants and vendors, and in many instances, our customers. We also generally limit access to and distribution of our source code and further limit the disclosure and use of other proprietary information. However, these measures provide only limited protection of our intellectual property rights. In addition, we may not have signed agreements containing adequate protective provisions in every case, and the contractual provisions that are in place may not provide us with adequate protection in all circumstances.
Despite our efforts to protect our intellectual property rights, unauthorized parties may attempt to copy or otherwise obtain or use technology or information such as trade secrets that we regard as confidential and proprietary. We cannot be certain that the steps taken by us to protect our intellectual property rights will be adequate to prevent misappropriation of our proprietary technology or that our competitors will not independently develop technologies that are similar or superior to our proprietary technology. In addition, the laws of some foreign countries do not protect our proprietary rights to the same extent as do the laws of the United States. Any infringement or misappropriation of our intellectual property rights could result in significant litigation costs, and any failure to adequately protect our intellectual property rights could result in our competitors’ offering similar products, potentially resulting in loss of competitive advantage, loss of market share and decreased revenues. Litigation may be necessary to enforce our intellectual property rights or to determine the validity and scope of the proprietary rights of others. Litigation of this type could result in substantial costs and diversion of resources and could significantly harm our business.
14
The telecommunication and data communications industries are characterized by the existence of a large number of patents and frequent litigation based on allegations of patent infringement. From time to time, third parties may assert patent, copyright, trademark and other intellectual property rights to technologies or related standards that are important to our business. We generally have not conducted searches to determine whether the technologies that we use infringe upon or misappropriate intellectual property rights held by third parties. Any claims asserting that any of our products or services infringe or misappropriate proprietary rights of third parties, if determined adversely to us, could significantly harm our business. See Part I, Item 1A of this Form 10-K for additional information regarding the risks associated with patents and other intellectual property.
Employees
As of December 31, 2015, we had 1,727 full time employees, 837 of whom were located in the U.S. We also from time to time hire temporary and part-time employees and independent contractors. Our future performance depends, to a significant degree, on our continued ability to attract and retain highly skilled and qualified technical, sales and marketing, and senior management personnel. Our employees are not represented by any labor unions, and we consider our relations with our employees to be good.
Available Information
Our website address is www.ixiacom.com. Information on our website does not constitute part of this report. We make available free of charge through a link provided at such website our Forms 10-K, 10-Q and 8-K as well as any amendments thereto. Such reports are available as soon as reasonably practicable after they are filed with the Securities and Exchange Commission (the "SEC").
The public may read and copy any materials we file with the SEC at the SEC's Public Reference Room at 100 F Street, NE, Washington, DC 20549. The public may obtain information on the operation of the Public Reference Room by calling the SEC at 1-800-SEC-0330. The SEC also maintains a website that contains reports, proxy and information statements and other information regarding the Company that we file electronically with the SEC at www.sec.gov.
Item 1A. Risk Factors
The statements that are not historical facts contained in this Form 10-K are forward-looking statements within the meaning of the Private Securities Litigation Reform Act of 1995. These statements reflect the current belief, expectations or intent of our management and are subject to and involve certain risks and uncertainties. Many of these risks and uncertainties are outside of our control and are difficult for us to forecast or mitigate. In addition to the risks described elsewhere in this Form 10-K and in certain of our other SEC filings, the following important factors, among others, could cause our actual results to differ materially from those expressed or implied by us in any forward-looking statements contained herein or made elsewhere by or on behalf of us.
Our business may be adversely affected by unfavorable general economic and market conditions.
Our business is subject to the effects of general global and regional economic conditions, including those in the United States and, in particular, market conditions in the communications and networking industries. In the past, our operating results have been adversely affected as a result of unfavorable economic conditions and reduced or deferred capital spending in the United States, Europe, Asia, and other parts of the world.
Global and regional economic conditions continue to be volatile and uncertain. If global and/or regional economic and market conditions, or economic conditions in key markets, remain uncertain or deteriorate further, we may experience material adverse impacts on our business. Unfavorable and/or uncertain economic and market conditions may result in lower capital spending by our customers on network test and monitoring solutions, and therefore demand for our products could decline, adversely impacting our revenue and our ability to accurately forecast the future demand and revenue trends for our products and services. Challenging economic and market conditions may also impair the ability of our customers to pay for the products and services they have purchased.
In addition, prolonged unfavorable economic conditions and market turbulence may also negatively impact our contract manufacturers’ and suppliers’ capability to timely supply and manufacture our products, thereby impairing our ability to meet our contractual obligations to our customers. These effects, as well as any other currently unforeseeable effects, are difficult to forecast and mitigate. As a result, we may experience material adverse impacts on our business, operating results, financial condition, and stock price.
15
Acquisitions undertaken and any that we may undertake could be difficult to integrate, disrupt our business, dilute shareholder value and significantly harm our operating results.
Acquisitions are inherently risky and no assurance can be given that our previous acquisitions, including our 2013 acquisition of Net Optics, or any future acquisitions will be successful or will not materially and adversely affect our business, operating results or financial condition. We expect to continue to review opportunities to acquire other businesses or technologies that would add to our existing product line, complement and enhance our current products, expand the breadth of our markets, enhance our technical capabilities or otherwise offer growth opportunities. While we are not currently a party to any pending acquisition agreements, we may acquire additional businesses, products or technologies in the future. If we make any further acquisitions, we could issue stock that would dilute existing shareholders’ percentage ownership, and we could incur substantial debt or assume substantial liabilities. Acquisitions involve numerous risks, including the following:
• | problems or delays in assimilating or transitioning to Ixia the acquired operations, systems, processes, controls, technologies, products, or personnel; |
• | loss of acquired customer accounts; |
• | unanticipated costs associated with the acquisition; |
• | our failure to identify in the due diligence process significant issues with product quality or development and liabilities related to operational issues, intellectual property infringement or tax or other regulatory matters; |
• | multiple and overlapping product lines as a result of our acquisitions that are offered, priced and supported differently, which could cause customer confusion and delays in orders; |
• | higher than anticipated costs in continuing support and development of acquired products; |
• | diversion of management’s attention from our core business and the challenges of managing larger and more widespread operations resulting from acquisitions; |
• | adverse effects on existing business relationships of Ixia or the acquired business with suppliers, licensors, contract manufacturers, customers, resellers, and industry experts; |
• | significant impairment, exit and/or restructuring charges if the products or technologies acquired in an acquisition do not meet our sales expectations or are unsuccessful; |
• | insufficient revenues to offset increased expenses associated with acquisitions; |
• | risks associated with entering markets in which we have no or limited prior experience; and |
• | potential loss of the acquired organization’s or our own key employees. |
Mergers and acquisitions are inherently risky and subject to many factors outside of our control, and we cannot be certain that we would be successful in overcoming problems in connection with our past or future acquisitions. Our inability to do so could significantly harm our business, revenues and results of operations. See Note 2 in the consolidated financial statements included in this Form 10-K.
Competition in our market could significantly harm our results of operations.
The market for our products is highly competitive. We currently compete with network test and monitoring solution vendors such as Spirent Communications and Gigamon. We also compete either directly or indirectly with large Ethernet switch vendors and network management, analysis, compliance, and test tool vendors that offer point solutions that address a subset of the issues that we solve. Additionally, some of our significant customers have developed, or may develop, in-house products for their own use or for sale to others. For example, Cisco Systems, our largest customer, has used internally developed test products for a number of years. Although Cisco Systems has in the past accounted for a significant portion of our revenues, we cannot be certain that it will continue to do so.
As we broaden our product offerings, we may move into new markets and face additional competition. Moreover, our competitors may have more experience operating in these new markets and be better established with the customers in these new markets.
16
Some of our competitors and potential competitors have greater brand name recognition and greater financial, technical, marketing, sales, and distribution capabilities than we do. Moreover, our competitors may consolidate with each other, or with other companies, giving them an even greater capability to compete against us.
Increased competition in the network test and monitoring markets could result in increased pressure on us to reduce prices and could result in a reduction in our revenues and/or a decrease in our profit margins, each of which could significantly harm our results of operations. In addition, increased competition could prevent us from increasing our market share, or cause us to lose our existing market share, either of which would harm our revenues and profitability.
We cannot predict whether our current or future competitors will develop or market technologies and products that offer higher performance or more features, or that are more cost-effective than our current or future products. To remain competitive, we must continue to develop cost-effective products and product enhancements which offer higher performance and more functionality. Our failure to do so will harm our revenues and results of operations.
If we are unable to successfully develop or introduce new products to keep pace with the rapid technological changes that characterize our market, our revenues and results of operations will be significantly harmed.
The market for our products is characterized by:
• | rapid technological change such as the recent advancements of IP-based networks and wireless technologies; |
• | frequent new product introductions such as higher speed and more complex routers; |
• | evolving industry standards; |
• | changing customer needs such as the increase in advanced IP services agreed to between service providers and their customers; |
• | short product life cycles as a result of rapid changes in our customers’ products; and |
• | new paradigms like Virtualization and Software Defined Networks ("SDN"). |
Our performance will depend on our successful development and introductions, and on market acceptance, of new and enhanced products that address new technologies and changes in customer requirements. If we experience any delay in the development or introduction of new products or enhancements to our existing products, our revenues and operating results may suffer. For instance, undetected software or hardware errors, which frequently occur when new products are first introduced, could result in the delay or loss of market acceptance of our products and the loss of credibility with our customers. In addition, if we are not able to develop or license, or acquire from third parties, the underlying core technologies necessary to create new products and enhancements, our existing products are likely to become technologically obsolete over time, and our revenues and operating results will suffer. If the rate of development of new technologies and transmission protocols by our customers is delayed, the growth of the market for our products, and therefore our revenues and operating results, may be harmed.
Our ability to successfully introduce new products in a timely fashion will depend on multiple factors, including our ability to:
• | anticipate technological changes and industry trends; |
• | properly identify customer needs; |
• | innovate, develop and license or acquire new technologies and applications; |
• | hire and retain necessary technical personnel; |
• | successfully commercialize new technologies in a timely manner; |
• | timely obtain key components for the manufacture of new products; |
• | manufacture and deliver our products in sufficient volumes and on time; |
• | price our products competitively; |
• | provide high quality, timely technical support; and |
• | differentiate our offerings from our competitors’ offerings. |
17
The development of new, technologically advanced products is a complex and uncertain process requiring high levels of innovation and highly skilled engineering and development personnel, as well as the accurate anticipation of technology and market trends. We cannot be certain that we will be able to identify, develop, manufacture, market, or support new or enhanced products successfully, if at all, or on a timely or cost-effective basis. Further, we cannot be certain that any new products will gain market acceptance or that we will be able to respond effectively to technological changes, emerging industry standards or product announcements by our competitors. If we fail to respond to technological changes and the needs of our markets, our revenues, results of operations and competitive position will suffer.
We depend on sales of a narrow range of products and therefore if the markets for those products contract or do not grow and customers do not purchase our products, our revenues and results of operations would be significantly harmed.
Our business and products are concentrated in the markets for systems that analyze and measure the performance of wired and wireless IP-based networks, and systems that provide network visibility into physical and virtual networks and optimize monitoring tool performance. These markets continue to evolve, and there is uncertainty regarding the future size and scope of these markets. If these markets contract, fail to grow or grow more slowly than we expect, our revenues and results of operations would be significantly harmed. Our performance will depend on increased sales of our existing systems into our markets and the successful development, introduction and market acceptance of new and enhanced products in those markets. We cannot be certain that we will be successful in increasing these sales or in developing and introducing new products. Our failure to do so would significantly harm our revenues and results of operations.
Because we depend on a limited number of customers and on a limited customer base for a significant portion of our revenues, any cancellation, reduction or delay in purchases by one or more of these customers, and any failure by us to maintain, expand and diversify our customer base, could significantly harm our revenues and results of operations.
Historically, a limited number of customers has accounted for a significant portion of our total revenues. We expect that some customer concentration will continue for the foreseeable future and that our operating results will continue to depend to a significant extent upon revenues from a limited number of customers. Our dependence on large orders from a limited number of customers makes our relationships with these customers critical to the success of our business. We cannot be certain that we will be able to retain our largest customers, that we will be able to increase sales to our other existing customers, or that we will be able to attract additional customers. From time to time, we have experienced delays and reductions in orders from some of our major customers. In addition, our customers have sought price reductions or other concessions from us and will likely continue to do so. We typically do not have long-term or volume purchase contracts with our customers, and our customers can stop purchasing our products at any time without penalty, and they are free to purchase products from our competitors. The loss of one or more of our largest customers, any reduction or delay in sales to one of these customers, our inability to successfully develop and maintain relationships with existing and new large customers, or requirements that we make price reductions or other concessions, could significantly harm our revenues and results of operations.
Historically, the majority of our total revenues have been generated from sales to network equipment manufacturers. Our growth depends, in part, on our ability to diversify our customer base by increasing sales to service provider, enterprise and government customers. To effectively compete for the business of these customers, we must develop new products and enhancements to existing products and expand our direct and indirect sales, marketing and customer service capabilities, which will result in increases in operating costs. If we cannot offset these increases in costs with an increase in our revenues, our operating results may be adversely affected. Some of our existing and potential competitors have existing relationships with many service providers, enterprise and government customers. We cannot be certain that we will be successful in increasing our sales presence in these customer markets. Any failure by us to diversify our customer base and to increase sales in these markets would adversely affect our growth.
18
If we are unable to expand and maintain our sales and distribution channels or are unable to successfully manage our expanded sales organization, our revenues and results of operations will be harmed.
Historically, we have relied primarily on a direct sales organization, supported by distributors, resellers and other partners, to sell our products. We may not be able to successfully expand our sales and distribution channels, and the cost of any expansion may exceed the revenues that we generate as a result of the expansion. To the extent that we are successful in expanding our sales and distribution channels, we cannot be certain that we will be able to compete successfully against the significantly larger and better-funded sales and marketing operations of many of our current or potential competitors. In some cases, we may grant exclusive rights to certain distributors to market our products in their specified territories. Our distributors may not market our products effectively or devote the resources necessary to provide us with effective sales, marketing and technical support. In the past, we have had distributors who entered bankruptcy or who performed poorly and were therefore terminated as distributors of our products. Moreover, if we terminate a distribution relationship for performance-related or other reasons, we may be subject to wrongful termination claims which may result in material litigation and could adversely impact our profitability. Our inability to effectively manage our current and any expansion of our sales organization, or to maintain existing or establish new relationships with successful distributors and partners, would harm our business, revenues and results of operations.
Our large customers have substantial negotiating leverage, which may require that we agree to terms and conditions that may have an adverse effect on our business.
Large network equipment manufacturers and service providers have substantial purchasing power and leverage in negotiating contractual arrangements with us. These customers may require us to develop additional features, reduce our prices or grant other concessions. As we seek to sell more products to these large customers, we may be required to agree to such terms and conditions. These terms may affect the amounts and timing of revenue recognition and our profit margins, which may adversely affect our profitability and financial condition in the affected periods.
We cannot assure investors that we will be able to fully address the material weakness in our internal controls that existed at December 31, 2015, or that remediation efforts will be fully effective or that we will not have future material weaknesses.
Our management has identified, and we have disclosed in this Form 10-K, a control deficiency in our financial reporting process that, as of December 31, 2015, constituted a material weakness in our internal control over financial reporting. This material weakness, which relates to revenue recognition, also existed at December 31, 2014, December 31, 2013 and December 31, 2012. In 2015, we continued to implement and initiate measures to remediate this material weakness, and we plan to implement in 2016 additional appropriate measures as part of our effort to fully remediate this material weakness. There can be no assurance, however, that we will be able to fully remediate this material weakness or prevent this material weakness from re-occurring in the future.
Further, there can be no assurance that we will not suffer from other material weaknesses in the future. Our internal control over financial reporting was also ineffective as of December 31, 2014, December 31, 2013 and December 31, 2012. If we fail to remediate this material weakness or fail to otherwise maintain effective internal controls over financial reporting in the future, such failure could result in a material misstatement of our annual or quarterly financial statements that would not be prevented or detected on a timely basis and which could cause investors and other users to lose confidence in our financial statements, limit our ability to raise capital and have a negative effect on the trading price of our common stock. Additionally, failure to remediate our existing material weakness or otherwise failing to maintain effective internal controls over financial reporting may also negatively impact our operating results and financial condition, impair our ability to timely file our periodic and other reports with the SEC, adversely affect shareholders' confidence, subject us to additional litigation and regulatory actions, consume a significant amount of management's time, and cause us to incur substantial additional costs in future periods relating to the implementation of remedial measures.
19
Our quarterly and annual operating results have historically fluctuated or may fluctuate significantly in the future as a result of new product introductions, changes in judgments or estimates, and/or other factors, which could cause our stock price to decline significantly.
Our quarterly and annual operating results are difficult to predict and have fluctuated, and may continue to fluctuate, significantly due to a variety of factors, many of which are outside of our control. Some of the factors that could cause our quarterly and annual operating results to fluctuate include the other risks discussed in this “Risk Factors” section. We may experience a shortfall or delay in generating or recognizing revenues for a number of reasons. Orders on hand at the beginning of a quarter and orders generated in a quarter do not always result in the shipment of products and the recognition of revenues for that quarter. For example, the deferral or cancellation of, or failure to ship, an order by the end of the quarter in which it was made, or our inability to recognize revenue for products shipped in a quarter in which they occurred due to nonstandard terms in our sales arrangements, may adversely affect our operating results for that quarter. Our agreements with customers typically provide that the customer may delay scheduled delivery dates and cancel orders prior to shipment without significant penalty. Because we incur operating expenses based on anticipated revenues and a high percentage of our expenses are fixed in the short term, any delay in generating or recognizing forecasted revenues could significantly harm our results of operations.
In addition, a significant portion of our orders generated and product shipments in each quarter occurs near the end of the quarter. Since individual orders can represent a meaningful percentage of our revenues and net income in any quarter, the deferral or cancellation of, or failure to ship, an order in a quarter in which it was made, may result in a revenue and net income shortfall, which could cause us to fail to meet securities analysts’ expectations, our business plan projections, or financial guidance provided by us. Revenue and net income shortfall of this type, in any given quarter, may also increase the amount of our revenues and net income in future periods.
Our operating results may also vary as a result of the timing of new product releases. The introduction of a new product in any quarter may cause an increase in revenues in that quarter that may not be sustainable in subsequent quarters. Conversely, a delay in introducing a new product in a quarter may result in a decrease in revenues in that quarter and lost sales. Our results may also fluctuate based on the mix of products and services (i.e., hardware, software and extended warranty and maintenance services) ordered in a particular quarter.
Further, actual events, circumstances, outcomes, and amounts differing from judgments, assumptions and estimates used in determining the values of certain assets (including the amounts of related valuation allowances), liabilities and other items reflected in our consolidated financial statements could significantly harm our results of operations.
The factors described above are difficult to forecast and mitigate. As a consequence, operating results for a particular period are difficult to predict, and therefore, prior results are not necessarily indicative of results to be expected in future periods. Any of the foregoing factors, or any other factors discussed elsewhere herein, could have a material adverse effect on our business, results of operations and financial condition and could adversely affect our stock price.
We expect our gross margins to vary over time and our recent level of gross margins may not be sustainable, which may have a material adverse effect on our future profitability.
Our recent level of gross margins may not be sustainable and may be adversely affected by numerous factors, including:
• | increased price competition; |
• | changes in customer, geographic or product mix (such as the mix of software versus hardware product sales); |
• | new product introductions by us and by our competitors; |
• | changes in shipment volume; |
• | excess or obsolete inventory costs; |
• | increased industry consolidation among our customers, which may lead to decreased demand for, and downward pricing pressure on, our products; and |
• | increases in labor costs. |
20
Each of the above factors may be exacerbated by a decrease in demand for our established products and our transition to our next-generation products. Our failure to sustain our recent level of gross margins due to these or other factors may have a material adverse effect on our results of operations.
Our restatements in 2013 and 2014 of certain of our prior period consolidated financial statements and any future required restatements may affect shareholder confidence, may consume a significant amount of our time and resources, and may have a material adverse effect on our business and stock price.
In recent years we have restated certain of our prior period consolidated financial statements in our filings with the SEC, including in our Annual Report on Form 10-K for the year ended December 31, 2012 and in our Quarterly Reports on Form 10-Q/A for the quarters ended March 31, 2013 and June 30, 2013. Those restatements corrected certain errors in our previously filed financial statements, including errors in the timing of revenue recognition. We cannot be certain that the measures we have taken since we completed the restatements will ensure that restatements will not occur in the future. Those restatements and any future restatements may affect investor confidence in the accuracy of our financial statements and disclosures, may raise reputational issues for our business and may result in a decline in our share price and the filing of shareholder lawsuits.
Restatements are typically resource-intensive and involve a significant amount of internal resources, including attention from management, and significant legal and accounting costs. Although we completed our restatement filings in June 2014, we cannot guarantee that we will not receive further inquiries from the SEC or The Nasdaq Stock Market (“Nasdaq”) regarding our restated financial statements or matters relating thereto or that our restated financial statements for the quarterly periods will not become the subject of additional shareholder lawsuits. Any future inquiries from the SEC or Nasdaq as a result of our 2013 and 2014 restatements may, regardless of the outcome, likely consume a significant amount of our internal resources and result in additional legal and accounting costs.
We are subject to a shareholder class action and a consolidated shareholder derivative action, as well as a pending SEC investigation, and these lawsuits and investigation and any future such lawsuits and investigations may adversely affect our business, financial condition, results of operations and cash flows.
We and certain of our current and former executive officers and directors are defendants in a federal securities class action lawsuit and in a shareholder derivative action. These lawsuits and the SEC investigation, including their current status, are described in Part I, Item 3 “Legal Proceedings” in this Form 10-K. While we have reached proposed settlements in both such lawsuits and we are in discussions with the Staff of the SEC’s Division of Enforcement concerning a proposed settlement of the SEC investigation, we cannot guarantee the outcome of such matters. These and any similar future matters may divert our attention from our ordinary business operations, and we may incur significant expenses associated with them (including, without limitation, substantial attorneys’ fees and other fees of professional advisors and potential obligations to indemnify current and former officers and directors who are or may become parties to or involved in such matters). Depending on the outcome of such matters, we could be required to pay material damages and fines, consent to injunctions on future conduct, and/or suffer other penalties, remedies, or sanctions. Accordingly, the ultimate resolution of these pending matters or any similar future matters could have a material adverse effect on our business, financial condition, results of operations, cash flows, liquidity, and ability to meet our debt obligations and could negatively impact the trading price of our common stock. Any existing or future shareholder lawsuits and governmental investigations and/or any future governmental enforcement actions could also adversely impact our reputation, our relationships with our customers, and our ability to generate revenue.
The loss of any of our key personnel could significantly harm our business, results of operations and competitive position.
In order to compete, we must attract, retain, and motivate executives and other key employees. Hiring and retaining qualified executives, scientists, engineers, technical staff, and sales representatives are critical to our business, and competition for experienced employees in our industry can be intense. To help attract, retain, and motivate qualified employees, we use share-based incentive awards such as employee stock options and restricted stock units. If the value of such stock awards does not appreciate as measured by the performance of the price of our common stock, or if our share-based compensation otherwise ceases to be viewed as a valuable benefit, our ability to attract, retain, and motivate employees could be weakened, which could harm our results of operations.
Moreover, companies in our industry whose employees accept positions with competitors frequently claim that those competitors have engaged in unfair hiring practices. We may be subject to such claims as we seek to retain or hire qualified personnel, some of whom may currently be working for our competitors. Some of these claims may result in material litigation. We could incur substantial costs in defending ourselves against these claims, regardless of their merits. Such claims could also discourage potential employees who currently work for our competitors from joining us.
21
Any loss of the services of executives and key employees and the inability to attract or retain qualified executives and key employees may adversely affect our ability to achieve our business objectives, including without limitation our ability to successfully market and sell our products and services, our ability to develop new products and product enhancements, our ability to support our products, and our ability to pursue strategic business growth and development objectives.
Some key components in our products come from sole or limited sources of supply, which exposes us to potential supply shortages that could disrupt the manufacture and sale of our products.
We and our contract manufacturers currently purchase a number of key components used to manufacture our products from sole or limited sources of supply for which alternative sources may not be available. From time to time, we have experienced shortages of key components, including chips, oscillators, memory devices and optical modules. We and our contract manufacturers have no guaranteed or long-term supply arrangements for these or other components, including field programmable gate arrays ("FPGAs") and NPs, which are integrated circuits that can be repeatedly reprogrammed to perform different sets of functions as required. Financial or other difficulties faced by our suppliers or significant changes in market demand for necessary components could limit the availability to us and our contract manufacturers of these components. Any interruption or delay in the supply of any of these components could significantly harm our ability to meet scheduled product deliveries to our customers and cause us to lose sales.
In addition, the purchase of these components on a sole or limited source basis subjects us to risks of price increases and potential quality assurance problems. Consolidation involving suppliers could further reduce the number of alternatives available to us and affect the availability and cost of components. An increase in the cost of components could make our products less competitive and result in lower gross margins.
There are limited substitute supplies available for many of these components, including FPGAs. All of these components are critical to the production of our products, and competition exists with other manufacturers for these key components. In the event that we can no longer obtain materials from a sole source supplier, we might not be able to qualify or identify alternative suppliers in a timely fashion, or at all. Any extended interruption in the supply of any of the key components currently obtained from a sole or limited source or delay in transitioning to a replacement supplier’s product or replacement component into our systems could disrupt our operations and significantly harm our business in any given period.
Failure by our contract manufacturers to provide us with adequate supplies of high quality products could harm our revenues, results of operations, competitive position and reputation.
We currently rely on a limited number of contract manufacturers to manufacture and assemble our products. We may experience delays in receiving product shipments from contract manufacturers or other problems, such as inferior quality and insufficient quantity of product. We cannot be certain that we will be able to effectively manage our contract manufacturers or that these manufacturers will meet our future requirements for timely delivery of products of sufficient quality and quantity. We intend to introduce new products and product enhancements, which will require that we rapidly achieve adequate production volumes by effectively coordinating with our suppliers and contract manufacturers. The inability of our contract manufacturers to provide us with adequate supplies of high-quality products or the loss of any of our contract manufacturers would cause a delay in our ability to fulfill customer orders while we obtain a replacement manufacturer and would harm our revenues, results of operations, competitive position and reputation.
If we fail to accurately forecast our manufacturing requirements, we could incur additional costs and experience manufacturing delays.
We provide our contract manufacturers with rolling forecasts based on anticipated product orders to determine our manufacturing requirements. Some of the components used in our products have significant lead times or lead times which may unexpectedly increase depending on factors such as the specific supplier, contract terms and the demand for components at a given time. Because of these long lead times, we are often required to forecast and order products before we know what our specific manufacturing requirements will be. If we overestimate our product orders, our contract manufacturers may have excess inventory of completed products which we would be obligated to purchase. This will lead to increased costs and the risk of obsolescence. If we underestimate our product orders, our contract manufacturers may have inadequate inventory, which could result in delays in shipments, the loss or deferral of revenues and/or higher costs of sales. Costs are also added to our products when we are required to expedite delivery of our products to customers or of components with long lead times to our contract manufacturers. We cannot be certain that we will be able to accurately forecast our product orders and may in the future carry excess or obsolete inventory, be unable to fulfill customer demand, or both, thereby harming our revenues, results of operations and customer relationships.
22
Continued growth will strain our operations and require us to incur costs to maintain and upgrade our management and operational resources.
We have experienced growth in our operations, including number of employees, sales, products, facility locations and customers, including as a result of our prior acquisitions, and expect to continue to experience growth in the future. Unless we manage our past and future growth effectively, we may have difficulty in operating our business. As a result, we may inaccurately forecast sales and materials requirements, fail to integrate new personnel or fail to maintain adequate internal controls or systems, which may result in fluctuations in our operating results and cause the price of our stock to decline. We may continue to expand our operations to enhance our product development efforts and broaden our sales reach, which may place a significant strain on our management and operational resources. In order to manage our growth effectively, we must improve and implement our operational systems, procedures and controls on a timely basis. If we cannot manage growth effectively, our profitability could be significantly harmed.
Changes in industry and market conditions could lead to charges related to discontinuances of certain of our products and asset impairments.
In response to changes in industry and market conditions, we may be required to strategically realign our resources by restructuring our operations and/or our product offerings. Any decision to limit investment in or dispose of a product offering may result in the recording of special charges to earnings, such as inventory, fixed asset and technology-related write-offs and charges relating to consolidation of excess facilities, which could adversely impact our business, results of operations and financial position.
International activity may increase our cost of doing business or disrupt our business.
We plan to continue to maintain or expand our international operations and sales activities. Operating internationally involves inherent risks that we may not be able to control, including:
• | difficulties in recruiting, hiring, training and retaining international personnel; |
• | increased complexity and costs of managing international operations; |
• | growing demand for and cost of technical personnel; |
• | changing governmental laws and regulations, including those related to income taxes, the UK Anti-Bribery Act, and the Foreign Corrupt Practices Act; |
• | increased exposure to foreign currency exchange rate fluctuations; |
• | political and economic instability, including military conflict and social unrest; |
• | commercial laws and business practices that favor local competition; |
• | differing labor and employment laws; |
• | supporting multiple languages; |
• | reduced or limited protections of intellectual property rights; |
• | more complicated logistical and distribution arrangements; and |
• | longer accounts receivable cycles and difficulties in collecting receivables. |
The above risks associated with our international operations and sales activities can restrict or adversely affect our ability to sell in international markets, disrupt our business and subject us to additional costs of doing business.
23
Our reported financial results could suffer if there is an impairment of goodwill or acquired intangible assets.
We are required to (i) test annually, and review when circumstances warrant, the value of our goodwill associated with acquisitions, and (ii) test the value of our acquisition-related intangible assets when circumstances warrant determining if an impairment has occurred. If such assets are deemed impaired, an impairment loss equal to the amount by which the applicable carrying amount exceeds (i) the implied fair value of the goodwill or (ii) the estimated fair value of acquired intangible assets would be recognized. This would result in an incremental charge for that quarter which would adversely impact our earnings for the period in which the impairment was determined to have occurred. For example, such impairment could occur if the market value of our common stock falls below the carrying value of our net assets for a sustained period. Recent economic downturns have contributed to extreme price and volume fluctuations in global stock markets that have reduced the market price of many technology company stocks, including ours. Such declines in our stock price or the failure of our stock price to recover from these declines, as well as any marked decline in our level of revenues or profit margins increase the risk that goodwill may become impaired in future periods. We cannot accurately predict the amount and timing of any impairment of our goodwill or acquired intangible assets.
Legal proceedings may harm our business, results of operations and financial condition.
We are a party to lawsuits and other legal proceedings in the normal course of our business. Litigation and other legal proceedings can be expensive, lengthy and disruptive to normal business operations. Moreover, the results of complex legal proceedings are difficult to predict. We cannot provide assurance that we will not be a party to additional legal proceedings in the future or that we will be able to favorably resolve our current lawsuits. To the extent legal proceedings continue for long time periods or are adversely resolved, our business, results of operations and financial position could be significantly harmed. For additional information regarding certain of the legal matters in which we are involved, see Item 3, “Legal Proceedings,” contained in Part I of this Form 10-K and in Note 10 to the consolidated financial statements included in this Form 10-K. For information regarding the risks associated with the shareholder class action and the consolidated shareholder derivative action, see “We are subject to a shareholder class action and a consolidated shareholder derivative action, as well as a pending SEC investigation, and these lawsuits and investigation and any future such lawsuits and investigations may adversely affect our business, financial condition, results of operations and cash flows” above.
Claims that we infringe third-party intellectual property rights could result in significant expenses or restrictions on our ability to sell our products.
From time to time, other parties may assert patent, copyright, trademark, and other intellectual property rights to technologies and items that are important to our business. We cannot provide assurance that others will not claim that we have infringed upon or misappropriated their intellectual property rights or that we do not in fact infringe upon or misappropriate those intellectual property rights. We have not generally conducted searches to determine whether the technology we have in our products infringes or misappropriates intellectual property rights held by third parties.
Any claims asserting that any of our products or services infringe or misappropriate proprietary rights of third parties, if determined adversely to us, could significantly affect our ability to conduct business and harm our results of operations. Any such claims, with or without merit, could:
• | be time-consuming; |
• | result in costly and protracted litigation; |
• | divert the efforts of our technical and management personnel; |
• | require us to modify the products or services at issue or to develop alternative technology, thereby causing delivery delays and the loss or deferral of revenues; |
• | require us to cease selling the products or services at issue; |
• | require us to pay substantial damage awards; |
• | expose us to indemnity claims from our customers; |
• | damage our reputation; or |
• | require us to enter into royalty or licensing agreements which, if required, may not be available on terms acceptable to us, if at all. |
24
In the event any such claim against us was successful and we could not obtain a license to the relevant technology on acceptable terms, license a substitute technology or redesign our products or services to avoid infringement or misappropriation, our revenues, results of operations, and competitive position could be harmed.
The inability to successfully defend claims from taxing authorities or the adoption of new tax legislation could adversely affect our operating results and financial position.
We conduct business in many countries, which requires us to interpret the income tax laws and rulings in each of those jurisdictions. Due to the complexity of tax laws in those jurisdictions as well as the subjectivity of factual interpretations, our estimates of income tax liabilities may differ from actual payments or assessments. Claims from tax authorities related to these differences could have an adverse impact on our results of operations, financial condition and cash flows. In addition, legislative bodies in the various countries in which we do business may from time to time adopt new tax legislation that could have a material adverse effect on our results of operations, financial condition and cash flows.
To the extent that our customers consolidate, they may reduce purchases of our products and demand more favorable terms and conditions from us, which would harm our revenues and profitability.
Consolidation of our customers could reduce the number of customers to whom our products could be sold. These merged customers could obtain products from a source other than us or demand more favorable terms and conditions from us, which would harm our revenues and profitability. In addition, our significant customers may merge with or acquire our competitors and discontinue their relationships with us.
Restructuring our workforce can be disruptive and harm our operating results and financial condition.
We have in the past restructured or made other adjustments to our workforce in response to the economic environment, performance issues, acquisitions and other internal and external considerations. Restructurings can among other things result in a temporary lack of focus and reduced productivity. These effects could recur in connection with future acquisitions and other restructurings and, as a result, our operating results and financial condition could be negatively affected.
Our products may contain defects which may cause us to incur significant costs, divert our attention from product development efforts and result in a loss of customers.
Our existing products and any new or enhanced products we introduce may contain undetected software or hardware defects when they are first introduced or as new versions are released. These problems may cause us to incur significant damages or warranty and repair costs, divert the attention of our engineering personnel from our product development efforts and cause significant customer relation problems or loss of customers and reputation, all of which would harm our results of operations. A successful claim against us for an amount exceeding the coverage limit on our product liability insurance policy would force us to use our own resources, to the extent available, to pay the claim, which could result in an increase in our expenses and a reduction of our working capital available for other uses, thereby harming our profitability and capital resources.
Our failure to protect our intellectual property may significantly harm our results of operations and reputation.
Our success and ability to compete is dependent in part on our ability to establish, protect and maintain our proprietary rights to our intellectual property. We currently rely on a combination of patent, trade secret, trademark, and copyright laws, and restrictions on disclosure and use, to establish, protect, and maintain our intellectual property rights. To date, we have relied primarily on trade secret laws to protect our proprietary processes and know-how. We also have patent applications and existing patents in the United States and other jurisdictions. We cannot be certain that any of these applications will be approved or that any such patents, if issued, or our existing patents, will be upheld. We also cannot be certain that our existing patents and any such additional patents, if issued, will be effective in protecting our proprietary technology.
We generally enter into assignment of rights and confidentiality agreements with our officers, employees and consultants. We also generally limit access to and distribution of our source code and further limit the disclosure and use of our other proprietary information. However, these measures provide only limited protection of our intellectual property rights. In addition, we may not have signed agreements containing adequate protective provisions in every case, and the contractual provisions that are in place may not provide us with adequate protection in all circumstances. Any infringement or misappropriation of our intellectual property rights could result in significant litigation costs, and any failure to adequately protect our intellectual property rights could result in our competitors’ offering similar products, potentially resulting in loss of one or more competitive advantages, loss of market share and decreased revenues.
25
Despite our efforts to protect our intellectual property rights, existing trade secret, copyright, patent, and trademark laws afford us only limited protection. In addition, the laws of some foreign countries do not protect our intellectual property rights to the same extent as do the laws of the United States. Accordingly, we may not be able to prevent misappropriation of our proprietary technologies or to deter others from developing similar technologies. Others may attempt to copy or reverse engineer aspects of our products or to obtain and use information that we regard as proprietary. Further, monitoring the unauthorized use of our products and our intellectual property rights is difficult. Litigation may be necessary to enforce our intellectual property rights or to determine the validity and scope of the proprietary rights of others. Litigation of this type could result in substantial costs and diversion of resources and could significantly harm our results of operations and reputation.
We have outstanding debt under our Credit Facility and may incur additional debt in the future, which could adversely affect our financial condition, liquidity, and results of operations.
On March 2, 2015, we entered into an amended and restated credit agreement establishing a senior secured credit facility (the “Credit Facility”) with certain institutional lenders. The amended and restated credit agreement, as amended to date, provides for a (i) term loan in the aggregate principal amount of $40 million, which was advanced to us on March 3, 2015, and (ii) revolving credit facility which was in the original aggregate amount of up to $60 million. Pursuant to amendments to the credit agreement and among other changes effected by such amendments, the maximum aggregate amount of the revolving credit facility was increased from $65 million to $75 million in September 2015 and to $150 million in January 2016. For additional information regarding our March 2015 credit facility, see Note 3 to the consolidated financial statements included in this Form 10-K.
While no amounts are currently outstanding under the revolving credit facility, we may in the future borrow amounts under the revolving credit facility or any other credit facilities that we may obtain and use the proceeds to fund working capital needs and capital expenditures and for other general corporate purposes, including acquisitions and stock repurchases. Increases in our aggregate levels of debt may adversely affect our operating results and financial condition by, among other things:
• | increasing our vulnerability to downturns in our business, competitive pressures and adverse economic and industry conditions; |
• | requiring the dedication of an increased portion of our expected cash from operations to service our indebtedness, thereby reducing the amount of expected cash flow available for other purposes; and |
• | limiting our flexibility in planning for, or reacting to, changes in our business and our industry. |
In addition, servicing our existing debt or increases in our aggregate levels of debt will depend on our future performance, which is subject to economic, financial, competitive, and other factors, many of which are beyond our control. Our business may not continue to generate cash flow from operations in the future sufficient to service our existing and any new indebtedness and to make necessary capital expenditures. If we are unable to generate sufficient cash flow, we may be required to adopt one or more alternatives, such as restructuring debt, obtaining additional equity capital on terms that may be onerous or highly dilutive, or selling assets. Our ability to refinance our indebtedness will depend on the capital markets and our financial condition at such time. We may not be able to engage in any of these activities or engage in these activities on desirable terms, which could result in a default under current and any future debt obligations. As a result, our business and financial condition could be materially and adversely affected.
If we fail to comply with certain covenants under our Credit Facility, any borrowings must be repaid, we may be prevented from further borrowing and/or the Credit Facility may be terminated by the lenders.
Our Credit Facility imposes restrictions on us, including restrictions on our ability to create liens on our assets and the ability of certain of our subsidiaries to incur indebtedness, and requires us to maintain compliance with specified financial ratios. The financial covenants in the related credit agreement require us to maintain a minimum consolidated fixed charge coverage ratio and a maximum consolidated total leverage ratio. The credit agreement that provides for our Credit Facility also requires us, among other things, to timely deliver certain financial statements to the lenders. Our failure to comply with such covenants or any other breach of the credit agreement could cause a default under the credit agreement. We may then be required to repay borrowings under the Credit Facility with capital from other sources. We could also be blocked from borrowing or obtaining letters of credit under the Credit Facility, and the credit agreement could be terminated by the lenders. Under these circumstances, other sources of capital may not be available or may be available only on unfavorable terms. In the event of a default, it is possible that our assets and certain of our subsidiaries’ assets may be attached or seized by the lenders. Any failure by us to comply with the covenants or other provisions of the credit agreement or any difficulty in securing any required future financing and any such seizure or attachment of assets could have a material adverse effect on our business and financial condition.
26
The issuance of shares of our common stock in any equity offering by the Company or upon any conversion of any convertible debt that we may issue in the future would dilute the ownership interest of our existing shareholders.
The issuance of shares of our common stock in any equity financing by us or upon conversion of any convertible debt we may issue in the future would dilute the ownership interests of our existing shareholders. Any sales in the public market of our common stock issuable in any such financing or upon any such conversion could adversely affect prevailing market prices of our common stock. In addition, the existence of any convertible debt, if issued in the future, may encourage short selling by market participants because the conversion of that convertible debt could depress the price of our common stock.
Our investment portfolio may become impaired by deterioration of the financial markets.
We follow an established investment policy and set of objectives designed to preserve principal and liquidity, to generate a market return given the policy’s guidelines and to avoid certain investment concentrations. The policy also sets forth credit quality standards and limits our exposure to any one non-government issuer. Our investment portfolio as of December 31, 2015 consisted of money market funds and U.S. Treasury, government agency and corporate debt securities.
These investments are classified as available-for-sale and are recorded on our consolidated balance sheets at fair value. Although our investment portfolio’s amortized cost approximated fair value as of December 31, 2015, we cannot predict future market conditions or market liquidity, or the future value of our investments. As a result, we can provide no assurance that our investment portfolio will not be impaired in the future and that any such impairment will not materially and adversely impact our financial condition, results of operations and cash flows.
Our business is subject to changing regulation that has resulted in increased costs and may continue to result in additional costs in the future.
We are subject to laws, rules and regulations of federal and state regulatory authorities, including the Nasdaq and financial market entities charged with the protection of investors and the oversight of companies whose securities are publicly traded. In recent years, these entities, including the Public Company Accounting Oversight Board, the SEC and the Nasdaq, have issued new requirements and regulations and continue to develop additional regulations and requirements partly in response to laws enacted by Congress, most notably the Sarbanes-Oxley Act of 2002 (“SOX”) and, more recently, the Dodd-Frank Wall Street Reform and Consumer Protection Act (the “Dodd-Frank Act”). Our efforts to comply with these requirements and regulations have resulted in, and are likely to continue to result in, increased general and administrative expenses and a diversion of substantial management time and attention from revenue-generating activities to compliance activities.
In particular, our efforts to comply with Section 404 of SOX and the related regulations regarding our required assessment of our internal control over financial reporting and our independent registered public accounting firm’s audit of the effectiveness of our internal control over financial reporting, have required, and continue to require, the commitment of significant financial and managerial resources. To the extent that we identify areas of our disclosures controls and procedures and/or internal controls requiring improvement (such as the material weakness that existed as of December 31, 2015, as discussed in Item 9A herein), we may have to incur additional costs and divert management’s time and attention.
Because these laws, regulations and standards are subject to varying interpretations, their application in practice may evolve over time as new guidance becomes available. This evolution may result in continuing uncertainty regarding compliance matters and additional costs necessitated by ongoing revisions to our disclosure and governance practices.
We are also subject to laws, rules and regulations of authorities in other countries where we do business, and these laws, rules and regulations are also subject to change and uncertainty regarding their application and interpretation. The growth of our operations, both domestically and internationally, has resulted in and is likely to continue to result in increased expense, resources and time spent on matters relating to compliance, including monitoring and training activities.
27
Compliance with recently adopted rules of the SEC relating to “conflict minerals” may require us and our suppliers to incur substantial expense and may limit the supply and increase the costs of certain metals and minerals used in the manufacturing of our products.
In 2012, the SEC adopted disclosure requirements under Section 1502 of the Dodd-Frank Act regarding the source of certain conflict minerals for issuers for which such conflict minerals are necessary to the functionality or production of a product manufactured, or contracted to be manufactured, by that issuer, which are mined from the Democratic Republic of Congo (“DRC”) and adjoining countries. The metals covered by the rules include tin, tantalum, tungsten and gold, commonly referred to as “3TG.” Because Ixia contracts to manufacture products which may contain tin, tantalum, tungsten, or gold, we will be required under these rules to determine whether those minerals are necessary to the functionality or production of our products and, if so, the rules require us to conduct a reasonable country of origin inquiry to determine if we know or have reason to believe any of the minerals used in the production process may have originated from the DRC or an adjoining country (collectively referred to as “covered countries”). The time required to be spent by our management and the management of our suppliers in this endeavor could be significant. There may be material costs associated with complying with the disclosure requirements, such as costs related to the due diligence process of determining the source of certain minerals used in our products, as well as costs of possible changes to products, processes or sources of supply as a consequence of such verification activities. There can be no assurance that these costs will not have an adverse effect on our business, financial condition or results of operations.
The implementation of these requirements could affect the sourcing and availability of products we purchase from our suppliers and contract manufacturers. This may also reduce the number of suppliers who provide products containing conflict free metals, and may affect our ability to obtain products in sufficient quantities, in a timely manner or at competitive prices. Our material sourcing is broad based and multi-tiered, and we may not be able to easily verify the origins for all metals used in our products. We may also encounter challenges to satisfy those customers who require that all of the components of our products be certified as conflict-free, which could place us at a competitive disadvantage if we are unable to do so.
If we fail to maintain our relationships with industry experts, our products may lose industry and market recognition and sales could decline.
Our relationships with industry experts, in particular in the field of performance analysis and measurement of networks and network equipment, are critical for maintaining our industry credibility and for developing new products. These experts have established standard testing methodologies that evaluate new network equipment products and technologies. We provide these experts and their testing labs with our products and engineering assistance to perform tests on these new network equipment products and technologies. These industry experts refer to our products in their publications which has given our products industry recognition. In addition, these labs offer us the opportunity to test our products on the newest network equipment and technologies, thereby assisting us in developing new products that are designed to meet evolving technological needs. We cannot be certain that we will be able to maintain our relationships with industry experts or that our competitors will not maintain similar or superior relationships with industry experts. If we are unable to maintain our relationships with industry experts or if competitors have superior relationships with them, our products may lose industry and market recognition which could harm our reputation and competitive position and cause our sales to decline.
Man-made problems such as cybersecurity attacks, computer viruses or terrorism may disrupt our operations and harm our business, reputation and operating results.
Our daily business operations require us to retain sensitive data such as intellectual property, proprietary business information, confidential employee information, and data related to customers, suppliers and business partners within our networking infrastructure. The ongoing maintenance and security of this information is pertinent to the success of our business operations and our strategic goals, and organizations like Ixia are susceptible to multiple variations of attacks on our networks on a daily basis.
Despite our implementation of network security measures, our network may be vulnerable to cybersecurity attacks, computer viruses, break-ins, and similar disruptions. Cybersecurity attacks, in particular, are evolving and include, but are not limited to, malicious software, attempts to gain unauthorized access to data and other electronic security breaches that could lead to disruptions in systems, unauthorized release of confidential or otherwise protected information and corruption of data. Any such event could, among other negative consequences, disrupt our operations, harm our reputation and customer relationships, result in claims and litigation against us, and impose on us the costs of investigation, notification, and remediation. Accordingly, any such event could have a material adverse effect on our business, operating results and financial condition.
28
Our networking infrastructure and related assets may be subject to unauthorized access by hackers, employee errors or other unforeseen activities. Such issues could result in the disruption of business processes, network degradation and system downtime, along with the potential that a third party will exploit our critical assets such as intellectual property, proprietary business information and data related to our customers, suppliers and business partners. To the extent that such disruptions occur, they may cause delays in the manufacture or shipment of our products and the cancellation of customer orders and, as a result, our business operating results and financial condition could be materially and adversely affected resulting in a possible loss of business or brand reputation.
In addition, the effects of war or acts of terrorism could have a material adverse effect on our business, operating results and financial condition. The continued threat of terrorism and heightened security and military action in response to this threat, or any future acts of terrorism, may cause further disruption to the economy and create further uncertainties in the economy. Energy shortages, such as gas or electricity shortages, could have similar negative impacts. To the extent that such disruptions or uncertainties result in delays or cancellations of customer orders or the manufacture or shipment of our products, our business, operating results and financial condition could be materially and adversely affected.
Our business and operations are subject to the risks of earthquakes, floods, hurricanes, and other natural disasters.
Our operations could be subject to natural disasters and other business disruptions, which could adversely affect our business and financial results. A number of our facilities and those of our suppliers, our contract manufacturers, and our customers are located in areas that have been affected by natural disasters such as ice and snow storms, earthquakes, floods, or hurricanes in the past. For example, currently, our corporate headquarters and many of our customers are located in California. California historically has been vulnerable to natural disasters and other risks, such as earthquakes, fires and floods, which at times have disrupted the local economy and posed physical risks to our property. To mitigate some of this risk, certain of our U.S. and international locations are insured up to certain levels against losses and interruptions caused by earthquakes, floods and/or other natural disasters. However, there can be no guarantee that such insurance may be adequate in the event of a natural disaster, and a significant natural disaster could have a material adverse impact on our business, operating results and financial condition.
Our use of open source software in our products could adversely affect our ability to sell our products and subject us to possible litigation.
Many of our products contain software modules licensed to us by third-party authors under “open source” licenses. If we combine our proprietary software with open source software in a certain manner and then distribute the combined software, we could, under certain open source licenses, be required to license that combined software under the terms of that open source license as well as release the source code of the combined software to third parties. This could allow third parties to use our proprietary software at no charge, could enable our competitors to create similar products with lower development effort and time, and ultimately could result in a loss of product sales and lower revenues for us.
Although we attempt to monitor our use of open source software to avoid subjecting our products to conditions we do not intend, we cannot assure you that our processes for controlling our use of open source software in our products will be effective. Further, there have been claims against companies that distribute or use open source software in their products and services, asserting that open source software infringes the claimants’ intellectual property rights. We could be subject to lawsuits by parties claiming infringement of intellectual property rights in what we believe to be licensed open source software. If we are held to have breached the terms of an open source software license, we could be required to: (i) seek licenses from third parties to continue offering our products; (ii) re-engineer our products; (iii) discontinue the sale of our products if re-engineering could not be accomplished in a timely manner; (iv) allow third parties to use our products at no charge under the terms of that open source software license; or (v) make generally available, in source code form, our proprietary software; any of which could adversely affect our business, operating results and financial condition.
In addition to risks related to license requirements, use of open source software can lead to greater risks than use of third-party commercial software, as open source licensors generally do not provide warranties or assurance of title or controls on origin of the software. Many of the risks associated with the use of open source software, such as the lack of warranties or assurances of title, cannot be eliminated, and could, if not properly addressed, adversely affect our business.
29
Provisions of our articles of incorporation and bylaws may make it difficult for a third party to acquire us, despite the possible benefits to our shareholders.
Our Board of Directors has the authority to issue up to 1,000,000 shares of preferred stock and to determine the price, rights, preferences, privileges, and restrictions, including voting rights, of those shares without any further vote or action by the shareholders. The rights of the holders of our common stock are subject to, and may be adversely affected by, the rights of the holders of any preferred stock that we may issue. The issuance of preferred stock could have the effect of making it more difficult for a third party to acquire a majority of our outstanding voting stock. Furthermore, some provisions of our articles of incorporation and bylaws could delay or make more difficult a merger, tender offer or proxy contest involving us. Our articles of incorporation include provisions that limit the persons who may call special meetings of shareholders and establish advance notice requirements for nominations for election to our Board of Directors and/or for proposing matters that can be acted on by shareholders at shareholder meetings. These and other provisions of our articles of incorporation and bylaws may have the effect of delaying, deferring or preventing a change in our control despite possible benefits to our shareholders, may discourage bids at a premium over the market price of our common stock and may harm the market price of our common stock and the voting and other rights of our shareholders.
Our stock price may continue to be volatile.
The trading price of our common stock has fluctuated substantially in recent years. The trading price may be subject to future fluctuations in response to, among other events and factors: (i) the global economic environment; (ii) variations in our quarterly operating results; (iii) the gain, loss or timing of significant orders; (iv) changes in earnings estimates by analysts who cover our stock or the stock of our competitors; (v) changes in our revenue and/or earnings guidance as periodically announced in our earnings calls or press releases; (vi) announcements of technological innovations and new products by us or our competitors; (vii) changes in domestic and international economic, political and business conditions; (viii) consolidation and general conditions in our industry; (ix) the announcement of significant transactions, such as a proposed business acquisition; and (x) changes in our executive management team. In addition, the stock market in general has experienced extreme price and volume fluctuations that have affected the market prices for many companies in our industry that have been unrelated to the operating performance of these companies. These market fluctuations have affected and may continue to affect the market price of our common stock.
Item 1B. Unresolved Staff Comments
Not applicable.
Item 2. Properties
As of December 31, 2015, our leased and owned properties in total provided us with aggregate square footage of approximately 446,000, of which approximately 1,000 square feet is owned. Our corporate headquarters are located in Calabasas, California, where we currently lease approximately 116,000 square feet of space which houses research and development, sales and marketing, finance and administration, and manufacturing operations. This lease terminates on May 31, 2023, with no extension options. We also lease office space for sales, support, marketing, operations and administration in the United Kingdom, Ireland, Germany, France, Finland, Sweden, Canada, South Korea, Japan, China, Singapore, India, Malaysia, United Arab Emirates, Russia, Spain, Brazil, and Israel and in various states throughout the United States. Additionally, we have leased research and development facilities in Romania, India, and Canada. We believe that our existing properties, including both owned and leased sites, will be adequate to meet our needs for the next 12 months, or that we will be able to obtain additional space when and as needed on acceptable terms.
From time to time we consider various alternatives related to our long-term facility needs. While we believe our existing facilities are adequate to meet our needs for the next 12 months, it may become necessary to lease or acquire additional or alternative space to accommodate future business needs.
Item 3. Legal Proceedings
For information on our legal proceedings, see Note 10 to the consolidated financial statements included in this Form 10-K.
Item 4. Mine Safety Disclosures
Not applicable.
30
PART II
Item 5. Market for Registrant’s Common Equity, Related Shareholder Matters and Issuer Purchases of Equity Securities
(a) | Market Price, Dividends and Related Matters |
Our Common Stock is traded on the Nasdaq Global Select Market under the symbol “XXIA.” The following table sets forth the high and low sales prices of our Common Stock as reported on the Nasdaq Global Select Market for the following time periods.
High | Low | ||||||
2015 | |||||||
Fourth quarter | $ | 15.50 | $ | 12.34 | |||
Third quarter | 16.05 | 12.08 | |||||
Second quarter | 13.51 | 11.45 | |||||
First quarter | 12.54 | 9.84 | |||||
2014 | |||||||
Fourth quarter | $ | 11.38 | $ | 8.40 | |||
Third quarter | 11.78 | 8.77 | |||||
Second quarter | 13.27 | 11.14 | |||||
First quarter | 14.65 | 11.94 | |||||
As of February 22, 2016, there were approximately 14 registered shareholders of record.
We have never declared or paid cash dividends on our Common Stock and do not anticipate paying any dividends in the foreseeable future. In addition, the terms of our credit facility established in March 2015 limit our ability to pay cash dividends on our capital stock.
31
The following graph compares the cumulative total return on our common stock with the cumulative total returns of the Nasdaq Composite Index and the Nasdaq Telecommunications Index for the five-year period commencing December 31, 2010. We are one of the companies that make up the Nasdaq Telecommunications Index. An investment of $100 (with reinvestment of all dividends) is assumed to have been made in our Common Stock and in each of the indices on December 31, 2010, and their relative performance is tracked through December 31, 2015. These indices are included only for comparative purposes as required by the rules of the Securities and Exchange Commission and do not necessarily reflect management’s opinion that such indices are an appropriate measure of the relative performance of the our Common Stock. The stock price performance shown on the graph below is not necessarily indicative of future price performance. This graph shall not be deemed "filed" for purposes of Section 18 of the Exchange Act, or otherwise subject to the liabilities under that Section and shall not be deemed to be incorporated by reference into any filing of Ixia under the Securities Act of 1933, as amended, or the Exchange Act.
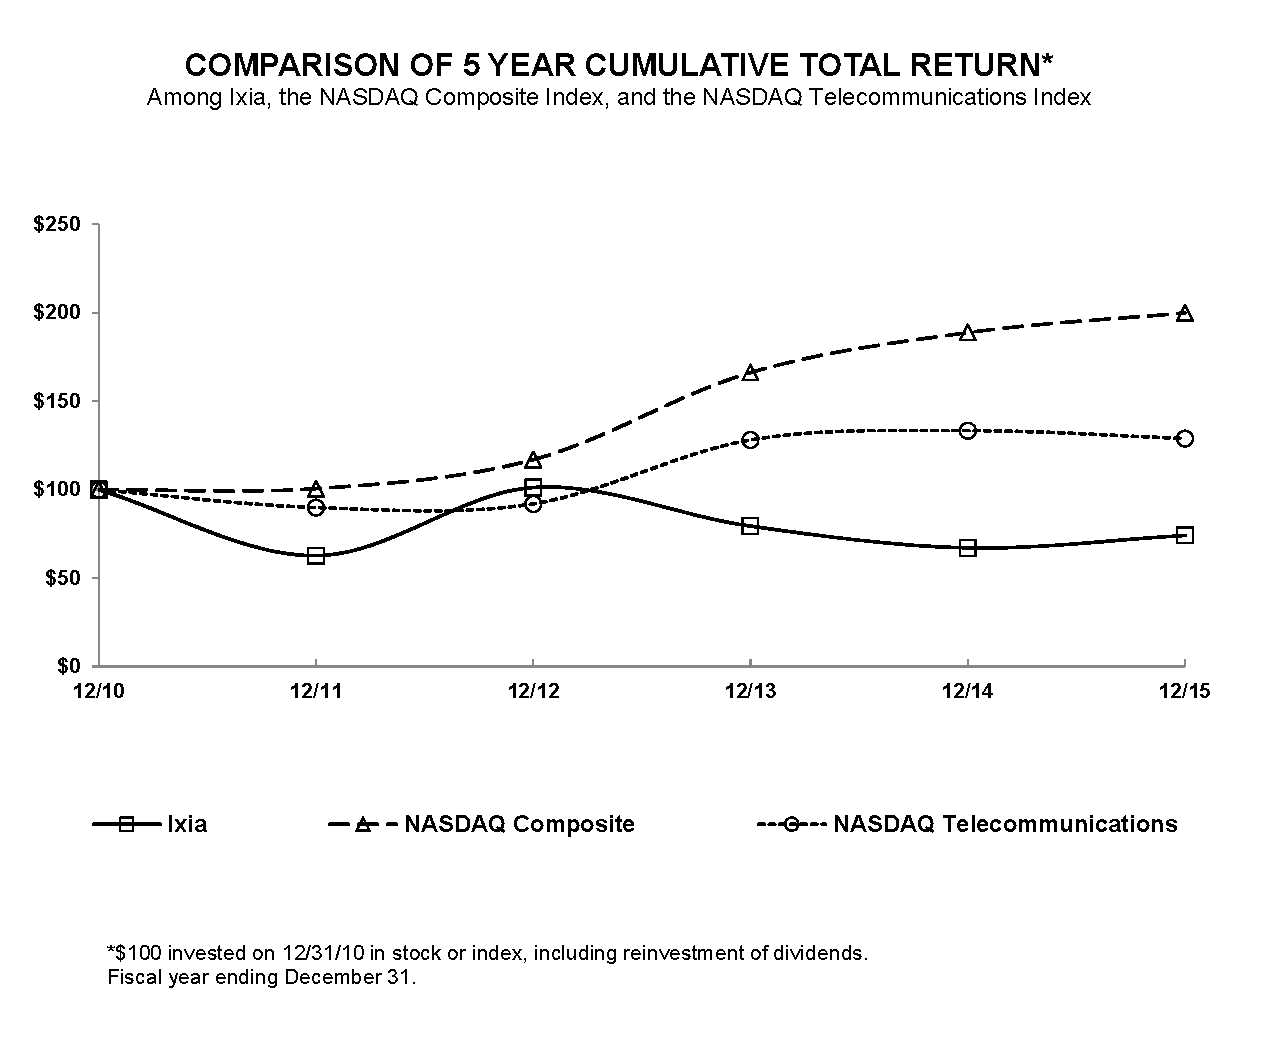
12/31/2010 | 12/31/2011 | 12/31/2012 | 12/31/2013 | 12/31/2014 | 12/31/2015 | ||||||||||||||||||
Ixia | $ | 100.00 | $ | 62.63 | $ | 101.19 | $ | 79.32 | $ | 67.04 | $ | 74.08 | |||||||||||
NASDAQ Composite | $ | 100.00 | $ | 100.53 | $ | 116.92 | $ | 166.19 | $ | 188.78 | $ | 199.95 | |||||||||||
NASDAQ Telecommunications | $ | 100.00 | $ | 89.84 | $ | 91.94 | $ | 128.06 | $ | 133.34 | $ | 128.91 | |||||||||||
(b) | Use of Proceeds |
None.
(c) | Issuer Repurchases of Equity Securities |
None.
32
Item 6. Selected Financial Data
The following selected consolidated financial data should be read in conjunction with “Management’s Discussion and Analysis of Financial Condition and Results of Operations” and our consolidated financial statements and the notes to those consolidated financial statements included in this Form 10-K. The consolidated statement of operations data set forth below for the years ended December 31, 2015, 2014 and 2013 and the consolidated balance sheet data as of December 31, 2015 and 2014 are derived from our audited consolidated financial statements included elsewhere in this Form 10-K. The consolidated statements of operations data set forth below for the years ended December 31, 2012 and 2011 and the consolidated balance sheet data as of December 31, 2013, 2012 and 2011 are prepared on a consistent basis with the consolidated financial statements presented herein and have been derived from our audited consolidated financial statements that are not included in this Form 10-K.
2015 | 2014 | 2013(3) | 2012(4) | 2011(5) | |||||||||||||||
Consolidated Statement of Operations Data (in thousands, except per share data): | |||||||||||||||||||
Revenues: | |||||||||||||||||||
Products | $ | 361,923 | $ | 325,455 | $ | 352,712 | $ | 330,315 | $ | 249,423 | |||||||||
Services | 155,014 | 139,003 | 114,544 | 83,119 | 61,947 | ||||||||||||||
Total revenues | 516,937 | 464,458 | 467,256 | 413,434 | 311,370 | ||||||||||||||
Costs and operating expenses: (1) | |||||||||||||||||||
Cost of revenues – products (2) | 97,415 | 98,815 | 89,136 | 71,668 | 56,801 | ||||||||||||||
Cost of revenues – services | 16,443 | 16,166 | 13,867 | 10,493 | 6,520 | ||||||||||||||
Research and development | 113,443 | 115,156 | 117,502 | 98,169 | 75,101 | ||||||||||||||
Sales and marketing | 155,211 | 151,765 | 137,724 | 117,214 | 87,011 | ||||||||||||||
General and administrative | 68,925 | 66,475 | 47,158 | 45,607 | 33,648 | ||||||||||||||
Amortization of intangible assets | 42,315 | 46,901 | 40,805 | 30,018 | 15,980 | ||||||||||||||
Acquisition and other related | 656 | 3,277 | 6,920 | 11,861 | 1,100 | ||||||||||||||
Restructuring(6) | (517 | ) | 10,310 | 1,840 | 4,077 | — | |||||||||||||
Total costs and operating expenses | 493,891 | 508,865 | 454,952 | 389,107 | 276,161 | ||||||||||||||
Income (loss) from operations | 23,046 | (44,407 | ) | 12,304 | 24,327 | 35,209 | |||||||||||||
Interest income and other, net(7) | (372 | ) | (24 | ) | 6,269 | 2,255 | 2,059 | ||||||||||||
Interest expense(8) | (8,331 | ) | (8,266 | ) | (7,771 | ) | (7,215 | ) | (7,200 | ) | |||||||||
Income (loss) before income taxes | 14,343 | (52,697 | ) | 10,802 | 19,367 | 30,068 | |||||||||||||
Income tax expense (benefit)(9) | 8,392 | (11,105 | ) | (1,068 | ) | (26,093 | ) | 3,355 | |||||||||||
Net income (loss) | $ | 5,951 | $ | (41,592 | ) | $ | 11,870 | $ | 45,460 | $ | 26,713 | ||||||||
Earnings (loss) per share: | |||||||||||||||||||
Basic | $ | 0.07 | $ | (0.54 | ) | $ | 0.16 | $ | 0.63 | $ | 0.39 | ||||||||
Diluted | $ | 0.07 | $ | (0.54 | ) | $ | 0.15 | $ | 0.59 | $ | 0.37 | ||||||||
Weighted average number of common and common equivalent shares outstanding: | |||||||||||||||||||
Basic | 79,633 | 77,629 | 75,757 | 72,183 | 69,231 | ||||||||||||||
Diluted | 81,459 | 77,629 | 77,513 | 84,505 | 71,664 | ||||||||||||||
(1) | Stock-based compensation included in: |
Cost of revenues – products | $ | 315 | $ | 331 | $ | 550 | $ | 423 | $ | 402 | |||||||||
Cost of revenues – services | 120 | 126 | 209 | 162 | 153 | ||||||||||||||
Research and development | 6,625 | 6,843 | 8,065 | 6,242 | 4,286 | ||||||||||||||
Sales and marketing | 4,730 | 5,624 | 7,367 | 5,352 | 3,296 | ||||||||||||||
General and administrative | 7,186 | 3,595 | 4,571 | 7,462 | 4,454 | ||||||||||||||
33
(2) | Cost of revenues – products excludes amortization of intangible assets, related to purchased technology of $25.7 million, $28.9 million, $26.0 million, $20.3 million, and $10.8 million for the years ended December 31, 2015, 2014, 2013, 2012, and 2011, respectively, which is included in Amortization of intangible assets. |
(3) | During the year ended December 31, 2013, we completed the acquisition of Net Optics, Inc. for approximately $187.4 million. |
(4) | During the year ended December 31, 2012, we completed the acquisition of Anue, Inc. and BreakingPoint Systems, Inc. for approximately $152.4 million and $163.7 million, respectively. |
(5) | During the year ended December 31, 2011, we completed the acquisition of VeriWave, Inc. for approximately $15.8 million. |
(6) | In 2012 and 2014 our management approved, committed to and initiated a plan to restructure our operations in light of our acquisitions of BreakingPoint and Net Optics, respectively. In 2013, management approved, committed to and initiated a plan to restructure certain operations related to our network test products. In 2014, management approved, committed to and initiated a plan to restructure our operations to better align our operating costs with our business opportunities. |
(7) | In 2013, we recorded realized gains of $2.9 million related to the sale of previously written down auction rate and corporate debt securities. |
(8) | December 2010, we issued $200 million in aggregate principal amount of 3.00% convertible senior notes that matured on December 15, 2015. The interest was payable semi-annually on June 15 and December 15 of each year, beginning on June 15, 2011. During each of 2011, 2012, 2013, and 2014, we made interest payments of $6.0 million. During 2015, we made interest payments of $4.9 million. In July 2015, we repurchased $65 million in aggregate principal amount of these notes, and in December 2015, the remaining outstanding notes in the aggregate principal amount of $200 million matured, and we repaid them in full. |
(9) | In 2012, we released $34.8 million of our valuation allowance previously established against our U.S. deferred tax assets. The 2012 partial releases related primarily to the net deferred tax liabilities recorded as part of the Anue and BreakingPoint acquisitions. |
2015 | 2014 | 2013 | 2012 | 2011 | |||||||||||||||
Consolidated Balance Sheet Data (in thousands): | |||||||||||||||||||
Cash and cash equivalents | $ | 52,472 | $ | 46,394 | $ | 34,189 | $ | 47,508 | $ | 42,729 | |||||||||
Short-term investments in marketable securities | 14,504 | 79,760 | 51,507 | 126,851 | 156,684 | ||||||||||||||
Working capital | 69,725 | (44,758 | ) | 128,960 | 227,309 | 234,723 | |||||||||||||
Long-term investments in marketable securities | — | — | — | 3,119 | 185,608 | ||||||||||||||
Total assets | 779,877 | 868,791 | 885,403 | 815,729 | 629,747 | ||||||||||||||
Convertible senior notes | — | 198,880 | 197,680 | 196,480 | 195,280 | ||||||||||||||
Term loan | 37,532 | — | — | — | — | ||||||||||||||
Total liabilities | 260,866 | 387,700 | 386,291 | 368,231 | 277,511 | ||||||||||||||
Total shareholders’ equity | 519,011 | 481,091 | 499,112 | 447,498 | 352,236 | ||||||||||||||
Item 7. Management’s Discussion and Analysis of Financial Condition and Results of Operations
The following discussion contains forward-looking statements that involve risks and uncertainties. Our actual results could differ materially from those anticipated in these forward-looking statements as a result of many factors, many of which are outside of our control and are difficult for us to forecast or mitigate. The factors that could cause our actual results to differ materially from those expressed or implied by us in any forward-looking statements contained herein or made elsewhere by or on behalf of us include the risks described elsewhere in this Form 10-K and in certain of our other Securities and Exchange Act Commission filings.
The consolidated results of operations for the years ended December 31, 2015, 2014 and 2013 are not necessarily indicative of the results that may be expected for any future period. The following discussion should be read in conjunction with the consolidated financial statements and the notes thereto included in Part IV, Item 15 of this Form 10-K and in conjunction with the “Risk Factors” included in Part I, Item 1A of this Form 10-K.
34
Business Overview
Ixia was incorporated in 1997 as a California corporation. We help customers validate the performance and security resilience of their applications and networks. Our test, visibility and security products help organizations make their, and their customers physical and virtual networks stronger. Enterprises, service providers, network equipment manufacturers, and governments worldwide rely on our solutions to validate new products before shipping, and secure ongoing operation of their networks with better visibility and security. Our product solutions consist of our high performance hardware platforms, software applications, and services, including warranty and maintenance offerings.
Our cash, cash equivalents and investments, in the aggregate, decreased by $59.2 million to $67.0 million at December 31, 2015 from $126.2 million at December 31, 2014. The net decrease was due to cash used for the retirement of our $200 million in convertible senior notes, partially offset by the $98.8 million of cash flows generated from our operating activities in 2015, which represents a 159.5% increase from the operating cash flows generated in 2014. This increase was primarily due to the increase in revenues and to a lesser extent, decreases in restructuring expenses and acquisition and other related costs. During 2015, total revenues increased 11.3% to $516.9 million from $464.5 million in 2014. The increase was primarily a result of a higher volume of shipments of our high speed Ethernet interface cards and higher revenues recognized on technical support, warranty and software maintenance services.
While we remain confident in our competitive position and our opportunities for long-term growth in both our network test solutions and network visibility solutions, we believe there continues to be some near term uncertainty and weakness in our markets, such as the capital spending plans of large service providers. This uncertainty and weakness may adversely impact our sales, results of operations and financial position over the near term.
Establishment of Senior Secured Revolving Credit Facility. On March 2, 2015 (the “Closing Date”), we entered into an amended and restated credit agreement (as amended to date, the “Credit Agreement”) with certain institutional lenders which amended and restated our prior 2012 credit agreement, as amended (the “Prior Credit Agreement”). As of December 31, 2015, the Credit Agreement provided for (i) a term loan (the “Term Loan”) in the aggregate principal amount of $40 million, which amount was advanced to us on March 3, 2015, and (ii) a revolving credit facility (the “Revolving Credit Facility” and, together with the Term Loan, the “Credit Facility”) in an aggregate amount of up to $75 million, with sub-limits of $25 million for the issuance of standby letters of credit and $15 million for swingline loans.
On January 25, 2016, we entered into an amendment to the Credit Agreement which, among other modifications, increases the commitments under the Revolving Credit Facility to an aggregate amount of up to $150 million, extends the maturity date of the Revolving Credit Facility from February 15, 2018 to February 15, 2020, and provides that the Revolving Credit Facility may, upon our request and subject to the receipt of increased commitments from our existing lenders or additional lenders, be increased by an aggregate amount of up to $100 million. The maturity date of the Term Loan did not change (i.e., February 15, 2018). We are permitted to voluntarily prepay outstanding loans under the Credit Facility at any time without premium or penalty. Prior to the maturity of the Credit Facility, we may re-borrow amounts under the Revolving Credit Facility, but we may not re-borrow amounts that are repaid or prepaid under the Term Loan.
Acquisition of Net Optics. On December 5, 2013, we completed our acquisition of all of the outstanding shares of common stock and other equity interests of Net Optics. The aggregate cash consideration totaled $187.4 million, or $185.4 million net of Net Optics’ cash and investment balances at the time of the acquisition. The aggregate purchase price reflects certain post-closing adjustments related to the final determination of the Net Optics’ closing working capital under the purchase agreement and the final amount of certain tax reimbursements paid to the sellers. The acquisition was funded from our existing cash and sale of investments. Net Optics is a leading provider of total application and network visibility solutions. The acquisition of Net Optics solidifies our position as a market leader with a comprehensive network visibility product offering that includes network packet brokers, comprehensive physical and virtual taps and application aware capabilities. Additionally, the acquisition has expanded our product portfolio, strengthened our service provider and enterprise customer base and broadened our sales channel and partner programs. These factors, among others, contributed to a purchase price in excess of the estimated fair value of Net Optics’ net identifiable assets acquired, and, as a result, we have recorded goodwill in connection with this transaction. The results of operations of Net Optics have been included in our consolidated statements of operations and cash flows since the date of the acquisition. See Note 2 to the consolidated financial statements included in this Form 10-K.
35
Restructuring Activities. During the third quarter of 2014, our management approved, committed to and implemented a company-wide initiative (the “2014 Corporate Restructuring”) to restructure our operations to better align our operating costs with our business opportunities. The restructuring included a reduction in force of approximately 96 positions across multiple business functions, which represented approximately 5.0% of our worldwide work force at that time. In connection with the 2014 Corporate Restructuring, we recorded approximately $6.1 million in restructuring costs related to employee termination benefits and exiting our facilities in India and Romania, all of which is included within the Restructuring line item in the consolidated statement of operations included in this Form 10-K. The 2014 Corporate Restructuring was substantially completed in the fourth quarter of 2014 and was estimated to provide future cost savings of approximately $17 million on an annualized basis, with the cost savings principally driven by a reduction in headcount-related costs, and to a lesser extent, facilities-related savings.
During the first quarter of 2014, our management approved, committed to and initiated a plan to restructure our operations following our December 5, 2013 acquisition of Net Optics (the “Net Optics Restructuring”). The Net Optics Restructuring included a net reduction in force of approximately 45 positions (primarily impacting our research and development team in Israel and Santa Clara, California), which represented approximately 2.3% of our worldwide work force at that time. In connection with the Net Optics Restructuring, we recorded approximately $3.5 million in restructuring costs related to employee termination benefits, and the termination of a subsidiary's facility lease in Israel, all of which was included within the Restructuring line item in the consolidated statement of operations included in this Form 10-K. The Net Optics Restructuring was substantially completed during the second quarter of 2014. Significant future costs savings were not expected as the restructuring was executed in conjunction with the acquisition of Net Optics.
During the fourth quarter of 2013, our management approved, committed to and initiated a plan to restructure our operations related to test products (the “Test Restructuring”). The Test Restructuring included a net reduction in force of approximately 120 positions (primarily impacting our research and development team in Bangalore, India), which represented approximately 6.5% of our worldwide work force at that time. In connection with the Test Restructuring, we recorded approximately $1.9 million in restructuring costs related to employee termination benefits, which are included within the Restructuring line item in the consolidated statement of operations included in this Form 10-K. The Test Restructuring was substantially completed by the fourth quarter of 2013 and all associated costs have been paid. Significant future costs savings were not expected from the Test Restructuring as the restructuring served to realign our resources.
Revenues. Our revenues are principally derived from the sale and support of our network test and visibility solutions.
Sales of our network test hardware products primarily consist of the sale of traffic generation and analysis hardware platforms containing multi-slot chassis and interface cards. Our primary network test hardware platform is enabled by our operating system software that is essential to the functionality of the hardware platform. Sales of our network visibility hardware products typically include the sale of an integrated, purpose-built hardware appliance with essential, proprietary software. Our software products consist of a comprehensive suite of technology-specific applications for certain of our network test hardware platforms. Our software products are typically installed on and work with our hardware products to further enhance the core functionality of the overall network test system, although some of our software products can be operated independently from our network test platforms.
Our service revenues primarily consist of technical support, warranty and software maintenance services revenues related to our network test and visibility hardware and software products. Most of our products include up to one year of these services with the initial product purchase, and our customers may separately purchase extended services for annual or multi-year periods. Our technical support, warranty and software maintenance services include assistance with the set-up, configuration and operation of our products, repair or replacement of defective products, bug fixes, and unspecified when and if available software upgrades. For certain network test products, our technical support and software maintenance service revenues also include revenues from the sale of our Application and Threat Intelligence ("ATI") service, which provides a comprehensive suite of application protocols, software updates and technical support. The ATI service provides full access to the latest security attacks and application updates for our customers' use in real-world test and assessment scenarios. Our customers may purchase the ATI service for annual or multi-year periods. Service revenues also include training and other professional services revenues.
During the three years ended December 31, 2015, our network test Ethernet interface cards, including our 1 Gigabit Ethernet, 10 Gigabit Ethernet and high speed Ethernet interface cards, represented the majority of our product revenues. During 2015, our 10 Gigabit Ethernet interface cards continued to be our strongest seller, but we also saw a significant increase in demand for our high speed Ethernet cards as a result of the shipment of newer technologies and network infrastructure upgrades. Over the longer term, while we expect the sale of our network test Ethernet interface cards to continue to represent a significant amount of our revenues, we also expect to see some decline in such revenues as a percentage of total revenues as we expect the sales of our network visibility and other network test solutions to increase.
36
To date, we have generated the majority of our revenues from sales to network equipment manufacturers, but this percentage has been declining over the past several years. While we expect that we will continue to have some customer concentration with network equipment manufacturers, we expect to continue to see revenues from sales to network equipment manufacturers to decline as a percentage of total revenues, given that we expect to sell our products to a wider variety and increasing number of service providers, enterprise and government customers. To the extent that we develop a broader and more diverse customer base, our reliance on any one customer or customer type should diminish. No one customer accounted for 10% or more of our total revenues in 2015 or 2014. In 2013, sales to AT&T and Cisco Systems accounted for $116.3 million, or 24.9%, of our total revenues
From a geographic perspective, we generated revenues from shipments to international locations of $199.1 million, or 38.5%, of our total revenues in 2015, $189.3 million, or 40.8%, of our total revenues in 2014, and $172.5 million, or 36.9% of our total revenues in 2013.
Stock-Based Compensation. Share-based payments, including grants of stock options, restricted stock units and employee stock purchase rights, are required to be recognized as expense in our financial statements based on the estimated fair values for accounting purposes on the grant date. For the years ended December 31, 2015, 2014 and 2013, stock-based compensation was $19.0 million, $16.5 million and $20.8 million, respectively. Our stock-based compensation increased for the year ended December 31, 2015 as compared to 2014 primarily due to the recognition of expense in 2015 related to certain performance based awards granted to executives with no such comparable expense in 2014. Our stock-based compensation expense decreased for the year ended December 31, 2014 as compared to 2013 due to a higher volume of stock award cancellations resulting from our restructuring activities and the departure of our former CFO, and lower valuations of awards due to a decline in the price of our common stock. The aggregate balance of gross unrecognized stock-based compensation to be expensed in the years 2016 through 2020 related to share-based awards unvested as of December 31, 2015 is approximately $20.4 million. To the extent that we grant share-based awards, future expense may increase by the additional unearned compensation resulting from those grants. We anticipate that we will continue to grant additional share-based awards in the future as part of our long-term incentive compensation programs. The impact of future grants cannot be estimated at this time because it will depend on a number of factors, including the amount of share-based awards granted and the then current fair values of such awards for accounting purposes.
Cost of Revenues. Our cost of revenues related to the sale of our hardware and software products includes materials, payments to third-party contract manufacturers, royalties, and salaries and other expenses related to our manufacturing and supply operations personnel. We outsource the majority of our manufacturing operations, accordingly, a significant portion of our cost of revenues related to our products consists of payments to our contract manufacturers. Cost of revenues related to the provision of services includes salaries and other expenses associated with technical support services, professional services and extended warranty and maintenance services. Cost of revenues does not include the amortization of purchased technology related to our acquisitions of certain businesses, product lines and technologies of $25.7 million, $28.9 million and $26.0 million for the years ended December 31, 2015, 2014 and 2013, respectively, which are included within our Amortization of intangible assets line item in our consolidated statements of operations included in this Form 10-K.
Our cost of revenues as a percentage of total revenues is primarily affected by the following factors:
• | our pricing policies and those of our competitors; |
• | the pricing we are able to obtain from our component suppliers and contract manufacturers; |
• | the mix of customers and sales channels through which our products are sold; |
• | the mix of our products sold, such as the mix of software versus hardware product sales and the mix of product versus services sales; |
• | new product introductions by us and by our competitors; |
• | demand for and quality of our products; and |
• | shipment volume. |
In the near term, although we anticipate that our cost of revenues as a percentage of total revenues will remain relatively flat, we expect to continue to experience pricing pressure on larger transactions and from larger customers as a result of competition.
37
Operating Expenses. Our operating expenses are generally recognized when incurred and consist of research and development, sales and marketing, general and administrative, amortization of intangible assets, acquisition and other related costs and restructuring expenses. In dollar terms, we expect total operating expenses, excluding stock-based compensation discussed above and amortization of intangible assets, acquisition and other related and restructuring expenses discussed below, to increase in 2016 when compared to 2015, due primarily to investments in our direct sales force.
• | Research and development expenses consist primarily of salaries and other personnel costs related to the design, development, testing, and enhancement of our products. We expense our research and development costs as they are incurred. We also capitalize and depreciate over a five-year period costs of our products used for internal purposes. We plan to continue to strategically invest in research and development and new products and technology as we believe that such investment is critical to attaining our strategic objectives and will further differentiate us in the marketplace. |
• | Sales and marketing expenses consist primarily of compensation and related costs for personnel engaged in direct sales, sales support and marketing functions, as well as tradeshow, promotional and advertising expenditures. We also capitalize and depreciate over a two-year period costs of our products used for sales and marketing activities, including product demonstrations for potential customers. |
• | General and administrative expenses consist primarily of salaries and related expenses for certain executive, finance, legal, human resources, information technology, and administrative personnel, as well as professional fees (e.g., legal and accounting), facility costs related to our corporate headquarters, insurance costs, and other general corporate expenses. General and administrative expenses also include costs related to internal and other investigations, shareholder litigation and related matters. |
• | Amortization of intangible assets consists of the recognition of the purchase price of various intangible assets over their estimated useful lives. The future amortization expense of acquired intangible assets depends on a number of factors, including the extent to which we acquire additional businesses, technologies and product lines or are required to record impairment charges related to our acquired intangible assets. See Note 8 to the consolidated financial statements included in this Form 10-K. |
• | Acquisition and other related costs are expensed as incurred and consist primarily of transaction and integration related costs such as success-based banking fees, professional fees for legal, accounting, tax, due diligence, valuation, and other related services, change in control payments, amortization of deferred compensation, consulting fees, regulatory costs, certain employee, facility and infrastructure transition costs, and other acquisition related expenses. We expect our acquisition and other related expenses to fluctuate over time based on the timing of our acquisitions and related integration activities. |
• | Restructuring expenses consist primarily of employee severance costs and other related charges, as well as facility-related charges to exit certain locations. See Note 4 to the consolidated financial statements included in this Form 10-K. |
Interest income and other, net represents interest on cash and a variety of securities, including money market funds, U.S. government and government agency debt securities and corporate debt securities, realized gains/losses on the sale of investment securities, certain foreign currency gains and losses, and other non-operating items.
Interest expense consists of interest on our convertible senior notes that were issued in December 2010 and interest on our Term Loan, amortization of debt issuance costs, and commitment fees on the unused portion of prior and current revolving credit facilities. Our convertible senior notes were retired in 2015. See Note 3 to the consolidated financial statements included in this Form 10-K.
Income tax expense (benefit) is determined based on the amount of earnings and enacted federal, state and foreign tax rates, adjusted for allowable credits and deductions, and for other effects of equity compensation plans. Our income tax provision may be significantly affected by changes to our estimates for tax in jurisdictions in which we operate and other estimates utilized in determining the global effective tax rate. Actual results may also differ from our estimates based on changes in economic conditions. Such changes could have a substantial impact on the income tax provision. Our income tax provision could also be significantly impacted by estimates surrounding our uncertain tax positions and the recording of valuation allowances against certain deferred tax assets, and changes to these valuation allowances in future periods. We reevaluate the judgments surrounding our estimates and make adjustments, as appropriate, each reporting period.
38
Our effective tax rate differs from the federal statutory rate due to state taxes, significant permanent differences, federal and foreign tax rate differences, inter-company royalties, research and development tax credits, and adjustments to our valuation allowance. Significant permanent differences arise due to stock-based compensation expenses that are not expected to generate a tax deduction, such as stock-based compensation expenses on grants to employees at foreign locations, offset by tax benefits from disqualifying dispositions. For additional information, see Note 9 to the consolidated financial statements included in this Form 10-K.
Realization of our deferred tax assets is dependent primarily on the generation of future taxable income. In considering the need for a valuation allowance we consider our historical, as well as future, projected taxable income along with other objectively verifiable evidence. Objectively verifiable evidence includes our realization of tax attributes, assessment of tax credits and utilization of net operating loss carryforwards during the year.
We maintain a valuation allowance in the amount of $2.1 million against our U.S. and Australian deferred tax assets. The U.S. valuation allowance in the amount of $1.1 million is related to our realized capital loss carryforwards and the Australian valuation allowance of $1.0 million is due to net operating loss carryforwards, which are not expected to be realized. During 2015, the U.S. valuation allowance decreased by $2.3 million due to the expiration of a portion of our capital loss carryforwards. The release of the remaining valuation allowance, or a portion thereof, would have a favorable impact on our effective tax rate. We will continue to monitor the need for a valuation allowance each reporting period, and at this time, it is uncertain when and if such a release of the remaining valuation allowance may occur.
On December 18, 2015, the Senate approved the House bill to extend the federal research and development credit permanently and retroactively to January 1, 2015. The 2015 research and development tax benefit of $1.2 million was recorded in the fourth quarter of 2015. On December 16, 2014, the Senate approved the House bill to extend the federal research and development credit for one year retroactively to January 1, 2014. The 2014 research and development tax benefit of $1.6 million was recorded in the fourth quarter of 2014. On January 2, 2013, the American Taxpayer Relief Act of 2012 was enacted, which included a reinstatement of the federal research and development credit for the tax year ended December 31, 2012. The 2012 research and development tax benefit in the amount of $2.6 million was recorded in 2013.
Critical Accounting Policies and Estimates
Management’s discussion and analysis of financial condition and results of operations is based upon our consolidated financial statements which have been prepared in accordance with accounting principles generally accepted in the United States of America. The preparation of these financial statements requires us to make estimates and judgments that affect the reported amounts of assets, liabilities, revenues and expenses, and related disclosure of contingent assets and liabilities. On an ongoing basis, we evaluate our estimates and judgments, including those related to revenue recognition, allowance for doubtful accounts, write-downs for obsolete inventory, income taxes, acquisition purchase price allocation, impairments of long-lived assets, goodwill and marketable securities, stock-based compensation, and contingencies and litigation. We base our estimates on historical experience and on various other assumptions that are believed to be reasonable under the circumstances. Actual results may differ materially from these estimates.
We apply the following critical accounting policies in the preparation of our consolidated financial statements:
• | Revenue Recognition Policy. We exercise significant judgment and use estimates in connection with the determination of the amount of revenue that is recognized in each accounting period and the allocation of those amounts to either product or services revenue. We recognize our revenue in accordance with authoritative guidance on both hardware and software revenue recognition. For our hardware and software products, and related services, we recognize revenue based on the following four criteria: whether (i) evidence of an arrangement exists, which is typically in the form of a customer purchase order; (ii) delivery has occurred (i.e., risks and rewards of ownership have passed to the customer); (iii) the sales price is fixed or determinable; and (iv) collectability is deemed reasonably assured (or probable for software-related deliverables). Provided that the above criteria are met, revenue from hardware and software product sales is typically recognized upon shipment and service revenues are recognized as the services are provided or completed. Our service revenues from our initial and separately purchased technical support, warranty and software maintenance arrangements are recognized on a straight-line basis over the applicable contractual period. |
39
Our systems are typically fully functional at the time of shipment and do not require us to perform any significant production, modification, customization or installation after shipment. If our arrangements include acceptance provisions based on customer specified criteria for which we cannot reliably demonstrate that the delivered product meets all the specified criteria, revenue is deferred until the earlier of the receipt of written customer acceptance or the expiration of the acceptance period. In addition, our arrangements generally do not include any provisions for cancellation, termination or refunds.
When sales arrangements involve a combination of hardware and software elements, we use a two-step process to allocate value to each element in the arrangement. First, we allocate the total arrangement fee to the separate non-software deliverables (e.g., chassis, interface cards, and software post contract customer support and maintenance (“PCS”) related to our operating system software that is essential to the functionality of our hardware platform) and the software-related deliverables as a group (e.g., application software and software PCS) based on a relative selling price (“RSP”) method applied to all elements in the arrangement using the selling price hierarchy, which is described below. Then, we allocate the value assigned to the software group for the software-related deliverables to each software element based on the residual method, whereby value is allocated first to the undelivered elements based on vendor specific objective evidence (“VSOE”), typically PCS, and the residual portion of the value is then allocated to the delivered elements (typically the software products) and recognized as revenue, provided all other revenue recognition criteria discussed above have been met.
Under the RSP method, the selling price to be used in the allocation of the total arrangement fee to each of the elements, or deliverables, is based on a selling price hierarchy, where the selling price for each element is based on (i) VSOE, if available; (ii) third-party evidence (“TPE”), if available and VSOE is not available; or (iii) the best estimate of selling price (“BESP”), if neither VSOE nor TPE are available.
The allocation of value to each deliverable in a multiple element arrangement is completed at the inception of an arrangement, which is typically the receipt of a customer purchase order. While changes in the allocation of the estimated selling price between the units of accounting will not affect the amount of total revenue recognized for a particular sales arrangement, any material changes in these allocations could impact the timing of revenue recognition, which could affect our results of operations.
The allocated value of each non-software deliverable is then recognized as revenue when each element is delivered, provided all of the other revenue recognition criteria discussed above have been met. For software deliverables, the total software group allocation (or total arrangement consideration for customer orders that include only software products and related services) is assigned to each deliverable based on VSOE in accordance with software revenue recognition guidance as described under step two of the allocation process above. We determine VSOE of fair value based on a bell-shaped curve approach, considering the actual sales prices charged to customers when the same element is sold separately, provided it is substantive. As we do not sell our software products without technical support, warranty and software maintenance services, we are unable to establish VSOE for our software products, and therefore use the residual method under the software revenue recognition guidance to allocate the software group (or arrangement) value to each software deliverable. Under the residual method, the software group (or arrangement) value is allocated first to the undelivered elements, typically technical support, warranty and software maintenance services based on VSOE, and the residual portion of the value is then allocated to the delivered elements (typically the software products) and recognized as revenue, provided all other revenue recognition criteria discussed above have been met. If VSOE cannot be established for an undelivered element within the software group (or arrangement), we defer the entire value allocated to the software group (or arrangement) until the earlier of (i) delivery of all elements (other than technical support, warranty and software maintenance services or (ii) establishment of VSOE of the undelivered element(s). If the only undelivered element(s) relates to a service for which VSOE has not been established, the entire allocated value of the software group (or arrangement) is recognized as revenue over the longer of the service or contractual period of the technical support, warranty and software PCS. Refer to Note 1, Significant Accounting Policies, for further detail regarding the allocation of value and revenue recognition timing on multiple element revenue arrangements.
40
VSOE of fair value typically only exists for our technical support, warranty and software maintenance services (“Support”). VSOE of fair value is established using the bell-shaped curve approach for a subgroup when a substantial majority (generally greater than 75%) of the transactions are priced within a reasonably narrow range (generally plus or minus 15% from the list price, which approximates the median). On a regular basis, we separately sell Support upon the expiration of the initial contractual periods included in an initial sales arrangement (“Support Renewals”). The population of Support Renewals is used in the bell-shaped curve approach to establish VSOE of fair value of Support and consists of actual sales prices charged to customers for Support Renewals and includes only Support Renewals sold separately on a stand-alone basis. We review these standalone sales of its Support Renewals for VSOE of fair value of its Support on a quarterly basis (“VSOE Analysis”). Our pricing for Support Renewal transactions is generally based on a percentage of our list price for the product for which the Support Renewal is being purchased. When pricing conditions vary significantly, we further stratify the population of stand-alone sales of our Support Renewals based on Support Renewal pricing conditions and separately analyze these subgroups of Support Renewal transactions. Our Support Renewal pricing conditions consist of the underlying product type, product family, customer type and the geographic region in which the sale is made.
Our pricing practices may be required to be modified as our business and offerings evolve over time, which could result in changes in selling prices, including both VSOE and BESP, in subsequent periods. In determining BESPs, we apply significant judgment as we weigh a variety of factors, based on the facts and circumstances of the arrangement. The facts and circumstances we may consider include, but are not limited to, prices charged for similar offerings, if any, our historical pricing practices as well as the nature and complexity of different technologies being licensed, geographies and the number of users allowed for a given license.
We use distributors and resellers to complement our direct sales and marketing efforts in certain markets and/or for certain products. Due to the broad range of features and options available with our hardware and software products, distributors and resellers generally do not stock our products and typically place orders with us after receiving an order from an end customer. These distributors and resellers receive business terms of sale similar to those received by our other customers; and payment to Ixia is not contingent on sell-through to and receipt of payment from the end customer. As such, for sales to distributors and resellers, we recognize revenue when the risks and rewards of ownership have transferred to the distributor or reseller provided that the other revenue recognition criteria noted above have been met.
• | Acquisition Purchase Price Allocation. When we acquire a business, product line or rights to a product or technology, we allocate the purchase price to the various tangible and intangible assets acquired and the liabilities assumed, based on their estimated fair values. Determining the fair value of certain assets and liabilities acquired is subjective in nature and often involves the use of significant estimates and assumptions, some of which may be based in part on historical experience and information obtained from the management of the acquired business, and are inherently uncertain. Many of the estimates and assumptions used to determine fair values, such as those for purchased technologies and customer relationships, are made based on forecasted information and discount rates. To assist in the purchase price allocation process, as well as the determination of estimated useful lives of acquired intangible assets, we may obtain appraisals from valuation specialists. Unanticipated events and circumstances may occur which may affect the accuracy or validity of such estimates and assumptions. |
• | Write-Down of Excess or Obsolete Inventory. We write down inventory for estimated obsolescence, excessive quantities or unmarketable inventory equal to the difference between the cost of inventory and the estimated market value based upon market and economic conditions; technology changes, new product introductions, and changes in strategic business direction; and requires estimates that may include elements that are uncertain. If actual future demand is less favorable than our initial estimate, additional inventory write-downs may be required and would be reflected in cost of goods sold in the period the revision is made. Once written down, the inventory reserves are not reversed until the inventory is disposed of or sold. |
41
• | Income Taxes. We operate in numerous states and countries through our various subsidiaries, and must allocate our income, expenses, and earnings under the various laws and regulations of each of these taxing jurisdictions. Accordingly, our provision for income taxes represents our total estimate of the liability that we have incurred in doing business each year in all of our locations. Deferred income tax balances reflect the effects of temporary differences between the carrying amounts of assets and liabilities and their tax bases and are stated at enacted tax rates expected to be in effect when taxes are actually paid or recovered. In determining whether we need to record a valuation allowance against our deferred tax assets, management must make a number of estimates, assumptions and judgments, including estimates of future earnings and taxable income. We establish a valuation allowance to reduce deferred tax assets to the amount we believe is more likely than not to be realized. The determination to record or release valuation allowances requires significant judgment. During 2015, management concluded that it is more likely than not that all of our U.S. deferred tax assets, with the exception of our U.S. deferred tax assets for capital loss carry-forwards, will be realized. Management’s conclusion was due to, among other reasons, (i) the three-year cumulative adjusted pre-tax accounting income realized in the U.S., (ii) the significant utilization of our net operating loss carry-forwards and R&D credits during 2015 and 2013, and (iii) losses incurred during 2014 were carried back and fully utilized against 2012 taxable income. |
Annually, we file tax returns that represent our filing positions with each jurisdiction and settle our tax return liabilities. Each jurisdiction has the right to audit those returns and may take different positions with respect to income and expense allocations and taxable earnings determinations. We may provide for estimated liabilities in our consolidated financial statements associated with uncertain tax return filing positions that are subject to audit by various tax authorities. Because the determinations of our annual provisions are subject to assumptions, judgments and estimates, it is likely that actual results may vary from those recognized in our consolidated financial statements. As a result, additions to, or reductions of, income tax expense will occur each year for prior reporting periods as our estimates or judgments change, or as actual tax returns and tax audits are settled. We recognize any such prior year adjustment in the discrete quarterly period in which it is determined.
• | Goodwill. We record goodwill as the difference, if any, between the aggregate consideration paid for an acquisition and the fair value of the acquired net tangible and intangible assets. We evaluate the recoverability of our goodwill on an annual basis or if events or changes in circumstances indicate that impairment in the value of goodwill recorded on our balance sheet may exist. We have determined that we have one reporting unit for goodwill impairment testing purposes. The fair value of the Company’s reporting unit is determined using the market capitalization of Ixia, which considers the observed market price of the Company’s publicly-traded equity securities on the impairment test date. The fair value of the Company’s reporting unit is then compared to the carrying amount of the Company’s reporting unit under “step 1” of the impairment testing model. If the carrying value of the reporting unit exceeds its fair value, then the fair value of goodwill is determined and compared to its carrying value under “step 2.” Impairment losses are recorded to the extent that the carrying value of the goodwill exceeds its estimated fair value. Currently management believes that it is not at risk of failing the “step 1” impairment test because the Company’s market capitalization is significantly in excess of the carrying value of the reporting unit. We completed our annual goodwill impairment test of our single reporting unit as of December 31, 2015 and determined that there was no impairment. |
• | Long-lived Asset Valuation (Intangible Assets and Property, Plant and Equipment). We test long-lived assets or asset groups for recoverability when events or changes in circumstances indicate that their carrying amounts may not be recoverable. Circumstances which could trigger a review include, but are not limited to: significant decreases in the market price of the asset; significant adverse changes in the business climate or legal factors; accumulation of costs significantly in excess of the amount originally expected for the acquisition or construction of the asset; current period cash flow or operating losses combined with a history of losses or a forecast of continuing losses associated with the use of the asset; and current expectation that the asset will more likely than not be sold or disposed of significantly before the end of its estimated useful life. When such events or changes in circumstances occur, we assess recoverability by determining whether the carrying value of such assets will be recovered through the undiscounted expected future cash flows. If the future undiscounted cash flows are less than the carrying amount of these assets, we recognize an impairment loss based on the excess of the carrying amount over the fair value of the assets. Fair value is determined using a discounted cash flow analysis that involves the use of significant estimates and assumptions, some of which may be based in part on historical experience, forecasted information and discount rates. No such impairment charges were recorded during the years ended December 31, 2015, 2014 and 2013. |
42
• | Stock-Based Compensation. Share-based payments, including grants of stock options, restricted stock units and employee stock purchase rights, are recognized based on the estimated fair values for accounting purposes on the grant date. We use the Black-Scholes option pricing model to estimate the fair value for accounting purposes of stock options and employee stock purchase rights. We use the grant date closing share sales price of a share of our common stock to estimate the fair value for accounting purposes of restricted stock units. The determination of the fair value of share-based awards utilizing the Black-Scholes model is affected by our stock price and a number of assumptions, including expected volatility, expected life and risk-free interest rate. The expected life and expected volatility are estimated based on historical data. The risk-free interest rate assumption is based on observed interest rates appropriate for the lives of our share-based awards. Stock-based compensation expense recognized in our consolidated financial statements is based on awards that are ultimately expected to vest. The amount of stock-based compensation expense is reduced for estimated forfeitures based on historical experience as well as future expectations. We recognize stock-based compensation expense based on the graded, or accelerated multiple-option, approach over the vesting period. |
• | Impairment of Marketable Securities. We regularly review our investment portfolio to determine if any security is other-than-temporarily impaired, which would require us to record an impairment charge in the period any such determination is made. In making this judgment, we evaluate, among other things, the duration and extent to which the fair value of a security is less than its cost and our intent and ability to sell, or whether we will more likely than not be required to sell, the security before recovery of its amortized cost basis. We have evaluated our investments as of December 31, 2015 and have determined that no investments with unrealized losses are other-than-temporarily impaired. |
• | Contingencies and Litigation. We evaluate contingent liabilities, including threatened or pending litigation, and record accruals when the loss is deemed probable and the liability can reasonably be estimated. We make these assessments based on the facts and circumstances of each situation and in some instances following consultation with outside legal counsel. |
43
Results of Operations
The following table sets forth certain statement of operations data as a percentage of total revenues for the periods indicated:
2015 | 2014 | 2013 | ||||||
Revenues: | ||||||||
Products | 70.0 | % | 70.1 | % | 75.5 | % | ||
Services | 30.0 | 29.9 | 24.5 | |||||
Total revenues | 100.00 | 100.0 | 100.0 | |||||
Costs and operating expenses: (1) | ||||||||
Cost of revenues – products (2) | 18.8 | 21.3 | 19.1 | |||||
Cost of revenues – services | 3.2 | 3.5 | 3.0 | |||||
Research and development | 21.9 | 24.8 | 25.1 | |||||
Sales and marketing | 30.0 | 32.7 | 29.5 | |||||
General and administrative | 13.3 | 14.3 | 10.1 | |||||
Amortization of intangible assets | 8.2 | 10.1 | 8.7 | |||||
Acquisition and other related costs | 0.1 | 0.7 | 1.5 | |||||
Restructuring | (0.1 | ) | 2.2 | 0.4 | ||||
Total costs and operating expenses | 95.5 | 109.6 | 97.4 | |||||
Income (loss) from operations | 4.5 | (9.6 | ) | 2.6 | ||||
Interest income and other, net | (0.1 | ) | — | 1.3 | ||||
Interest expense | (1.6 | ) | (1.8 | ) | (1.7 | ) | ||
Income (loss) before income taxes | 2.8 | (11.4 | ) | 2.2 | ||||
Income tax expense (benefit) | 1.6 | (2.4 | ) | (0.2 | ) | |||
Net income (loss) | 1.2 | % | (9.0 | )% | 2.4 | % | ||
(1) | Stock-based compensation included in: |
Cost of revenues – products | 0.1 | % | 0.1 | % | 0.1 | % | |||
Cost of revenues – services | 0.0 | 0.0 | 0.0 | ||||||
Research and development | 1.3 | 1.5 | 1.7 | ||||||
Sales and marketing | 0.9 | 1.2 | 1.6 | ||||||
General and administrative | 1.4 | 0.8 | 1.0 | ||||||
(2) | Cost of revenues – products excludes amortization of intangible assets related to purchased technology, as a percentage of total revenues, of 5.0%, 6.2% and 5.6% for the years ended December 31, 2015, 2014 and 2013, respectively, which is included in Amortization of intangible assets. |
44
Comparison of the Years Ended December 31, 2015 and 2014
Revenues. During the year ended December 31, 2015, total revenues increased 11.3% to $516.9 million from the $464.5 million recorded in the year ended December 31, 2014.
The following table presents revenue by product line (in thousands):
Year ended December 31, | |||||||
2015 | 2014 | ||||||
Product revenues | $ | 271,247 | $ | 238,282 | |||
Service revenues | 115,367 | 107,391 | |||||
Total Network Test Solutions | 386,614 | 345,673 | |||||
Product revenues | 90,676 | 87,173 | |||||
Service revenues | 39,647 | 31,612 | |||||
Total Network Visibility Solutions | 130,323 | 118,785 | |||||
Total | $ | 516,937 | $ | 464,458 | |||
During the year ended December 31, 2015, revenues from our Network Test Solutions product line increased 11.8% to $386.6 million compared to $345.7 million recorded in the year ended December 31, 2014. The year-over-year increase in revenue for Network Test Solutions was principally driven by an increase in product revenues, which was primarily due to a higher volume of shipments of our high speed Ethernet interface cards, and to a lesser extent, higher revenues recognized on technical support, warranty and software maintenance services.
During the year ended December 31, 2015 revenues from our Network Visibility Solutions product line increased 9.7% to $130.3 million compared to $118.8 million recorded in the year ended December 31, 2014. The year-over-year increase in revenue for Network Visibility Solutions was driven primarily by an increase in revenues recognized on technical support, warranty and software maintenance services.
Cost of Revenues. As a percentage of total revenues, our total cost of revenues decreased to 22.0% in the year ended December 31, 2015 from 24.8% in the year ended December 31, 2014. This percentage decrease was primarily due to the realization of higher gross margins on certain of our products in 2015, and to a lesser extent, incremental operating leverage associated with higher revenues and relatively fixed indirect costs.
Cost of revenues does not include the amortization of purchased technology related to our acquisitions of certain businesses, product lines and technologies of $25.7 million and $28.9 million for the years ended December 31, 2015 and 2014, respectively, which are included within our Amortization of intangible assets line item in our consolidated statements of operations included in this Form 10-K.
Research and Development. During the year ended December 31, 2015, research and development expenses decreased 1.5% to $113.4 million from $115.2 million in the year ended December 31, 2014. This decrease was primarily due to decreases in salaries and facilities costs due, in part, to cost reductions as a result of our 2014 restructuring activities, and decreases in consulting and outside services costs. These year-over-year decreases were partially offset by an increase in bonus accruals.
Sales and Marketing. During the year ended December 31, 2015, sales and marketing expenses increased 2.3% to $155.2 million from $151.8 million in the year ended December 31, 2014. This increase was primarily due to higher commissions and increases in bonus accruals. These year-over-year increases were partially offset by lower salaries and facilities expenses due, in part, to cost reductions as a result of our 2014 restructuring activities.
General and Administrative. During the year ended December 31, 2015, general and administrative expenses increased 3.7% to $68.9 million from $66.5 million in the year ended December 31, 2014. This increase was primarily due to higher stock-based compensation and bonus accruals, partially offset by lower legal fees due to a reduction in costs associated with our 2014 internal investigations and the securities class action and derivative actions pending against us and certain of our current and former officers and directors.
45
Amortization of Intangible Assets. During the year ended December 31, 2015, amortization of intangible assets decreased 9.8% to $42.3 million from $46.9 million in the year ended December 31, 2014. These decreases were primarily due the completion of amortization periods for certain previously acquired intangible assets.
Acquisition and Other Related Costs. During the year ended December 31, 2015, acquisition and other related costs decreased 80.0% to $656,000 from $3.3 million in the year ended December 31, 2014. During the years ended December 31, 2015 and 2014, acquisition and other related costs were primarily related to the December 2013 acquisition of Net Optics and primarily consisted of transaction and integration-related costs such as professional fees for legal, accounting and tax services, integration-related consulting fees, certain employee, facility and infrastructure costs, and other acquisition-related costs. For additional information, see Note 2 to the consolidated financial statements.
Restructuring. Restructuring costs for the year ended December 31, 2015 were a net credit of approximately $517,000 compared to costs of $10.3 million for the year ended December 31, 2014. Restructuring credits recorded in the year ended December 31, 2015 were primarily related to the receipt of insurance settlement proceeds for costs previously charged to the Restructuring line item in our consolidated statements of operations, and the impact of a favorable lease buyout. Restructuring costs incurred in the year ended December 31, 2014 were primarily related to the 2014 Corporate Restructuring and the Net Optics Restructuring, and consisted of costs related to employee termination benefits, including severance and other employee-related costs, and lease termination costs. For additional information, see Note 4 to the consolidated financial statements included in this Form 10-K.
Interest Income and Other, Net. Interest and other income, net was an expense of approximately $372,000 in the year ended December 31, 2015 compared to an expense of approximately $24,000 in the year ended December 31, 2014. This increase in expense was primarily due to higher foreign currency translation losses incurred during 2015 compared to 2014.
Interest expense. Interest expense, including the amortization of debt issuance costs, was $8.3 million for each of the years ended December 31, 2015 and 2014. Increases in interest expense as a result of our Term Loan and amortization of debt issuance costs related to our new credit facility were offset by lower interest expense related to our convertible senior notes as a result of the repurchase (prior to maturity) of a portion of the outstanding balance in July 2015. For additional information, see Note 3 to the consolidated financial statements included in this Form 10-K.
Income Tax Expense. Income tax expense was $8.4 million, or an effective rate of 58.5%, in 2015 as compared to an income tax benefit of $11.1 million, or an effective rate of 21.1%, in 2014. Our effective income tax rate in 2015 is higher than our statutory rate primarily due to increases in unrecognized tax benefits, non-deductible stock-based compensation and intercompany activity such as inter-company royalties and transfers.
Comparison of the Years Ended December 31, 2014 and 2013
We acquired Net Optics, Inc. on December 5, 2013, and our 2014 and 2013 consolidated results of operations include the financial results of such acquisition from its acquisition date.
Revenues. During the year ended December 31, 2014, total revenues decreased 0.6% to $464.5 million from the $467.3 million recorded in the year ended December 31, 2013. Revenues for the year ended December 31, 2014 and 2013 included $59.0 million and $4.8 million, respectively, related to the 2013 acquisition of Net Optics. Excluding the revenues of Net Optics, total revenues decreased by $57.0 million, or 12.3%, to $405.5 million in the year ended December 31, 2014 from $462.5 million in the year ended December 31, 2013.
46
The following table presents revenue by product line (in thousands):
Year ended December 31, | |||||||
2014 | 2013 | ||||||
Product revenues | $ | 238,282 | $ | 282,630 | |||
Service revenues | 107,391 | 93,667 | |||||
Total Network Test Solutions | 345,673 | 376,297 | |||||
Product revenues | 87,173 | 69,539 | |||||
Service revenues | 31,612 | 21,420 | |||||
Total Network Visibility Solutions | 118,785 | 90,959 | |||||
Total | $ | 464,458 | $ | 467,256 | |||
During the year ended December 31, 2014, revenues from our Network Test Solutions product line decreased 8.1% to $345.7 million from $376.3 million in the year ended December 31, 2013. The year-over-year decrease in revenue for Network Test Solutions was principally driven by a decrease in product revenues primarily due to a decrease in shipments of our Network Test Solutions hardware products (primarily our network test Ethernet interface cards), partially offset by an increase in services revenues recognized on technical support, warranty and software maintenance services.
During the year ended December 31, 2014 revenues from our Network Visibility Solutions product line increased 30.6% to $118.8 million in 2014 from $91.0 million in the year ended December 31, 2013. The year-over-year increase in revenue for Network Visibility Solutions was principally the result of the revenues from our acquisition of Net Optics in 2013 and an increase in services revenues recognized on technical support, warranty and software maintenance services. This year-over-year increase was partially offset by a decrease in legacy Network Visibility Solutions product revenues, primarily due to a decrease in shipments to certain service provider customers.
Cost of Revenues. As a percentage of total revenues, our total cost of revenues increased to 24.8% during the year ended December 31, 2014 from 22.1% in year ended December 31, 2013. The increase in cost of revenues as a percentage of total revenues was primarily driven by a higher volume of Net Optics related product sales in 2014, which generally are lower margin sales as compared to our sales of legacy Ixia products, and higher costs for excess and obsolete inventory.
Cost of revenues does not include the amortization of purchased technology related to our acquisitions of certain businesses, product lines and technologies of $28.9 million and $26.0 million for the years ended December 31, 2014 and 2013, respectively, which are included within our Amortization of intangible assets line item in our consolidated statements of operations included in this Form 10-K.
Research and Development Expenses. During the year ended December 31, 2014, research and development expenses decreased 2.0% to $115.2 million from $117.5 million in the year ended December 31, 2013. Research and development expenses attributable to Net Optics were approximately $9.6 million and $1.3 million for the years ended December 31, 2014 and 2013, respectively.
Our research and development expenses in the year ended December 31, 2014, other than those attributable to the activities of Net Optics or comprised of stock-based compensation expense, were in the aggregate amount of $98.7 million, representing an 8.7% decrease compared to $108.2 million of such expenses in the year ended December 31, 2013. This decrease was primarily due to a decrease in compensation and related employee costs, a reduction in costs to develop prototypes and lower expenses for depreciation and amortization. The decrease in compensation and related employee costs was primarily a result of headcount reductions from our various restructuring activities.
Sales and Marketing Expenses. During the year ended December 31 2014, sales and marketing expenses increased 10.2% to $151.8 million from $137.7 million in the year ended December 31, 2013. Sales and marketing expenses attributable to Net Optics were approximately $12.2 million and $1.0 million for the years ended December 31, 2014 and 2013, respectively.
47
Our sales and marketing expenses in the year ended December 31, 2014, other than those attributable to the activities of Net Optics or comprised of stock-based compensation expense, were in the aggregate amount of $133.9 million, representing a 3.6% increase compared to $129.3 million of such expenses in the year ended December 31, 2013. This increase was primarily due to an increase in net compensation and related employee costs, including travel, and a net change in bad debt expense (primarily the result of a net expense in 2014 as compared to a net recovery in 2013). The increase in compensation and related employee costs was primarily due to increased headcount in sales and marketing personnel.
General and Administrative Expenses. During the year ended December 31, 2014, general and administrative expenses increased 40.9% to $66.5 million from $47.2 million in the year ended December 31, 2013. General and administrative expenses attributable to the activities of Net Optics were approximately $3.1 million and $555,000 for the years ended December 31, 2014 and 2013, respectively.
Our general and administrative expenditures in the year ended December 31, 2014 included charges related (i) internal investigations and related remediation efforts, (ii) the restatement of our financial statements for the first quarter of 2013 and for the three and six months ended June 30, 2013, and (iii) the securities class action against the Company and certain of its current and former officers and directors as well as shareholder derivative actions. These costs consisted primarily of legal and accounting costs and expenses, recruiting and consulting expenses, severance and retention costs, and other related expenses.
Our general and administrative expenditures in 2013 included charges related to the internal investigation initiated by the Audit Committee of the Board of Directors as a result of the resignation of our former chief executive officer (Victor Alston) and costs related to the April 2013 restatement of certain of our previously filed financial statements. These charges were partially offset by proceeds from the settlement of a legal matter in the first quarter of 2013.
Our general and administrative expenses in the year ended December 31, 2014, other than those attributable to the activities of Net Optics or comprised of stock-based compensation expense or the other charges noted above, were in the aggregate amount of $45.3 million, representing an 11.5% increase compared to $40.6 million of such expenses in the year ended December 31, 2013. This increase was primarily due to an increase in net compensation and related employee costs, higher depreciation and amortization costs and higher facilities costs. The increase in compensation and other related costs was primarily due to an increase in our administrative headcount.
Amortization of Intangible Assets. During the year ended December 31, 2014, amortization of intangible assets increased 14.9% to $46.9 million from $40.8 million in the year ended December 31, 2013. These increases were primarily due to the full year and incremental amortization of intangible assets related to our 2013 Net Optics acquisition, partially offset by the completion of amortization periods for certain intangible assets.
Acquisition and Other Related Expenses. During the year ended December 31, 2014, acquisition and other related expenses decreased 52.6% to $3.3 million from $6.9 million in the year ended December 31, 2013. During the years ended December 31, 2014 and 2013, acquisition and other related expenses were primarily related to the 2013 acquisitions of Net Optics and the 2012 acquisition of BreakingPoint Systems. Acquisition and other related expenses primarily consisted of transaction and integration-related costs such as professional fees for legal, accounting and tax services, integration-related consulting fees, certain employee, facility and infrastructure costs, and other acquisition-related costs. For additional information, see Note 2 to the consolidated financial statements included in this Form 10-K.
Restructuring. Restructuring costs for the year ended December 31, 2014 were $10.3 million compared to $1.8 million for the year ended December 31, 2013. Restructuring costs incurred in the year ended December 31, 2014 were primarily related to expenses for employee termination benefits consisting of severance and other employee-related costs and lease termination costs associated with the 2014 Corporate Restructuring and the Net Optics Restructuring. Restructuring costs incurred in the year ended December 31, 2013 were primarily related to employee termination benefits associated with the restructuring of our offshore research and development group in India. For additional information, see Note 4 to the consolidated financial statements included in this Form 10-K.
Interest Income and Other, Net. Interest and other income, net was an expense of approximately $24,000 in the year ended December 31, 2014 compared to income of $6.3 million in the year ended December 31, 2013. This decrease was primarily due to a $2.9 million realized gain recorded during the second quarter of 2013 for the sale of certain auction rate securities that were previously written-down and a $1.0 million realized gain recorded during the third quarter of 2013 for the sale of corporate bond investments that were previously written-down. The decrease was also impacted by lower net realized gains incurred on investment activity in 2014 as compared to 2013.
48
Interest expense. Interest expense, including the amortization of debt issuance costs, increased to $8.3 million in the year ended December 31, 2014 from $7.8 million in the year ended December 31, 2013. Interest expense relates to our previously outstanding convertible senior notes, as well as the amortization of deferred issuance costs and commitment fees related to our prior credit facility, which we established in December 2012. The increase was primarily due to a write-off of the remaining unamortized debt issuance costs related to our prior credit facility. For additional information, see Note 3 to the consolidated financial statements included in this Form 10-K.
Income Tax Expense. Income tax benefit was $11.1 million, or an effective rate of 21.1%, in 2014 as compared to an income tax benefit of $1.1 million, or an effective rate of (9.9)%, in 2013. The lower effective tax rate of 21.1% when compared to the federal statutory income tax rate was mainly due to increases in unrecognized tax benefits, and intercompany activity such as inter-company royalties and transfers. The lower effective tax rate in 2013 when compared to the federal statutory income tax rate was primarily due to research and development credits generated during 2013, the benefit recorded for the 2012 Federal research and development credit during the first quarter of 2013 as a result of the statutory extension of the credit during the 2013 first quarter, and the release of certain reserves related to uncertain tax benefits.
Liquidity and Capital Resources
Our cash, cash equivalents and investments decreased by $59.2 million to $67.0 million at December 31, 2015 from the $126.2 million reported at December 31, 2014, primarily due to the use of approximately $201.7 million to repay our debt obligations and $8.4 million for capital expenditures, offset partially by net cash provided by our operating activities of $98.8 million, cash of $38.7 million (net of debt issuance costs) received from the March 2015 funding of our Term Loan and $13.7 million of proceeds received from the exercises of share-based awards.
Our cash, cash equivalents and investments in the aggregate increased by $40.5 million to $126.2 million at December 31, 2014 from the $85.7 million reported at December 31, 2013, primarily due to $38.1 million in net cash provided by our operating activities and $9.4 million of proceeds from exercises of share-based awards, partially offset by capital expenditures of $8.1 million.
Of our cash, cash equivalents and investments in the aggregate, $21.5 million and $33.6 million were held outside of the United States in various foreign subsidiaries as of December 31, 2015 and December 31, 2014, respectively. Cumulative undistributed earnings of foreign subsidiaries for which no deferred income taxes have been provided approximated $100.5 million and $84.8 million at December 31, 2015 and 2014, respectively. Under current tax laws and regulations, if our cash, cash equivalents or investments associated with the subsidiaries’ undistributed earnings were to be repatriated in the form of dividends or deemed distributions, we would be subject to additional U.S. income taxes and foreign withholding taxes. We consider these funds to be indefinitely reinvested in our foreign operations and do not intend to repatriate them. Determination of the amount of unrecognized deferred income tax liability related to these earnings is not practicable. We had no exposure to European sovereign debt as of December 31, 2015 and 2014.
The following table sets forth our summary cash flows for the years ended December 31, 2015, 2014 and 2013 (in thousands):
Year Ended December 31, | |||||||||||
2015 | 2014 | 2013 | |||||||||
Cash provided by operating activities | $ | 98,804 | $ | 38,071 | $ | 86,500 | |||||
Cash provided by (used in) investing activities | 55,837 | (34,916 | ) | (121,710 | ) | ||||||
Cash (used in) provided by financing activities | (148,563 | ) | 9,050 | 21,891 | |||||||
Cash Flows from Operating Activities
Operating cash inflows are principally provided by cash collections on sales to our customers. Our primary uses of cash from operating activities are for personnel-related expenditures, product costs and facility-related payments. Going forward, our cash flows from operating activities will be impacted by (i) the extent to which we grow our customer sales, (ii) the extent to which we increase our headcount and enhance our infrastructure to generate additional business, develop new products and features, and support our growth, (iii) our working capital management, and (iv) interest paid to service our debt (See Note 3 to the consolidated financial statements included in this Form 10-K).
49
Net cash provided by operating activities was $98.8 million for the year ended December 31, 2015 compared to $38.1 million for the year ended December 31, 2014. This increase in cash flow generated from operations was primarily driven by net earnings of $6.0 million for the year ended December 31, 2015 compared to a net loss of $41.6 million for the year ended December 31, 2014. That change was primarily a result of higher revenues in the year ended December 31, 2015, and a positive impact on cash from net working capital changes of $14.1 million. The positive impact on cash from net working capital changes was primarily a result of increases in accrued expenses and other liabilities, due primarily to higher bonus and income tax accruals, and decreases in our inventory balances due to more efficient inventory management, partially offset by a negative impact on cash from an increase in accounts receivable driven by higher sales in 2015 and the timing of cash collections.
Net cash provided by operating activities was $38.1 million for the year ended December 31, 2014 compared to $86.5 million for the year ended December 31, 2013. This decrease in cash flow generated from operations was primarily driven by a net loss of $41.6 million for the year ended December 31, 2014 compared to net income of $11.9 million for the year ended December 31, 2013. That change was primarily a result of higher operating expenses and other charges, including legal and accounting costs, associated with our restructuring initiatives, internal investigations, class action and shareholder derivative lawsuits, and financial statement restatements during the year ended December 31, 2014 as compared to the year ended December 31, 2013.
Cash Flows from Investing Activities
Our cash inflow from investing activities principally relates to proceeds from the sale and maturities of our investments in marketable securities. Our primary uses of cash from investing activities are for purchases of marketable securities investments, payments to acquire new products, technologies and businesses, and capital expenditures to support our growth. Going forward, we expect our cash flows from investing activities to fluctuate based on the number of product, technology and/or business acquisitions, if any, that we close using cash, and the timing of our sales, maturities and purchases of marketable securities.
Net cash provided by investing activities was $55.8 million for the year ended December 31, 2015, and net cash used in investing activities was $34.9 million for the year ended December 31, 2014. Net cash provided by investing activities during the year ended December 31, 2015 was primarily a result of net proceeds of $65.1 million from the sale of marketable securities to help fund the repayment of our convertible senior notes, partially offset by $8.4 million for purchases of property and equipment. Net cash used in investing activities for the year ended December 31, 2014 was primarily due to the use of $28.3 million for the net purchases of marketable securities and $8.1 million for purchases of property and equipment.
Net cash used in investing activities was $34.9 million and $121.7 million for the years ended December 31, 2014 and 2013, respectively. The decrease in net cash used in investing activities was primarily a result of less cash used for acquisitions and lower purchases of property and equipment during the year ended December 31, 2014 as compared to the year ended December 31, 2013, partially offset by lower cash provided from the proceeds of the sales of investments in marketable securities.
Cash Flows from Financing Activities
Historically, cash inflows from financing activities have been principally related to proceeds from the exercise of stock options and employee stock purchase plan options. On December 7, 2010, we raised $194 million in net proceeds from the issuance of $200 million in aggregate principal amount of convertible senior notes, which, to the extent they remained outstanding, matured on December 15, 2015. On March 2, 2015, we entered into an amended and restated credit agreement (the “Credit Agreement”) that provided for a term loan in the amount of $40 million (the “Term Loan”) and a revolving credit facility (the “Revolving Credit Facility” and, together with the Term Loan, the “Credit Facility”) in the maximum aggregate amount of $60 million. We received $38.8 million, net of debt issuance costs, upon funding of the Term Loan in March 2015. The amount of the Revolving Credit Facility was increased to $75 million in September 2015 pursuant to an amendment to the Credit Agreement. In January 2016, we entered into a further amendment to the Credit Agreement to, among other modifications, increase the commitments under the Revolving Credit Facility to an aggregate amount of up to $150 million, extend the maturity date of the Revolving Credit Facility to February 15, 2020, and provide that the Revolving Credit Facility may, upon our request and subject to the receipt of increased commitments from existing lenders or additional lenders, be increased by the aggregate amount of up to $100 million.
50
The Term Loan requires quarterly repayments of principal on the last day of the eleven fiscal quarters commencing with the fiscal quarter ended June 30, 2015. The first four payments are in the amount of $500,000 each, the following four payments are in the amount of $1.0 million each, and the next three payments are in the amount of $1.5 million each. The remaining principal balance of the Term Loan will be due and payable on February 15, 2018. We are permitted to voluntarily prepay outstanding loans under the Credit Facility at any time without premium or penalty. Prior to the maturity of the Credit Facility, we may re-borrow amounts under the Revolving Credit Facility, but we may not re-borrow amounts that are repaid or prepaid under the Term Loan. For additional information regarding the Term Loan and the Revolving Credit Facility, see Note 3 to the consolidated financial statements included in this Form 10-K.
Going forward, we expect our cash flows from financing activities to fluctuate based on (i) the number of exercises of share-based awards, which is partially dependent on the performance of our stock price and (ii) the utilization of our Revolving Credit Facility under the Credit Agreement. If deemed appropriate, and approved by our Board of Directors, we may from time to time also raise capital through debt or equity financings; refinance our existing debt under the Credit Agreement and/or initiate stock buyback programs.
Net cash used in financing activities was $148.6 million for the year ended December 31, 2015, and net cash provided by financing activities was $9.1 million for the year ended December 31, 2014. Net cash used by financing activities during the year ended December 31, 2015 was primarily related to the use of a total of $201.7 million for the July 2015 repurchase of certain of our outstanding convertible senior notes in the aggregate principal amount of $65 million, the December 2015 repayment at maturity of our remaining outstanding convertible senior notes in the aggregate principal amount of $135 million and periodic repayments of our Term Loan, partially offset by borrowings under our Term Loan, net of deferred issuance costs, of $38.7 million, and $13.7 million in proceeds received from the issuance of stock related to the exercise of stock options and employee stock purchase plan options. Net cash provided by financing activities of $9.1 million in 2014 was primarily related to proceeds received from the issuance of stock related to the exercise of stock options and employee stock purchase plan options.
Net cash provided by financing activities was $9.1 million and $21.9 million for the years ended December 31, 2014 and 2013, respectively. This decrease in cash flow provided by financing activities was primarily due to a $10.0 million decrease in proceeds received from exercises of share-based awards during the year ended December 31, 2014 as compared to the year ended December 31, 2013.
We believe that our existing balances of cash, cash equivalents and investments, cash flows expected to be generated from our operations and amounts available under our Credit Agreement will be sufficient to satisfy our operating requirements for the next 12 months.
We also may seek additional sources of capital as necessary or appropriate to fund acquisitions or to otherwise finance our growth or operations; there can be no assurance that such funds, if needed, will be available on favorable terms, if at all.
Our access to the capital markets to raise funds, through the sale of equity or debt securities, is subject to various limitations, including the conditions in U.S. capital markets. We are not currently able to sell our securities using short-form registration statement on Form S-3 under the Securities Act of 1933, as amended, due to our late filing with the SEC of certain of our periodic reports for prior periods, including most recently our Annual Report on Form 10-K for the year ended December 31, 2014. We expect to be eligible to use short-form registration on April 1, 2016. If we want to access the capital markets during the period of time that we are unable to use Form S-3, we may experience delays due to having to wait for a regulatory review of a Form S-1 registration statement. Any such delay may result in offering terms that may not be advantageous to us, may not allow us to obtain capital in a timely fashion, and would increase our transaction costs.
51
Contractual Obligations
Our significant financial commitments at December 31, 2015 are as follows (in thousands):
Total | Less than 1 year | 1-3 years | 3-5 years | More than 5 years | |||||||||||||||
(in thousands) | |||||||||||||||||||
Operating leases (1) | $ | 44,977 | $ | 10,338 | $ | 14,820 | $ | 11,359 | $ | 8,460 | |||||||||
Purchase obligations (2) | 24,617 | 24,617 | — | — | — | ||||||||||||||
Term Loan (Principal and Interest) (3) | 41,176 | 4,871 | 36,303 | 2 | — | ||||||||||||||
Total | $ | 110,770 | $ | 39,826 | $ | 51,123 | $ | 11,361 | $ | 8,460 | |||||||||
(1) | Minimum lease payments have not been reduced by minimum sublease rentals of $0.8 million due in the future under non-cancelable subleases. See Note 10 to consolidated financial statements. |
(2) | Purchase obligations in the table above consist of purchase orders issued to certain of our contract manufacturers in the normal course of business to purchase specified quantities of our hardware products. It is not our intent, nor is it reasonably likely, that we would cancel these executed purchase orders. |
(3) | In March 2015, we entered into an amended and restated credit agreement which provides for a term loan in the aggregate principal amount of $40 million. The Term Loan requires quarterly repayments of principal on the last day of the eleven fiscal quarters commencing with the fiscal quarter ended June 30, 2015. The first four payments are in the amount of $500,000 each, the following four payments will be in the amount of $1.0 million each, and the next three payments will be in the amount of $1.5 million each. The remaining principal balance of the Term Loan will be due and payable on the maturity date, which is February 15, 2018. See Note 3 to the consolidated financial statements. The term loan obligations in the table above assume an interest rate of 3.69% in future years. |
Recent Accounting Pronouncements
Information regarding new accounting pronouncements is included in Note 1 to the consolidated financial statements.
Item 7A. Quantitative and Qualitative Disclosures About Market Risk
Interest Rate Sensitivity
Investment Activities
We maintain a portfolio of cash equivalents and investments in a variety of fixed and variable rate securities, including U.S. government and federal agency securities, corporate debt securities and money market funds. The primary objective of our investment activities is to maintain the safety of principal and preserve liquidity while maximizing yields without significantly increasing risk. We do not enter into investments for trading or speculative purposes. Fixed-rate securities are subject to market risk so changes in prevailing interest rates may adversely impact their fair market value should interest rates rise. While we do not intend to sell these fixed rate securities prior to maturity based on a sudden change in market interest rates, should we choose to sell these securities in the future, our consolidated operating results or cash flows may be adversely affected. A smaller portion of our cash equivalents and investment portfolio consists of variable interest rate securities. Accordingly, we also have interest rate risk with these variable rate securities as the income produced may decrease if interest rates fall. We do not use derivatives or similar instruments to manage our interest rate risk. Due to the high investment quality and relatively short duration of these investments, we do not believe that they present any material exposure to changes in fair market value as a result of changes in interest rates.
52
Senior Secured Revolving Credit Facility
On March 2, 2015, we entered into a credit agreement with certain institutional lenders under which we secured a term loan in the aggregate principal amount of $40 million (the “Term Loan”), which amount has been advanced to us, and established a revolving credit facility for an aggregate loan amount of up to $60 million (the “Revolving Credit Facility” and, together with the Term Loan, the “Credit Facility”). As of December 31, 2015, the Revolving Credit Facility, as amended, provided for an aggregate loan amount of up to $75 million. On January 25, 2016, the Company entered into an amendment to the Credit Agreement which, among other modifications, increased the commitments under the Revolving Credit Facility to an aggregate amount of up to $150 million, extended the maturity date of the Revolving Credit Facility to February 15, 2020, and provided that the Revolving Credit Facility may, upon the Company’s request and subject to the receipt of increased commitments from the lenders party thereto or additional lenders, be increased by the aggregate amount of up to $100 million. As of December 31, 2015, there was $38.5 million outstanding under our term loan and no amounts outstanding under our Revolving Credit Facility.
Prior to September 30, 2015, interest rates for the Revolving Credit Facility for the first year following the March 2, 2015 effective date of the Credit Facility and for the Term Loan were set, at the Company’s option, at a rate per annum of (i) 4.25% above the Eurodollar rate or (ii) 3.25% above a defined base rate. After September 30, 2015, the interest rates for both the Term Loan and the Revolving Credit Facility are established, at the Company’s option, based on the Eurodollar rate or a defined base rate. Such interest rates range from 2.0% to 3.0% above the Eurodollar rate for Eurodollar-based borrowings and from 1.0% to 2.0% above the defined base rate for base rate borrowings, in each case depending on the Company’s leverage ratio. Swingline loans bear interest at the applicable margin for loans under the Revolving Credit Facility based on the defined base rate. If we default under the Credit Facility, the lenders may also increase the interest rate(s) to 2.0% more than the rate(s) otherwise applicable. Interest is payable quarterly. As of December 31, 2015, the interest rate applicable to the amount outstanding under the Term Loan was 2.92%.
Exchange Rate Sensitivity
The majority of our revenue and expenses are denominated in U.S. dollars. However, since we have sales, research and development, and other operations outside of the United States, we do incur operating expenses in foreign currencies, primarily the Japanese Yen, Romanian Lei, Indian Rupee, Chinese Yuan, Canadian Dollar, Euro and British Pound. If these currencies strengthen against the U.S. dollar, our costs reported in U.S. dollars will increase, which would adversely affect our operating expenses.
Approximately 27% of our operating expenses, excluding stock-based compensation expense and amortization of intangible assets, are exposed to foreign currency movements, and historically, we have not entered into foreign currency forward contracts to hedge our operating expense exposure to foreign currencies, but we may do so in the future. We estimate that the impact of changes in foreign currency rates in 2015 on our operating expenses, excluding stock-based compensation expense and amortization of intangible assets, was approximately 3.1%.
The fair value of our foreign currency forward contracts is sensitive to changes in foreign currency exchange rates. When possible, we use foreign currency forward contracts to minimize the short-term impact of currency fluctuations on foreign currency receivables that are denominated in Japanese Yen, Euros and British Pounds. The duration of our foreign currency forward contracts typically have maturities of one to four months. We do not enter into foreign exchange forward contracts for speculative or trading purposes. Due to the relatively short duration of these forward contracts, we do not believe that they present any material exposure to changes in fair market value as a result of changes in foreign currency exchange rates. Additionally, these contracts are intended to offset exchange losses and gains on underlying exposures in foreign currency receivables. During the years ended December 31, 2015, 2014 and 2013, the net impact from changes to foreign currency exchange rates related to forward contracts was not material.
As of December 31, 2015, we held three open foreign currency forward contracts with a notional value of $4.8 million and a net fair value of approximately $15,000. As of December 31, 2014, we held three open foreign currency forward contracts with a notional value of $8.5 million and a net fair value of approximately $24,000.
Item 8. Financial Statements and Supplementary Data
Our financial statements and supplementary data required by this Item are provided in the consolidated financial statements of the Company included in this Form 10-K as listed in Item 15(a) of this Form 10-K.
53
Item 9. Changes in and Disagreements with Accountants on Accounting and Financial Disclosure
None.
Item 9A. Controls and Procedures
Evaluation of Disclosure Controls and Procedures
Our management (with the participation of our Chief Executive Officer (“CEO”) and Chief Financial Officer (“CFO”)) evaluated the effectiveness, as of the end of the period covered by this Form 10-K, of the design and operation of the Company’s disclosure controls and procedures (as defined in Rules 13a-15(e) and 15d-15(e) under the Securities Exchange Act of 1934, as amended (the “Exchange Act”)). Based on that evaluation, our CEO and CFO have concluded that, due to a material weakness in our internal control over financial reporting as of December 31, 2015, our disclosure controls and procedures were not effective as of such date to ensure that the information required to be disclosed in reports that we file or submit under the Exchange Act is (i) recorded, processed, summarized and reported within the time periods specified in SEC rules and forms and (ii) accumulated and communicated to our management, including our CEO and CFO, as appropriate to allow timely decisions regarding required disclosure.
Notwithstanding such material weakness, which is described below in Management’s Report on Internal Control over Financial Reporting, our management has concluded that the consolidated financial statements included in this Form 10-K present fairly, in all material respects, our financial position, results of operations and cash flows for the periods presented in conformity with accounting principles generally accepted in the U.S.
Management’s Report on Internal Control over Financial Reporting
Our management is responsible for establishing and maintaining adequate internal control over financial reporting, as such term is defined in Rules 13a-15(f) and 15d-15(f) under the Exchange Act. Our internal control over financial reporting is a process designed by, or under the supervision of, our CEO and CFO, to provide reasonable assurance regarding the reliability of financial reporting and the preparation of our consolidated financial statements for external purposes in accordance with U.S. generally accepted accounting principles. Internal control over financial reporting includes those policies and procedures that (1) pertain to the maintenance of records that, in reasonable detail, accurately and fairly reflect the transactions and dispositions of the assets of the Company; (2) provide reasonable assurance that transactions are recorded as necessary to permit preparation of financial statements in accordance with generally accepted accounting principles, and that receipts and expenditures of the Company are being made only in accordance with authorizations of management and directors of the Company; and (3) provide reasonable assurance regarding prevention or timely detection of unauthorized acquisition, use or disposition of the Company’s assets that could have a material effect on the financial statements. Because of its inherent limitations, our internal control over financial reporting may not prevent or detect misstatements. Also, projections of any evaluation of effectiveness to future periods are subject to the risk that controls may become inadequate because of changes in conditions, or that the degree of compliance with policies or procedures may deteriorate.
Our management (with the participation of our CEO and CFO) conducted an evaluation of the effectiveness of our internal control over financial reporting as of December 31, 2015 based on the framework in Internal Control-Integrated Framework (2013) issued by the Committee of Sponsoring Organizations of the Treadway Commission (“COSO”).
A material weakness is a deficiency, or a combination of deficiencies, in internal control over financial reporting, such that there is a reasonable possibility that a material misstatement of the Company’s annual or interim financial statements will not be prevented or detected on a timely basis.
54
In connection with management’s assessment of our internal control over financial reporting described above, management has identified the following deficiencies that constituted a material weakness in our internal control over financial reporting related to revenue recognition as of December 31, 2015. The Company’s internal controls were not designed to: (i) appropriately identify each deliverable, including those deliverables within related orders, to allocate the arrangement consideration and assess the accounting impact of certain multiple-element sales arrangements, (ii) ensure that vendor specific objective evidence (VSOE) and best estimate of selling price (BESP) used to allocate arrangement consideration were properly determined, applied and documented, (iii) properly identify and account for arrangements that included payment terms that extended beyond the Company’s customary terms, (iv) ensure proper cut-off for certain transaction types, and (v) identify and account for modifications to approved sales orders prior to delivery of the related products and/or services. In addition, the Company’s controls over the completeness and accuracy of information used in the execution of internal controls within the revenue recognition process were not properly designed. The Company also did not have effective general information technology controls around certain licensing systems. As a result of these design deficiencies, the Company’s policies and controls related to its revenue recognition practices were not effective in ensuring that revenue was properly accounted for.
Because of this material weakness, management has concluded that we did not maintain effective internal control over financial reporting as of December 31, 2015.
The effectiveness of our internal control over financial reporting as of December 31, 2015 has been audited by Deloitte & Touche LLP, our independent registered public accounting firm, as stated in its report which is included elsewhere herein.
Changes in Internal Control Over Financial Reporting
During the quarter ended December 31, 2015, changes to our internal control over financial reporting that have materially affected, or that are reasonably likely to materially affect, our internal control over financial reporting were:
Control Environment. We established additional controls to assess the segregation of duties within certain areas of the organization, and to detect situations where segregation of duties conflicts could result in material misstatements to the financial statements. Specifically, the Company revised user responsibilities in its ERP system to eliminate or reduce certain of the segregation of duties conflicts. For segregation of duties conflicts that continue to exist due to the business process or system limitations, the Company identified appropriate compensating controls that mitigate the risk of material misstatements caused by existing segregation of duties conflicts.
Revenue. We designed and implemented appropriate general information technology controls over our data warehouse.
Remediation Efforts to Address Identified Material Weakness
Our management has worked, and continues to work, to strengthen our internal control over financial reporting. We are committed to ensuring that such controls are designed and operating effectively. If not remediated, the material weakness in our internal controls could result in material misstatements in our financial statements.
Our Board of Directors and management take internal controls over and the integrity of the Company’s financial statements seriously and believe that the remediation steps described below are essential to maintaining strong and effective internal controls over financial reporting and a strong internal control environment. The following steps are among the measures that will be implemented as soon as practicable after the date of this filing to address our material weakness as of December 31, 2015:
• | We will complete the design and implementation of controls related to revenue recognition, including those related to identification of deliverables in and allocation of consideration in arrangements, determination and application of VSOE and BESP, identification of and accounting for arrangements that include payment terms that extend beyond the Company’s customary terms, and application of proper cut-off. |
• | We will design and implement appropriate controls to identify and account for modifications to approved sales orders prior to delivery of the related products and/or services. |
• | We will complete the design and implementation of controls over the completeness and accuracy of information used in the execution of internal controls within the revenue recognition process. |
• | We will design and implement general information technology controls around certain licensing systems to ensure they are effective. |
55
The Audit Committee has directed management to develop a detailed plan and timetable for the completion of the implementation of the remedial measures outlined above and will continue to monitor such implementation. In addition, under the direction of the Audit Committee, management will continue to review and make necessary changes to the overall design of our internal control environment, as well as to our policies and procedures in order to improve the overall effectiveness of our internal control over financial reporting.
We are committed to maintaining a strong internal control environment, and believe that these remediation actions will represent significant improvements in our controls when they are fully implemented. We will continue to assess the effectiveness of our remediation efforts in connection with our evaluations of internal control over financial reporting.
Item 9B. Other Information
None.
56
REPORT OF INDEPENDENT REGISTERED PUBLIC ACCOUNTING FIRM
To the Board of Directors and Shareholders of Ixia
Calabasas, California
We have audited Ixia and subsidiaries’ (the “Company’s”) internal control over financial reporting as of December 31, 2015, based on criteria established in Internal Control - Integrated Framework (2013) issued by the Committee of Sponsoring Organizations of the Treadway Commission. The Company’s management is responsible for maintaining effective internal control over financial reporting and for its assessment of the effectiveness of internal control over financial reporting included in the accompanying Management’s Report on Internal Control over Financial Reporting. Our responsibility is to express an opinion on the Company’s internal control over financial reporting based on our audit.
We conducted our audit in accordance with the standards of the Public Company Accounting Oversight Board (United States). Those standards require that we plan and perform the audit to obtain reasonable assurance about whether effective internal control over financial reporting was maintained in all material respects. Our audit included obtaining an understanding of internal control over financial reporting, assessing the risk that a material weakness exists, testing and evaluating the design and operating effectiveness of internal control based on that risk, and performing such other procedures as we considered necessary in the circumstances. We believe that our audit provides a reasonable basis for our opinion.
A company’s internal control over financial reporting is a process designed by, or under the supervision of, the company’s principal executive and principal financial officers, or persons performing similar functions, and effected by the company’s board of directors, management, and other personnel to provide reasonable assurance regarding the reliability of financial reporting and the preparation of financial statements for external purposes in accordance with generally accepted accounting principles. A company’s internal control over financial reporting includes those policies and procedures that (1) pertain to the maintenance of records that, in reasonable detail, accurately and fairly reflect the transactions and dispositions of the assets of the company; (2) provide reasonable assurance that transactions are recorded as necessary to permit preparation of financial statements in accordance with generally accepted accounting principles, and that receipts and expenditures of the company are being made only in accordance with authorizations of management and directors of the company; and (3) provide reasonable assurance regarding prevention or timely detection of unauthorized acquisition, use, or disposition of the company’s assets that could have a material effect on the financial statements.
Because of the inherent limitations of internal control over financial reporting, including the possibility of collusion or improper management override of controls, material misstatements due to error or fraud may not be prevented or detected on a timely basis. Also, projections of any evaluation of the effectiveness of the internal control over financial reporting to future periods are subject to the risk that the controls may become inadequate because of changes in conditions, or that the degree of compliance with the policies or procedures may deteriorate.
A material weakness is a deficiency, or a combination of deficiencies, in internal control over financial reporting, such that there is a reasonable possibility that a material misstatement of the company’s annual or interim financial statements will not be prevented or detected on a timely basis. The following material weakness has been identified and included in management’s assessment:
Revenue Recognition - The Company’s internal controls were not designed to: (i) appropriately identify each deliverable, including those deliverables within related orders, to allocate the arrangement consideration and assess the accounting impact of certain multiple-element sales arrangements, (ii) ensure that vendor specific objective evidence (VSOE) and best estimate of selling price (BESP) used to allocate arrangement consideration were properly determined, applied and documented, (iii) properly identify and account for arrangements that included payment terms that extended beyond the Company’s customary terms, (iv) ensure proper cut-off for certain transaction types, and (v) identify and account for modifications to approved sales orders prior to delivery of the related products and/or services. In addition, the Company’s controls over the completeness and accuracy of information used in the execution of internal controls within the revenue recognition process were not properly designed. The Company also did not have effective general information technology controls around certain licensing systems. As a result of these design deficiencies, the Company’s policies and controls related to its revenue recognition practices were not effective in ensuring that revenue was properly accounted for.
This material weakness was considered in determining the nature, timing, and extent of audit tests applied in our audit of the consolidated financial statements as of and for the year ended December 31, 2015, of the Company and this report does not affect our report on such financial statements.
57
In our opinion, because of the effect of the material weakness identified above on the achievement of the objectives of the control criteria, the Company has not maintained effective internal control over financial reporting as of December 31, 2015, based on the criteria established in Internal Control - Integrated Framework (2013) issued by the Committee of Sponsoring Organizations of the Treadway Commission.
We have also audited, in accordance with the standards of the Public Company Accounting Oversight Board (United States), the consolidated financial statements as of and for the year ended December 31, 2015, of the Company and our report dated February 29, 2016, expressed an unqualified opinion on those financial statements.
/s/ Deloitte & Touche LLP
Los Angeles, California
February 29, 2016
58
PART III
Item 10. Directors, Executive Officers and Corporate Governance
Certain information required by this Item is incorporated herein by reference to information appearing in our definitive Proxy Statement for our Annual Meeting of Shareholders to be held on June 2, 2016, which information will appear under the captions entitled “Proposal 1 - Election of Directors – Nominees,” “Proposal 1 – Election of Directors - Information Regarding our Board of Directors and its Committees,” “Executive Officers,” and “Section 16(a) Beneficial Ownership Reporting Compliance.” The Proxy Statement will be filed with the Commission within 120 days after our last fiscal year-end which was December 31, 2015.
The Registrant has adopted a Code of Ethics for its Chief Executive and Senior Financial Officers, a copy of which is included as Exhibit 14.1 to Annual Report on Form 10-K for fiscal year-ended December 31, 2003.
Item 11. Executive Compensation
The information required by this Item is incorporated herein by reference to information appearing in our definitive Proxy Statement for our Annual Meeting of Shareholders to be held on June 2, 2016, which information will appear under the captions “Proposal 1 - Election of Directors - Compensation of Directors,” “Executive Compensation and Other Information” (other than under the subcaption “Equity Compensation Plan Information”), and “Compensation Committee Report.” The Proxy Statement will be filed with the Commission within 120 days after our last fiscal year-end which was December 31, 2015.
Item 12. Security Ownership of Certain Beneficial Owners and Management and Related Stockholder Matters
The information required by this Item is incorporated herein by reference to information appearing in our definitive Proxy Statement for our Annual Meeting of Shareholders to be held on June 2, 2016, which information will appear under the captions “Common Stock Ownership of Principal Shareholders and Management” and “Executive Compensation and Other Information - Equity Compensation Plan Information.” The Proxy Statement will be filed with the Commission within 120 days after our last fiscal year-end which was December 31, 2015.
Item 13. Certain Relationships and Related Transactions, and Director Independence
Any information required by this Item is incorporated herein by reference to information appearing in our definitive Proxy Statement for our Annual Meeting of Shareholders to be held on June 2, 2016, which information will appear under the captions “Certain Relationships and Related Transactions,” and “Proposal 1 – Election of Directors – Information Regarding our Board of Directors and its Committees.” The Proxy Statement will be filed with the Commission within 120 days after our last fiscal year-end which was December 31, 2015.
Item 14. Principal Accounting Fees and Services
The information required by this Item is incorporated herein by reference to information appearing in our definitive Proxy Statement for our Annual Meeting of Shareholders to be held on June 2, 2016, which information will appear under the captions “Proposal 3 - Ratification of Appointment of Independent Registered Public Accounting Firm.” The Proxy Statement will be filed with the Commission within 120 days after our last fiscal year-end which was December 31, 2015.
59
PART IV
Item 15. Exhibits, Financial Statement Schedules
(a) | The following documents are filed as part of this Report: |
(1) | Consolidated Financial Statements |
The consolidated financial statements listed in the accompanying Index to Consolidated Financial Statements are filed as part of this report.
(2) | Financial Statement Schedule |
The financial statement schedules have been omitted because they are not applicable or the information required to be set forth therein is included in the consolidated financial statements or notes thereto.
(3) | Exhibits |
2.1 | Agreement and Plan of Merger dated as of May 4, 2012, by and among the Company, Anue Systems, Inc., Emily Acquisition Corp. and Alexander Pepe, as the Representative (1) | |
2.2 | Agreement and Plan of Merger dated as of June 30, 2012, by and among the Company, BreakingPoint Systems, Inc., Camden Acquisition Corp. and Desmond P. Wilson III, as the Representative (2) | |
2.3 | Agreement and Plan of Merger dated as of October 29, 2013, by and among the Company, Net Optics, Inc., Matthew Acquisition Corp. and Charlotte Matityahu, as the Representative (3) | |
3.1 | Amended and Restated Articles of Incorporation, as amended (4) | |
3.2 | Bylaws, as amended (5) | |
10.1 | Amended and Restated Credit Agreement dated as of March 2, 2015, by and among the Company, as the Borrower, Anue Systems, Inc., BreakingPoint Systems, Inc., Catapult Communications Corporation, Net Optics, Inc., Net Optics IL, LLC, and VeriWave, Inc., as the Guarantors, Silicon Valley Bank, as Administrative Agent, Swingline Lender, and Letter of Credit Issuer, and the Other Lenders Parties Thereto (6) | |
10.1.1 | Corrective Amendment to Credit Agreement effective as of March 20, 2015 between the Company and Silicon Valley Bank, as Administrative Agent (7) | |
10.1.2 | Second Amendment to Amended and Restated Credit Agreement dated as of September 30, 2015, by and among the Company, as the Borrower, Anue Systems, Inc., BreakingPoint Systems, Inc., Catapult Communications Corporation, Net Optics, Inc., Net Optics IL LLC, and VeriWave, Inc., as the Guarantors, Silicon Valley Bank, as Administrative Agent, and the Lenders Party Thereto (8) | |
10.1.3 | Third Amendment to Amended and Restated Credit Agreement dated as of January 25, 2016, by and among the Company, as the Borrower, Anue Systems, Inc., BreakingPoint Systems, Inc., Catapult Communications Corporation, Net Optics, Inc., Net Optics IL LLC, and VeriWave, Inc., as the Guarantors, Silicon Valley Bank, as Administrative Agent, and the Lenders Party Thereto (9) | |
10.2* | Amended and Restated 1997 Equity Incentive Plan (10) | |
10.3* | Ixia 2010 Employee Stock Purchase Plan, as amended (11), including Amendment No. 2 dated May 9, 2013 (12) and Amendment No. 3 dated June 19, 2013 (13) | |
60
10.4* | Officer Severance Plan (14), including Amendment dated December 31, 2008 (15), Amendment No. 2 dated March 22, 2011 (16) and Amendment No. 3 dated December 21, 2012 (17) | |
10.5* | Ixia Officer Severance Plan (as Amended and Restated effective January 1, 2009) (18), including Amendment No. 1 dated December 21, 2012 (19) | |
10.5.1* | Ixia Officer Severance Plan (as Amended and Restated effective February 12, 2016) (20) | |
10.6* | Form of Indemnity Agreement between Ixia and its directors and executive officers (21) | |
10.7 | Office Lease Agreement dated September 14, 2007 between MS LPC Malibu Property Holdings, LLC and the Company (22) | |
10.7.1 | First Amendment to Office Lease dated February 11, 2010, between MS LPC Malibu Property Holdings, LLC and the Company (23) | |
10.7.2 | Second Amendment to Office Lease dated November 15, 2010, between MS LPC Malibu Property Holdings, LLC and the Company (24) | |
10.7.3 | Third Amendment to Office Lease dated January 10, 2012 between MS LPC Malibu Property Holdings, LLC and the Company (25) | |
10.7.4 | Fourth Amendment to Office Lease dated June 1, 2012 between MS LPC Malibu Property Holdings, LLC and the Company (26) | |
10.7.5 | Fifth Amendment to Office Lease dated November 1, 2012 between MS LPC Malibu Property Holdings, LLC and the Company (27) | |
10.7.6 | Sixth Amendment to Office Lease dated June 18, 2013 between MS LPC Malibu Property Holdings, LLC and the Company (28) | |
10.8* | Compensation of Named Executive Officers as of December 31, 2015 | |
10.9* | Summary of Compensation for the Company’s Non-Employee Directors effective April 1, 2013 (29) | |
10.10* | Ixia 2015 Senior Officer Bonus Plan (30) | |
10.11* | Amended and Restated Ixia 2008 Equity Incentive Plan, including Amended and Restated First Amendment dated as of May 4, 2011 and Second Amendment dated as of April 8, 2011 (31) | |
10.12* | Second Amended and Restated Ixia 2008 Equity Incentive Plan (32) | |
10.13* | Employment Offer Letter Agreement dated as of August 8, 2014 and effective as of August 13, 2014 between the Company and Bethany Mayer, as amended (33) | |
10.14* | Letter Agreement effective August 4, 2014 between the Company and Brent Novak (34) | |
10.15* | Employment Agreement entered into as of May 4, 2012 between the Company, as assignee of Anue Systems, Inc., and Alexander J. Pepe (35) | |
61
10.15.1* | Amendment No. 1 to Employment Agreement entered into as of August 14, 2013 between the Company and Alexander J. Pepe (36) | |
10.15.2* | Amendment No. 2 to Employment Agreement entered into as of October 24, 2013 between the Company and Alexander J. Pepe, as executed by the parties on August 5, 2014 (37) | |
10.16* | Employment Separation Agreement effective June 30, 2014 between the Company and Thomas B. Miller (38) | |
10.17* | Employment and Retention Agreement entered into as of December 23, 2014 between the Company and Ronald W. Buckly (39) | |
10.18* | Employment Separation Agreement effective February 26, 2015 between the Company and Alan Grahame (40) | |
10.19* | Employment Separation Agreement effective January 28, 2016 between the Company and Ronald W. Buckly | |
10.20* | Employment Offer Letter Agreement dated February 19, 2015 between the Company and Hans-Peter Klaey | |
14.1 | Code of Ethics for Chief Executive Officer and Senior Financial Officers (41) | |
21.1 | Subsidiaries of the Company | |
23.1 | Consent of Deloitte & Touche, LLP, Independent Registered Public Accounting Firm | |
31.1 | Certificate of Chief Executive Officer of Ixia pursuant to Rule 13a-14(a) under the Exchange Act, as adopted pursuant to Section 302 of the Sarbanes-Oxley Act of 2002 | |
31.2 | Certificate of Chief Financial Officer of Ixia pursuant to Rule 13a-14(a) under the Exchange Act, as adopted pursuant to Section 302 of the Sarbanes-Oxley Act of 2002 | |
32.1 | Certificate of Chief Executive Officer and Chief Financial Officer of Ixia pursuant to Rule 13a-14(b) under the Exchange Act and Section 906 of the Sarbanes-Oxley Act of 2002 | |
101.INS | XBRL Instance Document | |
101.SCH | XBRL Taxonomy Extension Schema Document | |
101.CAL | XBRL Taxonomy Calculation Linkbase Document | |
101.LAB | XBRL Taxonomy Label Linkbase Document | |
101.PRE | XBRL Taxonomy Presentation Linkbase Document | |
101.DEF | XBRL Taxonomy Extension Definition Document | |
* | Constitutes a management contract or compensatory plan or arrangement required to be filed as an exhibit to this Annual Report on Form 10-K. |
62
(1) | Incorporated by reference to Exhibit 2.1 to Ixia’s Current Report on Form 8-K (File No. 0-31523) filed with the Commission on May 7, 2012. |
(2) | Incorporated by reference to Exhibit 2.1 to Ixia’s Current Report on Form 8-K (File No. 0-31523) filed with the Commission on July 2, 2012. |
(3) | Incorporated by reference to Exhibit 2.1 to Ixia’s Current Report on Form 8-K (File No. 0-31523) filed with the Commission on October 31, 2013. |
(4) | Incorporated by reference to Exhibit 3.1 to Amendment No. 1 to the Company’s Registration Statement on Form S-1 (Reg. No. 333-42678) filed with the Commission on September 5, 2000. |
(5) | Incorporated by reference to Exhibit 3.2 to the Company’s Annual Report on Form 10-K (File No. 0-31523) filed with the Commission on April 4, 2013. |
(6) | Incorporated by reference to Exhibit 10.1 to the Company’s Current Report on Form 8-K (File No. 0-31523) filed with the Commission on March 6, 2015 |
(7) | Incorporated by reference to Exhibit 10.23 to the Company’s Annual Report on Form 10-K (File No. 0-31523) filed with the Commission on March 31, 2015. |
(8) | Incorporated by reference to Exhibit 10.1 to the Company’s Current Report on Form 8-K (File No. 0-31523) filed with the Commission on October 5, 2015. |
(9) | Incorporated by reference to Exhibit 10.1 to the Company’s Current Report on Form 8-K (File No. 0-31523) filed with the Commission on January 29, 2016. |
(10) | Incorporated by reference to Exhibit 4.1 to the Company’s Registration Statement on Form S-8 (Reg. No. 333-117969) filed with the Commission on August 5, 2004. |
(11) | Incorporated by reference to Exhibit 4.2 to the Company's Registration Statement on Form S-8 (Reg. No. 333-176237) filed with the Commission on August 11, 2011. |
(12) | Incorporated by reference to Exhibit 4.2 to the Company's Registration Statement on Form S-8 (Reg. No. 333-188689) filed with the Commission on May 17, 2013. |
(13) | Incorporated by reference to Exhibit 10.2 to the Company's Current Report on Form 8-K (File No. 0-31523) filed with the Commission on June 25, 2013. |
(14) | Incorporated by reference to Exhibit 10.4 to Amendment No. 1 to the Company’s Registration Statement on Form S- 1 (Reg. No. 333-42678) filed with the Commission on September 5, 2000. |
(15) | Incorporated by reference to Exhibit 10.2 to the Company’s Current Report on Form 8-K (File No. 0-31523) filed with the Commission on January 7, 2009. |
(16) | Incorporated by reference to Exhibit 10.2 to the Company’s Current Report on Form 8-K (File No. 0-31523) filed with the Commission on March 28, 2011. |
(17) | Incorporated by reference to Exhibit 10.5 to the Company’s Annual Report on Form 10-K (File No. 0-31523) filed with the Commission on April 4, 2013. |
(18) | Incorporated by reference to Exhibit 10.1 to the Company’s Current Report on Form 8-K (File No. 0-31523) filed with the Commission on January 7, 2009. |
(19) | Incorporated by reference to Exhibit 10.6 to the Company’s Annual Report on Form 10-K (File No. 0-31523) filed with the Commission on April 4, 2013. |
63
(20) | Amends and restates the Ixia Officer Severance Plan (as Amended and Restated effective January 1, 2009), as amended. |
(21) | Incorporated by reference to Exhibit 10.5 to Amendment No. 1 to the Company’s Registration Statement on Form S-1 (Reg. No. 333-42678) filed with the Commission on September 5, 2000. |
(22) | Incorporated by reference to Exhibit 10.1 to the Company’s Current Report on Form 8-K (File No. 0-31523) filed with the Commission on September 25, 2007. |
(23) | Incorporated by reference to Exhibit 10.7.1 to the Company’s Annual Report on Form 10-K (File No. 0-31523) filed with the Commission on March 5, 2012. |
(24) | Incorporated by reference to Exhibit 10.7.2 to the Company’s Annual Report on Form 10-K (File No. 0-31523) filed with the Commission on March 5, 2012. |
(25) | Incorporated by reference to Exhibit 10.8.3 to the Company’s Annual Report on Form 10-K (File No. 0-31523) filed with the Commission on April 4, 2013. |
(26) | Incorporated by reference to Exhibit 10.1 to the Company’s Current Report on Form 8-K (File No. 0-31523) filed with the Commission on July 10, 2012. |
(27) | Incorporated by reference to Exhibit 10.8.5 to the Company’s Annual Report on Form 10-K (File No. 0-31523) filed with the Commission on April 4, 2013. |
(28) | Incorporated by reference to Exhibit 10.1 to the Company’s Quarterly Report on Form 10-Q (File No. 0-31523) filed with the Commission on August 9, 2013. |
(29) | Incorporated by reference to Exhibit 10.10 to the Company’s Annual Report on Form 10-K (File No. 0-31523) filed with the Commission on June 23, 2014. |
(30) | Incorporated by reference to Exhibit 10.1 to the Company’s Quarterly Report on Form 10-Q (File No. 0-31523) filed with the Commission on August 7, 2015. A portion of this exhibit has been omitted pursuant to a confidential treatment order granted by the Commission. |
(31) | Incorporated by reference to Exhibit 10.1 to the Company’s Current Report on Form 8-K (File No. 0-31523) filed with the Commission on May 25, 2011. |
(32) | Incorporated by reference to Exhibit 10.1 to the Company's Current Report on Form 8-K (File No. 0-31523) filed with the Commission on June 25, 2013. |
(33) | Incorporated by reference to Exhibit 10.1 to the Company’s Quarterly Report on Form 10-Q (File No. 0-31523) filed with the Commission on November 7, 2014. |
(34) | Incorporated by reference to Exhibit 10.1 to the Company’s Current Report on Form 8-K (File No. 0-31523) filed with the Commission on August 5, 2014. |
(35) | Incorporated by reference to Exhibit 10.2 to the Company’s Current Report on Form 8-K (File No. 0-31523) filed with the Commission on August 5, 2014. |
(36) | Incorporated by reference to Exhibit 10.3 to the Company’s Current Report on Form 8-K (File No. 0-31523) filed with the Commission on August 5, 2014. |
(37) | Incorporated by reference to Exhibit 10.4 to the Company’s Current Report on Form 8-K (File No. 0-31523) filed with the Commission on August 5, 2014. |
(38) | Incorporated by reference to Exhibit 10.21 to the Company’s Annual Report on Form 10-K (File No. 0-31523) filed with the Commission on March 31, 2015. |
64
(39) | Incorporated by reference to Exhibit 10.1 to the Company’s Current Report on Form 8-K (File No. 0-31523) filed with the Commission on December 23, 2014. |
(40) | Incorporated by reference to Exhibit 10.4 to the Company’s Quarterly Report on Form 10-Q (File No. 0-31523) filed with the Commission on May 8, 2015. |
(41) | Incorporated by reference to Exhibit 14.1 to the Annual Report on Form 10-K (File No. 0-31523) filed with the Commission on March 12, 2004. |
(b) | Exhibits |
We hereby file as part of this Annual Report on Form 10-K the exhibits listed in Item 15(a)(3) above.
(c) | Financial Statement Schedules |
None.
65
SIGNATURES
Pursuant to the requirements of Section 13 or 15(d) of the Securities Exchange Act of 1934, the Registrant has duly caused this report to be signed on its behalf by the undersigned, thereunto duly authorized.
Dated: February 29, 2016 | IXIA | ||
/s/ BETHANY MAYER | |||
Bethany Mayer | |||
Chief Executive Officer | |||
Pursuant to the requirements of the Securities Exchange Act of 1934, this Report has been signed below by the following persons on behalf of the Registrant and in the capacities and on the dates indicated.
Name | Title | Date | ||
/s/ BETHANY MAYER | President, Chief Executive Officer, Director | February 29, 2016 | ||
Bethany Mayer | (Principal Executive Officer) | |||
/s/ BRENT NOVAK | Chief Financial Officer | February 29, 2016 | ||
Brent Novak | (Principal Financial and Accounting Officer) | |||
/s/ ERROL GINSBERG | Chairman of the Board, Director | February 29, 2016 | ||
Errol Ginsberg | ||||
/s/ JONATHAN FRAM | Director | February 29, 2016 | ||
Jonathan Fram | ||||
/s/ GAIL HAMILTON | Director | February 29, 2016 | ||
Gail Hamilton | ||||
/s/ LAURENT ASSCHER | Director | February 29, 2016 | ||
Laurent Asscher | ||||
/s/ ILAN DASKAL | Director | February 29, 2016 | ||
Ilan Daskal | ||||
66
IXIA
INDEX TO CONSOLIDATED FINANCIAL STATEMENTS | |
Page | |
Reports of Independent Registered Public Accounting Firms | |
Consolidated Balance Sheets as of December 31, 2015 and 2014 | |
Consolidated Statements of Operations for the years ended December 31, 2015, 2014 and 2013 | |
Consolidated Statements of Comprehensive Income (Loss) for the years ended December 31, 2015, 2014 and 2013 | |
Consolidated Statements of Shareholders’ Equity for the years ended December 31, 2015, 2014 and 2013 | |
Consolidated Statements of Cash Flows for the years ended December 31, 2015, 2014 and 2013 | |
Notes to Consolidated Financial Statements | |
67
REPORT OF INDEPENDENT REGISTERED PUBLIC ACCOUNTING FIRM
To the Board of Directors and Shareholders of Ixia
Calabasas, California
We have audited the accompanying consolidated balance sheets of Ixia and subsidiaries (the "Company") as of December 31, 2015 and 2014, and the related consolidated statements of operations, comprehensive income (loss), shareholders' equity, and cash flows for each of the three years in the period ended December 31, 2015. These financial statements are the responsibility of the Company's management. Our responsibility is to express an opinion on these financial statements based on our audits.
We conducted our audits in accordance with the standards of the Public Company Accounting Oversight Board (United States). Those standards require that we plan and perform the audit to obtain reasonable assurance about whether the financial statements are free of material misstatement. An audit includes examining, on a test basis, evidence supporting the amounts and disclosures in the financial statements. An audit also includes assessing the accounting principles used and significant estimates made by management, as well as evaluating the overall financial statement presentation. We believe that our audits provide a reasonable basis for our opinion.
In our opinion, such consolidated financial statements present fairly, in all material respects, the financial position of Ixia and subsidiaries as of December 31, 2015 and 2014, and the results of their operations and their cash flows for each of the three years in the period ended December 31, 2015, in conformity with accounting principles generally accepted in the United States of America.
We have also audited, in accordance with the standards of the Public Company Accounting Oversight Board (United States), the Company's internal control over financial reporting as of December 31, 2015, based on the criteria established in Internal Control - Integrated Framework (2013) issued by the Committee of Sponsoring Organizations of the Treadway Commission and our report dated February 29, 2016, expressed an adverse opinion on the Company's internal control over financial reporting because of a material weakness.
/s/ Deloitte & Touche LLP
Los Angeles, California
February 29, 2016
68
IXIA
Consolidated Balance Sheets
(in thousands)
As of December 31, | |||||||
2015 | 2014 | ||||||
Assets | |||||||
Current assets: | |||||||
Cash and cash equivalents | $ | 52,472 | $ | 46,394 | |||
Marketable securities | 14,504 | 79,760 | |||||
Accounts receivable, net | 121,932 | 99,528 | |||||
Inventories | 33,289 | 44,826 | |||||
Prepaid expenses and other current assets | 44,384 | 45,957 | |||||
Total current assets | 266,581 | 316,465 | |||||
Property and equipment, net | 36,536 | 37,648 | |||||
Intangible assets, net | 103,660 | 145,108 | |||||
Goodwill | 338,873 | 338,873 | |||||
Other assets | 34,227 | 30,697 | |||||
Total assets | $ | 779,877 | $ | 868,791 | |||
Liabilities and Shareholders’ Equity | |||||||
Current liabilities: | |||||||
Accounts payable | $ | 15,346 | $ | 16,902 | |||
Accrued expenses and other | 70,029 | 45,271 | |||||
Deferred revenues | 108,436 | 100,170 | |||||
Convertible senior notes, net | — | 198,880 | |||||
Term loan, net | 3,045 | — | |||||
Total current liabilities | 196,856 | 361,223 | |||||
Deferred revenues | 22,117 | 18,046 | |||||
Other liabilities | 7,406 | 8,431 | |||||
Term loan, net | 34,487 | — | |||||
Total liabilities | 260,866 | 387,700 | |||||
Commitments and contingencies (Note 10) | |||||||
Shareholders’ equity: | |||||||
Preferred stock, without par value; 1,000 shares authorized and none outstanding | — | — | |||||
Common stock, without par value; 200,000 shares authorized at December 31, 2015 and 2014; 80,805 and 78,575 shares issued and outstanding as of December 31, 2015 and 2014, respectively | 201,087 | 187,397 | |||||
Additional paid-in capital | 225,432 | 206,913 | |||||
Retained earnings | 93,525 | 87,574 | |||||
Accumulated other comprehensive loss | (1,033 | ) | (793 | ) | |||
Total shareholders’ equity | 519,011 | 481,091 | |||||
Total liabilities and shareholders’ equity | $ | 779,877 | $ | 868,791 | |||
The accompanying notes are an integral part of these consolidated financial statements.
69
IXIA
Consolidated Statements of Operations
(in thousands, except per share data)
Year Ended December 31, | |||||||||||
2015 | 2014 | 2013 | |||||||||
Revenues: | |||||||||||
Products | $ | 361,923 | $ | 325,455 | $ | 352,712 | |||||
Services | 155,014 | 139,003 | 114,544 | ||||||||
Total revenues | 516,937 | 464,458 | 467,256 | ||||||||
Costs and operating expenses: (1) | |||||||||||
Cost of revenues – products (2) | 97,415 | 98,815 | 89,136 | ||||||||
Cost of revenues – services | 16,443 | 16,166 | 13,867 | ||||||||
Research and development | 113,443 | 115,156 | 117,502 | ||||||||
Sales and marketing | 155,211 | 151,765 | 137,724 | ||||||||
General and administrative | 68,925 | 66,475 | 47,158 | ||||||||
Amortization of intangible assets | 42,315 | 46,901 | 40,805 | ||||||||
Acquisition and other related costs | 656 | 3,277 | 6,920 | ||||||||
Restructuring | (517 | ) | 10,310 | 1,840 | |||||||
Total costs and operating expenses | 493,891 | 508,865 | 454,952 | ||||||||
Income (loss) from operations | 23,046 | (44,407 | ) | 12,304 | |||||||
Interest income and other, net | (372 | ) | (24 | ) | 6,269 | ||||||
Interest expense | (8,331 | ) | (8,266 | ) | (7,771 | ) | |||||
Income (loss) before income taxes | 14,343 | (52,697 | ) | 10,802 | |||||||
Income tax expense (benefit) | 8,392 | (11,105 | ) | (1,068 | ) | ||||||
Net income (loss) | $ | 5,951 | $ | (41,592 | ) | $ | 11,870 | ||||
Earnings (loss) per share: | |||||||||||
Basic | $ | 0.07 | $ | (0.54 | ) | $ | 0.16 | ||||
Diluted | $ | 0.07 | $ | (0.54 | ) | $ | 0.15 | ||||
Weighted average number of common and common equivalent shares outstanding: | |||||||||||
Basic | 79,633 | 77,629 | 75,757 | ||||||||
Diluted | 81,459 | 77,629 | 77,513 | ||||||||
________________________________________
(1) | Stock-based compensation included in: |
Cost of revenues – products | $ | 315 | $ | 331 | $ | 550 | |||||
Cost of revenues – services | 120 | 126 | 209 | ||||||||
Research and development | 6,625 | 6,843 | 8,065 | ||||||||
Sales and marketing | 4,730 | 5,624 | 7,367 | ||||||||
General and administrative | 7,186 | 3,595 | 4,571 | ||||||||
(2) | Cost of revenues – products excludes amortization of intangible assets related to purchased technologies of $25.7 million, $28.9 million and $26.0 million for the years ended December 31, 2015, 2014 and 2013, respectively, which is included in Amortization of intangible assets. |
The accompanying notes are an integral part of these consolidated financial statements.
70
IXIA
Consolidated Statements of Comprehensive Income (Loss)
(in thousands)
Year Ended December 31, | |||||||||||
2015 | 2014 | 2013 | |||||||||
Net income (loss) | $ | 5,951 | $ | (41,592 | ) | $ | 11,870 | ||||
Unrealized loss on investments, net of tax | (56 | ) | (74 | ) | (2,028 | ) | |||||
Foreign currency translation adjustment | (184 | ) | (342 | ) | (638 | ) | |||||
Other comprehensive loss | (240 | ) | (416 | ) | (2,666 | ) | |||||
Comprehensive income (loss) | $ | 5,711 | $ | (42,008 | ) | $ | 9,204 | ||||
The accompanying notes are an integral part of these consolidated financial statements.
71
IXIA
Consolidated Statements of Shareholders' Equity
(in thousands)
Common Stock - No Par | Additional Paid-in- Capital | Retained Earnings | Accumulated Other Comprehensive Income (Loss) | Total Shareholders' Equity | ||||||||||||||||||
Shares | Amount | |||||||||||||||||||||
Balance at December 31, 2012 | 74,126 | $ | 158,933 | $ | 168,980 | $ | 117,296 | $ | 2,289 | $ | 447,498 | |||||||||||
Net income | — | — | — | 11,870 | — | 11,870 | ||||||||||||||||
Change in unrealized gains and losses on investments, net of tax | — | — | — | — | (2,028 | ) | (2,028 | ) | ||||||||||||||
Cumulative translation adjustment | — | — | — | — | (638 | ) | (638 | ) | ||||||||||||||
Shares issued pursuant to stock incentive plans and employee stock purchase plan options | 2,723 | 19,414 | — | — | — | 19,414 | ||||||||||||||||
Stock-based compensation | — | — | 20,762 | 20,762 | ||||||||||||||||||
Stock award tax benefit | — | — | 2,234 | — | — | 2,234 | ||||||||||||||||
Balance at December 31, 2013 | 76,849 | $ | 178,347 | $ | 191,976 | $ | 129,166 | $ | (377 | ) | $ | 499,112 | ||||||||||
Net loss | — | — | — | (41,592 | ) | — | (41,592 | ) | ||||||||||||||
Change in unrealized gains and losses on investments, net of tax | — | — | — | — | (74 | ) | (74 | ) | ||||||||||||||
Cumulative translation adjustment | — | — | — | — | (342 | ) | (342 | ) | ||||||||||||||
Shares issued pursuant to stock incentive plans and employee stock purchase plan options | 1,726 | 9,050 | — | — | — | 9,050 | ||||||||||||||||
Stock-based compensation | — | — | 16,519 | 16,519 | ||||||||||||||||||
Stock award tax deficiency | — | — | (1,582 | ) | — | — | (1,582 | ) | ||||||||||||||
Balance at December 31, 2014 | 78,575 | $ | 187,397 | $ | 206,913 | $ | 87,574 | $ | (793 | ) | $ | 481,091 | ||||||||||
Net income | — | — | — | 5,951 | — | 5,951 | ||||||||||||||||
Change in unrealized gains and losses on investments, net of tax | — | — | — | — | (56 | ) | (56 | ) | ||||||||||||||
Cumulative translation adjustment | — | — | — | — | (184 | ) | (184 | ) | ||||||||||||||
Shares issued pursuant to stock incentive plans and employee stock purchase plan options | 2,230 | 13,690 | — | — | — | 13,690 | ||||||||||||||||
Stock-based compensation | — | — | 18,976 | — | — | 18,976 | ||||||||||||||||
Stock award tax deficiency | — | — | (457 | ) | — | — | (457 | ) | ||||||||||||||
Balance at December 31, 2015 | 80,805 | $ | 201,087 | $ | 225,432 | $ | 93,525 | $ | (1,033 | ) | $ | 519,011 | ||||||||||
The accompanying notes are an integral part of these consolidated financial statements.
72
IXIA
Consolidated Statements of Cash Flows
(in thousands)
Year Ended December 31, | |||||||||||
2015 | 2014 | 2013 | |||||||||
Cash flows from operating activities: | |||||||||||
Net income (loss) | $ | 5,951 | $ | (41,592 | ) | $ | 11,870 | ||||
Adjustments to reconcile net income (loss) to net cash provided by operating activities: | |||||||||||
Depreciation | 16,833 | 16,525 | 16,061 | ||||||||
Amortization of intangible assets | 42,315 | 46,901 | 40,805 | ||||||||
Realized loss (gain) on sale of available-for-sale securities, net | 31 | (85 | ) | (4,469 | ) | ||||||
Stock-based compensation | 18,976 | 16,519 | 20,762 | ||||||||
Deferred income taxes | (7,666 | ) | (14,382 | ) | (6,664 | ) | |||||
Excess tax benefits from stock-based compensation | (758 | ) | — | (2,477 | ) | ||||||
Amortization of deferred issuance costs | 1,500 | 1,870 | — | ||||||||
Amortization of investment premiums | 80 | 63 | — | ||||||||
Changes in operating assets and liabilities, net of the effect of acquisitions: | |||||||||||
Accounts receivable, net | (22,404 | ) | 10,062 | 3,416 | |||||||
Inventories | 4,365 | (8,028 | ) | (11,036 | ) | ||||||
Prepaid expenses and other current assets | (9,560 | ) | (4,586 | ) | (6,773 | ) | |||||
Other assets | 3,936 | 5,538 | 3,154 | ||||||||
Accounts payable | (1,262 | ) | (2,419 | ) | 3,195 | ||||||
Accrued expenses and other | 34,129 | (5,400 | ) | (7,442 | ) | ||||||
Deferred revenues | 12,337 | 13,853 | 24,362 | ||||||||
Other liabilities | 1 | 3,232 | 1,736 | ||||||||
Net cash provided by operating activities | 98,804 | 38,071 | 86,500 | ||||||||
Cash flows from investing activities: | |||||||||||
Purchases of property and equipment | (8,381 | ) | (8,063 | ) | (12,131 | ) | |||||
Purchases of available-for-sale securities | (196,659 | ) | (96,886 | ) | (191,973 | ) | |||||
Proceeds from available-for-sale securities | 261,744 | 68,580 | 271,585 | ||||||||
Purchases of other intangible assets | (867 | ) | (771 | ) | (893 | ) | |||||
Proceeds from purchase price adjustments related to previous acquisitions | — | 6,081 | — | ||||||||
Payments in connection with acquisitions, net of cash acquired | — | (3,857 | ) | (188,298 | ) | ||||||
Net cash provided by (used in) investing activities | 55,837 | (34,916 | ) | (121,710 | ) | ||||||
Cash flows from financing activities: | |||||||||||
Proceeds from borrowings under term loan | 40,000 | — | — | ||||||||
Repayments of debt | (201,663 | ) | — | — | |||||||
Debt issuance costs | (1,348 | ) | — | — | |||||||
Proceeds from exercise of stock options and employee stock purchase plan options | 13,737 | 9,443 | 19,414 | ||||||||
Cash paid for shares withheld for taxes | (47 | ) | (393 | ) | — | ||||||
Excess tax benefits from stock-based compensation | 758 | — | 2,477 | ||||||||
Net cash (used in) provided by financing activities | (148,563 | ) | 9,050 | 21,891 | |||||||
Net increase (decrease) in cash and cash equivalents | 6,078 | 12,205 | (13,319 | ) | |||||||
Cash and cash equivalents at beginning of year | 46,394 | 34,189 | 47,508 | ||||||||
Cash and cash equivalents at end of year | $ | 52,472 | $ | 46,394 | $ | 34,189 | |||||
Supplemental disclosure of cash flow information: | |||||||||||
Cash paid (received) during the period for: | |||||||||||
Interest | $ | 7,036 | $ | 6,003 | $ | 6,000 | |||||
Income taxes | $ | 1,141 | $ | (1,446 | ) | $ | 10,334 | ||||
Supplemental disclosure of non-cash investing activities: | |||||||||||
Purchased and unpaid property and equipment | $ | 1,440 | $ | 1,088 | $ | 1,104 | |||||
Transfers of inventory to property and equipment | $ | 7,172 | $ | 10,464 | $ | 7,663 | |||||
The accompanying notes are an integral part of these consolidated financial statements.
73
IXIA
Notes to Consolidated Financial Statements
1. | Description of Business, Basis of Presentation, Significant Accounting Policies and Recent Accounting Pronouncements |
Description of Business
Ixia ("Ixia" or the "Company") was incorporated on May 27, 1997 as a California corporation. The Company provides application performance and security resilience solutions so that organizations can validate, secure and optimize their physical and virtual networks. Enterprises, service providers, network equipment manufacturers, and governments worldwide rely on Ixia’s solutions to deploy new technologies and achieve efficient, secure ongoing operation of their networks. Ixia's product solutions consist of its high performance hardware platforms, software applications and services, including warranty and maintenance offerings and professional services.
The Company is headquartered in Calabasas, California with operations across the U.S. and the rest of the world. The Company's revenues are principally derived from shipments within the U.S. and to the Europe, Middle East and Africa ("EMEA") and Asia Pacific regions.
Basis of Presentation
The accompanying consolidated financial statements for the years ended December 31, 2015, 2014 and 2013 have been prepared in accordance with accounting principles generally accepted in the United States of America ("GAAP").
Use of Estimates
In the normal course of preparing financial statements in conformity with accounting principles generally accepted in the United States, management is required to make estimates and assumptions that affect the reported amounts of assets and liabilities and disclosure of contingent assets and liabilities at the date of the financial statements and the reported amounts of revenues and expenses during the reporting period. Actual results could differ from those estimates.
Principles of Consolidation
All subsidiaries are consolidated as they are 100% owned by us. All intercompany transactions and accounts are eliminated in consolidation.
Significant Accounting Policies
Cash and Cash Equivalents
The Company considers all highly liquid investments with a maturity of three months or less at the date of purchase to be cash equivalents. Cash is carried at cost, which approximates fair value, and cash equivalents are carried at fair value. The Company generally invests funds that are in excess of current needs in high credit quality instruments such as money market funds. There are no restrictions on the use of cash and cash equivalents.
Fair Value of Financial Instruments
The Company's financial instruments, including cash, accounts receivable and accounts payable are carried at cost, which approximates their fair values because of the short-term maturity of these instruments and the relative stability of interest rates. The fair values of the Company's cash equivalents, money market funds, U.S. treasury, government and agency debt securities and corporate debt securities are based on quoted market prices as shown in its investment brokerage/custodial statements. See Note 3 for information related to the fair value of the Company's convertible senior notes, which were fully repaid as of December 31, 2015.
Fair value is defined as the exit price, or the amount that would be received to sell an asset or paid to transfer a liability in an orderly transaction between market participants as of the measurement date. There is an established hierarchy for inputs used in measuring fair value that maximizes the use of observable inputs and minimizes the use of unobservable inputs by requiring the most observable inputs be used when available. Observable inputs are inputs market participants would use in valuing the asset or liability and are developed based on market data obtained from independent sources. Unobservable inputs are inputs that reflect the assumptions about the factors that market participants would use in valuing the asset or liability.
74
Foreign Currency Forward Contracts
The Company utilizes foreign currency forward contracts to hedge certain accounts receivable amounts that are denominated in Japanese Yen, Euros and British Pounds. These contracts are cash flow hedges used to reduce the risk associated with exchange rate movements, as gains and losses on these contracts are intended to offset exchange losses and gains on underlying exposures. Foreign currency contracts are typically short-term in duration ranging from one to four months. The Company does not enter into foreign exchange forward contracts for speculative or trading purposes. In accordance with ASC 815, “Derivatives and Hedging,” the Company records all derivatives in the consolidated balance sheet as either assets or liabilities measured at fair value. The Company’s foreign currency contracts are generally not designated as hedges and any gains or losses on the movement in their fair values is recognized in the results of operations immediately. Foreign currency contracts are recorded at fair market values as a component of Prepaid expenses and other current assets in the consolidated balance sheet and the change in their fair value is recorded as a gain or loss in the consolidated statements of operations as a component of Interest income and other, net.
As of December 31, 2015, the Company held three open foreign currency forward contracts with a notional value of $4.8 million and a net fair value of approximately $15,000. As of December 31, 2014, the Company held three open foreign currency forward contracts with a notional value of $8.5 million and a net fair value of approximately $24,000. During 2015 and 2014, net gains related to the change in fair value of such foreign currency forward contracts were approximately $208,000 and $531,000, respectively. During 2015, net losses related to the change in fair value of such foreign currency forward contracts were not significant.
Investments in Marketable Securities
The Company maintains a portfolio of cash equivalents and investments in a variety of fixed and variable rate securities, including U.S. government and federal agency securities, corporate debt securities, and money market funds. The primary objective of the Company's investment activities is to maintain the safety of principal and preserve liquidity while maximizing yields without significantly increasing risk. The Company does not enter into investments for trading or speculative purposes. The Company determines the appropriate classification of investments in marketable securities at the time of purchase. Accretion and amortization of purchase discounts and premiums are included in Interest income and other, net. Available-for-sale securities are stated at fair value. The net unrealized gains or losses on available-for-sale securities are reported as a separate component of accumulated other comprehensive income or loss, net of tax. The specific identification method is used to compute realized gains and losses on marketable securities. In 2013, the Company had gross realized gains of approximately $4.5 million. In 2015 and 2014, gross realized gains were not significant. In 2015, 2014 and 2013, gross realized losses were not significant.
The Company regularly reviews its investment portfolio to determine if any security is other-than-temporarily impaired, which would require it to record an impairment charge in the period any such determination is made. In making this judgment, the Company evaluates, among other things, the duration and extent to which the fair value of a security is less than its cost and its intent and ability to sell, or whether it will more likely than not be required to sell, the security before recovery of its amortized cost basis. The Company has evaluated its investments as of December 31, 2015 and has determined that no investments with unrealized losses are other-than-temporarily impaired. The Company does not intend to sell and it is not more likely than not that it would be required to sell these investments before recovery of the amortized cost basis, which may be at maturity.
It is possible that the Company could recognize future impairment charges on the investment securities it currently owns if future events, new information or the passage of time cause the Company to believe that a decline in the carrying value of its securities is other-than-temporary. The Company will continue to review and analyze these securities for triggering events each reporting period. See Note 6 for additional information.
Accounts Receivable and Allowance for Doubtful Accounts
Trade accounts receivable are recorded at the invoiced amount. The allowance for doubtful accounts is based on the Company's best estimate of the amount of probable credit losses in existing accounts receivable. The Company reviews the allowance for doubtful accounts and provisions are made upon a specific review of all significant past due receivables. For those receivables not specifically reviewed, provisions are provided at a general rate that considers historical write-off experience and other qualitative factors. Account balances are charged off against the allowance when the Company believes it is probable the receivable will not be recovered.
75
Inventories
Inventories are goods held for sale in the normal course of business. Inventories are stated at the lower of cost (first-in, first-out) or market. The inventory balance consists of raw materials, work in process (“WIP”) and finished goods. Raw materials include low level components, many of which are purchased from vendors, WIP is partially assembled products and finished goods are products that are ready to be shipped to end customers. Consideration is given to inventory shipped and received near the end of a period and the transaction is recorded when transfer of title occurs. The Company evaluates inventory for excess and obsolescence and adjusts its carrying amount to net realizable value based on inventory that is obsolete or in excess of current demand.
Property, Plant and Equipment
Property, plant and equipment are stated at cost less accumulated depreciation. Depreciation of the Company's computer software and equipment is computed using the straight-line method based upon the estimated useful lives of the applicable assets, ranging from three to five years. Building and leasehold improvements are amortized over the lesser of their estimated useful lives or the remaining lease term. Useful lives are evaluated periodically by management in order to determine recoverability in light of current technological conditions. Property, plant and equipment also include the cost of the Company's products used for research and development which are classified as development equipment and are depreciated over five years to research and development. The Company also capitalizes and depreciates over a two-year period costs of its products used for sales and marketing activities, including product demonstrations for potential customers, which is included in Sales and marketing in the consolidated statements of operations. Repairs and maintenance are charged to expense as incurred while renewals and improvements are capitalized. Upon the sale or retirement of property, plant and equipment, the accounts are relieved of the cost and the related accumulated depreciation, with any resulting gain or loss included in the consolidated statements of operations.
Goodwill
The Company records goodwill as the difference, if any, between the aggregate consideration paid for an acquisition and the fair value of the acquired net tangible and intangible assets. The Company evaluates the recoverability of its goodwill on an annual basis or if events or changes in circumstances indicate that impairment in the value of goodwill recorded on its balance sheet may exist. The Company has determined that it has one reporting unit for goodwill impairment testing purposes. The fair value of the Company’s reporting unit is determined using the market capitalization of Ixia, which considers the observed market price of the Company’s publicly-traded equity securities on the impairment test date. The fair value of the Company’s reporting unit is then compared to the carrying amount of the Company’s reporting unit under “step 1” of the impairment testing model. If the carrying value of the reporting unit exceeds its fair value, then the fair value of goodwill is determined and compared to its carrying value under “step 2.” Impairment losses are recorded to the extent that the carrying value of the goodwill exceeds its estimated fair value. The Company completed its annual goodwill impairment test of its single reporting unit as of December 31, 2015 and determined that there was no impairment.
Intangible Assets
Intangible assets consist primarily of acquired intellectual property and other long-lived assets, such as purchased technology, customer relationships, service agreements, trade names, and non-compete agreements. Acquired intangible assets with finite lives are amortized over their estimated useful lives and reflected in the Amortization of intangible assets line item on the consolidated statements of operations.
Intangible assets with finite lives are tested for impairment whenever events or circumstances indicate that the carrying amount of an asset (asset group) may not be recoverable. Circumstances which could trigger a review include, but are not limited to: significant adverse change in the extent or manner in which the intangible asset is being used, significant adverse changes in the business climate or legal factors; current period cash flow or operating losses combined with a history of losses or a forecast of continuing losses associated with the use of the asset; or current expectation that the asset will more likely than not be sold or disposed significantly before the end of its estimated useful life.
An impairment loss is recognized when the carrying amount of an asset exceeds the estimated undiscounted cash flows used in determining the fair value of the asset. The amount of the impairment loss recorded is calculated by the excess of the asset’s carrying value over its fair value. Fair value is generally determined using a discounted cash flow analysis and may involve the use of significant estimates and assumptions, some of which may be based in part on historical experience, forecasted information and discount rates. No such impairment charges were recorded during the years ended December 31, 2015, 2014 and 2013.
76
Litigation
The Company is a defendant in one class action and in one consolidated shareholder derivative action. The Company accrues for losses when the loss is deemed probable and the liability can reasonably be estimated. Where a liability is probable and there is a range of estimated loss with no best estimate in the range, the Company records the minimum estimated liability related to the claim. As additional information becomes available, the Company assesses the potential liability related to its pending litigation and revises its estimates. See Note 10 for additional information.
Product Warranty
The Company generally provides an initial standard warranty (90-day or 12-month periods) on its hardware products after product shipment and accrues for estimated future warranty costs based on actual historical experience and other relevant data, as appropriate, at the time product revenue is recognized. All product warranty expenses associated with the Company's initial standard warranty is reflected within Cost of revenues-products in the accompanying consolidated statements of operations. Accrued product warranty costs are included as a component of Accrued expenses and other in the accompanying consolidated balance sheets.
Activity in the product warranty liability account for the years presented is as follows (in thousands):
December 31, 2015 | December 31, 2014 | December 31, 2013 | |||||||||
Balance at beginning of year | $ | 716 | $ | 646 | $ | 665 | |||||
Current year provision | 2,072 | 1,759 | 2,219 | ||||||||
Acquired liability (Net Optics acquisition) | — | — | 117 | ||||||||
Expenditures | (2,250 | ) | (1,689 | ) | (2,355 | ) | |||||
Balance at end of year | $ | 538 | $ | 716 | $ | 646 | |||||
Revenue Recognition
Sales of the Company's network test hardware products primarily consist of traffic generation and analysis hardware platforms containing multi-slot chassis and interface cards. The Company's primary network test hardware platform is enabled by its operating system software that is essential to the functionality of the hardware platform. Sales of the Company's network visibility hardware products typically include an integrated, purpose-built hardware appliance with essential, proprietary software. The Company's software products consist of a comprehensive suite of technology-specific applications for certain of its network test hardware platforms. The Company's software products are typically installed on and work with these hardware products to further enhance the core functionality of the overall network test system, although some of its software products can be operated independently from its network test platforms.
The Company's service revenues primarily consist of technical support, warranty and software maintenance services related to its network test and visibility hardware and software products. Many of the Company's products include up to one year of these services with the initial product purchase and its customers may separately purchase extended services for annual or multi-year periods. The Company's technical support, warranty and software maintenance services include assistance with the set-up, configuration and operation of its products, repair or replacement of defective products, bug fixes, and unspecified when and if available software upgrades. For certain network test products, the Company's technical support and software maintenance service revenues also include its Application and Threat Intelligence ("ATI") service, which provides a comprehensive suite of application protocols, software updates and technical support. The ATI service provides full access to the latest security attacks and application updates for use in real-world test and assessment scenarios. The Company's customers may purchase the ATI service for annual or multi-year periods. Service revenues also include training and other professional services.
As the Company's systems typically include hardware and software products, and the related services, the Company recognizes its revenue in accordance with authoritative guidance on both hardware and software revenue recognition. Furthermore, in accordance with the current revenue recognition guidance, the Company's hardware platform and certain other products that include both tangible products and software elements that function together to deliver the tangible product’s essential functionality have been scoped out of software revenue recognition guidance, and therefore these products are accounted for as hardware products for revenue recognition purposes.
77
The Company recognized revenue for hardware and software products, and related services, based on the following four criteria: whether (i) evidence of an arrangement exists, which is typically in the form of a customer purchase order; (ii) delivery has occurred (i.e., risks and rewards of ownership have passed to the customer); (iii) the sales price is fixed or determinable; and (iv) collectability is deemed reasonably assured (or probable for software-related deliverables). Provided that the above criteria are met, revenue from hardware and software product sales is typically recognized upon shipment, and service revenues are recognized as the services are provided or completed. The Company recognizes service revenues from its initial and separately purchased technical support, warranty and software maintenance arrangements on a straight-line basis over the applicable contractual period.
The Company's systems are generally fully functional at the time of shipment and do not require the Company to perform any significant production, modification, customization, or installation after shipment. If an arrangement includes acceptance provisions based on customer specified criteria for which it cannot reliably demonstrate that the delivered product meets all the specified criteria, revenue is deferred until the earlier of the receipt of written customer acceptance or the expiration of the acceptance period. In addition, the arrangements generally do not include any provisions for cancellation, termination or refunds.
Multiple Element Arrangements and Allocation of Value
The Company's sales arrangements with its customers typically include a combination of its hardware and software products, as well as the related technical support, warranty and software maintenance services of these products, and therefore are commonly referred to as multiple element arrangements. When sales arrangements involve hardware and software elements, the Company uses a two-step process to allocate value to each element in the arrangement:
(1) | The total arrangement fee is allocated to the separate non-software deliverables (e.g., chassis, interface cards, and software post contract customer support and maintenance (“PCS”) related to the Company's operating system software that is essential to the functionality of its hardware platform) and the software-related deliverables as a group (e.g., application software and software PCS) based on a relative selling price (“RSP”) method applied to all elements in the arrangement using the selling price hierarchy in the amended revenue recognition guidance as discussed below, and |
(2) | The value assigned to the software group for the software deliverables is then allocated to each software element based on the residual method, whereby value is allocated first to the undelivered elements, typically PCS, and the residual portion of the value is then allocated to the delivered elements (typically the software products) and recognized as revenue, provided all other revenue recognition criteria discussed above have been met. The fair value of an element must be based on vendor specific objective evidence (“VSOE”) of the selling price, which typically only exists for technical support, warranty and software maintenance services as discussed below. |
Under the RSP method, the selling price to be used in the allocation of the total arrangement fee to each of the elements, or deliverables, is based on a selling price hierarchy, where the selling price for each element is based on (i) VSOE, if available; (ii) third-party evidence (“TPE”), if available and VSOE is not available; or (iii) the best estimate of selling price (“BESP”), if neither VSOE nor TPE are available.
The Company determines VSOE of fair value based on a bell-shaped curve approach, considering the actual sales prices charged to customers when the same element is sold separately, provided it is substantive. All of the Company's products are sold as multiple element arrangement and not sold separately, as its products include an initial period (generally 90-day or 12-month periods) of free technical support, warranty and software maintenance services. Accordingly, the Company has not established VSOE for nearly all of its products. On a regular basis, the Company separately sells extended technical support, warranty and software maintenance services upon the expiration of the initial contractual periods included in an initial sales arrangement and have been able to establish VSOE for its technical support, warranty and software maintenance services.
The Company generally is not able to determine TPE for its products or services because its products are not interchangeable with those of its competitors. Furthermore, the Company is unable to reliably determine competitive selling prices when the applicable competitive products are sold separately. As such, the Company uses BESP for all of its products and services when allocating the total consideration of multiple element arrangements to each of the deliverables under step one of the allocation process described above except for its technical support, warranty and software maintenance services where it uses VSOE. The Company determines BESP for a product or service by considering multiple factors including, analyzing historical sales price data for standalone and bundled arrangements, published price lists, geographies and customer types. The Company's estimate of BESP used in its allocation of arrangement consideration requires significant judgment and the Company reviews these estimated selling prices on a quarterly basis.
78
The allocation of value to each deliverable in a multiple element arrangement is completed at the inception of an arrangement, which is typically the receipt of a customer purchase order. The allocated value of each non-software deliverable is then recognized as revenue when each element is delivered, provided all of the other revenue recognition criteria discussed above have been met. For software deliverables, the total software group allocation (or total arrangement consideration for customer orders that include only software products and related services) is allocated based on the residual method which requires that the Company first allocates value to the undelivered element at VSOE of the selling price of the undelivered element and the remaining portion of the arrangement fee is allocated to the delivered elements. As the Company does not sell its software products without technical support, warranty and software maintenance services, it is unable to establish VSOE for its software products, and therefore uses the residual method under the software revenue recognition guidance to allocate the software group (or arrangement) value to each software deliverable. Under the residual method, the software group (or arrangement) value is allocated first to the undelivered elements, typically technical support, warranty and software maintenance services based on VSOE, and the residual portion of the value is then allocated to the delivered elements (typically the software products) and recognized as revenue, provided all other revenue recognition criteria discussed above have been met. If VSOE cannot be established for an undelivered element within the software group (or arrangement), the value allocated to the software group (or arrangement) is deferred until the earlier of (i) delivery of all elements (other than technical support, warranty and software maintenance services or (ii) establishment of VSOE of the undelivered element(s). If the only undelivered element(s) relates to a service for which VSOE has not been established, the entire allocated value of the software group (or arrangement) is recognized as revenue over the longer of the service or contractual period of the technical support, warranty and software maintenance services.
VSOE of fair value typically only exists for the Company’s technical support, warranty and software maintenance services (“Support”). VSOE of fair value is established using the bell-shaped curve approach for a subgroup when a substantial majority (generally greater than 75%) of the transactions are priced within a reasonably narrow range (generally plus or minus 15% from the list price, which approximates the median). On a regular basis, the Company separately sells Support upon the expiration of the initial contractual periods included in an initial sales arrangement (“Support Renewals”). The population of Support Renewals is used in the bell-shaped curve approach to establish VSOE of fair value of Support and consists of actual sales prices charged to customers for Support Renewals and includes only Support Renewals sold separately on a stand-alone basis. The Company reviews these standalone sales of its Support Renewals for VSOE of fair value of its Support on a quarterly basis (“VSOE Analysis”). The Company’s pricing for Support Renewal transactions is generally based on a percentage of the Company’s list price for the product for which the Support Renewal is being purchased. When pricing conditions vary significantly, the Company further stratifies the population of stand-alone sales of its Support Renewals based on Support Renewal pricing conditions and separately analyzes these subgroups of Support Renewal transactions. The Company’s Support Renewal pricing conditions consist of the underlying product type, product family, customer type, and the geographic region in which the sale is made.
Sales to Distributors
The Company uses distributors and resellers to complement its direct sales and marketing efforts in certain markets and/or for certain products. Due to the broad range of features and options available with the Company's hardware and software products, distributors and resellers generally do not stock the Company's products and typically place orders with the Company after receiving an order from an end customer. These distributors and resellers receive business terms of sale similar to those received by the Company's other customers; and payment to the Company is not contingent on sell-through to and receipt of payment from the end customer. As such, for sales to distributors and resellers, the Company recognizes revenue when the risks and rewards of ownership have transferred to the distributor or reseller provided that the other revenue recognition criteria noted above have been met.
Cost of Revenues
The Company's cost of revenues related to the sale of its hardware and software products includes materials, payments to third party contract manufacturers, royalties, and salaries and other expenses related to its manufacturing and supply operations personnel. The Company outsources the majority of its manufacturing operations. Accordingly, a significant portion of the Company's cost of revenues related to its products consists of payments to its contract manufacturers. Cost of revenues related to the provision of services includes salaries and other expenses associated with technical support services and the cost of extended warranty and maintenance services. Cost of revenues does not include the amortization of purchased technology related to the Company's acquisitions of certain businesses, product lines and technologies of $25.7 million, $28.9 million and $26.0 million for the years ended December 31, 2015, 2014 and 2013, respectively, which are included the Amortization of intangible assets line item on the Company's consolidated statements of operations.
79
Shipping and Handling Costs
Shipping and handling costs are reported in Sales and marketing expenses in the Company's consolidated statements of operations. For the years ended December 31, 2015, 2014, and 2013 the Company recorded shipping and handling costs of $1.3 million, $1.7 million and $1.3 million, respectively.
Research and Development
Research and development expenses consist primarily of salaries and other personnel costs related to the design, development, testing, and enhancement of the Company's products. Costs related to research and development activities, including those incurred to establish the technological feasibility of a software product, are expensed as incurred. If technological feasibility is established, all development costs incurred until general product release are subject to capitalization. To date, establishment of technological feasibility of the Company's products and general release have substantially coincided. As a result, the Company has not capitalized any development costs.
Software Developed for Internal Use
The Company capitalizes costs of software, consulting services, hardware, and payroll-related costs incurred to purchase or develop internal-use software in accordance with the authoritative guidance on accounting for the costs of computer software developed or obtained for internal use. Internally developed software includes enterprise-level business software that the Company is customizing to meet its specific operational needs. To date, internal costs incurred to purchase or develop software for internal use have not been significant. Internally developed software is amortized over five years.
Advertising
Advertising costs are expensed as incurred. Advertising costs included in Sales and marketing were $2.4 million, $2.6 million and $2.9 million for the years ended December 31, 2015, 2014 and 2013, respectively.
Acquisition and Other Related Costs
Acquisition and other related costs are expensed as incurred and consist primarily of transaction and integration related costs such as success-based banking fees, professional fees for legal, accounting, tax, due diligence, valuation and other related services, change in control payments, amortization of deferred compensation, consulting fees, required regulatory costs, certain employee, facility and infrastructure transition costs, and other related expenses. The Company expects its acquisition and other related costs to fluctuate over time based on the timing of its acquisitions and related integration activities.
Stock-Based Compensation
Share-based payments, including grants of stock options, restricted stock units and employee stock purchase rights, are required to be recognized in the financial statements based on the estimated fair values for accounting purposes on the grant date. The Company uses the Black-Scholes option pricing model to estimate the fair value for accounting purposes of stock options and employee stock purchase rights. The Company uses the grant date closing share sales price of a share of its common stock to estimate the fair value for accounting purposes of restricted stock units. The determination of the fair value of share-based awards utilizing the Black-Scholes model is affected by the Company's stock price and a number of assumptions, including expected volatility, expected life and the risk-free interest rate. The expected life and expected volatility are estimated based on historical data. The risk-free interest rate assumption is based on U.S. constant maturities over the expected life of the award. Stock-based compensation expense recognized in the Company's consolidated financial statements is based on awards that are ultimately expected to vest. The amount of stock-based compensation expense is reduced for estimated forfeitures based on historical experience as well as future expectations. Forfeitures are required to be estimated at the time of grant and revised, if necessary, in subsequent periods if estimated and actual forfeitures differ from these initial estimates. The Company evaluates the assumptions used to value share-based awards on a periodic basis. The Company recognizes stock-based compensation expense based on the graded, or accelerated multiple-option, approach over the vesting period.
80
The Company has outstanding share-based awards that have performance-based vesting conditions. Awards with performance-based vesting conditions require the achievement of certain financial or other performance criteria as a condition to vesting. The Company recognizes the estimated fair value of performance-based awards, net of estimated forfeitures, as stock-based compensation expense over the performance period, using the graded approach, based upon its determination of whether it is probable that the performance targets will be achieved. At each reporting period, the Company reassess the probability of achieving the performance criteria and the performance period required to meet those targets. Determining whether the performance criteria will be achieved involves judgment, and the estimate of stock-based compensation expense may be revised periodically based on changes in the probability of achieving the performance criteria. Revisions are reflected in the period in which the estimate is changed. If performance goals are not met, no stock-based compensation expense is recognized, and, to the extent stock-based compensation was previously recognized, such stock-based compensation is reversed.
Income Taxes
The Company accounts for income taxes using the asset and liability method. Deferred taxes are determined based on the differences between the financial statement and tax bases of assets and liabilities, using enacted tax rates in effect for the year in which the differences are expected to reverse. Valuation allowances are established when necessary to reduce deferred tax assets to the amounts expected more likely than not to be realized.
The Company recognizes, in its consolidated financial statements, the impact of tax positions that are more likely than not to be sustained upon examination based on the technical merits of the positions. The Company recognizes interest and penalties related to uncertain tax positions in income tax expense. See Note 9 for additional information.
Earnings (Loss) Per Share
Basic earnings (loss) per share is computed using the weighted-average number of common shares outstanding during the period. Diluted earnings per share is computed using the weighted-average number of common shares and dilutive potential common shares outstanding during the period. Dilutive potential common shares primarily consist of shares underlying the Company's convertible senior notes, employee stock options and restricted stock units. See Note 13 for additional information.
Foreign Currency Translation and Transactions
Assets and liabilities of non-U.S. subsidiaries that operate in a local currency environment are translated to U.S. Dollars at exchange rates in effect at the balance sheet date, with the resulting translation adjustments included as a separate component of accumulated other comprehensive income or loss. Income and expense accounts are translated at average exchange rates during the year. Where the U.S. Dollar is the functional currency, certain balance sheet and income statement accounts are remeasured at historical exchange rates and translation adjustments from the re-measurement of the local currency amounts to U.S. Dollars are included in Interest income and other, net. During the years ended December 31, 2015, 2014 and 2013, the Company had net foreign currency (losses) income of approximately ($1.3) million, $(767,000) and $267,000, respectively, attributable to its foreign operations, which includes net gains and losses on forward contracts.
Comprehensive Income (Loss)
Comprehensive income (loss) includes all changes in equity (net assets) during a period from non-owner sources. Accumulated other comprehensive income or loss includes unrealized gains and losses on investments and foreign currency translation adjustments.
Segments
Operating segments are defined as components of an enterprise engaged in business activities for which discrete financial information is available and regularly reviewed by the chief operating decision maker (“CODM”) of the enterprise to make decisions about resource allocation and in assessing performance. The Company's CODM is its Chief Executive Officer who reviews the Company's consolidated budgets and results for the purposes of allocating resources and evaluating financial performance. Accordingly, the Company has determined that it operates and operated within one business segment as of, and for the years ended, December 31, 2015, 2014 and 2013. See Note 5 for entity-wide disclosures about products and services, geographic areas and major customers.
81
Recent Accounting Pronouncements
In February 2016, the Financial Accounting Standards Board (“FASB”) issued Accounting Standard Update (“ASU”) 2016-02, Leases, which requires that lessees recognize assets and liabilities for leases with lease terms greater than twelve months in the statement of financial position. ASU 2016-02 also requires improved disclosures to help users of financial statements better understand the amount, timing and uncertainty of cash flows arising from leases. The standard will be effective for annual reporting periods beginning after December 15, 2018, including interim periods within those reporting periods. Early adoption is permitted. The Company has not yet evaluated the impact of the adoption of this accounting standard on its consolidated financial statements.
In January 2016, the FASB issued ASU 2016-01, Recognition and Measurement of Financial Assets and Financial Liabilities, which provides updated guidance that enhances the reporting model for financial instruments, which includes amendments to address aspects of recognition, measurement, presentation and disclosure. The standard will be effective for annual reporting periods beginning after December 15, 2017, including interim periods within those reporting periods. Except for the early application guidance, early adoption of the amendments is not permitted. The Company has not yet evaluated the impact of the adoption of this accounting standard update on its consolidated financial statements.
In November 2015, the FASB issued ASU 2015-17, Balance Sheet Classification of Deferred Taxes to simplify the presentation of deferred taxes in the statement of financial position. The updated guidance requires that deferred tax assets and liabilities be classified as noncurrent in a classified balance sheet. The standard will be effective for annual reporting periods beginning after December 15, 2016, including interim periods within those reporting periods. Early application is permitted. The Company has not yet evaluated the impact of the adoption of this accounting standard update on its consolidated financial statements.
In September 2015, the FASB issued ASU 2015-16, Simplifying the Accounting for Measurement-Period Adjustments, which provides new guidance regarding measurement period adjustments in connection with business combinations by requiring that an acquirer recognize adjustments to provisional amounts that are identified during the measurement period in the reporting period in which the adjustment amounts are determined. The standard will be effective for annual reporting periods beginning after December 15, 2015, including interim periods within those reporting periods. The standard update is to be applied prospectively to adjustments of provisional amounts that occur after the effective date with earlier application permitted for financial statements that have not been issued. The Company does not expect the adoption of this standard to have a material impact on its consolidated financial statements.
In July 2015, the FASB issued ASU 2015-11, Simplifying the Measurement of Inventory, which provides new guidance regarding the measurement of inventory. The new guidance requires most inventory to be measured at the lower of cost and net realizable value. The standard defines net realizable value as estimated selling prices in the ordinary course of business, less reasonably predictable costs of completion, disposal and transportation. The standard applies to companies other than those that measure inventory using last-in, first-out ("LIFO") or the retail inventory method. The standard will be effective for annual reporting periods beginning after December 15, 2016, including interim periods within those reporting periods. Early application is permitted. The Company has not yet evaluated the impact of the adoption of this accounting standard update on its consolidated financial statements.
In April 2015, the FASB issued ASU 2015-03, Interest—Imputation of Interest: Simplifying the Presentation of Debt Issuance Costs, and, in August 2015, the FASB issued ASU 2015-15, Presentation and Subsequent Measurement of Debt Issuance Costs Associated with Line-of-Credit Arrangements. These ASUs require debt issuance costs related to a recognized debt liability to be presented in the balance sheet as a direct deduction from the carrying amount of that debt consistent with debt discounts. The presentation and subsequent measurement of debt issuance costs associated with lines of credit may be presented as an asset and amortized ratably over the term of the line of credit arrangement, regardless of whether there are outstanding borrowings on the arrangement. The recognition and measurement guidance for debt issuance costs are not affected by these ASUs. These ASUs are effective for financial statements issued for fiscal years beginning after December 15, 2015 and interim periods within those years. Early application is permitted. As part of the Company's adoption of this guidance, unamortized debt issuance costs of $1.1 million as of December 31, 2014 were reclassified from prepaid and other current assets to a reduction of short-term debt on its consolidated balance sheet.
82
In May 2014, the FASB issued ASU 2014-09, Revenue from Contracts with Customers, which provides new guidance on the recognition of revenue and states that an entity should recognize revenue to depict the transfer of promised goods or services to customers in an amount that reflects the consideration to which the entity expects to be entitled in exchange for those goods or services. The standard was originally set to become effective in annual periods beginning after December 15, 2016 and for interim and annual reporting periods thereafter. In August 2015, the FASB issued ASU 2015-14 Revenue from Contracts with Customers; Deferral of the Effective Date, which defers the effective sate of ASU 2014-09 for all entities by one year, thereby delaying the effective date of the standard to January 1, 2018, with an option that would permit companies to adopt the standard as early as the original effective date. Early adoption prior to the original effective date is not permitted. The Company has not yet evaluated the impact of the adoption of this accounting standard update on its consolidated financial statements.
2. | Acquisitions |
Net Optics, Inc.
On December 5, 2013, the Company completed its acquisition of all of the outstanding shares of common stock and all other equity interests of Net Optics. Net Optics is a leading provider of total application and network visibility solutions. With this acquisition, the Company has expanded its product portfolio, strengthened its service provider and enterprise customer base, and broadened its sales channel and partner programs. In addition, the Company has realized certain operational synergies and has leveraged Net Optics’ existing sales channels, partner relationships and assembled workforce, including Net Optics' experienced product development team in Santa Clara, California and its global sales force. These factors, among others, contributed to a purchase price in excess of the estimated fair value of Net Optics’ net identifiable assets acquired (see summary of net assets below) and as a result, the Company has recorded goodwill in connection with this transaction.
The aggregate purchase price totaled $187.4 million, and reflects certain post-closing adjustments, related to the final determination of the Net Optics’ closing working capital under the purchase agreement and the final amount of the tax reimbursements due to the sellers that were determined based upon the filing of certain tax returns. The acquisition was funded from the Company's existing cash and sale of investments.
Acquisition and other related costs, including integration activities, approximated $0.7 million and $3.5 million for the years ended December 31, 2015 and 2014, respectively. These acquisition and other related costs have been expensed as incurred and have been included within the Acquisition and other related costs line item on the Company's consolidated statements of operations.
During the first quarter of 2014, the Company reduced its aggregate purchase price for Net Optics from $193.8 million to $187.7 million due to a measurement period adjustment to finalize certain post-closing adjustments, including the net working capital calculation. The finalization of the net working capital calculation resulted in a decrease to the aggregate purchase price of $6.1 million and a corresponding reduction to goodwill. This adjustment was applied retrospectively to the acquisition date (i.e., December 5, 2013). The Company also recorded a measurement period adjustment to finalize the previous purchase accounting estimates resulting from an update to the tax basis of certain intangible assets. This resulted in an increase to deferred tax assets of $26.9 million and a corresponding decrease to goodwill, which were retrospectively adjusted to the acquisition date (i.e., December 5, 2013). These measurement period adjustments are reflected in the table below.
During the fourth quarter of 2014, the Company reduced its aggregate purchase price for Net Optics from $187.7 million to $187.4 million due to a measurement period adjustment to finalize certain post-closing adjustments, including the final amount of the tax reimbursements due to the sellers that were determined upon the filing of certain tax returns. The adjustment reduced the value of the Company's accrued expenses and other liabilities and goodwill balances by approximately $341,000. As these changes were not material, the Company did not recast its prior period financial statements for such changes. The below table reflects these changes.
83
The following table summarizes the allocation of the purchase price to the estimated fair values of the assets acquired and liabilities assumed at the date of acquisition (in thousands):
Cash and cash equivalents | $ | 1,967 | |
Accounts receivable | 9,253 | ||
Inventories | 6,543 | ||
Prepaid and other assets | 1,742 | ||
Fixed assets, | 2,976 | ||
Deferred tax asset | 26,915 | ||
Identifiable intangible assets | 72,858 | ||
Goodwill | 78,727 | ||
Total assets acquired | 200,981 | ||
Accounts payable, accrued expenses and other liabilities | (8,440 | ) | |
Deferred revenues | (5,170 | ) | |
Net assets acquired | $ | 187,371 | |
The identifiable intangible assets of $72.9 million consist of $50.0 million of acquired technology, $15.8 million of customer relationships and related service agreements, $3.7 million related to non-compete agreements, $3.0 million for the trade name, and approximately $358,000 of other identifiable intangible assets. The fair values of the identifiable intangible assets have been estimated using the income approach, which includes the discounted cash flow and relief-from-royalty methods. These intangible assets will be amortized using a straight-line method over their expected useful lives ranging from four months to seven years. The goodwill recorded in connection with this transaction is tax deductible for U.S. income tax purposes.
Pro Forma and Post Acquisition Results (Unaudited)
The following table summarizes the unaudited pro forma total revenues and net income of the combined entities, including Ixia, had the acquisition of Net Optics occurred January 1, 2012 (in thousands):
2013 | |||
Total revenues | $ | 516,767 | |
Net loss | (2,097 | ) | |
The pro forma combined results in the table above have been prepared for comparative purposes only and include acquisition related adjustments for, among others items, reductions in revenues and increases in costs related to the estimated fair value adjustments to deferred revenues and inventory, respectively, certain acquisition related costs, amortization of identifiable intangible assets, and the related income tax effects for these adjustments.
Post-acquisition results for Net Optics operations have been included in our consolidated financial statements since the acquisition date (i.e., December 5, 2013), which approximated $4.8 million of total revenues and a loss before income taxes of approximately $1.9 million for the year ended December 31, 2013.
The pro forma combined results do not purport to be indicative of the results of operations which would have resulted had the acquisition been effective at the beginning of the applicable periods noted above, or the future results of operations of the combined entity.
84
3. | Debt |
Unsecured Convertible Senior Notes
On December 7, 2010, the Company issued $200 million in aggregate principal amount of 3.00% Convertible Senior Notes (the “Notes”) due December 15, 2015 unless earlier repurchased or converted. The unsecured Notes were governed by the terms of an indenture dated December 7, 2010 between the Company and Wells Fargo Bank, N.A., as trustee (the “Indenture”).
In July 2015, the Company repurchased $65.0 million in aggregate principal amount of the Notes in a privately negotiated transaction for an aggregate cash purchase price of approximately $65.2 million plus accrued interest up to the date of repurchase in the aggregate amount of approximately $119,000. The Company paid the purchase price for such repurchased Notes with funds withdrawn from the "restricted amounts" established by the Company pursuant to the Company's amended and restated credit agreement dated as of March 2, 2015 (as such agreement and such restricted amounts are described below in this Note 3 under “Senior Secured Credit Agreements - 2015 Credit Agreement”).
In December 2015, the remaining outstanding Notes in the aggregate principal amount of $135.0 million matured, and the Company repaid the Notes in full in accordance with their terms. The Company used available cash on hand, as well as certain restricted cash and investment amounts as required under the Company's Credit Agreement, to fund the repayment of the Notes and the related payment of accrued interest in the aggregate amount of approximately $2.0 million.
Amortization of deferred issuance costs recorded to interest expense was $1.3 million during the year ended December 31, 2015. Amortization of deferred issuance costs recorded to interest expense was $1.2 million during each of the years ended December 31, 2014 and 2013.
As of December 31, 2014, the estimated fair value of the Notes was $202.4 million. The estimated fair value of the Notes was determined based on the market price of the Notes as of December 31, 2014, which were based on Level 2 inputs.
Senior Secured Credit Agreements
2015 Credit Agreement
On March 2, 2015 (the “Closing Date”), the Company entered into an amended and restated credit agreement (as amended to date, the “Credit Agreement”) by and among the Company, as borrower, certain of the Company’s wholly owned direct and indirect subsidiaries, as guarantors, Silicon Valley Bank, as administrative agent, swingline lender and letter of credit issuer, and the other lenders party thereto (Silicon Valley Bank and the other lenders from time to time party thereto hereinafter collectively referred to as the “Lenders”). The Credit Agreement amended and restated the Company's prior credit agreement dated as of December 21, 2012, as amended (the “Prior Credit Agreement”), by and among the Company, the guarantors, Silicon Valley Bank, as administrative agent, swingline lender, and letter of credit issuer (as successor to Bank of America, N.A. in such capacities), and the other lenders party thereto.
As of December 31, 2015, the Credit Agreement provided for a (i) term loan (the “Term Loan”) in the aggregate principal amount of $40 million, which amount was advanced to the Company on March 3, 2015, and (ii) revolving credit facility (the “Revolving Credit Facility” and, together with the Term Loan, the “Credit Facility”) in an aggregate amount of up to $75 million, with sub-limits of $25 million for the issuance of standby letters of credit and $15 million for swingline loans. As of such date, the aggregate amount available under the Credit Facility was, upon the Company's request and subject to the receipt of increased commitments from the Lenders or additional lenders, subject to increase by an aggregate amount of up to $65 million.
On January 25, 2016, the Company entered into an amendment to the Credit Agreement which, among other modifications, increased the commitments under the Revolving Credit Facility to an aggregate amount of up to $150.0 million, extended the maturity date of the Revolving Credit Facility to February 15, 2020, and provided that the Revolving Credit Facility may, upon the Company’s request and subject to the receipt of increased commitments from the lenders party thereto or additional lenders, be increased by the aggregate amount of up to $100.0 million. The maturity date of the Term Loan did not change (i.e., February 15, 2018).
The Company is permitted to voluntarily prepay outstanding loans under the Credit Facility at any time without premium or penalty. Prior to the maturity of the Credit Facility, the Company may re-borrow amounts under the Revolving Credit Facility, but it may not re-borrow amounts that are repaid or prepaid under the Term Loan.
85
Debt issuance costs related to the March 2, 2015 closing were approximately$1.3 million, which were capitalized to deferred issuance costs and are being amortized to interest expense over the three-year term of the Credit Facility. During the year ended December 31, 2015, amortization recorded to interest expense pertaining to deferred issuance costs was approximately $376,000. There was no amortization recorded to interest expense pertaining to deferred issuance costs for the Term Loan for the years ended December 2014 and 2013.
Prior to repayment of the Notes and as required by the Credit Agreement, the Company maintained funds advanced under the Term Loan, together with additional cash, cash equivalents and marketable securities, as restricted assets to be utilized for the repayment or repurchase of the Notes (the “Restricted Amounts”). As described above in this Note 3 under “Unsecured Convertible Senior Notes,” in July 2015, the Company used a portion of the Restricted Amounts to fund the repurchase of certain Notes and, in December 2015, used the remaining Restricted Amounts to repay the remaining outstanding Notes at maturity.
The Company may use the proceeds of the Revolving Credit Facility for (i) working capital, capital expenditures and general corporate purposes, (ii) share repurchases, and/or (iii) acquisitions, in each case as permitted by applicable law and the Credit Agreement. As of December 31, 2015, the restrictions on acquisitions as set forth in the Credit Agreement included a restriction that precluded the Company from funding an acquisition in whole or in part with cash unless the Company would have, after giving effect to the transaction, cash, cash equivalents and marketable securities in an amount not less than $75 million in excess of the amount then required to be maintained as Restricted Amounts. The January 2016 amendment to the Credit Agreement permits the Company to fund cash acquisitions in an aggregate amount of up to $200 million, subject to certain limitations, including the requirement that, after giving effect to an acquisition, the Company’s available liquidity, as defined in the Credit Agreement, exceeds $50 million.
The Term Loan requires quarterly repayments of principal on the last day of the eleven fiscal quarters, commencing with the fiscal quarter ended June 30, 2015. The first four payments are in the amount of $500,000 each, the following four payments are in the amount of $1.0 million each, and the next three payments are in the amount of $1.5 million each. The remaining principal balance of the Term Loan will be due and payable on the maturity date of the Credit Facility, which is February 15, 2018. The first, second and third of the four payments of $500,000 were made on June 30, 2015, September 30, 2015 and December 31, 2015, respectively.
The Company’s and the guarantors’ obligations under the Credit Agreement are secured by (i) a first priority perfected security interest in substantially all existing and after acquired tangible and intangible personal property of the Company and the guarantors and (ii) the pledge by the Company and the guarantors of (a) all outstanding equity securities of their existing and future domestic subsidiaries, including, in the case of the Company, the outstanding equity securities of each of the guarantors, and (b) 65% of the outstanding equity securities of their existing and future respective first-tier foreign subsidiaries, including, in the case of Catapult Communications Corporation (one of the Company's wholly owned domestic subsidiaries), 65% of the outstanding equity securities of Ixia Technologies International Limited, a company organized under the laws of Ireland.
Prior to September 30, 2015, interest rates for the Revolving Credit Facility for the first year following the March 2, 2015 effective date of the Credit Facility and for the Term Loan were set, at the Company’s option, at a rate per annum of (i) 4.25% above the Eurodollar rate or (ii) 3.25% above a defined base rate. After September 30, 2015, the interest rates for both the Term Loan and the Revolving Credit Facility are established, at the Company’s option, based on the Eurodollar rate or a defined base rate. Such interest rates range from 2.0% to 3.0% above the Eurodollar rate for Eurodollar-based borrowings and from 1.0% to 2.0% above the defined base rate for base rate borrowings, in each case depending on the Company’s leverage ratio. The Company is also required to pay a quarterly commitment fee, ranging from 0.3% to 0.50% per annum, on the undrawn portion of the Revolving Credit Facility. Letter of credit fees accrue based on the daily amount available to be drawn under outstanding letters of credit and range from 2.0% to 3.0%, depending on the Company’s leverage ratio. Swingline loans bear interest at the defined base rate plus the applicable margin for loans under the Revolving Credit Facility based on the defined base rate. If the Company defaults under the Credit Agreement, the Lenders may increase the interest rate(s) to 2.0% more than the rate(s) otherwise applicable. The weighted average interest rate applicable to the Term Loan for the year ended December 31, 2015 was 4.00%. As of December 31, 2015, the interest rate applicable to the amount outstanding under our Term Loan was 2.92%.
The Credit Agreement requires the Company to comply with certain covenants, including maintaining (i) a fixed charge coverage ratio (as defined in the Credit Agreement) of not less than 1.25 to 1.00, measured quarterly on a trailing 12 months basis, (ii) a consolidated senior leverage ratio (as defined in the Credit Agreement) of not greater than 2.50 to 1.00 through December 31, 2015, measured quarterly on a trailing 12 months basis, and (iii) a consolidated total leverage ratio (as defined in the Credit Agreement), measured quarterly on a trailing 12 months basis, of not greater than 3.00 to 1.00 through December 31, 2015, 3.25 to1.00 through June 30, 2018, and 3.00 to 1.00 thereafter.
86
The Credit Agreement also contains reporting covenants typical for transactions comparable to the Credit Facility provided for therein, including covenants to furnish the lenders with financial statements, business plans, annual budgets, and other financial and business information and with notice of certain material events and information regarding collateral. The Credit Agreement also contains customary affirmative covenants, including covenants relating to the payment of obligations, preservation of the existence of and registrations for patents, trademarks, trade names, and copyrights, maintenance of properties and insurance, compliance with laws and material contractual obligations, books and records, inspection rights, use of proceeds, addition of subsidiary guarantors, and security for the Credit Facility. The Credit Agreement contains customary negative covenants, including restrictions relating to liens and additional indebtedness, investments, mergers, liquidations and other fundamental changes, the sale and other disposition of properties and assets, restricted payments, changes in lines of business, transactions with affiliates, entering into certain burdensome agreements, and use of proceeds.
The Credit Agreement provides for customary events of default, including the non-payment of amounts due, failure to perform under covenants, breaches of representations and warranties, cross-defaults relating to certain indebtedness, institution of insolvency proceedings, inability to pay debts as they become due, entry of certain judgments, events relating to the Employee Retirement Income Security Act of 1974, as amended, invalidity of loan documents, change of control events, and ineffectiveness of subordination provisions. The occurrence of an event of default may result in the acceleration of all outstanding obligations under the Credit Agreement and in an increase in the applicable interest rate(s) as described above.
Prior Credit Agreement
The Company’s Prior Credit Agreement provided for a credit facility (the “Prior Credit Facility”) that originally consisted of a revolving loan commitment of up to $150 million. As a result of the termination of certain lenders’ commitments under the Prior Credit Facility, the aggregate loan commitment amount was reduced to $67.5 million million in January 2015 and further reduced to$46.5 million million in March 2015 prior to the date of the amendment and restatement of the Prior Credit Agreement on March 2, 2015. Due to the Company's defaults under the Prior Credit Agreement, the Company was, at the time of its amendment and restatement, blocked from borrowing and obtaining letters of credit under the Prior Credit Facility. As of December 31, 2014, and immediately prior to the March 2015 amendment and restatement of the Prior Credit Agreement, no amounts were outstanding under the Prior Credit Facility.
4. | Restructuring Costs |
During the year ended December 31, 2015, the Company recorded restructuring charges of $143,000 and restructuring credits of $0.7 million. Net restructuring credits recorded during the year ended December 31, 2015 included recoveries in the amount of $0.4 million relating to a favorable lease buyout and $0.4 million relating to the receipt of proceeds from an insurance settlement related to costs previously charged to the Restructuring line item on the consolidated statements of operations. During the years ended December 31, 2014 and 2013, the Company recorded restructuring charges of $10.3 million and $1.8 million, respectively. The Company’s restructuring charges include severance and other employee termination costs, lease termination costs and other related costs, which are reported in the Restructuring line item in its consolidated statements of operations. The timing of associated cash payments depend upon the type of restructuring charge and can extend over multiple periods.
During the fourth quarter of 2013, the Company's management approved, committed to and initiated a plan to restructure its Test operations (“Test Restructuring”). The Test Restructuring included a net reduction in force of approximately 120 positions (primarily impacting the Company's research and development team in Bangalore, India), which represented approximately 6.5% of the Company's worldwide work force at that time. The Company has recognized restructuring costs to date of $1.9 million which were primarily related to employee termination benefits consisting of severance and other employee related costs. The Test Restructuring was substantially completed by the fourth quarter of 2013, and no significant further charges are expected.
During the first quarter of 2014, the Company's management approved, committed to and initiated a plan to restructure its operations following our December 5, 2013 acquisition of Net Optics (“Net Optics Restructuring”). The Net Optics Restructuring included a net reduction in force of approximately 45 positions (primarily impacting our research and development team in Israel and Santa Clara, California), which represented approximately 2.3% of the Company's worldwide work force at that time. During 2014, the Company recognized total restructuring costs of $3.5 million, of which $2.0 million related to employee termination benefits consisting of severance and other related employee costs, $1.2 million related to costs required to terminate its lease in Israel, and approximately $316,000 for other related costs. The Net Optics Restructuring was substantially completed by the second quarter of 2014, and no significant further charges are expected.
87
During the third quarter of 2014, the Company's management approved, committed to and implemented a company-wide restructuring initiative (“2014 Corporate Restructuring”) to restructure its operations to better align the Company’s operating costs with its business opportunities. The restructuring included a reduction in force of approximately 96 positions across multiple business functions, which represented approximately 5% of the Company's worldwide work force at that time. During 2014, the Company recognized total restructuring charges of $6.1 million, of which $4.1 million related to expenses for employee termination benefits, $1.8 million for facility related charges in Austin, Santa Clara, India and Romania, and approximately $181,000 for other related costs. The 2014 Corporate Restructuring was substantially completed by the fourth quarter of 2014, and no significant further charges are expected.
Activities related to the Company's restructuring plans are as follows (in thousands):
Restructuring Prior to 2013 | Test Restructuring | Net Optics Restructuring | 2014 Corporate Restructuring | Total | ||||||||||||||||
Accrual at December 31, 2012 | $ | 1,026 | $ | — | $ | — | $ | — | $ | 1,026 | ||||||||||
Charges | 58 | 1,782 | — | — | 1,840 | |||||||||||||||
Payments | (474 | ) | (687 | ) | — | — | (1,161 | ) | ||||||||||||
Non-cash items | (198 | ) | — | — | — | (198 | ) | |||||||||||||
Accrual at December 31, 2013 | 412 | 1,095 | — | — | 1,507 | |||||||||||||||
Charges | — | 136 | 3,852 | 6,322 | 10,310 | |||||||||||||||
Payments | (160 | ) | (1,231 | ) | (3,515 | ) | (4,382 | ) | (9,288 | ) | ||||||||||
Non-cash items | (6 | ) | — | — | — | (6 | ) | |||||||||||||
Accrual at December 31, 2014 | 246 | — | 337 | 1,940 | 2,523 | |||||||||||||||
Credits | — | — | (322 | ) | (195 | ) | (517 | ) | ||||||||||||
Payments | (140 | ) | — | (15 | ) | (1,304 | ) | (1,459 | ) | |||||||||||
Non-cash items | (106 | ) | — | — | — | (106 | ) | |||||||||||||
Accrual at December 31, 2015 | $ | — | $ | — | $ | — | $ | 441 | $ | 441 | ||||||||||
At December 31, 2015, the remaining accrual related to the Company's restructuring activities totaled $0.4 million and was included within the Accrued expenses and other line item in its consolidated balance sheets. The remaining accrual primarily relates to lease termination costs, which are anticipated to be fully paid by the third quarter of 2020.
5. | Concentrations |
Credit Risk
Financial instruments that subject the Company to concentrations of credit risk consists primarily of cash and cash equivalents, investments and trade accounts receivable. The Company maintains its cash and cash equivalents with financial institutions that management deems reputable, and at times, cash balances may be in excess of FDIC insurance limits. The Company extends differing levels of credit to customers, typically do not require collateral, and maintains reserves for potential credit losses based upon the expected collectability of accounts receivable.
88
Revenue by Product Line
The Company has two product lines: Network Test Solutions and Network Visibility Solutions. Network Test products include the Company's multi-slot test chassis and appliances, its traffic generation interface cards, its suite of test applications, and the related technical support, warranty and software maintenance services, including its Application and Threat Intelligence ("ATI") service. The Company's Network Visibility products include network packet brokers, bypass switches, virtual and physical taps and the related technical support, warranty and software maintenance services, including its ATI service available on certain NVS products. The following table presents revenue by product line (in thousands):
Year Ended December 31, | |||||||||||
2015 | 2014 | 2013 | |||||||||
Network Test Solutions | $ | 386,614 | $ | 345,673 | $ | 376,297 | |||||
Network Visibility Solutions | 130,323 | 118,785 | 90,959 | ||||||||
Total | $ | 516,937 | $ | 464,458 | $ | 467,256 | |||||
Significant Customers
For the years ended December 31, 2015 and 2014, no customer comprised more than 10% of total revenues. For the year ended December 31, 2013, two customers comprised more than 10% of total revenues as follows:
Year Ended December 31, | ||||||
2015 | 2014 | 2013 | ||||
Customer A | * | * | 10.6 | % | ||
Customer B | * | * | 14.3 | % | ||
* Less than 10%
As of December 31, 2015 and 2014, no one customer had a receivable balance totaling more than 10% of total accounts receivable.
International Data
For the years ended December 31, 2015, 2014 and 2013, total international revenues as a percentage of total revenues based on customer location consisted of the following:
Year Ended December 31, | ||||||||
2015 | 2014 | 2013 | ||||||
International revenues | 38.5 | % | 40.8 | % | 36.9 | % | ||
As of December 31, 2015 and 2014, property and equipment, net were geographically located as follows (in thousands):
As of December 31, | |||||||
2015 | 2014 | ||||||
United States | $ | 23,654 | $ | 24,697 | |||
Romania | 6,542 | 6,035 | |||||
India | 3,576 | 3,857 | |||||
Other | 2,764 | 3,059 | |||||
Total | $ | 36,536 | $ | 37,648 | |||
89
6. | Selected Balance Sheet Data |
Allowance for Doubtful Accounts
Activity in the allowance for doubtful accounts during the years presented is as follows (in thousands):
December 31, 2015 | December 31, 2014 | December 31, 2013 | |||||||||
Balance at beginning of year | $ | 1,011 | $ | 840 | $ | 1,436 | |||||
Additions: charged to costs and expenses | 525 | 275 | 125 | ||||||||
Deductions: write-offs, net of recoveries | (429 | ) | (104 | ) | (721 | ) | |||||
Balance at end of year | $ | 1,107 | $ | 1,011 | $ | 840 | |||||
Investments in Marketable Securities
Investments in marketable securities as of December 31, 2015 consisted of the following (in thousands):
Amortized Cost | Gross Unrealized Gains | Gross Unrealized Losses | Fair Value | ||||||||||||
Available-for-sale – short-term: | |||||||||||||||
U.S. Treasury, government and agency debt securities | $ | 4,301 | $ | — | $ | (13 | ) | $ | 4,288 | ||||||
Corporate debt securities | 10,265 | — | (49 | ) | 10,216 | ||||||||||
Total | $ | 14,566 | — | (62 | ) | $ | 14,504 | ||||||||
Investments in marketable securities as of December 31, 2014 consisted of the following (in thousands):
Amortized Cost | Gross Unrealized Gains | Gross Unrealized Losses | Fair Value | ||||||||||||
Available-for-sale – short-term: | |||||||||||||||
U.S. Treasury, government and agency debt securities | $ | 42,289 | $ | 9 | $ | (17 | ) | $ | 42,281 | ||||||
Corporate debt securities | 37,476 | 41 | (38 | ) | 37,479 | ||||||||||
Total | $ | 79,765 | $ | 50 | $ | (55 | ) | $ | 79,760 | ||||||
As of December 31, 2015 and 2014, unrealized losses on the Company's investment in available-for-sale securities that have been in a continuous unrealized loss position for more the 12 months or longer were insignificant. Unrealized losses related to these investments are due to interest rate fluctuations as opposed to changes in credit quality. In addition, the Company does not intend to sell and it is not more likely than not that it would be required to sell these investments before recovery of their amortized cost basis, which may be at maturity. As a result, there is no other-than-temporary impairment for these investments at December 31, 2015.
The amortized cost and fair value of our investments at December 31, 2015, by contractual years-to-maturity, are as follows (in thousands):
Amortized Cost | Fair Value | ||||||
Due in less than 1 year | $ | 2,793 | $ | 2,787 | |||
Due within 1-2 years | 6,831 | 6,798 | |||||
Due within 2-5 years | 4,942 | 4,919 | |||||
Total | $ | 14,566 | 14,504 | ||||
90
Inventories
Inventories consisted of the following (in thousands):
December 31, 2015 | December 31, 2014 | ||||||
Raw materials | $ | 3,864 | $ | 5,502 | |||
Work in process | 11,253 | 18,047 | |||||
Finished goods | 18,172 | 21,277 | |||||
Total | $ | 33,289 | $ | 44,826 | |||
Property and Equipment, Net
Property and equipment, net consisted of the following (dollars in thousands):
December 31, 2015 | December 31, 2014 | ||||||||||
Useful Life | |||||||||||
(in years) | |||||||||||
Development equipment | 5 | $ | 35,831 | $ | 32,622 | ||||||
Demonstration equipment | 2 | 29,258 | 27,888 | ||||||||
Furniture and other equipment | 5 | 22,066 | 20,540 | ||||||||
Computer software | 3 | - | 5 | 20,702 | 18,429 | ||||||
Building and leasehold improvements | 1 | - | 40 | 20,921 | 19,651 | ||||||
Computer equipment | 3 | 16,698 | 15,237 | ||||||||
Total | 145,476 | 134,367 | |||||||||
Accumulated depreciation | (108,940 | ) | (96,719 | ) | |||||||
Total | $ | 36,536 | $ | 37,648 | |||||||
Accrued Expenses and Other
Accrued expenses and other consisted of the following (in thousands):
December 31, 2015 | December 31, 2014 | ||||||
Bonuses | $ | 20,423 | $ | 3,851 | |||
Compensation and related expenses | 12,805 | 9,853 | |||||
Vacation | 7,967 | 7,524 | |||||
Commissions | 5,083 | 4,966 | |||||
Legal contingencies | 4,825 | — | |||||
Income taxes | 3,599 | 977 | |||||
Other taxes | 3,106 | 5,372 | |||||
Professional fees | 2,163 | 2,780 | |||||
Other | 10,058 | 9,948 | |||||
Total | $ | 70,029 | $ | 45,271 | |||
91
7. | Fair Value Measurements |
Fair value is defined as the price that would be received to sell an asset or paid to transfer a liability in the principal or most advantageous market for an asset or liability in an orderly transaction between market participants at the measurement date. The hierarchy below lists three levels of fair value based on the extent to which inputs used in measuring fair value are observable in the market. The Company categorizes each of its fair value measurements in one of these three levels based on the lowest level input that is significant to the fair value measurement in its entirety. This hierarchy prioritizes the inputs into three broad levels as follows:
Level 1. Observable inputs such as quoted prices in active markets;
Level 2. Inputs, other than the quoted prices in active markets, that are observable either directly or indirectly; and
Level 3. | Unobservable inputs in which there is little or no market data, which require the reporting entity to develop its own assumptions. |
Financial assets carried at fair value as of December 31, 2015 and 2014 are summarized below (in thousands):
December 31, 2015 | December 31, 2014 | ||||||||||||||||||||||||||||||
Fair Value | Quoted Prices in Active Markets for Identical Assets (Level 1) | Significant Other Observable Inputs (Level 2) | Significant Unobservable Inputs (Level 3) | Fair Value | Quoted Prices in Active Markets for Identical Assets (Level 1) | Significant Other Observable Inputs (Level 2) | Significant Unobservable Inputs (Level 3) | ||||||||||||||||||||||||
Cash equivalents: | |||||||||||||||||||||||||||||||
Money market funds | $ | 284 | $ | 284 | $ | — | $ | — | $ | 267 | $ | 267 | $ | — | $ | — | |||||||||||||||
Corporate debt securities | — | — | — | — | 5,349 | — | 5,349 | — | |||||||||||||||||||||||
Short-term investments: | |||||||||||||||||||||||||||||||
U.S. Treasury, government and agency debt securities | 4,288 | — | 4,288 | — | 42,281 | — | 42,281 | — | |||||||||||||||||||||||
Corporate debt securities | 10,216 | — | 10,216 | — | 37,479 | — | 37,479 | — | |||||||||||||||||||||||
Total financial assets | $ | 14,788 | $ | 284 | $ | 14,504 | $ | — | $ | 85,376 | $ | 267 | $ | 85,109 | $ | — | |||||||||||||||
The Company's cash and investment instruments are classified within Level 1 or Level 2 of the fair value hierarchy based on quoted prices, broker or dealer quotations, or alternative pricing sources with reasonable levels of price transparency.
The fair values of the Company's money market funds, U.S. treasury, government and agency debt securities, and corporate debt securities are based on quoted market prices as shown in its investment brokerage/custodial statements. To the extent deemed necessary, the Company may also obtain non-binding dealer quotes to corroborate the estimated fair values reflected in its investment brokerage/custodial statements.
During 2013, the Company sold auction rate securities (“ARS”) that were classified as Level 3 financial assets. These ARS had a par value of $4.4 million and the sales resulted in realized gains of $2.9 million, which were included within Interest income and other, net line item on the Company's consolidated statements of operations.
There were no transfers of assets between levels within the fair value hierarchy for the years ended December 31, 2015 and 2014, and there were no Level 3 assets held as of December 31, 2015 and 2014.
There were no unrealized losses recorded in earnings for Level 3 assets still held at December 31, 2015 and 2014.
92
8. | Goodwill and Other Intangible Assets |
There was no activity within goodwill during 2015.
The following table presents the 2014 activity in goodwill (in thousands):
Balance at January 1, 2014 | $ | 338,836 | |
Purchase price allocation adjustment for Net Optics | (341 | ) | |
Other | 378 | ||
Balance at December 31, 2014 | $ | 338,873 | |
During the first quarter of 2014, the Company identified measurement period adjustments to previous purchase accounting estimates for the December 5, 2013 acquisition of Net Optics. The differences from estimated values resulted from the Company updating its preliminary assessment of the tax basis of certain intangible assets and the finalization of the Net Optics’ net working capital adjustment. These adjustments, which were retrospectively adjusted to the acquisition date (i.e., December 5, 2013), resulted in a decrease to goodwill of $32.9 million and are reflected in the January 1, 2014 goodwill balance in the above table. See Note 2 for additional information.
During the fourth quarter of 2014, the Company identified a measurement period adjustment related to the Net Optics acquisition to finalize certain post-closing adjustments for the final amount of the tax reimbursements due to the sellers that were determined based upon the filing of certain pre-acquisition tax returns. This adjustment resulted in a decrease to goodwill of approximately $341,000 and is reflected in the December 31, 2014 goodwill balance in the above table. See Note 2 for additional information.
The Company has not had any historical goodwill impairment charges.
The following table presents the Company's purchased intangible assets (in thousands) as of December 31, 2015:
Weighted Average Useful Life | Gross | Accumulated Amortization | Net | ||||||||||
(in years) | |||||||||||||
Other intangible assets: | |||||||||||||
Technology | 5.5 | $ | 185,665 | $ | (129,509 | ) | $ | 56,156 | |||||
Customer relationships | 6.0 | 71,700 | (51,533 | ) | 20,167 | ||||||||
Service agreements | 6.4 | 30,100 | (13,272 | ) | 16,828 | ||||||||
Trademark | 5.1 | 11,300 | (7,000 | ) | 4,300 | ||||||||
Non-compete agreements | 4.0 | 8,000 | (5,641 | ) | 2,359 | ||||||||
Other | 4.5 | 5,750 | (1,900 | ) | 3,850 | ||||||||
Total | $ | 312,515 | $ | (208,855 | ) | $ | 103,660 | ||||||
93
The following table presents the Company's purchased intangible assets (in thousands) as of December 31, 2014:
Weighted Average Useful Life | Gross | Accumulated Amortization | Net | ||||||||||
(in years) | |||||||||||||
Other intangible assets: | |||||||||||||
Technology | 5.5 | $ | 185,665 | $ | (106,953 | ) | $ | 78,712 | |||||
Customer relationships | 6.0 | 71,700 | (40,938 | ) | 30,762 | ||||||||
Service agreements | 6.4 | 30,100 | (8,577 | ) | 21,523 | ||||||||
Trademark | 5.1 | 11,300 | (5,033 | ) | 6,267 | ||||||||
Non-compete agreements | 4.0 | 8,000 | (3,641 | ) | 4,359 | ||||||||
Other | 4.2 | 4,883 | (1,398 | ) | 3,485 | ||||||||
Total | $ | 311,648 | $ | (166,540 | ) | $ | 145,108 | ||||||
The estimated future amortization expense of purchased intangible assets as of December 31, 2015 is as follows (in thousands):
2016 | $ | 39,029 | |
2017 | 31,915 | ||
2018 | 20,657 | ||
2019 | 7,436 | ||
2020 | 3,912 | ||
Thereafter | 711 | ||
Total | $ | 103,660 | |
9. | Income Taxes |
The components of income before income taxes were (in thousands):
Year Ended December 31, | |||||||||||
2015 | 2014 | 2013 | |||||||||
U.S. | $ | (5,307 | ) | $ | (53,850 | ) | $ | (5,501 | ) | ||
Foreign | 19,650 | 1,153 | 16,303 | ||||||||
Total | $ | 14,343 | $ | (52,697 | ) | $ | 10,802 | ||||
Income tax expense (benefit) consisted of the following (in thousands):
Year Ended December 31, | |||||||||||
2015 | 2014 | 2013 | |||||||||
Current: | |||||||||||
Federal | $ | 10,150 | $ | (372 | ) | $ | 2,920 | ||||
State | 1,635 | 1,111 | 756 | ||||||||
Foreign | 4,273 | 2,538 | 1,920 | ||||||||
Deferred: | |||||||||||
Federal | (5,145 | ) | (12,479 | ) | (9,286 | ) | |||||
State | (1,044 | ) | (1,916 | ) | (1,342 | ) | |||||
Foreign | (1,477 | ) | 13 | 3,964 | |||||||
Income tax expense (benefit) | $ | 8,392 | $ | (11,105 | ) | $ | (1,068 | ) | |||
94
The net effective income tax rate differed from the federal statutory income tax rate of 35% as follows (dollars in thousands):
2015 | 2014 | 2013 | |||||||||
Federal statutory expense | $ | 5,020 | $ | (18,445 | ) | $ | 3,779 | ||||
State taxes, net of federal benefit | 269 | (805 | ) | (836 | ) | ||||||
Research and development credits | (1,177 | ) | (1,585 | ) | (5,128 | ) | |||||
Domestic production deduction | (595 | ) | — | (499 | ) | ||||||
Foreign branch losses | 90 | (1,213 | ) | — | |||||||
Stock-based compensation | 1,740 | 1,700 | 1,750 | ||||||||
Foreign rate differential | (3,240 | ) | 1,633 | (2,935 | ) | ||||||
Deemed Dividend | — | — | 817 | ||||||||
Inter-company royalty | 3,121 | 3,168 | 3,932 | ||||||||
Inter-company transfer | 1,994 | 1,841 | — | ||||||||
Valuation allowance | (1,939 | ) | — | 1,111 | |||||||
Unrecognized tax benefits | 1,160 | 1,497 | (2,106 | ) | |||||||
Other | 1,949 | 1,104 | (953 | ) | |||||||
Income tax expense (benefit) | $ | 8,392 | $ | (11,105 | ) | $ | (1,068 | ) | |||
Net effective income tax rate | 58.5 | % | 21.1 | % | (9.9 | )% | |||||
During 2015, the Company’s higher effective tax rate of 58.5% when compared to the federal statutory income tax rate was mainly due to increases to unrecognized tax benefits, non-deductible stock based compensation, and intercompany activity such as royalties and transfers. During 2014, the Company’s lower effective tax rate of 21.1% when compared to the federal statutory income tax rate was mainly due to increases to unrecognized tax benefits, and intercompany activity such as royalties and transfers. During 2013, the Company’s lower effective tax rate of (9.9)% when compared to the federal statutory income tax rate was mainly due to the R&D credits generated during 2013, tax benefit recorded for the 2012 Federal R&D credit during the first quarter of 2013 as a result of the statutory extension of the credit during 2013, and the release of reserves related to unrecognized tax benefits.
The primary components of temporary differences that gave rise to deferred taxes were as follows (in thousands):
December 31, 2015 | December 31, 2014 | ||||||
Deferred tax assets: | |||||||
Research and development credit carryforward | $ | 13,544 | $ | 13,791 | |||
Deferred revenue | 3,611 | 3,091 | |||||
Stock-based compensation | 10,674 | 9,712 | |||||
Inventory adjustments | 8,862 | 8,805 | |||||
Net operating loss carryforward | 4,939 | 6,202 | |||||
Realized loss on investments | 3,421 | 3,211 | |||||
Accrued liabilities and other | 1,056 | 4,575 | |||||
Depreciation and amortization | 958 | — | |||||
Allowance for doubtful accounts | 282 | 323 | |||||
Foreign tax credit carryforward | — | 455 | |||||
47,347 | 50,165 | ||||||
Valuation allowance | (2,056 | ) | (4,358 | ) | |||
45,291 | 45,807 | ||||||
Deferred tax liabilities: | |||||||
Depreciation and amortization | (382 | ) | (6,758 | ) | |||
Intercompany royalty | (11,852 | ) | (13,081 | ) | |||
Net deferred tax assets | $ | 33,057 | $ | 25,968 | |||
95
As of December 31, 2015 and 2014, current deferred tax assets totaled $14.5 million and $15.5 million, respectively and were included within the Prepaid Expenses and Other Current Assets line item in the Company's consolidated balance sheets. As of December 31, 2015 and 2014, long-term deferred tax assets totaled $18.9 million and $11.9 million, respectively, and were included as part of the Other Assets line item in the Company's consolidated balance sheets.
As of December 31, 2015 and 2014, long-term deferred tax liabilities totaled $0.4 million and $1.4 million, respectively and were included within the Other Liabilities line item in the Company's consolidated balance sheets.
The realizability of deferred income tax assets is based on a more likely than not standard. If it is determined that it is more likely than not that deferred income tax assets will not be realized, a valuation allowance must be established against the deferred income tax assets. As of December 31, 2015, the Company had a valuation allowance of $1.1 million for its U.S. capital loss carryovers and $1.0 million against its Australian net operating loss carryforwards.
Realization of our deferred tax assets is dependent primarily on the generation of future taxable income. In considering the need for a valuation allowance the Company considers its historical, as well as, future projected taxable income along with other positive and negative evidence in assessing the realizability of its deferred tax assets.
For the years ended December 31, 2015, 2014 and 2013, the Company recorded changes in our valuation allowance of $2.3 million, approximately $214,000, and $2.2 million, respectively. The current year change was due to the expiration of a portion of our long-term capital loss carryforward.
As of December 31, 2015, the Company has gross federal and state research and development credit carryforwards of $20.4 million and $18.7 million, respectively. The federal carryovers begin to expire in 2022, while the state carryovers have an indefinite carryover period.
At December 31, 2015, the Company has gross federal and state net operating loss (“NOLs”) carryforwards of $10.5 million and $9.5 million, respectively. The federal NOLs expire beginning 2025, and the state NOLs begin to expire in 2024. Section 382 of the Internal Revenue Code imposes an annual limitation on the utilization of net operating loss carryforwards related to acquired corporations based on a statutory rate of return (usually the “applicable federal funds rate” as defined in the Internal Revenue Code) and the value of the corporation at the time of a “change in ownership” as defined by Section 382. The Company estimates that its 2015 limitation under Section 382 of the Internal Revenue Code is approximately $3.1 million.
Cumulative undistributed earnings of foreign subsidiaries for which no deferred income taxes have been provided approximated $100.5 million and $84.8 million at December 31, 2015 and 2014, respectively. No provision for U.S. income and foreign withholding taxes has been made for unrepatriated foreign earnings because it is expected that such earnings will be reinvested indefinitely outside of the U.S. Under current tax laws and regulations, if our cash, cash equivalents or investments associated with the subsidiaries’ undistributed earnings were distributed to the United States in the form of dividends or otherwise, it would be included in our U.S. taxable income, and we would be subject to additional U.S. income taxes and foreign withholding taxes. Determination of the amount of unrecognized deferred income tax liability related to these earnings is not practicable.
At December 31, 2015, the Company had gross unrecognized tax benefits of $21.2 million. Of this total, $4.4 million (net of the federal benefit on state issues) would affect its effective tax rate if recognized. The Company classifies liabilities for unrecognized tax benefits for which we do not anticipate payment or receipt of cash within one year in noncurrent other liabilities.
The Company recognizes interest and penalties related to uncertain tax positions in income tax expense. During the years ended December 31, 2015, 2014 and 2013, the Company recognized approximately $2,000, $13,000 and $49,000, net of federal benefit, of interest within our statements of operations. The Company had accrued interest, net of federal benefit, of approximately $182,000 and $179,000 as of December 31, 2015 and December 31, 2014, respectively. The Company files income tax returns in the U.S. federal jurisdiction and in various state and foreign jurisdictions. With few minor exceptions, the Company is no longer subject to U.S. federal, state and local, or non-U.S. income tax examinations by tax authorities in material jurisdictions for the tax years ended prior to 2009. The U.S. Internal Revenue Service is currently examining the Company's 2009 through 2012 federal income tax returns. The Company is subject to income tax in many jurisdictions outside the U.S. The Company's operations in certain jurisdictions remain subject to examination, some of which are currently under audit by local tax authorities. The resolutions of these audits are not expected to be material to the Company's financial statements.
96
A reconciliation of the beginning and ending amounts of gross unrecognized tax benefits is as follows (in thousands):
2015 | 2014 | 2013 | |||||||||
Unrecognized Tax Benefits - Beginning balance | $ | 19,134 | $ | 16,766 | $ | 14,454 | |||||
Gross increases – Tax positions taken in prior period | 188 | 417 | 1,364 | ||||||||
Gross decreases – Tax positions taken in prior period | (161 | ) | (74 | ) | (264 | ) | |||||
Gross increases – Tax positions taken in current period | 2,017 | 2,167 | 2,757 | ||||||||
Lapse of statute of limitations | — | (142 | ) | (1,545 | ) | ||||||
Unrecognized Tax Benefits – ending balance | $ | 21,178 | $ | 19,134 | $ | 16,766 | |||||
10. | Commitments and Contingencies |
We lease our facilities under non-cancelable operating leases for varying periods through May 2023, excluding options to renew. Certain leases require us to pay property taxes, insurance and routine maintenance, and include escalation clauses. The following are the future minimum commitments under these leases (in thousands):
Year Ending December 31,* | |||
2016 | $ | 10,338 | |
2017 | 7,938 | ||
2018 | 6,882 | ||
2019 | 6,030 | ||
2020 | 5,329 | ||
Thereafter | 8,460 | ||
Total | $ | 44,977 | |
*Minimum payments have not been reduced by minimum sublease rentals of $0.8 million due in the future under non-cancelable subleases.
Rent expense for the years ended December 31, 2015, 2014 and 2013 was approximately $8.9 million, $13.7 million and $9.9 million, respectively.
Securities Class Action
On November 14, 2013, a purported securities class action complaint captioned Felix Santore v. Ixia, Victor Alston, Atul Bhatnagar, Thomas B. Miller, and Errol Ginsberg was filed against us and certain of our current and former officers and directors in the U.S. District Court for the Central District of California. The lawsuit purports to be a class action brought on behalf of purchasers of the Company’s securities during the period from April 10, 2010 through October 14, 2013. The initial complaint alleged that the defendants violated the Securities Exchange Act of 1934, as amended (the “Exchange Act”), by making materially false and misleading statements concerning the Company’s recognition of revenues related to its warranty and software maintenance contracts and the academic credentials and employment history of the Company’s former President and Chief Executive Officer, Victor Alston. The complaint also alleged that the defendants made false and misleading statements, and failed to make certain disclosures, regarding the Company’s business, operations and prospects, including regarding the financial statements and internal financial controls that were the subject of the Company’s April 2013 restatement of certain of its prior period financial statements. The complaint further alleged that the Company lacked adequate internal financial controls and issued materially false and misleading financial statements for the fiscal years ended December 31, 2010 and 2011, and the fiscal quarters ended March 31, 2011, June 30, 2011, September 30, 2011, March 31, 2012, June 30, 2012, and September 30, 2012. The complaint, which purported to assert claims for violations of Sections 10(b) and 20(a) of the Exchange Act and Rule 10b-5 promulgated thereunder, sought, on behalf of the purported class, an unspecified amount of monetary damages, interest, fees and expenses of attorneys and experts, and other relief.
97
On March 24, 2014, following a proceeding to select a lead plaintiff in the matter, the court issued an order appointing Oklahoma Firefighters Pension & Retirement System and Oklahoma Law Enforcement Retirement System (the “Oklahoma Group”) as lead plaintiffs.
On June 11, 2014, the Oklahoma Group filed a first amended complaint, which asserted claims against the same defendants under the same legal theories set forth in the initial complaint. The first amended complaint also contained allegations that certain of the individual defendants increased their trading in the Company’s stock during February, March, April and May of 2011 and during February and March of 2013, and that the defendants sought to inflate the Company’s reported deferred revenues during the period of February 4, 2011 through April 3, 2013.
On July 18, 2014, all named defendants moved to dismiss the first amended complaint for failure to state a claim under the Federal Rules of Civil Procedure and the Private Securities Law Reform Act of 1995 (“PSLRA”). After briefing and a hearing on October 6, 2014, the court issued an order dismissing the first amended complaint in its entirety without prejudice. The court gave the Oklahoma Group 30 days in which to file an amended complaint.
On November 5, 2014, the Oklahoma Group filed a second amended complaint. On January 6, 2015, the named defendants moved to dismiss the second amended complaint. After briefing and a hearing on April 13, 2015, the court issued an order dismissing the second amended complaint in its entirety without prejudice. The court gave the Oklahoma Group 30 days in which to file an amended complaint.
On April 24, 2015, the court issued an order staying the class action until July 31, 2015, pending the outcome of a voluntary, non-binding mediation scheduled for July 23, 2015 to explore a possible settlement of both the purported securities class action and the shareholder derivative action discussed below. On July 23, 2015, the parties conducted the scheduled mediation with respect to the purported class action but did not reach an agreement to resolve and settle the litigation. However, settlement discussions continued after the mediation session, and on August 14, 2015, the parties agreed in principle to settle the purported securities class action litigation.
On November 17, 2015, the Company entered into a Stipulation and Agreement of Settlement, dated November 11, 2015 relating to the proposed settlement of the class action (the “Class Action Settlement Agreement”). This Class Action Settlement Agreement would resolve all of the claims asserted against the defendants in the Class Action and was entered into subject to the Court’s preliminary and final approval. The Class Action Settlement provides, among other terms, for a settlement payment of $3.5 million, which the Company expects would be paid in full by one of the Company’s insurance carriers. The Class Action Settlement Agreement does not include any admission of wrongdoing or liability on the part of the Company or the individual defendants, and upon final approval of the settlement by the Court, provides for a dismissal of, and a release of all claims asserted against the defendants in, the class action. At a hearing on February 26, 2016, the Court stated that it will grant preliminary approval of the Class Action Settlement Agreement—subject to the Court’s issuance of a formal order evidencing such preliminary approval—and scheduled a hearing for July 29, 2016 to consider the final approval of the Class Action Settlement Agreement.
The Company has accrued a liability of $3.5 million related to this matter as a component of Accrued expenses and other in the accompanying consolidated balance sheets as of December 31, 2015. The Company has also recorded an offsetting receivable for $3.5 million in Prepaid expenses and other current assets in the accompanying consolidated balance sheets as of December 31, 2015, as the Company deems recovery of the related insurance proceeds probable.
Shareholder Derivative Action
A consolidated shareholder derivative action, captioned In re Ixia Shareholder Derivative Litigation, is pending in the U.S. District Court for the Central District of California. This action is the consolidation of two lawsuits, namely: (i) Erie County Employees' Retirement System, Derivatively on behalf of Nominal Defendant Ixia v. Victor Alston, Errol Ginsberg, Laurent Asscher, Jonathan Fram, Gail Hamilton, Jon Rager, Atul Bhatnagar, and Thomas B. Miller, defendants, and Ixia, nominal defendant and (ii) Colleen Witmer, derivatively on behalf of Ixia v. Victor Alston, Atul Bhatnagar, Thomas B. Miller, Errol Ginsberg, Jonathan Fram, Laurent Asscher, Gail Hamilton, Jon F. Rager, Christopher Lee Williams, Alan Grahame, Raymond De Graaf, Walker H. Colston II, and Ronald W. Buckly, defendants, and Ixia, nominal defendant. Both were filed in the U.S. District Court for the Central District of California in May 2014.
98
Co-lead plaintiffs Erie County Employees’ Retirement System and Colleen Witmer filed a consolidated complaint on September 2, 2014. The consolidated complaint includes many allegations similar to those made in the purported class action complaint described above. Among other things, the complaint alleges that some or all (depending upon the claim) of the individual defendants breached their fiduciary duties to the Company by causing or allowing the Company to disseminate misleading financial statements, ignoring problems with the Company’s financial controls, making stock sales on the basis of material non-public information, and violating the Company’s code of conduct. As relief, among other things, the complaint seeks an unspecified amount of monetary damages, disgorgement and restitution of stock sale proceeds and an award under California Corporations Code Sections 24502 and 25502.5, as well as unspecified equitable and declaratory relief.
On October 15, 2014, the Company, on whose behalf the derivative action claims are purportedly brought, moved to dismiss the consolidated complaint on the grounds that the derivative plaintiffs did not file the claims in accordance with applicable laws governing the filing of derivative actions. The individual defendants joined in that motion and also filed motions to dismiss the claims against them for failure to state a claim. Before any ruling by the court on those motions, the plaintiffs filed an amended consolidated complaint on January 26, 2015. On March 12, 2015, the Company filed a motion to dismiss the amended consolidated complaint on the same grounds as it had set forth with respect to the first consolidated complaint, and the individual defendants joined in that motion and also filed motions to dismiss the claims against them for failure to state a claim. On April 24, 2015, before the scheduled hearing on the motion to dismiss, the Court issued an order staying the shareholder derivative action until July 31, 2015, pending the outcome of a voluntary, non-binding mediation scheduled for July 23, 2015 in connection with both the derivative action and the purported securities class action discussed above.
On July 23, 2015, the parties participated in the scheduled voluntary, non-binding mediation with respect to the derivative action and agreed in principle to resolve and settle the litigation. On November 17, 2015, the Company entered into a Stipulation and Agreement of Settlement, dated November 17, 2015, relating to the proposed settlement of the derivative action (the “Derivative Action Settlement Agreement”). The Derivative Action Settlement Agreement would resolve all of the claims asserted against the defendants in the derivative action and was entered into subject to preliminary and final approval by the Court. The Derivative Action Settlement Agreement provides, among other terms, for the Company to implement certain corporate governance measures and for the plaintiffs' counsel to apply to the Court for an award of attorneys’ fees and expenses in an amount of up to $575,000. The Company expects that any fees and expenses awarded by the Court to the plaintiffs' counsel will be paid by one of the Company’s insurance carriers. The Derivative Action Settlement Agreement does not include any admission of wrongdoing or liability on the part of the Company or the individual defendants and provides for a dismissal of, and a release of all claims asserted against the defendants in, the derivative action. At a hearing on February 26, 2016, the Court stated that it will grant preliminary approval of the Derivative Action Settlement Agreement—subject to the Court’s issuance of a formal order evidencing such preliminary approval—and scheduled a hearing for May 27, 2016 to consider the final approval of the Derivative Action Settlement Agreement.
The Company has accrued a liability of $575,000 related to this matter as a component of Accrued expenses and other in the accompanying consolidated balance sheets as of December 31, 2015. The Company has also recorded an offsetting receivable for $575,000 in Prepaid expenses and other current assets in the accompanying consolidated balance sheets as of December 31, 2015, as the Company deems recovery of the related insurance proceeds probable.
SEC Investigation
In July 2014, the Staff of the SEC’s Division of Enforcement (the “Staff”) requested that the Company produce certain documents and information in connection with an investigation of the Company. The SEC subsequently issued subpoenas to the Company seeking certain additional documents and to certain of the Company’s current and former employees seeking certain documents and their testimony. Based on the documents requested by the Staff, the Company believes that the SEC’s investigation relates to the matters addressed by (i) the previously disclosed accounting-related investigation conducted by the Audit Committee of the Company’s Board of Directors (the “Board”) that was completed in February 2014, and (ii) a separate internal investigation conducted by a Special Committee of the Board of stock sales during February and March 2013 by then current executive officers and directors of the Company. The Special Committee, which completed its investigation in June 2014, did not find with respect to such sales that there had been any insider trading based upon material non-public information. The Special Committee, however, made no finding with respect to the Company's former President and Chief Executive Officer, Victor Alston, because he declined to be interviewed by the Special Committee's counsel (both the Special Committee and the Audit Committee were assisted by independent counsel in their investigations).
99
The Company is continuing to cooperate fully with the SEC in its investigation and is in discussions with the Staff concerning a proposed settlement of the investigation as it pertains to the Company. Based on oral communications with the Staff, the Company understands that the proposed settlement would require the Company, without admitting or denying any allegations by the SEC, to consent to the SEC’s issuance of an administrative order with non-fraud charges involving violations of Section 13 of the Exchange Act and rules promulgated by the SEC thereunder. The Company understands that the charges would relate to the Company’s books and records, internal controls, and disclosures (not including financial statements) for the year ended December 31, 2012, and books and records, internal controls, and disclosures (including financial statements) for the first and second quarters of 2013. The Company would be required to pay a civil penalty in the amount of $750,000. The proposed settlement is subject to the Company’s receipt of, and agreement to, written settlement documentation from the Staff. In the event the Company and the Staff agree on such documentation, the settlement would then be subject to approval by the SEC Commissioners, and there can be no assurance that the SEC Commissioners would approve the proposed settlement. The proposed settlement would resolve Ixia’s potential liability with respect to the SEC investigation. Current or former employees, officers, and/or directors of the Company are not addressed by this proposed settlement.
The Company has accrued a liability of $750,000 related to this matter as a component of Accrued expenses and other in the accompanying consolidated balance sheets as of December 31, 2015.
Indemnifications
In the normal course of business, the Company provides certain indemnifications, commitments and guarantees of varying scope to customers, including against claims of intellectual property infringement made by third parties arising from the use of the Company's products. The Company also has certain obligations to indemnify its officers, directors and employees for certain events or occurrences while the officers, directors or employees are or were serving at the Company's request in such capacity. The duration of these indemnifications, commitments and guarantees varies and in certain cases is indefinite. Many of these indemnifications, commitments and guarantees do not provide for any limitation of the maximum potential future payments that the Company could be obligated to make. However, the Company's director and officer insurance policy may enable it to recover a portion of any future payments related to its officer, director or employee indemnifications. Historically, costs related to these indemnifications, commitments and guarantees have not been significant. With the exception of the product warranty accrual associated with the Company's initial standard warranty, no liabilities have been recorded for these indemnifications, commitments and guarantees.
11. | Shareholders’ Equity |
Stock Award Plans
Second Amended and Restated Ixia 2008 Equity Incentive Plan
The Company's Second Amended and Restated Ixia 2008 Equity Incentive Plan, as amended (the “2008 Plan” or the “Plan”), provides for the issuance of share-based awards to its eligible employees, directors and consultants. The share-based awards may include incentive stock options ("ISO"), non-statutory stock options, stock appreciation rights, restricted stock units ("RSU"), or restricted stock awards. Options become exercisable over a vesting period as determined by the Board of Directors and expire over terms not exceeding 7 years from the date of grant. The exercise price for options granted under the 2008 Plan may not be granted at less than 100% of the fair market value of our common stock on the date of grant (110% for ISOs granted to an employee who owns more than 10% of the voting shares of the outstanding stock). Options generally vest over a four-year period. In the event the holder ceases to be employed by us, all unvested options are forfeited and all vested options may be exercised within a period of up to 90 days after termination other than (i) for termination for cause for which the vested options are forfeited on the termination date or (ii) as a result of death or disability for which vested options may be exercised for up to 180 days after termination. The 2008 Plan will terminate in May 2018, unless terminated sooner by the Board of Directors.
100
In June 2013, our shareholders approved the Second Amended and Restated Ixia 2008 Equity Incentive Plan, which resulted in amendments to the Company's Amended and Restated Ixia 2008 Equity Incentive Plan, as amended, which include the following:
• | Increase in Share Reserve. Increased the total number of shares of the Company's common stock available for future grants by 9.8 million shares for a total of 29.0 million shares of our common stock authorized and reserved over the term of the Plan, of which 8.7 million shares were available for future grant as of December 31, 2015. |
• | Types of Awards. Added cash awards to the types of awards that may be granted under the Plan, including performance-based incentives that are intended to comply with Section 162(m) of the Internal Revenue Code of 1986, as amended (the “Code”). |
• | Award Limits. Added (i) a limit on the total number of shares (i.e., 1,000,000) subject to options and share appreciation rights granted to an eligible participant in any calendar year, (ii) with respect to performance-based awards that are intended to comply with the exception under Section 162(m) of the Code, limits on the total number of shares (i.e., 1,000,000) subject to RSUs and restricted stock awards that an individual may earn over a 12-month period and on the total dollar amount (i.e., $2,000,000) subject to cash awards that an individual may earn over a 12-month period, and (iii) a limit (i.e., $500,000) on the total dollar value of equity and cash awards that may be granted to a non-employee director in any calendar year. |
The Plan also provides for the following:
• | Shares Not Available for Awards. None of the following will be added to the shares available for awards under the Plan: (i) shares tendered by a participant or withheld by us in payment of the exercise price of an option, or to satisfy any tax withholding obligation with respect to options, and (ii) shares reacquired by the Company on the open market using cash proceeds from the exercise of options. |
• | Acquisitions and Combinations. In connection with acquisitions and combinations by the Company, it may grant under the Plan awards in substitution or exchange for awards or rights to future awards previously granted by the acquired or combined company without reducing the shares available under the Plan. Any shares subject to but not issued under any such substitute awards would not become available for other awards granted under the Plan. Also, in the event that a company acquired by the Company or with which the Company combined has a pre-existing plan approved by its shareholders that was not adopted in contemplation of the acquisition or combination, available shares under that plan may be used for Plan awards without reducing the shares available under the Plan. Any such awards may only be made to persons who were not eligible to receive awards under the Plan prior to the acquisition or combination and may not be made after the date that awards could have been made under the terms of the pre-existing plan. |
The following table summarizes stock option activity for the year ended December 31, 2015 (in thousands, except per share and contractual life data):
Number of Options | Weighted Average Exercise Price Per Share | Weighted Average Remaining Contractual Life (in years) | Aggregate Intrinsic Value | |||||||||
Outstanding as of December 31, 2014 | 5,396 | $ | 12.11 | 4.62 | $ | 7,075 | ||||||
Granted | 1,198 | 12.29 | ||||||||||
Exercised | (527 | ) | 9.18 | |||||||||
Forfeited/canceled | (593 | ) | 15.06 | |||||||||
Outstanding as of December 31, 2015 | 5,474 | $ | 12.11 | 4.35 | $ | 9,350 | ||||||
Vested and expected to vest as of December 31, 2015 | 5,319 | $ | 12.14 | 4.30 | $ | 9,079 | ||||||
Exercisable at December 31, 2015 | 3,290 | $ | 12.62 | 3.37 | $ | 5,584 | ||||||
101
The weighted average grant-date fair value of options granted for the years ended December 31, 2015, 2014 and 2013 was $4.21, $3.36 and $6.92 per share, respectively. The total intrinsic value of options exercised during the years ended December 31, 2015, 2014 and 2013 was $2.3 million, $1.1 million and $12.5 million, respectively. As of December 31, 2015, the remaining unrecognized compensation expense related to stock options is expected to be recognized over a weighted average period of 1.42 years.
The following table summarizes RSU activity for the year ended December 31, 2015 (in thousands, except per share data):
Number of Awards | Weighted Average Grant Date Fair Value Per Share | |||||
Outstanding as of December 31, 2014 | 1,923 | $ | 13.02 | |||
Awarded | 1,140 | 13.14 | ||||
Vested | (719 | ) | 12.49 | |||
Forfeited/canceled | (381 | ) | 16.46 | |||
Outstanding as of December 31, 2015 | 1,963 | $ | 12.63 | |||
The fair value of RSUs vested during the year ended December 31, 2015 was $9.1 million. The weighted average remaining contractual life and expense recognition period of the outstanding RSUs as of December 31, 2015 was 1.48 years.
Employee Stock Purchase Plan
During 2010, the Company's shareholders approved the 2010 Employee Stock Purchase Plan (the “Purchase Plan”). The Purchase Plan permits eligible employees to purchase our common stock, subject to limitations as set forth in the Purchase Plan, through payroll deductions which may not exceed the lesser of 20% of an employee’s compensation or $21,250 per annum. The Purchase Plan is implemented in a series of consecutive, overlapping 24-month offering periods, with each offering period consisting of four six-month purchase periods. Offering periods begin on the first trading day on or after May 1 and November 1 of each year. During each 24-month offering period under the Purchase Plan, participants accumulate payroll deductions which on the last trading day of each six-month purchase period within the offering period are applied toward the purchase of shares of our common stock at a purchase price equal to 85% of the lower of (i) the fair market value of a share of the Company's common stock as of the first trading day of the 24-month offering period and (ii) the fair market value of a share of the Company's common stock on the last trading day of the six-month purchase period. The third 24-month offering period under the Purchase Plan began on November 1, 2014 and will end on October 31, 2016. The Purchase Plan provides the potential for an automatic annual increase of up to 500,000 in the number of shares reserved for issuance under the Purchase Plan on May 1 of each year during the ten-year term of the plan. The Purchase Plan will terminate in March 2020, unless it is earlier terminated by the Board of Directors.
In June 2013, our shareholders approved a 2,000,000 share increase in the number of shares of our common stock authorized and reserved for issuance under our Purchase Plan. During May 2013, the number of shares authorized and reserved for issuance under the Purchase Plan was also increased by an additional 500,000 shares pursuant to the automatic annual increase provision of the Purchase Plan.
During November 2014 and October 2015, the number of shares authorized and reserved for issuance under the Purchase Plan was increased by an additional 500,000 shares, respectively, pursuant to the automatic annual increase provision of the Purchase Plan.
We have reserved a total of 4,800,000 shares of common stock for issuance under the Purchase Plan, of which 1,490,663 shares are available for future issuance for the existing and future offering periods. For the years ended December 31, 2015, 2014 and 2013, approximately 988,000, 685,000 and 918,000 shares, respectively, were issued under the Purchase Plan.
102
Stock-Based Compensation Expense
The Black-Scholes option-pricing model is used to calculate the estimated fair value of share-based awards for options and RSUs on the respective dates of grant for accounting purposes using the following weighted average assumptions:
Year Ended December 31, | ||||||||
2015 | 2014 | 2013 | ||||||
Expected lives (in years) | 3.9 | 4.0 | 3.6 | |||||
Risk-free interest rates | 1.2 | % | 1.2 | % | 0.6 | % | ||
Dividend yield | — | % | — | % | — | % | ||
Expected volatility | 43.3 | % | 46.7 | % | 48.9 | % | ||
The Black-Scholes option-pricing model is used to calculate the estimated fair value of share-based awards for our Purchase Plan for accounting purposes using the following weighted average assumptions:
Year Ended December 31, | |||||
2015 | 2014 | ||||
Expected lives (in years) | 1.25 | 1.20 | |||
Risk-free interest rates | 0.4 | % | 0.2 | % | |
Dividend yield | — | % | — | % | |
Expected volatility | 28.4 | % | 32.9 | % | |
Expected lives (in years) - The expected life was determined by estimating the expected option life, using historical data.
Risk-free interest rates - The risk-free interest rate for periods equal to the expected term of the option is based on the U.S. Treasury yield curve in effect at the time of grant.
Dividend yield - We have never declared or paid cash dividends on our common stock and do not anticipate paying any dividends in the foreseeable future.
Volatility - The stock volatility is determined based on the weighted average historical weekly price changes of our common stock over the expected option term.
Our stock-based compensation by award type is as follows (in thousands):
Year Ended December 31, | |||||||
2015 | 2014 | ||||||
Options | $ | 5,032 | $ | 3,934 | |||
RSUs | 10,078 | 9,328 | |||||
Common shares issued under the Purchase Plan | 3,866 | 3,257 | |||||
Total stock-based compensation | $ | 18,976 | $ | 16,519 | |||
The aggregate balance of gross unrecognized stock-based compensation to be expensed in the years 2016 through 2020 related to all unvested share-based awards as of December 31, 2015 was $20.4 million. There was no capitalized stock-based compensation for any of the periods presented.
103
Share Cancellation
Certain of the Company’s performance-based equity awards include a forfeiture provision that provides for the forfeiture of the unvested portion of such equity awards in the event that the Company concludes that it is required to restate its previously issued financial statements to reflect a less favorable financial condition and/or less favorable results of operations. On April 2, 2013, the Company concluded to restate certain previously issued consolidated financial statements and, due to such forfeiture provisions, we have for accounting purposes deemed such equity awards to have been automatically forfeited in 2013 and subsequently re-granted in either 2013 or 2014, as applicable. As a result, we recorded a reversal of stock-based compensation for the deemed cancellation of $4.0 million for the quarter ended June 30, 2013 and additional stock-based compensation for the deemed 2013 re-grant of certain of such awards of $3.7 million for the year ended December 31, 2013.
On June 24, 2014, certain performance-based equity awards that, for accounting purposes, were deemed to have been automatically forfeited in 2013 as a result of the aforementioned restatement were deemed to have been re-granted. As a result, we recorded additional stock-based compensation related to these deemed re-grants. Stock-based compensation for all of the deemed re-grants was approximately $84,000 and $908,000 for years ended December 31, 2015 and December 31, 2014, respectively.
Accumulated Other Comprehensive Loss
The following table summarizes, as of each balance sheet date, the changes in the Company's accumulated other comprehensive loss, by component, net of income taxes (in thousands):
Gains and Losses on Available-for- Sale Securities (a) | Foreign Currency Items (a) | Total | |||||||||
Beginning balance, December 31, 2013 | $ | 42 | $ | (419 | ) | $ | (377 | ) | |||
Other comprehensive loss before reclassifications | (22 | ) | (342 | ) | (364 | ) | |||||
Amounts reclassified from accumulated other comprehensive loss (b) | (52 | ) | — | (52 | ) | ||||||
Net current-period other comprehensive loss | (74 | ) | (342 | ) | (416 | ) | |||||
Ending balance, December 31, 2014 | $ | (32 | ) | $ | (761 | ) | $ | (793 | ) | ||
Other comprehensive loss before reclassifications | (76 | ) | (184 | ) | (260 | ) | |||||
Amounts reclassified from accumulated other comprehensive loss (b) | 20 | — | 20 | ||||||||
Net current-period other comprehensive loss | (56 | ) | (184 | ) | (240 | ) | |||||
Ending balance, December 31, 2015 | $ | (88 | ) | $ | (945 | ) | $ | (1,033 | ) | ||
(a) | All amounts are net-of-tax. Amounts in parentheses indicate reductions. |
(b) | Amount represents gain on the sale of securities and is included as a component of Interest income and other, net in the consolidated statements of operations. |
Other Comprehensive Income (Loss)
The Company sold available-for-sale securities in the year ended December 31, 2015 which resulted in a gross reclassification from accumulated other comprehensive loss for realized gains of approximately $32,000, which was included within its Interest income and other, net line item in our consolidated statements of operations. This realized gain, along with the related tax impact for the year ended December 31, 2015 of approximately $12,000 was reclassified from accumulated other comprehensive loss.
Prior to the reclassification for the sale of available-for-sale securities, the Company had a net unrealized loss of approximately $125,000 for the year ended December 31, 2015. The tax impact on the unrealized loss was a benefit of approximately $49,000 for the year ended December 31, 2015.
The Company sold available-for-sale securities in the year ended December 31, 2014 which resulted in a gross reclassification from accumulated other comprehensive loss for realized gains of $85,000, which was included within the Company's Interest income and other, net line item on its consolidated statements of operations. This realized gain, along with the related tax impact for the year ended December 31, 2014 of $33,000 was reclassified from accumulated other comprehensive loss.
104
Prior to the reclassification for the sale of available-for-sale securities, the Company had a net unrealized loss of $36,000 for the year ended December 31, 2014. The tax impact for the unrealized gain was an expense of approximately $14,000 for the year ended December 31, 2014.
Stock Buyback Program
On February 23, 2016, the Company announced a stock buyback program to repurchase up to $25 million of its common stock.
12. | Retirement Plan |
The Company provides a 401(k) Retirement Plan (the “Plan”) to eligible employees who may authorize contributions up to IRS annual deferral limits to be invested in employee elected investment funds. As determined annually by the Board of Directors, the Company may contribute matching funds of 50% of the employee contributions up to $2,500. These matching contributions vest based on the employee’s years of service with the Company. For the years ended December 31, 2015, 2014 and 2013, the Company expensed and made contributions to the Plan in the amount of $3.0 million, $1.6 million and $1.5 million, respectively.
13. | Earnings Per Share |
The following table sets forth the computation of basic and diluted earnings (loss) per share for the periods indicated (in thousands, except per share data):
Year Ended December 31, | |||||||||||
2015 | 2014 | 2013 | |||||||||
Basic Presentation: | |||||||||||
Numerator for basic earnings (loss) per share: | |||||||||||
Net income (loss) | $ | 5,951 | $ | (41,592 | ) | $ | 11,870 | ||||
Denominator for basic earnings (loss) per share: | |||||||||||
Weighted average common shares outstanding | 79,633 | 77,629 | 75,757 | ||||||||
Basic earnings (loss) per share | $ | 0.07 | $ | (0.54 | ) | $ | 0.16 | ||||
Diluted presentation: | |||||||||||
Numerator for diluted earnings (loss) per share: | |||||||||||
Net income (loss) | $ | 5,951 | $ | (41,592 | ) | $ | 11,870 | ||||
Denominator for diluted earnings (loss) per share: | |||||||||||
Weighted average common shares outstanding | 79,633 | 77,629 | 75,757 | ||||||||
Effect of dilutive securities: | |||||||||||
Stock options and other share-based awards | 1,826 | — | 1,756 | ||||||||
Dilutive potential common shares | 81,459 | 77,629 | 77,513 | ||||||||
Diluted earnings (loss) per share | $ | 0.07 | $ | (0.54 | ) | $ | 0.15 | ||||
The diluted earnings per share computation for the year ended December 31, 2015 excluded (i) the weighted average number of shares underlying the Company's convertible senior notes of 8.4 million shares, as they are considered anti-dilutive because the related interest expense on a per common share “if converted” basis exceeds basic earnings per share, and (ii) the weighted average number of shares underlying the Company's employee stock options and other share-based awards of 2.6 million shares, which were anti-dilutive because the exercise price of these awards exceeded the average closing sales price per share of the Company's common stock.
The diluted loss per share computation for the year ended December 31, 2014, excluded (i) the weighted average number of shares underlying the Company's then-outstanding convertible senior notes of 10.3 million shares, as they are considered anti-dilutive because the related interest expense on a per common share “if converted” basis exceeds basic (loss) earnings per share, and (ii) the weighted average number of shares underlying our employee stock options and other share-based awards of 4.7 million shares, which were anti-dilutive because, the Company reported a net loss for the year ended December 31, 2014.
105
The diluted earnings per share computation for the year ended December 31, 2013, excluded (i) the weighted average number of shares underlying our then outstanding convertible senior notes of 10.3 million shares, as they are considered anti-dilutive because the related interest expense on a per common share “if converted” basis exceeds basic earnings per share, and (ii) the weighted average number of shares underlying our employee stock options and other share-based awards of 2.2 million shares, which were anti-dilutive because, in general, the exercise price of these awards exceeded the average closing sales price per share of our common stock.
14. | Quarterly Financial Summary (Unaudited) |
For the three months ended | |||||||||||||||||||||||||||||||
2015 | 2014 | ||||||||||||||||||||||||||||||
Dec. 31 | Sep. 30 | Jun. 30 | Mar. 31 | Dec. 31 | Sep. 30 | Jun. 30 | Mar. 31 | ||||||||||||||||||||||||
(in thousands) | |||||||||||||||||||||||||||||||
Consolidated Statement of Operations Data: | |||||||||||||||||||||||||||||||
Total revenues | $ | 138,478 | $ | 125,887 | $ | 131,610 | $ | 120,962 | $ | 127,206 | $ | 113,997 | $ | 109,522 | $ | 113,733 | |||||||||||||||
Total cost of revenues (1) | 35,697 | 33,913 | 34,983 | 35,001 | 36,080 | 34,647 | 35,691 | 37,483 | |||||||||||||||||||||||
Gross profit | 102,781 | 91,974 | 96,627 | 85,961 | 91,126 | 79,350 | 73,831 | 76,250 | |||||||||||||||||||||||
Income (loss) before income taxes | 12,309 | 506 | 6,574 | (5,046 | ) | 68 | (10,364 | ) | (20,282 | ) | (22,119 | ) | |||||||||||||||||||
Net income (loss) | 5,751 | 4,008 | 5,803 | (9,611 | ) | 286 | (7,329 | ) | (15,077 | ) | (19,472 | ) | |||||||||||||||||||
Earnings (loss) per share: | |||||||||||||||||||||||||||||||
Basic | $ | 0.07 | $ | 0.05 | $ | 0.07 | $ | (0.12 | ) | $ | — | $ | (0.09 | ) | $ | (0.19 | ) | $ | (0.25 | ) | |||||||||||
Diluted | $ | 0.07 | $ | 0.05 | $ | 0.07 | $ | (0.12 | ) | $ | — | $ | (0.09 | ) | $ | (0.19 | ) | $ | (0.25 | ) | |||||||||||
(1) | For the quarters ended December 31, 2015; September 30, 2015; June 30, 2015; March 31, 2015; December 31, 2014; September 30, 2014; June 30, 2014; and March 31, 2014; total cost of revenues includes charges related to amortization of intangible assets of $6.4 million, $6.4 million, $6.4 million, $6.4 million, $6.4 million, $6.4 million, $7.9 million, and $8.1 million, respectively. |
106
EXHIBIT INDEX
Exhibit No. | Description | |
10.5.1* | Ixia Officer Severance Plan (as Amended and Restated effective February 12, 2016) | |
10.8* | Compensation of Named Executive Officers as of December 31, 2015 | |
10.19* | Employment Separation Agreement effective January 28, 2016 between the Company and Ronald W. Buckly | |
10.20* | Employment Offer Letter Agreement dated February 19, 2015 between the Company and Hans-Peter Klaey | |
21.1 | Subsidiaries of the Registrant | |
23.1 | Consent of Deloitte & Touche LLP, Independent Registered Public Accounting Firm | |
31.1 | Certification of Chief Executive Officer of Ixia pursuant to Section 302 of the Sarbanes-Oxley Act of 2002 | |
31.2 | Certification of Chief Financial Officer of Ixia pursuant to Section 302 of the Sarbanes-Oxley Act of 2002 | |
32.1 | Certifications of Chief Executive Officer and Chief Financial Officer of Ixia pursuant to Rule 13a-14(b) under the Exchange Act and 18 U.S.C. Section 1350, as adopted pursuant to Section 906 of the Sarbanes-Oxley Act of 2002 | |
101.INS | XBRL Instance Document | |
101.SCH | XBRL Taxonomy Extension Schema Document | |
101.CAL | XBRL Taxonomy Calculation Linkbase Document | |
101.LAB | XBRL Taxonomy Label Linkbase Document | |
101.PRE | XBRL Taxonomy Presentation Linkbase Document | |
101.DEF | XBRL Taxonomy Extension Definition Document | |
* | Constitutes a management contract or compensatory plan or arrangement required to be filed as an exhibit to this Annual Report on Form 10-K. |
107