Attached files
| file | filename |
|---|---|
| EX-12.1 - EXHIBIT 12.1 - FLUIDIGM CORP | exhibit121-ratioofearnings.htm |
| EX-32.1 - EXHIBIT 32.1 - FLUIDIGM CORP | exhibit32110k2015.htm |
| EX-23.2 - EXHIBIT 23.2 - FLUIDIGM CORP | exhibit232-eyconsent2015.htm |
| EX-31.1 - EXHIBIT 31.1 - FLUIDIGM CORP | exhibit31110k2015.htm |
| EX-32.2 - EXHIBIT 32.2 - FLUIDIGM CORP | exhibit32210k2015.htm |
| EX-31.2 - EXHIBIT 31.2 - FLUIDIGM CORP | exhibit31210k2015.htm |
| EX-23.1 - EXHIBIT 23.1 - FLUIDIGM CORP | exhibit231-pwcconsent.htm |
UNITED STATES
SECURITIES AND EXCHANGE COMMISSION
Washington, D.C. 20549
______________________________________
FORM 10-K
(Mark One)
x ANNUAL REPORT PURSUANT TO SECTION 13 OR 15(d) OF THE SECURITIES EXCHANGE ACT OF 1934
For the fiscal year ended December 31, 2015
Or
¨ TRANSITION REPORT PURSUANT TO SECTION 13 OR 15(d) OF THE SECURITIES EXCHANGE ACT OF 1934
For the transition period from to
Commission file number: 001-34180
______________________________________
FLUIDIGM CORPORATION
(Exact name of registrant as specified in its charter)
Delaware | 77-0513190 | |
(State or other jurisdiction of incorporation or organization) | (I.R.S. Employer Identification Number) | |
7000 Shoreline Court, Suite 100
South San Francisco, California 94080
(Address of principal executive offices) (Zip Code)
(650) 266-6000
Registrant’s telephone number, including area code
Securities registered pursuant to Section 12(b) of the Act:
Title of each class | Name of each exchange on which registered | |
Common Stock, $0.001 Par Value per Share | The NASDAQ Global Select Market | |
Securities registered pursuant to Section 12(g) of the Act:
None
______________________________________
Indicate by check mark if the registrant is a well-known seasoned issuer, as defined in Rule 405 of the Securities Act of 1933, as amended. Yes ¨ No x
Indicate by check mark if the registrant is not required to file reports pursuant to Section 13 or Section 15(d) of the Securities Exchange Act of 1934, as amended. Yes ¨ No x
Indicate by check mark whether the registrant (1) has filed all reports required to be filed by Section 13 or 15(d) of the Securities Exchange Act of 1934 during the preceding 12 months (or for such shorter period that the registrant was required to file such reports), and (2) has been subject to such filing requirements for the past 90 days. Yes x No ¨
Indicate by check mark whether the registrant has submitted electronically and posted on its corporate Web site, if any, every Interactive Data File required to be submitted and posted pursuant to Rule 405 of Regulation S-T during the preceding 12 months (or for such shorter period that the registrant was required to submit and post such files). Yes x No ¨
Indicate by check mark if disclosure of delinquent filers pursuant to Item 405 of Regulation S-K is not contained herein, and will not be contained, to the best of the registrant’s knowledge, in definitive proxy or information statements incorporated by reference in Part III of this Form 10-K or any amendment to this Form 10-K. x
Indicate by check mark whether the registrant is a large accelerated filer, an accelerated filer, a non-accelerated filer, or a smaller reporting company. See the definitions of “large accelerated filer,” “accelerated filer” and “smaller reporting company” in Rule 12b-2 of the Exchange Act.
Large accelerated filer | x | Accelerated filer | ¨ | |||
Non-accelerated filer | ¨ (Do not check if a smaller reporting company) | Smaller reporting company | ¨ | |||
Indicate by check mark whether the registrant is a shell company (as defined in Rule 12b-2 of the Exchange Act). Yes ¨ No x
As of June 30, 2015, the last business day of the registrant’s most recently completed second fiscal quarter, the aggregate market value of voting and non-voting common equity held by non-affiliates of the registrant was approximately $695,502,434 (based on a closing sale price of $24.20 per share as reported for the NASDAQ Global Select Market on June 30, 2015).
The number of shares of the registrant’s common stock, $0.001 par value per share, outstanding as of February 10, 2016 was 28,844,206.
______________________________________
DOCUMENTS INCORPORATED BY REFERENCE
The information called for by Part III of this Annual Report on Form 10-K will be included in an amendment to this Form 10-K or incorporated by reference from the registrant’s definitive Proxy Statement relating to its 2016 Annual Meeting of Stockholders.
Fluidigm Corporation
Fiscal Year 2015
Form 10-K
Annual Report
______________________________________
TABLE OF CONTENTS
Page | ||||
PART I | ||||
ITEM 1. | ||||
ITEM 1A. | ||||
ITEM 1B. | ||||
ITEM 2. | ||||
ITEM 3. | ||||
ITEM 4. | ||||
PART II | ||||
ITEM 5. | ||||
ITEM 6. | ||||
ITEM 7. | ||||
ITEM 7A. | ||||
ITEM 8. | ||||
ITEM 9. | ||||
ITEM 9A. | ||||
ITEM 9B. | ||||
PART III | ||||
ITEM 10. | ||||
ITEM 11. | ||||
ITEM 12. | ||||
ITEM 13. | ||||
ITEM 14. | ||||
PART IV | ||||
ITEM 15. | ||||
i
Special Note Regarding Forward-looking Statements and Industry Data
This Form 10-K contains forward-looking statements that are based on our management’s beliefs and assumptions and on information currently available to our management. The forward-looking statements are contained principally in the sections entitled “Business,” “Risk factors,” and “Management’s discussion and analysis of financial condition and results of operations.” Forward-looking statements include information concerning our possible or assumed future results of operations, cash flow, sources of revenue, operating and other expenses, unit sales, business strategies, expansion of our business, financing plans, competitive position, industry environment, potential growth opportunities, and the effects of competition. Forward-looking statements include statements that are not historical facts and can be identified by terms such as “anticipates,” “believes,” “could,” “seeks,” “estimates,” “expects,” “intends,” “may,” “plans,” “potential,” “predicts, “projects,” “should,” “will,” “would,” or similar expressions and the negatives of those terms.
Forward-looking statements involve known and unknown risks, uncertainties, and other factors that may cause our actual results, performance, or achievements to be materially different from any future results, performance, or achievements expressed or implied by the forward-looking statements. We discuss these risks in greater detail in the section entitled “Risk factors” and elsewhere in this Form 10-K. Given these uncertainties, you should not place undue reliance on these forward-looking statements.
Forward-looking statements represent our management’s beliefs and assumptions only as of the date of this Form 10-K. Except as required by law, we assume no obligation to update these forward-looking statements, or to update the reasons actual results could differ materially from those anticipated in these forward-looking statements, even if new information becomes available in the future. You should read this Form 10-K completely and with the understanding that our actual future results may be materially different from what we expect.
____________________________
“Fluidigm,” the Fluidigm logo, “Access Array,” “Biomark,” “C1,” “Callisto,” “CyTOF,” “Delta Gene,” “Digital Array,” “Dynamic Array,” “EP1,” “FC1,” “Flex Six,” “Helios,” “High-Precision 96.96 Genotyping,” “Juno,” “Maxpar,” “MSL,” “Nanoflex” “Open App,” “Polaris,” “Script Builder,” “Script Hub,” “Singular,” “SNP Trace” and “SNP Type” are trademarks or registered trademarks of Fluidigm Corporation. Other service marks, trademarks and trade names referred to in this Form 10-K are the property of their respective owners.
____________________________
Unless the context requires otherwise, references in this Annual Report on Form 10-K to “Fluidigm,” the “Company,” “we,” “us,” and “our” refer to Fluidigm Corporation and its subsidiaries.
PART I
ITEM 1. BUSINESS
Overview
We create, manufacture, and market innovative technologies and life science tools focused on the exploration and analysis of single cells, as well as the industrial application of genomics, based upon our core microfluidics and mass cytometry technologies. We sell instruments and consumables, including integrated fluidic circuits, or IFCs, assays, and reagents, to academic institutions, clinical laboratories, and pharmaceutical, biotechnology, and agricultural biotechnology, or Ag-Bio, companies.
Single-cell analysis is a rapidly-growing field that we believe has the potential to revolutionize basic discovery in biology and lead to new and better ways to diagnose and treat disease. We pioneered a field that is now known as single-cell genomics and, through our acquisition of DVS Sciences, Inc., or DVS, in February 2014, we expanded into the field of single-cell proteomics. Our single-cell biology platform empowers our customers to analyze a large number of individual cells using simplified workflows with increased speed and accuracy at reduced costs. Our products also enable customers to apply the knowledge of biology in industrial or other applied settings that typically utilize low quantity and/or quality samples in high-throughput repeat testing applications.
Researchers have successfully employed our products to help achieve breakthroughs in a variety of fields, including single-cell gene and protein expression, gene regulation, genetic variation, cellular function, and applied genetics. These breakthroughs include using our systems to help detect life-threatening mutations in cancer cells, discover cancer associated biomarkers, analyze the genetic composition of individual stem cells, and assess the quality of agricultural products, such as seeds or livestock.
As of December 31, 2015, we had sold approximately 1,630 systems to customers in more than 45 countries worldwide. Over 800 systems sold have been designated for single-cell biology research.
Our Target Markets
The current markets for our products include life science research and production genomics.
Life Science Research
Single-Cell Biology. Life science research typically involves the analysis of samples containing many thousands of cells of many different types. When such samples are studied using traditional methodologies, the results obtained reflect a rough average of the activity of all of the cells in the sample, which masks critical differences in cell types and between individual cells of the same type. Additionally, in fields such as in-vitro fertilization and stem cell research, the number of cells available for analysis is inherently limited and the small amount of genetic material in a single cell prevents conventional methods from analyzing the activity of more than a few genes.
Single-cell biology is a rapidly emerging area of life science research that requires specialized tools and techniques to harvest and process individual cells with high sensitivity and reproducibility. Single-cell biology researchers need to conduct a high number of tests on a large number of individual cells, which in combination translates into thousands of experiments that must be accurate, fast, simple, and low cost. Our systems enable researchers to perform gene expression or protein expression analysis on single cells on a scale that is otherwise impractical with conventional systems due to the cost, experimental variability, and the large amount of biological sample required to initiate typical studies.
Genomics. One primary area of focus within life science research is genetic analysis, the study of genes and their functions. The hereditary material or nucleic acid of an organism is often referred to as its genome, the protein-encoding regions of which are commonly known as genes. Analysis of variations in genomes, genes, and gene activity in and between organisms can provide valuable insight into their health and functioning. Single-cell genomics is the study of the sequence and expression of genes and their ultimate functions at the individual cell level.
There are several forms of genetic analysis in use today, including genotyping, gene expression analysis, and DNA sequencing.
• | Genotyping involves the analysis of DNA variations across individual genomes. There are multiple forms of variants, including single nucleotide polymorphism, or SNPs, insertion-deletions, and copy number variation. A common application of genotyping focuses on analyzing SNPs to determine whether a SNP or group of SNPs are associated with a particular genetic trait, such as propensity for a disease. |
1
• | Gene expression analysis involves measuring the levels of particular ribonucleic acid sequences known as messenger RNAs, or mRNAs, which have been transcribed from genes. Determining these levels is important because mRNAs are often translated by the cell into proteins, and may affect the activity of the cell or the larger organism. |
• | DNA sequencing is a process by which researchers are able to determine the particular order of nucleotide bases that comprise all or a portion of a particular gene or genome, and typically improves with target enrichment, such as complex sample preparation and tagging processes. Researchers are increasingly using next-generation DNA sequencers to rapidly and cost-effectively sequence portions of genomes, which is important for the identification of genetic variations that correlate with particular phenotypes. |
Gene expression and genotyping are studied through a combination of various technology platforms that characterize gene function and genetic variation. These platforms often rely on polymerase chain reaction, or PCR, amplification to generate exponential copies of a DNA sample to provide sufficient signal to facilitate detection. Real-time quantitative PCR, or real-time qPCR, is a more advanced form of PCR that makes it possible to quantify the number of copies of DNA present in a sample.
Proteomics. Another focus within life science research is protein analysis, the study of proteins and their structures and functions. Proteins perform a vast array of functions within living organisms, including catalyzing metabolic reactions, replicating DNA, responding to stimuli, and transporting molecules from one location to another. Protein analysis is required to profile and understand cellular function.
There are several forms of high-throughput protein analysis in use today, including mass spectrometry, traditional flow cytometry, and mass cytometry.
• | Mass spectrometry is an analytical chemistry technique that measures the mass-to-charge ratio in molecules using external electric and magnetic fields. Mass spectrometry techniques are limited to bulk samples and provide an understanding of global protein dynamics on a tissue or organism level, but does not alone enable researchers to analyze data at a single cell level. |
• | Traditional flow cytometry utilizes a suspension of cells in a stream of fluid and passes them through an electronic detection apparatus to allow simultaneous multi-parameter analysis of the physical and chemical characteristics of up to thousands of cells per second. Although traditional flow cytometry technologies are high-throughput with single-cell analysis capabilities, a key limitation is the use of fluorescent dyes to label antibodies for detection. These fluorescent labels have emission spectra that typically overlap, making it challenging to optimize reagents to analyze many protein markers at once. In general, the number of protein targets for conventional flow cytometry is less than about 10 with significant reagent optimization often involved. |
• | Mass cytometry is similar to traditional flow cytometry but is based primarily on antibodies using heavy metal isotope labels rather than fluorescent labels for detection of proteins, enabling the significant expansion of the number of parameters analyzed per individual cell versus conventional flow cytometry technologies. With high-throughput, single-cell analysis capabilities, and the ability to analyze more protein markers per individual cell, researchers have more granular information, which allows them to identify and characterize even finer subpopulations of cells. |
Production Genomics
Production genomics includes applied markets that utilize biology in an industrial or applied setting and typically involves high-throughput repeat testing applications. Key production genomics customers include Ag-Bio companies, clinical laboratories, biorepositories and biopharmaceutical companies.
Agricultural Biotechnology. Ag-Bio applies scientific techniques, including genetic analysis techniques such as SNP genotyping and DNA sequencing, to study and improve desired characteristics in plants, animals, and microorganisms. Genetic analysis techniques have become increasingly useful in Ag-Bio applications, including wildlife population studies, agricultural quality control, and commercial genetic engineering and identification. Ag-Bio customers require systems that can quickly and accurately analyze a large number of samples, such as tissue from livestock populations or seeds from a production lot, in a high-throughput and cost-efficient manner.
Clinical Laboratories. Recent advances in genetic analysis technology are increasingly being used for clinical research applications. Techniques such as SNP genotyping, gene expression analysis, targeted DNA sequencing and other genetic correlation studies have been developed to identify disease susceptibility and to diagnose, classify, and monitor
2
disease progression. Prognostics and diagnostics based on measuring these genetic markers have the potential to be much more accurate and robust than conventional diagnostics. The validation and translation of prognostics and diagnostics into clinically available tests often requires life science automation systems that are able to measure multiple biomarkers efficiently in a large number of patient samples.
Biorepositories. Advancements in biology have led to an increased dependence on biorepositories to store genetic material for future testing and analysis. Flaws in the identity and quality of biorepository specimens are costly and result in erroneous data. To ensure sample integrity, biorepositories require cost-effective, simple, and high-throughput techniques to identify DNA samples and ensure traceability throughout the banking and downstream analytical processes.
Biopharmaceuticals. Biopharmaceutical companies use production scale genomic and proteomic analytical methods in numerous phases of the discovery, development and approval process of a therapeutic agent. These methods also may be used in companion diagnostics to attempt to reduce adverse events and identify patient populations that may more effectively respond to a therapeutic agent.
Products
We market innovative technologies and life-science tools, including analytical and preparatory systems for genomic and proteomic analysis, and consumables, including IFCs, assays, and reagents. Our primary product offerings are summarized in the table below:
Product | Product Description | Applications | ||
Preparatory Instruments | ||||
C1 Single-Cell Auto Prep System | Sample preparation system that rapidly and reliably isolates and processes individual cells for genomic analysis. | Single-Cell Targeted Gene Expression, Single-Cell microRNA Analysis, Single-Cell mRNA Sequencing, Single-Cell Targeted DNA Sequencing, Single-Cell Whole Exome Sequencing, and Single-Cell Whole Genome DNA Sequencing, Single-Cell Epigenetics, Single-Cell Protein Expression | ||
Access Array System | Sample preparation system that enables automated PCR-based target enrichment, barcoding, and tagging of targeted sequencing libraries and facilitates parallel amplification of up to 480 amplicons across 48 unique samples. | Targeted Resequencing with Next-Generation DNA Sequencing | ||
Juno System and IFCs | System that automates the preparation of samples for genomic analysis. The system automates PCR-based target enrichment, barcoding, and tagging of targeted sequencing libraries utilizing Targeted Sequencing Prep chemistry and IFCs. The Targeted Sequencing Prep IFCs and chemistry facilitate parallel amplification of up to 5000 amplicons across up to 48 unique samples, or up to 2500 amplicons across up to 192 unique samples. Juno also automates workflows for PCR-based gene expression and genotyping, preparing the Flex Six, 48.48, and 96.96 IFCs for both gene expression and genotyping. The Juno genotyping IFC incorporates preamplification for genotyping of challenging and low-concentration DNA samples, genotyping of up to 96 samples and 96 assays on a single IFC. | SNP Genotyping and Targeted Resequencing with Next-Generation DNA Sequencing | ||
Callisto System and IFC | Integrated high-throughput system and IFC that enable automated cell culture and combinatorial dosing on a single device. | Stem Cell Reprogramming and Differentiation | ||
3
Product | Product Description | Applications | ||
Preparatory Analytical Instruments | ||||
Polaris System and IFC | System and IFC that incorporate cell selection, isolation, imaging, dosing, culture, and processing of single cells for downstream molecular biology and analysis techniques preparation into a single workflow. | Functional Genomics Using Single-Cell mRNA Sequencing | ||
Analytical Instruments | ||||
Biomark HD System | Real-time PCR analytical instrument for high-throughput gene expression analysis, single-cell targeted gene expression analysis, microRNA analysis, SNP genotyping, and digital PCR. | SNP Genotyping, Digital PCR, and Gene Expression, including Single-Cell Targeted Gene Expression | ||
EP1 System | End-point PCR analytical instrument that performs high-throughput SNP genotyping and end-point digital PCR. | SNP Genotyping and Digital PCR | ||
Helios/CyTOF 2 System | Mass cytometry instrument that performs high-parameter single-cell protein analysis by analyzing cells labeled with a panel of reagents conjugated to stable metal isotopes. | Single-Cell Protein Analysis | ||
Integrated Fluidic Circuits (IFCs) | ||||
C1 IFCs | IFCs that capture and prepare individual cells for genomic analysis, and uses integrated thermal and pneumatic controls at nanoliter scale to perform all the steps of the single-cell genomic workflow without intervention; designed to maximize cell capture efficiency based on cell size (5-25 micron); available in three sizes per application. | Single-Cell Targeted Gene Expression, Single-Cell microRNA Analysis, Single-Cell mRNA Sequencing, Single-Cell Targeted DNA Sequencing, Single-Cell Whole Exome DNA Sequencing, and Single-Cell Whole Genome DNA Sequencing | ||
Access Array IFC | IFC that facilitates parallel amplification, barcoding, and tagging of 48 unique samples and designed to enable recovery of reaction products from the IFC for sequencing. | Targeted Sequencing with Next-Generation DNA Sequencing | ||
Dynamic Array IFCs | IFCs based on matrix architecture, allowing users to (i) individually assay up to 48 samples against up to 48 assays, (ii) individually assay up to 96 samples against up to 96 assays, or (iii) individually assay up to 192 samples against up to 24 assays. | Real-time qPCR, End-Point PCR, SNP Genotyping and Gene Expression, including Single-Cell Targeted Gene Expression | ||
Digital Array IFCs | IFCs based on partitioning architecture, allowing users to divide samples into up to 770 chambers in each of up to 48 panels for up to 36,960 reactions per IFC. | Digital PCR, Copy Number Variation and Mutation Detection | ||
Flex Six IFC | IFC that incorporates six 12 X 12 partitions that can be organized in any configuration, in up to six separate experimental runs. | Gene Expression and SNP Genotyping | ||
High-Throughput C1 mRNA Sequencing IFC | IFC that enables sequencing transcriptomes of up to 800 single cells. | Single-Cell mRNA Sequencing | ||
4
Product | Product Description | Applications | ||
Assays and Reagents | ||||
Delta Gene and SNP Type Assays | Custom designed assays for specific nucleic acid regions of interest, providing optimized assays, content, and services to users of Biomark and EP1 systems at lower cost as compared to other commercially available chemistries. | Gene Expression, Single-Cell Targeted Gene Expression, and SNP Genotyping | ||
Access Array Target-Specific Primers and Targeted Sequencing Prep Primers | Custom designed amplicon-library preparation assays for use with Access Array IFCs on the Access Array or Juno systems. | Targeted Sequencing with Next-Generation DNA Sequencing | ||
Maxpar Reagents | Pre-conjugated metal-labeled antibodies for functional and phenotypic profiling of single cells, application specific panel kits, and reagents for custom antibody labeling and nucleic acid staining. | Single-Cell Protein Analysis | ||
We have announced the following new products, which we expect will be commercially available in the near future (as indicated below):
Product | Product Description | Applications | ||
Imaging Mass Cytometer (IMC) instrument and reagents | New platform instrument that enables simultaneous measurements of more than 35 proteins in complex tissue samples or cell suspensions deposited on a microscopy slide, with spatial resolution provided by analysis of individual one micrometer pixels. The platform consists of a laser ablation module, capable of generating non-overlapping single shot ablation plumes at a frequency of 100 Hz and higher, and Helios system. The laser ablation module is compatible with existing Helios system installations. The instrument and associated reagents are expected to be commercially available in the second half of 2016. | Research into system biology of solid tumors, such as breast cancer, pancreatic cancer, lung cancer | ||
Laser Ablation Module | When connected to a Helios system, provides a solution for the growing need to conduct high-parameter imaging to complement existing single-cell genomics and proteomics techniques by providing spatial context. Expected to be commercially available in the second half of 2016. | Spatial analysis of complex tissue samples and smeared cells on slides. | ||
Additional Maxpar Reagents | Pre-conjugated cadmium isotope-labeled antibodies for functional and phenotypic profiling of single cells, application specific panel kits, and reagents for custom cadmium isotope-antibody labeling and nucleic acid staining. Expected to be commercially available by the end of 2016. | Single-Cell Protein Analysis | ||
5
Our Technology
Multi-Layer Soft Lithography
Our IFCs are manufactured using multi-layer soft lithography technology, or MSL technology, to create valves, chambers, channels, and other fluidic components on our IFCs that allow nanoliter quantities of fluids to be precisely manipulated within the IFC. We have developed commercial manufacturing processes to fabricate valves, channels, vias, and chambers with dimensions in the ten to 100 micron range, at high density and with high yields.
Integrated Fluidic Circuits
Our IFCs incorporate several different types of technology that together enable us to use MSL technology to rapidly design and deploy new microfluidic applications. The first level of our IFC technology is a library of components that perform basic microfluidic functions, such as pumps, mixers, single-cell capture chambers, separation columns, control logic, and reaction chambers. The second level of our IFC technology comprises the architectures we have designed to exploit our ability to conduct thousands of reactions on a single IFC. The third level of our IFC technology involves the interaction of our IFCs with the actual laboratory environment. Our IFCs are built on specially designed input frames that are compatible with most commonly used laboratory systems.
Instrumentation and Software
We have developed instrumentation technology to load samples and reagents onto our IFCs and to control and monitor reactions within our IFCs. Our line of IFC controllers consists of commercial pneumatic components and both custom and commercial electronics. They apply precise control of multiple pressures to move fluid and control valve states in a microfluidic IFC.
Our Biomark HD system includes our custom thermal cycler, the FC1 cycler, and a sophisticated fluorescence imaging system. Our EP1 instrument is a fluorescence reader designed for end-point imaging, suitable for genotyping and digital PCR applications. Our C1 system combines the hardware elements of our IFC controllers and FC1 cycler with sophisticated scripting and protocol control software to enable automation of single-cell capture and preparation for subsequent analysis. Certain capabilities of the C1 system have been used to create our Juno system, which serves as a universal controller and cycler for our Dynamic Array IFCs. Our Callisto system integrates environmental regulation for long-term cell culture with the C1 control system. Our Polaris system combines the capabilities of all these instruments by incorporating thermal cycling, IFC control, environmental regulation, and imaging.
Our mass cytometry instrumentation technology includes a custom-designed inductively-coupled plasma ion source, ion-optical and vacuum systems, and instrument control electronics. With our CyTOF 2 system and our Helios system, which is an enhanced version of our CyTOF 2 system, individual cells are atomized, ionized, and extracted. A time-of-flight mass analyzer separates atomic ions of different mass-to-charge ratios, providing information on temporal distribution of ions.
We have also developed specialized software to manage and analyze the unusually large amounts of data produced by our systems. Our bioinformatic toolset, the Singular software, facilitates the analysis and visualization of single-cell gene expression data. More recently, we extended the scope of the toolset to include DNA analysis tools. We also developed the C1 Script Builder software to enable customers to take full advantage of the flexibility of C1 IFC architecture by allowing them to program their own control scripts for the C1 system. We offer Fluidigm Cytobank, our cloud-based platform of analytical tools, for use with the Helios/CyTOF 2 systems.
Assays and Reagents
Our Delta Gene and SNP Type assay products consist of assay design and custom content delivery systems for gene expression and genotyping, respectively. These offerings provide low-cost alternatives to chemistries such as TaqMan, and allow customers to use IFCs in more flexible ways. PCR assay reagents need to be specific to the gene targets of interest but the process of designing a set of assays may delay the implementation experiments or require the use of expensive pre-designed assays. We have developed a process to provide customers with validated assays for their targets of interest.
We also manufacture metal-conjugated antibodies for use with our Helios/CyTOF 2 system to allow detection of up to approximately 37 protein targets simultaneously in a single cell. Our metal-conjugated antibodies are manufactured using metal-chelating polymers, which are produced using proprietary polymerization processes and subsequent post-polymerization modifications.
Sales and Marketing
We distribute our systems through our direct sales force and support organizations located in North America, Europe, and Asia-Pacific, and through distributors or sales agents in several European, Latin American, Middle Eastern, and Asia-
6
Pacific countries. Our sales and marketing efforts are targeted at laboratory directors and principal investigators at leading companies and academic institutions who need reliable life science automation solutions or enabling new single-cell biology technologies for research or commercial purposes.
Our sales process often involves numerous interactions and demonstrations with multiple people within an organization. Some potential customers conduct in-depth evaluations of the system, including running experiments on our system and competing systems. In addition, in most countries, sales to academic or governmental institutions require participation in a tender process involving preparation of extensive documentation and a lengthy review process. As a result of these factors and the budget cycles of our customers, our sales cycle, the time from initial contact with a customer to our receipt of a purchase order, can often be 12 months or longer.
As of December 31, 2015, we had 209 people employed in sales, technical support, and marketing, including 106 sales representatives and applications specialists located in the field.
Customers
We have sold our instruments to leading academic institutions, clinical laboratories, and pharmaceutical, biotechnology and Ag-Bio companies. No single customer represented more than 10% of our total revenue for 2015, 2014, or 2013.
Manufacturing
Our manufacturing operations are primarily located in Singapore and Canada. Our facility in Singapore manufactures our genomics instruments, several of which are assembled at facilities of our contract manufacturers in Singapore, with testing and calibration of the assembled products performed at our Singapore facility. All of our IFCs for commercial sale and some IFCs for our research and development purposes are also fabricated at our Singapore facility. Our proteomics analytical instruments for commercial sale, as well as for internal research and development purposes, are manufactured at our facility in Canada. We are in the process of relocating this facility into a larger building. We also manufacture IFCs for research and development, assays, and reagents at our facilities in South San Francisco, California.
We rely on a limited number of suppliers for certain components and materials used in our products. Key components in our products that are supplied by sole or limited source suppliers include a specialized polymer and other specialized materials from which our IFC cores are fabricated, specialized custom camera lenses, fiber light guides, and other components required for the reader of our Biomark system, specialized pneumatic and electronic components for our C1, Juno, Callisto and Polaris systems, the electron multiplier detector included in, and the nickel sampler cone and certain metal isotopes used with, our Helios/CyTOF 2 system, and certain raw materials for our Delta Gene and SNP Type assays and Access Array Target-Specific primers. The loss of a single or sole source supplier would require significant time and effort to locate and qualify an alternative source of supply, if at all, and could adversely impact our business. For additional information, please see the section entitled “Risk factors” in Part I, Item 1A of this Form 10-K.
Research and Development
We have assembled experienced research and development teams at our South San Francisco, California, Markham, Ontario, Canada, and Singapore locations with the scientific, engineering, software, bioinformatic, and process talent that we believe is required to grow our business.
The largest component of our current research and development effort is in the areas of new products and new applications. For example, we have developed a prototype imaging mass cytometer to provide spatial resolution of protein expression in samples at the single-cell level, quantitative measurement using metal isotope tags, and analysis of more than 30 proteins. We also invest significantly in research and development efforts to expand our single-cell biology and production genomics applications. For example, we have developed our Singular bioinformatics tools for analyzing and visualizing single-cell gene expression data; our C1 Open App Program, which enables researchers to develop and share new single-cell applications on the C1 system; and our single-cell whole exome, single-cell whole genome, and high-throughput single-cell mRNA sequencing workflows for use with our C1 system.
The second component of our research and development effort is to continuously develop new manufacturing processes and test methods to drive down manufacturing cost, increase manufacturing throughput, widen fabrication process capability, and support new microfluidic devices and designs.
Our research and development expenses were $39.3 million, $43.4 million, and $20.0 million in 2015, 2014, and 2013, respectively. As of December 31, 2015, 132 of our employees were engaged in research and development activities.
7
Competition
The life science research and applied markets are highly competitive and expected to grow more competitive with the increasing knowledge gained from ongoing research and development. We believe that the principal competitive factors in our target markets include cost of capital equipment and supplies; reputation among customers; innovation in product offerings; flexibility and ease of use; accuracy and reproducibility of results; and compatibility with existing laboratory processes, tools, and methods.
We compete with both established and development stage life science companies that design, manufacture, and market instruments for gene expression analysis, genotyping, other nucleic acid detection, protein expression analysis, and additional applications. In addition, a number of other companies and academic groups are in the process of developing novel technologies for life science markets. Many of our competitors enjoy several competitive advantages over us, including significantly greater name recognition; greater financial and human resources; broader product lines and product packages; larger sales forces and eCommerce channels; larger and more geographically dispersed customer support organization; substantial intellectual property portfolios; larger and more established customer bases and relationships; greater resources dedicated to marketing efforts; better established and larger scale manufacturing capability; and greater resources and longer experience in research and development. For additional information, please see the section entitled “Risk factors” in Part I, Item 1A of this Form 10-K.
To successfully compete with existing products and future technologies, we need to demonstrate to potential customers that the cost savings and performance of our technologies and products, as well as our customer support capabilities, are superior to those of our competitors. To differentiate our company from other, larger enterprises, we need to introduce new and innovative offerings regularly and maintain a well-staffed commercial team “in the field” to successfully communicate the advantages of our products and overcome potential obstacles to acceptance of our products. In addition, ongoing collaborations and partnerships with key opinion leaders are desirable to demonstrate both innovation and applicability of our products.
Single-Cell Genomics Collaborations
In May 2012, in collaboration with the Broad Institute, we announced the launch of the Single-Cell Genomics initiative, or SCGi, a research center dedicated to accelerating the development of research methods and discoveries in mammalian single-cell genomics. The SCGi facilitates collaborative development by single-cell genomics researchers of novel single-cell, microfluidic approaches for gene expression profiling, RNA/DNA sequencing, and epigenetic analysis, and to develop and disseminate new application workflows, reagents, bioinformatics tools, and data sets to the greater scientific community. The SCGi is located at the Broad Institute in Cambridge, Massachusetts, and features a complete suite of our single-cell tools, protocols, and technologies, most notably the C1 and Biomark HD systems.
In December 2012, in collaboration with the Genome Institute of Singapore, or GIS, an institute under the umbrella of the Agency for Science, Technology and Research, we announced the establishment of the Single-Cell ‘Omics Center, or SCOC, the first research center in Asia exclusively dedicated to accelerating the understanding of how individual cells work, and how diagnosis and treatment might be enhanced through insight derived from single cells. The SCOC provides integrated analytics for single-cell genomic applications to the region’s single-cell genomics researchers. The SCOC is located in dedicated laboratory space at GIS facilities in Biopolis, Singapore, and features the full capabilities of our C1 and Biomark HD systems for single-cell targeted gene expression analytics and validation.
In December 2014, we announced a collaboration with the Wellcome Trust Sanger Institute - European Bioinformatics Institute Single-Cell Genomics Centre, or SCGC, located on the Wellcome Trust Genome Campus. The SCGC will work with our onsite senior staff to ensure that the SCGC has early access to the latest equipment, workflows, and methods for single-cell genomics and proteomics research. In addition to technology advancements, the collaboration is expected to make single-cell research more accessible to the greater research community by developing and disseminating new workflows, bioinformatics tools, and data sets. The SCGC features our C1 and Biomark HD systems and has access to our CyTOF technology.
Intellectual Property
Patents
We have developed a portfolio of issued patents and patent applications directed to commercial products and technologies in development. As of December 31, 2015, we owned or licensed over 520 patents and we had approximately 320 pending patent applications worldwide. Our patents have expiration dates ranging from 2016 to 2033.
License Agreements
We have entered into licenses for technologies from various companies and academic institutions.
8
Microfluidic Technologies. Our core microfluidics technology originated at the California Institute of Technology, or Caltech, in the laboratory of Professor Stephen Quake, who is a co-founder of Fluidigm. We license microfluidics technology from Caltech, Harvard University, and Caliper Life Sciences, Inc., which subsequently became a PerkinElmer company, referred to as Caliper.
• | We exclusively license from Caltech relevant patent filings relating to developed technologies that enabled the production of specialized valves and pumps capable of controlling fluid flow at nanoliter volumes. The license agreement will terminate as to each country and licensed product upon expiration of the last-to-expire patent covering licensed products in each country. The U.S. issued patents we have licensed from Caltech expire between 2017 and 2030. |
• | We have entered into a co-exclusive license agreement with Harvard University for the license of relevant patent filings relating to microfluidic technology. The license agreement will terminate with the last-to-expire of the licensed patents. The U.S. issued patents we have licensed from Harvard University expire between 2019 and 2027. |
• | In May 2011, we entered into a license agreement with Caliper Life Sciences, Inc., which subsequently became a PerkinElmer company, referred to as Caliper, to license Caliper’s existing patent portfolio in certain fields. The license agreement will terminate with the last-to-expire of the licensed patents. As later amended, the license agreement provides for certain royalty payments until mid-2018 for our existing products at the time of amendment and their future equivalents. |
Instrumentation and Digital PCR. On June 30, 2011, we settled litigation and entered into a series of patent cross-license and sub-license agreements with Life Technologies Corporation (now part of Thermo Fisher Scientific) and its Applied Biosystems, LLC subsidiary, referred to as Life. The agreements involve a cross-license concerning our imaging readers and other patent filings and certain of Life’s patent families relating to methods and instruments for conducting nucleic acid amplification, such as with PCR; a sub-license that provides us access to certain of Life’s digital PCR patents; and a sublicense that provides Life access to certain of our non-core technology patents licensed from Caltech. In July 2011, pursuant to the terms of the agreements, we paid Life $2.0 million in connection with our exercise of an option to preclude Life from initiating litigation under its patents existing as of June 30, 2011 against our customers for two years and against our company, with respect to our current products and equivalent future products, for four years, subject to certain exceptions. The license agreement will terminate with the last-to-expire of the licensed patents, which is expected to be in 2028.
Mass Cytometry. Some of the intellectual property rights covering our mass cytometry products were subject to a license agreement, referred to as the Original License Agreement, between Fluidigm Canada Inc., referred to as Fluidigm Canada, and PerkinElmer Health Sciences, Inc., referred to as Perkin Elmer. Under the Original License Agreement, Fluidigm Canada received an exclusive, royalty bearing, worldwide license to certain patents owned by PerkinElmer in the field of ICP-based mass cytometry, including the analysis of elemental tagged materials in connection therewith, referred to as the Patents, and a non-exclusive license for reagents outside the field of ICP-based mass cytometry. On November 4, 2015, we entered into a patent purchase agreement with PerkinElmer pursuant to which we purchased the Patents for a purchase price of $6.5 million and a patent assignment agreement pursuant to which PerkinElmer transferred and assigned to us all rights, title, privileges, and interest in and to the Patents and the Original License Agreement. Accordingly, we have no further financial obligations to PerkinElmer under the Original License Agreement. Contemporaneously with the purchase of the Patents, we entered into a license agreement with PerkinElmer pursuant to which we granted PerkinElmer a worldwide, non-exclusive, fully paid-up license to the Patents in fields other than (i) ICP-based mass analysis of atomic elements associated with a biological material, including any elements that are unnaturally bound, directly or indirectly, to such biological material (Mass Analysis) and (ii) the development, design, manufacture, and use of equipment or associated reagents for such Mass Analysis. The license will terminate on the last expiration date of the Patents, currently expected to be in December 2025, unless earlier terminated pursuant to the terms of the license agreement.
Any loss, termination, or adverse modification of our licensed intellectual property rights could have a material adverse effect on our business, operating results, and financial condition. For additional information, please see the section entitled “Risk factors” in Part I, Item 1A of this Form 10-K.
Other
In addition to pursuing patents and licenses on key technologies, we have taken steps to protect our intellectual property and proprietary technology by entering into confidentiality agreements and intellectual property assignment agreements with our employees, consultants, corporate partners, and, when needed, our advisors.
9
Government Regulation
Our products are currently labeled and sold for research purposes only, and we sell them to academic institutions, life sciences and clinical laboratories that conduct research, and pharmaceutical and biotechnology companies for non-diagnostic and non-clinical purposes. Our products are not intended for use in clinical practice in the diagnosis of disease or other conditions, and they are labeled for research use only. Accordingly, they are subject only to limited, specific regulation with respect to labeling by the U.S. Food and Drug Administration, or FDA. In particular, while FDA regulations require that research use only products be labeled, “For Research Use Only. Not for use in diagnostic procedures,” or RUO products, the regulations do not subject such products to the FDA’s broader pre- and post-market controls for medical devices.
In November 2013, the FDA issued a final guidance document stating that merely including a labeling statement that the product is for research purposes only will not necessarily render the device exempt from the FDA’s clearance, approval, or other regulatory requirements if the totality of circumstances surrounding the distribution of the product indicate that the manufacturer knows its product is being used by customers for diagnostic uses or the manufacturer intends such a use. These circumstances may include, among other things, written or verbal marketing claims regarding a product’s performance in clinical applications and a manufacturer’s provision of technical support for such activities. In the future, certain of our products or related applications could become subject to regulation as medical devices by the FDA. If we wish to label and market our products for use in performing clinical diagnostics, thus subjecting them to regulation by the FDA under premarket and postmarket control as medical devices, unless an exemption applies, we would be required to obtain either prior 510(k) clearance or prior pre-market approval from the FDA before commercializing the product. The FDA classifies medical devices into one of three classes. Devices deemed to pose lower risk to the patient are placed in either class I or II, which, unless an exemption applies, requires the manufacturer to submit a pre-market notification requesting FDA clearance for commercial distribution pursuant to Section 510(k) of the FFDCA. This process, known as 510(k) clearance, requires that the manufacturer demonstrate that the device is substantially equivalent to a previously cleared and legally marketed 510(k) device or a “pre-amendment” class III device for which pre-market approval applications, or PMAs, have not been required by the FDA. This process typically takes from four to twelve months, although it can take longer. Most class I devices are exempted from this 510(k) premarket submission requirement. Devices deemed by the FDA to pose the greatest risk, such as life-sustaining, life-supporting, or implantable devices, or those deemed not substantially equivalent to a legally marketed predicate device, are placed in class III. Class III devices typically require PMA approval. To obtain PMA approval, an applicant must demonstrate the reasonable safety and effectiveness of the device based, in part, on data obtained in clinical studies. PMA reviews generally last between one and two years, although they can take longer. Both the 510(k) and the PMA processes can be expensive and lengthy and may not result in clearance or approval. If we are required to submit our products for pre-market review by the FDA, we may be required to delay marketing while we obtain premarket clearance or approval from the FDA. There would be no assurance that we could ever obtain such clearance or approval.
In some cases, our customers or collaborators may use our RUO products in their own laboratory-developed tests, or LDTs, or in other FDA-regulated products for clinical diagnostic use. The FDA has historically exercised enforcement discretion in not enforcing the medical device regulations against LDTs and LDT manufacturers. However, on October 3, 2014, the FDA issued two draft guidance documents that set forth the FDA’s proposed risk-based framework for regulating LDTs, which are designed, manufactured, and used within a single laboratory. The guidance documents, if and when finalized, may impact the sales of our products and how customers use our products, and may require us to change our business model in order to maintain compliance with these laws.
We would become subject to additional FDA requirements if our products are determined to be medical devices or if we elect to seek 510(k) clearance or prior pre-market approval. We would need to continue to invest significant time and other resources to ensure ongoing compliance with FDA quality system regulations and other post-market regulatory requirements. For additional information, please see the section entitled “Risk factors” in Part I, Item 1A of this Form 10-K.
International sales of medical devices are subject to foreign government regulations, which vary substantially from country to country. Outside of the EU, regulatory approval needs to be sought on a country-by-country basis in order to market medical devices. Although there is a trend towards harmonization of quality system standards, regulations in each country may vary substantially which can affect timelines of introduction.
Environmental Matters
We are subject to many federal, state, local, and foreign environmental regulations. To comply with applicable regulations, we have and will continue to incur significant expense and allocate valuable internal resources to manage compliance-related issues. In addition, such regulations could restrict our ability to expand or equip our facilities, or could require us to acquire costly equipment or to incur other significant expenses to comply with the regulations. For example,
10
the Restriction on the Use of Certain Hazardous Substances in Electrical and Electronic Equipment Directive, or RoHS, and the Waste Electrical and Electronic Equipment Directive, or WEEE, enacted in the European Union, regulate the use of certain hazardous substances in, and require the collection, reuse, and recycling of waste from, products we manufacture. Certain of our products sold in these countries may become subject to RoHS and WEEE requirements. If we fail to comply with any present and future regulations, we could be subject to future fines, penalties, and restrictions, such as the suspension of manufacturing of our products or a prohibition on the sale of products we manufacture. For additional information, please see the section entitled “Risk factors” in Part I, Item 1A of this Form 10-K.
Additionally, our research and development and manufacturing processes involve the controlled use of hazardous materials, including flammables, toxics, corrosives, and biologics. Our research and manufacturing operations produce hazardous biological and chemical waste products. We seek to comply with applicable laws regarding the handling and disposal of such materials. The volume of such materials used or generated at our facilities is small. However, we cannot eliminate the risk of accidental contamination or discharge and any resultant injury from these materials. We do not currently maintain separate environmental liability coverage and any such contamination or discharge could result in significant cost to us in penalties, damages, and suspension of our operations.
Geographic Information
During the last three years, a majority of our revenue was generated within the United States and Europe and a majority of our long-lived assets are located within the United States and Singapore. Total product and service revenue received from customers outside the United States totaled $59.3 million, or 52% of our total product and service revenue, in 2015, compared to $56.8 million, or 49% of our total product and service revenue, in 2014, and $33.9 million, or 48% of our total product and service revenue, in 2013. Please see Note 13 to our audited consolidated financial statements for additional information for geographic areas.
Seasonality
In 2011, 2012, and 2014, our product revenue was higher in the fourth quarter of the year than in the first quarter of the next year reflecting numerous factors, including, among others, seasonal variations in customer operations and customer budget and capital spending cycles. Although this was not the case in the fourth quarter of 2013 compared to the first quarter of 2014, this historical trend resumed in 2015 and we expect it to continue.
Raw Materials
Certain raw materials used in our Delta Gene and SNP Type assays and Access Array target-specific primers are available from a limited number of sources. Additionally, certain metals used in our Maxpar reagents are available from a sole source. Currently, we do not have supply agreements with these suppliers. While we generally attempt to keep our inventory at minimal levels, we purchase incremental inventory as circumstances warrant to protect our supply chain.
Employees
As of December 31, 2015, we had 584 employees, of which 132 work in research and development, 86 work in general and administrative, 157 work in manufacturing, and 209 work in sales, technical support, and marketing. None of our employees are represented by a labor union or are the subject of a collective bargaining agreement.
Corporate and Available Information
We were incorporated in California in May 1999 as Mycometrix Corporation, changed our name to Fluidigm Corporation in April 2001, and reincorporated in Delaware in July 2007. Our principal executive offices are located at 7000 Shoreline Court, Suite 100, South San Francisco, California 94080. Our telephone number is (650) 266-6000. Our website address is www.fluidigm.com. We make available on our website, free of charge, our Annual Report on Form 10-K, Quarterly Reports on Form 10-Q, Current Reports on Form 8-K, and any amendments to those reports, as soon as reasonably practicable after we electronically file such material with, or furnish it to, the Securities and Exchange Commission, or SEC. Our SEC reports can be accessed through the investor relations page of our website located at http://investors.fluidigm.com/sec.cfm. Additionally, a copy of this Annual Report on Form 10-K is located at the SEC’s Public Reference Room at 100 F Street, NE, Washington, D.C. 20549. Information on the operation of the Public Reference Room can be obtained by calling the SEC at 1-800-SEC-0330.
We webcast our earnings calls and certain events we participate in or host with members of the investment community on our investor relations page of our website. Corporate governance information, including our board committee charters, code of ethics, and corporate governance principles, is also available on our investor relations page of our website located at http://investors.fluidigm.com/corporate-governance.cfm.
In addition to SEC filings, press releases, public conference calls, and webcasts, we use our website (www.fluidigm.com), corporate Twitter account (@Fluidigm), Facebook page (https://www.facebook.com/Fluidigm), and
11
LinkedIn page (https://www.linkedin.com/company/fluidigm-corporation) as channels of distribution of information about our company, our products, our planned financial and other announcements, our attendance at upcoming investor and industry conferences, and other matters. It is possible that the information we post on our website and through these social media accounts could be deemed material information. We may use these channels to comply with our disclosure obligations under Regulation FD. Therefore, investors should monitor our website and our social media accounts in addition to following our press releases, SEC filings, public conference calls, and webcasts.
The contents of our website and the information we post through social media are not a part of, and are not incorporated by reference into, this Annual Report on Form 10-K or any other report or document we file with the SEC. Any references to our websites are intended to be inactive textual references only.
Executive Officers
The following table sets forth the names, ages (as of February 10, 2016) and positions of our executive officers:
Name | Age | Position | ||
Gajus V. Worthington | 46 | President, Chief Executive Officer, and Director | ||
Vikram Jog | 59 | Chief Financial Officer | ||
Robert C. Jones | 61 | Chief Technology Officer, Genomics | ||
Steven C. McPhail | 62 | General Manager, Production Genomics | ||
William M. Smith | 64 | Executive Vice President, Legal Affairs, General Counsel, and Secretary | ||
Mai Chan (Grace) Yow | 57 | Executive Vice President, Worldwide Manufacturing and Managing Director of Fluidigm Singapore Pte. Ltd. | ||
Marc Unger, Ph.D. | 45 | Executive Vice President, Research and Development and Marketing | ||
Gajus V. Worthington is a co-founder of Fluidigm and has served as our President, Chief Executive Officer and a director since our inception in June 1999. From May 1994 to April 1999, Mr. Worthington held various staff and management positions at Actel Corporation, a public semiconductor company that was acquired by Microsemi Corporation in 2010. Mr. Worthington received a B.S. in Physics and an M.S. in Electrical Engineering from Stanford University.
Vikram Jog has served as our Chief Financial Officer since February 2008. From April 2005 to February 2008, Mr. Jog served as Chief Financial Officer for XDx, Inc. (now CareDx, Inc.), a molecular diagnostics company. From March 2003 to April 2005, Mr. Jog was a Vice President of Applera Corporation, a life science company that is now part of Thermo Fisher Scientific, and Vice President of Finance for its related businesses, Celera Genomics and Celera Diagnostics. From April 2001 to March 2003, Mr. Jog was Vice President of Finance for Celera Diagnostics and Corporate Controller of Applera Corporation. Mr. Jog received a Bachelor of Commerce degree from Delhi University and an M.B.A. from Temple University. Mr. Jog is a member of the American Institute of Certified Public Accountants.
Robert C. Jones has served as our Chief Technology Officer, Genomics since August 2015. Previously, Mr. Jones served as Executive Vice President, Research and Development from August 2005 to July 2015. From August 1984 to July 2005, Mr. Jones held various managerial and research and development positions at Applied Biosystems, a laboratory equipment and supplies manufacturer that was a division of Applera Corporation, including: Senior Vice President Research and Development from April 2001 to August 2005; Vice President and General Manager Informatics Division from 1998 to 2001; and Vice President PCR Business Unit from 1994 to 1998. Mr. Jones received a BSEE in Electrical Engineering and an MSEE in Computer Engineering from the University of Washington.
Steven C. McPhail has served as our General Manager, Production Genomics since May 2015. From February 2003 to August 2012, Mr. McPhail was President and Chief Executive Officer of Expression Analysis, Inc., a genomic services company that was acquired by Quintiles Transnational Corporation in August 2012, where Mr. McPhail was President of the post-acquisition operation until March 2015. Prior to Expression Analysis, Inc., Mr. McPhail held various staff and management positions at companies in the diagnostic, biotechnology, and medical device markets, including ArgoMed Inc., Xanthon, Inc., TriPath Imaging Inc., Dynex Technologies, Inc., and Abbott Laboratories. Mr. McPhail serves on the Board of Visitors of NC Children's Hospital and on the Board of Trustees of the Carolinas chapter of the Crohn's and Colitis Foundation of America. Mr. McPhail received a B.S. in Biology from San Diego State University.
William M. Smith has served as our Executive Vice President, Legal Affairs since February 2012, and as General Counsel and our Secretary since May 2000. From May 2000 to February 2012, Mr. Smith served as our Vice President, Legal Affairs and served as a director from May 2000 to April 2008. Mr. Smith served as an associate and then as a partner
12
at the law firm of Townsend and Townsend and Crew, LLP from 1985 through April 2008. Mr. Smith received a J.D. and an M.P.A. from the University of Southern California and a B.A. in Biology from the University of California, San Diego.
Mai Chan (Grace) Yow has served as Executive Vice President, Worldwide Manufacturing of Fluidigm Singapore Pte. Ltd., our Singapore subsidiary, since February 2012, and as Managing Director of Fluidigm Singapore Pte. Ltd. since March 2006. Ms. Yow served as Vice President, Worldwide Manufacturing, from March 2006 to January 2012. From June 2005 to March 2006, Ms. Yow served as General Manager of Fluidigm Singapore Pte. Ltd. From August 2004 to May 2005, Ms. Yow served as Vice President Engineering (Asia) for Kulicke and Soffa, a public semiconductor equipment manufacturer. From March 1991 to July 2004, Ms. Yow served as Director, Assembly Operations, Plant Facilities and EHS, for National Semiconductor Singapore, a semiconductor fabrication subsidiary of National Semiconductor Corporation. Ms. Yow received a B.E. in Electronic Engineering from Curtin University, a Certificate in Management Studies from the Singapore Institute of Management, and a Diploma in Electrical Engineering from Singapore Polytechnic.
Marc Unger, Ph.D., has served has our Executive Vice President of Research and Development and Marketing since January 2014. Dr. Unger first joined Fluidigm in 2002 as our Director of Microfluidic Research and Development. Dr. Unger also has served as our Director of Research and Development from 2003 to 2007, Chief Scientific Officer from 2007 to 2012, and Chief Technology Officer from 2012 to 2013. Dr. Unger received a Ph.D. in Physical Chemistry from the California Institute of Technology and a B.S. in Chemistry from Union College.
ITEM 1A. RISK FACTORS
We operate in a rapidly changing environment that involves numerous uncertainties and risks. The following risks and uncertainties may have a material and adverse effect on our business, financial condition, or results of operations. You should consider these risks and uncertainties carefully, together with all of the other information included or incorporated by reference in this Form 10-K. If any of the risks or uncertainties we face were to occur, the trading price of our securities could decline, and you may lose all or part of your investment.
Risks Related to Fluidigm’s Business and Strategy
Our financial results and revenue growth rates have varied significantly from quarter-to-quarter and year-to-year due to a number of factors, and a significant variance in our operating results or rates of growth, if any, could lead to substantial volatility in our stock price.
Our revenue, results of operations, and revenue growth rates have varied in the past and may continue to vary significantly from quarter-to-quarter or year-to-year. For example, in 2011, 2012 and 2014, we experienced higher sales in the fourth quarter than in the first quarter of the next fiscal year. Although this was not the case in the fourth quarter of 2013 compared to the first quarter of 2014, this seasonal historical trend resumed in 2015, and we expect it to continue. Additionally, for the quarters ended March 31, 2015 and June 30, 2015, we experienced year-over-year revenue growth rates that were substantially lower than revenue growth rates experienced in other periods since our initial public offering, and we experienced a year-over-year decline in revenue for the quarter ended September 30, 2015, and for the year ended December 31, 2015. We may experience substantial variability in our product mix from period-to-period as revenue from sales of our instruments relative to sales of our consumables may fluctuate or deviate significantly from expectations. Variability in our quarterly or annual results of operations, mix of product revenue, or rates of revenue growth, if any, may lead to volatility in our stock price as research analysts and investors respond to these fluctuations. These fluctuations are due to numerous factors that are difficult to forecast, including: fluctuations in demand for our products; changes in customer budget cycles and capital spending; seasonal variations in customer operations; tendencies among some customers to defer purchase decisions to the end of the quarter; the large unit value of our systems; changes in our pricing and sales policies or the pricing and sales policies of our competitors; our ability to design, manufacture, market, sell, and deliver products to our customers in a timely and cost-effective manner; quality control or yield problems in our manufacturing operations; our ability to timely obtain adequate quantities of the materials or components used in our products, which in certain cases are purchased through sole and single source suppliers; new product introductions and enhancements by us and our competitors; unanticipated increases in costs or expenses; our complex, variable and, at times, lengthy sales cycle; global economic conditions; and fluctuations in foreign currency exchange rates. Additionally, we have certain customers who have historically placed large orders in multiple quarters during a calendar year. A significant reduction in orders from one or more of these customers could adversely affect our revenue and operating results, and if these customers defer or cancel purchases or otherwise alter their purchasing patterns, our financial results and actual results of operations could be significantly impacted. Other unknown or unpredictable factors also could harm our results.
13
The foregoing factors, as well as other factors, could materially and adversely affect our quarterly and annual results of operations and rates of revenue growth, if any. We have experienced significant revenue growth in the past but we may not achieve similar growth rates in future periods. You should not rely on our operating results for any prior quarterly or annual period as an indication of our future operating performance. If we are unable to maintain adequate revenue growth, our operating results could suffer and our stock price could decline. In addition, a significant amount of our operating expenses are relatively fixed due to our manufacturing, research and development, and sales and general administrative efforts. Any failure to adjust spending quickly enough to compensate for a shortfall relative to our anticipated revenue could magnify the adverse impact of such shortfalls on our results of operations. We expect that our sales will continue to fluctuate on an annual and quarterly basis and that our financial results for some periods may be below those projected by securities analysts, which could significantly decrease the price of our common stock.
The life science research and applied markets are highly competitive and subject to rapid technological change, and we may not be able to successfully compete.
The markets for our products are characterized by rapidly changing technology, evolving industry standards, changes in customer needs, emerging competition, new product introductions, and strong price competition. We compete with both established and development stage life science research companies that design, manufacture, and market instruments and consumables for gene expression analysis, single-cell targeted gene expression or protein expression analysis, single nucleotide polymorphism genotyping, or SNP genotyping, polymerase chain reaction, or PCR, digital PCR, other nucleic acid detection, flow cytometry, cell imaging, and additional applications using well established laboratory techniques, as well as newer technologies such as bead encoded arrays, microfluidics, nanotechnology, high-throughput DNA sequencing, microdroplets, and photolithographic arrays. Most of our current competitors have significantly greater name recognition, greater financial and human resources, broader product lines and product packages, larger sales forces, larger existing installed bases, larger intellectual property portfolios, and greater experience and scale in research and development, manufacturing, and marketing than we do. For example, companies such as 10X Genomics, Inc., Affymetrix, Inc., Agena Bioscience, Inc., Agilent Technologies, Inc., Becton, Dickinson and Company, Bio-Rad Laboratories, Inc., Cellular Research, Inc. (now a part of Becton, Dickinson and Company), Danaher Corporation, Illumina, Inc., Life Technologies Corporation (now part of Thermo Fisher Scientific Inc.), LGC Limited, Luminex Corporation, Millipore Corporation, NanoString Technologies, Inc., PerkinElmer, Inc. (through its acquisition of Caliper Life Sciences, Inc.), RainDance Technologies, Inc., Roche Diagnostics Corporation, Sony Corporation, Thermo Fisher Scientific Inc., and WaferGen Bio-systems, Inc. have products that compete in certain segments of the market in which we sell our products. In addition, we have recently experienced increased competition in the single-cell biology market, including new product releases from Becton, Dickinson and Company, 10X Genomics, Inc. and WaferGen Bio-systems, Inc., as well as an announced exclusive partnership between Illumina, Inc. and Bio-Rad Laboratories, Inc.
Competitors may be able to respond more quickly and effectively than we can to new or changing opportunities, technologies, standards, or customer requirements. In light of these advantages, even if our technology is more effective than the product or service offerings of our competitors, current or potential customers might accept competitive products and services in lieu of purchasing our technology. We anticipate that we will face increased competition in the future as existing companies and competitors develop new or improved products and as new companies enter the market with new technologies. Increased competition is likely to result in pricing pressures, which could reduce our profit margins and increase our sales and marketing expenses. In addition, mergers, consolidations, or other strategic transactions between two or more of our competitors, or between our competitor and one of our key customers, could change the competitive landscape and weaken our competitive position, adversely affecting our business.
Market opportunities may not develop as quickly as we expect, limiting our ability to successfully sell our products, or our product development and strategic plans may change and our entry into certain markets may be delayed, if it occurs at all.
The application of our technologies to single-cell biology (across genomics and proteomics) and production genomics applications are emerging market opportunities. We believe these opportunities will take several years to develop or mature and we cannot be certain that these market opportunities will develop as we expect. The future growth of the single-cell biology market and the success of our products depend on many factors beyond our control, including recognition and acceptance by the scientific community, and the growth, prevalence, and costs of competing methods of genetic and protein analysis. If the market for single-cell biology and production genomics do not develop as we expect, our business may be adversely affected. Additionally, our success in these markets may depend to a large extent on our ability to successfully sell products using our technologies. If we are not able to successfully market and sell our products, or to achieve the revenue or margins we expect, our operating results may be harmed and we may not recover our product development and marketing expenditures. In addition, our product development and strategic plans may change, which could delay or impede our entry into these markets.
14
If our products fail to achieve and sustain sufficient market acceptance, our revenue will be adversely affected.
Our success depends, in part, on our ability to develop and market products that are recognized and accepted as reliable, enabling and cost-effective. Most of our potential customers already use expensive research systems in their laboratories and may be reluctant to replace those systems. Market acceptance of our systems will depend on many factors, including our ability to convince potential customers that our systems are an attractive alternative to existing technologies. Compared to some competing technologies, our technology is relatively new, and most potential customers have limited knowledge of, or experience with, our products. Prior to adopting our systems, some potential customers may need to devote time and effort to testing and validating our systems. Any failure of our systems to meet these customer benchmarks could result in customers choosing to retain their existing systems or to purchase systems other than ours.
In addition, it is important that our systems be perceived as accurate and reliable by the scientific and medical research community as a whole. Historically, a significant part of our sales and marketing efforts has been directed at convincing industry leaders of the advantages of our systems and encouraging such leaders to publish or present the results of their evaluation of our system. If we are unable to continue to induce leading researchers to use our systems, or if such researchers are unable to achieve and publish or present significant experimental results using our systems, acceptance and adoption of our systems will be slowed and our ability to increase our revenue would be adversely affected.
We may experience development or manufacturing problems or delays that could limit the growth of our revenue or increase our losses.
We may encounter unforeseen situations in the manufacturing and assembly of our products that would result in delays or shortfalls in our production. For example, our production processes and assembly methods may have to change to accommodate any significant future expansion of our manufacturing capacity, which may increase our manufacturing costs, delay production of our products, reduce our product margin, and adversely impact our business.
Additionally, all of our IFCs for commercial sale are manufactured at our facility in Singapore. Production of the elastomeric block that is at the core of our IFCs is a complex process requiring advanced clean rooms, sophisticated equipment, and strict adherence to procedures. Any contamination of the clean room, equipment malfunction, or failure to strictly follow procedures can significantly reduce our yield in one or more batches. We have in the past experienced variations in yields due to such factors. A drop in yield can increase our cost to manufacture our IFCs or, in more severe cases, require us to halt the manufacture of our IFCs until the problem is resolved. Identifying and resolving the cause of a drop in yield can require substantial time and resources.
Furthermore, developing an IFC for a new application may require developing a specific production process for that type of IFC. While all of our IFCs are produced using the same basic processes, significant variations may be required to ensure adequate yield of any particular type of IFC. Developing such a process can be very time consuming, and any unexpected difficulty in doing so can delay the introduction of a product.
If our manufacturing activities are adversely impacted, or if we are otherwise unable to keep up with demand for our products by successfully manufacturing, assembling, testing, and shipping our products in a timely manner, our revenue could be impaired, market acceptance for our products could be adversely affected and our customers might instead purchase our competitors’ products.
If our research and product development efforts do not result in commercially viable products within anticipated timelines, if at all, our business and results of operations will be adversely affected.
Our business is dependent on the improvement of our existing products, our development of new products to serve existing markets, and our development of new products to create new markets and applications that were previously not practical with existing systems. We intend to devote significant personnel and financial resources to research and development activities designed to advance the capabilities of our technology. We have developed design rules for the implementation of our technology that are frequently revised to reflect new insights we have gained about the technology. In addition, we have discovered that biological or chemical reactions sometimes behave differently when implemented on our systems rather than in a standard laboratory environment. Furthermore, many such reactions take place within the confines of single cells, which have also demonstrated unexpected behavior when grown and manipulated within microfluidic environments. As a result, research and development efforts may be required to transfer certain reactions and cell handling techniques to our systems. In the past, product development projects have been significantly delayed when we encountered unanticipated difficulties in implementing a process on our systems. We may have similar delays in the future, and we may not obtain any benefits from our research and
15
development activities. Any delay or failure by us to develop and release new products or product enhancements would have a substantial adverse effect on our business and results of operations. We are in the process of relocating our manufacturing facility for Helios/CyTOF 2 and other proteomics products in Canada, which could result in delays or disruptions in product development and which could have an adverse affect on our revenues or operating results.
Our products could have defects or errors, which may give rise to claims against us, adversely affect market adoption of our systems, and adversely affect our business, financial condition, and results of operations.
Our systems utilize novel and complex technology and such systems may develop or contain undetected defects or errors. We cannot assure you that material performance problems, defects, or errors will not arise, and as we increase the density and integration of our systems, these risks may increase. We generally provide warranties that our systems will meet performance expectations and will be free from defects. The costs incurred in correcting any defects or errors may be substantial and could adversely affect our operating margins. For example, we have recently experienced a performance issue with respect to certain IFCs used in our C1 systems due to the presence of more than one cell in an IFC chamber. We are currently working to redesign such IFCs. Although we have announced our current expectation that redesigned IFCs will be available in the second quarter of 2016, we may experience unexpected delays or product development challenges that could affect the timing or our ability to release redesigned IFCs that adequately address these performance issues.
In manufacturing our products, including our systems, IFCs, and assays, we depend upon third parties for the supply of various components, many of which require a significant degree of technical expertise to produce. In addition, we purchase certain products from third-party suppliers for resale. If our suppliers fail to produce components to specification or provide defective products to us for resale and our quality control tests and procedures fail to detect such errors or defects, or if we or our suppliers use defective materials or workmanship in the manufacturing process, the reliability and performance of our products will be compromised.
If our products contain defects, we may experience:
• | a failure to achieve market acceptance or expansion of our product sales; |
• | loss of customer orders and delay in order fulfillment; |
• | damage to our brand reputation; |
• | increased cost of our warranty program due to product repair or replacement; |
• | product recalls or replacements; |
• | inability to attract new customers; |
• | diversion of resources from our manufacturing and research and development departments into our service department; and |
• | legal claims against us, including product liability claims, which could be costly and time consuming to defend and result in substantial damages. |
In addition, certain of our products are marketed for use with products sold by third parties. For example, our Access Array system is marketed as compatible with major next-generation DNA sequencing instruments. If such third-party products are not produced to specification, are produced in accordance with modified specifications, or are defective, they may not be compatible with our products. In such case, the reliability and performance of our products may be compromised.
The occurrence of any one or more of the foregoing could negatively affect our business, financial condition, and results of operations.
16
Our business depends on research and development spending levels of academic, clinical, and governmental research institutions, and pharmaceutical, biotechnology, and Ag-Bio companies, a reduction in which could limit our ability to sell our products and adversely affect our business.
We expect that our revenue in the foreseeable future will be derived primarily from sales of our systems and IFCs to academic institutions, clinical laboratories that use our technology to develop tests, and pharmaceutical, biotechnology, and Ag-Bio companies worldwide. Our success will depend upon their demand for and use of our products. Accordingly, the spending policies of these customers could have a significant effect on the demand for our technology. These policies may be based on a wide variety of factors, including concerns regarding any future federal government budget sequestrations, the availability of resources to make purchases, the spending priorities among various types of equipment, policies regarding spending during recessionary periods, and changes in the political climate. In addition, academic, governmental, and other research institutions that fund research and development activities may be subject to stringent budgetary constraints that could result in spending reductions, reduced allocations, or budget cutbacks, which could jeopardize the ability of these customers to purchase our products. Our operating results may fluctuate substantially due to reductions and delays in research and development expenditures by these customers. For example, reductions in capital and operating expenditures by these customers may result in lower than expected sales of our systems and IFCs. These reductions and delays may result from factors that are not within our control, such as:
• | changes in economic conditions; |
• | natural disasters; |
• | changes in government programs that provide funding to research institutions and companies; |
• | changes in the regulatory environment affecting life science and Ag-Bio companies engaged in research and commercial activities; |
• | differences in budget cycles across various geographies and industries; |
• | market-driven pressures on companies to consolidate operations and reduce costs; |
• | mergers and acquisitions in the life science and Ag-Bio industries; and |
• | other factors affecting research and development spending. |
Any decrease in our customers’ budgets or expenditures, or in the size, scope, or frequency of capital or operating expenditures, could materially and adversely affect our operations or financial condition.
If one or more of our manufacturing facilities become unavailable or inoperable, we will be unable to continue manufacturing our instruments, IFCs, assays and/or reagents and, as a result, our business will be harmed until we are able to secure a new facility.
We manufacture all of our genomics analytical and preparatory instruments and integrated fluidic circuits, or IFCs, for commercial sale at our facility in Singapore, our proteomics analytical instruments for commercial sale at our facility in Canada, and our assays and reagents for commercial sale at our facility in South San Francisco. No other manufacturing facilities are currently available to us, particularly facilities of the size and scope required by our Singapore and Canada operations. Our facilities and the equipment we use to manufacture our instruments, IFCs, assays, and reagents would be costly to replace and could require substantial lead time to repair or replace. Our facilities may be harmed or rendered inoperable by natural or man-made disasters, which may render it difficult or impossible for us to manufacture our products for some period of time. If any of our facilities become unavailable to us, we cannot provide assurances that we will be able to secure a new manufacturing facility on acceptable terms, if at all. The inability to manufacture our products, combined with our limited inventory of manufactured supplies, may result in the loss of customers or harm our reputation, and we may be unable to reestablish relationships with those customers in the future. Although we possess insurance for damage to our property and the disruption of our business, this insurance may not be sufficient to cover all of our potential losses and may not continue to be available to us on acceptable terms, or at all. If our manufacturing capabilities are impaired, we may not be able to manufacture and ship our products in a timely manner, which would adversely impact our business. We are in the process of relocating our manufacturing facility for Helios/CyTOF 2 and other proteomics products in Canada, which could result in delays or disruptions in manufacturing and which could have an adverse effect on our revenues or operating results.
17
We generate a substantial portion of our revenue internationally and are subject to various risks relating to such international activities, which could adversely affect our sales and operating performance. In addition, any disruption or delay in the shipping or off-loading of our products, whether domestically or internationally, may have an adverse effect on our financial condition and results of operations.
During the years 2015, 2014, and 2013, approximately 52%, 49%, and 48%, respectively, of our product and service revenue was generated from sales to customers located outside of the United States. We believe that a significant percentage of our future revenue will come from international sources as we expand our international operations and develop opportunities in other countries. Engaging in international business inherently involves a number of difficulties and risks, including:
• | required compliance with existing and changing foreign regulatory requirements and laws that are or may be applicable to our business in the future, such as the RoHS and WEEE directives, which regulate the use of certain hazardous substances in, and require the collection, reuse, and recycling of waste from, products we manufacture; |
• | required compliance with anti-bribery laws, such as the U.S. Foreign Corrupt Practices Act and U.K. Bribery Act, data privacy requirements, labor laws, and anti-competition regulations; |
• | export or import restrictions; |
• | laws and business practices favoring local companies; |
• | longer payment cycles and difficulties in enforcing agreements and collecting receivables through certain foreign legal systems; |
• | unstable economic, political, and regulatory conditions; |
• | potentially adverse tax consequences, tariffs, customs charges, bureaucratic requirements, and other trade barriers; |
• | difficulties and costs of staffing and managing foreign operations; and |
• | difficulties protecting or procuring intellectual property rights. |
If one or more of these risks occurs, it could require us to dedicate significant resources to remedy, and if we are unsuccessful in finding a solution, our financial results will suffer.
In addition, a majority of our product sales are currently denominated in U.S. dollars and fluctuations in the value of the U.S. dollar relative to foreign currencies could decrease demand for our products and adversely impact our financial performance. For example, if the value of the U.S. dollar increases relative to foreign currencies, our products could become more costly to the international consumer and therefore less competitive in international markets, or if the value of the U.S. dollar decreases relative to the Singapore dollar or the Canadian dollar, it would become more costly in U.S. dollars for us to manufacture our products in Singapore and/or in Canada. Additionally, our expenses are generally denominated in the currencies of the countries in which our operations are located, which is primarily in the United States, with a portion of expenses incurred in Singapore and Canada where a significant portion of our manufacturing operations are located. Our results of operations and cash flows are, therefore, subject to fluctuations due to changes in foreign currency exchange rates. The volatility of exchange rates depends on many factors that we cannot forecast with reliable accuracy. We have experienced and will continue to experience fluctuations in our net income or loss as a result of transaction gains or losses related to revaluing certain current asset and current liability balances that are denominated in currencies other than the functional currency of the entities in which they are recorded. For example, for the years ended December 31, 2015, 2014, and 2013, we experienced foreign currency losses of $1.6 million, $1.1 million, and $0.5 million, respectively. Fluctuations in currency exchange rates could have an adverse impact on our financial results in the future.
We rely on shipping providers to deliver products to our customers globally. Labor, tariff, or World Trade Organization-related disputes, piracy, physical damage to shipping facilities or equipment caused by severe weather or terrorist incidents, congestion at shipping facilities, inadequate equipment to load, dock, and offload our products, energy-related tie-ups, or other factors could disrupt or delay shipping or off-loading of our products domestically and internationally. Such disruptions or delays may have an adverse effect on our financial condition and results of operations.
18
We are dependent on single and sole source suppliers for some of the components and materials used in our products, and the loss of any of these suppliers could harm our business.
We rely on single and sole source suppliers for certain components and materials used in our products. Additionally, several of our instruments are assembled at the facilities of contract manufacturers in Singapore. We do not have long term contracts with our suppliers of these components and materials or our assembly service providers. The loss of a single or sole source supplier of any of the following components and/or materials would require significant time and effort to locate and qualify an alternative source of supply, if at all:
• | The IFCs used in our microfluidic systems are fabricated using a specialized polymer, and other specialized materials, that are available from a limited number of sources. In the past, we have encountered quality issues that have reduced our manufacturing yield or required the use of additional manufacturing processes. |
• | Specialized pneumatic and electronic components for our C1, Callisto, Juno, and Polaris systems are available from a limited number of sources. |
• | The electron multiplier detector included in the Helios/CyTOF 2 systems and certain metal isotopes used with the Helios/CyTOF 2 systems are purchased from sole source suppliers. |
• | The nickel sampler cone used with the Helios/CyTOF 2 systems is purchased from single source suppliers and is available from a limited number of sources. |
• | The raw materials for our Delta Gene and SNP Type assays and Access Array target-specific primers are available from a limited number of sources. |
Our reliance on single and sole source suppliers and assembly service providers also subjects us to other risks that could harm our business, including the following:
• | we may be subject to increased component or assembly costs; |
• | we may not be able to obtain adequate supply or services in a timely manner or on commercially reasonable terms; |
• | our suppliers or service providers may make errors in manufacturing or assembly of components that could negatively affect the efficacy of our products or cause delays in shipment of our products; and |
• | our suppliers or service providers may encounter capacity constraints or financial hardships unrelated to our demand for components or services, which could inhibit their ability to fulfill our orders and meet our requirements. |
We have in the past experienced quality control and supply problems with some of our suppliers, such as manufacturing errors, and may again experience problems in the future. We may not be able to quickly establish additional or replacement suppliers, particularly for our single source components, or assembly service providers. Any interruption or delay in the supply of components or materials or assembly of our instruments, or our inability to obtain components, materials, or assembly services from alternate sources at acceptable prices in a timely manner, could impair our ability to meet the demand of our customers and cause them to cancel orders or switch to competitive products.
Our future success is dependent upon our ability to expand our customer base and introduce new applications.
Our customer base is primarily composed of academic institutions, clinical laboratories that use our technology to develop tests, and pharmaceutical, biotechnology, and agricultural biotechnology, or Ag-Bio, companies that perform analyses for research and commercial purposes. Our success will depend, in part, upon our ability to increase our market share among these customers, attract additional customers outside of these markets, and market new applications to existing and new customers as we develop such applications. Attracting new customers and introducing new applications require substantial time and expense. For example, it may be difficult to identify, engage, and market to customers who are unfamiliar with the current applications of our systems. Any failure to expand our existing customer base or launch new applications would adversely affect our ability to increase our revenue.
19
We may not be able to develop new products or enhance the capabilities of our existing systems to keep pace with rapidly changing technology and customer requirements, which could have a material adverse effect on our business, revenue, financial condition, and operating results.
Our success depends on our ability to develop new products and applications for our technology in existing and new markets, while improving the performance and cost-effectiveness of our systems. New technologies, techniques, or products could emerge that might offer better combinations of price and performance than our current or future product lines and systems. Existing markets for our products, including single-cell biology and production genomics, as well as potential markets for our products such as high-throughput DNA sequencing and molecular diagnostics applications, are characterized by rapid technological change and innovation. It is critical to our success for us to anticipate changes in technology and customer requirements and to successfully introduce new, enhanced, and competitive technology to meet our customers’ and prospective customers’ needs on a timely and cost-effective basis. Developing and implementing new technologies will require us to incur substantial development costs and we may not have adequate resources available to be able to successfully introduce new applications of, or enhancements to, our systems. We cannot guarantee that we will be able to maintain technological advantages over emerging technologies in the future. While we typically plan improvements to our systems, we may not be able to successfully implement these improvements. If we fail to keep pace with emerging technologies, demand for our systems will not grow and may decline, and our business, revenue, financial condition, and operating results could suffer materially. In addition, if we introduce enhanced systems but fail to manage product transitions effectively, customers may delay or forgo purchases of our systems and our operating results may be adversely affected by product obsolescence and excess inventory. Even if we successfully implement some or all of these planned improvements, we cannot guarantee that our current and potential customers will find our enhanced systems to be an attractive alternative to existing technologies, including our current products.
We have incurred losses since inception, and we may continue to incur substantial losses for the foreseeable future.
We have a limited operating history and have incurred significant losses in each fiscal year since our inception, including net losses of $53.3 million, $52.8 million, and $16.5 million during the years 2015, 2014, and 2013, respectively. As of December 31, 2015, we had an accumulated deficit of $363.5 million. These losses have resulted principally from costs incurred in our research and development programs, and from our manufacturing costs and selling, general, and administrative expenses. We believe that our continued investment in research and development, sales, and marketing is essential to our long-term competitive position and future growth, and we expect these expenses will increase in future periods. We also expect that our selling, general, and administrative expenses will continue to increase due to the additional operational costs associated with the growth of our business. Until we are able to generate additional revenue to support our level of operating expenses, we will continue to incur operating and net losses and negative cash flow from operations. Because of the numerous risks and uncertainties associated with our commercialization efforts and future product development, we are unable to predict when we will become profitable, and we may never become profitable. Even if we do achieve profitability, we may not be able to sustain or increase our profitability.
Impairment of our goodwill or other intangible assets could materially and adversely affect our business, operating results, and financial condition.
As of December 31, 2015, we had approximately $202.9 million of goodwill and net intangible assets, net of amortization, of approximately $104.1 million and $98.8 million, respectively. These assets represent a significant portion of the assets recorded on our consolidated balance sheet and relate primarily to our acquisition of DVS in February 2014. In addition, if in the future we acquire additional businesses, technologies, or other intangible assets, a substantial portion of the value of such assets may be recorded as goodwill or intangible assets.
The carrying amounts of goodwill and intangible assets are affected whenever events or changes in circumstances indicate that their carrying amounts may not be recoverable. We review goodwill and indefinite lived intangible assets for impairment at least annually and more frequently under certain circumstances. Other intangible assets that are deemed to have finite useful lives will continue to be amortized over their useful lives but must be reviewed for impairment when events or changes in circumstances indicate that the carrying amount of these assets may not be recoverable. Events or changes in circumstances that could affect the likelihood that we will be required to recognize an impairment charge include declines in our stock price or market capitalization, declines in our market share or revenues, an increase in our losses, rapid changes in technology, failure to achieve the benefits of capacity increases and utilization, significant litigation arising out of an acquisition, or other matters. In particular, these or other adverse events or changes in circumstances may affect the estimated undiscounted future operating cash flows expected to be derived from our goodwill and intangible assets. We have recently experienced substantial declines in our stock price, and continued weakness or further declines in our stock price increase the likelihood that we may be required to recognize impairment charges. Any impairment charges could have a material adverse
20
effect on our operating results and net asset value in the quarter in which we recognize the impairment charge. We cannot provide assurances that we will not in the future be required to recognize impairment charges.
If we are unable to recruit and retain key executives, scientists, and technical support personnel, we may be unable to achieve our goals.
Our performance is substantially dependent on the performance of our senior management, particularly Gajus V. Worthington, our president and chief executive officer. Additionally, to expand our research and product development efforts, we need key scientists skilled in areas such as molecular and cellular biology, assay development, and manufacturing. We also need highly trained technical support personnel with the necessary scientific background and ability to understand our systems at a technical level to effectively support potential new customers and the expanding needs of current customers. Competition for these people is intense. Because of the complex and technical nature of our systems and the dynamic market in which we compete, any failure to attract and retain a sufficient number of qualified employees could materially harm our ability to develop and commercialize our technology.
The loss of the services of any member of our senior management or our scientific or technical support staff might significantly delay or prevent the development of our products or achievement of other business objectives by diverting management’s attention to transition matters and identification of suitable replacements, if any, and could have a material adverse effect on our business. In addition, our research and product development efforts could be delayed or curtailed if we are unable to attract, train, and retain highly skilled employees, particularly, senior scientists and engineers. We do not maintain fixed term employment contracts or significant key man life insurance with any of our employees.
To use our products, our Biomark, EP1, and Helios/CyTOF 2 systems in particular, customers typically need to purchase specialized reagents. Any interruption in the availability of these reagents for use in our products could limit our ability to market our products.
Our products, our Biomark, EP1, and Helios/CyTOF 2 systems in particular, must be used in conjunction with one or more reagents designed to produce or facilitate the particular biological or chemical reaction desired by the user. Many of these reagents are highly specialized and available to the user only from a single supplier or a limited number of suppliers. Although we sell reagents for use with certain of our products, our customers may purchase these reagents directly from third-party suppliers, and we have no control over the supply of those materials. In addition, our products are designed to work with these reagents as they are currently formulated. We have no control over the formulation of reagents sold by third-party suppliers, and the performance of our products might be adversely affected if the formulation of these reagents is changed. If one or more of these reagents were to become unavailable or were reformulated, our ability to market and sell our products could be materially and adversely affected.
In addition, the use of a reagent for a particular process may be covered by one or more patents relating to the reagent itself, the use of the reagent for the particular process, the performance of that process, or the equipment required to perform the process. Typically, reagent suppliers, who are either the patent holders or their authorized licensees, sell the reagents along with a license or covenant not to sue with respect to such patents. The license accompanying the sale of a reagent often purports to restrict the purposes for which the reagent may be used. If a patent holder or authorized licensee were to assert against us or our customers that the license or covenant relating to a reagent precluded its use with our systems, our ability to sell and market our products could be materially and adversely affected. For example, our Biomark system involves real-time quantitative PCR, or qPCR. Leading suppliers of reagents for real-time qPCR reactions include Life Technologies Corporation (now part of Thermo Fisher Scientific) and Roche Diagnostics Corporation, who are our direct competitors, and their licensees. These real-time qPCR reagents are typically sold pursuant to limited licenses or covenants not to sue with respect to patents held by these companies. We do not have any contractual supply agreements for these real-time qPCR reagents, and we cannot assure you that these reagents will continue to be available to our customers for use with our systems, or that these patent holders will not seek to enforce their patents against us, our customers, or suppliers.
21
Being regulated as a medical device manufacturer by the U.S. Food and Drug Administration, or FDA, and foreign regulatory authorities, and seeking approval and/or clearance for our products, will take significant time and expense and may not result in FDA clearance or approval for the intended uses we believe are commercially attractive. If our products are successfully approved and/or cleared, we will be subject to ongoing and extensive regulatory requirements, which would increase our costs and divert resources away from other projects. If we fail to comply with these requirements, our business and financial condition could be adversely impacted.
Our products are currently labeled, promoted and sold to academic institutions, life sciences laboratories, and pharmaceutical, biotechnology, and Ag-Bio companies for research purposes only, or RUO, and are not designed for, or intended to be used for, diagnostic tests or as medical devices as currently marketed. Before we can begin to label and market our products for use as, or in the performance of, clinical diagnostics in the United States, thereby subjecting them to FDA regulation as medical devices, we would be required to obtain premarket 510(k) clearance or premarket approval from the FDA, unless an exception applies.
We have announced our plan to register with the FDA as a medical device manufacturer and list some of our products with the FDA pursuant to an FDA Class I listing for general purpose laboratory equipment. We currently expect to make initial filing in the near term. While this regulatory classification is exempt from certain FDA requirements, such as the need to submit a premarket notification commonly known as a 510(k), and most of the requirements of the FDA’s Quality System Regulations, or QSRs, we will be subject to ongoing FDA “general controls,” which include compliance with FDA regulations for labeling, inspections by the FDA, complaint evaluation, corrections and removals reporting, promotional restrictions, reporting adverse events or malfunctions for our products, and general prohibitions against misbranding and adulteration.
In addition, we plan to submit 510(k) premarket notifications to the FDA to obtain FDA clearance of certain of our products on a selected basis. Although we plan to submit 510(k) applications for certain of our products, it is possible that the FDA will take the position that a more burdensome premarket application, such as a premarket approval application or a de novo application is required for some of our products. If such applications are required, greater time and investment would be required to obtain FDA approval. Even if the FDA agrees that a 510(k) is appropriate, FDA clearance can be expensive and time consuming. It generally takes a significant amount of time to prepare a 510(k), including conducting appropriate testing on our products, and several months to years for the FDA to review a submission. Notwithstanding the effort and expense, FDA clearance or approval may be denied for some or all of our products. Even if we were to obtain regulatory approval or clearance, it may not be for the uses we believe are important or commercially attractive.
If we receive regulatory clearance or approval for our products, we will be subject to ongoing FDA obligations and continued regulatory oversight and review, including the general controls listed above and the FDA’s QSRs for our manufacturing operations. In addition, we may be required to obtain a new 510(k) clearance before we can introduce subsequent modifications or improvements to our products. We may also be subject to additional FDA post-marketing obligations, any or all of which would increase our costs and divert resources away from other projects. If we are not able to maintain regulatory compliance with applicable laws, we may be prohibited from marketing our products for use as, or in the performance of, clinical diagnostics and/or may be subject to enforcement actions, including warning letters and adverse publicity, fines, injunctions, and civil penalties; recall or seizure of products; operating restrictions; and criminal prosecution.
We intend to seek similar regulatory clearance or approval for our products in countries outside of the United States. Sales of our products outside the United States will be subject to foreign regulatory requirements, which vary greatly from country to country. As a result, the time required to obtain clearances or approvals outside the United States may differ from that required to obtain FDA clearance or approval and we may not be able to obtain foreign regulatory approvals on a timely basis or at all. Clearance or approval by the FDA does not ensure approval by regulatory authorities in other countries, and approval by one foreign regulatory authority does not ensure approval by regulatory authorities in other countries or by the FDA. In Europe, we will need to comply with the Medical Device Directive 93/42 EEC, which is required to market medical devices in the European Union. We also intend to seek certification under ISO 13485, the European Quality Standard applicable to medical device manufacturers. In addition, the FDA regulates exports of medical devices. Failure to comply with these regulatory requirements or obtain and maintain required approvals, clearances and certifications could impair our ability to commercialize our products for diagnostic use outside of the United States.
22
Our products could become subject to regulation as medical devices by the FDA or other regulatory agencies before we have obtained regulatory clearance or approval to market our products for diagnostic purposes, which would adversely impact our ability to market and sell our products and harm our business.
As products that are currently labeled, promoted and intended for RUO, our products are not currently subject to regulation as medical devices by the FDA or comparable agencies of other countries. However, the FDA or comparable agencies of other countries could disagree with our conclusion that our products are currently intended for research use only or deem our current marketing and promotional efforts as being inconsistent with research use only products. For example, our customers may independently elect to use our research use only labeled products in their own laboratory developed tests, or LDTs, for clinical diagnostic use. The FDA has historically exercised enforcement discretion in not enforcing the medical device regulations against laboratories offering LDTs. However, on October 3, 2014, the FDA issued two draft guidance documents that set forth the FDA’s proposed risk-based framework for regulating LDTs, which are designed, manufactured, and used within a single laboratory. The draft guidance documents provide the anticipated details through which the FDA would propose to establish an LDT oversight framework, including premarket review for higher-risk LDTs, such as those that have the same intended use as FDA-approved or cleared companion diagnostics currently on the market. The FDA held a public workshop and accepted comments on the two draft guidance documents and is currently assessing next steps for implementing the framework for regulating LDTs. At the same time, various legislative proposals have been floated that would take differing approaches to the regulation of LDTs. It is also possible that companies or associations will attempt to bring litigation against the FDA arguing that the FDA lacks legal authority over LDTs. We cannot predict how these various efforts will be resolved, how FDA will regulate LDTs in the future, or how that regulatory system will impact our business.
Additionally, on November 25, 2013, the FDA issued Final Guidance “Distribution of In Vitro Diagnostic Products Labeled for Research Use Only.” The guidance emphasizes that the FDA will review the totality of the circumstances when it comes to evaluating whether equipment and testing components are properly labeled as RUO. The final guidance states that merely including a labeling statement that the product is for research purposes only will not necessarily render the device exempt from the FDA’s clearance, approval, and other regulatory requirements if the circumstances surrounding the distribution of the product indicate that the manufacturer knows its product is, or intends for its product to be, used for clinical diagnostic purposes. These circumstances may include written or verbal marketing claims or links to articles regarding a product’s performance in clinical applications and a manufacturer’s provision of technical support for clinical applications.
If the FDA modifies its approach to our products labeled and intended for RUO, or otherwise determines our products or related applications should be subject to additional regulation as in vitro diagnostic devices based upon customers’ use of our products for clinical diagnostic or therapeutic purposes, before we have obtained regulatory clearance or approval to market our products for diagnostic purposes, our ability to market and sell our products could be impeded and our business, prospects, results of operations and financial condition may be adversely affected. In addition, if the FDA determines that our products labeled for RUO were intended, based on a review of the totality of circumstances, for use in clinical investigation or diagnosis, those products could be considered misbranded or adulterated under the Federal Food, Drug, and Cosmetic Act and subject to recall and/or other enforcement action.
Compliance or the failure to comply with current and future regulations affecting our products and business operations worldwide, such as environmental regulations enacted in the European Union, could cause us significant expense and adversely impact our business.
We are subject to many federal, state, local, and foreign regulations relating to various aspects of our business operations. Governmental entities at all levels are continuously enacting new regulations, and it is difficult to identify all applicable regulations and anticipate how such regulations will be implemented and enforced. We continue to evaluate the necessary steps for compliance with applicable regulations. To comply with applicable regulations, we have and will continue to incur significant expense and allocate valuable internal resources to manage compliance-related issues. In addition, such regulations could restrict our ability to expand or equip our facilities, or could require us to acquire costly equipment or to incur other significant expenses to comply with the regulations. For example, the Restriction on the Use of Certain Hazardous Substances in Electrical and Electronic Equipment Directive, or RoHS, and the Waste Electrical and Electronic Equipment Directive, or WEEE, enacted in the European Union, regulate the use of certain hazardous substances in, and require the collection, reuse, and recycling of waste from, products we manufacture. Certain of our products sold in these countries are subject to WEEE requirements may become subject to RoHS. These and similar regulations that have been or are in the process of being enacted in other countries may require us to redesign our products, use different types of materials in certain components, or source alternative components to ensure compliance with applicable standards, and may reduce the availability of parts and components used in our products by negatively impacting our suppliers’ ability to source parts and components in a timely and cost-effective manner.
23
Any such redesigns, required use of alternative materials, or limited availability of parts and components used in our products may detrimentally impact the performance of our products, add greater testing lead times for product introductions, reduce our product margins, or limit the markets for our products, and if we fail to comply with any present and future regulations, we could be subject to future fines, penalties, and restrictions, such as the suspension of manufacturing of our products or a prohibition on the sale of products we manufacture. Any of the foregoing could adversely affect our business, financial condition, or results of operations.
If we fail to maintain effective internal control over financial reporting in the future, the accuracy and timing of our financial reporting may be impaired, which could adversely affect our business and our stock price.
The Sarbanes-Oxley Act requires, among other things, that we maintain effective internal control over financial reporting and disclosure controls and procedures. In particular, we must perform system and process evaluation and testing of our internal control over financial reporting to allow management to report on the effectiveness of our internal control over financial reporting, as required by Section 404 of the Sarbanes-Oxley Act. Our testing may reveal deficiencies in our internal control over financial reporting that are deemed to be material weaknesses.
Our compliance with Section 404 requires that we incur substantial accounting expense and expend significant management time on compliance-related issues. We currently do not have an internal audit group, and we continue to evaluate our need for additional accounting and financial staff with appropriate public company experience and technical accounting knowledge. Moreover, if we do not comply with the requirements of Section 404, or if we or our independent registered public accounting firm identify deficiencies in our internal control over financial reporting that are deemed to be material weaknesses, the market price of our stock could decline and we could be subject to sanctions or investigations by the NASDAQ Global Select Market, or NASDAQ, the SEC or other regulatory authorities, which would require additional financial and management resources.
Our future capital needs are uncertain and we may need to raise additional funds in the future, which may cause dilution to stockholders or may be upon terms that are not favorable to us.
We believe that our existing cash and cash equivalents will be sufficient to meet our anticipated cash requirements for at least the next 18 months. We have continued to experience losses and, if that trend continues, we may need to seek additional sources of financing. In addition, we may need to raise substantial additional capital for various purposes, including:
• | expanding the commercialization of our products; |
• | funding our operations; |
• | furthering our research and development; and |
• | acquiring other businesses or assets and licensing technologies. |
Our future funding requirements will depend on many factors, including:
• | market acceptance of our products; |
• | the cost of our research and development activities; |
• | the cost of filing and prosecuting patent applications; |
• | the cost of defending any litigation including intellectual property, employment, contractual or other litigation; |
• | the cost and timing of regulatory clearances or approvals, if any; |
• | the cost and timing of establishing additional sales, marketing, and distribution capabilities; |
• | the cost and timing of establishing additional technical support capabilities; |
• | the effect of competing technological and market developments; and |
24
• | the extent to which we acquire or invest in businesses, products, and technologies, although we currently have no commitments or agreements relating to any of these types of transactions. |
We cannot assure you that we will be able to obtain additional funds on acceptable terms, or at all. If we raise additional funds by issuing equity securities, our stockholders may experience dilution. Debt financing, if available, may involve covenants restricting our operations or our ability to incur additional debt. Any debt or additional equity financing that we raise may contain terms that are not favorable to us or our stockholders. If we raise additional funds through collaboration and licensing arrangements with third parties, it may be necessary to relinquish some rights to our technologies or our products, or grant licenses on terms that are not favorable to us. If we are unable to raise adequate funds, we may have to liquidate some or all of our assets, delay development or commercialization of our products, or license to third parties the rights to commercialize products or technologies that we would otherwise seek to commercialize. We also may have to reduce marketing, customer support, or other resources devoted to our products, or cease operations. Any of these factors could harm our operating results.
We are subject to risks related to taxation in multiple jurisdictions and if taxing authorities disagree with our interpretations of existing tax laws or regulations, our effective income tax rate could be adversely affected and we could have additional tax liability.
We are subject to income taxes in both the United States and certain foreign jurisdictions. Significant judgments based on interpretations of existing tax laws or regulations are required in determining the provision for income taxes. For example, we have made certain interpretations of existing tax laws or regulations based upon the operations of our business internationally and we have implemented intercompany agreements based upon these interpretations and related transfer pricing analyses. If the U.S. Internal Revenue Service or other taxing authorities disagree with the positions, our effective income tax rate could be adversely affected and we could have additional tax liability, including interest and penalties. We recently completed a review of our European corporate structure and tax positions and, based upon our existing business operations, we plan to restructure our European intercompany transactions, which is likely to increase our income tax liability. From time to time, we may review our corporate structure and tax positions in other international jurisdictions and such review may result in additional changes to how we structure our international business operations, which may adversely impact our effective income tax rate. Our effective income tax rate could also be adversely affected by changes in the mix of earnings in tax jurisdictions with different statutory tax rates, changes in the valuation of deferred tax assets and liabilities, changes in existing tax laws or tax rates, changes in the level of non-deductible expenses (including share-based compensation), changes in our future levels of research and development spending, mergers and acquisitions, or the result of examinations by various tax authorities. Payment of additional amounts upon final adjudication of any disputes could have a material impact on our results of operations and financial position.
Adverse conditions in the global economy and disruption of financial markets may significantly harm our revenue, profitability, and results of operations.
The global credit and financial markets have in recent years experienced volatility and disruptions, including diminished liquidity and credit availability, increased concerns about inflation and deflation, and the downgrade of U.S. debt and exposure risks on other sovereign debts, decreased consumer confidence, lower economic growth, volatile energy costs, increased unemployment rates, and uncertainty about economic stability. Volatility and disruption of financial markets could limit our customers’ ability to obtain adequate financing or credit to purchase and pay for our products in a timely manner or to maintain operations, which could result in a decrease in sales volume that could harm our results of operations. General concerns about the fundamental soundness of domestic and international economies may also cause our customers to reduce their purchases. Changes in governmental banking, monetary, and fiscal policies to address liquidity and increase credit availability may not be effective. Significant government investment and allocation of resources to assist the economic recovery of sectors which do not include our customers may reduce the resources available for government grants and related funding for life science, Ag-Bio, and clinical research and development. Continuation or further deterioration of these financial and macroeconomic conditions could significantly harm our sales, profitability, and results of operations.
If we are unable to integrate future acquisitions successfully, our operating results and prospects could be harmed.
In addition to our acquisition of DVS, we may make additional acquisitions to improve our product offerings or expand into new markets. Our future acquisition strategy will depend on our ability to identify, negotiate, complete, and integrate acquisitions and, if necessary, to obtain satisfactory debt or equity financing to fund those acquisitions. Mergers and acquisitions are inherently risky, and any transaction we complete may not be successful. Our acquisition of DVS was our first acquisition of another company. Any merger or acquisition we may pursue would involve numerous risks, including but not limited to the following:
25
• | difficulties in integrating and managing the operations, technologies, and products of the companies we acquire; |
• | diversion of our management’s attention from normal daily operation of our business; |
• | our inability to maintain the key business relationships and the reputations of the businesses we acquire; |
• | our inability to retain key personnel of the acquired company; |
• | uncertainty of entry into markets in which we have limited or no prior experience and in which competitors have stronger market positions; |
• | our dependence on unfamiliar affiliates and customers of the companies we acquire; |
• | insufficient revenue to offset our increased expenses associated with acquisitions; |
• | our responsibility for the liabilities of the businesses we acquire, including those which we may not anticipate; and |
• | our inability to maintain internal standards, controls, procedures, and policies. |
We may be unable to secure the equity or debt funding necessary to finance future acquisitions on terms that are acceptable to us. If we finance acquisitions by issuing equity or convertible debt securities, our existing stockholders will likely experience dilution, and if we finance future acquisitions with debt funding, we will incur interest expense and may have to comply with financial covenants and secure that debt obligation with our assets.
If we are unable to manage our anticipated growth effectively, our business could be harmed.
The rapid growth of our business has placed a significant strain on our managerial, operational, and financial resources and systems. To execute our anticipated growth successfully, we must continue to attract and retain qualified personnel and manage and train them effectively. We must also upgrade our internal business processes and capabilities to create the scalability that a growing business demands.
We believe our facilities located in Singapore, Canada, and California, are sufficient to meet our short-term manufacturing needs. The current lease for our manufacturing facility in Singapore expires in June 2022. In the event that we need to add to our existing manufacturing space in Singapore or move our manufacturing facility to a new location in Singapore, such a move will involve significant expense and efforts in connection with the establishment of new clean rooms and the recommissioning of key manufacturing equipment. The current lease for our facility in Canada expires in April 2016. In August 2015, we entered into a lease for new office, laboratory and warehouse space in Canada and expect to relocate our Canada operations to the new space in April 2016. A move of any of our manufacturing facilities may delay or otherwise adversely affect our manufacturing activities and business.
Further, our anticipated growth will place additional strain on our suppliers and manufacturing facilities, resulting in an increased need for us to carefully monitor quality assurance. Any failure by us to manage our growth effectively could have an adverse effect on our ability to achieve our development and commercialization goals.
If we are unable to expand our direct sales and marketing force or distribution capabilities to adequately address our customers’ needs, our business may be adversely affected.
We may not be able to market, sell, and distribute our products effectively enough to support our planned growth. We sell our products primarily through our own sales force and through distributors in certain territories. Our future sales will depend in large part on our ability to develop and substantially expand our direct sales force and to increase the scope of our marketing efforts. Our products are technically complex and used for highly specialized applications. As a result, we believe it is necessary to develop a direct sales force that includes people with specific scientific backgrounds and expertise, and a marketing group with technical sophistication. Competition for such employees is intense. We may not be able to attract and retain personnel or be able to build an efficient and effective sales and marketing force, which could negatively impact sales of our products and reduce our revenue and profitability.
In addition, we may continue to enlist one or more sales representatives and distributors to assist with sales, distribution, and customer support globally or in certain regions of the world. If we do seek to enter into such arrangements, we may not be successful in attracting desirable sales representatives and distributors, or we may not be able to enter into such arrangements
26
on favorable terms. If our sales and marketing efforts, or those of any third-party sales representatives and distributors, are not successful, our technologies and products may not gain market acceptance, which would materially and adversely impact our business operations.
Risks associated with a company-wide implementation of an enterprise resource planning, or ERP, system may adversely affect our business and results of operations or the effectiveness of internal control over financial reporting.
We have been implementing a company-wide ERP system to handle the business and financial processes within our operations and corporate functions. ERP implementations are complex and time-consuming projects that involve substantial expenditures on system software and implementation activities that can continue for several years. ERP implementations also require transformation of business and financial processes in order to reap the benefits of the ERP system. Our business and results of operations may be adversely affected if we experience operating problems and/or cost overruns during the ERP implementation process, or if the ERP system and the associated process changes do not give rise to the benefits that we expect. If we do not effectively implement the ERP system as planned or if the system does not operate as intended, our business, results of operations, and internal controls over financial reporting may be adversely affected.
Changes in accounting principles, or interpretations thereof, could have a significant impact on our financial position and results of operations.
We prepare our consolidated financial statements in accordance with accounting principles generally accepted in the United States of America, referred to as GAAP. These principles are subject to interpretation by the SEC and various bodies formed to interpret and create appropriate accounting principles. A change in these principles can have a significant effect on our reported results and may even retroactively affect previously reported transactions. Additionally, the adoption of new or revised accounting principles may require that we make significant changes to our systems, processes and controls.
For example, the U.S.-based Financial Accounting Standards Board, referred to as FASB, is currently working together with the International Accounting Standards Board, referred to IASB, on several projects to further align accounting principles and facilitate more comparable financial reporting between companies who are required to follow GAAP under SEC regulations and those who are required to follow International Financial Reporting Standards outside of the United States. These efforts by the FASB and IASB may result in different accounting principles under GAAP that may result in materially different financial results for us in areas including, but not limited to, principles for recognizing revenue and lease accounting. Additionally, significant changes to GAAP resulting from the FASB’s and IASB’s efforts may require that we change how we process, analyze and report financial information and that we change financial reporting controls.
It is not clear if or when these potential changes in accounting principles may become effective, whether we have the proper systems and controls in place to accommodate such changes and the impact that any such changes may have on our financial position and results of operations.
Our ability to use net operating losses to offset future taxable income may be subject to certain limitations.
In general, under Section 382 of the Internal Revenue Code, a corporation that undergoes an “ownership change” is subject to limitations on its ability to utilize its pre-change net operating losses, or NOLs, to offset future taxable income. If we undergo one or more ownership changes, our ability to utilize NOLs could be limited by Section 382 of the Internal Revenue Code. Future changes in our stock ownership, some of which are outside of our control, could result in an ownership change under Section 382 of the Internal Revenue Code.
Risks Related to Intellectual Property
Our ability to protect our intellectual property and proprietary technology through patents and other means is uncertain.
Our commercial success depends in part on our ability to protect our intellectual property and proprietary technologies. We rely on patent protection, where appropriate and available, as well as a combination of copyright, trade secret, and trademark laws, and nondisclosure, confidentiality, and other contractual restrictions to protect our proprietary technology. However, these legal means afford only limited protection and may not adequately protect our rights or permit us to gain or keep any competitive advantage. We apply for patents covering our products and technologies and uses thereof, as we deem appropriate. However, we may fail to apply for patents on important products and technologies in a timely fashion or at all. Our pending U.S. and foreign patent applications may not issue as patents or may not issue in a form that will be sufficient to protect our proprietary technology and gain or keep our competitive advantage. Any patents we have obtained or do obtain may
27
be subject to re-examination, reissue, opposition, or other administrative proceeding, or may be challenged in litigation, and such challenges could result in a determination that the patent is invalid or unenforceable. In addition, competitors may be able to design alternative methods or devices that avoid infringement of our patents. Both the patent application process and the process of managing patent disputes can be time consuming and expensive.
Furthermore, the laws of some foreign countries may not protect our intellectual property rights to the same extent as do the laws of the United States, and many companies have encountered significant problems in protecting and defending such rights in foreign jurisdictions. Proceedings to enforce our patent rights in foreign jurisdictions could result in substantial cost and divert our efforts and attention from other aspects of our business. Changes in either the patent laws or in interpretations of patent laws in the United States or other countries may diminish the value of our intellectual property. We cannot predict the breadth of claims that may be allowed or enforced in our patents or in third-party patents. For example:
• | We might not have been the first to make the inventions covered by each of our pending patent applications; |
• | We might not have been the first to file patent applications for these inventions; |
• | The patents of others may have an adverse effect on our business; and |
• | Others may independently develop similar or alternative products and technologies or duplicate any of our products and technologies. |
To the extent our intellectual property, including licensed intellectual property, offers inadequate protection, or is found to be invalid or unenforceable, our competitive position and our business could be adversely affected.
We may be involved in lawsuits to protect or enforce our patents and proprietary rights, to determine the scope, coverage and validity of others’ proprietary rights, or to defend against third party claims of intellectual property infringement, any of which could be time-intensive and costly and may adversely impact our business or stock price.
Litigation may be necessary for us to enforce our patent and proprietary rights, determine the scope, coverage, and validity of others’ proprietary rights, and/or defend against third party claims of intellectual property infringement against us as well as against our suppliers, distributors, customers, and other entities with whom we do business. Litigation could result in substantial legal fees and could adversely affect the scope of our patent protection. The outcome of any litigation or other proceeding is inherently uncertain and might not be favorable to us, and we might not be able to obtain licenses to technology that we require. Even if such licenses are obtainable, they may not be available at a reasonable cost. We could therefore incur substantial costs related to royalty payments for licenses obtained from third parties, which could negatively affect our product margins or financial position. Further, we could encounter delays in product introductions, or interruptions in product sales, as we develop alternative methods or products.
As we move into new markets and applications for our products, incumbent participants in such markets may assert their patents and other proprietary rights against us as a means of impeding our entry into such markets or as a means to extract substantial license and royalty payments from us. Our commercial success may depend in part on our non-infringement of the patents or proprietary rights of third parties. Numerous significant intellectual property issues have been litigated, and will likely continue to be litigated, between existing and new participants in our existing and targeted markets. For example, some of our products provide for the testing and analysis of genetic material, and patent rights relating to genetic materials remain a developing area of patent law. A recent U.S. Supreme Court decision held, among other things, that claims to isolated genomic DNA occurring in nature are not patent eligible, while claims relating to synthetic DNA may be patent eligible. We expect the ruling will result in additional litigation in our industry. In addition, third parties may assert that we are employing their proprietary technology without authorization. For example, on June 4, 2008 we received a letter from Applied Biosystems, Inc., a wholly-owned subsidiary of Life Technologies Corporation (now part of Thermo Fisher Scientific Inc. and collectively referred to as Life), asserting that our Biomark system for gene expression analysis infringes upon U.S. Patent No. 6,814,934, or the ‘934 patent, and its foreign counterparts in Europe and Canada. In June 2011, we resolved this dispute by entering into license agreements with Life which, among other matters, granted us a non-exclusive license to the ‘934 patent and its foreign counterparts.
Our customers have been sued for various claims of intellectual property infringement in the past, and we expect that our customers will be involved in additional litigation in the future. In particular, our customers may become subject to lawsuits claiming that their use of our products infringes third-party patent rights, and we could become subject to claims that we contributed to or induced our customer’s infringement. In addition, our agreements with some of our suppliers, distributors, customers, and other entities with whom we do business may require us to defend or indemnify these parties to the extent they
28
become involved in infringement claims against us, including the claims described above. We could also voluntarily agree to defend or indemnify third parties in instances where we are not obligated to do so if we determine it would be important to our business relationships. If we are required or agree to defend or indemnify any of these third parties in connection with any infringement claims, we could incur significant costs and expenses that could adversely affect our business, operating results, or financial condition.
We may be subject to damages resulting from claims that we or our employees have wrongfully used or disclosed alleged trade secrets of our employees’ former employers or other institutions or third parties with whom such employees may have been previously affiliated.
Many of our employees were previously employed at universities or other life science or Ag-Bio companies, including our competitors or potential competitors. Although no claims against us are currently pending, we have in the past received notices from third parties alleging potential disclosures of confidential information. We may become subject to claims that our employees or we have inadvertently or otherwise used or disclosed trade secrets or other proprietary information of their former employers or other third parties or institutions with whom our employees may have been previously affiliated. Litigation may be necessary to defend against these claims. For example, a third party competitor recently initiated litigation against a newly hired Fluidigm employee alleging, among other claims, misappropriation of proprietary information and breach of contractual and fiduciary obligations to the third party. Although we are not currently a party to this litigation, we cannot provide assurances that the third party will not bring claims against Fluidigm with respect to this employee or other employees that we have hired or may hire who were previously associated with the third party. If we fail in defending such claims, in addition to paying monetary damages or the potential for injunctive relief against us, in some instances we may lose valuable intellectual property rights. A loss of key research personnel work product could hamper or prevent our ability to commercialize certain potential products or a loss or inability to hire key marketing, sales or research and development personnel could adversely affect our future product development, sales and revenues, any of which could severely harm our business. Even if we are successful in defending against these claims, litigation could result in substantial costs and be a distraction to management.
We depend on certain technologies that are licensed to us. We do not control these technologies and any loss of our rights to them could prevent us from selling our products, which would have an adverse effect on our business.
We rely on licenses in order to be able to use various proprietary technologies that are material to our business, including our core IFC, multi-layer soft lithography, and mass cytometry technologies. In some cases, we do not control the prosecution, maintenance, or filing of the patents to which we hold licenses, or the enforcement of these patents against third parties. Additionally, our business and product development plans anticipate and may substantially depend on future in-license agreements with additional third parties, some of which are currently in the early discussion phase. For example, Fluidigm Canada Inc., or Fluidigm Canada, an Ontario corporation and wholly-owned subsidiary of Fluidigm Sciences, was party to an interim license agreement, now expired, with Nodality, Inc., or Nodality, under which Nodality granted Fluidigm Canada a worldwide, non-exclusive, research use only, royalty bearing license to certain cytometric reagents, instruments, and other products. We have had prior discussions with Nodality to reinstate the license agreement. We cannot provide assurances that we will be able to reinstate the license agreement with Nodality or secure a new license agreement with Nodality or other third parties on acceptable terms, if at all.
In-licensed intellectual property rights that are fundamental to the business being operated present numerous risks and limitations. For example, all or a portion of the license rights granted may be limited for research use only, and in the event we attempt to expand into diagnostic applications, we would be required to negotiate additional rights, which may not be available to us on commercially reasonable terms, if at all.
Our rights to use the technology we license are also subject to the negotiation and continuation of those licenses. Certain of our licenses contain provisions that allow the licensor to terminate the license upon specific conditions. Our rights under the licenses are subject to our continued compliance with the terms of the license, including the payment of royalties due under the license. Because of the complexity of our products and the patents we have licensed, determining the scope of the license and related royalty obligation can be difficult and can lead to disputes between us and the licensor. An unfavorable resolution of such a dispute could lead to an increase in the royalties payable pursuant to the license. If a licensor believed we were not paying the royalties due under the license or were otherwise not in compliance with the terms of the license, the licensor might attempt to revoke the license. If such an attempt were successful and the license is terminated, we might be barred from marketing, producing, and selling some or all of our products, which would have an adverse effect on our business. Potential disputes between us and one of our existing licensors concerning the terms or conditions of the applicable license agreement could result, among other risks, in substantial management distraction; increased expenses associated with litigation or efforts to resolve disputes; substantial customer uncertainty concerning the direction of our product lines; potential infringement claims against us and/or our customers, which could include efforts by a licensor to enjoin sales of our products; customer
29
requests for indemnification by us; and, in the event of an adverse determination, our inability to operate our business as currently operated. Termination of material license agreements could prevent us from manufacturing and selling our products unless we can negotiate new license terms or develop or acquire alternative intellectual property rights that cover or enable similar functionality. Any of these factors would be expected to have a material adverse effect on our business, operating results, and financial condition and could result in a substantial decline in our stock price.
We are subject to certain manufacturing restrictions related to licensed technologies that were developed with the financial assistance of U.S. governmental grants.
We are subject to certain U.S. government regulations because we have licensed technologies that were developed with U.S. government grants. In accordance with these regulations, these licenses provide that products embodying the technologies are subject to domestic manufacturing requirements. If this domestic manufacturing requirement is not met, the government agency that funded the relevant grant is entitled to exercise specified rights, referred to as “march-in rights,” which if exercised would allow the government agency to require the licensors or us to grant a non-exclusive, partially exclusive, or exclusive license in any field of use to a third party designated by such agency. All of our microfluidic systems revenue is dependent upon the availability of our IFCs, which incorporate technology developed with U.S. government grants. All of our instruments, including microfluidic systems, and IFCs for commercial sale are manufactured at our facility in Singapore. The federal regulations allow the funding government agency to grant, at the request of the licensors of such technology, a waiver of the domestic manufacturing requirement. Waivers may be requested prior to any government notification. We have assisted the licensors of these technologies with the analysis of the domestic manufacturing requirement, and, in December 2008, the sole licensor subject to the requirement applied for a waiver of the domestic manufacturing requirement with respect to the relevant patents licensed to us by this licensor. In July 2009, the funding government agency granted the requested waiver of the domestic manufacturing requirement for a three-year period commencing in July 2009. In June 2012, the licensor requested a continued waiver of the domestic manufacturing requirement with respect to the relevant patents, but the government agency has not yet taken any action in response to this request. If the government agency does not grant the requested waiver or the government fails to grant additional waivers of such requirement that may be sought in the future, then the U.S. government could exercise its march-in rights with respect to the relevant patents licensed to us. In addition, the license agreement under which the relevant patents are licensed to us contains provisions that obligate us to comply with this domestic manufacturing requirement. We are not currently manufacturing instruments and IFCs in the United States that incorporate the relevant licensed technology. If our lack of compliance with this provision constituted a material breach of the license agreement, the license of the relevant patents could be terminated or we could be compelled to relocate our manufacturing of microfluidic systems and IFCs to the United States to avoid or cure a material breach of the license agreement. Any of the exercise of march-in rights, the termination of our license of the relevant patents or the relocation of our manufacturing of microfluidic systems and IFCs to the United States could materially adversely affect our business, operations and financial condition.
We are subject to certain obligations and restrictions relating to technologies developed in cooperation with Canadian government agencies.
Some of our Canadian research and development is funded in part through government grants and by government agencies. The intellectual property developed through these projects is subject to rights and restrictions in favor of government agencies and Canadians generally. In most cases the government agency retains the right to use intellectual property developed through the project for non-commercial purposes and to publish the results of research conducted in connection with the project. This may increase the risk of public disclosure of information relating to our intellectual property, including confidential information, and may reduce its competitive advantage in commercializing intellectual property developed through these projects. In certain projects, we have also agreed to use commercially reasonable efforts to commercialize intellectual property in Canada, or more specifically in the province of Ontario, for the economic benefit of Canada and the province of Ontario. These restrictions will limit our choice of business and manufacturing locations, business partners and corporate structure and may, in certain circumstances, restrict our ability to achieve maximum profitability and cost efficiency from the intellectual property generated by these projects. In one instance, a dispute with the applicable government funded entity may require mediation, which could lead to unanticipated delays in our commercialization efforts to that project. One of our Canadian government funded projects is also subject to certain limited “march-in” rights in favor of the government of the Province of Ontario, under which we may be required to grant a license to our intellectual property, including background intellectual property developed outside the scope of the project, to a responsible applicant on reasonable terms in circumstances where the government determines that such a license is necessary in order to alleviate emergency or extraordinary health or safety needs or for public use. In addition, we must provide reasonable assistance to the government in obtaining similar licenses from third parties required in connection with the use of its intellectual property. Instances in which the government of the Province of Ontario has exercised similar “march-in” rights are rare; however, the exercise of such rights could materially adversely affect our business, operations and financial condition.
30
Risks Related to Our Common Stock
Our stock price may fluctuate significantly, particularly if holders of substantial amounts of our stock attempt to sell, and holders may have difficulty selling their shares based on current trading volumes of our stock. In addition, numerous other factors could result in substantial volatility in the trading price of our stock.
Our stock is currently traded on NASDAQ, but we can provide no assurance that we will be able to maintain an active trading market on NASDAQ or any other exchange in the future. The trading volume of our stock tends to be low relative to our total outstanding shares, and we have several stockholders who hold substantial blocks of our stock. As of December 31, 2015, we had 28,844,206 shares of common stock outstanding, and stockholders holding at least 5% of our stock, individually or with affiliated persons or entities, collectively beneficially owned or controlled approximately 58% of such shares. Sales of large numbers of shares by any of our large stockholders could adversely affect our trading price, particularly given our relatively small historic trading volumes. If stockholders holding shares of our common stock sell, indicate an intention to sell, or if it is perceived that they will sell, substantial amounts of their common stock in the public market, the trading price of our common stock could decline. Moreover, if there is no active trading market or if the volume of trading is limited, holders of our common stock may have difficulty selling their shares.
In addition, the trading price of our common stock may be highly volatile and could be subject to wide fluctuations in response to various factors, some of which are beyond our control. These factors include:
• | actual or anticipated quarterly variation in our results of operations or the results of our competitors; |
• | announcements or communications by us or our competitors relating to, among other things, new commercial products, technological advances, significant contracts, commercial relationships, capital commitments, acquisitions or sales of businesses, and/or misperceptions in or speculation by the market regarding such announcements or communications; |
• | issuance of new or changed securities analysts’ reports or recommendations for our stock; |
• | developments or disputes concerning our intellectual property or other proprietary rights; |
• | commencement of, or our involvement in, litigation; |
• | market conditions in the life science, Ag-Bio, and clinical research sectors; |
• | failure to complete significant sales; |
• | manufacturing disruptions that could occur if we were unable to successfully expand our production in our current or an alternative facility; |
• | any future sales of our common stock or other securities in connection with raising additional capital or otherwise; |
• | any major change to the composition of our board of directors or management; and |
• | general economic conditions and slow or negative growth of our markets. |
The stock market in general, and market prices for the securities of technology-based companies like ours in particular, have from time to time experienced volatility that often has been unrelated to the operating performance of the underlying companies. These broad market and industry fluctuations may adversely affect the market price of our common stock regardless of our operating performance. In several recent situations where the market price of a stock has been volatile, holders of that stock have instituted securities class action litigation against the company that issued the stock. If any of our stockholders were to bring a lawsuit against us, the defense and disposition of the lawsuit could be costly and divert the time and attention of our management and harm our operating results.
If securities or industry analysts publish unfavorable research about our business or cease to cover our business, our stock price and/or trading volume could decline.
The trading market for our common stock may rely, in part, on the research and reports that equity research analysts publish about us and our business. We do not have any control of the analysts or the content and opinions included in their
31
reports. The price of our stock could decline if one or more equity research analysts downgrade our stock or issue other unfavorable commentary or research. If one or more equity research analysts ceases coverage of our company or fails to publish reports on us regularly, demand for our stock could decrease, which in turn could cause our stock price or trading volume to decline.
Anti-takeover provisions in our charter documents and under Delaware law could make an acquisition of us, which may be beneficial to our stockholders, more difficult and may prevent attempts by our stockholders to replace or remove our current management and limit the market price of our common stock.
Provisions in our certificate of incorporation and bylaws may have the effect of delaying or preventing a change of control or changes in our management, including provisions that:
• | authorize our board of directors to issue, without further action by the stockholders, up to 10,000,000 shares of undesignated preferred stock; |
• | require that any action to be taken by our stockholders be effected at a duly called annual or special meeting and not by written consent; |
• | specify that special meetings of our stockholders can be called only by our board of directors, the chairman of the board, the chief executive officer or the president; |
• | establish an advance notice procedure for stockholder approvals to be brought before an annual meeting of our stockholders, including proposed nominations of persons for election to our board of directors; |
• | establish that our board of directors is divided into three classes, Class I, Class II, and Class III, with each class serving staggered three year terms; |
• | provide that our directors may be removed only for cause; |
• | provide that vacancies on our board of directors may be filled only by a majority of directors then in office, even though less than a quorum; |
• | specify that no stockholder is permitted to cumulate votes at any election of directors; and |
• | require a super-majority of votes to amend certain of the above-mentioned provisions. |
These provisions may frustrate or prevent any attempts by our stockholders to replace or remove our current management by making it more difficult for stockholders to replace members of our board of directors, which is responsible for appointing the members of our management. In addition, because we are incorporated in Delaware, we are governed by the provisions of Section 203 of the Delaware General Corporation Law, which limits the ability of stockholders owning in excess of 15% of our outstanding voting stock to merge or combine with us.
We have never paid dividends on our capital stock, and we do not anticipate paying any cash dividends in the foreseeable future.
We have paid no cash dividends on any of our classes of capital stock to date, have contractual restrictions against paying cash dividends, and currently intend to retain our future earnings to fund the development and growth of our business. As a result, capital appreciation, if any, of our common stock will be stockholders’ sole source of gain for the foreseeable future.
Risks Related to Our Outstanding 2.75% Senior Convertible Notes due 2034
Our outstanding 2.75% senior convertible notes due 2034 are effectively subordinated to our secured debt and any liabilities of our subsidiaries.
Our outstanding 2.75% senior convertible notes due 2034, which we refer to as our “notes”, rank:
• | senior in right of payment to any of our indebtedness that is expressly subordinated in right of payment to the notes; |
32
• | equal in right of payment to all of our liabilities that are not so subordinated; |
• | effectively junior in right of payment to any of our secured indebtedness to the extent of the value of the assets securing such indebtedness; and |
• | structurally junior to all indebtedness and other liabilities (including trade payables) of our subsidiaries. |
In February 2014, we completed our offering of notes with an aggregate outstanding principal amount of $201.3 million. In the event of our bankruptcy, liquidation, reorganization, or other winding up, our assets that secure debt ranking senior in right of payment to the notes will be available to pay obligations on the notes only after the secured debt has been repaid in full from these assets, and the assets of our subsidiaries will be available to pay obligations on the notes only after all claims senior to the notes have been repaid in full. There may not be sufficient assets remaining to pay amounts due on any or all of the notes then outstanding. The indenture governing the notes does not prohibit us from incurring additional senior debt or secured debt, nor does it prohibit our subsidiaries from incurring additional liabilities.
The notes are our obligations only and some of our operations are conducted through, and a portion of our consolidated assets are held by, our subsidiaries.
The notes are our obligations exclusively and are not guaranteed by any of our operating subsidiaries. A portion of our consolidated assets is held by our subsidiaries. Accordingly, our ability to service our debt, including the notes, depends in part on the results of operations of our subsidiaries and upon the ability of such subsidiaries to provide us with cash, whether in the form of dividends, loans, or otherwise, to pay amounts due on our obligations, including the notes. Our subsidiaries are separate and distinct legal entities and have no obligation, contingent or otherwise, to make payments on the notes or to make any funds available for that purpose. In addition, dividends, loans, or other distributions to us from such subsidiaries may be subject to contractual and other restrictions and are subject to other business and tax considerations.
Recent and future regulatory actions and other events may adversely affect the trading price and liquidity of the notes.
We expect that many investors in, and potential purchasers of, the notes will employ, or seek to employ, a convertible arbitrage strategy with respect to the notes. Investors would typically implement such a strategy by selling short the common stock underlying the notes and dynamically adjusting their short position while continuing to hold the notes. Investors may also implement this type of strategy by entering into swaps on our common stock in lieu of or in addition to short selling the common stock. As a result, any specific rules regulating equity swaps or short selling of securities or other governmental action that interferes with the ability of market participants to effect short sales or equity swaps with respect to our common stock could adversely affect the ability of investors in, or potential purchasers of, the notes to conduct the convertible arbitrage strategy that we believe they will employ, or seek to employ, with respect to the notes. This could, in turn, adversely affect the trading price and liquidity of the notes.
The SEC and other regulatory and self-regulatory authorities have implemented various rules and taken certain actions, and may in the future adopt additional rules and take other actions, that may impact those engaging in short selling activity involving equity securities (including our common stock). Such rules and actions include Rule 201 of SEC Regulation SHO, the adoption by the Financial Industry Regulatory Authority, Inc. and the national securities exchanges of a “Limit Up-Limit Down” program, the imposition of market-wide circuit breakers that halt trading of securities for certain periods following specific market declines, and the implementation of certain regulatory reforms required by the Dodd-Frank Wall Street Reform and Consumer Protection Act of 2010. Although the direction and magnitude of the effect that Regulation SHO, FINRA, securities exchange rule changes, and implementation of the Dodd-Frank Act may have on the trading price and the liquidity of the notes will depend on a variety of factors, many of which cannot be determined at the date of this report, past regulatory actions (such as certain emergency orders issued by the SEC in 2008 prohibiting short sales of stock of certain financial services companies) have had a significant impact on the trading prices and liquidity of convertible debt instruments. Any governmental or regulatory action that restricts the ability of investors in, or potential purchasers of, the notes to effect short sales of our common stock, borrow our common stock, or enter into swaps on our common stock or increases the costs of implementing an arbitrage strategy could adversely affect the trading price and the liquidity of the notes.
Volatility in the market price and trading volume of our common stock could adversely impact the trading price of the notes.
The stock market in recent years has experienced significant price and volume fluctuations that have often been unrelated to the operating performance of companies. The market price of our common stock could fluctuate significantly for many reasons, including in response to the risks described in this report, or for reasons unrelated to our operations, such as reports by
33
industry analysts, investor perceptions or negative announcements by our customers, competitors or suppliers regarding their own performance, as well as industry conditions and general financial, economic and political instability. The market price of our common stock could also decline as a result of sales of a large number of shares of our common stock in the market, particularly sales by our directors, executive officers, employees, and significant stockholders, and the perception that these sales could occur may also depress the market price of our common stock. A decrease in the market price of our common stock would likely adversely impact the trading price of the notes. The market price of our common stock could also be affected by possible sales of our common stock by investors who view the notes as a more attractive means of equity participation in us and by hedging or arbitrage trading activity that we expect to develop involving our common stock. This trading activity could, in turn, affect the trading price of the notes.
We may still incur substantially more debt or take other actions which would intensify the risks discussed above.
We are not restricted under the terms of the indenture governing the notes from incurring additional debt, securing existing or future debt, recapitalizing our debt, or taking a number of other actions that are not limited by the terms of the indenture governing the notes that could have the effect of diminishing our ability to make payments on the notes when due. Any failure by us or any of our significant subsidiaries to make any payment at maturity of indebtedness for borrowed money in excess of $15 million or the acceleration of any such indebtedness in excess of $15 million would, subject to the terms of the indenture governing the notes, constitute a default under the indenture. If the repayment of the related indebtedness were to be accelerated after any applicable notice or grace periods, we may not have sufficient funds to repay the notes when required.
We may not have the ability to raise the funds necessary to repurchase the notes upon specified dates or upon a fundamental change, and our future debt may contain limitations on our ability to repurchase the notes.
Holders of the notes have the right to require us to repurchase all or a portion of their notes on certain dates or upon the occurrence of a fundamental change at a repurchase price equal to 100% of the principal amount of the notes to be repurchased, plus accrued and unpaid interest, if any. We may not have enough available cash or be able to obtain financing at the time we are required to make repurchases of notes surrendered therefor.
In addition, our ability to repurchase the notes may be limited by law, regulatory authority, or agreements governing our future indebtedness. Our failure to repurchase notes at a time when the repurchase is required by the indenture would constitute a default under the indenture. A default under the indenture or the fundamental change itself could also lead to a default under agreements governing our future indebtedness. If the repayment of the related indebtedness were to be accelerated after any applicable notice or grace periods, we may not have sufficient funds to repay the indebtedness and repurchase the notes when required.
Holders of notes are not entitled to any rights with respect to our common stock, but they are subject to all changes made with respect to them to the extent our conversion obligation includes shares of our common stock.
Holders of notes are not entitled to any rights with respect to our common stock (including, without limitation, voting rights and rights to receive any dividends or other distributions on our common stock) prior to the conversion date with respect to any notes they surrender for conversion, but they are subject to all changes affecting our common stock. For example, if an amendment is proposed to our certificate of incorporation or bylaws requiring stockholder approval and the record date for determining the stockholders of record entitled to vote on the amendment occurs prior to the conversion date with respect to any notes surrendered for conversion, then the holder surrendering such notes will not be entitled to vote on the amendment, although such holder will nevertheless be subject to any changes affecting our common stock.
We have made only limited covenants in the indenture governing the notes, and these limited covenants may not protect a noteholder's investment.
The indenture governing the notes does not:
• | require us to maintain any financial ratios or specific levels of net worth, revenues, income, cash flows, or liquidity and, accordingly, does not protect holders of the notes in the event that we experience adverse changes in our financial condition or results of operations; |
• | limit our subsidiaries’ ability to guarantee or incur indebtedness that would rank structurally senior to the notes; |
• | limit our ability to incur additional indebtedness, including secured indebtedness; |
34
• | restrict our subsidiaries’ ability to issue securities that would be senior to our equity interests in our subsidiaries and therefore would be structurally senior to the notes; |
• | restrict our ability to repurchase our securities; |
• | restrict our ability to pledge our assets or those of our subsidiaries; or |
• | restrict our ability to make investments or pay dividends or make other payments in respect of our common stock or our other indebtedness. |
Furthermore, the indenture governing the notes contains only limited protections in the event of a change of control. We could engage in many types of transactions, such as acquisitions, refinancings, or certain recapitalizations, that could substantially affect our capital structure and the value of the notes and our common stock but may not constitute a “fundamental change” that permits holders to require us to repurchase their notes or a “make-whole fundamental change” that permits holders to convert their notes at an increased conversion rate. For these reasons, the limited covenants in the indenture governing the notes may not protect a noteholder's investment in the notes.
The increase in the conversion rate for notes converted in connection with a make-whole fundamental change or provisional redemption may not adequately compensate noteholders for any lost value of the notes as a result of such transaction or redemption.
If a make-whole fundamental change occurs prior to February 6, 2021 or upon our issuance of a notice of provisional redemption, under certain circumstances, we will increase the conversion rate by a number of additional shares of our common stock for notes converted in connection with such events. The increase in the conversion rate for notes converted in connection with such events may not adequately compensate noteholders for any lost value of the notes as a result of such transaction or redemption. In addition, if the price of our common stock in the transaction is greater than $180.00 per share or less than $39.96 per share (in each case, subject to adjustment), no additional shares will be added to the conversion rate. Moreover, in no event will the conversion rate per $1,000 principal amount of notes as a result of this adjustment exceed 25.0250 shares of common stock, subject to adjustment.
Our obligation to increase the conversion rate for notes converted in connection with such events could be considered a penalty, in which case the enforceability thereof would be subject to general principles of reasonableness and equitable remedies.
The conversion rate of the notes may not be adjusted for all dilutive events.
The conversion rate of the notes is subject to adjustment for certain events, including, but not limited to, the issuance of certain stock dividends on our common stock, the issuance of certain rights or warrants, subdivisions, combinations, distributions of capital stock, indebtedness, or assets, cash dividends and certain issuer tender or exchange offers. However, the conversion rate will not be adjusted for other events, such as a third-party tender or exchange offer or an issuance of common stock for cash, that may adversely affect the trading price of the notes or our common stock. An event that adversely affects the value of the notes may occur, and that event may not result in an adjustment to the conversion rate.
Some significant restructuring transactions may not constitute a fundamental change, in which case we would not be obligated to offer to repurchase the notes.
Upon the occurrence of a fundamental change, a holder of notes has the right to require us to repurchase the notes. However, the fundamental change provisions will not afford protection to holders of notes in the event of other transactions that could adversely affect the notes. For example, transactions such as leveraged recapitalizations, refinancings, restructurings, or acquisitions initiated by us may not constitute a fundamental change requiring us to repurchase the notes. In the event of any such transaction, the holders would not have the right to require us to repurchase the notes, even though each of these transactions could increase the amount of our indebtedness, or otherwise adversely affect our capital structure or any credit ratings, thereby adversely affecting the holders of notes.
In addition, absent the occurrence of a fundamental change or a make-whole fundamental change as described under changes in the composition of our board of directors will not provide holders with the right to require us to repurchase the notes or to an increase in the conversion rate upon conversion.
35
We cannot assure noteholders that an active trading market will develop or be maintained for the notes.
We do not intend to apply to list our outstanding convertible notes on any securities exchange or to arrange for quotation on any automated dealer quotation system. In addition, the liquidity of the trading market in the notes and the market price quoted for the notes may be adversely affected by changes in the overall market for this type of security and by changes in our financial performance or prospects or in the prospects for companies in our industry generally. As a result, we cannot assure noteholders that an active trading market will develop or be maintained for the notes. If an active trading market does not develop or is not maintained, the market price and liquidity of the notes may be adversely affected. In that case, noteholders may not be able to sell the notes at a particular time or at a favorable price.
Any adverse rating of the notes may cause their trading price to fall.
We do not intend to seek a rating on the notes. However, if a rating service were to rate the notes and if such rating service were to lower its rating on the notes below the rating initially assigned to the notes or otherwise announces its intention to put the notes on credit watch, the trading price of the notes could decline.
Holders of notes may be subject to tax if we make or fail to make certain adjustments to the conversion rate of the notes even though they do not receive a corresponding cash distribution.
The conversion rate of the notes is subject to adjustment in certain circumstances, including the payment of cash dividends. If the conversion rate is adjusted as a result of a distribution that is taxable to our common stockholders, such as a cash dividend, a noteholder may be deemed to have received a dividend subject to U.S. federal income tax without the receipt of any cash. In addition, a failure to adjust (or to adjust adequately) the conversion rate after an event that increases a noteholder's proportionate interest in us could be treated as a deemed taxable dividend to you. If a make-whole fundamental change occurs prior to February 6, 2021 or we provide notice of a provisional redemption, under some circumstances, we will increase the conversion rate for notes converted in connection with the make-whole fundamental change or provisional redemption. Such increase may also be treated as a distribution subject to U.S. federal income tax as a dividend. For a non-U.S. holder, any deemed dividend would be subject to U.S. federal withholding tax at a 30% rate, or such lower rate as may be specified by an applicable treaty, which may be set off against subsequent payments on the notes.
Any conversions of the notes will dilute the ownership interest of our existing stockholders, including holders who had previously converted their notes.
Any conversion of some or all of the notes will dilute the ownership interests of our existing stockholders. Any sales in the public market of our common stock issuable upon such conversion could adversely affect prevailing market prices of our common stock. In addition, the existence of the notes may encourage short selling by market participants because the conversion of the notes could depress the price of our common stock.
ITEM 1B. UNRESOLVED STAFF COMMENTS
None.
ITEM 2. PROPERTIES
We lease approximately 94,000 square feet of office and laboratory space at our headquarters in South San Francisco, California under a lease that expires in April 2020. The leases for approximately 42,000 square feet of manufacturing and office space at our facility in Singapore will expire in June 2022. Additionally, we lease office, laboratory, and manufacturing space in Markham, Ontario, Canada and Sunnyvale, California under leases that expire in April 2016 and July 2016, respectively. We are currently relocating our Canada operations to a new facility in the Ontario, Canada area that has approximately 41,145 square feet of office, laboratory and warehouse space. The lease for the new facility expires 10 years from April 1, 2016. As of December 31, 2015, we also leased office space in Japan, China, and France, with various expiration dates through April 2018. We believe that our existing office, laboratory, and manufacturing space, together with additional space and facilities available on commercially reasonable terms, will be sufficient to meet our current needs through 2016. In addition, we believe that our properties are in good condition and are adequate and suitable for their purposes.
36
ITEM 3. LEGAL PROCEEDINGS
In the normal course of business, we are from time to time involved in legal proceedings or potential legal proceedings, including matters involving employment, intellectual property, or others. Although the results of litigation and claims cannot be predicted with certainty, we currently believe that the final outcome of any currently pending matters would not have a material adverse effect on our business, operating results, financial condition, or cash flows. Regardless of the outcome, litigation can have an adverse impact on us because of defense and settlement costs, diversion of management resources, and other factors.
ITEM 4. MINE SAFETY DISCLOSURES
Not applicable.
37
PART II
ITEM 5. MARKET FOR REGISTRANT’S COMMON EQUITY, RELATED STOCKHOLDER MATTERS AND ISSUER PURCHASES OF EQUITY SECURITIES
Market for Our Common Stock; Dividends
Our common stock began trading on the NASDAQ Global Select Market under the symbol “FLDM” on February 10, 2011. The following table sets forth the range of high and low closing sales prices of our common stock for the periods indicated:
Year ended December 31, 2015 | High | Low | ||
First Quarter | $45.54 | $33.27 | ||
Second Quarter | $44.47 | $23.39 | ||
Third Quarter | $23.60 | $8.11 | ||
Fourth Quarter | $11.95 | $7.38 | ||
Year ended December 31, 2014 | High | Low | ||
First Quarter | $48.89 | $36.70 | ||
Second Quarter | $45.72 | $25.46 | ||
Third Quarter | $32.08 | $24.50 | ||
Fourth Quarter | $33.73 | $22.06 | ||
We had approximately 99 stockholders of record as of February 10, 2016; however, because many of our outstanding shares are held in accounts with brokers and other institutions, we believe we have more beneficial owners. We have never declared or paid dividends on our common stock and do not expect to pay dividends on our common stock for the foreseeable future. Instead, we anticipate that all of our earnings in the foreseeable future will be used for the operation and growth of our business.
38
Stock Performance Graph
The following performance graph shall not be deemed “soliciting material” or to be “filed” with the Securities and Exchange Commission for purposes of Section 18 of the Securities Exchange Act of 1934, as amended, or the Exchange Act, or otherwise subject to the liabilities under that Section, and shall not be deemed to be incorporated by reference into any filing of Fluidigm Corporation under the Securities Act or the Exchange Act.
The following graph shows a comparison from February 10, 2011 (the date our common stock commenced trading on the NASDAQ Global Select Market) through December 31, 2015 of the cumulative total return for our common stock, the NASDAQ Composite Total Return Index and the NASDAQ US Benchmark Medical Equipment Index, each of which assumes an initial investment of $100 and reinvestment of all dividends. Such returns are based on historical results and are not intended to suggest future performance.
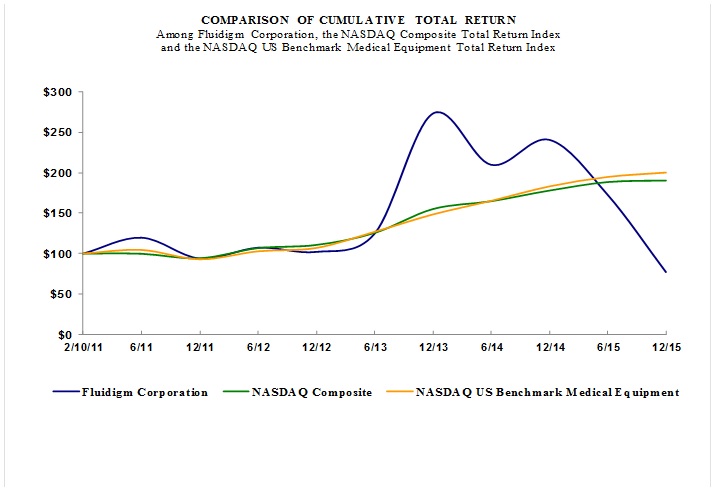
Sales of Unregistered Securities
None.
39
ITEM 6. SELECTED FINANCIAL DATA
The following selected financial data should be read in conjunction with the consolidated financial statements and related notes thereto appearing elsewhere in this Form 10-K. We have derived the consolidated statement of operations data for the years ended December 31, 2015, 2014, and 2013 and consolidated balance sheet data as of December 31, 2015 and 2014 from audited consolidated financial statements included elsewhere in this Form 10-K. The consolidated statement of operations data for the fiscal years ended December 31, 2012 and December 31, 2011 and the consolidated balance sheet data as of December 31, 2013, December 31, 2012, and December 31, 2011 were derived from audited consolidated financial statements that are not included in this Form 10-K.
Year Ended | ||||||||||||||||||||
December 31, 2015 | December 31, 2014 | December 31, 2013 | December 31, 2012 | December 31, 2011 | ||||||||||||||||
(in thousands, except per share amounts) | ||||||||||||||||||||
Consolidated Statement of Operations Data: | ||||||||||||||||||||
Total revenue | $ | 114,712 | $ | 116,456 | $ | 71,183 | $ | 52,334 | $ | 42,865 | ||||||||||
Loss from operations | (50,155 | ) | (51,836 | ) | (18,653 | ) | (18,071 | ) | (18,566 | ) | ||||||||||
Net loss | (53,315 | ) | (52,830 | ) | (16,526 | ) | (19,024 | ) | (32,370 | ) | ||||||||||
Net loss per share, basic and diluted | (1.86 | ) | (1.90 | ) | (0.65 | ) | (0.86 | ) | (1.81 | ) | ||||||||||
Consolidated Balance Sheet Data: | ||||||||||||||||||||
Cash, cash equivalents, and short and long-term investments | $ | 101,465 | $ | 142,800 | $ | 86,286 | $ | 83,677 | $ | 54,967 | ||||||||||
Working capital (1) | 123,433 | 133,440 | 89,354 | 91,500 | 51,873 | |||||||||||||||
Total assets | 371,061 | 407,559 | 116,915 | 113,732 | 79,326 | |||||||||||||||
Total long-term debt | 195,684 | 195,455 | — | — | 10,138 | |||||||||||||||
Total stockholders’ equity | 114,901 | 150,419 | 96,414 | 100,657 | 56,897 | |||||||||||||||
(1) Working capital excludes deferred revenue
40
ITEM 7. MANAGEMENT’S DISCUSSION AND ANALYSIS OF FINANCIAL CONDITION AND RESULTS OF OPERATIONS
The following discussion and analysis should be read together with our consolidated financial statements and the notes to those statements included elsewhere in this Form 10-K. This discussion contains forward-looking statements based on our current expectations, assumptions, estimates and projections about Fluidigm and our industry. These forward-looking statements involve risks and uncertainties. Our actual results could differ materially from those indicated in these forward-looking statements as a result of certain factors, as more fully described in “Risk factors” in Item 1A of this Form 10-K, in this Item 7, and elsewhere in this Form 10-K. Except as may be required by law, we undertake no obligation to update publicly any forward-looking statements for any reason, even if new information becomes available or other events occur in the future.
Overview
We create, manufacture, and market innovative technologies and life-science tools focused on the exploration and analysis of single cells, as well as the industrial application of genomics, based upon our core microfluidics and mass cytometry technologies. We sell instruments and consumables, including integrated fluidic circuits, or IFCs, assays, and reagents, to academic institutions, clinical laboratories, and pharmaceutical, biotechnology, and agricultural biotechnology, or Ag-Bio, companies.
We distribute our systems through our direct sales force and support organizations located in North America, Europe, and Asia-Pacific, and through distributors or sales agents in several European, Latin American, Middle Eastern, and Asia-Pacific countries. Our manufacturing operations are primarily located in Singapore and Canada. Our facility in Singapore manufactures our genomic instruments, several of which are assembled at facilities of our contract manufacturers in Singapore, with testing and calibration of the assembled products performed at our Singapore facility. All of our IFCs for commercial sale and some IFCs for our research and development purposes are fabricated at our Singapore facility. Our proteomics analytical instruments are manufactured at our facility in Canada. We also manufacture IFCs for research and development, assays, and reagents at our facilities in South San Francisco, California.
On February 13, 2014, we completed our acquisition of DVS Sciences, Inc., or DVS, for $199.9 million.
Our total revenue was $71.2 million in 2013, $116.5 million in 2014, and $114.7 million in 2015. We have incurred significant net losses since our inception in 1999 and, as of December 31, 2015, our accumulated deficit was $363.5 million.
Critical Accounting Policies, Significant Judgments and Estimates
Our consolidated financial statements and the related notes included elsewhere in this Form 10-K are prepared in accordance with accounting principles generally accepted in the United States. The preparation of these consolidated financial statements requires us to make estimates and assumptions that affect the reported amounts of assets, liabilities, revenue, costs, and expenses and related disclosures. We base our estimates on historical experience and on various other assumptions that we believe to be reasonable under the circumstances. Changes in accounting estimates may occur from period to period. Accordingly, actual results could differ significantly from the estimates made by our management. We evaluate our estimates and assumptions on an ongoing basis. To the extent that there are material differences between these estimates and actual results, our future financial statement presentation, financial condition, results of operations, and cash flows will be affected.
We believe that the following critical accounting policies involve a greater degree of judgment and complexity than our other accounting policies. Accordingly, these are the policies we believe are the most critical to understanding and evaluating our consolidated financial condition and results of operations. Our accounting policies are more fully described in Note 2 of the notes to our audited consolidated financial statements.
Revenue Recognition
We generate revenue from sales of our products and services, license agreements, and government grants. Our product revenue consists of sales of instruments and consumables, including IFCs, assays, and other reagents. Our service revenue consists of sales of post-warranty service contracts, preventive maintenance plans, instrument parts, installation, and training.
We recognize revenue when persuasive evidence of an arrangement exists, delivery has occurred or services have been rendered, the price to the customer is fixed or determinable, and collectability is reasonably assured. Revenue from the sales of our products that are not part of multiple element arrangements are recognized when no significant obligation remains undelivered and collection is reasonably assured, which is generally when delivery has occurred. Delivery occurs when there is a transfer of title and risk of loss passes to the customer. Payments received in advance of revenue recognition are classified as deferred revenue in the consolidated balance sheet.
41
The evaluation of these revenue recognition criteria requires significant management judgment. For instance, we use judgment to assess collectability based on factors such as the customer’s creditworthiness and past collection history, if applicable. If we determine that collection is not reasonably assured, revenue recognition is deferred until receipt of payment. We also use judgment to assess whether a price is fixed or determinable by, among other things, reviewing contractual terms and conditions related to payment.
Certain of our sales contracts involve the delivery of multiple products or services within contractually binding arrangements. Multiple-deliverable sales transactions typically consist of the sale and delivery of one or more instruments and consumables together with one or more of our installation, training and/or customer support services. Significant judgment is sometimes required to determine the appropriate accounting for such arrangements, including whether the deliverables specified in a multiple element arrangement should be treated as separate units of accounting for revenue recognition purposes and, if so, how the related sales price should be allocated among the elements, when to recognize revenue for each element, and the period over which revenue should be recognized.
For sales contracts that include multiple deliverables, we allocate the contract consideration at the inception of the contract to each unit of accounting based upon their relative selling prices. We may use our best estimate of selling price for individual deliverables when vendor specific objective evidence or third-party evidence is unavailable. A delivered item is considered to be a separate unit of accounting when it has value to the customer on a stand-alone basis.
Our products are typically delivered within a short time frame, generally within one to three months, of the contract date. Service contracts are entered into for terms of one to three years, following the expiration of the warranty period.
Our products are generally sold without the right of return. Accruals are provided for estimated warranty expenses at the time the associated revenue is recognized. We use judgment to estimate these accruals and, if we were to experience an increase in warranty claims or if costs of servicing our products under warranty were greater than our estimates, our cost of product revenue could be adversely affected in future periods.
We have entered into license agreements with third parties that generally provide us with up-front and periodic milestone payments. Revenue from license agreements is generally recognized when received, upfront payments are generally recognized over the term of the underlying agreement and milestone payments are generally recognized based upon the achievement of the milestones as defined in the agreement.
We have received grants from various governmental entities for research and related activities. Grants provide us with payments for certain types of research and development activities performed over a contractually defined period. Grant revenue is recognized in the period during which the related costs are incurred, provided that the conditions under which the grants were provided have been met and we have only perfunctory obligations outstanding. Amounts received in advance of revenue recognition are classified as deferred revenue in the consolidated balance sheets. Costs associated with grants are included in research and development expenses in the consolidated statements of operations.
Changes in judgments and estimates regarding application of these revenue recognition guidelines as well as changes in facts and circumstances could result in a change in the timing or amount of revenue recognized in future periods.
Stock-Based Compensation
We measure the cost of employee services received in exchange for an award of equity instruments, including stock options and restricted stock units, based on the grant date fair value of the award. The fair value of options on the grant date is estimated using the Black-Scholes option-pricing model, which requires the use of certain subjective assumptions, including expected term, volatility, risk-free interest rate and the fair value of our common stock. These assumptions generally require significant judgment. Stock-based compensation cost for restricted stock units granted to employees is measured based on the closing fair market value of our common stock on the date of grant.
Our board of directors sets the terms, conditions, and restrictions related to the grant of stock options and restricted stock units, including the number of shares underlying the grants and the vesting criteria. With respect to performance-based stock options, depending on the extent to which the vesting criteria are met, our board of directors determines the number of shares that vest under the grants.
The resulting costs of our equity awards, net of estimated forfeitures, are recognized over the period during which an employee is required to provide service in exchange for the award, usually a time-based vesting period. We amortize the fair value of stock-based compensation on a straight-line basis over the requisite service periods. For performance-based stock options, we recognize stock-based compensation over the requisite service periods using the accelerated attribution method.
42
Our common stock has a limited trading history because our common stock was not publicly traded until our initial public offering, or IPO, in February 2011. Accordingly, the expected volatility of our common stock is derived from the historical volatilities of several unrelated public companies within the life science industry. When selecting our industry peer companies, we consider our stage of development, size, and financial leverage. These historical volatilities are weighted and combined to produce a single volatility factor. The risk-free interest rate is based on the U.S. Treasury yield in effect at the time of grant for zero coupon U.S. Treasury notes with maturities approximately equal to each grant’s expected life. We estimate the expected lives of employee options using the “simplified” method as the midpoint of the expected time-to-vest and the contractual term.
The calculated fair value of our stock options could change significantly if we determine that another method is more reasonable, or if another method for calculating these input assumptions is prescribed by authoritative guidance. Higher volatility and longer expected lives result in an increase in stock-based compensation expense determined at the date of grant. Stock-based compensation expense affects our cost of product revenue, research and development expense, and selling, general and administrative expense.
We estimate our forfeiture rate based on an analysis of our actual forfeitures and we will continue to evaluate the appropriateness of the forfeiture rate based on actual forfeiture experience, analysis of employee turnover behavior, and other factors. Quarterly changes in the estimated forfeiture rate can have a significant effect on reported stock-based compensation expense, as the cumulative effect of adjusting the rate is recognized in the period the forfeiture estimate is changed. If a revised forfeiture rate is higher than the previously estimated forfeiture rate, an adjustment is made that will result in a decrease to the stock-based compensation expense recognized in the consolidated financial statements. If a revised forfeiture rate is lower than the previously estimated forfeiture rate, an adjustment is made that will result in an increase to the stock-based compensation expense recognized in the consolidated financial statements. The effect of forfeiture adjustments was insignificant during 2015, 2014, and 2013. We will continue to use judgment in evaluating the expected term, volatility, and forfeiture rate related to our stock-based compensation.
Also required to compute the fair value calculation of options is the fair value of the underlying common stock. We grant stock options at exercise prices not less than the fair value of our common stock at the date of grant. Prior to our IPO, our board of directors obtained contemporaneous valuations from an unrelated third-party valuation firm to determine the estimated fair value of common stock. There is inherent uncertainty in these estimates and if we or the valuation firm had made different assumptions, the amount of our stock-based compensation expense, net loss, and net loss per share amounts could have been significantly different. Following the completion of our IPO in February 2011, the fair value of options granted is based on the closing price of our common stock on the date of grant as quoted on the NASDAQ Global Select Market.
Historically, certain of our stock options were granted to officers with vesting acceleration features based upon the achievement of certain performance milestones. The timing of the attainment of these milestones affected the timing of expense recognition since we recognize compensation expense only for the portion of stock options that are expected to vest.
We recorded stock-based compensation of $16.8 million, $20.9 million, and $6.4 million during 2015, 2014, and 2013, respectively. As of December 31, 2015, we have $29.8 million of total unrecognized compensation cost related to stock-based compensation arrangements that is expected to be recognized over an average period of 2.6 years.
Income Taxes
We use the asset and liability method to account for income taxes. Deferred tax assets and liabilities are recognized for the future tax consequences attributable to differences between the financial statement carrying amounts of existing assets and liabilities and their respective tax bases. Deferred tax assets and liabilities are measured using enacted tax rates expected to apply to taxable income in the years in which those temporary differences are expected to be recovered or settled. Significant management judgment is required in determining our provision for income taxes, our deferred tax assets and liabilities, and any valuation allowance recorded against our deferred tax assets. Our provision for income taxes generally consists of tax expense/benefit related to current period earnings/losses. As part of the process of preparing our consolidated financial statements, we continuously monitor the circumstances impacting the expected realization of our deferred tax assets for each jurisdiction. We consider all available evidence, including historical operating results in each jurisdiction, expectations and risks associated with estimates of future taxable income, and ongoing prudent and feasible tax planning strategies in assessing the need for a valuation allowance. To the extent a deferred tax asset cannot be recognized, a valuation allowance is established to reduce our deferred tax assets to the amount that is more likely than not to be realized. These deferred tax assets primarily consist of net operating loss carryforwards, research and development tax credits, and stock-based compensation. We intend to maintain such valuation allowance until sufficient evidence exists to support its reduction. Our deferred tax liabilities primarily consist of book and tax basis differences in fixed assets and acquired identifiable intangible assets. We make estimates and judgments about our future taxable income that are based on assumptions that are consistent with our plans and estimates. Should the actual amounts differ from our estimates, the amount of our valuation allowance could be materially impacted. Changes in
43
these estimates may result in significant increases or decreases to our tax provision in a period in which such estimates are changed, which in turn would affect net income or loss.
We recognize the financial statement effects of a tax position when it is more likely than not, based on the technical merits, that the position will be sustained upon examination. Any interest and penalties related to uncertain tax positions will be reflected in the income tax provision.
We have not provided for U.S. federal and state income taxes on any of our non-U.S. subsidiaries’ undistributed earnings as of December 31, 2015 because such earnings are intended to be indefinitely reinvested. Upon distribution of such earnings in the form of dividends or otherwise, we believe there will be no material U.S. federal and state income tax liability as there are sufficient amount of tax losses or other attributes. Undistributed earnings of our foreign subsidiaries amounted to approximately $0.9 million, as of December 31, 2015. If these earning were to be repatriated, approximately $27,000 of withholding taxes may be due. However, since such subsidiaries’ earnings are permanently reinvested, no related deferred tax liabilities were accrued as of December 31, 2015.
Effective January 1, 2010, we obtained approval for Pioneer Tax Status in Singapore. The Pioneer Tax Status allowed a full exemption from Singapore corporate tax related to contract manufacturing activities through the effective period subject to the achievement of certain milestones. Effective January 1, 2015, our Pioneer Tax Status was replaced by a Development and Expansion Incentive, which provides a reduced tax rate for qualifying income in Singapore through 2019, if certain milestones are met. Due to available capital allowances, we have not benefited from the tax exemption or from the reduced tax rate through December 31, 2015, and may not benefit from the incentive if we do not achieve the required milestones in future years.
Inventory Valuation
We record adjustments to inventory for potentially excess, obsolete, slow-moving, or impaired goods in order to state inventory at its net realizable value. The business environment in which we operate is subject to rapid changes in technology and customer demand. We regularly review inventory for excess and obsolete products and components, taking into account product life cycle and development plans, product expiration and quality issues, historical experience, and our current inventory levels. If actual market conditions are less favorable than anticipated, additional inventory adjustments could be required.
Business Combinations
Assets acquired and liabilities assumed as part of a business acquisition are generally recorded at their fair value at the date of acquisition. The excess of purchase price over the fair value of assets acquired and liabilities assumed is recorded as goodwill. Determining fair value of identifiable assets, particularly intangibles, and liabilities acquired also requires management to make estimates, which are based on all available information and in some cases assumptions with respect to the timing and amount of future revenues and expenses associated with an asset. Accounting for business acquisitions requires management to make judgments as to whether a purchase transaction is a multiple element contract, meaning that it includes other transaction components such as a settlement of a preexisting relationship. This judgment and determination affects the amount of consideration paid that is allocable to assets and liabilities acquired in the business purchase transaction.
Long-lived Assets, including Goodwill
Goodwill and intangible assets with indefinite lives are not subject to amortization, but are tested for impairment on an annual basis during the fourth quarter or whenever events or changes in circumstances indicate the carrying amount of these assets may not be recoverable. Screening for and assessing whether impairment indicators exist, or if events or changes in circumstances have occurred, including a decline in our stock price or market capitalization, declines in our market shares or revenue, operating fundamentals, rapid changes in technology, competition, general economic conditions or other matters, requires significant judgment. An impairment charge may occur as a result of future goodwill and intangible asset impairment tests. The decreases in revenue and stock price that have occurred and may occur in the future could make such impairment more likely to result. If impairment is deemed to exist, we would write-down the recorded value of these intangible assets to their fair values. If and when these write-downs occur, they could harm our results of operations. We first conduct an assessment of qualitative factors to determine whether it is more likely than not that the fair value of our reporting unit is less than its carrying amount. If we determine that it is more likely than not that the fair value of our reporting unit is less than its carrying amount, we then conduct a two-step test for impairment of goodwill. In the first step, we compare the fair value of our reporting unit to its carrying value. If the fair value of our reporting unit exceeds the carrying value of the net assets, goodwill is not considered impaired and no further analysis is required. If the carrying value of the net assets exceeds the fair value of the reporting unit, then the second step of the impairment test must be performed in order to determine the implied fair value of the goodwill. If the carrying value of the goodwill exceeds the implied fair value, then an impairment loss equal to the difference would be recorded.
44
We evaluate our finite lived intangible assets for indicators of possible impairment when events or changes in circumstances indicate the carrying amount of an asset may not be recoverable. If any indicator of impairment exists, we assess the recoverability of the affected intangible assets by determining whether the carrying value of the asset can be recovered through undiscounted future operating cash flows. If impairment is indicated, we estimate the asset’s fair value using future discounted cash flows associated with the use of the asset, and adjust the carrying value of the asset accordingly.
Results of Operations
The following table presents our historical consolidated statements of operations data for the years ended December 31, 2015, 2014, and 2013, and as a percentage of total revenue for the respective years ($ in thousands):
Year Ended December 31, | |||||||||||||||||||||
2015 | 2015 | 2014 | 2014 | 2013 | 2013 | ||||||||||||||||
Revenue: | |||||||||||||||||||||
Total revenue | $ | 114,712 | 100 | % | $ | 116,456 | 100 | % | $ | 71,183 | 100 | % | |||||||||
Costs and expenses: | |||||||||||||||||||||
Cost of product revenue | 43,001 | 37 | 39,511 | 34 | 18,538 | 27 | |||||||||||||||
Cost of service revenue | 3,629 | 3 | 3,338 | 3 | 1,666 | 2 | |||||||||||||||
Research and development | 39,264 | 34 | 43,423 | 37 | 19,953 | 28 | |||||||||||||||
Selling, general and administrative | 82,959 | 72 | 71,324 | 62 | 48,412 | 68 | |||||||||||||||
Litigation settlement | — | — | — | — | 1,267 | 1 | |||||||||||||||
Acquisition-related expenses | — | — | 10,696 | 9 | — | — | |||||||||||||||
Gain on escrow settlement | (3,986 | ) | (3 | ) | |||||||||||||||||
Total costs and expenses | 164,867 | 143 | 168,292 | 145 | 89,836 | 126 | |||||||||||||||
Loss from operations | (50,155 | ) | (44 | ) | (51,836 | ) | (45 | ) | (18,653 | ) | (26 | ) | |||||||||
Interest expense | (5,808 | ) | (4 | ) | (5,344 | ) | (4 | ) | (14 | ) | — | ||||||||||
Gain from sale of investment in Verinata | 2,330 | 2 | 332 | 1 | 1,777 | 2 | |||||||||||||||
Other income (expense), net | (1,157 | ) | (1 | ) | (857 | ) | (1 | ) | 501 | 1 | |||||||||||
Loss before income taxes | (54,790 | ) | (47 | ) | (57,705 | ) | (49 | ) | (16,389 | ) | (23 | ) | |||||||||
Benefit from (provision for) income taxes | 1,475 | 1 | 4,875 | 4 | (137 | ) | — | ||||||||||||||
Net loss | $ | (53,315 | ) | (46 | )% | $ | (52,830 | ) | (45 | )% | $ | (16,526 | ) | (23 | )% | ||||||
Revenue
We generate revenue primarily from sales of our products and services. Our product revenue consists of sales of instruments and consumables, including IFCs, assays, and other reagents. Our service revenue consists of post-warranty service contracts, preventive maintenance plans, instrument parts, installation and training. We have entered into license agreements and have received government grants to conduct research and development activities.
The following table presents our revenue by source for each period presented (in thousands):
Year Ended December 31, | ||||||||||||
2015 | 2014 | 2013 | ||||||||||
Revenue: | ||||||||||||
Instruments | $58,455 | $60,233 | $36,044 | |||||||||
Consumables | 43,685 | 46,838 | 29,145 | |||||||||
Product revenue | 102,140 | 107,071 | 65,189 | |||||||||
Service revenue | 12,315 | 8,844 | 5,009 | |||||||||
License revenue | 257 | 323 | 327 | |||||||||
Grant revenue | — | 218 | 658 | |||||||||
Total revenue | $114,712 | $116,456 | $71,183 | |||||||||
The following table presents our total product and service revenue by geography and as a percentage of total product and service revenue by geography of our customers for each period presented (in thousands):
45
Year Ended December 31, | |||||||||||||||||||||
2015 | 2014 | 2013 | |||||||||||||||||||
United States | $55,147 | 48 | % | $59,133 | 51 | % | $36,308 | 52 | % | ||||||||||||
Europe | 36,772 | 32 | % | 33,045 | 29 | % | 18,472 | 26 | % | ||||||||||||
Asia Pacific | 10,925 | 10 | % | 12,878 | 11 | % | 6,564 | 9 | % | ||||||||||||
Japan | 6,042 | 5 | % | 6,932 | 6 | % | 6,639 | 10 | % | ||||||||||||
Other | 5,569 | 5 | % | 3,927 | 3 | % | 2,215 | 3 | % | ||||||||||||
Total product and service revenue | $114,455 | 100 | % | $115,915 | 100 | % | $70,198 | 100 | % | ||||||||||||
Our license and grant revenue is primarily generated in the United States.
Our customers include academic research institutions, clinical laboratories, and pharmaceutical, biotechnology and Ag-Bio companies worldwide. Product and service revenue, excluding license and grant revenue, from our five largest customers in each of the periods presented comprised 13%, 15%, and 18% of total product and service revenue in 2015, 2014, and 2013, respectively.
Comparison of the Years Ended December 31, 2015 and December 31, 2014
Total Revenue
Total revenue decreased by $1.7 million, or 1.5%, to $114.7 million for 2015, compared to $116.5 million for 2014 primarily due to a decrease of $4.9 million in product revenue, partially offset by a $3.5 million increase in service revenue. Unfavorable foreign exchange rates, primarily between the U.S. dollar and Euro, adversely affected total revenue by approximately $5.0 million, or 15% in 2015. Continued weakness in foreign currencies, particularly the Euro, relative to the U.S. dollar would be expected to have an adverse effect on our revenue.
Product Revenue
Product revenue decreased by $4.9 million, or 5%, to $102.1 million for 2015, compared to $107.1 million for 2014.
Instrument revenue decreased by $1.8 million, or 3%, to $58.4 million for 2015, primarily due to decreases in unit sales of core genomic analytical systems, which include BioMark, C1 and Access Array, and, to a lesser extent, lower average selling prices, partially offset by growth in unit sales of Helios/CyTOF2 systems with relatively higher selling prices compared to core genomic systems, and contributions from new products including Juno and Polaris. Unfavorable foreign exchange rates adversely affected instrument revenue by $3.6 million, or 6% in 2015 compared to 2014.
Consumables revenue decreased by $3.2 million, or 7%, to $43.7 million for 2015, primarily due to decreases in IFC unit volumes from production genomics applications, as well as the negative effects of foreign exchange rates, which reduced consumables revenue by $2.3 million or 5% in 2015.
Annualized IFC pull-through for our genomics analytical systems was within our revised range of $25,000 to $35,000 per system per year, compared to a range of $40,000 to $50,000 per system per year in 2014. In 2015, annualized IFC pull-through for our genomics preparatory systems was within our expected range of $15,000 to $25,000 per system per year, and consumables pull-through for our proteomics analytical systems was within our historical range of $50,000 to $70,000 per system. IFC pull-through is determined by dividing the applicable IFC revenue for a specific period by the number of genomics analytical or preparatory systems, as applicable, in our installed base at the beginning of the period. Similarly, consumables pull-through for proteomics analytical systems is determined by dividing the related consumables revenue for a specific period by the number of proteomics analytical systems in our installed base at the beginning of the period. The IFC and consumables pull-through amounts are annualized by multiplying the pull-through amounts by a ratio, the numerator of which equals 12 and the denominator of which equals the number of months in the specific period.
We currently expect total product revenue to increase over time as we continue our efforts to grow our customer base, expand our geographic market coverage, and launch new products. However, we expect the average selling prices of our products to fluctuate over time based on market conditions, product mix, and currency fluctuations. In addition, our revenue declined from fiscal 2014 to 2015, and we cannot provide assurance concerning future revenue growth, if any.
Service Revenue
Service revenue increased by $3.5 million, or 40%, to $12.3 million for 2015, primarily due to increased sales of post-warranty service contracts and increased installation and training for our Helios/CyTOF2 systems. Service revenue for prior periods, which was previously recorded in instrument revenue, has been reclassified to conform to the current period presentation.
46
Grant and License Revenue
Grant revenue consists of a grant from the California Institute for Regenerative Medicine (CIRM). Grant revenue was $0.2 million in 2014. There was no grant revenue in 2015. Our CIRM grant was awarded in 2011 in the amount of $1.9 million to be earned over a three-year period, which ended in April 2014. The CIRM grant revenue was recognized as the related research and development services were performed and costs associated with the grants were recognized as research and development expense during the period incurred.
License revenue was $0.3 million in each of 2015 and 2014.
Cost of Product and Service Revenue
The following table presents our cost of product and service revenue and product and service margins for each period presented (in thousands):
Year Ended | ||||||||
December 31, 2015 | December 31, 2014 | |||||||
Cost of product revenue | $ | 43,001 | $ | 39,511 | ||||
Product margin | 58 | % | 63 | % | ||||
Cost of service revenue | 3,629 | 3,338 | ||||||
Service margin | 71 | % | 62 | % | ||||
Cost of product revenue includes manufacturing costs incurred in the production process, including component materials, labor and overhead, installation, packaging, and delivery costs. In addition, cost of product revenue includes amortization of developed technology and intangibles, royalty costs for licensed technologies included in our products, warranty, provisions for slow-moving and obsolete inventory, and stock-based compensation expense. Cost of service includes direct labor hours, overhead and instrument parts. Costs related to license and grant revenue are included in research and development expense.
Cost of product revenue increased by $3.5 million, or 9%, to $43.0 million for 2015 from $39.5 million for 2014. Cost of product revenue for 2015 includes $11.2 million of amortization of acquired intangible assets resulting from our acquisition of DVS. Cost of product revenue for 2014 includes $10.7 million of amortization of developed technology and inventory fair value write-up resulting from our acquisition of DVS. Overall cost of product revenue as a percentage of product revenue was 42% and 37% for 2015 and 2014, including 11% and 10% related to these charges, respectively. Product margins declined 5 percentage points primarily due to lower consumables capacity utilization, lower instrument selling prices, higher acquisition-related amortization costs and higher IFC inventory reserves related to product transitions.
Cost of service revenue increased by $0.3 million, or 9%, to $3.6 million for 2015 from $3.3 million for 2014. Cost of service revenue as a percentage of service revenue was 29% and 38% for 2015 and 2014, respectively. Service margin increased nine percentage points during 2015 compared to 2014, mainly due to increased post-warranty service contract revenue combined with relatively lower growth in service costs.
Operating Expenses
The following table presents our operating expenses for each period presented (in thousands):
Year Ended | ||||||||
December 31, 2015 | December 31, 2014 | |||||||
Research and development | $ | 39,264 | $ | 43,423 | ||||
Selling, general and administrative | 82,959 | 71,324 | ||||||
Acquisition-related expenses | — | 10,696 | ||||||
Gain on escrow settlement | (3,986 | ) | — | |||||
Total operating expenses | $ | 118,237 | $ | 125,443 | ||||
Research and Development
Research and development expense consists primarily of personnel and independent contractor costs, prototype and material expenses and other allocated facilities, and information technology expenses. We have made substantial investments in
47
research and development since our inception. Our research and development efforts have focused primarily on enhancing our technologies and supporting development and commercialization of new and existing products and services.
Research and development expense decreased by $4.2 million, or 10%, to $39.3 million for 2015, compared to $43.4 million for 2014. The decrease in research and development expense was primarily due to a decrease in stock-based compensation expenses of $5.6 million resulting from the vesting in 2014 of a substantial portion of equity awards in connection with the DVS acquisition according to the vesting terms, partially offset by an increase in compensation-related costs of $0.7 million and an increase in facilities costs of $0.6 million.
We believe that our continued investment in research and development is essential to our long-term competitive position and that these expenses will increase in future periods.
Selling, General and Administrative
Selling, general and administrative expense consists primarily of personnel costs for our sales and marketing, business development, finance, legal, human resources and general management, as well as professional services, such as legal and accounting services.
Selling, general and administrative expense increased $11.6 million, or 16%, to $83.0 million for 2015, compared to $71.3 million for 2014. The increase was primarily due to higher headcount and compensation-related costs of $4.1 million, including an increase of $1.3 million in stock-based compensation; increased legal costs of $3.0 million and other outside services costs of $2.2 million, and increased facilities costs of $1.1 million. The increase in selling, general and administrative expense was mainly driven by continued investments in our global commercial infrastructure.
Acquisition-Related Expenses
Acquisition-related expenses were $10.7 million for 2014 and primarily included accelerated vesting of certain DVS restricted stock and options, and consulting, legal, and investment banking fees relating to our acquisition of DVS. There were no acquisition-related expenses in 2015.
Gain on Escrow Settlement
Approximately 885,000 shares of Fluidigm common stock were deposited into escrow, or Escrowed Shares, in connection with our acquisition of DVS in February 2014. The Escrowed Shares comprised a portion of the merger consideration and were being held in escrow to secure indemnification obligations under the merger agreement. Under the terms of the merger agreement, fifty percent (50.0%) of the aggregate shares subject to the indemnification escrow were eligible for release on March 13, 2015, or the Initial Release Date, and the balance of the shares were eligible for release on August 13, 2015, provided that in each case shares would have continued to be held in escrow in amounts that we reasonably determined in good faith to be necessary to satisfy any claims for which we had delivered a notice of claim which had not been fully resolved between us and the representative of the former stockholders of DVS, or Stockholder Representative. Prior to the Initial Release Date, we submitted escrow claim notices under the terms of the merger agreement, which were objected to by the Stockholder Representative. In July 2015, we entered into a settlement agreement with the Stockholder Representative regarding the claims pursuant to which the parties agreed to release approximately 80% of the Escrowed Shares to the former stockholders of DVS, and the remaining approximately 20% of the Escrowed Shares, or 170,107 shares, to us, which were canceled and returned to the status of authorized and unissued shares. On the settlement date, the 170,107 shares had a value of approximately $4.0 million, which was recorded to gain on escrow settlement during the quarter ended September 30, 2015.
Interest Expense and Other Income and Expense, Net
The following table presents these items for each period presented (in thousands):
Year Ended | ||||||||
December 31, 2015 | December 31, 2014 | |||||||
Interest expense | $ | (5,808 | ) | $ | (5,344 | ) | ||
Gain from sale of investment in Verinata | 2,330 | 332 | ||||||
Other income (expense), net | (1,157 | ) | (857 | ) | ||||
Total | $ | (4,635 | ) | $ | (5,869 | ) | ||
On February 4, 2014, we closed an underwritten public offering of $201.3 million aggregate principal amount of our 2.75% Senior Convertible Notes due 2034, or the Notes. The Notes accrue interest at a rate of 2.75% per year, payable semi-
48
annually in arrears on February 1 and August 1 of each year, commencing August 1, 2014. The Notes will mature on February 1, 2034, unless earlier converted, redeemed, or repurchased in accordance with the terms of the Notes.
Interest expense increased to $5.8 million for 2015, compared to $5.3 million for 2014 due to the accrual of interest under the terms of the Note, as compared to a partial comparable period in 2014.
Gain from Sale of Investment in Verinata
In February 2013, Illumina, Inc. acquired Verinata Health, Inc. (Verinata) for $350 million in cash and up to an additional $100 million in milestone payments through December 2015. In March 2013, we received cash proceeds of $3.1 million in exchange for our ownership interest in Verinata, resulting in a gain of $1.8 million. During 2014, we received cash proceeds of $0.3 million from the escrow account related to the acquisition. We recorded these amounts as "Gain from sale of investment in Verinata" in the accompanying consolidated statements of operations for the years ended December 31, 2013 and 2014. The final milestones related to the sale of Verinata to Illumina were met in December 2015 and, accordingly, we recorded our share of these milestone payment obligations in the amount of $2.3 million in Other Assets and Gain from sale of investment in Verinata in the accompanying consolidated statement of operations for the year ended December 31, 2015. In January 2016, we received payment of this amount.
Other expense, net increased by $1.1 million for 2015, compared to $0.9 million for 2014, primarily due to losses from revaluation of certain foreign currency denominated assets and liabilities during 2015.
Benefit from Income Taxes
We recorded a tax benefit of $1.5 million, or an effective tax rate benefit of 2.6%, for the year ended December 31, 2015. This tax benefit was primarily attributable to the amortization of our acquisition-related deferred tax liability, partially offset by net income tax expense from our foreign operations and unrecognized tax benefits. We recorded a tax benefit of $4.9 million for the year ended December 31, 2014, which was primarily attributable to the amortization of our acquisition-related deferred tax liability and net income tax benefit from our foreign operations and release of valuation allowance on California deferred tax assets, as a result of the deferred tax liability related to its acquired intellectual property.
Comparison of the Years Ended December 31, 2014 and December 31, 2013
Total Revenue
Total revenue increased by $45.3 million, or 64%, to $116.5 million for 2014, compared to $71.2 million for 2013 primarily due to an overall growth in our business, including revenue growth for both instruments and consumables. Revenue from the sale of Helios/CyTOF 2 systems and related consumables following our acquisition of DVS Sciences, Inc., or DVS, in February 2014, contributed $20.7 million to total revenue in 2014. This growth in revenues was negatively impacted by generally unfavorable foreign exchange rate trends for the year 2014 and in particular during the fourth quarter of 2014. The unfavorable impact on revenues was approximately 3% during the fourth quarter of 2014.
Product Revenue
Product revenue increased by $45.7 million, or 65%, to $115.9 million for 2014, compared to $70.2 million for 2013.
Instrument revenue increased by $28.0 million, or 68%, primarily driven by sales of our Helios/CyTOF 2 systems which we commenced selling upon the acquisition of DVS, and net increases in unit sales of our preparatory systems, which include the C1 Single-Cell Auto Prep system, and to a lesser extent, net increases in unit sales of our analytical systems. Instrument revenue growth, excluding contribution from the acquired Helios/CyTOF 2 system, was 30% for 2014 compared to 2013.
Consumables revenue increased by $17.7 million, or 61%, primarily due to growth in overall IFC unit volume, driven mainly by increased sales to production genomics customers, and to a lesser extent, contribution from the acquired antibody consumables sales and increased sales to other genomics customers. Consumables revenue growth, excluding revenue attributable to the acquired operations of DVS, was 44% for 2014 compared to 2013.
Annualized IFC pull-through for our genomics analytical and preparatory systems was within our historical range of $40,000 to $50,000 per system and $10,000 to $15,000 per system, respectively. Annualized consumables pull-through for our proteomics analytical systems was above its historical range of $50,000 to $70,000 per system. IFC pull-through is determined by dividing the applicable IFC revenue for a specific period by the number of genomics analytical or preparatory systems, as applicable, in our installed base at the beginning of the period. Similarly, consumables pull-through for proteomics analytical systems is determined by dividing the related consumables revenue for a specific period by the number of proteomics analytical systems in our installed base at the beginning of the period. The IFC and consumables pull-through amounts are annualized by
49
multiplying the pull-through amounts by a ratio, the numerator of which equals 12 and the denominator of which equals the number of months in the specific period.
Service Revenue
Service revenue increased by $3.8 million, or 77%, to $8.8 million for 2014, attributable primarily to sales of service and installation contracts in connection with the sale of Helios/CyTOF 2 systems as a result of the DVS acquisition. An increase in the sale of post-warranty service contracts also contributed to the increase in service revenue.
Grant and License Revenue
Grant revenue consists of a grant from CIRM. Grant revenue was $0.2 million and $0.7 million in 2014 and 2013, respectively. Our CIRM grant was awarded in 2011 in the amount of $1.9 million to be earned over a three-year period, which ended in April 2014. The CIRM grant revenue is recognized as the related research and development services are performed and costs associated with the grants are recognized as research and development expense during the period incurred.
License revenue was $0.3 million in each of 2014 and 2013.
Cost of Product and Service Revenue
The following table presents our cost of total product and service revenue and product and service margin for each period presented (in thousands):
Year Ended | ||||||||
December 31, 2014 | December 31, 2013 | |||||||
Cost of product revenue | $ | 39,511 | $ | 18,538 | ||||
Product margin | 63 | % | 72 | % | ||||
Cost of service revenue | $ | 3,338 | $ | 1,666 | ||||
Service margin | 62 | % | 67 | % | ||||
Cost of product revenue includes manufacturing costs incurred in the production process, including component materials, labor and overhead, installation, packaging, and delivery costs. In addition, cost of product revenue includes royalty costs for licensed technologies included in our products, warranty, provisions for slow-moving and obsolete inventory, and stock-based compensation expense. Cost of service revenue includes direct labor hours, overhead and instrument parts. Costs related to license and grant revenue are included in research and development expense.
Cost of product revenue increased by $21.0 million, or 113%, to $39.5 million for 2014 from $18.5 million for 2013. Cost of product revenue for 2014 includes $10.7 million of amortization of acquired intangible assets and inventory fair-value write-up resulting from our acquisition of DVS with no corresponding charges in 2013. Cost of product revenue as a percentage of product revenue was 37% (including 10 percentage points related primarily to amortization of acquired intangible assets and inventory fair-value write-up) and 28% for 2014 and 2013, respectively.
Excluding the impact of the acquisition-related amortization costs, overall product margins improved by one percentage point as the product margins for both our instruments and consumables increased, offset by a shift in the sales mix from consumables to instruments, which have comparatively lower product margins.
Cost of service revenue increased by $1.7 million, or 101%, to $3.3 million in 2014. The increase in cost of service revenue was primarily due to supporting additional service contracts from our acquisition of DVS in 2014 as compared to the comparable period.
50
Operating Expenses
The following table presents our operating expenses for each period presented (in thousands):
Year Ended | ||||||||
December 31, 2014 | December 31, 2013 | |||||||
Research and development | $ | 43,423 | $ | 19,953 | ||||
Selling, general and administrative | 71,324 | 48,412 | ||||||
Litigation settlement | 1,267 | |||||||
Acquisition-related expenses | $ | 10,696 | $ | — | ||||
Total operating expenses | $ | 125,443 | $ | 69,632 | ||||
Research and Development
Research and development expense consists primarily of personnel and independent contractor costs, prototype and material expenses and other allocated facilities, and information technology expenses. We have made substantial investments in research and development since our inception. Our research and development efforts have focused primarily on enhancing our technologies and supporting development and commercialization of new and existing products and services.
Research and development expense was $43.4 million for 2014, an increase of $23.5 million, or 118%, compared to $20.2 million for 2013. The increase in research and development expense was primarily due to an increase in headcount and other compensation-related costs of $15.5 million, an increase in lab supplies and equipment costs of $5.1 million, increase in facilities-related expense of $1.7 million, and an increase in outside services of $1.1 million. These increased costs were primarily driven by the acquisition of DVS and in support of our development and commercialization of new and existing products and services.
Selling, General and Administrative
Selling, general and administrative expense consists primarily of personnel costs for our sales and marketing, business development, finance, legal, human resources and general management, as well as professional services, such as legal and accounting services.
Selling, general and administrative expense increased $22.9 million, or 47%, to $71.3 million for 2014, compared to $48.4 million for 2013. The increase was primarily attributable to higher headcount and other compensation-related costs of $13.2 million, increases in legal, accounting and other professional services of $5.6 million, trade shows and other marketing expenses of $2.2 million, integration expenses of $1.3 million, and other expenses of $0.6 million. These increases were primarily driven by the acquisition of DVS, the expansion of worldwide commercial capabilities and, to a lesser extent, general and administrative expense to support our growth.
Litigation Settlement
From time to time, we may be subject to various legal proceedings and claims arising in the ordinary course of business. We assess contingencies to determine the degree of probability and range of possible loss for potential accrual in our financial statements. An estimated loss contingency is accrued in the financial statements if it is probable that a liability has been incurred and the amount of the loss can be reasonably estimated.
Pursuant to the terms of a patent cross license agreement with Life, we were obligated to make a $1.0 million payment to Life upon satisfaction of certain conditions. We do not believe that the conditions triggering the payment obligation have been met; however, on October 16, 2013, Life provided notice that the $1.0 million payment was due and payable under the license agreement. We accrued a loss contingency of $1.0 million as of September 30, 2013 and on January 30, 2014, we paid Life the amount due while reserving our rights with respect to the matter. Among other reasons, we made the payment to avoid what would have been, in our view, an improper termination of our license to certain Life patent filings under the agreement, which could have subjected our relevant product lines to risks associated with patent infringement litigation.
Acquisition-Related Expenses
Acquisition-related expenses were $10.7 million for 2014 and primarily included accelerated vesting of certain DVS restricted stock and options, and consulting, legal, and investment banking fees in our acquisition of DVS.
51
Interest Expense, Gain from Sale of Investment in Verinata, and Other Income and Expense, Net
The following table presents these items for each period presented (in thousands):
Year Ended | ||||||||
December 31, 2014 | December 31, 2013 | |||||||
Interest expense | $ | (5,344 | ) | $ | (14 | ) | ||
Gain from sale of investment in Verinata | 332 | 1,777 | ||||||
Other income (expense), net | (857 | ) | 501 | |||||
Total | $ | (5,869 | ) | $ | 2,264 | |||
On February 4, 2014, we closed an underwritten public offering of $201.3 million aggregate principal amount of our 2.75% Senior Convertible Notes due 2034. The Notes accrue interest at a rate of 2.75% per year, payable semi-annually in arrears on February 1 and August 1 of each year, commencing August 1, 2014. The Notes will mature on February 1, 2034, unless earlier converted, redeemed, or repurchased in accordance with the terms of the Notes.
Interest expense increased to $5.3 million for 2014, compared to $14,000 for 2013, due to interest expense under the terms of the Notes, which were issued in the first quarter of 2014, and amortization of debt discount related to the Notes.
In February 2013, Illumina, Inc. acquired Verinata Health, Inc., or Verinata, for $350 million in cash and up to an additional $100 million in milestone payments through 2015. In March 2013, we received cash proceeds of $3.1 million in exchange for our ownership interest in Verinata, resulting in a gain of $1.8 million. During 2014, we received cash proceeds of $0.3 million from the escrow account related to the acquisition. We recorded proceeds as "Gain from sale of investment in Verinata" in the accompanying consolidated statements of operations for the year ended December 31, 2014.
Other expense, net increased by $1.4 million for the year ended December 31, 2014 compared to other income, net of $0.5 million for the year ended December 31, 2013. In 2013, the income was due primarily to a gain resulting from settlement of litigation filed by us against NanoString Technologies, Inc. In 2014, the other expense is primarily due to the foreign exchange losses resulting mainly from unfavorable changes in the Euro and Japanese Yen exchange rates relative to the U.S. dollar.
Benefit from Income Taxes
We recorded a tax benefit of $4.9 million, or an effective tax rate benefit of 8.5%, for the year ended December 31, 2014. The tax benefit for the year ended December 31, 2014 was primarily attributable to the amortization of our acquisition-related deferred tax liability and net income tax benefit from our foreign operations and release of valuation allowance on California deferred tax assets, as a result of the deferred tax liability related to its acquired intellectual property. We recorded tax expense of $0.1 million for the year ended December 31, 2013.
Liquidity and Capital Resources
Sources of Liquidity
As of December 31, 2015, our principal sources of liquidity consisted of $29.1 million of cash and cash equivalents and $72.3 million of short-term and long-term investments. As of December 31, 2015, our working capital (excluding deferred revenue) totaled $123.4 million.
The following table presents our cash flow summary for each period presented (in thousands):
Year Ended December 31, | ||||||||||||
2015 | 2014 | 2013 | ||||||||||
Cash flow summary | ||||||||||||
Net cash used in operating activities | $ | (34,696 | ) | $ | (22,623 | ) | $ | (1,591 | ) | |||
Net cash (used in) provided by investing activities | 25,744 | (178,385 | ) | (27,565 | ) | |||||||
Net cash provided by financing activities | 5,303 | 200,326 | 5,806 | |||||||||
Net (decrease) increase in cash and cash equivalents | (4,596 | ) | (1,548 | ) | (23,388 | ) | ||||||
52
Net Cash Used in Operating Activities
We derive cash flows from operations primarily from cash collected from the sale of our products and services, license agreements, and grants from certain government entities. Our cash flows from operating activities are also significantly influenced by our use of cash for operating expenses and working capital to support the growth of our business. We have historically experienced negative cash flows from operating activities as we have expanded our business and built our infrastructure domestically and internationally, and this may continue in the future.
Net cash used in operating activities was $34.7 million, $22.6 million, and $1.6 million in 2015, 2014, and 2013, respectively. Net cash used in operating activities in 2015 of $34.7 million consisted of net loss of $53.3 million less non-cash adjustments of $26.9 million, plus net change in assets and liabilities of $8.2 million. Non-cash items primarily included stock-based compensation expense of $16.8 million, amortization of developed technology of $11.2 million, and depreciation and amortization of $4.9 million, partially offset by a $4.0 million gain on escrow settlement and $2.3 million gain from the sale of investment in Verinata. The net change in assets and liabilities was primarily driven by an increase in inventory and accounts receivable, offset by a net decrease in liabilities.
Net cash used in operating activities during 2014 resulted from a net loss of $52.8 million, adjusted for $38.1 million in non-cash charges and a $7.8 million increase in net assets and liabilities. Significant non-cash charges included stock-based compensation expense, depreciation and amortization, amortization of developed technology, and acquisition-related share-based awards acceleration expense. The net change in assets and liabilities was driven primarily by higher inventory and accounts receivables offset by a net increase in operating liabilities. Cash used in operating activities in 2014 included $8.0 million of cash outflows related to the DVS acquisition.
Net cash used in operating activities during 2013 resulted from a net loss of $16.5 million, adjusted for $7.5 million in non-cash charges and a $7.4 million decrease in net assets and liabilities. Significant non-cash charges included stock-based compensation expense, and depreciation and amortization. The net change in assets and liabilities was driven primarily by an increase in deferred revenue and other liabilities.
Net Cash (used in) provided by Investing Activities
Our primary investing activities consist of purchases, sales, and maturities of our short-term and long-term investments and to a much lesser extent, capital expenditures for manufacturing, laboratory, computer equipment and software to support our expanding infrastructure and work force. We expect to continue to expand our manufacturing capability and throughput, including improvements in manufacturing productivity, and expect to incur additional costs for capital expenditures related to these efforts in future periods. In addition, we expect to continue to incur costs for capital expenditures for demonstration units and loaner equipment to support our sales and service efforts, and computer equipment and software to support our growth.
Net cash provided by (used in) investing activities was $25.7 million, ($178.4) million and ($27.6) million in 2015, 2014, and 2013, respectively. Net cash provided by investing activities in 2015, included proceeds from sales and maturities of investments of $103.3 million, offset by purchases of investments of $67.0 million, purchase of patents from PerkinElmer and other intangibles of $6.7 million; and capital expenditures of $4.0 million to support growth in our commercial and manufacturing operations.
We used $178.4 million of cash in investing activities during 2014, including $113.2 million in connection with the DVS acquisition, net of acquired cash of $8.4 million classified as cash used in operating activities, purchases of investments of $132.6 million; capital expenditures of $7.4 million primarily to support growth in our manufacturing operations, partially offset by proceeds from sales and maturities of investments of $74.5 million, and additional proceeds of $0.3 million from the 2013 sale of our investment in Verinata.
We used $27.6 million of cash in investing activities during 2013 primarily for purchases of investments of $59.4 million, purchase of intangible assets from Helicos Biosciences Corporation and related transaction costs of $1.2 million, and purchases of capital equipment of $3.4 million to support growth in our commercial and manufacturing operations; partially offset by proceeds from sales and maturities of investments of $33.4 million, and proceeds from the sale of our investment in Verinata of $3.1 million.
Net Cash Provided by Financing Activities
We generated $5.3 million of cash from financing activities during 2015 from proceeds received in connection with the exercise of options for our common stock.
53
Net cash provided by financing activities was $200.3 million during 2014, consisting of net proceeds of $195.2 million from the issuance of the Notes and proceeds received in connection with the exercise of options for our common stock of $5.1 million.
We generated $5.8 million of cash from financing activities during 2013 from proceeds received in connection with the exercise of options for our common stock.
Capital Resources
At December 31, 2015 and December 31, 2014, our working capital, excluding deferred revenues, was $123.4 million and $133.4 million, respectively, including cash and cash equivalents of $29.1 million and $33.7 million, respectively, and short-term and long-term investments of $72.3 million and $109.1 million, respectively. On February 4, 2014, we closed an underwritten public offering of approximately $201.3 million aggregate principal amount of our Notes and received cash proceeds of $195.2 million, net of underwriting discounts. Debt issuance costs were approximately $1.1 million. We used $113.2 million of the net proceeds to fund the cash portion of the consideration paid by us in connection with our acquisition of DVS.
We believe our existing cash, cash equivalents, and investments will be sufficient to meet our working capital and capital expenditure needs for at least the next 18 months. However, we may experience lower than expected cash generated from operating activities or greater than expected capital expenditures, cost of revenue or operating expenses, and we may need to raise additional capital to expand the commercialization of our products, expand and fund our operations, further our research and development activities, or acquire or invest in a business. Our future funding requirements will depend on many factors, including market acceptance of our products, the cost of our research and development activities, the cost of filing and prosecuting patent applications, the cost associated with litigation or disputes relating to intellectual property rights, or otherwise, the cost and timing of regulatory clearances or approvals, if any, the cost and timing of establishing additional sales, marketing and distribution capabilities, the cost and timing of establishing additional technical support capabilities, and the effect of competing technological and market developments. In the future, we may acquire businesses or technologies from third parties, and we may decide to raise additional capital through debt or equity financing to the extent we believe this is necessary to successfully complete these acquisitions. We currently have no material commitments or agreements relating to any such acquisitions.
If we require additional funds in the future, we may not be able to obtain such funds on acceptable terms, or at all. If we raise additional funds by issuing equity securities, our stockholders may experience dilution. Debt financing, if available, may involve covenants restricting our operations or our ability to incur additional debt. Any debt or additional equity financing that we raise may contain terms that are not favorable to us or our stockholders. If we raise additional funds through collaboration and licensing arrangements with third parties, it may be necessary to relinquish some rights to our technologies or our products, or grant licenses on terms that are not favorable to us. If we are unable to raise adequate funds, we may have to liquidate some or all of our assets, or delay, reduce the scope of or eliminate some or all of our development programs. If we do not have, or are not able to obtain, sufficient funds, we may have to delay development or commercialization of our products or license to third parties the rights to commercialize products or technologies that we would otherwise seek to commercialize. We also may have to reduce marketing, customer support, research and development, or other resources devoted to our products or cease operations.
Off-Balance Sheet Arrangements
Since our inception, we have not had any off-balance sheet arrangements as defined in Item 303(a)(4) of the Securities and Exchange Commission’s Regulation S-K.
Contractual Obligations and Commitments
The following summarizes our contractual obligations as of December 31, 2015 (in thousands):
Payments Due by Period | ||||||||||||||||||||
Total | Less than 1 Year | 1-3 Years | 3-5 Years | Thereafter | ||||||||||||||||
Debt obligations | $ | 301,330 | $ | 5,534 | $ | 11,069 | $ | 11,069 | $ | 273,658 | ||||||||||
Operating lease obligations | 22,994 | 4,084 | 8,765 | 6,607 | 3,538 | |||||||||||||||
Purchase obligations | 8,527 | 8,350 | 177 | — | — | |||||||||||||||
Total | $ | 332,851 | $ | 17,968 | $ | 20,011 | $ | 17,676 | $ | 277,196 | ||||||||||
Debt obligations include the principal amount of the Notes and interest payments to be made under the Notes. Although the Notes mature in 2034, they can be converted into cash and shares of our common stock prior to maturity if certain
54
conditions are met. See Note 7 to our consolidated financial statements for additional information regarding the terms of the Notes.
Our operating lease obligations relate to a lease for our current headquarters and leases for manufacturing and office space for our foreign subsidiaries. Purchase obligations consist of contractual and legally binding commitments to purchase goods and services.
On April 9, 2013, we entered into an amendment (the 2013 Amendment) to the lease agreement dated September 4, 2010 (as amended, the Lease) relating to the lease of office and laboratory space at our headquarters located in South San Francisco, California. The 2013 Amendment provided for an expansion of the premises covered under the Lease, effective April 1, 2014; an extension of the term of the Lease to April 30, 2020 with an option to renew for an additional five years; payment of base rent with rent escalation; and payment of certain operating expenses during the term of the Lease. The 2013Amendment also provided for an allowance of approximately $0.7 million for tenant improvements, of which we used $0.5 million and the $0.2 million which was used to offset base rent obligations in the quarter ended September 30, 2015, and an additional allowance of $0.5 million for tenant improvements, which if used, will be repaid in equal monthly payments with interest at a rate of 9% per annum over the remaining term of the Lease. The total future minimum lease payments for the additional space, which will be paid through April 2020, are approximately $6.7 million as of December 31, 2015.
On June 4, 2014, we entered into an additional amendment to the Lease (the June 2014 Amendment), which provided for an expansion of the premises covered under the Lease by approximately 13,000 square feet, effective October 1, 2014; payment of base rent with rent escalation; and payment of certain operating expenses during the term of the Lease. The June 2014 Amendment also provided for an allowance of approximately $0.2 million for tenant improvements, which was fully utilized by March 31, 2015, and an additional allowance of approximately $0.1 million for tenant improvements, which, if used, will be repaid in equal monthly payments with interest at a rate of 9% per annum over the remaining term of the Lease. The total future minimum lease payments for the additional space, which will be paid through April 2020, are approximately $2.0 million as of December 31, 2015.
On September 15, 2014, we entered into an additional amendment to the Lease (the September 2014 Amendment), which provided for an expansion of the premises covered under the Lease by approximately 9,000 square feet, effective October 1, 2014; payment of base rent with rent escalation; and payment of certain operating expenses during the term of the Lease. The September 2014 Amendment also provided for an allowance of approximately $0.2 million for tenant improvements. The total future minimum lease payments for the additional space, which will be paid through April 2020, are approximately $1.3 million as of December 31, 2015.
On December 8, 2015, we entered into an additional amendment to the Lease (the December 2015 Amendment), which provides for an expansion of the premises covered under the Lease by approximately 24,039 square feet, with a targeted commencement date of April 1, 2016, payment of base rent with rent escalation, and an increase in our share of certain operating expenses during the term of the Lease. The December 2015 Amendment also provided for an allowance of up to approximately $0.4 million for tenant improvements. The total future minimum lease payments for additional space, which will be paid through April 2020, are approximately $3.8 million as of December 31, 2015.
On October 14, 2013, Fluidigm Singapore Pte. Ltd., our wholly-owned subsidiary, Fluidigm Singapore, accepted an offer of tenancy (Lease) from HSBC Institutional Trust Services (Singapore) Limited, as trustee of Ascendas Real Estate Investment Trust (Landlord), relating to the lease of a new facility located in Singapore. Pursuant to the terms of the Lease, Fluidigm Singapore took possession of the facility commencing on March 3, 2014 for a term of 99 months, and the Lease and rental obligations thereunder commenced on June 3, 2014. The Lease also provides Fluidigm Singapore with an option to renew the Lease for an additional 60 months at the then prevailing market rent, and on similar terms as the existing Lease. In June 2014, Fluidigm Singapore leased additional space of approximately 2,400 square feet in the same building as the new facility on the same terms as the Lease. We completed the consolidation of our Singapore manufacturing operations in the new space in July 2014 and the site qualification was completed in August 2014. The leases relating to our prior manufacturing facility in Singapore terminated on August 2014. The leases relating to our prior manufacturing facility in Singapore terminated in August 2014. In April 2015, Fluidigm Singapore leased additional space of approximately 10,000 square feet in the same building on the same terms as the Singapore Lease (the April 2015 Singapore Lease). In connection with the April 2015 Singapore Lease, Fluidigm Singapore terminated the June 2014 Singapore Lease as of June 30, 2015. The total future minimum lease payments for the facility, which will be paid through June 2022, are approximately $4.0 million as of December 31, 2015. In connection with our acquisition of DVS, we acquired the operating leases for facilities in Sunnyvale, California and Markham, Ontario, Canada, which expire in July 2016 and January 2016, respectively, in connection with our acquisition of DVS (See Note 4 to our audited consolidated financial statements for additional information). The Canada lease includes an option to renew the lease for an additional five years at the then prevailing market rent, and on similar terms as the existing lease. We extended the
55
Canada lease through April 2016. The total future minimum lease payments for the operating leases in Sunnyvale, California and Markham, Ontario, Canada are approximately $154,000 as of December 31, 2015.
On August 18, 2015, we, Fluidigm Canada Inc., our wholly-owned subsidiary of the Company (Fluidigm Canada), and Rodick Equities, Inc. (Landlord) entered into a lease dated as of August 17, 2015 (the New Canada Lease), relating to the lease of approximately 41,145 square feet of office, laboratory, and warehouse space at a facility in Markham, Ontario, Canada. Pursuant to the terms of the New Canada Lease, Fluidigm Canada was in possession of the new space commencing on or about August 27, 2015, and rental obligations thereunder will commence on April 1, 2016 for a term of ten years. The New Canada Lease provides for an allowance for tenant improvements, an option to renew the Lease for an additional five years, and a right of first offer on certain additional space in the Building.
We have entered into several license and patent agreements. Under these agreements, we pay annual license maintenance fees, nonrefundable license issuance fees, and royalties as a percentage of net sales for the sale or sublicense of products using the licensed technology. Future payments related to these license agreements have not been included in the contractual obligations table above as the period of time over which the future license payments will be required to be made, and the amount of such payments, are indeterminable. We do not expect the license payments to be material in any particular year.
ITEM 7A. QUANTITATIVE AND QUALITATIVE DISCLOSURES ABOUT MARKET RISK
Market risk represents the risk of loss that may impact our financial position due to adverse changes in financial market prices and rates. Our market risk exposure is primarily a result of fluctuations in foreign currency exchange rates and interest rates. We do not hold or issue financial instruments for trading purposes.
Foreign Currency Exchange Risk
As we expand internationally our results of operations and cash flows will become increasingly subject to fluctuations due to changes in foreign currency exchange rates. Our revenue is generally denominated in the local currency of the contracting party. Historically, the majority of our revenue has been denominated in U.S. dollars. Our expenses are generally denominated in the currencies in which our operations are located, which is primarily in the United States, with a portion of expenses incurred in Singapore and Canada where our manufacturing facilities are located. Our results of operations and cash flows are, therefore, subject to fluctuations due to changes in foreign currency exchange rates. The volatility of exchange rates depends on many factors that we cannot forecast with reliable accuracy. We have experienced and will continue to experience fluctuations in our net income or loss as a result of transaction gains or losses related to revaluing certain current asset and current liability balances that are denominated in currencies other than the functional currency of the entities in which they are recorded. For the years ended December 31, 2015 and 2014, we experienced foreign currency losses of $1.6 million and $1.1 million, respectively. To date, we have not entered into any foreign currency hedging contracts although we may do so in the future. As our international operations grow, we will continue to reassess our approach to manage our risk relating to fluctuations in currency rates.
Interest Rate Sensitivity
We had cash and cash equivalents of $29.1 million at December 31, 2015. These amounts were held primarily in cash on deposit with banks and money market funds which are short-term. We had $72.3 million in investments at December 31, 2015 held primarily in U.S. government agency securities. The contractual maturity periods of $65.9 million of our investments are within one year from December 31, 2015. The contractual maturity periods of our remaining investments are less than eighteen months from December 31, 2015. Cash and cash equivalents and investments are held for working capital purposes. Due to the short-term nature of these investments, we believe that we do not have any material exposure to changes in the fair value of our investment portfolio as a result of changes in interest rates. Declines in interest rates, however, will reduce future investment income. If overall interest rates had decreased by 10% during the periods presented, our interest income would not have been materially affected.
Fair Value of Financial Instruments
We do not have material exposure to market risk with respect to investments. We do not use derivative financial instruments for speculative or trading purposes. We may adopt specific hedging strategies in the future.
56
ITEM 8. FINANCIAL STATEMENTS AND SUPPLEMENTARY DATA
Index to Consolidated Financial Statements
Page | |
Report of Ernst & Young - Independent Registered Public Accounting Firm | |
Consolidated Statements of Stockholders' Equity | |
57
Report of Independent Registered Public Accounting Firm
The Board of Directors and Stockholders of Fluidigm Corporation
In our opinion, the accompanying consolidated balance sheet and the related consolidated statements of operations, of comprehensive loss, of stockholders’ equity, and of cash flows present fairly, in all material respects, the financial position of Fluidigm Corporation and its subsidiaries at December 31, 2015, and the results of their operations and their cash flows for the year then ended in conformity with accounting principles generally accepted in the United States of America. In addition, in our opinion, the financial statement schedule for the year ended December 31, 2015 listed in the index appearing under Item 15(2) presents fairly, in all material respects, the information set forth therein when read in conjunction with the related consolidated financial statements. Also in our opinion, the Company maintained, in all material respects, effective internal control over financial reporting as of December 31, 2015, based on criteria established in Internal Control - Integrated Framework (2013) issued by the Committee of Sponsoring Organizations of the Treadway Commission (COSO). The Company's management is responsible for these financial statements and financial statement schedule, for maintaining effective internal control over financial reporting and for its assessment of the effectiveness of internal control over financial reporting, included in the accompanying Management’s Report on Internal Control over Financial Reporting appearing under Item 9A. Our responsibility is to express opinions on these financial statements, on the financial statement schedule, and on the Company's internal control over financial reporting based on our integrated audit. We conducted our audit in accordance with the standards of the Public Company Accounting Oversight Board (United States). Those standards require that we plan and perform the audit to obtain reasonable assurance about whether the financial statements are free of material misstatement and whether effective internal control over financial reporting was maintained in all material respects. Our audit of the financial statements included examining, on a test basis, evidence supporting the amounts and disclosures in the financial statements, assessing the accounting principles used and significant estimates made by management, and evaluating the overall financial statement presentation. Our audit of internal control over financial reporting included obtaining an understanding of internal control over financial reporting, assessing the risk that a material weakness exists, and testing and evaluating the design and operating effectiveness of internal control based on the assessed risk. Our audits also included performing such other procedures as we considered necessary in the circumstances. We believe that our audits provide a reasonable basis for our opinions.
A company’s internal control over financial reporting is a process designed to provide reasonable assurance regarding the reliability of financial reporting and the preparation of financial statements for external purposes in accordance with generally accepted accounting principles. A company’s internal control over financial reporting includes those policies and procedures that (i) pertain to the maintenance of records that, in reasonable detail, accurately and fairly reflect the transactions and dispositions of the assets of the company; (ii) provide reasonable assurance that transactions are recorded as necessary to permit preparation of financial statements in accordance with generally accepted accounting principles, and that receipts and expenditures of the company are being made only in accordance with authorizations of management and directors of the company; and (iii) provide reasonable assurance regarding prevention or timely detection of unauthorized acquisition, use, or disposition of the company’s assets that could have a material effect on the financial statements.
Because of its inherent limitations, internal control over financial reporting may not prevent or detect misstatements. Also, projections of any evaluation of effectiveness to future periods are subject to the risk that controls may become inadequate because of changes in conditions, or that the degree of compliance with the policies or procedures may deteriorate.
/s/ PricewaterhouseCoopers LLP
San Jose, California
February 29, 2016
58
Report of Independent Registered Public Accounting Firm
The Board of Directors and Stockholders of Fluidigm Corporation
We have audited the accompanying consolidated balance sheets of Fluidigm Corporation as of December 31, 2014, and the related consolidated statements of operations, comprehensive loss, stockholders’ equity, and cash flows for the years ended December 31, 2014 and 2013. Our audits also included the financial statement schedule listed in the Index at Item 15(2). These financial statements and schedule are the responsibility of the Company’s management. Our responsibility is to express an opinion on these financial statements and schedule based on our audits.
We conducted our audits in accordance with the standards of the Public Company Accounting Oversight Board (United States). Those standards require that we plan and perform the audit to obtain reasonable assurance about whether the financial statements are free of material misstatement. An audit includes examining, on a test basis, evidence supporting the amounts and disclosures in the financial statements. An audit also includes assessing the accounting principles used and significant estimates made by management, as well as evaluating the overall financial statement presentation. We believe that our audits provide a reasonable basis for our opinion.
In our opinion, the financial statements referred to above present fairly, in all material respects, the consolidated financial position of Fluidigm Corporation at December 31, 2014, and the consolidated results of its operations and its cash flows for each of the years ended December 31, 2014 and 2013, in conformity with U.S. generally accepted accounting principles. Also, in our opinion, the related financial statement schedule, when considered in relation to the basic financial statements taken as a whole, presents fairly in all material respects the information set forth therein.
/s/ Ernst & Young LLP
Redwood City, California
February 29, 2016
59
FLUIDIGM CORPORATION
CONSOLIDATED BALANCE SHEETS
(In thousands, except per share amounts)
December 31, 2015 | December 31, 2014 | |||||||
ASSETS | ||||||||
Current assets: | ||||||||
Cash and cash equivalents | $ | 29,117 | $ | 33,713 | ||||
Short-term investments | 65,855 | 81,588 | ||||||
Accounts receivable (net of allowances of $103 and $120 at December 31, 2015 and 2014, respectively) | 25,457 | 22,384 | ||||||
Inventories | 17,924 | 15,991 | ||||||
Prepaid expenses and other current assets | 5,742 | 2,221 | ||||||
Total current assets | 144,095 | 155,897 | ||||||
Long-term investments | 6,493 | 27,499 | ||||||
Property and equipment, net | 15,258 | 13,889 | ||||||
Other non-current assets | 10,059 | 3,966 | ||||||
Developed Technology, net | 91,048 | 102,200 | ||||||
Goodwill | 104,108 | 104,108 | ||||||
Total assets | $ | 371,061 | $ | 407,559 | ||||
LIABILITIES AND STOCKHOLDERS’ EQUITY | ||||||||
Current liabilities: | ||||||||
Accounts payable | $ | 6,094 | $ | 5,919 | ||||
Accrued compensation and related benefits | 3,553 | 6,874 | ||||||
Other accrued liabilities | 11,015 | 9,664 | ||||||
Deferred revenue, current portion | 9,419 | 6,928 | ||||||
Total current liabilities | 30,081 | 29,385 | ||||||
Convertible notes, net | 195,684 | 195,455 | ||||||
Deferred tax liability | 23,595 | 26,152 | ||||||
Deferred revenue, net of current portion | 4,398 | 4,357 | ||||||
Other non-current liabilities | 2,402 | 1,791 | ||||||
Total liabilities | 256,160 | 257,140 | ||||||
Commitments and contingencies | ||||||||
Stockholders’ equity: | ||||||||
Preferred stock, $0.001 par value, 10,000 shares authorized, no shares issued and outstanding at either December 31, 2015 or 2014 | — | — | ||||||
Common stock: $0.001 par value, 200,000 shares authorized at December 31, 2015 and 2014; 28,844 and 28,341 shares issued and outstanding at December 31, 2015 and 2014, respectively | 29 | 28 | ||||||
Additional paid-in capital | 479,508 | 461,362 | ||||||
Accumulated other comprehensive loss | (1,144 | ) | (794 | ) | ||||
Accumulated deficit | (363,492 | ) | (310,177 | ) | ||||
Total stockholders’ equity | 114,901 | 150,419 | ||||||
Total liabilities and stockholders’ equity | $ | 371,061 | $ | 407,559 | ||||
See accompanying notes
60
FLUIDIGM CORPORATION
CONSOLIDATED STATEMENTS OF OPERATIONS
(In thousands, except per share amounts)
Year Ended December 31, | ||||||||||||
2015 | 2014 | 2013 | ||||||||||
Revenue: | ||||||||||||
Product revenue | $ | 102,140 | $ | 107,071 | $ | 65,189 | ||||||
Service revenue | 12,315 | 8,844 | 5,009 | |||||||||
License revenue | 257 | 323 | 327 | |||||||||
Grant revenue | — | 218 | 658 | |||||||||
Total revenue | 114,712 | 116,456 | 71,183 | |||||||||
Costs and expenses: | ||||||||||||
Cost of product revenue | 43,001 | 39,511 | 18,538 | |||||||||
Cost of service revenue | 3,629 | 3,338 | 1,666 | |||||||||
Research and development | 39,264 | 43,423 | 19,953 | |||||||||
Selling, general and administrative | 82,959 | 71,324 | 48,412 | |||||||||
Litigation settlement | — | — | 1,267 | |||||||||
Acquisition-related expenses | — | 10,696 | — | |||||||||
Gain on escrow settlement | (3,986 | ) | — | — | ||||||||
Total costs and expenses | 164,867 | 168,292 | 89,836 | |||||||||
Loss from operations | (50,155 | ) | (51,836 | ) | (18,653 | ) | ||||||
Interest expense | (5,808 | ) | (5,344 | ) | (14 | ) | ||||||
Gain from sale of investment in Verinata | 2,330 | 332 | 1,777 | |||||||||
Other income (expense), net | (1,157 | ) | (857 | ) | 501 | |||||||
Loss before income taxes | (54,790 | ) | (57,705 | ) | (16,389 | ) | ||||||
Benefit from (provision for) income taxes | 1,475 | 4,875 | (137 | ) | ||||||||
Net loss | (53,315 | ) | (52,830 | ) | (16,526 | ) | ||||||
Net loss per share, basic and diluted | $ | (1.86 | ) | $ | (1.90 | ) | $ | (0.65 | ) | |||
Shares used in computing net loss per share, basic and diluted | 28,711 | 27,768 | 25,479 | |||||||||
See accompanying notes
61
FLUIDIGM CORPORATION
CONSOLIDATED STATEMENTS OF COMPREHENSIVE LOSS
(In thousands)
Year Ended December 31, | ||||||||||||
2015 | 2014 | 2013 | ||||||||||
Net loss | $ | (53,315 | ) | $ | (52,830 | ) | $ | (16,526 | ) | |||
Other comprehensive (loss) income, net of tax | ||||||||||||
Foreign currency translation adjustment | (327 | ) | (2 | ) | 30 | |||||||
Unrealized (loss) gain on available-for-sale securities, net | (23 | ) | (62 | ) | 9 | |||||||
Other comprehensive (loss) income | (350 | ) | (64 | ) | 39 | |||||||
Comprehensive loss | $ | (53,665 | ) | $ | (52,894 | ) | $ | (16,487 | ) | |||
See accompanying notes
62
FLUIDIGM CORPORATION
CONSOLIDATED STATEMENTS OF STOCKHOLDERS’ EQUITY
(In thousands)
Common Stock | Additional Paid-in Capital | Accumulated Other Comprehensive Loss | Accumulated Deficit | Total Stockholders’ Equity | |||||||||||||||||||
Shares | Amount | ||||||||||||||||||||||
Balance at December 31, 2012 | 25,115 | $ | 25 | $ | 342,222 | $ | (769 | ) | $ | (240,821 | ) | $ | 100,657 | ||||||||||
Issuance of common stock upon exercise of stock options for cash | 696 | 1 | 5,805 | — | — | 5,806 | |||||||||||||||||
Stock-based compensation expense | — | — | 6,438 | — | — | 6,438 | |||||||||||||||||
Net loss | — | — | — | — | (16,526 | ) | (16,526 | ) | |||||||||||||||
Other comprehensive loss | — | — | — | 39 | — | 39 | |||||||||||||||||
Balance at December 31, 2013 | 25,811 | $ | 26 | $ | 354,465 | $ | (730 | ) | $ | (257,347 | ) | $ | 96,414 | ||||||||||
63
FLUIDIGM CORPORATION
CONSOLIDATED STATEMENTS OF STOCKHOLDERS’ EQUITY —(Continued)
(In thousands)
Common Stock | Additional Paid-in Capital | Accumulated Other Comprehensive Loss | Accumulated Deficit | Total Stockholders’ Equity | |||||||||||||||||||
Shares | Amount | ||||||||||||||||||||||
Balance at December 31, 2013 | 25,811 | $ | 26 | $ | 354,465 | $ | (730 | ) | $ | (257,347 | ) | $ | 96,414 | ||||||||||
Issuance of common stock upon purchase of DVS | 1,945 | 2 | 76,805 | — | — | 76,807 | |||||||||||||||||
Vested DVS stock options converted to equivalent vested options | — | — | 4,039 | — | — | 4,039 | |||||||||||||||||
Issuance of common stock upon exercise of stock options for cash and release of restricted stock units | 585 | — | 5,113 | — | — | 5,113 | |||||||||||||||||
Stock-based compensation expense | — | — | 20,940 | — | — | 20,940 | |||||||||||||||||
Net loss | — | — | — | — | (52,830 | ) | (52,830 | ) | |||||||||||||||
Other comprehensive income | — | — | — | (64 | ) | — | (64 | ) | |||||||||||||||
Balance at December 31, 2014 | 28,341 | $ | 28 | $ | 461,362 | $ | (794 | ) | $ | (310,177 | ) | $ | 150,419 | ||||||||||
64
FLUIDIGM CORPORATION
CONSOLIDATED STATEMENTS OF STOCKHOLDERS’ EQUITY —(Continued)
(In thousands)
Common Stock | Additional Paid-in Capital | Accumulated Other Comprehensive Loss | Accumulated Deficit | Total Stockholders’ Equity | |||||||||||||||||||
Shares | Amount | ||||||||||||||||||||||
Balance at December 31, 2014 | 28,341 | $ | 28 | $ | 461,362 | $ | (794 | ) | $ | (310,177 | ) | $ | 150,419 | ||||||||||
Issuance of common stock upon exercise of stock options for cash and release of restricted stock units | 673 | 1 | 5,302 | — | — | 5,303 | |||||||||||||||||
Stock-based compensation expense | — | — | 16,830 | — | — | 16,830 | |||||||||||||||||
Gain on escrow settlement | (170 | ) | — | (3,986 | ) | (3,986 | ) | ||||||||||||||||
Net loss | — | — | — | — | (53,315 | ) | (53,315 | ) | |||||||||||||||
Other comprehensive loss | — | — | — | (350 | ) | — | (350 | ) | |||||||||||||||
Balance at December 31, 2015 | 28,844 | $ | 29 | $ | 479,508 | $ | (1,144 | ) | $ | (363,492 | ) | $ | 114,901 | ||||||||||
See accompanying notes.
65
FLUIDIGM CORPORATION
CONSOLIDATED STATEMENTS OF CASH FLOWS
(In thousands)
Year Ended December 31, | ||||||||||||
2015 | 2014 | 2013 | ||||||||||
Operating activities | ||||||||||||
Net loss | $ | (53,315 | ) | $ | (52,830 | ) | $ | (16,526 | ) | |||
Adjustments to reconcile net loss to net cash used in operating activities: | ||||||||||||
Depreciation and amortization | 4,915 | 4,061 | 2,551 | |||||||||
Stock-based compensation expense | 16,830 | 20,940 | 6,438 | |||||||||
Acquisition-related share-based awards acceleration expense | — | 2,648 | — | |||||||||
Amortization of developed technology | 11,200 | 9,800 | — | |||||||||
Non-cash charges for sale of inventory revalued at the date of acquisition | — | 856 | — | |||||||||
Non-cash charges for release of restricted stock units | 137 | |||||||||||
Loss on disposal of property and equipment | 87 | 83 | 296 | |||||||||
Gain from escrow settlement | (3,986 | ) | — | — | ||||||||
Gain from sale of investment in Verinata | (2,330 | ) | (332 | ) | (1,777 | ) | ||||||
Changes in assets and liabilities: | ||||||||||||
Accounts receivable | (2,762 | ) | (3,393 | ) | 2,412 | |||||||
Inventories | (3,741 | ) | (6,162 | ) | (1,533 | ) | ||||||
Prepaid expenses and other assets | (1,127 | ) | (52 | ) | (882 | ) | ||||||
Accounts payable | 769 | 107 | 1,802 | |||||||||
Deferred revenue | 2,613 | 3,191 | 1,640 | |||||||||
Other liabilities | (3,986 | ) | (1,540 | ) | 3,988 | |||||||
Net cash used in operating activities | (34,696 | ) | (22,623 | ) | (1,591 | ) | ||||||
Investing activities | ||||||||||||
Acquisition, net of cash acquired | — | (113,190 | ) | — | ||||||||
Purchases of investments | (66,973 | ) | (132,644 | ) | (59,436 | ) | ||||||
Proceeds from sales and maturities of investments | 103,369 | 74,520 | 33,440 | |||||||||
Proceeds from sale of investment in Verinata | — | 332 | 3,117 | |||||||||
Purchase of intangible assets | (6,670 | ) | — | (1,240 | ) | |||||||
Purchases of property and equipment | (3,982 | ) | (7,403 | ) | (3,446 | ) | ||||||
Net cash (used in) provided by investing activities | 25,744 | (178,385 | ) | (27,565 | ) | |||||||
Financing activities | ||||||||||||
Proceeds from issuance of convertible notes, net | — | 195,213 | — | |||||||||
Proceeds from issuance of common stock, net of issuance costs | — | — | — | |||||||||
Proceeds from exercise of stock options | 5,303 | 5,113 | 5,806 | |||||||||
Repayment of long-term debt | — | — | — | |||||||||
Proceeds from line of credit | — | — | — | |||||||||
Repayment of line of credit | — | — | — | |||||||||
Net cash provided by financing activities | 5,303 | 200,326 | 5,806 | |||||||||
Effect of foreign exchange rate fluctuations on cash and cash equivalents | (947 | ) | (866 | ) | (38 | ) | ||||||
Net (decrease) increase in cash and cash equivalents | $ | (4,596 | ) | $ | (1,548 | ) | $ | (23,388 | ) | |||
Cash and cash equivalents at beginning of period | 33,713 | 35,261 | 58,649 | |||||||||
Cash and cash equivalents at end of period | $ | 29,117 | $ | 33,713 | $ | 35,261 | ||||||
Supplemental disclosures of cash flow information | ||||||||||||
Cash paid for interest | $ | 5,538 | $ | 2,750 | $ | 7 | ||||||
Cash paid for income taxes | $ | 189 | $ | 187 | $ | 242 | ||||||
Non-cash investing and financing activities | ||||||||||||
Issuance of common stock and options related to acquisition | $ | — | $ | 78,196 | $ | — | ||||||
See accompanying notes
66
1. Description of Business
Fluidigm Corporation (we, our, or us) was incorporated in the State of California in May 1999 to commercialize microfluidic technology initially developed at the California Institute of Technology. In July 2007, we were reincorporated in Delaware. Our headquarters are located in South San Francisco, California.
We create, manufacture, and market innovative technologies and life-science tools focused on the exploration and analysis of single cells, as well as the industrial application of genomics, based upon our core microfluidics and mass cytometry technologies. We sell instruments and consumables, including integrated fluidic circuits (IFCs), assays, and reagents, to academic institutions, clinical laboratories, and pharmaceutical, biotechnology, and agricultural biotechnology (Ag-Bio) companies.
On February 13, 2014, we completed our acquisition of DVS Sciences, Inc., a Delaware corporation (DVS) for approximately $199.9 million and assumed all outstanding DVS stock options and unvested restricted stock, pursuant to a merger agreement dated as of January 28, 2014.
2. Summary of Significant Accounting Policies
Basis of Presentation and Consolidation
The accompanying consolidated financial statements have been prepared in conformity with U.S. generally accepted accounting principles (U.S. GAAP) and include the accounts of our wholly-owned subsidiaries. As of December 31, 2015, we had wholly-owned subsidiaries in Singapore, Canada, the Netherlands, Japan, France, the United Kingdom, China, and Germany. All subsidiaries, except for Singapore, use their local currency as their functional currency. The Singapore subsidiary uses the U.S. dollar as its functional currency. All intercompany transactions and balances have been eliminated in consolidation.
Prior Period Reclassifications
Certain prior period amounts were reclassified to conform with the current period presentation of service revenue and cost of service revenue within our consolidated statement of operations. These reclassifications do not affect total revenue, total costs and expenses, loss from operations, or net loss.
Use of Estimates
The preparation of financial statements in accordance with U.S. GAAP requires management to make estimates and assumptions that affect the amounts reported in the consolidated financial statements and accompanying notes. We base our estimates on historical experience and on various other assumptions believed to be reasonable, which together form the basis for making judgments about the carrying values of assets and liabilities. Actual results could differ materially from these estimates and could have a material adverse effect on our consolidated financial statements.
Foreign Currency
Assets and liabilities of non-U.S. subsidiaries that use the local currency as their functional currency are translated into U.S. dollars at exchange rates in effect on the balance sheet date. The adjustments resulting from the foreign currency translations are recorded in accumulated other comprehensive income/loss, a separate component of stockholders’ equity. Income and expense accounts are translated at monthly average exchange rates during the year.
Cash and Cash Equivalents
We consider all highly liquid financial instruments with maturities at the time of purchase of three months or less to be cash equivalents. Cash and cash equivalents may consist of cash on deposit with banks, money market funds, and notes from government-sponsored agencies.
Investments
Short and long-term investments are comprised of notes from government-sponsored agencies. All investments are recorded at estimated fair value. Any unrealized gains and losses from investments are reported in accumulated other comprehensive loss, a separate component of stockholders’ equity. We evaluate our investments to assess whether investments
67
with unrealized loss positions are other than temporarily impaired. An investment is considered to be other than temporarily impaired if the impairment is related to deterioration in credit risk or if it is likely that we will sell the securities before the recovery of their cost basis. No investment has been assessed as other than temporarily impaired, and realized gains and losses were immaterial during the years presented. The cost of securities sold or the amount reclassified out of accumulated other comprehensive income into earnings is based on the specific-identification method.
Fair Value of Financial Instruments
Our financial instruments consist primarily of cash and cash equivalents, investments, accounts receivable, accounts payable, and convertible notes. Our cash equivalents, investments, accounts receivable, and accounts payable have short maturity or payment periods. Accordingly, their carrying values approximated their fair values at December 31, 2015 and 2014. The convertible notes are presented at their carrying value, with fair value disclosures made in Note 5. As a basis for considering fair value, we follow a three-tier value hierarchy, which prioritizes the inputs used in measuring fair value as follows:
Level I: observable inputs such as quoted prices in active markets;
Level II: inputs other than quoted prices in active markets that are observable either directly or indirectly; and
Level III: unobservable inputs for which there is little or no market data, which requires us to develop our own assumptions.
This hierarchy requires us to use observable market data, when available, and to minimize the use of unobservable inputs when determining fair value. Our cash equivalents, which include money market funds, are classified as Level I because they are valued using quoted market prices. Our investments and convertible notes are generally classified as Level II because their value is based on valuations using significant inputs derived from or corroborated by observable market data. Depending on the security, the income and market approaches are used in the model driven valuations. Inputs of these models include recently executed transaction prices in securities of the issuer or comparable issuers and yield curves.
Accounts Receivable
Trade accounts receivable are recorded at net invoice value. We review our exposure to accounts receivable and provide allowances of specific amounts if collectability is no longer reasonably assured based on historical experience and specific customer collection issues. We evaluate such allowances on a regular basis and adjust them as needed.
Concentrations of Business and Credit Risk
Financial instruments that potentially subject us to credit risk consist of cash, cash equivalents, investments, and accounts receivable. Our cash, cash equivalents, and investments may consist of deposits held with banks, money market funds, and other highly liquid investments that may at times exceed federally insured limits. Cash equivalents and investments are financial instruments that potentially subject us to concentrations of risk. Under our investment policy, we invest primarily in securities issued by the U.S. government. The goals of our investment policy, in order of priority, are as follows: preserve capital, meet liquidity needs, and optimize returns.
We generally do not require collateral to support credit sales. To reduce credit risk, we perform credit evaluations of our customers. No single customer represented more than 10% of total revenue for 2015, 2014, or 2013, and no single customer represented more than 10% of total accounts receivable at December 31, 2015 or 2014.
Our products include components that are currently procured from a single source or a limited number of sources. We believe that other vendors would be able to provide similar components; however, the qualification of such vendors may require start-up time. In order to mitigate any adverse impacts from a disruption of supply, we attempt to maintain an adequate supply of critical limited-source components.
Inventories
Inventories are stated at the lower of cost (on a first-in, first-out basis) or market. Inventory costs include direct materials, direct labor, and normal manufacturing overhead. Finished goods that are used for research and development are expensed as consumed or depreciated over their period of use. Provisions for slow-moving, excess, and obsolete inventories are recorded when required to reduce inventory values to their estimated net realizable values based on product life cycle, development plans, product expiration, and quality issues.
68
Property and Equipment
Property and equipment, including leasehold improvements, are stated at cost less accumulated depreciation. Accumulated depreciation is calculated using the straight-line method over the estimated useful lives of the assets, which range from three to seven years. Leasehold improvements are amortized using the straight-line method over the estimated useful lives of the assets or the remaining term of the lease, whichever is shorter.
We evaluate our long-lived assets for indicators of possible impairment when events or changes in circumstances indicate the carrying amount of an asset may not be recoverable. If any indicator of impairment exists, we assess the recoverability of the affected long-lived assets by determining whether the carrying value of the asset can be recovered through undiscounted future operating cash flows. If impairment is indicated, we estimate the asset’s fair value using future discounted cash flows associated with the use of the asset, and adjust the carrying value of the asset accordingly. We did not recognize any impairment of long-lived assets for any of the periods presented herein.
Investment, at Cost
In February 2013, Illumina, Inc. acquired Verinata Health, Inc. (Verinata), a privately-held company, for $350 million in cash and up to an additional $100 million in milestone payments through December 2015. In March 2013, we received cash proceeds of $3.1 million in exchange for our ownership interest in Verinata resulting in a gain of $1.8 million. During 2014, we received cash proceeds of $0.3 million from the escrow account related to the acquisition. We recorded these amounts as Gain from sale of investment in Verinata in the accompanying consolidated statements of operations for the years ended December 31, 2013 and 2014. The final milestones related to the sale of Verinata to Illumina were met in December 2015 and, accordingly, we recorded our share of these milestone payment obligations in the amount of $2.3 million in Other Assets and Gain from sale of investment in Verinata in the accompany consolidated statement of operations for the year ended December 31, 2015. In January 2016, we received payment of this amount.
Intangible Assets
In connection with the acquisition of DVS in February 2014, we acquired developed technology with a gross fair value of $112 million. These acquired intangible assets from DVS are being amortized to cost of product revenue over their useful life of ten years. Related amortization expense for the years ended December 31, 2015 and 2014 was $11.2 million and $9.8 million, respectively. For further discussion related to intangible assets acquired in 2014 from the DVS acquisition, see Note 4.
On June 28, 2013, we acquired certain patents, patent applications, and licenses from Helicos Biosciences Corporation (Helicos) relating to Helicos’ next-generation sequencing technology. The rights acquired by us are subject to certain licenses and sublicenses granted by Helicos prior to or contemporaneously with our acquisition. The assets were acquired for $1.0 million and we incurred transaction costs of approximately $0.3 million. The patents, patent applications, and licenses have an alternative future use and, as a result, the acquired assets and transaction costs are capitalized as intangible assets and are included in other non-current assets. The acquired assets from Helicos are being amortized to research and development expense over their useful life of ten years. Related amortization expense for the years ended December 31, 2015, 2014 and 2013 was $127,000, $127,000 and $63,000, respectively.
We evaluate our intangible assets for indicators of possible impairment when events or changes in circumstances indicate the carrying amount of an asset may not be recoverable. If any indicator of impairment exists, we assess the recoverability of the affected intangible assets by determining whether the carrying value of the asset can be recovered through undiscounted future operating cash flows. If impairment is indicated, we estimate the asset’s fair value using future discounted cash flows associated with the use of the asset, and adjust the carrying value of the asset accordingly. We did not recognize any impairment on intangible assets for any of the periods presented herein.
Product Warranties
We generally provide a one-year warranty on our instruments. We review our exposure to estimated warranty expense associated with instrument sales and establish an accrual based on historical product failure rates and actual warranty costs incurred. This expense is recorded as a component of cost of product revenue in the consolidated statements of operations.
69
Revenue Recognition
We generate revenue from sales of our products, services, license agreements, and government grants. Our products consist of instruments and consumables, including IFCs, assays, and other reagents. Our service revenue consists of post-warranty service contracts, preventive maintenance plans, instrument parts, installation, and training.
We recognize revenue when persuasive evidence of an arrangement exists, delivery has occurred or services have been rendered, the price to the customer is fixed or determinable, and collectability is reasonably assured. We assess collectability based on factors such as the customer’s creditworthiness and past collection history, if applicable. If collection is not reasonably assured, revenue recognition is deferred until receipt of payment. We also assess whether a price is fixed or determinable by, among other things, reviewing contractual terms and conditions related to payment. Delivery occurs when there is a transfer of title and risk of loss passes to the customer.
Product and Service Revenue
Certain of our sales contracts involve the delivery of multiple products and services within contractually binding arrangements. Multiple-deliverable sales transactions typically consist of the sale and delivery of one or more instruments and consumables together with one or more of our installation, training and/or customer support services. Significant judgment is sometimes required to determine the appropriate accounting for such arrangements, including whether the deliverables specified in a multiple element arrangement should be treated as separate units of accounting for revenue recognition purposes and, if so, how the related sales price should be allocated among the elements, when to recognize revenue for each element, and the period over which revenue should be recognized.
For sales contracts that include multiple deliverables, we allocate the contract consideration at the inception of the contract to each unit of accounting based upon its relative selling price. We may use our best estimate of selling price for
individual deliverables when vendor specific objective evidence or third-party evidence is unavailable. A delivered item is considered to be a separate unit of accounting when it has value to the customer on a stand-alone basis.
Our products, other than service contracts, are typically delivered within a short time frame, generally within one to three months of the contract date. Service contracts are entered into for terms of one to three years, following the expiration of the warranty period.
Our products are generally sold without the right of return. Amounts received before revenue recognition criteria are met are classified in the consolidated balance sheets as deferred revenue or customer deposits, depending on the terms of the arrangement.
License Revenue
License and royalty revenue from license agreements is recognized when received, which is generally in the quarter following the quarter in which the corresponding sales occur.
Grant Revenue
We have received grants from various governmental entities for research and related activities. Grants provide us with payments for certain types of research and development activities performed over a contractually defined period. Grant revenue is recognized in the period during which the related costs are incurred, provided that the conditions under which the grants were provided have been met and we have only perfunctory obligations outstanding. Amounts received in advance of revenue recognition are classified as deferred revenue in the consolidated balance sheets. Costs associated with grants are included in research and development expenses in the consolidated statements of operations.
Shipping and Handling Costs
Shipping and handling costs incurred for product shipments are included within cost of product revenue in the consolidated statements of operations.
Research and Development
We recognize research and development expenses in the period incurred. Research and development expenses consist of personnel costs, independent contractor costs, prototype and materials expenses, allocated facilities and information technology expenses, and related overhead expenses.
70
Advertising Costs
We expense advertising costs as incurred. We incurred advertising costs of $2.9 million, $4.2 million, and $2.4 million during 2015, 2014, and 2013, respectively.
Income Taxes
We use the asset and liability method to account for income taxes. Deferred tax assets and liabilities are recognized for the future tax consequences attributable to temporary differences between the financial statement carrying amounts of existing assets and liabilities and their respective tax bases. Deferred tax assets and liabilities are measured using enacted tax rates expected to apply to taxable income in the years in which those temporary differences are expected to be recovered or settled. Valuation allowances are provided when the expected realization of deferred tax assets does not meet a “more likely than not” criterion. We make estimates and judgments about our future taxable income that are based on assumptions that are consistent with our plans and estimates. Should the actual amounts differ from our estimates, the amount of our valuation allowance could be materially impacted. Changes in these estimates may result in significant increases or decreases to our tax provision in a period in which such estimates are changed, which in turn would affect net income or loss.
We recognize the financial statement effects of a tax position when it is more likely than not, based on the technical merits, that the position will be sustained upon examination. Any interest and penalties related to uncertain tax positions are reflected in the income tax provision.
Stock-Based Compensation
We account for stock options and restricted stock units granted to employees and directors based on the fair value of the awards. We recognize stock-based compensation expense on a straight-line basis over the requisite service periods. For performance-based stock options, we recognize stock-based compensation expense over the requisite service period using the accelerated attribution method.
Comprehensive Loss
Comprehensive loss is comprised of net loss and other comprehensive income (loss). Other comprehensive income (loss) consists of unrealized gains and losses on our investments and foreign currency translation adjustments. Total comprehensive loss for all periods presented has been disclosed in the consolidated statements of comprehensive loss.
The components of accumulated other comprehensive loss, net of tax, for the years ended December 31, 2015, 2014, and 2013 are as follows (in thousands):
Foreign currency translation adjustment | Unrealized gain (loss) on investments | Accumulated Other Comprehensive Income (Loss) | ||||||||||
Beginning balance at December 31, 2013 | $ | (743 | ) | $ | 13 | $ | (730 | ) | ||||
Change during the year | (2 | ) | (62 | ) | (64 | ) | ||||||
Ending balance at December 31, 2014 | (745 | ) | (49 | ) | (794 | ) | ||||||
Change during the year | (327 | ) | (23 | ) | (350 | ) | ||||||
Ending balance at December 31, 2015 | $ | (1,072 | ) | $ | (72 | ) | $ | (1,144 | ) | |||
None of the above amounts have been reclassified to the consolidated statement of operations.
Business Combinations
Assets acquired and liabilities assumed as part of a business combination are generally recorded at their fair values at the date of acquisition. The excess of purchase price over the fair value of assets acquired and liabilities assumed is recorded as goodwill. Determining fair value of identifiable assets, particularly intangibles, and liabilities acquired requires management to make estimates, which are based on all available information and, in some cases, assumptions with respect to the timing and amount of future revenues and expenses associated with an asset. Accounting for business acquisitions requires management to make judgments as to whether a purchase transaction is a multiple element contract, meaning that it includes other transaction components such as a settlement of a preexisting relationship. This judgment and determination affects the amount of consideration paid that is allocable to assets and liabilities acquired in the business purchase transaction. See Note 4.
71
Long-lived Assets, including Goodwill
Goodwill and intangible assets with indefinite lives are not subject to amortization, but are tested for impairment on an annual basis during the fourth quarter or whenever events or changes in circumstances indicate the carrying amount of these assets may not be recoverable. We first conduct an assessment of qualitative factors to determine whether it is more likely than not that the fair value of our reporting unit is less than its carrying amount. If we determine that it is more likely than not that the fair value of our reporting unit is less than its carrying amount, we then conduct a two-step test for impairment of goodwill. In the first step, we compare the fair value of our reporting unit to its carrying value. If the fair value of our reporting unit exceeds its carrying value, goodwill is not considered impaired and no further analysis is required. If the carrying values of the reporting unit exceed its fair value, then the second step of the impairment test must be performed in order to determine the implied fair value of the goodwill. If the carrying value of the goodwill exceeds its implied fair value, then an impairment loss equal to the difference would be recorded.
We evaluate our finite lived intangible assets for indicators of possible impairment when events or changes in circumstances indicate that the carrying amount of an asset may not be recoverable. If any indicator of impairment exists, we assess the recoverability of the affected intangible asset by determining whether the carrying value of the asset can be recovered through undiscounted future operating cash flows. If impairment is indicated, we estimate the asset’s fair value using future discounted cash flows associated with the use of the asset, and adjust the carrying value of the asset accordingly.
Net Loss per Share
Our basic and diluted net loss per share is calculated by dividing net loss by the weighted-average number of shares of common stock outstanding for the period. Restricted stock units and options to purchase our common stock are considered to be potentially dilutive common shares but have been excluded from the calculation of diluted net loss per share, as their effect is anti-dilutive for all periods presented.
The following potentially dilutive common shares were excluded from the computations of diluted net loss per share for the periods presented because including them would have been anti-dilutive (in thousands):
At December 31, | |||||||||
2015 | 2014 | 2013 | |||||||
Stock options, restricted stock units and restricted stock awards | 3,905 | 3,736 | 3,432 | ||||||
Convertible notes | 3,598 | 3,598 | — | ||||||
Total | 7,503 | 7,334 | 3,432 | ||||||
Recent Accounting Pronouncements
With the exception of those discussed below, there have not been any recent changes in accounting pronouncements issued by the Financial Accounting Standards Board (FASB) during the year ended December 31, 2015 that are of significance or potential significance to us.
In April 2015, the FASB issued Accounting Standards Update No. 2015-03 (ASU-2015-03), Interest - Imputation of Interest (Subtopic 835-30): Simplifying the Presentation of Debt Issuance Costs. This guidance is intended to simplify the presentation of debt issuance costs. These amendments require that debt issuance costs related to a recognized debt liability be presented in the balance sheet as a direct deduction from the carrying amount of that debt liability, consistent with debt discounts. It will be effective for our interim and annual financial statements beginning in the first quarter of 2016. We will apply the guidance in ASU 2015-03 in our financial statements commencing in the first quarter of 2016, which will result in a reclassification of approximately $1.0 million from Other Assets to a reduction of Convertible Notes, net.
In May 2014, the FASB issued Accounting Standards Update 2014-09 (ASU 2014-09) regarding ASC Topic 606 Revenue from Contracts with Customers. ASU 2014-09 provides principles for recognizing revenue to depict the transfer of promised goods or services to customers in an amount that reflects the consideration to which the entity expects to be entitled in exchange for those goods or services. On July 7, 2015, the FASB amended ASU 2014-09 to defer the effective date by one year with early adoption permitted as of the original effective date. ASU 2014-09 will be effective for our fiscal year beginning January 1, 2018 unless we elect the earlier date of January 1, 2017. We are currently evaluating the accounting, transition, and disclosure requirements of the standard. We have not yet determined whether we will elect early adoption of the standard and currently cannot estimate the financial statement impact of adoption.
72
In July 2015, the FASB issued Accounting Standards Update 2015-11, Inventory (Topic 330): Simplifying the Measurement of Inventory (ASU 2015-11) which changes the measurement principle for inventory from the lower of cost or market to the lower of cost and net realizable value. ASU 2015-11 defines net realizable value as estimated selling prices in the ordinary course of business, less reasonably predictable costs of completion, disposal, and transportation. It will be effective for our interim and annual financial statements beginning in the first quarter of 2017 and early adoption is permitted. We currently are evaluating the adoption of the provisions of ASU 2015-11 and cannot currently estimate the financial statement impact of adoption.
In November 2015, the FASB issued Accounting Standards Update 2015-17 ASC 740, Income Taxes, Balance Sheet Classification of Deferred Taxes, effective for annual periods beginning after December 15, 2016. The amendments in this update require that in a classified statement of financial position, an entity shall classify deferred tax liabilities and assets as non-current, and an entity shall not offset deferred tax liabilities and assets attributable to different tax-paying components of the entity or to different tax jurisdictions. We currently are evaluating the adoption of the provisions of ASU 2015-17 and cannot currently estimate the financial statement impact of adoption.
3. License and Grant Agreements
License Agreements
On June 30, 2011, we settled certain litigation and entered into a series of patent license agreements with Life Technologies Corporation (now part of Thermo Fisher Scientific) and its subsidiary, Applied Biosystems, LLC (collectively, Life). The agreements resulted in a net $3.0 million payment by us to Life, which was recognized as a litigation settlement expense. The agreements also provide for various royalty payments on future sales of certain products by each of the parties. Such royalty payments or receipts have not been and are not expected to be material to us. Under the terms of the agreements, in July 2011, we paid Life $2.0 million in connection with the exercise of our option to limit or preclude certain patent litigation between us and Life for a period of two to four years. As a result, subject to certain exceptions, Life may not initiate litigation under its patents existing as of June 30, 2011 against us, with respect to its current products and equivalent future products, for a period of four years. The additional payment was included in other assets and is being amortized to selling, general and administrative expense over four years on a straight-line basis beginning in July 2011. The additional payment is being amortized to selling, general and administrative expense because it precludes Life from initiating litigation for a period of four years under its relevant patents for any alleged prior and future infringement by us, and because such preclusion relates to our equivalent future products. We recognized $0.3 million, $0.5 million, and $0.5 million of amortization expense during 2015, 2014, and 2013, respectively.
In May 2011, we entered into an agreement with Caliper Life Sciences, Inc., which subsequently became a PerkinElmer company (Caliper), to license Caliper’s existing patent portfolio in certain fields, including non-invasive prenatal diagnostics, and obtained an option to extend this license to cover additional fields. Additional payments are due if we exercise our option to extend the license. Under this agreement, we made an up-front payment of $0.6 million and our obligation to pay royalties to Caliper commenced in January 2012. In August 2011, we entered into an amendment to the agreement with Caliper and made an additional up-front payment of $0.5 million. Pursuant to the amendment, the rates for royalties payable to Caliper were substantially reduced and the period for which we are obligated to make royalty payments was shortened, with the last payment due in mid-2018 for our existing products at the time of amendment and their future equivalents. If any of our future products are determined to infringe Caliper’s patents, the same reduced royalty rates will apply until the respective patents expire. The aggregate $1.1 million of payments to Caliper are being amortized to cost of product revenue on a straight-line basis through July 2018, when our royalty payment obligations are expected to terminate based upon our current products. We recognized $0.3 million in cost of product revenue during each of 2015, 2014, and 2013. Our future royalty payments are not expected to be material.
Grants
California Institute for Regenerative Medicine
In May 2011, we were awarded a grant from the California Institute for Regenerative Medicine (CIRM) in the amount of $1.9 million to be earned over a three-year period. Under this grant, we designed and developed prototype microfluidic systems for use in stem cell research. The CIRM grant revenue is recognized as the related research and development services are performed and costs associated with this grant were recognized as research and development expense during the period incurred. We recognized $0.2 million and $0.6 million during 2014 and 2013, respectively. This grant terminated in April 2014.
73
4. Acquisition
On February 13, 2014 (Acquisition Date), we acquired DVS primarily to broaden our addressable single-cell biology market opportunity and complement our existing product offerings. DVS develops, manufactures, markets, and sells high-parameter single-cell protein analysis systems and related reagents and data analysis tools. DVS’s principal market is the life sciences research market consisting of drug development companies, government research centers, and universities worldwide.
The contractual price for the acquisition was $207.5 million, subject to certain adjustments as specified in the merger agreement. The measurement period for the acquisition ended February 12, 2015. The aggregate purchase price was determined to be $199.9 million, as detailed in the table below (in thousands):
Estimated Fair Value | ||||
Cash | $ | 126,048 | ||
Issued 1,759,007 shares of Fluidigm common stock (2) | 76,805 | |||
Acquisition consideration paid at Acquisition Date | 202,853 | |||
Accelerated stock compensation (1) | (6,690 | ) | ||
Estimated fair value of vested Fluidigm equivalent stock options (2) | 4,039 | |||
Working capital adjustment | (269 | ) | ||
Aggregate purchase price | $ | 199,933 | ||
(1) | As a part of the acquisition, we accelerated vesting of certain DVS stock options and shares of restricted stock, and incurred a $6.7 million expense, based upon the per share consideration paid to holders of shares of DVS common stock as of February 13, 2014. This expense is accounted for as a separate transaction and reflected in the acquisition-related expenses line of the consolidated statements of operations. |
(2) | In conjunction with the acquisition, we assumed all outstanding DVS stock options and unvested shares of restricted stock and converted, as of the Acquisition Date, the unvested stock options outstanding under the DVS stock option plan into unvested stock options to purchase approximately 143,000 shares of Fluidigm common stock and the unvested DVS restricted stock into approximately 186,000 shares of restricted Fluidigm common stock, retaining the original vesting schedules. These restricted shares have been included in the "Issuance of common stock upon purchase of DVS" line item in the Consolidated Statement of Stockholders' Equity. The fair value of all converted share-based awards was $14.6 million, of which $4.0 million was attributed to the pre-combination service period and was included in the calculation of the purchase price. The remaining fair value will be recognized over the awards’ remaining vesting periods subsequent to the acquisition. The fair value of the Fluidigm equivalent share-based awards as of the Acquisition Date was estimated using the Black-Scholes valuation model. |
Approximately 885,000 shares of Fluidigm common stock, with a fair value of $38.6 million, representing 50.3030% of the shares otherwise payable to the former stockholders of DVS, were deposited into escrow (Escrowed Shares). These Escrowed Shares comprised a portion of the merger consideration and were held in escrow to secure indemnification obligations under the merger agreement. Under the terms of the merger agreement, fifty percent (50.0%) of the aggregate shares subject to the indemnification escrow were eligible for release on March 13, 2015 (Initial Release Date), and the balance of the shares were subject to release on August 13, 2015, provided that in each case shares would have continued to be held in escrow in amounts that we reasonably determined in good faith to be necessary to satisfy any claims for which we had delivered a notice of claim which had not been fully resolved between us and the representative of the former stockholders of DVS (Stockholder Representative). Prior to the Initial Release Date, we submitted escrow claim notices under the terms of the merger agreement. On April 9, 2015, the Stockholder Representative provided notices objecting to our claims. In July 2015, we entered into a settlement agreement with the Stockholder Representative regarding the claims (Settlement Agreement). Pursuant to the terms of the Settlement Agreement, the parties agreed to release approximately 80% of the Escrowed Shares to the former stockholders of DVS, and the remaining approximately 20% of the Escrowed Shares, or 170,107 shares, to us, which were canceled and returned to the status of authorized and unissued shares. Additionally, the parties agreed to, among other things, release various claims and waive certain rights with respect to the merger agreement. On the settlement date, the 170,107 shares had a value of approximately $4.0 million, which was recorded as gain on escrow settlement during the quarter ended September 30, 2015.
74
The results of DVS's operations have been included in the consolidated financial statements for the period from February 13, 2014 to December 31, 2014, including $20.7 million in revenue for the year ended December 31, 2014.
Net Assets Acquired
The transaction has been accounted for using the acquisition method of accounting which requires that assets acquired and liabilities assumed be recognized at their fair values as of the Acquisition Date. The following table summarizes the assets acquired and liabilities assumed as of the Acquisition Date (in thousands):
Allocation of purchase price | ||||
Cash and cash equivalents | $ | 8,405 | ||
Accounts receivable, net | 7,698 | |||
Inventories | 3,489 | |||
Prepaid expenses and other current assets | 1,482 | |||
Property and equipment, net | 1,202 | |||
Developed technology | 112,000 | |||
Goodwill | 104,108 | |||
Other non-current assets | 88 | |||
Total assets acquired | 238,472 | |||
Accounts payable | (1,114 | ) | ||
Accrued compensation and related benefits | (761 | ) | ||
Other accrued liabilities | (1,204 | ) | ||
Deferred revenue, current portion | (1,844 | ) | ||
Tax payable | (45 | ) | ||
Deferred tax liability | (31,942 | ) | ||
Deferred revenue, net of current portion | (1,629 | ) | ||
Net assets acquired | $ | 199,933 | ||
The following table provides details of intangible assets acquired in connection with the DVS acquisition as of December 31, 2015 (in thousands, except years):
Gross fair value | Accumulated Amortization | Net | Useful life in years | ||||||||||||
Developed technology | $ | 112,000 | $ | (21,000 | ) | $ | 91,000 | 10 | |||||||
We recognized $11.2 million and $9.8 million in intangible asset amortization expense during the years ended December 31, 2015 and 2014, respectively. Intangible asset amortization expense is recorded in cost of product revenue.
The $104.2 million of goodwill recognized as part of the transaction is attributable primarily to expected synergies and other benefits from the acquisition, including expansion of our addressable market from the single-cell genomics market to the larger single-cell biology market and the ability to leverage our larger global commercial sales organization and infrastructure to expand awareness of DVS's products and technology. Goodwill is not deductible for income tax purposes. The only change to goodwill between the Acquisition Date and December 31, 2014 was an adjustment of $0.1 million to the deferred taxes liability resulting from the final tax analysis during the measurement period.
Acquisition Costs
Acquisition-related expenses were $10.7 million in 2014 and primarily included accelerated vesting of certain DVS restricted stock and options, and consulting, legal, and investment banking fees. These costs are included within the acquisition-related expenses line of the consolidated statements of operations. No such costs were incurred in 2015.
75
Unaudited Pro Forma Results
The unaudited financial information in the table below summarizes our results of operations combined with DVS's as though the companies were combined as of the beginning of each of the years presented. The unaudited pro forma information does not necessarily reflect the actual results of operations had the acquisition been consummated at the beginning of the fiscal reporting periods indicated nor is it indicative of future operating results.
(in thousands) | Year Ended December 31, | |||||||
2014 | 2013 | |||||||
Pro forma total revenue | $ | 120,245 | $ | 98,459 | ||||
Pro forma net loss | $ | (55,249 | ) | $ | (37,906 | ) | ||
The unaudited pro forma financial information for the year ended December 31, 2014 includes adjustments related to stock-based compensation, amortization of developed technology, interest expense, and deferred tax liability of $1.4 million, $1.4 million, $1.0 million, and $371,000, respectively, and includes non-recurring adjustments representing the total acquisition-related expenses discussed above. The unaudited pro forma financial information for the year ended December 31, 2013 includes adjustments related to stock-based compensation, amortization of developed technology, interest expense, and deferred tax liability of $9.2 million, $11.2 million, $5.8 million, and $3.0 million, respectively.
5. Fair Value of Financial Instruments
The following table sets forth our financial instruments that were measured at fair value by level within the fair value hierarchy (in thousands):
December 31, 2015 | December 31, 2014 | |||||||||||||||||||||||||||||||
Level I | Level II | Level III | Total | Level I | Level II | Level III | Total | |||||||||||||||||||||||||
Assets | ||||||||||||||||||||||||||||||||
Money market funds (See Note 6) | $ | 11,228 | $ | — | $ | — | $ | 11,228 | $ | 10,220 | $ | — | $ | — | $ | 10,220 | ||||||||||||||||
U.S. government and agency securities | $ | — | $ | 72,348 | $ | — | $ | 72,348 | — | 109,087 | — | 109,087 | ||||||||||||||||||||
Total assets measured at fair value | $ | 11,228 | $ | 72,348 | $ | — | $ | 83,576 | $ | 10,220 | $ | 109,087 | $ | — | $ | 119,307 | ||||||||||||||||
As of December 31, 2015, the amortized cost basis, aggregate fair value, and gross unrealized gains and losses of our investments were as follows (in thousands):
Amortized Cost | Gross Unrealized Gains | Gross Unrealized Losses | Estimated Fair Value | |||||||||||||
U.S. government and agency securities | $ | 72,420 | $ | — | $ | (72 | ) | $ | 72,348 | |||||||
As of December 31, 2014, the amortized cost basis, aggregate fair value, and gross unrealized gains and losses of our investments were as follows (in thousands):
Amortized Cost | Gross Unrealized Gains | Gross Unrealized Losses | Estimated Fair Value | |||||||||||||
U.S. government and agency securities | $ | 109,136 | $ | 3 | $ | (52 | ) | $ | 109,087 | |||||||
The contractual maturity periods of $65.9 million of our investments are within one year from December 31, 2015. The contractual maturity periods of our remaining securities are less than eighteen months from December 31, 2015.
76
There were no transfers between Level 1 and Level 2 measurements during the year ended December 31, 2015, and there were no changes in the valuation techniques used.
Based on an evaluation of securities that were in a loss position, we did not recognize any other-than-temporary impairment charges for the years ended December 31, 2015, 2014, and 2013. None of the investments have been in a continuous loss position for more than 12 months. Our conclusion that these losses are not “other-than-temporary” is based on the high credit quality of the securities, their short remaining maturity periods, and our intent and ability to hold such securities until the date of recovery of their respective market values or maturity.
The estimated fair value of the 2.75% Convertible Senior Notes Due 2034, (Notes), is based on a market approach. The estimated fair value was approximately $118.8 million (par value $201.3 million) as of December 31, 2015 and represents a Level II valuation. When determining the estimated fair value of our long-term debt, we used a commonly accepted valuation methodology and market-based risk measurements that are indirectly observable, such as credit risk.
6. Balance Sheet Data
Cash and Cash Equivalents
The following are summaries of cash and cash equivalents (in thousands):
Amortized Cost and Estimated Fair Value | |||
As of December 31, 2015: | |||
Cash | $ | 17,889 | |
Money market funds | 11,228 | ||
$ | 29,117 | ||
As of December 31, 2014: | |||
Cash | $ | 23,493 | |
Money market funds | 10,220 | ||
$ | 33,713 | ||
77
Inventories
Inventories consist of the following (in thousands) as of:
December 31, 2015 | December 31, 2014 | |||||||
Raw materials | $ | 6,829 | $ | 4,670 | ||||
Work-in-process | 2,442 | 3,524 | ||||||
Finished goods | 8,653 | 7,797 | ||||||
Total inventories, net | $ | 17,924 | $ | 15,991 | ||||
Property and Equipment
Property and equipment consists of the following (in thousands) as of:
December 31, 2015 | December 31, 2014 | |||||||
Computer equipment and software | $ | 5,048 | $ | 3,905 | ||||
Laboratory and manufacturing equipment | 21,783 | 17,592 | ||||||
Leasehold improvements | 5,875 | 4,988 | ||||||
Office furniture and fixtures | 1,584 | 1,804 | ||||||
Property and equipment, gross | 34,290 | 28,289 | ||||||
Less accumulated depreciation and amortization | (19,618 | ) | (16,360 | ) | ||||
Construction-in-progress | 586 | 1,960 | ||||||
Property and equipment, net | $ | 15,258 | $ | 13,889 | ||||
Intangible Assets
The total intangible assets, which include developed technology, net as a result of the DVS acquisition and other intangible assets included in Other non-current assets, was $98.8 million, net of amortization as of December 31, 2015.
The estimated future amortization expense of these intangible assets as of December 31, 2015 is as follows (in thousands):
Amount | ||||
2016 | $ | 12,392 | ||
2017 | 12,376 | |||
2018 | 12,311 | |||
2019 | 12,220 | |||
2020 | 12,220 | |||
Thereafter | 37,259 | |||
$ | 98,778 | |||
78
Product Warranties
Activity for our warranty accrual for the years ended December 31, 2015 and 2014, which are included in other accrued liabilities, is summarized below (in thousands):
Year Ended December 31, | ||||||||
2015 | 2014 | |||||||
Beginning balance | $ | 1,178 | $ | 344 | ||||
Acquired warranty obligation from DVS | — | 791 | ||||||
Accrual for current period warranties | 672 | 1,298 | ||||||
Warranty costs incurred | (774 | ) | (1,255 | ) | ||||
Ending balance | $ | 1,076 | $ | 1,178 | ||||
7. Convertible Notes
On February 4, 2014, we closed an underwritten public offering of $201.3 million aggregate principal amount of our 2.75% Senior Convertible Notes due 2034 (Notes) pursuant to an underwriting agreement, dated January 29, 2014. The Notes accrue interest at a rate of 2.75% per year, payable semi-annually in arrears on February 1 and August 1 of each year, commencing August 1, 2014. The Notes will mature on February 1, 2034, unless earlier converted, redeemed, or repurchased in accordance with the terms of the Notes. The initial conversion rate of the Notes is 17.8750 shares of our common stock, par value $0.001 per share, per $1,000 principal amount of Notes (which is equivalent to an initial conversion price of approximately $55.94 per share). The conversion rate will be subject to adjustment upon the occurrence of certain specified events. Holders may surrender their Notes for conversion at any time prior to the stated maturity date. On or after February 6, 2018 and prior to February 6, 2021, we may redeem any or all of the Notes in cash if the closing price of our common stock exceeds 130% of the conversion price for a specified number of days, and on or after February 6, 2021, we may redeem any or all of the Notes in cash without any such condition. The redemption price of the Notes will equal 100% of the principal amount of the Notes plus accrued and unpaid interest. Holders may require us to repurchase all or a portion of their Notes on each of February 6, 2021, February 6, 2024, and February 6, 2029 at a repurchase price in cash equal to 100% of the principal amount of the Notes plus accrued and unpaid interest. If we undergo a fundamental change, as defined in the terms of the Notes, holders may require us to repurchase the Notes in whole or in part for cash at a repurchase price equal to 100% of the principal amount of the Notes plus accrued and unpaid interest.
In February 2014, we received $195.2 million, net of underwriting discounts, from the issuance of the Notes and incurred approximately $1.1 million in offering-related expenses. The underwriting discount of $6.0 million was recorded as an offset to the proceeds. Debt issuance costs of $1.1 million are included in “Other assets” on the Consolidated Balance Sheets as of the issuance date.
In February 2014, we used $113.2 million of the net proceeds to fund the cash portion of the consideration payable by us in connection with our acquisition of DVS (now Fluidigm Sciences Inc.) (See Note 4). Interest expense related to the Notes was approximately $5.8 million and $5.3 million during 2015 and 2014, respectively. Approximately $5.5M and $2.7 million of interest under the Notes was paid during 2015 and 2014, respectively.
The balance of unamortized debt discount and debt issuance costs was $6.6 million of which $5.6 million is included in "Convertible Notes" and $1.0 million is included within “Other non-current assets” as of December 31, 2015 on the accompanying Consolidated Balance Sheets.
8. Line of Credit
In December 2012, we entered into a two-year line of credit agreement (as amended, the Line of Credit) that provided us with the ability to borrow up to $10.0 million, of which $6.0 million was available on a non-formula basis, subject to certain covenants and other restrictions. The balance of $4.0 million was available based on eligible receivables. The line of credit was collateralized by our assets, excluding our intellectual property, and bore interest at a rate equal to the greater of (i) 3.75% or (ii) the prime rate plus 0.50% per year. On May 9, 2014, we entered into a modification agreement with the lender to amend and waive certain financial covenants under the financing agreement, effective as of March 31, 2014. On July 31, 2014, we entered into a modification agreement with the lender to amend and waive the financial covenant under the financing agreement
79
regarding our effective tangible net worth amount, which could not at any time exceed a deficit of more than $100.0 million, effective as of June 30, 2014. There were no amounts outstanding on the line of credit during 2015, 2014, or 2013. The line of credit expired in December 2014 and the lien on the collateral was released in January 2015.
9. Commitments and Contingencies
Operating Leases
We have entered into various long-term non-cancelable operating leases for equipment and facilities.
On April 9, 2013, we entered into an amendment (the 2013 Amendment) to the lease agreement dated September 4, 2010 (as amended, the Lease) relating to the lease of office and laboratory space at our headquarters located in South San Francisco, California. The 2013 Amendment provided for an expansion of the premises covered under the Lease, effective April 2014; an extension of the term of the Lease to April 30, 2020 with an option to renew for an additional five years; payment of base rent with rent escalation; and payment of certain operating expenses during the term of the Lease. The 2013 Amendment also provided for an allowance of approximately $0.7 million for tenant improvements, of which we used $0.5 million and the remaining $0.2 million was used to offset base rent obligations in the quarter ended September 30, 2015, and an additional allowance of approximately $0.5 million for tenant improvements, which, if used, will be repaid in equal monthly payments with interest at a rate of 9% per annum over the remaining term of the Lease. The total future minimum lease payments for the additional space, which will be paid through April 2020, are approximately $6.7 million as of December 31, 2015.
On June 4, 2014, we entered into an additional amendment to the Lease (the June 2014 Amendment), which provided for an expansion of the premises covered under the Lease by approximately 13,000 square feet, effective October 1, 2014; payment of base rent with rent escalation; and payment of certain operating expenses during the term of the Lease. The June 2014 Amendment also provided for an allowance of approximately $0.2 million for tenant improvements, which, was fully utilized by March 31, 2015, and an additional allowance of approximately $0.1 million for tenant improvements, which, if used, will be repaid in equal monthly payments with interest at a rate of 9% per annum over the remaining term of the Lease. The total future minimum lease payments for the additional space, which will be paid through April 2020, are approximately $2.0 million as of December 31, 2015.
On September 15, 2014, we entered into an additional amendment to the Lease (the September 2014 Amendment), which provided for an expansion of the premises covered under the Lease by approximately 9,000 square feet, effective October 1, 2014; payment of base rent with rent escalation; and payment of certain operating expenses during the term of the Lease. The September 2014 Amendment also provided for an allowance of approximately $0.2 million for tenant improvements which was not used as of December 31, 2015. The total future minimum lease payments for the additional space, which will be paid through April 2020, are approximately $1.3 million as of December 31, 2015.
On December 8, 2015, we entered into an additional amendment to the Lease (the December 2015 Amendment),which provides for an expansion of the premises covered under the Lease by approximately 24,039 square feet, with a targeted commencement date of April 1, 2016, payment of base rent with rent escalation and an increase in our share of certain operating expenses during the term of the Lease. The December 2015 Amendment also provided for an allowance of up to approximately $0.4 million for tenant improvements. The total future minimum lease payments for additional space, which will be paid through April 2020, are approximately $3.8 million as of December 31, 2015.
On October 14, 2013, Fluidigm Singapore Pte. Ltd., our wholly-owned subsidiary (Fluidigm Singapore), accepted an offer of tenancy (Lease) from HSBC Institutional Trust Services (Singapore) Limited, as trustee of Ascendas Real Estate Investment Trust (Landlord), relating to the lease of a new facility located in Singapore. Pursuant to the terms of the Lease, Fluidigm Singapore took possession of the facility commencing on March 3, 2014 for a term of 99 months, and the Lease and rental obligations thereunder commenced on June 3, 2014. The Lease also provides Fluidigm Singapore with an option to renew the Lease for an additional 60 months at the then prevailing market rent, and on similar terms as the existing Lease (the June 2015 Lease). In June 2014, Fluidigm Singapore leased additional space of approximately 2,400 square feet in the same building as the new facility on the same terms as the Lease. We completed the consolidation of our Singapore manufacturing operations in the new space in July 2014 and the site qualification was completed in August 2014. The leases relating to our prior manufacturing facility in Singapore terminated in August 2014. In April 2015, Fluidigm Singapore leased additional space of approximately 10,000 square feet in the same building on the same terms as the Singapore Lease (the April 2015 Singapore Lease). In connection with the April 2015 Singapore Lease, Fluidigm Singapore terminated the June 2014 Singapore Lease as of June 30, 2015. The total future minimum lease payments for the facility, which will be paid through June 2022, are approximately $4.0 million as of December 31, 2015.
80
In connection with our acquisition of DVS (See Note 4), we acquired the operating leases for facilities in Sunnyvale, California and Markham, Ontario, Canada, which expire in July 2016 and January 2016, respectively. The Canada lease includes an option to renew the lease for an additional five years at the then prevailing market rent, and on similar terms as the existing lease. We extended the Canada lease through April 2016. The total future minimum lease payments for the operating leases in Sunnyvale, California and Markham, Ontario, Canada are approximately $154,000 as of December 31, 2015.
On August 18, 2015, we, Fluidigm Canada Inc., our wholly-owned subsidiary (Fluidigm Canada), and Rodick Equities, Inc. (Landlord) entered into a lease dated as of August 17, 2015 (the New Canada Lease), relating to the lease of approximately 41,145 square feet of office, laboratory, and warehouse space at a facility in Markham, Ontario, Canada. Pursuant to the terms of the New Canada Lease, Fluidigm Canada was in possession of the new space commencing on or about August 27, 2015, and rental obligations thereunder will commence on April 1, 2016 for a term of ten years. The New Canada Lease provides for an allowance for tenant improvements, an option to renew the Lease for an additional five years, and a right of first offer on certain additional space in the Building.
As of December 31, 2015, we also leased office space under non-cancelable leases in Japan, China, France and United Kingdom, with various expiration dates through April 2018. Certain facility leases also contain rent escalation clauses. Future minimum lease payments under non-cancelable operating leases as of December 31, 2015 are as follows (in thousands):
Years ending December 31: | |||
2016 | $ | 4,084 | |
2017 | 4,405 | ||
2018 | 4,360 | ||
2019 | 4,416 | ||
2020 | 2,191 | ||
Thereafter | 3,538 | ||
$ | 22,994 | ||
Our lease payments are expensed on a straight-line basis over the life of the leases. Rental expense under operating leases, net of amortization of lease incentive, totaled $5.2 million, $4.0 million, and $2.7 million for 2015, 2014, and 2013, respectively.
Other Commitments
In the normal course of business, we enter into various contractual and legally binding purchase commitments. As of December 31, 2015, these commitments for the next two years were approximately $8.5 million.
Indemnifications
From time to time, we have entered into indemnification provisions under certain of our agreements in the ordinary course of business, typically with business partners, customers, and suppliers. Pursuant to these agreements, we may indemnify, hold harmless, and agree to reimburse the indemnified parties on a case-by-case basis for losses suffered or incurred by the indemnified parties in connection with any patent or other intellectual property infringement claim by any third party with respect to our products. The term of these indemnification provisions is generally perpetual from the time of the execution of the agreement. The maximum potential amount of future payments we could be required to make under these indemnification provisions is typically not limited to a specific amount. In addition, we have entered into indemnification agreements with our officers, directors, and certain other employees. With certain exceptions, these agreements provide for indemnification for related expenses including, among others, attorneys' fees, judgments, fines and settlement amounts incurred by any of these individuals in any action or proceeding. We have not incurred material costs to defend lawsuits or settle claims related to these indemnification provisions. As of December 31, 2015, we had no accrued liabilities for these indemnification provisions.
Contingencies
From time to time, we may be subject to various legal proceedings and claims arising in the ordinary course of business. We assess contingencies to determine the degree of probability and range of possible loss for potential accrual in our financial statements. An estimated loss contingency is accrued in the financial statements if it is probable that a liability has been incurred and the amount of the loss can be reasonably estimated.
81
On November 6, 2012, we filed a complaint against NanoString Technologies, Inc., or NanoString, in the United States District Court in the Northern District of California (Civil Action No. 12-5712), alleging claims of false advertising, unfair competition, and unlawful trade practice in violation of the Lanham Act and corresponding sections of the California Business & Professions Code. Our complaint sought to enjoin NanoString from continuing to make or disseminate any of the false and misleading claims, misrepresenting and/or exaggerating the performance of its product in comparison with our Biomark system, to require NanoString to retract, remove, or correct the false and misleading advertising claims, and to recover damages and other relief for harm caused to us by NanoString. We also filed a lawsuit against NanoString in the High Court of the Republic of Singapore (Case No. S 282/2013) on April 5, 2013 alleging malicious falsehood in advertising and trademark infringement and sought relief similar to the relief sought in our complaint filed in the United States. On September 30, 2013, we and NanoString agreed to settle the lawsuits. The terms of the settlement required NanoString to, among other things, pay us $0.6 million, remove all references - from its marketing materials, website, and promotional activities - to a single-cell comparison study comparing Fluidigm and NanoString single-cell products, as well as recall and destroy all materials related to and/or based on the study. The case brought in the United States District Court in the Northern District of California was dismissed on October 22, 2013, and the case brought in Singapore was discontinued on October 29, 2013.
Pursuant to the terms of a patent cross license agreement with Applied Biosystems, LLC (a subsidiary of Life Technologies Corporation, or Life, and now part of Thermo Fisher Scientific), we were obligated to make a $1.0 million payment to Life upon satisfaction of certain conditions. We do not believe that the conditions triggering the payment obligation have been met; however, on October 16, 2013, Life provided notice that the $1.0 million payment was due and payable under the license agreement. We accrued a loss contingency of $1.0 million on September 30, 2013 and on January 30, 2014, we paid Life the amount due while reserving our rights with respect to such matter. Among other reasons, we made the payment to avoid what would have been, in our view, an improper termination of our license to certain Life patent filings under the agreement, which could have subjected our relevant product lines to risks associated with patent infringement litigation.
10. Stock-Based Compensation
2011 Equity Incentive Plan
On January 28, 2011, our board of directors adopted the 2011 Equity Incentive Plan (the 2011 Plan) under which incentive stock options, nonstatutory stock options, restricted stock units (RSUs), stock appreciation rights, performance units, and performance shares may be granted to our employees, directors, and consultants.
Incentive stock options and nonstatutory stock options granted under the 2011 Plan have a term of no more than ten years from the date of grant and an exercise price of at least 100% of the fair market value of the underlying common stock on the date of grant. If a participant owns stock representing more than 10% of the voting power of all classes of our stock on the grant date, an incentive stock option awarded to the participant will have a term of no more than five years from the date of grant and an exercise price of at least 110% of the fair market value of the underlying common stock on the date of grant. Generally, outstanding options vest at a rate of either 25% on the first anniversary of the option grant date and ratably each month over the remaining period of 36 months, or ratably each month over 48 months. We may grant options with different vesting terms from time to time.
Our board of directors sets the terms, conditions, and restrictions related to the grant of restricted stock units, including the number of restricted stock units to grant. Our board of directors also sets vesting criteria and, depending on the extent to which the criteria are met, our board of directors will determine the number of restricted stock units to be paid out. In general, RSUs vest on a quarterly basis over a period of four years from the date of grant, provided that no shares will vest during the first year of employment, at the end of which the shares that would have vested during the year will vest and the remaining shares will vest over the remaining 12 quarters, subject to the employees' continued employment.
The exercise price of any stock appreciation right shall be determined by our board of directors but will be no less than 100% of the fair market value of the underlying common stock on the date of grant. The stock appreciation rights expire upon the date determined by our board of directors but no later than ten years from the date of grant.
Our board of directors sets the performance objectives and other vesting provisions in determining the number of shares or value of performance units and performance shares that will be paid out. Such payout will be a function of the extent to which performance objectives or other vesting provisions have been achieved.
As of December 31, 2015, the 2011 Plan had a total of 5,431,215 awards authorized for issuance.
82
2009 Equity Incentive Plan and 1999 Stock Option Plan
Our 2009 Equity Incentive Plan (the 2009 Plan) terminated on the date the 2011 Plan was adopted and the 1999 Stock Option Plan (the 1999 Plan) expired in 2009. Options granted or shares issued under the 2009 Plan and the 1999 Plan that were outstanding on the date the 2011 Plan became effective remained subject to the terms of their respective plans.
Activity under the 2011 Plan, the 2009 Plan, and the 1999 Plan is as follows (in thousands, except per share amounts):
Stock options:
Outstanding Options | ||||||||||
Shares Available for Grant | Number of Shares | Weighted-Average Exercise Price per Share | ||||||||
Balance as of December 31, 2014 | 889 | 3,407 | $ | 17.98 | ||||||
Additional shares authorized | 1,000 | — | ||||||||
Options granted | (514 | ) | 514 | $ | 29.60 | |||||
Options exercised | — | (519 | ) | $ | 10.41 | |||||
Options canceled | 160 | (160 | ) | $ | 29.96 | |||||
Balance as of December 31, 2015 | 1,535 | 3,242 | $ | 20.45 | ||||||
Restricted Stock units:
Number Nonvested and Outstanding | Weighted-Average Grant date fair value per Share | ||||||
Balance as of December 31, 2014 | 329 | $ | 41.60 | ||||
RSUs granted | 590 | $ | 30.26 | ||||
RSUs vested | (164 | ) | $ | 40.12 | |||
RSUs canceled | (92 | ) | $ | 37.21 | |||
Balance as of December 31, 2015 | 663 | $ | 32.48 | ||||
83
We determine stock-based compensation expense using the Black-Scholes option-pricing model and the following weighted-average assumptions:
Year Ended December 31, | ||||||||||||
2015 | 2014 | 2013 | ||||||||||
Expected volatility | 46.3 | % | 57.5 | % | 57.1 | % | ||||||
Expected life | 5.9 years | 5.9 years | 5.9 years | |||||||||
Risk-free interest rate | 1.8 | % | 1.5 | % | 1.2 | % | ||||||
Dividend yield | 0 | % | 0 | % | 0 | % | ||||||
Weighted-average fair value of options granted | $ | 13.89 | $ | 9.80 | $ | 9.62 | ||||||
Expected volatility is derived from the historical volatilities of several unrelated public companies within the life sciences industry. Each company’s historical volatility is weighted and combined to produce the single volatility factor used by us. The risk-free interest rate is based on the U.S. Treasury yield curve in effect at the time of grant for zero coupon U.S. Treasury notes with maturities approximately equal to the option’s expected life. Given our limited history as a public company, we used the “simplified” method to estimate expected lives of options granted to the various employee groups. The “simplified” method calculates the expected life of an option as the average of the time-to-vesting and the contractual life of the options. Forfeitures were estimated based on an analysis of actual forfeitures. We periodically evaluate the adequacy of our forfeiture rate based on actual forfeiture experience, analysis of employee turnover, and other factors. Each of these inputs is subjective and generally requires significant judgment by us. Also required to compute the fair value calculation of options is the fair value of the underlying common stock.
We grant stock options at exercise prices not less than the fair value of our common stock at the date of grant. Prior to our IPO, our board of directors obtained contemporaneous valuations from an unrelated third-party valuation firm to determine the estimated fair value of common stock based on an analysis of relevant metrics. There is inherent uncertainty in these estimates and if we or the valuation firm had made different assumptions, the amount of our stock-based compensation expense, net loss, and net loss per share amounts could have been significantly different. Following the completion of our IPO in February 2011, the fair value of options granted is based on the closing price of our common stock on the date of grant as quoted on the NASDAQ Global Select Market.
The fair value of RSUs granted to employees was estimated on the date of grant by multiplying the number of shares granted by the fair market value of our common stock on the grant date.
Additional information regarding our stock options outstanding and exercisable as of December 31, 2015 is summarized in the following table:
Options Outstanding | ||||||||
Exercise Price Per Share | Number of Shares | Weighted-Average Remaining Contractual Life | Options Exercisable | |||||
(In Thousands) | (In Years) | (In Thousands) | ||||||
$0.64 - $4.45 | 205 | 4.3 | 200 | |||||
$8.36 - $8.37 | 247 | 7.6 | 114 | |||||
$13.01 - $14.90 | 682 | 5.5 | 666 | |||||
$15.04 - $19.32 | 1,319 | 6.8 | 1,021 | |||||
$20.46 - $21.94 | 112 | 9.3 | 26 | |||||
$27.00 - $29.87 | 70 | 8.3 | 59 | |||||
$30.58 - $33.73 | 25 | 8.0 | 13 | |||||
$37.56 - $38.28 | 21 | 8.2 | 9 | |||||
$43.66 - $44.07 | 247 | 9.1 | 59 | |||||
$46.85 - $47.55 | 314 | 8.0 | 148 | |||||
3,242 | 6.9 | 2,315 | ||||||
Options exercisable as of December 31, 2015 had a weighted-average remaining contractual life of 6.3 years, a weighted-average exercise price per share of $17.57, and an aggregate intrinsic value of $1.7 million.
84
Options outstanding that have vested as of December 31, 2015 or are expected to vest in the future are summarized as follows:
Number of shares | Weighted-Average Exercise Price per Share | Weighted- Average Remaining Contractual Life | Aggregate Intrinsic Value (1) | ||||||||||
(In Thousands) | (In Years) | (In Thousands) | |||||||||||
Vested | 2,315 | $ | 17.57 | 6.3 | $ | 1,729 | |||||||
Expected to vest, net of estimated forfeitures | 853 | $ | 27.84 | 8.4 | 70 | ||||||||
Total vested and expected to vest, net of forfeitures | 3,168 | $ | 20.34 | 6.8 | $ | 1,799 | |||||||
(1) | Aggregate intrinsic value was calculated as the difference between the closing stock price on the last trading day of 2015, which was $10.81, and the exercise price of the options, multiplied by the number of in-the-money options. |
The total intrinsic value of options exercised during 2015, 2014, and 2013 was $13.7 million, $12.8 million, and $20.8 million, respectively. The total intrinsic value of RSUs vested and released during the year ended December 31, 2015 was approximately $1.8 million. The intrinsic value of vested and released RSUs is calculated by multiplying the fair market value of our common stock on the vesting date by the number of shares vested. As of December 31, 2015, the number of RSUs outstanding and expected to vest was 596,562, with a total intrinsic value of $6.4 million. The intrinsic value of the outstanding and expected to vest RSUs is calculated based on the market value of the Company's closing stock price of $10.81 as of December 31, 2015, the last market trading day of 2015.
There were no stock-based compensation tax benefits recognized during 2015, 2014, or 2013. Capitalized stock-based compensation costs were insignificant at December 31, 2015, 2014, and 2013.
As of December 31, 2015, there was $29.8 million of total unrecognized compensation cost related to stock-based compensation arrangements that is expected to be recognized over an average period of 2.6 years.
In January 2011, we granted 94,972 performance-based options (the 2010 performance awards) to certain executives. These awards vest over a period of approximately four years based on continuing service and were subject to accelerated vesting if specified corporate and departmental performance goals were met for the fiscal year ended December 31, 2010. Based on achievement of 2010 departmental and corporate goals, vesting for 66,480 options was accelerated in March 2011. We recognized nil for each year during 2015 and 2014 and $8,000 of stock-based compensation expense related to the 2010 performance awards during 2013, respectively.
11. Income Taxes
Our loss before income taxes consists of the following (in thousands):
Year Ended December 31, | ||||||||||||
2015 | 2014 | 2013 | ||||||||||
Domestic | $ | (46,757 | ) | $ | (41,559 | ) | $ | (16,205 | ) | |||
International | (8,033 | ) | (16,146 | ) | (184 | ) | ||||||
Loss before income taxes | $ | (54,790 | ) | $ | (57,705 | ) | $ | (16,389 | ) | |||
Significant components of our benefit (provision) for income taxes are as follows (in thousands):
Year Ended December 31, | ||||||||||||
2015 | 2014 | 2013 | ||||||||||
Current: | ||||||||||||
Federal | $ | (30 | ) | $ | — | $ | — | |||||
State | $ | (14 | ) | $ | (20 | ) | $ | (24 | ) | |||
Foreign | (1,319 | ) | (254 | ) | (113 | ) | ||||||
Total current provision | (1,363 | ) | (274 | ) | (137 | ) | ||||||
Deferred: | ||||||||||||
State | — | 2,042 | — | |||||||||
Foreign | 2,838 | 3,107 | — | |||||||||
Total deferred benefit | 2,838 | 5,149 | — | |||||||||
Total benefit (provision) for income taxes | $ | 1,475 | $ | 4,875 | $ | (137 | ) | |||||
Reconciliation of income taxes at the statutory rate to the benefit from (provision for) income taxes recorded in the statements of operations is as follows:
Year Ended December 31, | |||||||||
2015 | 2014 | 2013 | |||||||
Tax benefit at federal statutory rate | 34.0 | % | 34.0 | % | 34.0 | % | |||
State tax credit (expense), net of federal benefit | 1.4 | (1.5 | ) | 5.6 | |||||
Foreign tax expense | (1.9 | ) | (3.7 | ) | (3.3 | ) | |||
Change in valuation allowance | (28.6 | ) | (21.1 | ) | (34.6 | ) | |||
Federal R&D Credit | 2.6 | 2.7 | 6.9 | ||||||
Unrecognized tax benefit | (1.8 | ) | (0.7 | ) | (4.5 | ) | |||
Return to provision reconciliation | (1.2 | ) | — | (2.8 | ) | ||||
Other, net | (1.9 | ) | (1.2 | ) | (2.1 | ) | |||
Effective tax rate | 2.6 | % | 8.5 | % | (0.8 | )% | |||
85
Significant components of our deferred tax assets and liabilities are as follows (in thousands):
December 31, 2015 | December 31, 2014 | |||||||
Deferred tax assets: | ||||||||
Net operating loss carryforwards | $ | 104,291 | $ | 90,250 | ||||
Reserves and accruals | 2,922 | 4,132 | ||||||
Depreciation and amortization | 548 | 231 | ||||||
Tax credit carryforwards | 11,098 | 10,181 | ||||||
Stock-based compensation | 7,185 | 7,866 | ||||||
Total gross deferred tax assets | 126,044 | 112,660 | ||||||
Valuation allowance on deferred tax assets | (124,137 | ) | (110,167 | ) | ||||
Total deferred tax assets | 1,907 | 2,493 | ||||||
Deferred tax liabilities: | ||||||||
Fixed asset and intangibles | (25,565 | ) | (28,612 | ) | ||||
Total deferred tax liabilities | (25,565 | ) | (28,612 | ) | ||||
Net deferred tax liability | $ | (23,658 | ) | $ | (26,119 | ) | ||
We evaluate a number of factors to determine the realizability of our deferred tax assets. Recognition of deferred tax assets is appropriate when realization of these assets is more likely than not. Assessing the realizability of deferred tax assets is dependent upon several factors including historical financial results. The net deferred tax assets have been partially offset by a valuation allowance because we have incurred losses since our inception. The valuation allowance increased by $14.0 million and $13.9 million during 2015 and 2014, respectively. The change in valuation allowance is mainly due to an increase in the current year taxable loss and an increase in research development credits, partially offset by a decrease in temporary differences.
A reconciliation of the beginning and ending amount of the valuation allowance for the year ended December 31, 2015 is as follows (in thousands):
December 31, 2014 | $ | 110,167 | |
Charges to earnings | 13,970 | ||
Charges to other accounts | — | ||
December 31, 2015 | $ | 124,137 | |
As of December 31, 2015, we had net operating loss carryforwards for U.S. federal income tax purposes of $316.6 million, which expire in the years 2020 through 2036, and U.S. federal research and development tax credits of $7.4 million, which expire in the years 2020 through 2036. As of December 31, 2015, we had net operating loss carryforwards for state income tax purposes of $191.4 million, which expire in the years 2015 through 2036, and California research and development tax credits of $8.5 million, which do not expire. As of December 31, 2015, we had foreign net operating loss carryforwards of $2.8 million, which expire in the years 2017 through 2021.
On December 18, 2015, the Protecting Americans from Tax Hikes Act of 2015 was signed into law. This law establishes the permanency of U.S. research and development credits. We recorded approximately $0.7 million which was fully offset by a valuation allowance in the current year.
Utilization of the net operating loss carryforwards and credits may be subject to a substantial annual limitation due to the ownership change limitations provided by Section 382 of the Internal Revenue Code of 1986, as amended, and similar state provisions. The annual limitation may result in the expiration of net operating losses and credits before utilization. We have completed a Section 382 analysis for the period from our inception in May 1999 through December 31, 2015, which excluded the net operating loss carryforwards for DVS prior to the acquisition, and determined that an ownership change as defined under Section 382 occurred in November 2001, which resulted in a reduction to our U.S. federal and California net operating losses by $1.2 million and $0.7 million, respectively. Net operating losses that were subject to Section 382 limitation for California purposes expired as of December 31, 2014.
86
We have not provided for U.S. federal and state income taxes on any of our non-U.S. subsidiaries’ undistributed earnings as of December 31, 2015, because such earnings are intended to be indefinitely reinvested. If we were to distribute such earnings of $0.9 million in the form of dividends, we may be subject to withholding taxes of approximately $27,000 . However, since such subsidiaries’ earnings are permanently reinvested, no deferred tax liabilities were accrued for that amount as of December 31, 2015.
Effective January 1, 2010, we obtained approval for Pioneer Tax Status in Singapore. The Pioneer Tax Status allowed a full exemption from Singapore corporate tax related to contract manufacturing activities through the effective period subject to the achievement of certain milestones. Effective January 1, 2015, our Pioneer Tax Status was replaced by a Development and Expansion Incentive, which provides a reduced tax rate for qualifying income in Singapore through 2019, if certain milestones are met. Due to available capital allowances, we have not benefited from the tax exemption or from the reduced tax rate through December 31, 2015, and may not benefit from the incentive if we do not achieve the required milestones in future years.
Uncertain Tax Positions
The aggregate changes in the balance of our gross unrecognized tax benefits during 2015, 2014, and 2013 were as follows (in thousands):
December 31, 2012 | $ | 6,351 | |
Increases in balances related to tax positions taken during current period | 1,044 | ||
Decreases in balances related to tax position taken during prior period | (547 | ) | |
December 31, 2013 | 6,848 | ||
Increases in balances related to tax positions taken during current period | 832 | ||
Decreases in balances related to tax positions taken during prior period | (8 | ) | |
December 31, 2014 | 7,672 | ||
Increases in balances related to tax positions taken during current period | 1,049 | ||
Decreases in balances related to tax positions taken during prior period | (59 | ) | |
December 31, 2015 | $ | 8,662 | |
Accrued interest and penalties related to unrecognized tax benefits were included in the income tax provision and are immaterial as of December 31, 2015 and 2014.
As of December 31, 2015, the total amount of unrecognized tax benefits that, if recognized, would affect our effective tax rate is $0.6 million. We do not anticipate that our existing unrecognized tax benefits will significantly increase or decrease within the next 12 months.
We file income tax returns in the United States, various states, and certain foreign jurisdictions. As a result of net operating loss carryforwards, all of our tax years are open to federal and state examination in the United States. Tax years from 2009 are open to examination in various foreign countries.
12. Employee Benefit Plans
We sponsor a 401(k) savings plan for our employees in the United States that stipulates that eligible employees may elect to contribute to the plan, subject to certain limitations, up to the lesser of 90% of eligible compensation or the maximum amount allowed by the U.S. Internal Revenue Service. We have not made contributions to this plan since its inception.
13. Information About Geographic Areas
We operate in one reporting segment, which is the development, manufacturing, and commercialization of life science tools for the life science and Ag-Bio industries. Our chief executive officer manages our operations and evaluates our financial performance on a consolidated basis. For purposes of allocating resources and evaluating regional financial performance, our chief executive officer reviews separate sales information for the different regions of the world. Our general and administrative expenses and our research and development expenses are not allocated to any specific region. Most of our principal operations, other than manufacturing, and our decision-making functions are located at our corporate headquarters in the United States.
87
The following table represents our product and service revenue of total product and service revenue by geography of our customers for each year presented (in thousands):
Year Ended December 31, | ||||||||||||
2015 | 2014 | 2013 | ||||||||||
United States | $ | 55,147 | $ | 59,133 | $ | 36,308 | ||||||
Europe | 36,772 | 33,045 | 18,472 | |||||||||
Asia-Pacific | 10,925 | 12,878 | 6,564 | |||||||||
Japan | 6,042 | 6,932 | 6,639 | |||||||||
Other | 5,569 | 3,927 | 2,215 | |||||||||
Total | $ | 114,455 | $ | 115,915 | $ | 70,198 | ||||||
Our license and grant revenue is primarily generated in the United States.
We had long-lived assets consisting of property and equipment, net of accumulated depreciation, in the following geographic areas (in thousands) as of:
December 31, 2015 | December 31, 2014 | December 31, 2013 | ||||||||||
United States | $ | 6,123 | $ | 5,317 | $ | 2,967 | ||||||
Singapore | 8,014 | 7,624 | 3,741 | |||||||||
Canada | 1,065 | 837 | — | |||||||||
Europe | 47 | 75 | 64 | |||||||||
Japan | 2 | 22 | 32 | |||||||||
Asia-Pacific | 7 | 14 | 14 | |||||||||
Total | $ | 15,258 | $ | 13,889 | $ | 6,818 | ||||||
14. Purchase of Patents from PerkinElmer Health Sciences, Inc.
Some of the intellectual property rights covering our mass cytometry products were subject to a license agreement (the Original License Agreement) between Fluidigm Canada Inc. (Fluidigm Canada) and PerkinElmer Health Sciences, Inc. (PerkinElmer). Under the Original License Agreement, Fluidigm Canada received an exclusive, royalty bearing, worldwide license to certain patents owned by PerkinElmer in the field of ICP-based mass cytometry, including the analysis of elemental tagged materials in connection therewith (the Patents), and a non-exclusive license for reagents outside the field of ICP-based mass cytometry. On November 4, 2015, we entered into a patent purchase agreement with PerkinElmer pursuant to which we purchased the Patents for a purchase price of $6.5 million and a patent assignment agreement pursuant to which PerkinElmer transferred and assigned to us all rights, title, privileges, and interest in and to the Patents and the Original License Agreement. Accordingly, we have no further financial obligations to PerkinElmer under the Original License Agreement. Contemporaneously with the purchase of the Patents, we entered into a license agreement with PerkinElmer pursuant to which we granted PerkinElmer a worldwide, non-exclusive, fully paid-up license to the Patents in fields other than (i) ICP-based mass analysis of atomic elements associated with a biological material, including any elements that are unnaturally bound, directly or indirectly, to such biological material (Mass Analysis) and (ii) the development, design, manufacture, and use of equipment or associated reagents for such Mass Analysis. The license will terminate on the last expiration date of the Patents, currently expected to be in December 2025, unless earlier terminated pursuant to the terms of the license agreement.
88
15. Quarterly Results of Operations (Unaudited)
Selected quarterly results of operations for the years ended December 31, 2015 and 2014 are as follows (in thousands, except for per share amounts):
2015 | First Quarter | Second Quarter | Third Quarter | Fourth Quarter | ||||||||||||
Total revenue | $ | 26,729 | $ | 28,618 | $ | 28,643 | $ | 30,722 | ||||||||
Net loss | $ | (15,931 | ) | $ | (15,236 | ) | $ | (9,269 | ) | $ | (12,879 | ) | ||||
Net loss per share, basic and diluted | $ | (0.56 | ) | $ | (0.53 | ) | $ | (0.32 | ) | $ | (0.45 | ) | ||||
2014 | First Quarter | Second Quarter | Third Quarter | Fourth Quarter | ||||||||||||
Total revenue | $ | 25,724 | $ | 27,607 | $ | 29,635 | $ | 33,490 | ||||||||
Net loss | $ | (15,414 | ) | $ | (12,682 | ) | $ | (13,790 | ) | $ | (10,944 | ) | ||||
Net loss per share, basic and diluted | $ | (0.57 | ) | $ | (0.45 | ) | $ | (0.49 | ) | $ | (0.39 | ) | ||||
89
ITEM 9. CHANGES IN AND DISAGREEMENTS WITH ACCOUNTANTS ON ACCOUNTING AND FINANCIAL DISCLOSURE
None.
ITEM 9A. CONTROLS AND PROCEDURES
Evaluation of Disclosure Controls and Procedures
Our management, with the participation of our Chief Executive Officer and our Chief Financial Officer, evaluated the effectiveness of our disclosure controls and procedures as of December 31, 2015. The term “disclosure controls and procedures,” as defined in Rules 13a-15(e) and 15d-15(e) under the Exchange Act, means controls and other procedures of a company that are designed to ensure that information required to be disclosed by a company in the reports that it files or submits under the Exchange Act is recorded, processed, summarized and reported, within the time periods specified in the SEC’s rules and forms. Disclosure controls and procedures include, without limitation, controls and procedures designed to ensure that information required to be disclosed by a company in the reports that it files or submits under the Exchange Act is accumulated and communicated to the company’s management, including its principal executive and principal financial officers, as appropriate to allow timely decisions regarding required disclosure. Management recognizes that any controls and procedures, no matter how well designed and operated, can provide only reasonable assurance of achieving their objectives and management necessarily applies its judgment in evaluating the cost-benefit relationship of possible controls and procedures. Based on the evaluation of our disclosure controls and procedures as of December 31, 2015, our Chief Executive Officer and Chief Financial Officer concluded that, as of such date, our disclosure controls and procedures were effective at the reasonable assurance level.
Management’s Report on Internal Control Over Financial Reporting
Our management is responsible for establishing and maintaining adequate internal control over financial reporting (as such term is defined in Exchange Act Rule 13a-15f) to provide reasonable assurance regarding the reliability of our financial reporting and the preparation of financial statements for external purposes in accordance with generally accepted accounting principles. Management assessed our internal control over financial reporting as of December 31, 2015. Management based its assessment on criteria established in Internal Control—Integrated Framework issued by the Committee of Sponsoring Organizations of the Treadway Commission (2013 Framework). Based on that evaluation, our management concluded that our internal control over financial reporting was effective as of December 31, 2015.
The effectiveness of our internal control over financial reporting as of December 31, 2015 has been audited by PricewaterhouseCoopers, LLP, an independent registered public accounting firm, as stated in their report included in this Annual Report on Form 10-K.
Changes in Internal Control Over Financial Reporting
There were no changes in our internal control over financial reporting that occurred during the three months ended December 31, 2015 that have materially affected, or are reasonably likely to materially affect, our internal control over financial reporting.
Inherent Limitations on the Effectiveness of Controls
Control systems, no matter how well conceived and operated, are designed to provide a reasonable, but not an absolute, level of assurance that the objectives of the control system are met. Further, the design of a control system must reflect the fact that there are resource constraints, and the benefits of controls must be considered relative to their costs. Because of the inherent limitations in all control systems, no evaluation of controls can provide absolute assurance that all control issues and instances of fraud, if any, have been detected. Because of the inherent limitations in any control system, misstatements due to error or fraud may occur and not be detected.
ITEM 9B. OTHER INFORMATION
Not applicable.
90
PART III
ITEM 10. DIRECTORS, EXECUTIVE OFFICERS AND CORPORATE GOVERNANCE
Pursuant to General Instruction G(3) of Form 10-K, the information required by this Item 10 relating to our executive officers is included under the caption “Executive Officers” in Part I of this Form 10-K.
The other information required by this Item 10 will be included either (i) in an amendment to this Annual Report on Form 10-K or (ii) incorporated by reference to our Proxy Statement for the 2016 Annual Meeting of Stockholders under the headings “Corporate Governance and Board of Directors,” “Election of Class II Directors,” “Executive Officers,” and “Related Person Transactions and Section 16(a) Beneficial Ownership Reporting Compliance.” Such amendment to our Form 10-K or Proxy Statement for our 2016 Annual Meeting of Stockholders will be filed with the Securities and Exchange Commission within 120 days of our December 31, 2015 fiscal year end.
ITEM 11. EXECUTIVE COMPENSATION
The information required by this Item 11 will be included either (i) in an amendment to this Annual Report on Form 10-K or (ii) incorporated by reference to our Proxy Statement for the 2016 Annual Meeting of Stockholders under the headings “Corporate Governance and Board of Directors” and “Executive Compensation.” Such amendment to our Form 10-K or Proxy Statement for our 2016 Annual Meeting of Stockholders will be filed with the Securities and Exchange Commission within 120 days of our December 31, 2015 fiscal year end.
ITEM 12. SECURITY OWNERSHIP OF CERTAIN BENEFICIAL OWNERS AND MANAGEMENT AND RELATED STOCKHOLDER MATTERS
The information required by this Item 12 will be included either (i) in an amendment to this Annual Report on Form 10-K or (ii) incorporated by reference to our Proxy Statement for the 2016 Annual Meeting of Stockholders under the headings “Executive Compensation” and “Security Ownership.” Such amendment to our Form 10-K or Proxy Statement for our 2016 Annual Meeting of Stockholders will be filed with the Securities and Exchange Commission within 120 days of our December 31, 2015 fiscal year end.
ITEM 13. CERTAIN RELATIONSHIPS AND RELATED TRANSACTIONS, AND DIRECTOR INDEPENDENCE
The information required by this Item 13 will be included either (i) in an amendment to this Annual Report on Form 10-K or (ii) incorporated by reference to our Proxy Statement for the 2016 Annual Meeting of Stockholders under the headings “Corporate Governance and Board of Directors” and “Related Person Transactions and Section 16(a) Beneficial Ownership Reporting Compliance.” Such amendment to our Form 10-K or Proxy Statement for our 2016 Annual Meeting of Stockholders will be filed with the Securities and Exchange Commission within 120 days of our December 31, 2015 fiscal year end.
ITEM 14. PRINCIPAL ACCOUNTING FEES AND SERVICES
The information required by this Item 14 will be included either (i) in an amendment to this Annual Report on Form 10-K or (ii) incorporated by reference to our Proxy Statement for the 2016 Annual Meeting of Stockholders under the heading “Ratification of Appointment of Independent Registered Public Accounting Firm.” Such amendment to our Form 10-K or Proxy Statement for our 2016 Annual Meeting of Stockholders will be filed with the Securities and Exchange Commission within 120 days of our December 31, 2015 fiscal year end.
91
PART IV
ITEM 15. EXHIBITS, FINANCIAL STATEMENT SCHEDULES
1. Financial Statements. See “Index to Consolidated Financial Statements” in Part II, Item 8 of this Form 10-K.
2. Financial Statement schedule. See “Schedule II—Valuation and Qualifying Account and Reserve” in this section of this Form 10-K.
3. Exhibits. The exhibits listed in the accompanying Index to Exhibits are filed herewith or are incorporated by reference to exhibits previously filed with the U.S. Securities and Exchange Commission.
92
SCHEDULE II—VALUATION AND QUALIFYING ACCOUNT AND RESERVE
In thousands | ||||||||||||||||
Balance at Beginning of Period | Additions/ Charged to Expense | Deductions | Balance at End of Period | |||||||||||||
Year ended December 31, 2015 | ||||||||||||||||
Accounts receivable allowance | $ | 120 | $ | 23 | $ | (40 | ) | $ | 103 | |||||||
Year ended December 31, 2014 | ||||||||||||||||
Accounts receivable allowance | $ | 36 | $ | 103 | $ | (19 | ) | $ | 120 | |||||||
Year ended December 31, 2013 | ||||||||||||||||
Accounts receivable allowance | $ | 448 | $ | 4 | $ | (416 | ) | $ | 36 | |||||||
93
SIGNATURES
Pursuant to the requirements of Section 13 or 15(d) of the Securities Exchange Act of 1934, the registrant has duly caused this report to be signed on its behalf by the undersigned, thereunto duly authorized.
FLUIDIGM CORPORATION | |||||
Dated: February 29, 2016 | By: | /s/ Gajus V. Worthington | |||
Gajus V. Worthington | |||||
President and Chief Executive Officer | |||||
POWER OF ATTORNEY
KNOW ALL PERSONS BY THESE PRESENTS, that each person whose signature appears below constitutes and appoints Gajus V. Worthington and Vikram Jog, jointly and severally, as his or her true and lawful attorneys-in-fact and agents, with full power of substitution and resubstitution, for him or her and in his or her name, place and stead, in any and all capacities, to sign this Form 10-K, and to file the same, with all exhibits thereto, and other documents in connection therewith, with the Securities and Exchange Commission, granting unto said attorneys-in-fact and agents full power and authority to do and perform each and every act and thing requisite or necessary to be done in and about the premises hereby ratifying and confirming all that said attorneys-in-fact and agents, or his or their substitute or substitutes, may lawfully do or cause to be done by virtue hereof.
Pursuant to the requirements of the Securities Exchange Act of 1934, this report has been signed below by the following persons on behalf of the registrant and in the capacities and on the dates indicated.
Signature | Title | Date | ||
/s/ Gajus V. Worthington | President and Chief Executive Officer (Principal Executive Officer); Director | February 29, 2016 | ||
Gajus V. Worthington | ||||
/s/ Vikram Jog | Chief Financial Officer (Principal Financial and Accounting Officer) | February 29, 2016 | ||
Vikram Jog | ||||
/s/ Samuel D. Colella | Chairman of the Board of Directors | February 29, 2016 | ||
Samuel D. Colella | ||||
/s/ Gerhard F. Burbach | Director | February 29, 2016 | ||
Gerhard F. Burbach | ||||
/s/ Evan Jones | Director | February 29, 2016 | ||
Evan Jones | ||||
/s/ Patrick S. Jones | Director | February 29, 2016 | ||
Patrick S. Jones | ||||
/s/ John A. Young | Director | February 29, 2016 | ||
John A. Young | ||||
94
INDEX TO EXHIBITS
Exhibit Number | Description | Incorporated by Reference From Form | Incorporated by Reference From Exhibit Number | Date Filed | ||||
2.1 | Agreement and Plan of Merger dated January 28, 2014 by and among Fluidigm Corporation, DVS Sciences, Inc., Dawid Merger Sub, Inc. and Shareholder Representative Services LLC. | 8-K | 2.1 | 1/29/2014 | ||||
3.1 | Eighth Amended and Restated Certificate of Incorporation of Fluidigm Corporation filed on February 15, 2011. | 10-K | 3.1 | 3/28/2011 | ||||
3.2 | Amended and Restated Bylaws of Fluidigm Corporation effective as of February 9, 2011. | 10-K | 3.2 | 3/28/2011 | ||||
4.1 | Specimen Common Stock Certificate of Fluidigm Corporation. | S-1/A | 4.1 | 2/7/2011 | ||||
4.2 | Indenture, dated February 4, 2014, by and between Fluidigm Corporation and U.S. Bank National Association. | 8-K | 4.1 | 2/4/2014 | ||||
4.3 | First Supplemental Indenture, dated February 4, 2014, by and between Fluidigm Corporation and U.S. Bank National Association. | 8-K | 4.2 | 2/4/2014 | ||||
4.4 | Form of Global Note (included in Exhibit 4.3). | 8-K | 4.3 | 2/4/2014 | ||||
4.5 | Ninth Amended and Restated Investor Rights Agreement between Fluidigm Corporation and certain holders of Fluidigm Corporation's capital stock named therein, including amendments No. 1, No. 2 and No. 3. | S-1 | 4.5 | 12/3/2010 | ||||
4.6 | Reserved. | |||||||
4.7 | Reserved. | |||||||
4.8 | Business Financing Agreement by and between Bridge Bank, National Association and Fluidigm Corporation, dated December 16, 2010. | S-1/A | 4.8 | 1/28/2011 | ||||
4.8A | Business Financing Modification Agreement dated March 31, 2011, by and between Bridge Bank, National Association and Fluidigm Corporation. | 8-K | 4.8A | 4/4/2011 | ||||
4.8B | Business Financing Modification Agreement dated December 21, 2012, by and between Bridge Bank, National Association and Fluidigm Corporation. | 8-K | 4.8B | 12/27/2012 | ||||
4.8C | Business Financing Modification Agreement dated January 29, 2014, by and between Bridge Bank, National Association and Fluidigm Corporation. | 8-K | 10.1 | 1/29/2014 | ||||
4.8D | Business Financing Modification Agreement dated May 9, 2014, by and between Bridge Bank, National Association and Fluidigm Corporation. | 10-Q | 10.5 | 5/12/2014 | ||||
4.8E | Business Financing Modification Agreement dated July 31, 2014, by and between Bridge Bank, National Association and Fluidigm Corporation. | 10-Q | 10.2 | 8/4/2014 | ||||
10.1 | Form of Indemnification Agreement between Fluidigm Corporation and its directors and officers. | S-1/A | 10.1 | 1/28/2011 | ||||
10.2# | 1999 Stock Option Plan of Fluidigm Corporation, as amended. | S-1 | 10.2 | 12/3/2010 | ||||
10.2A# | Forms of agreements under the 1999 Stock Option Plan. | S-1 | 10.2A | 12/3/2010 | ||||
10.3# | 2009 Equity Incentive Plan of Fluidigm Corporation, as amended. | S-1 | 10.3 | 12/3/2010 | ||||
10.3A# | Forms of agreements under the 2009 Equity Incentive Plan. | S-1 | 10.3A | 12/3/2010 | ||||
10.4# | 2011 Equity Incentive Plan of Fluidigm Corporation. | S-1/A | 10.4 | 1/28/2011 | ||||
95
Exhibit Number | Description | Incorporated by Reference From Form | Incorporated by Reference From Exhibit Number | Date Filed | ||||
10.4A# | Forms of agreements under the 2011 Equity Incentive Plan. | S-1/A | 10.4A | 1/28/2011 | ||||
10.5† | Second Amended and Restated License Agreement by and between California Institute of Technology and Fluidigm Corporation, effective as of May 1, 2004. | S-1 | 10.5 | 12/3/2010 | ||||
10.5A† | First Addendum, effective as of March 29, 2007, to Second Amended and Restated License Agreement by and between California Institute of Technology and Fluidigm Corporation effective as of May 1, 2004. | S-1 | 10.5A | 12/3/2010 | ||||
10.6† | Co-Exclusive License Agreement between President and Fellows of Harvard College and Fluidigm Corporation effective as of October 15, 2000. | S-1 | 10.6 | 12/3/2010 | ||||
10.6A† | First Amendment to Co-Exclusive License Agreement between President and Fellows of Harvard College and Fluidigm Corporation effective as of October 15, 2000. | S-1 | 10.6A | 12/3/2010 | ||||
10.7† | Co-Exclusive License Agreement between President and Fellows of Harvard College and Fluidigm Corporation effective as of October 15, 2000. | S-1 | 10.7 | 12/3/2010 | ||||
10.8† | Co-Exclusive License Agreement between President and Fellows of Harvard College and Fluidigm Corporation effective as of October 15, 2000. | S-1 | 10.8 | 12/3/2010 | ||||
10.9† | Letter Agreement between President and Fellows of Harvard College and Fluidigm Corporation dated December 22, 2004. | S-1 | 10.9 | 12/3/2010 | ||||
10.10 | Reserved. | |||||||
10.11 | Reserved. | |||||||
10.12 | Reserved. | |||||||
10.13 | Reserved. | |||||||
10.14# | Form of Amended and Restated Employment and Severance Agreement between Fluidigm Corporation and each of its executive officers. | 8-K | 10.14 | 12/11/2012 | ||||
10.15 | Reserved. | |||||||
10.16 | Reserved. | |||||||
10.17# | Offer Letter to Vikram Jog dated January 29, 2008. | S-1 | 10.17 | 12/3/2010 | ||||
10.18# | Offer Letter dated May 3, 2010 to Fredric Walder and Addendum thereto dated November 8, 2010. | 8-K | 10.18 | 4/4/2011 | ||||
10.19 | Lease Agreement between ARE - San Francisco No. 17 LLC and Fluidigm Corporation, dated September 14, 2010, as amended September 22, 2010. | S-1/A | 10.19 | 1/7/2011 | ||||
10.19A | Second Amendment to Lease Agreement between ARE-San Francisco No. 17, LLC and Fluidigm Corporation, dated April 9, 2013. | 10-Q | 10.19A | 5/9/2013 | ||||
10.19B | Fourth Amendment to Lease Agreement between ARE-San Francisco No. 17, LLC and Fluidigm Corporation, dated June 4, 2014. | 10-Q | 10.3 | 8/4/2014 | ||||
10.19C | Fifth Amendment to Lease Agreement between ARE-San Francisco No. 17, LLC and Fluidigm Corporation, dated September 15, 2014. | 10-Q | 10.2 | 11/6/2014 | ||||
10.19D | Sixth Amendment to Lease Agreement between ARE-San Francisco No. 17, LLC and Fluidigm Corporation, dated December 8, 2015. | 8-K | 10.1 | 12/14/2015 | ||||
96
Exhibit Number | Description | Incorporated by Reference From Form | Incorporated by Reference From Exhibit Number | Date Filed | ||||
10.20 | Tenancy for Flatted Factory Space in Singapore between JTC Corporation and Fluidigm Corporation dated July 27, 2005, as amended August 12, 2008 and May 31, 2010. | S-1 | 10.20 | 12/3/2010 | ||||
10.21 | Offer of Tenancy for Facility Lease between Fluidigm Singapore Pte. Ltd. and SBC Institutional Trust Services (Singapore) Limited, as trustee of Ascendas Real Estate Investment Trust dated October 14, 2013. | 10-K | 10.21 | 3/12/2014 | ||||
10.22 | Offer of Tenancy for Lease of Additional Space at Singapore Facility between Fluidigm Singapore Pte. Ltd. and HSBC Institutional Trust Services (Singapore) Limited, as trustee of Ascendas Real Estate Investment Trust, dated April 2, 2015. | 10-Q | 10.1 | 8/10/2015 | ||||
10.23† | Office Lease by and among Rodick Equities Inc., Fluidigm Canada Inc., and Fluidigm Corporation, dated August 17, 2015. | 10-Q | 10.1 | 11/9/2015 | ||||
10.24 | Reserved. | |||||||
10.25# | Executive Bonus Plan. | 10-K | 10.25 | 3/28/2011 | ||||
10.26# | Letter Agreement between Fluidigm Corporation and William M. Smith, Fluidigm Corporation's Executive Vice President of Legal Affairs and General Counsel, dated March 4, 2014. | 10-Q | 10.2 | 5/12/2014 | ||||
10.27† | License Agreement between MDS Analytical Technologies, a business unit of MDS INC., and DVS Sciences Inc., dated July 17, 2008. | 10-Q/A | 10.3 | 9/15/2014 | ||||
10.28† | Sublicense Agreement between DVS Sciences Inc. and Fluidigm Corporation, dated January 28, 2014. | 10-Q/A | 10.4 | 9/15/2014 | ||||
12.1 | Computation of ratio of earnings to combined fixed charges and preference dividends. | Filed herewith | ||||||
21.1 | Subsidiaries of Fluidigm Corporation. | 10-K | 21.1 | 2/26/2015 | ||||
23.1 | Consent of PricewaterhouseCoopers LLP, Independent Registered Public Accounting Firm. | Filed herewith | ||||||
23.2 | Consent of Ernst & Young LLP, Independent Registered Public Accounting Firm. | Filed herewith | ||||||
24.1 | Power of Attorney (contained in the signature page to this Form 10-K). | Filed herewith | ||||||
31.1 | Certification Pursuant to 18 U.S.C. Section 1350, as Adopted Pursuant to Section 302 of the Sarbanes-Oxley Act of 2002 of Chief Executive Officer. | Filed herewith | ||||||
31.2 | Certification Pursuant to 18 U.S.C. Section 1350, as Adopted Pursuant to Section 302 of the Sarbanes-Oxley Act of 2002 of Chief Financial Officer. | Filed herewith | ||||||
32.1~ | Certification Pursuant to 18 U.S.C. Section 1350, as Adopted Pursuant to Section 906 of the Sarbanes-Oxley Act of 2002 of Chief Executive Officer. | Filed herewith | ||||||
32.2~ | Certification Pursuant to 18 U.S.C. Section 1350, as Adopted Pursuant to Section 906 of the Sarbanes-Oxley Act of 2002 of Chief Executive Officer. | Filed herewith | ||||||
101.INS | XBRL Instance Document | Filed herewith | ||||||
101.SCH | XBRL Taxonomy Extension Schema Document | Filed herewith | ||||||
101.CAL | XBRL Taxonomy Extension Calculation Linkbase Document | Filed herewith | ||||||
97
Exhibit Number | Description | Incorporated by Reference From Form | Incorporated by Reference From Exhibit Number | Date Filed | ||||
101.DEF | XBRL Taxonomy Extension Definition Linkbase Document | Filed herewith | ||||||
101.LAB | XBRL Taxonomy Extension Label Document | Filed herewith | ||||||
101.PRE | XBRL Taxonomy Extension Presentation Document | Filed herewith | ||||||
# Management contracts or compensation plans or arrangements in which directors or executive officers are eligible to participate.
† Portions of the exhibit have been omitted pursuant to an order granted by the Securities and Exchange Commission for confidential treatment.
~ In accordance with Item 601(b)(32)(ii) of Regulation S-K and SEC Release No. 33-8238 and 34-47986, Final Rule: Management’s Reports on Internal Control Over Financial Reporting and Certification of Disclosure in Exchange Act Periodic Reports, the certifications furnished in Exhibits 32.1 and 32.2 hereto are deemed to accompany this Form 10-K and will not be deemed “filed” for purposes of Section 18 of the Exchange Act. Such certifications will not be deemed to be incorporated by reference into any filings under the Securities Act or the Exchange Act, except to the extent that Fluidigm Corporation specifically incorporates it by reference.
98