Attached files
| file | filename |
|---|---|
| EX-32 - EX-32 - TOOTSIE ROLL INDUSTRIES INC | tr-20151231xex32.htm |
| EX-31.1 - EX-31.1 - TOOTSIE ROLL INDUSTRIES INC | tr-20151231ex311bca900.htm |
| EX-31.2 - EX-31.2 - TOOTSIE ROLL INDUSTRIES INC | tr-20151231ex312afc23f.htm |
| EX-21 - EX-21 - TOOTSIE ROLL INDUSTRIES INC | tr-20151231ex21f2584e2.htm |
| EX-10.12 - EX-10.12 - TOOTSIE ROLL INDUSTRIES INC | tr-20151231ex10125024e.htm |
| EX-10.13 - EX-10.13 - TOOTSIE ROLL INDUSTRIES INC | tr-20151231ex10139a01a.htm |
UNITED STATES
SECURITIES AND EXCHANGE COMMISSION
Washington, D.C. 20549
FORM 10-K
(Mark One)
☒ANNUAL REPORT PURSUANT TO SECTION 13 OR 15(d) OF THE SECURITIES EXCHANGE ACT OF 1934
For the fiscal year ended December 31, 2015
OR
☐TRANSITION REPORT PURSUANT TO SECTION 13 OR 15(d) OF THE SECURITIES EXCHANGE ACT OF 1934
For the transition period from to
Commission file number 1-1361
TOOTSIE ROLL INDUSTRIES, INC.
(Exact name of Registrant as specified in its charter)
|
Virginia |
|
22-1318955 |
|
(State or other jurisdiction of |
|
(IRS Employer Identification No.) |
|
incorporation or organization) |
|
|
7401 South Cicero Avenue, Chicago, Illinois 60629
(Address of principal executive offices) (Zip Code)
Registrant’s Telephone Number: (773) 838-3400
Securities registered pursuant to Section 12(b) of the Act:
|
Title of each class |
|
Name of each exchange |
|
Common Stock — Par Value $.69-4/9 Per Share |
|
New York Stock Exchange |
Securities registered pursuant to Section 12(g) of the Act:
Class B Common Stock — Par Value $.69-4/9 Per Share
Indicate by check mark if the registrant is a well-known seasoned issuer, as defined in Rule 405 of the Securities Act. Yes ☒ No ☐
Indicate by check mark if the registrant is not required to file reports pursuant to Section 13 or Section 15(d) of the Act. Yes ☐ No ☒
Indicate by check mark whether the registrant: (1) has filed all reports required to be filed by Section 13 or 15(d) of the Securities Exchange Act of 1934 during the preceding 12 months (or for such shorter period that the registrant was required to file such reports), and (2) has been subject to such filing requirements for the past 90 days. Yes ☒ No ☐
Indicate by check mark whether the registrant has submitted electronically and posted on its corporate Web site, if any, every Interactive Data File required to be submitted and posted pursuant to Rule 405 of Regulation S-T (§ 232.405 of this chapter) during the preceding 12 months (or for such shorter period that the registrant was required to submit and post such files). Yes ☒ No ☐
Indicate by check mark if disclosure of delinquent filers pursuant to Item 405 of Regulation S-K is not contained herein, and will not be contained, to the best of registrant’s knowledge, in definitive proxy or information statements incorporated by reference in Part III of this Form 10-K or any amendment to this Form 10-K. ☐
Indicate by check mark whether the registrant is a large accelerated filer, an accelerated filer or a non-accelerated filer. See definition of “large accelerated filer,” “accelerated filer and “smaller reporting company” in Rule 12b-2 of the Exchange Act.
|
Large Accelerated Filer ☒ |
|
Accelerated Filer ☐ |
|
|
|
|
|
Non-accelerated Filer ☐ |
|
Smaller Reporting Company ☐ |
Indicate by check mark whether the registrant is a shell company (as defined in Rule 12b-2 of the Exchange Act). Yes ☐ No ☒
As of February 15, 2016, there were outstanding 37,168,856 shares of Common Stock par value $.69-4/9 per share, and 23,541,710 shares of Class B Common Stock par value $.69-4/9 per share.
As of June 30, 2015, the aggregate market value of the Common Stock (based upon the closing price of the stock on the New York Stock Exchange on such date) held by non-affiliates was approximately $580,496,000. Class B Common Stock is not traded on any exchange, is restricted as to transfer or other disposition, but is convertible into Common Stock on a share-for-share basis. Upon such conversion, the resulting shares of Common Stock are freely transferable and publicly traded. Assuming all 23,541,710 shares of outstanding Class B Common Stock were converted into Common Stock, the aggregate market value of Common Stock held by non-affiliates on June 30, 2015 (based upon the closing price of the stock on the New York Stock Exchange on such date) would have been approximately $712,808,000. Determination of stock ownership by non-affiliates was made solely for the purpose of this requirement, and the Registrant is not bound by these determinations for any other purpose.
DOCUMENTS INCORPORATED BY REFERENCE
Portions of the Company’s Definitive Proxy Statement for the Company’s Annual Meeting of Shareholders (the “2016 Proxy Statement”) scheduled to be held on May 2, 2016 are incorporated by reference in Part III of this report.
2
Forward-Looking Information
From time to time, in the Company’s statements and written reports, including this report, the Company discusses its expectations regarding future performance by making certain “forward-looking statements” within the meaning of the Private Securities Litigation Reform Act of 1995. Forward-looking statements can be identified by the use of words such as “anticipated,” “believe,” “expect,” “intend,” “estimate,” “project,” and other words of similar meaning in connection with a discussion of future operating or financial performance and are subject to certain factors, risks, trends and uncertainties that could cause actual results and achievements to differ materially from those expressed in the forward-looking statements. These forward-looking statements are based on currently available competitive, financial and economic data and management’s views and assumptions regarding future events. Such forward-looking statements are inherently uncertain, and actual results may differ materially from those expressed or implied herein. Consequently, the Company wishes to caution readers not to place undue reliance on any forward-looking statements. Factors, among others, which could cause the Company’s future results to differ materially from the forward-looking statements, expectations and assumptions expressed or implied herein include general factors, such as economic conditions, political developments, currency exchange rates, interest and inflation rates, accounting standards, taxes, and laws and regulations affecting the Company in markets where it competes and those factors described in Item 1A “Risk Factors” and elsewhere in this Form 10-K and in other Company filings with the Securities and Exchange Commission.
PART I
Tootsie Roll Industries, Inc. and its consolidated subsidiaries (the “Company”) have been engaged in the manufacture and sale of confectionery products for over 100 years. This is the only industry segment in which the Company operates and is its only line of business. The majority of the Company’s products are sold under the registered trademarks TOOTSIE ROLL, TOOTSIE POPS, CHILD’S PLAY, CARAMEL APPLE POPS, CHARMS, BLOW-POP, CHARMS MINI POPS, CELLA’S, DOTS, JUNIOR MINTS, CHARLESTON CHEW, SUGAR DADDY, SUGAR BABIES, ANDES, FLUFFY STUFF, DUBBLE BUBBLE, RAZZLES, CRY BABY, NIK-L-NIP, and TUTSI POP (Mexico).
The Company’s products are marketed in a variety of packages designed to be suitable for display and sale in different types of retail outlets. They are sold through approximately 30 candy and grocery brokers and by the Company itself to approximately 4,000 customers throughout the United States. These customers include wholesale distributors of candy and groceries, supermarkets, variety stores, dollar stores, chain grocers, drug chains, discount chains, cooperative grocery associations, mass merchandisers, warehouse and membership club stores, vending machine operators, the U.S. military and fund-raising charitable organizations.
The Company’s principal markets are in the United States, Canada and Mexico. The majority of production from the Company’s Canadian plants is sold in the United States. The majority of production from the Company’s Mexican plant is sold in Mexico.
The domestic confectionery business is highly competitive. The Company competes primarily with other manufacturers of confectionery products sold to the above mentioned customers. Although accurate statistics are not available, the Company believes it is among the ten largest domestic manufacturers in this field. In the markets in which the Company competes, the main forms of competition comprise brand recognition, as well as competition for retail shelf space and a fair price for the Company’s products at various retail price points.
The Company did not have a material backlog of firm orders at the end of the calendar years 2015 or 2014.
Although the Company experienced moderating costs for some ingredients in 2015 compared to 2014, unit costs for certain ingredients and packaging materials were higher in 2015 compared to 2014, and the Company expects higher ingredient costs in 2016. The Company has made progress toward restoring margins to their historical levels before the increases in commodity and other input costs in past years.
3
The Company has historically hedged certain of its future sugar, corn syrup and soybean oil needs with derivatives at such times that it believes that the forward markets are favorable. The Company’s decision to hedge its major ingredient requirements is dependent on the Company’s evaluation of forward commodity markets and comparison to vendor quotations, if available, and/or historical costs. The Company has historically hedged these major commodities and ingredients with derivatives, primarily commodity futures and option contracts, before the commencement of the next calendar year to better ascertain the need for product pricing changes or product weight decline (indirect price change) adjustments to its product sales portfolio and better manage ingredient costs. The Company will generally purchase forward derivative contracts (i.e., “long” position) in selected future months that correspond to the Company’s estimated procurement and usage needs of the respective commodity in the respective forward periods.
From time to time, the Company also changes the size of certain of its products, which are usually sold at standard prices, in response to significant changes in ingredient and other input costs.
The Company does not hold any material patents, licenses, franchises or concessions. The Company’s major trademarks are registered in the United States and in many other countries. Continued trademark protection is of material importance to the Company’s business as a whole.
Although the Company does research and develops new products and product line extensions for existing brands, it also improves the quality of existing products, improves and modernizes production processes, and develops and implements new technologies to enhance the quality and reduce the costs of products. The Company does not expend material amounts of money on research or development activities.
The manufacture and sale of consumer food products is highly regulated. In the United States, the Company’s activities are subject to regulation by various government agencies, including the Food and Drug Administration, the Department of Agriculture, the Federal Trade Commission, the Department of Commerce and the Environmental Protection Agency, as well as various state and local agencies. Similar agencies also regulate the businesses outside of the United States. The Company maintains quality assurance and other programs to insure that all products the Company manufactures and distributes are safe and of high quality and comply with all applicable laws and regulations.
The Company’s compliance with federal, state and local regulations which have been enacted or adopted regulating the discharge of materials into the environment, or otherwise relating to the protection of the environment, has not had a material effect on the capital expenditures, earnings or competitive position of the Company nor does the Company anticipate any such material effects from presently enacted or adopted regulations.
The Company employs approximately 2,000 persons.
The Company has found that its sales normally maintain a consistent level throughout the year except for a substantial increase in the third quarter which reflects pre-Halloween and back-to-school sales. In anticipation of this high sales period, the Company generally begins building inventories in the second quarter of each year. The Company historically offers extended credit terms for sales made under seasonal sales programs, including Halloween. Each year, after accounts receivables related to third quarter sales have been collected, the Company invests such funds in various marketable securities.
Sales revenues from Wal-Mart Stores, Inc. aggregated approximately 23.7%, 23.7%, and 23.8% of net product sales during the years ended December 31, 2015, 2014 and 2013, respectively. Some of the aforementioned sales to Wal-Mart are sold to McLane Company, a large national grocery wholesaler, which services and delivers certain of the Company products to Wal-Mart and other retailers in the U.S.A. Net product sales revenues from McLane, which includes these Wal-Mart sales as well as sales and deliveries to other Company customers, were 16.7% in 2015 and 15.3% in 2014 and 15.1% in 2013. Although no customer other than McLane Company, Inc. and Wal-Mart Stores, Inc. accounted for more than 10% of net product sales, the loss of one or more significant customers could have a material adverse effect on the Company’s business.
4
For a summary of sales and long-lived assets of the Company by geographic area see Note 9 of the “Notes to Consolidated Financial Statements” which is incorporated herein by reference.
Information regarding the Company’s annual reports on Form 10-K, quarterly reports on Form 10-Q, current reports on Form 8-K, and any amendments to these reports, will be made available, free of charge, upon written request to Tootsie Roll Industries, Inc., 7401 South Cicero Avenue, Chicago, Illinois 60629, Attention: Barry Bowen, Treasurer and Assistant Secretary. The Company does not make all such reports available on its website at www.tootsie.com because it believes that they are readily available from the Securities Exchange Commission at www.sec.gov, and because the Company provides them free of charge upon request. Interested parties, including shareholders, may communicate to the Board of Directors or any individual director in writing, by regular mail, addressed to the Board of Directors or an individual director, in care of Tootsie Roll Industries, Inc., 7401 South Cicero Avenue, Chicago, Illinois 60629, Attention: Ellen R. Gordon, Chairman and Chief Executive Officer. If an interested party wishes to communicate directly with the Company’s non-employee directors, it should be noted on the cover of the communication.
Significant factors that could impact the Company’s financial condition or results of operations include, without limitation, the following:
|
· |
Risk of changes in the price and availability of raw materials - The principal ingredients used by the Company are subject to price volatility. Although the Company engages in commodity hedging transactions and annual supply agreements as well as leveraging the high volume of its annual purchases, the Company may experience price increases in these ingredients that it may not be able to offset, which could have an adverse impact on the Company’s results of operations and financial condition. In addition, although the Company has historically been able to procure sufficient supplies of its ingredients, market conditions could change such that adequate supplies might not be available or only become available at substantially higher costs. Adverse weather patterns, including the effects of climate change, could also significantly affect the cost and availability of these ingredients. |
|
· |
Risk of changes in product performance and competition - The Company competes with other well-established manufacturers of confectionery products. A failure of new or existing products to be favorably received, a failure to retain preferred shelf space at retail or a failure to sufficiently counter aggressive promotional and price competition could have an adverse impact on the Company’s results of operations and financial condition. |
|
· |
Risk of discounting and other competitive actions - Discounting and pricing pressure by the Company’s retail customers and other competitive actions could make it more difficult for the Company to maintain its operating margins. Actions taken by major customers and competitors may make shelf space less available for confectionary products or some of the Company’s products. |
|
· |
Risk of pricing actions – Inherent risks in the marketplace, including uncertainties about trade and consumer acceptance of pricing actions or product weight changes could make it more difficult for the Company to maintain its sales and operating margins. |
|
· |
Risk related to seasonality - The Company’s sales are highest during the Halloween season. Adverse circumstances surrounding Halloween, such as widespread weather events at that time of year or general changes in consumer interest in Halloween could significantly affect the Company’s sales. |
|
· |
Risk of dependence on large customers - The Company’s largest customer, Wal-Mart Stores, Inc., accounted for approximately 23.7% of net product sales in 2015, and other large national chains are also material to the Company’s sales. The loss of Wal-Mart Stores, Inc. or one or more other large customers, or a material decrease in purchases by one or more large customers, could result in decreased sales and adversely impact the Company’s results of operations and financial condition. |
5
|
· |
Risk of changes in consumer preferences and tastes - Failure to adequately anticipate and react to changing demographics, consumer trends, consumer health concerns and product preferences, including product ingredients, could have an adverse impact on the Company’s results of operations and financial condition. |
|
· |
Risk of economic conditions on consumer purchases - The Company’s sales are impacted by consumer spending levels and impulse purchases which are affected by general macroeconomic conditions, consumer confidence, employment levels, disposable income, availability of consumer credit and interest rates on that credit, consumer debt levels, energy costs and other factors. Volatility in food and energy costs, rising unemployment and/or underemployment, declines in personal spending, and recessionary economic conditions could adversely impact the Company’s revenues, profitability and financial condition. |
|
· |
Risks related to environmental matters - The Company’s operations are not particularly impactful on the environment, but increased government environmental regulation or legislation could adversely impact the Company’s profitability. |
|
· |
Risks relating to participation in the multi-employer pension plan for certain Company union employees - As outlined in the notes to the consolidated financial statements and discussed in the Management’s Discussion & Analysis- , the Company participates in a multi-employer pension plan (Plan) which is currently in “critical and declining status”, as defined by applicable law. A designation of “critical and declining status” implies that the Plan is expected to become insolvent in the next 20 years. Under terms of a rehabilitation plan, the Company is to be assessed 5% annual compounded surcharges on its contributions to the Plan until such time as the Plan emerges from critical status. Should the Company withdraw from the Plan, it would subject to a significant withdrawal liability which is discussed in Note 7 of the Company’s Notes to Consolidated Financial Statements. The Company is currently unable to determine the ultimate outcome of this matter and therefore, is unable to determine the effects on its consolidated financial statements, but, the ultimate outcome could be material to its consolidated results of operations in one or more future periods. |
|
· |
Risk of new governmental laws and regulations - Governmental laws and regulations, including those that affect food advertising and marketing, including products for children, use of ingredients in products, including the use of hydrogenated oils, new labeling requirements, income and other taxes and tariffs, including those targeted toward confectionery products, and the environment, both in and outside the U.S., are subject to change over time, which could adversely impact the Company’s results of operations and ability to compete in domestic or foreign marketplaces. |
|
· |
Risk of labor stoppages - To the extent the Company experiences any significant labor stoppages, such disputes or strikes could negatively affect shipments from suppliers or shipments of finished product. |
|
· |
Risk of impairment of goodwill or indefinite-lived intangible assets - In accordance with authoritative guidance, goodwill and indefinite-lived intangible assets are not amortized but are subject to an impairment evaluation annually or more frequently upon the occurrence of a triggering event. Other long-lived assets are likewise tested for impairment upon the occurrence of a triggering event. Such evaluations are based on assumptions and variables including sales growth, profit margins and discount rates. Adverse changes in any of these variables could affect the carrying value of these intangible assets and the Company’s reported profitability. |
|
· |
Risk of the cost of energy increasing - Higher energy costs would likely result in higher distribution, freight and other operating costs. The Company may not be able to offset these cost increases or pass such cost increases onto customers in the form of price increases, which could have an adverse impact on the Company’s results of operations and financial condition. |
|
· |
Risk of a product recall - Issues related to the quality and safety of the Company’s products could result in a voluntary or involuntary large-scale product recall. Costs associated with a product recall and related litigation or fines, and marketing costs relating to the re-launch of such products or brands, could negatively affect operating results. In addition, negative publicity associated with this type of event, including a product recall relating to |
6
product contamination or product tampering, whether valid or not, could negatively impact future demand for the Company’s products. |
|
· |
Risk of operational interruptions relating to computer software or hardware failures - The Company is reliant on computer systems to operate its business. Software failure or corruption, including cyber-based attacks or network security breaches, or catastrophic hardware failures or other disasters could disrupt communications, supply chain planning and activities relating to sales demand forecasts, materials procurement, production and inventory planning, customer shipments, and financial and accounting, all of which could negatively impact sales and profits. |
|
· |
Risk of releasing sensitive information – Although the Company does not maintain a large amount of sensitive data, a system breach, whether inadvertent or perpetrated by hackers, could result in identity theft which could expose the Company to financial costs and adversely affect profitability. |
|
· |
Risk of production interruptions - The majority of the Company’s products are manufactured in a single production facility on specialized equipment. In the event of a disaster, such as a fire or earthquake, at a specific plant location, it would be difficult to transfer production to other facilities or a new location in a timely manner, which could result in loss of market share for the affected products. In addition, from time to time, the Company upgrades or replaces this specialized equipment. In many cases these are integrated and complex installations. A failure or delay in implementing such an installation could impact the availability of one or more of the Company’s products which would have an adverse impact on sales and profits. |
|
· |
Risk related to international operations - To the extent there is political or social unrest, civil war, terrorism or significant economic instability in the countries in which the Company operates, the results of the Company’s business in such countries could be adversely impacted. Currency exchange rate fluctuations between the U.S. dollar and foreign currencies could also have an adverse impact on the Company’s results of operations and financial condition. The Company’s principal markets are the U.S.A., Canada, and Mexico. |
|
· |
Risk related to investments in marketable securities - The Company invests its surplus cash in a diversified portfolio of highly rated marketable securities, including corporate and tax exempt municipal bonds, with maturities of generally up to three years. Nonetheless, such investments could become impaired in the event of certain adverse economic and/or geopolitical events which, if severe, would adversely affect the Company’s financial condition. |
|
· |
Disruption to the Company’s supply chain could impair Company’s ability to produce or deliver its finished products, resulting in a negative impact on operating results - Disruption to the manufacturing operations or supply chain, some of which are discussed above, could result from, but are not limited to natural disasters, pandemic outbreak of disease, weather, fire or explosion, terrorism or other acts of violence, unavailability of ingredients or packaging materials, labor strikes or other labor activities, operational and/or financial instability of key suppliers, and other vendors or service providers. Although precautions are taken to mitigate the impact of possible disruptions, if the Company is unable, or if it is not financially feasible, to effectively mitigate the likelihood or potential impact of such disruptive events, the Company’s results of operations and financial condition could be negatively impacted. |
|
· |
Risk related to acquisitions – From time to time, the Company has purchased other confectionery companies or brands. These acquisitions generally come at a high multiple of earnings and are justified based on various assumptions related to sales growth, and operating margins. Were the Company to make another acquisition and be unable to achieve the assumed sales and operating margins, it could have an adverse impact on future sales and profits. In addition it could become necessary to record an impairment which would have a further adverse impact on reported profits. |
|
· |
Risk of further losses in Spain – The Company has restructured its Spanish subsidiaries and is exploring a variety of programs to increase sales and profitability. However, the outcome of these efforts is uncertain and additional losses could be reported from these business units. |
7
|
· |
The Company is a controlled company due to the common stock holdings of the Gordon family - The Gordon family’s share ownership represents a majority of the combined voting power of all classes of the Company’s common stock as of December 31, 2015. As a result, the Gordon family has the power to elect the Company’s directors and approve actions requiring the approval of the shareholders of the Company. |
The factors identified above are believed to be significant factors, but not necessarily all of the significant factors, that could impact the Company’s business. Unpredictable or unknown factors could also have material effects on the Company.
Additional significant factors that may affect the Company’s operations, performance and business results include the risks and uncertainties listed from time to time in filings with the Securities and Exchange Commission and the risk factors or uncertainties listed herein or listed in any document incorporated by reference herein.
ITEM 1B. Unresolved Staff Comments.
None.
The Company owns its principal manufacturing, warehousing and distribution and offices facilities which are located in Chicago, Illinois in a building consisting of approximately 2,354,000 square feet. In addition, the Company leases manufacturing and warehousing facilities at a second location in Chicago which comprises 137,000 square feet. The lease is renewable by the Company every five years through June, 2041; the Company expects to renew this lease prior to termination. The Company also periodically leases additional warehousing space at this second location as needed on a month-to-month basis.
The Company’s other principal manufacturing, warehousing and distribution facilities, all of which are owned, are:
|
Location |
|
Square Feet (a) |
|
|
|
|
|
|
|
Covington, Tennessee |
|
685,000 |
|
|
Cambridge, Massachusetts |
|
142,000 |
|
|
Delavan, Wisconsin |
|
162,000 |
|
|
Concord, Ontario, Canada |
|
280,500 |
(b) |
|
Hazelton, Pennsylvania |
|
240,000 |
(c) |
|
Mexico City, Mexico |
|
90,000 |
|
|
Barcelona, Spain |
|
93,000 |
(d) |
|
(a) |
Square footage is approximate and includes production, warehousing and office space. |
|
(b) |
Two facilities; a third owned facility, comprising 225,000 square feet of warehousing space, and which is excluded from the reported totals above, is leased to a third party. |
|
(c) |
Warehousing only. |
|
(d) |
Excludes 9,500 square feet of unused office space in a separate facility. |
The Company owns substantially all of the production machinery and equipment located in its plants. The Company also holds four commercial real estate properties for investment which were acquired with the proceeds from a sale of surplus real estate in 2005.
8
There are no material pending legal proceedings known to the Company to which the Company or any of its subsidiaries is a party or of which any of their property is the subject, and no penalties have been imposed by the Internal Revenue Service on the Company.
ADDITIONAL ITEM. Executive Officers of the Registrant.
See the information on Executive Officers set forth in the table in Part III, Item 10.
ITEM 4. Mine Safety Disclosures.
None
9
PART II
ITEM 5. Market for Registrant’s Common Equity, Related Stockholder Matters and Issuer Purchases of Equity Securities.
The Company’s common stock is traded on the New York Stock Exchange. The Company’s Class B common stock is subject to restrictions on transferability. The Class B common stock is convertible at the option of the holder into shares of common stock on a share-for-share basis. As of February 26, 2016, there were approximately 2,900 and 1,100 registered holders of record of common and Class B common stock, respectively. In addition, the Company estimates that as of February 26, 2016 there were 12,500 and 4,300 beneficial holders of common and Class B common stock, respectively.
The following table sets forth information about the shares of its common stock the Company purchased on the open market during the fiscal quarter ended December 31, 2015:
Issuer Purchases of Equity Securities
|
|
|
|
|
|
|
|
Total Number of |
|
Maximum Number (or |
|
|
|
|
Total |
|
Average |
|
Shares Purchased |
|
Approximate Dollar Value) |
|
|
|
|
|
Number |
|
Price |
|
as Part of Publicly |
|
of Shares that May Yet |
|
|
|
|
|
of Shares |
|
Paid per |
|
Announced Plans |
|
be Purchased Under the |
|
|
|
Period |
|
Purchased |
|
Share |
|
or Programs |
|
Plans or Programs |
|
|
|
|
|
|
|
|
|
|
|
|
|
|
|
Oct 1 to Oct 31 |
|
157,486 |
|
$ |
31.22 |
|
Not Applicable |
|
Not Applicable |
|
|
Nov 1 to Nov 30 |
|
52,099 |
|
|
31.61 |
|
Not Applicable |
|
Not Applicable |
|
|
Dec 1 to Dec 31 |
|
109,583 |
|
|
31.31 |
|
Not Applicable |
|
Not Applicable |
|
|
Total |
|
319,168 |
|
$ |
31.31 |
|
|
|
|
|
While the Company does not have a formal or publicly announced Company common stock purchase program, the Company repurchases its common shares on the open market from time to time as authorized by the Board of Directors.
Quarterly Stock Prices and Dividends
Quarterly prices for the Company’s common stock, as reported on the New York Stock Exchange composite tape and quarterly dividends in 2015 and 2014 were:
|
|
|
|
|
|
|
|
|
|
|
|
|
|
|
|
|
|
|
|
|
|
|
|
|
|
|
|
|
2015 |
|
2014 |
||||||||||||||||||||
|
|
|
4th |
|
3rd |
|
2nd |
|
1st |
|
4th |
|
3rd |
|
2nd |
|
1st |
||||||||
|
|
|
|
Quarter |
|
|
Quarter |
|
|
Quarter |
|
|
Quarter |
|
|
Quarter |
|
|
Quarter |
|
|
Quarter |
|
|
Quarter |
|
|
|
|
|
|
|
|
|
|
|
|
|
|
|
|
|
|
|
|
|
|
|
|
|
|
|
High |
|
$ |
32.85 |
|
$ |
32.88 |
|
$ |
34.34 |
|
$ |
34.79 |
|
$ |
30.99 |
|
$ |
30.12 |
|
$ |
30.11 |
|
$ |
32.42 |
|
Low |
|
|
30.85 |
|
|
30.37 |
|
|
30.34 |
|
|
29.24 |
|
|
27.98 |
|
|
26.15 |
|
|
27.40 |
|
|
28.80 |
|
Dividends per share |
|
|
0.09 |
|
|
0.09 |
|
|
0.09 |
|
|
0.08 |
|
|
0.08 |
|
|
0.08 |
|
|
0.08 |
|
|
0.08 |
NOTE: In addition to the above cash dividends, a 3% stock dividend was issued on April 10, 2015 and April 4, 2014. Cash dividends are restated to reflect 3% stock dividends.
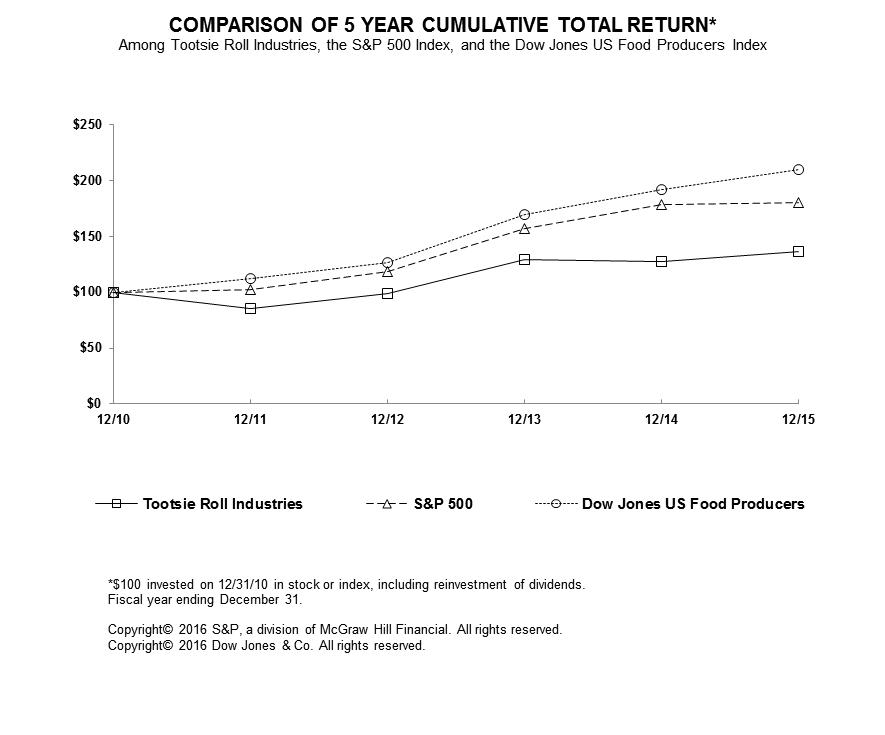
Performance Graph
The following performance graph compares the cumulative total shareholder return on the Company’s common stock for a five-year period (December 31, 2010 to December 31, 2015) with the cumulative total return of Standard & Poor’s 500 Stock Index (“S&P 500”) and the Dow Jones Industry Food Index (“Peer Group,” which includes
10
the Company), assuming (i) $100 invested on December 31 of the first year of the chart in each of the Company’s common stock, S&P 500 and the Dow Jones Industry Food Index and (ii) the reinvestment of cash and stock dividends.
11
ITEM 6. Selected Financial Data.
Five Year Summary of Earnings and Financial Highlights
(Thousands of dollars except per share, percentage and ratio figures)
|
(See management’s comments starting on page 4) |
|
2015 |
|
2014 |
|
2013 |
|
2012 |
|
2011 |
|
|||||
|
Sales and Earnings Data (2) |
|
|
|
|
|
|
|
|
|
|
|
|
|
|
|
|
|
Net product sales |
|
$ |
536,692 |
|
$ |
539,895 |
|
$ |
539,627 |
|
$ |
545,985 |
|
$ |
528,369 |
|
|
Product gross margin |
|
|
196,602 |
|
|
198,962 |
|
|
188,667 |
|
|
180,412 |
|
|
163,144 |
|
|
Interest expense |
|
|
76 |
|
|
99 |
|
|
92 |
|
|
137 |
|
|
121 |
|
|
Provision for income taxes |
|
|
26,451 |
|
|
28,434 |
|
|
23,634 |
|
|
22,160 |
|
|
16,974 |
|
|
Net earnings attributable to Tootsie Roll Industries, Inc. |
|
|
66,089 |
|
|
63,298 |
|
|
60,849 |
|
|
52,004 |
|
|
43,938 |
|
|
% of net product sales |
|
|
12.3 |
% |
|
11.7 |
% |
|
11.3 |
% |
|
9.5 |
% |
|
8.3 |
% |
|
% of shareholders’ equity |
|
|
9.5 |
% |
|
9.2 |
% |
|
8.9 |
% |
|
8.0 |
% |
|
6.6 |
% |
|
Per Common Share Data (1)(3) |
|
|
|
|
|
|
|
|
|
|
|
|
|
|
|
|
|
Net earnings attributable to Tootsie Roll Industries, Inc. |
|
$ |
1.08 |
|
$ |
1.02 |
|
$ |
0.96 |
|
$ |
0.81 |
|
$ |
0.68 |
|
|
Cash dividends declared |
|
|
0.35 |
|
|
0.32 |
|
|
0.32 |
|
|
0.82 |
|
|
0.32 |
|
|
Stock dividends |
|
|
3 |
% |
|
3 |
% |
|
3 |
% |
|
3 |
% |
|
3 |
% |
|
Additional Financial Data (1)(2) |
|
|
|
|
|
|
|
|
|
|
|
|
|
|
|
|
|
Working capital |
|
$ |
221,744 |
|
$ |
200,162 |
|
$ |
179,990 |
|
$ |
136,476 |
|
$ |
153,272 |
|
|
Net cash provided by operating activities |
|
|
91,073 |
|
|
88,769 |
|
|
109,823 |
|
|
101,418 |
|
|
51,098 |
|
|
Net cash provided by (used in) investing activities |
|
|
(8,523) |
|
|
(30,459) |
|
|
(47,963) |
|
|
(40,435) |
|
|
(51,157) |
|
|
Net cash used in financing activities |
|
|
(53,912) |
|
|
(44,664) |
|
|
(37,425) |
|
|
(76,234) |
|
|
(36,597) |
|
|
Property, plant & equipment additions |
|
|
15,534 |
|
|
10,704 |
|
|
15,752 |
|
|
8,886 |
|
|
16,351 |
|
|
Net property, plant & equipment |
|
|
184,586 |
|
|
190,081 |
|
|
196,916 |
|
|
201,290 |
|
|
212,162 |
|
|
Total assets |
|
|
908,983 |
|
|
910,386 |
|
|
888,409 |
|
|
846,737 |
|
|
857,856 |
|
|
Long-term debt |
|
|
7,500 |
|
|
7,500 |
|
|
7,500 |
|
|
7,500 |
|
|
7,500 |
|
|
Total Tootsie Roll Industries, Inc. shareholders’ equity |
|
|
698,183 |
|
|
690,809 |
|
|
680,305 |
|
|
649,815 |
|
|
665,935 |
|
|
Average shares outstanding |
|
|
61,441 |
|
|
62,358 |
|
|
63,195 |
|
|
64,044 |
|
|
64,907 |
|
|
(1) |
Per common share data and average shares outstanding adjusted for annual 3% stock dividends. |
|
(2) |
Certain reclassifications have been made to prior year numbers to conform to current year presentation. |
|
(3) |
The fourth quarter 2012 includes a $0.50 special dividend. |
12
Item 7. Management’s Discussion and Analysis of Financial Condition and Results of Operations
(in thousands except per share, percentage and ratio figures)
The following discussion should be read in conjunction with the other sections of this report, including the consolidated financial statements and related notes contained in Item 8 of this Annual Report on Form 10-K.
FINANCIAL REVIEW
This financial review discusses the Company’s financial condition, results of operations, liquidity and capital resources, significant accounting policies and estimates, new accounting pronouncements, market risks and other matters. It should be read in conjunction with the Consolidated Financial Statements and related footnotes that follow this discussion.
FINANCIAL CONDITION
The Company’s overall financial position remains very strong as a result of its higher net earnings and strong cash flows provided by operating activities. Cash flows from 2015 operating activities totaled $91,073 and were used to pay cash dividends of $20,775, purchase and retire $33,004 of its outstanding shares, make capital expenditures of $15,534, and add to the Company’s marketable securities investments.
The Company’s net working capital was $221,744 at December 31, 2015 compared to $200,162 at December 31, 2014 which generally reflects higher cash and cash equivalents and short-term investments. As of December 31, 2015, the Company’s aggregate cash, cash equivalents and investments, including all long-term investments in marketable securities, was $321,230 compared to $303,137 at December 31, 2014, an increase of $18,093. The aforementioned includes $60,584 and $71,682 in trading securities as of December 31, 2015 and 2014, respectively. The Company invests in trading securities to provide an economic hedge for its deferred compensation liabilities, as further discussed herein and in Note 7 of the Company’s Notes to Consolidated Financial Statements.
Shareholders’ equity increased from $690,809 at December 31, 2014 to $698,183 as of December 31, 2015, principally reflecting 2015 net earnings of $66,089, less cash dividends of $20,775, share repurchases of $33,004, and an increase in accumulated other comprehensive loss of $4,266 during 2015.
The Company has a relatively straight-forward financial structure and has historically maintained a conservative financial position. Except for an immaterial amount of operating leases, the Company has no special financing arrangements or “off-balance sheet” special purpose entities. Cash flows from operations plus maturities of short-term investments are expected to be adequate to meet the Company’s overall financing needs, including capital expenditures, in 2016. Periodically, the Company considers possible acquisitions, and if the Company were to pursue and complete such an acquisition, that could result in bank borrowings or other financing.
Results of Operations
2015 vs. 2014
While the Company finished 2015 with a 3.0% increase in fourth quarter domestic sales, the Company’s reported consolidated sales of $139,881 in 2015, which increased 1.4% in fourth quarter 2015, were adversely impacted by foreign currency translation due to the strength of the U.S. dollar. Twelve months 2015 consolidated sales were $536,692 compared to $539,895 in 2014, a decrease of $3,203 or 0.6%, although twelve months 2015 domestic sales were 1.0% ahead of twelve months 2014 domestic sales. Twelve months 2015 consolidated sales were adversely affected by currency translation of $8,191 due to a stronger U.S. dollar in 2015 compared to 2014, principally relating to Mexico and Canada. Overall, 2015 sales volumes in the United States were 1% ahead of 2014, and there were no significant changes in selling prices and price realization, or product mix. The Company’s sales results in the United States continue to reflect the challenges of certain of the Company’s retail customers including their consumer sales and margin pressures.
Product cost of goods sold were $340,090 in 2015 compared to $340,933 in 2014, a decrease of $843 or 0.2%. Product cost of goods sold includes $497 and $1,140 in certain deferred compensation expenses in 2015 and 2014, respectively.
13
These deferred compensation expenses principally result from changes in the market value of investments and investment income from trading securities relating to compensation deferred in previous years and are not reflective of current operating results. Adjusting for the aforementioned, product cost of goods sold decreased from $339,793 in 2014 to $339,593 in 2015, a decrease of $200 or 0.1%. As a percent of net product sales, these adjusted costs increased from 62.9% in 2014 to 63.3% in 2015, an unfavorable increase of 0.4% as a percent of net product sales. Although the Company’s overall comparative ingredient costs were somewhat more favorable in 2015, certain key ingredient costs were higher in 2015 compared to 2014, and the Company expects higher overall ingredient costs in 2016. The Company’s product gross margins also benefited from manufacturing plant efficiencies driven by capital investments and cost containment programs, but were adversely affected by higher manufacturing plant overhead costs. The Company is continuing its focus on cost reductions and savings, including capital investments to achieve manufacturing efficiencies, and has made progress on restoring the Company’s margins to their historical levels before the increases in commodity and other input costs in past years.
Selling, marketing and administrative expenses were $108,051 in 2015 compared to $117,722 in 2014, a decrease of $9,671 or 8.2%. Selling, marketing and administrative expenses include $953 and $3,761 in certain deferred compensation expenses in 2015 and 2014, respectively. These deferred compensation expenses principally result from changes in the market value of investments and investment income from trading securities relating to compensation deferred in previous years and are not reflective of current operating results. Adjusting for the aforementioned, selling, marketing and administrative expenses decreased from $113,961 in 2014 to $107,098 in 2015, a decrease of $6,863 or 6.0%. As a percent of net product sales, these adjusted expenses decreased from 21.1% of net product sales in 2014 to 20.0% of net product sales in 2015, a 1.1% favorable decrease as a percentage of sales. Selling, marketing and administrative expenses include $42,619 and $46,525 of freight, delivery and warehousing expenses in 2015 and 2014, respectively, which decreased from 8.6% of net product sales in 2014 to 7.9% of net product sales in 2015. This expense reduction reflects lower distribution and delivery expenses including the effects of declining energy and fuel costs and internal initiatives to reduce expense.
The Company believes that the carrying values of its goodwill and trademarks have indefinite lives as they are expected to generate cash flows indefinitely. In accordance with current accounting guidance, these indefinite-lived intangible assets are assessed at least annually for impairment as of December 31 or whenever events or circumstances indicate that the carrying values may not be recoverable from future cash flows. No impairments were recorded in 2015, 2014 or 2013. The fair values of trademarks are assessed each year using the present value of estimated future cash flows and estimated royalties. Based on the Company’s estimate at December 31, 2015, the individual fair values of the indefinite lived intangible assets exceed the net book value by more than 10%. For certain trademarks, holding all other assumptions constant at the test date, a 100 basis point increase in the discount rate or a 100 basis point decrease in the royalty rate would reduce the fair value of certain trademarks by approximately 15% and 10%, respectively. Individually, a 100 basis point increase in the discount rate or a 100 basis point decrease in the royalty rate would not result in a potential impairment as of December 31, 2015.
Earnings from operations were $91,082 in 2015 compared to $83,923 in 2014, an increase of $7,159. Earnings from operations include $1,450 and $4,901 in certain deferred compensation expense in 2015 and 2014, respectively, which are discussed above. Adjusting for these deferred compensation expenses, earnings from operations increased from $88,824 in 2014 to $92,532 in 2015, an increase of $3,708 or 4.2%. This increase in 2015 earnings from operations principally reflects the benefits of higher domestic sales and the cost and expense reductions discussed above.
Management believes the comparisons presented in the preceding paragraphs, after adjusting for changes in deferred compensation, are more reflective of the underlying operations of the Company.
Other income, net was $1,496 in 2015 compared to $7,371 in 2014, a decrease of $5,875. Other income, net principally reflects $1,450 and $4,901 of aggregate net gains and investment income on trading securities in 2015 and 2014, respectively. These trading securities provide an economic hedge of the Company’s deferred compensation liabilities; and the related net gains and investment income were offset by a like amount of expense in aggregate product cost of goods sold and selling, marketing, and administrative expenses in the respective years as discussed above. Other income, net includes investment income on available for sale securities of $1,421 and $1,582 in 2015 and 2014, respectively; and foreign exchange losses of $1,427 and $861 in 2015 and 2014, respectively. In addition, prior year first quarter and 2014 other income, net includes a pre-tax gain of approximately $1,800 ($529 after-tax loss) resulting from the step acquisition
14
of the two Spanish companies discussed below and in Note 1 of the Company’s Notes to Consolidated Financial Statements.
The consolidated effective tax rate was 28.6% and 31.1% in 2015 and 2014, respectively. The lower effective tax rate for 2015 principally reflects a $1,066 release of an uncertain income tax liability, and resulting income tax benefit, due to a decision by a foreign court issued in second quarter 2015, and the reversal of deferred tax assets of $2,350 (and increase in income tax expense) in first quarter 2014 relating to the step acquisition of the Spanish companies as discussed in Note 1 of the Company’s Notes to Consolidated Financial Statements. A reconciliation of the differences between the U.S. statutory rate and these effective tax rates is provided in Note 4 of the Company’s Notes to Consolidated Financial Statements. At December 31, 2015, the Company’s deferred tax assets include $8,122 of income tax benefits relating to its Canadian subsidiary tax loss carry-forwards which the Company expects to realize before their expiration dates (2028 through 2031). The Company utilized approximately $2,758 and $1,632 of these tax carry-forward benefits in 2015 and 2014, respectively. The Company has concluded that it is more-likely-than-not that it would realize these deferred tax assets relating to its Canadian tax operating loss carry-forwards because it is expected that sufficient levels of taxable income will be generated during the carry-forward periods. The Company has provided a full valuation allowance on its Spanish subsidiaries’ tax loss carry-forward benefits of approximately $1,834 as of December 31, 2015 because the Company has concluded that it is not more-likely-than-not that these losses will be utilized before their expiration dates. The Spanish subsidiaries have a history of net operating losses and it is not known when and if they will generate taxable income in the future. The Company has not provided for U.S. federal or foreign withholding taxes on approximately $3,500 and $5,400 of foreign subsidiaries’ undistributed earnings as of December 31, 2015 and December 31, 2014, respectively, because such earnings are considered to be permanently reinvested. The Company estimates that the federal income tax liability on such undistributed earnings would approximate 30% of these amounts.
Net earnings attributable to Tootsie Roll Industries, Inc. were $66,089 in 2015 compared to $63,298 in 2014, and earnings per share were $1.08 and $1.02 in 2015 and 2014, respectively, an increase of $0.06 or 5.9%. Net earnings principally benefited from higher domestic sales, cost and expense reductions, and a lower effective income tax rate which are discussed above. Earnings per share in 2015 benefited from the reduction in average shares outstanding resulting from purchases of the Company’s common stock in the open market by the Company. Average shares outstanding decreased from 62,358 in 2014 to 61,441 in 2015.
During first quarter 2014, the Company gained operating control of its two 50% owned Spanish companies when Company employee representatives assumed all positions on their boards of directors. This was considered a step acquisition, whereby the Company remeasured the previously held investment to fair value in first quarter 2014. As a result, the Company’s first quarter 2014 net earnings include a net loss of $529, including an additional income tax provision of $2,350 relating to deferred income taxes. During 2014, the Company further increased its control and ownership to 83% by purchasing and subscribing to additional common shares of its Spanish subsidiaries for approximately $1,400 ($1,200 was paid in 2014, and the balance was paid in 2015). These Spanish companies had operating losses for each of the years 2008 through 2015. Company management has restructured the Spanish operations and made other changes to its business plan but believes that the business, competitive and economic challenges in Spain are likely to continue, and therefore, additional cash financing of these Spanish companies will likely be required in 2016.
As discussed in Note 7 of the Company’s Notes to Consolidated Financial Statements, the Company received notices beginning in 2012 from the Bakery, Confectionery, Tobacco Workers and Grain Millers International Union Pension Plan (Plan), a multi-employer defined benefit pension plan for certain Company union employees. The notices indicated that the Plan’s actuary certified the Plan to be in “critical status”, the “Red Zone”, as defined by the Pension Protection Act (PPA) and the Pension Benefit Guaranty Corporation (PBGC), and that a plan of rehabilitation was adopted by the trustees of the Plan in fourth quarter 2012. During second quarter 2015, the Company received new notices that the Plan is now in “critical and declining status”, as defined by the PPA and PBGC, for the plan year beginning January 1, 2015, and that the Plan is projected to have an accumulated funding deficiency for the 2017 through 2024 plan years. A designation of “critical and declining status” implies that the Plan is expected to become insolvent in the next 20 years. Such plans are eligible, but not required, to reduce benefits, temporarily or permanently, for participants, including most retirees.
The Plan’s funded percentage (plan investment assets as a percentage of plan liabilities), as defined, were 65.11%, 66.41% and 66.86% as of the most recent valuation dates available, January 1, 2014, 2013, and 2012, respectively. These funded
15
percentages are based on actuarial values, as defined, and do not reflect the actual market value of Plan investments as of these dates. If the market value of investments had been used as of January 1, 2014 the funded percentage would be 60.22% (not 65.11%). As of the January 1, 2014 valuation date, 21% of Plan participants were active, 51% were retired or separated from service and receiving benefits, and 28% were retired or separated from service and entitled to future benefits.
In fourth quarter 2014, the Company was advised by the Plan that its withdrawal liability would have been $56,400 if it had withdrawn from the Plan during 2014. The Company was previously advised by the Plan that if the Company had withdrawn from the Plan during 2012, its estimated withdrawal liability would have been $37,200. The increase from 2012 to 2014 principally reflects changes in key actuarial assumptions, including the effects of a lower interest rates proscribed by PBGC which were partially used to determine the present value of vested benefits, and a change to a more conservative mortality table. In fourth quarter 2015, the Company was advised that its withdrawal liability would have been $61,000 if it had withdrawn from the Plan during 2015. The increase from 2014 to 2015 principally reflects a higher share of the Plan’s unfunded vested benefits allocated to the Company. Based on the Company’s actuarial study and certain provisions in ERISA and the law relating to withdrawal liability payments, management believes that the Company’s liability would be limited to twenty annual payments of $2,966 which have a present value in the range of $34,800 to $45,400 based on a range of valuation interest rates which management understands is provided under the statute. Should the Company actually withdraw from the Plan at a future date, a withdrawal liability, which could be higher than the above discussed amounts, could be payable to the Plan.
The Company’s existing labor contract with the local union commits the Company’s participation in this Plan through third quarter 2017. The rehabilitation plan, which continues, requires that employer contributions include 5% compounded annual surcharge increases each year for an unspecified period of time beginning January 2013 (in addition to the 5% interim surcharge initiated in June 2012) as well as certain plan benefit reductions. The Company’s pension expense for this Plan for 2015, 2014 and 2013 was $2,574, $2,588, and $2,231 respectively. The aforementioned expense includes surcharge increases of $447, $342, and $242 in 2015, 2014 and 2013, respectively, as required under the plan of rehabilitation.
The Company is currently unable to determine the ultimate outcome of the above discussed matter and therefore is unable to determine the effects on its consolidated financial statements, but the ultimate outcome or the effects of any modifications to the current rehabilitation plan could be material to its consolidated results of operations or cash flows in one or more future periods.
2014 vs. 2013
Net product sales in fourth quarter 2014 increased by 1.8% to $137,929, and twelve months net product sales increased by $268 or 0.1% to $539,895 in 2014. Company sales results in the United States reflect the challenges of certain of the Company’s retail customers regarding consumer sales and consumer spending. Overall, 2014 sales volumes in the United States were relatively even with 2013, and there were no significant changes in selling prices and price realization, or product mix. Lower sales in Mexico and Canada, including the effects of a weaker Mexican and Canadian currencies, respectively, also adversely affected the Company’s reported sales during these same comparative periods.
Product cost of goods sold were $340,933 in 2014 compared to $350,960 in 2013, a decrease of $10,027 or 2.9%. Product cost of goods sold includes $1,140 and $2,457 in certain deferred compensation expenses in 2014 and 2013, respectively. These deferred compensation expenses principally result from changes in the market value of investments and investment income from trading securities relating to compensation deferred in previous years and are not reflective of current operating results. Adjusting for the aforementioned, product cost of goods sold decreased from $348,503 in 2013 to $339,793 in 2014, a decrease of $8,710 or 2.5%. As a percent of net product sales, these adjusted costs decreased from 64.6% in 2013 to 62.9% in 2014, a favorable decrease of 1.7% as a percent of net product sales. Although the Company’s overall comparative ingredient costs were more favorable in 2014 compared to 2013, certain key ingredient costs were higher in 2014. Product gross margins benefited from manufacturing plant efficiencies resulting from capital investments and cost containment programs.
Selling, marketing and administrative expenses were $117,722 in 2014 compared to $119,113 in 2013, a decrease of $1,391 or 1.2%. Selling, marketing and administrative expenses include $3,761 and $8,131 in certain deferred compensation
16
expenses in 2014 and 2013, respectively. These deferred compensation expenses principally result from changes in the market value of investments and investment income from trading securities relating to compensation deferred in previous years and are not reflective of current operating results. Adjusting for the aforementioned, selling, marketing and administrative expenses increased from $111,002 in 2013 to $113,961 in 2014, an increase of $2,959 or 2.7%. As a percent of net product sales, these adjusted expenses increased slightly from 20.6% of net product sales in 2013 to 21.1% of net product sales in 2014. Selling, marketing and administrative expenses include $46,525 and $45,367 of freight, delivery and warehousing expenses in 2014 and 2013, respectively, which increased slightly from 8.4% of net product sales in 2013 to 8.6% of net product sales in 2014.
Earnings from operations were $83,923 in 2014 compared to $72,353 in 2013, an increase of $11,570. Earnings from operations include $4,901 and $10,588 in certain deferred compensation expense in 2014 and 2013, respectively, which are discussed above. Adjusting for these deferred compensation expenses, earnings from operations increased from $82,941 in 2013 to $88,824 in 2014, an increase of $5,883 or 7.1%. This increase in 2014 earnings from operations principally reflects more favorable ingredient costs, plant efficiencies driven by capital investments, and on-going cost control programs as discussed above.
Management believes the comparisons presented in the preceding paragraphs, after adjusting for changes in deferred compensation, are more reflective of the underlying operations of the Company.
Other income, net was $7,371 in 2014 compared to $12,130 in 2013, a decrease of $4,759. Other income, net principally reflects $4,901 and $10,588 of aggregate net gains and investment income on trading securities in 2014 and 2013, respectively. These trading securities provide an economic hedge of the Company’s deferred compensation liabilities; and the related net gains and investment income were offset by a like amount of expense in aggregate product cost of goods sold and selling, marketing, and administrative expenses in the respective years as discussed above. Other income, net also includes foreign exchange losses of $861 and $790 in 2014 and 2013, respectively. In addition, 2013 net includes a $2,430 gain on the sale of an investment security.
The consolidated effective tax rate was 31.1% and 28.0% in 2014 and 2013, respectively. This higher effective tax rate in 2014 reflects an additional deferred income tax expense of $2,350 relating the Company’s step acquisition of its Spanish subsidiaries which is discussed below. At December 31, 2014, the Company’s deferred tax assets include $10,880 of income tax benefits relating to its Canadian subsidiary tax loss carry-forwards which the Company expects to realize before their expiration dates (2027 through 2031). The Company utilized approximately $600 and $400 of these tax carry-forward benefits in 2014 and 2013, respectively. The Company provided a full valuation allowance on its Spanish subsidiaries’ tax loss carry-forward benefits of approximately $2,092 as of December 31, 2014.
Net earnings attributable to Tootsie Roll Industries, Inc. were $63,298 in 2014 compared to $60,849 in 2013, and earnings per share were $1.02 and $0.96 in 2014 and 2013, respectively, an increase of $0.06 or 6.3%. Net earnings principally benefited from improved gross profit margins which are discussed above. Net earnings for the prior year 2013 benefited from a lower effective income tax rate and a capital gain on the sale of an investment security, both of which adversely affects the comparison of 2014 net earnings to those in 2013. Earnings per share in 2014 benefited from the reduction in average shares outstanding resulting from purchases of the Company’s common stock in the open market by the Company. Average shares outstanding decreased from 63,195 in 2013 to 62,358 in 2014.
LIQUIDITY AND CAPITAL RESOURCES
Cash flows from operating activities were $91,073, $88,769 and $109,823 in 2015, 2014 and 2013, respectively. The $2,304 increase in cash flows from operating activities from 2014 to 2015 primarily reflects decreases in inventories in 2015, and changes in prepaid expenses and other assets in the respective years; however, 2015 cash flows from operating activities were adversely affected by changes in deferred compensation and other liabilities which principally relate to the payment of certain deferred compensation during 2015. The decrease in cash flows from 2013 to 2014 primarily reflects the 2014 increases in inventories and account receivable and changes in prepaid expenses and other assets in the comparative years.
17
During fourth quarter 2014 and 2013, the Company contributed $1,000 and $15,000 to a VEBA trust, managed and controlled by the Company, to fund the estimated future costs of certain employee health, welfare and other benefits. No contributions were made during 2015. The Company is using these funds to pay the actual cost of such benefits through 2017. At December 31, 2015 and 2014, the VEBA trust held $6,727 and $10,845, respectively, of aggregate cash and cash equivalents. This asset value is included in prepaid expenses and long-term other assets in the Company’s Consolidated Statement of Financial Position. These assets are categorized as Level 1 within the fair value hierarchy.
During fourth quarter 2013, the Company restructured and amended its post-retirement health benefits plan provided to corporate office and management employees. These changes resulted in a negative plan amendment, as defined by accounting guidance, resulting in a $10,425 reduction in the Company’s benefit obligation as of December 31, 2013. The plan changes generally limited future annual cost increases in health benefits to 3%, restricted this benefit to current employees with long-term service with the Company, required retirees to pay the full cost of life insurance, and eliminated all post-retirement benefits for future employees effective April 1, 2014. Post-retirement benefits liabilities (as amended) were $11,400 and $12,311 at December 31, 2015 and 2014, respectively. This decrease reflects actuarial gains relating to a 30 basis point increase in the discount rate (4.13% and 3.83% discount rate as of December 31, 2015 and 2014, respectively).
Cash flows from investing activities reflect capital expenditures of $15,534, $10,704, and $15,752 in 2015, 2014 and 2013, respectively. The changes in amounts each year principally reflects the timing of expenditures relating to plant manufacturing projects. These capital expenditures include $812, $1,676 and $1,775 relating to computer systems and software and implementations in 2015, 2014 and 2013, respectively. Capital expenditures for 2016 are expected to be in line with historical annual spending but actual expenditures can vary due to the timing of larger projects and payments. They are to be funded from the Company’s cash flow from operations and internal sources.
Other than the bank loans and the related restricted cash of the Company’s Spanish subsidiaries which are discussed in Note 1 of the Company’s Notes to Consolidated Financial Statements, the Company had no bank borrowings or repayments in 2013, 2014, or 2015, and had no outstanding bank borrowings as of December 31, 2014 or 2015. Nonetheless, the Company would consider bank borrowing or other financing in the event that a business acquisition is completed.
Financing activities include Company common stock purchases and retirements of $33,004, $25,020, and $23,143 in 2015, 2014 and 2013, respectively. Cash dividends of $20,775, $19,241, and $14,282 were paid in 2015, 2014 and 2013, respectively.
SIGNIFICANT ACCOUNTING POLICIES AND ESTIMATES
Preparation of the Company’s financial statements involves judgments and estimates due to uncertainties affecting the application of accounting policies, and the likelihood that different amounts would be reported under different conditions or using different assumptions. The Company bases its estimates on historical experience and other assumptions, as discussed herein, that it believes are reasonable. If actual amounts are ultimately different from previous estimates, the revisions are included in the Company’s results of operations for the period in which the actual amounts become known. The Company’s significant accounting policies are discussed in Note 1 of the Company’s Notes to Consolidated Financial Statements.
Following is a summary and discussion of the more significant accounting policies which management believes to have a significant impact on the Company’s operating results, financial position, cash flows and footnote disclosure.
Revenue recognition
Revenue, net of applicable provisions for discounts, returns, allowances and certain advertising and promotional costs, is recognized when products are delivered to customers based on an accepted customer purchase order. These include quantity, sales price and other relevant terms of sale, and collectability is reasonably assured. The accounting for promotional costs is discussed under “Customer incentive programs, advertising and marketing” below. Accounts receivable are unsecured.
18
Provisions for bad debts are recorded as selling, marketing and administrative expenses. Write-offs of bad debts did not exceed 0.1% of net product sales in each of 2015, 2014 and 2013, and accordingly, have not been significant to the Company’s financial position or results of operations.
Shipping and handling costs are included in selling, marketing and administrative expenses.
Intangible assets
The Company’s intangible assets consist primarily of goodwill and acquired trademarks. All trademarks have been assessed by management to have indefinite lives because they are expected to generate cash flows indefinitely. In accordance with accounting guidance, goodwill and other indefinite-lived assets are not amortized, but are instead subjected to annual testing for impairment unless certain triggering events or circumstances are noted. The Company performs its annual impairment testing as of December 31. The Company may utilize third-party professional valuation firms to assist in the determination of valuation of certain trademarks.
With respect to impairment testing of goodwill, the first step compares the reporting unit’s estimated fair value with its carrying value. The Company estimates a reporting unit’s fair value using projected discounted cash flows. If the carrying value of a reporting unit’s net assets exceeds its fair value, the second step is applied to measure the difference between the carrying value and implied fair value of goodwill. If the carrying value of goodwill exceeds its implied fair value, the goodwill is considered impaired and reduced to its implied fair value.
The Company tests non-amortizable intangible assets, trademarks, for impairment by comparing the fair value of each trademark with its carrying value. The Company determines the fair value of trademarks using discounted cash flows and estimates of royalty rates. If the carrying value exceeds fair value, the trademark is considered impaired and is reduced to fair value.
The cash flow projections discussed above requires us to make assumptions and estimates regarding the Company’s future plans, including sales projections and profit margins, market based discount rates, competitive factors, and economic conditions; and the Company’s actual results and conditions may differ over time. A change in the assumptions relating to the impairment analysis of goodwill and trademarks, including but not limited to a reduction in projected cash flows, the use of a different discount rate to discount future cash flows or a different royalty rate applied to the Company’s trademarks, could cause impairment in the future.
Customer incentive programs, advertising and marketing
Advertising and marketing costs are recorded in the period to which such costs relate. The Company does not defer the recognition of any amounts on its consolidated balance sheet with respect to such costs. Customer incentives and other promotional costs are recorded at the time of sale based upon incentive program terms and historical utilization statistics, which are generally consistent from year to year.
The liabilities associated with these programs are reviewed quarterly and adjusted if utilization rates differ from management’s original estimates. Such adjustments have not historically been material to the Company’s operating results.
Split dollar officer life insurance
The Company provides split dollar life insurance benefits to certain executive officers and records an asset principally equal to the cumulative premiums paid. The Company will fully recover these premiums in future years under the terms of the plan. The Company retains a collateral assignment of the cash surrender values and policy death benefits payable to insure recovery of these premiums.
Valuation of long-lived assets
Long-lived assets, primarily property, plant and equipment are reviewed for impairment as events or changes in business circumstances occur indicating that the carrying value of the asset may not be recoverable. The estimated cash flows
19
produced by assets or asset groups, are compared to the asset carrying value to determine whether impairment exists. Such estimates involve considerable management judgment and are based upon assumptions about expected future operating performance. As a result, actual cash flows could differ from management’s estimates due to changes in business conditions, operating performance, and economic and competitive conditions.
Income taxes
Deferred income taxes are recognized for future tax effects of temporary differences between financial and income tax reporting using tax rates in effect for the years in which the differences are expected to reverse. The Company records valuation allowances in situations where the realization of deferred tax assets, including those relating to net operating tax losses, is not more-likely-than-not; and the Company adjusts and releases such valuation allowances when realization becomes more-likely-than-not as defined by accounting guidance. The Company periodically reviews assumptions and estimates of the Company’s probable tax obligations and effects on its liability for uncertain tax positions, using informed judgment which may include the use of third-party consultants, advisors and legal counsel, and historical experience.
Valuation of investments
Investments, primarily corporate and municipal bonds are reviewed for impairment at each reporting period by comparing the carrying value or amortized cost to the fair market value. The Company may utilize third-party professional valuation firms as necessary to assist in the determination of the value of investments that utilize Level 3 inputs as defined by guidance. In the event that an investment security’s fair value is below carrying value or amortized cost, the Company will record an other-than-temporary impairment or a temporary impairment based on accounting guidance.
Other matters
In the opinion of management, other than contracts for foreign currency forwards and raw materials, including currency and commodity hedges and outstanding purchase orders for packaging, ingredients, supplies, and operational services, all entered into in the ordinary course of business, the Company does not have any significant contractual obligations or future commitments. The Company’s outstanding contractual commitments as of December 31, 2015, all of which are generally normal and recurring in nature, are summarized in the chart which follows below.
RECENT ACCOUNTING PRONOUNCEMENTS
See Note 1 of the Company’s Notes to Consolidated Financial Statements.
MARKET RISKS
The Company is exposed to market risks related to commodity prices, interest rates, investments in marketable securities, equity price and foreign exchange.
The Company’s ability to forecast the direction and scope of changes to its major input costs is impacted by significant volatility in crude oil, sugar, corn, soybean and edible oils, cocoa and dairy products markets. The prices of these commodities are influenced by changes in global demand, changes in weather and crop yields, including the effects of climate change, changes in governments’ farm policies, including mandates for ethanol and bio-fuels, environmental matters, and fluctuations in the U.S. dollar relative to dollar-denominated commodities in world markets. The Company believes that its competitors face the same or similar challenges.
In order to address the impact of rising input and other costs, the Company periodically reviews each item in its product portfolio to ascertain if price realization adjustments or other actions should be taken. These reviews include an evaluation of the risk factors relating to market place acceptance of such changes and their potential effect on future sales volumes. In addition, the estimated cost of packaging modifications associated with weight changes is evaluated. The Company also maintains ongoing cost reduction and productivity improvement programs under which cost savings initiatives are encouraged and progress monitored. The Company is not able to accurately predict the outcome of these cost savings initiatives and their effects on its future results.
20
Commodity future and foreign currency forward contracts
Commodity price risks relate to ingredients, primarily sugar, cocoa, chocolate, corn syrup, dextrose, soybean and edible oils, milk, whey and gum base ingredients. The Company believes its competitors face similar risks, and the industry has historically adjusted prices to compensate for adverse fluctuations in commodity costs. The Company, as well as competitors in the confectionery industry, has historically taken actions, including higher price realization to mitigate rising input costs for ingredients, energy, freight and delivery. Although management seeks to substantially recover cost increases over the long-term, there is risk that higher price realization cannot be fully passed on to customers and, to the extent they are passed on, they could adversely affect customer and consumer acceptance and resulting sales volume.
The Company utilizes commodity futures contracts and commodity options contracts, as well as annual supply agreements, to hedge and plan for anticipated purchases of certain ingredients, including sugar, in order to mitigate commodity cost fluctuation. The Company also may purchase forward foreign exchange contracts to hedge its costs of manufacturing certain products in Canada for sale and distribution in the United States, and periodically does so for purchases of equipment or raw materials from foreign suppliers. Such commodity futures, commodity options and currency forward contracts are cash flow hedges and are effective as hedges as defined by accounting guidance. The unrealized gains and losses on such contracts are deferred as a component of accumulated other comprehensive loss (or gain) and are recognized as a component of product cost of goods sold when the related inventory is sold.
The potential change in fair value of commodity and foreign currency derivative instruments held by the Company at December 31, 2015, assuming a 10% change in the underlying contract price, was $2,887. The analysis only includes commodity and foreign currency derivative instruments and, therefore, does not consider the offsetting effect of changes in the price of the underlying commodity or foreign currency. This amount is not significant compared with the net earnings and shareholders’ equity of the Company.
Interest rates
Interest rate risks primarily relate to the Company’s investments in marketable securities with maturities or auction dates of generally up to three years.
The majority of the Company’s investments, which are classified as available for sale, have historically been held until they mature, which limits the Company’s exposure to interest rate fluctuations. The accompanying chart summarizes the maturities of the Company’s investments in debt securities at December 31, 2015.
|
Less than 1 year |
|
$ |
42,140 |
|
1 – 2 years |
|
|
48,652 |
|
2 – 3 years |
|
|
42,953 |
|
Over 3 years |
|
|
741 |
|
Total |
|
$ |
134,486 |
The Company’s outstanding debt at December 31, 2015 and 2014 was $7,500 in an industrial revenue bond in which interest rates reset each week based on the current market rate. Therefore, the Company does not believe that it has significant interest rate risk with respect to its interest bearing debt.
Investment in marketable securities
As stated above, the Company invests primarily in marketable securities with maturities or auction dates generally up to three years. The Company utilizes professional money managers and maintains investment policy guidelines which emphasize quality and liquidity in order to minimize the potential loss exposures that could result in the event of a default or other adverse event, including failed auctions. The Company continues to monitor these investments and markets, as well as its investment policies, however, the financial markets could experience unanticipated or unprecedented events as it did beginning in 2008, and future outcomes may be less predictable than in the past.
21
Equity price
Equity price risk relates to the Company’s investments in mutual funds which are principally used to fund and hedge the Company’s deferred compensation liabilities. At December 31, 2015, the Company has investments in mutual funds, classified as trading securities, of $60,584. Any change in the fair value of these trading securities is completely offset by a corresponding change in the respective hedged deferred compensation liability.
Foreign currency
Foreign currency risk principally relates to the Company’s foreign operations in Canada, Mexico and Spain, as well as periodic purchase commitments of machinery and equipment from foreign sources.
Certain of the Company’s Canadian manufacturing costs, including local payroll and plant operations, and a portion of its packaging and ingredients are sourced in Canadian dollars. The Company may purchase Canadian forward contracts to receive Canadian dollars at a specified date in the future and uses its Canadian dollar collections on Canadian sales as a partial hedge of its overall Canadian manufacturing obligations sourced in Canadian dollars. The Company also periodically purchases and holds Canadian dollars to facilitate the risk management of these currency changes.
From time to time, the Company may use foreign exchange forward contracts and derivative instruments to mitigate its exposure to foreign exchange risks, as well as those related to firm commitments to purchase equipment from foreign vendors. See Note 10 of the Company’s Notes to Consolidated Financial Statements for outstanding foreign exchange forward contracts as of December 31, 2015.
Open Contractual Commitments as of December 31, 2015:
|
|
|
|
|
|
Less than |
|
1 to 3 |
|
3 to 5 |
|
More than |
|
||||
|
Payable in |
|
Total |
|
1 Year |
|
Years |
|
Years |
|
5 Years |
|
|||||
|
Commodity hedges |
|
$ |
13,202 |
|
$ |
7,860 |
|
$ |
5,342 |
|
$ |
— |
|
$ |
— |
|
|
Foreign currency hedges |
|
|
15,668 |
|
|
13,311 |
|
|
2,357 |
|
|
— |
|
|
— |
|
|
Purchase obligations |
|
|
8,109 |
|
|
8,109 |
|
|
— |
|
|
— |
|
|
— |
|
|
Interest bearing debt |
|
|
7,500 |
|
|
— |
|
|
— |
|
|
— |
|
|
7,500 |
|
|
Operating leases |
|
|
1,441 |
|
|
818 |
|
|
362 |
|
|
117 |
|
|
144 |
|
|
Total |
|
$ |
45,920 |
|
$ |
30,098 |
|
$ |
8,061 |
|
$ |
117 |
|
$ |
7,644 |
|
Note: Commodity hedges and foreign currency hedges reflect the amounts at which the Company will settle the related contracts. The above amounts exclude deferred income tax liabilities of $47,616, liabilities for uncertain tax positions of $5,101, postretirement health care benefits of $11,400 and deferred compensation and other liabilities of $66,843 because the timing of payments relating to these items cannot be reasonably determined.
22
ITEM 7A. Quantitative and Qualitative Disclosures About Market Risk.
The information required by this item is included under the caption “Market Risk” in Item 7 above.
See also Note 1 of the Notes to Consolidated Financial Statements.
ITEM 8. Financial Statements and Supplementary Data.
Management’s Report on Internal Control Over Financial Reporting
The management of Tootsie Roll Industries, Inc. is responsible for establishing and maintaining adequate internal control over financial reporting, as such term is defined in the Securities Exchange Act of 1934 (SEC) Rule 13a-15(f). Company management conducted an evaluation of the effectiveness of the Company’s internal control over financial reporting as of December 31, 2015 as required by SEC Rule 13a-15(c). In making this assessment, the Company used the criteria established in Internal Control—Integrated Framework (2013) issued by the Committee of Sponsoring Organizations of the Treadway Commission (the COSO criteria). Based on the Company’s evaluation under the COSO criteria, Company management concluded that its internal control over financial reporting was effective as of December 31, 2015.
The effectiveness of the Company’s internal control over financial reporting as of December 31, 2015 has been audited by PricewaterhouseCoopers LLP, an independent registered public accounting firm, as stated in their report which is included herein.
23
Report of Independent Registered Public Accounting Firm
To the Board of Directors and Shareholders of Tootsie Roll Industries, Inc.:
In our opinion, the accompanying consolidated balance sheets and the related consolidated statements of earnings, comprehensive earnings and retained earnings, and of cash flows present fairly, in all material respects, the financial position of Tootsie Roll Industries, Inc. and its subsidiaries at December 31, 2015 and December 31, 2014, and the results of their operations and their cash flows for each of the three years in the period ended December 31, 2015 in conformity with accounting principles generally accepted in the United States of America. Also in our opinion, the Company maintained, in all material respects, effective internal control over financial reporting as of December 31, 2015, based on criteria established in Internal Control - Integrated Framework (2013) issued by the Committee of Sponsoring Organizations of the Treadway Commission (COSO). The Company's management is responsible for these financial statements, for maintaining effective internal control over financial reporting and for its assessment of the effectiveness of internal control over financial reporting, included in Management's Report on Internal Control over Financial Reporting. Our responsibility is to express opinions on these financial statements and on the Company's internal control over financial reporting based on our integrated audits. We conducted our audits in accordance with the standards of the Public Company Accounting Oversight Board (United States). Those standards require that we plan and perform the audits to obtain reasonable assurance about whether the financial statements are free of material misstatement and whether effective internal control over financial reporting was maintained in all material respects. Our audits of the financial statements included examining, on a test basis, evidence supporting the amounts and disclosures in the financial statements, assessing the accounting principles used and significant estimates made by management, and evaluating the overall financial statement presentation. Our audit of internal control over financial reporting included obtaining an understanding of internal control over financial reporting, assessing the risk that a material weakness exists, and testing and evaluating the design and operating effectiveness of internal control based on the assessed risk. Our audits also included performing such other procedures as we considered necessary in the circumstances. We believe that our audits provide a reasonable basis for our opinions.
A company’s internal control over financial reporting is a process designed to provide reasonable assurance regarding the reliability of financial reporting and the preparation of financial statements for external purposes in accordance with generally accepted accounting principles. A company’s internal control over financial reporting includes those policies and procedures that (i) pertain to the maintenance of records that, in reasonable detail, accurately and fairly reflect the transactions and dispositions of the assets of the company; (ii) provide reasonable assurance that transactions are recorded as necessary to permit preparation of financial statements in accordance with generally accepted accounting principles, and that receipts and expenditures of the company are being made only in accordance with authorizations of management and directors of the company; and (iii) provide reasonable assurance regarding prevention or timely detection of unauthorized acquisition, use, or disposition of the company’s assets that could have a material effect on the financial statements.
Because of its inherent limitations, internal control over financial reporting may not prevent or detect misstatements. Also, projections of any evaluation of effectiveness to future periods are subject to the risk that controls may become inadequate because of changes in conditions, or that the degree of compliance with the policies or procedures may deteriorate.
/s/PricewaterhouseCoopers LLP
Chicago, Illinois
February 26, 2016
24
CONSOLIDATED STATEMENTS OF
Earnings and Retained Earnings
|
TOOTSIE ROLL INDUSTRIES, INC. AND SUBSIDIARIES |
(in thousands except per share data) |
|
|
|
For the year ended December 31, |
|
|||||||
|
|
|
2015 |
|
2014 |
|
2013 |
|
|||
|
Net product sales |
|
$ |
536,692 |
|
$ |
539,895 |
|
$ |
539,627 |
|
|
Rental and royalty revenue |
|
|
3,420 |
|
|
3,630 |
|
|
3,756 |
|
|
Total revenue |
|
|
540,112 |
|
|
543,525 |
|
|
543,383 |
|
|
Product cost of goods sold |
|
|
340,090 |
|
|
340,933 |
|
|
350,960 |
|
|
Rental and royalty cost |
|
|
889 |
|
|
947 |
|
|
937 |
|
|
Total costs |
|
|
340,979 |
|
|
341,880 |
|
|
351,897 |
|
|
Product gross margin |
|
|
196,602 |
|
|
198,962 |
|
|
188,667 |
|
|
Rental and royalty gross margin |
|
|
2,531 |
|
|
2,683 |
|
|
2,819 |
|
|
Total gross margin |
|
|
199,133 |
|
|
201,645 |
|
|
191,486 |
|
|
Selling, marketing and administrative expenses |
|
|
108,051 |
|
|
117,722 |
|
|
119,133 |
|
|
Earnings from operations |
|
|
91,082 |
|
|
83,923 |
|
|
72,353 |
|
|
Other income, net |
|
|
1,496 |
|
|
7,371 |
|
|
12,130 |
|
|
Earnings before income taxes |
|
|
92,578 |
|
|
91,294 |
|
|
84,483 |
|
|
Provision for income taxes |
|
|
26,451 |
|
|
28,434 |
|
|
23,634 |
|
|
Net earnings |
|
|
66,127 |
|
|
62,860 |
|
|
60,849 |
|
|
Less: Net earnings (loss) attributable to noncontrolling interests |
|
|
38 |
|
|
(438) |
|
|
— |
|
|
Net earnings attributable to Tootsie Roll Industries, Inc. |
|
$ |
66,089 |
|
$ |
63,298 |
|
$ |
60,849 |
|
|
|
|
|
|
|
|
|
|
|
|
|
|
Net earnings attributable to Tootsie Roll Industries, Inc. per share |
|
$ |
1.08 |
|
$ |
1.02 |
|
$ |
0.96 |
|
|
Average number of shares outstanding |
|
|
61,441 |
|
|
62,358 |
|
|
63,195 |
|
|
|
|
|
|
|
|
|
|
|
|
|
|
Retained earnings at beginning of period |
|
$ |
64,927 |
|
$ |
73,109 |
|
$ |
80,210 |
|
|
Net earnings attributable to Tootsie Roll Industries, Inc. |
|
|
66,089 |
|
|
63,298 |
|
|
60,849 |
|
|
Cash dividends |
|
|
(21,308) |
|
|
(19,199) |
|
|
(18,922) |
|
|
Stock dividends |
|
|
(57,359) |
|
|
(52,281) |
|
|
(49,028) |
|
|
Retained earnings at end of period |
|
$ |
52,349 |
|
$ |
64,927 |
|
$ |
73,109 |
|
(The accompanying notes are an integral part of these statements.)
25
CONSOLIDATED STATEMENTS OF
Comprehensive Earnings
|
TOOTSIE ROLL INDUSTRIES, INC. AND SUBSIDIARIES |
(in thousands except per share data) |
|
|
|
|
|
|
|
|
|
|
|
|
|
|
|
For the year ended December 31, |
|
|||||||
|
|
|
2015 |
|
2014 |
|
2013 |
|
|||
|
Net earnings |
|
$ |
66,127 |
|
$ |
62,860 |
|
$ |
60,849 |
|
|
|
|
|
|
|
|
|
|
|
|
|
|
Other comprehensive income (loss), before tax: |
|
|
|
|
|
|
|
|
|
|
|
Foreign currency translation adjustments |
|
|
(4,145) |
|
|
(4,453) |
|
|
(102) |
|
|
|
|
|
|
|
|
|
|
|
|
|
|
Pension and postretirement reclassification adjustment: |
|
|
|
|
|
|
|
|
|
|
|
Unrealized gains (losses) for the period on postretirement and pension benefits |
|
|
1,446 |
|
|
(2,746) |
|
|
20,037 |
|
|
Less: reclassification adjustment for (gains) losses to net earnings |
|
|
(1,451) |
|
|
(1,804) |
|
|
671 |
|
|
Unrealized gains (losses) on postretirement and pension benefits |
|
|
(5) |
|
|
(4,550) |
|
|
20,708 |
|
|
|
|
|
|
|
|
|
|
|
|
|
|
Investments: |
|
|
|
|
|
|
|
|
|
|
|
Unrealized gains (losses) for the period on investments |
|
|
(428) |
|
|
(606) |
|
|
1,091 |
|
|
Less: reclassification adjustment for (gains) losses to net earnings |
|
|
— |
|
|
— |
|
|
(2,430) |
|
|
Unrealized gains (losses) on investments |
|
|
(428) |
|
|
(606) |
|
|
(1,339) |
|
|
|
|
|
|
|
|
|
|
|
|
|
|
Derivatives: |
|
|
|
|
|
|
|
|
|
|
|
Unrealized gains (losses) for the period on derivatives |
|
|
(3,814) |
|
|
(3,137) |
|
|
(2,107) |
|
|
Less: reclassification adjustment for (gains) losses to net earnings |
|
|
4,133 |
|
|
1,295 |
|
|
1,446 |
|
|
Unrealized gains (losses) on derivatives |
|
|
319 |
|
|
(1,842) |
|
|
(661) |
|
|
|
|
|
|
|
|
|
|
|
|
|
|
Total other comprehensive income (loss), before tax |
|
|
(4,259) |
|
|
(11,451) |
|
|
18,606 |
|
|
Income tax benefit (expense) related to items of other comprehensive income |
|
|
(7) |
|
|
2,991 |
|
|
(6,797) |
|
|
Total comprehensive earnings |
|
|
61,861 |
|
|
54,400 |
|
|
72,658 |
|
|
Comprehensive earnings (loss) attributable to noncontrolling interests |
|
|
38 |
|
|
(438) |
|
|
— |
|
|
Total comprehensive earnings attributable to Tootsie Roll Industries, Inc. |
|
$ |
61,899 |
|
$ |
53,962 |
|
$ |
72,658 |
|
(The accompanying notes are an integral part of these statements.)
26
|
CONSOLIDATED STATEMENTS OF |
|
|
Financial Position |
|
|
TOOTSIE ROLL INDUSTRIES, INC. AND SUBSIDIARIES |
(in thousands) |
Assets
|
|
|
December 31, |
|
||||
|
|
|
2015 |
|
2014 |
|
||
|
CURRENT ASSETS: |
|
|
|
|
|
|
|
|
Cash and cash equivalents |
|
$ |
126,145 |
|
$ |
100,108 |
|
|
Restricted cash |
|
|
395 |
|
|
— |
|
|
Investments |
|
|
42,155 |
|
|
39,450 |
|
|
Accounts receivable trade, less allowances of $2,225 and $1,968 |
|
|
51,010 |
|
|
43,253 |
|
|
Other receivables |
|
|
2,772 |
|
|
3,577 |
|
|
Inventories: |
|
|
|
|
|
|
|
|
Finished goods and work-in-process |
|
|
35,032 |
|
|
44,549 |
|
|
Raw materials and supplies |
|
|
27,231 |
|
|
25,830 |
|
|
Prepaid expenses |
|
|
5,935 |
|
|
6,060 |
|
|
Deferred income taxes |
|
|
3,131 |
|
|
1,794 |
|
|
Total current assets |
|
|
293,806 |
|
|
264,621 |
|
|
PROPERTY, PLANT AND EQUIPMENT, at cost: |
|
|
|
|
|
|
|
|
Land |
|
|
22,188 |
|
|
22,360 |
|
|
Buildings |
|
|
114,562 |
|
|
113,279 |
|
|
Machinery and equipment |
|
|
357,627 |
|
|
350,929 |
|
|
Construction in progress |
|
|
5,158 |
|
|
1,641 |
|
|
|
|
|
499,535 |
|
|
488,209 |
|
|
Less—Accumulated depreciation |
|
|
314,949 |
|
|
298,128 |
|
|
Net property, plant and equipment |
|
|
184,586 |
|
|
190,081 |
|
|
OTHER ASSETS: |
|
|
|
|
|
|
|
|
Goodwill |
|
|
73,237 |
|
|
73,237 |
|
|
Trademarks |
|
|
175,024 |
|
|
175,024 |
|
|
Investments |
|
|
152,930 |
|
|
163,579 |
|
|
Split dollar officer life insurance |
|
|
26,042 |
|
|
33,632 |
|
|
Prepaid expenses |
|
|
3,050 |
|
|
6,927 |
|
|
Restricted cash |
|
|
— |
|
|
1,589 |
|
|
Deferred income taxes |
|
|
308 |
|
|
1,696 |
|
|
Total other assets |
|
|
430,591 |
|
|
455,684 |
|
|
Total assets |
|
$ |
908,983 |
|
$ |
910,386 |
|
(The accompanying notes are an integral part of these statements.)
27
(in thousands except per share data)
Liabilities and Shareholders’ Equity
|
|
|
December 31, |
|
||||
|
|
|
2015 |
|
2014 |
|
||
|
CURRENT LIABILITIES: |
|
|
|
|
|
|
|
|
Accounts payable |
|
$ |
11,322 |
|
$ |
11,641 |
|
|
Bank loans |
|
|
231 |
|
|
124 |
|
|
Dividends payable |
|
|
5,486 |
|
|
4,814 |
|
|
Accrued liabilities |
|
|
50,117 |
|
|
46,482 |
|
|
Postretirement health care benefits |
|
|
448 |
|
|
328 |
|
|
Income taxes payable |
|
|
4,436 |
|
|
1,070 |
|
|
Deferred income taxes |
|
|
22 |
|
|
— |
|
|
Total current liabilities |
|
|
72,062 |
|
|
64,459 |
|
|
NONCURRENT LIABILITIES: |
|
|
|
|
|
|
|
|
Deferred income taxes |
|
|
47,594 |
|
|
47,356 |
|
|
Bank loans |
|
|
383 |
|
|
694 |
|
|
Postretirement health care benefits |
|
|
10,952 |
|
|
11,983 |
|
|
Industrial development bonds |
|
|
7,500 |
|
|
7,500 |
|
|
Liability for uncertain tax positions |
|
|
5,101 |
|
|
8,584 |
|
|
Deferred compensation and other liabilities |
|
|
66,843 |
|
|
78,674 |
|
|
Total noncurrent liabilities |
|
|
138,373 |
|
|
154,791 |
|
|
TOOTSIE ROLL INDUSTRIES, INC. SHAREHOLDERS’ EQUITY: |
|
|
|
|
|
|
|
|
Common stock, $.69-4/9 par value— 120,000 shares authorized— 37,382 and 37,285, respectively, issued |
|
|
25,960 |
|
|
25,892 |
|
|
Class B common stock, $.69-4/9 par value— 40,000 shares authorized— 23,542 and 22,887, respectively, issued |
|
|
16,348 |
|
|
15,894 |
|
|
Capital in excess of par value |
|
|
622,882 |
|
|
599,186 |
|
|
Retained earnings |
|
|
52,349 |
|
|
64,927 |
|
|
Accumulated other comprehensive loss |
|
|
(17,364) |
|
|
(13,098) |
|
|
Treasury stock (at cost)— 80 shares and 78 shares, respectively |
|
|
(1,992) |
|
|
(1,992) |
|
|
Total Tootsie Roll Industries, Inc. shareholders’ equity |
|
|
698,183 |
|
|
690,809 |
|
|
Noncontrolling interests |
|
|
365 |
|
|
327 |
|
|
Total equity |
|
|
698,548 |
|
|
691,136 |
|
|
Total liabilities and shareholders’ equity |
|
$ |
908,983 |
|
$ |
910,386 |
|
(The accompanying notes are an integral part of these statements.)
28
|
CONSOLIDATED STATEMENTS OF |
|
||||||||||
|
Cash Flows |
|
||||||||||
|
TOOTSIE ROLL INDUSTRIES, INC. AND SUBSIDIARIES |
(in thousands) |
||||||||||
|
|
|
For the year ended December 31, |
|
|||||||
|
|
|
2015 |
|
2014 |
|
2013 |
|
|||
|
CASH FLOWS FROM OPERATING ACTIVITIES: |
|
|
|
|
|
|
|
|
|
|
|
Net earnings |
|
$ |
66,127 |
|
$ |
62,860 |
|
$ |
60,849 |
|
|
Adjustments to reconcile net earnings to net cash provided by operating activities: |
|
|
|
|
|
|
|
|
|
|
|
Depreciation |
|
|
20,388 |
|
|
20,758 |
|
|
20,050 |
|
|
Deferred income taxes |
|
|
255 |
|
|
(946) |
|
|
6,558 |
|
|
Net loss on step acquisition |
|
|
— |
|
|
529 |
|
|
— |
|
|
Impairment of equity method investment |
|
|
— |
|
|
— |
|
|
975 |
|
|
Loss from equity method investment |
|
|
— |
|
|
— |
|
|
967 |
|
|
Amortization of marketable security premiums |
|
|
3,105 |
|
|
3,261 |
|
|
3,035 |
|
|
Changes in operating assets and liabilities: |
|
|
|
|
|
|
|
|
|
|
|
Accounts receivable |
|
|
(8,929) |
|
|
(2,007) |
|
|
1,330 |
|
|
Other receivables |
|
|
1,119 |
|
|
1,289 |
|
|
253 |
|
|
Inventories |
|
|
7,530 |
|
|
(7,329) |
|
|
503 |
|
|
Prepaid expenses and other assets |
|
|
11,593 |
|
|
9,524 |
|
|
14,922 |
|
|
Accounts payable and accrued liabilities |
|
|
3,839 |
|
|
(1,268) |
|
|
418 |
|
|
Income taxes payable |
|
|
(115) |
|
|
(78) |
|
|
(6,490) |
|
|
Postretirement health care benefits |
|
|
(903) |
|
|
(1,289) |
|
|
2,861 |
|
|
Deferred compensation and other liabilities |
|
|
(12,936) |
|
|
3,465 |
|
|
3,592 |
|
|
Net cash provided by operating activities |
|
|
91,073 |
|
|
88,769 |
|
|
109,823 |
|
|
CASH FLOWS FROM INVESTING ACTIVITIES: |
|
|
|
|
|
|
|
|
|
|
|
Net cash acquired in step acquisition |
|
|
— |
|
|
161 |
|
|
— |
|
|
Change in restricted cash |
|
|
1,149 |
|
|
224 |
|
|
— |
|
|
Capital expenditures |
|
|
(15,534) |
|
|
(10,704) |
|
|
(15,752) |
|
|
Purchases of trading securities |
|
|
(4,095) |
|
|
(4,294) |
|
|
(6,575) |
|
|
Sales of trading securities |
|
|
16,644 |
|
|
727 |
|
|
1,075 |
|
|
Purchase of available for sale securities |
|
|
(61,951) |
|
|
(54,882) |
|
|
(66,324) |
|
|
Sale and maturity of available for sale securities |
|
|
55,264 |
|
|
38,309 |
|
|
39,613 |
|
|
Net cash used in investing activities |
|
|
(8,523) |
|
|
(30,459) |
|
|
(47,963) |
|
|
CASH FLOWS FROM FINANCING ACTIVITIES: |
|
|
|
|
|
|
|
|
|
|
|
Shares purchased and retired |
|
|
(33,004) |
|
|
(25,020) |
|
|
(23,143) |
|
|
Dividends paid in cash |
|
|
(20,775) |
|
|
(19,241) |
|
|
(14,282) |
|
|
Repayment of bank loans |
|
|
(133) |
|
|
(403) |
|
|
— |
|
|
Net cash used in financing activities |
|
|
(53,912) |
|
|
(44,664) |
|
|
(37,425) |
|
|
|
|
|
|
|
|
|
|
|
|
|
|
Effect of exchange rate changes on cash |
|
|
(2,601) |
|
|
(1,821) |
|
|
(14) |
|
|
|
|
|
|
|
|
|
|
|
|
|
|
Increase (decrease) in cash and cash equivalents |
|
|
26,037 |
|
|
11,825 |
|
|
24,421 |
|
|
Cash and cash equivalents at beginning of year |
|
|
100,108 |
|
|
88,283 |
|
|
63,862 |
|
|
Cash and cash equivalents at end of year |
|
$ |
126,145 |
|
$ |
100,108 |
|
$ |
88,283 |
|
|
|
|
|
|
|
|
|
|
|
|
|
|
Supplemental cash flow information: |
|
|
|
|
|
|
|
|
|
|
|
Income taxes paid |
|
$ |
24,940 |
|
$ |
26,599 |
|
$ |
24,225 |
|
|
Interest paid |
|
$ |
17 |
|
$ |
34 |
|
$ |
21 |
|
|
Stock dividend issued |
|
$ |
57,220 |
|
$ |
52,165 |
|
$ |
48,925 |
|
(The accompanying notes are an integral part of these statements.)
29
Notes to Consolidated Financial Statements ($ in thousands except per share data)
TOOTSIE ROLL INDUSTRIES, INC. AND SUBSIDIARIES
NOTE 1—SIGNIFICANT ACCOUNTING POLICIES:
Basis of consolidation:
The consolidated financial statements include the accounts of Tootsie Roll Industries, Inc. and its wholly-owned and majority-owned subsidiaries (the Company), which are primarily engaged in the manufacture and sales of candy products. Non-controlling interests relating to majority-owned subsidiaries are reflected in the consolidated financial statements and all significant intercompany transactions have been eliminated. Certain amounts previously reported have been reclassified to conform to the current year presentation.
The preparation of financial statements in conformity with generally accepted accounting principles in the United States of America requires management to make estimates and assumptions that affect the reported amounts of assets and liabilities and disclosure of contingent assets and liabilities at the date of the financial statements and the reported amounts of revenues and expenses during the reporting period. Actual results could differ from those estimates.
Revenue recognition:
Products are sold to customers based on accepted purchase orders which include quantity, sales price and other relevant terms of sale. Revenue, net of applicable provisions for discounts, returns, allowances and certain advertising and promotional costs, is recognized when products are delivered to customers and collectability is reasonably assured. Shipping and handling costs of $42,619, $46,525, and $45,367 in 2015, 2014 and 2013, respectively, are included in selling, marketing and administrative expenses. Accounts receivable are unsecured.
Cash and cash equivalents:
The Company considers temporary cash investments with an original maturity of three months or less to be cash equivalents.
Investments:
Investments consist of various marketable securities with maturities of generally up to three years. The Company classifies debt and equity securities as either available for sale or trading. Available for sale securities are not actively traded by the Company and are carried at fair value. The Company follows current fair value measurement guidance and unrealized gains and losses on these securities are excluded from earnings and are reported as a separate component of shareholders’ equity, net of applicable taxes, until realized or other-than-temporarily impaired. Trading securities relate to deferred compensation arrangements and are carried at fair value with gains or losses included in other income, net. The Company invests in trading securities to economically hedge changes in its deferred compensation liabilities.
The Company regularly reviews its investments to determine whether a decline in fair value below the cost basis is other-than-temporary. If the decline in fair value is judged to be other-than-temporary, the cost basis of the security is written down to fair value and the amount of the write-down is included in other income, net. Further information regarding the fair value of the Company’s investments is included in Note 10 of the Company’s Notes to Consolidated Financial Statements.
Derivative instruments and hedging activities:
Authoritative guidance requires qualitative disclosures about objectives and strategies for using derivatives, quantitative disclosures about fair value amounts of derivative instruments and related gains and losses, and disclosures about credit-risk-related contingent features in derivative agreements.
30
From time to time, the Company enters into commodity futures, commodity options contracts and foreign currency forward contracts. Commodity futures and options are intended and are effective as hedges of market price risks associated with the anticipated purchase of certain raw materials (primarily sugar). Foreign currency forward contracts are intended and are effective as hedges of the Company’s exposure to the variability of cash flows, primarily related to the foreign exchange rate changes of products manufactured in Canada and sold in the United States, and periodic equipment purchases from foreign suppliers denominated in a foreign currency. The Company does not engage in trading or other speculative use of derivative instruments. Further information regarding derivative instruments and hedging activities is included in Note 11 of the Company’s Notes to Consolidated Financial Statements.
Inventories:
Inventories are stated at cost, not to exceed market. The cost of substantially all of the Company’s inventories ($58,413 and $65,545 at December 31, 2015 and 2014, respectively) has been determined by the last-in, first-out (LIFO) method. The excess of current cost over LIFO cost of inventories approximates $16,864 and $18,117 at December 31, 2015 and 2014, respectively. The cost of certain foreign inventories ($3,850 and $4,834 at December 31, 2015 and 2014, respectively) has been determined by the first-in, first-out (FIFO) method. Rebates, discounts and other cash consideration received from vendors related to inventory purchases is reflected as a reduction in the cost of the related inventory item, and is therefore reflected in cost of sales when the related inventory item is sold.
Property, plant and equipment:
Depreciation is computed for financial reporting purposes by use of the straight-line method based on useful lives of 20 to 35 years for buildings and 5 to 20 years for machinery and equipment. Depreciation expense was $20,388, $20,758 and $20,050 in 2015, 2014 and 2013, respectively.
Carrying value of long-lived assets:
The Company reviews long-lived assets to determine if there are events or circumstances indicating that the amount of the asset reflected in the Company’s balance sheet may not be recoverable. When such indicators are present, the Company compares the carrying value of the long-lived asset, or asset group, to the future undiscounted cash flows of the underlying assets to determine if impairment exists. If applicable, an impairment charge would be recorded to write down the carrying value to its fair value. The determination of fair value involves the use of estimates of future cash flows that involve considerable management judgment and are based upon assumptions about expected future operating performance. The actual cash flows could differ from management’s estimates due to changes in business conditions, operating performance, and economic conditions. No impairment charges of long-lived assets were recorded by the Company during 2015, 2014 and 2013.
Postretirement health care benefits:
The Company provides certain postretirement health care benefits to corporate office and management employees. The cost of these postretirement benefits is accrued during employees’ working careers. See Note 7 of the Company’s Notes to Consolidated Financial Statements for changes to these benefits and the resulting effects of the negative amendment, as defined by guidance. The Company also provides split dollar life benefits to certain executive officers. The Company records an asset equal to the cumulative insurance premiums paid that will be recovered upon the death of covered employees or earlier under the terms of the plan. No premiums were paid in 2015, 2014 and 2013. Certain split dollar agreements were terminated during 2015 and 2014 which resulted in the full repayment to the Company of all of the cumulative premiums previously paid on these policies. During 2015 and 2014, the Company received $7,591 and $6,496, respectively, of such repayments which were recorded as a reduction in the carrying value of Split Dollar Officer Life Insurance.
Goodwill and indefinite-lived intangible assets:
In accordance with authoritative guidance, goodwill and intangible assets with indefinite lives are not amortized, but rather tested for impairment at least annually unless certain interim triggering events or circumstances require more
31
frequent testing. All trademarks have been assessed by management to have indefinite lives because they are expected to generate cash flows indefinitely. Management believes that all assumptions used for the impairment tests are consistent with those utilized by market participants performing similar valuations. The Company has completed its annual impairment testing of its goodwill and trademarks at December 31 of each of the years presented. No impairments of intangibles, including goodwill were recorded in 2015, 2014 and 2013.
With respect to impairment testing of goodwill, the first step compares the reporting unit’s estimated fair value with its carrying value. Projected discounted cash flows are used to determine the fair value of the reporting unit. If the carrying value of a reporting unit’s net assets exceeds its fair value, the second step is applied to measure the difference between the carrying value and implied fair value of goodwill. If the carrying value of goodwill exceeds its implied fair value, the goodwill is considered impaired and reduced to its implied fair value. Non-amortizable intangible assets, trademarks, are tested for impairment by comparing the fair value of each trademark with its carrying value. The fair value of trademarks is determined using discounted cash flows and estimates of royalty rates. If the carrying value exceeds fair value, the trademark is considered impaired and is reduced to fair value.
Income taxes:
Deferred income taxes are recorded and recognized for future tax effects of temporary differences between financial and income tax reporting. The Company records valuation allowances in situations where the realization of deferred tax assets is not more-likely-than-not. Federal income taxes are provided on the portion of income of foreign subsidiaries that is expected to be remitted to the U.S. and become taxable, but not on the portion that is considered to be permanently reinvested in the foreign subsidiary.
Foreign currency translation:
The U.S. dollar is used as the functional currency where a substantial portion of the subsidiary’s business is indexed to the U.S. dollar or where its manufactured products are principally sold in the U.S. All other foreign subsidiaries use the local currency as their functional currency. Where the U.S. dollar is used as the functional currency, foreign currency remeasurements are recorded as a charge or credit to other income, net in the statement of earnings. Where the foreign local currency is used as the functional currency, translation adjustments are recorded as a separate component of accumulated other comprehensive income (loss).
Equity method investment and majority-owned subsidiaries:
The 2013 financial results include the Company’s 50% interest in two Spanish companies that was accounted for using the equity method. The Company recorded an increase in its investment to the extent of its share of earnings, and reduced its investment to the extent of losses and dividends received. No dividends were paid in 2013.
As of December 31, 2013 management determined that the carrying value of this equity method investment was impaired as a result of accumulated losses from operations and review of future expectations. The Company recorded a pre-tax impairment charge of $975 in 2013. The fair value was assessed primarily using the discounted cash flow method and liquidation valuation. The key inputs to this method include projections of future cash flows, determinations of appropriate discount rates, and other assumptions of the equity method investee which are considered reasonable and inherent in the discounted cash flow analysis. The Company’s carrying value of this investment at December 31, 2013 was not significant.
During first quarter 2014, the Company gained operating control of its two 50% owned Spanish companies when Company employee representatives assumed all positions on their boards of directors. This was considered a step acquisition, whereby the Company remeasured the previously held investment to fair value in first quarter 2014. As a result, the Company’s first quarter 2014 net earnings include a net loss of $529, including an additional income tax provision of $2,350 relating to deferred income taxes. During 2014, the Company further increased its control and ownership to 83% by subscribing to additional common shares of these Spanish subsidiaries for approximately $1,400 ($1,200 was paid in 2014, and the balance was paid in 2015). The accompanying consolidated financial statements for the
32
year ended December 31, 2015 and 2014 include these Spanish companies and related minority interests. These Spanish subsidiaries are not material to the Company’s consolidated financial statements.
Restricted cash:
Restricted cash comprises certain cash deposits of the Company’s majority-owned Spanish subsidiaries with international banks that are pledged as collateral for letters of credit and bank borrowings.
VEBA trust:
During fourth quarter 2014 and 2013, the Company contributed $1,000 and $15,000 to a VEBA trust, managed and controlled by the Company, to fund the estimated future costs of certain employee health, welfare and other benefits. No contributions were made during 2015. The Company is using these funds to pay the actual cost of such benefits through 2017. At December 31, 2015 and 2014, the VEBA trust held $6,727 and $10,845, respectively, of aggregate cash and cash equivalents. This asset value is included in prepaid expenses and long-term other assets in the Company’s Consolidated Statement of Financial Position. These assets are categorized as Level 1 within the fair value hierarchy.
Bank loans:
Long term bank loans comprise borrowings by the Company’s majority-owned Spanish subsidiaries which are held by international banks. The average weighted interest rate in 2015 was 2.4% and maturity dates range from 1 to 4 years. Short term bank loans also relate to the Company’s majority-owned Spanish subsidiaries.
Comprehensive earnings:
Comprehensive earnings includes net earnings, foreign currency translation adjustments and unrealized gains/losses on commodity and/or foreign currency hedging contracts, available for sale securities and certain postretirement benefit obligations.
Earnings per share:
A dual presentation of basic and diluted earnings per share is not required due to the lack of potentially dilutive securities under the Company’s simple capital structure. Therefore, all earnings per share amounts represent basic earnings per share.
The Class B common stock has essentially the same rights as common stock, except that each share of Class B common stock has ten votes per share (compared to one vote per share of common stock), is not traded on any exchange, is restricted as to transfer and is convertible on a share-for-share basis, at any time and at no cost to the holders, into shares of common stock which are traded on the New York Stock Exchange.
Use of estimates:
The preparation of consolidated financial statements in conformity with accounting principles generally accepted in the U.S. requires management to make estimates and assumptions that affect the amounts reported. Estimates are used when accounting for sales discounts, allowances and incentives, product liabilities, assets recorded at fair value, income taxes, depreciation, amortization, employee benefits, contingencies and intangible asset and liability valuations. Actual results may or may not differ from those estimates.
Recent accounting pronouncements:
In May 2014, the Financial Accounting Standards Board ("FASB") issued Accounting Standards Update ("ASU") 2014-09 that introduces a new five-step revenue recognition model in which an entity should recognize revenue to depict the transfer of promised goods or services to customers in an amount that reflects the consideration to which the entity expects to be entitled in exchange for those goods or services. This ASU also requires disclosures sufficient to enable users
33
to understand the nature, amount, timing, and uncertainty of revenue and cash flows arising from contracts with customers, including qualitative and quantitative disclosures about contracts with customers, significant judgments and changes in judgments, and assets recognized from the costs to obtain or fulfill a contract. This standard is effective for fiscal years beginning after December 15, 2017, including interim periods within that reporting period. The Company is currently evaluating the new guidance to determine the impact it may have on the consolidated financial statements.
In August 2014, the FASB issued ASU 2014-15 which provides guidance about management's responsibility to evaluate whether there is substantial doubt about an entity's ability to continue as a going concern and to provide related footnote disclosures. This guidance will be effective for the annual period ending after December 15, 2016, and for annual periods and interim periods thereafter. The Company does not expect the adoption of this guidance to have a significant impact on the consolidated financial statements.
In November 2015, the FASB issued ASU 2015-17 which requires that deferred tax liabilities and assets be classified as noncurrent in a classified statement of financial position. The current requirement that deferred tax liabilities and assets of a tax-paying component of an entity be offset and presented as a single amount is not affected by the amendments in the standard. This standard is effective for fiscal years, and interim periods within those years, beginning after December 15, 2016. Early adoption is permitted and the standard may be applied either retrospectively or on a prospective basis to all deferred tax assets and liabilities. The Company is currently evaluating the new guidance to determine the impact it may have on the consolidated financial statements.
In January 2016, the FASB issued ASU 2016-01 which modifies certain aspects of the recognition, measurement, presentation, and disclosure of financial instruments. This standard is effective for fiscal years, and interim periods within those years, beginning after December 15, 2017, and early adoption is permitted. The Company is currently evaluating the new guidance to determine the impact it may have on the consolidated financial statements.
NOTE 2—ACCRUED LIABILITIES:
Accrued liabilities are comprised of the following:
|
|
|
|
|
|
|
|
|
|
|
|
December 31, |
|
||||
|
|
|
2015 |
|
2014 |
|
||
|
Compensation |
|
$ |
9,383 |
|
$ |
9,788 |
|
|
Other employee benefits |
|
|
7,440 |
|
|
7,185 |
|
|
Taxes, other than income |
|
|
2,716 |
|
|
3,284 |
|
|
Advertising and promotions |
|
|
22,453 |
|
|
19,805 |
|
|
Other |
|
|
8,125 |
|
|
6,420 |
|
|
|
|
$ |
50,117 |
|
$ |
46,482 |
|
NOTE 3—INDUSTRIAL DEVELOPMENT BONDS:
Industrial development bonds are due in 2027. The average floating interest rate, which is reset weekly, was 0.1% and 0.1% in 2015 and 2014, respectively. See Note 10 of the Company’s Notes to Consolidated Financial Statements for fair value disclosures.
NOTE 4—INCOME TAXES:
The domestic and foreign components of pretax income are as follows:
|
|
|
|
|
|
|
|
|
|
|
|
|
|
|
2015 |
|
2014 |
|
2013 |
|
|||
|
Domestic |
|
$ |
82,276 |
|
$ |
81,255 |
|
$ |
73,362 |
|
|
Foreign |
|
|
10,302 |
|
|
10,039 |
|
|
11,121 |
|
|
|
|
$ |
92,578 |
|
$ |
91,294 |
|
$ |
84,483 |
|
34
The provision for income taxes is comprised of the following:
|
|
|
|
|
|
|
|
|
|
|
|
|
|
|
2015 |
|
2014 |
|
2013 |
|
|||
|
Current: |
|
|
|
|
|
|
|
|
|
|
|
Federal |
|
$ |
26,259 |
|
$ |
25,173 |
|
$ |
16,192 |
|
|
Foreign |
|
|
(596) |
|
|
549 |
|
|
219 |
|
|
State |
|
|
785 |
|
|
1,538 |
|
|
891 |
|
|
|
|
|
26,448 |
|
|
27,260 |
|
|
17,302 |
|
|
Deferred: |
|
|
|
|
|
|
|
|
|
|
|
Federal |
|
|
(1,189) |
|
|
(172) |
|
|
4,286 |
|
|
Foreign |
|
|
2,106 |
|
|
2,032 |
|
|
1,823 |
|
|
State |
|
|
(914) |
|
|
(686) |
|
|
223 |
|
|
|
|
|
3 |
|
|
1,174 |
|
|
6,332 |
|
|
|
|
$ |
26,451 |
|
$ |
28,434 |
|
$ |
23,634 |
|
Significant components of the Company’s net deferred tax liability at year end were as follows:
|
|
|
December 31, |
|
||||
|
|
|
2015 |
|
2014 |
|
||
|
Deferred tax assets: |
|
|
|
|
|
|
|
|
Accrued customer promotions |
|
$ |
3,907 |
|
$ |
3,219 |
|
|
Deferred compensation |
|
|
23,842 |
|
|
28,099 |
|
|
Postretirement benefits |
|
|
4,543 |
|
|
4,895 |
|
|
Other accrued expenses |
|
|
8,324 |
|
|
7,660 |
|
|
Foreign subsidiary tax loss carry forward |
|
|
9,956 |
|
|
12,972 |
|
|
Tax credit carry forward |
|
|
2,319 |
|
|
1,530 |
|
|
|
|
|
52,891 |
|
|
58,375 |
|
|
Valuation allowance |
|
|
(2,077) |
|
|
(2,478) |
|
|
Total deferred tax assets |
|
$ |
50,814 |
|
$ |
55,897 |
|
|
Deferred tax liabilities: |
|
|
|
|
|
|
|
|
Depreciation |
|
$ |
29,062 |
|
$ |
31,520 |
|
|
Deductible goodwill and trademarks |
|
|
44,255 |
|
|
43,960 |
|
|
Accrued export company commissions |
|
|
5,897 |
|
|
5,555 |
|
|
Employee benefit plans |
|
|
2,403 |
|
|
3,907 |
|
|
Inventory reserves |
|
|
3,793 |
|
|
3,422 |
|
|
Prepaid insurance |
|
|
1,065 |
|
|
867 |
|
|
Unrealized capital gain |
|
|
362 |
|
|
2,364 |
|
|
Deferred gain on sale of real estate |
|
|
8,154 |
|
|
8,168 |
|
|
Total deferred tax liabilities |
|
$ |
94,991 |
|
$ |
99,763 |
|
|
Net deferred tax liability |
|
$ |
44,177 |
|
$ |
43,866 |
|
At December 31, 2015, the Company has $289 of benefits related to its Mexican and Canadian subsidiaries tax credit carry-forwards. The carry-forward credits expire in 2017. A valuation allowance has been established for the carry-forward losses to reduce the future income tax benefits to amounts expected to be realized. The Company also has $2,030 of benefits related to state tax credit carry-forwards. The state credit carry-forward expires in 2021. The Company expects that these state credit carry-forwards will be utilized before their expiration.
At December 31, 2015, the tax benefits of the Company’s Canadian subsidiary tax loss carry-forwards expiring by year are as follows: $4,081 in 2028, $3,439 in 2029 and $602 in 2031. The Company expects that these carry-forwards will be realized before their expiration.
At December 31, 2015, the amounts of the Company’s Spanish subsidiary loss carry-forwards expiring by year are as follows: $273 in 2026, $58 in 2027, $200 in 2028, $99 in 2029, $306 in 2030, $399 in 2031, $288 in 2032 and $211 in
35
2033. A full valuation allowance has been provided for these Spanish loss carry-forwards as the Company expects that the losses will not be utilized before their expiration.
The effective income tax rate differs from the statutory rate as follows:
|
|
|
|
|
|
|
|
|
|
|
|
2015 |
|
2014 |
|
2013 |
|
|
U.S. statutory rate |
|
35.0 |
% |
35.0 |
% |
35.0 |
% |
|
State income taxes, net |
|
1.1 |
|
1.0 |
|
1.0 |
|
|
Exempt municipal bond interest |
|
(0.1) |
|
(0.5) |
|
(0.4) |
|
|
Foreign tax rates |
|
(1.3) |
|
(1.5) |
|
(2.0) |
|
|
Qualified domestic production activities deduction |
|
(2.6) |
|
(2.8) |
|
(2.2) |
|
|
Tax credits receivable |
|
(1.2) |
|
(0.6) |
|
(0.9) |
|
|
Adjustment of deferred tax balances |
|
0.2 |
|
1.9 |
|
(1.1) |
|
|
Reserve for uncertain tax benefits |
|
(2.1) |
|
— |
|
(0.7) |
|
|
Other, net |
|
(0.4) |
|
(1.4) |
|
(0.7) |
|
|
Effective income tax rate |
|
28.6 |
% |
31.1 |
% |
28.0 |
% |
The Company has not provided for U.S. federal or foreign withholding taxes on $3,529 and $5,393 of a foreign subsidiary undistributed earnings as of December 31, 2015 and December 31, 2014, respectively, because such earnings are considered to be permanently reinvested. The Company estimates that the federal income tax liability on such remittances would approximate 30%. This foreign subsidiary holds $15,265 and $15,986 of cash and short term investments as of December 31, 2015 and 2014, respectively.
At December 31, 2015 and 2014, the Company had unrecognized tax benefits of $4,680 and $6,993, respectively. Included in this balance is $2,737 and $4,805, respectively, of unrecognized tax benefits that, if recognized, would favorably affect the annual effective income tax rate. As of December 31, 2015 and 2014, $421 and $1,591, respectively, of interest and penalties were included in the liability for uncertain tax positions.
A reconciliation of the beginning and ending balances of the total amounts of unrecognized tax benefits is as follows:
|
|
|
|
|
|
|
|
|
|
|
|
|
|
|
2015 |
|
2014 |
|
2013 |
|
|||
|
Unrecognized tax benefits at January 1 |
|
$ |
6,993 |
|
$ |
6,010 |
|
$ |
6,677 |
|
|
Increases in tax positions for the current year |
|
|
812 |
|
|
1,827 |
|
|
1,163 |
|
|
Increases in tax positions for new uncertain tax position |
|
|
— |
|
|
609 |
|
|
— |
|
|
Reductions in tax positions for lapse of statute of limitations |
|
|
(865) |
|
|
(1,050) |
|
|
(867) |
|
|
Reductions in tax positions relating to settlements with taxing authorities |
|
|
(772) |
|
|
(403) |
|
|
(140) |
|
|
Decreases in prior period unrecognized tax benefits |
|
|
(1,488) |
|
|
— |
|
|
— |
|
|
Reductions in tax positions for effective settlements |
|
|
— |
|
|
— |
|
|
(823) |
|
|
Unrecognized tax benefits at December 31 |
|
$ |
4,680 |
|
$ |
6,993 |
|
$ |
6,010 |
|
The Company recognizes interest and penalties related to unrecognized tax benefits in the provision for income taxes on the Consolidated Statements of Earnings and Retained Earnings.
The Company is subject to taxation in the U.S. and various state and foreign jurisdictions. The Company remains subject to examination by U.S. federal and state and foreign tax authorities for the years 2012 through 2014. With few exceptions, the Company is no longer subject to examinations by tax authorities for the years 2011 and prior.
The Company’s Canadian subsidiary is currently subject to examination by the Canada Revenue Agency for tax years 2005 and 2007. In addition, the Company is currently subject to various state tax examinations. Although the Company is unable to determine the ultimate outcome of the ongoing examinations, the Company believes that its liability for uncertain tax positions relating to these jurisdictions for such years is adequate.
36
NOTE 5—SHARE CAPITAL AND CAPITAL IN EXCESS OF PAR VALUE:
|
|
|
|
|
|
|
|
|
|
|
|
|
|
|
|
|
|
|
|
|
|
|
|
|
|
|
|
|
|
|
|
|
|
|
|
|
|
|
Capital in |
|
|
|
|
|
|
|
|
|
|
Class B |
|
|
|
|
|
|
Excess |
|
||||
|
|
|
Common Stock |
|
Common Stock |
|
Treasury Stock |
|
of Par |
|
||||||||||
|
|
|
Shares |
|
Amount |
|
Shares |
|
Amount |
|
Shares |
|
Amount |
|
Value |
|
||||
|
|
|
(000’s) |
|
|
|
|
(000’s) |
|
|
|
|
(000’s) |
|
|
|
|
|
|
|
|
Balance at January 1, 2013 |
|
36,649 |
|
$ |
25,450 |
|
21,627 |
|
$ |
15,018 |
|
73 |
|
$ |
(1,992) |
|
$ |
547,576 |
|
|
Issuance of 3% stock dividend |
|
1,095 |
|
|
761 |
|
648 |
|
|
450 |
|
3 |
|
|
— |
|
|
47,714 |
|
|
Conversion of Class B common shares to common shares |
|
19 |
|
|
13 |
|
(19) |
|
|
(13) |
|
— |
|
|
— |
|
|
— |
|
|
Purchase and retirement of common shares |
|
(752) |
|
|
(522) |
|
— |
|
|
— |
|
— |
|
|
— |
|
|
(22,621) |
|
|
Balance at December 31, 2013 |
|
37,011 |
|
|
25,702 |
|
22,256 |
|
|
15,455 |
|
76 |
|
|
(1,992) |
|
|
572,669 |
|
|
Issuance of 3% stock dividend |
|
1,099 |
|
|
763 |
|
667 |
|
|
464 |
|
2 |
|
|
— |
|
|
50,939 |
|
|
Conversion of Class B common shares to common shares |
|
36 |
|
|
25 |
|
(36) |
|
|
(25) |
|
— |
|
|
— |
|
|
— |
|
|
Purchase and retirement of common shares |
|
(861) |
|
|
(598) |
|
— |
|
|
— |
|
— |
|
|
— |
|
|
(24,422) |
|
|
Balance at December 31, 2014 |
|
37,285 |
|
|
25,892 |
|
22,887 |
|
|
15,894 |
|
78 |
|
|
(1,992) |
|
|
599,186 |
|
|
Issuance of 3% stock dividend |
|
1,112 |
|
|
773 |
|
687 |
|
|
476 |
|
2 |
|
|
— |
|
|
55,982 |
|
|
Conversion of Class B common shares to common shares |
|
32 |
|
|
22 |
|
(32) |
|
|
(22) |
|
— |
|
|
— |
|
|
— |
|
|
Purchase and retirement of common shares |
|
(1,047) |
|
|
(727) |
|
— |
|
|
— |
|
— |
|
|
— |
|
|
(32,286) |
|
|
Balance at December 31, 2015 |
|
37,382 |
|
$ |
25,960 |
|
23,542 |
|
$ |
16,348 |
|
80 |
|
$ |
(1,992) |
|
$ |
622,882 |
|
Average shares outstanding and all per share amounts included in the financial statements and notes thereto have been adjusted retroactively to reflect annual three percent stock dividends.
While the Company does not have a formal or publicly announced Company common stock purchase program, the Company’s board of directors periodically authorizes a dollar amount for such share purchases.
Based upon this policy, shares were purchased and retired as follows:
|
|
|
|
|
|
|
|
|
|
|
Total Number of Shares |
|
|
|
|
|
Year |
|
Purchased (000’s) |
|
Average Price Paid Per Share |
|
|
|
2015 |
|
1,047 |
|
$ |
31.47 |
|
|
2014 |
|
861 |
|
$ |
29.02 |
|
|
2013 |
|
752 |
|
$ |
30.73 |
|
NOTE 6—OTHER INCOME, NET:
Other income, net is comprised of the following:
|
|
|
|
|
|
|
|
|
|
|
|
|
|
|
2015 |
|
2014 |
|
2013 |
|
|||
|
Interest and dividend income |
|
$ |
1,421 |
|
$ |
1,582 |
|
$ |
1,445 |
|
|
Gains on trading securities relating to deferred compensation plans |
|
|
1,450 |
|
|
4,901 |
|
|
10,588 |
|
|
Interest expense |
|
|
(76) |
|
|
(99) |
|
|
(92) |
|
|
Pretax gain on step acquisition |
|
|
— |
|
|
1,821 |
|
|
— |
|
|
Impairment of equity investment |
|
|
— |
|
|
— |
|
|
(975) |
|
|
Equity method investment loss |
|
|
— |
|
|
— |
|
|
(967) |
|
|
Foreign exchange gains (losses) |
|
|
(1,427) |
|
|
(861) |
|
|
(790) |
|
|
Capital gains (losses) |
|
|
2 |
|
|
(219) |
|
|
2,576 |
|
|
Miscellaneous, net |
|
|
126 |
|
|
246 |
|
|
345 |
|
|
|
|
$ |
1,496 |
|
$ |
7,371 |
|
$ |
12,130 |
|
37
NOTE 7—EMPLOYEE BENEFIT PLANS:
Pension plans:
The Company sponsors defined contribution pension plans covering certain non-union employees with over one year of credited service. The Company’s policy is to fund pension costs accrued based on compensation levels. Total pension expense for 2015, 2014 and 2013 approximated $3,100, $3,134 and $3,211, respectively. The Company also maintains certain profit sharing and retirement savings-investment plans. Company contributions in 2015, 2014 and 2013 to these plans were $2,533, $2,374 and $2,347 respectively.
The Company also contributes to a multi-employer defined benefit pension plan for certain of its union employees under a collective bargaining agreement which is as follows:
Plan name: Bakery and Confectionery Union and Industry International Pension Fund
Employer Identification Number and plan number: 52-6118572, plan number 001
Funded Status as of the most recent year available: 65.11% funded as of January 1, 2014
The Company’s contributions to such plan: $2,574, $2,588 and $2,231 in 2015, 2014 and 2013, respectively
Plan status: Critical and declining as of December 31, 2014
Beginning in 2012, the Company received periodic notices from the Bakery, Confectionery, Tobacco Workers and Grain Millers International Union Pension Plan (Plan), a multi-employer defined benefit pension plan for certain Company union employees, that the Plan’s actuary certified the Plan to be in “critical status”, the “Red Zone”, as defined by the Pension Protection Act (PPA) and the Pension Benefit Guaranty Corporation (PBGC); and that a plan of rehabilitation was adopted by the trustees of the Plan in fourth quarter 2012. During second quarter 2015, the Company received new notices that the Plan is now in “critical and declining status”, as defined by the PPA and PBGC, for the plan year beginning January 1, 2015, and that the Plan is projected to have an accumulated funding deficiency for the 2017 through 2024 plan years. A designation of “critical and declining status” implies that the Plan is expected to become insolvent in the next 20 years.
The Company has been advised that its withdrawal liability would have been $61,000 and $56,400 if it had withdrawn from the Plan during 2015 and 2014, respectively. The increase from 2014 to 2015 principally reflects a higher share of the Plan’s unfunded vested benefits allocated to the Company. Should the Company actually withdraw from the Plan at a future date, a withdrawal liability, which could be higher than the above discussed amounts, could be payable to the Plan.
The Company’s existing labor contract with the local union commits the Company’s participation in this Plan through third quarter 2017. The rehabilitation plan, which continues, requires that employer contributions include 5% compounded annual surcharge increases each year for an unspecified period of time beginning January 2013 (in addition to the 5% interim surcharge initiated in June 2012) as well as certain plan benefit reductions. The Company’s pension expense for this Plan for 2015 and 2014 was $2,574 and $2,588, respectively. The aforementioned expense includes surcharge increases of $447 and $342 in 2015 and 2014, respectively, as required under the plan of rehabilitation.
The Company is currently unable to determine the ultimate outcome of the above discussed matter and therefore is unable to determine the effects on its consolidated financial statements, but the ultimate outcome or the effects of any modifications to the current rehabilitation plan could be material to its consolidated results of operations or cash flows in one or more future periods.
Deferred compensation:
The Company sponsors three deferred compensation plans for selected executives and other employees: (i) the Excess Benefit Plan, which restores retirement benefits lost due to IRS limitations on contributions to tax-qualified plans, (ii) the Supplemental Plan, which allows eligible employees to defer the receipt of eligible compensation until designated future
38
dates and (iii) the Career Achievement Plan, which provides a deferred annual incentive award to selected executives. Participants in these plans earn a return on amounts due them based on several investment options, which mirror returns on underlying investments (primarily mutual funds). The Company economically hedges its obligations under the plans by investing in the actual underlying investments. These investments are classified as trading securities and are carried at fair value. At December 31, 2015 and 2014, these investments totaled $60,584 and $71,682, respectively. All gains and losses and related investment income from these investments, which are recorded in other income, net, are equally offset by corresponding increases and decreases in the Company’s deferred compensation liabilities.
Postretirement health care benefit plans:
During fourth quarter 2013, the Company restructured and amended its post-retirement health benefits plan provided to corporate office and management employees. These changes resulted in a negative plan amendment, as defined by accounting guidance, resulting in a $10,425 reduction in the Company’s benefit obligation as of December 31, 2013. The plan changes generally limited future annual cost increases in health benefits to 3%, restricted this benefit to current employees with long-term service with the Company, eliminated the Company provided life insurance benefit and required retirees to pay the full cost of life insurance, and eliminated all post-retirement benefits for future employees effective April 1, 2014. Post-retirement benefits liabilities (as amended) were $11,400 and $12,311 at December 31, 2015 and 2014, respectively. The aforementioned decrease reflects actuarial gains relating to a 30 basis point increase in the discount rate (4.13% discount rate used at December 31, 2015) which generally reflects higher market interest rates, and an update of the mortality table based on the Society of Actuaries’ research that indicates that retirees are living longer.
Amounts recognized in accumulated other comprehensive loss (pre-tax) at December 31, 2015 are as follows:
|
Prior service credit |
|
$ |
(8,098) |
|
Net actuarial gain |
|
|
(2,371) |
|
Net amount recognized in accumulated other comprehensive loss |
|
$ |
(10,469) |
The estimated actuarial gain and prior service credit to be amortized from accumulated other comprehensive loss into net periodic benefit income during 2016 are $291 and $1,352, respectively.
The changes in the accumulated postretirement benefit obligation at December 31, 2015 and 2014 consist of the following:
|
|
|
December 31, |
|
||||
|
|
|
2015 |
|
2014 |
|
||
|
Benefit obligation, beginning of year |
|
$ |
12,311 |
|
$ |
9,176 |
|
|
Service cost |
|
|
441 |
|
|
342 |
|
|
Interest cost |
|
|
465 |
|
|
423 |
|
|
Actuarial (gain)/loss |
|
|
(1,580) |
|
|
2,611 |
|
|
Benefits paid |
|
|
(237) |
|
|
(241) |
|
|
Benefit obligation, end of year |
|
$ |
11,400 |
|
$ |
12,311 |
|
Net periodic postretirement benefit cost (income) included the following components:
|
|
|
|
|
|
|
|
|
|
|
|
|
|
|
2015 |
|
2014 |
|
2013 |
|
|||
|
Service cost—benefits attributed to service during the period |
|
$ |
441 |
|
$ |
342 |
|
$ |
1,036 |
|
|
Interest cost on the accumulated postretirement benefit obligation |
|
|
465 |
|
|
423 |
|
|
1,060 |
|
|
Net amortization |
|
|
(1,451) |
|
|
(1,804) |
|
|
671 |
|
|
Net periodic postretirement benefit cost (income) |
|
$ |
(545) |
|
$ |
(1,039) |
|
$ |
2,767 |
|
39
The Company estimates future benefit payments will be $448, $415, $451, $495 and $539 in 2016 through 2020, respectively, and a total of $3,214 in 2021 through 2025. As a result of the plan changes, the Company no longer qualifies for the Medicare Part D retiree drugs subsidy which has historically not been significant.
NOTE 8—COMMITMENTS:
Rental expense aggregated $728, $749 and $793 in 2015, 2014 and 2013, respectively.
Future operating lease commitments are not significant.
NOTE 9—SEGMENT AND GEOGRAPHIC INFORMATION:
The Company operates as a single reportable segment encompassing the manufacture and sale of confectionery products. Its principal manufacturing operations are located in the United States and Canada, and its principal market is the United States. The Company also manufactures and sells confectionery products in Mexico, and exports products to Canada and other countries worldwide.
The following geographic data includes net product sales summarized on the basis of the customer location and long-lived assets based on their physical location:
|
|
|
|
|
|
|
|
|
|
|
|
|
|
|
2015 |
|
2014 |
|
2013 |
|
|||
|
Net product sales: |
|
|
|
|
|
|
|
|
|
|
|
United States |
|
$ |
492,450 |
|
$ |
488,795 |
|
$ |
495,082 |
|
|
Canada and Other |
|
|
44,242 |
|
|
51,100 |
|
|
44,545 |
|
|
|
|
$ |
536,692 |
|
$ |
539,895 |
|
$ |
539,627 |
|
|
Long-lived assets: |
|
|
|
|
|
|
|
|
|
|
|
United States |
|
$ |
149,144 |
|
$ |
153,444 |
|
$ |
160,099 |
|
|
Canada and Other |
|
|
35,442 |
|
|
36,637 |
|
|
36,817 |
|
|
|
|
$ |
184,586 |
|
$ |
190,081 |
|
$ |
196,916 |
|
Sales revenues from Wal-Mart Stores, Inc. aggregated approximately 23.7%, 23.7%, and 23.8% of net product sales during the years ended December 31, 2015, 2014 and 2013, respectively. Some of the aforementioned sales to Wal-Mart are sold to McLane Company, a large national grocery wholesaler, which services and delivers certain of the Company products to Wal-Mart and other retailers in the U.S.A. Net product sales revenues from McLane, which includes these Wal-Mart sales as well as sales and deliveries to other Company customers, were 16.7% in 2015 and 15.3% in 2014 and 15.1% in 2013.
NOTE 10—FAIR VALUE MEASUREMENTS:
Current accounting guidance defines fair value as the price that would be received in the sale of an asset or paid to transfer a liability in an orderly transaction between market participants at the measurement date. Guidance requires disclosure of the extent to which fair value is used to measure financial assets and liabilities, the inputs utilized in calculating valuation measurements, and the effect of the measurement of significant unobservable inputs on earnings, or changes in net assets, as of the measurement date. Guidance establishes a three-level valuation hierarchy based upon the transparency of inputs utilized in the measurement and valuation of financial assets or liabilities as of the measurement date. Level 1 inputs include quoted prices for identical instruments and are the most observable. Level 2 inputs include quoted prices for similar assets and observable inputs such as interest rates, foreign currency exchange rates, commodity rates and yield curves. Level 3 inputs are not observable in the market and include management’s own judgments about the assumptions market participants would use in pricing the asset or liability. The use of observable and unobservable inputs is reflected in the hierarchy assessment disclosed in the table below.
As of December 31, 2015 and 2014, the Company held certain financial assets that are required to be measured at fair value on a recurring basis. These include derivative hedging instruments related to the foreign currency forward contracts
40
and purchase of certain raw materials, investments in trading securities and available for sale securities. The Company’s available for sale and trading securities principally consist of municipal bonds and mutual funds that are publicly traded.
The following tables present information about the Company’s financial assets and liabilities measured at fair value as of December 31, 2015 and 2014, and indicate the fair value hierarchy and the valuation techniques utilized by the Company to determine such fair value:
|
|
|
|
|
|
|
|
|
|
|
|
|
|
|
|
|
|
Estimated Fair Value December 31, 2015 |
|
||||||||||
|
|
|
Total |
|
Input Levels Used |
|
||||||||
|
|
|
Fair Value |
|
Level 1 |
|
Level 2 |
|
Level 3 |
|
||||
|
Cash and equivalents |
|
$ |
126,145 |
|
$ |
126,145 |
|
$ |
— |
|
$ |
— |
|
|
Available for sale securities |
|
|
134,501 |
|
|
2,430 |
|
|
132,071 |
|
|
— |
|
|
Foreign currency forward contracts |
|
|
(2,626) |
|
|
— |
|
|
(2,626) |
|
|
— |
|
|
Commodity futures contracts, net |
|
|
271 |
|
|
271 |
|
|
— |
|
|
— |
|
|
Trading securities |
|
|
60,584 |
|
|
60,584 |
|
|
— |
|
|
— |
|
|
Total assets measured at fair value |
|
$ |
318,875 |
|
$ |
189,430 |
|
$ |
129,445 |
|
$ |
— |
|
|
|
|
|
|
|
|
|
|
|
|
|
|
|
|
|
|
|
Estimated Fair Value December 31, 2014 |
|
||||||||||
|
|
|
Total |
|
Input Levels Used |
|
||||||||
|
|
|
Fair Value |
|
Level 1 |
|
Level 2 |
|
Level 3 |
|
||||
|
Cash and equivalents |
|
$ |
100,108 |
|
$ |
100,108 |
|
$ |
— |
|
$ |
— |
|
|
Available for sale securities |
|
|
131,347 |
|
|
2,446 |
|
|
128,901 |
|
|
— |
|
|
Foreign currency forward contracts |
|
|
(1,939) |
|
|
— |
|
|
(1,939) |
|
|
— |
|
|
Commodity futures contracts, net |
|
|
(737) |
|
|
(737) |
|
|
— |
|
|
— |
|
|
Trading securities |
|
|
71,682 |
|
|
71,682 |
|
|
— |
|
|
— |
|
|
Total assets measured at fair value |
|
$ |
300,461 |
|
$ |
173,499 |
|
$ |
126,962 |
|
$ |
— |
|
Available for sale securities which utilize Level 2 inputs consist primarily of municipal and corporate bonds, which are valued based on quoted market prices or alternative pricing sources with reasonable levels of price transparency.
A summary of the aggregate fair value, gross unrealized gains, gross unrealized losses, realized losses and amortized cost basis of the Company’s investment portfolio by major security type is as follows:
|
|
|
|
|
|
|
|
|
|
|
|
|
|
|
|
|
|
|
|
|
December 31, 2015 |
|
|||||||||||||
|
|
|
Amortized |
|
Fair |
|
Unrealized |
|
Realized |
|
|||||||
|
Available for Sale: |
|
Cost |
|
Value |
|
Gains |
|
Losses |
|
Losses |
|
|||||
|
Municipal bonds |
|
$ |
34,021 |
|
$ |
33,977 |
|
$ |
— |
|
$ |
(44) |
|
$ |
— |
|
|
Corporate bonds |
|
|
95,286 |
|
|
94,403 |
|
|
— |
|
|
(883) |
|
|
— |
|
|
Government securities |
|
|
2,430 |
|
|
2,430 |
|
|
— |
|
|
— |
|
|
— |
|
|
Certificates of deposit |
|
|
3,692 |
|
|
3,676 |
|
|
— |
|
|
(16) |
|
|
— |
|
|
Mutual funds |
|
|
20 |
|
|
15 |
|
|
— |
|
|
(5) |
|
|
— |
|
|
|
|
$ |
135,449 |
|
$ |
134,501 |
|
$ |
— |
|
$ |
(948) |
|
$ |
— |
|
|
|
|
December 31, 2014 |
|
|||||||||||||
|
|
|
Amortized |
|
Fair |
|
Unrealized |
|
Realized |
|
|||||||
|
Available for Sale: |
|
Cost |
|
Value |
|
Gains |
|
Losses |
|
Losses |
|
|||||
|
Municipal bonds |
|
$ |
51,797 |
|
$ |
51,804 |
|
$ |
7 |
|
$ |
— |
|
$ |
— |
|
|
Corporate bonds |
|
|
72,587 |
|
|
72,075 |
|
|
— |
|
|
(512) |
|
|
— |
|
|
Government securities |
|
|
2,450 |
|
|
2,446 |
|
|
— |
|
|
(4) |
|
|
— |
|
|
Certificates of deposit |
|
|
5,014 |
|
|
5,007 |
|
|
— |
|
|
(7) |
|
|
— |
|
|
Mutual funds |
|
|
20 |
|
|
15 |
|
|
— |
|
|
(5) |
|
|
— |
|
|
|
|
$ |
131,868 |
|
$ |
131,347 |
|
$ |
7 |
|
$ |
(528) |
|
$ |
— |
|
The fair value of the Company’s industrial revenue development bonds at December 31, 2015 and 2014 were valued using Level 2 inputs which approximates the carrying value of $7,500 for both periods. Interest rates on these bonds reset weekly based on current market conditions.
41
NOTE 11—DERIVATIVE INSTRUMENTS AND HEDGING ACTIVITIES:
From time to time, the Company uses derivative instruments, including foreign currency forward contracts, commodity futures contracts and commodity option contracts, to manage its exposures to foreign exchange and commodity prices. Commodity futures contracts and most commodity option contracts are intended and effective as hedges of market price risks associated with the anticipated purchase of certain raw materials (primarily sugar). Foreign currency forward contracts are intended and effective as hedges of the Company’s exposure to the variability of cash flows, primarily related to the foreign exchange rate changes of products manufactured in Canada and sold in the United States, and periodic equipment purchases from foreign suppliers denominated in a foreign currency. The Company does not engage in trading or other speculative use of derivative instruments.
The Company recognizes all derivative instruments as either assets or liabilities at fair value in the Consolidated Statements of Financial Position. Derivative assets are recorded in other receivables and derivative liabilities are recorded in accrued liabilities. The Company uses either hedge accounting or mark-to-market accounting for its derivative instruments. Derivatives that qualify for hedge accounting are designated as cash flow hedges by formally documenting the hedge relationships, including identification of the hedging instruments, the hedged items and other critical terms, as well as the Company’s risk management objectives and strategies for undertaking the hedge transaction.
Changes in the fair value of the Company’s cash flow hedges are recorded in accumulated other comprehensive loss, net of tax, and are reclassified to earnings in the periods in which earnings are affected by the hedged item. Substantially all amounts reported in accumulated other comprehensive loss for commodity derivatives are expected to be reclassified to cost of goods sold. Substantially all amounts reported in accumulated other comprehensive loss for foreign currency derivatives are expected to be reclassified to other income, net.
The following table summarizes the Company’s outstanding derivative contracts and their effects on its Consolidated Statements of Financial Position at December 31, 2015 and 2014:
|
|
|
December 31, 2015 |
|
|||||||
|
|
|
Notional |
|
|
|
|
|
|
|
|
|
|
|
Amounts |
|
Assets |
|
Liabilities |
|
|||
|
Derivatives designated as hedging instruments: |
|
|
|
|
|
|
|
|
|
|
|
Foreign currency forward contracts |
|
$ |
15,668 |
|
$ |
— |
|
$ |
(2,626) |
|
|
Commodity futures contracts |
|
|
13,202 |
|
|
484 |
|
|
(213) |
|
|
Total derivatives |
|
|
|
|
$ |
484 |
|
$ |
(2,839) |
|
|
|
|
December 31, 2014 |
|
|||||||
|
|
|
Notional |
|
|
|
|
|
|
|
|
|
|
|
Amounts |
|
Assets |
|
Liabilities |
|
|||
|
Derivatives designated as hedging instruments: |
|
|
|
|
|
|
|
|
|
|
|
Foreign currency forward contracts |
|
$ |
27,603 |
|
$ |
— |
|
$ |
(1,939) |
|
|
Commodity futures contracts |
|
|
5,422 |
|
|
23 |
|
|
(760) |
|
|
Total derivatives |
|
|
|
|
$ |
23 |
|
$ |
(2,699) |
|
42
The effects of derivative instruments on the Company’s Consolidated Statement of Earnings, Comprehensive Earnings and Retained Earnings for years ended December 31, 2015 and 2014 are as follows:
|
|
|
|
|
|
|
|
|
|
|
|
|
|
|
For Year Ended December 31, 2015 |
|
|||||||
|
|
|
|
|
|
|
|
|
Gain (Loss) |
|
|
|
|
|
|
|
|
Gain (Loss) |
|
on Amount Excluded |
|
||
|
|
|
Gain (Loss) |
|
Reclassified from |
|
from Effectiveness |
|
|||
|
|
|
Recognized |
|
Accumulated OCI |
|
Testing Recognized |
|
|||
|
|
|
in OCI |
|
into Earnings |
|
in Earnings |
|
|||
|
Foreign currency forward contracts |
|
$ |
(3,199) |
|
$ |
(2,510) |
|
$ |
— |
|
|
Commodity futures contracts |
|
|
(615) |
|
|
(1,623) |
|
|
— |
|
|
Total |
|
$ |
(3,814) |
|
$ |
(4,133) |
|
$ |
— |
|
|
|
|
|
|
|
|
|
|
|
|
|
|
|
|
For Year Ended December 31, 2014 |
|
|||||||
|
|
|
|
|
|
|
|
|
Gain (Loss) |
|
|
|
|
|
|
|
|
Gain (Loss) |
|
on Amount Excluded |
|
||
|
|
|
Gain (Loss) |
|
Reclassified from |
|
from Effectiveness |
|
|||
|
|
|
Recognized |
|
Accumulated OCI |
|
Testing Recognized |
|
|||
|
|
|
in OCI |
|
into Earnings |
|
in Earnings |
|
|||
|
Foreign currency forward contracts |
|
$ |
(2,256) |
|
$ |
(1,001) |
|
$ |
— |
|
|
Commodity futures contracts |
|
|
(881) |
|
|
(294) |
|
|
— |
|
|
Total |
|
$ |
(3,137) |
|
$ |
(1,295) |
|
$ |
— |
|
NOTE 12—ACCUMULATED OTHER COMPREHENSIVE LOSS:
The following table sets forth information with respect to accumulated other comprehensive earnings (loss):
|
|
|
|
|
|
|
|
|
|
|
|
|
|
|
|
|
|
|
|
|
|
|
|
|
|
|
|
|
|
|
|
|
|
|
|
|
|
Accumulated |
|
|
|
|
Foreign |
|
|
|
Foreign |
|
|
|
Postretirement |
|
Other |
||||||
|
|
|
Currency |
|
|
|
Currency |
|
Commodity |
|
and Pension |
|
Comprehensive |
||||||
|
|
|
Translation |
|
Investments |
|
Derivatives |
|
Derivatives |
|
Benefits |
|
Earnings (Loss) |
||||||
|
Balance at December 31, 2013 |
|
$ |
(13,527) |
|
$ |
54 |
|
$ |
(436) |
|
$ |
(96) |
|
$ |
9,367 |
|
$ |
(4,638) |
|
Other comprehensive earnings (loss) before reclassifications |
|
|
(3,155) |
|
|
(386) |
|
|
(1,439) |
|
|
(562) |
|
|
(1,776) |
|
|
(7,318) |
|
Reclassifications from accumulated other comprehensive loss |
|
|
(817) |
|
|
— |
|
|
639 |
|
|
188 |
|
|
(1,152) |
|
|
(1,142) |
|
Other comprehensive earnings (loss) net of tax |
|
|
(3,972) |
|
|
(386) |
|
|
(800) |
|
|
(374) |
|
|
(2,928) |
|
|
(8,460) |
|
Balance at December 31, 2014 |
|
$ |
(17,499) |
|
$ |
(332) |
|
$ |
(1,236) |
|
$ |
(470) |
|
$ |
6,439 |
|
$ |
(13,098) |
|
Other comprehensive earnings (loss) before reclassifications |
|
|
(4,145) |
|
|
(273) |
|
|
(2,041) |
|
|
(392) |
|
|
874 |
|
|
(5,977) |
|
Reclassifications from accumulated other comprehensive loss |
|
|
— |
|
|
— |
|
|
1,602 |
|
|
1,035 |
|
|
(926) |
|
|
1,711 |
|
Other comprehensive earnings (loss) net of tax |
|
|
(4,145) |
|
|
(273) |
|
|
(439) |
|
|
643 |
|
|
(52) |
|
|
(4,266) |
|
Balance at December 31, 2015 |
|
$ |
(21,644) |
|
$ |
(605) |
|
$ |
(1,675) |
|
$ |
173 |
|
$ |
6,387 |
|
$ |
(17,364) |
43
The amounts reclassified from accumulated other comprehensive income (loss) consisted of the following:
|
|
|
|
|
|
|
|
|
|
|
|
Details about Accumulated Other |
|
Year to Date Ended |
|
|
|
||||
|
Comprehensive Income Components |
|
December 31, 2015 |
|
December 31, 2014 |
|
Location of (Gain) Loss Recognized in Earnings |
|
||
|
Foreign currency derivatives |
|
$ |
2,510 |
|
$ |
1,001 |
|
Other income, net |
|
|
Commodity derivatives |
|
|
1,623 |
|
|
294 |
|
Product cost of goods sold |
|
|
Foreign currency translation |
|
|
— |
|
|
(1,298) |
|
Other income, net |
|
|
Postretirement and pension benefits |
|
|
(740) |
|
|
(992) |
|
Selling, marketing and administrative expenses |
|
|
Postretirement and pension benefits |
|
|
(711) |
|
|
(812) |
|
Product cost of goods sold |
|
|
Total before tax |
|
|
2,682 |
|
|
(1,807) |
|
|
|
|
Tax expense (benefit) |
|
|
(971) |
|
|
665 |
|
|
|
|
Net of tax |
|
$ |
1,711 |
|
$ |
(1,142) |
|
|
|
NOTE 13—GOODWILL AND INTANGIBLE ASSETS:
All of the Company’s intangible indefinite-lived assets are trademarks.
The changes in the carrying amount of trademarks for 2015 and 2014 were as follows:
|
|
|
2015 |
|
2014 |
|
||
|
Original cost |
|
$ |
193,767 |
|
$ |
193,767 |
|
|
Accumulated impairment losses as of January 1 |
|
|
(18,743) |
|
|
(18,743) |
|
|
Balance at January 1 |
|
$ |
175,024 |
|
$ |
175,024 |
|
|
Current year impairment losses |
|
|
— |
|
|
— |
|
|
Balance at December 31 |
|
$ |
175,024 |
|
$ |
175,024 |
|
|
Accumulated impairment losses as of December 31 |
|
$ |
(18,743) |
|
$ |
(18,743) |
|
The fair value of indefinite-lived intangible assets was primarily assessed using the present value of estimated future cash flows and relief-from-royalty method.
The Company has no accumulated impairment losses of goodwill.
NOTE 14—QUARTERLY FINANCIAL DATA (UNAUDITED):
|
|
|
(Thousands of dollars except per share data) |
|
|||||||||||||
|
|
|
First |
|
Second |
|
Third |
|
Fourth |
|
Year |
|
|||||
|
2015 |
|
|
|
|
|
|
|
|
|
|
|
|
|
|
|
|
|
Net product sales |
|
$ |
105,477 |
|
$ |
107,528 |
|
$ |
183,806 |
|
$ |
139,881 |
|
$ |
536,692 |
|
|
Product gross margin |
|
|
38,332 |
|
|
38,795 |
|
|
66,760 |
|
|
52,715 |
|
|
196,602 |
|
|
Net earnings attributable to Tootsie Roll Industries, Inc. |
|
|
9,154 |
|
|
11,059 |
|
|
26,171 |
|
|
19,705 |
|
|
66,089 |
|
|
Net earnings attributable to Tootsie Roll Industries, Inc. per share |
|
|
0.15 |
|
|
0.18 |
|
|
0.43 |
|
|
0.32 |
|
|
1.08 |
|
|
|
|
|
|
|
|
|
|
|
|
|
|
|
|
|
|
|
|
2014 |
|
|
|
|
|
|
|
|
|
|
|
|
|
|
|
|
|
Net product sales |
|
$ |
106,812 |
|
$ |
104,061 |
|
$ |
191,093 |
|
$ |
137,929 |
|
$ |
539,895 |
|
|
Product gross margin |
|
|
39,947 |
|
|
37,879 |
|
|
67,929 |
|
|
53,207 |
|
|
198,962 |
|
|
Net earnings attributable to Tootsie Roll Industries, Inc. |
|
|
9,581 |
|
|
9,026 |
|
|
26,668 |
|
|
18,023 |
|
|
63,298 |
|
|
Net earnings attributable to Tootsie Roll Industries, Inc. per share |
|
|
0.15 |
|
|
0.14 |
|
|
0.43 |
|
|
0.29 |
|
|
1.02 |
|
Net earnings per share is based upon average outstanding shares as adjusted for 3% stock dividends issued during the second quarter of each year as discussed above. The sum of the quarterly per share amounts may not equal annual amounts due to rounding.
44
ITEM 9. Changes in and Disagreements with Accountants on Accounting and Financial Disclosure.
None.
ITEM 9A. Controls And Procedures.
Disclosure Controls and Procedures
The Company’s Chief Executive Officer and Chief Financial Officer have concluded, based on their evaluation as of the end of the period covered by this report, that the Company’s disclosure controls and procedures (as defined in Rule 13a-15(e) of the Securities Exchange Act of 1934, as amended (the “Exchange Act”) ) are effective to ensure that information required to be disclosed in the reports that the Company files or submits under the Exchange Act is (i) recorded, processed, summarized and reported within the time periods specified in the Securities and Exchange Commission’s rules and forms, and (ii) is accumulated and communicated to the Company’s management, including its Chief Executive Officer and Chief Financial Officer, as appropriate to allow timely decisions regarding required disclosure.
Internal Control over Financial Reporting
|
(a) |
See “Management’s Report on Internal Control Over Financial Reporting,” included in Item 8 “Financial Statements and Supplementary Data,” which is incorporated herein by reference. |
|
(b) |
See “Report of Independent Registered Public Accounting Firm” included in Item 8 “Financial Statements and Supplementary Data” for the attestation report of the Company’s independent registered public accounting firm, which is incorporated herein by reference. |
|
(c) |
There were no changes in the Company’s internal control over financial reporting during the quarter ended December 31, 2015 that have materially affected, or are reasonably likely to materially affect, the Company’s internal control over financial reporting. |
None
45
PART III
ITEM 10. Directors, Executive Officers and Corporate Governance.
See the information with respect to the Directors of the Company which is set forth in the section entitled “Election of Directors” of the 2016 Proxy Statement, which section of the 2016 Proxy Statement is incorporated herein by reference. See the information in the section entitled “Section 16(a) Beneficial Ownership Reporting Compliance” of the Company’s 2016 Proxy Statement, which section is incorporated herein by reference.
The following table sets forth the information with respect to the executive officers of the Company:
|
Name |
|
Position (1) |
|
Age |
|
|
|
|
|
|
|
Ellen R. Gordon* |
|
Chairman of the Board and Chief Executive Officer |
|
84 |
|
|
|
|
|
|
|
G. Howard Ember Jr. |
|
Vice President/Finance |
|
63 |
|
|
|
|
|
|
|
John W. Newlin Jr. |
|
Vice President/Manufacturing |
|
78 |
|
|
|
|
|
|
|
Thomas E. Corr |
|
Vice President/Marketing and Sales |
|
67 |
|
|
|
|
|
|
|
John P. Majors |
|
Vice President/Distribution |
|
54 |
|
|
|
|
|
|
|
Barry P. Bowen |
|
Treasurer |
|
60 |
* A member of the Board of Directors of the Company.
|
(1) |
All of the above named officers have served in the positions set forth in the table as their principal occupations for more than the past five years except for Mrs. Gordon who was appointed to her current position on January 20, 2015. Mrs. Gordon also serves as Vice President of HDI Investment Corp., a family investment company. |
Code of Ethics
The Company has a Code of Business Conduct and Ethics, which applies to all of the Company’s directors and employees, and which meets the Securities Exchange Commission criteria for a “code of ethics.” The Code of Business Conduct and Ethics is available on the Company’s website, located at www.tootsie.com, and the information in such is available in print to any shareholder who requests a copy.
ITEM 11. Executive Compensation.
See the information set forth in the sections entitled “Executive Compensation” and “Director Compensation” of the Company’s 2016 Proxy Statement, which are incorporated herein by reference.
ITEM 12. Security Ownership of Certain Beneficial Owners and Management and Related Stockholder Matters.
For information with respect to the beneficial ownership of the Company’s common stock and Class B common stock by the beneficial owners of more than 5% of said shares and by the management of the Company, see the sections entitled “Ownership of Common Stock and Class B Common Stock by Certain Beneficial Owners” and “Ownership of Common Stock and Class B Common Stock by Management” of the 2016 Proxy Statement. These sections of the 2016 Proxy Statement are incorporated herein by reference. The Company does not have any compensation plans under which equity securities of the Company are authorized for issuance.
46
ITEM 13. Certain Relationships and Related Transactions, and Director Independence.
See the section entitled “Related Person Transactions” of the 2016 Proxy Statement, which is incorporated herein by reference.
The Company’s board of directors has determined that its non-management directors, Mr. Seibert and Ms. Wardynski and Ms. Lewis-Brent, are independent under the New York Stock Exchange listing standards because they have no direct or indirect relationship with the Company other than through their service on the Board of Directors.
ITEM 14. Principal Accounting Fees and Services.
See the section entitled “Independent Auditor Fees and Services” of the 2016 Proxy Statement, which is incorporated herein by reference.
ITEM 15. Exhibits, Financial Statements Schedule.
|
|
|
|
(1) Financial Statements. |
|
|
|
|
|
The following financial statements and schedule are included in Item 8: |
|
|
|
|
|
Report of Independent Registered Public Accounting Firm |
|
|
|
|
|
Consolidated Statements of Earnings and Retained Earnings for each of the three years ended December 31, 2015, 2014 and 2013 |
|
|
|
|
|
Consolidated Statements of Comprehensive Earnings for each of the three years ended December 31, 2015, 2014 and 2013 |
|
|
|
|
|
Consolidated Statements of Financial Position at December 31, 2015 and 2014 |
|
|
|
|
|
Consolidated Statements of Cash Flows for each of the three years ended in the period December 31, 2015, 2014 and 2013 |
|
|
|
|
|
Notes to Consolidated Financial Statements |
|
|
|
|
|
|
|
|
|
|
|
(2) Financial Statement Schedules |
|
|
|
|
|
The financial statement schedule included in this Form 10-K is Schedule II - Valuation and Qualifying Accounts and Reserves for the Years Ended December 31, 2015, 2014 and 2013 (see Schedule II immediately following the signature page of this Form 10-K). |
|
|
|
|
|
|
|
|
|
|
|
(3) Exhibits required by Item 601 of Regulation S-K: |
|
|
|
|
|
See Index to Exhibits which appears following Financial Schedule II. |
|
47
SIGNATURES
Pursuant to the requirements of Section 13 or 15 (d) of the Securities Exchange Act of 1934, Tootsie Roll Industries, Inc., has duly caused this report to be signed on its behalf by the undersigned, thereunto duly authorized.
|
|
|
|
|
|
TOOTSIE ROLL INDUSTRIES, INC. |
|
|
|
|
|
|
|
|
|
|
|
By: |
Ellen R. Gordon |
|
|
|
Ellen R. Gordon, Chairman of the Board of Directors and Chief Executive Officer |
|
|
|
|
|
|
Date: |
February 26, 2016 |
Pursuant to the requirements of the Securities Exchange Act of 1934, this report has been signed below by the following persons on behalf of the registrant and in the capacities and on the dates indicated.
|
Ellen R. Gordon |
|
Chairman of the Board of Directors and Chief Executive Officer |
|
February 26, 2016 |
|
Ellen R. Gordon |
|
(principal executive officer) |
|
|
|
|
|
|
|
|
|
Paula M. Wardynski |
|
Director |
|
February 26, 2016 |
|
Paula M. Wardynski |
|
|
|
|
|
|
|
|
|
|
|
Lana Jane Lewis-Brent |
|
Director |
|
February 26, 2016 |
|
Lana Jane Lewis-Brent |
|
|
|
|
|
|
|
|
|
|
|
Barre A. Seibert |
|
Director |
|
February 26, 2016 |
|
Barre A. Seibert |
|
|
|
|
|
|
|
|
|
|
|
G. Howard Ember, Jr. |
|
Vice President, Finance |
|
February 26, 2016 |
|
G. Howard Ember, Jr. |
|
(principal financial officer and principal accounting officer) |
|
|
48
SCHEDULE II – VALUATION AND QUALIFYING ACCOUNTS (in thousands)
DECEMBER 31, 2015, 2014 AND 2013
|
|
|
|
|
|
Additions |
|
|
|
|
|
|
|
|
|
|
|
|
|
|
(reductions) |
|
|
|
|
|
|
|
|
|
|
|
Balance at |
|
charged |
|
|
|
|
Balance at |
|
|||
|
|
|
beginning |
|
(credited) to |
|
|
|
|
End of |
|
|||
|
Description |
|
of year |
|
expense |
|
Deductions(1) |
|
Year |
|
||||
|
|
|
|
|
|
|
|
|
|
|
|
|
|
|
|
2015: |
|
|
|
|
|
|
|
|
|
|
|
|
|
|
Reserve for bad debts |
|
$ |
1,300 |
|
$ |
267 |
|
$ |
157 |
|
$ |
1,410 |
|
|
Reserve for cash discounts |
|
|
668 |
|
|
9,678 |
|
|
9,531 |
|
|
815 |
|
|
Deferred tax asset valuation |
|
|
2,478 |
|
|
(401) |
|
|
— |
|
|
2,077 |
|
|
|
|
$ |
4,446 |
|
$ |
9,544 |
|
$ |
9,688 |
|
$ |
4,302 |
|
|
|
|
|
|
|
|
|
|
|
|
|
|
|
|
|
2014: |
|
|
|
|
|
|
|
|
|
|
|
|
|
|
Reserve for bad debts |
|
$ |
1,398 |
|
$ |
29 |
|
$ |
127 |
|
$ |
1,300 |
|
|
Reserve for cash discounts |
|
|
644 |
|
|
9,667 |
|
|
9,643 |
|
|
668 |
|
|
Deferred tax asset valuation |
|
|
957 |
|
|
1,521 |
|
|
— |
|
|
2,478 |
|
|
|
|
$ |
2,999 |
|
$ |
11,217 |
|
$ |
9,770 |
|
$ |
4,446 |
|
|
|
|
|
|
|
|
|
|
|
|
|
|
|
|
|
2013: |
|
|
|
|
|
|
|
|
|
|
|
|
|
|
Reserve for bad debts |
|
$ |
1,462 |
|
$ |
16 |
|
$ |
80 |
|
$ |
1,398 |
|
|
Reserve for cash discounts |
|
|
680 |
|
|
9,725 |
|
|
9,761 |
|
|
644 |
|
|
Deferred tax asset valuation |
|
|
2,040 |
|
|
(1,083) |
|
|
— |
|
|
957 |
|
|
|
|
$ |
4,182 |
|
$ |
8,658 |
|
$ |
9,841 |
|
$ |
2,999 |
|
|
(1) |
Deductions against reserve for bad debts consist of accounts receivable written off net of recoveries and exchange rate movements. Deductions against reserve for cash discounts consist of allowances to customers. |
49
INDEX TO EXHIBITS
|
|
|
|
|
|
3.1 |
|
Restated Articles of Incorporation. Incorporated by reference to Exhibit 3.1 of the Company’s Quarterly Report on Form 10-Q for the quarterly period ended June 30, 1997. |
|
|
|
|
|
|
|
3.2 |
|
Amendment to Restated Articles of Incorporation. Incorporated by reference to Exhibit 3.2 of the Company’s Annual Report on Form 10-K for the year ended December 31, 1999. |
|
|
|
|
|
|
|
3.3 |
|
Amended and Restated By-Laws. Incorporated by reference to Exhibit 3.2 of the Company’s Annual Report on Form 10-K for the year ended December 31, 1996. |
|
|
|
|
|
|
|
4.1 |
|
Specimen Class B Common Stock Certificate. Incorporated by reference to Exhibit 1.1 of the Company’s Registration Statement on Form 8-A dated February 29, 1988. |
|
|
|
|
|
|
|
10.1* |
|
Excess Benefit Plan. Incorporated by reference to Exhibit 10.8.1 of the Company’s Annual Report on Form 10-K for the year ended December 31, 1990. |
|
|
|
|
|
|
|
10.2* |
|
Amended and Restated Career Achievement Plan of the Company. Incorporated by reference to Exhibit 10.8.2 of the Company’s Annual Report on Form 10-K for the year ended December 31, 1998. |
|
|
|
|
|
|
|
10.3* |
|
Amendment to the Amended and Restated Career Achievement Plan of the Company. Incorporated by reference to Exhibit 10.8.3 of the Company’s Annual Report on Form 10-K for the year ended December 31, 1999. |
|
|
|
|
|
|
|
10.4* |
|
Restatement of Split Dollar Agreement (Special Trust) between the Company and the trustee of the Gordon Family 1993 Special Trust dated January 31, 1997. Incorporated by reference to Exhibit 10.12 of the Company’s Annual Report on Form 10-K for the year ended December 31, 1996. |
|
|
|
|
|
|
|
10.5* |
|
Form of Change In Control Agreement dated August, 1997 between the Company and certain executive officers. Incorporated by reference to Exhibit 10.25 of the Company’s Annual Report on Form 10-K for the year ended December 31, 1997. |
|
|
|
|
|
|
|
10.6* |
|
Amendment to Split Dollar Agreement (Special Trust) dated April 2, 1998 between the Company and the trustee of the Gordon Family 1993 Special Trust, together with related Collateral Assignments. Incorporated by reference to Exhibit 10.27 of the Company’s Annual Report on Form 10-K for the year ended December 31, 1998 |
|
|
|
|
|
|
|
10.7* |
|
Form of amendment to Change in Control Agreement between the Company and certain executive officers. Incorporated by reference to Exhibit 10.28 of the Company’s Annual Report on Form 10-K for the year ended December 31, 2008. |
|
|
|
|
|
|
|
10.8* |
|
Post 2004 Supplemental Savings Plan of the Company. Incorporated by reference to Exhibit 10.29 of the Company’s Annual Report on Form 10-K for the year ended December 31, 2008. |
|
|
|
|
|
|
|
10.9* |
|
Post 2004 Excess Benefit Plan of the Company. Incorporated by reference to Exhibit 10.30 of the Company’s Annual Report on Form 10-K for the year ended December 31, 2008. |
|
|
|
|
|
|
|
10.10* |
|
Amended and Restated Career Achievement Plan of the Company. Incorporated by reference to Exhibit 10.31 of the Company’s Annual Report on Form 10-K for the year ended December 31, 2008. |
|
|
|
|
|
|
|
10.11* |
|
Exhibit 10.1- Tootsie Roll Industries, Inc. Management Incentive Plan. Incorporated by reference to Appendix A to the Company’s definitive Proxy Statement filed with the Commission on March 24, 2006. |
|
|
|
|
|
|
|
10.12* |
|
Amendment 2015-1, to the Tootsie Roll Industries, Inc. Post 2004 Excess Benefit Plan |
|
|
|
|
|
|
|
10.13* |
|
Amendment 2015-1, to the Tootsie Roll Industries, Inc. Career Achievement Plan |
|
50
|
|
|
|
|
|
21 |
|
List of Subsidiaries of the Company. |
|
|
|
|
|
|
|
31.1 |
|
Certification of the Chief Executive Officer pursuant to Section 302 of the Sarbanes-Oxley Act of 2002. |
|
|
|
|
|
|
|
31.2 |
|
Certification of the Chief Financial Officer pursuant to Section 302 of the Sarbanes-Oxley Act of 2002. |
|
|
|
|
|
|
|
32 |
|
Certification pursuant to 18 U.S.C. Section 1350, as adopted pursuant to Section 906 of the Sarbanes-Oxley Act of 2002. |
|
|
|
|
|
|
|
101 |
|
The following financial statements and notes from Tootsie Roll Industries, Inc.’s Annual Report on Form 10-K for the year ended December 31, 2015, filed with the Securities and Exchange Commission on February 26, 2015, formatted in XBRL (eXtensible Business Reporting Language): (i) the Consolidated Statements of Earnings and Retained Earnings; (ii) Consolidated Statements of Comprehensive Earnings; (iii) Consolidated Statements of Financial Position; (iv) the Consolidated Statements of Cash Flows; and (v) the Notes to Consolidated Financial Statements. |
|
*Management compensation plan or arrangement.
51