Attached files
| file | filename |
|---|---|
| 8-K - 8-K - FTI CONSULTING, INC | d149599d8k.htm |
Exhibit 99.1
|
|

FTI Consulting, Inc.
Fourth Quarter and Fiscal 2015 Earnings Conference Call
|
|
Cautionary Note About Forward-Looking Statements
This presentation includes “forward-looking statements” within the meaning of Section 27A of the Securities Act of 1933, as amended, and Section 21E of the Securities Exchange Act of 1934, as amended, which involve uncertainties and risks. Forward-looking statements include statements concerning our plans, objectives, goals, strategies, future events, future revenues, future results and performance, expectations, plans or intentions relating to acquisitions and other matters, business trends and other information that is not historical, including statements regarding estimates of our medium-term growth targets or other future financial results. When used in this press release, words such as “anticipates,” “aspirational,” “estimates,” “expects,” “goals,” “intends,” “believes,” “forecasts,” “targets,” “objectives” and variations of such words or similar expressions are intended to identify forward-looking statements. All forward-looking statements, including, without limitation, estimates of our future financial results, are based upon our expectations at the time we make them and various assumptions. Our expectations, beliefs, projections and growth targets are expressed in good faith, and we believe there is a reasonable basis for them. However, there can be no assurance that management’s expectations, beliefs, estimates or growth targets will be achieved, and the Company’s actual results may differ materially from our expectations, beliefs, estimates and growth targets. The Company has experienced fluctuating revenues, operating income and cash flow in prior periods and expects that this will occur from time to time in the future. Other factors that could cause such differences include declines in demand for, or changes in, the mix of services and products that we offer, the mix of the geographic locations where our clients are located or where services are performed, adverse financial, real estate or other market and general economic conditions, which could impact each of our segments differently, the pace and timing of the consummation and integration of past and future acquisitions, the Company’s ability to realize cost savings and efficiencies, competitive and general economic conditions, retention of staff and clients and other risks described under the heading “Item 1A Risk Factors” in the Company’s most recent Form 10-K filed with the SEC and in the Company’s other filings with the SEC, including the risks set forth under “Risks Related to Our Reportable Segments” and “Risks Related to Our Operations.” We are under no duty to update any of the forward looking statements to conform such statements to actual results or events and do not intend to do so.
2
|
|

Today’s Speakers
Steven Gunby President & Chief Executive Officer
David Johnson Chief Financial Officer
Catherine Freeman SVP, Controller & Chief Accounting Officer
3
|
|
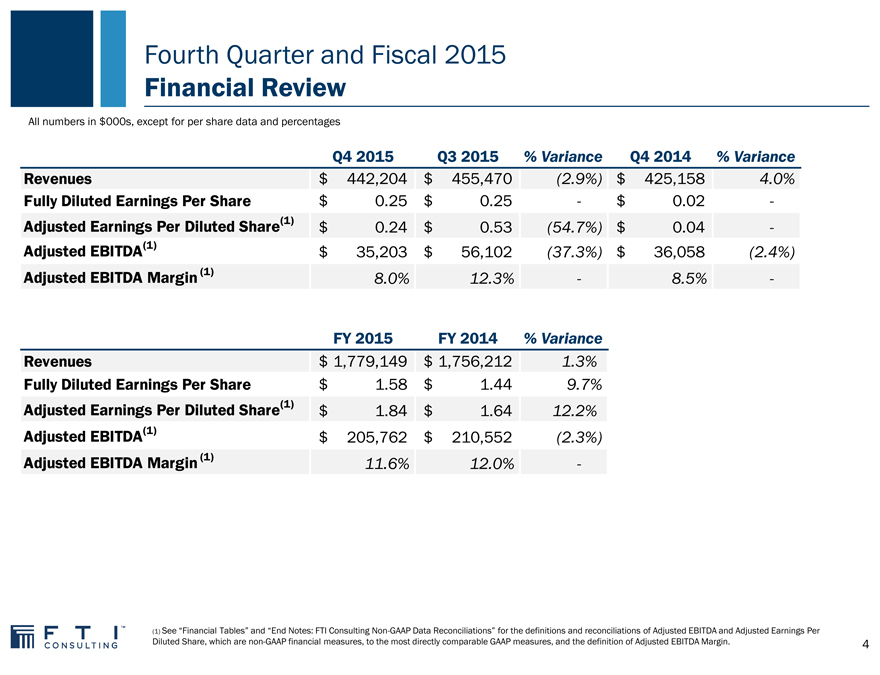
Fourth Quarter and Fiscal 2015
Financial Review
All numbers in $000s, except for per share data and percentages
Q4 2015 Q3 2015% Variance Q4 2014% Variance
Revenues $ 442,204 $ 455,470(2.9%) $ 425,158 4.0%
Fully Diluted Earnings Per Share $ 0.25 $ 0.25—$ 0.02 -
Adjusted Earnings Per Diluted Share(1) $ 0.24 $ 0.53(54.7%) $ 0.04 -
Adjusted EBITDA(1) $ 35,203 $ 56,102(37.3%) $ 36,058(2.4%)
Adjusted EBITDA Margin (1) 8.0% 12.3%—8.5% -
FY 2015 FY 2014% Variance
Revenues $ 1,779,149 $ 1,756,212 1.3%
Fully Diluted Earnings Per Share $ 1.58 $ 1.44 9.7%
Adjusted Earnings Per Diluted Share(1) $ 1.84 $ 1.64 12.2%
Adjusted EBITDA(1) $ 205,762 $ 210,552(2.3%)
Adjusted EBITDA Margin (1) 11.6% 12.0% -
(1) See “Financial Tables” and “End Notes: FTI Consulting Non-GAAP Data Reconciliations” for the definitions and reconciliations of Adjusted EBITDA and Adjusted Earnings Per Diluted Share, which are non-GAAP financial measures, to the most directly comparable GAAP measures, and the definition of Adjusted EBITDA Margin.
4
|
|
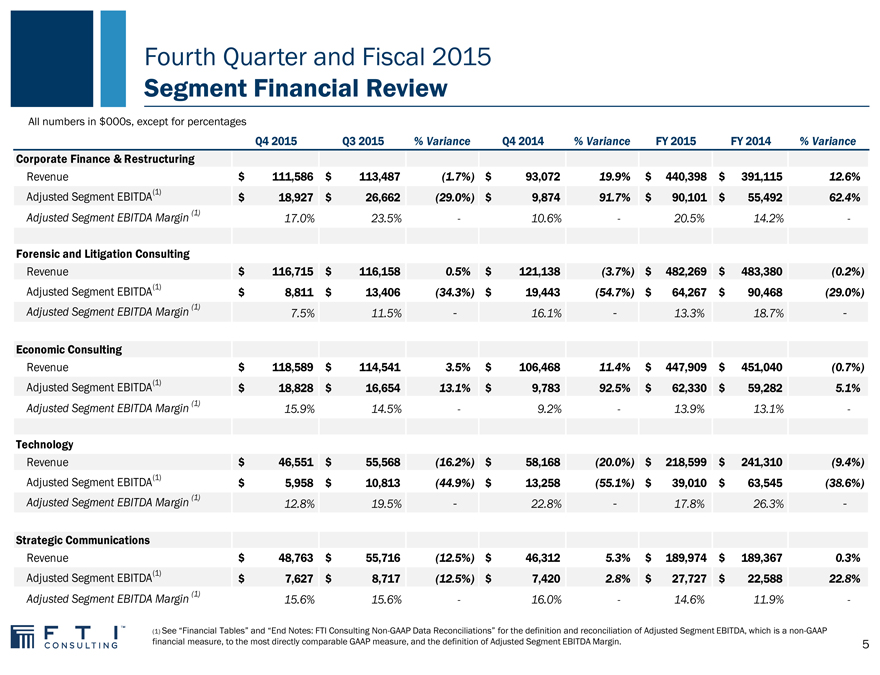
Fourth Quarter and Fiscal 2015
Segment Financial Review
All numbers in $000s, except for percentages
Q4 2015 Q3 2015% Variance Q4 2014% Variance FY 2015 FY 2014% Variance
Corporate Finance & Restructuring
Revenue $ 111,586 $ 113,487(1.7%) $ 93,072 19.9% $ 440,398 $ 391,115 12.6%
Adjusted Segment EBITDA(1) $ 18,927 $ 26,662(29.0%) $ 9,874 91.7% $ 90,101 $ 55,492 62.4%
Adjusted Segment EBITDA Margin (1) 17.0% 23.5%—10.6%—20.5% 14.2% -
Forensic and Litigation Consulting
Revenue $ 116,715 $ 116,158 0.5% $ 121,138(3.7%) $ 482,269 $ 483,380(0.2%)
Adjusted Segment EBITDA(1) $ 8,811 $ 13,406(34.3%) $ 19,443(54.7%) $ 64,267 $ 90,468(29.0%)
Adjusted Segment EBITDA Margin (1) 7.5% 11.5%—16.1%—13.3% 18.7% -
Economic Consulting
Revenue $ 118,589 $ 114,541 3.5% $ 106,468 11.4% $ 447,909 $ 451,040(0.7%)
Adjusted Segment EBITDA(1) $ 18,828 $ 16,654 13.1% $ 9,783 92.5% $ 62,330 $ 59,282 5.1%
Adjusted Segment EBITDA Margin (1) 15.9% 14.5%—9.2%—13.9% 13.1% -
Technology
Revenue $ 46,551 $ 55,568(16.2%) $ 58,168(20.0%) $ 218,599 $ 241,310(9.4%)
Adjusted Segment EBITDA(1) $ 5,958 $ 10,813(44.9%) $ 13,258(55.1%) $ 39,010 $ 63,545(38.6%)
Adjusted Segment EBITDA Margin (1) 12.8% 19.5%—22.8%—17.8% 26.3% -
Strategic Communications
Revenue $ 48,763 $ 55,716(12.5%) $ 46,312 5.3% $ 189,974 $ 189,367 0.3%
Adjusted Segment EBITDA(1) $ 7,627 $ 8,717(12.5%) $ 7,420 2.8% $ 27,727 $ 22,588 22.8%
Adjusted Segment EBITDA Margin (1) 15.6% 15.6%—16.0%—14.6% 11.9% -
(1) See “Financial Tables” and “End Notes: FTI Consulting Non-GAAP Data Reconciliations” for the definition and reconciliation of Adjusted Segment EBITDA, which is a non-GAAP financial measure, to the most directly comparable GAAP measure, and the definition of Adjusted Segment EBITDA Margin.
5
|
|
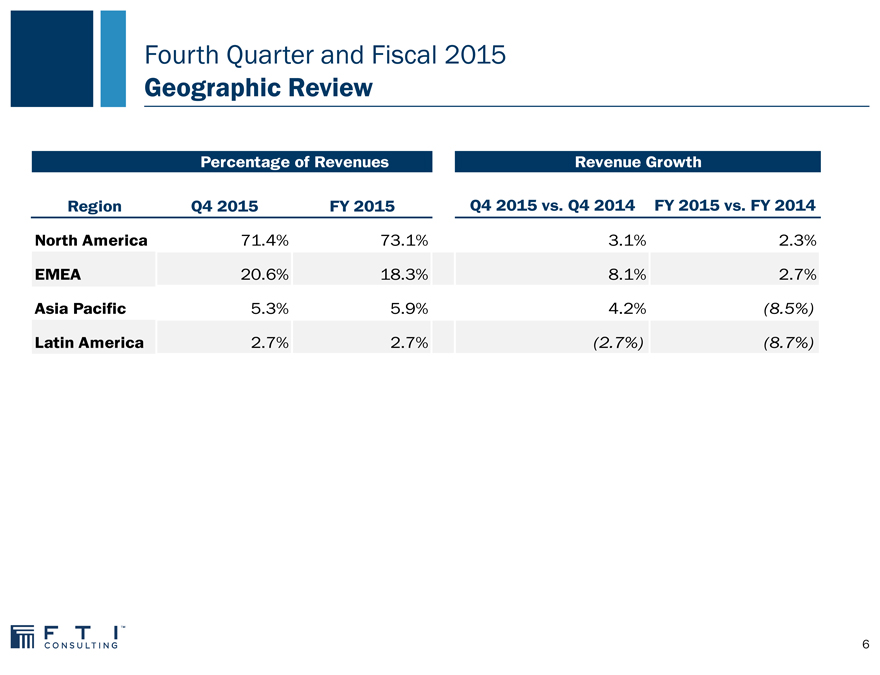
Fourth Quarter and Fiscal 2015
Geographic Review
Percentage of Revenues Revenue Growth
Region Q4 2015 FY 2015 Q4 2015 vs. Q4 2014 FY 2015 vs. FY 2014
North America 71.4% 73.1% 3.1% 2.3%
EMEA 20.6% 18.3% 8.1% 2.7%
Asia Pacific 5.3% 5.9% 4.2%(8.5%)
Latin America 2.7% 2.7%(2.7%)(8.7%)
6
|
|
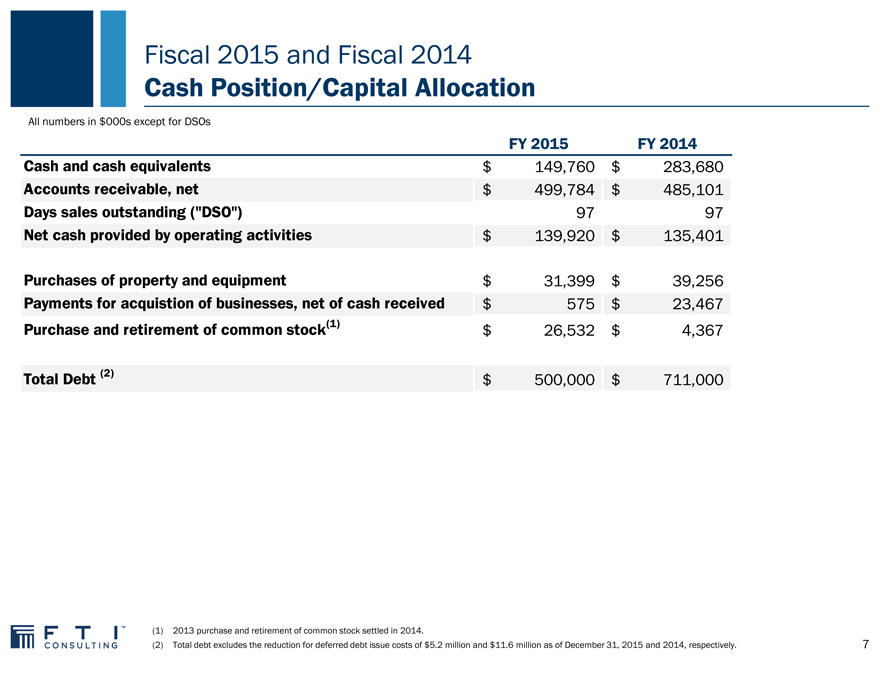
Fiscal 2015 and Fiscal 2014
Cash Position/Capital Allocation
All numbers in $000s except for DSOs
FY 2015 FY 2014
Cash and cash equivalents $ 149,760 $ 283,680
Accounts receivable, net $ 499,784 $ 485,101
Days sales outstanding (“DSO”) 97 97
Net cash provided by operating activities $ 139,920 $ 135,401
Purchases of property and equipment $ 31,399 $ 39,256
Payments for acquistion of businesses, net of cash received $ 575 $ 23,467
Purchase and retirement of common stock(1) $ 26,532 $ 4,367
Total Debt (2) $ 500,000 $ 711,000
(1) 2013 purchase and retirement of common stock settled in 2014.
(2) Total debt excludes the reduction for deferred debt issue costs of $5.2 million and $11.6 million as of December 31, 2015 and 2014, respectively.
7
|
|

Fourth Quarter and Fiscal 2015
Question & Answer Session
Q&A
8
|
|

Financial Tables
|
|
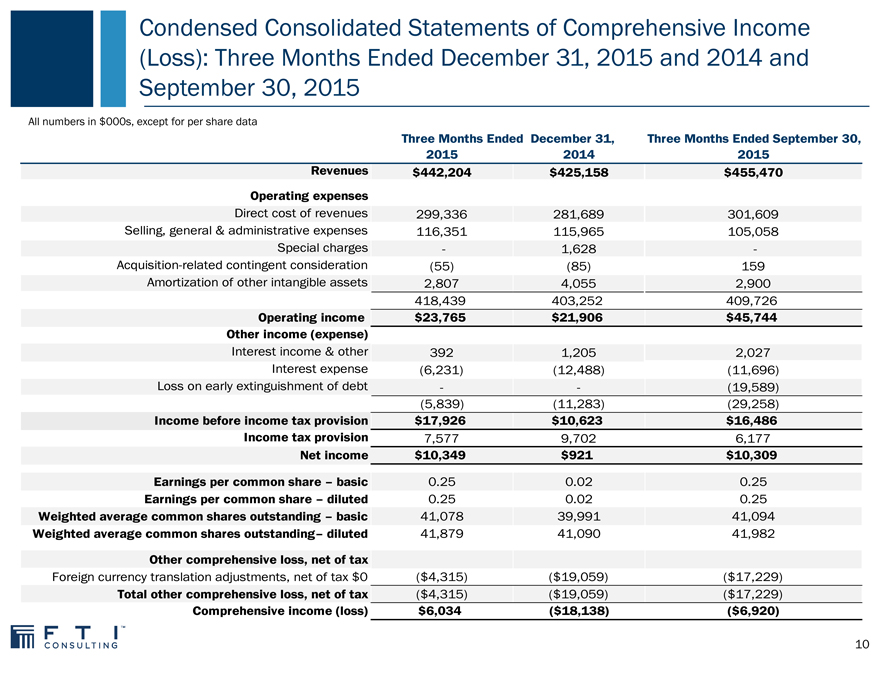
Condensed Consolidated Statements of Comprehensive Income (Loss): Three Months Ended December 31, 2015 and 2014 and September 30, 2015
All numbers in $000s, except for per share data
Three Months Ended December 31, Three Months Ended September 30,
2015 2014 2015
Revenues $442,204 $425,158 $455,470
Operating expenses
Direct cost of revenues 299,336 281,689 301,609
Selling, general & administrative expenses 116,351 115,965 105,058
Special charges—1,628 -
Acquisition-related contingent consideration(55)(85) 159
Amortization of other intangible assets 2,807 4,055 2,900
418,439 403,252 409,726
Operating income $23,765 $21,906 $45,744
Other income (expense)
Interest income & other 392 1,205 2,027
Interest expense(6,231)(12,488)(11,696)
Loss on early extinguishment of debt —(19,589)
(5,839)(11,283)(29,258)
Income before income tax provision $17,926 $10,623 $16,486
Income tax provision 7,577 9,702 6,177
Net income $10,349 $921 $10,309
Earnings per common share – basic 0.25 0.02 0.25
Earnings per common share – diluted 0.25 0.02 0.25
Weighted average common shares outstanding – basic 41,078 39,991 41,094
Weighted average common shares outstanding– diluted 41,879 41,090 41,982
Other comprehensive loss, net of tax
Foreign currency translation adjustments, net of tax $0($4,315)($19,059)($17,229)
Total other comprehensive loss, net of tax($4,315)($19,059)($17,229)
Comprehensive income (loss) $6,034($18,138)($6,920)
10
|
|
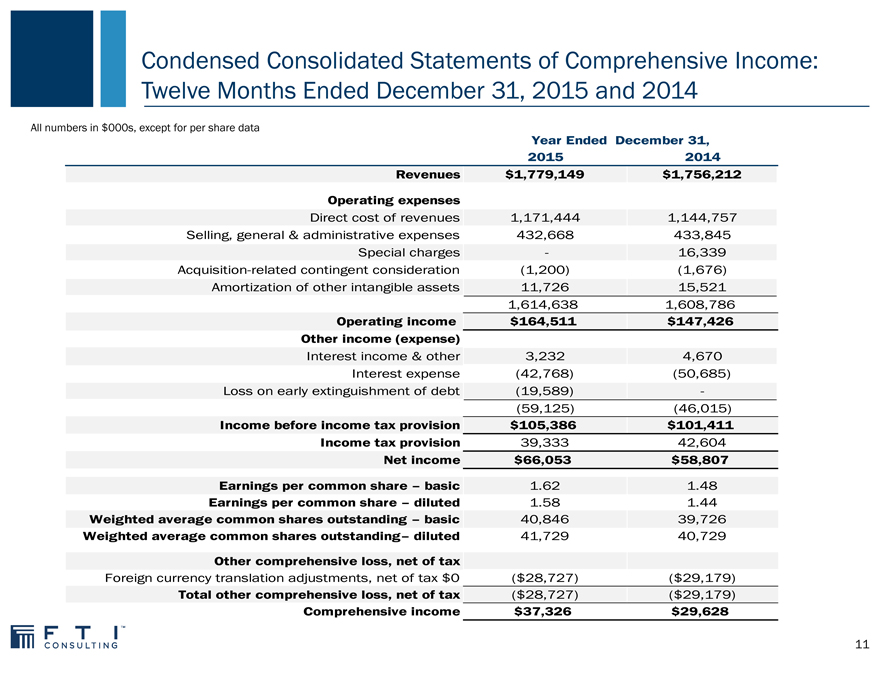
Condensed Consolidated Statements of Comprehensive Income: Twelve Months Ended December 31, 2015 and 2014
All numbers in $000s, except for per share data
Year Ended December 31,
2015 2014
Revenues $1,779,149 $1,756,212
Operating expenses
Direct cost of revenues 1,171,444 1,144,757
Selling, general & administrative expenses 432,668 433,845
Special charges—16,339
Acquisition-related contingent consideration(1,200)(1,676)
Amortization of other intangible assets 11,726 15,521
1,614,638 1,608,786
Operating income $164,511 $147,426
Other income (expense)
Interest income & other 3,232 4,670
Interest expense(42,768)(50,685)
Loss on early extinguishment of debt(19,589) -
(59,125)(46,015)
Income before income tax provision $105,386 $101,411
Income tax provision 39,333 42,604
Net income $66,053 $58,807
Earnings per common share – basic 1.62 1.48
Earnings per common share – diluted 1.58 1.44
Weighted average common shares outstanding – basic 40,846 39,726
Weighted average common shares outstanding– diluted 41,729 40,729
Other comprehensive loss, net of tax
Foreign currency translation adjustments, net of tax $0($28,727)($29,179)
Total other comprehensive loss, net of tax($28,727)($29,179)
Comprehensive income $37,326 $29,628
11
|
|
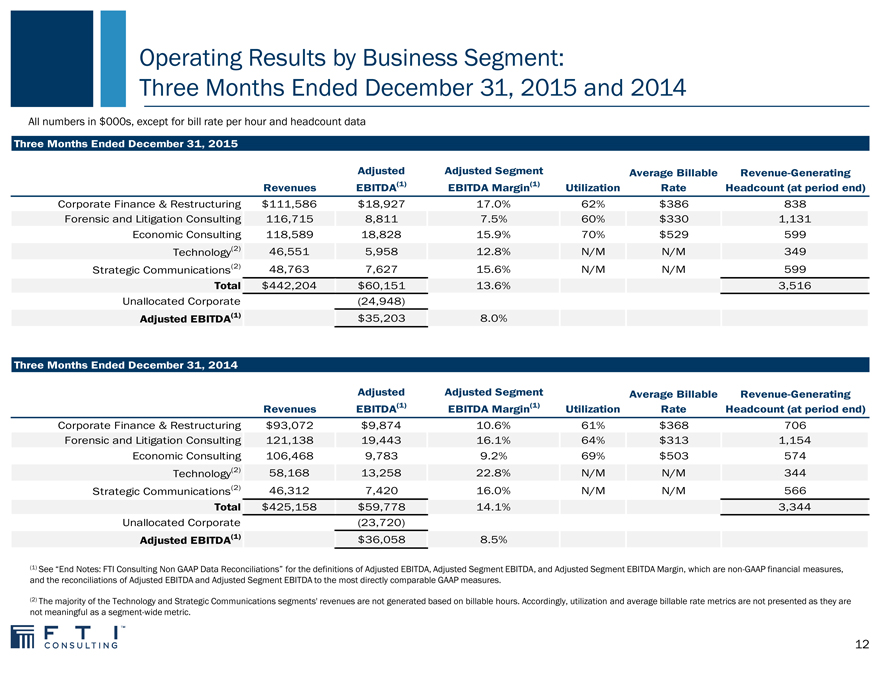
Operating Results by Business Segment:
Three Months Ended December 31, 2015 and 2014
All numbers in $000s, except for bill rate per hour and headcount data
Adjusted Adjusted Segment Average Billable Revenue-Generating
Revenues EBITDA(1) EBITDA Margin(1) Utilization Rate Headcount (at period end)
Corporate Finance & Restructuring $111,586 $18,927 17.0% 62% $386 838
Forensic and Litigation Consulting 116,715 8,811 7.5% 60% $330 1,131
Economic Consulting 118,589 18,828 15.9% 70% $529 599
Technology(2) 46,551 5,958 12.8% N/M N/M 349
Strategic Communications(2) 48,763 7,627 15.6% N/M N/M 599
Total $442,204 $60,151 13.6% 3,516
Unallocated Corporate(24,948)
Adjusted EBITDA(1) $35,203 8.0%
Three Months Ended December 31, 2014
Adjusted Adjusted Segment Average Billable Revenue-Generating
Revenues EBITDA(1) EBITDA Margin(1) Utilization Rate Headcount (at period end)
Corporate Finance & Restructuring $93,072 $9,874 10.6% 61% $368 706
Forensic and Litigation Consulting 121,138 19,443 16.1% 64% $313 1,154
Economic Consulting 106,468 9,783 9.2% 69% $503 574
Technology(2) 58,168 13,258 22.8% N/M N/M 344
Strategic Communications(2) 46,312 7,420 16.0% N/M N/M 566
Total $425,158 $59,778 14.1% 3,344
Unallocated Corporate(23,720)
Adjusted EBITDA(1) $36,058 8.5%
(1) See “End Notes: FTI Consulting Non GAAP Data Reconciliations” for the definitions of Adjusted EBITDA, Adjusted Segment EBITDA, and Adjusted Segment EBITDA Margin, which are non-GAAP financial measures, and the reconciliations of Adjusted EBITDA and Adjusted Segment EBITDA to the most directly comparable GAAP measures.
(2) The majority of the Technology and Strategic Communications segments’ revenues are not generated based on billable hours. Accordingly, utilization and average billable rate metrics are not presented as they are not meaningful as a segment-wide metric.
12
|
|
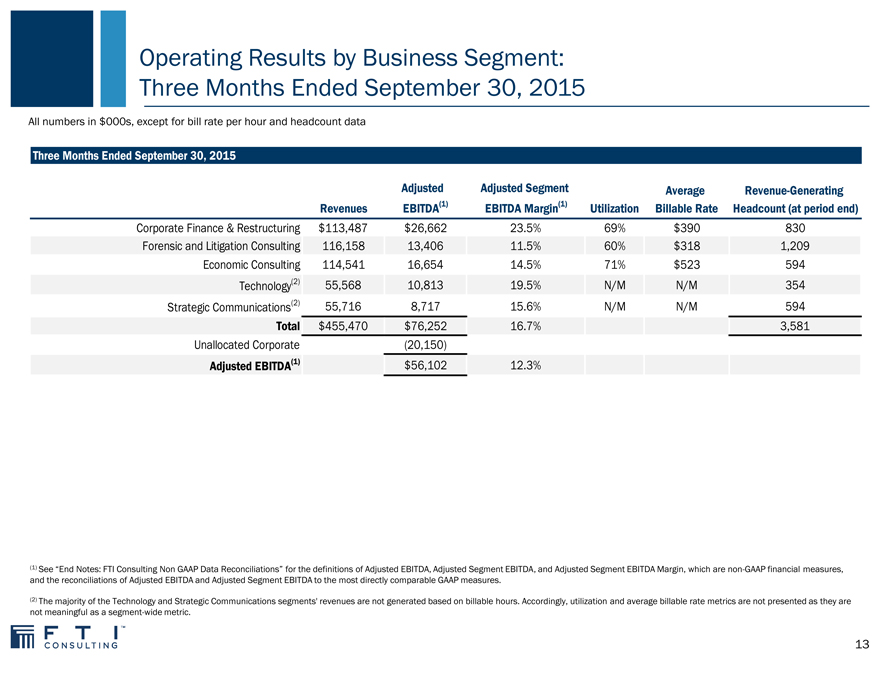
Operating Results by Business Segment: Three Months Ended September 30, 2015
All numbers in $000s, except for bill rate per hour and headcount data
Three Months Ended September 30, 2015
Adjusted Adjusted Segment Average Revenue-Generating
Revenues EBITDA(1) EBITDA Margin(1) Utilization Billable Rate Headcount (at period end)
Corporate Finance & Restructuring $113,487 $26,662 23.5% 69% $ 390 830
Forensic and Litigation Consulting 116,158 13,406 11.5% 60% $ 318 1,209
Economic Consulting 114,541 16,654 14.5% 71% $ 523 594
Technology(2) 55,568 10,813 19.5% N/M N/M 354
Strategic Communications(2) 55,716 8,717 15.6% N/M N/M 594
Total $455,470 $76,252 16.7% 3,581
Unallocated Corporate(20,150)
Adjusted EBITDA(1) $56,102 12.3%
(1) See “End Notes: FTI Consulting Non GAAP Data Reconciliations” for the definitions of Adjusted EBITDA, Adjusted Segment EBITDA, and Adjusted Segment EBITDA Margin, which are non-GAAP financial measures, and the reconciliations of Adjusted EBITDA and Adjusted Segment EBITDA to the most directly comparable GAAP measures.
(2) The majority of the Technology and Strategic Communications segments’ revenues are not generated based on billable hours. Accordingly, utilization and average billable rate metrics are not presented as they are not meaningful as a segment-wide metric.
13
|
|
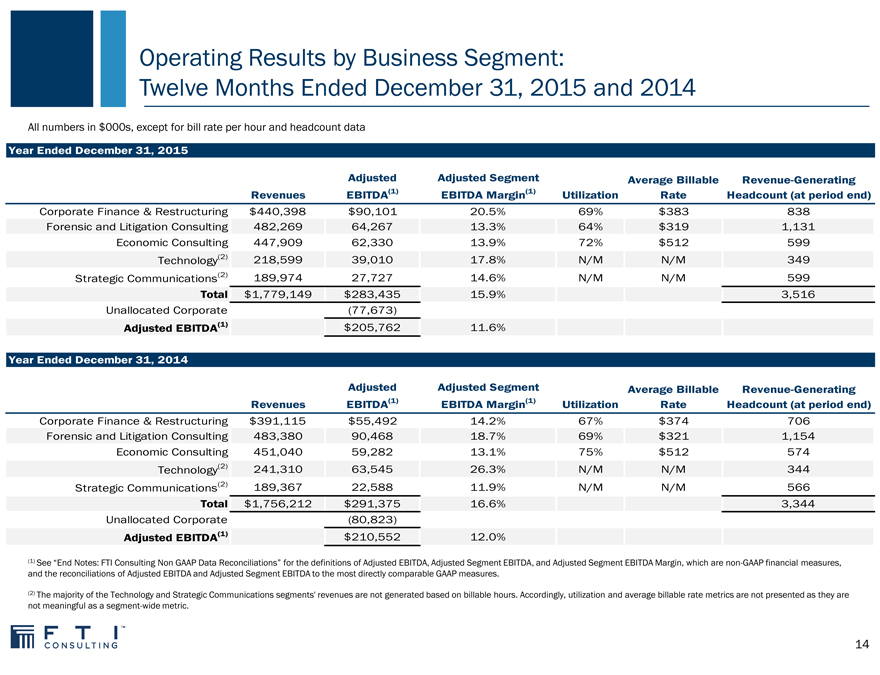
Operating Results by Business Segment:
Twelve Months Ended December 31, 2015 and 2014
All numbers in $000s, except for bill rate per hour and headcount data
Year Ended December 31, 2015
Adjusted Adjusted Segment Average Billable Revenue-Generating
Revenues EBITDA(1) EBITDA Margin(1) Utilization Rate Headcount (at period end)
Corporate Finance & Restructuring $440,398 $90,101 20.5% 69% $383 838
Forensic and Litigation Consulting 482,269 64,267 13.3% 64% $319 1,131
Economic Consulting 447,909 62,330 13.9% 72% $512 599
Technology(2) 218,599 39,010 17.8% N/M N/M 349
Strategic Communications(2) 189,974 27,727 14.6% N/M N/M 599
Total $1,779,149 $283,435 15.9% 3,516
Unallocated Corporate(77,673)
Adjusted EBITDA(1) $205,762 11.6%
Year Ended December 31, 2014
Adjusted Adjusted Segment Average Billable Revenue-Generating
Revenues EBITDA(1) EBITDA Margin(1) Utilization Rate Headcount (at period end)
Corporate Finance & Restructuring $391,115 $55,492 14.2% 67% $374 706
Forensic and Litigation Consulting 483,380 90,468 18.7% 69% $321 1,154
Economic Consulting 451,040 59,282 13.1% 75% $512 574
Technology(2) 241,310 63,545 26.3% N/M N/M 344
Strategic Communications(2) 189,367 22,588 11.9% N/M N/M 566
Total $1,756,212 $291,375 16.6% 3,344
Unallocated Corporate(80,823)
Adjusted EBITDA(1) $210,552 12.0%
(1) See “End Notes: FTI Consulting Non GAAP Data Reconciliations” for the definitions of Adjusted EBITDA, Adjusted Segment EBITDA, and Adjusted Segment EBITDA Margin, which are non-GAAP financial measures, and the reconciliations of Adjusted EBITDA and Adjusted Segment EBITDA to the most directly comparable GAAP measures.
(2) The majority of the Technology and Strategic Communications segments’ revenues are not generated based on billable hours. Accordingly, utilization and average billable rate metrics are not presented as they are not meaningful as a segment-wide metric.
14
|
|
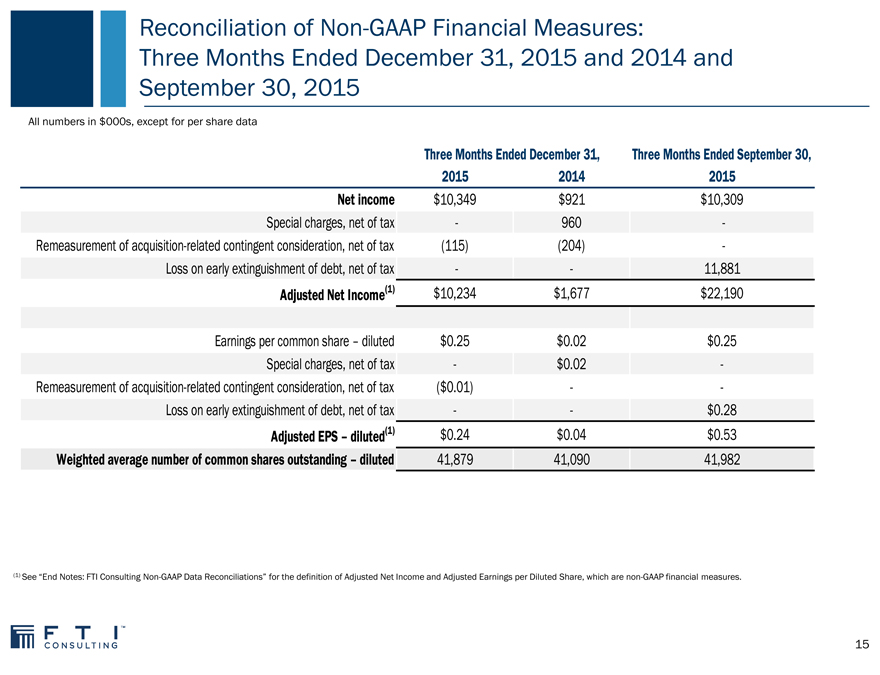
Reconciliation of Non-GAAP Financial Measures: Three Months Ended December 31, 2015 and 2014 and September 30, 2015
All numbers in $000s, except for per share data
Three Months Ended December 31, Three Months Ended September 30,
2015 2014 2015
Net income $10,349 $921 $10,309
Special charges, net of tax—960 -
Remeasurement of acquisition-related contingent consideration, net of tax(115)(204) -
Loss on early extinguishment of debt, net of tax — 11,881
Adjusted Net Income(1) $10,234 $1,677 $22,190
Earnings per common share – diluted $0.25 $0.02 $0.25
Special charges, net of tax—$0.02 -
Remeasurement of acquisition-related contingent consideration, net of tax($0.01) —
Loss on early extinguishment of debt, net of tax — $0.28
Adjusted EPS – diluted(1) $0.24 $0.04 $0.53
Weighted average number of common shares outstanding – diluted 41,879 41,090 41,982
(1) See “End Notes: FTI Consulting Non-GAAP Data Reconciliations” for the definition of Adjusted Net Income and Adjusted Earnings per Diluted Share, which are non-GAAP financial measures.
15
|
|
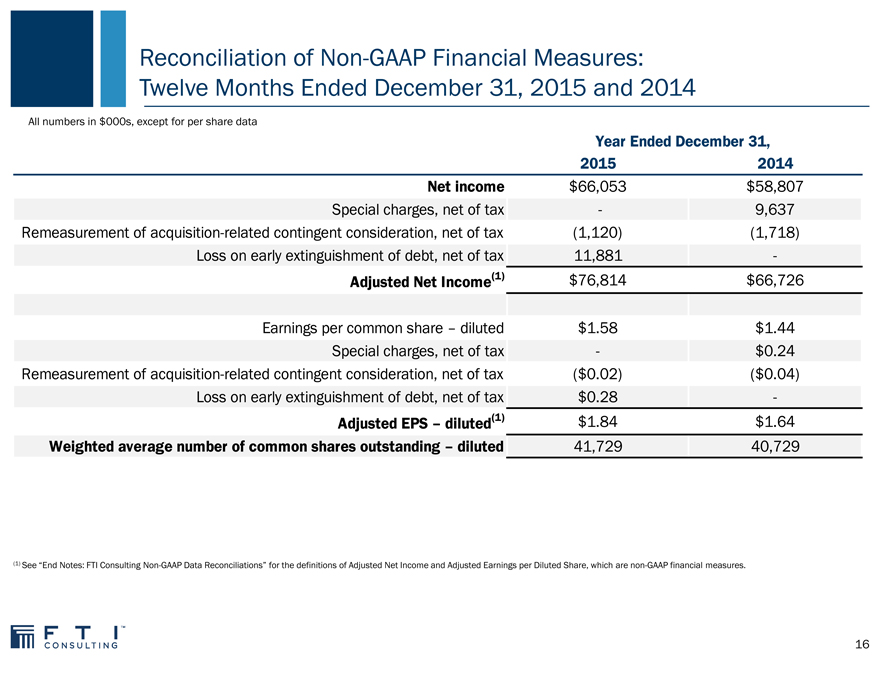
Reconciliation of Non-GAAP Financial Measures: Twelve Months Ended December 31, 2015 and 2014
All numbers in $000s, except for per share data
Year Ended December 31,
2015 2014
Net income $66,053 $58,807
Special charges, net of tax—9,637
Remeasurement of acquisition-related contingent consideration, net of tax(1,120)(1,718)
Loss on early extinguishment of debt, net of tax 11,881 -
Adjusted Net Income(1) $76,814 $66,726
Earnings per common share – diluted $1.58 $1.44
Special charges, net of tax—$0.24
Remeasurement of acquisition-related contingent consideration, net of tax($0.02)($0.04)
Loss on early extinguishment of debt, net of tax $0.28 -
Adjusted EPS – diluted(1) $1.84 $1.64
Weighted average number of common shares outstanding – diluted 41,729 40,729
(1) See “End Notes: FTI Consulting Non-GAAP Data Reconciliations” for the definitions of Adjusted Net Income and Adjusted Earnings per Diluted Share, which are non-GAAP financial measures.
16
|
|
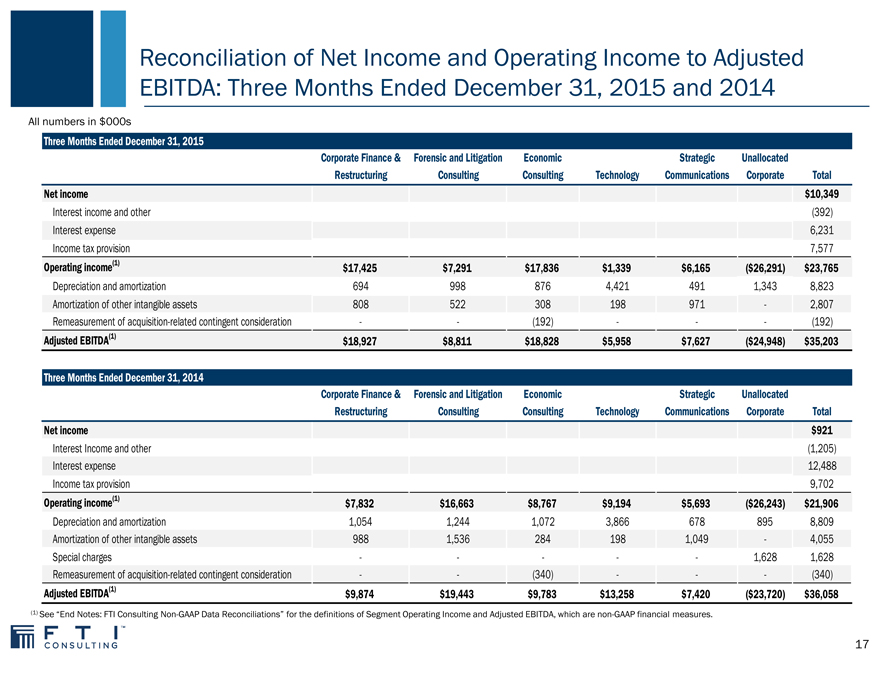
Reconciliation of Net Income and Operating Income to Adjusted EBITDA: Three Months Ended December 31, 2015 and 2014
All numbers in $000s
Three Months Ended December 31, 2015
Corporate Finance & Forensic and Litigation Economic Strategic Unallocated
Restructuring Consulting Consulting Technology Communications Corporate Total
Net income $10,349
Interest income and other(392)
Interest expense 6,231
Income tax provision 7,577
Operating income(1) $17,425 $7,291 $17,836 $1,339 $6,165($26,291) $23,765
Depreciation and amortization 694 998 876 4,421 491 1,343 8,823
Amortization of other intangible assets 808 522 308 198 971—2,807
Remeasurement of acquisition-related contingent consideration —(192) — -(192)
Adjusted EBITDA(1) $18,927 $8,811 $18,828 $5,958 $7,627($24,948) $35,203
Three Months Ended December 31, 2014
Corporate Finance & Forensic and Litigation Economic Strategic Unallocated
Restructuring Consulting Consulting Technology Communications Corporate Total
Net income $921
Interest Income and other(1,205)
Interest expense 12,488
Income tax provision 9,702
Operating income(1) $7,832 $16,663 $8,767 $9,194 $5,693($26,243) $21,906
Depreciation and amortization 1,054 1,244 1,072 3,866 678 895 8,809
Amortization of other intangible assets 988 1,536 284 198 1,049—4,055
Special charges — ——1,628 1,628
Remeasurement of acquisition-related contingent consideration —(340) — -(340)
Adjusted EBITDA(1) $9,874 $19,443 $9,783 $13,258 $7,420($23,720) $36,058
(1) See “End Notes: FTI Consulting Non-GAAP Data Reconciliations” for the definitions of Segment Operating Income and Adjusted EBITDA, which are non-GAAP financial measures.
17
|
|
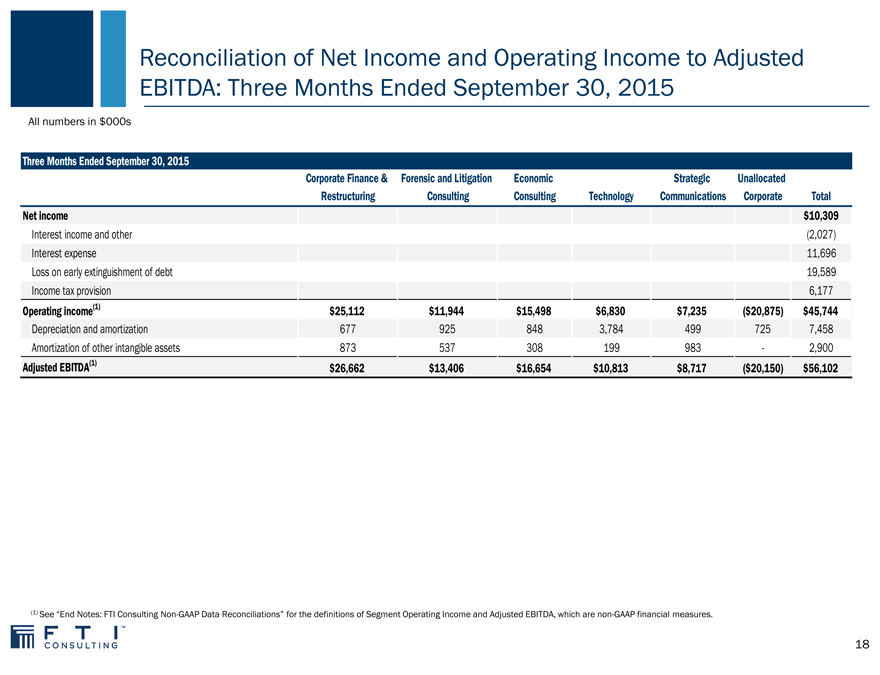
Reconciliation of Net Income and Operating Income to Adjusted EBITDA: Three Months Ended September 30, 2015
All numbers in $000s
Three Months Ended September 30, 2015
Corporate Finance & Forensic and Litigation Economic Strategic Unallocated
Restructuring Consulting Consulting Technology Communications Corporate Total
Net income $10,309
Interest income and other(2,027)
Interest expense 11,696
Loss on early extinguishment of debt 19,589
Income tax provision 6,177
Operating income(1) $ 25,112 $ 11,944 $15,498 $6,830 $ 7,235($ 20,875) $45,744
Depreciation and amortization 677 925 848 3,784 499 725 7,458
Amortization of other intangible assets 873 537 308 199 983—2,900
Adjusted EBITDA(1) $ 26,662 $ 13,406 $16,654 $10,813 $ 8,717($ 20,150) $56,102
(1) See “End Notes: FTI Consulting Non-GAAP Data Reconciliations” for the definitions of Segment Operating Income and Adjusted EBITDA, which are non-GAAP financial measures.
18
|
|
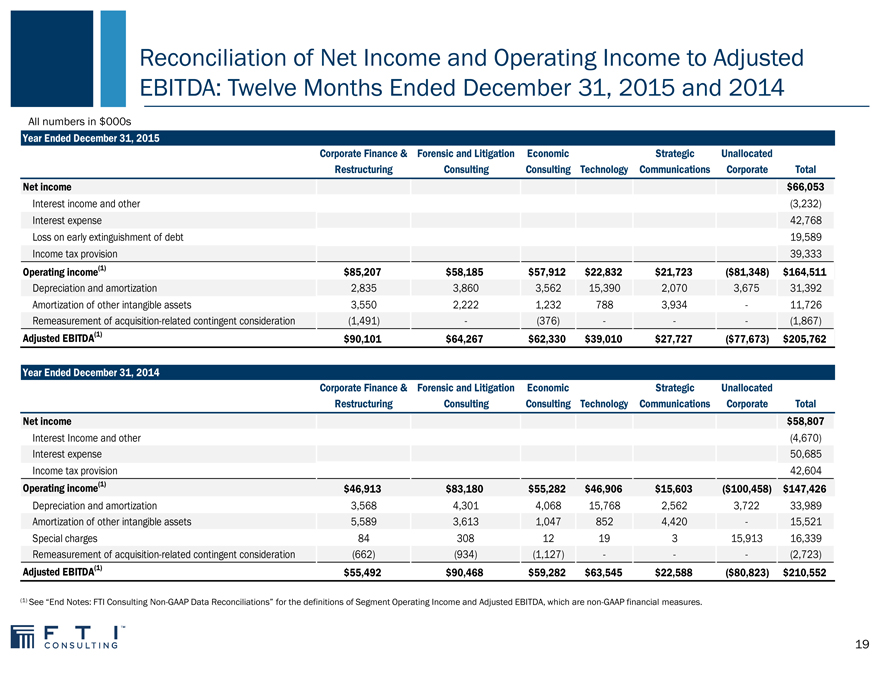
Reconciliation of Net Income and Operating Income to Adjusted EBITDA: Twelve Months Ended December 31, 2015 and 2014
All numbers in $000s
Year Ended December 31, 2015
Corporate Finance & Forensic and Litigation Economic Strategic Unallocated
Restructuring Consulting Consulting Technology Communications Corporate Total
Net income $66,053
Interest income and other(3,232)
Interest expense 42,768
Loss on early extinguishment of debt 19,589
Income tax provision 39,333
Operating income(1) $85,207 $58,185 $57,912 $22,832 $21,723($81,348) $164,511
Depreciation and amortization 2,835 3,860 3,562 15,390 2,070 3,675 31,392
Amortization of other intangible assets 3,550 2,222 1,232 788 3,934—11,726
Remeasurement of acquisition-related contingent consideration(1,491) -(376) — -(1,867)
Adjusted EBITDA(1) $90,101 $64,267 $62,330 $39,010 $27,727($77,673) $205,762
Year Ended December 31, 2014
Corporate Finance & Forensic and Litigation Economic Strategic Unallocated
Restructuring Consulting Consulting Technology Communications Corporate Total
Net income $58,807
Interest Income and other(4,670)
Interest expense 50,685
Income tax provision 42,604
Operating income(1) $46,913 $83,180 $55,282 $46,906 $15,603($100,458) $147,426
Depreciation and amortization 3,568 4,301 4,068 15,768 2,562 3,722 33,989
Amortization of other intangible assets 5,589 3,613 1,047 852 4,420—15,521
Special charges 84 308 12 19 3 15,913 16,339
Remeasurement of acquisition-related contingent consideration(662)(934)(1,127) — -(2,723)
Adjusted EBITDA(1) $55,492 $90,468 $59,282 $63,545 $22,588($80,823) $210,552
(1) See “End Notes: FTI Consulting Non-GAAP Data Reconciliations” for the definitions of Segment Operating Income and Adjusted EBITDA, which are non-GAAP financial measures.
19
|
|
End Notes
FTI Consulting Non-GAAP Data Reconciliations
We define Adjusted Net Income and Adjusted Earnings per Diluted Share (“Adjusted EPS”) as Net Income and Earnings Per Diluted Share, respectively, excluding the impact of remeasurement of acquisition-related contingent consideration, special charges, goodwill impairment charges and losses on early extinguishment of debt. We use Adjusted Net Income for the purpose of calculating Adjusted EPS. Management uses Adjusted EPS to assess total Company operating performance on a consistent basis. We believe that this measure, when considered together with our GAAP financial results, provides management and investors with a more complete understanding of our business operating results, including underlying trends, by excluding the effects of remeasurement of acquisition-related contingent consideration, special charges, goodwill impairment charges and losses on early extinguishment of debt.
We define Segment Operating Income (loss) as a segment’s share of consolidated operating income (loss). We define Total Segment Operating Income (loss) as the total of Segment Operating Income (loss) for all segments, which excludes unallocated corporate expenses. We use Segment Operating Income (loss) for the purpose of calculating Adjusted Segment EBITDA (loss). We define Adjusted EBITDA as consolidated net income (loss) before income tax provision, other non-operating income (expense), depreciation, amortization of intangible assets, remeasurement of acquisition-related contingent consideration, special charges, goodwill impairment charges and losses on early extinguishment of debt. We define Adjusted Segment EBITDA as a segment’s share of consolidated operating income (loss) before depreciation, amortization of intangible assets, remeasurement of acquisition-related contingent consideration, special charges and goodwill impairment charges. We define Total Adjusted Segment EBITDA as the total of Adjusted Segment EBITDA for all segments, which excludes unallocated corporate expenses. We define Adjusted EBITDA Margin as Adjusted EBITDA as a percentage of total revenues. We define Adjusted Segment EBITDA margin as Adjusted Segment EBITDA as a percentage of a segment’s share of revenue. We use Adjusted Segment EBITDA to internally evaluate the financial performance of our segments because we believe it is a useful supplemental measure which reflects current core operating performance and provides an indicator of the segment’s ability to generate cash. We also believe that these measures, when considered together with our GAAP financial results, provide management and investors with a more complete understanding of our operating results, including underlying trends, by excluding the effects of remeasurement of acquisition-related contingent consideration, special charges, and goodwill impairment charges. In addition, EBITDA and Adjusted EBITDA are common alternative measures of operating performance used by many of our competitors. It is used by investors, financial analysts, rating agencies and others to value and compare the financial performance of companies in our industry. Therefore, we also believe that these measures, considered along with corresponding GAAP measures, provide management and investors with additional information for comparison of our operating results to the operating results of other companies.
Non-GAAP financial measures are not defined in the same manner by all companies and may not be comparable to other similarly titled measures of other companies. Non-GAAP financial measures should be considered in addition to, but not as a substitute for or superior to, the information contained in our Consolidated Statements of Comprehensive Income (loss).
20
|
|

Appendix
|
|
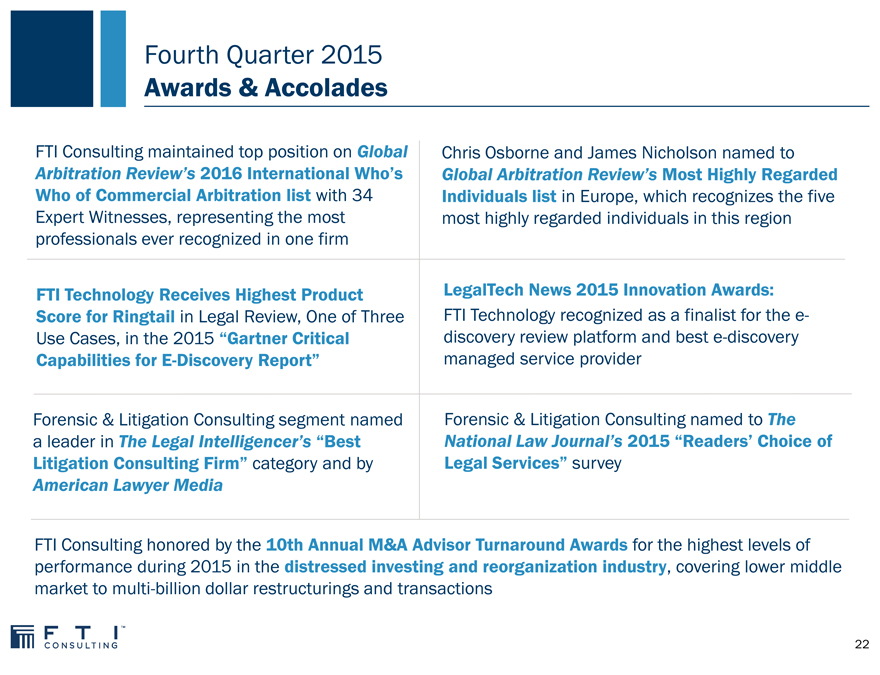
Fourth Quarter 2015
Awards & Accolades
FTI Consulting maintained top position on Global Arbitration Review’s 2016 International Who’s Who of Commercial Arbitration list with 34
Expert Witnesses, representing the most professionals ever recognized in one firm
FTI Technology Receives Highest Product
Score for Ringtail in Legal Review, One of Three Use Cases, in the 2015 “Gartner Critical Capabilities for E-Discovery Report”
Forensic & Litigation Consulting segment named a leader in The Legal Intelligencer’s “Best
Litigation Consulting Firm” category and by
American Lawyer Media
Chris Osborne and James Nicholson named to
Global Arbitration Review’s Most Highly Regarded Individuals list in Europe, which recognizes the five most highly regarded individuals in this region
LegalTech News 2015 Innovation Awards:
FTI Technology recognized as a finalist for the e-discovery review platform and best e-discovery managed service provider
Forensic & Litigation Consulting named to The
National Law Journal’s 2015 “Readers’ Choice of Legal Services” survey
FTI Consulting honored by the 10th Annual M&A Advisor Turnaround Awards for the highest levels of performance during 2015 in the distressed investing and reorganization industry, covering lower middle market to multi-billion dollar restructurings and transactions
22
|
|

Critical Thinking at the Critical Time ™