Attached files
| file | filename |
|---|---|
| EX-31.1 - EXHIBIT 31.1 - UNIVERSAL DISPLAY CORP \PA\ | ex31-1december312015.htm |
| EX-32.1 - EXHIBIT 32.1 - UNIVERSAL DISPLAY CORP \PA\ | ex32-1december312015.htm |
| EX-32.2 - EXHIBIT 32.2 - UNIVERSAL DISPLAY CORP \PA\ | ex32-2december312015.htm |
| EX-10.47 - EXHIBIT 10.47 - UNIVERSAL DISPLAY CORP \PA\ | ex1047december312015.htm |
| EX-21.1 - EXHIBIT 21.1 - UNIVERSAL DISPLAY CORP \PA\ | ex21december312015.htm |
| EX-10.48 - EXHIBIT 10.48 - UNIVERSAL DISPLAY CORP \PA\ | ex1048december312015.htm |
| EX-23.1 - EXHIBIT 23.1 - UNIVERSAL DISPLAY CORP \PA\ | ex23-1december312015.htm |
| EX-31.2 - EXHIBIT 31.2 - UNIVERSAL DISPLAY CORP \PA\ | ex31-2december312015.htm |
UNITED STATES
SECURITIES AND EXCHANGE COMMISSION
Washington, D.C. 20549
FORM 10-K
(Mark One)
[X] ANNUAL REPORT PURSUANT TO SECTION 13 OR 15(d) OF THE SECURITIES EXCHANGE ACT OF 1934
For the fiscal year ended December 31, 2015
OR
[ ] TRANSITION REPORT PURSUANT TO SECTION 13 OR 15(d) OF THE SECURITIES EXCHANGE ACT OF 1934
For the transition period from ____________ to ___________
Commission File Number 1-12031

UNIVERSAL DISPLAY CORPORATION
(Exact name of registrant as specified in its charter)
Pennsylvania | 23-2372688 | |
(State or other jurisdiction of incorporation or organization) | (I.R.S. Employer Identification No.) | |
375 Phillips Boulevard, Ewing, New Jersey | 08618 | |
(Address of principal executive offices) | (Zip Code) | |
Registrant’s telephone number, including area code: (609) 671-0980
Securities registered pursuant to Section 12(b) of the Act:
Title of Each Class | Name of Each Exchange on Which Registered | |
Common Stock, $0.01 par value | The NASDAQ Stock Market LLC | |
Securities registered pursuant to Section 12(g) of the Act: None
Indicate by check mark if the registrant is a well-known seasoned issuer, as defined in Rule 405 of the Securities Act. Yes X No
Indicate by check mark if the registrant is not required to file reports pursuant to Section 13 or Section 15(d) of the Act. Yes No X
Indicate by check mark whether the registrant (1) has filed all reports required to be filed by Section 13 or 15(d) of the Securities Exchange Act of 1934 during the preceding 12 months (or for such shorter period that the registrant was required to file such reports), and (2) has been subject to such filing requirements for the past 90 days. Yes X No
Indicate by check mark whether the registrant has submitted electronically and posted on its corporate Web site, if any, every Interactive Data File required to be submitted and posted pursuant to Rule 405 of Regulation S-T (§ 232.405 of this chapter) during the preceding 12 months (or for such shorter period that the registrant was required to submit and post such files). Yes X No
Indicate by check mark if disclosure of delinquent filers pursuant to Item 405 of Regulation S-K is not contained herein, and will not be contained, to the best of registrant’s knowledge, in definitive proxy or information statements incorporated by reference in Part III of this Form 10-K or any amendment to this Form 10-K. X
Indicate by check mark whether the registrant is a large accelerated filer, an accelerated filer, a non-accelerated filer, or a smaller reporting company. See the definitions of “large accelerated filer,” “accelerated filer” and “smaller reporting company” in Rule 12b-2 of the Exchange Act. (Check one):
Large accelerated filer X | Accelerated filer | |
Non-accelerated filer (Do not check if a smaller reporting company) | Smaller reporting company ____ | |
Indicate by check mark whether the registrant is a shell company (as defined in Rule 12b-2 of the Exchange Act). Yes No X
The aggregate market value of the voting and non-voting common equity held by non-affiliates of the registrant computed by reference to the closing sale price of the registrant’s common stock on the NASDAQ Global Market as of June 30, 2015, was $1,746,723,042. Solely for purposes of this calculation, all executive officers and directors of the registrant and all beneficial owners of more than 10% of the registrant’s common stock (and their affiliates) were considered affiliates.
As of February 23, 2016, the registrant had outstanding 46,824,158 shares of common stock.
DOCUMENTS INCORPORATED BY REFERENCE
Portions of the registrant’s Proxy Statement for the 2016 Annual Meeting of Shareholders, which is to be filed with the Securities and Exchange Commission no later than April 29, 2016, are incorporated by reference into Part III of this report.
TABLE OF CONTENTS
PART I
PART II
PART III
PART IV
i
CAUTIONARY STATEMENT
CONCERNING FORWARD-LOOKING STATEMENTS
This report and the documents incorporated by reference in this report contain some “forward-looking statements” within the meaning of Section 27A of the Securities Act of 1933 and Section 21E of the Securities Exchange Act of 1934. Forward-looking statements concern possible or assumed future events, results and business outcomes. These statements often include words such as “believe,” “expect,” “anticipate,” “intend,” “plan,” “estimate,” “seek,” “will,” “may,” “project” or similar expressions. These statements are based on assumptions that we have made in light of our experience in the industry, as well as our perceptions of historical trends, current conditions, expected future developments and other factors we believe are appropriate under the circumstances.
As you read and consider this report, you should not place undue reliance on any forward-looking statements. You should understand that these statements involve substantial risk and uncertainty and are not guarantees of future performance or results. They depend on many factors that are discussed further under Item 1A (Risk Factors) below, including:
• | successful commercialization by organic light emitting diode (OLED) manufacturers of products incorporating our OLED technologies and materials and their continued willingness to utilize our OLED technologies and materials; |
• | the adequacy of protections afforded to us by the patents that we own or license and the cost to us of maintaining, enforcing and defending those patents; |
• | our ability to obtain, expand and maintain patent protection in the future, and to protect our non-patented intellectual property; |
• | our exposure to and ability to defend third-party claims and challenges to our patents and other intellectual property rights; |
• | our ability to maintain and improve our competitive position following the expiration of certain of our fundamental phosphorescent organic light-emitting diode (PHOLED) patents; |
• | our ability to form and continue strategic relationships with manufacturers of OLED products; |
• | the payments that we expect to receive under our existing contracts with OLED manufacturers and the terms of contracts that we expect to enter into with OLED manufacturers in the future; |
• | the potential commercial applications of and future demand for our OLED technologies and materials, and of OLED products in general; |
• | our customers' development and use of more efficient manufacturing processes and material processing protocols that result in the more efficient utilization of our materials, and therefore reduce their requirements for our materials; |
• | the comparative advantages and disadvantages of our OLED technologies and materials versus competing technologies and materials currently in the market; |
• | the nature and potential advantages of any competing technologies that may be developed in the future; |
• | the outcomes of our ongoing and future research and development activities, and those of others, relating to OLED technologies and materials; |
• | our ability to access future OLED technology developments of our academic and commercial research partners; |
• | our ability to acquire and supply OLED materials at cost competitive pricing; |
• | our ability to compete against third parties with resources greater than ours; |
• | our future capital requirements and our ability to obtain additional financing if and when needed; |
• | our future OLED technology licensing and OLED material revenues and results of operations, including supply and demand for our OLED materials; and |
• | general economic and market conditions. |
Changes or developments in any of these areas could affect our financial results or results of operations and could cause actual results to differ materially from those contemplated by any forward-looking statements.
All forward-looking statements speak only as of the date of this report or the documents incorporated by reference, as the case may be. We do not undertake any duty to update, correct, modify, or supplement any of these forward-looking statements to reflect events or circumstances after the date of this report or to reflect the occurrence of unanticipated events.
1
PART I
ITEM 1. | BUSINESS |
Our Company
We are a leader in the research, development and commercialization of organic light emitting diode, or OLED, technologies and materials for use in displays for mobile phones, tablets, televisions, wearables, personal computers, and automotive interiors, as well as solid-state lighting applications. OLEDs are thin, lightweight and power-efficient solid-state devices that emit light, making them highly suitable for use in full-color displays and as lighting products. OLED displays are capturing a growing share of the flat panel display market. We believe that this is because OLEDs offer potential advantages over competing display technologies with respect to power efficiency, contrast ratio, viewing angle, video response time, form factor and manufacturing cost. We also believe that OLED lighting products have the potential to replace many existing light sources in the future because of their high power efficiency, excellent color rendering index, low operating temperature and novel form factor. Our technology leadership and intellectual property position should enable us to share in the revenues from OLED displays and lighting products as they enter mainstream consumer and other markets.
Our primary business strategy is to (1) further develop and license our proprietary OLED technologies to manufacturers of products for display applications, such as mobile phones, portable media devices, wearable electronic devices, tablets, notebook computers and televisions, and specialty and general lighting products; and (2) develop new OLED materials and sell the materials to those product manufacturers. We have established a significant portfolio of proprietary OLED technologies and materials, primarily through our internal research and development efforts and acquisitions of patents and patent applications, as well as maintaining our relationships with world-class partners such as Princeton University (Princeton), the University of Southern California (USC), the University of Michigan (Michigan) and PPG Industries, Inc. (PPG Industries). We currently own, exclusively license or have the sole right to sublicense more than 3,600 patents issued and pending worldwide.
We sell our proprietary OLED materials to customers for evaluation and use in commercial OLED products. We also enter into agreements with manufacturers of OLED display and lighting products under which we grant them licenses to practice under our patents and to use our proprietary know-how. At the same time, we work with these and other companies who are evaluating our OLED technologies and materials for possible use in commercial OLED display and lighting products.
Market Overview
The Flat Panel Display Market
Flat panel displays are essential for a wide variety of portable consumer electronics products, such as mobile phones, portable media devices, digital cameras, wearables, tablets and notebook computers. Due to their narrow profile and light weight, flat panel displays have also become the display of choice for larger product applications, such as computer monitors and televisions.
Liquid crystal displays, or LCDs, continue to dominate the flat panel display market. However, we believe that OLED displays are an attractive alternative to LCDs because they offer a number of potential advantages, including:
• | higher power efficiencies, thereby reducing energy consumption; |
• | a thinner profile and lighter weight; |
• | higher contrast ratios, leading to sharper picture images and graphics; |
• | wider viewing angles; |
• | deposition on non-rigid substrates which enables conformable and flexible displays; |
• | faster response times for video; and |
• | lower cost manufacturing methods and materials. |
Based on these characteristics, product manufacturers have adopted small-area OLED displays for use in portable electronic devices, such as smartphones, wearables and tablets. Manufacturers have begun commercializing large area OLED displays for use in televisions. We believe that if these efforts are successful, they could result in sizeable markets for OLED displays.
In addition, due to the inherent transparency of organic materials and through the use of transparent electrode technology, OLEDs eventually may enable the production of transparent displays for use in products such as automotive windshields and windows with embedded displays. Organic materials also make technically possible the development of flexible displays for use in an entirely new set of product applications. Such applications include display devices that can be conformed to certain shapes for wearable, industrial and ruggedized applications.
2
The Solid-State Lighting Market
Traditional incandescent light bulbs are inefficient because they convert only about 5% of the energy they consume into visible light, with the rest emerging as heat. Fluorescent lamps use excited gases, or plasmas, to achieve a higher energy conversion efficiency of about 20%. However, the color rendering index, or CRI, of most fluorescent lamps – in other words, the quality of their color compared to an ideal light source – is inferior to that of an incandescent bulb. Fluorescent lamps also pose environmental concerns because they typically contain mercury.
Solid-state lighting relies on the direct conversion of electricity to visible light using semiconductor materials. By avoiding the heat and plasma-producing processes of incandescent bulbs and fluorescent lamps, respectively, solid-state lighting products can have substantially higher energy conversion efficiencies.
There are currently two basic types of solid-state lighting devices: inorganic light emitting diodes, or LEDs, and OLEDs. Current LEDs are very small in size (about one square millimeter) and are extremely bright. Having been developed about 25 years before OLEDs, LEDs are already employed in a variety of lighting products, such as traffic lights, billboards, replacements for incandescent lighting, backlights for smartphones, computer monitors and televisions, and as border or accent lighting. However, the high operating temperatures and intense brightness of LEDs may make them less desirable for many general illumination and diffuse lighting applications.
OLEDs, on the other hand, are larger in size and can be viewed directly, without using diffusers that are required to temper the intense brightness of LEDs. OLEDs can be added to any suitable surface, including glass, plastic or metal foil, and could be cost-effective to manufacture in high volume. Given these characteristics, product manufacturers are working and have introduced limited product applications of OLEDs for diffuse specialty lighting applications and ultimately general illumination. If these efforts are successful, we believe that OLED lighting products could begin to be used for applications currently addressed by incandescent bulbs and fluorescent lamps, as well as for new applications that take advantage of the OLED form factor. In particular, the ability of OLED technology to produce uniform illumination over arbitrary shapes is making OLED lighting very attractive to the automobile industry.
Our Competitive Strengths
We believe our position as one of the leading technology developers in the OLED industry is the direct result of our technological innovation. We have built an extensive intellectual property portfolio around our OLED technologies and materials, and are working diligently to enable our manufacturing partners to adopt our OLED technologies and materials for expanding commercial usage. Our key competitive strengths include:
Technology Leadership
We are a recognized technology leader in the OLED industry. Along with our research partners, we have pioneered the development of our UniversalPHOLED® phosphorescent OLED technologies, which can be used to produce OLEDs that are up to four times more efficient than traditional fluorescent OLEDs and significantly more efficient than current LCDs, which are illuminated using backlights. We believe that our phosphorescent OLED technologies and materials are well-suited for industry usage in the commercial production of OLED displays and lighting products. Through our relationships with companies such as PPG Industries and our academic partners, we have also developed other important OLED technologies, as well as novel OLED materials that we believe will facilitate the adoption of our various OLED technologies by product manufacturers.
Broad Portfolio of Intellectual Property
We believe that our extensive portfolio of patents, trade secrets and non-patented know-how provides us with a competitive advantage in the OLED industry. Through our internal development efforts, acquisitions, and our relationships with world-class partners such as Princeton, USC, Michigan and PPG Industries, we own, exclusively license or have the sole right to sublicense more than 3,600 patents issued and pending worldwide. In 2011, we purchased 74 issued U.S. patents from Motorola Solutions, Inc. (f/k/a Motorola, Inc.) (Motorola), together with foreign counterparts in various countries, which patents we had previously licensed from Motorola, and in 2012, we acquired the entire worldwide patent portfolio of more than 1,200 OLED patents and patent applications of Fujifilm Corporation (Fujifilm) for a total cost of $109.5 million. We also continue to accumulate valuable non-patented technical know-how relating to our OLED technologies and materials.
Focus on Licensing Our OLED Technologies
We are focused on licensing our proprietary OLED technologies to product manufacturers on a non-exclusive basis. Our current business model does not involve the direct manufacture or sale of OLED display or lighting products. Instead, we seek license fees and royalties from OLED product manufacturers based on their sales of licensed products. We believe this business model allows us to concentrate on our core strengths of technology development and innovation, while at the same time providing significant operating leverage. We also believe that this approach may reduce potential competitive conflicts between us and our customers.
3
Licenses with Key Product Manufacturers
We have licensed our OLED technologies and patents to manufacturers for use in commercial products. In 2015, we entered into a license agreement with LG Display Co., Ltd. (LG Display) for its manufacture of AMOLED display products. In 2011, we entered into a new license agreement with Samsung Mobile Display Co. Ltd. (SMD) for its manufacture of active matrix OLED (AMOLED) display products, which agreement superseded our prior license agreement with Samsung Display Co., Ltd (SDC). In July 2012, SMD merged with SDC. Following the merger, all agreements between us and SMD were assigned to SDC, and SDC is obligated to honor all pre-existing agreements made between us and SMD. We also have license agreements with Konica Minolta Holdings Inc. (Konica Minolta), Sumitomo Chemical Company, Ltd. (Sumitomo), Lumiotec, Inc. (Lumiotec), Pioneer Corporation (Pioneer), Kaneka Corporation (Kaneka) and OLEDWorks L.L.C. (OLEDWorks) for the manufacture of OLED lighting products. Additionally, we have a license agreement with DuPont Displays for its manufacture of solution-processed OLED display products using proprietary OLED materials obtained through us.
Leading Supplier of UniversalPHOLED Emitter Materials
We are the leading supplier of phosphorescent emitter materials to OLED product manufacturers. The emitter material, which is designed to efficiently convert electrical energy to a desired wavelength of light, is the key component in an OLED device. PPG Industries currently manufactures our proprietary emitter materials for us, which we then qualify and resell to OLED product manufacturers. We record revenues based on our sales of these materials to OLED product manufacturers. This allows us to maintain close technical and business relationships with the OLED product manufacturers purchasing our proprietary materials, which in turn further supports our technology licensing business.
Complementary UniversalPHOLED Host Material Business
We supply certain of our proprietary phosphorescent host materials to OLED product manufacturers. In one design, the emitter material is disbursed into a host material, with the resulting mixture consisting of predominantly host material. PPG Industries is also currently responsible for the manufacture of our proprietary host materials for us, which we then qualify and resell to our customers. We believe that host material sales can be complementary to our phosphorescent emitter material sales business; however, our OLED product manufacturing customers are not required to purchase our host materials in order to utilize our phosphorescent emitter materials. In addition, the host material business is more competitive than the phosphorescent emitter material sales business. This means our long-term prospects for host material sales are uncertain.
Established Material Supply Relationships
We have established relationships with well-known manufacturers that are using, or are evaluating, our OLED materials for use in commercial products. In 2015, SDC, LG Display, Tohoku Pioneer Corporation (Tohoku Pioneer), AU Optronics Corporation (AU Optronics) and Konica Minolta purchased our proprietary OLED materials for use in commercial OLED display and lighting products. We continue to work with many product manufacturers that are evaluating our OLED materials and technologies for use in commercial OLED displays and lighting products, including BOE Technology Group Co., Ltd. (BOE), Innolux Corporation (Innolux) (formerly Chimei Innolux Corporation (CMI)), and Kaneka.
U.S. Government Program Support
We perform work under research and development contracts with U.S. government agencies, such as the U.S. Department of the Army and the U.S. Department of Energy. Under these contracts, the U.S. government funds a portion of our efforts to develop next-generation OLED technologies for applications such as flexible displays and solid-state lighting. This enables us to supplement our internal research and development budget with additional funding. As OLED technology continues to prosper in the marketplace, U.S. government funding will likely continue to decline.
Experienced Management and Scientific Advisory Team
Our management team has significant experience in developing business models focused on licensing disruptive technologies in high growth industries. In addition, our management team has assembled a Scientific Advisory Board that includes some of the leading researchers in the OLED industry, such as Professor Stephen R. Forrest of Michigan (formerly of Princeton) and Professor Mark E. Thompson of USC.
Our Business Strategy
Our current business strategy is to promote and continue to expand our portfolio of OLED technologies and materials for widespread use in OLED displays and lighting products. We generate revenues primarily by licensing our OLED technologies and selling our proprietary OLED materials to display and lighting product manufacturers. We are presently focused on the following steps to implement our business strategy:
4
Target Leading Product Manufacturers
We are targeting leading manufacturers of flat panel displays and lighting products as potential commercial licensees of our OLED technologies and purchasers of our OLED materials. We also supply our proprietary OLED materials to manufacturers of OLED displays and lighting products for evaluation and for use in product development and for pre-commercial activities, and we provide technical assistance and support to these manufacturers. We concentrate on working closely with OLED product manufacturers because we believe that the successful incorporation of our technologies and materials into commercial products is critical to their widespread adoption.
Enhance Our Existing Portfolio of PHOLED Technologies and Materials
We believe that a strong portfolio of proprietary OLED technologies and materials for both displays and lighting products is critical to our success. Consequently, we are continually seeking to expand this portfolio through our internal development efforts, our collaborative relationships with academic and other research partners, and other strategic opportunities. One of our primary goals is to develop new and improved phosphorescent OLED technologies and materials with increased efficiencies, enhanced color gamut and extended lifetimes, which are compatible with different manufacturing methods, so that they can be used by various manufacturers in a broad array of OLED display and lighting products.
Develop Next-Generation Organic Technologies
We continue to conduct research and development activities relating to next-generation OLED technologies for both displays and lighting products. We also are funding research by our academic partners on the use of organic thin-film technology in other applications. Our focus on next-generation technologies is designed to enable us to maintain our position as a leading provider of OLED and other organic electronics technologies and materials as new markets emerge.
Business and Geographic Markets
We derive revenue from the following:
• | sales of OLED materials for evaluation, development and commercial manufacturing; |
• | intellectual property and technology licensing; and |
• | technology development and support, including government contract work and support provided to third parties for commercialization of their OLED products. |
Most manufacturers of flat panel displays and lighting products who are or might potentially be interested in our OLED technologies and materials are currently located outside of the United States, particularly in the Asia-Pacific region. To provide on-the-ground support to these manufacturers, we have established wholly-owned subsidiaries in Ireland, Korea, Japan and Hong Kong, as well as a representative office in Taiwan. Our subsidiary in Hong Kong operates a world-class chemistry laboratory to support our expanding research and development initiatives in OLED materials and technologies. Our subsidiary in Ireland is responsible for all material sales world-wide (excluding the United States) and for licensing and managing intellectual property and undertaking certain other business transactions in all non-U.S. territories.
We receive a majority of our revenues from customers that are domiciled outside of the United States, and our business is heavily dependent on our relationships with these customers. In particular, one of our key customers located in the Asia-Pacific region, SDC, accounted for 62% of our consolidated revenues for 2015 and indirectly accounted for 67% of our consolidated revenues for 2015. Substantially all revenue derived from our customers is denominated in U.S. dollars.
For more information on our revenues, costs and expenses associated with our business, as well as a breakdown of revenues from North America and foreign sources, please see our Consolidated Financial Statements and the notes thereto, as well as “Management’s Discussion and Analysis of Financial Condition and Results of Operations,” included elsewhere in this report.
Our Technology and its Relation to OLED Technology and Structure
OLED devices are solid-state semiconductor devices made from thin films of organic material that emit light of various wavelengths when electricity is selectively applied to the emissive layer of the device. OLED devices are typically referred to as incorporating an “OLED stack.” OLED stacks vary in specific structure but those commonly used today may include a cathode, an electron injection layer, an electron transport layer, an emissive layer, a hole transport layer, a hole injection layer and an anode, all of which are placed on a substrate which may be made of a number of different materials, including glass, plastic and metal.
5
Our technology and materials are most commonly utilized in the emissive layer; the materials in the emissive layer are the light-generating component of the OLED stack. Many of our key technologies relate primarily to phosphorescent emitter materials, which we believe are more energy efficient than fluorescent emitter materials that can also be used to generate light within the emissive layer of the OLED device. We began selling emitter materials commercially in 2003. A manufacturer will use a small amount of emitter material for each device through a process called “doping” into a host material. The emitter material(s) and the host material(s) together form an emissive layer system. Depending on the nature of the OLED device, the emissive materials and emissive layer system may be designed to emit different colors. We have commercially produced and sold phosphorescent emitter materials that produce red, yellow, green and light-blue light, which are combined in various ways for the flat panel display and lighting markets.
Our current materials business, conducted outside the United States by our Irish subsidiary, is focused primarily on the delivery of such emissive materials. We have also developed host materials for the emissive layer and began selling them commercially in 2011. In addition to our materials, which are protected by patents covering various molecular structures, we also have fundamental and important patents that cover various aspects of the OLED device, including the use of phosphorescent emission in an OLED device, flexible OLEDs, lighting, encapsulation, and methods of manufacturing OLEDs. These patents are important to our licensing business because they enable us to provide our business partners important OLED related technology.
Our Phosphorescent OLED Technologies
Phosphorescent OLEDs utilize specialized materials and device structures that allow OLEDs to emit light through a process known as phosphorescence. Traditional fluorescent OLEDs emit light through an inherently less efficient process. Theory and experiment show that phosphorescent OLEDs exhibit device efficiencies up to four times higher than those exhibited by fluorescent OLEDs. Phosphorescence substantially reduces the power requirements of an OLED and is useful in displays for hand-held devices, such as smartphones, where battery power is often a limiting factor.
Phosphorescence is also important for large-area displays such as televisions, where higher device efficiency and lower heat generation may enable longer product lifetimes and increased energy efficiency.
We have a strong intellectual property portfolio surrounding our existing PHOLED phosphorescent OLED technologies and materials for both displays and lighting products which we market under the UniversalPHOLED® brand. We devote a substantial portion of our efforts to developing new and improved proprietary PHOLED materials and device architectures for red, green, yellow, blue and white OLED devices. In 2015, we continued our commercial supply relationships with companies such as SDC and LG Display to use our UniversalPHOLED® materials for their manufacture of OLED displays. In addition, we continued to work closely with customers evaluating and qualifying our proprietary PHOLED materials for commercial usage in both displays and lighting products, and with other material suppliers to match our PHOLED emitters with their phosphorescent hosts and other OLED materials.
Our Additional Proprietary OLED Technologies
Our research, development and commercialization efforts also encompass a number of other OLED device and manufacturing technologies, including the following:
FOLED™ Flexible OLEDs
We are working on a number of technologies required for the fabrication of OLEDs on flexible substrates. Most OLED and other flat panel displays are built on rigid substrates such as glass. In contrast, FOLEDs are OLEDs built on non-rigid substrates such as plastic or metal foil. This has the potential to enhance durability and enable conformation to certain shapes or repeated bending or flexing. Eventually, FOLEDs may be capable of being rolled into a cylinder, similar to a window shade. These features create the possibility of new flat panel display product applications that do not exist today, such as a portable, roll-up Internet connectivity and communications device as well as enhance the usefulness of such devices in ruggedized, industrial and wearable computing systems. Manufacturers also may be able to produce FOLEDs using more efficient continuous, or roll-to-roll, processing methods. We currently are conducting research and development on FOLED technologies internally.
Thin-Film Encapsulation
We have developed proprietary, patented encapsulation technology for the packaging of flexible OLEDs and other thin-film devices, as well as for use as a barrier film for plastic substrates. Addressing a major roadblock to the successful commercialization of flexible OLEDs, our hybrid, single-layer approach provides barrier performance useful for OLEDs using a potentially cost-effective process. In addition to accelerating the commercial viability of flexible OLEDs, our thin-film encapsulation technology has the potential to provide benefits for a variety of other flexible thin-film devices, including photovoltaics and thin-film batteries.
6
UniversalP2OLED® Printable Phosphorescent OLEDs
The standard approach for manufacturing a small molecule OLED, including a PHOLED, is based on a vacuum thermal evaporation, or VTE, process. With a VTE process, the thin layers of organic material in an OLED are deposited in a high-vacuum environment. An alternate approach for manufacturing a small molecule OLED involves solution processing of the various organic materials in an OLED using techniques such as spin coating or inkjet printing onto the substrate. Solution-processing methods, and inkjet printing in particular, have the potential to be lower cost approaches to OLED manufacturing and scalable to large area displays. For several years, we worked on P2OLEDs under joint development agreements with Seiko Epson Corporation.
OVJP® Organic Vapor Jet Printing
OLEDs can be manufactured using other processes as well, including OVJP. As a direct printing technique, OVJP technology has the potential to offer high deposition rates for any size or shaped OLED. In addition, OVJP technology reduces OLED material waste associated with use of a shadow mask (i.e., the waste of material that deposits on the shadow mask itself when fabricating an OLED). By comparison to inkjet printing, an OVJP process does not use liquid solvents and therefore the OLED materials utilized are not limited by their viscosity or solvent solubility. OVJP also avoids generation of solvent wastes and eliminates the additional step of removing residual solvent from the OLED device. We have installed a prototype OVJP tool at our Ewing, New Jersey facility, and we continue to collaborate on OVJP technology development with Professor Forrest of Michigan.
OVPD® Organic Vapor Phase Deposition
Another approach for manufacturing a small molecule OLED is based on OVPD. The OVPD process utilizes a carrier gas, such as nitrogen, in a hot walled reactor in a low pressure environment to deposit the layers of organic material in an OLED. The OVPD process may offer advantages over the VTE process or solution processing methods through more efficient materials utilization and enhanced deposition control. We have licensed Aixtron AG, a leading manufacturer of metal-organic chemical vapor deposition equipment, to develop and qualify equipment for the fabrication of OLED displays utilizing the OVPD process.
TOLED Transparent OLEDs
We have developed a technology for the fabrication of OLEDs that have transparent cathodes. Conventional OLEDs use a reflective metal cathode and a transparent anode. In contrast, TOLEDs use a transparent cathode and either a transparent, reflective or opaque metal anode. TOLEDs utilizing transparent cathodes and reflective metal anodes are known as “top-emission” OLEDs. In a “top-emission” AMOLED, light is emitted without having to travel through much of the device electronics where a significant portion of the usable light is lost. This results in OLED displays having image qualities and lifetimes superior to those of conventional AMOLEDs. TOLEDs utilizing transparent cathodes and transparent anodes may also be useful in novel flat panel display applications requiring semi-transparency or transparency, such as graphical displays in automotive windshields.
Our Strategic Relationships with Product Manufacturers
We have established early-stage evaluation programs, development and pre-commercial programs, and commercial arrangements with a substantial number of manufacturers or potential manufacturers of OLED display and lighting products. Many of these relationships are directed towards tailoring our proprietary OLED technologies and materials for use by individual manufacturers. Our ultimate objective is to license our OLED technologies and sell our OLED materials to these manufacturers for their commercial production of OLED products. Our publicly announced relationships with product manufacturers include the following:
SDC
We have been working with SDC and providing our next generation PHOLED materials to SDC for evaluation since 2001. In 2011, we entered into a patent license agreement with SDC for its manufacture and sale of AMOLED display products which has a term that extends through December 31, 2017. We also supply our proprietary PHOLED materials to SDC for its use in manufacturing licensed products. Under a separate supplemental agreement, SDC has agreed to purchase a minimum amount of phosphorescent emitter material from us for the manufacture of licensed products. This minimum purchase commitment is subject to SDC’s requirements for phosphorescent emitter materials and our ability to meet these requirements over the term of the supplemental agreement, which is concurrent with the term of the license agreement.
7
LG Display
We have been providing our proprietary PHOLED materials to LG Display for evaluation, and we have been supporting LG Display in its OLED product development activities for several years. In January 2015, we entered into an OLED patent license agreement and an OLED commercial supply agreement with LG Display, which were effective as of January 1, 2015 and superseded a 2007 commercial supply agreement between the parties for the supply of our proprietary PHOLED materials for use in AMOLED display products. The new agreements have a term that is set to expire by the end of 2022. The patent license agreement provides LG Display a non-exclusive, royalty bearing portfolio license to make and sell OLED displays under the Company's patent portfolio. The patent license agreement calls for license fees, prepaid royalties and running royalties on licensed products. The agreements include customary provisions relating to warranties, indemnities, confidentiality, assignability and business terms. The agreements provide for certain other minimum obligations relating to the volume of materials sales anticipated over the life of the agreements as well as minimum royalty revenue to be generated under the patent license agreement. The Company expects to generate revenue under these agreements that are predominantly tied to LG Display sales of OLED licensed products. The OLED commercial supply agreement provides for the sales of materials for use by LG Display, which may include phosphorescent dopants and host materials.
AU Optronics
We have a longstanding collaborative relationship with AU Optronics dating back to 2001. We are providing our proprietary PHOLED materials to AU Optronics for evaluation, and we have helped AU Optronics accelerate its introduction of commercial OLED products into the market. In 2016, we entered into a revised commercial supply agreement for the continued evaluation and commercial supply of our proprietary PHOLED materials.
Sumitomo
In 2015, we entered into an OLED patent portfolio license agreement with Sumitomo in which the Company granted Sumitomo a non-exclusive, world-wide, royalty bearing license to make and sell OLED lighting panels using a solution based manufacturing process. The patent license extends for the term of our current patents and pending applications. The license includes a non-refundable license fee, and running royalties based on Sumitomo's future sales revenues of licensed products.
BOE
In 2013, we entered into an evaluation agreement with BOE for the evaluation of our materials and technology for use in the manufacture of PHOLED display products. The parties extended and expanded the evaluation agreement in 2015 to provide additional OLED materials for purchase by BOE under the evaluation agreement. In 2016, we entered into a new commercial supply agreement with BOE which provides for BOE's continued evaluation and commercial use of our proprietary PHOLED materials.
Sony
We have been supporting Sony in its development of AMOLED display products for many years. We have supplied, and intend to continue supplying our proprietary PHOLED materials to Sony for evaluation and for potential commercial applications.
Innolux
We have been working with Innolux and its predecessor companies since 2007, when we entered into an agreement to supply our proprietary PHOLED materials and technologies to Chi Mei EL Corporation (CMEL) for use in its manufacture of commercial AMOLED display products. In May 2012, we entered into a Commercial Material Supply Agreement, and in August 2013, we extended our current Evaluation Agreement. We continue to supply our proprietary PHOLED materials to Innolux in support of their OLED development efforts.
Pioneer
We have been supplying our proprietary PHOLED materials to Tohoku Pioneer, a subsidiary of Pioneer, for the commercial production of passive matrix OLED (PMOLED) display products since 2003. In 2011, we entered into a separate license agreement with Pioneer for its manufacture and sale of OLED lighting products.
Kaneka
In 2013, we entered into a license agreement with Kaneka for the manufacture and sale of OLED lighting products. In April 2014, we entered into a Commercial Material Supply Agreement with Kaneka.
Konica Minolta
We have been supplying our proprietary PHOLED materials to Konica Minolta for evaluation, and we have been supporting Konica Minolta in its efforts to develop OLED lighting products for many years. In 2008, we entered into a technology license agreement with Konica Minolta for its manufacture and sale of OLED lighting products that utilize our phosphorescent and other OLED technologies.
8
Lumiotec
In January 2012, we entered into a technology license agreement with Lumiotec for its manufacture and sale of OLED lighting products utilizing our phosphorescent and other OLED technologies. The agreement was extended in 2015.
LG Chem
We have entered into an evaluation agreement to supply LG Chem, Ltd. (LG Chem) with our proprietary PHOLED materials for use in the development of OLED products. We have also entered into short-term commercial sales agreements with LG Chem, as needed, for their OLED manufacturing needs, which generates commercial chemical sales and license fee revenues from our supply of materials to LG Chem. In late 2015, LG Display announced that it is acquiring the OLED lighting business of LG Chem. We intend to continue our LG Chem OLED lighting relationship with LG Display and cooperate in the transition of the relevant business operations and associated contractual and support services from LG Chem to LG Display.
NEC Lighting
We have been supplying our proprietary PHOLED materials to NEC Lighting, Ltd. (NEC Lighting) for the manufacture of sample OLED lighting products. NEC Lighting has publicly exhibited OLED lighting panels that utilize our proprietary PHOLED materials and technology.
Osram
In 2015, we entered into an evaluation agreement with Osram for the evaluation of our materials and technology for use in manufacturing OLED lighting products, including automotive OLED lighting products.
OLEDWorks
In 2015, we entered into an OLED patent license agreement and an OLED commercial supply agreement with OLEDWorks for use in OLED lighting products. The patent license agreement extends for the term of the applicable patent and patent applications. In 2015, OLEDWorks announced and completed an acquisition of OLED-related lighting assets from Philips, which had been a contracting customer of our proprietary PHOLED materials. the Company has extended rights under the OLEDWorks license agreement and commercial supply agreement to OLEDWorks GmbH, the German company and facility acquired by OLEDWorks from Philips. These rights were granted for as long as OLEDWorks GmbH is a wholly owned affiliate of OLEDWorks.
Our OLED Materials Supply Business
In support of our OLED licensing business, we supply our proprietary UniversalPHOLED materials to display manufacturers and others. We qualify our materials in OLED devices before shipment in order to ensure that they meet required specifications. We believe that our inventory-carrying practices, along with the terms under which we sell our OLED materials (including payment terms), are typical for the markets in which we operate. In 2015, our OLED materials business received recertification in accordance with ISO 9001:2008 Quality Management Systems standards and guidelines.
PPG Industries
We have maintained a close working relationship with PPG Industries since 2000. In 2011, we entered into an agreement with PPG Industries, the term of which continues through December 31, 2017 and shall be automatically renewed for additional one year terms, unless terminated by us with prior notice of one year or terminated by PPG Industries with prior notice of two years. Under that agreement, PPG Industries is responsible, under our direction, for manufacturing scale-up of our proprietary OLED materials, and for supplying us with those materials for research and development, and for resale to our customers, both for their evaluation and for use in commercial OLED products. Through our collaboration with PPG Industries, key raw materials are sourced from multiple suppliers to ensure that we are able to meet the needs of our customers on a timely basis. The raw materials we require for our emitter and host materials are available from multiple sources and historically, we have not had any issues with obtaining access to adequate amounts of any key raw materials.
Our OLED Material Customers
Throughout 2015, we continued supplying our proprietary UniversalPHOLED materials to SDC for use in its commercial AMOLED display products and for its development efforts. SDC is currently the largest manufacturer of AMOLED displays for handset and other personal electronic devices. SDC’s customers for these products have included many well-known consumer electronics companies throughout the world.
In 2015, we also supplied our proprietary UniversalPHOLED materials to LG Display for use in its commercial AMOLED display products, to Tohoku Pioneer for use in its commercial PMOLED display products, and Konica Minolta for its manufacture of commercial OLED lighting products. During the year, we also supplied our proprietary OLED materials to these and various other product manufacturers for evaluation and for purposes of development, manufacturing qualification and product testing.
9
Collaborations with Other OLED Material Manufacturers
We continued our non-exclusive collaborative relationships with other manufacturers of OLED materials during 2015, including Nippon Steel and Sumikin Chemical Co., Ltd. (NSCC). Most of these relationships are focused on matching our proprietary PHOLED emitters with the host and other OLED materials of these companies. In 2012 we also entered into an agreement with Duksan Hi-Metal Company Limited (Duksan) to provide us host sublimation services in Korea. We believe that collaborative relationships such as these are important for ensuring success of the OLED industry and broader adoption of our PHOLED and other OLED technologies.
Research and Development
Our research and development activities are focused on the advancement of our OLED technologies and materials for displays, lighting and other applications. We conduct this research and development both internally and through various relationships with our commercial business partners and academic institutions. In the years 2015, 2014 and 2013, we incurred expenses of $44.6 million, $41.2 million and $34.2 million, respectively, on both internal and third-party sponsored research and development activities with respect to our various OLED technologies and materials.
Internal Development Efforts
We conduct a substantial portion of our OLED development activities at our state-of-the-art development and testing facility in Ewing, New Jersey. At this newly expanded facility, which now exceeds 50,000 square feet, we perform technology development, including device and process optimization, prototype fabrication, manufacturing scale-up studies, process and product testing, characterization and reliability studies, and technology transfer with our business partners.
Our Ewing facility houses multiple OLED deposition systems, including a full-color flexible OLED system, a system for fabricating solution-processible OLEDs, and an OVJP organic vapor jet printing system. In addition, the facility contains equipment for substrate patterning, organic material deposition, display packaging, module assembly and extensive testing in Class 100 and 100,000 clean rooms and opto-electronic test laboratories. Our facility also includes state-of-the-art synthetic and analytical chemistry laboratories in which we conduct OLED materials research and make small quantities of new materials that we then test in OLED devices.
As of December 31, 2015, we employed a team of 86 research scientists, engineers and laboratory technicians in both our Ewing and Hong Kong facilities. This team includes chemists, physicists, engineers and technicians with physics, electrical engineering, mechanical engineering and organic/inorganic chemistry backgrounds, and highly-trained theoreticians and experimentalists.
University Sponsored Research
We have long-standing relationships with Princeton University and USC, dating back to 1994, for the conduct of research relating to our OLED and other organic thin-film technologies and materials for applications such as displays and lighting. This research had been performed at Princeton under the direction of Professor Forrest and at USC under the direction of Professor Thompson. In 2006, Professor Forrest transferred to the University of Michigan, where we continue to fund his research.
We funded research at Princeton under a research agreement executed in 1997 (the 1997 Research Agreement). The 1997 Research Agreement was allowed to expire in 2007, after Professor Forrest transferred to Michigan. We have exclusive license rights to all OLED and other thin-film organic electronic patents (other than for organic photovoltaic solar cells) arising out of research conducted under that agreement.
In connection with Professor Forrest’s transfer to Michigan, in 2006 we entered into a new sponsored research agreement with USC under which we are funding organic electronics research being conducted by Drs. Forrest and Thompson (the 2006 Research Agreement). Work by Professor Forrest is being funded through a subcontract between USC and Michigan. As with the 1997 Research Agreement, we have exclusive license rights to all OLED and thin-film organic electronic patents (other than for organic photovoltaic solar cells) arising out of this research.
Effective June 1, 2013, we amended the 2006 Research Agreement again to extend the term of the agreement for an additional four years. As of December 31, 2015, we are obligated to reimburse the universities for up to approximately $3.5 million in actual costs to be incurred for research conducted under the remaining term of the agreement, which expires April 30, 2017.
In 2005, we entered into a separate sponsored research agreement with Princeton to fund research under the direction of Professor Sigurd Wagner on thin-film encapsulation and fabrication of OLED devices. This research was completed as of December 31, 2013. Like our other relationships with Princeton, we have exclusive license rights to all patents arising out of the research.
We entered into a sponsored research agreement with the Yuen Tjing Ling Industrial Research Institute of National Taiwan University in 2004. Under that agreement, we funded a research program under the direction of Professor Ken-Tsung Wong relating to new OLED materials. We have exclusive rights to all intellectual property developed under that program, which was extended through February 2016.
10
We entered into a contract research agreement with the Chitose Institute of Science and Technology of Japan (CIST) in 2004. Under that agreement, we funded a research program headed by Professor Chihaya Adachi relating to high-efficiency OLED materials and devices. We were granted exclusive rights to all intellectual property developed under this program. Our relationship with CIST ended in 2006 when Professor Adachi transferred to Kyushu University. However, we have continued our relationship with Professor Adachi under a separate consulting arrangement.
In 2006 and 2007, we entered into one-year research agreements with Kyung Hee University to sponsor research programs on flexible, amorphous silicon thin-film transistor (TFT) backplane technology. The programs were directed by Professor Jin Jang. In 2008 and 2009, we entered into contract research agreements with Silicon Display Technology, Ltd. (SDT), a company founded by Professor Jang, and in 2013, we entered into another one-year agreement with SDT. We continue to maintain a good working relationship with Professor Jang.
Aixtron
In 2000, we entered into a development and license agreement with Aixtron AG of Aachen, Germany to develop and commercialize equipment used in the manufacture of OLEDs using the OVPD process. Under this agreement, we granted Aixtron an exclusive license to produce and sell its equipment for the manufacture of OLEDs and other devices using our proprietary OVPD process. Aixtron is required to pay us royalties on its sales of this equipment. Purchasers of the equipment also must obtain rights to use our proprietary OVPD process to manufacture OLEDs and other devices using the equipment, which they may do through us or Aixtron. If these rights are granted through Aixtron, Aixtron is required to make additional payments to us under our agreement.
Aixtron has reported to us the delivery of nine OVPD systems since 2002. These include two second-generation systems, one of which was sold to the Fraunhofer Institute for Photonic Microsystems in Dresden, Germany in 2007, and the other of which was sold to RiTdisplay Corporation of Taiwan in 2003. We record royalty income from Aixtron’s sales of these various systems in the quarters in which Aixtron notifies us of the sale and the related royalties are due.
U.S. Government-Funded Research
We have entered into several U.S. government contracts and subcontracts to fund a portion of our efforts to develop next-generation OLED technologies. On contracts for which we were the prime contractor, we subcontract portions of the work to various entities and institutions. We also serve as a subcontractor under certain of our government contracts with PPG Industries. All of our government contracts and subcontracts are subject to termination at the election of the contracting governmental agency.
Our government-funded programs are concentrated primarily in two areas: flexible OLEDs and OLEDs for lighting. We have received support for our work on flexible OLED technology through various U.S. Department of Defense (DOD) agencies, including the Army Research Laboratory (ARL), the Air Force Research Laboratory (AFRL), the Army Communications-Electronics Research Development and Engineering Center (CERDEC) and the National Science Foundation (NSF). The U.S. Department of Energy (DOE) supports our work on white OLEDs for lighting, including through its Solid State Lighting (SSL) initiative. Several of our key U.S. government program initiatives in 2015 were as follows:
Technology Development for OLED Lighting
During 2015, we continued working to develop technical approaches for using our proprietary PHOLED and other OLED technologies for high-efficiency white lighting applications. In 2015, we received funding from the DOE to work with Arizona State University and the University of Michigan.
The FlexTech Alliance
We are a member of the FlexTech Alliance, Inc. (formerly the United States Display Consortium), an organization devoted to fostering the growth, profitability and success of the electronic display and the flexible, printed electronics supply chain. The role of the FlexTech Alliance is to offer expanded collaboration between and among industry, academia, government and research organizations for advancing displays and flexible, printed electronics from R&D to commercialization. The FlexTech Alliance has approximately 74 members, as well as additional development partners, including companies, universities and R&D organizations.
OLED Association
We are a charter member of the OLED Association (OLED-A). OLED-A is a trade association whose mission involves serving as an OLED information resource, driving OLED technology development, and promoting interest in OLED products. We are one of 18 members of OLED-A, and we actively participate on its marketing and technology committees. Mike Hack, our Vice President of Business Development, serves as a member of the Board of Directors of OLED-A.
11
Next Generation Lighting Industry Alliance
We joined the Next Generation Lighting Industry Alliance (NGLIA) in 2009. NGLIA was formed in 2003 to foster industry-government partnership to accelerate the technical foundation, and ultimate commercialization, of solid state lighting systems. NGLIA was designated in 2005 as the “industry partner” by DOE for its SSL program. The SSL program is being undertaken to research, develop and conduct demonstration activities on advanced solid state white lighting technologies based on LEDs and OLEDs. We are one of 15 members of NGLIA.
OLED Lighting Coalition
We are a founding member of the OLED Lighting Coalition, a subgroup of OLED-A and NGLIA. The OLED Lighting Coalition is a group of U.S. companies and advocates of OLED technology joined together to promote the OLED lighting industry to the government, public and the lighting community. Mike Hack, our Vice President of Business Development, serves as a member of the Board of Directors of the OLED Lighting Coalition.
Intellectual Property
Along with our personnel, our primary and most fundamental assets are patents and other intellectual property. This includes numerous U.S. and foreign patents and patent applications that we own, exclusively license or have the sole right to sublicense. It also includes a substantial body of non-patented technical know-how that we have accumulated over time.
Our Patents
Our research and development activities, conducted both internally and through collaborative programs with our partners, have resulted in the filing of a substantial number of patent applications relating to our OLED technologies and materials. As of December 31, 2015, we owned, through assignment to us alone or jointly with others, 355 pending U.S. applications (active U.S. cases and international applications designated in the U.S.) and 532 U.S. patents, together with counterparts filed in various foreign countries. These owned patents will start expiring in the U.S. in 2020.
Patents We License from Princeton, USC and Michigan
We exclusively license many of our patent rights, including certain of our key PHOLED technology patents, under the 1997 Amended License Agreement. In 2006, based on Professor Forrest’s transfer to Michigan that year, Michigan was added as a party to this agreement. As of December 31, 2015, the patent rights we license from these universities included 265 issued U.S. patents, 91 pending U.S. patent applications, together with counterparts filed in various foreign countries. The earliest of these patents expired in the U.S. in 2014, while our key PHOLED technology patents licensed from these universities will start expiring in the U.S. in 2017.
Under the 1997 Amended License Agreement, Princeton, USC and Michigan granted us worldwide, exclusive license rights to specified patents and patent applications relating to OLED technologies and materials (including our PHOLED technology and materials). Our license rights also extend to any patent rights arising out of the research conducted by Princeton, USC or Michigan under our various research agreements with these entities. We are free to sublicense to third parties all or any portion of our patent rights under the 1997 Amended License Agreement. The term of the 1997 Amended License Agreement continues for the lifetime of the licensed patents, though it is subject to termination for an uncured material breach or default by us, or if we become bankrupt or insolvent.
Princeton is primarily responsible for the filing, prosecution and maintenance of all patent rights licensed to us under the 1997 Amended License Agreement pursuant to an inter-institutional agreement between Princeton, USC and Michigan. However, we manage this process and have the right to instruct patent counsel on specific matters to be covered in any patent applications filed by Princeton. We are required to bear all costs associated with the filing, prosecution and maintenance of these patent rights.
We are required under the 1997 Amended License Agreement to pay Princeton royalties for licensed products sold by us or our sublicensees. These royalties amount to 3% of the net sales price for licensed products sold by us and 3% of the revenues we receive for licensed products sold by our sublicensees. These royalty rates are subject to renegotiation for products not reasonably conceivable as arising out of the research agreements if Princeton reasonably determines that the royalty rates payable with respect to these products are not fair and competitive. Princeton shares portions of these royalties with USC and Michigan under their inter-institutional agreement.
We have a minimum royalty obligation of $100,000 per year during the term of the 1997 Amended License Agreement. We owe royalties under the 1997 Amended License Agreement with Princeton of $5.4 million for 2015. We also are required under the 1997 Amended License Agreement to use commercially reasonable efforts to bring the licensed OLED technology to market. However, this requirement is deemed satisfied if we invest a minimum of $800,000 per year in research, development, commercialization or patenting efforts respecting the patent rights licensed to us under the 1997 Amended License Agreement.
12
Patents We Acquired from Motorola
In 2000, we entered into a license agreement with Motorola whereby Motorola granted us perpetual license rights to what are now 74 issued U.S. patents relating to Motorola’s OLED technologies, together with foreign counterparts in various countries. These patents expire in the U.S. between 2014 through 2018.
In 2011, we purchased these patents from Motorola, including all existing and future claims and causes of action for any infringement of the patents. This effectively terminated our license agreement with Motorola, including any obligation to make royalty payments to Motorola. In consideration for Motorola assigning and transferring the patents to us, we made a one-time cash payment to Motorola of $440,000, and we granted Motorola a royalty-free, non-exclusive and non-sublicensable license under the patents for use by Motorola and its affiliates in their respective businesses.
Patents We Acquired from Fujifilm Corporation
In 2012, we entered into a Patent Sale Agreement (the Agreement) with Fujifilm. Under the Agreement, Fujifilm sold more than 1,200 OLED-related patents and patent applications for a total cost of $109.5 million. The Agreement contains customary representations and warranties and covenants, including respective covenants not to sue by both parties thereto. The Agreement permitted us to assign all of our rights and obligations under the Agreement to our affiliates, and we assigned, prior to the consummation of the transactions contemplated by the Agreement, our rights and obligations to UDC Ireland Limited (UDC Ireland), a wholly-owned subsidiary formed under the laws of the Republic of Ireland. The transactions contemplated by the Agreement were consummated on July 26, 2012.
Intellectual Property Developed under Our Government Contracts
We and our subcontractors have developed, and may continue to develop, patentable OLED technology inventions under our various U.S. government contracts and subcontracts. Under these arrangements, we or our subcontractors generally can elect to take title to any patents on these inventions, and to control the manner in which these patents are licensed to third parties. However, the U.S. government reserves rights to these inventions and associated technical data that could restrict our ability to market them to the government for military and other applications, or to third parties for commercial applications. In addition, if the U.S. government determines that we or our subcontractors have not taken effective steps to achieve practical application of these inventions in any field of use in a reasonable time, the government may require that we or our subcontractors license these inventions to third parties in that field of use.
Non-patented Technical Know-How
We have accumulated, and continue to accumulate, a substantial amount of non-patented technical know-how relating to OLED technologies and materials. Where practicable, we share portions of this information with display manufacturers and other business partners on a confidential basis. We also employ various methods to protect this information from unauthorized use or disclosure, although no such methods can afford complete protection. Moreover, because we derive some of this information and know-how from academic institutions such as Princeton, USC and Michigan, there is an increased potential for public disclosure. We also cannot prevent the actual independent development of the same or similar information and know-how by third parties.
Competition
The industry in which we operate is highly competitive. We compete against alternative flat panel display technologies, in particular LCDs, as well as other OLED technologies. We also compete in the lighting market against incumbent technologies, such as incandescent bulbs, fluorescent lamps, inorganic LEDs and emerging technologies, such as other OLED technologies.
Flat Panel Display Industry Competitors
Numerous domestic and foreign companies have developed or are developing and improving LCD and other flat panel display technologies that compete with our OLED display technologies. We believe that OLED display technologies ultimately can compete with LCDs and other display technologies for many product applications on the basis of lower power consumption, better contrast ratios, faster video rates, form factor and lower manufacturing cost. However, other companies may succeed in continuing to improve these competing display technologies, or in developing new display technologies, that are superior to OLED display technologies in various respects. We cannot predict the timing or extent to which such improvements or developments may occur.
Lighting Industry Competitors
Although there has been a movement to phase out traditional incandescent bulbs throughout many countries, traditional incandescent bulbs and fluorescent lamps remain well-entrenched products in the lighting industry. In addition, compact fluorescent lamps and solid-state LEDs have recently been introduced into the market and would compete with OLED lighting products. Having attributes different from fluorescent lamps and LEDs, OLEDs may compete directly with these products for certain lighting applications. However, manufacturers of LEDs and compact fluorescent lamps may succeed in more broadly adapting their products to various lighting applications, or others may develop competing solid-state lighting technologies that are superior to OLEDs. Again, we cannot predict whether or when this might occur.
13
OLED Technology and Materials Competitors
Eastman Kodak Company (Kodak) developed and patented the original fluorescent OLED technology in 1987. Cambridge Display Technology, Ltd. (CDT), which was acquired by Sumitomo Chemical Company in 2007, developed and patented polymer OLED technology in 1989. Display and lighting manufacturers, including customers of ours, are engaged in their own OLED research, development and commercialization activities, and have developed and may continue to develop proprietary OLED technologies that are necessary or useful for commercial OLED devices. In addition, other material manufacturers, such as Sumitomo, Idemitsu Kosan Co., Ltd. (Idemitsu Kosan), Merck KGaA and BASF Corporation, are selling or sampling competing OLED materials to customers, including companies to which we sell our proprietary PHOLED materials.
Our licensing business is based on our control of a broad portfolio of OLED-related device patents and technology. We believe this portfolio includes fundamental patents in the field of phosphorescent OLED materials and devices, as well as certain additional complementary OLED technologies. As discussed above, alternative technologies, such as fluorescent OLED emitter materials, exist and could be competitive to our phosphorescent OLED material solutions. However, fluorescent materials have characteristics that we believe many market participants consider less desirable than those of phosphorescent materials. Suppliers of fluorescent emitter materials include Dow Chemical (previously Gracel Display), Doosan Electronics, SFC Co. Ltd. and Idemitsu Kosan. Fluorescent materials may also be viewed as complementary in that they can be used in the same OLED stack as phosphorescent materials, especially for use as emitters for generating deep blue pixels in display modules until such time as the OLED industry improves the properties of currently available deep blue phosphorescent materials.
The competitive landscape with respect to our host materials business is characterized by a larger number of established chemical material suppliers who have long-term relationships with many of our existing customers and licensees. We have elected to partner with certain of these companies to manufacture and deliver our host solutions to our customers, as well as selling our host materials directly to device manufacturers. We believe our competitive advantage stems, in part, from our deep knowledge of our phosphorescent emitter materials, which are complementary with the host solutions. We believe that our understanding of the phosphorescent emitter materials enables us to create host material solutions that are especially well suited for use with a certain class of emitter materials that are implemented commercially today. However, we note that many of our technology partners have their own host solutions and the competitive landscape includes many well-established companies such as Dow Chemical, Idemitsu Kosan, NSCC, Doosan Electronics, Merck KGaA, Cheil Industries and Duksan, which have significant resources and may aggressively pursue such business in the future.
Our existing business relationships with SDC and other product manufacturers suggest that our OLED technologies and materials, particularly our PHOLED technologies and materials, may achieve a significant level of market penetration in the flat panel display and lighting industries. However, others may succeed in developing new OLED technologies and materials that may supplement or be utilized in place of ours. We cannot be sure of the extent to which product manufacturers will adopt and continue to utilize our OLED technologies and materials for the production of commercial flat panel displays and lighting products.
Employees
As of December 31, 2015, we had 153 active full-time employees and one part-time employee, none of whom are unionized. We believe that relations with our employees are good.
Our Company History
Our corporation was organized under the laws of the Commonwealth of Pennsylvania in 1985. Our business was commenced in 1994 by a company then known as Universal Display Corporation, which had been incorporated under the laws of the State of New Jersey. In 1995, a wholly-owned subsidiary of ours merged into this New Jersey corporation. The surviving corporation in this merger became a wholly-owned subsidiary of ours and changed its name to UDC, Inc. Simultaneously with the consummation of this merger, we changed our name to Universal Display Corporation. UDC, Inc. functions as an operating subsidiary of ours and has certain overlapping officers and directors. We have also formed other wholly-owned subsidiaries, including Universal Display Corporation Hong Kong, Ltd. (2008), Universal Display Corporation Korea, Y.H. (2010), Universal Display Corporation Japan, G.K. (2011) and UDC Ireland Limited (2012), and we established a representative office in Taiwan (2011).
Our Compliance with Environmental Protection Laws
We are not aware of any material effects that compliance with Federal, State or local environmental protection laws or regulations will have on our business. We have not incurred substantial costs to comply with any environmental protection laws or regulations, and we do not anticipate having to do so in the foreseeable future.
14
Our Internet Site
Our Internet address is www.udcoled.com. We make available through our Internet website, free of charge, our annual reports on Form 10-K, quarterly reports on Form 10-Q, current reports on Form 8-K and amendments to those reports filed or furnished pursuant to Section 13(a) or 15(d) of the Securities Exchange Act of 1934 as soon as reasonably practicable after we file such material with the Securities and Exchange Commission (the SEC). In addition, we have made available on our Internet website under the heading “Corporate Governance” the charter for the Audit Committee of our Board of Directors, the charter for the Compensation Committee of our Board of Directors, the charter for the Nominating & Corporate Governance Committee of our Board of Directors, our Code of Ethics & Business Conduct for Employees, and our Code of Conduct for Directors. We intend to make available on our website any future amendments or waivers to our Code of Ethics & Business Conduct for Employees and our Code of Conduct for Directors. The information on our Internet site is not part of this report.
ITEM 1A. | RISK FACTORS |
You should carefully consider the following risks and uncertainties when reading this Annual Report on Form 10-K. The following factors, as well as other factors affecting our operating results and financial condition, could cause our actual future results and financial condition to differ materially from those projected.
If we cannot obtain and maintain appropriate patent and other intellectual property protection for our OLED technologies and materials, our business will suffer.
The value of our OLED technologies and materials is dependent on our ability to secure and maintain appropriate patent and other intellectual property rights protection. Although we own or license many patents respecting our OLED technologies and materials that have already been issued, there can be no assurance that additional patents applied for will be obtained, or that any of these patents, once issued, will afford commercially significant protection for our OLED technologies and materials, or will be found valid if challenged. Also, there is no assurance that we will be successful in defending the validity of our current or future patents in pending and future patent oppositions, invalidation trials, interferences, reexaminations, reissues, or other administrative or court proceedings. Moreover, we have not obtained patent protection for some of our OLED technologies and materials in all foreign countries in which OLED products or materials might be manufactured or sold.
We believe that the strength of our current intellectual property position results primarily from the essential nature of our fundamental patents covering phosphorescent OLED devices and certain materials utilized in these devices. Our existing fundamental phosphorescent OLED patents expire in the United States in 2017 and 2019, and in other countries of the world in 2018 and 2020. While we hold a wide range of additional patents and patent applications whose expiration dates extend (and in the case of patent applications, will extend) beyond 2020, many of which are also of importance in the OLED industry, none are of an equally essential nature as our fundamental patents, and therefore our competitive position may be less certain as these patents expire.
We may become engaged in litigation to protect or enforce our patent and other intellectual property rights, or in International Trade Commission proceedings to abate the importation of goods that would compete unfairly with those of our licensees. In addition, we are participating in or have participated in, and in the future will likely have to participate in, interference, reissue, or reexamination proceedings before the U.S. Patent and Trademark Office, and opposition, nullity or other proceedings before foreign patent offices, with respect to some of our patents or patent applications. All of these actions place our patents and other intellectual property rights at risk and may result in substantial costs to us as well as a diversion of management attention from our business and operations. Moreover, if successful, these actions could result in the loss of patent or other intellectual property rights protection for the key OLED technologies and materials on which our business depends.
We rely, in part, on several non-patented proprietary technologies to operate our business. Others may independently develop the same or similar technologies or otherwise obtain access to our unpatented technologies. Furthermore, these parties may obtain patent protection for such technology, inhibiting or preventing us from practicing the technology. To protect our trade secrets, know-how and other non-patented proprietary information, we require employees, consultants, financial advisors and strategic partners to enter into confidentiality agreements. These agreements may not ultimately provide meaningful protection for our trade secrets, know-how or other non-patented proprietary information. In particular, we may not be able to fully or adequately protect our proprietary information as we conduct discussions with potential strategic partners. Additionally, although we take many measures to prevent theft and misuse of our proprietary information, we may face attempts by others to gain unauthorized access through the Internet to our information technology systems or to our intellectual property, which might be the result of industrial or other espionage or actions by hackers seeking to harm our company or its products. If we are unable to protect the proprietary nature of our technologies, it will harm our business.
15
We or our licensees may incur substantial costs or lose important rights as a result of litigation or other proceedings relating to our patent and other intellectual property rights or with respect to our OLED materials business.
There are a number of other companies and organizations that have been issued patents and are filing patent applications relating to OLED technologies and materials, including, without limitation, Kodak (substantially all of whose OLED assets were sold to a group of LG companies in 2009), CDT (acquired by Sumitomo in 2007), Canon, Inc., Semiconductor Energy Laboratories Co., Idemitsu Kosan and Mitsubishi Chemical Corporation. As a result, there may be issued patents or pending patent applications of third parties that would be infringed by the use of our OLED technologies or materials, thus subjecting our licensees to possible suits for patent infringement in the future. Such lawsuits could result in our licensees being liable for damages or require our licensees to obtain additional licenses that could increase the cost of their products. This, in turn, could have an adverse effect on our licensees’ sales and thus our royalties, or cause our licensees to seek to renegotiate our royalty rates. In addition, we have agreed to indemnify customers purchasing our OLED materials for commercial usage against certain claims of patent infringement by third parties, as a result of which we may incur substantial legal costs in connection with defending these customers from such claims.
Our licensees may also seek to avoid paying future royalties by attempting to have our patents declared invalid and unenforceable by a court. Our licensees may be more likely to file such declaratory actions in light of the U.S. Supreme Court’s decision in MedImmune, Inc. v. Genentech, Inc. (2007), in which the Court found that a licensee need not refuse to pay royalties and commit material breach of the license agreement before bringing an action to declare a licensed U. S. patent invalid and unenforceable.
In addition, we may be required, from time-to-time, to assert our intellectual property rights by instituting legal proceedings against others. We cannot be assured that we will be successful in enforcing our patents in any lawsuits we may commence. Defendants in any litigation we may commence to enforce our patents may attempt to establish that our patents are invalid or are unenforceable. Thus, any patent litigation we commence could lead to a determination that one or more of our patents are invalid or unenforceable. If a third party succeeds in invalidating one or more of our patents, that party and others could compete more effectively against us. Our ability to derive licensing revenues from products or technologies covered by these patents would also be adversely affected.
Whether our licensees are defending the assertion of third-party intellectual property rights against their businesses arising as a result of the use of our technology, or we are asserting our own intellectual property rights against others, such litigation can be complex, costly, protracted and highly disruptive to our or our licensees’ business operations by diverting the attention and energies of management and key technical personnel. As a result, the pendency or adverse outcome of any intellectual property litigation to which we or our licensees are subject could disrupt business operations, require the incurrence of substantial costs and subject us or our licensees to significant liabilities, each of which could severely harm our business. Costs associated with these actions are likely to increase as AMOLED products using our PHOLED and other OLED technologies and materials enter the consumer marketplace.
Plaintiffs in intellectual property cases often seek injunctive relief in addition to money damages. Any intellectual property litigation commenced against our licensees may force them to take actions that could be harmful to their businesses and thus to our royalties, including the halting of sales of products that incorporate or otherwise use our technology or materials.
Furthermore, the measure of damages in intellectual property litigation can be complex, and is often subjective or uncertain. If our licensees were to be found liable for infringement of proprietary rights of a third party, the amount of damages they might have to pay could be substantial and is difficult to predict. Decreased sales of our licensees’ products incorporating our technology or materials would have an adverse effect on our royalty revenues under existing licenses and material sales under our existing sales agreements. Were this to occur, it would likely harm our ability to (i) obtain new licensees which would have an adverse effect on the terms of the royalty arrangements we could enter into with any new licensees, and (ii) sell our UniversalPHOLED materials to existing and new customers. Moreover, to the extent any third party claims are directed specifically to materials supplied by us to our customers, we may be required to incur significant costs associated with the defense of such claims and potential damages associated with such claims that may be awarded against our customers.
As is commonplace in technology companies, we employ individuals who were previously employed at other technology companies. To the extent our employees are involved in research areas that are similar to those areas in which they were involved at their former employers, we may be subject to claims that such employees or we have, inadvertently or otherwise, used or disclosed the alleged trade secrets or other proprietary information of the former employers. Litigation may be necessary to defend against such claims. The costs associated with these actions or the loss of rights critical to our or our licensees’ businesses could negatively impact our revenues or cause our business to fail.
16
Recent court decisions in various patent cases may make it more difficult for us to obtain future patents, enforce our patents against third parties or obtain favorable judgments in cases where the patents are enforced.
Recent case law may make it more difficult for patent holders to secure future patents and/or enforce existing patents. For example, in KSR International Co. vs. Teleflex, Inc. (2007), the U.S. Supreme Court mandated a more expansive and flexible approach to determine whether a patent is obvious and invalid. As a result of the less rigid approach to assessing obviousness, defending the validity of or obtaining patents may be more difficult.
Recent court decisions may also impact the enforcement of our patents. For example, we may not be able to enjoin certain third party uses of products or methods covered by our patents following the initial authorized sale, even where those uses are expressly proscribed in an agreement with the buyer. Also, we may face increased difficulty enjoining infringement of our patents. The U.S. Supreme Court has held that an injunction should not automatically issue based on a finding of patent infringement, but should be determined based on a test balancing considerations of the patentee’s interest, the infringer’s interest, and the public’s interest. Obtaining enhanced damages for willful infringement of our patents may also be more difficult even in those cases where we successfully prove a third party has infringed our patents, as a recent case set a more stringent standard for proving willful infringement.
Therefore, as a result of such rulings, it may be more difficult for us to defend our currently issued patents, obtain additional patents in the future or achieve the desired competitive effect even when our patents are enforced. If we are unable to so defend our currently issued patents, or to obtain new patents for any reason, our business would suffer.
If we cannot form and maintain lasting business relationships with OLED product manufacturers, our business strategy will fail.
Our business strategy ultimately depends upon our development and maintenance of commercial licensing and material supply relationships with high-volume manufacturers of OLED products. We have entered into only a limited number of such relationships from which most of our material sales and licensing revenue are generated. Our other relationships with product manufacturers currently are limited to technology development and the evaluation of our OLED technologies and materials for possible use in commercial products. Some or all of these relationships may not succeed or, even if they are successful, may not result in the product manufacturers entering into commercial licensing and material supply relationships with us.
Many of our agreements with product manufacturers last for only limited periods of time, such that our relationships with these manufacturers will expire unless they are renewed. These product manufacturers may not agree to renew their relationships with us on a continuing basis or may agree to do so on terms that are less favorable to us. In addition, we regularly continue working with product manufacturers after our existing agreements with them have expired while we are attempting to negotiate contract extensions or new agreements with them. Should our relationships with the various product manufacturers not continue or be renewed on less favorable terms, or if we are not able to identify other product manufacturers and enter into contracts with them, our business may materially suffer.
Our ability to enter into additional commercial licensing and material supply relationships, or to maintain our existing relationships, may depend on our ability to make certain financial or other commitments. We might not be able, for financial or other reasons, to enter into or continue these relationships on commercially acceptable terms, or at all. Failure to do so may cause our business strategy to fail.
If we fail to make advances in our OLED research and development activities, we might not succeed in commercializing our OLED technologies and materials.
Further advances in our OLED technologies and materials depend, in part, on the success of the research and development work we conduct, both alone and with our research partners. We cannot be certain that this work will yield additional advances in the research and development of these technologies and materials.
Our research and development efforts remain subject to all of the risks associated with the development of new products based on emerging and innovative technologies, including, without limitation, unanticipated technical or other problems and the possible insufficiency of funds for completing development of these products. Technical problems may result in delays and cause us to incur additional expenses that would increase our losses. If we cannot complete research and development of our OLED technologies and materials successfully, or if we experience delays in completing research and development of our OLED technologies and materials for use in potential commercial applications, particularly after incurring significant expenditures, our business may fail.
17
Conflicts or other problems may arise with our licensees or joint development partners, resulting in renegotiation, breach or termination of, or litigation related to, our agreements with them. This would adversely affect our revenues.
Conflicts or other problems could arise between us and our licensees or joint development partners, some of which we have made strategic investments in, as to royalty rates, milestone payments or other commercial terms. Similarly, we may disagree with our licensees or joint development partners as to which party owns or has the right to commercialize intellectual property that is developed during the course of the relationship or as to other non-commercial terms. If such a conflict were to arise, a licensee or joint development partner might attempt to compel renegotiation of certain terms of their agreement or terminate their agreement entirely, and we might lose the royalty revenues and other benefits of the agreement. Either we or the licensee or joint development partner might initiate litigation to determine commercial obligations, establish intellectual property rights or resolve other disputes under the agreement. Such litigation could be costly to us and require substantial attention of management. If we were unsuccessful in such litigation, we could lose the commercial benefits of the agreement, be liable for financial damages and suffer losses of intellectual property or other rights that are the subject of dispute.
If our OLED technologies and materials are not feasible for broad-based product applications, we may not be able to continue to generate revenues sufficient to support ongoing operations.
Our main business strategy is to license our OLED technologies and sell our OLED materials to manufacturers for incorporation into the flat panel display and lighting products that they sell. Consequently, our success depends on the ability and willingness of these manufacturers to develop, manufacture and sell commercial products integrating our technologies and materials.
Before product manufacturers will agree to expand the use of our OLED technologies and materials for wider scale commercial production, they will likely require us to demonstrate to their satisfaction that our OLED technologies and materials are feasible for broad-based product applications beyond current commercial application, such as smartphones, wearables and television displays. This, in turn, may require additional advances in our technologies and materials, as well as those of others, for applications in a number of areas, including, without limitation, advances with respect to the development of:
• | OLED materials with improved lifetimes, efficiencies and color coordinates for larger area full-color OLED displays and general lighting products; |
• | more robust OLED materials for use in more demanding large-scale manufacturing environments; and |
• | scalable and cost-effective methods and technologies for the fabrication of large volume OLED materials and products. |
We cannot be certain that these advances will occur, and hence our OLED technologies and materials may not be feasible for additional broad-based product applications and expansion.
Even if our OLED technologies are technically feasible, they may not be adopted by product manufacturers.
The potential size, timing and viability of market opportunities targeted by us are uncertain at this time. Market acceptance of our OLED technologies beyond current product offerings will depend, in part, upon these technologies providing benefits comparable or superior to current display and lighting technologies at an advantageous cost to manufacturers, and the adoption of products incorporating these technologies by consumers. Many current and potential licensees of our OLED technologies utilize and have invested significant resources in competing technologies, and may, therefore, be reluctant to redesign their products or manufacturing processes to incorporate our OLED technologies.
During the entire product development process for a new product, we face the risk that our technology will fail to meet the manufacturer’s technical, performance or cost requirements or will be replaced by a competing product or alternative technology. Even if we offer technologies that are satisfactory to a product manufacturer, the manufacturer may choose to delay or terminate its product development efforts for reasons unrelated to our technologies. In addition, our license agreements do not require our customers to purchase our host materials in order to utilize our phosphorescent emitter materials, and those customers may elect not to purchase our host materials.
Mass production of new mass market OLED products will require the availability of suitable manufacturing equipment, components and materials, many of which are available only from a limited number of suppliers. In addition, there may be a number of other technologies that manufacturers need to utilize in conjunction with our OLED technologies in order to bring these new OLED products to the market. Thus, even if our OLED technologies are a viable alternative to competing approaches, if product manufacturers are unable to obtain access to this equipment and these components, materials and other technologies, they may not utilize our OLED technologies.
18
There are numerous potential alternatives to OLEDs, which may limit our ability to commercialize our OLED technologies and materials.
The flat panel display market is currently, and will likely continue to be for some time, dominated by displays based on LCD technology. Numerous companies are making substantial investments in, and conducting research to improve characteristics of, LCDs; additionally, other competing flat panel display technologies have been, or are being, developed. A similar situation exists in the solid-state lighting market, which is currently dominated by LED products. Advances in any of these various technologies may overcome their current limitations and permit them to become the leading technologies in their field, either of which could limit the potential market for products utilizing our OLED technologies and materials. This, in turn, would cause product manufacturers to avoid entering into commercial relationships with us, or to terminate or not renew their existing relationships with us.
Other OLED technologies may be more successful or cost-effective than ours, which may limit the commercial adoption of our OLED technologies and materials.
Our competitors have developed OLED technologies that differ from or compete with our OLED technologies. In particular, competing fluorescent OLED technology, which entered the marketplace prior to ours, may become a viable alternative to our phosphorescent OLED technology. Moreover, our competitors may succeed in developing new OLED technologies that are more cost-effective or have fewer limitations than our OLED technologies. If our OLED technologies, and particularly our phosphorescent OLED technology, are unable to capture a substantial portion of the OLED product market, our business strategy may fail.
The consumer electronics industry experiences significant downturns from time to time, any of which may adversely affect the demand for and pricing of our OLED technologies and materials.
Our success depends upon the ability and continuing willingness of our licensees to manufacture and sell products utilizing our technologies and materials, specifically our phosphorescent emitters and host materials, and the widespread acceptance of our licensees’ products in the consumer marketplace. Any slowdown in the demand for our licensees’ products or a decrease in our licensees’ use of or demand for our materials would adversely affect our material sales and royalty revenues and thus our business. Our licensees’ decrease in the use of or demand for our materials may depend on several factors, including pricing, availability, continued technical improvements and competitive product offerings. The markets for flat panel displays and lighting products are highly competitive. Success in the market for end-user products that may integrate our OLED technologies and materials also depends on factors beyond the control of our licensees and us, including the cyclical and seasonal nature of the end-user markets that our licensees serve, as well as industry and general economic conditions.
The markets that we hope to penetrate have experienced significant periodic downturns, often in connection with, or in anticipation of, declines in general economic conditions. These downturns have been characterized by lower product demand, production overcapacity and erosion of average selling prices. Our business strategy is dependent on manufacturers building and selling products that incorporate our OLED technologies and materials. Industry-wide fluctuations and downturns in the demand for flat panel displays and solid-state lighting products could cause significant harm to our business.
Our customers may develop new or more efficient manufacturing processes, which may adversely affect demand for our OLED materials.
OLED device manufacturing is in its early stages. By developing enhanced material processing methods and more efficient manufacturing techniques, our customers who purchase our phosphorescent emitter and host materials could become more efficient in the utilization of our materials, which could limit or reduce the amount of materials they purchase from us. Thus, demand for our materials may not expand in proportion to the number of OLED related products manufactured by our customers, and may result in reduced demand for our materials and technology relative to our customers' manufacture and sale of products made with such materials.
Any downturn in U.S. or global economic conditions may have a significant adverse effect on our business.
There have been significant and sustained economic downturns in the U.S. and globally in the past. These downturns have placed pressure on consumer demand, and the resulting impact on consumer spending has had a material adverse effect on the demand for consumer electronic products. Similar downturns in the future may have a significant adverse effect on one or more of our licensees as an enterprise, which could result in those licensees reducing their efforts to commercialize products that incorporate our OLED technologies and materials. Consumer demand and the condition of the flat panel display and lighting industries may also be impacted by other external factors such as war, terrorism, geopolitical uncertainties and other business interruptions. The impact of these external factors is difficult to predict, and one or more of these factors could adversely impact the demand for our licensees’ products, and thus our business.
19
Many of our competitors have greater resources, which may make it difficult for us to compete successfully against them.
The flat panel display and solid-state lighting industries are characterized by intense competition. Many of our competitors have better name recognition and greater financial, technical, marketing, personnel and research capabilities than we do. Because of these differences, we may never be able to compete successfully in these markets or maintain any competitive advantages we are able to achieve over time.
If we cannot keep our key employees or hire other talented persons as we grow, our business might not succeed.
Our performance is substantially dependent on the continued services of our executive officers and other key technical and managerial personnel, and on our ability to offer competitive salaries and benefits to these and our other employees. We do not have employment agreements with any of our executive officers or other key technical or managerial personnel. Additionally, competition for highly skilled technical and managerial personnel is intense. We might not be able to attract, hire, train, retain and motivate the highly skilled employees we need to be successful. If we fail to attract and retain the necessary technical and managerial personnel, our business will suffer and might fail.
We rely solely on PPG Industries to manufacture the OLED materials we use and sell to product manufacturers.
Our business prospects depend significantly on our ability to obtain proprietary OLED materials for our own use and for sale to product manufacturers. Our agreement with PPG Industries provides us with a source for these materials for development, evaluation and commercial purposes. Our agreement with PPG Industries currently runs through the end of 2017 and shall be automatically renewed for additional one year terms, unless terminated by us with prior notice of one year or terminated by PPG with prior notice of two years. Our inability to continue obtaining these OLED materials from PPG Industries or another source at cost-competitive prices and to continue obtaining these OLED materials in sufficient quantities to meet our product manufacturers' current and future demands and timetables would have a material adverse effect on our revenues and cost of goods sold relating to sales of these materials to OLED product manufacturers, as well as on our ability to perform future development work.
We strive to maintain sufficient levels of inventory to accommodate our manufacturing customers. Inventory management relating to our material sales is complex, and excess inventory may harm our business and cause it to suffer.
Inventory management remains an area of focus as we balance the need to maintain strategic inventory levels of our OLED materials to ensure competitive lead times against the risk of inventory obsolescence because of rapidly changing technology and customer requirements. As a just-in-time supplier to our customers, we carry sufficient inventory to accommodate their capacity requirements, sometimes without firm purchase commitments. Our dependence on third-party manufacturers to provide our materials to us exposes us to longer lead times than if we were a direct manufacturer, increasing our risk of inventory obsolescence comparatively. Our customers may increase orders during periods of product shortages, cancel orders if their inventory is too high, or delay orders in anticipation of new products. They also may adjust their orders in response to the supply and demand of their products by end-users, or the supply and demand of our products and the products of our competitors that are available to them.
Inventory management risks are heightened when our largest customers launch new products and retire existing products. At such times, these customers tend to change product designs and may introduce some of our new materials into new designs. The production of these materials requires us to purchase essential raw material and commence manufacturing well in advance of receiving firm customer orders for such materials. Accordingly, we are subject to the risk of unanticipated changes in our customers’ manufacturing plans and designs. Unanticipated product cessation and product introduction delays or cancellation may cause us to order or produce excess or insufficient inventory. Excess inventory of our OLED materials is subject to the risk of inventory obsolescence. In the event that a substantial portion of our inventory becomes obsolete, it could have a material adverse effect on earnings due to the resulting costs associated with the inventory impairment charges and inventory write downs.
We are the sole source supplier for certain critical components used in OLED technologies, which subjects customers to risk if we are unable to meet the demand for such components.
Our customers depend on us as the sole source for certain critical components used in manufacturing OLED products, which makes them susceptible to supply shortages if we are unable to meet their demand for such components. A potential customer could be hesitant to adopt OLED technology given the risks inherent in depending on a sole source for critical components and the inability to establish alternate supply relationships. If we are unable to supply the components needed by our existing customers in a timely manner, or if potential customers do not utilize OLED technology because of concerns about our ability to meet supply demands, our business may materially suffer.
20
We may require additional funding in the future in order to continue our business.
Our capital requirements have been and will continue to be significant. We may require additional funding in the future for the research, development and commercialization of our OLED technologies and materials, to obtain and maintain patents and other intellectual property rights in these technologies and materials, and for working capital and other purposes, the timing and amount of which are difficult to ascertain. Our cash on hand may not be sufficient to meet all of our future needs. When we need additional funds, such funds may not be available on commercially reasonable terms or at all. If we cannot obtain more money when needed, our business might fail. Additionally, if we attempt to raise money in an offering of shares of our common stock, preferred stock, warrants or depositary shares, or if we engage in acquisitions involving the issuance of such securities, the issuance of these shares will dilute our then-existing shareholders.
Because the vast majority of OLED product manufacturers are located in the Asia-Pacific region, we are subject to international operational, financial, legal and political risks which may negatively impact our operations.
Many of our licensees and prospective licensees have a majority of their operations in countries other than the United States, particularly in the Asia-Pacific region. We also have offices in various countries located outside of the United States. Risks associated with our doing business outside of the United States include, without limitation:
• | compliance with a wide variety of foreign laws and regulations, including certain registration requirements for the OLED materials we sell; |
• | legal uncertainties regarding taxes, tariffs, quotas, export controls, export licenses and other trade barriers; |
• | economic instability in the countries of our licensees, causing delays or reductions in orders for their products and therefore our royalties; |
• | political instability in the countries in which our licensees operate, particularly in South Korea relating to its disputes with North Korea and in Taiwan relating to its disputes with China; |
• | difficulties in collecting accounts receivable and longer accounts receivable payment cycles; and |
• | potentially adverse tax and tariff consequences. |
Any of these factors could impair our ability to license our OLED technologies and sell our OLED materials, thereby harming our business. Compliance with changing laws and regulations may involve significant costs or require changes in business practice that could result in reduced profitability.
We rely on information technology systems to operate various elements of our business and a cyber-attack or other breach of our systems, or those of third parties on whom we may rely, could subject us to liability or interrupt the operation of our business.
We are dependent on information technology systems to operate various elements of our business. A breakdown, invasion, corruption, destruction or interruption of critical information technology systems by employees, others with authorized access to our systems or unauthorized persons could negatively impact operations. In the ordinary course of business, we collect, store and transmit important data and it is critical that we do so in a secure manner to maintain the confidentiality and integrity of such information. Additionally, we outsource certain elements of our information technology systems to third parties. As a result of this outsourcing, our third party vendors may or could have access to our confidential information making such systems vulnerable. Data breaches of our information technology systems, or those of our third party vendors, may pose a risk that sensitive data may be exposed to unauthorized persons or to the public. While we believe that we have taken appropriate security measures to protect our data and information technology systems, and have been informed by our third party vendors that they have as well, there can be no assurance that our efforts will prevent breakdowns or breaches in our systems, or those of our third party vendors, that could adversely affect our business.
The U.S. government has rights to intellectual property derived from our government-funded work that might prevent us from realizing the full benefits of our intellectual property portfolio.
The U.S. government, through various government agencies, has provided and continues to provide funding to us, Princeton, USC and Michigan for work related to certain aspects of our OLED technologies. Because we have been provided with this funding, the government has rights to any intellectual property derived from this work that could restrict our ability to market OLED products to the government for military and other applications, or to license this intellectual property to third parties for commercial applications. Moreover, if the government determines that we have not taken effective steps to achieve practical application of this intellectual property in any field of use in a reasonable time, the government could require us to license this intellectual property to other parties in that field of use. Any of these occurrences would limit our ability to obtain maximum value from our intellectual property portfolio.
21
The market price of our common stock may be highly volatile.
The market price of our common stock may be highly volatile, as has been the case with our common stock in the past as well as the securities of many companies, particularly other emerging-growth companies in the technology industry. We have included in the section of this report entitled “Market for Registrant’s Common Equity, Related Stockholder Matters and Issuer Purchases of Equity Securities,” a table indicating the high and low closing prices of our common stock as reported on the NASDAQ Global Market for the past two years. Factors such as the following may have a significant impact on the market price of our common stock in the future:
• | our revenues, expenses and operating results; |
• | announcements by us or our competitors of technological developments, new product applications or license arrangements; and |
• | other factors affecting the flat panel display and solid-state lighting industries in general. |
Our operating results may have significant period-to-period fluctuations, which would make it difficult to predict our future performance.
Due to the current stage of commercialization of our OLED technologies and materials; the limited number of commercially successful consumer products utilizing our OLED technologies that licensees have introduced in the marketplace; the relatively short product lifetimes of these consumer products; and the significant development and manufacturing objectives that we and our licensees must achieve for the widespread inclusion of our OLED technologies in new classes of consumer products such as tablets, television displays and lighting products, our quarterly operating results are difficult to predict and may vary significantly from quarter to quarter.
We believe that period-to-period comparisons of our operating results are not a reliable indicator of our future performance at this time. Among other factors affecting our period-to-period results, our license and technology development fees often consist of large one-time, annual or semi-annual payments, which may result in significant fluctuations in our revenues. In addition, our reliance on a small number of licensees with large volumes of consumer product sales makes our quarterly operating results subject to our licensee's specific plans and the success of their specific product offerings.
With respect to material sales, our sales are primarily dependent on purchases made by a small number of customers. In addition to the other factors described above relating to our customers’ sales opportunities, our quarter-to-quarter sales may be materially impacted by our customers’ inventory management plans, which may vary substantially based on financial management considerations, changes in their product mix plans, modified material processing techniques and manufacturing line modifications.
If, in some future period, our operating results or business outlook fall below the expectations of securities analysts or investors, our stock price would be likely to decline and investors in our common stock may not be able to resell their shares at or above their purchase price. Broad market, industry and global economic factors may also materially reduce the market price of our common stock, regardless of our operating performance.
The issuance of additional shares of our common stock could drive down the price of our stock.
The price of our common stock could decrease if:
• | shares of our common stock that are currently subject to restriction on sale become freely salable, whether through an effective registration statement or based on Rule 144 under the Securities Act of 1933, as amended; or |
• | we issue additional shares of our common stock that might be or become freely salable, including shares that would be issued upon conversion of our preferred stock or the exercise of outstanding stock options. |
We can issue shares of preferred stock that may adversely affect the rights of shareholders of our common stock.
Our Articles of Incorporation authorize us to issue up to 5,000,000 shares of preferred stock with designations, rights and preferences determined from time-to-time by our Board of Directors. Accordingly, our Board of Directors is empowered, without shareholder approval, to issue preferred stock with dividend, liquidation, conversion, voting or other rights superior to those of shareholders of our common stock. For example, an issuance of shares of preferred stock could:
• | adversely affect the voting power of the shareholders of our common stock; |
• | make it more difficult for a third party to gain control of us; |
• | discourage bids for our common stock at a premium; or |
• | otherwise adversely affect the market price of our common stock. |
22
As of February 23, 2016, we have issued and outstanding 200,000 shares of Series A Nonconvertible Preferred Stock, all of which are held by an entity controlled by members of the family of Sherwin I. Seligsohn, our Founder and Chairman of the Board of Directors. Our Board of Directors has authorized and issued other shares of preferred stock in the past, none of which are currently outstanding, and may do so again at any time in the future.
Because we do not currently intend to pay dividends, shareholders will benefit from an investment in our common stock only if it appreciates in value.
We have never declared or paid any cash dividends on our common stock. We currently intend to retain our future earnings, if any, to finance further research and development and do not expect to pay any cash dividends in the foreseeable future. As a result, the success of an investment in our common stock will depend upon any future appreciation in its value. There is no guarantee that our common stock will appreciate in value or even maintain the price at which current shareholders purchased their shares.
Our executive officers and directors own a significant percentage of our common stock and could exert significant influence over matters requiring shareholder approval, including takeover attempts.
Our executive officers and directors and their respective affiliates and the adult children of Sherwin Seligsohn, beneficially own, as of February 23, 2016, approximately 12.7% of the outstanding shares of our common stock. Accordingly, these individuals may, as a practical matter, be able to exert significant influence over matters requiring approval by our shareholders, including the election of directors and the approval of mergers or other business combinations. This concentration also could have the effect of delaying or preventing a change in control of us.
Natural disasters or other unforeseen catastrophic events could unfavorably affect our business.
Natural disasters, such as hurricanes, tsunamis, or earthquakes, particularly in Asia-Pacific region, where many of our licensees are located, or the occurrence of other unforeseen catastrophic events, such a fire or flood, could unfavorably affect our business and financial performance. Such events could unfavorably affect our licensees in many ways, such as causing physical damage to one or more of their properties, the temporary or permanent closure of one or more plants, the disruption or cessation of manufacturing of product lines, and the temporary or long-term disruption in the supply or demand for their products. A resulting by-product of such natural disasters or other unforeseen catastrophic events could be a temporary or long-term disruption in the supply of or demand for our products.
Our effective tax rate may increase or decrease.
We are subject to income taxes in the U.S. and numerous foreign jurisdictions. Significant judgment is required in determining our worldwide provision for income taxes. In the ordinary course of our business, there are many transactions and calculations where the ultimate tax determination is uncertain. We are subject to audit by tax authorities where we do business. Although we believe that our tax estimates and tax positions are reasonable, they could be materially affected by many factors including the final outcome of tax audits and related litigation, the introduction of new tax accounting standards, legislation, regulations, and related interpretations, our global mix of earnings and the realizability of deferred tax assets. An increase or decrease in our effective tax rate could have a material adverse impact on our financial condition and results of operations.
ITEM 1B. | UNRESOLVED STAFF COMMENTS |
None.
ITEM 2. | PROPERTIES |
Our corporate offices and research and development laboratories are located at 375 Phillips Boulevard in Ewing, New Jersey. In 2004, we acquired the building and property at which this facility is located. During 2005, we conducted a two-stage expansion of our laboratory and office space in the building, as well as a recent expansion in 2013 and 2015. We currently occupy the entire newly expanded facility.
ITEM 3. | LEGAL PROCEEDINGS |
Patent Related Challenges and Oppositions
Each major jurisdiction that issues patents provides both third parties and applicants an opportunity to seek a further review of an issued patent. The specific process for requesting and considering such reviews are specific to the jurisdiction that issued the patent in question, and generally do not include claims for monetary damages or specific claims of infringement. The conclusions made by the reviewing administrative bodies tend to be appealable and generally are limited in scope and applicability to the specific claims and jurisdiction in question.
23
We believe that opposition proceedings are frequently commenced in the ordinary course of business by third parties who may believe that one or more claims in a patent do not comply with the technical or legal requirements of the specific jurisdiction in which the patent was issued. We view these proceedings as reflective of our goal of obtaining the broadest legally permissible patent coverage permitted in each jurisdiction. Once a proceeding is initiated, as a general matter, the issued patent continues to be presumed valid until the jurisdiction’s applicable administrative body issues a final non-appealable decision. Depending on the jurisdiction, the outcome of these proceedings could include affirmation, denial or modification of some or all of the originally issued claims. We believe that as OLED technology becomes more established and as our patent portfolio increases in size, so will the number of these proceedings.
Below are summaries of certain proceedings that have been commenced against issued patents that are either exclusively licensed to us or which are now assigned to us. We do not believe that the confirmation, loss or modification of our rights in any individual claim or set of claims that are the subject of the following legal proceedings would have a material impact on our material sales or licensing business or on our consolidated financial statements, including our consolidated statements of income, as a whole. However, as noted within the descriptions, some of the following proceedings involve issued patents that relate to our fundamental phosphorescent OLED technologies and we intend to vigorously defend against claims that, in our opinion, seek to restrict or reduce the scope of the originally issued claim, which may require the expenditure of significant amounts of our resources. In certain circumstances, when permitted, we may also utilize the proceedings to request modification of the claims to better distinguish the patented invention from any newly identified prior art and/or improve the claim scope of the patent relative to commercially important categories of the invention. The entries marked with an "*" relate to our UniversalPHOLED phosphorescent OLED technology, some of which may be commercialized by us.
Opposition to European Patent No. 1394870*
On April 20, 2010, Merck Patent GmbH; BASF Schweitz AG of Basel, Switzerland; Osram GmbH of Munich, Germany; Siemens Aktiengesellschaft of Munich, Germany; and Koninklijke Philips Electronics N.V., of Eindhoven, The Netherlands filed Notices of Opposition to European Patent No. 1394870 (the EP '870 patent). The EP '870 patent, which was issued on July 22, 2009, is a European counterpart patent, in part, to U.S. patents 6,303,238; 6,579,632; 6,872,477; 7,279,235; 7,279,237; 7,488,542; 7,563,519; and 7,901,795; and to pending U.S. patent application 13/035,051, filed on February 25, 2011 (hereinafter the “U.S. '238 Patent Family”). They are exclusively licensed to us by Princeton, and we are required to pay all legal costs and fees associated with this proceeding.
An Oral Hearing was held before an EPO panel of first instance in Munich, Germany on April 8-9, 2014. After the completion of the hearing, the panel decided that the broad claims originally issued did not satisfy EPO requirements and amended the claims to more narrowly define the scope of the claims. The '870 patent, in its amended form, was held by the panel to comply with EPO requirements.
We believe the EPO's decision relating to the broad original claims is erroneous and have appealed the ruling to reinstate a broader set of claims. This patent, as originally granted by the EPO, is deemed valid during the pendency of the appeals process.
At this time, based on our current knowledge, we believe that the patent being challenged should be declared valid and that all or a significant portion of our claims should be upheld. However, we cannot make any assurances of this result.
Invalidation Trial in Japan for Japan Patent No. 4511024*
On June 16, 2011, we learned that a Request for an Invalidation Trial was filed in Japan by Semiconductor Energy Laboratory, Co., Ltd. for our Japanese Patent No. JP-4511024 (the JP '024 patent), which issued on May 14, 2010. The JP '024 patent is a counterpart patent, in part, to the U.S. '238 Patent Family, which relate to the EP '870 patent, which is subject to one of the above-noted European oppositions and which relates to our UniversalPHOLED phosphorescent OLED technology. They are exclusively licensed to us by Princeton, and we are required to pay all legal costs and fees associated with this proceeding.
On May 10, 2012, we learned that the JPO issued a decision upholding the validity of certain claimed inventions in the JP '024 Patent but invalidating the broadest claims in the patent. We appealed the JPO’s decision to the Japanese IP High Court. On October 31, 2013, the Japanese IP High Court ruled that the prior art references relied on by the JPO did not support the JPO’s findings, reversed the JPO’s decision with respect to the previously invalidated broad claims in the JP ‘024 patent and remanded the matter back to the JPO for further consideration consistent with its decision. The JPO subsequently issued a decision upholding the validity of certain claimed inventions in the JP '024 Patent but invalidating the broadest claims in the patent. We appealed the decision to reinstate a broader set of claims but the IP High Court declined to reinstate the broader claims. We have appealed the IP High Court ruling to the Japanese Supreme Court for reconsideration of the legal basis of the IP High Court's decision. This patent, as originally granted by the JPO, is deemed valid during the pendency of the appeals process.
Although we cannot provide any assurances as to the possible outcome of future appellate proceedings which we may elect to pursue, if any, the patent is expected to be maintained at least with respect to the narrower set of claims which were not the subject of the IP High Court's invalidation ruling.
24
Opposition to European Patent No. 1390962
On November 16, 2011, Osram AG and BASF SE each filed a Notice of Opposition to European Patent No. 1390962 (EP '962 patent), which relates to our white phosphorescent OLED technology. The EP '962 patent, which was issued on February 16, 2011, is a European counterpart patent to U.S. patents 7,009,338 and 7,285,907. They are exclusively licensed to us by Princeton, and we are required to pay all legal costs and fees associated with this proceeding.
The EPO combined the oppositions into a single opposition proceeding and a hearing was held in December 2015, wherein the EPO Opposition Division revoked the patent claims for alleged insufficiencies under EPC Article 83. We believe the EPO's decision relating to the original claims is erroneous, and we will appeal the decision. This patent, as originally granted, is deemed valid during the pendency of the appeals process.
At this time, based on our current knowledge, we believe that the patent being challenged should be declared valid, and that all or a significant portion of our claims should be upheld. However, we cannot make any assurances of this result.
Opposition to European Patent No. 1933395*
On February 24 and 27, 2012, Sumitomo, Merck Patent GmbH and BASF SE filed oppositions to our European Patent No. 1933395 (the EP '395 patent). The EP '395 patent is a counterpart patent to EP '637 patent, and, in part, to the U.S. Patents 7,001,536, 6,902,830, and 6,830,828 and to JP patents 4358168 and 4357781. This patent is exclusively licensed to us by Princeton, and we are required to pay all legal costs and fees associated with this proceeding.
At an Oral Hearing on October 14, 2013, the EPO panel issued a decision that affirmed the basic invention and broad patent coverage in the EP '395 patent, but narrowed the scope of the original claims.
On February 26, 2014, we appealed the ruling to reinstate a broader set of claims. The patent, as originally granted by the EPO, is deemed to be valid during the pendency of the appeals process. Two of the three opponents also filed their own appeals of the ruling. In January 2015, Sumitomo withdrew its opposition of the '395 patent, and the EPO accepted the withdrawal notice. The EPO issued a notice that the appeal proceedings will proceed in the second quarter of 2016.
In addition to the above proceedings, from time to time, we may have other proceedings that are pending which relate to patents we acquired as part of the Fuji Patent acquisition or which relate to technologies that are not currently widely utilized in the marketplace.
EXECUTIVE OFFICERS OF THE REGISTRANT
The following table sets forth certain information with respect to our executive officers as of February 23, 2016:
Name | Age | Position |
Sherwin I. Seligsohn | 80 | Founder and Chairman of the Board of Directors |
Steven V. Abramson | 64 | President, Chief Executive Officer and Director |
Sidney D. Rosenblatt | 68 | Executive Vice President, Chief Financial Officer, Treasurer, Secretary and Director |
Julia J. Brown | 54 | Senior Vice President and Chief Technical Officer |
Janice M. DuFour | 58 | Vice President of Technology Commercialization and General Manager, PHOLED Material Sales Business |
Mauro Premutico | 50 | Vice President, Legal and General Manager, Patents and Licensing |
Our Board of Directors has appointed these executive officers to hold office until their successors are duly appointed.
Sherwin I. Seligsohn is our Founder and has been the Chairman of our Board of Directors since June 1995. He also served as our Chief Executive Officer from June 1995 through December 2007, and as our President from June 1995 through May 1996. Mr. Seligsohn serves as the sole Director, President and Secretary of American Biomimetics Corporation, International Multi-Media Corporation, and Wireless Unified Network Systems Corporation. He was also previously the Chairman of the Board of Directors, President and Chief Executive Officer of NanoFlex Power Corporation (formally known as Global Photonic Energy Corporation) (NanoFlex) since its inception until April 2012, when he resigned from his positions at NanoFlex. Since that time, the only relationship Mr. Seligsohn has had with NanoFlex is as a shareholder and option holder. From June 1990 to October 1991, Mr. Seligsohn was Chairman Emeritus of InterDigital Communications, Inc. (InterDigital), formerly International Mobile Machines Corporation. He founded InterDigital and from August 1972 to June 1990 served as its Chairman of the Board of Directors. Mr. Seligsohn is a member of the Industrial Advisory Board of the Princeton Institute for the Science and Technology of Materials (PRISM) at Princeton.
25
Steven V. Abramson is our President and Chief Executive Officer, and has been a member of our Board of Directors since May 1996. Mr. Abramson served as our President and Chief Operating Officer from May 1996 through December 2007. From March 1992 to May 1996, Mr. Abramson was Vice President, General Counsel, Secretary and Treasurer of Roy F. Weston, Inc., a worldwide environmental consulting and engineering firm. From December 1982 to December 1991, Mr. Abramson held various positions at InterDigital, including General Counsel, Executive Vice President and General Manager of the Technology Licensing Division.
Sidney D. Rosenblatt is an Executive Vice President and has been our Chief Financial Officer, Treasurer and Secretary since June 1995. He also has been a member of our Board of Directors since May 1996. Mr. Rosenblatt was the owner of S. Zitner Company from August 1990 through August 2010 and served as its President from August 1990 through December 1998. From May 1982 to August 1990, Mr. Rosenblatt served as the Senior Vice President, Chief Financial Officer and Treasurer of InterDigital. Mr. Rosenblatt is also a trustee of Arcadia University and is on the Board of Managers of the Overbrook School for the Blind. He is also a member of the Board of the Careers in Culinary Arts Program.
Julia J. Brown, Ph.D. is a Senior Vice President and has been our Chief Technical Officer since June 2002. She joined us in June 1998 as our Vice President of Technology Development. From November 1991 to June 1998, Dr. Brown was a Research Department Manager at Hughes Research Laboratories where she directed the pilot line production of high-speed Indium Phosphide-based integrated circuits for insertion into advanced airborne radar and satellite communication systems. Dr. Brown received an M.S. and Ph.D. in Electrical Engineering/Electrophysics at USC under the advisement of Professor Stephen R. Forrest. Dr. Brown has served as an Associate Editor of the Journal of Electronic Materials and as an elected member of the Electron Device Society Technical Board. She co-founded an international engineering mentoring program sponsored by the Institute of Electrical and Electronics Engineers (IEEE) and is a Fellow of the IEEE. Dr. Brown has served on numerous technical conference committees and is presently a member of the Society of Information Display.
Janice M. DuFour (formally Janice K. Mahon) has been our Vice President of Technology Commercialization since January 1997, and became the General Manager of our PHOLED Material Sales Business in January 2007. From 1992 to 1996, Ms. DuFour was Vice President of SAGE Electrochromics, Inc., a thin-film electrochromic technology company, where she oversaw a variety of business development, marketing and finance and administrative activities. From 1984 to 1989, Ms. DuFour was a Vice President and General Manager for Chronar Corporation, a leading developer and manufacturer of amorphous silicon photovoltaic (PV) panels. Prior to that, Ms. DuFour worked as Senior Engineer for the Industrial Chemicals Division of FMC Corporation. Ms. DuFour received her B.S. in Chemical Engineering from Rensselaer Polytechnic Institute in 1979, and an M.B.A. from Harvard University in 1984. Ms. DuFour was a member of the Technical Council of the FlexTech Alliance from 1997 through 2010, and a member of its Governing Board from 2008 through 2010. Ms. DuFour was a member of the Board of Directors and Marketing Committee Chairperson of the OLED Association from 2009-2014.
Mauro Premutico has been our Vice President of Legal and General Manager of Patents and Licensing since April 2012. Prior to joining us, Mr. Premutico was the Managing Vice President and Chief Patent Counsel for The Walt Disney Company from 2009 to 2012, and Vice President of Intellectual Property and Associate General Counsel for Lenovo Group Ltd. from 2005 to 2009. Mr. Premutico was also Special Counsel at the international law firm of Cleary, Gottlieb, Steen & Hamilton from 2002 until 2005 where he served as the co-head of the New York's office Intellectual Property and Technology Law practice. Mr. Premutico received his law degree from Boston University School of Law and a BSEE from Worcester Polytechnic Institute.
ITEM 4. | MINE SAFETY DISCLOSURES |
Not applicable.
26
PART II
ITEM 5. | MARKET FOR REGISTRANT’S COMMON EQUITY, RELATED STOCKHOLDER MATTERS AND ISSUER PURCHASES OF EQUITY SECURITIES |
Our Common Stock
Our common stock is quoted on the NASDAQ Global Market under the symbol “OLED.” The following table sets forth, for the periods indicated, the high and low closing prices of our common stock as reported on the NASDAQ Global Market.
High Close | Low Close | |||||||
2015 | ||||||||
Fourth Quarter | $ | 56.02 | $ | 33.01 | ||||
Third Quarter | 51.59 | 33.73 | ||||||
Second Quarter | 55.29 | 44.07 | ||||||
First Quarter | 47.23 | 25.98 | ||||||
2014 | ||||||||
Fourth Quarter | $ | 32.90 | $ | 25.59 | ||||
Third Quarter | 37.40 | 28.90 | ||||||
Second Quarter | 32.15 | 22.93 | ||||||
First Quarter | 35.05 | 30.63 | ||||||
As of February 23, 2016, there were approximately 278 holders of record of our common stock.
We have never declared or paid cash dividends on our common stock. We currently intend to retain any future earnings for the operation and expansion of our business. We do not anticipate declaring or paying cash dividends on our common stock in the foreseeable future. Any future payment of cash dividends on our common stock will be at the discretion of our Board of Directors and will depend upon our results of operations, earnings, capital requirements, contractual restrictions and other factors deemed relevant by our Board of Directors.
Share Repurchases
In June 2014, we announced that the Board of Directors had approved a program to repurchase up to $50 million of the outstanding shares of our common stock from time to time over the next twelve months (the Repurchase Program). During the period, we repurchased 956,362 shares of common stock at a cost of $29.5 million. The repurchase program ended during the second quarter of 2015.
During the quarter ended December 31, 2015, we acquired 710 shares of common stock through transactions related to the vesting of restricted share awards previously granted to employees of ours. Upon vesting, the employees turned in shares of common stock in amounts sufficient to pay the minimum statutory tax withholding at rates required by the relevant tax authorities.
The following table provides information relating to the shares we acquired during the fourth quarter of 2015 (dollar amounts in thousands, other than per share amounts):
Period | Total Number of Shares Purchased | Weighted Average Price Paid per Share | Total Number of Shares Purchased as Part of Publicly Announced Program | Approximate Dollar Value of Shares that May Yet Be Purchased Under the Program | ||||||||||
October 1 – October 31 | 631 | $ | 35.28 | — | $ | — | ||||||||
November 1 – November 30 | 79 | 36.00 | — | — | ||||||||||
December 1 – December 31 | — | — | — | — | ||||||||||
Total | 710 | — | — | — | ||||||||||
27
Performance Graph
The performance graph below compares the change in the cumulative shareholder return of our common stock from December 31, 2010 to December 31, 2015, with the percentage change in the cumulative total return over the same period on (i) the Russell 2000 Index, and (ii) the Nasdaq Electronics Components Index. This performance graph assumes an initial investment of $100 on December 31, 2010 in each of our common stock, the Russell 2000 Index and the Nasdaq Electronics Components Index.
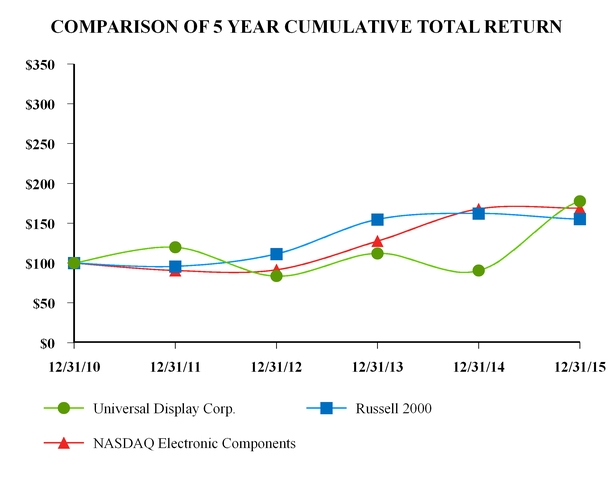
Cumulative Total Return | ||||||||||||||||||
12/10 | 12/11 | 12/12 | 12/13 | 12/14 | 12/15 | |||||||||||||
Universal Display Corp. | 100.00 | 119.71 | 83.59 | 112.10 | 90.54 | 177.62 | ||||||||||||
Russell 2000 | 100.00 | 95.82 | 111.49 | 154.78 | 162.35 | 155.18 | ||||||||||||
NASDAQ Electronic Components | 100.00 | 90.64 | 91.50 | 127.54 | 167.91 | 168.98 | ||||||||||||
Securities Authorized for Issuance under Equity Compensation Plans
The information required by this item with respect to our equity compensation plans will be set forth in our Proxy Statement, and is incorporated herein by reference.
28
ITEM 6. | SELECTED FINANCIAL DATA |
The following selected consolidated financial data has been derived from, and should be read in conjunction with, our Consolidated Financial Statements and the notes thereto, and with “Management’s Discussion and Analysis of Financial Condition and Results of Operations,” included elsewhere in this report.
(in thousands, except share and per share data) | Year Ended December 31, | |||||||||||||||||||
2015 | 2014 | 2013 | 2012 | 2011 | ||||||||||||||||
Operating Results: | ||||||||||||||||||||
Total revenue | $ | 191,046 | $ | 191,031 | $ | 146,639 | $ | 83,224 | $ | 61,289 | ||||||||||
Cost of material sales(1) | 62,997 | 41,315 | 28,889 | 4,528 | 3,731 | |||||||||||||||
Research and development expense | 44,641 | 41,154 | 34,215 | 30,032 | 24,129 | |||||||||||||||
Selling, general and administrative expense | 29,046 | 28,135 | 24,745 | 19,550 | 18,940 | |||||||||||||||
Patent costs and amortization of acquired technology | 16,716 | 17,288 | 17,273 | 13,385 | 7,442 | |||||||||||||||
Interest income | 837 | 777 | 811 | 1,240 | 994 | |||||||||||||||
Income tax (expense) benefit (2) | (18,381 | ) | (17,473 | ) | 35,044 | (5,208 | ) | 714 | ||||||||||||
Net income | 14,678 | 41,854 | 74,052 | 9,660 | 3,155 | |||||||||||||||
Net income per common share, basic | $ | 0.31 | $ | 0.90 | $ | 1.61 | $ | 0.21 | $ | 0.07 | ||||||||||
Net income per common share, diluted | $ | 0.31 | $ | 0.90 | $ | 1.59 | $ | 0.21 | $ | 0.07 | ||||||||||
Unaudited non-GAAP Measures: | ||||||||||||||||||||
Adjusted net income* | 44,842 | 41,854 | 32,634 | 9,660 | 3,155 | |||||||||||||||
Adjusted net income per common share, basic* | $ | 0.96 | $ | 0.90 | $ | 0.71 | $ | 0.21 | $ | 0.07 | ||||||||||
Adjusted net income per common share, diluted* | $ | 0.94 | $ | 0.90 | $ | 0.70 | $ | 0.21 | $ | 0.07 | ||||||||||
Balance Sheet Data: | ||||||||||||||||||||
Total assets | $ | 559,412 | $ | 489,847 | $ | 462,754 | $ | 385,524 | $ | 373,878 | ||||||||||
Current liabilities | 34,510 | 26,823 | 23,229 | 22,299 | 19,517 | |||||||||||||||
Shareholders’ equity | 466,765 | 448,742 | 427,686 | 350,235 | 342,227 | |||||||||||||||
Other Financial Data: | ||||||||||||||||||||
Working capital | $ | 413,174 | $ | 343,682 | $ | 303,819 | $ | 245,246 | $ | 342,787 | ||||||||||
Capital expenditures | 5,103 | 6,153 | 4,710 | 2,737 | 2,624 | |||||||||||||||
Additions to intangibles | — | — | 359 | 109,102 | 440 | |||||||||||||||
Weighted average shares used in computing basic net income per common share | 46,816,394 | 46,252,960 | 45,898,019 | 45,951,276 | 43,737,968 | |||||||||||||||
Weighted average shares used in computing diluted net income per common share | 47,494,188 | 46,685,145 | 46,543,605 | 46,883,602 | 45,140,394 | |||||||||||||||
Shares of common stock outstanding, end of period | 48,132,223 | 47,061,826 | 46,423,667 | 46,355,535 | 46,113,296 | |||||||||||||||
_______________________________________________
(1) During the second quarter of 2015, the Company experienced a faster-than-anticipated decline in host material sales, which we believe was a result of our customer's selling new products that did not include our host materials. Based on the most recent sales forecast, we determined that there were likely to be significantly lower sales of our existing host material. As such, a write-down in net realizable value of our inventory during the second quarter was required.
(2) During the year ended December 31, 2013, we released income tax valuation allowances of $59.4 million.
* The unaudited adjusted presentation is a non-GAAP measure which reflects our operating results excluding the impact of the inventory write-down for the year ended December 31, 2015 as well as the release of certain income tax valuation allowances (including the impact of recording a deferred income tax provision subsequent to the release) for the year ended December 31, 2013. The adjusted presentation is intended to present our net income and net income per common share information for the year ended December 31, 2015 as if the inventory write-down did not occur. For 2013, the adjusted presentation is intended to present our net income and net income per common share information for the year ended December 31, 2013 as if the income tax valuation allowances were not reversed, consistent with prior years. Refer to the reconciliation of non-GAAP measures below for more detail.
29
Reconciliation of non-GAAP measures
The following table details our reconciliation of non-GAAP measures to the most directly comparable GAAP measures:
(in thousands, except per share data) | Year Ended December 31, | |||||||||||||||||||
2015 | 2014 | 2013 | 2012 | 2011 | ||||||||||||||||
(Unaudited) | ||||||||||||||||||||
Operating Results: | ||||||||||||||||||||
Cost of material sales | $ | 62,997 | $ | 41,315 | $ | 28,889 | $ | 4,528 | $ | 3,731 | ||||||||||
Operating expenses | 158,770 | 132,411 | 108,395 | 69,568 | 55,602 | |||||||||||||||
Operating income | 32,276 | 58,620 | 38,244 | 13,676 | 5,687 | |||||||||||||||
Income before income taxes | 33,059 | 59,327 | 39,008 | 14,868 | 2,441 | |||||||||||||||
Net income | 14,678 | 41,854 | 74,052 | 9,660 | 3,155 | |||||||||||||||
Net Income per common share, basic | $ | 0.31 | $ | 0.90 | $ | 1.61 | $ | 0.21 | $ | 0.07 | ||||||||||
Net Income per common share, diluted | $ | 0.31 | $ | 0.90 | $ | 1.59 | $ | 0.21 | $ | 0.07 | ||||||||||
Non-GAAP Reconciling Items: | ||||||||||||||||||||
Deferred income tax expense | — | — | 17,934 | — | — | |||||||||||||||
Release of income tax valuation allowances | — | — | (59,352 | ) | — | — | ||||||||||||||
Inventory write-down | 33,000 | — | — | — | — | |||||||||||||||
Tax impact of inventory write-down | (2,836 | ) | — | — | — | — | ||||||||||||||
Total non-GAAP reconciling items | 30,164 | — | (41,418 | ) | — | — | ||||||||||||||
Non-GAAP Measures: | ||||||||||||||||||||
Cost of material sales | $ | 29,997 | $ | 41,315 | $ | 28,889 | $ | 4,528 | $ | 3,731 | ||||||||||
Operating expenses | 125,770 | 132,411 | 108,395 | 69,568 | 55,602 | |||||||||||||||
Operating income | 65,276 | 58,620 | 38,244 | 13,676 | 5,687 | |||||||||||||||
Income before income taxes | 66,059 | 59,327 | 39,008 | 14,868 | 2,441 | |||||||||||||||
Net income* | 44,842 | 41,854 | 32,634 | 9,660 | 3,155 | |||||||||||||||
Net Income per common share, basic** | $ | 0.96 | $ | 0.90 | $ | 0.71 | $ | 0.21 | $ | 0.07 | ||||||||||
Net Income per common share, diluted*** | $ | 0.94 | $ | 0.90 | $ | 0.70 | $ | 0.21 | $ | 0.07 | ||||||||||
* Non-GAAP net income assumes an effective tax rate of 32% for the year ended December 31, 2015, based on excluding the impact of the inventory write down of $33.0 million in the second quarter of 2015 and its related impact on our effective tax rate.
** The adjusted net income per common share, basic is derived from dividing adjusted net income by the number of weighted average shares used in computing basic net income per common share.
***The adjusted net income per common share, diluted for the year ended December 31, 2013, is derived from dividing adjusted net income by adjusted weighted average shares of 46,582,347, which excludes the amount of any excess tax benefits in assumed proceeds in calculating the weighted average shares using the treasury stock method. The exclusion is intended to present our diluted net income per common share for the year ended December 31, 2013 as if our assessment of the future realizability of our deferred tax assets did not change and the income tax valuation allowances were not reversed, consistent with prior periods. For the years ended December 31, 2014, and from December 31, 2011 to 2012, there is no difference between net income per common share and adjusted net income per common share.
30
Non-GAAP Measures
To supplement our selected financial data presented in accordance with U.S. generally accepted accounting principles (GAAP), we are providing certain non-GAAP measures. These non-GAAP measures include adjusted net income, adjusted net income per common share, basic and adjusted income per common share, diluted. Reconciliation to the most directly comparable GAAP measures of all non-GAAP measures included in the presentation can be found within the table detailing the reconciliation of non-GAAP measures to GAAP measures above.
We have provided these non-GAAP measures to enhance investors' overall understanding of our current financial performance, and as a means to evaluate period-to-period comparisons. We believe that these non-GAAP measures provide meaningful supplemental information regarding our financial performance by excluding the inventory charge and related tax effect as well as excluding the effect of the release of income tax valuation allowances that may not be indicative of recurring core business operating results. We believe that the non-GAAP measures that exclude the impact of the inventory charge and also the release of income tax valuation allowances including recording a deferred income tax provision subsequent to the release of the allowances, when viewed with GAAP results, enhance the comparability or results against prior periods and allow for greater transparency of financial results. The presentation of non-GAAP measures is not intended to be considered in isolation or as a substitute for, or superior to, the financial information prepared and presented in accordance with GAAP.
ITEM 7. | MANAGEMENT’S DISCUSSION AND ANALYSIS OF FINANCIAL CONDITION AND RESULTS OF OPERATIONS |
The following discussion and analysis of our financial condition and results of operations should be read in conjunction with the section entitled “Selected Financial Data” in this report and our Consolidated Financial Statements and related notes to this report. This discussion and analysis contains forward-looking statements based on our current expectations, assumptions, estimates and projections. These forward-looking statements involve risks and uncertainties. Our actual results could differ materially from those indicated in these forward-looking statements as a result of certain factors, as more fully discussed in Item 1A of this report, entitled “Risk Factors.”
OVERVIEW
We are a leader in the research, development and commercialization of organic light emitting diode, or OLED, technologies and materials for use in displays for wearables, mobile phones, televisions, tablets, portable media devices, laptop computers, personal computers, and automotive interiors, as well as solid-state lighting applications. Since 1994, we have been exclusively engaged, and expect to continue to be primarily engaged, in funding and performing research and development activities relating to OLED technologies and materials, and commercializing these technologies and materials. We derive our revenue from the following:
• | sales of OLED materials for evaluation, development and commercial manufacturing; |
• | intellectual property and technology licensing; and |
• | technology development and support, including government contract work and support provided to third parties for commercialization of their OLED products. |
Material sales relate to our sale of OLED materials for incorporation into our customers’ commercial OLED products or for their OLED development and evaluation activities. Material sales are recognized at the time of shipment or at time of delivery, and passage of title, depending upon the contractual agreement between the parties.
We receive license and royalty payments under certain commercial, development and technology evaluation agreements, some of which are non-refundable advances. These payments may include royalty and license fees made pursuant to license agreements and also license fees included as part of certain commercial supply agreements. For arrangements with extended payment terms, where the fee is not fixed or determinable, we recognize revenue when the payment is due and payable. Royalty revenue and license fees included as part of commercial supply agreements are recognized when earned and the amount is fixed and determinable.
Currently, our most significant commercial license agreement, which runs through the end of 2017, is with SDC and covers the manufacture and sale of specified OLED display products. Under this agreement, we are being paid a license fee, payable in semi-annual installments over the agreement term of 6.4 years. The installments, which are due in the second and fourth quarter of each year, increase on an annual basis over the term of the agreement. The agreement conveys to SDC the non-exclusive right to use certain of our intellectual property assets for a limited period of time that is less than the estimated life of the assets. Ratable recognition of revenue is impacted by the agreement's extended increasing payment terms in light of our limited history with similar agreements. As a result, revenue is recognized at the lesser of the proportional performance approach (ratable) and the amount of due and payable fees from SDC. Given the increasing contractual payment schedule, license fees under the agreement are recognized as revenue when they become due and payable, which is currently scheduled to be in the second and fourth quarter of each year.
At the same time we entered into the current patent license agreement with SDC, we also entered into a new supplemental material purchase agreement with SDC. Under the current supplemental material purchase agreement, SDC agrees to purchase from us a minimum dollar amount of phosphorescent emitter materials for use in the manufacture of licensed products. This minimum purchase commitment is subject to SDC’s requirements for phosphorescent emitter materials and our ability to meet these requirements over the term of the supplemental agreement. The minimum purchase amounts increase on an annual basis over the term of the supplemental agreement. These amounts were determined through negotiation based on a number of factors, including, without limitation, estimates of SDC’s OLED business growth as a percentage of published OLED market forecasts and SDC’s projected minimum usage of red and green phosphorescent emitter materials over the term of the agreement.
In 2015, we entered into an OLED patent license agreement and an OLED commercial supply agreement with LG Display Co., Ltd. (LG Display), which were effective as of January 1, 2015 and superseded the existing 2007 commercial supply agreement between the parties. The new agreements have a term that is set to expire by the end of 2022. The patent license agreement provides LG Display a non-exclusive, royalty bearing portfolio license to make and sell OLED displays under the Company's patent portfolio. The patent license calls for license fees, prepaid royalties and running royalties on licensed products. The agreements include customary provisions relating to warranties, indemnities, confidentiality, assignability and business terms. The agreements provide for certain other minimum obligations relating to the volume of materials sales anticipated over the life of the agreements as well
31
as minimum royalty revenue to be generated under the patent license agreement. The Company expects to generate revenue under these agreements that are predominantly tied to LG Display's sales of OLED licensed products. The OLED commercial supply agreement provides for the sales of materials for use by LG Display, which may include phosphorescent dopants and host materials.
Technology development and support revenue is revenue earned from government contracts, development and technology evaluation agreements and commercialization assistance fees, which includes reimbursements by government entities for all or a portion of the research and development costs we incur in relation to our government contracts. Revenues are recognized proportionally as research and development costs are incurred, or as defined milestones are achieved.
While we have made significant progress over the past few years developing and commercializing our family of OLED technologies (including our PHOLED, TOLED, FOLED technologies) and materials, and have generated net income over the past three years, we incurred significant losses prior to this period, resulting in an accumulated deficit of $73.6 million as of December 31, 2015.
We anticipate fluctuations in our annual and quarterly results of operations due to uncertainty regarding, among other factors:
• | the timing, cost and volume of sales of our OLED materials; |
• | the timing of our receipt of license fees and royalties, as well as fees for future technology development and evaluation; |
• | the timing and magnitude of expenditures we may incur in connection with our ongoing research and development and patent-related activities; and |
• | the timing and financial consequences of our formation of new business relationships and alliances. |
Critical Accounting Policies and Estimates
The discussion and analysis of our financial condition and results of operations is based on our consolidated financial statements, which have been prepared in accordance with U.S. generally accepted accounting principles. The preparation of these financial statements requires us to make estimates and judgments that affect our reported assets and liabilities, revenues and expenses, and other financial information. Actual results may differ significantly from our estimates under other assumptions and conditions.
We believe that our accounting policies related to revenue recognition and deferred revenue, inventories, the valuation and recoverability of acquired technology, stock-based compensation, income taxes and our Supplemental Executive Retirement Plan, as described below, are our “critical accounting policies” as contemplated by the SEC. These policies, which have been reviewed with our Audit Committee, are discussed in greater detail below.
Revenue Recognition and Deferred Revenue
Material sales relate to the Company's sale of its OLED materials for incorporation into its customers' commercial OLED products or for their OLED development and evaluation activities. Material sales are recognized at the time of shipment or at time or delivery, and the passage of title, depending upon the contractual agreement between the parties.
We receive non-refundable advance license and royalty payments under certain commercial, development and technology evaluation agreements with our customers. These payments may include royalty and license fees made pursuant to license agreements and certain material supply agreements. Amounts received are deferred and classified as either current or non-current deferred revenue based upon current contractual remaining terms; however, based upon on-going relationships with customers, as well as future agreement extensions and other factors, amounts classified as current may not be recognized as revenue over the next twelve months. The Company evaluates these agreements quarterly, and if it is determined that there is no appreciable likelihood of executing a commercial license agreement with the customer or if a customer terminates the relationship prior to the expiration of its term, the previous deferred amount will recognized as revenue in the corresponding period. For arrangements with extended payment terms where the fee is not fixed and determinable, we recognize revenue when the payment is due and payable. Royalty revenue and license fee revenue included as part of commercial supply agreements are recognized when earned and the amount is fixed and determinable. If we used different estimates for the useful life of the licensed technology, or if fees are fixed and determinable, reported revenue during the relevant period would differ.
Technology development and support revenue is revenue earned from government contracts, development and technology evaluation agreements and commercialization assistance fees, which includes reimbursements by the U.S. government for all or a portion of the research and development expenses we incur related to our government contracts. Revenue is recognized proportionally as research and development expenses are incurred or as defined milestones are achieved. In order to ascertain the revenue associated with these contracts for a period, we estimate the proportion of related research and development expenses incurred and whether defined milestones have been achieved. Different estimates would result in different revenues for the period.
32
The Company records taxes billed to customers and remitted to various governmental entities on a gross basis in both revenues and cost of material sales in the consolidated statements of income. The amounts of these pass through taxes reflected in revenues and cost of material sales were $1.3 million, $4.3 million and $178,000 for the years ended December 31, 2015, 2014 and 2013, respectively.
Inventories
Inventories consist of raw materials, work-in-process and finished goods, including inventory consigned to our customers, and are stated at the lower of cost, determined on a first-in, first-out basis, or market. Inventory valuation and firm committed purchase order assessments are performed on a quarterly basis and those items that are identified to be obsolete or in excess of forecasted usage are written down to their estimated realizable value. Estimates of realizable value are based upon management’s analyses and assumptions, including, but not limited to, forecasted sales levels by product, expected product lifecycle, product development plans and future demand requirements. A 12-month rolling forecast based on factors, including, but not limited to, our production cycles, anticipated product orders, marketing forecasts, backlog, and shipment activities is used in the analysis. If market conditions are less favorable than our forecasts or actual demand from our customers is lower than our estimates, we may require additional inventory write-downs. If demand is higher than expected, inventories that had previously been written down may be sold.
Certain of the Company’s customers have assumed the responsibility for maintaining our inventory at their location based on the customers' demand forecast. Notwithstanding the fact that the Company builds and ships the inventory, the customer does not purchase the consigned inventory until the inventory is drawn or pulled by the customer to be used in the manufacture of the customer’s product. Though the consigned inventory may be at the customer’s physical location, it remains inventory owned by the Company until the inventory is drawn or pulled, which is the time at which the sale takes place.
Valuation of Stock-Based Compensation
We recognize in the statement of income the grant-date fair value of equity-based compensation issued to employees and directors (see Notes 2 and 12 of the Notes to Consolidated Financial Statements). We also record an expense for equity-based compensation grants to non-employees, in exchange for goods or services based on the fair value of the award, which is remeasured over the vesting period of such awards.
The performance unit awards we grant are subject to either a performance-based or market-based vesting requirement. For performance-based vesting, the grant-date fair value of the award, based on fair value of the Company's common stock, is recognized over the service period, based on an assessment of the likelihood that the applicable performance goals will be achieved, and compensation expense is periodically adjusted based on actual and expected performance. Compensation expense for performance unit awards with market-based vesting is calculated based on the estimated fair value as of the grant date utilizing a Monte Carlo simulation model and is recognized over the service period on a straight-line basis.
Accounting for Income Taxes
We are subject to income taxes in both the U.S. and foreign jurisdictions. Significant judgments and estimates are required in evaluating our tax positions for future realization and determining our provision for income taxes. Our income tax expense, deferred tax assets and liabilities, and reserves for unrecognized tax benefits reflect management's best assessment of estimated future taxes to be paid.
Our income tax expense during the year ended December 31, 2015 primarily related to federal taxes on our U.S. income and foreign withholding taxes. The foreign taxes were primarily related to foreign taxes withheld on royalty and license fees paid to the U.S. operating entity. SDC has been required to withhold tax upon payment of royalty and license fees to the U.S. operating entity at a rate of 16.5%. In assessing the realizability of deferred tax assets, we consider whether it is more likely than not that some portion or all of our deferred tax assets will not be realized. The ultimate realization of deferred tax assets is dependent on our ability to generate future taxable income to obtain benefit from the reversal of temporary differences, net operating loss carryforwards and tax credits. As part of our assessment we consider the scheduled reversal of deferred tax liabilities, projected future taxable income, and tax planning strategies. During the year ended December 31, 2015, based on previous earnings history, a current evaluation of expected future taxable income and other evidence, we determined to retain the valuation allowance that relates to UDC Ireland, U.S. foreign tax credits and New Jersey research and development credits.
Actual results could differ from our assessments if adequate taxable income is generated in future periods. To the extent we establish a new valuation allowance or change a previously established valuation allowance in a future period, income tax expense will be impacted. In addition, our ability to use our federal net operating loss carryforwards could be subject to limitation because of certain ownership changes. Net deferred tax assets totaled $27.3 million, representing, 4.9% of total assets, as of December 31, 2015.
33
Retirement Plan
We have recorded a significant retirement plan benefit liability that is developed from actuarial valuations. The determination of our retirement plan benefit liability requires key assumptions regarding discount rates, as well as rates of compensation increases, retirement dates and life expectancies used to determine the present value of future benefit payments. We determine these assumptions in consultation with, and after input from, our actuaries and considering our experience and expectations for the future. Actual results for a given period will often differ from assumed amounts because of economic and other factors.
The discount rate reflects the estimated rate at which the benefit liabilities could be settled at the end of the year. The discount rate is determined by selecting a single rate that produces a result equivalent to discounting expected benefit payments from the plan using the Citigroup Above-Median Pension Discount Curve (the Curve). Based upon this analysis using the Curve, we used a discount rate to measure our retirement plan benefit liability of 3.78% at December 31, 2015. A change of 25 basis points in the discount rate would increase or decrease the expense on an annual basis by approximately $35,000.
RESULTS OF OPERATIONS
Year Ended December 31, 2015 Compared to Year Ended December 31, 2014
We had operating income of $32.3 million for the year ended December 31, 2015, compared to operating income of $58.6 million for the year ended December 31, 2014. The decrease in operating income was due to the following:
• | an increase in operating expenses of $26.4 million, which includes a $21.7 million increase in the cost of material sales due to a $33.0 million write-down of inventory. Without the write-down of inventory, operating income would have been $65.3 million, an increase of $6.7 million. See the discussion of non-GAAP measures in Item 6 (Selected Financial Data) of this report. |
• | selling, general and administrative expenses increased by $0.9 million and research and development expenses increased by $3.5 million, all of which are described below. |
We had net income of $14.7 million (or $0.31 per basic and diluted share) for the year ended December 31, 2015, compared to net income of $41.9 million (or $0.90 per basic and diluted share) for the year ended December 31, 2014. The decrease in net income was primarily due to:
• | a decrease in operating income of $26.3 million, which in turn was mainly due to the $33.0 million write-down of inventory; and |
• | an increase in income tax expense of $0.9 million. |
Excluding the inventory write-down in the second quarter of 2015 and its related impact on our effective tax rate, we had non-GAAP net income of $44.8 million (or $0.96 per non-GAAP basic and $0.94 per non-GAAP diluted share) for the year ended December 31, 2015. See the discussion of non-GAAP measures in Item 6 (Selected Financial Data) of this report.
Revenue
The following table details our revenues for the years ended December 31, 2015 and 2014 (amounts in thousands):
Year Ended December 31, | (Decrease) Increase | ||||||||||||||
2015 | 2014 | $ | % | ||||||||||||
Revenue: | |||||||||||||||
Material sales | $ | 113,066 | $ | 126,885 | $ | (13,819 | ) | (11 | )% | ||||||
Royalty and license fees | 77,773 | 63,192 | 14,581 | 23 | % | ||||||||||
Technology development and support revenue | 207 | 954 | (747 | ) | (78 | )% | |||||||||
Total revenue | $ | 191,046 | $ | 191,031 | $ | 15 | — | % | |||||||
Total revenue for the year ended December 31, 2015 increased by $15,000 compared to the year ended December 31, 2014. The increase in revenue was primarily the result of an increase in royalty and license fees offset by a decrease in material sales, described in more detail below.
34
Material sales
The following table details our revenues derived from material sales for the years ended December 31, 2015 and 2014 (amounts in thousands):
Year Ended December 31, | (Decrease) Increase | ||||||||||||||
2015 | 2014 | $ | % | ||||||||||||
Material sales: | |||||||||||||||
Commercial material sales | $ | 101,141 | $ | 117,499 | $ | (16,358 | ) | (14 | )% | ||||||
Developmental material sales | 11,925 | 9,386 | 2,539 | 27 | % | ||||||||||
Total material sales | $ | 113,066 | $ | 126,885 | $ | (13,819 | ) | (11 | )% | ||||||
Commercial material sales for the year ended December 31, 2015 decreased by $16.4 million compared to the year ended December 31, 2014, primarily due to lower host sales of $28.8 million, offset, to some extent, by a $15.0 million increase in phosphorescent emitter sales, described in more detail below.
Developmental material sales for the year ended December 31, 2015 increased by $2.5 million compared to the year ended December 31, 2014. The increase in our development material sales was primarily due to an increase in the numbers of grams sold.
Material sales included sales of both phosphorescent emitter and host materials which were comprised of the following for the years ended December 31, 2015 and 2014 (amounts in thousands):
Year Ended December 31, | Increase (Decrease) | ||||||||||||||
2015 | 2014 | $ | % | ||||||||||||
Material sales: | |||||||||||||||
Phosphorescent emitter sales | $ | 100,571 | $ | 85,559 | $ | 15,012 | 18 | % | |||||||
Host material sales | 12,495 | 41,326 | (28,831 | ) | (70 | )% | |||||||||
Total material sales | $ | 113,066 | $ | 126,885 | $ | (13,819 | ) | (11 | )% | ||||||
Phosphorescent emitter sales for the year ended December 31, 2015 increased by $15.0 million compared to the year ended December 31, 2014. The increase in emitter sales was primarily due to an increase in the number of grams sold, offset, to some extent, by a decrease in the average price per gram sold.
Host material sales for the year ended December 31, 2015 decreased by $28.8 million compared to the year ended December 31, 2014. The decline in our host material sales was primarily due to a decrease in the number of grams sold due to what we believe was a result of our customer's continuing to sell new products that do not include our host materials, as well as a reduction in the average price per gram sold. Based on our current sales forecast, we anticipate that sales of existing host material will continue to be reduced. Our customers are not required to purchase our host materials in order to utilize our phosphorescent emitter materials, and the host material sales business continues to be more competitive than the phosphorescent emitter material sales business.
Royalty and license fees
Royalty and license fees were as follows for the years ended December 31, 2015 and 2014 (amounts in thousands):
Year Ended December 31, | Increase | ||||||||||||||
2015 | 2014 | $ | % | ||||||||||||
Royalty and license fees | $ | 77,773 | $ | 63,192 | $ | 14,581 | 23 | % | |||||||
Royalty and license fees for the year ended December 31, 2015 increased by $14.6 million compared to the year ended December 31, 2014. The increase reflects the receipt and therefore recognition of $60.0 million of royalty and license fee payments under our patent and license agreement with SDC, compared to $50.0 million in the prior period.
35
Technology development and support revenue
Technology development and support revenue were as follows for the years ended December 31, 2015 and 2014 (amounts in thousands):
Year Ended December 31, | (Decrease) | ||||||||||||||
2015 | 2014 | $ | % | ||||||||||||
Technology development and support revenue | $ | 207 | $ | 954 | $ | (747 | ) | (78 | )% | ||||||
Technology development and support revenue is revenue earned from government contracts, development and technology evaluation agreements and commercialization assistance fees, which includes reimbursements by the U.S. government for all or a portion of the research and development expenses we incur related to our government contracts.
Technology development and support revenue for the year ended December 31, 2015 decreased by $0.7 million compared to the year ended December 31, 2014. The decrease was primarily related to the smaller number of government contracts. We do not anticipate this to be a material revenue stream in the future.
Cost of material sales
Cost of commercial material sales were as follows for the years ended December 31, 2015 and 2014 (amounts in thousands):
Year Ended December 31, | ||||||||
2015 | 2014 | |||||||
Commercial material sales | $ | 101,141 | $ | 117,499 | ||||
Cost of commercial material sales | 62,997 | 41,315 | ||||||
Inventory write-down | 33,000 | 3,900 | ||||||
% of commercial material sales | 62 | % | 35 | % | ||||
Cost of commercial material sales for the year ended December 31, 2015 increased by $21.7 million compared to the year ended December 31, 2014. The increase in the cost of our commercial material sales was primarily due to an inventory write-down of $33.0 million, offset to some extent by a decrease in commercial material sales. During the second quarter of 2015, the Company experienced a faster-than-anticipated decline in host material sales and based on the most recent sales forecasts, we determined that there were likely to be significantly lower sales of our existing host material. As such, a write-down in net realizable value of our inventory was performed in the second quarter. Without the write-down and commensurate with the decline in material sales revenue, the cost of commercial material sales would have been $30.0 million for the year ended December 31, 2015, and the cost of commercial material sales as a percent of commercial material sales would have been 29.7% for the year ended December 31, 2015. The increase in commercial sales margin absent the write-down was due to the decrease in host material sales, which have less favorable margins than our emitter materials. Depending on the amounts, timing and state of materials being classified as commercial, we expect cost of materials sales to fluctuate year over year.
Cost of commercial material sales includes the cost of producing materials that have been classified as commercial and shipping costs for such materials, but excludes the cost of producing certain materials, which have already been included in research and development expense.
Research and development
We incurred research and development expenses of $44.6 million for the year ended December 31, 2015, compared to $41.2 million for the year ended December 31, 2014. The increase was primarily due to:
• | increased costs of $1.2 million associated with bonus, retirement benefits, and stock-based compensation for certain employees as well as increased salaries and salary related expenses associated with new and existing employees; and |
• | increased consulting and lab related costs of $2.9 million due to increased outsourced research and development efforts. |
Selling, general and administrative
Selling, general and administrative expenses were $29.0 million for the year ended December 31, 2015, compared to $28.1 million for the year ended December 31, 2014. The increase was primarily due to increased costs associated with bonus, retirement benefits, and stock-based compensation for certain executive officers, and increased salaries and salary-related expenses associated with new and existing employees.
36
Patent costs and amortization of acquired technology
Patent costs and amortization of acquired technology decreased to $16.7 million for the year ended December 31, 2015, compared to $17.3 million for the year ended December 31, 2014. The decrease relates to a decrease in patents costs mainly due to lower legal expenses.
Royalty and license expense
Royalty and license expense increased to $5.4 million for the year ended December 31, 2015, compared to $4.5 million for the year ended December 31, 2014. The increase was mainly due to increased royalties incurred under our amended license agreement with Princeton, USC, and Michigan, resulting from higher material sales and increased royalty and license fees. See Note 3 in Notes to Consolidated Financial Statements for further discussion.
Income taxes
We recorded income tax expense of $18.4 million for the year ended December 31, 2015 compared to income tax expense of $17.5 million for the year ended December 31, 2014.
Our income tax expense for the years ended December 31, 2015 and 2014 primarily related to foreign withholding taxes and federal taxes on our U.S. income.
The foreign taxes are primarily related to foreign taxes withheld on royalty and license fees paid to the U.S. operating entity. SDC has been required to withhold tax upon payment of royalty and license fees to the U.S. operating entity at a rate of 16.5%. During the year ended December 31, 2015 and 2014, we paid South Korea withholding taxes of $9.9 million and $8.3 million, respectively.
Year Ended December 31, 2014 Compared to Year Ended December 31, 2013
We had operating income of $58.6 million for the year ended December 31, 2014, compared to operating income of $38.2 million for the year ended December 31, 2013. The increase in operating income was due to:
• | an increase in revenue of $44.4 million, which includes increases in both material sales and royalty and license fees, partially offset by a $3.0 million dollar decrease in technology development and support revenue; offset by |
• | an increase in operating expenses of $24.0 million, which includes a $12.4 million increase in the cost of material sales, a $3.4 million increase in selling, general and administrative expenses and a $6.9 million increase in research and development expenses, all of which are described below. |
We had net income of $41.9 million (or $0.90 per basic and diluted share) for the year ended December 31, 2014, compared to net income of $74.1 million (or $1.61 per basic and diluted share) for the year ended December 31, 2013. The decrease in net income was primarily due to:
• | recording income tax expense of $17.5 million in 2014 compared to the recognition of a tax benefit of $35.0 million in 2013, resulting from the release of income tax valuation allowances; offset by |
• | an increase in operating income of $20.4 million. |
We had adjusted net income of $32.6 million (or $0.71 per adjusted basic share and $0.70 per adjusted diluted share) for the year ended December 31, 2013. This non-GAAP measure excludes the effect of the tax valuation allowance releases described above. See the discussion of non-GAAP measures in Item 6 (Selected Financial Data) of this report.
Revenue
The following table details our revenues for the years ended December 31, 2014 and 2013 (amounts in thousands):
Year Ended December 31, | Increase (Decrease) | ||||||||||||||
2014 | 2013 | $ | % | ||||||||||||
Revenue: | |||||||||||||||
Material sales | $ | 126,885 | $ | 95,713 | $ | 31,172 | 33 | % | |||||||
Royalty and license fees | 63,192 | 47,006 | 16,186 | 34 | % | ||||||||||
Technology development and support revenue | 954 | 3,920 | (2,966 | ) | (76 | )% | |||||||||
Total revenue | $ | 191,031 | $ | 146,639 | $ | 44,392 | 30 | % | |||||||
Total revenue for the year ended December 31, 2014 increased by $44.4 million compared to the year ended December 31, 2013. The increase in our revenue was primarily the result of increased materials sales and royalty and license fees.
37
Material sales
The following table details our revenues derived from material sales for the years ended December 31, 2014 and 2013 (amounts in thousands):
Year Ended December 31, | Increase | ||||||||||||||
2014 | 2013 | $ | % | ||||||||||||
Material sales: | |||||||||||||||
Commercial material sales | $ | 117,499 | $ | 88,131 | $ | 29,368 | 33 | % | |||||||
Developmental material sales | 9,386 | 7,582 | 1,804 | 24 | % | ||||||||||
Total material sales | $ | 126,885 | $ | 95,713 | $ | 31,172 | 33 | % | |||||||
Commercial material sales for the year ended December 31, 2014 increased by $29.4 million compared to the year ended December 31, 2013, primarily reflecting increased commercial chemical sales resulting from the adoption of our technology and materials in the marketplace by display manufacturers.
Developmental material sales for the year ended December 31, 2014 increased by $1.8 million compared to the year ended December 31, 2013, primarily reflecting increased number of grams sold of development materials for our customer's evaluation, manufacture, and development activities. This increase was offset, to some extent, by a change in sales mix from development to commercial.
Material sales included sales of both phosphorescent emitter and host materials. Material sales were comprised of the following for the years ended December 31, 2014 and 2013 (amounts in thousands):
Year Ended December 31, | Increase | ||||||||||||||
2014 | 2013 | $ | % | ||||||||||||
Material sales: | |||||||||||||||
Phosphorescent emitter sales | $ | 85,559 | $ | 61,552 | $ | 24,007 | 39 | % | |||||||
Host material sales | 41,326 | 34,161 | 7,165 | 21 | % | ||||||||||
Total material sales | $ | 126,885 | $ | 95,713 | $ | 31,172 | 33 | % | |||||||
Phosphorescent emitter sales for the year ended December 31, 2014 increased by $24.0 million compared to the year ended December 31, 2013. The increase in our phosphorescent emitter sales was primarily due to an increase in commercial phosphorescent emitter sales and developmental phosphorescent emitter sales.
Host material sales for the year ended December 31, 2014 increased by $7.2 million compared to the year ended December 31, 2013. The increase in our host material sales was primarily due to an increase in the number of grams sold as well as the collection of pass through tax settlements of $3.9 million with a Japanese customer related to certain host sales in Japan. These increases were offset by a decrease in the average price per gram sold. Our customers are not required to purchase our host materials in order to utilize our phosphorescent emitter materials and the host materials business is more competitive than the phosphorescent material sales business.
Royalty and license fees
Royalty and license fees were as follows for the years ended December 31, 2014 and 2013 (amounts in thousands):
Year Ended December 31, | Increase | ||||||||||||||
2014 | 2013 | $ | % | ||||||||||||
Royalty and license fees | $ | 63,192 | $ | 47,006 | $ | 16,186 | 34 | % | |||||||
Royalty and license fees for the year ended December 31, 2014 increased by $16.2 million compared to the year ended December 31, 2013. This increase reflects the receipt and therefore recognition of $50.0 million of license fee payments under our patent and license agreement with SDC, compared to $40.0 million in the prior period. The increase was also related to an increase in license fees attributable to material sales to certain customers.
38
Technology development and support revenue
Technology development and support revenue were as follows for the years ended December 31, 2014 and 2013 (amounts in thousands):
Year Ended December 31, | (Decrease) | ||||||||||||||
2014 | 2013 | $ | % | ||||||||||||
Technology development and support revenue | $ | 954 | $ | 3,920 | $ | (2,966 | ) | (76 | )% | ||||||
Technology development and support revenue is revenue earned from government contracts, development and technology evaluation agreements and commercialization assistance fees, which includes reimbursements by the U.S. government for all or a portion of the research and development expenses we incur related to our government contracts.
Technology development and support revenue for the year ended December 31, 2014 decreased by $3.0 million compared to year ended December 31, 2013. The decrease is primarily related to the smaller number of government contracts and due to the timing of revenue recognition for certain customers.
Cost of material sales
Cost of commercial material sales were as follows for the years ended December 31, 2014 and 2013 (amounts in thousands):
Year Ended December 31, | ||||||||
2014 | 2013 | |||||||
Commercial material sales | $ | 117,499 | $ | 88,131 | ||||
Cost of commercial material sales | 41,315 | 28,889 | ||||||
% of commercial material sales | 35 | % | 33 | % | ||||
Cost of commercial material sales for the year ended December 31, 2014 increased 12.4 million from the year ended December 31, 2013. The increase in our cost of commercial material sales was primarily due to the 33% increase in commercial material sales as well as an increase in pass through tax settlements of $3.9 million that was owed to the Japanese tax authority related to certain host sales in Japan. In 2014, cost of materials sales was further increased by inventory write-downs of $3.9 million. This increase was partially offset by a reduction in costs of manufacturing the materials. Depending on the amounts, timing and stage of materials being classified as commercial, we expect cost of materials sales to fluctuate year over year.
Cost of commercial material sales includes the cost of producing materials that have been classified as commercial and shipping costs for such materials, but excludes the cost of producing certain materials, which have already been included in research and development expense.
Research and development
We incurred research and development expenses of $41.2 million for the year ended December 31, 2014, compared to $34.2 million for the year ended December 31, 2013. The increase was primarily due to:
• | increased costs of $2.7 million associated with bonus and stock-based compensation for certain executive officers as well as increased salaries and salary-related expenses associated with new and existing employees; |
• | increased costs of $3.9 million incurred under our agreement with PPG Industries; and |
• | increased consulting and lab related costs of $2.4 million due to increased outsourced research and development efforts; offset by |
• | decreased costs of $1.9 million related to joint development and sponsored research contracts. |
Selling, general and administrative
Selling, general and administrative expenses were $28.1 million for the year ended December 31, 2014, compared to $24.7 million for the year ended December 31, 2013. The increase was primarily due to increased costs associated with bonus and stock-based compensation for certain executive officers as well as increased salaries and salary-related expenses associated with new and existing employees.
Patent costs and amortization of acquired technology
Patent costs and amortization of acquired technology increased to $17.3 million for both the year ended December 31, 2014 and 2013.
39
Royalty and license expense
Royalty and license expense increased to $4.5 million for the year ended December 31, 2014, compared to $3.3 million for the year ended December 31, 2013. The increase was mainly due to increased royalties incurred under our amended license agreement with Princeton, USC, and Michigan, resulting from higher material sales and increased royalty and license fees. See Note 3 in the Notes to Consolidated Financial Statements for further discussion.
Interest income
Interest income decreased to $0.8 million for the year ended December 31, 2014, compared to $0.8 million for the year ended December 31, 2013.
Income taxes
We recorded income tax expense of $17.5 million for the year ended December 31, 2014 compared to an income tax benefit of $35.0 million year ended December 31, 2013.
Our income tax expense for the year ended December 31, 2014 was primarily related to foreign withholding taxes and federal taxes on our U.S. income. Our income tax benefit during the year ended December 31, 2013 was primarily the result of the release of valuation allowances offset by foreign withholding taxes.
The foreign taxes are primarily related to foreign taxes withheld on royalty and license fees paid to the U.S. operating entity. SDC has been required to withhold tax upon payment of royalty and license fees to U.S. operating entity at a rate of 16.5%. During the years ended December 31, 2014 and 2013, we paid South Korean withholding taxes of $8.3 million and $6.6 million, respectively.
Liquidity and Capital Resources
Our principle sources of liquidity are our cash and cash equivalents and our short-term investments. As of December 31, 2015, we had cash and cash equivalents of $97.5 million and short-term investments of $298.0 million, for a total of $395.5 million. This compares to cash and cash equivalents of $45.4 million and short-term investments of $243.1 million, for a total of $288.5 million, as of December 31, 2014 providing for a total liquidity increase of $107.0 million. The increase in cash and cash equivalents of $52.1 million was primarily due to cash provided by operating activities, partially offset by cash used in investing activities and financing activities.
Cash provided by operating activities was $113.6 million for the year ended December 31, 2015, compared to $47.3 million for the year ended December 31, 2014. The increase in cash provided by operating activities was primarily due to the following:
• | the receipt of $48.8 million from customers for prepaid royalty and license fees recognized as deferred revenue; and |
• | the impact of the timing of net inventory purchases of $21.8 million. |
Cash used in investing activities was $58.6 million for the year ended December 31, 2015, compared to $42.3 million for the year ended December 31, 2014. The increase in cash used in investing activities was mainly due to the timing of maturities and purchases of investments resulting in net purchases of $53.5 million for the year ended December 31, 2015, compared to net purchases of $36.2 million for the year ended December 31, 2014.
Cash used in financing activities was $2.9 million for the year ended December 31, 2015, compared to cash used of $30.1 million for the year ended December 31, 2014. The decrease in cash used in financing activities was primarily due to the fact that there were no repurchases of common stock during the year ended December 31, 2015 compared to $29.5 million of repurchases of common stock during in the year ended December 31, 2014.
Working capital was $413.2 million as of December 31, 2015, compared to $343.7 million as of December 31, 2014. The increase in working capital is primarily due to the increase in cash and cash equivalents, short-term investments, partially offset by a decrease in inventories and an increase in deferred revenue.
We anticipate, based on our internal forecasts and assumptions relating to our operations (including, among others, assumptions regarding our working capital requirements, the progress of our research and development efforts, the availability of sources of funding for our research and development work, and the timing and costs associated with the preparation, filing, prosecution, maintenance, defense and enforcement of our patents and patent applications), that we have sufficient cash, cash equivalents and short-term investments to meet our obligations for at least the next twelve months.
40
We believe that potential additional financing sources for us include long-term and short-term borrowings, public and private sales of our equity and debt securities and the receipt of cash upon the exercise of outstanding stock options. It should be noted, however, that additional funding may be required in the future for research, development and commercialization of our OLED technologies and materials, to obtain, maintain and enforce patents respecting these technologies and materials, and for working capital and other purposes, the timing and amount of which are difficult to ascertain. There can be no assurance that additional funds will be available to us when needed, on commercially reasonable terms or at all, particularly in the current economic environment.
Contractual Obligations
As of December 31, 2015, we had the following contractual commitments:
Payments due by period (in thousands) | ||||||||||||||||||||
Contractual Obligations | Total | Less than 1 year | 1-3 years | 3-5 years | More than 5 years | |||||||||||||||
Estimated retirement plan benefit payments | $ | 43,286 | $ | — | $ | 5,372 | $ | 5,453 | $ | 32,461 | ||||||||||
Research related obligations | 3,546 | 1,304 | 2,242 | — | — | |||||||||||||||
Minimum royalty obligation (1) | 500 | 100 | 200 | 200 | $100/year | |||||||||||||||
Total (2) | $ | 47,332 | $ | 1,404 | $ | 7,814 | $ | 5,653 | $ | 32,461 | ||||||||||
(1) Under the 1997 Amended License Agreement, we are obligated to pay Princeton minimum royalties of $100,000 per year until the agreement is no longer in effect. The agreement has no scheduled expiration date.
(2) See Note 13 to the Consolidated Financial Statements for discussion of obligations upon termination of employment of executive officers as a result of a change in our control.
Off-Balance Sheet Arrangements
As of December 31, 2015, we had no off-balance sheet arrangements in the nature of guarantee contracts, retained or contingent interests in assets transferred to unconsolidated entities (or similar arrangements serving as credit, liquidity or market risk support to unconsolidated entities for any such assets), or obligations (including contingent obligations) arising out of variable interests in unconsolidated entities providing financing, liquidity, market risk or credit risk support to us, or that engage in leasing, hedging or research and development services with us.
Recently Issued Accounting Pronouncements
Recently issued accounting pronouncements are addressed in Note 2 in the Notes to Consolidated Financial Statements.
ITEM 7A. | QUANTITATIVE AND QUALITATIVE DISCLOSURES ABOUT MARKET RISK |
We do not utilize financial instruments for trading purposes and hold no derivative financial instruments, other financial instruments or derivative commodity instruments that could expose us to significant market risk other than our investments disclosed in “Fair Value Measurements” in Note 2 to the Consolidated Financial Statements included herein. We generally invest in investment grade financial instruments to reduce our exposure related to investments. Our primary market risk exposure with regard to such financial instruments is to changes in interest rates, which would impact interest income earned on investments. However, based upon the conservative nature of our investment portfolio and current experience, we do not believe a decrease in investment yields would have a material negative effect on our interest income.
Substantially all our revenue is derived from outside of North America. All revenue is primarily denominated in U.S. dollars and therefore we bear no significant foreign exchange risk.
ITEM 8. | FINANCIAL STATEMENTS AND SUPPLEMENTARY DATA |
Our Consolidated Financial Statements and the related notes to those statements are attached to this report beginning on page F-1.
ITEM 9. | CHANGES IN AND DISAGREEMENTS WITH ACCOUNTANTS ON ACCOUNTING AND FINANCIAL DISCLOSURE |
None.
41
ITEM 9A. | CONTROLS AND PROCEDURES |
Evaluation of Disclosure Controls and Procedures
Our management, with the participation of our Chief Executive Officer and Chief Financial Officer, evaluated the effectiveness of our disclosure controls and procedures as of December 31, 2015. Based on that evaluation, the Chief Executive Officer and Chief Financial Officer concluded that our disclosure controls and procedures, as of the end of the period covered by this report, are effective to provide reasonable assurance that the information required to be disclosed by us in reports filed or submitted under the Securities Exchange Act of 1934, as amended, is (i) recorded, processed, summarized and reported within the time periods specified in the SEC’s rules and forms, and (ii) accumulated and communicated to our management, including the Chief Executive Officer and Chief Financial Officer, as appropriate to allow timely decisions regarding disclosure. However, a controls system, no matter how well designed and operated, cannot provide absolute assurance that the objectives of the controls system are met, and no evaluation of controls can provide absolute assurance that all control issues and instances of fraud, if any, within a company have been detected.
Management’s Report on Internal Control over Financial Reporting and Report of Independent Registered Public Accounting Firm on Internal Control over Financial Reporting
The report of management on our internal control over financial reporting and the associated attestation report of our independent registered public accounting firm are set forth in Item 8 of this report.
Changes in Internal Control over Financial Reporting
There were no changes in our internal control over financial reporting during the quarter ended December 31, 2015 that have materially affected, or are reasonably likely to materially affect, our internal control over financial reporting.
ITEM 9B. | OTHER INFORMATION |
None.
42
PART III
ITEM 10. | DIRECTORS, EXECUTIVE OFFICERS AND CORPORATE GOVERNANCE |
Information with respect to this item is set forth in our definitive Proxy Statement for the 2016 Annual Meeting of Shareholders, which is to be filed with the Securities and Exchange Commission no later than April 29, 2016 (our “Proxy Statement”), and which is incorporated herein by reference. Information regarding our executive officers is included at the end of Part I of this report.
ITEM 11. | EXECUTIVE COMPENSATION |
Information with respect to this item will be set forth in our Proxy Statement, and is incorporated herein by reference.
ITEM 12. | SECURITY OWNERSHIP OF CERTAIN BENEFICIAL OWNERS AND MANAGEMENT AND RELATED STOCKHOLDER MATTERS |
Information with respect to this item will be set forth in our Proxy Statement, and is incorporated herein by reference.
ITEM 13. | CERTAIN RELATIONSHIPS AND RELATED TRANSACTIONS, AND DIRECTOR INDEPENDENCE |
Information with respect to this item will be set forth in our Proxy Statement, and is incorporated herein by reference.
ITEM 14. | PRINCIPAL ACCOUNTANT FEES AND SERVICES |
Information with respect to this item will be set forth in our Proxy Statement, and is incorporated herein by reference.
43
PART IV
ITEM 15. | EXHIBITS AND FINANCIAL STATEMENT SCHEDULES |
(a) The following documents are filed as part of this report:
(1) Financial Statements:
Management’s Report on Internal Control Over Financial Reporting | F-2 |
Reports of Independent Registered Public Accounting Firm | F-3 |
Consolidated Balance Sheets | F-5 |
Consolidated Statements of Income | F-6 |
Consolidated Statements of Comprehensive Income | F-7 |
Consolidated Statements of Shareholders’ Equity | F-8 |
Consolidated Statements of Cash Flows | F-9 |
Notes to Consolidated Financial Statements | F-10 |
(2) Financial Statement Schedules:
None.
(3) Exhibits:
The following is a list of the exhibits filed as part of this report. Where so indicated by footnote, exhibits that were previously filed are incorporated by reference. For exhibits incorporated by reference, the location of the exhibit in the previous filing is indicated parenthetically, together with a reference to the filing indicated by footnote.
Exhibit Number | Description | |
3.1 | Amended and Restated Articles of Incorporation of the registrant (1) | |
3.2 | Bylaws of the registrant (2) | |
10.1# | Amended and Restated Change in Control Agreement between the registrant and Sherwin I. Seligsohn, dated as of November 4, 2008 (3) | |
10.2# | Amended and Restated Change in Control Agreement between the registrant and Steven V. Abramson, dated as of November 4, 2008 (3) | |
10.3# | Amended and Restated Change in Control Agreement between the registrant and Sidney D. Rosenblatt, dated as of November 4, 2008 (3) | |
10.4# | Amended and Restated Change in Control Agreement between the registrant and Julia J. Brown, dated as of November 4, 2008 (3) | |
10.5# | Amended and Restated Change in Control Agreement between the registrant and Janice M. DuFour, dated as of November 4, 2008 (3) | |
10.6# | Non-Competition and Non-Solicitation Agreement between the registrant and Sherwin I. Seligsohn, dated as of February 23, 2007 (5) | |
10.7# | Non-Competition and Non-Solicitation Agreement between the registrant and Steven V. Abramson, dated as of January 26, 2007 (5) | |
10.8# | Non-Competition and Non-Solicitation Agreement between the registrant and Sidney D. Rosenblatt, dated as of February 7, 2007 (5) | |
10.9# | Non-Competition and Non-Solicitation Agreement between the registrant and Julia J. Brown, dated as of February 5, 2007 (5) | |
10.10# | Non-Competition and Non-Solicitation Agreement between the registrant and Janice M. DuFour, dated as of February 23, 2007 (3) | |
10.11# | Equity Retention Agreement between the registrant and Steven V. Abramson, dated as of March 18, 2010 (6) | |
10.12# | Equity Retention Agreement between the registrant and Sidney D. Rosenblatt, dated as of March 18, 2010 (6) | |
10.13# | Equity Retention Agreement between the registrant and Julia J. Brown, dated as of January 6, 2011 (7) | |
10.14# | Equity Retention Agreement between the registrant and Janice M. DuFour, dated as of January 6, 2011 (7) | |
10.15# | Equity Retention Agreement between the registrant and Julia J. Brown, dated as of March 8, 2012 (8) | |
44
Exhibit Number | Description | |
10.16# | Equity Retention Agreement between the registrant and Janice M. DuFour, dated as of March 8, 2012 (8) | |
10.17# | Amended and Restated Change in Control Agreement between the Registrant and Mauro Premutico, dated April 16, 2012 (9) | |
10.22# | Equity Retention Agreement between the Registrant and Mauro Premutico, dated April 16, 2012 (9) | |
10.19# | Supplemental Executive Retirement Plan, dated as of April 1, 2010 (6) | |
10.20# | Amended and Restated Equity Compensation Plan, effective as of March 7, 2013 (10) | |
10.21 | Sponsored Research Agreement between the registrant and the University of Southern California, dated as of May 1, 2006 (11) | |
10.22 | Amendment No. 1 to the Sponsored Research Agreement between the registrant and the University of Southern California, dated as of May 1, 2006 (3) | |
10.23 | Amendment No. 2 to the Sponsored Research Agreement between the registrant and the University of Southern California, dated as of May 7, 2009 (12) | |
10.24 | 1997 Amended License Agreement among the registrant, The Trustees of Princeton University and the University of Southern California, dated as of October 9, 1997 (13) | |
10.25 | Amendment #1 to the Amended License Agreement among the registrant, the Trustees of Princeton University and the University of Southern California, dated as of August 7, 2003 (14) | |
10.26 | Amendment #2 to the Amended License Agreement among the registrant, the Trustees of Princeton University, the University of Southern California and the Regents of the University of Michigan, dated as of January 1, 2006 (14) | |
10.27 | Termination, Amendment and License Agreement by and among the registrant, PD-LD, Inc., Dr. Vladimir S. Ban, and The Trustees of Princeton University, dated as of July 19, 2000 (15) | |
10.28 | Letter of Clarification of UDC/GPEC Research and License Arrangements between the registrant and Global Photonic Energy Corporation, dated as of June 4, 2004 (5) | |
10.29+ | Amended and Restated OLED Materials Supply and Service Agreement between the registrant and PPG Industries, Inc., dated as of October 1, 2011 (16) | |
10.30+ | OLED Patent License Agreement between the registrant and Samsung Mobile Display Co., Ltd., dated as of August 22, 2011 (17) | |
10.31+ | Supplemental OLED Material Purchase Agreement between the registrant and Samsung Mobile Display Co., Ltd., dated as of August 22, 2011 (17) | |
10.32+ | Settlement and License Agreement between the registrant and Seiko Epson Corporation, dated as of July 31, 2006(18) | |
10.33+ | Amendment No. 1 to the Settlement and License Agreement between the registrant and Seiko Epson Corporation, dated as of March 30, 2009 (19) | |
10.33+ | OLED Technology License Agreement between the registrant and Konica Minolta Holdings, Inc., dated as of August 11, 2008 (20) | |
10.34+ | Limited-Term OLED Technology License Agreement between the registrant and Panasonic Idemitsu OLED Lighting Co., Ltd., dated as of August 23, 2011 (16) | |
10.35+ | OLED Technology License Agreement between the registrant and Pioneer Corporation, dated as of September 27, 2011 (22) | |
10.36+ | OLED Technology License Agreement between the registrant and Lumiotec, Inc., dated as of January 5, 2012 (8) | |
10.37+ | Patent Sale Agreement, dated as of July 23, 2012 by and between FUJIFILM Corporation and the Company. (23) | |
10.38 | Amendment No. 3 to the Sponsored Research Agreement between the registrant and the University of Southern California, dated as of June 1, 2013 (24). | |
10.39# | Universal Display Corporation Annual Incentive Plan (25) | |
10.40# | Form Agreement - Restricted Stock Unit Grant Letter (26) | |
10.41# | Form Agreement - Performance Unit Grant Letter (26) | |
10.42# | Universal Display Corporation Equity Compensation Plan (27) | |
10.43# | Amendment 2015-1, dated March 3, 2015, to Universal Display Corporation Supplemental Executive Retirement Plan(28) | |
10.44# | Equity Retention Agreement between the Registrant and Steven V. Abramson, dated April 7, 2015 (29) | |
10.45# | Equity Retention Agreement between the Registrant and Sidney D. Rosenblatt, dated April 7, 2015(29) | |
10.46# | Equity Retention Agreement between the Registrant and Julia J. Brown, dated September 10, 2015 (30) | |
45
Exhibit Number | Description | |
10.47# | Equity Retention Agreement between the Registrant and Mauro Premutico, dated September 10, 2015(30) | |
21* | Subsidiaries of the registrant | |
23.1* | Consent of KPMG LLP | |
31.1* | Certifications of Steven V. Abramson, Chief Executive Officer, as required by Rule 13a-14(a) or Rule 15d-14(a) | |
31.2* | Certifications of Sidney D. Rosenblatt, Chief Financial Officer, as required by Rule 13a-14(a) or Rule 15d-14(a) | |
32.1** | Certifications of Steven V. Abramson, Chief Executive Officer, as required by Rule 13a-14(b) or Rule 15d-14(b), and by 18 U.S.C. Section 1350. (This exhibit shall not be deemed “filed” for purposes of Section 18 of the Securities Exchange Act of 1934, as amended, or otherwise subject to the liability of that section. Further, this exhibit shall not be deemed to be incorporated by reference into any filing under the Securities Act of 1933, as amended, or the Securities Exchange Act of 1934, as amended.) | |
32.2** | Certifications of Sidney D. Rosenblatt, Chief Financial Officer, as required by Rule 13a-14(b) or Rule 15d-14(b), and by 18 U.S.C. Section 1350. (This exhibit shall not be deemed “filed” for purposes of Section 18 of the Securities Exchange Act of 1934, as amended, or otherwise subject to the liability of that section. Further, this exhibit shall not be deemed to be incorporated by reference into any filing under the Securities Act of 1933, as amended, or the Securities Exchange Act of 1934, as amended.) | |
101.INS* | XBRL Instance Document | |
101.SCH* | XBRL Taxonomy Extension Schema Document | |
101.CAL* | XBRL Taxonomy Extension Calculation Linkbase Document | |
101.DEF* | XBRL Taxonomy Extension Definition Linkbase Document | |
101.LAB* | XBRL Taxonomy Extension Label Linkbase Document | |
101.PRE* | XBRL Taxonomy Extension Presentation Linkbase Document | |
Explanation of footnotes to listing of exhibits:
* | Filed herewith. | |
** | Furnished herewith. | |
# | Management contract or compensatory plan or arrangement. | |
+ | Confidential treatment has been accorded to certain portions of this exhibit pursuant to Rule 406 under the Securities Act of 1933, as amended, or Rule 24b-2 under the Securities Exchange Act of 1934, as amended. | |
46
(1) | Filed as an Exhibit to the Quarterly Report on Form 10-Q for the quarter ended June 30, 2013, filed with the SEC on August 8, 2013. | |
(2) | Filed as an Exhibit to the Annual Report on Form 10-K for the year ended December 31, 2003, filed with the SEC on March 1, 2004. | |
(3) | Filed as an Exhibit to the Annual Report on Form 10-K for the year ended December 31, 2008, filed with the SEC on March 12, 2009. | |
(4) | Filed as an Exhibit to the Annual Report on Form 10-K for the year ended December 31, 2009, filed with the SEC on March 15, 2010. | |
(5) | Filed as an Exhibit to the Annual Report on Form 10-K for the year ended December 31, 2006, filed with the SEC on March 15, 2007. | |
(6) | Filed as an Exhibit to the Quarterly Report on Form 10-Q for the quarter ended March 31, 2010, filed with the SEC on May 10, 2010. | |
(7) | Filed as an Exhibit to a Current Report on Form 8-K, filed with the SEC on March 21, 2011. | |
(8) | Filed as an Exhibit to the Quarterly Report on Form 10-Q for the quarter ended March 31, 2012, filed with the SEC on May 9, 2012. | |
(9) | Filed as an Exhibit to the Quarterly Report on Form 10-Q for the quarter ended June 30, 2012, filed with the SEC on August 8, 2012. | |
(10) | Filed as an Exhibit to the Quarterly Report on Form 10-Q for the quarter ended March 31, 2013, filed with the SEC on May 9, 2013. | |
(11) | Filed as an Exhibit to the Quarterly Report on Form 10-Q for the quarter ended June 30, 2006, filed with the SEC on August 9, 2006. | |
(12) | Filed as an Exhibit to the Quarterly Report on Form 10-Q for the quarter ended June 30, 2009, filed with the SEC on August 10, 2009. | |
(13) | Filed as an Exhibit to the Annual Report on Form 10K-SB for the year ended December 31, 1997, filed with the SEC on March 31, 1998. | |
(14) | Filed as an Exhibit to the Quarterly Report on Form 10-Q for the quarter ended September 30, 2003, filed with the SEC on November 10, 2003. | |
(15) | Filed as an Exhibit to the amended Quarterly Report on Form 10-Q for the quarter ended September 30, 2000, filed with the SEC on November 20, 2001. | |
(16) | Filed as an Exhibit to the Quarterly Report on Form 10-Q for the quarter ended September 30, 2011, filed with the SEC on November 8, 2011. | |
(17) | Filed as an Exhibit to an Amended Current Report on Form 8-K, filed with the SEC on December 19, 2011. | |
(18) | Filed as an Exhibit to the Quarterly Report on Form 10-Q for the quarter ended September 30, 2006, filed with the SEC on November 6, 2006. | |
(19) | Filed as an Exhibit to the Quarterly Report on Form 10-Q for the quarter ended March 31, 2009, filed with the SEC on May 7, 2009. | |
(20) | Filed as an Exhibit to the Quarterly Report on Form 10-Q for the quarter ended September 30, 2008, filed with the SEC on November 6, 2008. | |
(21) | Filed as an Exhibit to the Annual Report on Form 10-K for the year ended December 31, 2009, as amended, filed with the SEC on June 23, 2010. | |
(22) | Filed as an Exhibit to Amendment No. 1 to the Quarterly Report on Form 10-Q for the quarter ended September 30, 2011, filed with the SEC on January 27, 2012. | |
(23) | Filed as an Exhibit to a Current Report on Form 8-K, filed with the SEC on July 27, 2012. | |
(24) | Filed as an Exhibit to the Quarterly Report on Form 10-Q for the quarter ended September 30, 2013, filed with the SEC on November 7, 2013. | |
(25) | Filed as an Exhibit to a Current Report on Form 8-K, filed with the SEC on June 24, 2013. | |
(26) | Filed as an Exhibit to the Annual Report on Form 10-K for the year ended December 31, 2013, filed with the SEC on February 28, 2014. | |
(27) | Filed as Exhibit A to the Company's Definitive Proxy Statement for the 2014 Annual Meeting filed with the SEC on April 25, 2014. | |
(28) | Filed as an exhibit to the Current Report on Form 8-K filed with the SEC on March 9, 2015. | |
(29) | Filed as an Exhibit to the Quarterly Report on Form 10-Q for the quarter ended June 30, 2015, filed with the SEC on August 6, 2015. | |
(30) | Filed as an Exhibit to the Quarterly Report on Form 10-Q for the quarter ended September 30, 2015, filed with the SEC on November 5, 2015. | |
47
Note: Any of the exhibits listed in the foregoing index not included with this report may be obtained, without charge, by writing to Mr. Sidney D. Rosenblatt, Corporate Secretary, Universal Display Corporation, 375 Phillips Boulevard, Ewing, New Jersey 08618.
(b) The exhibits required to be filed by us with this report are listed above.
(c) The consolidated financial statement schedules required to be filed by us with this report are listed above.
48
SIGNATURES
Pursuant to the requirements of Section 13 or 15(d) of the Securities Exchange Act of 1934, the registrant has duly caused this report to be signed on its behalf by the undersigned, thereunto duly authorized.
UNIVERSAL DISPLAY CORPORATION | |
By: /s/ Sidney D. Rosenblatt | |
Sidney D. Rosenblatt | |
Executive Vice President, Chief Financial Officer, | |
Treasurer and Secretary | |
Date: February 25, 2016 | |
Pursuant to the requirements of the Securities Exchange Act of 1934, this report has been signed below by the following persons on behalf of the registrant and in the capacities and on the dates indicated.
Name | Title | Date | ||
/s/ Sherwin I. Seligsohn | Founder and Chairman of the Board of Directors | February 25, 2016 | ||
Sherwin I. Seligsohn | ||||
/s/ Steven V. Abramson | President, Chief Executive Officer and Director (principal executive officer) | February 25, 2016 | ||
Steven V. Abramson | ||||
/s/ Sidney D. Rosenblatt | Executive Vice President, Chief Financial Officer, Treasurer, Secretary and Director (principal financial and accounting officer) | February 25, 2016 | ||
Sidney D. Rosenblatt | ||||
/s/ Leonard Becker | Director | February 25, 2016 | ||
Leonard Becker | ||||
/s/ Elizabeth H. Gemmill | Director | February 25, 2016 | ||
Elizabeth H. Gemmill | ||||
/s/ C. Keith Hartley | Director | February 25, 2016 | ||
C. Keith Hartley | ||||
/s/ Lawrence Lacerte | Director | February 25, 2016 | ||
Lawrence Lacerte | ||||
/s/ Richard C. Elias | Director | February 25, 2016 | ||
Richard C. Elias | ||||
/s/ Rosemarie B. Greco | Director | February 25, 2016 | ||
Rosemarie B. Greco | ||||
49
UNIVERSAL DISPLAY CORPORATION AND SUBSIDIARIES
INDEX TO CONSOLIDATED FINANCIAL STATEMENTS
Consolidated Financial Statements: | ||
F-1
MANAGEMENT’S REPORT ON INTERNAL CONTROL OVER FINANCIAL REPORTING
Our management is responsible for establishing and maintaining adequate internal control over financial reporting for the Company. Internal control over financial reporting is a process designed to provide reasonable assurance regarding the reliability of financial reporting and the preparation of consolidated financial statements for external purposes in accordance with generally accepted accounting principles. Our system of internal control over financial reporting includes those policies and procedures that (i) pertain to the maintenance of records that, in reasonable detail, accurately and fairly reflect the transactions and dispositions of the assets of the Company; (ii) provide reasonable assurance that transactions are recorded as necessary to permit preparation of financial statements in accordance with generally accepted accounting principles, and that receipts and expenditures of the Company are being made only in accordance with authorizations of management and directors of the Company; and (iii) provide reasonable assurance regarding prevention or timely detection of unauthorized acquisition, use or disposition of the Company’s assets that could have a material effect on the financial statements.
Because of its inherent limitations, internal control over financial reporting may not prevent or detect misstatements. Also, projections of any evaluation of effectiveness to future periods are subject to the risk that controls may become inadequate because of changes in conditions, or that the degree of compliance with the policies or procedures may deteriorate.
Management performed an assessment of the effectiveness of our internal control over financial reporting as of December 31, 2015 based upon criteria in Internal Control — Integrated Framework (2013) issued by the Committee of Sponsoring Organizations of the Treadway Commission (COSO). Based on this assessment, management determined that the Company’s internal control over financial reporting was effective as of December 31, 2015, based on the criteria in Internal Control-Integrated Framework (2013) issued by COSO.
The effectiveness of our internal control over financial reporting as of December 31, 2015, has been attested to by KPMG LLP, an independent registered public accounting firm, as stated in its report which appears on the following page.
Steven V. Abramson President and Chief Executive Officer | Sidney D. Rosenblatt Executive Vice President and Chief Financial Officer | |
February 25, 2016
F-2
REPORT OF INDEPENDENT REGISTERED PUBLIC ACCOUNTING FIRM
The Board of Directors and Shareholders
Universal Display Corporation:
We have audited Universal Display Corporation’s internal control over financial reporting as of December 31, 2015, based on criteria established in Internal Control - Integrated Framework (2013) issued by the Committee of Sponsoring Organizations of the Treadway Commission (COSO). Universal Display Corporation's management is responsible for maintaining effective internal control over financial reporting and for its assessment of the effectiveness of internal control over financial reporting, included in the accompanying Management’s Report on Internal Control Over Financial Reporting. Our responsibility is to express an opinion on the Company’s internal control over financial reporting based on our audit.
We conducted our audit in accordance with the standards of the Public Company Accounting Oversight Board (United States). Those standards require that we plan and perform the audit to obtain reasonable assurance about whether effective internal control over financial reporting was maintained in all material respects. Our audit included obtaining an understanding of internal control over financial reporting, assessing the risk that a material weakness exists, and testing and evaluating the design and operating effectiveness of internal control based on the assessed risk. Our audit also included performing such other procedures as we considered necessary in the circumstances. We believe that our audit provides a reasonable basis for our opinion.
A company's internal control over financial reporting is a process designed to provide reasonable assurance regarding the reliability of financial reporting and the preparation of financial statements for external purposes in accordance with generally accepted accounting principles. A company's internal control over financial reporting includes those policies and procedures that (1) pertain to the maintenance of records that, in reasonable detail, accurately and fairly reflect the transactions and dispositions of the assets of the company; (2) provide reasonable assurance that transactions are recorded as necessary to permit preparation of financial statements in accordance with generally accepted accounting principles, and that receipts and expenditures of the company are being made only in accordance with authorizations of management and directors of the company; and (3) provide reasonable assurance regarding prevention or timely detection of unauthorized acquisition, use, or disposition of the company’s assets that could have a material effect on the financial statements.
Because of its inherent limitations, internal control over financial reporting may not prevent or detect misstatements. Also, projections of any evaluation of effectiveness to future periods are subject to the risk that controls may become inadequate because of changes in conditions, or that the degree of compliance with the policies or procedures may deteriorate.
In our opinion, Universal Display Corporation maintained, in all material respects, effective internal control over financial reporting as of December 31, 2015, based on criteria established in Internal Control - Integrated Framework (2013) issued by the Committee of Sponsoring Organizations of the Treadway Commission (COSO).
We also have audited, in accordance with the standards of the Public Company Accounting Oversight Board (United States), the consolidated balance sheets of Universal Display Corporation and subsidiaries as of December 31, 2015 and 2014, and the related consolidated statements of income, comprehensive income, shareholders’ equity, and cash flows for each of the years in the three-year period ended December 31, 2015, and our report dated February 25, 2016 expressed an unqualified opinion on those consolidated financial statements.
/s/ KPMG LLP
Philadelphia, Pennsylvania
February 25, 2016
F-3
REPORT OF INDEPENDENT REGISTERED PUBLIC ACCOUNTING FIRM
The Board of Directors and Shareholders
Universal Display Corporation:
We have audited the accompanying consolidated balance sheets of Universal Display Corporation and subsidiaries as of December 31, 2015 and 2014, and the related consolidated statements of income, comprehensive income, shareholders’ equity, and cash flows for each of the years in the three-year period ended December 31, 2015. These consolidated financial statements are the responsibility of the Company’s management. Our responsibility is to express an opinion on these consolidated financial statements based on our audits.
We conducted our audits in accordance with the standards of the Public Company Accounting Oversight Board (United States). Those standards require that we plan and perform the audit to obtain reasonable assurance about whether the financial statements are free of material misstatement. An audit includes examining, on a test basis, evidence supporting the amounts and disclosures in the financial statements. An audit also includes assessing the accounting principles used and significant estimates made by management, as well as evaluating the overall financial statement presentation. We believe that our audits provide a reasonable basis for our opinion.
In our opinion, the consolidated financial statements referred to above present fairly, in all material respects, the financial position of Universal Display Corporation and subsidiaries as of December 31, 2015 and 2014, and the results of their operations and their cash flows for each of the years in the three-year period ended December 31, 2015, in conformity with U.S. generally accepted accounting principles.
We also have audited, in accordance with the standards of the Public Company Accounting Oversight Board (United States), Universal Display Corporation’s internal control over financial reporting as of December 31, 2015, based on criteria established in Internal Control — Integrated Framework (2013) issued by the Committee of Sponsoring Organizations of the Treadway Commission (COSO), and our report dated February 25, 2016 expressed an unqualified opinion on the effectiveness of the Company’s internal control over financial reporting.
/s/ KPMG LLP
Philadelphia, Pennsylvania
February 25, 2016
F-4
UNIVERSAL DISPLAY CORPORATION AND SUBSIDIARIES
CONSOLIDATED BALANCE SHEETS
(in thousands, except share and per share data)
December 31, | ||||||||
2015 | 2014 | |||||||
ASSETS | ||||||||
CURRENT ASSETS: | ||||||||
Cash and cash equivalents | $ | 97,513 | $ | 45,418 | ||||
Short-term investments | 297,981 | 243,088 | ||||||
Accounts receivable | 24,729 | 22,075 | ||||||
Inventories | 12,748 | 37,109 | ||||||
Deferred income taxes | 12,326 | 18,459 | ||||||
Other current assets | 2,387 | 4,356 | ||||||
Total current assets | 447,684 | 370,505 | ||||||
PROPERTY AND EQUIPMENT, net of accumulated depreciation of $27,897 and $24,813 | 22,407 | 19,922 | ||||||
ACQUIRED TECHNOLOGY, net of accumulated amortization of $54,837 and $43,838 | 72,015 | 83,014 | ||||||
INVESTMENTS | 2,187 | 3,047 | ||||||
DEFERRED INCOME TAXES | 14,945 | 12,934 | ||||||
OTHER ASSETS | 174 | 425 | ||||||
TOTAL ASSETS | $ | 559,412 | $ | 489,847 | ||||
LIABILITIES AND SHAREHOLDERS’ EQUITY | ||||||||
CURRENT LIABILITIES: | ||||||||
Accounts payable | $ | 6,849 | $ | 9,260 | ||||
Accrued expenses | 17,387 | 14,986 | ||||||
Deferred revenue | 10,107 | 2,466 | ||||||
Other current liabilities | 167 | 111 | ||||||
Total current liabilities | 34,510 | 26,823 | ||||||
DEFERRED REVENUE | 35,543 | 3,366 | ||||||
RETIREMENT PLAN BENEFIT LIABILITY | 22,594 | 10,916 | ||||||
Total liabilities | 92,647 | 41,105 | ||||||
COMMITMENTS AND CONTINGENCIES (Note 14) | ||||||||
SHAREHOLDERS’ EQUITY: | ||||||||
Preferred Stock, par value $0.01 per share, 5,000,000 shares authorized, 200,000 shares of Series A Nonconvertible Preferred Stock issued and outstanding (liquidation value of $7.50 per share or $1,500) | 2 | 2 | ||||||
Common Stock, par value $0.01 per share, 100,000,000 shares authorized, 48,132,223 and 47,061,826 shares issued at December 31, 2015 and 2014, respectively | 482 | 471 | ||||||
Additional paid-in capital | 589,885 | 581,114 | ||||||
Accumulated deficit | (73,627 | ) | (88,305 | ) | ||||
Accumulated other comprehensive loss | (9,819 | ) | (4,382 | ) | ||||
Treasury stock, at cost (1,357,863 shares at December 31, 2015 and 2014) | (40,158 | ) | (40,158 | ) | ||||
Total shareholders’ equity | 466,765 | 448,742 | ||||||
TOTAL LIABILITIES AND SHAREHOLDERS’ EQUITY | $ | 559,412 | $ | 489,847 | ||||
The accompanying notes are an integral part of these consolidated financial statements.
F-5
UNIVERSAL DISPLAY CORPORATION AND SUBSIDIARIES
CONSOLIDATED STATEMENTS OF INCOME
(in thousands, except share and per share data)
Year Ended December 31, | ||||||||||||
2015 | 2014 | 2013 | ||||||||||
REVENUE: | ||||||||||||
Material sales | $ | 113,066 | $ | 126,885 | $ | 95,713 | ||||||
Royalty and license fees | 77,773 | 63,192 | 47,006 | |||||||||
Technology development and support revenue | 207 | 954 | 3,920 | |||||||||
Total revenue | 191,046 | 191,031 | 146,639 | |||||||||
OPERATING EXPENSES: | ||||||||||||
Cost of material sales | 62,997 | 41,315 | 28,889 | |||||||||
Research and development | 44,641 | 41,154 | 34,215 | |||||||||
Selling, general and administrative | 29,046 | 28,135 | 24,745 | |||||||||
Patent costs and amortization of acquired technology | 16,716 | 17,288 | 17,273 | |||||||||
Royalty and license expense | 5,370 | 4,519 | 3,273 | |||||||||
Total operating expenses | 158,770 | 132,411 | 108,395 | |||||||||
Operating income | 32,276 | 58,620 | 38,244 | |||||||||
INTEREST INCOME | 837 | 777 | 811 | |||||||||
INTEREST EXPENSE | (54 | ) | (70 | ) | (47 | ) | ||||||
INCOME BEFORE INCOME TAXES | 33,059 | 59,327 | 39,008 | |||||||||
INCOME TAX (EXPENSE) BENEFIT | (18,381 | ) | (17,473 | ) | 35,044 | |||||||
NET INCOME | $ | 14,678 | $ | 41,854 | $ | 74,052 | ||||||
NET INCOME PER COMMON SHARE: | ||||||||||||
BASIC | $ | 0.31 | $ | 0.90 | $ | 1.61 | ||||||
DILUTED | $ | 0.31 | $ | 0.90 | $ | 1.59 | ||||||
WEIGHTED AVERAGE SHARES USED IN COMPUTING NET INCOME PER COMMON SHARE: | ||||||||||||
BASIC | 46,816,394 | 46,252,960 | 45,898,019 | |||||||||
DILUTED | 47,494,188 | 46,685,145 | 46,543,605 | |||||||||
The accompanying notes are an integral part of these consolidated financial statements.
F-6
UNIVERSAL DISPLAY CORPORATION AND SUBSIDIARIES
CONSOLIDATED STATEMENTS OF COMPREHENSIVE INCOME
(in thousands)
Year Ended December 31, | ||||||||||||
2015 | 2014 | 2013 | ||||||||||
NET INCOME | $ | 14,678 | $ | 41,854 | $ | 74,052 | ||||||
OTHER COMPREHENSIVE (LOSS) INCOME, NET OF TAX: | ||||||||||||
Unrealized loss on available-for-sale securities, net of tax of $46, $3, and $4, respectively | (83 | ) | (4 | ) | (6 | ) | ||||||
Employee benefit plan: | ||||||||||||
Actuarial (loss) gain on retirement plan, net of tax of $218, none and $488 | (388 | ) | (385 | ) | 413 | |||||||
Plan amendment cost, net of tax of $3,305, none and none, respectively | (5,963 | ) | — | — | ||||||||
Amortization of plan amendment cost, prior service cost and actuarial loss for retirement plan included in net periodic pension costs, net of tax of $553, $209 and $238, respectively | 997 | 375 | 927 | |||||||||
Net change for employee benefit plan | (5,354 | ) | (10 | ) | 1,340 | |||||||
TOTAL OTHER COMPREHENSIVE (LOSS) INCOME | (5,437 | ) | (14 | ) | 1,334 | |||||||
COMPREHENSIVE INCOME | $ | 9,241 | $ | 41,840 | $ | 75,386 | ||||||
The accompanying notes are an integral part of these consolidated financial statements.
F-7
UNIVERSAL DISPLAY CORPORATION AND SUBSIDIARIES
CONSOLIDATED STATEMENTS OF SHAREHOLDERS’ EQUITY
(in thousands, except for share data)
Series A Nonconvertible | Common Stock | Additional | Accumulated Deficit | Accumulated Other Comprehensive Loss | Treasury Stock | Total Shareholders’ Equity | |||||||||||||||||||||||||||||||
Preferred Stock | Paid-in | ||||||||||||||||||||||||||||||||||||
Shares | Amount | Shares | Amount | Capital | Shares | Amount | |||||||||||||||||||||||||||||||
BALANCE, JANUARY 1, 2013 | 200,000 | $ | 2 | 46,561,437 | $ | 465 | $ | 564,883 | $ | (204,211 | ) | $ | (5,702 | ) | 205,902 | $ | (5,202 | ) | $ | 350,235 | |||||||||||||||||
Net income | — | — | — | — | — | 74,052 | — | — | — | 74,052 | |||||||||||||||||||||||||||
Other comprehensive income | — | — | — | — | — | — | 1,334 | — | — | 1,334 | |||||||||||||||||||||||||||
Repurchase of common stock | — | — | — | — | — | — | — | 195,599 | (5,456 | ) | (5,456 | ) | |||||||||||||||||||||||||
Exercise of common stock options and warrants, net of tendered shares | — | — | 223,714 | 2 | 2,556 | — | — | — | — | 2,558 | |||||||||||||||||||||||||||
Issuance of common stock to employees, net of shares withheld for employee taxes | — | — | (13,502 | ) | — | 3,519 | — | — | — | — | 3,519 | ||||||||||||||||||||||||||
Issuance of common stock to Board of Directors and Scientific Advisory Board | — | — | 39,153 | 1 | 1,100 | — | — | — | — | 1,101 | |||||||||||||||||||||||||||
Issuance of common stock to employees under an Employee Stock Purchase Plan (ESPP) | — | — | 14,366 | — | 343 | — | — | — | — | 343 | |||||||||||||||||||||||||||
BALANCE, DECEMBER 31, 2013 | 200,000 | 2 | 46,825,168 | 468 | 572,401 | (130,159 | ) | (4,368 | ) | 401,501 | (10,658 | ) | 427,686 | ||||||||||||||||||||||||
Net income | — | — | — | — | — | 41,854 | — | — | — | 41,854 | |||||||||||||||||||||||||||
Other comprehensive income | — | — | — | — | — | — | (14 | ) | — | — | (14 | ) | |||||||||||||||||||||||||
Repurchase of common stock | — | — | — | — | — | — | — | 956,362 | (29,500 | ) | (29,500 | ) | |||||||||||||||||||||||||
Exercise of common stock options and warrants, net of tendered shares | — | — | 184,798 | 3 | 1,884 | — | — | — | — | 1,887 | |||||||||||||||||||||||||||
Issuance of common stock to employees | — | — | 83,834 | 1 | 8,026 | — | — | — | — | 8,027 | |||||||||||||||||||||||||||
Shares withheld for employee taxes | — | — | (83,831 | ) | (1 | ) | (2,843 | ) | — | — | — | — | (2,844 | ) | |||||||||||||||||||||||
Issuance of common stock to Board of Directors and Scientific Advisory Board | — | — | 39,484 | — | 1,318 | — | — | — | — | 1,318 | |||||||||||||||||||||||||||
Issuance of common stock to employees under an ESPP | — | — | 12,373 | — | 328 | — | — | — | — | 328 | |||||||||||||||||||||||||||
BALANCE, DECEMBER 31, 2014 | 200,000 | 2 | 47,061,826 | 471 | 581,114 | (88,305 | ) | (4,382 | ) | 1,357,863 | (40,158 | ) | 448,742 | ||||||||||||||||||||||||
Net income | — | — | — | — | — | 14,678 | — | — | — | 14,678 | |||||||||||||||||||||||||||
Other comprehensive loss | — | — | — | — | — | — | (5,437 | ) | — | — | (5,437 | ) | |||||||||||||||||||||||||
Exercise of common stock options, net of tendered shares | — | — | 340,725 | 3 | 2,031 | — | — | — | — | 2,034 | |||||||||||||||||||||||||||
Issuance of common stock to employees | — | — | 798,036 | 8 | 10,039 | — | — | — | — | 10,047 | |||||||||||||||||||||||||||
Shares withheld for employee taxes | — | — | (124,961 | ) | — | (5,337 | ) | — | — | — | — | (5,337 | ) | ||||||||||||||||||||||||
Issuance of common stock to Board of Directors and Scientific Advisory Board | — | — | 44,351 | — | 1,591 | — | — | — | — | 1,591 | |||||||||||||||||||||||||||
Issuance of common stock to employees under an ESPP | — | — | 12,246 | — | 447 | — | — | — | — | 447 | |||||||||||||||||||||||||||
BALANCE, DECEMBER 31, 2015 | 200,000 | $ | 2 | 48,132,223 | $ | 482 | $ | 589,885 | $ | (73,627 | ) | $ | (9,819 | ) | 1,357,863 | $ | (40,158 | ) | $ | 466,765 | |||||||||||||||||
The accompanying notes are an integral part of these consolidated financial statements.
F-8
UNIVERSAL DISPLAY CORPORATION AND SUBSIDIARIES
CONSOLIDATED STATEMENTS OF CASH FLOWS
(in thousands)
Year Ended December 31, | ||||||||||||
2015 | 2014 | 2013 | ||||||||||
CASH FLOWS FROM OPERATING ACTIVITIES: | ||||||||||||
Net income | $ | 14,678 | $ | 41,854 | $ | 74,052 | ||||||
Adjustments to reconcile net income to net cash provided by operating activities: | ||||||||||||
Amortization of deferred revenue | (8,994 | ) | (4,274 | ) | (5,880 | ) | ||||||
Depreciation | 3,086 | 2,077 | 2,044 | |||||||||
Amortization of intangibles | 10,999 | 10,997 | 10,973 | |||||||||
Inventory write-down | 33,000 | 3,900 | — | |||||||||
Amortization of premium and discount on investments, net | (697 | ) | (531 | ) | (458 | ) | ||||||
Stock-based compensation to employees | 9,173 | 7,278 | 6,077 | |||||||||
Stock-based compensation to Board of Directors and Scientific Advisory Board | 1,291 | 995 | 809 | |||||||||
Deferred income tax expense (benefit) | 7,137 | 9,108 | (41,418 | ) | ||||||||
Retirement plan benefit expense | 3,354 | 1,679 | 1,665 | |||||||||
(Increase) decrease in assets: | ||||||||||||
Accounts receivable | (2,654 | ) | (6,418 | ) | (7,000 | ) | ||||||
Inventories | (8,639 | ) | (30,414 | ) | 424 | |||||||
Other current assets | 1,969 | 2,267 | (2,706 | ) | ||||||||
Other assets | 251 | (183 | ) | 35 | ||||||||
Increase (decrease) in liabilities: | ||||||||||||
Accounts payable and accrued expenses | 790 | 3,055 | 3,614 | |||||||||
Other current liabilities | 56 | 87 | (11 | ) | ||||||||
Deferred revenue | 48,812 | 5,793 | 2,767 | |||||||||
Net cash provided by operating activities | 113,612 | 47,270 | 44,987 | |||||||||
CASH FLOWS FROM INVESTING ACTIVITIES: | ||||||||||||
Purchases of property and equipment | (5,103 | ) | (6,153 | ) | (4,710 | ) | ||||||
Additions to intangibles | — | — | (359 | ) | ||||||||
Purchases of investments | (691,876 | ) | (408,974 | ) | (362,838 | ) | ||||||
Proceeds from sale of investments | 638,411 | 372,818 | 313,132 | |||||||||
Net cash used in investing activities | (58,568 | ) | (42,309 | ) | (54,775 | ) | ||||||
CASH FLOWS FROM FINANCING ACTIVITIES: | ||||||||||||
Proceeds from issuance of common stock | 354 | 328 | 343 | |||||||||
Repurchase of common stock | — | (29,500 | ) | (5,456 | ) | |||||||
Proceeds from the exercise of common stock options | 2,034 | 1,887 | 2,832 | |||||||||
Payment of withholding taxes related to stock-based compensation to employees | (5,337 | ) | (2,844 | ) | (3,268 | ) | ||||||
Net cash used in financing activities | (2,949 | ) | (30,129 | ) | (5,549 | ) | ||||||
INCREASE (DECREASE) IN CASH AND CASH EQUIVALENTS | 52,095 | (25,168 | ) | (15,337 | ) | |||||||
CASH AND CASH EQUIVALENTS, BEGINNING OF YEAR | 45,418 | 70,586 | 85,923 | |||||||||
CASH AND CASH EQUIVALENTS, END OF YEAR | $ | 97,513 | $ | 45,418 | $ | 70,586 | ||||||
The accompanying notes are an integral part of these consolidated financial statements.
F-9
UNIVERSAL DISPLAY CORPORATION AND SUBSIDIARIES
NOTES TO CONSOLIDATED FINANCIAL STATEMENTS
1. | BUSINESS: |
Universal Display Corporation (the Company) is a leader in the research, development and commercialization of organic light emitting diode (OLED) technologies and materials. OLEDs are thin, lightweight and power-efficient solid-state devices that emit light, making them highly suitable for use in full-color displays and as lighting products. OLED displays are capturing a growing share of the display market. The Company believes this is because OLEDs offer potential advantages over competing display technologies with respect to power efficiency, contrast ratio, viewing angle, video response time, form factor and manufacturing cost. The Company also believes that OLED lighting products have the potential to replace many existing light sources in the future because of their high power efficiency, excellent color rendering index, low operating temperature and novel form factor. The Company's technology leadership and intellectual property position should enable it to share in the revenues from OLED displays and lighting products as they enter mainstream consumer and other markets.
The Company's primary business strategy is to (1) further develop and license its proprietary OLED technologies to manufacturers of products for display applications, such as mobile phones, televisions, tablets, wearables, portable media devices, notebook computers, personal computers, automotive interiors, and specialty and general lighting products; and (2) develop new OLED materials and sell the materials to those product manufacturers. The Company has established a significant portfolio of proprietary OLED technologies and materials, primarily through internal research and development efforts and acquisitions of patents and patent applications, as well as maintaining its relationships with world-class partners such as Princeton University (Princeton), the University of Southern California (USC), the University of Michigan (Michigan) and PPG Industries, Inc. (PPG Industries). The Company currently owns, exclusively licenses or has the sole right to sublicense more than 3,600 patents issued and pending worldwide.
The Company sells its proprietary OLED materials to customers for evaluation and use in commercial OLED products. The Company also enters into agreements with manufacturers of OLED display and lighting products under which it grants them licenses to practice under its patents and to use the Company's proprietary know-how. At the same time, the Company works with these and other companies who are evaluating the Company's OLED technologies and materials for possible use in commercial OLED display and lighting products.
2. | SUMMARY OF SIGNIFICANT ACCOUNTING POLICIES: |
Principles of Consolidation
The consolidated financial statements include the accounts of Universal Display Corporation and its wholly owned subsidiaries, UDC, Inc., Universal Display Corporation Hong Kong, Ltd., Universal Display Corporation Korea, Y.H., Universal Display Corporation Japan, G.K. and UDC Ireland Limited. All intercompany transactions and accounts have been eliminated.
Management’s Use of Estimates
The preparation of financial statements in conformity with U.S. generally accepted accounting principles (GAAP) requires management to make estimates and assumptions that affect the reported amounts of assets and liabilities and disclosure of contingent assets and liabilities at the date of the financial statements and the reported amounts of revenues and expenses during the reporting period. The estimates made are principally in the areas of revenue recognition for license agreements, the useful life of acquired technology, the use and recoverability of inventories, income taxes including realization of deferred tax assets, stock-based compensation and retirement benefit plan liabilities. Actual results could differ from those estimates.
F-10
Cash, Cash Equivalents and Investments
The Company considers all highly liquid debt instruments purchased with an original maturity of three months or less to be cash equivalents. The Company classifies its remaining investments as available-for-sale. These securities are carried at fair market value, with unrealized gains and losses reported in shareholders’ equity. Gains or losses on securities sold are based on the specific identification method. Investments at December 31, 2015 and 2014 consist of the following (in thousands):
Amortized | Unrealized | Aggregate Fair | ||||||||||||||
Investment Classification | Cost | Gains | (Losses) | Market Value | ||||||||||||
December 31, 2015 | ||||||||||||||||
Certificates of deposit | $ | 11,532 | $ | 3 | $ | (14 | ) | $ | 11,521 | |||||||
Corporate bonds | 233,848 | — | (139 | ) | 233,709 | |||||||||||
U.S. Government bonds | 54,953 | 1 | (16 | ) | 54,938 | |||||||||||
$ | 300,333 | $ | 4 | $ | (169 | ) | $ | 300,168 | ||||||||
December 31, 2014 | ||||||||||||||||
Certificates of deposit | $ | 11,373 | $ | 4 | $ | (13 | ) | $ | 11,364 | |||||||
Corporate bonds | 228,799 | 14 | (41 | ) | 228,772 | |||||||||||
U.S. Government bonds | 5,999 | — | — | 5,999 | ||||||||||||
$ | 246,171 | $ | 18 | $ | (54 | ) | $ | 246,135 | ||||||||
On July 13, 2012, the Company entered into a three-year joint development agreement with Plextronics, Inc. (Plextronics), a private company engaged in printed solar, lighting and other electronics related research and development. The Company invested $4.0 million in Plextronics through the purchase of a convertible promissory note. The note accrued interest at a rate of 3% per year. The note was repaid in full plus interest during the first quarter of 2014. See Fair Value Measurements below for additional information regarding the note.
On July 17, 2012, the Company invested $300,000 in a private company engaged in plasma processing equipment research and development through the purchase of a convertible promissory note. The note accrued interest at a rate of 5% per year. The note was repaid in full plus interest during the second quarter of 2014. See Fair Value Measurements below for additional information regarding the note.
All short-term investments held at December 31, 2015 will mature within a year.
Trade Accounts Receivable
Trade accounts receivable are stated at the amount the Company expects to collect and do not bear interest. The Company considers the following factors when determining the collectability of specific customer accounts: customer credit-worthiness, past transaction history with the customer, current economic industry trends, and changes in customer payment terms. The Company’s accounts receivable balance is a result of chemical sales, royalties, license fees. These receivables have historically been paid timely. Due to the nature of the accounts receivable balance, the Company believes there is no significant risk of collection. If the financial condition of the Company’s customers were to deteriorate, adversely affecting their ability to make payments, allowances for doubtful accounts would be required. The Company recorded no bad debt expense in the years ended December 31, 2015, 2014 and 2013.
Inventories
Inventories consist of raw materials, work-in-process and finished goods, including inventory consigned to customers, and are stated at the lower of cost, determined on a first-in, first-out basis, or market. Inventory valuation and firm committed purchase order assessments are performed on a quarterly basis and those items that are identified to be obsolete or in excess of forecasted usage are written down to their estimated realizable value. Estimates of realizable value are based upon management’s analyses and assumptions, including, but not limited to, forecasted sales levels by product, expected product lifecycle, product development plans and future demand requirements. A 12-month rolling forecast based on factors, including, but not limited to, production cycles, anticipated product orders, marketing forecasts, backlog, and shipment activities is used in the forecast. If market conditions are less favorable than forecasts or actual demand from customers is lower than estimates, additional inventory write-downs may be required. If demand is higher than expected, inventories that had previously been written down may be sold.
Certain of the Company’s customers have assumed the responsibility for maintaining the Company's inventory at their location based on the customers' demand forecast. Notwithstanding the fact that the Company builds and ships the inventory, the customer does not purchase the consigned inventory until the inventory is drawn or pulled by the customer to be used in the
F-11
manufacture of the customer’s product. Though the consigned inventory may be at the customer’s physical location, it remains inventory owned by the Company until the inventory is drawn or pulled, which is the time at which the sale takes place.
Fair Value Measurements
The following table provides the assets and liabilities carried at fair value measured on a recurring basis as of December 31, 2015 (in thousands):
Fair Value Measurements, Using | ||||||||||||||||
Total carrying value as of December 31, 2015 | Quoted prices in active markets (Level 1) | Significant other observable inputs (Level 2) | Significant unobservable inputs (Level 3) | |||||||||||||
Cash equivalents | $ | 34,980 | $ | 34,980 | $ | — | $ | — | ||||||||
Short-term investments | 297,981 | 297,981 | — | — | ||||||||||||
Long-term investments | 2,187 | 2,187 | — | — | ||||||||||||
The following table provides the assets and liabilities carried at fair value measured on a recurring basis as of December 31, 2014 (in thousands):
Fair Value Measurements, Using | ||||||||||||||||
Total carrying value as of December 31, 2014 | Quoted prices in active markets (Level 1) | Significant other observable inputs (Level 2) | Significant unobservable inputs (Level 3) | |||||||||||||
Cash equivalents | $ | 970 | $ | 970 | $ | — | $ | — | ||||||||
Short-term investments | 243,088 | 243,088 | — | — | ||||||||||||
Long-term investments | 3,047 | 3,047 | — | — | ||||||||||||
Level 1 inputs are quoted prices (unadjusted) in active markets for identical assets or liabilities. Level 2 inputs are quoted prices for similar assets and liabilities in active markets or inputs that are observable for the asset or liability, either directly or indirectly through market corroboration, for substantially the full term of the financial instrument. Level 3 inputs are unobservable inputs based on management’s own assumptions used to measure assets and liabilities at fair value. Financial asset or liability classification is determined based on the lowest level input that is significant to the fair value measurement.
The Company's convertible promissory note investments were classified within investments on the consolidated balance sheet and fair value was based on Level 3 inputs.
These convertible promissory note investments are inherently risky as the notes lack a ready market for resale and the note issuer's success is dependent on numerous factors, including, among others, product development, market acceptance, operational efficiency, the ability of the investee companies to raise additional funds in financial markets that can be volatile, and other key business factors. The Company determined the fair value of its convertible promissory note investments portfolio quarterly by performing certain quantitative analyses of identified events or circumstances affecting the investee.
Changes in fair value of the investments are recorded as unrealized gains and losses in other comprehensive income. If a decline in fair value of an investment is deemed to be other than temporary, the cost basis of the Company’s investment will be written down by the amount of the other-than-temporary impairment with a resulting charge to net income. There were no other-than-temporary impairments of investments as of December 31, 2015 and 2014.
The following table is a reconciliation of the changes in fair value of the Company’s investments in convertible notes for the years ended December 31, 2015 and 2014, which had been classified in Level 3 in the fair value hierarchy (in thousands):
Year Ended December 31, | ||||||||
2015 | 2014 | |||||||
Fair value of notes, beginning of year | $ | — | $ | 4,300 | ||||
Repayments of notes | — | (4,300 | ) | |||||
Fair value of notes, end of year | $ | — | $ | — | ||||
F-12
Fair Value of Financial Instruments
The carrying values of accounts receivable, other current assets, and accounts payable approximate fair value in the accompanying financial statements due to the short-term nature of those instruments. The Company’s other financial instruments, which include cash equivalents and investments are carried at fair value as noted above.
Property and Equipment
Property and equipment are stated at cost and depreciated on a straight-line basis over the estimated useful life of thirty years for building, fifteen years for building improvements, and three to seven years for office and lab equipment and furniture and fixtures. Repair and maintenance costs are charged to expense as incurred. Additions and betterments are capitalized.
Impairment of Long-Lived Assets
Company management continually evaluates whether events or changes in circumstances might indicate that the remaining estimated useful life of long-lived assets may warrant revision, or that the remaining balance may not be recoverable. When factors indicate that long-lived assets should be evaluated for possible impairment, the Company uses an estimate of the related undiscounted cash flows in measuring whether the long-lived asset should be written down to fair value. Measurement of the amount of impairment would be based on generally accepted valuation methodologies, as deemed appropriate. As of December 31, 2015, Company management believed that no revision to the remaining useful lives or write-down of the Company’s long-lived assets was required, and similarly, no such revisions were required for the years ended December 31, 2014 or 2013.
Net Income Per Common Share
The Company computes earnings per share in accordance with ASC Topic 260, Earnings per Share ("ASC 260"), which requires earnings per share for each class of stock to be calculated using the two-class method. The two-class method is an allocation of income between the holders of common stock and the Company's participating security holders. Under the two-class method, income for the reporting period is allocated between common shareholders and other security holders based on their respective participation rights in undistributed income. Unvested share-based payment awards that contain non-forfeitable rights to dividends or dividend equivalents are participating securities and, therefore, are included in computing earnings per share pursuant to the two-class method.
Basic net income per common share is computed by dividing net income allocated to common shareholders by the weighted-average number of shares of common stock outstanding for the period excluding restricted stock units and performance units. Net income allocated to the holders of the Company's unvested restricted stock awards is calculated based on the shareholders proportionate share of weighted average shares of common stock outstanding on an if-converted basis. The effect of using the two-class method is immaterial to the consolidated financial statements and does not change the reported earnings per share figures and thus will not be presented herein.
For purposes of determining diluted net income per common share, basic earnings per share is further adjusted to include the effect of potential dilutive common shares outstanding, including stock options, restricted stock units and performance units, and the impact of shares to be issued under the ESPP.
The following table is a reconciliation of net income and the shares used in calculating basic and diluted net income per common share for the years ended December 31, 2015, 2014 and 2013 (in thousands, except share and per share data):
Year Ended December 31, | ||||||||||||
2015 | 2014 | 2013 | ||||||||||
Numerator: | ||||||||||||
Net income | $ | 14,678 | $ | 41,854 | $ | 74,052 | ||||||
Denominator: | ||||||||||||
Weighted average common shares outstanding – Basic | 46,816,394 | 46,252,960 | 45,898,019 | |||||||||
Effect of dilutive shares: | ||||||||||||
Common stock equivalents arising from stock options and ESPP | 267,145 | 265,129 | 458,574 | |||||||||
Restricted stock units and performance units | 410,649 | 167,056 | 187,012 | |||||||||
Weighted average common shares outstanding – Diluted | 47,494,188 | 46,685,145 | 46,543,605 | |||||||||
Net income per common share: | ||||||||||||
Basic | $ | 0.31 | $ | 0.90 | $ | 1.61 | ||||||
Diluted | $ | 0.31 | $ | 0.90 | $ | 1.59 | ||||||
F-13
For the year ended December 31, 2015, 2014 and 2013, the combined effects of unvested restricted stock units, performance unit awards of 17,055, 87,894, and 140,839, respectively, and the impact of shares to be issued under the ESPP, which was minor, were excluded from the calculation of diluted EPS as their impact would have been antidilutive, or for performance units, as the units would not be issued if the end of the reporting period was the end of the performance period.
Revenue Recognition and Deferred Revenue
Material sales relate to the Company’s sale of its OLED materials for incorporation into its customers’ commercial OLED products or for their OLED development and evaluation activities. Material sales are recognized at the time of shipment or at time of delivery, and passage of title, depending upon the contractual agreement between the parties.
The Company receives non-refundable license and royalty payments under certain commercial, development and technology evaluation agreements. These payments may include royalty and license fees made pursuant to license agreements and certain material supply agreements. Amounts received are deferred and classified as either current or non-current deferred revenue based upon current contractual remaining terms; however, based upon on-going relationships with customers, as well as future agreement extensions and other factors, amounts classified as current may not be recognized as revenue over the next twelve months. The Company evaluates these agreements quarterly, and if it is determined that there is no appreciable likelihood of executing a commercial license agreement with the customer or if a customer terminates the relationship prior to the expiration of its term, the previous deferred amount will be recognized as revenue in the corresponding period. For arrangements with extended payment terms where the fee is not fixed and determinable, the Company recognizes revenue when the payment is due and payable. Royalty revenue and license fee revenue included as part of commercial supply agreements are recognized when earned and the amount is fixed and determinable. If the Company used different estimates for the useful life of the licensed technology, or if fees are fixed and determinable, reported revenue during the relevant period would differ.
Technology development and support revenue is revenue earned from government contracts, development and technology evaluation agreements and commercialization assistance fees, which includes reimbursements by government entities for all or a portion of the research and development costs the Company incurs in relation to its government contracts. Revenues are recognized proportionally as research and development costs are incurred, or as defined milestones are achieved.
Currently, the Company's most significant commercial license agreement, which is set to expire by the end of 2017, is with Samsung Display Co., Ltd. (SDC) and covers the manufacture and sale of specified OLED display products. Under this agreement, the Company is being paid a license fee, payable in semi-annual installments over the agreement term of 6.4 years. The installments, which are due in the second and fourth quarter of each year, increase on an annual basis over the term of the agreement. The agreement conveys to SDC the non-exclusive right to use certain of the Company's intellectual property assets for a limited period of time that is less than the estimated life of the assets. Ratable recognition of revenue is impacted by the agreement's extended increasing payment terms in light of the Company's limited history with similar agreements. As a result, revenue is recognized at the lesser of the proportional performance approach (ratable) and the amount of due and payable fees from SDC. Given the increasing contractual payment schedule, license fees under the agreement are recognized as revenue when they become due and payable, which is currently scheduled to be in the second and fourth quarter of each year.
In 2015, the Company entered into an OLED patent license agreement and an OLED commercial supply agreement with LG Display Co., Ltd. (LG Display), which were effective as of January 1, 2015 and supersede the existing 2007 commercial supply agreement between the parties. The new agreements have a term that is set to expire by the end of 2022. The patent license agreement provides LG Display a non-exclusive, royalty bearing portfolio license to make and sell OLED displays under the Company's patent portfolio. The patent license calls for license fees, prepaid royalties and running royalties on licensed products. The prepaid royalty amount is included in deferred revenue and a portion of this amount can be credited against total royalties due over the life of the contract. The agreements include customary provisions relating to warranties, indemnities, confidentiality, assignability and business terms. The agreements provide for certain other minimum obligations relating to the volume of materials sales anticipated over the term of the agreements as well as minimum royalty revenue to be generated under the patent license agreement. The Company expects to generate revenue under these agreements that are predominantly tied to LG Display sales of OLED licensed products. The OLED commercial supply agreement provides for the sales of materials for use by LG Display, which may include phosphorescent dopants and host materials.
The Company records taxes billed to customers and remitted to various governmental entities on a gross basis in both revenues and cost of material sales in the consolidated statements of income. The amounts of these pass through taxes reflected in revenues and cost of material sales were $1.3 million, $4.3 million and $178,000 for the years ended December 31, 2015, 2014 and 2013, respectively.
All amounts are billed and due within a year and substantially all are transacted in U.S. dollars.
F-14
Cost of Material Sales
Cost of material sales represents costs associated with the sale of materials that have been classified as commercial, including shipping costs. Commercial materials are materials that have been validated by the Company for use in commercial OLED products. Prior to their designation as commercial materials, costs incurred related to the materials are included in research and development costs.
Research and Development
Expenditures for research and development are charged to operations as incurred. Research and development expenses consist of the following (in thousands):
Year Ended December 31, | ||||||||||||
2015 | 2014 | 2013 | ||||||||||
Development and operations in the Company’s facilities | $ | 34,348 | $ | 27,891 | $ | 23,491 | ||||||
PPG OLED Materials Agreement (Note 8) | 7,912 | 10,614 | 7,470 | |||||||||
Costs incurred under sponsored research agreements | 1,795 | 2,014 | 2,671 | |||||||||
Scientific Advisory Board compensation | 586 | 635 | 583 | |||||||||
$ | 44,641 | $ | 41,154 | $ | 34,215 | |||||||
Patent Costs and Amortization of Acquired Technology
Costs associated with patent applications, patent prosecution, patent defense and the maintenance of patents are charged to expense as incurred. Costs to successfully defend a challenge to a patent are capitalized to the extent of an evident increase in the value of the patent. Costs that relate to an unsuccessful outcome are charged to expense. Amortization costs relate to technology acquired from Fujifilm and Motorola in the years ended December 31, 2012 and 2011, respectively.
Translation of Foreign Currency Financial Statements and Foreign Currency Transactions
The Company's reporting currency is the U.S. dollar. The functional currency for the Company's Ireland subsidiary is also the U.S. dollar and the functional currency for each of the Company's Asia-Pacific foreign subsidiaries is its local currency. The Company translates the amounts included in the consolidated statements of income from its Asia-Pacific foreign subsidiaries into U.S. dollars at weighted-average exchange rates, which the Company believes are representative of the actual exchange rates on the dates of the transactions. The Company's foreign subsidiaries' assets and liabilities are translated into U.S. dollars from the local currency at the actual exchange rates as of the end of each reporting date, and the Company records the resulting foreign exchange translation adjustments in the consolidated balance sheets as a component of accumulated other comprehensive loss. The overall effect of the translation of foreign currency and foreign currency transactions to date has been insignificant.
Statement of Cash Flow Information
The following non-cash activities occurred (in thousands):
Year Ended December 31, | ||||||||||||
2015 | 2014 | 2013 | ||||||||||
Unrealized loss on available-for-sale securities | $ | (129 | ) | $ | (7 | ) | $ | (10 | ) | |||
Common stock issued to Board of Directors and Scientific Advisory Board that was earned in a previous period | 300 | 323 | 315 | |||||||||
Common stock issued to employees that was accrued for in a previous period | 967 | 749 | 282 | |||||||||
Property and equipment purchases included in accounts payable | 467 | 965 | 420 | |||||||||
During the year ended December 31, 2015, 2014, and 2013, the Company paid cash of approximately $10.4 million, $8.0 million and $6.6 million for income taxes.
F-15
Income Taxes
Income taxes are accounted for under the asset and liability method. Deferred tax assets and liabilities are recognized for the future tax consequences attributable to differences between the financial statement carrying amounts of existing assets and liabilities and their respective tax bases and operating loss and tax credit carryforwards. Deferred tax assets and liabilities are measured using enacted tax rates expected to apply to taxable income in the years in which those temporary differences are expected to be recovered or settled. The effect on deferred tax assets and liabilities of a change in tax rates is recognized in income in the period that includes the enactment date. The Company recognizes the effect of income tax positions only if those positions are more likely than not of being sustained. Recognized income tax positions are measured at the largest amount of which the likelihood of realization is greater than 50%. Changes in recognition or measurement are reflected in the period in which the change in judgment occurs. The Company records interest and penalties, if any, related to unrecognized tax benefits as a component of tax expense.
Share-Based Payment Awards
The Company recognizes in the statements of income the grant-date fair value of equity based awards such as shares issued under employee stock purchase plans, restricted stock awards, restricted stock units, performance unit awards issued to employees and directors.
The grant-date fair value of stock awards is based on the closing price of the stock on the date of grant. The fair value of share-based awards is recognized as compensation expense on a straight-line basis over the requisite service period, net of forfeitures. The Company issues new shares upon the respective grant, exercise or vesting of the share-based payment awards, as applicable.
Performance unit awards are subject to either a performance-based or market-based vesting requirement. For performance-based vesting, the grant-date fair value of the award, based on fair value of the Company's common stock, is recognized over the service period, based on an assessment of the likelihood that the applicable performance goals will be achieved and compensation expense is periodically adjusted based on actual and expected performance. Compensation expense for performance unit awards with market-based vesting is calculated based on the estimated fair value as of the grant date utilizing a Monte Carlo simulation model and is recognized over the service period on a straight-line basis.
Recent Accounting Pronouncements
In May 2014, the Financial Accounting Standards Board (FASB) issued a new revenue recognition standard entitled “Revenue from Contracts with Customers.” The objective of the standard is to establish the principles that an entity shall apply to report useful information to users of financial statements about the nature, amount, timing, and uncertainty of revenue and cash flows from a contract with a customer. The standard is effective for annual reporting periods beginning after December 15, 2017. Earlier adoption as of the original date is optional; however, the Company will adopt the standard beginning January 1, 2018. The standard allows for either “full retrospective” adoption, meaning the standard is applied to all periods presented, or “modified retrospective” adoption, meaning the standard is applied only to the most current period presented in the financial statements. The Company is currently assessing which method it will choose for adoption, and is evaluating the impact of the adoption of this new accounting standard on its consolidated results of income and financial position.
In July 2015, the FASB issued ASU No. 2015-11, Simplifying the Measurement of Inventory, which requires an entity that uses the first-in first-out method for inventory to report inventory cost at the lower of cost or net realizable value versus the current measurement principle of lower of cost or market. The ASU requires prospective adoption for inventory measurements for fiscal years beginning after December 15, 2016. Early adoption is permitted. The Company is evaluating the effect that ASU 2015-11 may have on its consolidated financial statements and related disclosures.
In November 2015, the FASB issued ASU No. 2015-17, Balance Sheet Classification of Deferred Taxes, which requires the classification of all deferred tax assets and liabilities as noncurrent. The standard is effective for annual reporting periods beginning after December 15, 2016. The standard allows for either "prospective" adoption, meaning the standard is applied to the most current period presented in the financial statements or "full retrospective” adoption, meaning the standard is applied to all periods presented. Earlier adoption is permitted. The Company is evaluating the effect that ASU 2015-17 may have on its consolidated financial statements and related disclosures.
F-16
3. | RESEARCH AND LICENSE AGREEMENTS WITH PRINCETON UNIVERSITY, UNIVERSITY OF SOUTHERN CALIFORNIA AND THE UNIVERSITY OF MICHIGAN: |
The Company funded OLED technology research at Princeton and, on a subcontractor basis, at USC for 10 years under a Research Agreement executed with Princeton in August 1997 (the 1997 Research Agreement). The principal investigator conducting work under the 1997 Research Agreement transferred to Michigan in January 2006. Following this transfer, the 1997 Research Agreement was allowed to expire on July 31, 2007.
As a result of the transfer, the Company entered into a new Sponsored Research Agreement with USC to sponsor OLED technology research at USC and, on a subcontractor basis, Michigan. This new Sponsored Research Agreement (as amended, the 2006 Research Agreement) was effective as of May 1, 2006 and had an original term of three years. On May 1, 2009, the Company amended the 2006 Research Agreement to extend the term of the agreement for an additional four years. The 2006 Research Agreement superseded the 1997 Research Agreement with respect to all work being performed at USC and Michigan. Payments under the 2006 Research Agreement were made to USC on a quarterly basis as actual expenses were incurred. The Company incurred a total of $5.0 million in research and development expense for work performed under the 2006 Research Agreement during the extended term, which ended on April 30, 2013.
Effective June 1, 2013, the Company amended the 2006 Research Agreement again to extend the term of the agreement for an additional four years. As of December 31, 2015, the Company is obligated to pay USC up to $3.5 million for work to be actually performed during the remaining extended term, which expires April 30, 2017. From June 1, 2013 through December 31, 2015, the Company incurred $3.0 million in research and development expense for work performed under the newly amended 2006 Research Agreement.
On October 9, 1997, the Company, Princeton and USC entered into an Amended License Agreement (as amended, the 1997 Amended License Agreement) under which Princeton and USC granted the Company worldwide, exclusive license rights, with rights to sublicense, to make, have made, use, lease and/or sell products and to practice processes based on patent applications and issued patents arising out of work performed by Princeton and USC under the 1997 Research Agreement. Under this 1997 Amended License Agreement, the Company is required to pay Princeton royalties for licensed products sold by the Company or its sublicensees. For licensed products sold by the Company, the Company is required to pay Princeton 3% of the net sales price of these products. For licensed products sold by the Company’s sublicensees, the Company is required to pay Princeton 3% of the revenues received by the Company from these sublicensees. These royalty rates are subject to renegotiation for products not reasonably conceivable as arising out of the 1997 Research Agreement if Princeton reasonably determines that the royalty rates payable with respect to these products are not fair and competitive.
The Company is obligated, under the 1997 Amended License Agreement, to pay to Princeton minimum annual royalties. The minimum royalty payment is $100,000 per year. The Company recorded royalty expense in connection with this agreement of $5.4 million, $4.5 million and $3.2 million for the years ended December 31, 2015, 2014 and 2013, respectively.
The Company also is required, under the 1997 Amended License Agreement, to use commercially reasonable efforts to bring the licensed OLED technology to market. However, this requirement is deemed satisfied if the Company invests a minimum of $800,000 per year in research, development, commercialization or patenting efforts respecting the patent rights licensed to the Company.
In connection with entering into the 2006 Research Agreement, the Company amended the 1997 Amended License Agreement to include Michigan as a party to that agreement effective as of January 1, 2006. Under this amendment, Princeton, USC and Michigan have granted the Company a worldwide exclusive license, with rights to sublicense, to make, have made, use, lease and/or sell products and to practice processes based on patent applications and issued patents arising out of work performed under the 2006 Research Agreement. The financial terms of the 1997 Amended License Agreement were not impacted by this amendment.
4. | INVENTORIES: |
Inventories consisted of the following (in thousands):
December 31, | ||||||||
2015 | 2014 | |||||||
Raw materials | $ | 6,539 | $ | 7,696 | ||||
Work-in-process | 1,064 | 4,419 | ||||||
Finished goods | 5,145 | 24,994 | ||||||
$ | 12,748 | $ | 37,109 | |||||
F-17
Inventories included none and $1.0 million of inventory consigned to customers at December 31, 2015 and 2014, respectively. During the year ended December 31, 2015, 2014 and 2013, the Company recorded write-downs of inventories of $33.0 million, $3.9 million, and none, respectively. The write-down for the 2015 period consisted of $22.9 million of work-in-process and $10.1 million of finished goods inventory. During the second quarter of 2015, the Company experienced a faster-than-anticipated decline in host material sales and based on the most recent sales forecast, the Company determined that there were likely to be significantly lower sales of existing host material. Sales forecasts tend to be volatile, but because of the deterioration in both actual and forecasted sales demand, a write-down in net realizable value primarily to host inventory was required. The write-down for the 2014 period, which occurred in the fourth quarter, was comprised solely of finished goods inventory.
5. | PROPERTY AND EQUIPMENT: |
Property and equipment consist of the following (in thousands):
December 31, | |||||||
2015 | 2014 | ||||||
Land | $ | 820 | $ | 820 | |||
Building and improvements | 19,642 | 17,631 | |||||
Office and lab equipment | 25,086 | 23,666 | |||||
Furniture, fixtures and computer related assets | 2,457 | 506 | |||||
Construction-in-progress | 2,299 | 2,112 | |||||
50,304 | 44,735 | ||||||
Less: Accumulated depreciation | (27,897 | ) | (24,813 | ) | |||
Property and equipment, net | $ | 22,407 | $ | 19,922 | |||
Depreciation expense was approximately $3.1 million, $2.1 million and $2.0 million for the years ended December 31, 2015, 2014 and 2013, respectively.
6. | ACQUIRED TECHNOLOGY: |
Acquired technology consists of acquired license rights for patents and know-how obtained from PD-LD, Inc., Motorola and Fujifilm. These intangible assets consist of the following (in thousands):
December 31, | ||||||||
2015 | 2014 | |||||||
PD-LD, Inc. | $ | 1,481 | $ | 1,481 | ||||
Motorola | 15,909 | 15,909 | ||||||
Fujifilm | 109,462 | 109,462 | ||||||
126,852 | 126,852 | |||||||
Less: Accumulated amortization | (54,837 | ) | (43,838 | ) | ||||
Acquired technology, net | $ | 72,015 | $ | 83,014 | ||||
Amortization expense for all intangible assets was $11.0 million for the years ended December 31, 2015, 2014 and 2013, respectively, and is included in patent costs and amortization of acquired technology expense on the consolidated statements of income.
Motorola Patent Acquisition
In 2000, the Company entered into a royalty-bearing license agreement with Motorola whereby Motorola granted the Company perpetual license rights to what are now 74 issued U.S. patents relating to Motorola’s OLED technologies, together with foreign counterparts in various countries. These patents expire in the U.S. between 2014 and 2018.
On March 9, 2011, the Company purchased these patents from Motorola, including all existing and future claims and causes of action for any infringement of the patents, pursuant to a Patent Purchase Agreement. The Patent Purchase Agreement effectively terminated the Company’s license agreement with Motorola, including any obligation to make royalty payments to Motorola. The technology acquired from Motorola is being amortized over a period of 7.5 years.
F-18
Fujifilm Patent Acquisition
On July 23, 2012, the Company entered into a Patent Sale Agreement (the Agreement) with Fujifilm. Under the Agreement, Fujifilm sold more than 1,200 OLED-related patents and patent applications in exchange for a cash payment of $105.0 million, and costs of $4.5 million were incurred in connection with the purchase. The Agreement contains customary representations and warranties and covenants, including respective covenants not to sue by both parties thereto. The Agreement permitted the Company to assign all of its rights and obligations under the Agreement to its affiliates, and the Company assigned, prior to the consummation of the transactions contemplated by the Agreement, its rights and obligations to UDC Ireland Limited (UDC Ireland), a wholly-owned subsidiary of the Company formed under the laws of the Republic of Ireland. The transactions contemplated by the Agreement were consummated on July 26, 2012. The Company recorded the $105.0 million plus $4.5 million of costs as acquired technology, which is being amortized over a period of 10 years.
Amortization expense related to acquired technology is currently expected to be as follows (in thousands):
Year | Projected Expense | |||
2016 | $ | 10,999 | ||
2017 | 10,999 | |||
2018 | 10,999 | |||
2019 | 10,999 | |||
2020 | 10,999 | |||
Thereafter | 17,020 | |||
$ | 72,015 | |||
7. | ACCRUED EXPENSES: |
Accrued expenses consist of the following (in thousands):
December 31, | ||||||||
2015 | 2014 | |||||||
Compensation | $ | 9,885 | $ | 8,738 | ||||
Royalties | 5,362 | 4,454 | ||||||
Research and development agreements | 1,389 | 570 | ||||||
Professional fees | 296 | 507 | ||||||
Consulting | 407 | 370 | ||||||
Other | 48 | 347 | ||||||
$ | 17,387 | $ | 14,986 | |||||
F-19
8. | EQUITY AND CASH COMPENSATION UNDER THE PPG AGREEMENTS: |
On October 1, 2000, the Company entered into a five-year Development and License Agreement (the Development Agreement) and a seven-year Supply Agreement (the Supply Agreement) with PPG Industries. Under the Development Agreement, a team of PPG Industries scientists and engineers assisted the Company in developing its proprietary OLED materials and supplied the Company with these materials for evaluation purposes. Under the Supply Agreement, PPG Industries supplied the Company with its proprietary OLED materials that were intended for resale to customers for commercial purposes.
On July 29, 2005, the Company entered into an OLED Materials Supply and Service Agreement with PPG Industries (the OLED Materials Agreement). The OLED Materials Agreement superseded and replaced in their entireties the Development Agreement and Supply Agreement effective as of January 1, 2006, and extended the term of the Company’s relationship with PPG Industries through December 31, 2009.
On September 22, 2011, the Company entered into an Amended and Restated OLED Materials Supply and Service Agreement with PPG Industries (the New OLED Materials Agreement), which replaced the original OLED Materials Agreement with PPG Industries effective as of October 1, 2011. The term of the New OLED Materials Agreement ran through December 31, 2015 and shall be automatically renewed for additional one year terms, unless terminated by the Company by providing prior notice of one year or terminated by PPG by providing prior notice of two years. The agreement was automatically renewed through December 31, 2017. The New OLED Materials Agreement contains provisions that are substantially similar to those of the original OLED Materials Agreement. Under the New OLED Materials Agreement, PPG Industries continues to assist the Company in developing its proprietary OLED materials and supplying the Company with those materials for evaluation purposes and for resale to its customers.
Under the New OLED Materials Agreement, the Company compensates PPG Industries on a cost-plus basis for the services provided during each calendar quarter. The Company is required to pay for some of these services in all cash. Up to 50% of the remaining services are payable, at the Company’s sole discretion, in cash or shares of the Company’s common stock, with the balance payable in cash. The actual number of shares of common stock issuable to PPG Industries is determined based on the average closing price for the Company’s common stock during a specified number of days prior to the end of each calendar half-year period ending on March 31 and September 30. If, however, this average closing price is less than $20.00, the Company is required to compensate PPG Industries in cash. No shares were issued for services to PPG for the years ended December 31, 2015, 2014 and 2013.
The Company is also to reimburse PPG Industries for raw materials used for research and development. The Company records the purchases of these raw materials as a current asset until such materials are used for research and development efforts.
The Company recorded research and development expense of $7.9 million, $9.2 million and $7.5 million for the years ended December 31, 2015, 2014 and 2013, respectively, in relation to the cash portion of the reimbursement of expenses and work performed by PPG Industries, excluding amounts paid for commercial chemicals.
9. | PREFERRED STOCK: |
The Company’s Articles of Incorporation authorize it to issue up to 5,000,000 shares of preferred stock with designations, rights and preferences determined from time-to-time by the Company’s Board of Directors. Accordingly, the Company’s Board of Directors is empowered, without shareholder approval, to issue preferred stock with dividend, liquidation, conversion, voting or other rights superior to those of shareholders of the Company’s common stock.
In 1995, the Company issued 200,000 shares of Series A Nonconvertible Preferred Stock (Series A) to American Biomimetics Corporation (ABC) pursuant to a certain Technology Transfer Agreement between the Company and ABC. The Series A shares have a liquidation value of $7.50 per share. Series A shareholders, as a single class, have the right to elect two members of the Company’s Board of Directors. This right has never been exercised. Holders of the Series A shares are entitled to one vote per share on matters which shareholders are generally entitled to vote. The Series A shareholders are not entitled to any dividends.
10. | SHAREHOLDERS' EQUITY: |
Stock Repurchase Program
On November 14, 2012, the Company's Board of Directors approved a stock repurchase program authorizing the Company to purchase shares of its common stock up to a total purchase price of $50.0 million over the subsequent 12 months. During the years ended December 31, 2013 and 2012, the Company purchased 195,599 and 205,902 shares, respectively, at a cost of approximately $5.5 million and $5.2 million, respectively. This repurchase program ended in 2013.
F-20
On June 2, 2014, the Company's Board of Directors approved an additional stock repurchase program authorizing the Company to purchase shares of its common stock up to a total purchase price of $50.0 million over the subsequent 12 months. Since approval of the program and through December 31, 2015, the Company purchased 956,362 shares, at a cost of approximately $29.5 million. This repurchase program ended in 2015.
Scientific Advisory Board, Board of Directors and Employee Awards
In March 2015, 2014 and 2013, respectively, the Company granted a total of 35,205, 31,301 and 22,586 shares of fully vested common stock to employees and non-employee members of the Scientific Advisory Board for services performed in 2014, 2013 and 2012, respectively. The fair value of the shares issued was $967,000, $749,000 and $435,000, respectively, for employees and $300,000, $323,000 and $300,000, respectively, for members of the Board of Directors and non-employee members of the Scientific Advisory Board, which amounts were accrued at December 31, 2014, 2013 and 2012, respectively. In connection with the issuance of these grants, 9,565, 8,071 and 4,672 shares, respectively, with fair values of $346,000, $271,000 and $154,000, respectively, were withheld in satisfaction of employee tax withholding obligations in 2015, 2014 and 2013, respectively.
11. | ACCUMULATED OTHER COMPREHENSIVE LOSS: |
Amounts related to the changes in accumulated other comprehensive loss were as follows (in thousands):
Unrealized loss on marketable securities | Net unrealized loss on retirement plan(2) | Total | Affected line items in the consolidated statement of income | |||||||||||
Balance January 1, 2013, net of tax | $ | (18 | ) | $ | (5,684 | ) | $ | (5,702 | ) | |||||
Other comprehensive loss before reclassification | (6 | ) | 413 | 407 | ||||||||||
Reclassification to net income (1) | — | 927 | 927 | Selling, general and administrative and research and development | ||||||||||
Change during period | (6 | ) | 1,340 | 1,334 | ||||||||||
Balance December 31, 2013, net of tax | $ | (24 | ) | $ | (4,344 | ) | $ | (4,368 | ) | |||||
Other comprehensive loss before reclassification | (4 | ) | (385 | ) | (389 | ) | ||||||||
Reclassification to net income (1) | — | 375 | 375 | Selling, general and administrative and research and development | ||||||||||
Change during period | (4 | ) | (10 | ) | (14 | ) | ||||||||
Balance December 31, 2014, net of tax | $ | (28 | ) | $ | (4,354 | ) | $ | (4,382 | ) | |||||
Other comprehensive (loss) income before reclassification | (83 | ) | (388 | ) | (471 | ) | ||||||||
Plan amendment cost | — | (5,963 | ) | (5,963 | ) | |||||||||
Reclassification to net income (1) | — | 997 | 997 | Selling, general and administrative and research and development | ||||||||||
Change during period | (83 | ) | (5,354 | ) | (5,437 | ) | ||||||||
Balance December 31, 2015, net of tax | $ | (111 | ) | $ | (9,708 | ) | $ | (9,819 | ) | |||||
_______________________________________________
(1) The Company reclassified amortization of prior service cost and actuarial loss for its retirement plan from accumulated other comprehensive loss to net income in the amounts of $1.0 million, $375,000 and $927,000 for the years ended December 31, 2015, 2014 and 2013, respectively.
(2) Refer to Note 13: Supplemental Executive Retirement Plan.
12. | STOCK-BASED COMPENSATION: |
The Company recognizes in the statements of income the grant-date fair value of equity based awards such as shares issued under employee stock purchase plans, restricted stock awards, restricted stock units, performance unit awards issued to employees and directors.
The grant-date fair value of stock awards is based on the closing price of the stock on the date of grant. The fair value of share-based awards is recognized as compensation expense on a straight-line basis over the requisite service period, net of forfeitures. The Company issues new shares upon the respective grant, exercise or vesting of the share-based payment awards, as applicable.
F-21
Performance unit awards are subject to either a performance-based or market-based vesting requirement. For performance-based vesting, the grant-date fair value of the award, based on fair value of the Company's common stock, is recognized over the service period, based on an assessment of the likelihood that the applicable performance goals will be achieved and compensation expense is periodically adjusted based on actual and expected performance. Compensation expense for performance unit awards with market-based vesting is calculated based on the estimated fair value as of the grant date utilizing a Monte Carlo simulation model and is recognized over the service period on a straight-line basis.
Equity Compensation Plan
In 1995, the Board of Directors of the Company adopted a stock option plan, which was amended and restated in 2003 and is now called the Equity Compensation Plan. The Equity Compensation Plan provides for the granting of incentive and nonqualified stock options, shares of common stock, stock appreciation rights and performance units to employees, directors and consultants of the Company. Stock options are exercisable over periods determined by the Compensation Committee, but for no longer than 10 years from the grant date. Through December 31, 2015, the Company’s shareholders have approved increases in the number of shares reserved for issuance under the Equity Compensation Plan to 10,500,000, and have extended the term of the plan through 2024. At December 31, 2015, there were 2,807,928 shares that remained available to be granted under the Equity Compensation Plan.
Stock Options
The following table summarizes the stock option activity during the year ended December 31, 2015 for all grants under the Equity Compensation Plan:
Options | Weighted Average Exercise Price | ||||||
Outstanding at January 1, 2015 | 384,435 | $ | 10.52 | ||||
Granted | — | — | |||||
Exercised | (367,935 | ) | 10.33 | ||||
Forfeited | — | — | |||||
Cancelled | — | — | |||||
Outstanding at December 31, 2015 | 16,500 | 14.83 | |||||
Vested and expected to vest | 16,500 | 14.83 | |||||
Exercisable at December 31, 2015 | 16,500 | $ | 14.83 | ||||
No stock options were granted during the years ended December 31, 2015, 2014 or 2013.
A summary of stock options outstanding and exercisable by price range at December 31, 2015 is as follows (in thousands, except share and per share data):
Outstanding and Exercisable | ||||||||||||
Number of Options Outstanding at December 31, | Weighted Average Remaining Contractual | Weighted Average Exercise | Aggregate Intrinsic | |||||||||
Exercise Price | 2015 | Life (Years) | Price | Value (A) | ||||||||
$10.04-$12.70 | 1,750 | 1.5 | $ | 11.78 | $ | 75 | ||||||
$14.16-$14.39 | 10,500 | 0.3 | $ | 14.38 | $ | 421 | ||||||
$15.22-$18.34 | 4,250 | 1.5 | $ | 17.21 | $ | 158 | ||||||
Total | 16,500 | 0.88 | $ | 14.83 | $ | 654 | ||||||
_______________________________________________
(A) The difference between the stock option’s exercise price and the closing price of the common stock at December 31, 2015.
The total intrinsic value of stock awards exercised during the years ended December 31, 2015, 2014 and 2013 was $12.0 million, $3.7 million and $4.9 million, respectively. There was no compensation expense recognized for the years ended December 31, 2015, 2014 and 2013.
F-22
During the years ended December 31, 2015, 2014 and 2013, 13,959, none and 20,768 shares of common stock, with fair values of $429,000, none and $1 million, respectively, were tendered to net share settle the exercise of options. In connection with the exercise of options during the years ended December 31, 2015, 2014 and 2013, 30,186, none and 7,599 shares, with fair values of $1.3 million, none and $274,000, respectively, were withheld in satisfaction of employee tax withholding obligations.
Stock Awards
The following table summarizes the activity related to restricted stock unit ("RSU") share based payment awards:
Number of Shares | Weighted- Average Grant-Date Fair Value | ||||||
Unvested, January 1, 2015 | 213,113 | $ | 32.94 | ||||
Granted | 91,811 | 41.09 | |||||
Vested | (138,926 | ) | 32.93 | ||||
Forfeited | (1,324 | ) | 33.54 | ||||
Unvested, December 31, 2015 | 164,674 | $ | 37.49 | ||||
The weighted average grant-date fair value of RSU awards granted was $41.09, $37.95 and $32.80 during the years ended December 31, 2015, 2014 and 2013, respectively. The fair value as of the respective vesting dates of RSUs was $5.6 million, $3.1 million, and $1.8 million for 2015, 2014 and 2013, respectively.
The following table summarizes the activity related to restricted stock award ("RSA") share based payment awards:
Number of Shares | Weighted- Average Grant-Date Fair Value | ||||||
Unvested, January 1, 2015 | 186,471 | $ | 24.47 | ||||
Granted | 770,205 | 43.49 | |||||
Vested | (169,352 | ) | 22.82 | ||||
Forfeited | — | — | |||||
Unvested, December 31, 2015 | 787,324 | $ | 43.43 | ||||
The weighted average grant-date fair value of restricted stock award share based payment awards granted was $43.49, $32.54 and $32.54 during the years ended December 31, 2015, 2014 and 2013, respectively. The fair value as of the respective vesting dates of RSAs was $7.3 million, $4.6 million, $5.7 million for 2015, 2014 and 2013, respectively.
Restricted Stock Awards and Units
The Company has issued restricted stock awards and units to employees and non-employee members of the Scientific Advisory Board with vesting terms of one to six years. The fair value is equal to the market price of the Company’s common stock on the date of grant for awards granted to employees and equal to the market price at the end of the reporting period for unvested non-employee awards or upon the date of vesting for vested non-employee awards. Expense for restricted stock awards and units is amortized ratably over the vesting period for the awards issued to employees and using a graded vesting method for the awards issued to non-employee members of the Scientific Advisory Board.
For the years ended December 31, 2015, 2014 and 2013, the Company recorded, as compensation charges related to restricted stock awards and units issued to employees and non-employees, selling, general and administrative expense of $6.0 million, $3.7 million and $3.8 million, respectively, and research and development expense of $1.9 million, $1.8 million and $1.6 million, respectively.
The majority of the Company's restricted stock awards and units that vested in 2015, 2014 and 2013 were net-share settled such that the Company withheld shares with value equivalent to the employees minimum statutory obligation for the applicable income and other employment taxes, and remitted the cash to the appropriate taxing authorities. The total shares withheld were approximately 99,345, 75,760, and 89,635 for 2015, 2014 and 2013, respectively, and were based on the value of the restricted stock on their respective vesting dates as determined by the Company's closing stock price. Total payments for the employees' tax obligations to taxing authorities were $4.2 million, $2.6 million, and $2.8 million in 2015, 2014 and 2013, respectively, and are reflected as a financing activity within the Consolidated Statements of Cash Flows.
F-23
For the years ended December 31, 2015, 2014 and 2013, the Company recorded as compensation charges related to all restricted stock units to non-employee members of the Scientific Advisory Board whose unvested shares are marked to market each reporting period, research and development expense of $426,000, $175,000, and $267,000 for 2015, 2014 and 2013, respectively.
Board of Directors Compensation
The Company has granted restricted stock units to non-employee members of the Board of Directors with vesting terms of approximately one year. The fair value is equal to the market price of the Company's common stock on the date of grant. The restricted stock units are issued and expense is recognized ratably over the vesting period. For the years ended December 31, 2015, 2014 and 2013, the Company recorded compensation charges for services performed related to all restricted stock units granted to non-employee members of the Board of Directors, selling, general and administrative expense of $865,000, $797,000 and $525,000, respectively. Restricted stock issued to non-employee members of the Board of Directors during 2015, 2014 and 2013 was 29,167, 23,750, and 20,000 shares, respectively.
As of December 31, 2015, the total unrecognized compensation cost related to RSUs and RSAs was $33.2 million, which the Company expects to recognize over a weighted average period of 3.96 years.
Performance Unit Awards
The following table summarizes the activity related to performance unit awards ("PSU") share based payment awards:
Number of Shares | Weighted- Average Grant-Date Fair Value | ||||||
Unvested, January 1, 2015 | 71,868 | $ | 39.42 | ||||
Granted | 32,632 | 35.98 | |||||
Vested | (35,776 | ) | 32.56 | ||||
Forfeited | — | — | |||||
Unvested, December 31, 2015 | 68,724 | $ | 34.63 | ||||
During the years ended December 31, 2015 and 2014, respectively, the Company granted 32,632 and 36,092 performance units, of which 16,315 and 18,044 are subject to a performance-based vesting requirements and 16,317 and 18,048 are subject to a market-based vesting requirements, and will vest over the terms described below. The weighted average grant date fair value of the performance unit awards granted was $35.98, $38.67 and $40.17 during the years ended December 31, 2015, 2014, and 2013, respectively, as determined by the Company's common stock on date of grant for the units with performance-based vesting and a Monte-Carlo simulation for the units with market-based vesting.
Each performance unit award is subject to both a performance-vesting requirement (either performance-based or market-based) and a service-vesting requirement. The performance-based vesting requirement is tied to the Company's cumulative revenue growth compared to the cumulative revenue growth of companies comprising the Nasdaq Electronics Components Index, as measured over a specific performance period. The market-based vesting requirement is tied to the Company's total shareholder return relative to the total shareholder return of companies comprising the Nasdaq Electronics Components Index, as measured over a specific performance period. The maximum number of performance units that may vest based on performance is two times the shares granted. Further, if the Company's total shareholder return is negative, the performance units may not vest above the shares granted.
For the years ended December 31, 2015, 2014 and 2013, the Company recorded, as compensation charges related to all performance stock units, selling, general and administrative expenses of $871,000, $1.4 million and $453,000, respectively, and research and development expenses of $237,000, $408,000, and $137,000, respectively. In connection with the vesting of performance units during the year ended December 31, 2015, 16,071 shares with an aggregate fair value of $752,000 were withheld in satisfaction of employee tax withholding obligations.
As of December 31, 2015, the total unrecognized compensation cost related to PSUs was $1.5 million, which the Company expects to recognize over a weighted average period of 1.77 years.
Employee Stock Purchase Plan
On April 7, 2009, the Board of Directors of the Company adopted an Employee Stock Purchase Plan (ESPP). The ESPP was approved by the Company’s shareholders and became effective on June 25, 2009. The Company has reserved 1,000,000 shares of common stock for issuance under the ESPP. Unless sooner terminated by the Board of Directors, the ESPP will expire when all reserved shares have been issued.
F-24
Eligible employees may elect to contribute to the ESPP through payroll deductions during consecutive three-month purchase periods, the first of which began on July 1, 2009. Each employee who elects to participate will be deemed to have been granted an option to purchase shares of the Company’s common stock on the first day of the purchase period. Unless the employee opts out during the purchase period, the option will automatically be exercised on the last day of the period, which is the purchase date, based on the employee’s accumulated contributions to the ESPP. The purchase price will equal 85% of the lesser of the price per share of common stock on the first day of the period or the last day of the period.
Employees may allocate up to 10% of their base compensation to purchase shares of common stock under the ESPP; however, each employee may purchase no more than 12,500 shares on a given purchase date, and no employee may purchase more than $25,000 of common stock under the ESPP during a given calendar year.
For years ended December 31, 2015, 2014 and 2013, the Company issued 12,246, 12,373 and 14,366 shares, respectively, of its common stock under the ESPP, resulting in proceeds of $354,000, $328,000 and $343,000, respectively. For the years ended December 31, 2015, 2014 and 2013, the Company recorded charges of $43,000, $44,000 and $36,000, respectively, to selling, general and administrative expense and $50,000, $52,000 and $71,000, respectively, to research and development expense, related to the ESPP equal to the amount of the discount and the value of the look-back feature.
13. | SUPPLEMENTAL EXECUTIVE RETIREMENT PLAN: |
On March 18, 2010, the Compensation Committee and the Board of Directors of the Company approved and adopted the Universal Display Corporation Supplemental Executive Retirement Plan (SERP), effective as of April 1, 2010. On March 3, 2015, the Compensation Committee and the Board of Directors amended the SERP to include salary and bonus as part of the plan. Prior to this amendment, the SERP benefit did not take into account any bonuses. The purpose of the SERP, which is unfunded, is to provide certain of the Company’s executive officers with supplemental pension benefits following a cessation of their employment. As of December 31, 2015 there were six participants in the SERP.
The SERP benefit is based on a percentage of the participant’s annual base salary and in certain cases, the participant's average annual bonus for the most recent three fiscal years ending prior to the participant's date of termination of employment with the Company for the life of the participant. For this purpose, annual base salary means 12 times the highest monthly base salary paid or payable to the participant during the 24-month period immediately preceding the participant’s date of termination of employment, or, if required, the date of a change in control of the Company.
Under the SERP, if a participant resigns or is terminated without cause at or after age 65 and with at least 20 years of service, he or she will be eligible to receive a SERP benefit. The benefit is based on a percentage of the participant’s annual base salary and bonus for the life of the participant. This percentage is 50%, 25% or 15%, depending on the participant’s benefit class. All current participants in the SERP are in the 50% benefit class.
If a participant resigns at or after age 65 and with at least 15 years of service, he or she will be eligible to receive a prorated SERP benefit. If a participant is terminated without cause or on account of a disability after at least 15 years of service, he or she will be eligible to receive a prorated SERP benefit regardless of age. The prorated benefit in either case would be based on the participant’s number of years of service (up to 20), divided by 20. In the event a participant is terminated for cause, his or her SERP benefit and any future benefit payments are subject to immediate forfeiture.
The SERP benefit is payable in installments over 10 years, beginning at the later of age 65 or the date of the participant’s separation from service. Payments are based on a present value calculation of the benefit amount for the actuarial remaining life expectancy of the participant. This calculation is made as of the date benefit payments are to begin (later of age 65 or separation from service). If the participant dies after reaching age 65, any future or remaining benefit payments are made to the participant’s beneficiary or estate. If the participant dies before reaching age 65, the benefit is forfeited.
In the event of a change in control of the Company, each participant will become immediately vested in his or her SERP benefit. Unless the participant’s benefit has already fully vested, if the participant has less than 20 years of service at the time of the change in control, he or she will receive a prorated benefit based on his or her number of years of service (up to 20), divided by 20. If the change in control qualifies as a “change in control event” for purposes of Section 409A of the Internal Revenue Code, then each participant (including former employees who are entitled to SERP benefits) will receive a lump sum cash payment equal to the present value of the benefit immediately upon the change in control.
Certain of the Company’s executive officers are designated as special participants under the SERP. If these participants resign or are terminated without cause after 20 years of service, or at or after age 65 and with at least 15 years of service, they will be eligible to receive a SERP benefit. If they are terminated without cause or on account of a disability, they will be eligible to receive a prorated SERP benefit regardless of age. The prorated benefit would be based on the participant’s number of years of service (up to 20), divided by 20.
F-25
The SERP benefit for special participants is based on 50% of their annual base salary and bonus for their life and the life of their surviving spouse, if any. Payments are based on a present value calculation of the benefit amount for the actuarial remaining life expectancies of the participant and their surviving spouse, if any. If they die before reaching age 65, the benefit is not forfeited if the surviving spouse, if any, lives until the participant would have reached age 65. If their spouse also dies before the participant would have reached age 65, the benefit is forfeited.
The Company records amounts relating to the SERP based on calculations that incorporate various actuarial and other assumptions, including discount rates, rate of compensation increases, retirement dates, and life expectancies. The net periodic costs are recognized as employees render the services necessary to earn the SERP benefits.
In connection with the initiation and subsequent amendment of the SERP, the Company recorded cost related to prior service of $11.7 million as accumulated other comprehensive loss. The prior service cost is being amortized as a component of net periodic pension cost over the average of the remaining service period of the employees expected to receive benefits under the plan. The prior service cost expected to be amortized for the year ending December 31, 2016 is $1.7 million.
Information relating to the Company’s plan is as follows (in thousands):
Year Ended December 31, | ||||||||
2015 | 2014 | |||||||
Change in benefit obligation: | ||||||||
Benefit obligation, beginning of year | $ | 10,916 | $ | 9,436 | ||||
Service cost | 1,186 | 669 | ||||||
Interest cost | 618 | 426 | ||||||
Actuarial loss | 606 | 385 | ||||||
Plan amendment | 9,268 | — | ||||||
Benefit obligation, end of year | 22,594 | 10,916 | ||||||
Fair value of plan assets | — | — | ||||||
Unfunded status of the plan, end of year | $ | 22,594 | $ | 10,916 | ||||
Current liability | — | — | ||||||
Noncurrent liability | $ | 22,594 | $ | 10,916 | ||||
The accumulated benefit obligation for the plan was approximately $20.0 million and $9.3 million as of December 31, 2015 and 2014, respectively.
The components of net periodic pension cost were as follows (in thousands):
Year Ended December 31, | ||||||||||||
2015 | 2014 | 2013 | ||||||||||
Service cost | $ | 1,186 | $ | 669 | $ | 646 | ||||||
Interest cost | 618 | 426 | 343 | |||||||||
Amortization of prior service cost | 1,550 | 584 | 584 | |||||||||
Amortization of loss | — | — | 92 | |||||||||
Total net periodic benefit cost | $ | 3,354 | $ | 1,679 | $ | 1,665 | ||||||
The measurement date is the Company’s fiscal year end. The net periodic pension cost is based on assumptions determined at the prior year end measurement date.
F-26
Assumptions used to determine the year end benefit obligation were as follows:
Year Ended December 31, | ||||
2015 | 2014 | |||
Discount rate | 3.78% | 3.57% | ||
Rate of compensation increases | 3.50% | 3.50% | ||
Assumptions used to determine the net periodic pension cost were as follows:
Year Ended December 31, | ||||||
2015 | 2014 | 2013 | ||||
Discount rate | 3.78% | 4.51% | 3.49% | |||
Rate of compensation increases | 3.50% | 3.50% | 3.50% | |||
(1) The Company used a discount rate of 3.57% until the plan amendment, when the above mentioned discount rate was used to calculate the net periodic pension cost for the remainder of the year.
Actuarial gains and losses are amortized from accumulated other comprehensive loss into net periodic pension cost over future years based upon the average remaining service period of active plan participants, when the accumulation of such gains or losses exceeds 10% of the year end benefit obligation. The cost or benefit of plan changes that increase or decrease benefits for prior employee service (prior service cost [credit]) is included in the Company’s results of income on a straight-line basis over the average remaining service period of active plan participants.
The estimated amounts to be amortized from accumulated other comprehensive loss into the net periodic pension cost in 2016 are as follows (in thousands):
Amortization of prior service cost | $ | 1,743 | ||
Amortization of gain/loss | — | |||
Total | $ | 1,743 | ||
Benefit payments, which reflect estimated future service, are currently expected to be paid as follows (in thousands):
Year | Projected Benefits | |||
2016 | $ | — | ||
2017 | 1,737 | |||
2018 | 1,818 | |||
2019 | 1,818 | |||
2020 | 1,818 | |||
2021-2025 | 12,497 | |||
Thereafter | 23,598 | |||
14. | COMMITMENTS AND CONTINGENCIES: |
Commitments
Under the 2006 Research Agreement with USC, the Company is obligated to make certain payments to USC based on work performed by USC under that agreement, and by Michigan under its subcontractor agreement with USC. See Note 3 for further explanation.
Under the terms of the 1997 Amended License Agreement, the Company is required to make minimum royalty payments to Princeton. See Note 3 for further explanation.
The Company has agreements with six executive officers which provide for certain cash and other benefits upon termination of employment of the officer in connection with a change in control of the Company. Each executive is entitled to a lump-sum cash payment equal to two times the sum of the average annual base salary and bonus of the officer and immediate vesting of all stock options and other equity awards that may be outstanding at the date of the change in control, among other items.
F-27
In order to manage manufacturing lead times and help ensure adequate material supply, the Company entered into a New OLED Materials Agreement (see note 8) that will allow PPG Industries to procure and produce inventory based upon criteria as defined by the Company. These purchase commitments consist of firm, noncancelable and unconditional commitments. In certain instances, this agreement allows the Company the option to reschedule and adjust the Company’s requirements based on its business needs prior to firm orders being placed. As of December 31, 2015 and 2014, the Company had purchase commitments for inventory of $9.0 million and $9.1 million, respectively.
Patent Related Challenges and Oppositions
Each major jurisdiction that issues patents provides third parties and applicants an opportunity to seek a further review of an issued patent. The process for requesting and considering such reviews is specific to the jurisdiction that issued the patent in question, and generally does not provide for claims of monetary damages or a review of specific claims of infringement. The conclusions made by the reviewing administrative bodies tend to be appealable and generally are limited in scope and applicability to the specific claims and jurisdiction in question.
The Company believes that opposition proceedings are frequently commenced in the ordinary course of business by third parties who may believe that one or more claims in a patent do not comply with the technical or legal requirements of the specific jurisdiction in which the patent was issued. The Company views these proceedings as reflective of its goal of obtaining the broadest legally permissible patent coverage permitted in each jurisdiction. Once a proceeding is initiated, as a general matter, the issued patent continues to be presumed valid until the jurisdiction’s applicable administrative body issues a final non-appealable decision. Depending on the jurisdiction, the outcome of these proceedings could include affirmation, denial or modification of some or all of the originally issued claims. The Company believes that as OLED technology becomes more established and its patent portfolio increases in size, so will the number of these proceedings.
Below are summaries of certain proceedings that have been commenced against issued patents that are either exclusively licensed to the Company or which are now assigned to the Company. The Company does not believe that the confirmation, loss or modification of the Company's rights in any individual claim or set of claims that are the subject of the following legal proceedings would have a material impact on the Company's materials sales or licensing business or on the Company's consolidated financial statements, including its consolidated statements of income, as a whole. However, as noted within the descriptions, some of the following proceedings involve issued patents that relate to the Company's fundamental phosphorescent OLED technologies and the Company intends to vigorously defend against claims that, in the Company's opinion, seek to restrict or reduce the scope of the originally issued claim, which may require the expenditure of significant amounts of the Company's resources. In certain circumstances, when permitted, the Company may also utilize the proceedings to request modification of the claims to better distinguish the patented invention from any newly identified prior art and/or improve the claim scope of the patent relative to commercially important categories of the invention. The entries marked with an "*" relate to the Company's UniversalPHOLED phosphorescent OLED technology, some of which may be commercialized by the Company.
Opposition to European Patent No. 1394870*
On April 20, 2010, Merck Patent GmbH; BASF Schweitz AG of Basel, Switzerland; Osram GmbH of Munich, Germany; Siemens Aktiengesellschaft of Munich, Germany; and Koninklijke Philips Electronics N.V., of Eindhoven, The Netherlands filed Notices of Opposition to European Patent No.1394870 (the EP '870 patent). The EP '870 patent, which was issued on July 22, 2009, is a European counterpart patent, in part, to U.S. patents 6,303,238; 6,579,632; 6,872,477; 7,279,235; 7,279,237; 7,488,542; 7,563,519; and 7,901,795; and to pending U.S. patent application 13/035,051, filed on February 25, 2011 (hereinafter the “U.S. '238 Patent Family”). They are exclusively licensed to the Company by Princeton, and the Company is required to pay all legal costs and fees associated with this proceeding.
An Oral Hearing was held before an EPO panel of first instance in Munich, German, on April 8-9, 2014. The panel rejected the original claims and amended the claims to comply with EPO requirements by more narrowly defining the scope of the claims. The '870 patent, in its amended form, was held by the panel to comply with the EPO requirements.
The Company believes the EPO's decision relating to the broad original claims is erroneous and has appealed the ruling to reinstate a broader set of claims. This patent, as originally granted by the EPO, is deemed valid during the pendency of the appeals process.
At this time, based on the Company's current knowledge, the Company believes that the patent being challenged should be declared valid and that all or a significant portion of the Company's claims should be upheld. However, the Company cannot make any assurances of this result.
F-28
Invalidation Trial in Japan for Japan Patent No. 4511024*
On June 16, 2011, the Company learned that a Request for an Invalidation Trial was filed in Japan by Semiconductor Energy Laboratory, Co., Ltd. for its Japanese Patent No. JP-4511024 (the JP '024 patent), which issued on May 14, 2010. The JP '024 patent is a counterpart patent, in part, to the U.S. '238 Patent Family, which relate to the EP '870 patent, which is subject to one of the above-noted European oppositions and which relates to the Company's UniversalPHOLED phosphorescent OLED technology. They are exclusively licensed to the Company by Princeton, and the Company is required to pay all legal costs and fees associated with this proceeding.
On May 10, 2012, the Company learned that the JPO issued a decision upholding the validity of certain claimed inventions in the JP '024 Patent but invalidating the broadest claims in the patent. The Company appealed the JPO’s decision to the Japanese IP High Court. On October 31, 2013, the Japanese IP High Court ruled that the prior art references relied on by the JPO did not support the JPO’s findings, reversed the JPO’s decision with respect to the previously invalidated broad claims in the JP ‘024 patent and remanded the matter back to the JPO for further consideration consistent with its decision. The JPO subsequently issued a decision upholding the validity of certain claimed inventions in the JP '024 Patent but invalidating the broadest claims in the patent. The Company appealed the decision to reinstate a broader set of claims but the IP High Court declined to reinstate the broader set of claims. The Company appealed the IP High Court's decision to the Japanese Supreme Court for reconsideration of the legal basis of the IP High Court's decision. This patent, as originally granted by the JPO, is deemed valid during the pendency of the appeals process.
Although the Company cannot provide any assurances as to the possible outcome of future appellate proceedings which the Company may elect to pursue, if any, the patent is expected to be maintained at least with respect to the narrower set of claims which were not the subject of the IP High Court's invalidation ruling.
Opposition to European Patent No. 1390962
On November 16, 2011, Osram AG and BASF SE each filed a Notice of Opposition to European Patent No. 1390962 (EP '962 patent), which relates to the Company's white phosphorescent OLED technology. The EP '962 patent, which was issued on February 16, 2011, is a European counterpart patent to U.S. patents 7,009,338 and 7,285,907. They are exclusively licensed to the Company by Princeton, and the Company is required to pay all legal costs and fees associated with this proceeding.
The EPO combined the oppositions into a single opposition proceeding, and a hearing on this matter was held in December 2015, wherein the EPO Opposition Division revoked the patent claims for alleged insufficiencies under EPC Article 83. The Company believes the EPO's decision relating to the original claims is erroneous, and will appeal the decision. The patent, as originally granted, is deemed valid during the pendency of the appeals process.
At this time, based on its current knowledge, the Company believes that the patent being challenged should be declared valid, and that all or a significant portion of the Company's claims should be upheld. However, the Company cannot make any assurances of this result.
Opposition to European Patent No. 1933395*
On February 24 and 27, 2012, Sumitomo, Merck Patent GmbH and BASF SE filed oppositions to the Company's European Patent No. 1933395 (the EP '395 patent). The EP ‘395 patent is a counterpart to the EP ‘637 patent, and, in part, to U.S. Patents 7,001,536, 6,902,830, and 6,830,828, and to JP patents 4358168 and 4357781. This patent is exclusively licensed to the Company by Princeton, and the Company is required to pay all legal costs and fees associated with this proceeding.
At an Oral Hearing on October 14, 2013, the EPO panel issued a decision that affirmed the basic invention and broad patent coverage in the EP '395 patent, but narrowed the scope of the original claims.
On February 26, 2014, the Company appealed the ruling to reinstate a broader set of claims. The patent, as originally granted by the EPO, is deemed to be valid during the pendency of an appeals process. Two of the three opponents also filed their own appeals of the ruling. In January 2015, Sumitomo withdrew its opposition of the '395 patent, and the EPO accepted the withdrawal notice. The EPO also issued a notice that the appeal proceedings will proceed in the second quarter of 2016.
In addition to the above proceedings and now-concluded proceedings which have been referenced in prior filings, from time to time, the Company may have other proceedings that are pending which relate to patents the Company acquired as part of the Fuji Patent acquisition or which relate to technologies that are not currently widely utilized in the marketplace.
F-29
15. | CONCENTRATION OF RISK: |
Included in technology development and support revenue in the accompanying statement of income is $0.2 million, $0.1 million and $1.1 million for the years ended December 31, 2015, 2014 and 2013, respectively, of revenue which was derived from contracts with United States government agencies. Revenues derived from contracts with United States government agencies represented approximately less than 1% of the consolidated revenue for the years ended December 31, 2015, 2014 and 2013, respectively.
Revenues and accounts receivable from the Company's largest non-government customers for the years ended December 31 were as follows (in thousands):
2015 | 2014 | 2013 | ||||||||||||||||
Customer | % of Total Revenue(1) | Accounts Receivable | % of Total Revenue(1) | Accounts Receivable | % of Total Revenue(1) | Accounts Receivable | ||||||||||||
A | 62% | $ | 13,355 | 54% | $ | 8,550 | 60% | $ | 7,337 | |||||||||
B | 25% | 8,477 | 19% | 7,598 | 9% | 4,743 | ||||||||||||
C | 5% | 198 | 18% | 953 | 22% | 2,905 | ||||||||||||
_______________________________________________
(1) Materials sold to Customer C are eventually purchased by Customer A.
Revenues from outside of North America represented approximately 99% of the consolidated revenue for the years ended December 31, 2015, 2014 and 2013, respectively. Revenues by geographic area are as follows (in thousands):
Country | 2015 | 2014 | 2013 | |||||||||
South Korea | $ | 168,267 | $ | 141,922 | $ | 102,948 | ||||||
Japan | 16,542 | 44,903 | 40,539 | |||||||||
Taiwan | 2,175 | 1,596 | 904 | |||||||||
Other non-U.S. locations | 2,844 | 1,904 | 696 | |||||||||
Total non-U.S. locations | 189,828 | 190,325 | 145,087 | |||||||||
United States | 1,218 | 706 | 1,552 | |||||||||
Total revenue | $ | 191,046 | $ | 191,031 | $ | 146,639 | ||||||
The Company attributes revenue to different geographic areas on the basis of the location of the customer.
Long-lived assets (net), by geographic area are as follows (in thousands):
2015 | 2014 | |||||||
United States | $ | 22,187 | $ | 19,763 | ||||
Other | 220 | 159 | ||||||
Total long-lived assets | $ | 22,407 | $ | 19,922 | ||||
Substantially all chemical materials were purchased from one supplier. See Note 8.
16. | INCOME TAXES: |
The components of income before income taxes are as follows (in thousands):
Year ended December 31, | ||||||||||||
2015 | 2014 | 2013 | ||||||||||
United States | $ | 54,338 | $ | 60,485 | $ | 57,258 | ||||||
Foreign | (21,279 | ) | (1,158 | ) | (18,250 | ) | ||||||
Income before income tax | $ | 33,059 | $ | 59,327 | $ | 39,008 | ||||||
F-30
The components of the income tax benefit (expense) are as follows (in thousands):
Year ended December 31, | ||||||||||||
2015 | 2014 | 2013 | ||||||||||
Current income tax benefit (expense): | ||||||||||||
Federal | $ | (1,018 | ) | $ | — | $ | 226 | |||||
State | (2 | ) | (2 | ) | — | |||||||
Foreign | (10,224 | ) | (8,363 | ) | (6,600 | ) | ||||||
(11,244 | ) | (8,365 | ) | (6,374 | ) | |||||||
Deferred income tax (expense) benefit: | ||||||||||||
Federal | (7,145 | ) | (9,652 | ) | (16,811 | ) | ||||||
State | 51 | 575 | (1,192 | ) | ||||||||
Foreign | (43 | ) | (31 | ) | 69 | |||||||
(7,137 | ) | (9,108 | ) | (17,934 | ) | |||||||
Adjustments to the beginning-of-year valuation allowance | — | — | 59,352 | |||||||||
Income tax benefit (expense) | $ | (18,381 | ) | $ | (17,473 | ) | $ | 35,044 | ||||
Reconciliation of the statutory U.S. federal tax rate to the Company's effective tax rate is as follows:
Year ended December 31, | |||||||||
2015 | 2014 | 2013 | |||||||
Statutory U.S. federal income tax rate | 35.0 | % | 35.0 | % | 35.0 | % | |||
State income taxes, net of federal benefit | (0.1 | )% | (0.4 | )% | (1.3 | )% | |||
State apportionment change | — | % | — | % | 0.3 | % | |||
U.S. federal rate change | — | % | — | % | (3.6 | )% | |||
Effect of foreign operations | 15.2 | % | 0.7 | % | 10.9 | % | |||
Subpart F income | — | % | (4.5 | )% | 15.6 | % | |||
Nondeductible employee compensation | 2.5 | % | 0.5 | % | 2.3 | % | |||
Research tax credits | (4.4 | )% | (2.5 | )% | (3.4 | )% | |||
Change in valuation allowance | 8.4 | % | (0.4 | )% | (146.4 | )% | |||
Other | (1.0 | )% | 1.0 | % | 0.8 | % | |||
Effective tax rate | 55.6 | % | 29.4 | % | (89.8 | )% | |||
As of December 31, 2015, the Company had net operating loss and credit carry forwards. The Company’s net operating loss carry forwards below differ from the Company's accumulated deficit principally due to the timing of the recognition of certain revenues and expenses. A portion of the Company’s tax credit carry forwards relates to tax deductions from stock-based compensation that will be accounted for as an increase to additional paid-in capital for financial reporting purposes to the extent such future deductions are utilized by the Company (see below). Pursuant to Internal Revenue Code (IRC) sections 382 and 383, utilization of the Company’s federal and state net operating loss and tax credit carry forwards could be subject to an annual limitation because of certain ownership changes.
F-31
The following table summarizes Company tax loss and tax credit carry forwards for tax return purposes at December 31, 2015 (in thousands):
Related Tax Deduction | Tax Benefit | Expiration Date | ||||||||
Loss carry forwards: | ||||||||||
Federal net operating loss | $ | — | $ | — | ||||||
Foreign net operating loss | 29,729 | 3,716 | n/a | |||||||
Total loss carry forwards | $ | 29,729 | $ | 3,716 | ||||||
Tax credit carry forwards: | ||||||||||
Research tax credits | n/a | $ | 11,061 | 2020 to 2035 | ||||||
Foreign tax credits | n/a | 24,913 | 2020 to 2025 | |||||||
State research tax credits | n/a | 2,299 | 2022 to 2030 | |||||||
Total credit carry forwards | n/a | $ | 38,273 | |||||||
_______________________________________________
This tables includes $84.9 million (tax benefit of $30.3 million) related to excess tax benefits which are not included in deferred tax assets on the consolidated balance sheet and are not recognized until the deduction reduces taxes payable (see below).
Significant components of the Company's net deferred tax assets and liabilities are as follows (in thousands):
December 31, | ||||||||
2015 | 2014 | |||||||
Deferred tax asset: | ||||||||
Net operating loss carry forwards | $ | 3,716 | $ | 2,425 | ||||
Capitalized technology license | 3,922 | 2,146 | ||||||
Capitalized research expenditures | 10,206 | 12,227 | ||||||
Accruals and reserves | 6,675 | 3,021 | ||||||
Retirement plan | 8,062 | 3,761 | ||||||
Deferred revenue | 731 | 541 | ||||||
Tax credit carry forwards | 7,973 | 19,395 | ||||||
Stock-based compensation | 2,012 | 2,060 | ||||||
Other | 1,857 | 1,589 | ||||||
45,154 | 47,165 | |||||||
Valuation allowance | (14,483 | ) | (12,372 | ) | ||||
Deferred tax assets | 30,671 | 34,793 | ||||||
Deferred tax liability: | ||||||||
Subpart F income | (3,400 | ) | (3,400 | ) | ||||
Deferred tax liabilities | (3,400 | ) | (3,400 | ) | ||||
Net deferred tax assets | $ | 27,271 | $ | 31,393 | ||||
During 2015, the Company retained the valuation allowance that relates to UDC Ireland, U.S. foreign tax credits and New Jersey research and development credits.
During the years ended December 31, 2015, 2014 and 2013, the Company paid foreign taxes on South Korean royalty and license fee income of $9.9 million, $8.3 million and $6.6 million, respectively, which were recorded as current income tax expense. For periods prior to May 2010, the Company filed for and was granted a five year exemption on withholding tax on royalty payments received from SDC under its patent license agreement as part of a tax incentive program in South Korea. The exemption was granted in May 2005 and remained in effect until May 2010. Since then, SDC has been required to withhold tax at a rate of 16.5% upon payment of royalties and license fees to the Company.
F-32
During the year ended December 31, 2014, the Company recorded U.S. income tax expense and a corresponding deferred tax liability of $3.4 million for future recapture of the earnings for activities of UDC Ireland which currently has a deficit in earning and profits. During the year ended December 31, 2015, this amount remained $3.4 million.
Due to the Company's net operating loss position, deferred tax assets relating to tax benefits of employee stock-based compensation have been reduced related to stock options exercised and restricted stock vested for which the tax deduction exceeded the aggregate compensation expense recorded for financial reporting purposes. Although these additional tax benefits or windfalls are reflected in net operating loss carryforwards in the tax return, the additional tax benefit associated with the windfalls is not recognized until the deduction reduces taxes payable. The Company follows the “with and without” approach (excluding indirect tax effects to items such as R&D credits) described in ASC 740 Income Taxes which gives primacy to continuing operations in determining realized tax benefits. Under the with and without approach, the excess tax benefit of deductions from stock-based compensation is reflected as an increase in additional paid-in capital only if an incremental benefit is provided after considering all other tax attributes available to the Company. Accordingly, windfall tax benefits are not considered to offset current year taxable income and a benefit is not recorded in paid-in-capital if the amount of available net operating loss and tax credit carryforwards generated from continuing operations is sufficient to offset current year taxable income before considering windfall tax benefits. Given the Company's net operating loss carry forward position, no incremental benefit has been recognized in paid-in capital for such excess tax benefits.
When recognizing deferred tax assets for employee stock based awards that may be subject to limitation under IRC Section 162(m), and calculating the resulting windfall benefit, the Company prioritizes the impact of future cash compensation over stock-based compensation. Accordingly, if the anticipated cash compensation is equal to or greater than the total tax deductible annual compensation amount for a covered employee, the Company does not record a deferred tax asset associated with any stock-based compensation for that individual. As noted above, in accounting for the indirect effect of stock-based compensation on the Company's research tax credits, the Company does not set apart these credits when measuring the windfall tax benefit; instead the Company follows the practice of recognizing the full effect of research tax credits in income from continuing operations. As of December 31, 2015 and 2014, windfalls included in net operating loss carryforwards and tax credit carryforwards but not reflected in deferred tax assets totaled $84.9 million and $72.3 million, respectively.
In assessing the realizability of deferred tax assets, management considers whether it is more likely than not that some portion or all of the deferred tax assets will not be realized. The ultimate realization of deferred tax assets is dependent on the Company's ability to generate future taxable income to obtain benefit from the reversal of temporary differences, net operating loss carryforwards and tax credits. As part of its assessment management considers the scheduled reversal of deferred tax liabilities, projected future taxable income, and tax planning strategies. During the year ended December 31, 2015, based on previous earnings history, a current evaluation of expected future taxable income and other evidence, the Company retained the valuation allowance that relates to UDC Ireland, U.S. foreign tax credits and New Jersey research and development credits. The Company's valuation allowance increased by $2.1 million for the year ended December 31, 2015 and decreased by $226,000 and $57.1 million for the years ended December 31, 2014 and 2013, respectively.
The Company did not record a liability for uncertain tax positions as of December 31, 2015, 2014, and 2013, respectively. Company management does not anticipate any material change in its uncertain tax positions in the next twelve months. The Company’s federal income tax returns for 2012 through 2014 are open tax years and are subject to examination by the Internal Revenue Service. State tax years 2011 to 2015 remain open to examination by the jurisdictions (Pennsylvania and New Jersey) in which the Company is subject to tax. However, due to the Company's net operating losses, the Company's federal income tax returns for 1995 and later will remain subject to examination until the losses are utilized or expire; certain state returns remain subject to examination as well. In addition, the Company's foreign returns for 2010 and thereafter remain subject to examination.
17. | DEFINED CONTRIBUTION PLAN: |
The Company maintains the Universal Display Corporation 401(k) Plan (the Plan) in accordance with the provisions of Section 401(k) of the Internal Revenue Code (the Code). The Plan covers substantially all full-time employees of the Company. Participants may contribute up to 15% of their total compensation to the Plan, not to exceed the limit as defined in the Code, with the Company matching 50% of the participant’s contribution, limited to 6% of the participant’s total compensation. For the years ended December 31, 2015, 2014 and 2013, the Company contributed $348,000, $320,000 and $290,000, respectively, to the Plan.
18. | QUARTERLY SUPPLEMENTAL FINANCIAL DATA (UNAUDITED): |
The following tables present certain unaudited consolidated quarterly financial information for each of the eight quarters in the two-year period ended December 31, 2015. In the opinion of Company management, this quarterly information has been prepared on the same basis as the consolidated financial statements and includes all adjustments (consisting of only normal recurring adjustments) necessary to present fairly the information for the periods presented. The results of operations for any quarter are not necessarily indicative of the results for the full year or for any future period.
Presented below is a summary of the unaudited quarterly financial information for the year ended December 31, 2015 (in thousands, except per share data):
Three Months Ended | ||||||||||||||||||||
March 31, 2015 | June 30, 2015 (1) | September 30, 2015 | December 31, 2015 (1) | Total | ||||||||||||||||
Revenue | $ | 31,223 | $ | 58,092 | $ | 39,419 | $ | 62,312 | $ | 191,046 | ||||||||||
Net income (loss) | $ | 1,314 | $ | (11,771 | ) | (2) | $ | 7,047 | $ | 18,088 | $ | 14,678 | ||||||||
Net income (loss) per common share: | ||||||||||||||||||||
Basic | $ | 0.03 | $ | (0.25 | ) | $ | 0.15 | $ | 0.39 | $ | 0.31 | |||||||||
Diluted | $ | 0.03 | $ | (0.25 | ) | $ | 0.15 | $ | 0.39 | $ | 0.31 | |||||||||
_______________________________________________
(1) The Company receives significant license revenue in the second and fourth quarters; see Note 2 for further details.
(2) Includes a $33.0 million write down of inventory; see Note 4 for further details.
Presented below is a summary of the unaudited quarterly financial information for the year ended December 31, 2014 (in thousands, except per share data):
Three Months Ended | ||||||||||||||||||||
March 31, 2014 | June 30, 2014 (1) | September 30, 2014 | December 31, 2014 (1) | Total | ||||||||||||||||
Revenue | $ | 37,839 | $ | 64,127 | $ | 32,892 | $ | 56,173 | $ | 191,031 | ||||||||||
Net income | $ | 4,022 | $ | 20,422 | $ | 4,284 | $ | 13,126 | $ | 41,854 | ||||||||||
Net income per common share: | ||||||||||||||||||||
Basic | $ | 0.09 | $ | 0.44 | $ | 0.09 | $ | 0.29 | $ | 0.90 | ||||||||||
Diluted | $ | 0.09 | $ | 0.44 | $ | 0.09 | $ | 0.28 | $ | 0.90 | ||||||||||
_______________________________________________
(1) The Company receives significant license revenue in the second and fourth quarters; see Note 2 for further details.
Per share amounts for each quarter have been calculated separately. Accordingly, quarterly amounts may not add to annual amounts.
F-33