Attached files
| file | filename |
|---|---|
| 8-K - SWN FORM 8-K - SOUTHWESTERN ENERGY CO | swn022516form8k.htm |

NEWS RELEASE
SOUTHWESTERN ENERGY ANNOUNCES 2015 FINANCIAL
AND OPERATING RESULTS
Houston, Texas – February 25, 2016...Southwestern Energy Company (NYSE: SWN) today announced its financial and operating results for the fourth quarter and the year ended December 31, 2015. Calendar year 2015 highlights include:
| · | Net cash provided by operating activities before changes in operating assets and liabilities (a non-GAAP measure reconciled below) of approximately $1.5 billion; |
| · | Approximately $1.9 billion of unused capacity on unsecured credit facility at year-end 2015 with no near-term debt maturities; |
| · | Adjusted net income attributable to common stock (a non-GAAP measure reconciled below) was $71 million, or $0.19 per diluted share, when excluding a non-cash ceiling test impairment of natural gas and oil properties and certain other items; |
| · | Record natural gas and oil production of 976 Bcfe, up 27% compared to 2014; this includes organic growth of 9% when excluding the impacts of acquisitions announced in the fourth quarter of 2014; |
| · | Significant production growth driven by the Company’s Appalachia acreage, where Northeast Appalachia production volumes grew by 42% and the newly acquired acreage in Southwest Appalachia produced 143 Bcfe in its first year in the portfolio; |
| · | Upward proved reserves performance revisions of 1.4 Tcfe and 0.2 Tcfe in Northeast Appalachia and Southwest Appalachia, respectively, reflecting lower costs and higher ultimate well recoveries; |
| · | Finding and Development costs (a non-GAAP measure computed below) for the total company and Northeast Appalachia of $0.61 per Mcfe and $0.29 per Mcfe, respectively, including performance revisions but excluding price revisions, acquisitions and the impacts from the use of different accounting methods; and |
| · | Integration of acquired West Virginia and southwest Pennsylvania asset with well productivity, well costs and economic takeaway capacity outperforming expectations. |
“Our results in the fourth quarter and for the full year 2015 reflect our ability to maneuver through the challenging market conditions facing our entire industry. They also demonstrate the actions we are taking to proactively address the challenges of the current environment to position our company for future success,” remarked Bill Way, President and Chief Executive Officer of Southwestern Energy.
“We remained flexible throughout 2015 and, accordingly, we reduced activity to align with market realities and focused on maintaining a strong liquidity position,” Way added. “We will continue to optimize our performance by focusing on our core assets and operating efficiently, while we take appropriate actions to position Southwestern to outperform when the pricing environment improves.”
The Company’s emphasis on capital efficiency was exhibited in 2015 as a higher percentage of the capital program was invested in the higher return Appalachian Basin. Production in Northeast Appalachia grew
by 42% and the newly acquired acreage in Southwest Appalachia produced 143 Bcfe in its first year in the Company’s portfolio.
Fourth Quarter of 2015 Financial Results
For the fourth quarter of 2015, Southwestern reported an adjusted net loss attributable to common stock of $6 million, or $0.02 per share (reconciled below), when excluding a non-cash ceiling test impairment of natural gas and oil properties of $2.6 billion ($1.6 billion net of taxes) and certain other items typically excluded by the investment community in published estimates, which in aggregate decreased net income by $2.1 billion or $5.56 per share (diluted). Including these items, the net loss attributable to common stock for the fourth quarter of 2015 was $2.1 billion, or $5.58 per share. For the fourth quarter of 2014, Southwestern reported adjusted net income attributable to common stock of $185 million, or $0.52 per diluted share (reconciled below), when excluding a $138 million ($84 million net of taxes) gain on derivative contracts that have not been settled, discrete income tax adjustments totaling $46 million and $5 million ($3 million net of taxes) of certain transaction costs associated with the West Virginia and southwest Pennsylvania acquisition closed in the fourth quarter of 2014. Including these items, net income for the fourth quarter of 2014 was $312 million, or $0.88 per diluted share.
Net cash provided by operating activities before changes in operating assets and liabilities (reconciled below) was $306 million for the fourth quarter of 2015, compared to $570 million for the same period in 2014. On a GAAP basis, net cash provided by operating activities was $353 million for the fourth quarter of 2015, compared to $561 million in the fourth quarter of 2014.
The fourth quarter of 2014 included the operating results from the Company’s gathering system in northeast Pennsylvania and its conventional E&P assets in East Texas and the Arkoma basin which were divested during the second quarter of 2015. See “Divestitures” below for additional information.
E&P Segment – The operating loss from the Company’s E&P segment was $64 million for the fourth quarter of 2015 (reconciled below), when excluding the non-cash impairment and gain on sale of assets, compared to operating income of $196 million for the same period in 2014. The decrease was primarily due to lower realized natural gas prices and increased operating costs and expenses associated with higher production levels, partially offset by the revenue impacts of these higher production volumes. On a GAAP basis, the operating loss from the Company’s E&P segment was $2.6 billion for the fourth quarter of 2015, down from operating income of $196 million during the fourth quarter of 2014.
Net production totaled 249 Bcfe in the fourth quarter of 2015, up 24% from 201 Bcfe in the fourth quarter of 2014. The quarter included 112 Bcf from the Fayetteville Shale, 97 Bcf from Northeast Appalachia and 40 Bcfe from Southwest Appalachia. This compares to 125 Bcf from the Fayetteville Shale and 69 Bcf from Northeast Appalachia and 3 Bcfe from Southwest Appalachia in the fourth quarter of 2014.
Including the effect of hedges, Southwestern’s average realized gas price in the fourth quarter of 2015 was $2.07 per Mcf, down from $3.52 per Mcf in the fourth quarter of 2014. The Company’s commodity hedging activities increased its average realized gas price by $0.59 per Mcf during the fourth quarter of 2015, compared to an increase of $0.26 per Mcf during the same period in 2014. As of February 23, 2016, the Company had 37 Bcf of its 2016 production hedged at an average price of $2.60 per Mcf. The Company is currently looking to opportunistically add additional hedges to protect the balance sheet while minimizing the loss of any potential benefit associated with a commodity price recovery.
Similar to most producers, the Company typically sells its natural gas at a discount to NYMEX settlement prices. This discount includes basis differential, third-party transportation charges and fuel expenses. Disregarding the impact of hedges, the Company’s average price received for its gas production during the fourth quarter of 2015 was approximately $0.79 per Mcf lower than average NYMEX settlement prices, compared to approximately $0.74 per Mcf lower during the fourth quarter of 2014. As of December 31, 2015, we have attempted to mitigate the volatility of basis differentials by protecting basis on approximately 216 Bcf and 67 Bcf of our 2016 and 2017 production, respectively, and expected natural gas production through physical sales arrangements at a basis differential to NYMEX natural gas prices of approximately ($0.16) per Mcf and ($0.20) per Mcf for 2016 and 2017, respectively. Additionally, we have financial hedges in place on 5 Bcf of our 2016 production at a weighted average basis differential of $0.75 per Mcf.
Lease operating expenses per unit of production for the Company’s E&P segment were $0.91 per Mcfe in the fourth quarter of 2015, compared to $0.90 per Mcfe in the fourth quarter of 2014. The increase was primarily due to higher operating costs in Southwest Appalachia associated with liquids production.
General and administrative expenses per unit of production were $0.20 per Mcfe in the fourth quarter of 2015, compared to $0.24 per Mcfe in the fourth quarter of 2014, down primarily due to the increase in production volumes.
Taxes other than income taxes were $0.09 per Mcfe in the fourth quarter of 2015 compared to $0.10 per Mcfe for the same period of 2014. Taxes other than income taxes per Mcfe vary from period to period due to changes in severance and ad valorem taxes that result from the mix of the Company’s production volumes and fluctuations in commodity prices.
The Company’s full cost pool amortization rate decreased to $0.78 per Mcfe in the fourth quarter of 2015, down from $1.12 per Mcfe in the fourth quarter of 2014. The amortization rate is impacted by the timing and amount of reserve additions and the costs associated with those additions, revisions of previous reserve estimates due to both price and well performance, write-downs that result from full cost ceiling tests, proceeds from the sale of properties that reduce the full cost pool and the levels of costs subject to amortization. The Company cannot predict its future full cost pool amortization rate with accuracy due to the variability of each of the factors discussed above, as well as other factors.
Midstream Services – Operating income for the Company’s Midstream Services segment, which is comprised of gathering and marketing activities, was $72 million for the fourth quarter of 2015, down 19% from $89 million for the same period in 2014. The decrease in operating income was largely due to a decrease in volumes gathered resulting from lower production volumes in the Fayetteville Shale and the sale of the Company’s northeast Pennsylvania gathering assets. At December 31, 2015, the Company’s midstream segment was gathering approximately 1.9 Bcf per day through 2,044 miles of gathering lines in the Fayetteville Shale.
Full-Year 2015 Financial Results
For 2015, Southwestern reported adjusted net income attributable to common stock, which includes a $13 million impact from a theoretical income allocation to preferred stock, of $71 million, or $0.19 per diluted share (reconciled below), when excluding a non-cash ceiling test impairment of natural gas and oil properties of $7.0 billion ($4.3 billion net of taxes) and certain other items typically excluded by the investment community in published estimates, which in aggregate decreased net income by $4.7 billion, or $12.47 per share (diluted). Including these items, the net loss attributable to common stock for 2015 was
$4.7 billion, or $12.25 per diluted share. For 2014, Southwestern reported adjusted net income attributable to common stock of $801 million, or $2.27 per diluted share (reconciled below), when excluding a $131 million ($80 million net of taxes) gain on derivative contracts that have not been settled, discrete income tax adjustments totaling $46 million and $5 million ($3 million net of taxes) of certain transaction costs associated with the West Virginia and southwest Pennsylvania acquisition closed in the fourth quarter of 2014. Including these items, net income for 2014 was $924 million, or $2.62 per diluted share.
Net cash provided by operating activities before changes in operating assets and liabilities (reconciled below) was $1.5 billion for 2015, compared to $2.3 billion in 2014. On a GAAP basis, net cash provided by operating activities was $1.6 billion for 2015, compared to $2.3 billion for 2014.
E&P Segment – The operating loss from Southwestern’s E&P segment was $159 million for 2015 (reconciled below), when excluding the non-cash impairment, gain on sale of assets and restructuring costs, compared to operating income of $1,013 million for 2014. The decrease was primarily due to lower realized natural gas prices and increased operating costs and expenses from higher activity levels, partially offset by the revenue impacts of higher production volumes. On a GAAP basis, the operating loss from the Company’s E&P segment was $7.1 billion for 2015, down from operating income of $1.0 billion during 2014.
Net production totaled 976 Bcfe in 2015, up 27% from 768 Bcfe in 2014, and included 465 Bcf from the Fayetteville Shale, 360 Bcf from Northeast Appalachia and 143 Bcfe from Southwest Appalachia. This compares to 494 Bcf from the Fayetteville Shale, 254 Bcf from Northeast Appalachia and 3 Bcfe from Southwest Appalachia in 2014.
Including the effect of hedges, Southwestern’s average realized gas price in 2015 was $2.37 per Mcf, down from $3.72 per Mcf in 2014. The Company’s commodity hedging activities increased its average realized gas price by $0.46 per Mcf during 2015, compared to a decrease of $0.02 per Mcf during 2014. Disregarding the impact of hedges, the average price received for the Company’s gas production during 2015 was approximately $0.75 per Mcf lower than average monthly NYMEX settlement prices, compared to approximately $0.67 per Mcf during 2014.
Lease operating expenses per unit of production for the Company’s E&P segment were $0.92 per Mcfe in 2015, compared to $0.91 per Mcfe in 2014. The increase was primarily due to higher operating costs in Southwest Appalachia associated with liquids production.
General and administrative expenses per unit of production were $0.21 per Mcfe in 2015, compared to $0.24 per Mcfe in 2014, down primarily due to the increase in production volumes.
Taxes other than income taxes were $0.10 per Mcfe during 2015, compared to $0.11 per Mcfe in 2014.
The Company’s full cost pool amortization rate decreased to $1.00 per Mcfe in 2015, compared to $1.10 per Mcfe in 2014.
Midstream Services – Operating income, excluding the gain on sale of assets divested, for the Company’s Midstream Services segment was $306 million for 2015, down 15% from $361 million for 2014 (reconciled below). The decrease in operating income was largely due to a decrease in volumes gathered resulting from lower production volumes in the Fayetteville Shale and the sale of the Company’s northeast Pennsylvania
gathering assets. On a GAAP basis, operating income for the Midstream Services segment was $583 million for 2015, compared to $361 million for 2014.
Capital Structure and Investments – At December 31, 2015, Southwestern had approximately $4.7 billion in long-term debt, including $116 million borrowed on its revolving credit facility, which is unsecured and matures in December 2018. At December 31, 2015, the Company had strong liquidity with almost $1.9 billion available capacity, no significant debt maturities prior to 2018 and an operating plan that aligns the Company’s capital investment program with the cash flows generated from its operations. The Company’s long-term debt ratings are BB+ by Standard and Poor’s, B1 by Moody’s and BBB- by Fitch. These ratings result in current interest rates under the revolving credit facility and the $750 million term loan of 2.00% and 1.625% over LIBOR, respectively.
During 2015, excluding the $609 million of acquisition costs and post-closing adjustments for the Appalachia transactions that closed in December 2014 and January 2015, Southwestern invested a total of $1.8 billion. This included approximately $1.8 billion invested in its E&P business, $58 million invested in its Midstream Services segment and $12 million invested for corporate and other purposes. The Company exhibited flexibility in twice adjusting its capital investment levels in 2015 to align with the decreasing commodity prices, lowering capital investments by 30% from its original 2015 plan.
Divestitures
The Company divested its gathering system in northeast Pennsylvania and its conventional E&P assets in East Texas and the Arkoma basin in the second quarter of 2015.
The northeast Pennsylvania gathering system generated operating income of $13 million in 2015, compared to operating income of $8 million and $35 million for the three and twelve months ended December 31, 2014. For 2015, this gathering system generated net cash provided by operating activities of $15 million. For the three and twelve months ended December 31, 2014, this gathering system generated net cash provided by operating activities of approximately $10 million and $42 million, respectively.
The conventional E&P assets in East Texas and the Arkoma basin had production of 6 Bcfe during 2015. This compares to 4 Bcfe and 15 Bcfe for the three and twelve months ended December 31, 2014, respectively. These assets generated operating income of $3 million and $27 million for the three and twelve months ended December 31, 2014, respectively.
2015 Natural Gas and Oil Reserves and Operational Review
Southwestern’s estimated proved natural gas and oil reserves totaled approximately 6,215 Bcfe at December 31, 2015, compared to 10,747 Bcfe at the end of 2014. The decrease in the Company’s reserves in 2015 was primarily due to downward price revisions in its proved undeveloped reserves associated with decreased commodity prices, partially offset by upward performance revisions in Northeast Appalachia and Southwest Appalachia and the Company’s successful development programs in the Northeast Appalachia, Southwest Appalachia and the Fayetteville Shale. The average prices utilized to value the Company’s estimated proved natural gas and oil reserves at December 31, 2015 were $2.59 per MMBtu for natural gas, $46.79 per barrel for oil and $6.82 per barrel for NGLs, compared to $4.35 per MMBtu for natural gas, $91.48 per barrel for oil and $23.79 per barrel for NGLs at December 31, 2014. Approximately 95% of the Company’s estimated proved reserves were natural gas and 93% were classified as proved developed at year-end 2015, compared to 91% and 55%, respectively, at year-end 2014.
The following table details additional information relating to reserve estimates as of and for the year ended December 31, 2015:
| Natural Gas | Oil | NGL | Total | ||||
| (Bcf) | (MBbls) | (MBbls) | (Bcfe) | ||||
| Proved reserves, beginning of year | 9,809 | 37,615 | 118,699 | 10,747 | |||
| Revisions of previous estimates | (3,458) | (28,394) | (75,664) | (4,083) | |||
| Extensions, discoveries and other additions | 546 | 1,367 | 6,274 | 592 | |||
| Production | (899) | (2,265) | (10,702) | (976) | |||
| Acquisition of reserves in place | 97 | 525 | 2,340 | 114 | |||
| Disposition of reserves in place | (178) | (95) | – | (179) | |||
| Proved reserves, end of year | 5,917 | 8,753 | 40,947 | 6,215 | |||
| Proved developed reserves: | |||||||
| Beginning of year | 5,675 | 7,445 | 38,632 | 5,951 | |||
| End of year | 5,474 | 8,753 | 40,947 | 5,772 |
Note: Figures may not add due to rounding
In 2015, the Company’s reserve replacement ratio was negatively affected by net downward revisions of 4,083 Bcfe primarily as a result of the depressed commodity price environment. The Company’s production volumes were partially offset with 592 Bcfe of proved reserve additions and 114 Bcfe of proved reserve additions as a result of acquisitions. Of the reserve additions, 416 Bcfe were proved developed and 176 Bcfe were proved undeveloped. In 2015, downward reserve revisions resulting from lower natural gas, oil and NGL prices totaled 2,315 Bcf, 1,875 Bcfe, 1,496 Bcf and 32 Bcfe in our Northeast Appalachia, Southwest Appalachia, Fayetteville Shale and other divisions, respectively. Southwestern also had upward performance revisions in 2015 of 1,383 Bcf, 209 Bcfe, 10 Bcf and 33 Bcfe in its Northeast Appalachia, Southwest Appalachia, Fayetteville Shale and other divisions, respectively. Additionally, our reserves decreased by 179 Bcfe as a result of our sale of natural gas and oil leases and wells in 2015. Excluding price revisions, 240% of the Company’s production volumes were replaced with proved reserve additions, acquisitions and performance revisions. For the period ending December 31, 2015, the Company’s three-year average reserve replacement ratio, including revisions and acquisitions, was 199%. Excluding reserve revisions and acquisitions, the Company’s three-year average reserve replacement ratio was 232%.
The Company’s 2015 and three-year average finding and development costs, including performance revisions, were $0.61 and $0.62 per Mcfe, respectively, when excluding price revisions, acquisitions and the impact of capitalizing interest and portions of G&A costs in accordance with the full cost method of accounting (a non-GAAP financial measure computed below). Including price revisions, acquisitions and the impact of capitalizing interest and portions of G&A costs in accordance with the full cost method of accounting, the Company’s three-year average finding and development costs for the period ending December 31, 2015 was $2.40 per Mcfe.
The following table provides an overall and by category summary of the Company’s natural gas, oil and NGL reserves as of December 31, 2015 and sets forth 2015 annual information related to production and capital investments for each of its operating areas:
| 2015 PROVED RESERVES BY CATEGORY AND SUMMARY OPERATING DATA
| ||||||||||||||
| Appalachia | ||||||||||||||
| Northeast | Southwest | Fayetteville Shale | Other (1) | Total | ||||||||||
| Estimated Proved Reserves: | ||||||||||||||
| Natural Gas (Bcf): | ||||||||||||||
| Developed (Bcf) | 2,005 | 311 | 3,156 | 2 | 5,474 | |||||||||
| Undeveloped (Bcf) | 314 | 4 | 125 | – | 443 | |||||||||
| 2,319 | 315 | 3,281 | 2 | 5,917 | ||||||||||
| Crude Oil (MMBbls): | ||||||||||||||
| Developed (MMBbls) | – | 8.5 | – | 0.3 | 8.8 | |||||||||
| Undeveloped (MMBbls) | – | – | – | – | – | |||||||||
| – | 8.5 | – | 0.3 | 8.8 | ||||||||||
| Natural Gas Liquids (MMBbls): | ||||||||||||||
| Developed (MMBbls) | – | 40.9 | – | – | 40.9 | |||||||||
| Undeveloped (MMBbls) | – | – | – | – | – | |||||||||
| – | 40.9 | – | – | 40.9 | ||||||||||
| Total Proved Reserves (Bcfe)(2): | ||||||||||||||
| Developed (Bcfe) | 2,005 | 607 | 3,156 | 4 | 5,772 | |||||||||
| Undeveloped (Bcfe) |
| 314 |
|
| 4 |
|
| 125 |
|
| – |
|
| 443 |
| 2,319 | 611 | 3,281 | 4 | 6,215 | ||||||||||
| Percent of Total | 37% | 10% | 53% | 0% | 100% | |||||||||
| Percent Proved Developed | 86% | 99% | 96% | 100% | 93% | |||||||||
| Percent Proved Undeveloped | 14% | 1% | 4% | 0% | 7% | |||||||||
| Production (Bcfe) | 360 | 143 | 465 | 8 | 976 | |||||||||
| Capital Investments (millions)(3) | $ | 710 | $ | 857 | $ | 565 | $ | 105 | $ | 2,237 | ||||
| Total Gross Producing Wells(4) | 774 | 1,085 | 4,268 | 20 | 6,147 | |||||||||
| Total Net Producing Wells(4) | 407 | 859 | 2,971 | 17 | 4,254 | |||||||||
| Total Net Acreage | 270,335 | (5) | 425,098 | (6) | 957,641 | (7) | 3,673,853 | (8) | 5,326,927 | |||||
| Net Undeveloped Acreage | 168,753 | (5) | 193,582 | (6) | 288,569 | (7) | 3,661,375 | (8) | 4,312,279 | |||||
| PV-10: | ||||||||||||||
| Pre-Tax (millions)(9) | $ | 707 | $ | 115 | $ | 1,604 | $ | (9) | $ | 2,417 | ||||
| PV of Taxes (millions)(9) | – | – | – | – | – | |||||||||
| After-Tax (millions)(9) | $ | 707 | $ | 115 | $ | 1,604 | $ | (9) | $ | 2,417 | ||||
| Percent of Total | 29% | 5% | 66% | 0% | 100% | |||||||||
| Percent Operated(10) | 98% | 95% | 99% | 100% | 98% | |||||||||
| (1) | Other includes New Ventures and the production from Southwestern’s Ark-La-Tex properties divested in May 2015.
|
| (2) | There are no reserves from synthetic gas, synthetic oil or nonrenewable natural resources intended to be upgraded into synthetic gas or oil. The Company used standard engineering and geoscience methods, or a combination of methodologies in determining estimates of material properties, including performance and test date analysis offset statistical analogy of performance data, volumetric evaluation, including analysis of petrophysical parameters (including porosity, net pay, fluid saturations (i.e., water, oil and gas) and permeability) in combination |
| with estimated reservoir parameters (including reservoir temperature and pressure, formation depth and formation volume factors), geological analysis, including structure and isopach maps and seismic analysis, including review of 2-D and 3-D data to ascertain faults, closure and other factors.
|
| (3) | The Total and Fayetteville Shale capital investments exclude $21 million related to the Company’s drilling rig related equipment, sand facility and other equipment.
|
| (4) | Represents all producing wells, including wells in which the Company only has an overriding royalty interest, as of December 31, 2015.
|
| (5) | Assuming successful wells are not drilled to develop the acreage and leases are not extended, leasehold expiring over the next three years will be 30,172 net acres in 2016, 57,724 net acres in 2017 and 12,891 net acres in 2018.
|
| (6) | Assuming successful wells are not drilled to develop the acreage and leases are not extended leasehold expiring over the next three years will be 36,934 net acres in 2016, 42,034 net acres in 2017 and 12,604 net acres in 2018. Of this acreage, 16,160 net acres in 2016, 15,262 net acres in 2017 and 1,990 net acres in 2018 can be extended for an average of an additional 4.8 years.
|
| (7) | The Fayetteville Shale acreage includes 31,413 net undeveloped acres and 170,743 net developed acres in the Arkoma Basin that have previously been reported as a component of conventional Arkoma acreage. Assuming successful wells are not drilled to develop the acreage and leases are not extended, leasehold expiring over the next three years will be 164 net acres in 2016, 453 net acres in 2017 and 31 net acres in 2018 (excluding 158,231 net acres held on federal lands which are currently suspended by the Bureau of Land Management).
|
| (8) | Assuming successful wells are not drilled to develop the acreage and leases are not extended, the Company’s leasehold expiring over the next three years, excluding New Brunswick, Canada, the Lower Smackover Brown Dense area and the Sand Wash Basin, will be 255,527 net acres in 2016, 217,927 net acres in 2017 and 23,086 net acres in 2018. With regard to the Company’s acreage in New Brunswick, Canada, exploration licenses were extended through 2021. With regard to acreage in the Lower Smackover Brown Dense, assuming successful wells are not drilled and leases are not extended, leasehold expiring over the next three years will be 58,849 net acres in 2016, 68,790 net acres in 2017 and 67,528 net acres in 2018. With regard to acreage in the Sand Wash Basin, assuming successful wells are not drilled and leases are not extended, leasehold expiring over the next three years will be 85,767 net acres in 2016, 35,883 net acres in 2017, and 55,918 net acres in 2018.
|
| (9) | Pre-tax PV-10 (a non-GAAP measure) is one measure of the value of a Company’s proved reserves that the Company believes is used by securities analysts to compare relative values among peer companies without regard to income taxes. The reconciling difference in pre-tax PV-10 and the after-tax PV-10, or standardized measure, is the discounted value of future income taxes on the estimated cash flows from the Company’s proved natural gas, oil and NGL reserves.
|
| (10) | Based upon pre-tax PV-10 of proved developed producing activities. |
During 2015, Southwestern invested a total of $1.8 billion in its E&P business, excluding acquisition costs and post-closing adjustments for the Appalachia transactions that closed in December 2014 and January 2015 of $609 million, which included $500 million related to the Company’s E&P business and $109 million to Midstream Services. The Company participated in drilling 576 wells, placed 430 wells to sales, and had 203 wells which were in progress at year-end. Of the 203 wells in progress at year-end, 83, 43 and 77 were located in its Northeast Appalachia, Southwest Appalachia and Fayetteville Shale, respectively. Of the $1.8 billion invested in the Company’s E&P business in 2015, $547 million was invested in Northeast Appalachia, $520 million in Southwest Appalachia, $565 million in the Fayetteville Shale, $102 million in New Ventures and $21 million in E&P services.
Excluding the acquisitions announced in the fourth quarter of 2014, of the $1.8 billion invested in 2015, $1.2 billion was invested in exploratory and development drilling and workovers, $390 million in capitalized interest and other expenses, $107 million for acquisition of properties, and $6 million for seismic expenditures. Additionally, the Company invested $21 million in its drilling rig related equipment, sand facility and other equipment.
Northeast Appalachia – In 2015, Southwestern invested $710 million in Northeast Appalachia, which included $472 million to spud 89 operated wells and acquire 86 horizontal and 2 vertical wells. Total capital investments in Northeast Appalachia during 2015 also included $172 million for the acquisition of properties and $66 million in facilities, capitalized costs and other expenses.
Southwestern’s net gas production from Northeast Appalachia was 360 Bcf in 2015, up 42% from 254 Bcf in 2014. Gross operated production in Northeast Appalachia was 1,302 MMcf per day at the end of 2015 compared to approximately 1,020 MMcf per day at the end of 2014.
Total proved reserves in Northeast Appalachia were 2,319 Bcf as of December 31, 2015, compared to 3,192 Bcf at year-end 2014. The net decrease in reserves included downward price revisions of 2,315 Bcf and production of 360 Bcf, partially offset by upward reserve revisions due to well performance of 1,383 Bcf, reserve additions of 340 Bcf and acquisitions of 79 Bcf. The average gross proved reserves for the 36 undeveloped locations included in the Company’s 2015 year-end reserves was approximately 10.4 Bcf per well, compared to 9.6 Bcf per well for the 200 undeveloped locations as of December 2014.
In the fourth quarter of 2015, the average 30th-day rate was 5,601 Mcf per day on 33 wells that had an average lateral length of 5,429 feet and an average cost of $4.9 million per well. This compares to an average 30th-day rate of 5,720 Mcf per day on 19 wells that had an average lateral length of 5,512 feet and an average cost of $5.5 million per well in the third quarter of 2015. In 2015, for wells online with a 30th-day rate, Southwestern’s operated horizontal wells had an average completed well cost of $5.6 million per well and an average horizontal lateral length of 5,384 feet. This compares to an average completed operated well cost of $6.1 million per well and an average horizontal lateral length of 4,752 feet in 2014.
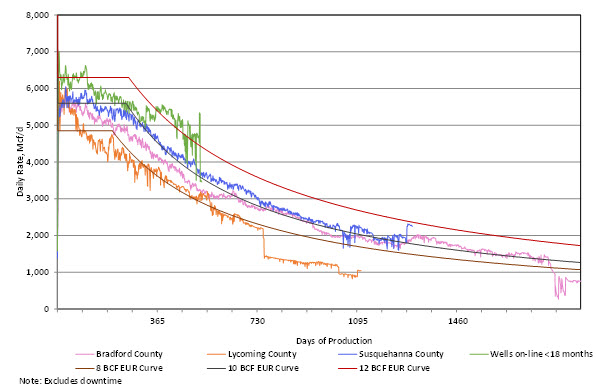
As of December 31, 2015, Southwestern had spud or acquired 553 operated wells, of which 423 were horizontal and on production and 83 were in progress. Of the 423 operated horizontal wells on production, 139 were located in Bradford County, 25 were located in Lycoming County and 259 were located in Susquehanna County. Of the 83 wells in progress, 35 were either waiting on completion or waiting to be placed to sales, including 25 in Susquehanna County, 6 in Bradford County and 4 wells in Sullivan, Tioga and Wyoming Counties, combined.
The graph below provides normalized average daily production data through December 31, 2015, for the horizontal wells drilled by the Company in Northeast Appalachia. The “pink curve” summarizes results for 139 wells in Bradford County, the “blue curve” reflects results for 259 wells in Susquehanna County, the “orange curve” shows the results for 25 wells in Lycoming County and the “green curve” averages the results for the 146 wells that have been put on production within the last 18 months. As a reminder, the pressure drawdown in the reservoir, hence the production rates from all of the wells in Northeast Appalachia, are managed to maximize the ultimate recovery from the wells. The impact of this program is exhibited in all of the curves with the relatively flat production for the first 365 days before the wells begin normal declines. Furthermore, the Company continues to improve its completion design, and the performance history from the most recent wells is beginning to reflect these improvements. The normalized production curves are intended to provide a qualitative indication of the Company’s Northeast Appalachia wells’ performance and should not be used to estimate an individual well’s estimated ultimate recovery. The 8, 10 and 12 Bcf type curves are shown solely for reference purposes and are not intended to be projections of the performance of the Company’s wells.
At December 31, 2015, Southwestern held leases for approximately 270,335 net acres in Northeast Appalachia, compared to approximately 266,073 net acres at year-end 2014.
Southwest Appalachia – In 2015, Southwestern invested $857 million in Southwest Appalachia, which included $248 million to spud 48 operated wells. Total capital investments in Southwest Appalachia during 2015 also included $409 million for the acquisition of properties and $200 million in capitalized costs and other expenses. Net production from Southwest Appalachia was 143 Bcfe in 2015.
Total proved reserves in Southwest Appalachia were 611 Bcfe at year-end 2015, compared to 2,297 Bcfe in 2014. The net decrease in reserves included downward price revisions of 1,875 Bcfe and production of 143 Bcfe, partially offset by upward reserve revisions due to well performance of 209 Bcfe, reserve additions of 88 Bcfe and acquisitions of 35 Bcfe.
In 2015, the Company drilled 48 wells, with an average lateral length of 6,544 feet and average time to drill to total depth of 17.6 days from re-entry to re-entry. Additionally, Southwestern placed 47 wells on production. The Company again achieved better results by drilling in a tighter target interval, enhancing the completion design and utilizing pressure drawdown management.
For example, the Company placed 4 horizontal wells on production in Wetzel County where the average estimated ultimate recovery per 1,000 lateral feet was 2.9 Bcfe, or 95% higher than the offset wells drilled and completed by the previous operator, when normalized for lateral length. Another example is the Alice Edge pad, where 9 wells were brought online during the fourth quarter. These wells combined for over 86,000 feet of completed lateral length and exhibited very strong performance with the pad having a peak rate of almost 50 million cubic feet per day of gas production and over 5 thousand barrels per day of condensate production. Results from all of the wells brought online are shown in the table below.
| Time Frame | Wells Placed on Production | Average Lateral Length | Avg Rate | 30th-Day | Avg Rate | 60th-Day |
| 2nd Qtr 2015 | 10 | 5,399 | 6,428 (10) | 51 / 13 / 36 | 6,246 (10) | 52 / 11 / 37 |
| 3rd Qtr 2015 | 5 | 5,898 | 6,703 (5) | 37 / 18 / 45 | 7,038 (5) | 38 / 15 / 47 |
| 4th Qtr 2015 | 19 | 7,833 | 6,810 (19) | 39 / 20 / 41 | 7,864 (15) | 41 / 18 / 41 |
In the fourth quarter of 2015, the Company drilled its first Utica well, the O. E. Burge located in Marshall County, West Virginia. Despite operational challenges being faced similar to other Utica wells in the area, the Company was able to drill the well to its targeted 8,000 feet of lateral length and stayed in the target interval 100% of the time. The Company is encouraged by the data observed during drilling and will report updates as they occur.
The Company had a total of 318 horizontal and 676 vertical wells that the Company operated and that were on production as of December 31, 2015. Additionally, there were 43 horizontal wells in progress at the end of 2015, of which 21 were waiting on pipeline or production facilities.
At December 31, 2015, Southwestern held leases for approximately 425,098 net acres in Southwest Appalachia, compared to approximately 413,376 net acres at year-end 2014.
Fayetteville Shale – In 2015, Southwestern invested $565 million in the Fayetteville Shale, which included $481 million to spud 155 wells, all of which were operated. Total capital investments in the Fayetteville Shale during 2015 also included $4 million for the acquisition of properties and $80 million in capitalized costs and other expenses.
Southwestern’s net gas production from the Fayetteville Shale was 465 Bcf in 2015, compared to 494 Bcf in 2014. Gross operated gas production in the Fayetteville Shale was approximately 1,759 MMcf per day at the end of 2015 compared to approximately 2,132 MMcf per day at the end of 2014.
Total proved reserves in the Fayetteville Shale were 3,281 Bcf at year-end 2015, compared to 5,069 Bcf in 2014. The net decrease in reserves included downward price revisions of 1,496 Bcf and production of 465 Bcf, partially offset by reserve additions of 163 Bcf and positive revisions of 10 Bcf due to well performance. A total of 61 undeveloped locations were included in the 2015 year-end reserves at approximately 3.0 Bcf per well, compared to the 1,213 undeveloped locations at approximately 2.3 Bcf per well booked as of December 2014.
Southwestern’s operated horizontal wells had an average completed well cost of $2.8 million per well, average horizontal lateral length of 5,729 feet and average time to drill to total depth of 7.3 days from re-entry to re-entry in 2015. This compares to an average completed operated well cost of $2.6 million per well, average horizontal lateral length of 5,440 feet and average time to drill to total depth of 6.8 days from re-entry to re-entry in 2014. Southwestern placed 261 operated wells on production during 2015 with average initial production rates of 4,280 Mcf per day, compared to 454 operated wells with average initial production rates of 4,430 Mcf per day in 2014.
During the fourth quarter of 2015, the Company’s horizontal wells had an average initial production rate of 4,277 Mcf per day, average completed well cost of $2.8 million per well, average horizontal lateral length of 5,526 feet and average time to drill to total depth of 8.3 days from re-entry to re-entry. This compares to an average initial production rate of 3,886 Mcf per day, an average horizontal lateral length of 5,407 feet, average time to drill to total depth of 6.9 days from re-entry to re-entry and an average completed well cost of $2.7 million per well in the third quarter of 2015.
At December 31, 2015, Southwestern held leases for approximately 957,641 net acres in the Fayetteville Shale area, compared to approximately 888,161 net acres at year-end 2014. Certain acreage previously reported as a component of Southwestern’s conventional Arkoma Basin has been included in the unconventional net acreage for the Fayetteville Shale at December 31, 2015 reflecting the Company’s current drilling focus.
Explanation and Reconciliation of Non-GAAP Financial Measures
The Company reports its financial results in accordance with accounting principles generally accepted in the United States of America (“GAAP”). However, management believes certain non-GAAP performance measures may provide financial statement users with additional meaningful comparisons between current results and the results of its peers and of prior periods. These non-GAAP performance measures often exclude items typically excluded by the investment community in published estimates to improve comparability.
One such non-GAAP financial measure is net cash provided by operating activities before changes in operating assets and liabilities. Management presents this measure because (i) it is accepted as an indicator of an oil and gas exploration and production Company’s ability to internally fund exploration and development activities and to service or incur additional debt, (ii) changes in operating assets and liabilities relate to the timing of cash receipts and disbursements which the Company may not control and (iii) changes in operating assets and liabilities may not relate to the period in which the operating activities occurred.
Additional non-GAAP financial measures the Company may present from time to time are adjusted net income, adjusted diluted earnings per share, adjusted EBITDA and its E&P and Midstream segment operating income, all which exclude certain charges or amounts. Management presents these measures because (i) they are consistent with the manner in which the Company’s performance is measured relative to the performance of its peers, (ii) these measures are more comparable to earnings estimates provided by securities analysts, and (iii) charges or amounts excluded cannot be reasonably estimated and guidance provided by the Company excludes information regarding these types of items. These adjusted amounts are not a measure of financial performance under GAAP.
See the reconciliations below of GAAP financial measures to non-GAAP financial measures for the three and twelve months ended December 31, 2015 and December 31, 2014. Non-GAAP financial measures should not be considered in isolation or as a substitute for the Company's reported results prepared in accordance with GAAP.
|
| 3 Months Ended Dec 31, | ||||
|
| 2015 |
| 2014 | ||
|
| (in millions) | ||||
| Net income (loss) attributable to common stock: |
|
|
| ||
| Net income (loss) attributable to common stock | $ | (2,134) |
| $ | 312 |
| Add back (deduct): |
|
|
| ||
| Impairment of natural gas and oil properties (net of taxes) | 1,597 |
| – | ||
| (Gain) Loss on certain derivatives (net of taxes) | 31 |
| (84) | ||
| Adjustments due to discrete tax items(1, 2) | 483 |
| (46) | ||
| Adjustments due to inventory valuation (net of taxes) | 20 |
| – | ||
| Gain on sale of assets (net of taxes) | (4) |
| – | ||
| Transaction costs (net of taxes) | 1 |
| 3 | ||
| Adjusted net income (loss) attributable to common stock | $ | (6) |
| $ | 185 |
|
| 12 Months Ended Dec 31, | ||||
|
| 2015 |
| 2014 | ||
|
| (in millions) | ||||
| Net income (loss) attributable to common stock: |
|
|
| ||
| Net income (loss) attributable to common stock | $ | (4,662) |
| $ | 924 |
| Add back (deduct): |
|
|
| ||
| Participating securities – mandatory convertible preferred stock | (13) |
| – | ||
| Impairment of natural gas and oil properties (net of taxes) | 4,287 |
| – | ||
| (Gain) Loss on certain derivatives (net of taxes) | 96 |
| (80) | ||
| Adjustments due to discrete tax items(1, 2) | 483 |
| (46) | ||
| Adjustments due to inventory valuation (net of taxes) | 20 |
| – | ||
| Gain on sale of assets (net of taxes) | (174) |
| – | ||
| Transaction costs (net of taxes) | 33 |
| 3 | ||
| Restructuring costs (net of taxes) | 1 |
| – | ||
| Adjusted net income attributable to common stock | $ | 71 | $ | 801 | |
|
| 3 Months Ended Dec 31, | ||||
|
| 2015 |
| 2014 | ||
|
|
| ||||
| Diluted earnings per share: |
|
|
| ||
| Diluted earnings per share | $ | (5.58) |
| $ | 0.88 |
| Add back (deduct): |
|
|
| ||
| Impairment of natural gas and oil properties (net of taxes) | 4.18 |
| – | ||
| (Gain) Loss on certain derivatives (net of taxes) | 0.08 |
| (0.24) | ||
| Adjustments due to discrete tax items(1, 2) | 1.26 |
| (0.13) | ||
| Adjustments due to inventory valuation (net of taxes) | 0.05 |
| – | ||
| Gain on sale of assets (net of taxes) | (0.01) |
| – | ||
| Transaction costs (net of taxes) | 0.00 |
| 0.01 | ||
| Adjusted diluted earnings per share | $ | (0.02) | $ | 0.52 | |
|
| 12 Months Ended Dec 31, | ||||
|
| 2015 |
| 2014 | ||
|
|
| ||||
| Diluted earnings per share: |
|
|
| ||
| Diluted earnings per share | $ | (12.25) |
| $ | 2.62 |
| Add back (deduct): |
|
|
| ||
| Participating securities – mandatory convertible preferred stock | (0.03) |
| – | ||
| Impairment of natural gas and oil properties (net of taxes) | 11.27 |
| – | ||
| (Gain) Loss on certain derivatives (net of taxes) | 0.25 |
| (0.23) | ||
| Adjustments due to discrete tax items(1, 2) | 1.27 |
| (0.13) | ||
| Adjustments due to inventory valuation (net of taxes) | 0.05 |
| – | ||
| Gain on sale of assets (net of taxes) | (0.46) |
| – | ||
| Transaction costs (net of taxes) | 0.09 |
| 0.01 | ||
| Restructuring costs (net of taxes) | 0.00 |
| – | ||
| Adjusted diluted earnings per share | $ | 0.19 | $ | 2.27 | |
|
| 3 Months Ended Dec 31, | ||||
|
| 2015 |
| 2014 | ||
|
| (in millions) | ||||
| E&P segment operating income (loss): |
|
|
| ||
| E&P segment operating income (loss) | $ | (2,633) | $ | 196 | |
| Add back (deduct): |
|
|
| ||
| Impairment of natural gas and oil properties | 2,576 |
| – | ||
| Gain on sale of assets | (7) |
| – | ||
| Adjusted E&P segment operating income (loss) | $ | (64) | $ | 196 | |
|
| 12 Months Ended Dec 31, | ||||
|
| 2015 |
| 2014 | ||
|
| (in millions) | ||||
| E&P segment operating income (loss): |
|
|
| ||
| E&P segment operating income (loss) | $ | (7,104) | $ | 1,013 | |
| Add back (deduct): |
|
|
| ||
| Impairment of natural gas and oil properties | 6,950 |
| – | ||
| Gain on sale of assets | (6) |
| – | ||
| Restructuring costs | 1 |
| – | ||
| Adjusted E&P segment operating income (loss) | $ | (159) | $ | 1,013 | |
|
| 12 Months Ended Dec 31, | ||||
|
| 2015 |
| 2014 | ||
|
| (in millions) | ||||
| Midstream segment operating income: |
|
|
| ||
| Midstream segment operating income | $ | 583 | $ | 361 | |
| Add back (deduct): |
|
|
| ||
| Gain on sale of assets | (277) |
| – | ||
| Adjusted Midstream segment operating income | $ | 306 | $ | 361 | |
| 3 Months Ended Dec 31, | |||||
|
| 2015 |
| 2014 | ||
|
| (in millions) | ||||
| Cash flow from operating activities: |
|
|
| ||
| Net cash provided by operating activities | $ | 353 |
| $ | 561 |
| Add back (deduct): |
|
|
| ||
| Changes in operating assets and liabilities | (47) |
| 9 | ||
| Net cash provided by operating activities before changes in operating assets and liabilities | $ | 306 | $ | 570 | |
| 12 Months Ended Dec 31, | |||||
|
| 2015 |
| 2014 | ||
|
| (in millions) | ||||
| Cash flow from operating activities: |
|
|
| ||
| Net cash provided by operating activities | $ | 1,580 |
| $ | 2,335 |
| Add back (deduct): |
|
|
| ||
| Changes in operating assets and liabilities | (112) |
| (65) | ||
| Net cash provided by operating activities before changes in operating assets and liabilities | $ | 1,468 | $ | 2,270 | |
| (1) | 2015 primarily relates to the exclusion of certain discrete tax adjustments in the fourth quarter of 2015 due to an increase to the valuation allowance against the Company’s deferred tax assets. The Company expects its 2016 income tax rate to be 38.0%.
|
| (2) | 2014 primarily relates to the exclusion of certain discrete tax adjustment that were recognized in the fourth quarter of 2014 due to a redetermination of deferred state tax liabilities to reflect updated state apportionment factors.
|
Finding and development costs – Finding and development (F&D) costs are computed by dividing acquisition, exploration and development capital costs incurred for the indicated period by reserve additions, including reserves acquired, for that same period. At times, adjustments are made to this calculation in order to improve usefulness for investors. For example, price revisions are often excluded due to volatile commodity price changes. Another example is the adjustment made to exclude the differences between accounting methods to improve comparability. The following computes F&D costs using information required by GAAP for the periods ending December 31, 2015 and 2014 and the three years ending December 31, 2015. A breakdown is also shown detailing these amounts separately for Northeast Appalachia, Southwest Appalachia and the Fayetteville Shale.
|
|
|
|
|
|
|
|
| Total Company | ||||
|
| For the 12 Months |
| For the 12 Months |
| For the 3 Years |
|
| Ended |
| Ended |
| Ended |
|
| December 31, 2015 |
| December 31, 2014 |
| December 31, 2015 |
|
|
|
|
|
|
|
| Total exploration, development and acquisition costs incurred ($ in thousands) | $ 2,240,200 |
| $ 7,220,776 |
| $ 11,484,254 |
| Reserve extensions, discoveries and acquisitions (MMcfe) | 706,156 |
| 3,997,329 |
| 7,992,469 |
| Finding & development costs, excluding revisions ($/Mcfe) | $ 3.17 |
| $ 1.81 |
| $ 1.44 |
| Reserve extensions, discoveries, acquisitions and performance revisions (MMcfe) | 2,340,661 |
| 4,486,406 |
| 10,195,661 |
| Finding & development costs, including performance revisions ($/Mcfe) | $ 0.96 |
| $ 1.61 |
| $ 1.13 |
|
|
|
|
|
|
|
| Total exploration and development costs incurred ($ in thousands) | $ 1,739,661 |
| $ 1,944,245 |
| $ 5,611,140 |
| Reserve extensions, discoveries and performance revisions (MMcfe) | 2,226,267 |
| 2,182,361 |
| 7,773,108 |
| Finding & development costs, excluding price revisions and acquisitions ($/Mcfe) | $ 0.78 |
| $ 0.89 |
| $ 0.72 |
|
|
|
|
|
|
|
| Total exploration and development costs incurred, excluding the impact of capitalizing interest and portions of G&A ($ in thousands) | $ 1,360,910 |
| $ 1,706,956 |
| $ 4,782,801 |
| Reserve extensions, discoveries and performance revisions (MMcfe) | 2,226,267 |
| 2,182,361 |
| 7,773,108 |
| F&D costs, excluding price revisions, acquisitions and the impact of capitalizing interest and portions of G&A in accordance with full cost accounting ($/Mcfe) | $ 0.61 |
| $ 0.78 |
| $ 0.62 |
|
|
|
|
|
|
| |
|
| Northeast Appalachia | |||||
|
| For the 12 Months |
| For the 12 Months |
| For the 3 Years | |
|
| Ended |
| Ended |
| Ended | |
|
| December 31, 2015 |
| December 31, 2014 |
| December 31, 2015 | |
|
|
|
|
|
|
| |
| Total exploration, development and acquisition costs incurred ($ in thousands) | $ 701,434 |
| $ 711,647 |
| $ 2,294,078 | |
| Reserve extensions, discoveries and acquisitions (MMcfe) | 419,145 |
| 836,250 |
| 2,455,627 | |
| Finding & development costs, excluding revisions ($/Mcfe) | $ 1.67 |
| $ 0.85 |
| $ 0.93 | |
| Reserve extensions, discoveries, acquisitions and performance revisions (MMcfe) | 1,802,640 |
| 1,472,409 |
| 4,537,470 | |
| Finding & development costs, including performance revisions ($/Mcfe) | $ 0.39 |
| $ 0.48 |
| $ 0.51 | |
|
|
|
|
|
|
| |
| Total exploration and development costs incurred ($ in thousands) | $ 562,103 |
| $ 704,012 |
| $ 2,051,294 | |
| Reserve extensions, discoveries and performance revisions (MMcfe) | 1,723,323 |
| 1,470,696 |
| 4,452,326 | |
| Finding & development costs, excluding price revisions and acquisitions ($/Mcfe) | $ 0.33 |
| $ 0.48 |
| $ 0.46 | |
|
|
|
|
|
|
| |
| Total exploration and development costs incurred, excluding the impact of capitalizing interest and portions of G&A ($ in thousands) | $ 504,196 |
| $ 637,676 |
| $ 1,866,680 | |
| Reserve extensions, discoveries and performance revisions (MMcfe) | 1,723,323 |
| 1,470,696 |
| 4,452,326 | |
| F&D costs, excluding price revisions, acquisitions and the impact of capitalizing interest and portions of G&A in accordance with full cost accounting ($/Mcfe) | $ 0.29 |
| $ 0.43 |
| $ 0.42 | |
|
|
|
|
|
|
| |
|
| Southwest Appalachia | |||||
|
| For the 12 Months |
| For the 12 Months |
| For the 2 Years | |
|
| Ended |
| Ended |
| Ended | |
|
| December 31, 2015 |
| December 31, 2014 |
| December 31, 2015 | |
|
|
|
|
|
|
| |
| Total exploration, development and acquisition costs incurred ($ in thousands) | $ 849,790 |
| $ 5,051,924 |
| $ 5,901,714 | |
| Reserve extensions, discoveries and acquisitions (MMcfe) | 123,409 |
| 2,300,259 |
| 2,423,668 | |
| Finding & development costs, excluding revisions ($/Mcfe) | $ 6.89 |
| $ 2.20 |
| $ 2.44 | |
| Reserve extensions, discoveries, acquisitions and performance revisions (MMcfe) | 332,195 |
| 2,300,259 |
| 2,632,454 | |
| Finding & development costs, including performance revisions ($/Mcfe) | $ 2.56 |
| $ 2.20 |
| $ 2.24 | |
|
|
|
|
|
|
| |
| Total exploration and development costs incurred ($ in thousands) | $ 488,525 |
| $ - |
| $ 488,525 | |
| Reserve extensions, discoveries and performance revisions (MMcfe) | 297,118 |
| - |
| 297,118 | |
| Finding & development costs, excluding price revisions and acquisitions ($/Mcfe) | $ 1.64 |
| N/A |
| $ 1.64 | |
|
|
|
|
|
|
| |
| Total exploration and development costs incurred, excluding the impact of capitalizing interest and portions of G&A ($ in thousands) | $ 290,751 |
| $ - |
| $ 290,751 | |
| Reserve extensions, discoveries and performance revisions (MMcfe) | 297,118 |
| - |
| 297,118 | |
| F&D costs, excluding price revisions, acquisitions and the impact of capitalizing interest and portions of G&A in accordance with full cost accounting ($/Mcfe) | $ 0.98 |
| N/A |
| $ 0.98 | |
|
|
|
|
|
|
|
|
| Fayetteville Shale | ||||
|
| For the 12 Months |
| For the 12 Months |
| For the 3 Years |
|
| Ended |
| Ended |
| Ended |
|
| December 31, 2015 |
| December 31, 2014 |
| December 31, 2015 |
|
|
|
|
|
|
|
| Total exploration, development and acquisition costs incurred ($ in thousands) | $ 578,063 |
| $ 972,823 |
| $ 2,489,938 |
| Reserve extensions, discoveries and acquisitions (MMcfe) | 162,871 |
| 856,307 |
| 3,105,774 |
| Finding & development costs, excluding revisions ($/Mcfe) | $ 3.55 |
| $ 1.14 |
| $ 0.80 |
| Reserve extensions, discoveries, acquisitions and performance revisions (MMcfe) | 173,000 |
| 730,078 |
| 3,005,984 |
| Finding & development costs, including performance revisions ($/Mcfe) | $ 3.34 |
| $ 1.33 |
| $ 0.83 |
|
|
|
|
|
|
|
| Total exploration and development costs incurred ($ in thousands) | $ 578,063 |
| $ 971,425 |
| $ 2,488,315 |
| Reserve extensions, discoveries and performance revisions (MMcfe) | 173,000 |
| 730,078 |
| 3,005,984 |
| Finding & development costs, excluding price revisions and acquisitions ($/Mcfe) | $ 3.34 |
| $ 1.33 |
| $ 0.83 |
|
|
|
|
|
|
|
| Total exploration and development costs incurred, excluding the impact of capitalizing interest and portions of G&A ($ in thousands) | $ 509,307 |
| $ 876,780 |
| $ 2,236,879 |
| Reserve extensions, discoveries and performance revisions (MMcfe) | 173,000 |
| 730,078 |
| 3,005,984 |
| F&D costs, excluding price revisions, acquisitions and the impact of capitalizing interest and portions of G&A in accordance with full cost accounting ($/Mcfe) | $ 2.94 |
| $ 1.20 |
| $ 0.74 |
The Company believes that providing a measure of F&D costs is useful for investors as a means of evaluating a Company’s cost to add proved reserves on a per thousand cubic feet of natural gas equivalent basis. These measures are provided in addition to, and not as an alternative for the financial statements, including the notes thereto, contained in Southwestern’s Annual Report. Due to various factors, including timing differences, F&D costs do not necessarily reflect precisely the costs associated with particular reserves. For example, exploration costs may be recorded in periods prior to the periods in which related acquisitions and increases in reserves are recorded and development costs, including future development costs for proved undeveloped reserve additions, may be recorded in periods subsequent to the periods in which related increases in reserves are recorded. In addition, changes in commodity prices can affect the magnitude of recorded increases in reserves independent of the related costs of such increases. As a result of the foregoing factors and various factors that could materially affect the timing and amounts of future increases in reserves and the timing and amounts of future costs, including factors disclosed in Southwestern’s filings with the SEC, future F&D costs may differ materially from those set forth above. Further, the methods used by Southwestern to calculate its F&D costs may differ significantly from methods used by other companies to compute similar measures and, as a result, Southwestern’s F&D costs may not be comparable to similar measures provided by other companies.
Southwestern management will host a teleconference call on Friday, February 26, 2016 at 10:00 a.m. EST to discuss its fourth quarter and year-end 2015 results. The toll-free number to call is 877-407-8035 and the international dial-in number is 201-689-8035. The teleconference can also be heard “live” on the Internet at http://www.swn.com.
Southwestern Energy Company is an independent energy company whose wholly-owned subsidiaries are engaged in natural gas and oil exploration, development and production, natural gas gathering and marketing. Additional information on the Company can be found on the Internet at http://www.swn.com.
| Contacts: | |||
| Bill Way President and Chief Executive Officer (832) 796-4791 | |||
| R. Craig Owen Senior Vice President | Michael Hancock Director, Investor Relations | ||
| and Chief Financial Officer (832) 796-2808 | (832) 796-7367 michael_hancock@swn.com | ||
This news release contains forward-looking statements. Forward-looking statements relate to future events and anticipated results of operations, business strategies, and other aspects of our operations or operating results. In many cases you can identify forward-looking statements by terminology such as “anticipate,” “intend,” “plan,” “project,” “estimate,” “continue,” “potential,” “should,” “could,” “may,” “will,” “objective,” “guidance,” “outlook,” “effort,” “expect,” “believe,” “predict,” “budget,” “projection,” “goal,” “forecast,” “target” or similar words. Statements may be forward looking even in the absence of these particular words. Where, in any forward-looking statement, the Company expresses an expectation or belief as to future results, such expectation or belief is expressed in good faith and believed to have a reasonable basis. However, there can be no assurance that such expectation or belief will result or be achieved. The actual results of operations can and will be affected by a variety of risks and other matters including, but not limited to, changes in commodity prices; changes in expected levels of natural gas and oil reserves or
production; operating hazards, drilling risks, unsuccessful exploratory activities; limited access to capital or significantly higher cost of capital related to illiquidity or uncertainty in the domestic or international financial markets; international monetary conditions; unexpected cost increases; potential liability for remedial actions under existing or future environmental regulations; potential liability resulting from pending or future litigation; and general domestic and international economic and political conditions; as well as changes in tax, environmental and other laws applicable to our business. Other factors that could cause actual results to differ materially from those described in the forward-looking statements include other economic, business, competitive and/or regulatory factors affecting our business generally as set forth in our filings with the Securities and Exchange Commission. Unless legally required, Southwestern Energy Company undertakes no obligation to update publicly any forward-looking statements, whether as a result of new information, future events or otherwise.
###
|
|
|
|
|
|
|
|
|
|
|
|
|
|
| OPERATING STATISTICS (Unaudited) | Page 1 of 5 | |||||||||||
| Southwestern Energy Company and Subsidiaries |
|
|
|
| ||||||||
|
|
| For the three months ended |
| For the year ended | ||||||||
|
|
| December 31, |
| December 31, | ||||||||
|
|
| 2015 |
| 2014 |
| 2015 |
| 2014 | ||||
|
|
|
|
|
|
|
|
|
|
|
|
|
|
| Exploration & Production |
|
|
|
|
|
|
|
|
|
|
|
|
| Production |
|
|
|
|
|
|
|
|
|
|
|
|
| Gas production (Bcf) |
|
| 226 |
|
| 199 |
|
| 899 |
|
| 766 |
| Oil production (MBbls) |
|
| 569 |
|
| 121 |
|
| 2,265 |
|
| 235 |
| NGL production (MBbls) |
|
| 3,328 |
|
| 204 |
|
| 10,702 |
|
| 231 |
| Total production (Bcfe) |
|
| 249 |
|
| 201 |
|
| 976 |
|
| 768 |
| Commodity Prices |
|
|
|
|
|
|
|
|
|
|
|
|
| Average realized gas price per Mcf, including hedges |
| $ | 2.07 |
| $ | 3.52 |
| $ | 2.37 |
| $ | 3.72 |
| Average realized gas price per Mcf, excluding hedges |
| $ | 1.48 |
| $ | 3.26 |
| $ | 1.91 |
| $ | 3.74 |
| Average oil price per Bbl |
| $ | 27.36 |
| $ | 60.51 |
| $ | 33.25 |
| $ | 79.91 |
| Average NGL price per Bbl |
| $ | 7.62 |
| $ | 12.38 |
| $ | 6.80 |
| $ | 15.72 |
| Summary of Derivative Activity in the Statement of Operations |
|
|
|
|
|
|
|
|
|
|
|
|
| Settled commodity amounts included in "Operating Revenues" (in millions) |
| $ | 64 |
| $ | 22 |
| $ | 209 |
| $ | (26) |
| Settled commodity amounts included in "Gain (Loss) on Derivatives" (in millions) |
| $ | 69 |
| $ | 31 |
| $ | 206 |
| $ | 10 |
| Unsettled commodity amounts included in "Gain (Loss) on Derivatives" (in millions) |
| $ | (50) |
| $ | 140 |
| $ | (153) |
| $ | 137 |
| Average unit costs per Mcfe |
|
|
|
|
|
|
|
|
|
|
|
|
| Lease operating expenses |
| $ | 0.91 |
| $ | 0.90 |
| $ | 0.92 |
| $ | 0.91 |
| General & administrative expenses |
| $ | 0.20 |
| $ | 0.24 |
| $ | 0.21 |
| $ | 0.24 |
| Taxes, other than income taxes |
| $ | 0.09 |
| $ | 0.10 |
| $ | 0.10 |
| $ | 0.11 |
| Full cost pool amortization |
| $ | 0.78 |
| $ | 1.12 |
| $ | 1.00 |
| $ | 1.10 |
| Midstream |
|
|
|
|
|
|
|
|
|
|
|
|
| Volumes marketed (Bcfe) |
|
| 290 |
|
| 234 |
|
| 1,127 |
|
| 904 |
| Volumes gathered (Bcf) |
|
| 179 |
|
| 243 |
|
| 799 |
|
| 963 |
|
|
|
|
|
|
|
|
|
|
|
|
|
|
| STATEMENTS OF OPERATIONS (Unaudited) | Page 2 of 5 | |||||||||||
| Southwestern Energy Company and Subsidiaries |
|
|
|
|
| |||||||
|
|
| For the three months ended |
| For the years ended | ||||||||
|
|
| December 31, |
| December 31, | ||||||||
|
|
| 2015 |
| 2014 |
| 2015 |
| 2014 | ||||
|
|
|
| (in millions, except share/per share amounts) | |||||||||
| Operating Revenues |
|
|
|
|
|
|
|
|
|
|
|
|
| Gas sales |
| $ | 406 |
| $ | 672 |
| $ | 1,946 |
| $ | 2,827 |
| Oil sales |
|
| 16 |
|
| 7 |
|
| 76 |
|
| 19 |
| NGL sales |
|
| 26 |
|
| 2 |
|
| 73 |
|
| 3 |
| Marketing |
|
| 200 |
|
| 231 |
|
| 863 |
|
| 996 |
| Gas gathering |
|
| 39 |
|
| 50 |
|
| 175 |
|
| 193 |
|
|
|
| 687 |
|
| 962 |
|
| 3,133 |
|
| 4,038 |
| Operating Costs and Expenses |
|
|
|
|
|
|
|
|
|
|
|
|
| Marketing purchases |
|
| 198 |
|
| 228 |
|
| 852 |
|
| 980 |
| Operating expenses |
|
| 182 |
|
| 118 |
|
| 689 |
|
| 427 |
| General and administrative expenses |
|
| 58 |
|
| 59 |
|
| 246 |
|
| 221 |
| Depreciation, depletion and amortization |
|
| 215 |
|
| 249 |
|
| 1,091 |
|
| 942 |
| Impairment of natural gas and oil properties |
|
| 2,576 |
|
| – |
|
| 6,950 |
|
| – |
| Gain on sale of assets, net |
|
| (7) |
|
| – |
|
| (283) |
|
| – |
| Taxes, other than income taxes |
|
| 26 |
|
| 23 |
|
| 110 |
|
| 95 |
|
|
|
| 3,248 |
|
| 677 |
|
| 9,655 |
|
| 2,665 |
| Operating Income (Loss) |
|
| (2,561) |
|
| 285 |
|
| (6,522) |
|
| 1,373 |
| Interest Expense |
|
|
|
|
|
|
|
|
|
|
|
|
| Interest on debt |
|
| 47 |
|
| 26 |
|
| 200 |
|
| 101 |
| Other interest charges |
|
| 6 |
|
| 9 |
|
| 60 |
|
| 13 |
| Interest capitalized |
|
| (49) |
|
| (15) |
|
| (204) |
|
| (55) |
|
|
|
| 4 |
|
| 20 |
|
| 56 |
|
| 59 |
|
|
|
|
|
|
|
|
|
|
|
|
|
|
| Other Loss, Net |
|
| (32) |
|
| (5) |
|
| (30) |
|
| (4) |
| Gain on Derivatives |
|
| 17 |
|
| 168 |
|
| 47 |
|
| 139 |
| Income (Loss) Before Income Taxes |
|
| (2,580) |
|
| 428 |
|
| (6,561) |
|
| 1,449 |
| Provision (Benefit) for Income Taxes |
|
|
|
|
|
|
|
|
|
|
|
|
| Current |
|
| (9) |
|
| (13) |
|
| (2) |
|
| 21 |
| Deferred |
|
| (464) |
|
| 129 |
|
| (2,003) |
|
| 504 |
|
|
|
| (473) |
|
| 116 |
|
| (2,005) |
|
| 525 |
| Net Income (Loss) |
| $ | (2,107) |
| $ | 312 |
| $ | (4,556) |
| $ | 924 |
| Mandatory convertible preferred stock dividend |
|
| 27 |
|
| – |
|
| 106 |
|
| – |
| Net Income (Loss) Attributable to Common Stock |
|
| (2,134) |
|
| 312 |
|
| (4,662) |
|
| 924 |
|
|
|
|
|
|
|
|
|
|
|
|
|
|
| Earnings (Loss) Per Common Share |
|
|
|
|
|
|
|
|
|
|
|
|
| Basic |
| $ | (5.58) |
| $ | 0.89 |
| $ | (12.25) |
| $ | 2.63 |
| Diluted |
| $ | (5.58) |
| $ | 0.88 |
| $ | (12.25) |
| $ | 2.62 |
| Weighted Average Common Shares Outstanding | ||||||||||||
| Basic |
|
| 382,334,978 |
|
| 351,710,349 |
|
| 380,521,039 |
|
| 351,446,747 |
| Diluted |
|
| 382,334,978 |
|
| 352,289,601 |
|
| 380,521,039 |
|
| 352,410,683 |
|
|
|
|
|
|
|
|
| BALANCE SHEETS (Unaudited) | Page 3 of 5 | |||||
| Southwestern Energy Company and Subsidiaries |
|
|
|
|
| |
|
|
| December 31, |
| December 31, | ||
|
|
| 2015 |
| 2014 | ||
|
|
| (in millions) | ||||
| ASSETS |
|
|
|
|
|
|
| Current assets |
| $ | 393 |
| $ | 1,115 |
| Property and equipment |
|
| 24,364 |
|
| 22,557 |
| Less: Accumulated depreciation, depletion and amortization |
|
| (16,821) |
|
| (8,845) |
| Total property and equipment, net |
|
| 7,543 |
|
| 13,712 |
| Other long-term assets |
|
| 174 |
|
| 98 |
| Total assets |
|
| 8,110 |
|
| 14,925 |
|
|
|
|
|
|
|
|
| LIABILITIES AND EQUITY |
|
|
|
|
|
|
| Current liabilities |
|
| 707 |
|
| 5,428 |
| Long-term debt |
|
| 4,728 |
|
| 2,466 |
| Deferred income taxes |
|
| – |
|
| 1,951 |
| Other long-term liabilities |
|
| 393 |
|
| 418 |
| Total liabilities |
|
| 5,828 |
|
| 10,263 |
| Equity: |
|
|
|
|
|
|
| Common stock, $0.01 par value; 1,250,000,000 shares authorized; issued 390,138,549 shares in 2015 and 354,488,992 shares in 2014 |
|
| 4 |
|
| 4 |
| Preferred stock, $0.01 par value; 10,000,000 shares authorized, 6.25% Series B Mandatory Convertible, $1,000 per share liquidation preference, 1,725,000 shares issued and outstanding as of December 31, 2015 |
|
| – |
|
| – |
| Additional paid-in capital |
|
| 3,409 |
|
| 1,019 |
| Retained earnings (Accumulated deficit) |
|
| (1,082) |
|
| 3,577 |
| Accumulated other comprehensive income (loss) |
|
| (48) |
|
| 62 |
| Common stock in treasury; 47,149 shares in 2015 and 11,055 shares in 2014 |
|
| (1) |
|
| – |
| Total equity |
|
| 2,282 |
|
| 4,662 |
| Total liabilities and equity |
| $ | 8,110 |
| $ | 14,925 |
|
|
|
|
|
|
|
|
| STATEMENTS OF CASH FLOWS (Unaudited) | Page 4 of 5 | |||||
| Southwestern Energy Company and Subsidiaries |
|
|
|
|
| |
|
|
| For the years ended December 31, | ||||
|
|
| 2015 |
| 2014 | ||
|
| (in millions) | |||||
| Cash Flows From Operating Activities |
|
|
|
|
|
|
| Net income (loss) |
| $ | (4,556) |
| $ | 924 |
| Adjustment to reconcile net income to net cash provided by operating |
|
|
|
|
|
|
| Depreciation, depletion and amortization |
|
| 1,092 |
|
| 942 |
| Impairment of natural gas and oil properties |
|
| 6,950 |
|
| – |
| Amortization of debt issuance cost |
|
| 53 |
|
| 10 |
| Deferred income taxes |
|
| (2,003) |
|
| 504 |
| (Gain) loss on derivatives, net of settlement |
|
| 155 |
|
| (130) |
| Stock-based compensation |
|
| 26 |
|
| 18 |
| Gain on sale of assets, net |
|
| (283) |
|
| – |
| Write-down of inventory |
|
| 32 |
|
| – |
| Other | 2 | 2 | ||||
| Change in assets and liabilities |
|
| 112 |
|
| 65 |
| Net cash provided by operating activities |
|
| 1,580 |
|
| 2,335 |
|
|
|
|
|
|
|
|
| Cash Flows From Investing Activities |
|
|
|
|
|
|
| Capital investments |
|
| (1,798) |
|
| (2,043) |
| Acquisitions |
|
| (579) |
|
| (5,298) |
| Proceeds from sale of property and equipment |
|
| 729 |
|
| 43 |
| Other |
|
| 10 |
|
| 10 |
| Net cash used in investing activities |
|
| (1,638) |
|
| (7,288) |
|
|
|
|
|
|
|
|
| Cash Flows From Financing Activities |
|
|
|
|
|
|
| Payments on current portion of long-term debt |
|
| (1) |
|
| (1) |
| Payments on long-term debt |
|
| (500) |
|
| – |
| Payments on short-term debt |
|
| (4,500) |
|
| – |
| Payments on revolving credit facility |
|
| (3,024) |
|
| (5,179) |
| Borrowings under revolving credit facility |
|
| 2,840 |
|
| 5,196 |
| Payments on commercial paper |
|
| (7,988) |
|
| – |
| Borrowings under commercial paper |
|
| 7,988 |
|
| – |
| Change in bank drafts outstanding |
|
| 12 |
|
| 11 |
| Proceeds from issuance of long-term debt |
|
| 2,950 |
|
| 500 |
| Proceeds from issuance of short-term debt |
|
| – |
|
| 4,500 |
| Debt issuance costs |
|
| (20) |
|
| (56) |
| Proceeds from exercise of common stock options | – | 12 | ||||
| Proceeds from issuance of common stock | 669 | – | ||||
| Proceeds from issuance of mandatory convertible preferred stock | 1,673 | – | ||||
| Mandatory convertible preferred stock dividend | (79) | – | ||||
| Net cash provided by financing activities |
|
| 20 |
|
| 4,983 |
|
|
|
|
|
|
|
|
| Increase (decrease) in cash and cash equivalents |
|
| (38) |
|
| 30 |
| Cash and cash equivalents at beginning of year |
|
| 53 |
|
| 23 |
| Cash and cash equivalents at end of year |
| $ | 15 |
| $ | 53 |
|
|
|
|
|
|
|
|
|
|
|
|
|
|
|
|
| ||
| SEGMENT INFORMATION (Unaudited) | Page 5 of 5 | ||||||||||||||||
| Southwestern Energy Company and Subsidiaries |
|
|
|
|
|
|
|
|
|
|
| ||||||
|
|
|
|
|
|
|
|
|
|
|
|
| ||||||
|
|
| Exploration |
|
|
|
|
|
|
|
|
|
|
| ||||
|
|
| & |
| Midstream |
|
|
|
|
|
|
|
|
| ||||
|
|
| Production |
| Services |
| Other |
| Eliminations |
| Total | |||||||
|
| (in millions) | ||||||||||||||||
| Quarter Ending December 31, 2015 |
|
|
|
|
|
|
|
|
|
|
|
|
|
|
| ||
| Revenues |
| $ | 441 |
| $ | 668 |
| $ | (1) |
| $ | (421) |
| $ | 687 | ||
| Marketing purchases |
|
| – |
|
| 541 |
|
| – |
|
| (343) |
|
| 198 | ||
| Operating expenses |
|
| 229 |
|
| 33 |
|
| (2) |
|
| (78) |
|
| 182 | ||
| General & administrative expenses |
|
| 49 |
|
| 9 |
|
| – |
|
| – |
|
| 58 | ||
| Depreciation, depletion & amortization |
|
| 204 |
|
| 10 |
|
| 1 |
|
| – |
|
| 215 | ||
| Impairment of natural gas properties |
|
| 2,576 |
|
| – |
|
| – |
|
| – |
|
| 2,576 | ||
| Gain on sale of assets, net |
|
| (7) |
|
| – |
|
| – |
|
| – |
|
| (7) | ||
| Taxes, other than income taxes |
|
| 23 |
|
| 3 |
|
| – |
|
| – |
|
| 26 | ||
| Operating income (loss) |
|
| (2,633) |
|
| 72 |
|
| – |
|
| – |
|
| (2,561) | ||
| Capital investments(1) |
|
| 378 |
|
| 3 |
|
| 2 |
|
| – |
|
| 383 | ||
|
|
|
|
|
|
|
|
|
|
|
|
|
|
|
|
| ||
| Quarter Ending December 31, 2014 |
|
|
|
|
|
|
|
|
|
|
|
|
|
|
| ||
| Revenues |
| $ | 680 |
| $ | 1,014 |
| $ | – |
| $ | (732) |
| $ | 962 | ||
| Marketing purchases |
|
| – |
|
| 855 |
|
| – |
|
| (627) |
|
| 228 | ||
| Operating expenses |
|
| 180 |
|
| 42 |
|
| 1 |
|
| (105) |
|
| 118 | ||
| General & administrative expenses |
|
| 49 |
|
| 10 |
|
| – |
|
| – |
|
| 59 | ||
| Depreciation, depletion & amortization |
|
| 234 |
|
| 15 |
|
| – |
|
| – |
|
| 249 | ||
| Taxes, other than income taxes |
|
| 21 |
|
| 3 |
|
| (1) |
|
| – |
|
| 23 | ||
| Operating income |
|
| 196 |
|
| 89 |
|
| – |
|
| – |
|
| 285 | ||
| Capital investments(1) |
|
| 5,548 |
|
| 35 |
|
| 27 |
|
| – |
|
| 5,610 | ||
|
|
|
|
|
|
|
|
|
|
|
|
|
|
|
|
| ||
| Year Ending December 31, 2015 |
|
|
|
|
|
|
|
|
|
|
|
|
|
|
| ||
| Revenues |
| $ | 2,074 |
| $ | 3,119 |
| $ | – |
| $ | (2,060) |
| $ | 3,133 | ||
| Marketing purchases |
|
| – |
|
| 2,566 |
|
| – |
|
| (1,714) |
|
| 852 | ||
| Operating expenses |
|
| 899 |
|
| 136 |
|
| – |
|
| (346) |
|
| 689 | ||
| General & administrative expenses |
|
| 207 |
|
| 39 |
|
| – |
|
| – |
|
| 246 | ||
| Depreciation, depletion & amortization |
|
| 1,028 |
|
| 62 |
|
| 1 |
|
| – |
|
| 1,091 | ||
| Impairment of natural gas properties |
|
| 6,950 |
|
| – |
|
| – |
|
| – |
|
| 6,950 | ||
| Gain on sale of assets, net |
|
| (6) |
|
| (277) |
|
| – |
|
| – |
|
| (283) | ||
| Taxes, other than income taxes |
|
| 100 |
|
| 10 |
|
| – |
|
| – |
|
| 110 | ||
| Operating income (loss) |
|
| (7,104) |
|
| 583 |
|
| (1) |
|
| – |
|
| (6,522) | ||
| Capital investments(1) |
|
| 2,258 |
|
| 167 |
|
| 12 |
|
| – |
|
| 2,437 | ||
|
|
|
|
|
|
|
|
|
|
|
|
|
|
|
|
| ||
| Year Ending December 31, 2014 |
|
|
|
|
|
|
|
|
|
|
|
|
|
|
| ||
| Revenues |
| $ | 2,862 |
| $ | 4,358 |
| $ | – |
| $ | (3,182) |
| $ | 4,038 | ||
| Marketing purchases |
|
| – |
|
| 3,738 |
|
| – |
|
| (2,758) |
|
| 980 | ||
| Operating expenses |
|
| 697 |
|
| 153 |
|
| 1 |
|
| (424) |
|
| 427 | ||
| General & administrative expenses |
|
| 183 |
|
| 38 |
|
| – |
|
| – |
|
| 221 | ||
| Depreciation, depletion & amortization |
|
| 884 |
|
| 58 |
|
| – |
|
| – |
|
| 942 | ||
| Taxes, other than income taxes |
|
| 85 |
|
| 10 |
|
| – |
|
| – |
|
| 95 | ||
| Operating income (loss) |
|
| 1,013 |
|
| 361 |
|
| (1) |
|
| – |
|
| 1,373 | ||
| Capital investments(1) |
|
| 7,254 |
|
| 144 |
|
| 49 |
|
| – |
|
| 7,447 | ||
|
|
|
|
|
|
|
|
|
|
|
|
|
|
|
|
| ||
| (1) Capital investments includes a decrease of $28 million and an increase of $41 million for the three months ended December 31, 2015 and 2014, respectively, and a decrease of $33 million and an increase of $155 million for the years ended December 31, 2015 and 2014, respectively, relating to the change in accrued expenditures between periods. | |||||||||||||||||