Attached files
| file | filename |
|---|---|
| EX-23.1 - EXHIBIT 23.1 - SENSIENT TECHNOLOGIES CORP | ex23_1.htm |
| EX-32 - EXHIBIT 32 - SENSIENT TECHNOLOGIES CORP | ex32.htm |
| EX-31 - EXHIBIT 31 - SENSIENT TECHNOLOGIES CORP | ex31.htm |
| EX-21 - EXHIBIT 21 - SENSIENT TECHNOLOGIES CORP | ex21.htm |
UNITED STATES
SECURITIES AND EXCHANGE COMMISSION
WASHINGTON, D.C. 20549
FORM 10-K
| ☒ | ANNUAL REPORT PURSUANT TO SECTION 13 OR 15(d) OF THE SECURITIES EXCHANGE ACT OF 1934 |
For the Fiscal Year Ended December 31, 2015
OR
| ☐ | TRANSITION REPORT PURSUANT TO SECTION 13 OR 15(d) OF THE SECURITIES EXCHANGE ACT OF 1934 |
Commission File Number 1-7626
Sensient Technologies Corporation
|
WISCONSIN
|
39-0561070
|
|
|
(State of Incorporation)
|
(IRS Employer Identification Number)
|
777 EAST WISCONSIN AVENUE
MILWAUKEE, WISCONSIN 53202-5304
(414) 271-6755
(Address of Principal Executive Offices)
SECURITIES REGISTERED PURSUANT TO SECTION 12(b) OF THE ACT:
|
TITLE OF EACH CLASS
Common Stock, $0.10 par value
|
NAME OF EACH EXCHANGE
ON WHICH REGISTERED
|
|
|
|
New York Stock Exchange, Inc.
|
Indicate by check mark if the registrant is a well-known seasoned issuer, as defined in Rule 405 of the Securities Act. Yes ☒ No ☐
Indicate by check mark if the registrant is not required to file reports pursuant to Section 13 or Section 15(d) of the Act. Yes ☐ No ☒
Indicate by check mark whether the Registrant (1) has filed all reports required to be filed by Section 13 or 15(d) of the Securities Exchange Act of 1934 during the preceding 12 months (or such shorter period that the Registrant was required to file such reports), and (2) has been subject to such filing requirements for at least the past 90 days. Yes ☒ No ☐
Indicate by check mark whether the registrant has submitted electronically and posted on its corporate Web site, if any, every Interactive Data File required to be submitted and posted pursuant to Rule 405 of Regulation S-T (§232.405 of this chapter) during the preceding 12 months (or for such shorter period that the registrant was required to submit and post such files). Yes ☒ No ☐
Indicate by check mark if disclosure of delinquent filers pursuant to Item 405 of Regulation S-K is not contained herein, and will not be contained, to the best of Registrant’s knowledge, in definitive proxy or information statements incorporated by reference in Part III of this Form 10-K or any amendment to this Form 10-K. ☐
Indicate by check mark whether the registrant is a large accelerated filer, an accelerated filer, a non-accelerated filer, or a smaller reporting company. See the definitions of “large accelerated filer,” “accelerated filer” and “smaller reporting company” in Rule 12b-2 of the Exchange Act. (Check one):
|
Large accelerated filer ☒
|
Accelerated filer ☐
|
Non-accelerated filer ☐
|
Smaller Reporting Company ☐
|
Indicate by check mark if the registrant is a shell company (as defined in Rule 12b-2 of the Exchange Act). Yes ☐ No ☒
The aggregate market value of the voting Common Stock held by non-affiliates of the Registrant as of June 30, 2015, was $3,076,116,649. For purposes of this computation only, the Registrant’s directors and executive officers were considered to be affiliates of the Registrant. Such characterization shall not be construed to be an admission or determination for any other purpose that such persons are affiliates of the Registrant.
There were 44,965,308 shares of Common Stock outstanding as of February 19, 2016.
DOCUMENTS INCORPORATED BY REFERENCE
Portions of the Company’s 2016 Notice of Annual Meeting and Proxy Statement which will be filed with the Securities and Exchange Commission within 120 days after December 31, 2015 (see Part III of this Form 10-K).
|
1
|
|||
|
1
|
|||
|
1
|
|||
|
1
|
|||
|
2
|
|||
|
2
|
|||
|
3
|
|||
|
3
|
|||
|
3
|
|||
|
3
|
|||
|
4
|
|||
|
4
|
|||
|
4
|
|||
|
4
|
|||
|
4
|
|||
|
4
|
|||
|
7
|
|||
|
7
|
|||
|
8
|
|||
|
8
|
|||
|
9
|
|||
| 10 | |||
|
10
|
|||
|
12
|
|||
|
14
|
|||
|
24
|
|||
|
25
|
|||
|
25
|
|||
|
25
|
|||
|
25
|
|||
|
26
|
|||
|
26
|
|||
|
26
|
|||
|
26
|
|||
|
26
|
|||
|
26
|
|||
|
27
|
|||
|
27
|
|||
|
27
|
|||
|
27
|
|||
|
56
|
|||
|
S-1
|
|||
|
E-1
|
|||
FORWARD-LOOKING STATEMENTS
This document contains forward-looking statements that reflect management’s current assumptions and estimates of future economic circumstances, industry conditions, Company performance and financial results. Forward-looking statements include statements in the future tense, statements referring to any period after December 31, 2015, and statements including the terms “expect,” believe,” “anticipate” and other similar terms that express expectations as to future events or conditions. The Private Securities Litigation Reform Act of 1995 provides a safe harbor for such forward-looking statements. Such forward-looking statements are not guarantees of future performance and involve known and unknown risks, uncertainties and other factors that could cause actual events to differ materially from those expressed in those statements. A variety of factors could cause the Company’s actual results and experience to differ materially from the anticipated results. These factors and assumptions include the pace and nature of new product introductions by the Company and the Company’s customers; the Company’s ability to successfully implement its growth strategies; the outcome of the Company’s various productivity-improvement and cost-reduction efforts; the effectiveness of the Company’s restructuring activities; changes in costs of raw materials, including energy; industry and economic factors related to the Company’s domestic and international business; growth in markets for products in which the Company competes; industry and customer acceptance of price increases; actions by competitors; currency exchange rate fluctuations; and the matters discussed below under the heading “Risk Factors” and under Part II, including the critical accounting policies set forth below on pages 22 through 23. Except to the extent required by applicable law, the Company does not undertake to publicly update or revise its forward-looking statements even if experience or future changes make it clear that any projected results expressed or implied therein will not be realized.
Sensient Technologies Corporation (the “Company”) was incorporated in 1882 in Wisconsin. Its principal executive offices are located at 777 East Wisconsin Avenue, Suite 1100, Milwaukee, Wisconsin 53202-5304, telephone (414) 271-6755.
The Company is subject to the informational and reporting requirements of the Securities Exchange Act of 1934, as amended (the “Act”), and, in accordance with the Act, has filed annual, quarterly and current reports, proxy statements and other information with the Securities and Exchange Commission (the “Commission”). These reports and other information may be read and copied at the public reference facilities of the Commission at its principal offices at 100 F Street, N.E., Washington, D.C. 20549, and can also be accessed from the website maintained by the Commission at http://www.sec.gov. The public may obtain information on operations of the public reference room by calling the Commission at (800) SEC-0330.
The Company’s common stock is listed on the New York Stock Exchange under the ticker symbol “SXT.” Information about the Company may be obtained at the offices of the New York Stock Exchange, 20 Broad Street, New York, New York 10005.
The Company can also be reached at its website at www.sensient.com. The Company’s web address is provided as an inactive textual reference only, and the contents of that website are not incorporated in or otherwise to be regarded as part of this report. The Company makes available free of charge on its website its proxy statement, its annual report on Form 10-K, quarterly reports on Form 10-Q, current reports on Form 8-K, and amendments to these reports filed or furnished pursuant to Section 13(a) or 15(d) of the Act as soon as reasonably practicable after such documents are electronically filed with or furnished to the Commission. Charters for the Audit, Compensation and Development, and Nominating and Corporate Governance Committees of the Company’s Board of Directors, as well as the Company’s Code of Conduct, Corporate Governance Guidelines, our Policy on Recovery of Incentive Compensation From Executives and our Directors and Officers Stock Ownership Guidelines are also available on the Company’s website, and are available in print to any shareholder, free of charge, upon request. If there are any amendments to the Code of Conduct or the Corporate Governance Guidelines, or if waivers from any of them are granted for executive officers or directors, those amendments or waivers also will be posted on the Company’s website.
The Company is a leading global manufacturer and marketer of colors, flavors and fragrances. The Company uses advanced technologies at facilities around the world to develop specialty food and beverage systems, cosmetic and pharmaceutical systems, specialty inks and colors, and other specialty and fine chemicals. The Company’s customers include major international manufacturers representing some of the world’s best-known brands.
The Company’s principal products include:
| ● | flavors, flavor enhancers, ingredients and bionutrients; |
| ● | fragrances, aroma chemicals and essential oils; |
| ● | natural ingredients, including dehydrated vegetables and other food ingredients; |
| ● | natural and synthetic food and beverage colors; |
| ● | cosmetic colors and ingredients and pharmaceutical excipients and ingredients; and |
| ● | technical colors, specialty inks and colors, and specialty dyes and pigments. |
The Company’s three reportable segments are the Flavors & Fragrances Group and the Color Group, which are managed on a product-and-services basis, and the Asia Pacific Group, which is managed on a geographic basis. The Company’s corporate expenses and restructuring and other costs are included in the “Corporate & Other” category. Financial information regarding the Company’s three reportable segments and the operations included within Corporate & Other is set forth below on pages 47 through 49 under the heading “Segment and Geographic Information.”
In 2014, the Company announced and began a restructuring plan related to eliminating underperforming operations, consolidating manufacturing facilities and improving efficiencies within the Company, with an emphasis on the Flavors & Fragrances Group. Additional information regarding the costs related to the implementation of restructuring plan is set forth below on pages 50 through 52 under the heading “Restructuring Charges.”
The Company is a global developer, manufacturer and supplier of flavor and fragrance systems for the food, beverage, personal care and household-products industries. The Company’s flavor formulations are used in many of the world’s best-known consumer products. Under the unified brand names of Sensient Flavors, Sensient Natural Ingredients and Sensient Fragrances, the Group is a supplier to multinational companies.
The Flavors & Fragrances Group produces flavor and fragrance products that impart a desired taste, texture, aroma and/or other characteristics to a broad range of consumer and other products. This Group includes the Company’s natural ingredients business, which produces ingredients for food processors. The main products of the Group are systems products, including flavor-delivery systems, and compounded and blended products. In addition, the Group has strong positions in selected ingredient products such as essential oils, natural and synthetic flavors, and aroma chemicals. The Group serves food and non-food industries. In food industries, markets include savory, beverage and sweet flavors. In non-food industries, the Group supplies fragrance products to the personal and home-care markets.
Operating through its Sensient Natural Ingredients business, the Company believes it is the second largest producer (by sales) of dehydrated onion and garlic products in the United States. The Company is also one of the largest producers and distributors of chili powder, paprika, chili pepper and dehydrated vegetables such as parsley, celery and spinach. Domestically, the Company sells dehydrated products to food manufacturers for use as ingredients and also for repackaging under private labels for sale to the retail market and to the food service industry. Advanced dehydration technologies utilized by Sensient Natural Ingredients permit fast and effective rehydration of ingredients used in many of today’s popular convenience foods.
The Flavors & Fragrances Group operates principally through the Company’s subsidiaries Sensient Flavors LLC and Sensient Natural Ingredients LLC. The Group’s principal manufacturing plants are located in California, Illinois, Indiana, Michigan, Wisconsin, Belgium, China, France, Mexico, the Netherlands, Spain and the United Kingdom.
Beginning in the first quarter of 2015, the results of operations for the Company’s businesses in Central and South America, previously reported in the Corporate & Other segment, are now reported in the Flavors & Fragrances segment. Results for 2014 and 2013 have been restated to reflect these changes.
The Company is a developer, manufacturer and supplier of colors for businesses worldwide. The Company provides natural and synthetic color systems for use in foods, beverages and pharmaceuticals; colors and other ingredients for cosmetics, such as active ingredients, solubilizers and surface treated pigments; pharmaceutical excipients, such as colors, flavors and coatings; specialty inks; and technical colors for industrial applications.
The Company believes that it is one of the world’s largest producers (by sales) of synthetic and natural colors, and that it is the world’s largest manufacturer (by sales) of certified food colors. The Company sells its synthetic and natural colors to domestic and international producers of beverages, bakery products, processed foods, confections, pet foods, cosmetics and pharmaceuticals. The Company also makes industrial colors, specialty inks and other dyes and pigments used in a variety of non-food applications.
The Color Group operates principally through the Company’s subsidiary Sensient Colors LLC. The Group’s principal manufacturing plants are located in Missouri, New Jersey, Brazil, Canada, France, Germany, Italy, Mexico, Switzerland and the United Kingdom.
The Color Group operates under the following trade names:
| ● | Sensient Food Colors (food and beverage colors); |
| ● | Sensient Pharmaceutical Coating Systems (pharmaceutical colors and coatings); |
| ● | Sensient Cosmetic Technologies (cosmetic colors and ingredients and systems); |
| ● | Sensient Inks (specialty inks); and |
| ● | Sensient Industrial Colors (paper colors; and industrial colors for plastics, leather, wood stains, antifreeze and other uses). |
The Company believes that its advanced process technology, state-of-the-art laboratory facilities and equipment, world class application chemists and a complete range of synthetic and natural color products constitute the basis for its market leadership position.
The Asia Pacific Group focuses on marketing the Company’s diverse product line in the Pacific Rim under the Sensient name. Through these operations, the Company offers a full range of products from its Flavors & Fragrances Group and Color Group, as well as products developed by regional technical teams to appeal to local preferences.
Sales, marketing and technical functions are managed through the Asia Pacific Group’s headquarters in Australia. Manufacturing operations are located in Australia, China, Japan, New Zealand and the Philippines. The Asia Pacific Group maintains offices for local technical support, as well as sales, in China, India, Indonesia, Korea and Thailand, and is significantly expanding its research and development capabilities in Singapore.
The development of specialized products and services is a complex technical process calling upon the combined knowledge and talents of the Company’s research, development and quality assurance personnel. The Company believes that its competitive advantage lies in its ability to work with its customers to develop and deliver high-performance products that address the distinct needs of those customers.
The Company’s research, development and quality assurance personnel support the Company’s efforts to improve existing products and develop new products tailored to customer needs, while providing on-going technical support and know-how to the Company’s manufacturing activities. The Company employed 726 people in research and development, quality assurance, quality control and lab technician positions as of December 31, 2015.
Expenditures for research and development related to continuing operations in calendar year 2015 were $35.1 million, compared with $35.9 million in the year ended December 31, 2014, and $34.1 million in the year ended December 31, 2013. As part of its commitment to quality as a competitive advantage, the Company’s production facilities hold various certifications, such as those under the International Organization for Standardization (ISO) and those recognized by the Global Food Safety Initiative (GFSI), including the Safe Quality Food Program (SQF), British Retail Consortium (BRC), Food Safety System Certification (FSSC 22000) and International Featured Standards (IFS), for certifying the safety and quality of its products and production processes.
The Company’s strategic focus is on the manufacture and marketing of high-performance components that bring life to products. Accordingly, the Company devotes considerable attention and resources to the development of product applications and processing improvements to support its customers’ numerous new and reformulated products. The majority of the proprietary processes and formulae developed by the Company are maintained as trade secrets and under confidentiality agreements with customers.
Within the Flavors & Fragrances Group, development activity is focused on ingredients, flavors, fragrances, and flavor and fragrance systems that are responsive to consumer trends and the processing needs of our food and beverage customers. These activities include the development of functional ingredient systems for foods and beverages, savory flavors, and ingredient systems for prepared foods and flavors and ingredients for dairy, confectionery and other applications. The Company believes that the development of yeast derivatives and other specialty ingredients also provides growth opportunities in bionutrients and biotechnology markets, such as pharmaceuticals, vitamins, vaccines and bioremediation.
Within the Color Group, development activity for food and beverage product lines is focused on value-added products derived from synthetic dyes and pigments and natural food and beverage colors and on color systems. The Company also produces a diverse line of colors and ingredients for cosmetics and pharmaceutical applications and technical colors for industrial applications.
The Company uses a wide range of raw materials in producing its products. Chemicals used to produce certified colors are obtained from several domestic and foreign suppliers. Raw materials for natural colors, such as carmine, beta-carotene, annatto and turmeric, are purchased from overseas and U.S. sources. In the production of flavors and fragrances, the principal raw materials include essential oils, aroma chemicals, botanicals, fruits and juices, and are obtained from domestic and foreign suppliers. Flavor enhancers and secondary flavors are produced from brewers’ yeast and vegetable materials such as corn and soybeans. Chili peppers, onion, garlic and other vegetables are acquired under annual contracts with numerous growers in the western United States and Europe. The Company has expanded its sources of vegetables to include growers in China.
The Company believes that its ability to reformulate its products and the general availability of alternate sources of materials would enable it to maintain its competitive position in the event of an interruption in the supply of raw materials from a single supplier.
All Company products are sold in highly competitive markets. While no single factor is determinative, the Company’s competitive position is based principally on process and applications expertise, quality, technological advances resulting from its research and development, and customer service and support. Because of its highly differentiated products, the Company competes with only a few companies across multiple product lines, and is more likely to encounter competition specific to an individual product.
| · | Flavors & Fragrances. Competition to supply the flavors and fragrances industries has taken on an increasingly global nature. Most of the Company’s customers do not buy their entire flavor and/or fragrance products from a single supplier and the Company does not compete with a single supplier in all product categories. Competition for the supply of flavors and fragrances is based on the development of customized ingredients for new and reformulated customer products, as well as on quality, customer service and price. Competition to supply dehydrated vegetable products is present through several large and small domestic competitors, as well as competitors in other countries. Competition for the supply of dehydrated vegetables is based principally on product quality, customer service and price. |
| · | Color. Competition in the color market is diverse, with the majority of the Company’s competitors specializing in either synthetic dyes and pigments or natural colors. The Company believes that it gains a competitive advantage as the only major basic manufacturer of a full range of color products, including synthetic dyes and pigments as well as natural colors. Competition in the supply of cosmetic colors and ingredients, specialty inks and pharmaceutical excipients is based on the development of customized products and solutions as well as quality, customer service, and price. The Company believes that its reputation and capacity as a color producer as well as its product development give it a competitive advantage in these markets. |
| · | Asia Pacific. Because of the broad array of products available to customers of the Asia Pacific Group, the Company believes that it is able to offer a wider product base than many of its competitors. Competition is based upon reliability in product quality, service and price as well as technical support available to customers. |
Additional information regarding the Company’s foreign operations is set forth below on pages 47 through 49 under the heading “Segment and Geographic Information.”
The Company owns or controls many patents, formulae and trademarks related to its businesses. The businesses are not materially dependent upon any particular patent or trademark; however, trademarks, patents and formulae are important to the business of the Company.
As of December 31, 2015, the Company employed 4,032 persons worldwide.
Compliance with government provisions regulating discharges into the environment, or otherwise relating to the protection of the environment, did not have a material adverse effect on the Company’s operations for the year covered by this report. Current compliance is not expected to have a material adverse effect in the next two years. The production, packaging, labeling and distribution of certain of the products of the Company in the U.S. are subject to the regulations of various federal, state and local governmental agencies, in particular the U.S. Food and Drug Administration. The Company is subject to similar regulations in many international markets.
As with any business, the Company’s business and operations involve risks and uncertainties. In addition to the other discussions in this report, particularly those in “Management’s Discussion & Analysis of Operations & Financial Condition” from pages 14 through 24 and “Forward-Looking Statements” above, the following factors should be considered:
| · | Our recent restructurings may not be as effective as we anticipate and we may fail to realize the expected cost savings. |
During 2013, 2014 and 2015, we announced and engaged in various restructuring activities. These activities require the devotion of significant resources and management attention and may pose significant risks. Our ability to realize anticipated cost savings may be affected by a number of factors, including our ability to effectively reduce overhead, rationalize manufacturing capacity and shift production to more efficient facilities. Furthermore, our restructurings may not be as effective as we anticipate, and we may fail to realize the cost savings we expect from these restructurings. Actual charges, costs and adjustments due to restructuring activities may vary materially from our estimates and our restructuring activities may require cash and non-cash costs or charges in excess of budgeted amounts, which could reduce anticipated cost savings and could have an adverse effect on our margins.
| · | The impact of currency exchange rate fluctuation may negatively affect our results. |
We report the results of our foreign operations in the applicable local currency and then translate those results into U.S. dollars at applicable exchange rates. The applicable exchange rates between and among local currencies, foreign currencies and the U.S. dollar have fluctuated and will continue to do so in the future. These fluctuations have impacted our results of operations in recent periods as discussed in more detail in Management’s Discussion and Analysis of Financial Condition and Results of Operations in this annual report on Form 10-K. Such currency exchange rate volatility may also adversely impact our financial condition or liquidity. While we may use forward exchange contracts and foreign currency denominated debt to manage our exposure to foreign exchange risk, such risk management strategies may not be effective and our results of operations could be adversely affected.
| · | In some product lines, most of our sales are made to a relatively small number of customers; if we lose any of those customers, sales and operating results could decline. |
In some of our product lines, our sales are concentrated to a small number of customers. While we do not currently have any single customer that we consider to be significant to us as a whole, the loss of a significant customer of a product line could substantially affect the sales and profitability of that line, which may cause us to re-evaluate that line. Those developments could affect our results. In addition, the financial condition of our customers may adversely affect their ability to buy from us or to pay for products that they have already purchased.
| · | Many of our products are used in items for human consumption and contact. We may be subject to product liability claims and product recalls, which could negatively impact our profitability and corporate image. |
We sell flavors, fragrances and colors which are used in foods, beverages, pharmaceuticals, cosmetics and other items for human consumption or contact. These products involve risks such as product contamination or spoilage, product tampering and other adulteration. We may be subject to liability if the consumption or use of our flavors, fragrances and colors, or products which incorporate ingredients we manufacture, cause injury, illness or death. In addition, we or our customers may need to recall products in the event of contamination or damage.
A significant product defect, product liability judgment or product recall may negatively impact our profitability for a period of time depending on publicity, product availability, scope, competitive reaction and consumer attitudes. Even if a product liability claim is unsuccessful or is not fully pursued, the negative publicity surrounding any assertion that our products caused illness, injury or death could adversely affect our reputation with existing and potential customers and our corporate image.
| · | Consolidation has resulted in customers with increased buying power, which can affect our profitability. |
Many of our customers have consolidated in recent years and we expect the combination trend to continue. These consolidations have often produced large, sophisticated customers with increased buying power who are more capable of resisting price increases. If the larger size or greater buying power of those customers results in additional negotiating strength, the prices we are able to charge could be negatively affected and our profitability could decline.
| · | Intense competition may result in reduced sales and profitability. |
The industries and markets in which we operate are highly competitive. That competition can reduce both our sales and the prices at which we are able to sell our products, which can in turn negatively affect our profitability.
| · | Our sales and profitability are affected by changing consumer preferences and changing technologies. |
Although we do not generally make or sell proprietary consumer products, many of our products are sold to companies which develop and market consumer products. Sales of these flavors, fragrances, colors and inks depend in part upon our customers’ ability to identify and meet consumer preferences and their sales and marketing efforts, all of which are beyond our control. Our sales could also be affected by changing technologies that could impact consumer demand for products that contain our flavors, fragrances, colors and inks. Therefore, we depend upon our customers’ ability to create markets for the consumer products which incorporate many of the flavors, fragrances, colors and inks which we manufacture.
| · | If we do not maintain an efficient cost structure, our profitability could decrease. |
Our success depends in part on our ability to maintain an efficient cost structure. We regularly initiate cost-reduction measures that could impact our manufacturing, sales, operations and information systems functions. If we do not continue to manage costs and achieve additional efficiencies, or we do not successfully implement related strategies, our competitiveness and our profits could decrease.
| · | Commodity, energy and transportation price volatility and increases or material shortages may reduce our profits. |
We use many different commodities as raw ingredients. We also use petroleum-based raw materials and other raw materials whose production is energy intensive. In addition, various energy sources are used in our production and distribution processes. Commodity and energy prices are subject to significant volatility caused by market fluctuations, supply and demand, currency fluctuation, production and transportation disruption, world events, and changes in governmental programs. Commodity and energy price increases will raise both our raw material costs and operating costs. We may not be able to increase our product prices enough to offset these increased costs. Increasing our prices also may reduce sales volume and related profitability.
In addition, we obtain some of the raw materials that we use from a single supplier or a limited number of suppliers, and problems with those suppliers could affect the availability of those materials. Even if there are multiple suppliers of a particular raw material, there are occasional shortages. An unavailability or shortage of a raw material could negatively affect our operations using that raw material and thus our results.
| · | There are many laws and regulations applicable to our industries. Compliance with those requirements is costly to us and can affect our operations. Failure to comply could also be costly and disruptive. |
Our facilities and products are subject to many laws and regulations relating to health, safety and the processing, packaging, storage, distribution, quality and safety of food, drugs, cosmetics and other consumer products, specialty inks and industrial colors. These laws and regulations are administered in the United States by the Department of Agriculture, the Food and Drug Administration, the Environmental Protection Agency, the Department of Labor and other federal and state governmental agencies. We are subject to similar governmental regulation and oversight abroad. Compliance with these laws and regulations can be costly and affect our operations. Also, if we fail to comply with applicable laws and regulations, we could be subject to administrative penalties and injunctive relief, civil remedies, fines and recalls of our products. Our customers, particularly those in the pharmaceutical industry, are also subject to laws and regulations which may impose costs on or create risk for us.
| · | Environmental compliance may be costly to us. |
Our operations are subject to extensive and increasingly stringent laws and regulations which pertain to the discharge of materials into the environment and the handling and disposition of wastes. These rules operate or will operate at both the federal and state levels in the United States, and there are analogous laws at many of our overseas locations. Environmental regulations, and the potential failure to comply with them, can have serious consequences, including the costs of compliance and defense, interference with our operations or the ability to obtain required permits, civil and administrative penalties and negative publicity.
| · | Operating in foreign countries and emerging markets exposes us to increased risks, including economic, political and international operation risks. |
We operate, manufacture and sell our products in many foreign countries and emerging markets. The international aspects of our business subject us to risks that could materially impact our operating results, including: difficulties in staffing and managing foreign personnel in diverse cultures; transportation delays or interruptions; and the effects of international political developments and political and economic instability. In addition, changes in policies by the United States or foreign governments could negatively affect our operating results due to changes in duties, tariffs, trade regulations, taxes or limitations on currency or fund transfers.
| · | We depend on certain key personnel, and the loss or retirement of these persons may harm our business. |
Our success depends in large part on the continued service and availability of our key management and technical personnel, and on our ability to attract and retain qualified new personnel. The competition for these individuals can be significant, and the loss of key employees could harm our business. In addition, as some of these persons approach retirement age, we need to provide for smooth transitions, and our operations and results may be negatively affected if we are not able to do so.
| · | We may not successfully complete and integrate past and future acquisitions, which could adversely affect our operating results. |
We have acquired many companies and operations in the past and may continue growth by acquisition in the future. Our future growth through acquisitions could involve significant risks that may have a material adverse effect on us. We may also be at risk for factors associated with acquisitions that the Company has made in the past. Acquired companies may also have significant latent liabilities which may not be discovered before an acquisition or fully reflected in the price we pay.
We may also need to finance future acquisitions, and the terms of any financing, and the need to ultimately repay or refinance any indebtedness, may have negative effects on us. Acquisitions also could have a dilutive effect on our financial results. Acquisitions also generally result in goodwill, which would need to be written off against earnings in the future if it becomes impaired.
| · | Our ability to successfully maintain and upgrade our information technology systems, and to effectively respond to failures, disruptions or breaches of our information technology systems, may affect our competitiveness and our profits could decrease. |
Our success depends in part on our ability to maintain a current information technology platform for our business to operate. We routinely review and upgrade our information technology systems in order to better manage and report the sales, manufacturing and other operations of our business. If we do not continue to maintain our information technology platform and successfully implement upgrades to the system, our competitiveness and profits could decrease. Furthermore, our information technology systems may be susceptible to failures, disruptions, breaches and other similar cyber-security events. The impact of any such event and the effectiveness of our response thereto may adversely affect our operations and subject us to increased operating costs.
| · | World events and natural disasters are beyond our control and could affect our results. |
World events can adversely affect national, international and local economies. Economies can also be affected by natural disasters or by epidemics. Such events and conditions, as well as the current impairment of financial markets, have adversely affected and could continue to affect our revenues and profitability, particularly if they occur in locations in which we or our customers have significant operations. In addition, while we have manufacturing facilities throughout the world, certain of our facilities are the sole manufacturer of a specific product and a disruption in manufacturing could lead to increased costs of relocating or replacing the production of a product, or reformulating a product, which could have an adverse effect on our results.
The Company received comment letters from the staff of the Securities and Exchange Commission's Division of Corporation Finance dated June 24, 2015 and August 6, 2015 regarding its Annual Report on Form 10-K for the fiscal year ended December 31, 2014 and 2014 Annual Report to Shareholders. The Company responded to the staff comments on July 8, 2015 and August 18, 2015, respectively, with supplemental information and analyses. The staff comments related to various matters, including the Company’s disclosures of its restructuring activities, its treatment of long-lived assets, and its use of non-GAAP financial measures. The comment letters and the Company’s response letters are available on the Securities and Exchange Commission’s website.
As of the date of this annual report on Form 10-K, the Company has not received confirmation from the staff of the Division of Corporation Finance of the Securities and Exchange Commission that their review process relating to the comment letters had been completed. If the Company receives additional comments from the staff, the Company intends to attempt to resolve such additional comments promptly.
Refer to Item 3 for information about the informal inquiry the Company received from the staff of Securities and Exchange Commission’s Division of Enforcement on October 22, 2015.
We lease our corporate headquarters offices, which are located at 777 East Wisconsin Avenue, Milwaukee, Wisconsin. We own our Color Group headquarters offices located in St. Louis, Missouri and our Asia Pacific Group headquarters offices located in Keysborough, Australia. We own a part, and lease a part, of our Flavors & Fragrances Group headquarters offices located in Hoffman Estates, Illinois. The locations of our production properties by reportable segment are as follows:
Color Group:
U.S. – St. Louis, Missouri; and South Plainfield, New Jersey*.
International – Jundiai, Brazil*; Kingston, Ontario, Canada; Saint Ouen L’Aumone, France*; Geesthacht, Germany; Reggio Emilia, Italy; Lerma, Mexico; Johannesburg, South Africa; Morges, Switzerland; and Kings Lynn, United Kingdom*.
Flavors & Fragrances Group:
U.S. – Livingston and Turlock, California; Amboy, Illinois; Indianapolis, Indiana; Harbor Beach, Michigan; and Juneau, Wisconsin.
International – Heverlee, Belgium; Qingdao, China*; San Jose, Costa Rica*; Marchais and Strasbourg, France; Celaya and Tlalnepantla, Mexico; Elburg, Netherlands; Granada, Spain; and Wales and Milton Keynes, United Kingdom.
Asia Pacific:
U.S. – None.
International – Keysborough, Australia; Guangzhou, China*; Hitachi, Japan; Auckland, New Zealand; Manila, Philippines*; and Bangkok, Thailand*.
* Indicates a leased property at the location.
All properties are owned except as otherwise indicated above. All facilities are considered to be in good condition (ordinary wear and tear excepted) and suitable and adequate for the Company’s requirements.
Commercial Litigation
U.S. Equal Employment Opportunity Commission Civil Complaint
On September 21, 2015, the U.S. Equal Employment Opportunity Commission filed a civil complaint against Sensient Natural Ingredients LLC (SNI) in the U.S. District Court for the Eastern District of California. SNI is a wholly owned subsidiary of the Company. The EEOC’s complaint alleges that SNI failed to comply with the Americans with Disabilities Act (ADA), as amended, when it terminated five employees in 2011. The EEOC seeks to enjoin SNI from engaging in employment practices that discriminate on the basis of disability; asks the Court to order SNI to implement policies, practices, and programs to ensure it does not violate the ADA; and requests back pay with prejudgment interest, reinstatement, front pay, compensation for past and future pecuniary and non-pecuniary losses, and punitive damages on behalf of the five named former employees and any similarly aggrieved individuals. Recoverable compensatory and punitive damages are subject to statutory caps. The complaint does not request a specific damages amount. To date, the EEOC has provided the Company with a list of 13 additional potentially aggrieved former employees not listed in the complaint who may have been terminated in violation of the ADA during the relevant time period.
The Company is vigorously investigating the facts alleged in the complaint to determine what exposure SNI may have. Since 2013, SNI’s on-site human resources representatives have worked closely with both Company counsel and outside labor and employment counsel to ensure that all policies, procedures and actions, including terminations, comply with applicable law. At this early stage, it is not possible to assess the probability of any legal or financial exposure in this matter.
SEC Inquiry
On October 22, 2015, the Company received an informal inquiry from the staff of the Securities and Exchange Commission’s Division of Enforcement requesting the voluntary provision of documents and information generally related to the Company’s disclosures of its restructuring activities, its treatment of long-lived assets, and its use of non-GAAP financial measures in its SEC filings and 2014 Annual Report to Shareholders. The Company is fully cooperating with the inquiry and is unable to predict the outcome of the inquiry or its potential impact.
Other Claims and Litigation
The Company is involved in various other claims and litigation arising in the normal course of business. In the judgment of management, which relies in part on information from Company counsel, the ultimate resolution of these actions will not materially affect the consolidated financial statements of the Company.
Not applicable.
The executive officers of the Company and their ages as of February 19, 2016, are as follows:
|
Name
|
Age
|
Position
|
|
Paul Manning
|
41
|
President and Chief Executive Officer
|
|
John F. Collopy
|
46
|
Vice President and Treasurer
|
|
Michael C. Geraghty
|
54
|
President, Color Group
|
|
Gautam Grover
|
46
|
President, Flavors & Fragrances Group
|
|
John L. Hammond
|
69
|
Senior Vice President, General Counsel and Secretary
|
|
Jeffrey T. Makal
|
52
|
Vice President, Controller and Chief Accounting Officer
|
|
John J. Manning
|
47
|
Vice President and Assistant General Counsel
|
|
Kimberly A. Morin
|
53
|
Vice President, Human Resources
|
|
Stephen J. Rolfs
|
51
|
Senior Vice President and Chief Financial Officer
|
|
Robert J. Wilkins
|
59
|
President, Asia Pacific Group
|
The Company has employed all of the individuals named above, in substantively their current positions, for at least the past five years except as follows. Mr. Paul Manning has held his present office since February 2, 2014, and previously served as President and Chief Operating Officer (October 2012 – February 2014) and President, Color Group (2010 – October 2012). Mr. Geraghty has held his present office since October 18, 2012, and previously served as General Manager, Food Colors USA (April 2011 – October 2012). Mr. Grover has held his present office since December 3, 2015. Prior to joining the Company, Mr. Grover served as Vice President, Strategy and Vice President, Logistics Services for US Foods, Inc. from September 2012 to November 2015 and January 2013 to November 2015, respectively, and as Director, Strategy and Business Development and Business Director – Asia for Brady Corporation from 2009 to September 2012. Mr. John Manning has held his present office since January 2, 2013. Prior to joining the Company, Mr. John Manning served as an Assistant U.S. Attorney and Deputy Criminal Chief for the United States Attorney’s Office – Eastern District of Wisconsin from 2004 to December 2012 and 2006 to December 2012, respectively. Ms. Morin has held her present office since October 20, 2015, and previously served as Human Resources Director, Flavors & Fragrances Group (August 2013 – October 2015). Prior to joining the Company, Ms. Morin served as Vice President Human Resources for Harbor Light Hospice, Inc. from April 2012 to August 2013, and as Senior Human Resources Director of Exel from 2005 to April 2012. Mr. Rolfs has held his present position since February 7, 2015, and previously served as Senior Vice President, Administration (July 2013 – February 2015) and Vice President, Administration (2010 – July 2013).
| Item 5. | Market for the Registrant’s Common Equity, Related Stockholder Matters and Issuer Purchases of Equity Securities. |
The only market in which the common stock of the Company is traded is the New York Stock Exchange. The range of the high and low sales prices as quoted in the New York Stock Exchange – Composite Transaction tape for the common stock of the Company and the amount of dividends declared for the fiscal years 2015 and 2014 are set forth below:
|
Market Price
|
Dividends
Declared
|
|||||||||||
|
High
|
Low
|
Per Share
|
||||||||||
|
2015
|
||||||||||||
|
First Quarter
|
$
|
68.99
|
$
|
56.71
|
$
|
0.25
|
||||||
|
Second Quarter
|
70.53
|
64.04
|
0.25
|
|||||||||
|
Third Quarter
|
69.87
|
59.34
|
0.27
|
|||||||||
|
Fourth Quarter
|
67.47
|
59.54
|
0.27
|
|||||||||
|
2014
|
||||||||||||
|
First Quarter
|
$
|
57.11
|
$
|
46.08
|
$
|
0.48
|
||||||
|
Second Quarter
|
57.35
|
51.39
|
—
|
|||||||||
|
Third Quarter
|
56.99
|
51.60
|
0.25
|
|||||||||
|
Fourth Quarter
|
63.35
|
49.72
|
0.25
|
|||||||||
In 2015 and 2014, common stock dividends were paid on a quarterly basis, and it is expected that quarterly dividends will continue to be paid in the future. On July 23, 2015, the Company announced an increase in its cash dividend on its common stock from an annual rate of $1.00 per share to an annual rate of $1.08 per share, commencing with the quarterly dividend paid on September 1, 2015, to shareholders of record on August 7, 2015.
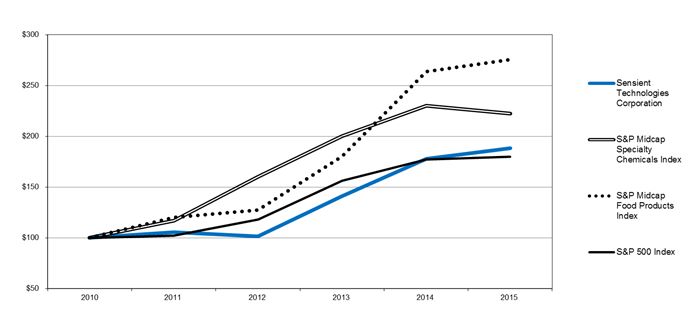
This graph compares the cumulative total shareholder return for the Company’s common stock over the last five years to the total returns on the Standard & Poor’s Midcap Specialty Chemicals Index (the “S&P Midcap Specialty Chemicals Index”), the Standard & Poor’s Midcap Food Products Index (the “S&P Midcap Food Products Index”) and the Standard & Poor’s 500 Stock Index (the “S&P 500 Index”). The graph assumes a $100 investment made on December 31, 2010, and reinvestment of dividends. The stock performance shown on the graph is not necessarily indicative of future price performance.
|
2010
|
2011
|
2012
|
2013
|
2014
|
2015
|
|||||||||||||||||||
|
Sensient Technologies Corporation
|
$
|
100
|
$
|
105
|
$
|
101
|
$
|
141
|
$
|
178
|
$
|
188
|
||||||||||||
|
S&P Midcap Specialty Chemicals Index
|
100
|
117
|
160
|
200
|
230
|
222
|
||||||||||||||||||
|
S&P Midcap Food Products Index
|
100
|
120
|
127
|
180
|
264
|
276
|
||||||||||||||||||
|
S&P 500 Index
|
100
|
102
|
118
|
156
|
177
|
180
|
||||||||||||||||||
Standard & Poor’s and S&P are registered trademarks of Standard & Poor’s Financial Services, LLC.
On August 21, 2014, the Board of Directors authorized the repurchase of up to five million shares. As of February 19, 2016, 2,966,062 shares had been repurchased under this authorization. The Company repurchased 201,811 shares during the fourth quarter of 2015 and a total of 2,733,301 shares during 2015.
The following table provides the specified information about the repurchases of shares by the Company during the fourth quarter of 2015.
|
Period
|
Total number of
shares purchased
|
Average price
paid per share
|
Total number of shares purchased as
part of a publicly announced plan
|
Maximum number of shares that may be
purchased under publicly announced plans
|
||||||||||||
|
October 1 to 31, 2015
|
-
|
$
|
-
|
-
|
2,329,269
|
|||||||||||
|
November 1 to 30, 2015
|
-
|
-
|
-
|
2,329,269
|
||||||||||||
|
December 1 to 31, 2015
|
201,811
|
62.83
|
201,811
|
2,127,458
|
||||||||||||
|
Total
|
201,811
|
$
|
62.83
|
201,811
|
||||||||||||
The number of shareholders of record on February 19, 2016, was 2,480.
Information regarding the Company’s equity compensation plans is incorporated by reference into Item 11 of Part III of this report.
The following selected financial data is derived from our consolidated financial statements. This data should be read in conjunction with the consolidated financial statements and notes thereto, and with Item 7, Management’s Discussion and Analysis of Financial Condition and Results of Operations.
Quarterly Data
|
(in thousands except per share amounts) (unaudited)
|
||||||||||||||||||||
|
First
Quarter
|
Second
Quarter
|
Third
Quarter
|
Fourth
Quarter
|
Full
Year
|
||||||||||||||||
|
2015
|
||||||||||||||||||||
|
Revenue
|
$
|
346,226
|
$
|
346,009
|
$
|
344,533
|
$
|
339,196
|
$
|
1,375,964
|
||||||||||
|
Gross profit
|
117,433
|
118,155
|
112,772
|
106,073
|
454,433
|
|||||||||||||||
|
Earnings from continuing operations
|
30,735
|
29,542
|
27,638
|
19,332
|
107,247
|
|||||||||||||||
|
Loss from discontinued operations, net of tax
|
(209
|
)
|
(92
|
)
|
(47
|
)
|
(114
|
)
|
(462
|
)
|
||||||||||
|
Net earnings
|
30,526
|
29,450
|
27,591
|
19,218
|
106,785
|
|||||||||||||||
|
Earnings per basic share:
|
||||||||||||||||||||
|
Continuing operations
|
0.65
|
0.64
|
0.61
|
0.43
|
2.34
|
|||||||||||||||
|
Discontinued operations
|
—
|
—
|
—
|
—
|
(0.01
|
)
|
||||||||||||||
|
Earnings per basic share
|
0.65
|
0.64
|
0.61
|
0.43
|
2.33
|
|||||||||||||||
|
Earnings per diluted share:
|
||||||||||||||||||||
|
Continuing operations
|
0.65
|
0.64
|
0.61
|
0.43
|
2.32
|
|||||||||||||||
|
Discontinued operations
|
—
|
—
|
—
|
—
|
(0.01
|
)
|
||||||||||||||
|
Earnings per diluted share
|
0.64
|
0.63
|
0.60
|
0.43
|
2.31
|
|||||||||||||||
|
2014
|
||||||||||||||||||||
|
Revenue
|
$
|
367,125
|
$
|
373,373
|
$
|
364,504
|
$
|
342,819
|
$
|
1,447,821
|
||||||||||
|
Gross profit
|
124,496
|
129,408
|
121,501
|
113,105
|
488,510
|
|||||||||||||||
|
Earnings from continuing operations
|
2,631
|
30,147
|
22,664
|
26,329
|
81,771
|
|||||||||||||||
|
Loss from discontinued operations, net of tax
|
(4,706
|
)
|
(1,086
|
)
|
(1,359
|
)
|
(974
|
)
|
(8,125
|
)
|
||||||||||
|
Net earnings
|
(2,075
|
)
|
29,061
|
21,305
|
25,355
|
73,646
|
||||||||||||||
|
Earnings per basic share:
|
||||||||||||||||||||
|
Continuing operations
|
0.05
|
0.62
|
0.47
|
0.55
|
1.69
|
|||||||||||||||
|
Discontinued operations
|
(0.09
|
)
|
(0.02
|
)
|
(0.03
|
)
|
(0.02
|
)
|
(0.17
|
)
|
||||||||||
|
Earnings per basic share
|
(0.04
|
)
|
0.60
|
0.44
|
0.53
|
1.52
|
||||||||||||||
|
Earnings per diluted share:
|
||||||||||||||||||||
|
Continuing operations
|
0.05
|
0.62
|
0.47
|
0.55
|
1.67
|
|||||||||||||||
|
Discontinued operations
|
(0.09
|
)
|
(0.02
|
)
|
(0.03
|
)
|
(0.02
|
)
|
(0.17
|
)
|
||||||||||
|
Earnings per diluted share
|
(0.04
|
)
|
0.59
|
0.44
|
0.53
|
1.51
|
||||||||||||||
Five Year Review
|
(in thousands except percentages, employee and per share data)
|
||||||||||||||||||||||||||||||||||||||||
|
Years ended December 31,
|
2015
|
2014
|
2013
|
2012
|
2011
|
|||||||||||||||||||||||||||||||||||
|
Summary of Operations
|
||||||||||||||||||||||||||||||||||||||||
|
Revenue
|
$
|
1,375,964
|
100.0
|
%
|
$
|
1,447,821
|
100.0
|
%
|
$
|
1,462,126
|
100.0
|
%
|
$
|
1,453,555
|
100.0
|
%
|
$
|
1,423,893
|
100.0
|
%
|
||||||||||||||||||||
|
Cost of products sold
|
921,531
|
67.0
|
959,311
|
66.3
|
987,080
|
67.5
|
990,911
|
68.2
|
975,494
|
68.5
|
||||||||||||||||||||||||||||||
|
Selling and administrative expenses
|
288,092
|
20.9
|
357,845
|
24.7
|
301,266
|
20.6
|
269,765
|
18.6
|
256,283
|
18.0
|
||||||||||||||||||||||||||||||
|
Operating income
|
166,341
|
12.1
|
130,665
|
9.0
|
173,780
|
11.9
|
192,879
|
13.3
|
192,116
|
13.5
|
||||||||||||||||||||||||||||||
|
Interest expense
|
16,945
|
1.2
|
16,067
|
1.1
|
16,147
|
1.1
|
16,901
|
1.2
|
19,439
|
1.4
|
||||||||||||||||||||||||||||||
|
Earnings before income taxes
|
149,396
|
10.9
|
114,598
|
7.9
|
157,633
|
10.8
|
175,978
|
12.1
|
172,677
|
12.1
|
||||||||||||||||||||||||||||||
|
Income taxes
|
42,149
|
3.1
|
32,827
|
2.3
|
43,335
|
3.0
|
50,896
|
3.5
|
51,279
|
3.6
|
||||||||||||||||||||||||||||||
|
Earnings from continuing operations
|
107,247
|
7.8
|
81,771
|
5.6
|
114,298
|
7.8
|
125,082
|
8.6
|
121,398
|
8.5
|
||||||||||||||||||||||||||||||
|
Loss from discontinued operations, net of tax
|
(462
|
)
|
—
|
(8,125
|
)
|
(0.6
|
)
|
(1,003
|
)
|
(0.1
|
)
|
(1,174
|
)
|
(0.1
|
)
|
(914
|
)
|
(0.1
|
)
|
|||||||||||||||||||||
|
Net earnings
|
$
|
106,785
|
7.8
|
%
|
$
|
73,646
|
5.1
|
%
|
$
|
113,295
|
7.7
|
%
|
$
|
123,908
|
8.5
|
%
|
$
|
120,484
|
8.5
|
%
|
||||||||||||||||||||
|
Earnings per basic share:
|
||||||||||||||||||||||||||||||||||||||||
|
Continuing operations
|
$
|
2.34
|
$
|
1.69
|
$
|
2.30
|
$
|
2.52
|
$
|
2.44
|
||||||||||||||||||||||||||||||
|
Discontinued operations
|
(0.01
|
)
|
(0.17
|
)
|
(0.02
|
)
|
(0.02
|
)
|
(0.02
|
)
|
||||||||||||||||||||||||||||||
|
Earnings per basic share
|
$
|
2.33
|
$
|
1.52
|
$
|
2.28
|
$
|
2.50
|
$
|
2.42
|
||||||||||||||||||||||||||||||
|
Earnings per diluted share:
|
||||||||||||||||||||||||||||||||||||||||
|
Continuing operations
|
$
|
2.32
|
$
|
1.67
|
$
|
2.29
|
$
|
2.51
|
$
|
2.43
|
||||||||||||||||||||||||||||||
|
Discontinued operations
|
(0.01
|
)
|
(0.17
|
)
|
(0.02
|
)
|
(0.02
|
)
|
(0.02
|
)
|
||||||||||||||||||||||||||||||
|
Earnings per diluted share
|
$
|
2.31
|
$
|
1.51
|
$
|
2.27
|
$
|
2.49
|
$
|
2.41
|
||||||||||||||||||||||||||||||
|
Other Related Data
|
||||||||||||||||||||||||||||||||||||||||
|
Dividends per share, declared and paid
|
$
|
1.04
|
$
|
0.98
|
$
|
0.91
|
$
|
0.87
|
$
|
0.84
|
||||||||||||||||||||||||||||||
|
Average common shares outstanding:
|
||||||||||||||||||||||||||||||||||||||||
|
Basic
|
45,910
|
48,525
|
49,755
|
49,596
|
49,746
|
|||||||||||||||||||||||||||||||||||
|
Diluted
|
46,204
|
48,819
|
49,934
|
49,822
|
49,937
|
|||||||||||||||||||||||||||||||||||
|
Book value per common share
|
$
|
18.78
|
$
|
21.94
|
$
|
24.72
|
$
|
23.09
|
$
|
20.87
|
||||||||||||||||||||||||||||||
|
Price range per common share
|
56.71 -
70.53
|
46.08 -
63.35
|
35.54 -
53.35
|
33.13 -
41.08
|
30.15 -
39.69
|
|||||||||||||||||||||||||||||||||||
|
Share price at December 31
|
62.82
|
60.34
|
48.52
|
35.56
|
37.90
|
|||||||||||||||||||||||||||||||||||
|
Capital expenditures
|
79,941
|
79,398
|
104,246
|
103,806
|
72,200
|
|||||||||||||||||||||||||||||||||||
|
Depreciation
|
46,694
|
50,225
|
50,716
|
46,992
|
44,771
|
|||||||||||||||||||||||||||||||||||
|
Amortization
|
1,245
|
1,231
|
1,300
|
1,360
|
1,328
|
|||||||||||||||||||||||||||||||||||
|
Total assets
|
1,711,437
|
1,765,206
|
1,870,734
|
1,776,643
|
1,654,164
|
|||||||||||||||||||||||||||||||||||
|
Long-term debt
|
613,877
|
451,011
|
348,124
|
333,979
|
312,422
|
|||||||||||||||||||||||||||||||||||
|
Total debt
|
634,532
|
466,899
|
355,174
|
354,027
|
335,396
|
|||||||||||||||||||||||||||||||||||
|
Shareholders’ equity
|
845,127
|
1,046,935
|
1,242,684
|
1,153,898
|
1,049,210
|
|||||||||||||||||||||||||||||||||||
|
Return on average shareholders’ equity
|
11.6
|
%
|
6.4
|
%
|
9.5
|
%
|
11.3
|
%
|
11.4
|
%
|
||||||||||||||||||||||||||||||
|
Total debt to total capital
|
42.9
|
%
|
30.8
|
%
|
22.2
|
%
|
23.5
|
%
|
24.2
|
%
|
||||||||||||||||||||||||||||||
|
Employees
|
4,032
|
4,053
|
4,130
|
3,983
|
3,887
|
|||||||||||||||||||||||||||||||||||
The 2015 results include a charge of $43.6 million ($33.6 million after tax, or $0.73 per share) related to the restructuring and other costs. These costs pertain to the Company’s 2014 Restructuring Plan related to eliminating underperforming operations, consolidating manufacturing facilities and improving efficiencies within the Company, and to acquisition related costs.
The 2014 results include a charge of $90.6 million ($65.5 million after tax, or $1.34 per share) related to the restructuring and other costs. These costs pertain to the Company’s 2014 Restructuring Plan related to eliminating underperforming operations, consolidating manufacturing facilities and improving efficiencies within the Company, and to proxy contest costs.
The 2013 results include a charge of $31.7 million ($22.0 million after tax, or $0.44 per share) related to the 2013 restructuring program related to the relocation of the Flavors & Fragrances Group headquarters to Chicago, as well as a profit improvement plan across all segments of the Company.
The 2011 results include a charge of $4.8 million ($3.7 million after tax, or $0.07 per share) related to the Company’s plan to improve the profitability and efficiency of selected operations. The 2011 results also include a gain of $3.6 million ($3.6 million after tax, or $0.07 per share) related to the revaluation of the Company’s non-controlling interest in a subsidiary.
OVERVIEW
Sensient Technologies Corporation (the “Company”) is a global developer, manufacturer and supplier of flavor and fragrance systems for the food, beverage, personal care and household-products industries. In addition, the Company is a developer, manufacturer and supplier of colors for businesses worldwide. The Company provides natural and synthetic color systems for use in foods, beverages and pharmaceuticals; colors and other ingredients for cosmetics, pharmaceuticals and specialty inks; and technical colors for industrial applications. The Company has three reporting segments: the Flavors & Fragrances segment; the Color segment; and the Asia Pacific segment.
The Company’s 2015 diluted earnings per share from continuing operations were $2.32 in 2015 and $1.67 in 2014. Included in the 2015 and 2014 results, were $43.6 million and $90.6 million, respectively, of restructuring and other costs, or 73 cents per share and $1.34 per share, respectively. Adjusted diluted earnings per share, which exclude these restructuring and other costs, were $3.05 in 2015 and $3.02 in 2014 (see discussion below regarding Non-GAAP Financial Measures and the Company’s Restructuring Activities).
In 2015, the Company continued a series of strategic initiatives to increase shareholder value. The Company’s restructuring activities continue to eliminate underperforming businesses and consolidate manufacturing operations. The Company continued to pay an uninterrupted since 1962 quarterly cash dividend and increased the quarterly dividend by 2 cents per share from 25 cents to 27 cents per share, or $1.08 per share on an annualized basis, in 2015. Furthermore, the Company repurchased $176.6 million of Company stock in 2015, which is in addition to the $137.2 million repurchased in 2014.
Additional information on the results is included below.
RESULTS OF CONTINUING OPERATIONS
2015 vs. 2014
Revenue
Sensient’s revenue was $1.4 billion in both 2015 and 2014. The impact of foreign exchange rates reduced consolidated revenue by 7.4% in 2015.
Gross Profit
The Company’s gross margin was 33.0% in 2015 and 33.7% in 2014. Included in the cost of products sold are $6.1 million and $1.9 million of restructuring costs for 2015 and 2014, respectively. The decrease in the gross margin is primarily due to the lower volumes in the Color segment’s specialty inks business and higher restructuring costs. Restructuring costs reduced gross margin by 50 basis points and 20 basis points in 2015 and 2014, respectively.
Selling and Administrative Expenses
Selling and administrative expense as a percent of revenue was 20.9% in 2015 and 24.7% in 2014. Restructuring and other costs of $37.5 million and $88.6 million for 2015 and 2014, respectively, were included in selling and administrative expense. The decrease in selling and administrative expense as a percent of revenue is primarily a result of the decrease in restructuring and other costs, and lower corporate expenses, primarily a reduction of performance based executive compensation costs of $6.8 million. Restructuring and other costs increased selling and administrative expense as a percent of revenue by 270 basis points and 610 basis points in 2015 and 2014, respectively.
Operating Income
Operating income was $166.3 million in 2015 and $130.7 million in 2014. Operating margins increased to 12.1% in 2015 from 9.0% in 2014. Restructuring and other costs reduced operating margins by 320 basis points and 630 basis points in 2015 and 2014, respectively.
Additional information on segment results can be found in the Segment Information section.
Interest Expense
Interest expense was $16.9 million in 2015 and $16.1 million in 2014. The increase in expense was primarily due to the increase in average debt outstanding which was partially offset by the lower average interest rates.
Income Taxes
The effective income tax rate was 28.2% in 2015 and 28.6% in 2014. The effective tax rates in both 2015 and 2014 were impacted by changes in estimates associated with the finalization of prior year tax items, audit settlements, mix of foreign earnings and restructuring costs. In total, net impact of the discrete items and restructuring costs reduced the effective income tax rate by 2.4% for 2015 and had no net impact on the rate in 2014.
|
2015
|
2014
|
|||||||
|
Rate before restructuring and discrete items
|
30.6
|
%
|
28.6
|
%
|
||||
|
Restructuring impact
|
0.9
|
%
|
0.8
|
%
|
||||
|
Discrete items
|
(3.3
|
%)
|
(0.8
|
%)
|
||||
|
Reported effective tax rate
|
28.2
|
%
|
28.6
|
%
|
||||
Acquisition
On June 29, 2015, the Company completed the acquisition of the business and net assets of Xennia Technology Ltd. (“Xennia”) for $8.4 million. The Xennia business has been integrated with the specialty inks business in the Color segment. The Company acquired goodwill and intangibles of approximately $6.2 million and has incurred acquisition related costs of $0.8 million, which are included in the Corporate & Other segment.
Restructuring
The Company incurred restructuring costs in both continuing and discontinued operations. The discussion in this note relates to the combination of both continuing and discontinued operations unless otherwise noted. Restructuring costs related to discontinued operations are recorded in discontinued operations within the Company’s Consolidated Statements of Earnings and are discussed in more detail in Note 13, Discontinued Operations.
In March of 2014, the Company announced that it was initiating a restructuring plan (2014 Restructuring Plan or “Plan”) to eliminate underperforming operations, consolidate manufacturing facilities and improve efficiencies within the Company. The Company determined that it had redundant manufacturing capabilities in both North America and Europe and that it could lower costs and operate more efficiently by consolidating into fewer facilities. Eight facilities were identified for consolidation in the Flavors & Fragrances segment, four in North America and four in Europe. To date, closures have been announced in Indianapolis, Indiana, United States; Cornwall, Mississauga and Halton Hills, Canada; Bremen, Germany; and Milan, Italy. The Company also discontinued one of the businesses in the Color segment, located near Leipzig, Germany, because it did not fit with the Company’s long term strategic plan and it had generated losses for several years. In 2015, the Company identified additional opportunities to consolidate manufacturing operations at one of the Color segment’s facilities in Europe and eliminate additional positions in the European Flavors & Fragrances businesses.
Based on this Plan, the Company determined that certain long-lived assets associated with the underperforming operations were impaired. The Company reduced the carrying amounts of these assets to their aggregate respective fair values which were determined based on independent market valuations. The fair values of the remaining long-lived assets are estimated to be approximately $19 million, which includes certain of the land, buildings and equipment in the assets held for sale, noted below. Also certain machinery and equipment has been identified to be disposed of at the time of the facility closures and the associated depreciation for these assets has been accelerated. The Company recorded long-lived asset impairments, including the impairment charges and accelerated depreciation of $14.5 million and $70.2 million, during the years ended December 31, 2015 and 2014, respectively. Since initiating the Plan, the Company has recorded $84.7 million of long-lived asset impairments, including the impairment charges and accelerated depreciation. In addition, certain intangible assets, inventory and other current assets were also determined to be impaired and were written down.
The Company has also incurred employee separation and other restructuring costs as a result of this Plan. The Company expects to reduce headcount by approximately 400 positions at the affected facilities, primarily in the Flavors & Fragrances segment, related to direct and indirect labor at manufacturing sites. As of December 31, 2015, approximately 220 positions have been eliminated as a result of this Plan.
As a part of the Plan, the Company anticipates selling its European Natural Ingredients business, a business in the Flavors & Fragrances segment, in 2016. This business has two facilities, located in Marchais, France and Elburg, the Netherlands, which will be included in the expected sale. The European Natural Ingredients business has not generated significant profits for several years and it does not fit with the Company’s long-term strategic plan. In connection with the anticipated sale of the European Natural Ingredients business, the Company has recorded an impairment charge of $2.0 million in 2015, reducing the carrying value of the long-lived assets for this business to zero. An estimate of the fair value of this business, less cost to sell, was determined to be lower than its carrying value. The difference between the fair value and its carrying value exceeded the existing net book value of the long-lived assets. Upon completion of the sale, the Company expects to recognize an additional non-cash loss of approximately $12.0 million.
The Company has recorded assets held for sale of land, buildings and equipment of $9.6 million related to the 2014 Restructuring Plan, and inventory, receivables and other assets of $21.4 million related to the anticipated sale of the European Natural Ingredients business. The Company also has $4.1 million of liabilities held for sale related to the anticipated sale of the European Natural Ingredients business.
The Company recorded total restructuring costs of $42.8 million and $98.4 million in the years ended December 31, 2015 and 2014, respectively, in accordance with GAAP and based on an internal review of the affected facilities and consultation with legal and other advisors. Since initiating the 2014 Restructuring Plan, the Company has incurred $141 million of restructuring costs through December 31, 2015. The Company expects to incur approximately $16 million of additional restructuring costs by the end of 2016.
The Company expects that the closure and sale of these operations will significantly lower the Company's operating costs over the next few years. Upon initiating the Plan, the Company estimated the annual cost reductions to be approximately $30 million, when fully implemented. The U.S. dollar has strengthened considerably since the initiation of the Plan, and based on the current exchange rates, the dollar value of the same cost savings would now be approximately $22 million. In 2015, the Company identified additional cost savings opportunities and as a result of these actions the current estimate of annual cost savings is approximately $27 million. The Company has already realized approximately $12 million of these cost savings, with approximately $3 million realized in 2014 and an additional $9 million in 2015. The Company expects to realize approximately $6 million to $7 million of incremental savings in 2016 and the remaining savings in 2017. The Company has also implemented price increases to further mitigate the impact of foreign currency movements.
In connection with the 2014 Restructuring Plan, the Company approved a plan to dispose of a certain business within the Color segment. Production ceased in 2014 and the business met the criteria to be reported as a discontinued operation. The pre-tax loss from discontinued operations, which includes restructuring costs, was not material in 2015 and $11.5 million in 2014.
NON-GAAP FINANCIAL MEASURES
Within the following tables, the Company reports certain non-GAAP financial measures, including: (1) adjusted operating income, adjusted net earnings and adjusted diluted EPS from continuing operations (which exclude restructuring costs, acquisition related costs, and costs related to the 2014 proxy contest) and (2) percentage changes in revenue, operating income, diluted EPS, adjusted operating income, and adjusted diluted EPS on a local currency basis which eliminates the effects that result from translating its international operations into U.S. dollars.
The Company has included each of these non-GAAP measures in order to provide additional information regarding our underlying operating results and comparable year-over-year performance. Such information is supplemental to information presented in accordance with GAAP and is not intended to represent a presentation in accordance with GAAP. These non-GAAP measures should not be considered in isolation. Rather, they should be considered together with GAAP measures and the rest of the information included in this report. Management internally reviews each of these non-GAAP measures to evaluate performance on a comparative period-to-period basis and to gain additional insight into underlying operating and performance trends, and the Company believes the information can be beneficial to investors for the same purposes. These non-GAAP measures may not be comparable to similarly titled measures used by other companies.
|
Twelve Months Ended December 31,
|
||||||||||||
| (In thousands except per share amounts) |
2015
|
2014
|
% Change
|
|||||||||
|
Operating Income from continuing operations (GAAP)
|
$
|
166,341
|
$
|
130,665
|
27.3
|
%
|
||||||
|
Restructuring - Cost of products sold
|
6,098
|
1,914
|
||||||||||
|
Restructuring & other (1) - Selling and administrative
|
37,528
|
88,636
|
||||||||||
|
Adjusted operating income
|
$
|
209,967
|
$
|
221,215
|
(5.1
|
%)
|
||||||
|
Net Earnings from continuing operations (GAAP)
|
$
|
107,247
|
$
|
81,771
|
31.2
|
%
|
||||||
|
Restructuring & other, before tax
|
43,626
|
90,550
|
||||||||||
|
Tax impact of restructuring & other
|
(10,017
|
)
|
(25,014
|
)
|
||||||||
|
Adjusted net earnings
|
$
|
140,856
|
$
|
147,307
|
(4.4
|
%)
|
||||||
|
Diluted EPS from continuing operations (GAAP)
|
$
|
2.32
|
$
|
1.67
|
38.9
|
%
|
||||||
|
Restructuring & other, net of tax
|
0.73
|
1.34
|
||||||||||
|
Adjusted diluted EPS
|
$
|
3.05
|
$
|
3.02
|
1.0
|
%
|
||||||
| (1) | “Other” consists of acquisition related costs incurred in 2015 and proxy contest costs incurred in 2014. The Company incurred $0.8 million of acquisition related costs in 2015 and $3.2 million of proxy contest costs in 2014. |
The following table summarizes the percentage change in the 2015 results compared to the 2014 results in the respective financial measures.
|
Twelve Months Ended December 31, 2015
|
||||||||||||
|
Total
(GAAP)
|
Foreign Exchange Rates
|
Local Currency
|
||||||||||
|
Revenue
|
||||||||||||
|
Flavors & Fragrances
|
(3.8
|
%)
|
(6.7
|
%)
|
2.9
|
%
|
||||||
|
Color
|
(7.5
|
%)
|
(8.9
|
%)
|
1.4
|
%
|
||||||
|
Asia Pacific
|
(2.1
|
%)
|
(6.4
|
%)
|
4.4
|
%
|
||||||
|
Total Revenue
|
(5.0
|
%)
|
(7.4
|
%)
|
2.5
|
%
|
||||||
|
Operating Income From Continuing Operations
|
||||||||||||
|
Flavors & Fragrances
|
0.8
|
%
|
(2.9
|
%)
|
3.7
|
%
|
||||||
|
Color
|
(16.9
|
%)
|
(8.8
|
%)
|
(8.1
|
%)
|
||||||
|
Asia Pacific
|
1.5
|
%
|
(5.1
|
%)
|
6.6
|
%
|
||||||
|
Corporate & Other
|
(41.4
|
%)
|
(9.9
|
%)
|
(31.5
|
%)
|
||||||
|
Operating Income from continuing operations
|
27.3
|
%
|
(1.5
|
%)
|
28.8
|
%
|
||||||
|
Diluted EPS from continuing operations
|
38.9
|
%
|
(1.2
|
%)
|
40.1
|
%
|
||||||
|
Adjusted operating income
|
(5.1
|
%)
|
(6.7
|
%)
|
1.6
|
%
|
||||||
|
Adjusted diluted EPS
|
1.0
|
%
|
(7.3
|
%)
|
8.3
|
%
|
||||||
SEGMENT INFORMATION
The Company determines its operating segments based on information utilized by its chief operating decision maker to allocate resources and assess performance. Segment performance is evaluated on operating income of the respective business units before restructuring charges which are reported in the Corporate & Other segment.
The Company’s reportable segments consist of the Flavors & Fragrances, Color, and Asia Pacific segments. The Asia Pacific segment, which was previously reported in the Corporate & Other segment, meets the quantitative thresholds outlined in Accounting Standards Codification (ASC) 280, Segment Reporting, to be reported separately as of December 31, 2015.
The results of operations for the Company’s businesses in Central and South America have been included in the Flavors & Fragrances segment, beginning in 2015. Previously, they had been reported in the Corporate & Other segment. In addition, the Flavors & Fragrances and Color segments have reassigned customer accounts and revised cost allocations amongst the businesses within their respective segments, resulting in changes in the underlying components of segment revenue and segment operating income. All prior year results have been restated to reflect each of these changes.
Flavors & Fragrances
Revenue for the Flavors & Fragrances segment was $819.0 million in 2015 and $851.5 million in 2014, a decrease of 3.8%. Foreign exchange rates reduced revenue 6.7% in 2015. The decrease in revenue was primarily due to lower revenue in Europe ($31.8 million) and Latin America ($2.6 million) partially offset by higher revenue in North America ($1.8 million). The lower revenue in Europe was primarily a result of the impact of unfavorable foreign exchange rates ($40.9 million) partially offset by higher selling prices ($6.9 million) and volumes ($2.3 million). The lower revenue in Latin America was a result of the impact of unfavorable exchange rates ($6.3 million) partially offset by higher selling prices ($2.9 million) and volumes ($0.8 million). The higher revenue in North America was primarily a result of higher selling prices ($13.2 million) partially offset by the impact of unfavorable exchange rates ($9.7 million) and volumes ($1.8 million).
Gross margin increased 20 basis points to 27.1% in 2015 from 26.9% in 2014. The increase was primarily due to the impact of higher selling prices, product mix and savings associated with the 2014 Restructuring Plan partially offset by higher raw material costs.
Segment operating income for the Flavors & Fragrances segment was $121.9 million in 2015 and $120.9 million in 2014, an increase of 0.8%. Foreign exchange rates reduced segment operating income by 2.9% in 2015. The higher segment operating income was primarily a result of higher segment operating income in Europe ($2.3 million) and lower segment operating income in North America ($1.2 million). The higher operating income in Europe was primarily due to higher selling prices ($6.9 million), product mix ($4.3 million) and savings associated with the Restructuring Plan ($2.0 million) partially offset by higher raw material costs ($7.0 million), manufacturing and other costs ($3.6 million) and unfavorable exchange rates ($0.3 million). The lower operating income in North America was primarily due to higher raw material costs ($14.3 million), higher production and other costs ($3.5 million), unfavorable exchange rates ($1.8 million) and unfavorable product mix ($1.6 million) partially offset by higher selling prices ($13.2 million), savings associated with the 2014 Restructuring Plan ($5.1 million) and volumes ($1.7 million). Segment operating margin increased 70 basis points in 2015 to 14.9% from 14.2% in 2014.
Color
Revenue for the Color segment was $470.9 million in 2015 and $509.3 million in 2014, a decrease of 7.5%. Foreign exchange rates reduced segment revenue 8.9% in 2015. The decrease in revenue was primarily due to lower revenue in non-food colors ($30.2 million) and food and beverage colors ($8.2 million). The lower revenue in non-food colors was primarily due to the impact of unfavorable exchange rates ($18.1 million), lower volumes ($13.6 million), primarily specialty inks, and lower selling prices ($5.1 million) partially offset by higher volumes resulting from the Xennia acquisition ($6.6 million). The lower revenue in food and beverage colors was primarily due to the impact of unfavorable exchange rates ($27.4 million), partially offset by higher selling prices ($13.1 million) and volumes ($6.1 million), which includes approximately $4 million from a one-off fourth quarter sale of natural colors.
Gross margin for the Color segment decreased 130 basis points to 40.3% in 2015 from 41.6% in 2014. The decrease was primarily due to the impact of the lower volumes, primarily specialty inks, and higher raw material costs, partially offset by higher selling prices and product mix.
Segment operating income for the Color segment was $94.8 million in 2015 and $114.0 million in 2014, a decrease of 16.9%. Foreign exchange rates reduced segment operating income by 8.8% in 2015. The lower segment operating income was due to lower non-food colors ($20.0 million) partially offset by higher food and beverage colors ($0.8 million). The lower operating income for non-food colors was primarily due to lower volumes ($8.0 million), primarily specialty inks, unfavorable exchange rates ($4.9 million), lower selling prices ($5.1 million) and higher manufacturing and other costs ($6.1 million) partially offset by favorable product mix ($3.9 million). The higher operating income for food and beverage colors was primarily due to the higher selling prices ($13.1 million), and higher volumes ($3.2 million), which includes approximately $2 million from a one-off fourth quarter sale of natural colors, partially offset by higher raw material costs ($10.6 million) and unfavorable exchange rates ($5.2 million). Segment operating margin was 20.1% in 2015 and 22.4% in 2014.
Asia Pacific
Revenue for the Asia Pacific segment was $130.6 million in 2015 and $133.3 million in 2014, a decrease of 2.1%. Foreign exchange rates reduced segment revenue by 6.4% in 2015. Higher volumes ($5.2 million) and selling prices ($0.8 million) were offset by unfavorable exchange rates ($8.6 million).
Gross margin for the Asia Pacific segment increased 60 basis points to 37.5% in 2015 from 36.9% in 2014. The increase was primarily due to the higher selling prices and favorable product mix.
Segment operating income for the Asia Pacific segment was $25.5 million in 2015 and $25.1 million in 2014, an increase of 1.5%. Foreign exchange rates reduced segment operating income by 5.1% in 2015. The higher segment operating income was a result of the higher volumes ($1.9 million), product mix ($1.1 million) and selling prices ($0.8 million) partially offset by the impact of unfavorable exchange rates ($1.3 million) and higher manufacturing and other costs ($2.1 million). Segment operating margin was 19.5% in 2015 and 18.8% in 2014.
Corporate & Other
The Corporate & Other expenses were $75.8 million in 2015 and $129.4 million in 2014, a decrease of 41.4%, primarily due to lower restructuring costs and lower costs for performance based compensation. The Company evaluates segment performance before restructuring costs, and reports all of the restructuring and other costs in the Corporate & Other segment. Restructuring and other costs were $43.6 million and $90.6 million in 2015 and 2014, respectively.
RESULTS OF CONTINUING OPERATIONS
2014 vs. 2013
Revenue
Sensient’s revenue was approximately $1.4 billion in 2014 and $1.5 billion in 2013. The impact of foreign exchange rates reduced consolidated revenue by 1.1% in 2014.
Gross Profit
The Company’s gross margin was 33.7% in 2014 and 32.5% in 2013. The increase in gross margin is primarily due to an increase in selling prices. Restructuring costs reduced gross margin 20 basis points and 10 basis points in 2014 and 2013, respectively.
Selling and Administrative Expense
Selling and administrative expense as a percent of revenue was 24.7% in 2014 compared to 20.6% in 2013. The increase in selling and administrative expenses during 2014 was attributable to the increase in restructuring costs of $88.6 million recorded in 2014 compared to $30.0 million recorded in 2013. Restructuring and other costs increased selling and administrative expenses as a percent of revenue by 610 basis points and 200 basis points in 2014 and 2013, respectively.
Operating Income
Operating income was $130.7 million in 2014 compared to $173.8 million in 2013. The decrease in operating income was primarily attributable to the increase in restructuring costs in 2014 compared to 2013. Operating margins decreased 290 basis points to 9.0% in 2015 from 11.9% in 2014. Restructuring and other costs reduced operating margins by 630 basis points and 220 basis points in 2014 and 2013, respectively.
Additional information on segment results can be found in the Segment Information section.
Interest Expense
Interest expense was $16.1 million in both 2014 and 2013. The decrease in average interest rates offset the higher average outstanding debt balance.
Income Taxes
The effective income tax rate was 28.6% in 2014 and 27.5% in 2013. The effective tax rates for both 2014 and 2013 were affected by discrete items, including the favorable resolution of prior years’ tax matters and restructuring costs. In total, the discrete items and the impact of restructuring costs had no impact on the effective tax rate for 2014 and reduced the effective tax rate by 2.0% in 2013.
|
2014
|
2013
|
|||||||
|
Rate before restructuring and discrete items
|
28.6
|
%
|
29.5
|
%
|
||||
|
Restructuring impact
|
0.8
|
%
|
(0.3
|
%)
|
||||
|
Discrete items
|
(0.8
|
%)
|
(1.7
|
%)
|
||||
|
Reported effective tax rate
|
28.6
|
%
|
27.5
|
%
|
||||
Restructuring Activities
In 2014, the Company announced that it was initiating its 2014 Restructuring Plan. The Company recorded $98.4 million of restructuring costs in 2014. For further information on the 2014 Restructuring Plan, see the discussion on pages 15 and 16 of Management’s Discussion and Analysis of Operations and Financial Condition.
In 2013, the Company successfully completed its 2013 restructuring program related to relocating the Flavors & Fragrances segment headquarters to Chicago, and generating operating efficiencies across all segments of the Company by consolidating multiple facilities throughout Europe and North America. The Company recorded total costs of $31.7 million in 2013 related to the 2013 restructuring program. The plan resulted in the reduction of global headcount of approximately 280 employees performing various functions. Management estimates that operating costs were reduced by approximately $12 million and $7 million as of December 31, 2014 and 2013, respectively.
NON-GAAP FINANCIAL MEASURES
Within the following tables, the Company reports certain non-GAAP financial measures, including: (1) adjusted operating income, adjusted net earnings and adjusted diluted EPS from continuing operations (which exclude restructuring costs, and costs related to the 2014 proxy contest) and (2) percentage changes in revenue, operating income, diluted EPS, adjusted operating income, and adjusted diluted EPS on a local currency basis which eliminates the effects that result from translating its international operations into U.S. dollars.
The Company has included each of these non-GAAP measures in order to provide additional information regarding our underlying operating results and comparable year-over-year performance. Such information is supplemental to information presented in accordance with GAAP and is not intended to represent a presentation in accordance with GAAP. These non-GAAP measures should not be considered in isolation. Rather, they should be considered together with GAAP measures and the rest of the information included in this report. Management internally reviews each of these non-GAAP measures to evaluate performance on a comparative period-to-period basis and to gain additional insight into underlying operating and performance trends, and the Company believes the information can be beneficial to investors for the same purposes. These non-GAAP measures may not be comparable to similarly titled measures used by other companies.
|
Twelve Months Ended December 31,
|
||||||||||||
| (In thousands except per share amounts) |
2014
|
2013
|
% Change
|
|||||||||
|
Operating Income from continuing operations (GAAP)
|
$
|
130,665
|
$
|
173,780
|
(24.8
|
)%
|
||||||
|
Restructuring - Cost of products sold
|
1,914
|
1,840
|
||||||||||
|
Restructuring & other (1) - Selling and administrative
|
88,636
|
29,895
|
||||||||||
|
Adjusted operating income
|
$
|
221,215
|
$
|
205,515
|
7.6
|
%
|
||||||
|
Net Earnings from continuing operations (GAAP)
|
$
|
81,771
|
$
|
114,298
|
(28.5
|
)%
|
||||||
|
Restructuring & other, before tax
|
90,550
|
31,735
|
||||||||||
|
Tax impact of restructuring & other
|
(25,014
|
)
|
(9,776
|
)
|
||||||||
|
Adjusted net earnings
|
$
|
147,307
|
$
|
136,257
|
8.1
|
%
|
||||||
|
Diluted EPS from continuing operations (GAAP)
|
$
|
1.67
|
$
|
2.29
|
(27.1
|
)%
|
||||||
|
Restructuring & other, net of tax
|
1.34
|
0.44
|
||||||||||
|
Adjusted diluted EPS
|
$
|
3.02
|
$
|
2.73
|
10.6
|
%
|
||||||
| (1) | “Other” consists of $3.2 million of proxy contest costs incurred in 2014. |
The following table summarizes the percentage change in the 2014 results compared to the 2013 results in the respective financial measures.
|
Twelve Months Ended December 31, 2014
|
||||||||||||
|
Total
(GAAP)
|
Foreign
Exchange
Rates
|
Local Currency
|
||||||||||
|
Revenue
|
||||||||||||
|
Flavors & Fragrances
|
(3.3
|
%)
|
(0.6
|
%)
|
(2.7
|
)%
|
||||||
|
Color
|
2.6
|
%
|
(1.1
|
%)
|
3.7
|
%
|
||||||
|
Asia Pacific
|
0.5
|
%
|
(3.3
|
%)
|
3.8
|
%
|
||||||
|
Total Revenue
|
(1.0
|
%)
|
(1.1
|
%)
|
0.1
|
%
|
||||||
|
Operating Income From Continuing Operations
|
||||||||||||
|
Flavors & Fragrances
|
(0.8
|
%)
|
(0.7
|
%)
|
(0.1
|
%)
|
||||||
|
Color
|
6.3
|
%
|
(0.7
|
%)
|
7.0
|
%
|
||||||
|
Asia Pacific
|
13.4
|
%
|
(2.8
|
%)
|
16.2
|
%
|
||||||
|
Corporate & Other
|
(67.1
|
%)
|
-
|
(67.1
|
%)
|
|||||||
|
Operating Income from continuing operations
|
(24.8
|
%)
|
(1.3
|
%)
|
(23.6
|
%)
|
||||||
|
Diluted EPS from continuing operations
|
(27.1
|
%)
|
(1.3
|
%)
|
(25.8
|
%)
|
||||||
|
Adjusted operating income
|
7.6
|
%
|
(1.1
|
%)
|
8.7
|
%
|
||||||
|
Adjusted diluted EPS
|
10.6
|
%
|
(1.1
|
%)
|
11.7
|
%
|
||||||
SEGMENT INFORMATION
The Company’s reportable segments consist of the Flavors & Fragrances, Color, and Asia Pacific segments. The Asia Pacific segment, which was previously reported in the Corporate & Other segment, meets the quantitative thresholds outlined in ASC 280, Segment Reporting, to be reported separately as of December 31, 2015.
The results of operations for the Company’s businesses in Central and South America have been included in the Flavors & Fragrances segment, beginning in 2015. Previously, they had been reported in the Corporate & Other segment. In addition, the Flavors & Fragrances and Color segments have reassigned customer accounts and revised cost allocations amongst the businesses within their respective segments, resulting in changes in the underlying components of segment revenue and segment operating income. All prior year results have been restated to reflect each of these changes.
Flavors & Fragrances
Revenue for the Flavors & Fragrances segment was $851.5 million in 2014 and $880.6 million in 2013, a decrease of 3.3%. Foreign exchange rates decreased revenue by 0.6% in 2014. The decrease in revenue was primarily due to lower revenue in North America ($29.4 million) and Latin America ($1.2 million) partially offset by higher revenue in Europe ($1.6 million). The lower revenue in North America is primarily due to lower volumes ($41.6 million), mainly lower natural ingredient volumes, and unfavorable exchange rates ($5.8 million) partially offset by higher selling prices ($18.0 million). The lower revenue in Latin America was primarily due to unfavorable exchange rates ($1.7 million) and lower volumes ($0.9 million) partially offset by higher selling prices ($1.4 million). The higher revenue in Europe was primarily due to favorable foreign exchange rates ($2.5 million) partially offset by unfavorable volumes ($0.9 million).
Gross margin increased 130 basis points to 26.9% in 2014 from 25.6% in 2013. The increase was primarily due to the impact of higher selling prices partially offset by the lower volumes.
Segment operating income for the Flavors & Fragrances segment was $120.9 million in 2014 and $121.8 million in 2013, a decrease of 0.8%. Foreign exchange rates reduced segment operating income by 0.7%. Higher profit in Latin America ($0.7 million) was offset by lower profit in North America ($0.7 million) and Europe ($0.9 million). The higher profit in Latin America was primarily due to higher selling prices ($1.4 million) partially offset by unfavorable exchange rates ($0.3 million) and other items ($0.4 million). The lower profit in North America was primarily due to lower volumes ($11.6 million), mainly natural ingredients, higher manufacturing and other costs ($8.6 million) and unfavorable exchange rates ($1.0 million) partially offset by higher selling prices ($18.0 million), product mix ($1.0 million) and savings associated with the restructuring program ($1.5 million). The lower profit in Europe was primarily due to higher employee costs ($4.4 million) partially offset by favorable raw material costs ($1.7 million), manufacturing and other costs ($1.4 million) and exchange rates ($0.5 million). Segment operating margin for the Flavors & Fragrances segment was 14.2% and 13.8% in 2014 and 2013, respectively.
Color
Revenue for the Color segment was $509.3 million in 2014 and $496.3 million in 2013, an increase of 2.6%. Foreign exchange rates reduced revenue by 1.1% in 2014. The increase in revenue was primarily due to higher sales of non-food colors ($12.4 million) and food and beverage colors ($0.6 million). The higher sales of non-food colors was primarily due to higher volumes ($12.4 million) and the higher sales of food and beverage colors was primarily due to higher selling prices ($6.5 million) partially offset by unfavorable exchange rates ($5.0 million) and lower volumes ($1.0 million).
Gross margin for the Color segment increased 70 basis points to 41.6% in 2014 from 40.9% in 2013. The increase was primarily due to the impact of higher selling prices and the higher volumes.
Segment operating income for the Color segment was $114.0 million in 2014 and $107.2 million in 2013, an increase of 6.3%. Foreign exchange rates decreased segment operating income by 0.7% in 2014. The increase was primarily due to non-food colors ($5.4 million) and food and beverage colors ($1.4 million). The higher profit for non-food colors was primarily due to the higher volumes and favorable product mix ($10.5 million) partially offset by higher salaries and wages ($3.0 million) and raw material costs ($2.1 million). The higher profit for food and beverage colors was primarily due to higher selling prices ($6.5 million) partially offset by higher raw material costs ($1.6 million), lower volumes and mix ($1.1 million), higher manufacturing and other costs ($1.3 million) and higher salaries and wages ($1.1 million). Segment operating margin for the Color segment increased 80 basis points to 22.4% in 2014 from 21.6% in 2013.
Asia Pacific
Revenue for the Asia Pacific segment was $133.3 million in 2014 and $132.6 million in 2013, an increase of 0.5%. Foreign exchange rates reduced revenue by 3.3% in 2014. The higher revenue was primarily due to higher volumes ($3.7 million) and selling prices ($1.3 million) partially offset by unfavorable exchange rates ($4.3 million).
Gross margin for the Asia Pacific segment increased 10 basis points to 36.9% in 2014 from 36.8% in 2013. The increase was primarily due to the higher volumes and selling prices.
Segment operating income for the Asia Pacific segment was $25.1 million in 2014 and $22.2 million in 2013, an increase of 13.4%. Foreign exchange rates reduced segment operating income by 2.8% in 2014. The higher profit was primarily a result of the higher volumes ($1.7 million), selling prices ($1.3 million) and lower other costs ($0.5 million) partially offset by the impact of unfavorable exchange rates ($0.6 million). Segment operating margin was 18.8% in 2014 and 16.7% in 2013.
Corporate & Other
Corporate & Other expenses were $129.4 million in 2014 and $77.4 million in 2013, an increase of 67.1%. The Company evaluates segment performance before restructuring costs, and reports all of the restructuring and other costs in the Corporate & Other segment. Restructuring and other costs were $90.6 million and $31.7 million in 2014 and 2013, respectively. The increased Corporate & Other costs in 2014 are due to the higher restructuring costs, offset by lower expenses for executive compensation.
LIQUIDITY AND FINANCIAL POSITION
Financial Condition
The Company’s financial position remains strong. The Company entered into an amendment to its credit agreement in November 2015, to increase and extend the maturity of its credit facility. The amended facility consists of a $170 million term loan and a $350 million revolving loan agreement, and it replaces the $450 million credit facility that that Company entered into in October 2014. The Company also issued new fixed rate notes of €67 million in November 2015. Proceeds from the new term loan and the sale of notes were used to refinance existing debt.
The Company expects its cash flow from operations, the new debt agreements and its existing debt capacity can be used to meet future cash requirements for operations, capital expenditures, dividend payments, acquisitions and stock repurchases. The impact of inflation on both the Company’s financial position and its results of operations has been minimal and is not expected to significantly affect 2016 results.
Cash Flows from Operating Activities
Net cash provided by operating activities was $128.1 million in 2015, $189.2 million in 2014 and $153.6 million in 2013. Operating cash flow provided the primary source of funds for operating needs, capital expenditures, shareholder dividends, acquisitions, and some share repurchases. The decrease in net cash provided by operating activities in 2015 is primarily due to the impact of foreign currency, higher payments of restructuring costs, and higher receivable balances. The increase in net cash provided by operating activities in 2014 was primarily due to higher earnings and working capital reductions in the second half of 2014.
Cash Flows from Investing Activities
Net cash used in investing activities was $75.8 million in 2015, $79.1 million in 2014 and $98.2 million in 2013. Capital expenditures were $79.9 million in 2015, $79.4 million in 2014 and $104.2 million in 2013.
Cash Flows from Financing Activities
Net cash used in financing activities was $50.1 million in 2015, $98.6 million in 2014 and $48.2 million in 2013. The Company had a net increase in debt of $174.6 million in 2015, a net increase in debt of $85.8 million in 2014 and a net decrease in debt of $3.7 million in 2013. In 2015, Sensient purchased $176.6 million of Company stock which settled before December 31, 2015, and purchased $137.2 million in 2014 of Company stock which settled before December 31, 2014. There were no purchases of Company stock in 2013.
The Company has paid uninterrupted quarterly cash dividends since commencing public trading in its stock in 1962. In the third quarter of 2015, the Company increased its quarterly dividend from 25 cents per share to 27 cents per share. Dividends paid per share were $1.04 in 2015, 98 cents in 2014 and 91 cents in 2013. Total dividends paid were $48.1 million, $47.9 million and $45.5 million in 2015, 2014, and 2013, respectively.
ISSUER PURCHASES OF EQUITY SECURITIES
Sensient purchased 2.7 million shares of Company stock in 2015 for a total cost of $178.0 million and 2.5 million shares of Company stock in 2014 for a total cost of $138.3 million. There were no purchases of Company stock in 2013. In July 2014, the Board approved a share repurchase program under which the Company was authorized to repurchase five million shares of Company stock in addition to amounts remaining from a prior Board authorization. As of December 31, 2015, 2.1 million shares were available to be repurchased under existing authorizations. The Company’s share repurchase program has no expiration date.
CRITICAL ACCOUNTING POLICIES
In preparing the financial statements in accordance with accounting principles generally accepted in the U.S., management is required to make estimates and assumptions that have an impact on the asset, liability, revenue and expense amounts reported. These estimates can also affect supplemental information disclosures of the Company, including information about contingencies, risk and financial condition. The Company believes, given current facts and circumstances, that its estimates and assumptions are reasonable, adhere to accounting principles generally accepted in the U.S. and are consistently applied. Inherent in the nature of an estimate or assumption is the fact that actual results may differ from estimates and estimates may vary as new facts and circumstances arise. The Company makes routine estimates and judgments in determining the net realizable value of accounts receivable, inventories, property, plant and equipment, and prepaid expenses. Management believes the Company’s most critical accounting estimates and assumptions are in the following areas:
Revenue Recognition
The Company recognizes revenue (net of estimated discounts, allowances and returns) when title passes, the customer is obligated to pay the Company and the Company has no remaining obligations. Such recognition typically corresponds with the shipment of goods.
Goodwill Valuation
The Company reviews the carrying value of goodwill annually utilizing several valuation methodologies, including a discounted cash flow model. The Company completed its annual goodwill impairment test under ASC 350, Intangibles – Goodwill and Other, in the third quarter of 2015. In conducting its annual test for impairment, the Company performed a qualitative assessment of its previously calculated fair values for each of its reporting units and compared each of these values to the net book value of each reporting unit. Fair value is estimated using both a discounted cash flow analysis and an analysis of comparable company market values. If the fair value of a reporting unit exceeds its net book value, no impairment exists. The Company has three reporting units that had goodwill recorded and were tested for impairment. All three reporting units had fair values that were over 100% above their respective net book values. Changes in estimates of future cash flows caused by items such as unforeseen events or changes in market conditions could negatively affect the reporting units’ fair value and result in an impairment charge.
Income Taxes
The Company estimates its income tax expense in each of the taxing jurisdictions in which it operates. The Company is subject to a tax audit in each of these jurisdictions, which could result in changes to the estimated tax expense. The amount of these changes would vary by jurisdiction and would be recorded when probable and estimable. These changes could impact the Company’s financial statements. Management has recorded valuation allowances to reduce the Company’s deferred tax assets to the amount that is more likely than not to be realized. Examples of deferred tax assets include deductions, net operating losses and tax credits that the Company believes will reduce its future tax payments. In assessing the future realization of these assets, management has considered future taxable income and ongoing tax planning strategies. An adjustment to the recorded valuation allowance as a result of changes in facts or circumstances could result in a significant change in the Company’s tax expense. The Company does not provide for deferred taxes on unremitted earnings of foreign subsidiaries which are considered to be invested indefinitely.
Inventories
Inventories are stated at the lower of cost or market. Cost is determined using the first-in, first-out (“FIFO”) method with the exception of certain locations of the Flavors & Fragrances Group where cost is determined using a weighted average method. Market is determined on the basis of estimated realizable values. Cost includes direct materials, direct labor and manufacturing overhead.
The Company estimates any required write-downs for inventory obsolescence by examining inventories on a quarterly basis to determine if there are any damaged items or slow moving products in which the carrying values could exceed net realizable value. Inventory write-downs are recorded as the difference between the cost of inventory and its estimated market value. While significant judgment is involved in determining the net realizable value of inventory, the Company believes that inventory is appropriately stated at the lower of cost of market.
Commitments and Contingencies
The Company is subject to litigation and other legal proceedings arising in the ordinary course of its businesses or arising under provisions related to the protection of the environment. Estimating liabilities and costs associated with these matters requires the judgment of management, who rely in part on information from Company legal counsel. When it is probable that the Company has incurred a liability associated with claims or pending or threatened litigation matters and the Company’s exposure is reasonably estimable, the Company records a charge against earnings. The Company recognizes related insurance reimbursement when receipt is deemed probable. The Company’s estimate of liabilities and related insurance recoveries may change as further facts and circumstances become known.
CONTRACTUAL OBLIGATIONS
The Company is subject to certain contractual obligations, including long-term debt, operating leases, manufacturing purchases and pension benefit obligations. The Company had unrecognized tax benefits of $6.1 million as of December 31, 2015. However, the Company cannot make a reasonably reliable estimate of the period of potential cash settlement of the liabilities and, therefore, has not included unrecognized tax benefits in the following table of significant contractual obligations as of December 31, 2015.
PAYMENTS DUE BY PERIOD
|
(in thousands)
|
Total
|
1 year
|
2-3 years
|
4-5 years
|
> 5 years
|
|||||||||||||||
|
Long-term debt
|
$
|
613,877
|
$
|
45,869
|
$
|
142,794
|
$
|
235,357
|
$
|
189,857
|
||||||||||
|
Interest payments on long-term debt
|
61,958
|
16,599
|
23,673
|
17,615
|
4,071
|
|||||||||||||||
|
Operating lease obligations
|
26,038
|
9,768
|
10,555
|
3,886
|
1,829
|
|||||||||||||||
|
Manufacturing purchase commitments
|
58,610
|
56,360
|
1,575
|
675
|
-
|
|||||||||||||||
|
Pension funding obligations
|
32,294
|
7,092
|
6,152
|
4,016
|
15,034
|
|||||||||||||||
|
Total contractual obligations
|
$
|
792,777
|
$
|
135,688
|
$
|
184,749
|
$
|
261,549
|
$
|
210,791
|
||||||||||
NEW PRONOUNCEMENTS
In November 2015, the Financial Accounting Standards Board (“FASB”) issued Accounting Standards Update (“ASU”) No. 2015-17, Balance Sheet Classification of Deferred Taxes, which will require entities to present deferred tax assets and deferred tax liabilities as noncurrent in a classified balance sheet. The ASU simplifies the current guidance, which requires entities to separately present deferred tax assets and deferred tax liabilities as current and noncurrent in a classified balance sheet. This guidance is effective for interim and annual periods beginning after December 31, 2016, with early adoption permitted. We are currently evaluating the expected impact of this standard, and do not expect it to be material to our financial statements.
In September 2015, the FASB issued ASU 2015-16, Simplifying the Accounting for Measurement-Period Adjustments, which requires the acquirer in a business combination to recognize adjustments to provisional amounts that are identified during the measurement period in the reporting period in which the adjustment amounts are determined. The financial statements should contain the effect on earnings of changes in depreciation, amortization or other income effects calculated as if the accounting had been completed at the acquisition date. This guidance is effective for interim and annual periods beginning after December 15, 2015, with early adoption permitted. The impact of this standard will not have a significant impact on the Company’s financial statements.
In July 2015, the FASB issued ASU No. 2015-11, Simplifying the Measurement of Inventory. Under this guidance, inventory that is accounted for using the first-in, first-out or average cost method shall be measured at the lower of cost or net realizable value, as opposed to the lower of cost or market measurement under current guidance. This guidance is effective for interim and annual periods beginning after December 15, 2016, with early adoption permitted. This new guidance is required to be retrospectively applied to all prior periods. We are currently evaluating the expected impact of this standard.
In July 2015, the FASB affirmed its proposed one-year deferral of the effective date for ASU No. 2014-09, Revenue from Contracts with Customers. Under this proposal, the requirements of the new standard are effective for interim and annual periods beginning after December 15, 2017. The proposal also permits entities to adopt the standard for interim and annual reporting periods beginning after December 15, 2016. We are currently evaluating the expected impact of this standard.
In April 2015, the FASB issued ASU No. 2015-03, Simplifying the Presentation of Debt Issuance Costs, which requires debt issuance costs to be presented in the balance sheet as a direct deduction from the carrying amount of the associated debt liability. Also, on August 18, 2015, the FASB issued ASU 2015-15, Presentation and Subsequent Measurement of Debt Issuance Costs Associated with Line-of-Credit Arrangements, to clarify that the SEC staff would not object to deferring and presenting debt issuance costs as an asset and subsequently amortizing deferred debt issuance costs ratably over the term of the line-of-credit arrangement. This guidance is effective for interim and annual periods beginning after December 15, 2015, with early adoption permitted. This new guidance is required to be retrospectively applied to all prior periods. The impact of this standard will not have a significant impact on the Company’s financial statements.
OFF-BALANCE SHEET ARRANGEMENTS
The Company had no off-balance sheet arrangements as of December 31, 2015.
The Company is exposed to market risks, including changes in interest rates, currency exchange rates and commodity prices. To manage the volatility relating to these exposures on a consolidated basis, the Company nets the exposures to take advantage of natural offsets. The Company also enters into various derivative transactions for some of the remaining exposures pursuant to the Company’s policies covering hedging practices. The financial impacts of these hedging instruments are offset by corresponding changes in the underlying exposures being hedged.
The Company does not hold or issue derivative financial instruments for trading purposes. Note 1 and Note 5 to the Consolidated Financial Statements include a discussion of the Company’s accounting policies for financial instruments.
A key part of the Company’s strategy is to expand into new geographic markets. Because the Company manufactures and sells its products throughout the world, it is exposed to movements in foreign currency exchange rates. The major foreign currency exposures involve the markets in Western Europe, Latin America and Canada. The primary purpose of the Company’s foreign currency hedging activities is to protect against the volatility associated with foreign currency sales, purchases of materials, and other assets and liabilities created during the normal course of business. The Company generally utilizes foreign exchange contracts with durations of less than 18 months that may or may not be designated as cash flow hedges under ASC 815, Derivatives and Hedging. The net fair value of these instruments, based on dealer quotes, was a liability of $0.2 million and $0.1 million as of December 31, 2015 and 2014, respectively. At December 31, 2015, the potential gain or loss in the fair value of the Company’s outstanding foreign exchange contracts, assuming a hypothetical 10% fluctuation in the currencies of such contracts, would be approximately $2.6 million. However, any change in the value of the contracts, real or hypothetical, would be significantly offset by a corresponding change in the value of the underlying hedged items. In addition, this hypothetical calculation assumes that each exchange rate would change in the same direction relative to the U.S. dollar.
The Company has certain debt denominated in Euros and Swiss Francs. These non-derivative debt instruments act as partial hedges of the Company’s Euro and Swiss Franc net asset positions. The potential increase or decrease in the annual U.S. dollar interest expense of the Company’s outstanding foreign currency-denominated debt, assuming a hypothetical 10% fluctuation in the currencies of such debt, would be approximately $0.3 million at December 31, 2015. However, any change in interest expense from fluctuations in currency, real or hypothetical, would be significantly offset by a corresponding change in the value of the foreign income before interest. In addition, this hypothetical calculation assumes that each exchange rate would change in the same direction relative to the U.S. dollar.
The Company manages its debt structure and interest rate risk through the use of fixed rate and floating rate debt and through the use of derivatives. The Company’s primary exposure is to interest rates in the U.S. and Western Europe. At December 31, 2015, the potential increase or decrease in annual interest expense, assuming a hypothetical 10% fluctuation in interest rates of floating rate debt, would be approximately $0.5 million.
The Company is the purchaser of certain commodities, such as corn, sugar, soybean meal and fruits. The Company generally purchases these commodities based upon market prices that are established with the vendor as part of the purchase process. In general, the Company does not use commodity financial instruments to hedge commodity prices due to a high correlation between the commodity cost and the ultimate selling price of the Company’s products. On occasion, the Company may enter into non-cancelable forward purchase contracts, as deemed appropriate, to reduce the effect of price fluctuations on future manufacturing requirements.
The financial statements required by this item are set forth on pages 28 through 53 below and the supplementary data required by this item are set forth on page 10 above.
None.
Evaluation of Disclosure Controls and Procedures. The Company carried out an evaluation, under the supervision and with the participation of management, including the Company’s President and Chief Executive Officer and its Senior Vice President and Chief Financial Officer, of the effectiveness, as of December 31, 2015, of the design and operation of the disclosure controls and procedures, as defined in Rule 13a-15(e) of the Act. Based upon that evaluation, the Company’s President and Chief Executive Officer and its Senior Vice President and Chief Financial Officer have concluded that the disclosure controls and procedures were effective as of December 31, 2015.
Management’s Report on Internal Control over Financial Reporting. The management of the Company is responsible for establishing and maintaining adequate internal control over financial reporting, as defined in Rule 13a-15(f) under the Act. It is management’s policy to maintain a control-conscious environment through an effective system of internal accounting controls. These controls are supported by the careful selection of competent and knowledgeable personnel and by the communication of standard accounting and reporting policies and procedures throughout the Company. The Company’s internal control over financial reporting is designed to provide reasonable assurance regarding the reliability of financial reporting and the preparation of financial statements for external purposes in accordance with generally accepted accounting principles. Management has assessed the effectiveness of the Company’s internal control over financial reporting as of December 31, 2015. In making its assessment of internal control over financial reporting, management used the criteria set forth by the Committee of Sponsoring Organizations of the Treadway Commission in Internal Control — Integrated Framework (2013 Framework). Based on that assessment, management has concluded that the Company’s internal control over financial reporting was effective as of December 31, 2015.
The Company’s internal control over financial reporting as of December 31, 2015, has been audited by Ernst & Young LLP, an independent registered public accounting firm. Their opinion on the Company’s internal control over financial reporting is set forth on page 55 below.
Because of its inherent limitations, internal control over financial reporting may not prevent or detect misstatements. Also, projections of any evaluation of effectiveness to future periods are subject to the risk that controls may become inadequate because of changes in conditions, or that the degree of compliance with the policies or procedures may deteriorate.
Changes in Internal Control over Financial Reporting. There has been no change in the Company’s internal control over financial reporting during the quarter ended December 31, 2015, that has materially affected, or is reasonable likely to materially affect, the Company’s internal control over financial reporting.
None.
Information required by this item regarding directors and officers, corporate governance and other matters appearing under “Election of Directors” and “Section 16(a) Beneficial Ownership Reporting Compliance” in the Proxy Statement for the Annual Meeting of Shareholders of the Company to be filed with the Commission within 120 days after December 31, 2015 (“2016 Proxy Statement”), is incorporated by reference. Additional information required by this item regarding executive officers appears at the end of Part I above, and information required by this item regarding codes of conduct and ethics for officers appears at the beginning of Part I above.
Information required by this item relating to compensation of directors and officers is incorporated by reference from the “Director Compensation and Benefits,” “Executive Compensation,” “Equity Compensation Plan Information” and “Employment Agreements” portions of the 2016 Proxy Statement. Information required by this item relating to the Compensation and Development Committee of the Company’s Board of Directors is incorporated by reference from the headings “Compensation and Development Committee Report” and “Committees of the Board of Directors” in the 2016 Proxy Statement.
| Item 12. | Security Ownership of Certain Beneficial Owners and Management and Related Stockholder Matters. |
The information required by this item regarding security ownership of certain beneficial owners and management and related stockholder matters appearing under “Principal Shareholders” in the 2016 Proxy Statement is incorporated by reference. The information required by this item regarding appearing under “Equity Compensation Plan Information” in the 2016 Proxy Statement is incorporated by reference.
The information required by this item regarding certain relationships and related party transactions and director independence appearing at the end of “Election of Directors” and under “Transactions With Related Persons” in the 2016 Proxy Statement, is incorporated by reference herein.
The disclosure regarding principal accountant fees and services appearing under “Audit Committee Report” in the 2016 Proxy Statement is incorporated by reference.
Documents filed:
|
1 and 2:
|
Financial Statements and Financial Statement Schedule. See below for “List of Financial Statements and Financial Statement Schedule.”
|
|
3:
|
See Exhibit Index following this report.
|
List of Financial Statements and Financial Statement Schedule
The following consolidated financial statements of Sensient Technologies Corporation and subsidiaries are included in this annual report on Form 10-K:
|
Report of Independent Registered Public Accounting Firm
|
54
|
|
|
Consolidated Balance Sheets – December 31, 2015 and 2014
|
30
|
|
|
Consolidated Statements of Earnings – Years ended December 31, 2015, 2014 and 2013
|
28
|
|
|
Consolidated Statements of Comprehensive Income – Years ended December 31, 2015, 2014 and 2013
|
29
|
|
|
Consolidated Statements of Shareholders’ Equity – Years ended December 31, 2015, 2014 and 2013
|
32
|
|
|
Consolidated Statements of Cash Flows – Years ended December 31, 2015, 2014 and 2013
|
31
|
|
|
Notes to Consolidated Financial Statements
|
33-53
|
|
Schedule II – Valuation and Qualifying Accounts
|
56
|
All other schedules are omitted because they are inapplicable, not required by the instructions or the information is included in the consolidated financial statements or notes thereto.
CONSOLIDATED STATEMENTS OF EARNINGS
|
Years Ended December 31,
|
||||||||||||
|
(in thousands except per share amounts)
|
2015
|
2014 | 2013 | |||||||||
|
Revenue
|
$
|
1,375,964
|
$
|
1,447,821
|
$
|
1,462,126
|
||||||
|
Cost of products sold
|
921,531
|
959,311
|
987,080
|
|||||||||
|
Selling and administrative expenses
|
288,092
|
357,845
|
301,266
|
|||||||||
|
Operating income
|
166,341
|
130,665
|
173,780
|
|||||||||
|
Interest expense
|
16,945
|
16,067
|
16,147
|
|||||||||
|
Earnings before income taxes
|
149,396
|
114,598
|
157,633
|
|||||||||
|
Income taxes
|
42,149
|
32,827
|
43,335
|
|||||||||
|
Earnings from continuing operations
|
107,247
|
81,771
|
114,298
|
|||||||||
|
Loss from discontinued operations, net of tax
|
(462
|
)
|
(8,125
|
)
|
(1,003
|
)
|
||||||
|
Net earnings
|
$
|
106,785
|
$ |
73,646
|
$
|
113,295
|
||||||
|
Earnings per common share:
|
||||||||||||
|
Basic:
|
||||||||||||
|
Continuing operations
|
$
|
2.34
|
$ |
1.69
|
$ |
2.30
|
||||||
|
Discontinued operations
|
(0.01
|
)
|
(0.17
|
) |
(0.02
|
) | ||||||
|
Earnings per common share
|
$
|
2.33
|
$ |
1.52
|
$ |
2.28
|
||||||
|
Diluted:
|
||||||||||||
|
Continuing operations
|
$
|
2.32
|
$
|
1.67
|
$ |
2.29
|
||||||
|
Discontinued operations
|
(0.01
|
)
|
(0.17
|
)
|
(0.02
|
) | ||||||
|
Earnings per common share
|
$
|
2.31
|
$
|
1.51
|
$ |
2.27
|
||||||
|
Weighted average number of common shares outstanding:
|
||||||||||||
|
Basic
|
45,910
|
48,525
|
49,755
|
|||||||||
|
Diluted
|
46,204
|
48,819
|
49,934
|
|||||||||
See notes to consolidated financial statements.
CONSOLIDATED STATEMENTS OF COMPREHENSIVE INCOME
|
(in thousands)
|
Years Ended December 31,
|
|||||||||||
|
2015
|
2014
|
2013
|
||||||||||
|
Net earnings
|
$
|
106,785
|
$
|
73,646
|
$
|
113,295
|
||||||
|
Cash flow hedges adjustment, net of tax of $61, $153 and $50, respectively
|
(160
|
)
|
423
|
(134
|
)
|
|||||||
|
Pension adjustment, net of tax of $613, $226 and $3,675, respectively
|
777
|
1,598
|
5,294
|
|||||||||
|
Foreign currency translation on net investment hedges
|
7,542
|
12,677
|
(4,020
|
)
|
||||||||
|
Tax effect of current year activity on net investment hedges
|
(2,966
|
)
|
(4,947
|
)
|
1,810
|
|||||||
|
Foreign currency translation on long-term intercompany loans
|
(10,681
|
)
|
(8,325
|
)
|
5,781
|
|||||||
|
Other foreign currency translation
|
(79,446
|
)
|
(92,556
|
)
|
1,856
|
|||||||
|
Total Comprehensive Income (Loss)
|
$
|
21,851
|
$
|
(17,484
|
)
|
$
|
123,882
|
|||||
See notes to consolidated financial statements.
CONSOLIDATED BALANCE SHEETS
|
(in thousands except share and per share amounts)
|
December 31,
|
|||||||
|
Assets
|
2015
|
2014
|
||||||
|
Current Assets:
|
||||||||
|
Cash and cash equivalents
|
$
|
11,997
|
$
|
20,329
|
||||
|
Trade accounts receivable, less allowance for losses of $3,871 and $3,838, respectively
|
232,047
|
228,907
|
||||||
|
Inventories
|
409,159
|
449,409
|
||||||
|
Prepaid expenses and other current assets
|
44,673
|
37,713
|
||||||
|
Deferred income taxes
|
24,438
|
21,735
|
||||||
|
Assets held for sale
|
31,029
|
1,296
|
||||||
|
Total current assets
|
753,343
|
759,389
|
||||||
|
Other assets
|
79,561
|
77,376
|
||||||
|
Intangible assets – at cost, less accumulated amortization of $15,176 and $14,390, respectively
|
9,209
|
8,760
|
||||||
|
Goodwill
|
399,646
|
424,114
|
||||||
|
Property, Plant and Equipment:
|
||||||||
|
Land
|
33,975
|
42,868
|
||||||
|
Buildings
|
274,318
|
295,381
|
||||||
|
Machinery and equipment
|
664,917
|
723,631
|
||||||
|
Construction in progress
|
62,515
|
54,579
|
||||||
|
1,035,725
|
1,116,459
|
|||||||
|
Less accumulated depreciation
|
(566,047
|
)
|
(620,892
|
)
|
||||
|
469,678
|
495,567
|
|||||||
|
Total assets
|
$
|
1,711,437
|
$
|
1,765,206
|
||||
|
Liabilities and Shareholders’ Equity
|
||||||||
|
Current Liabilities:
|
||||||||
|
Trade accounts payable
|
$
|
95,442
|
$
|
99,033
|
||||
|
Accrued salaries, wages and withholdings from employees
|
23,530
|
30,010
|
||||||
|
Other accrued expenses
|
61,701
|
76,383
|
||||||
|
Income taxes
|
7,504
|
3,591
|
||||||
|
Short-term borrowings
|
20,655
|
15,888
|
||||||
|
Liabilities held for sale
|
4,090
|
—
|
||||||
|
Total current liabilities
|
212,922
|
224,905
|
||||||
|
Deferred income taxes
|
12,970
|
—
|
||||||
|
Other liabilities
|
7,534
|
17,372
|
||||||
|
Accrued employee and retiree benefits
|
19,007
|
24,983
|
||||||
|
Long-term debt
|
613,877
|
451,011
|
||||||
|
Shareholders’ Equity:
|
||||||||
|
Common stock, par value $0.10 a share, authorized 100,000,000 shares; issued 53,954,874 shares
|
5,396
|
5,396
|
||||||
|
Additional paid‑in capital
|
109,974
|
110,969
|
||||||
|
Earnings reinvested in the business
|
1,302,302
|
1,243,627
|
||||||
|
Treasury stock, 9,174,843 and 6,529,891 shares, respectively, at cost
|
(402,483
|
)
|
(227,929
|
)
|
||||
|
Accumulated other comprehensive loss
|
(170,062
|
)
|
(85,128
|
)
|
||||
|
845,127
|
1,046,935
|
|||||||
|
Total liabilities and shareholders’ equity
|
$
|
1,711,437
|
$
|
1,765,206
|
||||
See notes to consolidated financial statements.
CONSOLIDATED STATEMENTS OF CASH FLOWS
|
(in thousands)
|
Years ended December 31,
|
|||||||||||
|
2015
|
2014
|
2013
|
||||||||||
|
Cash Flows from Operating Activities
|
||||||||||||
|
Net earnings
|
$
|
106,785
|
$
|
73,646
|
$
|
113,295
|
||||||
|
Adjustments to arrive at net cash provided by operating activities:
|
||||||||||||
|
Depreciation and amortization
|
47,939
|
51,456
|
52,016
|
|||||||||
|
Share-based compensation
|
1,598
|
6,265
|
8,430
|
|||||||||
|
Loss on assets
|
13,190
|
70,745
|
695
|
|||||||||
|
Deferred income taxes
|
(4,452
|
)
|
(16,780
|
)
|
(6,178
|
)
|
||||||
|
Changes in operating assets and liabilities:
|
||||||||||||
|
Trade accounts receivable
|
(21,721
|
)
|
(10,582
|
)
|
3,466
|
|||||||
|
Inventories
|
3,041
|
64
|
(30,217
|
)
|
||||||||
|
Prepaid expenses and other assets
|
2,698
|
6,479
|
616
|
|||||||||
|
Accounts payable and other accrued expenses
|
(8,792
|
)
|
6,745
|
3,606
|
||||||||
|
Accrued salaries, wages and withholdings from employees
|
(2,851
|
)
|
(365
|
)
|
5,384
|
|||||||
|
Income taxes
|
(5,520
|
)
|
7,047
|
(100
|
)
|
|||||||
|
Other liabilities
|
(3,868
|
)
|
(5,532
|
)
|
2,540
|
|||||||
|
Net cash provided by operating activities
|
128,047
|
189,188
|
153,553
|
|||||||||
|
Cash Flows from Investing Activities:
|
||||||||||||
|
Acquisition of property, plant and equipment
|
(79,941
|
)
|
(79,398
|
)
|
(104,246
|
)
|
||||||
|
Proceeds from sale of assets
|
12,912
|
1,029
|
6,225
|
|||||||||
|
Acquisition of new business
|
(8,393
|
)
|
—
|
—
|
||||||||
|
Other investing activities
|
(372
|
)
|
(780
|
)
|
(208
|
)
|
||||||
|
Net cash used in investing activities
|
(75,794
|
)
|
(79,149
|
)
|
(98,229
|
)
|
||||||
|
Cash Flows from Financing Activities
|
||||||||||||
|
Proceeds from additional borrowings
|
331,277
|
213,985
|
194,973
|
|||||||||
|
Debt payments
|
(156,662
|
)
|
(128,186
|
)
|
(198,686
|
)
|
||||||
|
Purchase of treasury stock
|
(176,566
|
)
|
(137,192
|
)
|
—
|
|||||||
|
Dividends paid
|
(48,110
|
)
|
(47,893
|
)
|
(45,513
|
)
|
||||||
|
Proceeds from options exercised and other equity transactions
|
(73
|
)
|
733
|
1,007
|
||||||||
|
Net cash used in financing activities
|
(50,134
|
)
|
(98,553
|
)
|
(48,219
|
)
|
||||||
|
Effect of exchange rate changes on cash and cash equivalents
|
(10,451
|
)
|
(10,993
|
)
|
(2,331
|
)
|
||||||
|
Net (decrease) increase in cash and cash equivalents
|
(8,332
|
)
|
493
|
4,774
|
||||||||
|
Cash and cash equivalents at beginning of year
|
20,329
|
19,836
|
15,062
|
|||||||||
|
Cash and cash equivalents at end of year
|
$
|
11,997
|
$
|
20,329
|
$
|
19,836
|
||||||
|
Cash paid during the year for:
|
||||||||||||
|
Interest
|
$
|
16,839
|
$
|
16,158
|
$
|
16,168
|
||||||
|
Income taxes
|
46,281
|
42,335
|
47,436
|
|||||||||
|
Capitalized interest
|
944
|
1,449
|
1,875
|
|||||||||
See notes to consolidated financial statements.
CONSOLIDATED STATEMENTS OF SHAREHOLDERS’ EQUITY
|
(in thousands except share and per share amounts)
|
Common
|
Additional
Paid-in
|
Earnings
Reinvested
in the
|
Treasury Stock
|
Accumulated
Other
Comprehensive
|
||||||||||||||||||||
|
Stock
|
Capital
|
Business
|
Shares
|
Amount
|
Income (Loss)
|
||||||||||||||||||||
|
Balances at December 31, 2012
|
$
|
5,396
|
$
|
98,253
|
$
|
1,150,092
|
4,264,821
|
$
|
(95,258
|
)
|
$
|
(4,585
|
)
|
||||||||||||
|
Net earnings
|
113,295
|
||||||||||||||||||||||||
|
Other comprehensive income
|
10,587
|
||||||||||||||||||||||||
|
Cash dividends paid – $0.91 per share
|
(45,513
|
)
|
|||||||||||||||||||||||
|
Share-based compensation
|
8,430
|
||||||||||||||||||||||||
|
Stock options exercised
|
(63
|
)
|
(47,584
|
)
|
1,063
|
||||||||||||||||||||
|
Non-vested stock issued upon vesting
|
(2,113
|
)
|
(94,600
|
)
|
2,113
|
||||||||||||||||||||
|
Benefit plans
|
385
|
(26,635
|
)
|
595
|
|||||||||||||||||||||
|
Other
|
227
|
9,825
|
(220
|
)
|
|||||||||||||||||||||
|
Balances at December 31, 2013
|
5,396
|
105,119
|
1,217,874
|
4,105,827
|
(91,707
|
)
|
6,002
|
||||||||||||||||||
|
Net earnings
|
73,646
|
||||||||||||||||||||||||
|
Other comprehensive income
|
(91,130
|
)
|
|||||||||||||||||||||||
|
Cash dividends paid – $0.98 per share
|
(47,893
|
)
|
|||||||||||||||||||||||
|
Share-based compensation
|
6,265
|
||||||||||||||||||||||||
|
Stock options exercised
|
(161
|
)
|
(27,001
|
)
|
753
|
||||||||||||||||||||
|
Non-vested stock issued upon vesting
|
(1,206
|
)
|
(40,300
|
)
|
1,206
|
||||||||||||||||||||
|
Benefit plans
|
510
|
(18,185
|
)
|
406
|
|||||||||||||||||||||
|
Purchase of treasury stock
|
2,500,000
|
(138,288
|
)
|
||||||||||||||||||||||
|
Other
|
442
|
9,550
|
(299
|
)
|
|||||||||||||||||||||
|
Balances at December 31, 2014
|
5,396
|
110,969
|
1,243,627
|
6,529,891
|
(227,929
|
)
|
(85,128
|
)
|
|||||||||||||||||
|
Net earnings
|
106,785
|
||||||||||||||||||||||||
|
Other comprehensive income
|
(84,934
|
)
|
|||||||||||||||||||||||
|
Cash dividends paid – $1.04 per share
|
(48,110
|
)
|
|||||||||||||||||||||||
|
Share-based compensation
|
1,598
|
||||||||||||||||||||||||
|
Stock options exercised
|
(356
|
)
|
(21,000
|
)
|
788
|
||||||||||||||||||||
|
Non-vested stock issued upon vesting
|
(3,080
|
)
|
(74,300
|
)
|
3,080
|
||||||||||||||||||||
|
Benefit plans
|
416
|
(15,165
|
)
|
546
|
|||||||||||||||||||||
|
Purchase of treasury stock
|
2,733,301
|
(178,037
|
)
|
||||||||||||||||||||||
|
Other
|
427
|
22,116
|
(931
|
)
|
|||||||||||||||||||||
|
Balances at December 31, 2015
|
$
|
5,396
|
$
|
109,974
|
$
|
1,302,302
|
9,174,843
|
$
|
(402,483
|
)
|
$
|
(170,062
|
)
|
||||||||||||
See notes to consolidated financial statements.
NOTES TO CONSOLIDATED FINANCIAL STATEMENTS
Years ended December 31, 2015, 2014 and 2013
1. Summary of Significant Accounting Policies
Nature of Operations
Sensient Technologies Corporation, together with its subsidiaries (the “Company”), is a leading global manufacturer and marketer of colors, flavors and fragrances. The Company uses advanced technologies at facilities around the world to develop specialty food and beverage systems, cosmetic and pharmaceutical systems, specialty inks and colors, and other specialty and fine chemicals. The Company’s reportable segments consist of the Flavors & Fragrances and Color Groups, which are managed on a products and services basis; the Asia Pacific Group, which is managed on a geographic basis; and Corporate & Other.
Principles of Consolidation and Basis of Presentation
The consolidated financial statements include the accounts of the Company and have been prepared in accordance with accounting principles generally accepted in the United States of America (“GAAP”). All significant intercompany accounts and transactions have been eliminated in consolidation.
The results of operations for one of the Company’s business units within the Color Group have been reported as a discontinued operation for all periods presented. The corresponding assets have been reclassified in accordance with the authoritative literature on assets held for sale as of December 31, 2015. See Note 13, Discontinued Operations, for further information regarding discontinued operations.
Use of Estimates
The preparation of the consolidated financial statements requires the use of management’s estimates and assumptions that affect reported amounts of assets, liabilities, revenue and expenses during the reporting period and the disclosure of contingent assets and liabilities at the date of the financial statements. Actual results could differ from those estimates.
Revenue Recognition
The Company recognizes revenue (net of estimated discounts, allowances and returns) when title to goods passes, the customer is obligated to pay the Company and the Company has no remaining obligations. Such recognition typically corresponds with the shipment of goods.
Cost of Products Sold
Cost of products sold includes materials, labor and overhead expenses incurred in the manufacture of our products. Cost of products sold also includes charges for obsolete and slow moving inventories, as well as costs for quality control, purchasing and receiving costs, inspection costs, warehousing costs, internal transfer costs, other costs of our internal distribution network and costs incurred for shipping and handling. The Company records fees billed to customers for shipping and handling as revenue.
Selling and Administrative Expenses
Selling and administrative expenses primarily include the salaries and related costs for executive, finance, accounting, human resources, information technology, research and development and legal personnel as well as salaries and related costs of salespersons and commissions paid to external sales agents.
Cash Equivalents
The Company considers all highly liquid investments with maturities of three months or less at the date of acquisition as cash equivalents.
Accounts Receivable
Receivables are recorded at their face amount, less an allowance for doubtful accounts. The allowance for doubtful accounts is based on customer-specific analysis and general matters such as current assessments of past due balances and economic conditions. Specific accounts are written off against the allowance for doubtful accounts when it is deemed that the receivable is no longer collectible.
Inventories
Inventories are stated at the lower of cost or market. Market is determined on the basis of estimated realizable values. Cost is determined using the first-in, first-out (“FIFO”) method with the exception of certain locations of the Flavors & Fragrances Group where cost is determined using a weighted average method. Inventories include finished and in-process products totaling $291.9 million and $308.7 million at December 31, 2015 and 2014, respectively, and raw materials and supplies of $117.3 million and $140.7 million at December 31, 2015 and 2014, respectively.
Property, Plant and Equipment
Property, plant and equipment are recorded at cost reduced by accumulated depreciation. Depreciation is provided over the estimated useful life of the related asset using the straight-line method for financial reporting. The estimated useful lives for buildings and leasehold improvements range from 5 to 40 years. Machinery and equipment have estimated useful lives ranging from 3 to 20 years. Interest costs on significant projects constructed or developed for the Company’s own use are capitalized as part of the asset.
Goodwill and Other Intangible Assets
The carrying value of goodwill is evaluated for impairment on an annual basis or more frequently when an indicator of impairment occurs. The impairment assessment includes comparing the carrying amount of net assets, including goodwill, of each reporting unit to its respective fair value as of the date of the assessment. Fair value was estimated based upon an evaluation of the reporting unit’s estimated future discounted cash flow as well as the public trading and private transaction valuation multiples for comparable companies. The Company performed such a quantitative analysis in 2014, which indicated a substantial premium compared to the carrying value of net assets, including goodwill. In 2015, the Company completed a qualitative assessment in comparison to the 2014 quantitative assessment, noting no indicators of a change in fair value. The Company did not record impairment charges for any of its reporting units in 2015, 2014 or 2013.
The cost of intangible assets with determinable useful lives is amortized on a straight-line basis to reflect the pattern of economic benefits consumed, ranging from 5 to 20 years. These assets include technological know-how, customer relationships, patents, trademarks and non-compete agreements, among others.
Impairment of Long-lived Assets
The Company reviews long-lived assets for impairment whenever events or changes in business circumstances indicate that the carrying amount of the assets may not be fully recoverable. The Company performs undiscounted cash flow analyses to determine if potential impairment exists. If impairment is determined to exist, any related impairment loss is calculated based on the difference between fair value and carrying value. Impairment losses were recorded as a result of the Company’s 2014 Restructuring Plan. See Note 12, Restructuring Charges, for additional information.
Derivative Financial Instruments
The Company selectively uses derivative financial instruments to reduce market risk associated with changes in foreign currency and interest rate exposures which exist as part of ongoing business operations. All derivative transactions are authorized and executed pursuant to the Company’s risk management policies and procedures, which strictly prohibit the use of financial instruments for speculative trading purposes.
The primary objectives of the foreign exchange risk management activities are to understand and mitigate the impact of potential foreign exchange fluctuations on the Company’s financial results and its economic well-being. Changes in the fair value of derivatives that are designated as fair value hedges, along with the gain or loss on the hedged item, are recorded in current period earnings. Generally, these risk management transactions involve the use of foreign currency derivatives to protect against exposure resulting from recorded accounts receivable and payable. The Company may utilize forward exchange contracts, generally with maturities of less than 18 months, which qualify as cash flow hedges. Generally, these foreign exchange contracts are intended to offset the effect of exchange rate fluctuations on non-functional currency denominated sales and purchases. For derivative instruments that are designated as cash flow hedges, gains and losses are deferred in accumulated other comprehensive (loss) income (“OCI”) until the underlying transaction is recognized in earnings.
Hedge effectiveness is determined by how closely the changes in the fair value of the hedging instrument offset the changes in the fair value or cash flows of the hedged item. Hedge accounting is permitted only if the hedging relationship is expected to be highly effective at the inception of the transaction and on an ongoing basis. Any ineffective portions are recognized in earnings immediately.
The Company’s existing cash flow hedges are highly effective. As a result, any current impact on earnings due to cash flow hedge ineffectiveness is immaterial.
Interest Rate Hedging
The Company is exposed to interest rate risk through its corporate borrowing activities. The objective of the Company’s interest rate risk management activities is to manage the levels of the Company’s fixed and floating interest rate exposure to be consistent with the Company’s preferred mix. The interest rate risk management program may include entering into interest rate swaps, which qualify as fair value hedges, when there is a desire to modify the Company’s exposure to interest rates. Gains or losses on fair value hedges are recognized in earnings, net of gains and losses on the fair value of the hedged instruments.
Net Investments Hedging
The Company may enter into foreign-denominated debt to be used as a non-derivative instrument to hedge the Company’s net investment in foreign subsidiaries. The change in the carrying amount of the foreign-denominated debt on the Company’s books, attributable to changes in the spot foreign exchange rate, is a hedge of the net investment in its foreign subsidiaries. Changes in the fair value of debt designated as a net investment hedge are recorded in foreign currency translation in OCI.
Commodity Purchases
The Company purchases certain commodities in the normal course of business that result in physical delivery of the goods and, hence, are excluded from ASC 815, Derivatives and Hedging.
Translation of Foreign Currencies
For all significant foreign operations, the functional currency is the local currency. Assets and liabilities of foreign operations are translated into U.S. dollars at current exchange rates. Revenue and expense accounts are translated into U.S. dollars at average exchange rates prevailing during the year. Adjustments resulting from the translation of foreign accounts into U.S. dollars are recorded in foreign currency translation in OCI. Transaction gains and losses that occur as a result of transactions denominated in non-functional currencies are included in earnings and were not significant during the three-year period ended December 31, 2015.
Share-Based Compensation
Share-based compensation expense is recognized over the vesting period of each award based on the fair value of the instrument at the time of grant as summarized in Note 6, Share-Based Compensation.
Income Taxes
The Company recognizes a current tax liability or asset for the estimated taxes payable or refundable on tax returns for the current year and a deferred tax liability or asset for the estimated future tax effects attributable to temporary differences and carryforwards. The measurement of current and deferred tax liabilities and assets is based on provisions of enacted tax law. Deferred tax assets are reduced, if necessary, by the amount of any tax benefits for which the utilization of the asset is not considered likely.
Earnings Per Share
The difference between basic and diluted earnings per share (“EPS”) is the dilutive effect of stock options and non-vested stock. Diluted EPS assumes that non-vested stock has vested and all dilutive stock options, for which the average market price exceeds the exercise price (in-the-money), are exercised. Stock options for which the exercise price exceeds the average market price (out-of-the-money) have an anti-dilutive effect on EPS, and accordingly, are excluded from the calculation.
The following table sets forth the computation of basic and diluted earnings per share from continuing operations for the years ended December 31:
|
Years Ended December 31,
|
||||||||||||
|
(in thousands except per share amounts)
|
2015
|
2014
|
2013
|
|||||||||
|
Numerator:
|
||||||||||||
|
Net earnings from continuing operations
|
$
|
107,247
|
$
|
81,771
|
$
|
114,298
|
||||||
|
Denominator:
|
||||||||||||
|
Denominator for basic earnings per share - weighted average common shares
|
45,910
|
48,525
|
49,755
|
|||||||||
|
Effect of dilutive securities
|
294
|
294
|
179
|
|||||||||
|
Denominator for diluted earnings per share - diluted weighted average shares outstanding
|
46,204
|
48,819
|
49,934
|
|||||||||
|
Earnings per common share from continuing operations
|
||||||||||||
|
Basic
|
$
|
2.34
|
$
|
1.69
|
$
|
2.30
|
||||||
|
Diluted
|
$
|
2.32
|
$
|
1.67
|
$
|
2.29
|
||||||
The Company has a share-based compensation plan under which employees may be granted share-based awards in which non-forfeitable dividends are paid on non-vested shares for certain awards. As such, these shares are considered participating securities under the two-class method of calculating EPS as described in ASC 260, Earnings per Share. The two-class method of calculating EPS did not have a material impact on the Company’s EPS calculations as of December 31, 2015, 2014 and 2013.
In 2015, 2014 and 2013, there were no anti-dilutive stock options. All EPS amounts are presented on a diluted basis unless otherwise noted.
Accumulated Other Comprehensive Income (Loss)
Accumulated OCI is composed primarily of foreign currency translation, pension liability and unrealized gains or losses on cash flow hedges. See Note 8, Accumulated Other Comprehensive Income, for additional information.
Research and Development
Research and development costs are recorded in selling and administrative expenses in the year they are incurred. Research and development costs related to continuing operations were $35.1 million, $35.9 million and $34.1 million during the years ended December 31, 2015, 2014 and 2013, respectively.
Advertising
Advertising costs are recorded in selling and administrative expenses as they are incurred. Advertising costs related to continuing operations were $1.7 million, $1.9 million and $1.6 million during the years ended December 31, 2015, 2014 and 2013, respectively.
Environmental Liabilities
The Company records liabilities related to environmental remediation obligations when estimated future expenditures are probable and reasonably estimable. Such accruals are adjusted as further information becomes available or as circumstances change. Estimated future expenditures are discounted to their present value when the timing and amount of future cash flows are fixed and readily determinable. Recoveries of remediation costs from other parties, if any, are recognized as assets when their receipt is realizable.
Subsequent Events
The Company performed an evaluation of subsequent events through the date these financial statements were issued and no such events were identified.
New Pronouncements
In November 2015, the Financial Accounting Standards Board (“FASB”) issued Accounting Standards Update (“ASU”) No. 2015-17, Balance Sheet Classification of Deferred Taxes, which will require entities to present deferred tax assets and deferred tax liabilities as noncurrent in a classified balance sheet. The ASU simplifies the current guidance, which requires entities to separately present deferred tax assets and deferred tax liabilities as current and noncurrent in a classified balance sheet. This guidance is effective for interim and annual periods beginning after December 31, 2016, with early adoption permitted. We are currently evaluating the expected impact of this standard, and do not expect it to be material to our financial statements.
In April 2015, the FASB issued ASU No. 2015-03, Simplifying the Presentation of Debt Issuance Costs, which requires debt issuance costs to be presented in the balance sheet as a direct deduction from the carrying amount of the associated debt liability. Also, on August 18, 2015, the FASB issued ASU 2015-15, Presentation and Subsequent Measurement of Debt Issuance Costs Associated with Line-of-Credit Arrangements, to clarify that the SEC staff would not object to deferring and presenting debt issuance costs as an asset and subsequently amortizing deferred debt issuance costs ratably over the term of the line-of-credit arrangement. This guidance is effective for interim and annual periods beginning after December 15, 2015, with early adoption permitted. This new guidance is required to be retrospectively applied to all prior periods. The impact of this standard will not have a significant impact on the Company’s financial statements.
In July 2015, the FASB affirmed its proposed one-year deferral of the effective date for ASU No. 2014-09, Revenue from Contracts with Customers. Under this proposal, the requirements of the new standard are effective for interim and annual periods beginning after December 15, 2017. The proposal also permits entities to adopt the standard for interim and annual reporting periods beginning after December 15, 2016. We are currently evaluating the expected impact of this standard.
In July 2015, the FASB issued ASU No. 2015-11, Simplifying the Measurement of Inventory. Under this guidance, inventory that is accounted for using first-in, first-out or average cost method shall be measured at the lower of cost or net realizable value, as opposed to the lower of cost or market measurement under current guidance. This guidance is effective for interim and annual periods beginning after December 15, 2016, with early adoption permitted. This new guidance is required to be retrospectively applied to all prior periods. We are currently evaluating the expected impact of this standard.
In September 2015, the FASB issued ASU 2015-16, Simplifying the Accounting for Measurement-Period Adjustments, which requires the acquirer in a business combination to recognize adjustments to provisional amounts that are identified during the measurement period in the reporting period in which the adjustment amounts are determined. The financial statements should contain the effect on earnings of changes in depreciation, amortization or other income effects calculated as if the accounting had been completed at the acquisition date. This guidance is effective for interim and annual periods beginning after December 15, 2015, with early adoption permitted. The impact of this standard will not have a significant impact on the Company’s financial statements.
2. Acquisitions
On June 29, 2015, the Company completed the acquisition of the net assets and business of Xennia Technology Ltd. (“Xennia”). The Company paid $8.4 million of cash for this acquisition. Xennia is a European manufacturer of specialty inks used in digital printing. Xennia’s operations are included in the Color segment.
The assets acquired and liabilities assumed were recorded at their fair values as of the acquisition date. The purchase price exceeded the carrying value of the net assets by approximately $6.2 million. The Company identified intangible assets, principally technological know-how of $1.1 million, trade names of $0.6 million, and allocated the remaining excess of $4.5 million to goodwill. The Company incurred $0.8 million of acquisition related costs for the year ended December 31, 2015, which are recorded in the Corporate & Other segment.
3. Goodwill and Intangible Assets
At December 31, 2015 and 2014, goodwill is the only intangible asset that is not subject to amortization. The following table summarizes intangible assets with determinable useful lives by major category as of December 31, 2015 and 2014:
|
2015
|
2014
|
|||||||||||||||||||
|
(In thousands except weighted average amortization years)
|
Weighted Average Amortization Years
|
Cost
|
Accumulated Amortization
|
Cost
|
Accumulated Amortization
|
|||||||||||||||
|
Technological know-how
|
20.0
|
$
|
7,387
|
$
|
(4,738
|
)
|
$
|
6,459
|
$
|
(4,352
|
)
|
|||||||||
|
Customer relationships
|
20.0
|
6,575
|
(4,332
|
)
|
6,938
|
(4,170
|
)
|
|||||||||||||
|
Patents, trademarks, non-compete agreements and other
|
19.3
|
10,423
|
(6,106
|
)
|
9,753
|
(5,868
|
)
|
|||||||||||||
|
Total finite-lived intangibles
|
19.7
|
$
|
24,385
|
$
|
(15,176
|
)
|
$
|
23,150
|
$
|
(14,390
|
)
|
|||||||||
In 2015, the Company identified $1.7 million of acquisition related intangible assets, primarily technological know-how and trade names, which are included in the above table.
Amortization of intangible assets was $1.2 million in both 2015 and 2014 and $1.3 million in 2013. Estimated amortization expense each year for the five years subsequent to December 31, 2015, is $1.2 million in 2016, $1.1 million in 2017, $1.0 million in 2018 and 2019, and $0.9 million in 2020.
The changes in goodwill for the years ended December 31, 2015 and 2014, by reportable business segment, were as follows:
|
(In thousands)
|
Flavors & Fragrances
|
Color
|
Asia Pacific
|
Consolidated
|
||||||||||||
|
Balance as of December 31, 2013
|
$
|
136,637
|
$
|
317,323
|
$
|
3,309
|
$
|
457,269
|
||||||||
|
Currency translation impact
|
(10,614
|
)
|
(22,050
|
)
|
(333
|
)
|
(32,997
|
)
|
||||||||
|
Impairment (1)
|
—
|
(158
|
)
|
—
|
(158
|
)
|
||||||||||
|
Balance as of December 31, 2014
|
126,023
|
295,115
|
2,976
|
424,114
|
||||||||||||
|
Currency translation impact
|
(11,675
|
)
|
(17,272
|
)
|
(26
|
)
|
(28,973
|
)
|
||||||||
|
Acquisition
|
—
|
4,505
|
—
|
4,505
|
||||||||||||
|
Balance as of December 31, 2015
|
$
|
114,348
|
$
|
282,348
|
$
|
2,950
|
$
|
399,646
|
||||||||
|
(1)
|
A portion of the Color segment’s goodwill that was written down in 2014 related to the discontinued operation.
|
4. Debt
Long-term Debt
Long-term debt consisted of the following unsecured obligations at December 31:
|
(in thousands)
|
2015
|
2014
|
||||||
|
3.66% senior notes due November 2023
|
$
|
75,000
|
$
|
75,000
|
||||
|
3.06% Euro-denominated senior notes due November 2023
|
41,545
|
46,270
|
||||||
|
1.85% Euro-denominated senior notes due November 2022
|
72,623
|
—
|
||||||
|
4.47% senior notes due November 2018
|
25,000
|
25,000
|
||||||
|
4.14% senior notes due November 2017
|
25,000
|
25,000
|
||||||
|
4.91% senior notes due through May 2017
|
77,000
|
88,000
|
||||||
|
3.77% senior notes due November 2016
|
25,000
|
25,000
|
||||||
|
Term loan
|
167,875
|
98,750
|
||||||
|
Long-term revolving loan agreement
|
103,343
|
65,987
|
||||||
|
Various other notes
|
1,491
|
2,004
|
||||||
|
613,877
|
451,011
|
|||||||
|
Less current maturities
|
—
|
—
|
||||||
|
Total long-term debt
|
$
|
613,877
|
$
|
451,011
|
||||
On November 6, 2015, the Company increased and extended the maturity of its credit facility. The credit facility, consisting of a $170 million term loan and a $350 million revolver, will mature on November 6, 2020. It replaces the $450 million credit facility originally entered into in October 2014, consisting of a $100 million term loan and a $350 million revolver. Interest rates on borrowings under the current credit facility are at LIBOR plus a margin based on the Company’s leverage ratio. Currently, when fully drawn, the interest rate is at LIBOR plus 1.50%. Also on November 6, 2015, the Company issued 7-year, notes of €67 million at a fixed rate of 1.85%. The notes will have a final maturity in November 2022. Proceeds from the increased term loan and the sale of the notes were used to refinance existing debt.
The borrowings under the long-term revolving loan agreement had an average interest rate of 1.36% and 1.54% for the years ended December 31, 2015 and 2014, respectively.
The aggregate amounts of contractual maturities on long-term debt each year for the five years subsequent to December 31, 2015, are as follows: 2016, $45.9 million; 2017, $103.9 million; 2018, $38.9 million; 2019, $17.1 million; and 2020, $218.2 million.
The Company has approximately $45.9 million of long-term debt that matures in 2016. It is the Company’s intention and ability to refinance these maturities under the long-term revolving loan agreement and accordingly, that maturing debt has been classified as long-term debt in the Consolidated Balance Sheet.
The Company had $255.3 million available under the revolving loan agreement and $86.3 million available under other lines of credit from several banks at December 31, 2015.
Substantially all of the senior loan agreements contain restrictions concerning interest coverage, borrowings and investments. The Company is in compliance with all of these restrictions at December 31, 2015. The following table summarizes the Company’s most restrictive loan covenants calculated in accordance with the applicable agreements as of December 31, 2015:
|
Actual
|
Required
|
|||||||
|
Debt to EBITDA(1) (Maximum)
|
2.49
|
3.50
|
||||||
|
Interest Coverage (Minimum)
|
7.60
|
2.00
|
||||||
| (1) | Debt to EBITDA is defined in the Company’s debt covenants as total funded debt divided by the Company’s consolidated operating income excluding non-operating gains and losses and depreciation and amortization. |
The Company had stand-by and trade letters of credit outstanding of $6.3 million as of December 31, 2015 and 2014.
Short-term Borrowings
The Company’s short-term borrowings consisted of the following items at December 31:
|
(in thousands)
|
2015
|
2014
|
||||||
|
Uncommitted loans
|
$
|
18,580
|
$
|
14,086
|
||||
|
Loans of foreign subsidiaries
|
2,075
|
1,802
|
||||||
|
Total
|
$
|
20,655
|
$
|
15,888
|
||||
The weighted average interest rates on short-term borrowings were 1.62% and 1.66% at December 31, 2015 and 2014, respectively.
5. Derivative Instruments and Hedging Activity
The Company may use derivative instruments for the purpose of hedging currency, commodity and interest rate exposures, which exist as part of ongoing business operations. As a policy, the Company does not engage in speculative or leveraged transactions, nor does the Company hold or issue financial instruments for trading purposes. Hedge effectiveness is determined by how closely the changes in the fair value of the hedging instrument offset the changes in the fair value or cash flows of the hedged transaction. Hedge accounting, which generally results in the deferral of derivative gains and losses until such time as the underlying transaction is recognized in net earnings, is permitted only if the hedging relationship is expected to be highly effective at the inception of the transaction and on an ongoing basis. Any ineffective portions are recognized in earnings immediately.
The Company manages its exposure to foreign exchange risk by the use of forward exchange contracts to reduce the effect of fluctuating foreign currencies on non-functional currency sales, purchases, and other known foreign currency exposures. These forward exchange contracts generally have maturities of less than 18 months. The Company also uses certain debt denominated in foreign currencies to manage the net asset positions of the Company’s foreign subsidiaries. The Company’s primary hedging activities and their accounting treatment are summarized below:
Forward Exchange Contracts
Certain forward exchange contracts have been designated as cash flow hedges. The Company had $35.2 million and $17.8 million of forward exchange contracts, designated as hedges, outstanding as of December 31, 2015 and 2014, respectively. As of December 31, 2015 the amount deferred in OCI was not material to the financial statements. For the years ended December 31, 2015 and 2014, a loss of $1.2 million and a gain of $0.1 million, respectively, were reclassified into net earnings in the Company’s Consolidated Statement of Earnings that offset the earnings impact of the related non-functional asset or liability hedged in the same period. In addition, the Company utilizes forward exchange contracts that are not designated as cash flow hedges and the results of these transactions are not material to the financial statements.
Net Investment Hedges
The Company has certain debt denominated in Euros and Swiss Francs. These debt instruments have been designated as partial hedges of the Company’s Euro and Swiss Franc net asset positions. Changes in the fair value of this debt attributable to changes in the spot foreign exchange rate are recorded in foreign currency translation in OCI. As of December 31, 2015 and 2014, the total value of the Company’s Euro and Swiss Franc debt designated as net investment hedges was $162.5 million and $97.3 million, respectively. The impact of foreign exchange rates on these debt instruments has decreased debt by $7.5 million and $12.7 million for the years ended December 31, 2015 and 2014, respectively. These amounts have been recorded as foreign currency translation in OCI.
Concentrations of Credit Risk
Counterparties to forward exchange contracts consist of large international financial institutions. While these counterparties may expose the Company to potential losses due to the credit risk of non-performance, losses are not anticipated. Concentrations of credit risk with respect to trade accounts receivable are limited by the large number of customers, generally short payment terms and their dispersion across geographic areas.
6. Share-Based Compensation
The Company has various stock plans under which employees and directors may be granted non-vested stock which vests over a specific time period. The 2007 Stock Plan also allows for the granting of non-qualified stock options or incentive stock options. Upon vesting, the stock options allow the participant to purchase common stock at 100% of the closing market price on the day the options were granted. No options were granted in 2015, 2014 or 2013.
As of December 31, 2015, there were 1.2 million shares available to be granted as non-vested stock under the Company’s existing stock plans.
Stock options became exercisable over a three-year vesting period, or earlier upon retirement, and expire 10 years from the date of grant. Expense for stock options was recognized on a straight-line basis over three years from the date of grant or over the period from the date of grant until the participant was retirement-eligible, whichever was less. Treasury shares are issued for non-vested stock awards and for the exercise of stock options.
The following table summarizes the transactions involving the Company’s stock option plans:
|
(In thousands except exercise price and life)
|
Options
|
Weighted
Average
Exercise Price
|
Weighted
Average
Remaining Life
(Years)
|
Aggregate
Intrinsic Value
|
||||||||||||
|
Outstanding at December 31, 2012
|
141
|
$
|
22.35
|
2.7
|
$
|
1,859
|
||||||||||
|
Exercised
|
(48
|
)
|
21.00
|
|||||||||||||
|
Outstanding at December 31, 2013
|
93
|
23.04
|
2.2
|
2,374
|
||||||||||||
|
Exercised
|
(27
|
)
|
21.92
|
|||||||||||||
|
Outstanding at December 31, 2014
|
66
|
23.49
|
1.7
|
2,438
|
||||||||||||
|
Exercised
|
(21
|
)
|
20.59
|
|||||||||||||
|
Outstanding at December 31, 2015
|
45
|
24.84
|
1.2
|
1,715
|
||||||||||||
|
Exercisable at December 31, 2015
|
45
|
$
|
24.84
|
1.2
|
$
|
1,715
|
||||||||||
The aggregate intrinsic value of stock options exercised during 2015, 2014 and 2013, was $0.9 million, $0.8 million and $1.1 million, respectively.
As of December 31, 2015, all stock options outstanding were vested.
The following table summarizes information concerning outstanding and exercisable stock options at December 31, 2015:
|
Range of Exercise Price
|
||||||||||||
|
(In thousands except life and exercise price)
|
$
|
19.03 – 24.14
|
$
|
24.15 – 26.11
|
$
|
26.12 – 30.07
|
||||||
|
Options outstanding
|
12
|
12
|
21
|
|||||||||
|
Weighted average remaining contractual life, in years
|
0.2
|
1.1
|
1.8
|
|||||||||
|
Weighted average exercise price
|
$
|
19.64
|
$
|
24.35
|
$
|
28.16
|
||||||
|
Options exercisable
|
12
|
12
|
21
|
|||||||||
|
Weighted average exercise price
|
$
|
19.64
|
$
|
24.35
|
$
|
28.16
|
||||||
The Company’s stock plans also provide for the awarding of non-vested stock. Prior to December 2014, expense for shares of non-vested stock is recognized over the vesting period or during the period from the date of grant until the participant reaches age 65, whichever is shorter. The vesting period is five years for awards granted prior to December 2013 and three years beginning with awards granted in December 2013. During the period of restriction, the holder of non-vested stock has voting rights and is entitled to receive all dividends and other distributions paid with respect to the stock.
The December 2013 grant consisted of 50% performance stock units and 50% time-vesting stock. The number of shares issued under the performance stock units is based on certain performance metrics measured over a two-year performance period and the awards have a three-year vesting period. Two year performance that exceeds the stated performance metrics would result in an award up to 150% of the original grant. The holders of the performance stock units are not entitled to vote or receive dividends and other distributions paid with respect to the stock, until the units have vested and the shares of stock are issued.
The December 2014 and 2015 grants consisted of 100% performance stock unit awards which are based on a three-year performance and vesting period and a pro-rata vesting upon retirement. Three year performance that exceeds the stated performance metrics would result in an award up to 150% of the original grant. The holders of the performance stock units are not entitled to vote or receive dividends and other distributions paid with respect to the stock, until the units have vested and the shares of stock are issued.
The Company expenses awards for non-vested stock, including time-vesting stock and performance stock units, based on the fair value of the Company’s common stock at the date of the grant.
The following table summarizes the non-vested stock and performance stock unit activity:
|
(In thousands except fair value)
|
Shares
|
Grant Date
Weighted Average
Fair Value
|
Aggregate Intrinsic
Value
|
|||||||||
|
Outstanding at December 31, 2012
|
339
|
$
|
33.22
|
$
|
12,046
|
|||||||
|
Granted
|
262
|
46.14
|
||||||||||
|
Vested
|
(94
|
)
|
40.57
|
|||||||||
|
Cancelled
|
(10
|
)
|
42.22
|
|||||||||
|
Outstanding at December 31, 2013
|
497
|
38.46
|
|
24,095
|
||||||||
|
Granted
|
171
|
55.21
|
||||||||||
|
Vested
|
(40
|
)
|
27.15
|
|||||||||
|
Cancelled
|
(24
|
)
|
40.84
|
|||||||||
|
Outstanding at December 31, 2014
|
604
|
43.84
|
|
36,454
|
||||||||
|
Granted
|
154
|
60.65
|
||||||||||
|
Vested
|
(74
|
)
|
35.51
|
|||||||||
|
Cancelled
|
(142
|
)
|
47.02
|
|||||||||
|
Outstanding at December 31, 2015
|
542
|
$
|
48.94
|
$
|
34,063
|
|||||||
The total intrinsic values of shares vested during 2015, 2014 and 2013, was $4.8 million, $2.2 million and $4.4 million, respectively.
As of December 31, 2015, total remaining unearned compensation, net of expected forfeitures, related to non-vested stock and performance stock units was $14.9 million, which will be amortized over the weighted average remaining service period of 1.68 years.
Total pre-tax share-based compensation recognized in the Consolidated Statements of Earnings was $1.6 million, $6.3 million and $8.4 million in 2015, 2014 and 2013, respectively. Tax related benefits of $1.4 million, $2.4 million and $2.6 million were also recognized in 2015, 2014 and 2013, respectively. Cash received from the exercise of stock options was $0.4 million, $0.6 million and $1.0 million for 2015, 2014 and 2013, respectively, and is reflected in cash flows from financing activities in the Consolidated Statements of Cash Flows.
7. Retirement Plans
The Company provides benefits under defined contribution plans including a savings plan and an employee stock ownership plan (“ESOP”). The savings plan covers substantially all domestic salaried and certain non-union hourly employees and provides for matching contributions up to 4% of each employee’s salary. The ESOP covers substantially all domestic employees and provides for contributions based on a percentage of each employee’s compensation as determined by the Company’s Board of Directors. Total expense for the Company’s defined contribution plans was $5.4 million in 2015, $5.0 million in 2014, and $4.7 million in 2013.
Although the Company intends for these defined contribution plans to be the primary retirement benefit for most employees, the Company also has several defined benefit plans. The funded status of the defined benefit plans was as follows at December 31:
|
(in thousands)
|
2015
|
2014
|
||||||
|
Benefit obligation at beginning of year
|
$
|
55,396
|
$
|
72,582
|
||||
|
Service cost
|
2,692
|
2,523
|
||||||
|
Interest cost
|
1,803
|
2,390
|
||||||
|
Foreign currency exchange rate changes
|
(2,379
|
)
|
(1,889
|
)
|
||||
|
Benefits paid
|
(10,708
|
)
|
(23,726
|
)
|
||||
|
Actuarial (gain) loss
|
(1,173
|
)
|
5,858
|
|||||
|
Curtailment gain
|
(121
|
)
|
(2,342
|
)
|
||||
|
Other
|
849
|
-
|
||||||
|
Benefit obligation at end of year
|
46,359
|
55,396
|
||||||
|
Plan assets at beginning of year
|
39,520
|
37,122
|
||||||
|
Company contributions
|
10,204
|
22,402
|
||||||
|
Foreign currency exchange rate changes
|
(2,859
|
)
|
(2,379
|
)
|
||||
|
Benefits paid
|
(10,708
|
)
|
(23,726
|
)
|
||||
|
Actual gain on plan assets
|
79
|
6,101
|
||||||
|
Plan assets at end of year
|
36,236
|
39,520
|
||||||
|
Funded status
|
$
|
(10,123
|
)
|
$
|
(15,876
|
)
|
||
|
Accumulated benefit obligation
|
$
|
45,217
|
$
|
54,435
|
||||
In 2014, two of the Company’s defined benefit plans were frozen resulting in the recognition of a curtailment gain. The changes to these plans will limit the plans to the current participants as well as freeze their respective benefits. In addition, a curtailment loss was recognized for a certain defined benefit plan associated with a closure of a facility. These changes did not have a material impact on the Company’s 2015 or 2014 results, and are not expected to have a material impact on future years’ results. The decrease in benefit payments in 2015 from 2014, was primarily due to the retirement of the Company’s former Chief Executive Officer, who received his defined benefit pension in a lump sum payment during 2014.
Amounts recognized in the Consolidated Balance Sheets at December 31:
|
(in thousands)
|
2015
|
2014
|
||||||
|
Accrued employee and retiree benefits
|
$
|
(14,129
|
)
|
$
|
(18,258
|
)
|
||
|
Other accrued expenses
|
(5,927
|
)
|
(7,263
|
)
|
||||
|
Prepaid expenses and other current assets
|
9,933
|
9,645
|
||||||
|
Net liability
|
$
|
(10,123
|
)
|
$
|
(15,876
|
)
|
||
Components of annual benefit cost:
|
(In thousands)
|
2015
|
2014
|
2013
|
|||||||||
|
Service cost
|
$
|
2,692
|
$
|
2,523
|
$
|
3,260
|
||||||
|
Interest cost
|
1,803
|
2,390
|
2,557
|
|||||||||
|
Expected return on plan assets
|
(1,210
|
)
|
(1,791
|
)
|
(1,689
|
)
|
||||||
|
Amortization of prior service cost
|
—
|
171
|
172
|
|||||||||
|
Recognized actuarial loss (gain)
|
228
|
(305
|
)
|
3,203
|
||||||||
|
Settlement expense
|
1,119
|
1,467
|
1,177
|
|||||||||
|
Curtailment gain
|
(104
|
)
|
(754
|
)
|
—
|
|||||||
|
Defined benefit expense
|
$
|
4,528
|
$
|
3,701
|
$
|
8,680
|
||||||
Weighted average liability assumptions as of December 31:
|
2015
|
2014
|
|||||||
|
Discount rate
|
3.94
|
%
|
3.70
|
%
|
||||
|
Expected return on plan assets
|
3.40
|
%
|
3.32
|
%
|
||||
|
Rate of compensation increase
|
0.35
|
%
|
0.37
|
%
|
||||
Weighted average cost assumptions for the year ended December 31:
|
2015
|
2014
|
|||||||
|
Discount rate
|
3.70
|
%
|
3.91
|
%
|
||||
|
Expected return on plan assets
|
3.32
|
%
|
5.12
|
%
|
||||
|
Rate of compensation increase
|
0.37
|
%
|
4.59
|
%
|
||||
The aggregate amounts of benefits expected to be paid from defined benefit plans in each of the next five years subsequent to December 31, 2015, which include employees’ expected future service, are as follows: 2016, $7.1 million; 2017, $2.0 million; 2018, $4.2 million; 2019, $1.9 million; 2020, $2.1 million and $15.0 million in total for the years 2021 through 2025.
The Company expects to contribute $6.5 million to defined benefit plans in 2016.
Amounts in accumulated other comprehensive income at December 31 were as follows:
|
(In thousands)
|
2015
|
2014
|
||||||
|
Unrecognized net actuarial loss
|
$
|
5,725
|
$
|
7,407
|
||||
The pension adjustments, net of tax, recognized in OCI, were as follows:
|
(In thousands)
|
2015
|
2014
|
2013
|
|||||||||
|
Net actuarial (loss) gain arising during the period
|
$
|
(140
|
)
|
$
|
(387
|
)
|
$
|
3,180
|
||||
|
Amortization of actuarial loss, included in defined benefit expense
|
917
|
1,252
|
2,006
|
|||||||||
|
Amortization of prior service cost, included in defined benefit expense
|
—
|
733
|
108
|
|||||||||
|
Pension adjustment, net of tax
|
$
|
777
|
$
|
1,598
|
$
|
5,294
|
||||||
The estimated actuarial loss for the defined benefit plans that will be amortized from accumulated other comprehensive loss into periodic benefit cost during 2016 is $0.3 million.
The investment objectives and target allocations for the Company’s pension plans related to the assets of the plans are reviewed on a regular basis. The investment objectives for the pension assets are to maximize the return on assets while maintaining an overall level of risk appropriate for a retirement fund and ensuring the availability of funds for the payment of retirement benefits. The levels of risk assumed by the pension plans are determined by market conditions, the rate of return expectations and the liquidity requirements of each pension plan. The actual asset allocations of each pension plan are reviewed on a regular basis to ensure that they are in line with the target allocations.
The following table presents the Company’s pension plan assets by asset category as of December 31, 2015 and 2014:
|
Fair Value
as of
December 31,
|
Fair Value Measurements at
December 31, 2015
Using Fair Value Hierarchy
|
Fair Value
as of
December 31,
|
Fair Value Measurements at
December 31, 2014
Using Fair Value Hierarchy
|
|||||||||||||||||||||||||||||
|
(in thousands)
|
2015
|
Level 1
|
Level 2
|
Level 3
|
2014
|
Level 1
|
Level 2
|
Level 3
|
||||||||||||||||||||||||
|
Equity Funds
|
||||||||||||||||||||||||||||||||
|
Domestic
|
$
|
6,064
|
$
|
6,064
|
$
|
—
|
$
|
—
|
$
|
6,424
|
$
|
6,424
|
$
|
—
|
$
|
—
|
||||||||||||||||
|
International
|
179
|
3
|
176
|
—
|
242
|
—
|
242
|
—
|
||||||||||||||||||||||||
|
International Fixed Income Funds
|
22,374
|
711
|
21,663
|
—
|
22,710
|
960
|
21,750
|
—
|
||||||||||||||||||||||||
|
Other investments
|
7,619
|
40
|
7,579
|
—
|
10,144
|
38
|
10,106
|
—
|
||||||||||||||||||||||||
|
Total assets at fair value
|
$
|
36,236
|
$
|
6,818
|
$
|
29,418
|
$
|
—
|
$
|
39,520
|
$
|
7,422
|
$
|
32,098
|
$
|
—
|
||||||||||||||||
The Company is required to categorize pension plan assets based on the following fair value hierarchy:
Level 1: Observable inputs that reflect quoted prices (unadjusted) for identical assets or liabilities in active markets.
Level 2: Inputs other than quoted prices included in Level 1 that are observable for the asset or liability through corroboration with observable market data.
Level 3: Unobservable inputs that reflect the reporting entity’s own assumptions.
8. Accumulated Other Comprehensive Income
The following tables summarize the changes in OCI for 2015:
|
(In thousands)
|
Cash Flow
Hedges (a)
|
Pension
Items (a)
|
Foreign Currency
Items
|
Total
|
||||||||||||
|
Balance as of December 31, 2014
|
$
|
324
|
$
|
(5,170
|
)
|
$
|
(80,282
|
)
|
$
|
(85,128
|
)
|
|||||
|
Other comprehensive income before reclassifications
|
(993
|
)
|
(140
|
)
|
(85,551
|
)
|
(86,684
|
)
|
||||||||
|
Amounts reclassified from OCI
|
833
|
917
|
-
|
1,750
|
||||||||||||
|
Balance as of December 31, 2015
|
$
|
164
|
$
|
(4,393
|
)
|
$
|
(165,833
|
)
|
$
|
(170,062
|
)
|
|||||
| (a) | Cash Flow Hedges and Pension Items are net of tax. |
See Note 7, Retirement Plans, for more information on the pension items reclassified out of OCI and into Selling and Administrative expenses in the Statement of Earnings during 2015. See Note 5, Derivative Instruments and Hedging Activity, for additional information on the Company’s cash flow hedges.
9. Income Taxes
The provision for income taxes for continuing operations was as follows:
|
(In thousands)
|
2015
|
2014
|
2013
|
|||||||||
|
Currently payable:
|
||||||||||||
|
Federal
|
$
|
20,794
|
$
|
18,642
|
$
|
21,252
|
||||||
|
State
|
2,936
|
2,264
|
3,065
|
|||||||||
|
Foreign
|
23,873
|
25,435
|
25,175
|
|||||||||
|
47,603
|
46,341
|
49,492
|
||||||||||
|
Deferred (benefit) expense:
|
||||||||||||
|
Federal
|
5,779
|
1,532
|
(5,125
|
)
|
||||||||
|
State
|
(772
|
)
|
(935
|
)
|
502
|
|||||||
|
Foreign
|
(10,461
|
)
|
(14,111
|
)
|
(1,534
|
)
|
||||||
|
(5,454
|
)
|
(13,514
|
)
|
(6,157
|
)
|
|||||||
|
Income taxes
|
$
|
42,149
|
$
|
32,827
|
$
|
43,335
|
||||||
The tax effects of temporary differences that give rise to significant portions of deferred tax assets and liabilities consisted of the following:
|
(in thousands)
|
2015
|
2014
|
||||||
|
Deferred tax assets:
|
||||||||
|
Benefit plans
|
$
|
12,901
|
$
|
15,507
|
||||
|
Liabilities and reserves
|
18,986
|
19,384
|
||||||
|
Operating loss and credit carryovers
|
59,013
|
57,128
|
||||||
|
Other
|
3,226
|
6,872
|
||||||
|
Gross deferred tax assets
|
94,126
|
98,891
|
||||||
|
Valuation allowance
|
(36,008
|
)
|
(43,055
|
)
|
||||
|
Deferred tax assets
|
58,118
|
55,836
|
||||||
|
Deferred tax liabilities:
|
||||||||
|
Property, plant and equipment
|
(1,850
|
)
|
(1,619
|
)
|
||||
|
Other assets
|
(907
|
)
|
(1,462
|
)
|
||||
|
Goodwill
|
(27,824
|
)
|
(28,583
|
)
|
||||
|
Other
|
(8,000
|
)
|
(1,426
|
)
|
||||
|
Deferred tax liabilities
|
(38,581
|
)
|
(33,090
|
)
|
||||
|
Net deferred tax assets
|
$
|
19,537
|
$
|
22,746
|
||||
As of December 31, 2015, $8.1 million of the net deferred tax asset balance, is a non-current asset and is reported in the other assets line item in the Consolidated Balance Sheet.
At December 31, 2015, foreign operating loss carryovers were $117.3 million. Included in the foreign operating loss carryovers are losses of $14.8 million that expire through 2030 and $102.5 million that do not have an expiration date. At December 31, 2015, state operating loss carryovers were $145.2 million, all of which expire through 2030.
The effective tax rate for continuing operations differed from the statutory federal income tax rate of 35% as described below:
|
2015
|
2014
|
2013
|
||||||||||
|
Taxes at statutory rate
|
35.0
|
%
|
35.0
|
%
|
35.0
|
%
|
||||||
|
State income taxes, net of federal income tax benefit
|
1.7
|
1.9
|
1.1
|
|||||||||
|
Tax credits
|
(0.7
|
)
|
(0.4
|
)
|
(0.3
|
)
|
||||||
|
Taxes on foreign earnings
|
(0.8
|
)
|
(4.7
|
)
|
(5.3
|
)
|
||||||
|
Resolution of prior years’ tax matters
|
(0.3
|
)
|
(0.6
|
)
|
(0.7
|
)
|
||||||
|
U.S. manufacturing deduction
|
(1.9
|
)
|
(2.0
|
)
|
(1.6
|
)
|
||||||
|
Valuation allowance adjustments
|
(5.0
|
)
|
0.2
|
(0.8
|
)
|
|||||||
|
Other, net
|
0.2
|
(0.8
|
)
|
0.1
|
||||||||
|
Effective tax rate
|
28.2
|
%
|
28.6
|
%
|
27.5
|
%
|
||||||
Taxes on foreign earnings include the difference between the tax rates applied to foreign earnings relative to the U.S. statutory tax rate, accruals for foreign unrecognized tax benefits, and the impact of the U.S. foreign tax credit. The impact on the Company’s effective tax rate varies from year to year based on the mix of earnings, increases in foreign unrecognized tax benefits, and the expected realization of U.S. foreign tax credits generated each year.
The 2015 reduction in the effective tax rate from the valuation allowance adjustments is the result of a tax audit settlement and a change in projections on the utilization of certain deferred tax assets.
Earnings from continuing operations before income taxes were as follows:
|
(In thousands)
|
2015
|
2014
|
2013
|
|||||||||
|
United States
|
$
|
87,749
|
$
|
56,211
|
$
|
55,461
|
||||||
|
Foreign
|
61,647
|
58,387
|
102,172
|
|||||||||
|
Total
|
$
|
149,396
|
$
|
114,598
|
$
|
157,633
|
||||||
Federal and state income taxes are provided on international subsidiary income distributed to or taxable in the United States during the year. At December 31, 2015, federal and state taxes have not been provided for approximately $430.2 million of unremitted earnings of the foreign subsidiaries that are considered to be invested indefinitely. Determination of the deferred tax liability on such earnings is not practicable.
A reconciliation of the change in the liability for unrecognized tax benefits for 2015 and 2014 is as follows:
|
(in thousands)
|
2015
|
2014
|
||||||
|
Balance at beginning of year
|
$
|
13,940
|
$
|
5,295
|
||||
|
Increases for tax positions taken in the current year
|
1,322
|
718
|
||||||
|
Increases for tax positions taken in prior years
|
1,061
|
10,238
|
||||||
|
Decreases related to settlements with tax authorities
|
(10,610
|
)
|
(1,044
|
)
|
||||
|
Decreases as a result of lapse of the applicable statutes of limitations
|
(278
|
)
|
(751
|
)
|
||||
|
Foreign currency exchange rate changes
|
(472
|
)
|
(516
|
)
|
||||
|
Balance at the end of year
|
$
|
4,963
|
$
|
13,940
|
||||
The amount of the unrecognized tax benefits that would affect the effective tax rate, if recognized, was approximately $4.3 million. The Company recognizes interest and penalties related to the unrecognized tax benefits in income tax expense. As of December 31, 2015 and 2014, $0.5 million of accrued interest and penalties were reported as an income tax liability in each period. The $10.6 million decrease related to Settlements with Tax Authorities was due to a 2015 audit settlement. A portion of this decrease reduced the Company’s deferred tax assets and an immaterial amount was recognized in net earnings. The liability for unrecognized tax benefits relates to multiple jurisdictions and is reported in Other liabilities on the Consolidated Balance Sheet at December 31, 2015.
The Company believes that it is reasonably possible that the total amount of liability for unrecognized tax benefits as of December 31, 2015, will decrease by approximately $0.5 million during 2016, of which $0.5 million is estimated to impact the effective tax rate. The potential decrease relates to various tax matters for which the statute of limitations may expire or will be otherwise settled in 2016. The amount that is ultimately recognized in the financial statements will be dependent upon various factors including potential increases or decreases in unrecognized tax benefits as a result of examinations, settlements and other unanticipated items that may occur during the year. With limited exceptions, the Company is no longer subject to federal, state and local, or non-U.S. income tax examinations by tax authorities for years before 2010.
10. Segment and Geographic Information
The accounting policies of the segments are the same as those described in the summary of significant accounting policies. The Company evaluates performance based on operating income of the respective business units before restructuring and other charges, interest expense and income taxes (“segment operating income”). Total revenue and segment operating income by business segment and geographic region include both sales to customers, as reported in the Company’s Consolidated Statements of Earnings, and intersegment sales, which are accounted for at prices that approximate market prices and are eliminated in consolidation.
Assets by business segment and geographic region are those assets used in the Company’s operations in each segment and geographic region. Segment assets reflect the allocation of goodwill to each segment. Corporate & Other assets consist primarily of fixed assets and investments.
Segment Information
The Company determines its operating segments based on information utilized by its chief operating decision maker to allocate resources and assess performance. Segment performance is evaluated on operating income of the respective business units before restructuring charges which are reported in the Corporate & Other segment.
The Company’s reportable segments consist of the Flavors & Fragrances, Color, and Asia Pacific segments. The Asia Pacific segment, which was previously reported in the Corporate & Other segment, meets the quantitative thresholds outlined in ASC 280, Segment Reporting, to be reported separately as of December 31, 2015.
The Company’s Flavors & Fragrances segment produces flavor and fragrance products that impart a desired taste, texture, aroma or other characteristic to a broad range of consumer and other products. The Color segment produces natural and synthetic color systems for pharmaceuticals, foods and beverages; colors and formulations for cosmetics; and technical colors for industrial applications. The Asia Pacific segment is managed on a geographic basis and produces color, flavor and fragrance products for the Asia Pacific countries.
The results of operations for the Company’s businesses in Central and South America have been included in the Flavors & Fragrances segment, beginning in 2015. Previously, they had been reported in the Corporate & Other segment. All prior year results have been restated to reflect each of these changes.
Restructuring and other costs related to continuing operations for the years ended December 31, 2015, 2014, and 2013, are further described in Note 12, Restructuring Charges, and are included in the operating income (loss) results in the Corporate & Other segment below. Consistent with presentation in the Consolidated Balance Sheets and Statements of Cash Flows, the below amounts for assets, capital expenditures, and depreciation and amortization include discontinued operations for all periods presented and are included in the Corporate & Other segment.
|
(In thousands)
|
Flavors &
Fragrances
|
Color
|
Asia Pacific
|
Corporate
& Other
|
Consolidated
|
|||||||||||||||
|
2015:
|
||||||||||||||||||||
|
Revenue from external customers
|
$
|
793,386
|
$
|
452,203
|
$
|
130,375
|
$
|
—
|
$
|
1,375,964
|
||||||||||
|
Intersegment revenue
|
25,623
|
18,736
|
180
|
—
|
44,539
|
|||||||||||||||
|
Total revenue
|
819,009
|
470,939
|
130,555
|
—
|
1,420,503
|
|||||||||||||||
|
Operating income (loss)
|
121,874
|
94,799
|
25,496
|
(75,828
|
)
|
166,341
|
||||||||||||||
|
Interest expense
|
—
|
—
|
—
|
16,945
|
16,945
|
|||||||||||||||
|
Earnings (loss) before income taxes from continuing operations
|
121,874
|
94,799
|
25,496
|
(92,773
|
)
|
149,396
|
||||||||||||||
|
Assets
|
806,401
|
706,769
|
82,696
|
115,571
|
1,711,437
|
|||||||||||||||
|
Capital expenditures
|
56,233
|
18,933
|
2,643
|
2,132
|
79,941
|
|||||||||||||||
|
Depreciation and amortization
|
24,049
|
18,529
|
2,349
|
3,012
|
47,939
|
|||||||||||||||
|
2014:
|
||||||||||||||||||||
|
Revenue from external customers
|
$
|
825,976
|
$
|
488,762
|
$
|
133,083
|
$
|
—
|
$
|
1,447,821
|
||||||||||
|
Intersegment revenue
|
25,570
|
20,574
|
229
|
—
|
46,373
|
|||||||||||||||
|
Total revenue
|
851,546
|
509,336
|
133,312
|
—
|
1,494,194
|
|||||||||||||||
|
Operating income (loss)
|
120,888
|
114,014
|
25,122
|
(129,359
|
)
|
130,665
|
||||||||||||||
|
Interest expense
|
—
|
—
|
—
|
16,067
|
16,067
|
|||||||||||||||
|
Earnings (loss) before income taxes from continuing operations
|
120,888
|
114,014
|
25,122
|
(145,426
|
)
|
114,598
|
||||||||||||||
|
Assets
|
819,366
|
747,738
|
84,842
|
113,260
|
1,765,206
|
|||||||||||||||
|
Capital expenditures
|
41,244
|
31,883
|
2,010
|
4,261
|
79,398
|
|||||||||||||||
|
Depreciation and amortization
|
26,316
|
18,843
|
2,473
|
3,824
|
51,456
|
|||||||||||||||
|
2013:
|
||||||||||||||||||||
|
Revenue from external customers
|
$
|
854,515
|
$
|
475,061
|
$
|
132,550
|
$
|
—
|
$
|
1,462,126
|
||||||||||
|
Intersegment revenue
|
26,071
|
21,246
|
97
|
—
|
47,414
|
|||||||||||||||
|
Total revenue
|
880,586
|
496,307
|
132,647
|
—
|
1,509,540
|
|||||||||||||||
|
Operating income (loss)
|
121,806
|
107,214
|
22,161
|
(77,401
|
)
|
173,780
|
||||||||||||||
|
Interest expense
|
—
|
—
|
—
|
16,147
|
16,147
|
|||||||||||||||
|
Earnings (loss) before income taxes from continuing operations
|
121,806
|
107,214
|
22,161
|
(93,548
|
)
|
157,633
|
||||||||||||||
|
Assets
|
901,870
|
778,864
|
87,708
|
102,292
|
1,870,734
|
|||||||||||||||
|
Capital expenditures
|
59,086
|
38,639
|
1,670
|
4,851
|
104,246
|
|||||||||||||||
|
Depreciation and amortization
|
27,575
|
17,607
|
2,543
|
4,291
|
52,016
|
|||||||||||||||
Geographic Information
The Company has manufacturing facilities or sales offices in North America, Europe, Asia, Australia, South America and Africa.
The Company’s annual revenue from continuing operations summarized by geographic location is as follows:
|
(In thousands)
|
2015
|
2014
|
2013
|
|||||||||
|
Revenue from external customers:
|
||||||||||||
|
North America
|
$
|
744,481
|
$
|
750,345
|
$
|
782,088
|
||||||
|
Europe
|
349,100
|
389,588
|
382,077
|
|||||||||
|
Asia Pacific
|
177,559
|
193,163
|
188,917
|
|||||||||
|
Other
|
104,824
|
114,725
|
109,044
|
|||||||||
|
Consolidated
|
$
|
1,375,964
|
$
|
1,447,821
|
$
|
1,462,126
|
||||||
|
Long-lived assets:
|
||||||||||||
|
North America
|
$
|
524,921
|
$
|
537,668
|
$
|
531,005
|
||||||
|
Europe
|
397,244
|
423,972
|
506,352
|
|||||||||
|
Asia Pacific
|
26,589
|
29,948
|
32,148
|
|||||||||
|
Other
|
9,340
|
14,229
|
11,404
|
|||||||||
|
Consolidated
|
$
|
958,094
|
$
|
1,005,817
|
$
|
1,080,909
|
||||||
Sales in the United States, based on the final country of destination of the Company’s products, were $592.9 million, $573.6 million and $590.0 million in 2015, 2014 and 2013, respectively. No other country of destination exceeded 10% of consolidated sales. Total long-lived assets in the United States amounted to $469.4 million, $450.8 million and $389.7 million at December 31, 2015, 2014 and 2013, respectively.
Product Information
The Company’s revenue from continuing operations summarized by product portfolio is as follows:
|
(In thousands)
|
2015
|
2014
|
2013
|
|||||||||
|
Traditional Flavors & Fragrances
|
$
|
667,941
|
$
|
715,789
|
$
|
727,659
|
||||||
|
Natural Ingredients
|
240,793
|
227,538
|
244,155
|
|||||||||
|
Food & Beverage Colors
|
328,200
|
335,771
|
308,371
|
|||||||||
|
Non-Food Colors
|
183,569
|
215,096
|
229,355
|
|||||||||
|
Interdivision Revenue
|
(44,539
|
)
|
(46,373
|
)
|
(47,414
|
)
|
||||||
|
Consolidated
|
$
|
1,375,964
|
$
|
1,447,821
|
$
|
1,462,126
|
||||||
11. Fair Value Measurements
ASC 820, Fair Value Measurements and Disclosures, defines fair value for financial assets and liabilities, establishes a framework for measuring fair value in GAAP and expands disclosures about fair value measurements. As of December 31, 2015 and 2014, the Company’s only assets and liabilities subject to this standard are forward contracts, investments in a money market fund and municipal bonds, and defined benefit plan assets (See Note 7, Retirement Plans, for additional information on the defined benefit plan assets). The net fair value of the forward exchange contracts based on current pricing obtained for comparable derivative products (Level 2 inputs) was a liability of $0.2 million and $0.1 million as of December 31, 2015 and 2014, respectively. The fair value of the investments based on December 31, 2015 and 2014, market quotes (Level 1 inputs) was an asset of $1.5 million and $1.9 million, respectively.
The carrying values of the Company’s cash and cash equivalents, trade accounts receivable, accounts payable, accrued expenses and short-term borrowings approximated fair values as of December 31, 2015 and 2014.
The fair value of the Company’s long-term debt, including current maturities, is estimated using discounted cash flows based on the Company’s current incremental borrowing rates for similar types of borrowing arrangements (Level 2 inputs). The carrying value of the long-term debt at December 31, 2015 and 2014, was $613.9 million and $451.0 million, respectively. The fair value of the long-term debt at December 31, 2015 and 2014, was approximately $625.3 million and $464.5 million, respectively.
12. Restructuring Charges
The Company incurred restructuring costs in both continuing and discontinued operations. The discussion in this note relates to the combination of both continuing and discontinued operations unless otherwise noted. Restructuring costs related to discontinued operations are recorded in discontinued operations within the Company’s Consolidated Statements of Earnings and are discussed in more detail in Note 13, Discontinued Operations.
In March of 2014, the Company announced that it was initiating a restructuring plan (2014 Restructuring Plan or “Plan”) to eliminate underperforming operations, consolidate manufacturing facilities and improve efficiencies within the Company. The Company determined that it had redundant manufacturing capabilities in both North America and Europe and that it could lower costs and operate more efficiently by consolidating into fewer facilities. Eight facilities were identified for consolidation in the Flavors & Fragrances segment, four in North America and four in Europe. To date, closures have been announced in Indianapolis, Indiana, United States; Cornwall, Mississauga and Halton Hills, Canada; Bremen, Germany; and Milan, Italy. The Company also discontinued one of the businesses in the Color segment, located near Leipzig, Germany, because it did not fit with the Company’s long term strategic plan and it had generated losses for several years. In 2015, the Company identified additional opportunities to consolidate manufacturing operations at one of the Color segment’s facilities in Europe and eliminate additional positions in the European Flavors & Fragrances businesses.
Based on this Plan, the Company determined that certain long-lived assets associated with the underperforming operations were impaired. The Company reduced the carrying amounts of these assets to their aggregate respective fair values which were determined based on independent market valuations. The fair values of the remaining long-lived assets are estimated to be approximately $19 million, which includes certain of the land, buildings and equipment in the assets held for sale, noted below. Also certain machinery and equipment has been identified to be disposed of at the time of the facility closures and the associated depreciation for these assets has been accelerated. The Company recorded long-lived asset impairments, including the impairment charges and accelerated depreciation of $14.5 million and $70.2 million, during the years ended December 31, 2015 and 2014, respectively. Since initiating the Plan, the Company has recorded $84.7 million of long-lived asset impairments, including the impairment charges and accelerated depreciation. In addition, certain intangible assets, inventory and other current assets were also determined to be impaired and were written down.
The Company has also incurred employee separation and other restructuring costs as a result of this Plan. The Company will reduce headcount by approximately 400 positions at the affected facilities, primarily in the Flavors & Fragrances segment, related to direct and indirect labor at manufacturing sites. As of December 31, 2015, approximately 220 positions have been eliminated as a result of this Plan.
As a part of the Plan, the Company anticipates selling its European Natural Ingredients business, a business in the Flavors & Fragrances segment, in 2016. This business has two facilities, located in Marchais, France and Elburg, the Netherlands, which will be included in the expected sale. The European Natural Ingredients business has not generated significant profits for several years and it does not fit with the Company’s long-term strategic plan. In connection with the anticipated sale of the European Natural Ingredients business, the Company has recorded an impairment charge of $2.0 million in 2015, reducing the carrying value of the long-lived assets for this business to zero. An estimate of the fair value of this business less cost to sell, was determined to be lower than its carrying value. The difference between the fair value and its carrying value exceeded the existing net book value of the long-lived assets. Upon completion of the sale, the Company expects to recognize an additional non-cash loss of approximately $12.0 million.
The Company has recorded assets held for sale of land, buildings and equipment of $9.6 million related to the 2014 Restructuring Plan, and inventory, receivable and other assets of $21.4 million related to the anticipated sale of the European Natural Ingredients business. The Company also has $4.1 million of liabilities held for sale related to the anticipated sale of the European Natural Ingredients business.
The Company recorded total restructuring costs of $42.8 million and $98.4 million in the years ended December 31, 2015 and 2014, respectively, in accordance with GAAP and based on an internal review of the affected facilities and consultation with legal and other advisors. Since initiating the 2014 Restructuring Plan, the Company has incurred $141 million of restructuring costs through December 31, 2015. The Company expects to incur approximately $16 million of additional restructuring costs by the end of 2016.
The Company expects that the closure and sale of these operations will significantly lower the Company’s operating costs over the next few years. Upon initiating the Plan, the Company estimated the annual cost reductions to be approximately $30 million, when fully implemented. The U.S. dollar has strengthened considerably since the initiation of the Plan, and based on the current exchange rates, the dollar value of the same cost savings would now be approximately $22 million. In 2015, the Company identified additional cost savings opportunities, and as a result of these actions, the current estimate of annual cost savings is approximately $27 million. The Company has already realized approximately $12 million of these cost savings, with approximately $3 million realized in 2014 and an additional $9 million in 2015. The Company expects to realize approximately $6 million to $7 million of incremental savings in 2016 and the remaining savings in 2017. The Company has also implemented price increases to further mitigate the impact of foreign currency movements.
In connection with the 2014 Restructuring Plan, the Company approved a plan to dispose of a certain business within the Color segment. Production ceased in 2014 and the business met the criteria to be reported as a discontinued operation. The pre-tax loss from discontinued operations, which includes restructuring costs, was not material in 2015 and $11.5 million in 2014.
The Company evaluates performance based on operating income of each segment before restructuring costs. All restructuring costs related to continuing operations are recorded in the Corporate & Other segment. The following table summarizes the restructuring expense by segment and discontinued operations for the years ended December 31, 2015, 2014, and 2013:
|
(In thousands)
|
2015
|
2014
|
2013
|
|||||||||
|
Flavors & Fragrances
|
$
|
37,309
|
$
|
83,871
|
$
|
22,284
|
||||||
|
Color
|
2,113
|
-
|
7,065
|
|||||||||
|
Asia Pacific
|
82
|
261
|
665
|
|||||||||
|
Corporate and Other
|
3,299
|
3,240
|
1,721
|
|||||||||
|
Total Continuing Operations
|
42,803
|
87,372
|
31,735
|
|||||||||
|
Discontinued Operations
|
43
|
10,998
|
-
|
|||||||||
|
Total Restructuring(1)
|
$
|
42,846
|
$
|
98,370
|
$
|
31,735
|
||||||
| (1) | In 2014, the Company recorded $3.2 million of proxy costs related to the 2014 proxy contest. These costs were included in this disclosure in the Company’s 2014 Annual Report to Shareholders. These costs have been removed from the disclosure to conform to current year presentation. |
The Company recorded restructuring costs in continuing operations for the year ended December 31, 2015, as follows:
|
(In thousands)
|
Selling &
Administrative |
Cost of
Products Sold |
Total
|
|||||||||
|
Employee separation
|
$
|
7,155
|
$
|
-
|
$
|
7,155
|
||||||
|
Long-lived asset impairment
|
14,551
|
-
|
14,551
|
|||||||||
|
Gain on asset sales
|
(1,301
|
)
|
-
|
(1,301
|
)
|
|||||||
|
Write-down of inventory
|
-
|
6,098
|
6,098
|
|||||||||
|
Other costs(1)
|
16,300
|
-
|
16,300
|
|||||||||
|
Total
|
$
|
36,705
|
$
|
6,098
|
$
|
42,803
|
||||||
| (1) | Other costs include decommissioning costs, professional services, temporary labor, moving costs and other related costs. |
The Company recorded restructuring costs in continuing operations for the year ended December 31, 2014, as follows:
|
(In thousands)
|
Selling &
Administrative |
Cost of
Products Sold |
Total
|
|||||||||
|
Employee separation
|
$
|
17,794
|
$
|
-
|
$
|
17,794
|
||||||
|
Long-lived asset impairment
|
63,431
|
-
|
63,431
|
|||||||||
|
Gain on asset sales
|
(602
|
)
|
-
|
(602
|
)
|
|||||||
|
Write-down of inventory
|
-
|
1,914
|
1,914
|
|||||||||
|
Other costs(1)
|
4,835
|
-
|
4,835
|
|||||||||
|
Total(2)
|
$
|
85,458
|
$
|
1,914
|
$
|
87,372
|
||||||
| (1) | Other costs include decommissioning costs, professional services, moving costs and other related costs. |
| (2) | In 2014, the Company recorded $3.2 million of proxy costs related to the 2014 proxy contest. These costs were included in this disclosure in the Company’s 2014 Annual Report to Shareholders. These costs have been removed from the disclosure to conform to current year presentation. |
The Company recorded restructuring costs in continuing operations for the year ended December 31, 2013, as follows:
|
(In thousands)
|
Selling &
Administrative |
Cost of
Products Sold |
Total
|
|||||||||
|
Employee separation
|
$
|
18,081
|
$
|
-
|
$
|
18,081
|
||||||
|
Long-lived asset impairment
|
4,176
|
-
|
4,176
|
|||||||||
|
Gain on asset sales
|
(3,019
|
)
|
-
|
(3,019
|
)
|
|||||||
|
Write-down of inventory
|
-
|
1,840
|
1,840
|
|||||||||
|
Other costs(1)
|
10,657
|
-
|
10,657
|
|||||||||
|
Total
|
$
|
29,895
|
$
|
1,840
|
$
|
31,735
|
||||||
| (1) | Other costs include decommissioning costs, professional services, moving costs and other related costs. |
In 2013, the Company completed its 2013 restructuring program related to relocating the Flavors & Fragrances segment headquarters to Chicago and generating operating efficiencies across all segments of the Company by consolidating multiple facilities throughout Europe and North America. The Company recorded $31.7 million of restructuring costs in 2013. The plan resulted in the reduction of global headcount by approximately 280 employees performing various functions.
The following table summarizes the accrual activity for the restructuring liabilities for the years ended December 31, 2015 and 2014:
|
(In thousands)
|
Employee
Separations |
Other Costs
|
Total
|
|||||||||
|
Balance as of December 31, 2013
|
$
|
4,562
|
$
|
1,588
|
$
|
6,150
|
||||||
|
Expense activity(1)
|
18,951
|
4,904
|
23,855
|
|||||||||
|
Cash spent(1)
|
(7,067
|
)
|
(5,595
|
)
|
(12,662
|
)
|
||||||
|
Translation adjustment
|
(1,537
|
)
|
-
|
(1,537
|
)
|
|||||||
|
Balance as of December 31, 2014
|
$
|
14,909
|
$
|
897
|
$
|
15,806
|
||||||
|
Expense activity
|
6,853
|
16,748
|
23,601
|
|||||||||
|
Cash spent
|
(10,174
|
)
|
(16,733
|
)
|
(26,907
|
)
|
||||||
|
Translation adjustment
|
(1,328
|
)
|
-
|
(1,328
|
)
|
|||||||
|
Balance as of December 31, 2015
|
$
|
10,260
|
$
|
912
|
$
|
11,172
|
||||||
|
(1)
|
In 2014, the Company recorded $3.2 million of proxy costs related to the 2014 proxy contest. These costs were included in this disclosure in the Company’s 2014 Annual Report to Shareholders. These costs have been removed from the disclosure to conform to current year presentation.
|
13. Discontinued Operations
In connection with the 2014 Restructuring Plan, the Company approved a plan to dispose of a business unit within the Color segment. The Company determined that as of September 30, 2014, the business met the criteria to be presented as a discontinued operation as established in ASC Subtopic 205-20, Discontinued Operations. The results of this business have been reported as a discontinued operation in the Consolidated Statements of Earnings for all periods presented. The corresponding assets, which include property, plant, and equipment, have met the held for sale criteria and have been properly presented on the Consolidated Balance Sheets.
The following table summarizes the discontinued operation’s results, which are included in the loss from discontinued operations in the Consolidated Statements of Earnings for the years ended December 31, 2015, 2014, and 2013:
|
(In thousands)
|
2015
|
2014
|
2013
|
|||||||||
|
Net sales
|
$
|
187
|
$
|
5,197
|
$
|
5,424
|
||||||
|
Loss from discontinued operations before income taxes
|
(471
|
)
|
(11,496
|
)
|
(1,418
|
)
|
||||||
|
Income tax benefit
|
9
|
3,371
|
415
|
|||||||||
|
Loss from discontinued operations, net of tax
|
$
|
(462
|
)
|
$
|
(8,125
|
)
|
$
|
(1,003
|
)
|
|||
Pre-tax restructuring costs are included in the loss before income taxes from discontinued operations. For the year ended December 31, 2015, the restructuring costs were not material and for the year ended December 31, 2014, these costs were $11.0 million. See Note 12, Restructuring Charges, for additional information.
14. Commitments and Contingencies
Leases
The Company leases certain facilities and equipment under operating lease arrangements. Aggregate minimum rental commitments at December 31, 2015, for all noncancelable operating leases with an initial lease term greater than one year for the years ending December 31 are as follows: 2016, $9.8 million; 2017, $6.3 million; 2018, $4.2 million; 2019, $2.3 million; 2020, $1.6 million and $1.8 million thereafter.
Rent expense from continuing operations totaled $12.3 million, $10.7 million and $10.6 million during the years ended December 31, 2015, 2014 and 2013, respectively.
Commercial Litigation
U.S. Equal Employment Opportunity Commission Civil Complaint
On September 21, 2015, the U.S. Equal Employment Opportunity Commission filed a civil complaint against Sensient Natural Ingredients LLC (SNI) in the U.S. District Court for the Eastern District of California. SNI is a wholly owned subsidiary of the Company. The EEOC’s complaint alleges that SNI failed to comply with the Americans with Disabilities Act (ADA), as amended, when it terminated five employees in 2011. The EEOC seeks to enjoin SNI from engaging in employment practices that discriminate on the basis of disability; asks the Court to order SNI to implement policies, practices, and programs to ensure it does not violate the ADA; and requests back pay with prejudgment interest, reinstatement, front pay, compensation for past and future pecuniary and non-pecuniary losses, and punitive damages on behalf of the five named former employees and any similarly aggrieved individuals. Recoverable compensatory and punitive damages are subject to statutory caps. The complaint does not request a specific damages amount. To date, the EEOC has provided the Company with a list of 13 additional potentially aggrieved former employees not listed in the complaint who may have been terminated in violation of the ADA during the relevant time period.
The Company is vigorously investigating the facts alleged in the complaint to determine what exposure SNI may have. Since 2013, SNI’s on-site human resources representatives have worked closely with both Company counsel and outside labor and employment counsel to ensure that all policies, procedures and actions, including terminations, comply with applicable law. At this early stage, it is not possible to assess the probability of any legal or financial exposure in this matter.
Other Claims
The Company is subject to various claims and litigation arising in the normal course of business. The Company establishes reserves for claims and proceedings when it is probable that liabilities exist and reasonable estimates of loss can be made. While it is not possible to predict the outcome of these matters, based on our assessment of the facts and circumstances now known, we do not believe that these matters, individually or in the aggregate, will have a material adverse effect on our financial position. However, actual outcomes may be different from those expected and could have a material effect on our results of operations or cash flows in a particular period.
Report of Independent Registered Public Accounting Firm
To The Board of Directors and Shareholders of
Sensient Technologies Corporation and Subsidiaries
Milwaukee, Wisconsin
We have audited the accompanying consolidated balance sheets of Sensient Technologies Corporation and subsidiaries as of December 31, 2015 and 2014, and the related consolidated statements of earnings, comprehensive income, shareholders' equity, and cash flows for each of the three years in the period ended December 31, 2015. Our audits also included the financial statement schedule listed in the index at Item 15. These financial statements are the responsibility of the Company's management. Our responsibility is to express an opinion on these financial statements based on our audits.
We conducted our audits in accordance with the standards of the Public Company Accounting Oversight Board (United States). Those standards require that we plan and perform the audit to obtain reasonable assurance about whether the financial statements are free of material misstatement. An audit includes examining, on a test basis, evidence supporting the amounts and disclosures in the financial statements. An audit also includes assessing the accounting principles used and significant estimates made by management, as well as evaluating the overall financial statement presentation. We believe that our audits provide a reasonable basis for our opinion.
In our opinion, the financial statements referred to above present fairly, in all material respects, the consolidated financial position of Sensient Technologies Corporation and subsidiaries at December 31, 2015 and 2014, and the consolidated results of their operations and their cash flows for each of the three years in the period ended December 31, 2015, in conformity with U.S. generally accepted accounting principles.
We also have audited, in accordance with the standards of the Public Company Accounting Oversight Board (United States), Sensient Technologies Corporation's internal control over financial reporting as of December 31, 2015, based on criteria established in Internal Control-Integrated Framework issued by the Committee of Sponsoring Organizations of the Treadway Commission (2013 framework) and our report dated February 25, 2016 expressed an unqualified opinion thereon.
|
/s/ Ernst & Young LLP
|
|
Milwaukee, Wisconsin
|
|
February 25, 2016
|
Report of Independent Registered Public Accounting Firm on Internal Control Over Financial Reporting
To The Board of Directors and Shareholders of
Sensient Technologies Corporation and Subsidiaries
Milwaukee, Wisconsin
We have audited Sensient Technologies Corporation and subsidiaries’ internal control over financial reporting as of December 31, 2015, based on criteria established in Internal Control–Integrated Framework issued by the Committee of Sponsoring Organizations of the Treadway Commission (2013 framework) (the COSO criteria). Sensient Technologies Corporation and subsidiaries’ management is responsible for maintaining effective internal control over financial reporting, and for its assessment of the effectiveness of internal control over financial reporting included in the accompanying Management’s Report on Internal Control Over Financial Reporting. Our responsibility is to express an opinion on the Company’s internal control over financial reporting based on our audit.
We conducted our audit in accordance with the standards of the Public Company Accounting Oversight Board (United States). Those standards require that we plan and perform the audit to obtain reasonable assurance about whether effective internal control over financial reporting was maintained in all material respects. Our audit included obtaining an understanding of internal control over financial reporting, assessing the risk that a material weakness exists, testing and evaluating the design and operating effectiveness of internal control based on the assessed risk, and performing such other procedures as we considered necessary in the circumstances. We believe that our audit provides a reasonable basis for our opinion.
A company’s internal control over financial reporting is a process designed to provide reasonable assurance regarding the reliability of financial reporting and the preparation of financial statements for external purposes in accordance with generally accepted accounting principles. A company’s internal control over financial reporting includes those policies and procedures that (1) pertain to the maintenance of records that, in reasonable detail, accurately and fairly reflect the transactions and dispositions of the assets of the company; (2) provide reasonable assurance that transactions are recorded as necessary to permit preparation of financial statements in accordance with generally accepted accounting principles, and that receipts and expenditures of the company are being made only in accordance with authorizations of management and directors of the company; and (3) provide reasonable assurance regarding prevention or timely detection of unauthorized acquisition, use, or disposition of the company’s assets that could have a material effect on the financial statements.
Because of its inherent limitations, internal control over financial reporting may not prevent or detect misstatements. Also, projections of any evaluation of effectiveness to future periods are subject to the risk that controls may become inadequate because of changes in conditions, or that the degree of compliance with the policies or procedures may deteriorate.
In our opinion, Sensient Technologies Corporation and subsidiaries maintained, in all material respects, effective internal control over financial reporting as of December 31, 2015, based on the COSO criteria.
We also have audited, in accordance with the standards of the Public Company Accounting Oversight Board (United States), the consolidated balance sheets of Sensient Technologies Corporation and subsidiaries as of December 31, 2015 and 2014, and the related consolidated statements of earnings, comprehensive income, shareholders' equity, and cash flows for each of the three years in the period ended December 31, 2015 and our report dated February 25, 2016 expressed an unqualified opinion thereon.
|
/s/ Ernst & Young LLP
|
|
Milwaukee, Wisconsin
|
|
February 25, 2016
|
Valuation and Qualifying Accounts (in thousands); Years Ended December 31, 2015, 2014 and 2013
|
Valuation Accounts Deducted in the Balance Sheet From the Assets to Which They Apply
|
Balance
at Beginning
of Period
|
Additions
Charged to
Costs and
Expenses
|
Additions
Recorded
During
Acquisitions
|
Deductions
(A)
|
Balance at
End of
Period
|
|||||||||||||||
|
2013
Allowance for losses:
Trade accounts receivable
|
$
|
3,045
|
$
|
1,413
|
$
|
0
|
$
|
130
|
$
|
4,327
|
||||||||||
|
2014
Allowance for losses:
Trade accounts receivable
|
$
|
4,327
|
$
|
896
|
$
|
0
|
$
|
1,385
|
$
|
3,838
|
||||||||||
|
2015
Allowance for losses:
Trade accounts receivable
|
$
|
3,838
|
$
|
1,459
|
$
|
0
|
$
|
1,426
|
$
|
3,871
|
||||||||||
|
(A) Accounts written off, net of recoveries.
|
||||||||||||||||||||
Pursuant to the requirements of Section 13 or 15(d) of the Securities Exchange Act of 1934, the Registrant has duly caused this report to be signed on its behalf by the undersigned, thereunto duly authorized.
|
SENSIENT TECHNOLOGIES CORPORATION
|
|
|
/s/ John L. Hammond
|
|
|
John L. Hammond
|
|
|
Senior Vice President, General Counsel and Secretary
|
|
|
Dated: February 25, 2016
|
Pursuant to the requirements of the Securities Exchange Act of 1934, this report has been signed below as of February 25, 2016, by the following persons on behalf of the Registrant and in the capacities indicated.
|
/s/ Kenneth P. Manning
|
/s/ Fergus M. Clydesdale
|
|
Kenneth P. Manning
|
Fergus M. Clydesdale
|
|
Chairman of the Board
|
Director
|
|
/s/ Paul Manning
|
/s/ James A.D. Croft
|
|
Paul Manning
|
James A.D. Croft
|
|
Director, President and
|
Director
|
|
Chief Executive Officer
|
|
|
/s/ Stephen J. Rolfs
|
/s/ Mario Ferruzzi
|
|
Stephen J. Rolfs
|
Mario Ferruzzi
|
|
Senior Vice President and
|
Director
|
|
Chief Financial Officer
|
|
|
/s/ Jeffrey T. Makal
|
/s/ Donald W. Landry
|
|
Jeffrey T. Makal
|
Donald W. Landry
|
|
Vice President, Controller and
|
Director
|
|
Chief Accounting Officer
|
|
|
/s/ Hank Brown
|
/s/ Deborah McKeithan-Gebhardt
|
|
Hank Brown
|
Deborah McKeithan-Gebhardt
|
|
Director
|
Director
|
|
/s/ Joseph Carleone
|
/s/ Elaine R. Wedral
|
|
Joseph Carleone
|
Elaine R. Wedral
|
|
Director
|
Director
|
|
/s/ Edward H. Cichurski
|
/s/ Essie Whitelaw
|
|
Edward H. Cichurski
|
Essie Whitelaw
|
|
Director
|
Director
|
SENSIENT TECHNOLOGIES CORPORATION
2015 ANNUAL REPORT ON FORM 10-K
|
Exhibit
Number
|
Description
|
Incorporated by
Reference from
|
Filed
Herewith
|
|||
|
3.1
|
Sensient Technologies Corporation Amended and Restated Articles of Incorporation
|
Exhibit 3.1 to Quarterly Report on Form 10-Q for the quarter ended March 31, 2015 (Commission File No.1-7626)
|
||||
|
3.2
|
Sensient Technologies Corporation Amended and Restated By-Laws
|
Exhibit 3.2 to Current Report on Form 8-K dated December 3, 2015 (Commission File No. 1-7626)
|
||||
|
4.1(a)
|
Note Purchase Agreement dated as of March 22, 2011
|
Exhibit 10.1 to Current Report on Form 8-K dated March 22, 2011 (Commission File No. 1-7626)
|
||||
|
4.1(b)
|
First Amendment dated as of November 6, 2015 to Note Purchase Agreement dated as of March 22, 2011
|
Exhibit 10.4 to Current Report on Form 8-K dated November 6, 2015 (Commission File No. 1-7626)
|
||||
|
4.2(a)
|
Note Purchase Agreement dated as of April 5, 2013
|
Exhibit 10.1 to Current Report on Form 8-K dated April 5, 2013 (Commission File No. 1-7626)
|
||||
|
4.2(b)
|
First Amendment dated as of November 6, 2015 to Note Purchase Agreement dated as of April 5, 2013
|
Exhibit 10.3 to Current Report on Form 8-K dated November 6, 2015 (Commission File No. 1-7626)
|
||||
|
4.3
|
First Amendment dated as of November 6, 2015 to Note Purchase Agreement dated as of November 19, 2009
|
Exhibit 10.5 to Current Report on Form 8-K dated November 6, 2015 (Commission File No. 1-7626)
|
||||
|
4.4
|
Note Purchase Agreement dated as of November 6, 2015
|
Exhibit 10.2 to Current Report on Form 8-K dated November 6, 2015 (Commission File No. 1-7626)
|
||||
|
10
|
Material Contracts
|
|||||
|
10.1
|
Management Contracts or Compensatory Plans
|
|||||
|
10.1(a)
|
Executive Employment Contract dated as of February 2, 2014, between Sensient Technologies Corporation and Paul Manning
|
Exhibit 10.1 to Current Report on Form 8-K dated February 4, 2014 (Commission File No. 1-7626)
|
||||
|
10.1(b)
|
Form of Change of Control Employment and Severance Agreement
|
Exhibit 10.1(b)(3) to Annual Report on Form 10-K for the fiscal year ended December 31, 2011 (Commission File No. 1-7626)
|
||||
|
10.1(c)(1)
|
Sensient Technologies Corporation 2002 Non-Employee Directors Stock Plan (superseded)
|
Appendix C to Definitive Proxy Statement filed on Schedule 14A on March 15, 2004 (Commission File No. 1-7626)
|
||||
|
10.1(c)(2)
|
Sensient Technologies Corporation 2012 Non-Employee Directors Stock Plan
|
Exhibit 10.1(c)(2) to Annual Report of Form 10-K for the fiscal year ended December 31, 2014 (Commission File No. 1-7626)
|
SENSIENT TECHNOLOGIES CORPORATION
EXHIBIT INDEX
2015 ANNUAL REPORT ON FORM 10-K
|
Exhibit
Number
|
Description
|
Incorporated by
Reference from
|
Filed
Herewith
|
|||
|
10.1(d)
|
Universal Foods Corporation 1994 Employee Stock Plan
|
Exhibit 10.2(f) to Annual Report on Form 10-K for the fiscal year ended September 30, 1998 (Commission File No. 1-7626)
|
||||
|
10.1(d)(1)
|
Amendment of Universal Foods Corporation 1994 Employee Stock Plan
|
Exhibit 10.1(e)(1) to Annual Report on Form 10-K for the fiscal year ended December 31, 2000 (Commission File No. 1-7626)
|
||||
|
10.1(e)
|
Universal Foods Corporation 1998 Stock Option Plan
|
Exhibit 10.2(h) to Annual Report on Form 10-K for the fiscal year ended September 30, 1998 (Commission File No. 1-7626)
|
||||
|
10.1(e)(1)
|
Amendment of Universal Foods Corporation 1998 Stock Option Plan
|
Exhibit 10.1(f)(1) to Annual Report on Form 10-K for-the fiscal year ended December 31, 2000 (Commission File No. 1-7626)
|
||||
|
10.1(f)
|
Universal Foods Corporation 1999 Non-Employee Director Stock Option Plan
|
Appendix A to Definitive Proxy Statement filed on Schedule 14A on December 17, 1999 (Commission File No. 1-7626)
|
||||
|
10.1(f)(1)
|
Amendment of Universal Foods Corporation 1999 Non-Employee Director Stock Option Plan
|
Exhibit 10.1(g)(1) to Annual Report on Form 10-K for the fiscal year ended December 31, 2000 (Commission File No. 1-7626)
|
||||
|
10.1(g)
|
Sensient Technologies Corporation 2002 Stock Option Plan
|
Appendix B to Definitive Proxy Statement filed on Schedule 14A on March 22, 2002 (Commission File No. 1-7626)
|
||||
|
10.1(g)(1)
|
Amendment No. 1 to the Sensient Technologies Corporation 2002 Stock Option Plan
|
Exhibit 10.11 to Quarterly Report on Form 10-Q for the quarter ended September 30, 2008 (Commission File No. 1-7626)
|
||||
|
10.1(g)(2)
|
Form of Sensient Technologies Corporation 2002 Stock Option Plan Restricted Stock Agreement
|
Exhibit 10.1 to Current Report on Form 8-K dated December 1, 2005 (Commission File No. 1-7626)
|
||||
|
10.1(h)
|
Sensient Technologies Corporation 2007 Restricted Stock Plan
|
Appendix B to Definitive Proxy Statement filed on Schedule 14A on March 15, 2007 (Commission File No. 1-7626)
|
||||
|
10.1(h)(1)
|
Amendment No. 1 to the Sensient Technologies Corporation 2007 Restricted Stock Plan
|
Exhibit 10.12 to Quarterly Report on Form 10-Q for the quarter ended September 30, 2008 (Commission File No. 1-7626)
|
||||
|
10.1(i)
|
Sensient Technologies Corporation Directors’ Deferred Compensation Plan
|
Exhibit 10.1 to Current Report on Form 8-K dated May 28, 2014 (Commission File No. 1-7626)
|
||||
|
10.1(i)(1)
|
Sensient Technologies Corporation Non-Employee Directors’ Retirement Plan
|
Exhibit 10.2 to Current Report on Form 8-K dated July 25, 2013 (Commission File No. 1-7626)
|
||||
|
10.1(j)(1)
|
Sensient Technologies Corporation Frozen Management Income Deferral Plan
|
Exhibit 10.5(a) to Quarterly Report on Form 10-Q for the quarter ended September 30, 2008 (Commission File No. 1-7626)
|
SENSIENT TECHNOLOGIES CORPORATION
EXHIBIT INDEX
2015 ANNUAL REPORT ON FORM 10-K
|
Exhibit
Number
|
Description
|
Incorporated by
Reference from
|
Filed
Herewith
|
|||
|
10.1(j)(2)
|
Sensient Technologies Corporation Management Income Deferral Plan
|
Exhibit 10.5(b) to Quarterly Report on Form 10-Q for the quarter ended September 30, 2008 (Commission File No. 1-7626)
|
||||
|
10.1(k)(1)
|
Sensient Technologies Corporation Frozen Executive Income Deferral Plan
|
Exhibit 10.4(a) to Quarterly Report on Form 10-Q for the quarter ended September 30, 2008 (Commission File No. 1-7626)
|
||||
|
10.1(k)(2)
|
Sensient Technologies Corporation Executive Income Deferral Plan
|
Exhibit 10.4(b) to Quarterly Report on Form 10-Q for the quarter ended September 30, 2008 (Commission File No. 1-7626)
|
||||
|
10.1(l)
|
Amended and Restated Sensient Technologies Corporation Rabbi Trust “A” Agreement dated November 30, 2009, between Sensient Technologies Corporation and Wells Fargo Bank, N.A.
|
Exhibit 10.1(l) to Annual Report on Form 10-K for the fiscal year ended December 31, 2009 (Commission File No. 1-7626)
|
||||
|
10.1(m)
|
Amended and Restated Sensient Technologies Corporation Rabbi Trust “B” Agreement dated November 30, 2009, between Sensient Technologies Corporation and Wells Fargo Bank, N.A.
|
Exhibit 10.1(m) to Annual Report on Form 10-K for the fiscal year ended December 31, 2009 (Commission File No. 1-7626)
|
||||
|
10.1(n)
|
Amended and Restated Sensient Technologies Corporation Rabbi Trust “C” Agreement dated November 30, 2009, between Sensient Technologies Corporation and Wells Fargo Bank, N.A.
|
Exhibit 10.1(n) to Annual Report on Form 10-K for the fiscal year ended December 31, 2009 (Commission File No. 1-7626)
|
||||
|
10.1(o)
|
Sensient Technologies Corporation Incentive Compensation Plan for Elected Corporate Officers
|
Appendix B to Definitive Proxy Statement filed on Schedule 14A on March 17, 2014 (Commission File No. 1-7626)
|
||||
|
10.1(p)
|
Sensient Technologies Corporation Management Incentive Plan for Group Presidents
|
Exhibit 10.9 to Quarterly Report on Form 10-Q for the quarter ended September 30, 2008 (Commission File No. 1-7626)
|
||||
|
10.1(q)
|
Sensient Technologies Corporation Management Incentive Plan for Corporate Management
|
Exhibit 10.7 to Quarterly Report on Form 10-Q for the quarter ended September 30, 2008 (Commission File No. 1-7626)
|
||||
|
10.1(r)
|
Sensient Technologies Corporation Management Incentive Plan for Group/Division Management
|
Exhibit 10.8 to Quarterly Report on Form 10-Q for the quarter ended September 30, 2008 (Commission File No. 1-7626)
|
||||
|
10.1(s)(1)
|
Sensient Technologies Corporation Form of Supplemental Executive Retirement Plan A Agreement
|
Exhibit 10.1(s) to Annual Report on Form 10-K for the fiscal year ended December 31, 2008 (Commission File No. 1-7626)
|
||||
|
10.1(s)(2)
|
Form of Amendment No. 1 to the Sensient Technologies Corporation Amended and Restated Supplemental Executive Retirement Plan A
|
Exhibit 10.1(s)(2) to Annual Report on Form 10-K for the fiscal year ended December 31, 2010 (Commission file No. 1-7626)
|
SENSIENT TECHNOLOGIES CORPORATION
EXHIBIT INDEX
2015 ANNUAL REPORT ON FORM 10-K
|
Exhibit
Number
|
Description
|
Incorporated by
Reference From
|
Filed
Herewith
|
|||
|
10.1(s)(3)
|
Form of Amendment No. 2 to the Sensient Technologies Corporation Amended and Restated Supplemental Executive Retirement Plan A
|
Exhibit 10.1 to Current Report on Form 8-K dated April 22, 2010 (Commission File No. 1-7626)
|
||||
|
10.1(t)(1)
|
Sensient Technologies Corporation Form of Supplemental Executive Retirement Plan B Agreement
|
Exhibit 10.1(t) to Annual Report on Form 10-K for the fiscal year ended December 31, 2008 (Commission File No. 1-7626)
|
||||
|
10.1(t)(2)
|
Form of Amendment No. 1 to the Sensient Technologies Corporation Amended and Restated Supplemental Executive Retirement Plan B
|
Exhibit 10.1(t)(2) to Annual Report on Form 10-K for the fiscal year ended December 31, 2010 (Commission File No. 1-7626)
|
||||
|
10.1(t)(3)
|
Form of Amendment No. 2 to the Sensient Technologies Corporation Amended and Restated Supplemental Executive Retirement Plan B
|
Exhibit 10.2 to Current Report on Form 8-K dated April 22, 2010 (Commission File No. 1-7626)
|
||||
|
10.1(u)(1)
|
Sensient Technologies Corporation Frozen Supplemental Benefit Plan
|
Exhibit 10.6(a) to Quarterly Report on Form 10-Q for the quarter ended September 30, 2008 (Commission File No. 1-7626)
|
||||
|
10.1(u)(2)
|
Sensient Technologies Corporation Supplemental Benefit Plan
|
Exhibit 10.6(b) to Quarterly Report on Form 10-Q for the quarter ended September 30, 2008 (Commission File No. 1-7626)
|
||||
|
10.1(v)
|
Sensient Technologies Corporation Policy on Recovery of Incentive Compensation from Executives
|
Exhibit 10.1 to Current Report on Form 8-K dated December 8, 2011 (Commission File No. 1-7626)
|
||||
|
10.1(w)
|
Form of Performance Stock Unit Agreement
|
Exhibit 10.3 to Current Report on Form 8-K dated May 28, 2014 (Commission File No. 1-7626)
|
||||
|
10.2(a)
|
Amended and Restated Credit Agreement dated as of October 24, 2014
|
Exhibit 10.1 to Current Report on Form 8-K dated October 24, 2014 (Commission File No. 1-7626)
|
||||
|
10.2(b)
|
First Amendment dated as of November 6, 2015 to Amended and Restated Credit Agreement dated as of October 24, 2014
|
Exhibit 10.1 to Current Report on Form 8-K dated November 6, 2015 (Commission File No. 1-7626)
|
||||
|
10.3
|
Credit Agreement dated as of October 7, 2008
|
Exhibit 10.1 to Current Report on Form 8-K dated October 7, 2008 (Commission File No. 1-7626)
|
||||
|
Subsidiaries of the Registrant
|
X
|
SENSIENT TECHNOLOGIES CORPORATION
EXHIBIT INDEX
2015 ANNUAL REPORT ON FORM 10-K
|
Exhibit
Number
|
Description
|
Incorporated by
Reference From
|
Filed
Herewith
|
|||
|
Consent of Ernst & Young LLP
|
X
|
|||||
|
Certifications of Sensient’s President and Chief Executive Officer and Senior Vice President and Chief Financial Officer, pursuant to Rule 13a-14(a) of the Exchange Act
|
X
|
|||||
|
Certifications of Sensient’s President and Chief Executive Officer and Senior Vice President and Chief Financial Officer, pursuant to 18 United States Code § 1350
|
X
|
|||||
|
101.INS*
|
Instance Document
|
X
|
||||
|
101.SCH*
|
XBRL Taxonomy Extension Schema Document
|
X
|
||||
|
101.CAL*
|
XBRL Taxonomy Extension Calculation Linkbase Document
|
X
|
||||
|
101.DEF*
|
XBRL Taxonomy Extension Definition Linkbase Document
|
X
|
||||
|
101.LAB*
|
XBRL Taxonomy Extension Label Linkbase Document
|
X
|
||||
|
101.PRE*
|
XBRL Taxonomy Extension Presentation Linkbase Document
|
X
|
*The following financial information is formatted in XBRL (eXtensible Business Reporting Language) and furnished electronically herewith: (i) Consolidated Statements of Earnings for the twelve months ended December 31, 2015, 2014 and 2013; (ii) Consolidated Statements of Comprehensive Income for the twelve months ended December 31, 2015, 2014 and 2013; (iii) Consolidated Balance Sheets as of December 31, 2015 and 2014; (iv) Consolidated Statements of Shareholders’ Equity for the twelve months ended December 31, 2015, 2014 and 2013; (v) Consolidated Statements of Cash Flow for the twelve months ended December 31, 2015, 2014 and 2013; and (vi) Notes to Consolidated Financial Statements.
E-5