Attached files
| file | filename |
|---|---|
| EX-23.1 - EXHIBIT 23.1 - PARKWAY PROPERTIES INC | pky-20151231x10kxexhibit231.htm |
| EX-31.2 - EXHIBIT 31.2 - PARKWAY PROPERTIES INC | pky-20151231x10kxexhibit312.htm |
| EX-32.1 - EXHIBIT 32.1 - PARKWAY PROPERTIES INC | pky-20151231x10kxexhibit321.htm |
| EX-32.2 - EXHIBIT 32.2 - PARKWAY PROPERTIES INC | pky-20151231x10kxexhibit322.htm |
| EX-10.37 - EXHIBIT 10.37 - PARKWAY PROPERTIES INC | pky-20151231x10kxexhibit1037.htm |
| EX-31.1 - EXHIBIT 31.1 - PARKWAY PROPERTIES INC | pky-20151231x10kxexhibit311.htm |
| EX-10.19 - EXHIBIT 10.19 - PARKWAY PROPERTIES INC | pky-20151231x10kxexhibit1019.htm |
| EX-21 - EXHIBIT 21 - PARKWAY PROPERTIES INC | pky-20151231x10kxexhibit21.htm |
UNITED STATES SECURITIES AND EXCHANGE COMMISSION
Washington, D.C. 20549
FORM 10-K
x ANNUAL REPORT PURSUANT TO SECTION 13 OR 15(d)
OF THE SECURITIES EXCHANGE ACT OF 1934
For the fiscal year ended December 31, 2015
OR
o TRANSITION REPORT PURSUANT TO SECTION 13 OR 15(d)
OF THE SECURITIES EXCHANGE ACT OF 1934
For the transition period from to
Commission file number 1-11533
Parkway Properties, Inc.
(Exact name of registrant as specified in its charter)
Maryland | 74-2123597 |
(State or other jurisdiction | (I.R.S. Employer |
of incorporation or organization) | Identification No.) |
Bank of America Center
390 North Orange Avenue, Suite 2400
Orlando, Florida 32801
(Address of principal executive offices) (Zip Code)
Registrant's telephone number: (407) 650-0593
Securities registered pursuant to Section 12(b) of the Act:
Common Stock, $.001 Par Value
New York Stock Exchange
Securities registered pursuant to Section 12(g) of the Act:
None
Indicate by check mark if the registrant is a well-known seasoned issuer, as defined in Rule 405 of the Securities Act. x Yes o No
Indicate by check mark if the registrant is not required to file reports pursuant to Section 13 or Section 15(d) of the Act. o Yes x No
Indicate by check mark whether the registrant (1) has filed all reports required to be filed by Section 13 or 15(d) of the Securities Exchange Act of 1934 during the preceding 12 months (or for such shorter period that the registrant was required to file such reports), and (2) has been subject to such filing requirements for the past 90 days. x Yes o No
Indicate by check mark whether the registrant has submitted electronically and posted on its corporate Web site, if any, every Interactive Data File required to be submitted and posted pursuant to Rule 405 of Regulation S-T (§232.405 of this chapter) during the preceding 12 months (or for such shorter period that the registrant was required to submit and post such files). x Yes o No
Indicate by check mark if disclosure of delinquent filers pursuant to Item 405 of Regulation S-K is not contained herein, and will not be contained, to the best of registrant's knowledge, in definitive proxy or information statements incorporated by reference in Part III of this Form 10-K or any amendment to this Form 10-K. x
Indicate by check mark whether the registrant is a large accelerated filer, an accelerated filer, a non-accelerated filer or a smaller reporting company. See definition of "large accelerated filer" in Rule 12b-2 of the Exchange Act. (Check one):
Large accelerated filer x Accelerated filer o Non-accelerated filer o Smaller reporting company o
(do not check if a smaller reporting company)
Indicate by check mark whether the registrant is a shell company (as defined in Rule 12b-2 of the Exchange Act). o Yes x No
The aggregate market value of the voting and non-voting common equity held by non-affiliates computed by reference to the price at which the common equity was last sold, or the average bid and asked price of such common equity, at June 30, 2015 was $1.7 billion.
There were 111,635,604 shares of common stock and 4,213,104 shares of limited voting stock outstanding at February 18, 2016.
DOCUMENTS INCORPORATED BY REFERENCE
Portions of the Registrant's Proxy Statement for the 2016 Annual Meeting of Stockholders are incorporated by reference into Part III.
PARKWAY PROPERTIES, INC.
TABLE OF CONTENTS
Page | ||
PART I. | ||
Item 1. | ||
Item 1A. | ||
Item 1B. | ||
Item 2. | ||
Item 3. | ||
Item 4. | ||
PART II. | ||
Item 5. | ||
Item 6. | ||
Item 7. | ||
Item 7A. | ||
Item 8. | ||
Item 9. | ||
Item 9A. | ||
Item 9B. | ||
PART III. | ||
Item 10. | ||
Item 11. | ||
Item 12. | ||
Item 13. | ||
Item 14. | ||
PART IV. | ||
Item 15. | ||
SIGNATURES | ||
Forward-Looking Statements
Certain sections of this Annual Report on Form 10-K contain "forward-looking statements" within the meaning of the Private Securities Litigation Reform Act of 1995 set forth in Section 27A of the Securities Act of 1933, as amended (the "Securities Act"), and Section 21E of the Securities Exchange Act of 1934, as amended (the "Exchange Act"). Examples of forward-looking statements include projected capital resources, projected profitability and portfolio performance, estimates of market rental rates, projected capital improvements, expected sources of financing, expectations as to the timing of closings of acquisitions, dispositions or other transactions, the ability to complete acquisitions and dispositions and the risks associated therewith, and the expected operating performance of anticipated near-term acquisitions and descriptions relating to these expectations. We caution investors that any forward-looking statements presented in this Annual Report on Form 10-K are based on management's beliefs and assumptions made by, and information currently available to, management. When used, the words "anticipate," "assume," "believe," "estimate," "expect," "intend," "may," "might," "plan," "potential," "project," "should," "will," "result" or similar expressions that do not relate solely to historical matters are intended to identify forward-looking statements. You can also identify forward-looking statements by discussions of strategy, plans or intentions.
Forward-looking statements involve risks and uncertainties (some of which are beyond our control) and are subject to change based upon various factors, including but not limited to the following risks and uncertainties:
• | changes in the real estate industry and in performance of the financial markets; |
• | the actual or perceived impact of U.S. monetary policy; |
• | competition in the leasing market; |
• | the demand for and market acceptance of our properties for rental purposes; |
• | oversupply of office properties in our geographic markets; |
• | the amount and growth of our expenses; |
• | customer financial difficulties and general economic conditions, including increasing interest rates and changes in prices of commodities, as well as economic conditions in our geographic markets; |
• | defaults or non-renewal of leases; |
• | risks associated with joint venture partners; |
• | risks associated with the ownership and development of real property, including risks related to natural disasters; |
• | risks associated with property acquisitions; |
• | the failure to acquire or sell properties as and when anticipated; |
• | illiquidity of real estate; |
• | termination or non-renewal of property management contracts; |
• | the bankruptcy or insolvency of companies for which we provide property management services or the sale of these properties; |
• | the outcome of claims and litigation involving or affecting us; |
• | the ability to satisfy conditions necessary to close pending transactions and the ability to successfully integrate businesses; |
• | compliance with environmental and other regulations, including real estate and zoning laws; |
• | our inability to obtain financing; |
• | our inability to use net operating loss carryforwards; |
• | our failure to maintain our status as real estate investment trust ("REIT") under the Internal Revenue Code of 1986, as amended (the “Code”); and |
• | other risks and uncertainties detailed from time to time in our SEC filings. |
A discussion of these and other risks and uncertainties that could cause actual results and events to differ materially from such forward-looking statements is included in "Risk Factors" and "Management's Discussion and Analysis of Financial Condition and Results of Operations" of this Annual Report on Form 10-K. Should one or more of these risks or uncertainties occur, or should underlying assumptions prove incorrect, our business, financial condition, liquidity, cash flows and financial results could differ materially from those expressed in any forward-looking statement. While forward-looking statements reflect our good faith beliefs, they are not guarantees of future performance. Any forward-looking statement speaks only as of the date on which it is made. New risks and uncertainties arise over time, and it is not possible for us to predict the occurrence of those matters or the manner in which they may affect us. Except as required by law, we undertake no obligation to publicly update or revise any forward-looking statement to reflect changes in underlying assumptions or factors, of new information, data or methods, future events or other changes.
PART I
ITEM I. Business
As used herein, the terms "we," "us," "our," "Parkway" and the "Company" refer to Parkway Properties, Inc., a Maryland corporation, individually or together with its subsidiaries, including Parkway Properties LP, a Delaware limited partnership, and our predecessors. The term "Operating Partnership" refers to Parkway Properties LP, individually or together with its subsidiaries.
Overview
We are a fully integrated, self-administered and self-managed REIT specializing in the acquisition, ownership, development and management of quality office properties in high-growth submarkets in the Sunbelt region of the United States. We owned or had an interest in a portfolio of 36 office properties located in six states with an aggregate of approximately 14.3 million square feet of leasable space at January 1, 2016. "Part I. Item 2. Properties – Office Buildings" includes a complete listing of properties by market. We offer fee-based real estate services through wholly owned subsidiaries, which in total managed and/or leased approximately 2.7 million square feet for third-party property owners at January 1, 2016. Unless otherwise indicated, all references to square feet represent net rentable area.
Administration
We were formed as a corporation under the laws of the State of Maryland in 1996 and elected to be taxed as a REIT for U.S. federal income tax purposes commencing with our taxable year ended December 31, 1997. We generally perform commercial real estate leasing, management and acquisition services on an in-house basis. As of December 31, 2015, we had 245 employees. Our principal executive office is located at 390 North Orange Avenue, Suite 2400, Orlando, Florida 32801 and our telephone number is (407) 650-0593. In addition, we have a regional office in Jacksonville, Florida.
Business Objective and Operating Strategies
Our business objective is to maximize long-term stockholder value by generating sustainable cash flow growth and increasing the long-term value of our real estate assets through operations, acquisitions and capital recycling, while maintaining a conservative and flexible balance sheet. We intend to achieve this objective by executing on the following business and growth strategies:
• | Create Value as the Leading Owner of Quality Assets in Core Submarkets. Our investment strategy is to pursue attractive returns by focusing primarily on owning high-quality office buildings and portfolios that are well-located and competitively positioned within central business district and urban infill locations within our core submarkets in the Sunbelt region of the United States. In these submarkets, we seek to maintain a portfolio that consists of core, core-plus and value-add investment opportunities. Further, we intend to pursue an efficient capital allocation strategy that maximizes the returns on our invested capital. This may include selectively disposing of properties when we believe returns have been maximized and redeploying capital into acquisitions or other opportunities. |
• | Maximize Cash Flow by Continuing to Enhance the Operating Performance of Each Property. We provide property management and leasing services to our portfolio, actively managing our properties and leveraging our customer relationships to improve operating performance, maximize long-term cash flow and enhance stockholder value. We seek to attain a favorable customer retention rate by providing outstanding property management and customer service programs responsive to the varying needs of our diverse customer base. We also employ a judicious prioritization of capital projects to focus on projects that enhance the value of our property through increased rental rates, occupancy, service delivery, or enhanced reversion value. |
• | Realize Leasing and Operational Efficiencies and Gain Local Advantage. We concentrate our real estate portfolio in submarkets where we believe that we can maximize market penetration by accumulating a critical mass of properties and thereby enhance operating efficiencies. We believe that strengthening our local presence and leveraging our extensive market relationships will yield superior market information and service delivery and facilitate additional investment opportunities to create long-term stockholder value. |
5
Joint Ventures and Partnerships
Investing in wholly owned properties is the highest priority of our capital allocation. However, we may selectively pursue joint ventures if we determine that such a structure will allow us to reduce anticipated risks related to a property or portfolio, limit concentration of rental revenue from a particular market or building or address unusual operational risks. Under the terms of these joint ventures and partnerships, where applicable, we will seek to manage all phases of the investment cycle including acquisition, financing, operations, leasing and dispositions, and we will seek to receive fees for providing these services.
Parkway Properties Office Fund II, L.P.
At December 31, 2015, we had one consolidated partnership structured as a discretionary fund. Parkway Properties Office Fund II, L.P. ("Fund II"), a $750.0 million discretionary fund, was formed on May 14, 2008. Fund II was structured with the Teacher Retirement System of Texas ("TRST") as a 70% investor and our Operating Partnership as a 30% investor, with an original target capital structure of approximately $375.0 million of equity capital and $375.0 million of non-recourse, fixed-rate first mortgage debt. Fund II currently owns five properties and one development property totaling 2.2 million square feet in Atlanta, Georgia; Phoenix, Arizona; and Philadelphia, Pennsylvania. In August 2012, Fund II increased its investment capacity by $20.0 million to purchase Hayden Ferry Lakeside III, IV and V, a 2,500 space parking garage, a 21,000 square foot office property and a vacant parcel of land available for development, all adjacent to our Hayden Ferry Lakeside I and Hayden Ferry Lakeside II office properties in Phoenix, Arizona. In August 2013, Fund II expanded its investment guidelines solely for the purpose of authorizing the purchase of a parcel of land available for development in Tempe, Arizona. In April 2014, Fund II authorized the development of Hayden Ferry Lakeside III, as well as the transfer of an interest in the owner of Hayden Ferry Lakeside III, a subsidiary of Fund II, to our Operating Partnership. We now own a 70% indirect interest in Hayden Ferry Lakeside III.
We serve as the general partner of Fund II and provide asset management, property management, leasing and construction management services to the fund, for which we are paid market-based fees. Cash is distributed by Fund II pro rata to each partner until a 9% annual cumulative preferred return is received and invested capital is returned. Thereafter, 56% will be distributed to TRST and 44% to us. The term of Fund II is seven years from the date the fund was fully invested, or until February 2019, with provisions to extend the term for two additional one-year periods at our discretion.
Joint Ventures
In addition to the 35 office properties included in our consolidated financial statements, we were also invested in three unconsolidated joint ventures as of December 31, 2015.
US Airways Building Tenancy in Common
On June 3, 2013, we purchased a 74.6% interest in the US Airways Building, a 229,000 square foot office building located in the Tempe submarket of Phoenix, Arizona, for a purchase price of $41.8 million. US Airways owns the remaining 25.4% interest in the building. This nine-story office building is adjacent to our Hayden Ferry Lakeside and Tempe Gateway assets and shares a parking garage with our Tempe Gateway asset. The property is the headquarters for US Airways, which has leased 100% of the building through April 2024. US Airways has a termination option on December 31, 2021 with 12 months' prior written notice. At closing, we issued a $13.9 million first mortgage loan to the US Airways Building Tenancy in Common, which is secured by the US Airways Building. The mortgage loan has a fixed interest rate of 3.0% and matures on December 31, 2016. As of December 31, 2015 and 2014, the balance of the mortgage loan was $13.1 million and $13.4 million, respectively. Because we act as both the lender and the borrower for this mortgage loan, our share of the mortgage loan is not reflected on our consolidated balance sheets. As of December 31, 2015 and 2014, the balance of our mortgage loan receivable was $3.3 million and $3.4 million, respectively.
7000 Central Park
On November 5, 2013, we and our joint venture partner foreclosed and took ownership of 7000 Central Park, a 414,000 square foot office building located in the Central Perimeter of Atlanta, Georgia. We previously acquired a 40% common equity interest in a mortgage note in the original principal amount of $65.0 million secured by the asset. The total purchase price for the note, which was previously under special servicer oversight, was $56.6 million plus an additional $318,000 in transaction costs. Our share of such amount was approximately $45.0 million, comprised of an investment of approximately $37.0 million for a preferred equity interest in the joint venture that acquired the note and an investment of approximately $8.0 million for a 40% common equity interest. On December 13, 2013, we and our joint venture partner placed secured financing on the asset in the amount of $30.0 million, the net proceeds of which were used to repay a portion of our initial preferred equity investment, reducing the preferred equity interest to approximately $7.6 million. On November 6, 2015, we and our joint venture partner sold 7000 Central
6
Park for a gross sale price of $85.3 million. The joint venture recognized a gain on the sale of 7000 Central Park of approximately $30.5 million, and we recognized a gain on the sale of approximately $9.7 million during the year ended December 31, 2015.
Tryon Place, LLC
On December 23, 2015, we entered into a joint venture agreement with a third party investor for the purpose of exploring a development opportunity in Charlotte, North Carolina. Our investment in this joint venture was $1.0 million as of December 31, 2015.
Financing Strategy
Our financing strategy is to maintain a strong and flexible financial position by limiting our debt to a prudent level. We monitor a number of leverage and other financial metrics defined in our senior unsecured revolving credit facility and unsecured term loans, which includes but is not limited to our total debt to total asset value. In addition, we also monitor interest and fixed charge coverage ratios, earnings before interest, taxes, depreciation and amortization ("EBITDA"), and the net debt to adjusted earnings before interest, taxes, depreciation and amortization ("Adjusted EBITDA") multiple. We also monitor other traditional measures of leverage. Management believes all of the leverage and other financial metrics it monitors, including those discussed above, provide useful information on total debt levels as well as our ability to cover interest and principal with current income.
We intend to finance future growth and future maturing debt with the most advantageous source of capital when available, while also maintaining our variable interest rate exposure at a prudent level. Sources of capital may include selling common or preferred equity or debt securities through public offerings or private placements and sales of our assets. We may, in appropriate circumstances, acquire one or more properties in exchange for our equity securities, including units in our operating partnership. We may also finance specific assets with non-recourse mortgage financing. In such cases, we expect to continue seeking primarily fixed rate, non-recourse mortgage financing with maturities from five to ten years typically amortizing over 25 to 30 years on select office building investments.
We have no set policy as to the amount or percentage of our assets that may be invested in any specific property. Rather than a specific policy, we evaluate each property in terms of whether and the extent to which the property meets our investment criteria and strategic objectives. The strategies and policies set forth above were determined and are subject to review by our Board of Directors (the "Board"), which may change such strategies or policies based upon its evaluation of the state of the real estate market, the performance of our assets, capital and credit market conditions, and other relevant factors.
Capital Allocation
Capital allocation receives constant review by management and our Board, which considers many factors including the capital markets, our weighted average cost of capital, buying criteria, the real estate market and management of the risk associated with the rate of return. We examine all aspects of each type of investment, whether it is fee simple, a joint venture or a mortgage loan receivable, including but not limited to the estimated discount to replacement cost, current yield, and the leveraged and unleveraged internal rate of return.
Third-Party Management
We benefit from a fully integrated management infrastructure, provided by certain of our wholly owned subsidiaries (collectively, our "management companies"). As of January 1, 2016, our management companies managed and/or leased properties containing an aggregate of approximately 17.0 million net rentable square feet, of which approximately 14.3 million net rentable square feet related to properties owned fully or partially by us and approximately 2.7 million net rentable square feet related to properties owned by third parties.
Segment Reporting
Our primary business is the ownership and operation of office properties. We account for each office property or groups of related office properties as an individual operating segment. We have aggregated our individual operating segments into a single reporting segment due to the fact that the individual operating segments have similar operating and economic characteristics, such as being leased by the square foot, sharing the same primary operating expenses and ancillary revenue opportunities and being cyclical in economic performance based on current supply and demand conditions. The individual operating segments are also similar in that revenues are derived from the leasing of office space to customers and each office property is managed and operated consistently in accordance with our standard operating procedures. The range and type of customer uses of our properties is similar throughout our portfolio regardless of location or class of building and the needs and priorities of our customers do not vary widely
7
from building to building. Therefore, our management responsibilities do not vary widely from location to location based on the size of the building, geographic location or class.
Regulation/Environmental
We believe that our properties are in compliance in all material respects with all federal, state and local laws, ordinances and regulations regarding the environment or hazardous or toxic substances. We are not aware of any environmental condition that we believe would have a material adverse effect on our capital expenditures, earnings or competitive position (before consideration of any potential insurance coverage). Nevertheless, it is possible that there are material environmental conditions and liabilities of which we are unaware. Moreover, no assurances can be given that (1) future laws, ordinances or regulations or future interpretations of existing requirements will not impose any material environmental liability or (2) the current environmental condition of our properties has not been or will not be affected by customers and occupants of our properties, by the condition of properties in the vicinity of our properties or by third parties.
Insurance
We, or in certain instances, customers at our properties, carry comprehensive commercial general liability, fire, extended coverage, business interruption, rental loss coverage, environmental and umbrella liability coverage on all of our properties. We also carry wind and flood coverage on properties in areas where we believe such coverage is warranted, in each case with limits of liability that we deem adequate. Similarly, we are insured against the risk of direct physical damage in amounts we believe to be adequate to reimburse us, on a replacement cost basis, for costs incurred to repair or rebuild each property, including loss of rental income during the reconstruction period. We believe that our insurance coverage contains policy specifications and insured limits that are customary for similar properties, business activities and markets, and we believe our properties are adequately insured. However, we may be subject to certain types of losses that are generally uninsured losses, including, but not limited to, losses caused by riots, war or acts of God. In the opinion of our management, our properties are adequately insured given the relative risk of loss, the cost of the coverage, and industry practice.
Competition
We compete with a considerable number of other real estate companies, financial institutions, pension funds, private partnerships, individual investors and others when attempting to acquire and lease office space in the markets in which we own properties. Principal factors of competition in our business are the quality of properties (including the design and condition of improvements), leasing terms (including rent and other charges and allowances for tenant improvements), attractiveness and convenience of location, the quality and breadth of customer services provided and reputation as an owner and operator of quality office properties in the relevant market. Our ability to compete also depends on, among other factors, trends in the national and local economies, financial condition and operating results of current and prospective customers, availability and cost of capital, taxes and governmental regulations and legislation.
Available Information
We make available free of charge on the "Investors" page of our web site, www.pky.com, our filed and furnished reports on Form 10-K, 10-Q and 8-K and all amendments thereto, as soon as reasonably practicable after we electronically file such material with, or furnish it to, the Securities and Exchange Commission (the "SEC"). The information on our website is not and should not be considered part of this Annual Report and is not incorporated by reference in this document.
Our Corporate Governance Guidelines, Code of Business Conduct and Ethics and the charters of the Audit Committee, Nominating and Corporate Governance Committee and Compensation Committee of our Board are available on the "Investors" page of our web site. Copies of these documents are also available free of charge in print upon written request addressed to Investor Relations, Parkway Properties, Inc., 390 North Orange Avenue, Suite 2400, Orlando, Florida 32801.
ITEM 1A. Risk Factors.
In addition to the other information contained or incorporated by reference in this document, readers should carefully consider the following risk factors. Any of these risks or the occurrence of any one or more of the uncertainties described below could have a material adverse effect on our financial condition and the performance of our business.
8
Risks Related to Our Properties and Business
We face risks associated with our recent and future property acquisitions.
Since January 1, 2015, we have acquired three wholly owned office properties adding over 879,000 square feet of office space. We intend to continue to pursue the acquisition of properties and portfolios of properties, including large portfolios that could further increase our size and result in further alterations to our capital structure.
Our acquisition activities and their success are subject to the following risks:
• | acquisition agreements contain conditions to closing, which may include completion of due diligence investigations to our satisfaction or other conditions that are not within our control, which may not be satisfied; |
• | we may be unable to finance acquisitions on favorable terms or at all; |
• | acquired properties may fail to perform as expected; |
• | the actual costs of repositioning acquired properties may be higher than our estimates; |
• | we may be unable to obtain adequate insurance coverage for new properties; |
• | acquired properties may be located in new markets where we face risks associated with an incomplete knowledge or understanding of the local market and a limited number of established business relationships in the area; and |
• | we may acquire properties subject to liabilities and without any recourse, or with only limited recourse, to the transferor with respect to unknown liabilities, including liabilities for clean-up of undisclosed environmental contamination or non-compliance with environmental laws. As a result, if a claim were asserted against us based upon ownership of those properties, we might have to pay substantial sums to settle it, which could adversely affect our cash flow. |
Our business and operating results could be negatively affected if we are unable to integrate our recent and future acquisitions successfully.
Integration of acquisitions involves a number of significant risks, including the diversion of management's attention to the assimilation of the operations of the acquired businesses or assets; difficulties in the integration of operations and systems; the inability to realize potential operating synergies; difficulties in the assimilation and retention of the personnel of the acquired companies; accounting, regulatory or compliance issues that could arise, including internal control over financial reporting; and challenges in retaining the customers of the combined businesses. Further, acquisitions may have a material adverse impact on our operating results if unanticipated expenses or charges to earnings were to occur, including unanticipated operating expenses and depreciation and amortization expenses over the useful lives of certain assets acquired, as well as costs related to potential impairment charges, assumed litigation and unknown liabilities. If we are unable to successfully integrate our recent and future acquisitions in a timely and cost-effective manner, our operating results could be negatively affected.
Competition for acquisitions may reduce the number of acquisition opportunities available to us and increase the costs of those acquisitions.
We plan to continue to acquire properties as we are presented with attractive opportunities. We may face competition for acquisition opportunities from other investors and this competition may adversely affect us by subjecting us to the following risks:
• | an inability to acquire a desired property because of competition from other well-capitalized real estate investors, including publicly traded and privately held REITs, private real estate funds, domestic and foreign financial institutions, life insurance companies, sovereign wealth funds, pension trusts, partnerships and individual investors; and |
• | an increase in the purchase price for such acquisition property in the event we are able to acquire such desired property. |
9
We may be unable to develop new properties successfully, which could adversely affect our results of operations due to unexpected costs, delays and other contingencies.
From time to time, we may acquire unimproved real property for development purposes as market conditions warrant. In addition to the risks associated with the ownership of real estate investments in general and investments in joint ventures, there are significant risks associated with our development activities, including the following:
• | delays in obtaining, or an inability to obtain, necessary zoning, land-use, building, occupancy and other required governmental permits and authorizations, which could result in completion delays and increased development costs; |
• | incurring development costs for a property that exceed original estimates due to increased materials, labor or other costs, changes in development plans or unforeseen environmental conditions, which could make completion of the property more costly or uneconomical; |
• | abandoning development projects that we have begun to explore or for which we have started development, and failing to recover expenses and costs incurred through the time of abandonment; |
• | risk of loss of periodic progress payments or advances to builders prior to completion; |
• | termination of leases by customers due to completion delays; |
• | the lease-up of space at our development projects may be slower than expected, resulting in lower than expected occupancy levels; |
• | rental rates achieved for leased space at our development projects may be lower than anticipated; and |
• | other risks related to the lease-up of newly constructed properties. |
In addition, we also rely on rental income and expense projections and estimates of the fair market value of a property upon completion of construction when agreeing upon a purchase price at the time we acquire unimproved real property. If our projections are inaccurate, including due to any of the risks described above, we may pay too much for a property and be unable to charge rents that compensate us for our increased costs which could adversely affect our results of operations.
TPG VI Pantera Holdings, L.P. is a significant stockholder and may have conflicts of interest with us in the future.
As of December 31, 2015, TPG VI Pantera Holdings, L.P. ("TPG Pantera") and TPG VI Management, LLC (“TPG Management"), an affiliate of TPG Pantera (collectively, the "TPG Entities"), owned approximately 21% of our issued and outstanding common stock and limited voting stock together. In addition, so long as TPG Pantera owns at least 10% of our issued and outstanding common stock, TPG Pantera has a pre-emptive right to participate in our future equity issuances, subject to certain conditions. This concentration of ownership in one stockholder could potentially be disadvantageous to other stockholders' interests. In addition, if TPG Pantera were to sell or otherwise transfer all or a large percentage of its holdings, our stock price could decline and we could find it difficult to raise capital, if needed, through the sale of additional equity securities.
The interests of the TPG Entities may differ from the interests of our other stockholders in material respects. For example, the TPG Entities may have an interest in directly or indirectly pursuing acquisitions, divestitures, financings or other transactions that, in their judgment, could enhance their other equity investments, even though such transactions might involve risks to us. The TPG Entities are in the business of making or advising on investments in companies and may from time to time in the future acquire interests in, or provide advice to, businesses that directly or indirectly compete with certain portions of our business. They may also pursue acquisition opportunities that may be complementary to our business, and, as a result, those acquisition opportunities may not be available to us.
Our stockholders agreement with the TPG Entities grants TPG Pantera certain rights that may restrain our ability to take various actions in the future.
In connection with TPG Pantera's May 2012 investment in us, we entered into a stockholders agreement with the TPG Entities, pursuant to which we granted TPG Pantera certain rights that may restrain our ability to take various actions in the future. Under the stockholders agreement, as amended, we have agreed to maintain a ten member Board, and TPG Pantera will have the right to nominate a specified number of directors to the Board and to have a specified number of such directors appointed to each committee of the Board for so long as TPG Pantera's ownership percentage of our common stock is equal to or greater than 5%.
10
TPG Pantera will be entitled to nominate to the Board (1) four directors if TPG Pantera's ownership percentage of our common stock is at least 21% and it continues to own at least 90% of the shares of our common stock that it owned as of the completion of our underwritten public offering in December 2012 (the "2012 offering"), which is approximately 21.2 million shares, (2) three directors if TPG Pantera's ownership percentage is at least 17.5% but less than 21% and it continues to own at least 70% of the shares of our common stock that it owned as of the completion of the 2012 offering, which is approximately 16.5 million shares, (3) two directors if TPG Pantera's ownership percentage is at least 13% but less than 17.5%, and (4) one director if TPG Pantera's ownership percentage is at least 5% but less than 13%. In addition, we have agreed to constitute each of our Board committees as a four member committee and (1) for so long as TPG Pantera's ownership percentage of our common stock is equal to or greater than 20%, TPG Pantera has the right to have two of its nominated directors appointed to each committee of the Board, and (2) for so long as TPG Pantera's ownership percentage is equal to or greater than 5% but less than 20%, TPG Pantera will have the right to have one of its nominated directors appointed to each committee of the Board.
Pursuant to the terms of the stockholders agreement, TPG Pantera also will have the right to consent to certain actions related to our corporate existence and governance, including any change in the rights and responsibilities of either the investment committee of the Board or the compensation committee of the Board, for so long as TPG Pantera's ownership percentage of our common stock is equal to or greater than 20%, other than in connection with any change in control.
In addition, for so long as TPG Pantera's ownership percentage of our common stock is equal to or greater than 5%, other than in connection with any change in control of us, the rights and responsibilities of the investment committee of the Board will include (1) except for certain permitted issuances relating to outstanding rights to purchase or acquire our capital stock, compensation arrangements and acquisition transactions, any sale or issuance of any capital stock or other security, (2) any incurrence of indebtedness with a principal amount greater than $20 million, and (3) any other matters over which the investment committee currently has approval authority, including without limitation material asset acquisitions and dispositions. During such period, the rights and responsibilities of the compensation committee of the Board will include (1) the hiring or termination of any of our Chief Executive Officer, Chief Financial Officer, Chief Operating Officer or Chief Investment Officer, or any material change in any of the duties of any such executive officer, and (2) any approval of future compensation arrangements for such officers. During such period, the Board may not approve such matters without the affirmative approval of the investment committee or the compensation committee, as applicable.
Our performance is subject to risks inherent in owning real estate investments.
We are generally subject to risks incidental to the ownership of real estate. These risks include:
• | changes in supply of or demand for office properties or customers for such properties in areas in which we own buildings; |
• | the ongoing need for capital improvements; |
• | increased operating costs, which may not necessarily be offset by increased rents, including insurance premiums, utilities and real estate taxes, due to inflation and other factors; |
• | changes in tax, real estate and zoning laws; |
• | changes in governmental rules and fiscal policies; |
• | inability of customers to pay rent; |
• | competition from the development of new office space in the markets in which we own property and the quality of competition, such as the attractiveness of our properties as compared to our competitors' properties based on considerations such as convenience of location, rental rates, amenities and safety record; and |
• | civil unrest, acts of war, terrorism, acts of God, including earthquakes, hurricanes and other natural disasters (which may result in uninsured losses) and other factors beyond our control. |
Should any of these events occur, our financial condition and results of operations could be adversely affected.
11
Our business could be adversely affected by security breaches through cyber attacks, cyber intrusions or otherwise.
We face risks associated with security breaches, whether through cyber attacks or cyber intrusions over the internet, malware, computer viruses, attachments to e-mails, persons inside our organization or persons with access to systems inside our organization, and other significant disruptions of our information technology networks and related systems. These risks include operational interruption, private data exposure and damage to our relationship with our customers, among others. Although we make efforts to maintain the security and integrity of our information technology networks and related systems and we have implemented various measures to manage the risk of a security breach or disruption, there can be no assurance that these activities will be effective. A security breach involving our networks and related systems could disrupt our operations in numerous ways that could ultimately have an adverse effect on our financial condition and results of operations.
The conditions of our primary markets affect our operations.
Substantially all of our properties are located in the Southeastern and Southwestern United States and, therefore, our financial condition and ability to make distributions to our stockholders is linked to economic conditions in these markets as well as the market for office space generally in these markets. An economic downturn in these markets, particularly increases in unemployment, may adversely affect our financial condition and results of operations.
Additionally, the geographic concentration of our exposure makes us particularly susceptible to adverse weather conditions that threaten southern and coastal states, such as hurricanes and flooding. Although we anticipate and plan for losses, even a single catastrophe or destructive weather event may have a significant negative effect on our financial condition and results of operations because of the concentration of our properties.
If global market and economic conditions deteriorate, our business, financial condition and results of operations could be adversely affected.
If current economic conditions deteriorate, business layoffs, downsizing, industry slowdowns and other similar factors that affect our customers could negatively impact commercial real estate fundamentals and result in lower occupancy, lower rental rates and declining values in our real estate portfolio. The timing of changes in occupancy levels tends to lag the timing of changes in overall economic activity and employment levels. Additionally, deteriorating economic conditions could have an impact on our lenders or customers, causing them to fail to meet their obligations to us. No assurances can be given that the current economic conditions will continue to improve, and if the economic recovery slows or stalls, our ability to lease our properties and increase or maintain rental rates may be affected, which would have a material adverse effect on our business, financial condition and results of operations.
We face considerable competition in the leasing market and may be unable to renew existing leases or re-let space on terms similar to our existing leases, or we may expend significant capital in our efforts to re-let space, which may adversely affect our financial condition and results of operations.
Each year, we compete with a number of other owners and operators of office properties to renew leases with our existing customers and to attract new customers. To the extent that we are able to renew leases that are scheduled to expire in the short-term or re-let such space to new customers, heightened competition resulting from adverse market conditions may require us to utilize rent concessions and tenant improvements to a greater extent than we historically have. In addition, the economic downturn of the last several years has led to increased competition for credit worthy customers and we may have difficulty competing with competitors who have purchased properties at depressed prices because our competitor's lower cost basis in their properties may allow them to offer space at reduced rental rates.
If our competitors offer space at rental rates below current market rates or below the rental rates we currently charge our customers, we may lose potential customers, and we may be pressured to reduce our rental rates below those we currently charge, or may not be able to increase rates to market rates, in order to retain customers upon expiration of their existing leases. Even if our customers renew their leases or we are able to re-let the space, the terms and other costs of renewal or re-letting, including the cost of required renovations, increased tenant improvement allowances, leasing commissions, declining rental rates, and other potential concessions, may be less favorable than the terms of our current leases and could require significant capital expenditures. If we are unable to renew leases or re-let space in a reasonable time, or if rental rates decline or tenant improvement, leasing commissions, or other costs increase, our financial condition and results of operations could be adversely affected.
12
An oversupply of space in our markets would typically cause rental rates and occupancies to decline, making it more difficult for us to lease space at attractive rental rates, if at all.
Undeveloped land in many of the markets in which we operate is generally more readily available and less expensive than in higher barrier-to-entry markets such as New York, New York; Chicago, Illinois; Boston, Massachusetts; and San Francisco and Los Angeles, California. As a result, even during times of positive economic growth, our competitors could construct new buildings that would compete with our properties. Any such oversupply could result in lower occupancy and rental rates in our portfolio, which would have a negative impact on our results of operations.
Customer defaults could adversely affect our operations.
The majority of our revenues and income come from rental income from real property. As such, our revenues and income could be adversely affected if a significant number of our customers defaulted under their lease obligations. Our ability to manage our assets is also subject to federal bankruptcy laws and state laws that limit creditors' rights and remedies available to real property owners to collect delinquent rents. If a customer becomes insolvent or bankrupt, we cannot be sure that we could recover the premises from the customer promptly or from a trustee or debtor-in-possession in any bankruptcy proceeding relating to that customer. We also cannot be sure that we would receive rent in the proceeding sufficient to cover our expenses with respect to the premises. If a customer becomes bankrupt, the federal bankruptcy code will apply and, in some instances, may restrict the amount and recoverability of our claims against the customer. A customer's default on its obligations to us could adversely affect our financial condition and results of operations.
Our business could be adversely affected by a decline in commodity prices.
The Houston market represents approximately 23.6% of the square footage that we owned or had an interest in as of December 31, 2015. The Houston market is economically dependent on the petroleum industry. A key economic variable that affects the petroleum industry is the price of crude oil, which can be influenced by general economic conditions, industry inventory levels, production quotas imposed by the Organization of Petroleum Exporting Countries, weather-related damage and disruptions, competing fuel prices and geopolitical risk. If the Houston market faces significant exposure to fluctuations in global crude oil prices, particularly for extended periods of time, or oil prices continue to decrease, the Houston market may experience business layoffs, downsizing, consolidations, industry slowdowns and other similar factors. These potential risks to our customers in Houston could negatively impact commercial real estate fundamentals and result in lower occupancy, increased market for sublease space, lower rental rates and declining values in our real estate portfolio in the Houston market.
Some of our leases provide customers with the right to terminate their leases early, which could have an adverse effect on our cash flow and results of operations.
Certain of our leases permit our customers to terminate their leases as to all or a portion of the leased premises prior to their stated lease expiration dates under certain circumstances, such as providing notice by a certain date and, in most cases, paying a termination fee. For example, our customer BMC Software, Inc., which is one of our top 20 customers, terminated a portion of its lease with us effective January 31, 2016 and vacated approximately 270,000 square feet in CityWestPlace. To the extent that our customers exercise early termination rights, our cash flow and earnings will be adversely affected, and we can provide no assurances that we will be able to generate an equivalent amount of net effective rent by leasing the vacated space to new third-party customers.
Leasing office space to smaller and growth-oriented businesses could adversely affect our cash flow and results of operations.
Some of the tenants in our properties are smaller, growth-oriented businesses that may not have the financial strength of larger corporate tenants. Smaller companies generally experience a higher rate of failure than large businesses. Growth-oriented firms may also seek other office space as they develop. Leasing office space to these companies could create a higher risk of tenant defaults, turnover and bankruptcies, which could adversely affect our distributable cash flow and results of operations.
Our expenses may remain constant or increase, even if our revenues decrease, causing our results of operations to be adversely affected.
Costs associated with our business, such as mortgage payments, real estate taxes, insurance premiums, and maintenance costs, are relatively inflexible and generally do not decrease, and may increase, when a property is not fully occupied, rental rates decrease, a customer fails to pay rent or other circumstances cause a reduction in property revenues. As a result, if revenues drop, we may not be able to reduce our expenses accordingly, which would adversely affect our results of operations.
13
Our property taxes could increase due to property tax rate changes or reassessment, which could impact our cash flows.
Even if we qualify as a REIT for U.S. federal income tax purposes, we will be required to pay state and local taxes on our properties. The real property taxes on our properties may increase as property tax rates change or as our properties are assessed or reassessed by taxing authorities. Therefore, the amount of property taxes we pay in the future may increase substantially from what we have paid in the past. If the property taxes we pay increase, our financial condition, results of operations, cash flows, per share trading price of our common stock and our ability to satisfy our principal and interest obligations and to make distributions to our stockholders could be adversely affected.
Illiquidity of real estate may limit our ability to vary our portfolio.
Real estate investments are relatively illiquid. Our ability to vary our portfolio by selling properties and buying new ones in response to changes in economic and other conditions may therefore be limited. In addition, the Code limits our ability to sell our properties by imposing a penalty tax of 100% on the gain derived from prohibited transactions, which are defined as sales of property held primarily for sale to customers in the ordinary course of a trade or business. The frequency of sales and the holding period of the property sold are two primary factors in determining whether the property sold fits within this definition. These considerations may limit our opportunities to sell our properties. If we must sell an investment, we cannot assure you that we will be able to dispose of the investment in the time period we desire or that the sales price of the investment will recoup or exceed our cost for the investment, or that the penalty tax would not be assessed.
We may acquire properties or portfolios of properties through tax deferred contribution transactions, which could result in stockholder dilution and limit our ability to sell such assets.
We have acquired, and we may acquire in the future, properties or portfolios of properties through tax deferred contribution transactions in exchange for partnership interests in our Operating Partnership. These transactions can result in stockholder dilution. This acquisition structure can have the effect of, among other things, reducing the amount of tax depreciation we could deduct over the tax life of the acquired properties, and may require (and in the case of our properties, requires) that we agree to protect the contributors’ ability to defer recognition of taxable gain through restrictions on our ability to dispose of the acquired properties and/or the allocation of partnership debt to the contributors to maintain their tax bases. These restrictions could limit our ability to sell an asset at a time, or on terms, that would be favorable absent such restrictions.
Certain of our properties may represent a significant portion of our revenues and assets.
As of January 1, 2016, one of our properties, CityWestPlace, accounted for approximately 12.5% of our assets on a consolidated basis. No other property accounted for more than 10% of our portfolio's annualized base rent or assets as of January 1, 2016. Our revenue and cash available for distribution to our stockholders would be materially and adversely affected if this property were materially damaged or destroyed. Additionally, our revenue and cash available for distribution to our stockholders would be materially adversely affected if tenants at this property experienced a downturn in their business, which could weaken their financial condition and result in their failure to make timely rental payments, defaulting under their leases or filing for bankruptcy.
Our joint venture investments could be adversely affected by the capital markets, our lack of sole decision-making authority, our reliance on our joint venture partners' financial condition and any disputes that may arise between us and our joint venture partners.
We have in the past co-invested, and may in the future co-invest, with third parties through partnerships, joint ventures or other structures, acquiring noncontrolling interests in, or sharing responsibility for managing the affairs of, a property, partnership, co-tenancy or other entity. Therefore, we may not be in a position to exercise sole decision-making authority regarding the properties owned through joint ventures. In addition, investments in joint ventures may, under certain circumstances, involve risks not present when a third party is not involved, including potential deadlocks in making major decisions, restrictions on our ability to exit the joint venture, reliance on our joint venture partners and the possibility that joint venture partners might become bankrupt or fail to fund their share of required capital contributions, thus exposing us to liabilities in excess of our share of the investment or take action that could jeopardize our REIT status. The funding of our capital contributions may be dependent on proceeds from asset sales, credit facility advances and/or sales of equity securities. Joint venture partners may have business interests or goals that are inconsistent with our business interests or goals and may be in a position to take actions contrary to our policies or objectives. We may in specific circumstances be liable for the actions of our joint venture partners. In addition, any disputes that may arise between us and joint venture partners may result in litigation or arbitration that would increase our expenses.
14
We and our properties are subject to various federal, state and local regulatory requirements, such as environmental laws, state and local fire and safety requirements, building codes and land use regulations.
We, our tenants, and our properties are subject to various federal, state and local regulatory requirements, such as environmental laws, state and local fire and safety requirements, building codes and land use regulations. Failure to comply with these requirements could subject us or our tenants to governmental fines or private litigant damage awards. In addition, compliance with these requirements, including new requirements or stricter interpretation of existing requirements, may require us or our tenants to incur significant expenditures. We do not know whether existing requirements will change or whether future requirements, including any requirements that may emerge from pending or future climate change legislation, will develop. Environmental noncompliance liability also could impact a tenant's ability to make rental payments to us. Furthermore, our reputation could be negatively affected if we violate environmental laws or regulations.
In addition, as a current or former owner or operator of real property, we may be subject to liabilities resulting from the presence of hazardous substances, waste or petroleum products at, on, under or emanating from such property, including investigation and cleanup costs, natural resource damages, third-party liability for cleanup costs. personal injury or property damage, and costs or losses arising from property use restrictions. In particular, some of our properties are adjacent to or near other properties that have contained or currently contain underground storage tanks used to store petroleum products or other hazardous or toxic substances. In addition, certain of our properties are on, adjacent to, or near sites upon which others, including former owners or tenants of our properties, have engaged, or may in the future engage, in activities that have released or may have released petroleum products or other hazardous or toxic substances. Cleanup liabilities are often imposed without regard to whether the owner or operator knew of, or was responsible for, the presence of such contamination, and the liability may be joint and several. The presence of hazardous substances also may result in use restrictions on impacted properties or result in liens on contaminated sites in favor of the government for damages it incurs to address contamination. We also may be liable for the costs of removal or remediation of hazardous substances or waste at disposal or treatment facilities if we arranged for disposal or treatment of hazardous substances at such facilities, whether or not we own such facility. Moreover, buildings and other improvements on our properties may contain asbestos-containing material or could have indoor air quality concerns (e.g., from airborne contaminants such as mold), which may subject us to costs, damages and other liabilities including abatement cleanup, personal injury, and property damage liabilities. The foregoing could adversely affect occupancy and our ability to develop, sell or borrow against any affected property and could require us to make significant unanticipated expenditures that would adversely impact our business, financial condition and results of operations.
We may be adversely affected by laws, regulations or other issues related to climate change.
If we become subject to laws or regulations related to climate change, our business, results of operations and financial condition could be impacted adversely. The federal government has enacted, and some of the states and localities in which we operate may enact certain climate change laws and regulations or have begun regulating carbon footprints and greenhouse gas emissions. Although these laws and regulations have not had any known material adverse effects on our business to date, they could result in substantial compliance costs, retrofit costs and construction costs, including monitoring and reporting costs and capital expenditures for environmental control facilities and other new equipment. Furthermore, our reputation could be negatively affected if we violate climate change laws or regulations. We cannot predict how future laws and regulations, or future interpretations of current laws and regulations, related to climate change will affect our business, results of operations and financial condition. Lastly, the potential physical impacts of climate change on our operations are highly uncertain, and would be particular to the geographic circumstances in areas in which we operate. These may include changes in rainfall and storm patterns and intensities, water shortages, changing sea levels and changing temperatures. These impacts may adversely affect our business, financial condition and results of operations.
Compliance or failure to comply with the Americans with Disabilities Act could result in substantial costs.
Our properties must comply with the Americans with Disabilities Act (the "ADA") and any equivalent state or local laws, to the extent that our properties are public accommodations as defined under such laws. Under the ADA, all public accommodations must meet federal requirements related to access and use by disabled persons. If one or more of our properties is not in compliance with the ADA or any equivalent state or local laws, then we may be required to incur additional costs to bring the property into compliance with the ADA or similar state or local laws. Noncompliance with the ADA could also result in imposition of fines or an award of damages to private litigants. We cannot predict the ultimate amount of the cost of compliance with the ADA or any equivalent state or local laws. If we incur substantial costs to comply with the ADA or any equivalent state or local laws, our business, financial condition and results of operations could be adversely affected.
15
Our third-party management and leasing agreements are subject to the risk of termination and non-renewal.
Our third-party management and leasing agreements are subject to the risk of possible termination under certain circumstances, including our failure to perform as required under these agreements and to the risk of non-renewal by the property owner upon expiration or renewal on terms less favorable to us than the current terms. If management and leasing agreements are terminated, or are not renewed upon expiration, our expected revenues will decrease and our financial condition and results of operations could be adversely affected.
Our third-party property management business may subject us to certain liabilities.
We may hire and supervise third-party contractors to provide construction, engineering and various other services for properties we are managing on behalf of third-party clients. Depending upon (1) the terms of our contracts with third-party clients, which, for example, may place us in the position of a principal rather than an agent, or (2) the responsibilities we assume or are legally deemed to have assumed in the course of a client engagement (whether or not memorialized in a contract), we may be subjected to, or become liable for, claims for construction defects, negligent performance of work or other similar actions by third parties we do not control. Adverse outcomes of property management disputes or litigation could negatively impact our business, financial condition and results of operations, particularly if we have not limited in our contracts the extent of damages to which we may be liable for the consequences of our actions, or if our liabilities exceed the amounts of the commercial third-party insurance that we carry. Moreover, our clients may seek to hold us accountable for the actions of contractors because of our role as property manager even if we have technically disclaimed liability as a legal matter, in which case we may find it commercially prudent to participate in a financial settlement for purposes of preserving the client relationship.
Acting as a principal may also mean that we pay a contractor before we have been reimbursed by the client, which exposes us to additional risks of collection from the client in the event of an intervening bankruptcy or insolvency of the client. The reverse can occur as well, where a contractor that we have paid files bankruptcy or commits fraud with the funds before completing a project for which we have paid it in part or in full. As part of our project management business, we are responsible for managing the various other contractors required for a project, including general contractors, in order to ensure that the cost of a project does not exceed the contract price and that the project is completed on time. In the event that one of the other contractors on the project does not or cannot perform as a result of bankruptcy or for some other reason, we may be responsible for any cost overruns as well as the consequences for late delivery. In the event that for whatever reason we have not accurately estimated our own costs of providing services under warranted or guaranteed cost contracts, we may lose money on such contracts until such time as we can legally terminate them.
We are required to maintain certain licenses to conduct our third-party property management business.
The brokerage of real estate leasing transactions and property management require us to maintain licenses in various jurisdictions in which we operate and to comply with particular regulations. If we fail to maintain our licenses or conduct regulated activities without a license or in contravention of applicable regulations, we may be required to pay fines or return commissions. As a licensed real estate service provider and advisor in various jurisdictions, we may be subject to various due diligence, disclosure, standard-of-care, anti-money laundering and other obligations in the jurisdictions in which we operate. Failure to fulfill these obligations could subject us to litigation from parties who leased properties we brokered or managed. We could become subject to claims by participants in real estate sales or other services claiming that we did not fulfill our obligations as a service provider or broker. This may include claims with respect to conflicts of interest where we are acting, or are perceived to be acting, for two or more clients with potentially contrary interests.
Uninsured and underinsured losses may adversely affect our operations.
We, or in certain instances, customers at our properties, carry comprehensive commercial general liability, fire, extended coverage, business interruption, rental loss coverage, environmental and umbrella liability coverage on all of our properties. We also carry wind and flood coverage on properties in areas where we believe such coverage is warranted, in each case with limits of liability that we deem adequate. Similarly, we are insured against the risk of direct physical damage in amounts we believe to be adequate to reimburse us, on a replacement cost basis, for costs incurred to repair or rebuild each property, including loss of rental income during the reconstruction period. We believe that our insurance coverage contains policy specifications and insured limits that are customary for similar properties, business activities and markets, and we believe our properties are adequately insured. However, we may be subject to certain types of losses that are generally uninsured losses, including, but not limited to losses caused by riots, war or acts of God. In the event of substantial property loss, the insurance coverage may not be sufficient to pay the full current market value or current replacement cost of the property. In the event of an uninsured loss, we could lose some or all of our capital investment, cash flow and anticipated profits related to one or more properties. Inflation, changes in building codes and ordinances, environmental considerations and other factors also might make it not feasible to use insurance
16
proceeds to replace a property after it has been damaged or destroyed. Under such circumstances, the insurance proceeds we receive might not be adequate to restore our economic position with respect to such property.
We may be subject to litigation, which could have a material adverse effect on our financial condition.
We may be subject to litigation, including claims relating to our assets and operations that are otherwise in the ordinary course of business. Some of these claims may result in significant defense costs and potentially significant judgments against us, some of which we may not be insured against. We generally intend to vigorously defend ourselves against such claims. However, we cannot be certain of the ultimate outcomes of claims that may be asserted. Resolution of these types of matters against us may result in our having to pay significant fines, judgments, or settlements, which, if uninsured, or if the fines, judgments and settlements exceed insured levels, would adversely impact our earnings and cash flows, thereby impacting our ability to service debt and make quarterly distributions to our stockholders. Certain litigation or the resolution of certain litigation may affect the availability or cost of some of our insurance coverage, which could adversely impact our financial condition and results of operations, expose us to increased risks that would be uninsured, and/or adversely impact our ability to attract officers and directors.
If we are unable to satisfy the regulatory requirements of the Sarbanes-Oxley Act of 2002, or if our disclosure controls or internal control over financial reporting is not effective, investors could lose confidence in our reported financial information, which could adversely affect the perception of our business and the trading price of our common stock.
The design and effectiveness of our disclosure controls and procedures and internal control over financial reporting may not prevent all errors, misstatements or misrepresentations. Although management will continue to review the effectiveness of our disclosure controls and procedures and internal control over financial reporting, there can be no guarantee that our internal control over financial reporting will be effective in accomplishing all control objectives all of the time. Deficiencies, including any material weakness, in our internal control over financial reporting which may occur in the future could result in misstatements of our results of operations, restatements of our financial statements, a decline in the trading price of our common stock, or otherwise materially adversely affect our business, reputation, results of operations, financial condition, or liquidity.
We depend on key personnel, each of whom would be difficult to replace.
Our continued success depends to a significant degree upon the continued contributions of certain key personnel including, but not limited to, James R. Heistand, our President and Chief Executive Officer, who would be difficult to replace. Although we entered into an employment agreement with Mr. Heistand in July 2013 that provides for a three-year term, we cannot provide any assurance that he will remain employed by us. Our ability to retain Mr. Heistand, or to attract a suitable replacement should he leave, is dependent on the competitive nature of the employment market. The loss of services of Mr. Heistand could adversely affect our results of operations and slow our future growth.
We have a significant amount of indebtedness and may need to incur more in the future.
As of December 31, 2015, we had approximately $1.8 billion of total outstanding indebtedness. In addition, in connection with executing our business strategies going forward, we expect to continue to evaluate the possibility of acquiring additional properties and making strategic investments, and we may elect to finance these endeavors by incurring additional indebtedness. The amount of such indebtedness could have material adverse consequences for us, including:
• | hindering our ability to adjust to changing market, industry or economic conditions; |
• | limiting our ability to access the capital markets to raise additional equity or refinance maturing debt on favorable terms or to fund acquisitions or emerging businesses; |
• | limiting the amount of free cash flow available for future operations, acquisitions, dividends, stock repurchases or other uses; |
• | making us more vulnerable to economic or industry downturns, including interest rate increases; and |
• | placing us at a competitive disadvantage compared to less leveraged competitors. |
17
Moreover, to respond to competitive challenges, we may be required to raise substantial additional capital to execute our business strategy. Our ability to arrange additional financing will depend on, among other factors, our financial position and performance, as well as prevailing market conditions and other factors beyond our control. If we are able to obtain additional financing, our credit ratings could be further adversely affected, which could further raise our borrowing costs and further limit our future access to capital and our ability to satisfy our obligations under our indebtedness.
We have existing debt and refinancing risks that could affect our cost of operations.
We currently have both fixed and variable rate indebtedness and may incur additional indebtedness in the future, including borrowings under our credit facilities, to finance possible acquisitions and for general corporate purposes. As a result, we are, and expect to be, subject to the risks normally associated with debt financing including:
• | that interest rates may rise; |
• | that our cash flow will be insufficient to make required payments of principal and interest; |
• | that we will be unable to refinance some or all of our debt; |
• | that any refinancing will not be on terms as favorable as those of our existing debt; |
• | that required payments on mortgages and on our other debt are not reduced if the economic performance of any property declines; |
• | that debt service obligations will reduce funds available for distribution to our stockholders; |
• | that any default on our debt, due to noncompliance with financial covenants or otherwise, could result in acceleration of those obligations; |
• | that we may be unable to refinance or repay the debt as it becomes due; and |
• | that if our degree of leverage is viewed unfavorably by lenders or potential joint venture partners, it could affect our ability to obtain additional financing. |
We may not be able to refinance or repay debt as it becomes due which may force us to refinance or to incur additional indebtedness at higher rates and additional cost or, in the extreme case, to sell assets or seek protection from our creditors under applicable law.
A lack of any limitation on our debt could result in our becoming more highly leveraged.
Our governing documents do not limit the amount of indebtedness we may incur. Accordingly, our Board may incur additional debt and would do so, for example, if it were necessary to maintain our status as a REIT. We might become more highly leveraged as a result, and our financial condition, results of operations and cash available for distribution to stockholders might be negatively affected, and the risk of default on our indebtedness could increase.
The cost and terms of mortgage financings may render the sale or financing of a property difficult or unattractive.
The sale of a property subject to a mortgage loan may trigger pre-payment penalties, yield maintenance payments or make-whole payments to the lender, which would reduce the amount of gain or increase our loss on the sale of a property and could make the sale of a property less likely. Certain of our mortgage loans will have significant outstanding principal balances on their maturity dates, commonly known as "balloon payments." There is no assurance that we will be able to refinance such balloon payments upon the maturity of the loans, which may force disposition of properties on disadvantageous terms or require replacement with debt with higher interest rates, either of which would have an adverse impact on our financial condition and results of operations. Additionally, at the time a loan matures, the property may be worth less than the loan amount and, as a result, we may determine not to refinance the loan and permit foreclosure, generating a loss.
18
Financial covenants could adversely affect our ability to conduct our business.
Our senior unsecured revolving credit facility and unsecured term loans contain restrictions on the amount of debt we may incur and other restrictions and requirements on our operations. These restrictions, as well as any additional restrictions to which we may become subject to in connection with additional financings or refinancings, could restrict our ability to pursue business initiatives, effect certain transactions or make other changes to our business that may otherwise be beneficial to us, which could adversely affect our results of operations. In addition, violations of these covenants could cause declaration of defaults under, and acceleration of, any related indebtedness, which would result in adverse consequences to our financial condition. Our senior unsecured revolving credit facility and unsecured term loans also contain cross-default provisions that give the lenders the right to declare a default if we are in default under other loans in excess of certain amounts. In the event of a default, we may be required to repay such debt with capital from other sources, which may not be available to us on attractive terms, or at all, which would have a material adverse effect on our business, financial condition and results of operations.
Mortgage debt obligations expose us to the possibility of foreclosure, which could result in the loss of our investment in a property or group of properties subject to mortgage debt.
Incurring mortgage and other secured debt obligations increases our risk of property losses because defaults on indebtedness secured by properties may result in foreclosure actions initiated by lenders and ultimately our loss of the property securing any loans for which we are in default. Any foreclosure on a mortgaged property or group of properties could adversely affect the overall value of our portfolio of properties (or portions thereof). For tax purposes, a foreclosure of any of our properties that is subject to a nonrecourse mortgage loan generally would be treated as a sale of the property for a purchase price equal to the outstanding balance of the debt secured by the mortgage. If the outstanding balance of the debt secured by the mortgage exceeds our tax basis in the property, we would recognize taxable income on foreclosure, but would not receive any cash proceeds, which could hinder our ability to satisfy the distribution requirements applicable to REITs under the Code. Foreclosures could also trigger our tax indemnification obligations under the terms of our agreements with certain continuing investors with respect to sales of certain properties.
Failure to hedge effectively against interest rate changes may adversely affect results of operations.
The interest rate hedge instruments we use to manage some of our exposure to interest rate volatility involve risk, such as the risk that counterparties may fail to honor their obligations under these arrangements. Failure to hedge effectively against interest rate changes may adversely affect our results of operations.
We depend on external sources of capital that are outside of our control, which may affect our ability to pursue strategic opportunities, refinance or repay our indebtedness and make distributions to our stockholders.
In order to qualify as a REIT, we generally must distribute annually at least 90% of our "REIT taxable income," subject to certain adjustments and excluding any net capital gain. Because of this distribution requirement, it is not likely that we will be able to fund all future capital needs from income from operations. As a result, when we engage in the development or acquisition of new properties or expansion or redevelopment of existing properties, we will continue to rely on third-party sources of capital, including lines of credit, collateralized or unsecured debt (both construction financing and permanent debt) and equity issuances. Our access to third-party sources of capital depends on a number of factors, including general market conditions, the market's view of the quality of our assets, the market's perception of our growth potential, our current debt levels and our current and expected future earnings. There can be no assurance that we will be able to obtain the financing necessary to fund our current or new developments or project expansions or our acquisition activities on terms favorable to us or at all. If we are unable to obtain a sufficient level of third-party financing to fund our capital needs, our results of operations, financial condition and ability to make distributions to our stockholders may be adversely affected.
We may amend our investment strategy and business policies without your approval.
Our Board may change our investment strategy or any of our guidelines, financing strategy or leverage policies with respect to investments, acquisitions, growth, operations, indebtedness, capitalization and distributions at any time without the consent of our stockholders, which could result in an investment portfolio with a different risk profile. A change in our strategy may increase our exposure to interest rate risk, default risk and real estate market fluctuations. These changes could adversely affect our financial condition, results of operations, the market price of our common stock and our ability to make distributions to our stockholders.
19
Our ability to use our net operating loss carryforwards is limited.
As of December 31, 2015, we had net operating losses ("NOLs") of approximately $166.4 million for U.S. federal income tax purposes (not including NOLs acquired from our merger transactions with Thomas Properties Group, Inc. ("TPGI") in December 2013 (such transactions, the "Mergers")). These NOLs are subject to varying expirations between 2018 and 2032. In 2012, we underwent an ownership change for purposes of Section 382 of the Code. An ownership change is, as a general matter, triggered by sales or acquisitions of our stock in excess of 50% on a cumulative basis during a three-year period by persons owning five percent or more of our total equity value. As a result of this ownership change, and subject to certain exceptions, our NOLs in existence at that time are subject to a gross annual limitation of $15.4 million. As of the year ended December 31, 2015, we generally may utilize approximately $47.0 million of our NOLs carryforwards derived prior to the ownership change to reduce our "REIT taxable income" (and therefore our distribution requirement) for a given taxable year. In addition, if we experience an additional ownership change during any subsequent three-year period, our future ability to utilize our NOLs may become further limited. In addition, our ability to use NOLs of TPGI, totaling $85.8 million, to which we succeeded as a result of the merger of TPGI with and into Parkway Properties, Inc. on December 19, 2013 (the "Parent Merger") is limited.
The Parent Merger carried certain tax risks.
Because TPGI was taxable as a regular C corporation and we acquired its appreciated assets in a transaction in which the adjusted tax basis of the assets in our hands was determined by reference to the adjusted tax basis of the assets in the hands of TPGI prior to the Parent Merger, we will be subject to corporate income tax on the "built-in gain" (totaling approximately $66.7 million or $36.7 million net of NOLs deduction) that existed with respect to TPGI’s assets at the time of the Parent Merger to the extent that we dispose of those assets in a taxable transaction within ten years following the Parent Merger (which occurred on December 19, 2013).
Furthermore, in order to qualify as a REIT, we must not have, at the end of any taxable year, any earnings and profits accumulated in a non-REIT year. In connection with the Parent Merger, we succeeded to any earnings and profits accumulated by TPGI for taxable periods preceding the Parent Merger. In connection with the closing of the Mergers, however, we received a report, prepared by TPGI’s accountants, to the effect that TPGI did not have any earnings and profits accumulated in a non-REIT year to which we would succeed as a result of the Parent Merger. If we are (or were) treated as having, as a result of the Parent Merger, any earnings and profits accumulated in any non-REIT year, in order to maintain our qualification as a REIT, we may have to pay a special dividend and/or employ applicable deficiency dividend procedures to eliminate such earnings and profits. If we were to need to make a special dividend or pay a deficiency dividend and do not otherwise have cash on hand to do so, we may need to (1) sell assets in adverse market conditions, (2) borrow on unfavorable terms, (3) distribute amounts otherwise intended to be used for other purposes, or (4) make a taxable distribution of common stock, which could increase our costs or reduce our equity. In addition, we may be required to pay interest based on the amount of any such deficiency dividends.
Risks Related to Our Status as a REIT
Loss of our tax status as a REIT would have significant adverse consequences to us and the value of our securities.
We believe that we qualify for taxation as a REIT for U.S. federal income tax purposes, and we plan to operate so that we can continue to meet the requirements for taxation as a REIT. To qualify as a REIT we must satisfy numerous requirements (some on an annual and quarterly basis) established under the highly technical and complex provisions of the Code applicable to REITs, which include:
• | maintaining ownership of specified minimum levels of real estate related assets; |
• | generating specified minimum levels of real estate related income; |
• | maintaining certain diversity of ownership requirements with respect to our shares; and |
• | distributing at least 90% of our "REIT taxable income," subject to certain adjustments and excluding any net capital gain on an annual basis. |
The distribution requirement noted above could adversely affect our ability to use earnings for improvements or acquisitions because funds distributed to stockholders will not be available for capital improvements to existing properties or for acquiring additional properties.
20
Only limited judicial and administrative interpretations exist of the REIT rules. In addition, qualification as a REIT involves the determination of various factual matters and circumstances not entirely within our control.
If we fail to qualify as a REIT, we will be subject to U.S. federal income tax (including any applicable alternative minimum tax) on our taxable income at regular corporate rates without any deduction for dividends paid. In addition, unless entitled to relief under certain statutory provisions, we will be disqualified from treatment as a REIT for the four taxable years following the year during which we failed to qualify. This treatment would reduce net earnings available for investment or distribution to stockholders because of the additional tax liability for the year or years involved. In addition, we would no longer be required to make distributions to our stockholders. To the extent that distributions to stockholders had been made based on our qualifying as a REIT, we might be required to borrow funds or to liquidate certain of our investments to pay the applicable tax. As a REIT, we have been and will continue to be subject to certain U.S. federal, state and local taxes on our income and property.
If our Operating Partnership failed to qualify as a partnership for U.S. federal income tax purposes, we would cease to qualify as a REIT and suffer other adverse consequences.
We believe that our Operating Partnership is properly treated as a partnership for U.S. federal income tax purposes. As a partnership, our Operating Partnership is not subject to U.S. federal income tax on its income. Instead, each of its partners, including us, is allocated, and may be required to pay tax with respect to, its share of our Operating Partnership's income. We cannot assure you, however, that the Internal Revenue Service (the “IRS") will not challenge the status of our Operating Partnership or any other subsidiary partnerships in which we own an interest as a partnership for U.S. federal income tax purposes, or that a court would not sustain such a challenge. If the IRS were successful in treating our Operating Partnership or certain of our other subsidiary partnerships as an entity taxable as a corporation for U.S. federal income tax purposes, we would fail to meet the gross income tests and certain of the asset tests applicable to REITs and, accordingly, we would likely cease to qualify as a REIT. Also, the failure of our Operating Partnership or any subsidiary partnerships to qualify as a partnership would cause it to become subject to federal and state corporate income tax, which could reduce significantly the amount of cash available for debt service and for distribution to its partners, including us.
REIT distribution requirements could adversely affect our ability to execute our business plan or cause us to finance our needs during unfavorable market conditions.
In order to qualify as a REIT, we generally must distribute annually at least 90% of our REIT taxable income, subject to certain adjustments and excluding any net capital gain, in order for U.S. federal corporate income tax not to apply to earnings that we distribute. To the extent that we satisfy this distribution requirement but distribute less than 100% of our taxable income, we will be subject to U.S. federal corporate income tax on our undistributed taxable income. In addition, we will be subject to a 4% nondeductible excise tax if the actual amount that we pay out to our stockholders in a calendar year is less than a minimum amount specified under U.S. federal tax laws. We intend to make distributions to our stockholders to comply with the REIT requirements of the Code.
From time to time, we may generate taxable income greater than our income for financial reporting purposes prepared in accordance with generally accepted accounting principles ("GAAP"). This may occur, for instance, because of differences in timing between the recognition of taxable income and the actual receipt of cash or the effects of non-deductible capital expenditures, or the creation of reserve required debt or amortization payments. As a result, we may find it difficult or impossible to meet distribution requirements in certain circumstances. The requirement to distribute a substantial portion of our taxable income could cause us to (1) sell assets in adverse market conditions, (2) borrow on unfavorable terms, (3) distribute amounts that would otherwise be invested in future acquisitions, capital expenditures or repayment of debt or (4) make a taxable distribution of our common stock as part of a distribution in which stockholders may elect to receive our common stock or (subject to a limit measured as a percentage of the total distribution) cash, in order to comply with REIT requirements. These alternatives could increase our costs or reduce our equity. Thus, compliance with the REIT requirements may hinder our ability to grow, which could adversely affect our business, financial condition and results of operations.
Even if we qualify as a REIT, we may face other tax liabilities that reduce our cash flow.
Even if we qualify for taxation as a REIT, we may be subject to certain U.S. federal, state and local taxes on our income, property or net worth, including taxes on any undistributed income, tax on income from some activities conducted as a result of a foreclosure, and state or local income, property and transfer taxes. In addition, we could, in certain circumstances, be required to pay an excise or penalty tax (which could be significant in amount) in order to utilize one or more relief provisions under the Code to maintain our qualification as a REIT. Any of these taxes would decrease cash available for the payment of our debt obligations and distributions to stockholders. Our taxable REIT subsidiaries (each a "TRS") generally will be subject to U.S. federal corporate income tax on their net taxable income.
21
We face possible state and local tax audits.
Because we are organized and qualify as a REIT, we are generally not subject to federal income taxes, but we are subject to certain state and local taxes. In the normal course of business, certain entities through which we own real estate have undergone tax audits. Collectively, tax deficiency notices received to date from the jurisdictions conducting previous audits have not been material. However, there can be no assurance that future audits will not occur with increased frequency or that the ultimate result of such audits will not have a material adverse effect on our results of operations.
Complying with REIT requirements may limit our ability to hedge effectively and may cause us to incur tax liabilities.
The REIT provisions of the Code may limit our ability to hedge our assets and operations. Under these provisions, income that we generate from transactions intended to hedge our interest rate and certain types of foreign currency risk generally will be excluded from gross income for purposes of the 75% and 95% gross income tests applicable to REITs if the instrument hedges interest rate or foreign currency risk on liabilities used to carry or acquire real estate assets or certain other types of foreign currency risk, and such instrument is properly identified. Income from hedging transactions that do not meet these requirements will generally constitute non-qualifying income for purposes of both the REIT 75% and 95% gross income tests. As a result of these rules, we may have to limit our use of hedging techniques that might otherwise be advantageous or implement those hedges through a TRS. This could increase the cost of our hedging activities because our TRS would be subject to tax on gains or expose us to greater risks associated with changes in interest rates than we would otherwise want to bear. In addition, losses in our TRS will generally not provide any tax benefit, except for being carried forward against future taxable income in the TRS.
Complying with REIT requirements may force us to forgo and/or liquidate otherwise attractive investment opportunities.
To qualify as a REIT, we must ensure that we meet the REIT gross income tests annually and that at the end of each calendar quarter, at least 75% of the value of our assets consists of cash, cash items, government securities and qualified real estate assets. The remainder of our investment in securities (other than government securities and qualified real estate assets) generally cannot include more than 10% of the outstanding voting securities of any one issuer or more than 10% of the total value of the outstanding securities of any one issuer. In addition, in general, no more than 5% of the value of our assets (other than government securities and qualified real estate assets) can consist of the securities of any one issuer, and no more than 25% (20% for tax years beginning after December 31, 2017) of the value of our total assets can be represented by stock or securities of one or more TRSs. Effective for taxable years beginning after December 31, 2015, debt instruments issued by publicly offered REITs, to the extent not secured by real property or interests in real property, qualify for the 75% asset test, but the value of such debt instruments cannot exceed 25% of the value of our total assets. If we fail to comply with these requirements at the end of any calendar quarter, we must correct the failure within 30 days after the end of the calendar quarter or qualify for certain statutory relief provisions to avoid losing our REIT qualification and suffering adverse tax consequences. As a result, we may be required to liquidate from our portfolio or contribute to a TRS otherwise attractive investments in order to maintain our qualification as a REIT. These actions could have the effect of reducing our income and amounts available for distribution to our stockholders. In addition, we may be unable to pursue investments that would otherwise be advantageous to us in order to satisfy the source of income or asset diversification requirements for qualifying as a REIT. Thus, compliance with the REIT requirements may hinder our ability to make, and, in certain cases, maintain ownership of, certain attractive investments.
The requirements necessary to maintain our REIT status limit our ability to earn fee income at the REIT level, which causes us to conduct fee-generating activities through a TRS.
The REIT provisions of the Code limit our ability to earn additional management fee and other fee income from joint ventures and third parties. Our aggregate gross income from fees and certain other non-qualifying sources cannot exceed 5% of our annual gross income. As a result, our ability to increase the amount of fee income we earn at the REIT level is limited and, therefore, we conduct fee-generating activities through a TRS. Any fee income we earn through a TRS is subject to U.S. federal, state and local income tax at regular corporate rates, which reduces our cash available for distribution to stockholders.
Our ability to own stock and securities of TRSs is limited and our transactions with our TRSs will cause us to be subject to a 100% penalty tax on certain income or deductions if those transactions are not conducted on arm's length terms.
A REIT may own up to 100% of the stock of one or more TRSs. A TRS may hold assets and earn income that would not be qualifying assets or income if held or earned directly by a REIT. Both the subsidiary and the REIT must jointly elect to treat the subsidiary as a TRS. A corporation of which a TRS directly or indirectly owns more than 35% of the voting power or value of the stock will automatically be treated as a TRS. Overall, no more than 25% (20% for tax years beginning after December 31, 2017) of the value of a REIT's assets may consist of stock or securities of one or more TRSs. In addition, the rules applicable to TRSs limit the deductibility of interest paid or accrued by a TRS to its parent REIT to assure that the TRS is subject to an appropriate
22
level of corporate taxation. The rules also impose a 100% excise tax on certain transactions involving a TRS that are not conducted on an arm's length basis.
Our TRS will pay U.S. federal, state and local income tax on its taxable income. The after-tax net income of our TRSs will be available for distribution to us but generally is not required to be distributed. We anticipate that the aggregate value of the stock and securities of our TRS will be less than 25% (20% for tax years beginning after December 31, 2017) of the value of our total assets (including the stock and securities of our TRS). Furthermore, we will monitor the value of our respective investments in our TRS for the purpose of ensuring compliance with the ownership limitations applicable to TRSs. We will scrutinize all of our transactions involving our TRS to ensure that they are entered into on arm's length terms to avoid incurring the 100% excise tax described above. There can be no assurance, however, that we will be able to comply with the 25%/20% limitation discussed above or avoid application of the 100% excise tax discussed above.
Dividends payable by REITs do not qualify for the reduced tax rates available for some dividends.
The maximum tax rate applicable to income from "qualified dividends" payable to U.S. stockholders that are individuals, trusts and estates is 20%. Dividends payable by REITs, however, generally are not eligible for the reduced rates and will continue to be subject to tax at rates applicable to ordinary income. Although this does not adversely affect the taxation of REITs or dividends payable by REITs, the more favorable rates applicable to regular corporate qualified dividends could cause investors who are individuals, trusts and estates to perceive investments in REITs to be relatively less attractive than investments in the shares of non-REIT corporations that pay dividends, which could adversely affect the value of the stock of REITs, including our stock.
The tax imposed on REITs engaging in "prohibited transactions" may limit our ability to engage in transactions that would be treated as sales for U.S. federal income tax purposes.
A REIT's net income from prohibited transactions is subject to a 100% penalty tax. In general, prohibited transactions are sales or other dispositions of property, other than foreclosure property, held primarily for sale to customers in the ordinary course of business. Although we do not intend to hold any properties that would be characterized as held for sale to customers in the ordinary course of our business, unless a sale or disposition qualifies under certain statutory safe harbors, such characterization is a factual determination and no guarantee can be given that the IRS would agree with our characterization of our properties or that we will be able to make use of the otherwise available safe harbors.
The ability of our Board to revoke our REIT election without stockholder approval may cause adverse consequences to our stockholders.
Our charter provides that our Board may revoke or otherwise terminate our REIT election, without the approval of our stockholders, if our Board determines that it is no longer in our best interest to continue to qualify as a REIT. If we cease to qualify as a REIT, we would become subject to U.S. federal income tax on our net taxable income and we generally would no longer be required to distribute any of our net taxable income to our stockholders, which may have adverse consequences on our total return to our stockholders.
There is a risk of changes in the tax law applicable to REITs.
The Internal Revenue Service, the United States Treasury Department and Congress frequently review U.S. federal income tax legislation, regulations and other guidance. For example, in December 2015, the Protecting Americans from Tax Hikes Act of 2015 was passed by Congress and signed by the President. Among other provisions, this legislation contained changes to tax law impacting REIT restrictions and requirements, including modifying one of the REIT income tests and the REIT asset tests to permit investments in debt instruments issued by “publicly offering REITs” to be treated as qualified real estate assets; modifying the calculation methodology related to prohibited transactions; modifying treatment of ancillary personal property leased with real property to be treated as real property for one of the REIT asset tests and, effective for tax years beginning after December 31, 2017, reducing the percentage of gross assets a REIT can hold as securities of a TRS. We cannot predict whether, when or to what extent new U.S. federal tax laws, regulations, interpretations or rulings will be adopted. Any legislative action may prospectively or retroactively modify our tax treatment and, therefore, may adversely affect taxation of us and/or our investors.
23
Risks Associated with Our Stock
Limitations on the ownership of our common stock may preclude the acquisition or change of control of our Company.
Certain provisions contained in our charter and bylaws and certain provisions of Maryland law may have the effect of discouraging a third party from making an acquisition proposal for us and may thereby inhibit a change of control. Provisions of our charter are designed to assist us in maintaining our qualification as a REIT under the Code by preventing concentrated ownership of our capital stock that might jeopardize REIT qualification. Among other things, these provisions provide that, if a transfer of our stock or a change in our capital structure would result in (1) any person (as defined in the charter) directly or indirectly acquiring beneficial or constructive ownership of more than 9.8% (in value or in number, whichever is more restrictive) of our outstanding equity stock excluding Excess Stock (as defined below), (2) our outstanding shares being owned by fewer than 100 persons, or (3) our being "closely held" within the meaning of Section 856(h) of the Code, then:
• | any proposed transfer will be void from the beginning and we will not recognize such transfer; |
• | we may institute legal proceedings to enjoin such transfer; |
• | we will have the right to redeem the shares proposed to be transferred; and/or |
• | the shares proposed to be transferred will be automatically converted into and exchanged for shares of a separate class of stock (the "Excess Stock"). |
Excess Stock has no dividend or voting rights but holders of Excess Stock do have certain rights in the event of our liquidation, dissolution or winding up. Our charter provides that we will hold the Excess Stock as trustee for the person or persons to whom the shares are ultimately transferred, until the time that the shares are retransferred to a person or persons in whose hands the shares would not be Excess Stock and certain price-related restrictions are satisfied. These provisions may have an anti-takeover effect by discouraging tender offers or purchases of large blocks of stock, thereby limiting the opportunity for stockholders to receive a premium for their shares over then-prevailing market prices. Under the terms of our charter, our Board has the authority to waive these ownership restrictions.
Furthermore, under our charter, our Board has the authority to classify and reclassify any of our unissued shares of capital stock into shares of capital stock with such preferences, rights, powers and restrictions as the Board may determine. The authorization and issuance of a new class of capital stock could have the effect of delaying or preventing someone from taking control of us, even if a change in control were in our stockholders' best interests.
Maryland business statutes may limit the ability of a third party to acquire control of us.
Maryland law provides protection for Maryland corporations against unsolicited takeovers by limiting, among other things, the duties of the directors in unsolicited takeover situations. The duties of directors of Maryland corporations do not require them to (a) accept, recommend or respond to any proposal by a person seeking to acquire control of the corporation, (b) authorize the corporation to redeem any rights under, or modify or render inapplicable, any stockholder rights plan, (c) make a determination under the Maryland Business Combination Act, or (d) act or fail to act solely because of the effect of the act or failure to act may have on an acquisition or potential acquisition of control of the corporation or the amount or type of consideration that may be offered or paid to the stockholders in an acquisition. Moreover, under Maryland law the act of a director of a Maryland corporation relating to or affecting an acquisition or potential acquisition of control is not subject to any higher duty or greater scrutiny than is applied to any other act of a director. Maryland law also contains a statutory presumption that an act of a director of a Maryland corporation satisfies the applicable standards of conduct for directors under Maryland law.
The Maryland Business Combination Act provides that unless exempted, a Maryland corporation may not engage in business combinations, including mergers, dispositions of ten percent or more of its assets, certain issuances of shares of stock and other specified transactions, with an "interested stockholder" or an affiliate of an interested stockholder for five years after the most recent date on which the interested stockholder became an interested stockholder, and thereafter unless specified criteria are met. An interested stockholder is generally a person owning or controlling, directly or indirectly, ten percent or more of the voting power of the outstanding stock of the Maryland corporation.
24
Market interest rates may have an effect on the value of our common stock.
One of the factors that will influence the price of our common stock will be the dividend yield on our common stock (the dividend per share as a percentage of the price of our common stock) relative to market interest rates. An increase in market interest rates, which are currently at low levels relative to historical rates, may lead prospective purchasers of our common stock to expect a higher dividend yield, and higher interest rates would likely increase our borrowing costs and potentially decrease funds available for distribution. Thus, higher market interest rates could cause the market price of our common stock to decrease.
The number of shares of our common stock available for future issuance or sale could adversely affect the per share trading price of our common stock and may be dilutive to current stockholders.
Our charter authorizes our Board to, among other things, issue additional shares of capital stock without stockholder approval. We cannot predict whether future issuances or sales of shares of our common stock or the availability of shares for resale in the open market will decrease the per share trading price per share of our common stock. The issuance of substantial numbers of shares of our common stock in the public market, or upon exchange of common units of limited partnership interests in our Operating Partnership, or the perception that such issuances might occur, could adversely affect the per share trading price of our common stock. In addition, any such issuance could dilute our existing stockholders' interests in our company. The per share trading price of our common stock may decline significantly upon the sale of shares of our common stock pursuant to registration rights granted to the TPG Entities in connection with TPG Pantera's investment in us in May 2012. In particular, we have entered into a stockholders agreement with the TPG Entities pursuant to which the TPG Entities may at any time (1) make up to three demands for registration and (2) include the common stock they hold in any registration statement we file on account of any of our other security holders. The shares of common stock that may be registered on behalf of the TPG Entities, as described above, represent approximately 21% of our issued and outstanding common stock and of our issued and outstanding common stock and limited voting stock as of December 31, 2015. As a result, a substantial number of shares may be sold pursuant to the registration rights granted to the TPG Entities. The sale of such shares by the TPG Entities, or the perception that such a sale may occur, could materially and adversely affect the per share trading price of our common stock and could dilute our existing stockholders' interests in our company.
The exchange of common units for common stock, the issuance of our common stock or common units in connection with future property, portfolio or business acquisitions and other issuances of our common stock could have an adverse effect on the per share trading price of our common stock. In addition, we may issue shares of our common stock or grant options, deferred incentive share units, restricted shares or other equity-based awards exercisable for or convertible or exchangeable into shares of our common stock under the Parkway Properties, Inc. and Parkway Properties LP 2015 Omnibus Equity Incentive Plan. Future issuances of shares of our common stock may be dilutive to existing stockholders.
Future offerings of debt securities, which would be senior to our common stock upon liquidation, or preferred equity securities which may be senior to our common stock for purposes of dividend distributions or upon liquidation, may adversely affect the per share trading price of our common stock.
In the future, we may attempt to increase our capital resources by making additional offerings of debt or equity securities (or causing our Operating Partnership to issue such debt securities), including medium-term notes, senior or subordinated notes and additional classes or series of preferred stock. Upon liquidation, holders of our debt securities and shares of preferred stock or preferred units of partnership interest in our Operating Partnership and lenders with respect to other borrowings will be entitled to receive our available assets prior to distribution to the holders of our common stock. Additionally, any convertible or exchangeable securities that we issue in the future may have rights, preferences and privileges more favorable than those of our common stock and may result in dilution to owners of our common stock. Other than the TPG Entities, holders of our common stock are not entitled to preemptive rights or other protections against dilution. Any shares of preferred stock or preferred units that we issue in the future could have a preference on liquidating distributions or a preference on dividend payments that could limit our ability to pay dividends to the holders of our common stock. Because our decision to issue securities in any future offering will depend on market conditions and other factors beyond our control, we cannot predict or estimate the amount, timing or nature of our future offerings. Thus, our stockholders bear the risk of our future offerings reducing the per share trading price of our common stock and diluting their interest in us.
Our ability to pay dividends is limited by the requirements of Maryland law.
Our ability to pay dividends on our common stock is limited by the laws of Maryland. Under applicable Maryland law, a Maryland corporation generally may not make a distribution if, after giving effect to the distribution, the corporation would not be able to pay its debts as the debts become due in the usual course of business or the corporation's total assets would be less than the sum of its total liabilities plus, unless the corporation's charter permits otherwise, the amount that would be needed, if the
25
corporation were dissolved at the time of the distribution, to satisfy the preferential rights upon dissolution of stockholders whose preferential rights are superior to those receiving the distribution. Accordingly, we generally may not make a distribution on our common stock if, after giving effect to the distribution, we would not be able to pay our debts as they become due in the usual course of business or our total assets would be less than the sum of our total liabilities plus, unless the terms of such class or series provide otherwise, the amount that would be needed to satisfy the preferential rights upon dissolution of the holders of shares of any class or series of preferred stock then outstanding, if any, with preferences upon dissolution senior to those of our common stock.
We may change our dividend policy.
Future distributions will be declared and paid at the discretion of our Board and the amount and timing of distributions will depend upon cash generated by operating activities, our financial condition, capital requirements, annual distribution requirements under the REIT provisions of the Code, and such other factors as our Board deems relevant. Our Board may change our dividend policy at any time, and there can be no assurance as to the manner in which future dividends will be paid or that the current dividend level will be maintained in future periods.
Our senior unsecured revolving credit facility and unsecured term loans prohibit us from repurchasing shares of our common stock and may limit our ability to pay dividends on our common stock.
Our senior unsecured revolving credit facility and unsecured term loans prohibit us from repurchasing any shares of our common stock, during the term of the senior unsecured revolving credit facility and the unsecured term loans. Under the credit agreement governing our senior unsecured revolving credit facility and unsecured term loans, our distributions may not exceed the greater of (1) 90% of our funds from operations, (2) the amount required for us to qualify and maintain our status as a REIT, or (3) the amount required for us to avoid the imposition of income and excise taxes. As a result, if we do not generate sufficient funds from operations (as defined in the credit agreement) during the 12 months preceding any common stock dividend payment date, we would not be able to pay dividends to our common stockholders consistent with our past practice without causing a default under our credit agreement. In the event of such a default, we would be unable to borrow under our credit agreement, and any amounts we have borrowed under the credit agreement thereunder could become due and payable.
The price of our common stock may be volatile and may decline.
The market price of our common stock may fluctuate widely as a result of a number of factors, many of which are outside of our control. In addition, the stock market is subject to fluctuations in share prices and trading volumes that affect the market prices of the shares of many companies. These fluctuations in the stock market may adversely affect the market price of our common stock. Among the factors that could affect the market price of our common stock are:
• | actual or anticipated quarterly fluctuations in our operating results and financial condition; |
• | changes in revenues or earnings estimates or publication of research reports and recommendations by financial analysts or actions taken by rating agencies with respect to our securities or those of other REITs; |
• | the ability of our customers to pay rent to us and meet their other obligations to us under current lease terms; |
• | our ability to re-lease spaces as leases expire; |
• | our ability to refinance our indebtedness as it matures; |
• | any changes in our distribution policy; |
• | any future issuances of equity securities; |
• | strategic actions by us or our competitors, such as acquisitions or restructurings; |
• | general market conditions and, in particular, developments related to market conditions for the real estate industry; and |
• | domestic and international economic factors unrelated to our performance. |
26
ITEM 1B. Unresolved Staff Comments.
None.
ITEM 2. Properties.
General
We operate and invest principally in quality office properties in high growth submarkets in the Sunbelt region of the United States. At January 1, 2016, we owned or had an interest in 36 office properties, including interests held through consolidated and unconsolidated joint ventures, comprising approximately 14.3 million square feet of office space located in six states.
Office Buildings
We generally hold and operate our portfolio of office buildings for investment purposes. When our operating standards require necessary upgrades to recent acquisitions, we renovate, improve, or redevelop our office buildings. All such improvements are expected to be financed by cash flow from the portfolio of office properties, capital expenditure escrow accounts or advances under our unsecured credit facilities.
Acquisitions
During the year ended December 31, 2015, we purchased three wholly owned office properties as follows (in thousands):
Office Properties | Location | Type of Ownership | Square Feet | Date Purchased | Gross Purchase Price (1) | ||||||||
One Buckhead Plaza | Atlanta, GA | Wholly Owned | 464 | 01/08/2015 | $ | 157,000 | |||||||
Harborview Plaza | Tampa, FL | Wholly Owned | 205 | 09/25/2015 | 49,000 | ||||||||
Two Buckhead Plaza | Atlanta, GA | Wholly Owned | 210 | 10/01/2015 | 80,000 | ||||||||
879 | $ | 286,000 | |||||||||||
(1) Purchase price consists of the contract price only and does not include closing costs, adjustments, proration or improvements made subsequent to purchase.
We generally financed these acquisitions with borrowings under our unsecured term loans and senior unsecured revolving credit facility and available cash.
We purchased these three assets at an estimated weighted average capitalization rate of 5.9%. We compute the estimated capitalization rate by dividing estimated cash net operating income including rent concessions for the first year of ownership by the gross purchase price. We define cash net operating income as property specific revenues (rental revenue, property expense recoveries and other revenue) less property specific expenses (personnel, real estate taxes, insurance, repairs and maintenance and other property expenses).
27
Dispositions
During the year ended December 31, 2015, we sold the following properties (in thousands):
Office Properties | Location | Type of Ownership | Square Feet | Date of Sale | Gross Sales Price | Gain (Loss) on Sale | |||||||||||
Raymond James Tower (1) | Memphis, TN | Wholly Owned | 337 | 01/15/2015 | $ | 19,250 | $ | (117 | ) | ||||||||
Honeywell Building | Houston, TX | Wholly Owned | 157 | 02/04/2015 | 28,000 | 14,276 | |||||||||||
Two Ravinia Drive (2) | Atlanta, GA | Joint Venture | 390 | 04/08/2015 | 78,000 | 29,034 | |||||||||||
400 North Belt | Houston, TX | Wholly Owned | 231 | 05/08/2015 | 10,150 | (1,233 | ) | ||||||||||
Peachtree Dunwoody | Atlanta, GA | Wholly Owned | 370 | 05/13/2015 | 53,940 | 14,454 | |||||||||||
Hillsboro I-IV and V (3) | Ft. Lauderdale, FL | Wholly Owned | 216 | 06/05/2015 | 22,000 | 2,411 | |||||||||||
Riverplace South | Jacksonville, FL | Wholly Owned | 113 | 06/12/2015 | 9,000 | 466 | |||||||||||
Westshore Corporate Center | Tampa, FL | Wholly Owned | 173 | 07/07/2015 | 30,000 | 7,938 | |||||||||||
Cypress Center I-III and IV | Tampa, FL | Wholly Owned | 287 | 07/07/2015 | 36,000 | 11,219 | |||||||||||
245 Riverside (4) | Jacksonville, FL | Joint Venture | 137 | 07/16/2015 | 25,100 | 7,203 | |||||||||||
550 Greens Parkway | Houston, TX | Wholly Owned | 72 | 07/31/2015 | 2,258 | 37 | |||||||||||
Comerica Bank Building | Houston, TX | Wholly Owned | 194 | 09/01/2015 | 31,350 | 13,013 | |||||||||||
Squaw Peak I & II | Phoenix, AZ | Wholly Owned | 290 | 09/03/2015 | 51,300 | 13,235 | |||||||||||
One Commerce Green (5) | Houston, TX | Wholly Owned | 341 | 09/11/2015 | 47,500 | (5,201 | ) | ||||||||||
City Centre | Jackson, MS | Wholly Owned | 266 | 09/30/2015 | 6,200 | (108 | ) | ||||||||||
Millenia Park One | Orlando, FL | Wholly Owned | 157 | 12/23/2015 | 28,200 | 3,540 | |||||||||||
3,731 | $ | 478,248 | $ | 110,167 | |||||||||||||
(1) The Raymond James Tower was sold for a gross sale price of $19.3 million, providing $8.9 million in buyer credits.
(2) Two Ravinia Drive was a Fund II property, of which 30% was our share. Our share of the gain was $8.7 million.
(3) Hillsboro I-IV and V represent the sale of two office properties.
(4) 245 Riverside was a Fund II property, of which 30% was our share. Our share of the gain was $2.2 million.
(5) One Commerce Green was sold for a gross sale price of $47.5 million, providing $23.5 million in buyer credits.
On November 6, 2015, we and our joint venture partner sold 7000 Central Park for a gross sale price of $85.3 million. The joint venture recognized a gain on the sale of 7000 Central Park of approximately $30.5 million, and we recognized a gain on the sale of approximately $9.7 million during the year ended December 31, 2015.
The following table sets forth certain information about office properties which we owned or had an interest in at January 1, 2016:
Market and Property | Parkway's Ownership Interest | Total Net Rentable Square Feet(In thousands) | Occupancy Percentage | Weighted Avg. Gross Rental Rate Per Net Rentable Square Foot (1) | % of Leases Expiring in 2016 (2) | Year Built/ Renovated | ||||||||||||
CONSOLIDATED PROPERTIES: | ||||||||||||||||||
PHOENIX, AZ | ||||||||||||||||||
Hayden Ferry Lakeside I | 30.0 | % | 204 | 74.4 | % | $ | 30.38 | 5.9 | % | 2002 | ||||||||
Hayden Ferry Lakeside II | 30.0 | % | 299 | 100.0 | % | 31.03 | 1.8 | % | 2007 | |||||||||
Hayden Ferry Lakeside IV | 30.0 | % | 21 | 80.7 | % | 33.09 | — | % | 2007 | |||||||||
Tempe Gateway | 100.0 | % | 264 | 98.4 | % | 28.27 | — | % | 2009 | |||||||||
788 | ||||||||||||||||||
JACKSONVILLE, FL | ||||||||||||||||||
Stein Mart Building | 100.0 | % | 197 | 92.0 | % | 19.70 | 4.1 | % | 1985 | |||||||||
Deerwood North | 100.0 | % | 498 | 97.1 | % | 22.47 | 13.7 | % | 1999 | |||||||||
Deerwood South | 100.0 | % | 523 | 96.4 | % | 21.59 | 4.8 | % | 1999 | |||||||||
JTB Center | 100.0 | % | 248 | 97.6 | % | 20.77 | 17.2 | % | 1999 - 2001 | |||||||||
1,466 | ||||||||||||||||||
TAMPA, FL | ||||||||||||||||||
Corporate Center I (3) | 100.0 | % | 391 | 78.2 | % | 30.54 | 8.5 | % | 1999 | |||||||||
Corporate Center II (3) | 100.0 | % | 291 | 71.6 | % | 31.06 | 3.8 | % | 2002 | |||||||||
Corporate Center III (3) | 100.0 | % | 292 | 67.4 | % | 35.26 | 3.4 | % | 2004 | |||||||||
Corporate Center IV (3) | 100.0 | % | 250 | 95.9 | % | 35.78 | 1.2 | % | 2008 | |||||||||
Harborview Plaza | 100.0 | % | 205 | 96.0 | % | 29.18 | — | % | 2002 | |||||||||
The Pointe | 100.0 | % | 252 | 91.1 | % | 29.73 | 8.4 | % | 1982 | |||||||||
1,681 | ||||||||||||||||||
28
Market and Property | Parkway's Ownership Interest | Total Net Rentable Square Feet(In thousands) | Occupancy Percentage | Weighted Avg. Gross Rental Rate Per Net Rentable Square Foot (1) | % of Leases Expiring in 2016 (2) | Year Built/ Renovated | ||||||||||||
MIAMI, FL | ||||||||||||||||||
Lincoln Place (3) | 100.0 | % | 140 | 100.0 | % | 25.18 | — | % | 2002 | |||||||||
Courvoisier Centre (5) | 100.0 | % | 343 | 83.7 | % | 43.85 | 9.8 | % | 1986/1990 | |||||||||
483 | ||||||||||||||||||
ORLANDO, FL | ||||||||||||||||||
Citrus Center | 100.0 | % | 261 | 94.6 | % | 25.96 | 6.8 | % | 1971 | |||||||||
Bank of America Center | 100.0 | % | 421 | 88.7 | % | 27.87 | 9.3 | % | 1987 | |||||||||
One Orlando Centre | 100.0 | % | 356 | 85.3 | % | 26.22 | 19.7 | % | 1987 | |||||||||
1,038 | ||||||||||||||||||
ATLANTA, GA | ||||||||||||||||||
3350 Peachtree | 100.0 | % | 409 | 92.0 | % | 28.77 | 1.8 | % | 1989 | |||||||||
3348 Peachtree | 100.0 | % | 260 | 84.0 | % | 29.14 | 3.4 | % | 1998 | |||||||||
3344 Peachtree | 33.0 | % | 485 | 95.9 | % | 40.08 | 8.5 | % | 2008 | |||||||||
The Forum at West Paces | 100.0 | % | 220 | 79.8 | % | 32.98 | 2.9 | % | 2001 | |||||||||
One Buckhead Plaza | 100.0 | % | 464 | 91.6 | % | 29.54 | 4.3 | % | 1987 | |||||||||
Two Buckhead Plaza | 100.0 | % | 210 | 96.6 | % | 35.87 | 16.6 | % | 2006 | |||||||||
2,048 | ||||||||||||||||||
CHARLOTTE, NC | ||||||||||||||||||
Hearst Tower | 100.0 | % | 964 | 93.6 | % | 29.95 | 0.9 | % | 2002 | |||||||||
NASCAR Plaza (3) | 100.0 | % | 394 | 100.0 | % | 28.23 | 1.8 | % | 2009 | |||||||||
1,358 | ||||||||||||||||||
PHILADELPHIA, PA | ||||||||||||||||||
Two Liberty Place | 19.0 | % | 941 | 98.2 | % | 31.18 | 9.4 | % | 1990 | |||||||||
941 | ||||||||||||||||||
AUSTIN, TX | ||||||||||||||||||
One Congress Plaza | 100.0 | % | 514 | 78.4 | % | 44.64 | 9.9 | % | 1987 | |||||||||
San Jacinto Center | 100.0 | % | 406 | 86.5 | % | 45.52 | 0.5 | % | 1987 | |||||||||
920 | ||||||||||||||||||
HOUSTON, TX | ||||||||||||||||||
5300 Memorial (4) | 100.0 | % | 154 | 93.5 | % | 28.85 | 9.9 | % | 1982 | |||||||||
Town & Country (4) | 100.0 | % | 149 | 93.7 | % | 30.66 | 25.7 | % | 1982 | |||||||||
Phoenix Tower | 100.0 | % | 630 | 82.5 | % | 31.84 | 6.4 | % | 1984/2011 | |||||||||
CityWestPlace | 100.0 | % | 1,472 | 97.7 | % | 38.00 | 25.8 | % | 1993-2001 | |||||||||
San Felipe Plaza | 100.0 | % | 980 | 85.0 | % | 37.21 | 7.4 | % | 1984 | |||||||||
3,385 | ||||||||||||||||||
Total Consolidated Properties | 14,108 | |||||||||||||||||
UNCONSOLIDATED PROPERTIES: | ||||||||||||||||||
PHOENIX, AZ | ||||||||||||||||||
US Airways Building | 74.6 | % | 229 | 100.0 | % | 18.14 | — | % | 1999 | |||||||||
Total Properties as of January 1, 2016 | 14,337 | 90.7 | % | $ | 32.27 | 8.6 | % | |||||||||||
(1) Weighted average expiring gross rental rate is the weighted average current rental rate, which also includes $5.86 per square foot of escalations for operating expenses. These rates do not reflect any future increases in contractual rent or projections with respect to expense reimbursements.
(2) The percentage of leases expiring in 2016 represents the ratio of square feet under leases expiring in 2016 divided by total net rentable square feet.
(3) These properties are subject to ground leases. See "Note 2 — Investment in Office Properties," to the consolidated financial statements for additional information on these ground leases.
(4) 5300 Memorial and Town & Country were classified as Held for Sale as of December 31, 2015, and were sold on January 22, 2016.
(5) On February 5, 2016, we sold 80% of our interest in Courvoisier Centre.
Development Property
We have a consolidated joint venture with Fund II for Hayden Ferry Lakeside III, a development property located in Phoenix, Arizona. We have a 57.142% direct membership interest in the joint venture with Fund II as a 42.858% investor. In total, we are, directly and indirectly, a 70% investor in the joint venture, and TRST is a 30% investor.
29
During the year ended December 31, 2015, Fund II increased its investment in the Hayden Ferry Lakeside III development by $37.3 million, of which our share was approximately $26.1 million. To date, Fund II has invested $61.3 million in the project and expects the total investment to be approximately $68.8 million. As of December 31, 2015, our total investment and our expected total investment were approximately $42.9 million and $48.2 million, respectively. The property was 71.1% occupied as of January 1, 2016.
Lease expirations
The following table represents the embedded growth by lease expiration year for our portfolio including consolidated and unconsolidated joint ventures:
Year of Expiration | Occupied Square Footage (in thousands) | Percentage of Total Square Feet | Annualized Rental Revenue (in thousands) | Number of Leases | Weighted Average Expiring Gross Rental Rate Per NRSF | Weighted Average Estimated Market Rent per NRSF (1) | |||||||||||||||
2016 | 1,226 | 8.6 | % | $ | 39,373 | 248 | $ | 32.12 | $ | 35.48 | |||||||||||
2017 | 1,375 | 9.6 | % | 42,599 | 161 | 30.98 | 33.26 | ||||||||||||||
2018 | 1,323 | 9.2 | % | 42,846 | 171 | 32.39 | 34.10 | ||||||||||||||
2019 | 1,196 | 8.4 | % | 40,495 | 112 | 33.86 | 34.13 | ||||||||||||||
2020 | 1,084 | 7.5 | % | 36,647 | 123 | 33.81 | 34.85 | ||||||||||||||
2021 | 1,414 | 9.9 | % | 44,789 | 61 | 31.68 | 33.86 | ||||||||||||||
Thereafter | 5,390 | 37.5 | % | 173,065 | 153 | 32.11 | 34.42 | ||||||||||||||
13,008 | 90.7 | % | 419,814 | 1,029 | $ | 32.27 | $ | 34.34 | |||||||||||||
(1) Estimated average market rent is based upon our estimates, determined, in part, by information obtained from (1) our experience in leasing space at our properties; (2) leasing agents in relevant markets with respect to quoted rental rates and completed leasing transactions for comparable properties in relevant markets; and (3) publicly available data with respect thereto. Estimated average market rent is weighted by the occupied rentable square feet in each property. The weighted average estimated market rent per net rentable square foot is solely an estimate, and is not a projection of anticipated rent we will realize upon release of the properties.
30
Top 20 Customers (based on rental revenue)
At January 1, 2016, our office properties were comprised of 1,029 leases associated with 833 customers, which are in a wide variety of industries. Our largest customer and 20 largest customers accounted for 6.4% and 39.5%, respectively, of our annualized rental revenue. The following table sets forth information concerning the 20 largest customers in our portfolio, including consolidated and unconsolidated joint ventures, based on annualized rent as of January 1, 2016 (in thousands, except number of properties, square footage and footnotes):
Customer (1) | No. of Props | Square Footage Expiring | Occupied Square Footage | Annualized Rental Revenue (2) | Percentage of Total Annualized Rent | ||||||||||||||||||||||||||
2016 | 2017 | 2018 | 2019 | 2020 | Thereafter | ||||||||||||||||||||||||||
Statoil Gulf Services, LLC (3) | 2 | 74,238 | 76,201 | — | — | — | 416,788 | 567,227 | $ | 23,729 | 6.4 | % | |||||||||||||||||||
BMC Software, Inc. (4) | 4 | 315,563 | — | 37,139 | — | — | 216,237 | 568,939 | 18,367 | 4.9 | % | ||||||||||||||||||||
CIGNA Health and Life Insurance Company (5) | 1 | 84,951 | — | — | — | — | 319,755 | 404,706 | 12,134 | 3.3 | % | ||||||||||||||||||||
Bank of America (6) | 3 | — | — | — | — | — | 380,954 | 380,954 | 11,406 | 3.1 | % | ||||||||||||||||||||
Ion Geophysical Corporation (7) | 1 | — | — | — | — | — | 176,349 | 176,349 | 7,690 | 2.1 | % | ||||||||||||||||||||
Blue Cross Blue Shield (BCBS) (8) | 2 | — | 18,419 | — | — | — | 227,592 | 246,011 | 6,693 | 1.8 | % | ||||||||||||||||||||
Wells Fargo (9) | 3 | 7,969 | — | — | — | 107,773 | 81,857 | 197,599 | 6,650 | 1.8 | % | ||||||||||||||||||||
ENSCO International Incorporated (10) | 1 | 546 | 152 | — | — | — | 166,136 | 166,834 | 5,941 | 1.6 | % | ||||||||||||||||||||
Regus Equity Business Centers, LLC (11) | 9 | 28,286 | 29,655 | 25,577 | — | 45,790 | 49,077 | 178,385 | 5,822 | 1.6 | % | ||||||||||||||||||||
Raymond James & Associates, Inc. (12) | 3 | — | — | — | — | — | 152,814 | 152,814 | 5,533 | 1.5 | % | ||||||||||||||||||||
Hearst Communication, Inc. (13) | 1 | — | 43,599 | — | — | — | 137,724 | 181,323 | 5,389 | 1.4 | % | ||||||||||||||||||||
OSI Restaurant Partners, Inc. (14) | 1 | — | — | — | — | — | 167,723 | 167,723 | 5,000 | 1.3 | % | ||||||||||||||||||||
NASCAR Media Group, LLC (10) | 1 | — | — | — | — | 139,461 | 139,461 | 4,730 | 1.3 | % | |||||||||||||||||||||
JPMorgan Chase Bank, N.A. (15) | 4 | — | 164,004 | — | — | 18,797 | 17,128 | 199,929 | 4,616 | 1.2 | % | ||||||||||||||||||||
US Airways Group, Inc. (16) | 1 | — | — | — | — | — | 225,000 | 225,000 | 4,163 | 1.1 | % | ||||||||||||||||||||
Nalco Company (17) | 1 | — | — | 130,115 | — | — | — | 130,115 | 4,087 | 1.1 | % | ||||||||||||||||||||
Board of Regents of the University System of Georgia (10) | 1 | — | — | — | — | — | 135,124 | 135,124 | 4,083 | 1.1 | % | ||||||||||||||||||||
Carlton Fields, PA (10) | 1 | — | — | — | 93,868 | — | — | 93,868 | 3,810 | 1.0 | % | ||||||||||||||||||||
K&L Gates LLP (18) | 1 | — | — | — | — | — | 110,914 | 110,914 | 3,689 | 1.0 | % | ||||||||||||||||||||
16th Street Partners, LLC (10) | 1 | — | — | — | — | — | 139,887 | 139,887 | 3,522 | 0.9 | % | ||||||||||||||||||||
Total | 511,553 | 332,030 | 192,831 | 93,868 | 172,360 | 3,260,520 | 4,563,162 | $ | 147,054 | 39.5 | % | ||||||||||||||||||||
Total Rentable Square Footage | 14,337,294 | ||||||||||||||||||||||||||||||
Total Portfolio Annualized Rental Revenue (2) | $ | 372,254 | |||||||||||||||||||||||||||||
(1) | In some cases, the actual tenant may be an affiliate or subsidiary of the customer shown. |
(2) | Annualized rental revenue represents the gross rental rate (including operating expense pass through) per square foot, multiplied by the number of square feet leased by the customer. Amounts do not include the impact for grossing up triple net leases for tenants who pay operating expenses directly. |
(3) | Statoil Gulf Services, LLC (CityWestPlace) lease allows for two contraction options to reduce the leased space by up to six full floors. Tenant's first contraction option provides that tenant may contract either: floors 7-9 or floors 10-12. Tenant provided notice of the first contraction as of November 24, 2014, and has provided timely notice of its election to contract floors 10-12 (totaling 74,238 square feet) effective August 31, 2016. Tenant's second contraction option provides for three one-time rights to contract the premises in one floor increments effective August 31, 2022, August 31, 2024, and August 31, 2027. Tenant must provide not less than 12 months' prior written notice of their intent to contract. The floor(s) selected to be contracted will be the then highest and/or lowest floor at our option. |
(4) | BMC Software, Inc. (CityWestPlace) lease for CityWestPlace Building IV provides a one-time option to reduce the leased space one full floor of approximately 26,000 square feet effective July 1, 2021 upon at least 12 months' prior written notice. Additionally, we have agreed to terminate 10,448 square feet of tenant's premises at CityWestPlace Building II as of January 31, 2016 to accommodate future expansion of Statoil Gulf Services, LLC at that building. |
(5) | CIGNA Health and Life Insurance Company (Two Liberty Place) lease allows for four one-time rights to reduce the leased space in one floor increments (up to 27,543 square feet each, subject to a data room exclusion in the fourth contraction option). Tenant's first contraction right is for floor 15 effective August 31, 2019, the second is for floor 14 effective August 31, 2020, the third is for floor 12 effective August 31, 2021, and effective August 31, 2022, the fourth is for, at tenant's discretion, either (i) all rentable area of floor 13 or (ii) all rentable area of floor 13, exclusive of the 10,559 rentable square feet that is used as tenant's data room. For each contraction option, tenant must provide no less than 12 months' prior written notice of its intent to contract prior to the relevant effective date. In addition to the aforementioned contraction rights, the lease provides tenant with the option to surrender the following areas: (1) a training room consisting of 1,083 square feet upon 60 days' prior written notice (which, upon surrender, will become part of the conference center amenity provided under the lease), and (2) effective August 31, 2020, the mail room consisting of 1,719 square feet upon 12 months' prior written notice. Tenant exercised its option to surrender storage space consisting of 2,331 square feet effective June 1, 2016. |
31
(6) | Bank of America (Bank of America Center) lease provides an option to terminate the lease, which consists of 35,959 square feet of leased space, effective July 31, 2019 upon nine months' prior written notice. Merrill Lynch (One Congress Plaza) lease provides an option to terminate the lease, which consists of 22,684 square feet of leased space, effective August 14, 2019 upon 12 months' prior written notice. |
(7) | ION Geophysical Corporation (CityWestPlace) lease provides an option to reduce the leased space by a full floor of approximately 23,000 square feet, effective October 1, 2017 upon no less than 12 months' prior written notice. |
(8) | Blue Cross Blue Shield (3350 Peachtree) has the option to reduce the leased space by up to 87,978 square feet, effective January 2018 upon nine months' prior written notice. |
(9) | Wells Fargo (The Pointe) lease provides the right to terminate leased space of 47,055 square feet on June 30, 2017, with prior written notice received no later than June 30, 2016. |
(10) | These leases do not provide for any early termination or contraction options. |
(11) | Regus Equity Business Centers, LLC (Courvoisier Centre) lease provides an option to terminate approximately 15,332 square feet effective May 31, 2019 upon 12 months' prior written notice. Regus Equity Business Centers, LLC (One Congress Plaza) lease provides an option to terminate approximately 23,101 square feet effective September 30, 2018, upon 270 days' prior written notice. |
(12) | Raymond James & Associates, Inc. (San Felipe Plaza) lease provides a one-time right to terminate the lease in its entirety or only with respect to Suite 4125 (4,377 square feet) as of May 30, 2019, with 12 prior written months' notice. Raymond James & Associates, Inc. (Tempe Gateway) may terminate its leased space (6,882 square feet), effective December 31, 2019 upon nine months' prior written notice. Raymond James & Associates, Inc. (Two Buckhead Plaza) has executed an early renewal pursuant to which the premises was reduced by 9,114 square feet effective October 1, 2016. |
(13) | Hearst Communications (Hearst Tower in Charlotte, NC) lease provides an option to reduce the leased space by all (22,738 square feet) or one-half (11,369 square feet) of floor 28 between January 1, 2015 and December 31, 2019. Tenant must provide at least 180 days' prior written notice, but in no event is tenant allowed to deliver such notice later than July 4, 2019. |
(14) | OSI Restaurant Partners, LLC (Corporate Center I in Tampa, FL) lease provides an option to reduce the leased space by up to 15,000 square feet (exclusive of suites 160, 180, 190, 500, and 600) between January 1, 2019 and December 31, 2020 upon 18 months' prior written notice. |
(15) | JPMorgan Chase Bank, N.A. (Deerwood South in Jacksonville, Florida) lease provides for an option to terminate approximately 12,849 square feet effective June 30, 2018 upon prior written notice by October 1, 2017. JPMorgan Chase Bank, N.A. (Hearst Tower in Charlotte, NC) lease provides an option to terminate approximately 5,948 square feet effective August 31, 2018 upon prior written notice by November 30, 2017. |
(16) | US Airways Group, Inc. (US Airways Building in Phoenix, Arizona) lease provides an option to terminate approximately 225,000 square feet effective as of December 31, 2021, should tenant or its subsidiaries be acquired by, directly or indirectly, or merge, consolidate, or otherwise combine, directly or indirectly, with an unaffiliated airline group upon one year prior written notice. US Airways Group, Inc. pays operating expenses directly; therefore, revenue included for Top Customer ranking calculations is reflected at net. |
(17) | Nalco Company (Phoenix Tower in Houston, Texas) exercised its option to terminate the lease in its entirety early effective February 28, 2018. |
(18) | K & L Gates LLP (Hearst Tower in Charlotte, North Carolina) lease provides an option to terminate approximately 109,341 square feet on September 30, 2024, upon prior written notice not later than September 23, 2023. Tenant can terminate its lease of storage space consisting of 1,573 square feet upon 30 days' prior written notice. |
Significant Properties
We have one property, CityWestPlace, whose book value exceeded ten percent of total assets at December 31, 2015 and whose gross rental revenue exceeded ten percent of consolidated gross revenues for the year ended December 31, 2015.
CityWestPlace is located in Houston, Texas and is comprised of four office buildings in a 35.3 acre complex that range from six stories to 21 stories with an aggregate of 1.5 million rentable square feet. We acquired CityWestPlace in December 2013 in conjunction with the Mergers. The buildings were constructed between 1993 and 2001. CityWestPlace's major customers include companies in the technology, and the oil and gas industries. At January 1, 2016, the property was 97.7% occupied with an average effective annual rental rate per square foot of $38.00. The average occupancy and rental rate per square foot since we acquired ownership of CityWestPlace is as follows:
Year | Average Occupancy | Average Rental Rate per Square Foot | ||||
2013 | 97.4% | $ | 30.30 | |||
2014 | 96.4% | $ | 31.37 | |||
2015 | 85.3% | $ | 34.12 | |||
Lease expirations for CityWestPlace at January 1, 2016 are as follows (in thousands, except square feet of leases expiring and number of leases):
Year | Square Feet of Leases Expiring | Percentage of Total Square Feet | Annualized Rent (1) | Percentage of Total Annualized Rent | Number of Leases | |||||||||||
2016 | 380,050 | 25.8 | % | $ | 12,789 | 23.4 | % | 9 | ||||||||
2017 | 152,017 | 10.3 | % | 5,597 | 10.2 | % | 2 | |||||||||
2018 | — | — | % | — | — | % | — | |||||||||
2019 | — | — | % | — | — | % | — | |||||||||
2020 | 34,260 | 2.3 | % | 1,597 | 2.9 | % | 4 | |||||||||
2021 | 15,905 | 1.1 | % | 398 | 0.7 | % | 3 | |||||||||
2022 | — | — | % | — | — | % | — | |||||||||
2023 | 176,349 | 12.0 | % | 7,690 | 14.1 | % | 1 | |||||||||
2024 | — | — | % | — | — | % | — | |||||||||
2025 | 46,971 | 3.2 | % | 1,862 | 3.4 | % | 5 | |||||||||
Thereafter | 633,025 | 43.0 | % | 24,732 | 45.3 | % | 2 | |||||||||
1,438,577 | 97.7 | % | $ | 54,665 | 100.0 | % | 26 | |||||||||
(1) Annualized rent represents the gross rental rate (including escalations) per square foot, multiplied by the number of square feet leased by the customer.
32
CityWestPlace has three customers that occupy 10% or more of the rentable square footage. Information regarding these customers is as follows:
Nature of Business | Square Feet Expiring (in thousands) | Lease Expiration Date | Effective Rental Rate Per Square Foot | Lease Options | ||||
Technology | 532 | 2016-2026 | $32.23-$33.56 | (1) | ||||
Oil & Gas | 567 | 2016-2032 | 39.66-42.62 | (2) | ||||
Oil & Gas | 176 | 2023 | 43.61 | (3) | ||||
(1) | This tenant has given notice to cancel 10,448 square feet effective January 31, 2016, and has an option to cancel 10,448 square feet effective July 1, 2021 upon 12 months' prior written notice. |
(2) | This tenant has three one-time options to cancel one floor each effective August 31, 2022, August 31, 2024, and August 21, 2027 with 12 months' notice. |
(3) | This tenant has an option to cancel up to 23,000 square effective October 1, 2017 upon 12 months' prior notice. |
For tax purposes, depreciation is calculated over 20 to 40 years for buildings and garages, seven to 40 years for building and tenant improvements and five to seven years for equipment, furniture and fixtures. The federal tax basis net of accumulated tax depreciation of CityWestPlace is estimated as follows at December 31, 2015 (in thousands):
CityWestPlace | ||||
Land | $ | 31,555 | ||
Building and garage | 204,384 | |||
Building and tenant improvements | 49,122 | |||
Real estate tax expense for the property for 2015 was $7.8 million.
We compete with a considerable number of other real estate companies, financial institutions, pension funds, private partnerships, individual investors and others seeking to acquire and lease office space in Houston, Texas. Principal factors of competition in our business are the quality of properties (including the design and condition of improvements), leasing terms (including rent and other charges and allowances for tenant improvements), attractiveness and convenience of location, the quality and breadth of customer services provided and reputation as an owner and operator of quality office properties in the relevant market. Our ability to compete also depends on, among other factors, trends in the national and local economies, financial condition and operating results of current and prospective customers, availability and cost of capital, taxes and governmental regulations and legislation.
We did not have any material liens or encumbrances that exceeded 10% of total assets at December 31, 2015.
Subsequent Property Transactions
On January 22, 2016, we sold 5300 Memorial, an office property located in Houston, Texas, for a gross sale price of $33.0 million, and expect to recognize a gain in the first quarter of 2016.
On January 22, 2016, we sold Town & Country, an office property located in Houston, Texas, for a gross sale price of $27.0 million, and expect to recognize a gain in the first quarter of 2016.
On February 5, 2016, we sold 80% of our interest in Courvoisier Centre, a complex of two office buildings located in the Brickell submarket of Miami, Florida, to a joint venture with a third party investor at a gross asset value of $175.0 million. Simultaneous with the closing of the joint venture transaction, the joint venture closed on a $106.5 million first mortgage secured by the asset, which has a fixed interest rate of 4.6%, matures in March 2026 and is interest only through maturity. The recapitalization of Courvoisier Centre resulted in net proceeds to us of $154.3 million. We retained a 20% noncontrolling ownership interest in the property. We expect to recognize a gain in the first quarter of 2016.
ITEM 3. Legal Proceedings.
We and our subsidiaries are, from time to time, parties to litigation arising from the ordinary course of business. Our management does not believe that any such litigation will materially affect our financial position or operations.
ITEM 4. Mine Safety Disclosures
Not Applicable.
33
PART II
ITEM 5. Market for Registrant's Common Equity, Related Stockholder Matters and Issuer Purchases of Equity Securities.
Market Price of and Dividends on the Issuer's Common Equity
Our common stock, $.001 par value, is listed and trades on the New York Stock Exchange (the "NYSE") under the symbol "PKY." The number of record holders of our common stock and limited voting stock was 2,131 and six, respectively, at February 18, 2016.
At February 18, 2016, the last reported sales price per share of our common stock on the NYSE was $12.47. The following table sets forth, for the periods indicated, the high and low sales prices per share of our common stock and the per share cash distributions we paid during each quarter.
Year Ended | Year Ended | |||||||||||||||||||||||
December 31, 2015 | December 31, 2014 | |||||||||||||||||||||||
Quarter Ended | High | Low | Distributions | High | Low | Distributions | ||||||||||||||||||
March 31 | $ | 19.00 | $ | 16.60 | $ | 0.1875 | $ | 19.54 | $ | 16.95 | $ | 0.1875 | ||||||||||||
June 30 | 18.09 | 16.03 | 0.1875 | 21.38 | 17.63 | 0.1875 | ||||||||||||||||||
September 30 | 18.68 | 15.20 | 0.1875 | 21.80 | 18.17 | 0.1875 | ||||||||||||||||||
December 31 | 17.69 | 15.35 | 0.1875 | 21.50 | 17.32 | 0.1875 | ||||||||||||||||||
$ | 0.7500 | $ | 0.7500 | |||||||||||||||||||||
Common stock distributions during 2015 ($0.7500 per share) and 2014 ($0.7500 per share) were taxable as follows for federal income tax purposes:
Year Ended | ||||||||
December 31, | ||||||||
2015 | 2014 | |||||||
Ordinary income | $ | 0.2689 | $ | 0.7141 | ||||
Capital gain | — | 0.0359 | ||||||
Return of capital | 0.4811 | — | ||||||
$ | 0.7500 | $ | 0.7500 | |||||
In order to qualify as a REIT, we are required to distribute dividends (other than capital gain dividends) to our stockholders in an amount at least equal to the sum of:
• | 90% of our "REIT taxable income," subject to certain adjustments and excluding any net capital gain and |
• | 90% of the net income (after tax), if any, from foreclosure property, minus |
• | the sum of certain items of noncash income over 5% of our REIT taxable income. |
We have made and intend to continue to make timely distributions sufficient to satisfy the annual distribution requirements described above. It is possible, however, that we, from time to time, may not have sufficient cash or liquid assets to meet the distribution requirements. This may occur for instance, because of differences in timing between the recognition of taxable income and the actual receipt of cash or the effects of non-deductible capital expenditures, or the creation of reserve required debt or amortization payments. In the event that such timing differences occur, in order to meet the distribution requirements, we may arrange for short term, or possibly long term, borrowing to permit the payment of required dividends. If the amount of nondeductible expenses exceeds noncash deductions, we may among other things, refinance our indebtedness to reduce principal payments and may borrow funds for capital expenditures.
Under the agreement governing our senior unsecured revolving credit facility and unsecured term loans, we are permitted to make distributions to our stockholders not to exceed the greater of (1) 90% of our Funds From Operations (as defined in such agreements) and (2) the amount required for us to maintain our status as a REIT and avoid income and excise taxes, provided that no default or event of default exists. If certain defaults or events of default exist, we may only make distributions sufficient to maintain our status as a REIT. However, we may not make any distributions if any event of default resulting from nonpayment or
34
bankruptcy exists, or if as a result of the occurrence of any other event of default any of the obligations under the agreements have been accelerated.
Unregistered Sales of Equity Securities
None.
Purchases of Equity Securities by the Issuer
The following table summarizes all of the repurchases during the three months ended December 31, 2015:
Period | Total Number of Shares Purchased | Average Price Paid per Share | Total Number of Shares Purchased as Part of Publicly Announced Plans or Programs | Maximum Number of Shares that May Yet Be Purchased Under the Plans or Programs | |||||||||
10/1/2015 to 10/31/2015 | 16,715 | (1) | $ | 17.09 | — | — | |||||||
11/1/2015 to 11/30/2015 | — | — | — | — | |||||||||
12/1/2015 to 12/31/2015 | 1,028 | (1) | 16.09 | — | — | ||||||||
17,743 | $ | 17.03 | — | — | |||||||||
(1) As permitted under our equity incentive plans, these shares were withheld by us to satisfy tax withholding obligations for employees in connection with the vesting of restricted stock and restricted stock units.
Performance Graph
The following graph provides a comparison of cumulative stockholder returns for the period from December 31, 2010 through December 31, 2015 among Parkway, the Standard & Poor's 500 Index ("S&P 500") and the National Association of Real Estate Investment Trusts ("NAREIT") Equity REIT Total Return Index ("NAREIT Equity"). The stock performance graph assumes an investment of $100 in our common stock and each index and the reinvestment of any dividends. The historical information set forth below is not necessarily indicative of future performance.
The performance graph and related information shall not be deemed "soliciting material" or deemed to be "filed" with the SEC, nor shall such information be incorporated by reference into any future filing, except to the extent that we specifically incorporate it by reference into such filing.
35
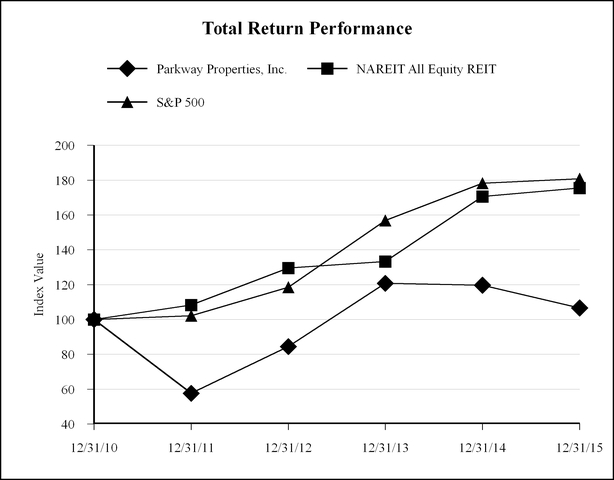
Period Ending | ||||||||||||||||||
Index | 12/31/2010 | 12/31/2011 | 12/31/2012 | 12/31/2013 | 12/31/2014 | 12/31/2015 | ||||||||||||
Parkway Properties, Inc. | 100.00 | 57.59 | 84.43 | 120.75 | 119.69 | 106.55 | ||||||||||||
NAREIT All Equity REIT | 100.00 | 108.28 | 129.62 | 133.32 | 170.68 | 175.51 | ||||||||||||
S&P 500 | 100.00 | 102.11 | 118.45 | 156.82 | 178.28 | 180.75 | ||||||||||||
Source: SNL Financial LC, Charlottesville, VA
36
ITEM 6. Selected Financial Data.
The following table sets forth selected financial data on a historical basis for Parkway Properties, Inc. This data should be read in conjunction with the consolidated financial statements and notes thereto and "Management's Discussion and Analysis of Financial Condition and Results of Operations" included elsewhere in this Annual Report on Form 10-K.
Year Ended December 31, | |||||||||||||||||||
2015 | 2014 | 2013 | 2012 | 2011 | |||||||||||||||
(In thousands, except per share data) | |||||||||||||||||||
Operating Data: | |||||||||||||||||||
Revenues | |||||||||||||||||||
Income from office properties | $ | 452,597 | $ | 418,007 | $ | 273,434 | $ | 190,718 | $ | 130,401 | |||||||||
Management company income | 10,321 | 22,140 | 18,145 | 19,778 | 16,896 | ||||||||||||||
Sale of condominium units | 11,065 | 16,554 | — | — | — | ||||||||||||||
Total revenues | 473,983 | 456,701 | 291,579 | 210,496 | 147,297 | ||||||||||||||
Expenses and other | |||||||||||||||||||
Property operating expenses | 173,241 | 168,071 | 108,867 | 76,835 | 55,247 | ||||||||||||||
Management company expenses | 9,935 | 20,280 | 19,399 | 17,237 | 13,337 | ||||||||||||||
Cost of sales - condominium units | 11,120 | 13,199 | 15 | — | — | ||||||||||||||
Depreciation and amortization | 190,387 | 182,955 | 118,031 | 74,626 | 49,119 | ||||||||||||||
Impairment loss on real estate | 5,400 | 11,700 | — | 5,700 | 6,420 | ||||||||||||||
Impairment loss on management contracts and goodwill | — | 4,750 | — | 41,967 | — | ||||||||||||||
Impairment loss on mortgage loan receivable | — | — | — | — | 9,235 | ||||||||||||||
Change in fair value of contingent consideration | — | — | — | 216 | (13,000 | ) | |||||||||||||
General and administrative | 31,194 | 32,660 | 25,653 | 16,420 | 18,805 | ||||||||||||||
Acquisition costs | 2,074 | 3,463 | 13,126 | 2,791 | 17,219 | ||||||||||||||
Total expenses and other | 423,351 | 437,078 | 285,091 | 235,792 | 156,382 | ||||||||||||||
Operating income (loss) | 50,632 | 19,623 | 6,488 | (25,296 | ) | (9,085 | ) | ||||||||||||
Other income and expenses | |||||||||||||||||||
Interest and other income | 903 | 1,452 | 2,236 | 272 | 938 | ||||||||||||||
Equity in earnings (losses) of unconsolidated joint ventures | 2,204 | (967 | ) | 178 | — | 57 | |||||||||||||
Gain on sale of in-substance real estate | — | 6,289 | — | — | |||||||||||||||
Net gains on sale of real estate | 110,732 | 76,378 | — | 48 | 743 | ||||||||||||||
Gain on sale of unconsolidated property | 9,698 | — | — | — | — | ||||||||||||||
Recovery of loss on mortgage loan receivable | — | — | — | 500 | — | ||||||||||||||
Loss on extinguishment of debt | (6,062 | ) | (2,405 | ) | — | — | |||||||||||||
Interest expense | (71,481 | ) | (66,095 | ) | (45,622 | ) | (34,352 | ) | (29,929 | ) | |||||||||
Income (loss) before income taxes | 96,626 | 34,275 | (36,720 | ) | (58,828 | ) | (37,276 | ) | |||||||||||
Income tax benefit (expense) | (1,903 | ) | (139 | ) | 1,405 | (261 | ) | (56 | ) | ||||||||||
Income (loss) from continuing operations | 94,723 | 34,136 | (35,315 | ) | (59,089 | ) | (37,332 | ) | |||||||||||
Discontinued operations: | |||||||||||||||||||
Income (loss) from discontinued operations | — | (391 | ) | (9,215 | ) | 3,170 | (192,496 | ) | |||||||||||
Gain on sale of real estate from discontinued operations | — | 10,463 | 32,493 | 12,938 | 17,825 | ||||||||||||||
Total discontinued operations | — | 10,072 | 23,278 | 16,108 | (174,671 | ) | |||||||||||||
Net income (loss) | 94,723 | 44,208 | (12,037 | ) | (42,981 | ) | (212,003 | ) | |||||||||||
Net (income) loss attributable to noncontrolling interests-real estate partnerships | (24,441 | ) | 824 | (7,904 | ) | 3,317 | 85,105 | ||||||||||||
Net (income) loss attributable to noncontrolling interests-unit holders | (2,947 | ) | (2,089 | ) | 291 | 269 | (5 | ) | |||||||||||
Net income (loss) for Parkway Properties, Inc. | 67,335 | 42,943 | (19,650 | ) | (39,395 | ) | (126,903 | ) | |||||||||||
Dividends on preferred stock | — | — | (3,433 | ) | (10,843 | ) | (10,052 | ) | |||||||||||
Dividends on convertible preferred stock | — | — | — | (1,011 | ) | — | |||||||||||||
Dividends on preferred stock redemption | — | — | (6,604 | ) | — | — | |||||||||||||
Net income (loss) attributable to common stockholders | $ | 67,335 | $ | 42,943 | $ | (29,687 | ) | $ | (51,249 | ) | $ | (136,955 | ) | ||||||
2015 | 2014 | 2013 | 2012 | 2011 | |||||||||||||||
(In thousands, except per share data) | |||||||||||||||||||
Amounts attributable to common stockholders: | |||||||||||||||||||
Income (loss) from continuing operations | $ | 67,335 | $ | 33,223 | $ | (39,522 | ) | $ | (62,537 | ) | $ | (38,502 | ) | ||||||
Discontinued operations | — | 9,720 | 9,835 | 11,288 | (98,453 | ) | |||||||||||||
Net income (loss) attributable to common stockholders | $ | 67,335 | $ | 42,943 | $ | (29,687 | ) | $ | (51,249 | ) | $ | (136,955 | ) | ||||||
Net income (loss) per common share attributable to | |||||||||||||||||||
Parkway Properties, Inc. | |||||||||||||||||||
Basic: | |||||||||||||||||||
Income (loss) from continuing operations attributable to | |||||||||||||||||||
Parkway Properties, Inc. | $ | 0.60 | $ | 0.33 | $ | (0.60 | ) | $ | (1.98 | ) | $ | (1.79 | ) | ||||||
Discontinued operations | — | 0.09 | 0.15 | 0.36 | (4.58 | ) | |||||||||||||
Net income (loss) attributable to Parkway Properties, Inc. | $ | 0.60 | $ | 0.42 | $ | (0.45 | ) | $ | (1.62 | ) | $ | (6.37 | ) | ||||||
Diluted: | |||||||||||||||||||
Income (loss) from continuing operations attributable to | |||||||||||||||||||
Parkway Properties, Inc. | 0.60 | $ | 0.33 | $ | (0.60 | ) | $ | (1.98 | ) | $ | (1.79 | ) | |||||||
Discontinued operations | — | 0.09 | 0.15 | 0.36 | (4.58 | ) | |||||||||||||
Net income (loss) attributable to Parkway Properties, Inc. | $ | 0.60 | $ | 0.42 | $ | (0.45 | ) | $ | (1.62 | ) | $ | (6.37 | ) | ||||||
Dividends per common share | $ | 0.75 | $ | 0.75 | $ | 0.6375 | $ | 0.375 | $ | 0.30 | |||||||||
Weighted average shares outstanding: | |||||||||||||||||||
Basic | 111,490 | 101,913 | 66,336 | 31,542 | 21,497 | ||||||||||||||
Diluted | 116,691 | 107,319 | 66,336 | 31,542 | 21,497 | ||||||||||||||
As of 12/31/15 | As of 12/31/14 | As of 12/31/13 | As of 12/31/12 | As of 12/31/11 | |||||||||||||||
(In thousands) | |||||||||||||||||||
Balance Sheet Data: | |||||||||||||||||||
Total real estate related investments, net | $ | 3,023,249 | $ | 3,024,271 | $ | 2,316,795 | $ | 1,562,717 | $ | 921,937 | |||||||||
Total assets | 3,619,235 | 3,704,714 | 2,925,501 | 1,906,611 | 1,636,311 | ||||||||||||||
Notes payable to banks | 550,000 | 481,500 | 303,000 | 262,000 | 132,322 | ||||||||||||||
Mortgage notes payable | 1,238,336 | 1,339,450 | 1,097,493 | 605,889 | 498,012 | ||||||||||||||
Total liabilities | 1,983,024 | 2,025,398 | 1,589,980 | 950,605 | 1,006,274 | ||||||||||||||
Preferred stock | — | — | — | 128,942 | 128,942 | ||||||||||||||
Noncontrolling interests | 247,512 | 286,543 | 318,921 | 261,992 | 258,428 | ||||||||||||||
Total Parkway Properties, Inc. stockholders' equity | 1,388,699 | 1,392,773 | 1,016,600 | 694,014 | 371,609 | ||||||||||||||
37
ITEM 7. Management's Discussion and Analysis of Financial Condition and Results of Operations.
Overview
We are a fully integrated, self-administered and self-managed real estate investment trust ("REIT") specializing in the acquisition, ownership, development and management of quality office properties in high-growth submarkets in the Sunbelt region of the United States. At January 1, 2016, we owned or had an interest in a portfolio of 36 office properties located in six states with an aggregate of approximately 14.3 million square feet of leasable space. We offer fee-based real estate services through our wholly owned subsidiaries, which in total managed and/or leased approximately 2.7 million square feet for third-party property owners at January 1, 2016. Unless otherwise indicated, all references to square feet represent net rentable area.
Business Objective and Operating Strategies
Our business objective is to maximize long-term stockholder value by generating sustainable cash flow growth and increasing the long-term value of our real estate assets through operations, acquisitions and capital recycling, while maintaining a conservative and flexible balance sheet. We intend to achieve this objective by executing on the following business and growth strategies:
• | Create Value as the Leading Owner of Quality Assets in Core Submarkets. Our investment strategy is to pursue attractive returns by focusing primarily on owning high-quality office buildings and portfolios that are well-located and competitively positioned within central business district and urban infill locations within our core submarkets in the Sunbelt region of the United States. In these submarkets, we seek to maintain a portfolio that consists of core, core-plus and value-add investment opportunities. Further, we intend to pursue an efficient capital allocation strategy that maximizes the returns on our invested capital. This may include selectively disposing of properties when we believe returns have been maximized and redeploying capital into acquisitions or other opportunities. |
• | Maximize Cash Flow by Continuing to Enhance the Operating Performance of Each Property. We provide property management and leasing services to our portfolio, actively managing our properties and leveraging our customer relationships to improve operating performance, maximize long-term cash flow and enhance stockholder value. We seek to attain a favorable customer retention rate by providing outstanding property management and customer service programs responsive to the varying needs of our diverse customer base. We also employ a judicious prioritization of capital projects to focus on projects that enhance the value of our property through increased rental rates, occupancy, service delivery, or enhanced reversion value. |
• | Realize Leasing and Operational Efficiencies and Gain Local Advantage. We concentrate our real estate portfolio in submarkets where we believe that we can maximize market penetration by accumulating a critical mass of properties and thereby enhance operating efficiencies. We believe that strengthening our local presence and leveraging our extensive market relationships will yield superior market information and service delivery and facilitate additional investment opportunities to create long-term stockholder value. |
Occupancy. Our revenues are dependent on the occupancy of our office buildings. At January 1, 2016, occupancy of our office portfolio was 90.7%, compared to 90.0% at October 1, 2015 and 88.6% at January 1, 2015. Not included in the January 1, 2016 occupancy rate is the impact of 28 signed leases totaling 289,153 square feet expected to take occupancy between now and the third quarter of 2018, of which the majority will commence during the first quarter of 2016. Including these signed leases, our portfolio was 92.7% leased at January 1, 2016. Our average occupancy for the three months and year ended December 31, 2015 was 90.2% and 89.4%, respectively.
During the fourth quarter of 2015, 25 leases were renewed totaling 345,000 rentable square feet at an average annual rental rate per square foot of $27.97, and at an average cost of $4.17 per square foot per year of the lease term. During the year ended December 31, 2015, 141 leases were renewed totaling 1.6 million rentable square feet at an average annual rental rate per square foot of $29.27, and at an average cost of $4.79 per square foot per year of the lease term.
During the fourth quarter of 2015, nine expansion leases were signed totaling 72,000 rentable square feet at an average annual rental rate per square foot of $24.37 and at an average cost of $3.47 per square foot per year of the lease term. During the year ended December 31, 2015, 46 expansion leases were signed totaling 227,000 rentable square feet at an average annual rental rate per square foot of $28.46 and at an average cost of $5.72 per square foot per year of the lease term.
38
During the fourth quarter of 2015, 29 new leases were signed totaling 214,000 rentable square feet at an average annual rental rate per square foot of $39.72 and at an average cost of $8.14 per square foot per year of the term. During the year ended December 31, 2015, 106 new leases were signed totaling 844,000 rentable square feet at an average annual rental rate per square foot of $34.25 and at an average cost of $7.55 per square foot per year of the lease term.
Rental Rates. An increase in vacancy rates in a market or at a specific property has the effect of reducing market rental rates. Inversely, a decrease in vacancy rates in a market or at a specific property has the effect of increasing market rental rates. Our leases typically have three to seven year terms, though we do enter into leases with terms that are either shorter or longer than that typical range from time to time. As leases expire, we seek to replace existing leases with new leases at the current market rental rate. For our properties owned as of January 1, 2016, management estimates that we have approximately $2.07 per square foot in annual rental rate embedded growth in our office property leases. Embedded growth is defined as the difference between the weighted average in-place cash rents including operating expense reimbursements and the weighted average estimated market rental rate.
The following table represents the embedded growth by lease expiration year for our portfolio including consolidated and unconsolidated joint ventures:
Year of Expiration | Occupied Square Footage (in thousands) | Percentage of Total Square Feet | Annualized Rental Revenue (in thousands) | Number of Leases | Weighted Average Expiring Gross Rental Rate per NRSF | Weighted Average Estimated Market Rent per NRSF (1) | |||||||||||||||
2016 | 1,226 | 8.6 | % | $ | 39,373 | 248 | $ | 32.12 | $ | 35.48 | |||||||||||
2017 | 1,375 | 9.6 | % | 42,599 | 161 | 30.98 | 33.26 | ||||||||||||||
2018 | 1,323 | 9.2 | % | 42,846 | 171 | 32.39 | 34.10 | ||||||||||||||
2019 | 1,196 | 8.4 | % | 40,495 | 112 | 33.86 | 34.13 | ||||||||||||||
2020 | 1,084 | 7.5 | % | 36,647 | 123 | 33.81 | 34.85 | ||||||||||||||
2021 | 1,414 | 9.9 | % | 44,789 | 61 | 31.68 | 33.86 | ||||||||||||||
Thereafter | 5,390 | 37.5 | % | 173,065 | 153 | 32.11 | 34.42 | ||||||||||||||
Total | 13,008 | 90.7 | % | $ | 419,814 | 1,029 | $ | 32.27 | $ | 34.34 | |||||||||||
(1) Estimated average market rent is based upon our estimates, determined, in part, by information obtained from (1) our experience in leasing space at our properties; (2) leasing agents in relevant markets with respect to quoted rental rates and completed leasing transactions for comparable properties in relevant markets; and (3) publicly available data with respect thereto. Estimated average market rent is weighted by the occupied rentable square feet in each property. The weighted average estimated market rent per net rentable square foot is solely an estimate, and is not a projection of anticipated rent we will realize upon release of the properties.
Customer Retention. Keeping existing customers is important as high customer retention leads to increased occupancy, less downtime between leases and reduced leasing costs. We estimate that it costs two to three times more to replace an existing customer with a new one than to retain the existing customer. In making this estimate, we take into account the sum of revenue lost during downtime on the space plus leasing costs, which typically rise as market vacancies increase. Therefore, we focus a great amount of energy on customer retention. We seek to retain our customers by continually focusing on operations at our office properties. We believe in providing superior customer service; hiring, training, retaining and empowering each employee; and creating an environment of open communication both internally and externally with customers and stockholders. Our customer retention rate was 81.9% for the quarter ended December 31, 2015, as compared to 86.6% for the quarter ended September 30, 2015, and 82.6% for the quarter ended December 31, 2014. Customer retention for the years ended December 31, 2015 and 2014 was 78.3% and 81.7%, respectively.
Joint Ventures and Partnerships
Management views investing in wholly owned properties as the highest priority of our capital allocation. However, we may selectively pursue joint ventures if we determine that such a structure will allow us to reduce anticipated risks related to a property or portfolio, limit concentration of rental revenue from a particular market or building or address unusual operational risks. To the extent we enter into joint ventures and partnerships, we will generally seek to manage all phases of the investment cycle including acquisition, financing, operations, leasing and dispositions, and we will seek to receive fees for providing these services.
39
Parkway Properties Office Fund II, L.P.
At December 31, 2015, we had one consolidated partnership structured as a discretionary fund. Fund II, a $750.0 million discretionary fund, was formed on May 14, 2008. Fund II was structured with TRST as a 70% investor and our Operating Partnership as a 30% investor, with an original target capital structure of approximately $375.0 million of equity capital and $375.0 million of non-recourse, fixed-rate first mortgage debt. Fund II currently owns five properties and one development property totaling 2.2 million square feet in Atlanta, Georgia; Phoenix, Arizona; and Philadelphia, Pennsylvania. In August 2012, Fund II increased its investment capacity by $20.0 million to purchase Hayden Ferry Lakeside III, IV and V, a 2,500 space parking garage, a 21,000 square foot office property and a vacant parcel of land available for development, all adjacent to our Hayden Ferry Lakeside I and Hayden Ferry Lakeside II office properties in Phoenix, Arizona. In August 2013, Fund II expanded its investment guidelines solely for the purpose of authorizing the purchase of a parcel of land available for development in Tempe, Arizona. In April 2014, Fund II authorized the development of Hayden Ferry Lakeside III, as well as the transfer of an interest in the owner of Hayden Ferry Lakeside III, a subsidiary of Fund II, to our Operating Partnership. We now own a 70% indirect interest in Hayden Ferry Lakeside III.
We serve as the general partner of Fund II and provide asset management, property management, leasing and construction management services to the fund, for which we are paid market-based fees. Cash is distributed by Fund II pro rata to each partner until a 9% annual cumulative preferred return is received and invested capital is returned. Thereafter, 56% will be distributed to TRST and 44% to us. The term of Fund II is seven years from the date the fund was fully invested, or until February 2019, with provisions to extend the term for two additional one-year periods at our discretion.
Joint Ventures
In addition to the 35 office properties included in our consolidated financial statements, we were also invested in three unconsolidated joint ventures as of December 31, 2015. These investments are accounted for using the equity method of accounting. Accordingly, the assets and liabilities of the joint ventures are not included in our consolidated balance sheet at December 31, 2015. Information relating to these unconsolidated joint ventures is detailed below:
Joint Venture Entity | Property Name | Location | Parkway's Ownership % | Square Feet (in thousands) | Percentage Occupied | |||||||
US Airways Building Tenancy in Common | US Airways Building | Phoenix, AZ | 74.58% | 229 | 100.0 | % | ||||||
7000 Central Park JV LLC ("7000 Central Park") | 7000 Central Park | Atlanta, GA | 40.00% | N/A | N/A | |||||||
Tryon Place, LLC | Tryon Place | Charlotte, NC | 14.80% | N/A | N/A | |||||||
US Airways Building Tenancy in Common
On June 3, 2013, we purchased a 74.6% interest in the US Airways Building, a 229,000 square foot office building located in the Tempe submarket of Phoenix, Arizona, for a purchase price of $41.8 million. US Airways owns the remaining 25.4% interest in the building. This nine-story office building is adjacent to our Hayden Ferry Lakeside and Tempe Gateway assets and shares a parking garage with our Tempe Gateway asset. The property is the headquarters for US Airways, which has leased 100% of the building through April 2024. US Airways has a termination option on December 31, 2021 with 12 months' prior written notice. At closing, we issued a $13.9 million first mortgage loan to the US Airways Building Tenancy in Common, which is secured by the US Airways Building. The mortgage loan has a fixed interest rate of 3.0% and matures on December 31, 2016. As of December 31, 2015 and 2014, the balance of the mortgage loan was $13.1 million and $13.4 million, respectively. Because we act as both the lender and the borrower for this mortgage loan, our share of the mortgage loan is not reflected on our consolidated balance sheets. As of December 31, 2015 and 2014, the balance of our mortgage loan receivable was $3.3 million and $3.4 million, respectively. Our investment in the joint venture was $38.5 million as of December 31, 2015.
7000 Central Park
On November 5, 2013, we and our joint venture partner foreclosed and took ownership of 7000 Central Park, a 414,000 square foot office building located in the Central Perimeter of Atlanta, Georgia. We previously acquired a 40% common equity interest in a mortgage note in the original principal amount of $65.0 million secured by the asset. The total purchase price for the note, which was previously under special servicer oversight, was $56.6 million plus an additional $318,000 in transaction costs. Our share of such amount was approximately $45.0 million, comprised of an investment of approximately $37.0 million for a preferred equity interest in the joint venture that acquired the note and an investment of approximately $8.0 million for a 40% common equity interest. On December 13, 2013, we and our joint venture partner placed secured financing on the asset in the amount of $30.0 million, the net proceeds of which were used to repay a portion of our initial preferred equity investment, reducing the preferred equity interest to approximately $7.6 million. On November 6, 2015, we and our joint venture partner sold 7000 Central
40
Park for a gross sale price of $85.3 million. The joint venture recognized a gain on the sale of 7000 Central Park of approximately $30.5 million, and we recognized a gain on the sale of approximately $9.7 million during the year ended December 31, 2015.
Tryon Place, LLC
On December 23, 2015, we entered into a joint venture agreement with a third party investor for the purpose of exploring a development opportunity in Charlotte, North Carolina. Our investment in this joint venture was $1.0 million as of December 31, 2015.
Financial Condition
Comparison of the year ended December 31, 2015 to the year ended December 31, 2014
Assets. In 2015, we continued the execution of our strategy of operating and acquiring office properties as well as disposing of non-core assets that no longer meet our investment criteria or for which a disposition would maximize value. During the year ended December 31, 2015, total assets decreased $85.5 million, or 2.3%, as compared to the year ended December 31, 2014. The primary reason for the decrease was the disposition of 17 consolidated office properties and one unconsolidated property (see "– Dispositions"), partially offset by the purchases of One Buckhead Plaza, Harborview Plaza and Two Buckhead Plaza (see "– Acquisitions and Improvements").
Acquisitions and Improvements. Our investment in office properties decreased $1.0 million net of accumulated depreciation. The carrying amount at December 31, 2015 was $3.0 billion and consisted of 35 office properties. The primary reason for the decrease in office properties relates to the sale of 17 consolidated office properties and increased depreciation of office and properties partially offset by the purchases of One Buckhead Plaza, Harborview Plaza and Two Buckhead Plaza which are summarized in the table below, improvements to office properties of approximately $95.0 million, and the development of Hayden Ferry Lakeside III in Phoenix, Arizona totaling approximately $37.3 million.
Office Properties | Location | Type of Ownership | Square Feet | Date Purchased | Gross Purchase Price (1) | ||||||||
One Buckhead Plaza | Atlanta, GA | Wholly Owned | 464 | 01/08/2015 | $ | 157,000 | |||||||
Harborview Plaza | Tampa, FL | Wholly Owned | 205 | 09/25/2015 | 49,000 | ||||||||
Two Buckhead Plaza | Atlanta, GA | Wholly Owned | 210 | 10/01/2015 | 80,000 | ||||||||
879 | $ | 286,000 | |||||||||||
(1) Purchase price consists of the contract price only and does not include closing costs, adjustments, prorations or improvements made subsequent to purchase.
During the year ended December 31, 2015, Fund II increased its investment in the Hayden Ferry Lakeside III development by $37.3 million, of which our share was approximately $26.1 million. To date, Fund II has invested $61.3 million in the project and expects the total investment to be approximately $68.8 million. As of December 31, 2015, our total investment and our expected total investment were approximately $42.9 million and $48.2 million, respectively.
During the year ended December 31, 2015, we capitalized building and tenant improvements of $95.0 million and recorded depreciation expense of $119.2 million related to our office properties.
41
Dispositions. During the year ended December 31, 2015, we sold the following 17 consolidated office properties and one unconsolidated property:
Office Properties | Location | Type of Ownership | Square Feet | Date Sold | Gross Sales Price (1) | ||||||||
Consolidated properties | |||||||||||||
Raymond James Tower (2) | Memphis, TN | Wholly Owned | 337 | 01/15/2015 | $ | 19,250 | |||||||
Honeywell Building | Houston, TX | Wholly Owned | 157 | 02/04/2015 | 28,000 | ||||||||
Two Ravinia Drive | Atlanta, GA | Joint Venture | 390 | 04/08/2015 | 78,000 | ||||||||
400 North Belt | Houston TX | Wholly Owned | 231 | 05/08/2015 | 10,150 | ||||||||
Peachtree Dunwoody | Atlanta, GA | Wholly Owned | 370 | 05/13/2015 | 53,940 | ||||||||
Hillsboro I-IV and V (3) | Ft Lauderdale, FL | Wholly Owned | 216 | 06/05/2015 | 22,000 | ||||||||
Riverplace South | Jacksonville, FL | Wholly Owned | 113 | 06/12/2015 | 9,000 | ||||||||
Westshore Corporate Center | Tampa, FL | Wholly Owned | 173 | 07/07/2015 | 30,000 | ||||||||
Cypress Center I-III and IV | Tampa, FL | Wholly Owned | 287 | 07/07/2015 | 36,000 | ||||||||
245 Riverside | Jacksonville, FL | Joint Venture | 137 | 07/16/2015 | 25,100 | ||||||||
550 Greens Parkway | Houston, TX | Wholly Owned | 72 | 07/31/2015 | 2,258 | ||||||||
Comerica Bank Building | Houston, TX | Wholly Owned | 194 | 09/01/2015 | 31,350 | ||||||||
Squaw Peak I&II | Phoenix, AZ | Wholly Owned | 290 | 09/03/2015 | 51,300 | ||||||||
One Commerce Green (4) | Houston, TX | Wholly Owned | 341 | 09/11/2015 | 47,500 | ||||||||
City Centre | Jackson, MS | Wholly Owned | 266 | 09/30/2015 | 6,200 | ||||||||
Millenia Park One | Orlando, FL | Wholly Owned | 157 | 12/23/2015 | 28,200 | ||||||||
Total consolidated properties | 3,731 | $ | 478,248 | ||||||||||
Unconsolidated joint venture properties | |||||||||||||
7000 Central Park | Atlanta, GA | Joint Venture | 415 | 11/06/2015 | $ | 85,300 | |||||||
(1) Gross sales price consists of the contract price only and does not include closing costs, adjustments or prorations.
(2) The Raymond James Tower was sold for a gross sale price of $19.3 million, providing $8.9 million in buyer credits.
(3) Hillsboro I-IV and V represents the sale of two office properties.
(4) One Commerce Green was sold for a gross sale price of $47.5 million, providing $23.5 million in buyer credits.
Condominium Units. In connection with the Mergers, we acquired and consolidated the Murano residential condominium project, which we control. Our unaffiliated partner's interest is reflected on our consolidated balance sheets under the "Noncontrolling Interests" caption. Our partner owns 27% of the condominium project. Net proceeds from the project will be distributed, to the extent available, based on an order of preferences described in the partnership agreement. We may receive distributions, if any, in excess of our 73% ownership interest if certain return thresholds are met. The carrying value of our condominium units was zero and $9.3 million as of December 31, 2015 and December 31, 2014, respectively
Mortgage Loans Receivable. On June 3, 2013, we issued a $13.9 million first mortgage loan to the US Airways Building Tenancy in Common, which is secured by the US Airways Building, a 229,000 square foot office building located in Phoenix, Arizona in which we own a 74.6% interest, with US Airways owning the remaining 25.4% interest in the building. The mortgage loan has a fixed interest rate of 3.0% and matures on December 31, 2016. As of December 31, 2015 and 2014, the balance of the mortgage loan was $13.1 million and $13.4 million, respectively. Because we act as both the lender and the borrower for this mortgage loan, our share of the mortgage loan is not reflected on our consolidated balance sheets. As of December 31, 2015 and 2014, the balance of our mortgage loan receivable was $3.3 million and $3.4 million, respectively.
Investment in Unconsolidated Joint Ventures. In addition to the 35 office properties included in our consolidated financial statements, we were also invested in three unconsolidated joint ventures as of December 31, 2015. Information relating to these unconsolidated joint ventures is detailed below:
Joint Venture Entity | Property Name | Location | Parkway's Ownership % | Square Feet (in thousands) | Percentage Occupied | |||||||
US Airways Building Tenancy in Common | US Airways Building | Phoenix, AZ | 74.58% | 229 | 100.0 | % | ||||||
7000 Central Park JV LLC ("7000 Central Park") | 7000 Central Park | Atlanta, GA | 40.00% | N/A | N/A | |||||||
Tryon Place, LLC | Tryon Place | Charlotte, NC | 14.80% | N/A | N/A | |||||||
42
US Airways Building Tenancy in Common
We account for our investment in US Airways Building under the equity method of accounting. Accordingly, the assets and liabilities of the joint ventures are not included in our consolidated balance sheet at December 31, 2015. Our investment in this joint venture was $38.5 million as of December 31, 2015.
7000 Central Park
On November 6, 2015, we and our joint venture partner sold 7000 Central Park for a gross sale price of $85.3 million. The joint venture recognized a gain on the sale of 7000 Central Park of approximately $30.5 million, and we recognized a gain on the sale of approximately $9.7 million during the year ended December 31, 2015. Our investment in this joint venture was $120,000 as of December 31, 2015.
Tryon Place, LLC
On December 23, 2015, we entered into a joint venture agreement with a third party investor for the purpose of exploring a development opportunity in Charlotte, North Carolina. Our investment in this joint venture was $1.0 million as of December 31, 2015.
Cash and Cash Equivalents. Cash and cash equivalents were $75.0 million and $116.2 million at December 31, 2015 and December 31, 2014, respectively. The decrease in cash and cash equivalents of $41.2 million, or 35.5%, during the year ended December 31, 2015, was primarily due to investments in real estate, real estate development, and improvements to real estate, repayments of mortgage notes payable and bank borrowings, and dividends paid on common stock, partially offset by proceeds from sale of real estate and proceeds from bank borrowings.
Receivables and Other Assets. For the year ended December 31, 2015, receivables and other assets increased $24.4 million, or 8.6%. The increase in receivables and other assets is primarily due to increases in our straight line rent receivable balance and increases in other assets associated with our purchases of One Buckhead Plaza, Harborview Plaza and Two Buckhead Plaza, partially offset by decreases in receivables and other assets associated with the dispositions of 17 properties during the year ended December 31, 2015.
Intangible Assets, Net. For the year ended December 31, 2015, intangible assets net of related amortization decreased $38.8 million, or 20.9%, and was primarily due to amortization recorded during the period, and the disposition of 17 office properties, which was partially offset by the assigned lease intangibles from our purchases of One Buckhead Plaza, Harborview Plaza and Two Buckhead Plaza during the period.
Assets Held for Sale and Liabilities Related to Assets Held for Sale. As of December 31, 2015 and 2014, we classified assets held for sale totaling $21.4 million and $24.1 million, respectively, and liabilities related to assets held for sale totaling $1.0 million and $2.0 million, respectively. Assets held for sale and liabilities related to assets held for sale in 2015 relate to 5300 Memorial and Town & Country in Houston, Texas. Assets held for sale and liabilities related to assets held for sale in 2014 relate to Raymond James Tower in Memphis, Tennessee and the Honeywell Building in Houston, Texas.
Management Contract Intangibles, Net. For the year ended December 31, 2015, management contracts decreased $755,000, or 66.6%, as a result of amortization recorded during the period.
Notes Payable to Banks. Notes payable to banks increased $68.5 million or 14.2% during the year ended December 31, 2015. The net increase was primarily attributable to draws on our senior unsecured revolving credit facility which were used to pay off certain mortgage notes and fund the acquisitions of One Buckhead Plaza, Harborview Plaza and Two Buckhead Plaza during the year ended December 31, 2015, as well as borrowings on our $200.0 million five-year unsecured term loan which were used to partially pay down our senior unsecured revolving credit facility's outstanding balance.
43
Mortgage Notes Payable. During the year ended December 31, 2015, mortgage notes payable decreased $101.1 million, or 7.5%, as a result of the following (in thousands):
Increase | ||||
(Decrease) | ||||
Scheduled principal payments | $ | (13,588 | ) | |
Payoff of Westshore Corporate Center, 3350 Peachtree, Two Ravinia Drive, 245 Riverside, John Hancock Facility and Teachers Insurance and Annuity Associations mortgages | (162,431 | ) | ||
Assumption of mortgage debt on Two Buckhead Plaza at fair value | 56,140 | |||
Amortization of premiums on mortgage debt acquired | (12,025 | ) | ||
Borrowings and interest payable under the Hayden Ferry III construction loan | 30,790 | |||
$ | (101,114 | ) | ||
For a description of our outstanding mortgage debts, please reference "—Liquidity and Capital Resources—Indebtedness—Mortgage Notes Payable."
We expect to continue seeking primarily fixed-rate, non-recourse mortgage financing with maturities from five to ten years typically amortizing over 25 to 30 years on select office building investments as additional capital is needed. We monitor a number of leverage and other financial metrics defined in the loan agreements for our senior unsecured revolving credit facility and working capital unsecured credit facility, which include but are not limited to our total debt to total asset value. In addition, we monitor interest and fixed charge coverage ratios as well as earnings before interest, taxes, depreciation and amortization ("EBITDA") and the net debt to adjusted earnings before interest, taxes, depreciation and amortization ("Adjusted EBITDA") multiple. The interest coverage ratio is computed by comparing interest expense to Adjusted EBITDA. The fixed charge coverage ratio is computed by comparing interest expense, principal payments made on mortgage loans and preferred dividends paid to Adjusted EBITDA. The net debt to Adjusted EBITDA multiple is computed by comparing our share of net debt to Adjusted EBITDA computed for the current quarter as annualized and adjusted pro forma for any completed investment activity. Management believes all of the leverage and other financial metrics it monitors, including those discussed above, provide useful information on total debt levels as well as our ability to cover interest and principal payments.
Accounts Payable and Other Liabilities. For the year ended December 31, 2015, accounts payable and other liabilities decreased $8.7 million, or 4.3%, and is primarily due to amortization of below market leases and decreases in corporate payables, partially offset by increases in other accrued expenses and accounts payable.
Equity. Total equity decreased $43.1 million, or 2.6%, during the year ended December 31, 2015 as a result of the following (in thousands):
Increase (Decrease) | |||
Net income attributable to Parkway Properties, Inc. | $ | 67,335 | |
Net income attributable to noncontrolling interests | 27,388 | ||
Other comprehensive loss | 1,499 | ||
Common stock dividends declared | (87,432 | ) | |
Share-based compensation | 5,955 | ||
Issuance of shares to directors | 275 | ||
Contribution of capital by noncontrolling interests | 2,125 | ||
Distributions to noncontrolling interests | (60,016 | ) | |
Other | (234 | ) | |
$ | (43,105 | ) | |
Common and Limited Voting Stock. On January 10, 2014, we completed an underwritten public offering of 10.5 million shares of our common stock, plus an additional 1.325 million shares of our common stock issued and sold pursuant to the exercise of the underwriters’ option to purchase additional shares, at the public offering price of $18.15 per share. The net proceeds from the offering, after deducting the underwriting discount and offering expenses, were approximately $205.2 million. We contributed the net proceeds of this offering to our Operating Partnership in exchange for common units. Our Operating Partnership used the
44
net proceeds from this offering to (i) repay amounts outstanding under our senior unsecured revolving credit facility, (ii) fund acquisition opportunities and (iii) for general corporate purposes.
On September 26, 2014, we completed an underwritten public offering of 10 million shares of our common stock at the public offering price of $18.60 per share. On October 2, 2014, we sold an additional 1.5 million shares of our common stock at the public offering price of $18.60 pursuant to the exercise of the underwriters’ option to purchase additional shares. The net proceeds from the offering, including shares sold pursuant to the underwriters' option to purchase additional shares, after deducting the underwriting discount and offering expenses payable by us, were approximately $204.8 million. We contributed the net proceeds of this offering to our Operating Partnership in exchange for common units. Our Operating Partnership used the net proceeds from the offering, including the net proceeds from the shares sold pursuant to the underwriters' option, to fund acquisitions and to repay amounts under our senior unsecured revolving credit facility.
We did not issue any shares in underwritten public offerings in 2015.
On May 28, 2014, we entered into an ATM Equity OfferingSM Sales Agreement (the "Sales Agreement") with various agents whereby we may sell, from time to time, shares of our common stock, par value $.001 per share, having aggregate gross sales proceeds of up to $150.0 million through an "at-the-market" equity offering program. Sales may be made to the agents in their capacity as sales agents or as principals. We intend to use the net proceeds for general corporate purposes, which may include repaying temporarily amounts outstanding from time to time under our senior unsecured revolving credit facility, for working capital and capital expenditures, and to fund potential acquisitions or development of office properties. We are required to pay each agent a commission that will not exceed, but may be lower than, 2.0% of the gross sales price of the shares sold through such agent. During the year ended December 31, 2015, there were no ATM sales under the Sales Agreement.
Shelf Registration Statement. We have a universal shelf registration statement on Form S-3 (No. 333-193203) that was automatically effective upon filing on January 6, 2014. We may offer an indeterminate number or amount, as the case may be, of (1) shares of common stock, par value $.001 per share; (2) shares of preferred stock, par value $.001 per share; (3) depository shares representing our preferred stock; (4) warrants to purchase common stock, preferred stock or depository shares representing preferred stock; and (5) rights to purchase our common stock, all of which may be issued from time to time on a delayed or continuous basis pursuant to Rule 415 under the Securities Act.
Results of Operations
Comparison of the year ended December 31, 2015 to the year ended December 31, 2014.
Net income attributable to common stockholders was $67.3 million ($0.60 per basic and diluted common share) and$42.9 million ($0.42 per basic and diluted common share) for the years ended December 31, 2015 and 2014, respectively. The increase in net income attributable to common stockholders in the amount of $24.4 million for the year ended December 31, 2015 as compared to the year ended December 31, 2014 is primarily attributable to an increase in net gains on sale of real estate.
Income from Office Properties. The analysis below includes changes attributable to same-store properties and acquisitions and dispositions of office properties. Same-store properties are consolidated properties that we owned for the current and prior year reporting periods, excluding properties classified as discontinued operations. At December 31, 2015, same-store properties consisted of 27 properties comprising 11.5 million square feet.
The following table represents revenue from office properties for the years ended December 31, 2015 and 2014 (in thousands):
Year Ended December 31, | |||||||||||||||
2015 | 2014 | Increase (Decrease) | % Change | ||||||||||||
Revenue from office properties: | |||||||||||||||
Same-store properties | $ | 346,987 | $ | 336,427 | $ | 10,560 | 3.1 | % | |||||||
Properties acquired | 65,284 | 26,580 | 38,704 | *N/M | |||||||||||
Properties disposed | 40,326 | 85,713 | (45,387 | ) | (53.0 | )% | |||||||||
Total revenue from office properties (1) | $ | 452,597 | $ | 448,720 | $ | 3,877 | 0.9 | % | |||||||
*N/M – Not meaningful | |||||||||||||||
(1) Total revenue from office properties for the year ended December 31, 2014 from the table is $448.7 million. Total income from office properties on our consolidated statement of operations and comprehensive income (loss) for the year ended December 31, 2014 is $418.0 million. The difference represents revenues from our One Congress Plaza and San
45
Jacinto Center properties in Austin, Texas which are included in same-store properties in the table above for comparative purposes but which are not included in our consolidated statement of operations and comprehensive income (loss) for the year ended December 31, 2014 as the activity was included previously in equity in earnings (loss) of unconsolidated joint ventures.
Revenue from office properties for same-store properties increased $10.6 million, or 3.1%, for the year ended December 31, 2015, compared to the year ended December 31, 2014, and is primarily due to increases in new leasing activity and average rent per square foot for same-store properties.
Property Operating Expenses. The following table represents property operating expenses for the years ended December 31, 2015 and 2014 (in thousands):
Year Ended December 31, | |||||||||||||||
2015 | 2014 | Increase (Decrease) | % Change | ||||||||||||
Expense from office properties: | |||||||||||||||
Same-store properties | $ | 128,008 | $ | 128,943 | $ | (935 | ) | (0.7 | )% | ||||||
Properties acquired | 27,205 | 11,259 | 15,946 | *N/M | |||||||||||
Properties disposed | 18,028 | 40,279 | (22,251 | ) | (55.2 | )% | |||||||||
Total expense from office properties (1) | $ | 173,241 | $ | 180,481 | $ | (7,240 | ) | (4.0 | )% | ||||||
*N/M – Not meaningful | |||||||||||||||
(1) Total expense from office properties for the year ended December 31, 2014 from the table is $180.5 million. Total property expenses on our consolidated statement of operations and comprehensive income (loss) for the year ended December 31, 2014 is $168.1 million. The difference represent expenses from our One Congress Plaza and San Jacinto Center properties in Austin, Texas which are included in same-store properties in the table above for comparative purposes but which are not included in our consolidated statement of operations and comprehensive income (loss) for the year ended December 31, 2014 as the activity was included previously in equity in earnings (loss) of unconsolidated joint ventures.
Property operating expenses for same-store properties decreased $935,000, or 0.7%, for the year ended December 31, 2015, compared to the year ended December 31, 2014, and is primarily due to decreases in property tax expenses.
Management Company Income and Expenses. Management company income decreased $11.8 million, or 53.4%, during the year ended December 31, 2015 compared to the year ended December 31, 2014 and is primarily due to the termination of certain Eola Capital, LLC ("Eola") management contracts. Management company expenses decreased $10.3 million, or 51.0%, during the year ended December 31, 2015 compared to the year ended December 31, 2014 and is primarily due to a decrease in salary expense associated with personnel formerly employed at assets for which the related management contracts have been terminated.
Depreciation and Amortization. Depreciation and amortization expense attributable to office properties increased $7.4 million, or 4.1%, for the year ended December 31, 2015 compared to the year ended December 31, 2014. The primary reason for the increase is due to the purchase of ten wholly owned office properties in 2014 in addition to the acquisitions of One Buckhead Plaza, Harborview Plaza and Two Buckhead Plaza during the year ended December 31, 2015, partially offset by the disposition of four office properties in 2014 and 17 office properties during the year ended December 31, 2015.
Impairment Loss on Real Estate. During the year ended December 31, 2015, we recorded a $4.4 million impairment loss on real estate in continuing operations in connection with the excess of our carrying value over our estimated fair value of 550 Greens Parkway, a 72,000 square foot office property located in Houston, Texas. We also recorded a $1.0 million impairment loss on real estate in continuing operations in connection with the excess of our carrying value over our estimated fair value of City Centre, a 266,000 square foot office property located in Jackson, Mississippi. During the year ended December 31, 2014, we recorded an $11.7 million impairment loss on real estate in connection with the excess of our carrying value over our estimated fair value of Raymond James Tower, a 337,000 square foot office property located in Memphis, Tennessee, which was classified as held for sale at December 31, 2014 and subsequently was sold on January 15, 2015.
Impairment Loss on Management Contracts. During the year ended December 31, 2014, we recorded a $4.8 million pre-tax non-cash impairment loss related to certain Eola management contracts. We did not record any impairment losses on management contracts during the year ended December 31, 2015.
General and Administrative Expense. General and administrative expense decreased $1.5 million, or 4.5%, for the year ended December 31, 2015, compared to the year ended December 31, 2014, and is primarily due to a decrease in share-based compensation expense. Compensation expense related to stock options, profits interest units ("LTIP units"), restricted shares, restricted share units ("RSUs") and deferred incentive share units of $6.5 million and $8.2 million was recognized during the years ended December 31, 2015 and 2014, respectively. Total compensation expense related to non-vested awards not yet recognized
46
was $5.5 million at December 31, 2015. The weighted average period over which this expense is expected to be recognized is approximately one year.
Acquisition Costs. During the year ended December 31, 2015, we incurred $2.1 million in acquisition costs compared to $3.5 million for the year ended December 31, 2014. The primary reason for the decrease is due to a decrease in the volume of acquisition activity during the year ended December 31, 2015 as compared to the year ended December 31, 2014.
Gain on Sale of In-Substance Real Estate. On December 19, 2013, we acquired TPGI's interest in the PKY/CalSTRS Austin LLC joint venture (the "Austin Joint Venture") as part of the Mergers. As of December 31, 2013, we and Madison International Realty, a New York based private equity firm ("Madison") owned a 50% interest in the Austin Joint Venture. On January 24, 2014, pursuant to a put right held by Madison, we purchased Madison’s approximately 17% interest in the Austin Joint Venture for a purchase price of approximately $41.5 million. On February 10, 2014, the California State Teachers' Retirement System ("CalSTRS") exercised an option to purchase 60% of Madison's former interest on the same terms that we acquired the interest from Madison for approximately $24.9 million. After giving effect to these transactions, we had a 40% interest in the Austin Joint Venture, with CalSTRS owning the remaining 60% and we recorded a gain of approximately $6.3 million during the year ended December 31, 2014.
Net Gains on Sale of Real Estate. Net gains on sale of real estate were $110.7 million and $76.4 million during the years ended December 31, 2015 and 2014, respectively.
Net Gains on Sale of Real Estate in 2015
On January 15, 2015, we sold the Raymond James Tower, an office property located in Memphis, Tennessee, for a gross sale price of $19.3 million, providing $8.9 million in buyer credits, and recognized a loss of approximately $117,000 during the year ended December 31, 2015.
On February 4, 2015, we sold the Honeywell Building, an office property located in Houston, Texas, for a gross sale price of $28.0 million, and recognized a gain of approximately $14.3 million during the year ended December 31, 2015.
On April 8, 2015, Fund II sold Two Ravinia Drive, an office property located in Atlanta, Georgia, for a gross sale price of $78.0 million, and recognized a gain of approximately $29.0 million during the year ended December 31, 2015, of which $8.7 million was our share.
On May 8, 2015, we sold 400 North Belt, an office property located in Houston, Texas, for a gross sale price of $10.2 million, and recognized a loss of approximately $1.2 million during the year ended December 31, 2015.
On May 13, 2015, we sold Peachtree Dunwoody, an office property located in Atlanta, Georgia, for a gross sale price of $53.9 million, and recognized a gain of approximately $14.5 million during the year ended December 31, 2015.
On June 5, 2015, we sold Hillsboro I-IV and V, office properties located in Ft. Lauderdale, Florida, for a gross sale price of $22.0 million, and recognized a gain of approximately $2.4 million during the year ended December 31, 2015.
On June 12, 2015, we sold Riverplace South, an office property located in Jacksonville, Florida, for a gross sale price of $9.0 million, and recognized a gain of approximately $466,000 during the year ended December 31, 2015.
On July 7, 2015, we sold Westshore Corporate Center and Cypress Center I-III, office properties located in Tampa, Florida, and Cypress Center IV, a parcel of land also located in Tampa, Florida, for a gross sale price of $66.0 million, and recognized a gain of approximately $19.2 million during the year ended December 31, 2015.
On July 16, 2015, Fund II sold 245 Riverside, an office property located in Jacksonville, Florida, for a gross sale price of $25.1 million, and recognized a gain of approximately $7.2 million during the year ended December 31, 2015, of which $2.2 million was our share.
On July 31, 2015, we sold 550 Greens Parkway, an office property located in Houston, Texas, for a gross sale price of $2.3 million, and recognized a gain of approximately $37,000 during the year ended December 31, 2015. During the year ended December 31, 2015, utilizing Level 2 fair value inputs, including our purchase and sale agreement dated July 24, 2015, we determined the carrying value of 550 Greens Parkway was not recoverable. As a result, we recognized an impairment loss on real
47
estate of $4.4 million for the difference between the carrying value and the estimated fair value during the year ended December 31, 2015.
On September 1, 2015, we sold Comerica Bank Building, an office property located in Houston, Texas, for a gross sale price of $31.4 million, and recognized a gain of approximately $13.0 million during the year ended December 31, 2015.
On September 3, 2015, we sold Squaw Peak I & II, an office property located in Phoenix, Arizona, for a gross sale price of $51.3 million, and recognized a gain of approximately $13.2 million during the year ended December 31, 2015.
On September 11, 2015, we sold One Commerce Green, an office property located in Houston, Texas, for a gross sale price of $47.5 million, providing $23.5 million in buyer credits, and recognized a loss of approximately $5.2 million during the year ended December 31, 2015.
On September 30, 2015, we sold City Centre, an office property located in Jackson, Mississippi, for a gross sale price of $6.2 million, and recognized a loss of approximately $108,000 during the year ended December 31, 2015. We recognized an impairment loss on real estate of $1.0 million for the difference between the carrying value and the estimated fair value during the year ended December 31, 2015.
On December 23, 2015, we sold Millenia Park One, an office property located in Orlando, Florida for a gross sales price of $28.2 million, and recognized a gain of approximately $3.5 million during the year ended December 31, 2015.
Net Gains on Sale of Real Estate in 2014
On September 4, 2014, we sold the Schlumberger Building located in Houston, Texas. We received approximately $17.0 million in gross proceeds. We received $16.2 million in net proceeds from the sale, which we used to fund subsequent acquisitions. We recorded a gain of approximately $6.7 million during the year ended December 31, 2014.
On October 6, 2014, Fund II sold Tempe Town Lake, a parcel of land zoned for a hotel development in Tempe, Arizona, for a gross sale price of $2.0 million. Fund II recognized a gain of $739,000, of which $221,700 was our share during the year ended December 31, 2014.
On November 17, 2014, we terminated the Austin Joint Venture. As part of the agreement, we acquired CalSTRS' 60% interest in San Jacinto Center and One Congress Plaza, resulting in 100% ownership of two assets, and we transferred our 40% interest in Frost Bank Tower, 300 West 6th Street and One American Center to CalSTRS. In connection with this transaction, we received net proceeds of approximately $43.6 million from CalSTRS and recognized a $52.8 million gain during the year ended December 31, 2014.
On December 29, 2014, we sold 525 North Tryon, an office property located in Charlotte, North Carolina, for a gross sale price of $60.0 million. We recognized a gain on the sale of approximately $16.1 million during the year ended December 31, 2014.
Gain on sale of unconsolidated property. On November 6, 2015, we and our joint venture partner sold 7000 Central Park for a gross sale price of $85.3 million. The joint venture recognized a gain on the sale of 7000 Central Park of approximately $30.5 million, and we recognized a gain on the sale of approximately $9.7 million during the year ended December 31, 2015.
Loss on Extinguishment of Debt. Loss on extinguishment of debt was $6.1 million and $2.4 million during the years ended December 31, 2015 and 2014, respectively.
On March 5, 2015, we repaid in full the first mortgage debt secured by the Westshore Corporate Center in Tampa, Florida, which had an outstanding balance of approximately $14.0 million. We recognized a gain on extinguishment of debt of $79,000 during the first quarter of 2015.
On April 3, 2015, we paid in full the $68.0 million Teachers Insurance and Annuity Associations mortgage debt secured by Hillsboro I-IV and V, Peachtree Dunwoody, One Commerce Green and the Comerica Bank Building and incurred a $3.0 million prepayment fee as part of the repayments.
On April 6, 2015, we paid in full the $31.9 million first mortgage secured by 3350 Peachtree and incurred a $319,000 prepayment fee as part of the repayment.
48
On April 8, 2015, Fund II paid in full the $22.1 million mortgage debt secured by Two Ravinia Drive and incurred a prepayment fee and swap early termination fee of $1.8 million as part of the repayment, of which $525,000 was our share.
On July 16, 2015, Fund II paid in full the $9.1 million mortgage debt secured by 245 Riverside and incurred a prepayment fee and swap early termination fee of $702,000 as part of the repayment, of which $210,000 was our share.
On December 22, 2015, we paid in full the $17.1 million first mortgage debt secured by 5300 Memorial and Town & Country and incurred a $503,000 prepayment fee as part of the repayment.
On April 8, 2014, we drew upon an unsecured term loan provided by the Amended, Restated and Consolidated Credit Agreement and simultaneously repaid in full the first mortgage debt secured by the Bank of America Center in Orlando, Florida, which had an outstanding balance of $33.9 million. We recognized a loss on extinguishment of debt of $339,000 during the year ended December 31, 2014.
On December 31, 2014, we repaid in full the first mortgage debt secured by the Raymond James Tower in Memphis, Tennessee, which had an outstanding balance of $7.9 million. We recognized a loss on extinguishment of debt of $2.1 million during the year ended December 31, 2014.
Interest Expense. Interest expense increased $5.4 million, or 8.1%, for the year ended December 31, 2015, compared to the year ended December 31, 2014 and is comprised of the following (in thousands):
Year Ended December 31, | |||||||||||||||
2015 | 2014 | Increase | % Change | ||||||||||||
Interest expense: | |||||||||||||||
Mortgage interest expense | $ | 64,491 | $ | 60,480 | $ | 4,011 | 6.6 | % | |||||||
Mortgage premium amortization | (12,024 | ) | (6,374 | ) | (5,650 | ) | 88.6 | % | |||||||
Credit facility interest expense | 15,902 | 9,143 | 6,759 | 73.9 | % | ||||||||||
Mortgage loan cost amortization | 1,203 | 1,286 | (83 | ) | (6.5 | )% | |||||||||
Credit facility cost amortization | 1,909 | 1,560 | 349 | 22.4 | % | ||||||||||
Total interest expense | $ | 71,481 | $ | 66,095 | $ | 5,386 | 8.1 | % | |||||||
Mortgage interest expense increased $4.0 million, or 6.6%, for the year ended December 31, 2015 compared to the year ended December 31, 2014, primarily due to approximately $52.0 million of mortgage debt assumed in connection with our 2015 acquisition of Two Buckhead Plaza as well as a full year of interest expense for mortgage debt placed or assumed during 2014 in connection with property acquisitions in 2014.
Credit facility interest expense increased $6.8 million, or 73.9%, for the year ended December 31, 2015 compared to the year ended December 31, 2014. The increase is due to an increase in year-to-date average borrowings of $326.7 million, partially offset by a decrease in the weighted average interest rate on average borrowings of 58 basis points.
49
Discontinued Operations. Discontinued operations are comprised of the following for the years ended December 31, 2015 and 2014 (in thousands):
Year Ended | |||||||
December 31, | |||||||
2015 | 2014 | ||||||
Statement of Operations: | |||||||
Revenues | |||||||
Income from office properties | $ | — | $ | 99 | |||
Expenses | |||||||
Property operating expenses | — | 373 | |||||
Management company expenses | — | 1 | |||||
Depreciation and amortization | — | 116 | |||||
Total expenses | — | 490 | |||||
Loss from discontinued operations | — | (391 | ) | ||||
Net gains on sale of real estate from discontinued operations | — | 10,463 | |||||
Total discontinued operations per Statement of Operations | — | 10,072 | |||||
Net income attributable to noncontrolling interest from discontinued operations | — | (352 | ) | ||||
Total discontinued operations – Parkway's Share | $ | — | $ | 9,720 | |||
With the exception of the 2013 impairment loss on real estate associated with the disposition of Mesa Corporate Center, all current and prior period income from the following office property dispositions is included in discontinued operations for the year ended December 31, 2014 (in thousands).
Office Properties | Location | Square Feet | Date of Sale | Net Sales Price | Net Book Value of Real Estate | Gain on Sale | Impairment Loss | ||||||||||||||||
2014 Dispositions (1) | |||||||||||||||||||||||
Woodbranch Building | Houston, TX | 109 | 01/14/2014 | $ | 14,424 | $ | 4,450 | $ | 9,974 | $ | — | ||||||||||||
Mesa Corporate Center (2) | Phoenix, AZ | 106 | 01/31/2014 | 12,257 | 11,768 | 489 | 5,600 | ||||||||||||||||
215 | $ | 26,681 | $ | 16,218 | $ | 10,463 | $ | 5,600 | |||||||||||||||
(1) | With the adoption of Financial Accounting Standards Board ("FASB") Accounting Standards Update ("ASU") 2014-08, "Reporting Discontinued Operations and Disposals of Components of an Entity" effective January 1, 2014, our 2014 sales of the Woodbranch Building and Mesa Corporate Center are included in discontinued operations for the year ended December 31, 2014 as these properties were previously classified as held for sale at December 31, 2013. |
(2) | The impairment loss on real estate recognized in discontinued operations during the year ended December 31, 2013 was comprised of a $4.6 million loss in connection with our Waterstone and Meridian properties that were sold in 2013 and a $5.6 million loss in connection with the valuation of Mesa Corporate Center based on our estimated fair value of the asset, and which was classified as held for sale at December 31, 2013. |
The income from properties disposed in 2015 is not recorded in discontinued operations as these properties did not represent a strategic shift in our operations pursuant to ASU 2014-08. See "—Financial Condition—Comparison of the year ended December 31, 2015 to the year ended December 31, 2014—Dispositions" above for additional information regarding the dispositions during the year ended December 31, 2015.
Income Taxes. The analysis below includes changes attributable to income tax benefit (expense) for the years ended December 31, 2015 and 2014 (in thousands):
Year Ended December 31, | |||||||||||||||
2015 | 2014 | $ Change | % Change | ||||||||||||
Income tax expense – current | $ | (1,540 | ) | $ | (4,902 | ) | $ | 3,362 | (68.6 | )% | |||||
Income tax (expense) benefit – deferred | (363 | ) | 4,763 | (5,126 | ) | *N/M | |||||||||
Total income tax expense | $ | (1,903 | ) | $ | (139 | ) | $ | (1,764 | ) | *N/M | |||||
*N/M – Not meaningful | |||||||||||||||
50
Current income tax expense decreased $3.4 million for the year ended December 31, 2015, compared to the year ended December 31, 2014. The decrease is primarily attributable to the decrease of income from the sale of Murano residential condominium units. Deferred income tax benefit decreased $5.1 million for the year ended December 31, 2015, compared to the year ended December 31, 2014. The decrease is primarily attributable to the book to tax differences related to the impairment loss associated with certain Eola management contracts and the reversal of a valuation allowance on the deferred tax assets in 2014.
Results of Operations
Comparison of the year ended December 31, 2014 to the year ended December 31, 2013.
Net income attributable to common stockholders for the year ended December 31, 2014 was $42.9 million ($0.42 per basic and diluted common share). Net loss attributable to common stockholders for the year ended December 31, 2013 was $29.7 million ($0.45 per basic and diluted common share). The increase in net income attributable to common stockholders for the year ended December 31, 2014 as compared to the year ended December 31, 2013 in the amount of $72.6 million is primarily attributable to gains on the sale of real estate of $93.1 million, including a gain of $52.8 million recognized on the termination of our Austin Joint Venture. These gains were offset by an impairment loss on real estate of $11.7 million and a pre-tax impairment loss on management contracts of $4.8 million. Gains on sale of real estate during the year ended December 31, 2013 were $32.5 million. The change in income (loss) from discontinued operations as well as other variances for income and expense items that comprise net income (loss) attributable to common stockholders is discussed in detail below.
Income from Office Properties. The analysis below includes changes attributable to same-store properties and acquisitions and dispositions of office properties. Same-store properties are consolidated properties that we owned for the current and prior year reporting periods, excluding properties classified as discontinued operations. At December 31, 2014, same-store properties consisted of 33 properties comprising 10.7 million square feet.
The following table represents revenue from office properties for the years ended December 31, 2014 and 2013 (in thousands):
Year Ended December 31, | |||||||||||||||
2014 | 2013 | Increase (Decrease) | % Change | ||||||||||||
Revenue from office properties: | |||||||||||||||
Same-store properties | $ | 253,335 | $ | 247,445 | $ | 5,890 | 2.4 | % | |||||||
Properties acquired | 145,892 | 6,182 | 139,710 | *N/M | |||||||||||
Properties disposed | 18,780 | 19,807 | (1,027 | ) | (5.2 | )% | |||||||||
Total revenue from office properties | $ | 418,007 | $ | 273,434 | $ | 144,573 | 52.9 | % | |||||||
*N/M – Not meaningful | |||||||||||||||
Revenue from office properties for same-store properties increased $5.9 million, or 2.4%, for the year ended December 31, 2014, compared to the year ended December 31, 2013. The primary reason for the increase is due to an increase in same-store average rental rates for same-store properties and an increase in average same-store occupancy for the year ended December 31, 2014, compared to the year ended December 31, 2013. Average same-store occupancy for the years ended December 31, 2014 and 2013 was 90.0% and 89.9%, respectively.
Property Operating Expenses. The following table represents property operating expenses for the years ended December 31, 2014 and 2013 (in thousands):
Year Ended December 31, | |||||||||||||||
2014 | 2013 | Increase (Decrease) | % Change | ||||||||||||
Expense from office properties: | |||||||||||||||
Same-store properties | $ | 98,690 | $ | 97,765 | $ | 925 | 0.9 | % | |||||||
Properties acquired | 60,132 | 1,489 | 58,643 | *N/M | |||||||||||
Properties disposed | 9,249 | 9,613 | (364 | ) | (3.8 | )% | |||||||||
Total expense from office properties | $ | 168,071 | $ | 108,867 | $ | 59,204 | 54.4 | % | |||||||
*N/M – Not meaningful | |||||||||||||||
51
Property operating expenses for same-store properties were consistent for the years ended December 31, 2014 and 2013.
Management Company Income and Expenses. Management company income increased $4.0 million during the year ended December 31, 2014, compared to the year ended December 31, 2013, and is primarily due to the addition of a management contract in connection with the Mergers as well as property management fees earned from our unconsolidated joint ventures. Management company expenses increased $881,000 during the year ended December 31, 2014, compared to the year ended December 31, 2013, and is primarily due to the addition of a management contract in connection with the Mergers and the associated increase in personnel costs.
Depreciation and Amortization. Depreciation and amortization expense attributable to office properties increased $64.9 million for the year ended December 31, 2014, compared to the year ended December 31, 2013. The primary reason for the increase is due to the purchase of three wholly owned office properties and properties acquired in connection with the Mergers during 2013, which were owned for a full year during 2014, in addition to the acquisition of ten wholly owned office properties during 2014, partially offset by the disposition of four office properties during 2014.
Impairment Loss on Real Estate. During the year ended December 31, 2014, we recorded an $11.7 million impairment loss on real estate in continuing operations in connection with our estimated fair value of Raymond James Tower, a 337,000 square foot office property located in Memphis, Tennessee, which was classified as held for sale at December 31, 2014 and subsequently was sold on January 15, 2015. We did not record any impairment losses on real estate in continuing operations for the year ended December 31, 2013.
Impairment Loss on Management Contracts. During the year ended December 31, 2014, we recorded a $4.8 million pre-tax non-cash impairment loss related to certain Eola management contracts.
General and Administrative Expense. General and administrative expense increased $7.0 million, or 27.3%, for the year ended December 31, 2014, compared to the year ended December 31, 2013. The increase is primarily due to additional share-based compensation expense. Compensation expense related to stock options, profits interest units ("LTIPS"), restricted shares and deferred incentive share units of $8.2 million and $5.7 million was recognized for the years ended December 31, 2014 and 2013, respectively. The primary reason for the increase in share-based compensation expense for the year ended December 31, 2014 was due to the additional expense associated with new grants under the Parkway Properties, Inc. and Parkway Properties LP 2013 Omnibus Equity Incentive Plan. Total compensation expense related to nonvested awards not yet recognized was $7.6 million at December 31, 2014. The weighted average period over which the expense is expected to be recognized is approximately one year.
Acquisition Costs. During the year ended December 31, 2014, we incurred $3.5 million in acquisition costs, compared to $13.1 million for the year ended December 31, 2013. The primary reason for the decrease is due to costs associated with the Mergers.
Gain on Sale of In-Substance Real Estate. On December 19, 2013, we acquired TPGI's interest in the Austin Joint Venture as part of the Mergers. As of December 31, 2013, we and Madison owned a 50% interest in the Austin Joint Venture. On January 24, 2014, pursuant to a put right held by Madison, we purchased Madison’s approximately 17% interest in the Austin Joint Venture for a purchase price of approximately $41.5 million. On February 10, 2014, CalSTRS exercised an option to purchase 60% of Madison's former interest on the same terms that we acquired the interest from Madison for approximately $24.9 million. After giving effect to these transactions, we had a 40% interest in the Austin Joint Venture, with CalSTRS owning the remaining 60%, and we recorded a gain of approximately $6.3 million during the year ended December 31, 2014.
Gain on Sale of Real Estate. On September 4, 2014, we sold the Schlumberger Building located in Houston, Texas. We received approximately $17.0 million in gross proceeds. We received $16.2 million in net proceeds from the sale, which we used to fund subsequent acquisitions. We recorded a gain of approximately $6.7 million during the year ended December 31, 2014.
On October 6, 2014, Fund II sold Tempe Town Lake, a parcel of land zoned for a hotel development in Tempe, Arizona, for a gross sale price of $2.0 million. During the year ended December 31, 2014, we recognized a gain of $739,000, of which $221,700 was our share.
52
On November 17, 2014, we and CalSTRS terminated the Austin Joint Venture in Austin, Texas. Pursuant to the transaction agreements, we acquired CalSTRS' 60% interest in San Jacinto Center and One Congress Plaza, resulting in 100% ownership of these two properties, and we transferred our 40% interest in Frost Bank Tower, 300 West 6th Street and One American Center to CalSTRS. We also received aggregate net proceeds of approximately $43.6 million from CalSTRS in connection with the transaction and recognized a $52.8 million gain during the year ended December 31, 2014.
On December 29, 2014, we sold 525 North Tryon, an office property located in Charlotte, North Carolina, for a gross sale price of $60.0 million. During the year ended December 31, 2014, we recognized a gain on the sale of 525 North Tryon of approximately $16.1 million.
Loss on Extinguishment of Debt. On April 8, 2014, we drew upon an unsecured term loan provided by the Amended, Restated and Consolidated Credit Agreement and simultaneously repaid in full the first mortgage debt secured by the Bank of America Center in Orlando, Florida, which had an outstanding balance of $33.9 million. We recognized a loss on extinguishment of debt of $339,000 during the year ended December 31, 2014.
On December 31, 2014, we repaid in full the first mortgage debt secured by the Raymond James Tower in Memphis, Tennessee, which had an outstanding balance of $7.9 million. We recognized a loss on extinguishment of debt of $2.1 million during the year ended December 31, 2014.
Interest Expense. Interest expense, including amortization of deferred financing costs, increased $20.5 million, or 44.9%, for the year ended December 31, 2014, compared to the year ended December 31, 2013, and is comprised of the following (in thousands):
Year Ended December 31, | |||||||||||||||
2014 | 2013 | Increase | % Change | ||||||||||||
Interest expense: | |||||||||||||||
Mortgage interest expense | $ | 60,480 | $ | 36,843 | $ | 23,637 | 64.2 | % | |||||||
Mortgage premium amortization | (6,374 | ) | — | (6,374 | ) | *N/M | |||||||||
Credit facility interest expense | 9,143 | 6,752 | 2,391 | 35.4 | % | ||||||||||
Mortgage loan cost amortization | 1,286 | 874 | 412 | 47.1 | % | ||||||||||
Credit facility cost amortization | 1,560 | 1,153 | 407 | 35.3 | % | ||||||||||
Total interest expense | $ | 66,095 | $ | 45,622 | $ | 20,473 | 44.9 | % | |||||||
*N/M – Not meaningful | |||||||||||||||
Mortgage interest expense increased $23.6 million, or 64.2%, for the year ended December 31, 2014, compared to the year ended December 31, 2013, primarily due to $301.3 million of mortgage debt assumed in connection with our 2014 acquisitions of One Orlando Centre, One Congress Plaza and San Jacinto Center, as well as a full year of interest expense for $534.8 million of mortgage debt placed or assumed during 2013 in connection with office property acquisitions in 2013, of which $321.0 million related to the Mergers.
Credit facility interest expense increased $2.4 million, or 35.4%, for the year ended December 31, 2014, compared to the year ended December 31, 2013. The increase is due to an increase in year-to-date average borrowings of $68.9 million and an increase in the weighted average interest rate on average borrowings of 65 basis points.
53
Discontinued Operations. Discontinued operations are comprised of the following for the years ended December 31, 2014 and 2013 (in thousands):
Year Ended | |||||||
December 31, | |||||||
2014 | 2013 | ||||||
Statement of Operations: | |||||||
Revenues | |||||||
Income from office properties | $ | 99 | $ | 14,976 | |||
99 | 14,976 | ||||||
Expenses | |||||||
Operating expenses | 373 | 6,835 | |||||
Management company expense | 1 | (39 | ) | ||||
Interest expense | — | 485 | |||||
Loss on extinguishment of debt | — | 2,149 | |||||
Depreciation and amortization | 116 | 4,561 | |||||
Impairment loss | — | 10,200 | |||||
490 | 24,191 | ||||||
Loss from discontinued operations | (391 | ) | (9,215 | ) | |||
Gain on sale of real estate from discontinued operations | 10,463 | 32,493 | |||||
Total discontinued operations per Statement of Operations | 10,072 | 23,278 | |||||
Net income attributable to noncontrolling interest from discontinued operations | (352 | ) | (13,443 | ) | |||
Total discontinued operations – Parkway's Share | $ | 9,720 | $ | 9,835 | |||
For 2013, impairment loss on real estate in discontinued operations was comprised of a $4.6 million loss in connection with our Waterstone and Meridian properties that were sold in 2013 and a $5.6 million loss in connection with the valuation of Mesa Corporate Center, a 106,000 square foot office property located in Phoenix, Arizona, based on our estimated fair value of the asset, and which was classified as held for sale at December 31, 2013.
All current and prior period income from the following office property dispositions is included in discontinued operations for the year ended December 31, 2013 (in thousands).
Office Properties | Location | Square Feet | Date of Sale | Net Sales Price | Net Book Value of Real Estate | Gain on Sale | Impairment Loss | ||||||||||||||||
Atrium at Stoneridge (1) | Columbia, SC | 108 | 03/20/2013 | $ | 2,966 | $ | 2,424 | $ | 542 | $ | 3,500 | ||||||||||||
Waterstone (2) | Atlanta, GA | 93 | 07/10/2013 | 3,247 | 3,207 | 40 | 3,000 | ||||||||||||||||
Meridian (2) | Atlanta, GA | 97 | 07/10/2013 | 6,615 | 6,560 | 55 | 1,600 | ||||||||||||||||
Bank of America Plaza | Nashville, TN | 436 | 07/17/2013 | 41,093 | 29,643 | 11,450 | — | ||||||||||||||||
Lakewood II | Atlanta, GA | 123 | 10/31/2013 | 10,240 | 4,403 | 5,837 | — | ||||||||||||||||
Carmel Crossing | Charlotte, NC | 326 | 11/08/2013 | 36,673 | 22,104 | 14,569 | — | ||||||||||||||||
2013 Dispositions (3) | 1,183 | $ | 100,834 | $ | 68,341 | $ | 32,493 | $ | 8,100 | ||||||||||||||
Woodbranch Building | Houston, TX | 109 | 01/14/2014 | $ | 14,424 | $ | 4,450 | $ | 9,974 | $ | — | ||||||||||||
Mesa Corporate Center (2) | Phoenix, AZ | 106 | 01/31/2014 | 12,257 | 11,768 | 489 | 5,600 | ||||||||||||||||
2014 Dispositions | 215 | $ | 26,681 | $ | 16,218 | $ | 10,463 | $ | 5,600 | ||||||||||||||
(1) | The impairment loss on real estate in connection with Atrium at Stoneridge was recognized in discontinued operations during the year ended December 31, 2012. |
(2) | The impairment loss on real estate recognized in discontinued operations during the year ended December 31, 2013 was comprised of a $4.6 million loss in connection with our Waterstone and Meridian properties that were sold in 2013 and a $5.6 million loss in connection with the valuation of Mesa Corporate Center based on our estimated fair value of the asset, and which was classified as held for sale at December 31, 2013. |
(3) | Total gain on the sale of real estate in discontinued operations recognized for the year ended December 31, 2013 was $32.5 million, of which $18.2 million was our proportionate share. |
In accordance with our adoption of FASB ASU 2014-08, "Reporting Discontinued Operations and Disclosures of Disposals of Components of an Entity," effective January 1, 2014, the sales of the Schlumberger Building and 525 North Tryon were not included in discontinued operations as they were not previously classified as held for sale as of December 31, 2013 and did not represent a strategic shift in our operations.
54
Income Taxes. The analysis below includes changes attributable to income tax benefit (expense) for the years ended December 31, 2014 and 2013 (in thousands):
Year Ended December 31, | ||||||||||||||
2014 | 2013 | $ Change | % Change | |||||||||||
Income tax expense – current | $ | (4,902 | ) | $ | (555 | ) | $ | (4,347 | ) | *N/M | ||||
Income tax benefit – deferred | 4,763 | 1,960 | 2,803 | *N/M | ||||||||||
Total income tax benefit (expense) | $ | (139 | ) | $ | 1,405 | $ | (1,544 | ) | *N/M | |||||
*N/M – Not meaningful | ||||||||||||||
Current income tax expense increased $4.3 million for the year ended December 31, 2014, compared to the year ended December 31, 2013. The increase is primarily attributable to an increase in income from our taxable REIT subsidiary and additional state taxes associated with our increased concentration in Pennsylvania and Texas as a result of the Mergers. Deferred income tax benefit increased $2.8 million for the year ended December 31, 2014, compared to the year ended December 31, 2013. The increase is primarily attributable to the book to tax differences related to the impairment loss associated with certain Eola management contracts and the reversal of a valuation allowance on the deferred tax assets in 2014.
Liquidity and Capital Resources
General
Our principal short-term and long-term liquidity needs include:
• | funding operating and administrative expenses; |
• | meeting debt service and debt maturity obligations; |
• | funding normal repair and maintenance expenses at our properties; |
• | funding capital improvements; |
• | funding tenant improvements, leasing commissions and other leasing costs; |
• | funding the development costs for development projects; |
• | acquiring additional investments that meet our investment criteria; and |
• | funding distributions to stockholders. |
We may fund these liquidity needs by drawing on multiple sources, including the following:
• | our current cash balance; |
• | our operating cash flows; |
• | borrowings (including borrowings under our senior unsecured revolving credit facility and borrowings from the placement of new unsecured term loans); |
• | proceeds from the placement of new mortgage loans and refinancing of existing mortgage loans; |
• | proceeds from the sale of assets and the sale of portions of assets owned through joint ventures; and |
• | the sale of equity or debt securities. |
Our short-term liquidity needs include funding operations and administrative expenses, normal repair and maintenance expenses at our properties, capital improvements, funding the development costs for our development properties and distributions to stockholders. We anticipate using our current cash balance, our operating cash flows and borrowings (including borrowings available under our senior unsecured revolving credit facility) to meet our short-term liquidity needs. We have received an investment grade rating which may positively impact our ability to access capital on favorable terms.
Our long-term liquidity needs include the principal amount of our long-term debt as it matures, significant capital expenditures that need to be made at our properties and acquiring additional investments that meet our investment criteria. We anticipate using proceeds from the placement of new mortgage loans and refinancing of existing mortgage loans, proceeds from the sale of assets and the portions of owned assets through joint ventures, and the possible sale of equity or debt securities to meet our long-term liquidity needs. We anticipate that these funding sources will be adequate to meet our liquidity needs.
55
Cash
Cash and cash equivalents were $75.0 million and $116.2 million at December 31, 2015 and 2014, respectively. Cash flows provided by operating activities for the years ended December 31, 2015 and 2014 were $82.6 million and $53.0 million, respectively. The increase in cash flows from operating activities of $29.6 million is primarily attributable to timing of receipt of revenues and payment of expenses.
Cash provided by investing activities was $105.9 million for the year ended December 31, 2015. Cash used in investing activities was $412.2 million for the year ended December 31, 2014. The increase in cash provided by (used in) investing activities of $518.1 million is primarily due to a decrease in investment in real estate and increases in proceeds from the sale of real estate and distributions of capital from unconsolidated joint ventures, partially offset by an increase in improvements to real estate and an increase in real estate development associated with Fund II's Hayden Ferry Lakeside III construction.
Cash used in financing activities was $229.8 million for the year ended December 31, 2015. Cash provided by financing activities was $416.7 million for the year ended December 31, 2014. The decrease in cash provided by (used in) financing activities of $646.5 million is primarily attributable to a decrease in proceeds from common stock offerings, net of offering costs, increases in payments on mortgage notes payable, including our paydowns of the Westshore Corporate Center, 3350 Peachtree, Two Ravinia Drive, 245 Riverside, John Hancock Facility and Teachers Insurance and Annuity Associations mortgages, and decreases in net proceeds received from bank borrowings.
Indebtedness.
Notes Payable to Banks. At December 31, 2015, we had a total of $550.0 million outstanding under the following credit facilities (in thousands):
Credit Facilities | Interest Rate | Initial Maturity | Outstanding Balance | ||||||
$10.0 Million Working Capital Revolving Credit Facility | 1.7 | % | 03/30/2018 | $ | — | ||||
$450.0 Million Revolving Credit Facility | 1.5 | % | 03/30/2018 | — | |||||
$250.0 Million Five-Year Term Loan | 2.6 | % | 03/29/2019 | 250,000 | |||||
$200.0 Million Five-Year Term Loan | 1.5 | % | 06/26/2020 | 200,000 | |||||
$100.0 Million Seven-Year Term Loan | 4.4 | % | 03/31/2021 | 100,000 | |||||
$ | 550,000 | ||||||||
Effective April 1, 2014, we entered into an Amended, Restated and Consolidated Credit Agreement (the "Amended Agreement") which provides for a $250.0 million senior unsecured revolving credit facility, a $250.0 million five-year unsecured term loan, and a $100.0 million seven-year unsecured term loan. On January 27, 2015, we exercised the accordion feature under our senior unsecured revolving credit facility to increase the facility by $200.0 million to $450.0 million. All other terms and covenants associated with the senior unsecured revolving credit facility remained unchanged as a result of the increase.
The maturity date of the senior unsecured revolving credit facility was extended to March 30, 2018, with an additional one-year extension option, and the $250.0 million five-year unsecured term loan and $100.0 million seven-year unsecured term loan have maturity dates of March 29, 2019 and March 31, 2021, respectively.
On June 26, 2015, we entered into a term loan agreement for a $200.0 million five-year unsecured term loan. The unsecured term loan has a maturity date of June 26, 2020, and has an accordion feature that allows for an increase in the size of the unsecured term loan to as much as $400.0 million. Interest on the unsecured term loan is based on LIBOR plus an applicable margin of 0.90% to 1.75% depending on our highest credit rating (with the current rate set at 1.35%). The unsecured term loan has substantially the same operating and financial covenants as required by our $450.0 million senior unsecured revolving credit facility.
The senior unsecured revolving credit facility and unsecured term loans bear interest at LIBOR plus an applicable margin. As a result of the investment grade credit ratings we received in January 2015 from the Standard & Poor's Ratings Services and Moody's Investors Service, we have changed to a different pricing grid under our existing credit agreement that is based on our most recent credit rating. The new applicable margin for the senior unsecured revolving credit facility is currently 1.30% resulting in an all-in rate of 1.49%. The new applicable margin for the $250.0 million five-year unsecured term loan is currently 1.40% resulting in a weighted average all-in rate of 2.56%, after giving effect to the floating-to-fixed-rate interest rate swaps. The new applicable margin for the $100.0 million seven-year unsecured term loan is currently 1.85%, resulting in an all-in rate of 4.41%, after accounting for the floating-to-fixed-rate interest rate swap.
56
For a discussion of interest rate swaps entered into in connection with our unsecured term loans and senior unsecured revolving credit facility, see "Note 7—Capital and Financing Transactions—Interest Rate Swaps" in our financial statements included elsewhere in this Annual Report on Form 10-K.
We monitor a number of leverage and other financial metrics including, but not limited to, debt to total asset value ratio, as defined in the loan agreements for our senior unsecured revolving credit facility. In addition, we also monitor interest and fixed charge coverage ratios, as well as the net debt to Adjusted EBITDA multiple. The interest coverage ratio is computed by comparing the cash interest accrued to Adjusted EBITDA. The interest coverage ratio for the years ended December 31, 2015 and 2014 was 3.9 and 3.6 times, respectively. The fixed charge coverage ratio is computed by comparing the cash interest accrued, principal payments made on mortgage loans and preferred dividends paid to Adjusted EBITDA. The fixed charge coverage ratio for the years ended December 31, 2015 and 2014 was 3.3 and 3.1 times, respectively. The net debt to Adjusted EBITDA multiple is computed by comparing our share of net debt to Adjusted EBITDA for the current quarter, as annualized and adjusted pro forma for any completed investment activities. The net debt to Adjusted EBITDA multiple for the years ended December 31, 2015 and 2014 was 6.4 and 6.1 times, respectively. Management believes various leverage and other financial metrics it monitors provide useful information on total debt levels as well as our ability to cover interest, principal and/or preferred dividend payments.
Mortgage Notes Payable. At December 31, 2015, we had $1.2 billion in mortgage notes payable secured by office properties, with an average interest rate of 4.0%.
The table below presents the principal payments due and weighted average interest rates for total mortgage notes payable, at December 31, 2015 (in thousands).
Weighted Average Interest Rate | Total Mortgage Maturities | Balloon Payments | Principal Amortization | |||||||||||
Schedule of Mortgage Maturities by Years: | ||||||||||||||
2016 | 3.6% | $ | 175,849 | $ | 161,407 | $ | 14,442 | |||||||
2017 | 3.7% | 426,356 | 412,397 | 13,959 | ||||||||||
2018 | 3.9% | 209,724 | 193,500 | 16,224 | ||||||||||
2019 | 4.9% | 146,435 | 138,632 | 7,803 | ||||||||||
2020 | 4.8% | 115,156 | 110,335 | 4,821 | ||||||||||
Thereafter | 3.9% | 144,938 | 135,141 | 9,797 | ||||||||||
Total principal maturities | 1,218,458 | $ | 1,151,412 | $ | 67,046 | |||||||||
Fair value premiums on mortgage debt acquired, net | N/A | 19,878 | ||||||||||||
Total principal maturities and fair value premium on mortgage debt acquired | 4.0 | % | $ | 1,238,336 | ||||||||||
Fair value at December 31, 2015 | $ | 1,235,553 | ||||||||||||
On March 5, 2015, we extinguished the mortgage note payable associated with Westshore Corporate Center. The balance at the date of payoff was approximately $14.0 million. We recognized a gain on extinguishment of debt of approximately $79,000.
On April 3, 2015, we paid in full the $68.0 million Teachers Insurance and Annuity Associations mortgage debt secured by Hillsboro I-IV and V, Peachtree Dunwoody, One Commerce Green and the Comerica Bank Building and incurred a $3.0 million prepayment fee as part of the repayments.
On April 6, 2015, we paid in full the $31.9 million first mortgage secured by 3350 Peachtree and incurred a $319,000 prepayment fee as part of the repayment.
On April 8, 2015, Fund II paid in full the $22.1 million mortgage debt secured by Two Ravinia Drive and incurred a prepayment fee and swap early termination fee of $1.8 million as part of the repayment, of which $525,000 was our share.
On July 16, 2015, Fund II paid in full the $9.1 million mortgage debt secured by 245 Riverside and incurred a prepayment fee and swap early termination fee of $702,000 as part of the repayment, of which $210,000 was our share.
On October 1, 2015, we assumed the $52.0 million first mortgage secured by Two Buckhead Plaza. The loan has an interest rate of 6.43% and matures on October 1, 2017.
57
On December 22, 2015, we paid in full the $17.1 million mortgage debt secured by 5300 Memorial and Town & Country and incurred a $503,000 prepayment fee as part of the repayments.
Market Risk
Our cash flows are exposed to interest rate changes primarily as a result of our senior unsecured revolving credit facility and term loans which have a floating interest rate tied to LIBOR. Our interest rate risk management objective is to appropriately limit the impact of interest rate changes on cash flows and to lower our overall borrowing costs. To achieve our objectives, we borrow at fixed rates when possible. In addition, we entered into and will from time to time enter into interest rate swap agreements. However, interest rate swap agreements and other hedging arrangements may expose us to additional risks, including a risk that a counterparty to a hedging arrangement may fail to honor our obligations. Developing an effective interest rate risk strategy is complex and no strategy can completely insulate us from risks associated with interest rate fluctuations. There can be no assurance that our hedging activities will have the desired beneficial impact on our results of operations or financial condition.
We designated the swaps as cash flow hedges of the variable interest rates on our $250.0 million unsecured term loan, our $100.0 million unsecured term loan, and the debt secured by 245 Riverside, Corporate Center IV, Two Ravinia Drive, Hayden Ferry Lakeside I and Hayden Ferry Lakeside II.
Our interest rate hedge contracts at December 31, 2015 and 2014 are summarized as follows (in thousands):
Asset (Liability) Balance | |||||||||||||||||||||
Current | December 31, | ||||||||||||||||||||
Type of Hedge | Balance Sheet Location | Associated Loan | Notional Amount | Maturity Date | Reference Rate | Fixed Rate | 2015 | 2014 | |||||||||||||
Swap | Receivables and Other Assets | 5-year term loan | 50,000 | 09/27/2017 | 1-month LIBOR | 0.7% | $ | 190 | $ | 452 | |||||||||||
Swap | Account payable and other liabilities | 5-year term loan | 120,000 | 06/11/2018 | 1-month LIBOR | 1.6% | (1,515 | ) | (1,438 | ) | |||||||||||
Swap | Account payable and other liabilities | Corporate Center IV | 13,475 | 10/08/2018 | 1-month LIBOR | 3.3% | (68 | ) | (18 | ) | |||||||||||
Swap | Receivables and Other Assets | 5-year term loan | 75,000 | 09/27/2017 | 1-month LIBOR | 0.7% | 284 | 679 | |||||||||||||
Swap | Account payable and other liabilities | Hayden Ferry Lakeside II | 4,316 | 01/25/2018 | 1-month LIBOR | 1.7% | (61 | ) | (71 | ) | |||||||||||
Swap | Account payable and other liabilities | Hayden Ferry Lakeside I | 21,536 | 01/25/2018 | 1-month LIBOR | 4.5% | (655 | ) | (877 | ) | |||||||||||
Swap | Account payable and other liabilities | Hayden Ferry Lakeside II | 41,747 | 01/25/2018 | 1-month LIBOR | 1.5% | (392 | ) | (413 | ) | |||||||||||
Swap | Account payable and other liabilities | 245 Riverside | 9,166 | 09/30/2018 | 1-month LIBOR | 5.2% | — | (617 | ) | ||||||||||||
Swap | Account payable and other liabilities | Corporate Center IV | 22,016 | 10/08/2018 | 1-month LIBOR | 5.4% | (1,295 | ) | (1,613 | ) | |||||||||||
Swap | Account payable and other liabilities | Two Ravinia Drive | 22,100 | 11/18/2018 | 1-month LIBOR | 5.0% | — | (1,317 | ) | ||||||||||||
Swap | Account payable and other liabilities | 5-year term loan | 5,000 | 04/01/2019 | 1-month LIBOR | 1.7% | (76 | ) | (60 | ) | |||||||||||
Swap | Account payable and other liabilities | 7-year term loan | 100,000 | 03/31/2021 | 1-month LIBOR | 2.6% | (4,964 | ) | (4,652 | ) | |||||||||||
$ | (8,552 | ) | $ | (9,945 | ) | ||||||||||||||||
We designated these swaps as cash flow hedges of the variable interest payments associated with the loans.
Equity
We have a universal shelf registration statement on Form S-3 (No. 333-193203) that was automatically effective upon filing on January 6, 2014. We may offer an indeterminate number or amount, as the case may be, of (1) shares of common stock, par value $.001 per share; (2) shares of preferred stock, par value $.001 per share; (3) depository shares representing our preferred stock; (4) warrants to purchase common stock, preferred stock or depository shares representing preferred stock; and (5) rights to purchase our common stock, all of which may be issued from time to time on a delayed or continuous basis pursuant to Rule 415 under the Securities Act.
58
We may issue equity securities from time to time, including units issued by our Operating Partnership in connection with property acquisitions, as management may determine necessary or appropriate to satisfy our liquidity needs, taking into consideration market conditions, our stock price, the cost and availability of other sources of liquidity and any other relevant factors.
On May 28, 2014, we entered into an ATM Equity OfferingSM Sales Agreement (the "Sales Agreement") with various agents whereby we may sell, from time to time, shares of our common stock, par value $.001 per share, having aggregate gross sales proceeds of up to $150.0 million through an "at-the-market" equity offering program. Sales may be made to the agents in their capacity as sales agents or as principals. We intend to use the net proceeds for general corporate purposes, which may include repaying temporarily amounts outstanding from time to time under our senior unsecured revolving credit facility, for working capital and capital expenditures, and to fund potential acquisitions or development of office properties. We are required to pay each agent a commission that will not exceed, but may be lower than, 2.0% of the gross sales price of the shares sold through such agent. During the year ended December 31, 2015, we did not sell any shares of common stock under our Sales Agreement.
Capital Expenditures
We presently have plans to make recurring capital expenditures to our office properties during 2016 of approximately $54.0 million to $59.0 million on a consolidated basis, with approximately $44.0 million to $49.0 million representing our share, including expenditures for unconsolidated joint ventures. During the year ended December 31, 2015, we incurred $52.7 million in recurring capital expenditures on a consolidated basis, with $35.0 million representing our share. These costs include tenant improvements, leasing costs and recurring building improvements. Additionally, we presently have plans to make improvements related to upgrades on consolidated properties acquired in recent years that were anticipated at the time of purchase in 2015 of approximately $57.0 million to $62.0 million on a consolidated and at share basis. During the year ended December 31, 2015, we incurred $92.6 million related to upgrades on properties acquired in recent years that were anticipated at the time of purchase and major renovations that are nonrecurring in nature to office properties, with $94.1 million representing our share, including unconsolidated joint ventures. All such improvements were financed, or will be financed, with cash flow from the properties, capital expenditure escrow accounts, borrowings under our senior unsecured revolving credit facility and contributions from joint venture partners.
During the year ended December 31, 2015, Fund II incurred $37.3 million in development costs related to the construction of Hayden Ferry Lakeside III, a planned office development in the Tempe submarket of Phoenix, Arizona. Costs related to planning, developing, leasing and constructing the property, including costs of development personnel working directly on projects under development, are capitalized. We own a 70% indirect controlling interest in Hayden Ferry Lakeside III.
Dividends
During 2015, we paid $87.5 million in dividends, $83.8 million to our common stockholders and $3.7 million to the common unit holders of our Operating Partnership. These dividends and distributions were funded with cash flow from the properties, proceeds from the sales of properties, and borrowings on our senior unsecured revolving credit facility. For additional information on our distribution policy, see "Item 5. Market for Registrant's Common Equity, Related Stockholder Matters and Issuer Purchases of Equity Securities—Market Price of and Dividends on the Issuer's Common Equity."
Contractual Obligations
We have contractual obligations including mortgage notes payable and lease obligations. The table below presents total payments due under specified contractual obligations by year through maturity at December 31, 2015 (in thousands):
Payments Due By Period | |||||||||||||||||||||||||||
Contractual Obligations | 2016 | 2017 | 2018 | 2019 | 2020 | Thereafter | Total | ||||||||||||||||||||
Long-term debt principal and interest payments (1) | $ | 248,700 | $ | 727,924 | $ | 243,954 | $ | 168,910 | $ | 328,216 | $ | 258,679 | $ | 1,976,383 | |||||||||||||
Operating leases | 163 | 122 | 72 | 9 | — | — | 366 | ||||||||||||||||||||
Ground lease payments | 1,264 | 1,294 | 1,294 | 1,294 | 1,296 | 91,378 | 97,820 | ||||||||||||||||||||
Purchase obligations (tenant improvements and lease commissions) | 56,708 | 2,377 | 10 | 114 | 3,007 | 25 | 62,241 | ||||||||||||||||||||
Total | $ | 306,835 | $ | 731,717 | $ | 245,330 | $ | 170,327 | $ | 332,519 | $ | 350,082 | $ | 2,136,810 | |||||||||||||
(1) Variable interest payments are calculated using the rate at December 31, 2015.
59
The amounts presented above for long-term debt include principal and interest payments, including principal payments under our $250.0 million unsecured five-year term loan which matures on March 29, 2019, our $200 million unsecured five-year term loan which matures on June 26, 2020, and our $100 million unsecured seven-year term loan which matures on March 31, 2021. The amounts presented for purchase obligations represent the remaining tenant improvement allowances and lease commissions for leases in place at December 31, 2015.
Off-Balance Sheet Arrangements
Our off-balance sheet arrangements are discussed in Note 4 “Investment in Unconsolidated Joint Ventures” and Note 17 “Commitments and Contingencies” of the accompanying consolidated financial statements
Critical Accounting Policies and Estimates
General. Our investments are generally made in office properties. Therefore, we are generally subject to risks incidental to the ownership of real estate. Some of these risks include changes in supply or demand for office properties or customers for such properties in an area in which we have buildings; changes in real estate tax rates; and changes in federal income tax, real estate and zoning laws. Our discussion and analysis of financial condition and results of operations is based upon our consolidated financial statements. Our consolidated financial statements include the accounts of Parkway Properties, Inc., our majority owned subsidiaries and joint ventures in which we have a controlling interest. We also consolidate subsidiaries where the entity is a variable interest entity and we are the primary beneficiary. The preparation of financial statements in conformity with accounting principles generally accepted in the United States of America ("GAAP") requires us to make estimates and assumptions that affect the reported amounts of assets and liabilities at the date of the financial statements and the reported amounts of revenues and expenses for the reporting period. Actual results could differ from our estimates.
The accounting policies and estimates used in the preparation of our consolidated financial statements are more fully described in the notes to our consolidated financial statements. However, certain of our significant accounting policies are considered critical accounting policies due to the increased level of assumptions used or estimates made in determining their impact on our consolidated financial statements.
We consider critical accounting policies and estimates to be those used in the determination of the reported amounts and disclosure related to the following:
(1) Revenue recognition;
(2) Impairment of long-lived assets;
(3) Depreciable lives applied to real estate and improvements to real estate;
(4) Initial recognition, measurement and assignment of the cost of real estate acquired; and
(5) Share-based compensation.
Revenue Recognition. Revenue from real estate rentals is recognized on a straight-line basis over the terms of the respective leases. The cumulative difference between lease revenue recognized under this method and contractual lease payment terms is recorded as straight line rent receivable on the accompanying balance sheets.
When we are the owner of the tenant improvements, the leased space is ready for its intended use when the tenant improvements are substantially completed, at which point revenue recognition begins. In limited instances, when the tenant is the owner of the tenant improvements, straight-line rent is recognized when the tenant takes possession of the unimproved space.
The leases also typically provide for tenant reimbursement of a portion of common area maintenance, real estate taxes and other operating expenses. Property operating cost recoveries from customers ("expense reimbursements") are recognized as revenue in the period in which the expenses are incurred. The computation of expense reimbursements is dependent on the provisions of individual customer leases. Most customers make monthly fixed payments of estimated expense reimbursements. We make adjustments, positive or negative, to expense reimbursement income quarterly to adjust the recorded amounts to our best estimate of the final property operating costs based on the most recent annual estimate. After the end of the calendar year, we compute each customer's final expense reimbursements and issue a bill or credit for the difference between the actual amount and the amounts billed monthly during the year. Differences between actual billed amounts and accrued amounts are considered immaterial.
60
Management company income represents market-based fees earned from providing management, construction, leasing, brokerage, and acquisition services to unconsolidated joint ventures, related parties, and third parties. Management fee income is computed and recorded monthly in accordance with the terms set forth in the management service agreements. Leasing and brokerage commissions, as well as salary and administrative fees, are recognized pursuant to the terms of the agreements at the time underlying leases are signed, which is the point at which the earnings process is complete and collection of the fees is reasonably assured. Fees relating to the purchase or sale of property are recognized when the earnings process is complete and the collection of fees is reasonably assured, which usually occurs at closing. All fees on Company-owned properties and consolidated joint ventures are eliminated in consolidation. We recognize our share of fees earned from unconsolidated joint ventures in management company income.
We recognize gains or losses on sales of real estate at times and in amounts determined in accordance with the accounting guidance for sales of real estate. The guidance takes into account the terms of the transaction and any continuing involvement, including in the form of management, leasing of space or financial assistance associated with the properties. If the sales criteria for the full accrual method are not met, then we defer gain recognition and account for the transaction by applying the deposit, finance, installment or cost recovery methods, as appropriate.
Impairment of Long-Lived Assets. Changes in the supply or demand of customers for our properties could impact our ability to fill available space. Should a significant amount of available space exist for an extended period, our investment in a particular office building may be impaired. We evaluate our real estate assets and intangible assets upon the occurrence of significant adverse changes to assess whether any impairment indicators are present that affect the recovery of the carrying amount.
We classify certain assets as held for sale based on management having the authority and intent of entering into commitments for sale transactions to close in the next twelve months. We consider an office property as held for sale once we have executed a contract for sale, allowed the buyer to complete its due diligence review and received a substantial non-refundable deposit. Until a buyer has completed its due diligence review of the asset, necessary approvals have been received and substantive conditions to the buyer's obligation to perform have been satisfied, we do not consider a sale to be probable. When we identify an asset as held for sale, we estimate the net realizable value of such asset and discontinue recording depreciation on the asset. We record assets held for sale at the lower of carrying amount or fair value less cost to sell. If the fair value of the asset net of estimated selling costs is less than the carrying amount, we record an impairment loss. With respect to assets classified as held and used, we recognize an impairment loss if the carrying amount is not recoverable and exceeds the sum of undiscounted future cash flows expected to result from the use and eventual disposition of the asset. Upon impairment, we recognize an impairment loss to reduce the carrying value of the real estate asset to the estimate of its fair value. The cash flow and fair value estimates are based on assumptions about employing the asset for its remaining useful life. Factors considered in projecting future cash flows include, but are not limited to: existing leases, future leasing and terminations, market rental rates, capital improvements, tenant improvements, leasing commissions, inflation, discount rates, capitalization rates and other known variables.
Depreciable Lives Applied to Real Estate and Improvements to Real Estate. Depreciation of buildings and parking garages is computed using the straight-line method over an estimated useful life of 40 years. Depreciation of building improvements is computed using the straight-line method over the estimated useful life of the improvement. If our estimate of useful lives proves to be incorrect, the depreciation expense recognized would also be incorrect. Therefore, a change in the estimated useful lives assigned to buildings and improvements would result in either an increase or decrease in depreciation expense prospectively, which would result in a decrease or increase in earnings.
Initial Recognition, Measurement and Assignment of the Cost of Real Estate Acquired. We account for our acquisitions of real estate by allocating the fair value of real estate to acquired tangible assets, consisting of land, building, garage, building improvements and tenant improvements, identified intangible assets and liabilities, which consist of the value of above and below market leases, lease costs, the value of in-place leases and any value attributable to above or below market debt assumed with the acquisition.
We assign the purchase price of properties to tangible and intangible assets based on fair values. We determine the fair value of the tangible and intangible components using a variety of methods and assumptions all of which result in an approximation of fair value. Differing assumptions and methods could result in different estimates of fair value and thus, a different purchase price assignment and corresponding increase or decrease in depreciation and amortization expense.
Share Based Compensation. We account for share-based employee compensation plans under the fair value recognition and measurement provisions in accordance with applicable accounting standards, which require all share-based payments to employees to be measured based on the grant-date fair value of the awards.
61
Recent Accounting Pronouncements
See information appearing under the caption "—Recent Accounting Pronouncements—" in "Note 1—Summary of Significant Accounting Policies" for a discussion of the recent accounting pronouncements not yet adopted by us.
Funds From Operations ("FFO"), Recurring FFO and Funds Available for Distribution ("FAD")
Management believes that FFO is an appropriate measure of performance for equity REITs and computes this measure in accordance with the NAREIT definition of FFO (including any guidance that NAREIT releases with respect to the definition). FFO is defined by NAREIT as net income (computed in accordance with GAAP), reduced by preferred dividends, excluding gains or losses from sale of previously depreciable real estate assets, impairment charges related to depreciable real estate under GAAP, plus depreciation and amortization related to depreciable real estate, and after adjustments to derive our pro rata share of FFO of consolidated and unconsolidated joint ventures. Further, we do not adjust FFO to eliminate the effects of non-recurring charges. We believe that FFO is a meaningful supplemental measure of our operating performance because historical cost accounting for real estate assets in accordance with GAAP implicitly assumes that the value of real estate assets diminishes predictably over time, as reflected through depreciation and amortization expenses. However, since real estate values have historically risen or fallen with market and other conditions, many industry investors and analysts have considered presentation of operating results for real estate companies that use historical cost accounting to be insufficient. Thus, NAREIT created FFO as a supplemental measure of operating performance for REITs that excludes historical cost depreciation and amortization, among other items, from net income, as defined by GAAP. We believe that the use of FFO, combined with the required GAAP presentations, has been beneficial in improving the understanding of operating results of REITs among the investing public and making comparisons of operating results among such companies more meaningful. FFO as reported by us may not be comparable to FFO reported by other REITs that do not define the term in accordance with the current NAREIT definition. FFO does not represent cash generated from operating activities in accordance with GAAP and is not an indication of cash available to fund cash needs. FFO should not be considered an alternative to net income as an indicator of our operating performance or as an alternative to cash flow as a measure of liquidity. FFO measures 100% of the operating performance of Parkway Properties LP in which Parkway Properties, Inc. owns an interest.
The following table presents a reconciliation of net income for Parkway Properties, Inc. and attributable to common stockholders to FFO attributable to the Operating Partnership for the years ended December 31, 2015 and 2014 (in thousands):
Year Ended | ||||||||
December 31, | ||||||||
2015 | 2014 | |||||||
Net income for Parkway Properties, Inc. and attributable to common stockholders | $ | 67,335 | $ | 42,943 | ||||
Adjustments to derive FFO attributable to the Operating Partnership: | ||||||||
Depreciation and amortization (Parkway's share) | 175,802 | 179,797 | ||||||
Noncontrolling interest - unit holders | 2,947 | 2,089 | ||||||
Impairment loss on real estate | 5,400 | 11,700 | ||||||
Net gains on sale of real estate (Parkway's share) | (85,366 | ) | (82,150 | ) | ||||
Net gains on sale of real estate - discontinued operations (Parkway's share) | — | (10,463 | ) | |||||
Gain on sale of unconsolidated property (Parkway's share) | (9,754 | ) | — | |||||
FFO attributable to the Operating Partnership | $ | 156,364 | $ | 143,916 | ||||
In addition to FFO, we also disclose recurring FFO ("Recurring FFO"), which excludes our share of non-cash adjustments for interest rate swaps, realignment expenses, adjustments for non-recurring lease termination fees, gains and losses on extinguishment of debt, acquisition costs, or other unusual items. Although this is a non-GAAP measure that differs from NAREIT’s definition of FFO, we believe it provides a meaningful presentation of operating performance because it allows investors to compare our operating performance to our performance in prior reporting periods without the effect of items that by their nature are not comparable from period to period and tend to obscure our actual operating results. Recurring FFO measures 100% of the operating performance of Parkway Properties LP in which Parkway Properties, Inc. owns an interest.
62
The following table presents a reconciliation of FFO attributable to the Operating Partnership to Recurring FFO attributable to the Operating Partnership for the years ended December 31, 2015 and 2014 (in thousands):
Year Ended | ||||||||
December 31, | ||||||||
2015 | 2014 | |||||||
FFO attributable to the Operating Partnership | $ | 156,364 | $ | 143,916 | ||||
Adjustments to derive Recurring FFO attributable to the Operating Partnership: | ||||||||
Non-recurring lease termination fee income | (2,054 | ) | (1,443 | ) | ||||
Loss on extinguishment of debt (Parkway's share) | 4,537 | 2,405 | ||||||
Acquisition costs | 2,074 | 3,463 | ||||||
Impairment loss on management contracts, net of tax (Parkway's share) | — | 2,905 | ||||||
Non-cash adjustment for interest rate swap (Parkway's share) | 370 | (19 | ) | |||||
Realignment expenses | 520 | 6,016 | ||||||
Recurring FFO attributable to the Operating Partnership | $ | 161,811 | $ | 157,243 | ||||
In addition to FFO and Recurring FFO, we also disclose FAD, which is FFO, excluding straight line rent adjustments, amortization of above and below market leases, share-based compensation expense, acquisition costs, amortization of loan costs, other non-cash charges, gain or loss on extinguishment of debt, amortization of mortgage interest premium and reduced by recurring non-revenue enhancing capital expenditures for building improvements, tenant improvements and leasing costs. Adjustments for our share of partnerships and joint ventures are included in the computation of FAD on the same basis. While there is not a generally accepted definition established for FAD, we believe it is a non-GAAP measure that provides a meaningful presentation of operating performance by representing cash flow available for our shareholders. FAD measures 100% of the operating performance of Parkway Properties LP in which Parkway Properties, Inc. owns an interest.
The following table presents a reconciliation of FFO attributable to the Operating Partnership to FAD attributable to the Operating Partnership for the years ended December 31, 2015 and 2014 (in thousands):
Year Ended | ||||||||
December 31, | ||||||||
2015 | 2014 | |||||||
FFO attributable to the Operating Partnership | $ | 156,364 | $ | 143,916 | ||||
Adjustments to derive FAD attributable to the Operating Partnership: | ||||||||
Straight-line rents | (36,320 | ) | (22,310 | ) | ||||
Amortization of below market leases, net | (18,149 | ) | (14,653 | ) | ||||
Share-based compensation expense | 6,525 | 8,238 | ||||||
Impairment loss on management contracts, net of tax (Parkway's share) | — | 2,905 | ||||||
Acquisition costs | 2,074 | 3,463 | ||||||
Amortization of loan costs (Parkway's share) | 2,919 | 2,712 | ||||||
Non-cash adjustment for interest rate swap (Parkway's share) | 370 | (19 | ) | |||||
Loss on extinguishment of debt (Parkway's share) | 4,537 | 2,405 | ||||||
Amortization of mortgage interest premium | (12,268 | ) | (10,046 | ) | ||||
Recurring capital expenditures (Parkway's share) | (34,975 | ) | (45,020 | ) | ||||
FAD attributable to the Operating Partnership | $ | 71,077 | $ | 71,591 | ||||
EBITDA and Adjusted EBITDA
We believe that using EBITDA as a non-GAAP financial measure helps investors and our management analyze our ability to service debt and pay cash distributions. We define EBITDA as net income before interest expense, income taxes and depreciation and amortization. We further adjust EBITDA to exclude acquisition costs, gains and losses on early extinguishment of debt, impairment of real estate, share-based compensation expense and gains and losses on sales of real estate, which we refer to as "Adjusted EBITDA."
Adjustments for Parkway’s share of partnerships and joint ventures are included in the computation of Adjusted EBITDA on the same basis.
63
However, the material limitations associated with using EBITDA and Adjusted EBITDA as non-GAAP financial measures compared to cash flows provided by operating, investing and financing activities are that EBITDA and Adjusted EBITDA do not reflect our historical cash expenditures or future cash requirements for working capital, capital expenditures or the cash required to make interest and principal payments on our outstanding debt. Although EBITDA and Adjusted EBITDA have limitations as analytical tools, we compensate for the limitations by only using EBITDA and Adjusted EBITDA to supplement GAAP financial measures. Additionally, we believe that investors should consider EBITDA and Adjusted EBITDA in conjunction with net income and the other required GAAP measures of our performance and liquidity to improve their understanding of our operating results and liquidity. EBITDA and Adjusted EBITDA measure 100% of the operating performance of Parkway Properties LP in which Parkway Properties, Inc. owns an interest.
We view EBITDA and Adjusted EBITDA primarily as liquidity measures and, as such, the GAAP financial measure most directly comparable to them is cash flows provided by operating activities. Because EBITDA and Adjusted EBITDA are not measures of financial performance calculated in accordance with GAAP, they should not be considered in isolation or as a substitute for operating income, net income, or cash flows provided by operating, investing and financing activities prepared in accordance with GAAP.
The following table reconciles cash flows provided by operating activities to EBITDA for the years ended December 31, 2015 and 2014 (in thousands):
Year Ended | ||||||||
December 31, | ||||||||
2015 | 2014 | |||||||
Cash flows provided by operating activities | $ | 82,648 | $ | 53,004 | ||||
Amortization of below market leases, net | 16,288 | 13,690 | ||||||
Share-based compensation expense | (6,230 | ) | (7,417 | ) | ||||
Gain on sale of in-substance real estate | — | 6,289 | ||||||
Net gains on sale of real estate | 110,732 | 76,378 | ||||||
Net gains on sale of real estate - discontinued operations | — | 10,463 | ||||||
Gain on sale of unconsolidated property | 9,698 | — | ||||||
Impairment loss on real estate | (5,400 | ) | (11,700 | ) | ||||
Impairment loss on management contracts, net of tax | — | (4,750 | ) | |||||
Loss on extinguishment of debt | (6,062 | ) | — | |||||
Equity in earnings (losses) of unconsolidated joint ventures | 2,204 | (967 | ) | |||||
Distributions of income from unconsolidated joint ventures | (4,490 | ) | (5,338 | ) | ||||
Change in deferred leasing costs | 22,589 | 16,742 | ||||||
Change in condominium units | (9,318 | ) | (10,582 | ) | ||||
Change in receivables and other assets | 54,976 | 65,846 | ||||||
Change in accounts payable and other liabilities | 9,061 | 17,310 | ||||||
Net income attributable to noncontrolling interests - unit holders | (2,947 | ) | (2,089 | ) | ||||
Net (income) loss attributable to noncontrolling interests - real estate partnerships | (24,441 | ) | 824 | |||||
Tax expense - current | 1,540 | 4,902 | ||||||
Interest expense, net | 80,258 | 69,643 | ||||||
EBITDA | $ | 331,106 | $ | 292,248 | ||||
64
The reconciliation of net income for Parkway Properties, Inc. to EBITDA and Adjusted EBITDA and the computation of our proportionate share of interest and fixed charge coverage ratios, as well as the net debt to Adjusted EBITDA multiple is as follows for the years ended December 31, 2015 and 2014 (in thousands):
Year Ended December 31, | ||||||||
2015 | 2014 | |||||||
Net income for Parkway Properties, Inc. | $ | 67,335 | $ | 42,943 | ||||
Adjustments to net income for Parkway Properties, Inc.: | ||||||||
Interest expense, net | 71,481 | 66,095 | ||||||
Tax expense | 1,903 | 139 | ||||||
Depreciation and amortization | 190,387 | 182,955 | ||||||
Depreciation and amortization - discontinued operations | — | 116 | ||||||
EBITDA | 331,106 | 292,248 | ||||||
Impairment loss on real estate | 5,400 | 11,700 | ||||||
Impairment loss on management contracts, net of tax | — | 2,905 | ||||||
Net gains on sale of real estate (Parkway's share) | (85,366 | ) | (92,613 | ) | ||||
Gain on sale of unconsolidated property (Parkway's share) | (9,754 | ) | — | |||||
Loss on extinguishment of debt (Parkway's share) | 4,537 | 2,405 | ||||||
Noncontrolling interest - unit holders | 2,947 | 2,089 | ||||||
Acquisition costs (Parkway's share) | 2,074 | 3,463 | ||||||
Share-based compensation expense (Parkway's share) | 6,525 | 7,417 | ||||||
Realignment expenses | 520 | — | ||||||
EBITDA adjustments - noncontrolling interest in real estate partnerships and unconsolidated joint ventures | (23,204 | ) | 13 | |||||
Adjusted EBITDA (1) | $ | 234,785 | $ | 229,627 | ||||
Interest coverage ratio: | ||||||||
Adjusted EBITDA | $ | 234,785 | $ | 229,627 | ||||
Interest expense: | ||||||||
Interest expense | $ | 71,481 | $ | 66,095 | ||||
Interest expense - noncontrolling interest in real estate partnerships and unconsolidated joint ventures | (11,908 | ) | (2,509 | ) | ||||
Total interest expense | $ | 59,573 | $ | 63,586 | ||||
Interest coverage ratio | 3.9 | 3.6 | ||||||
Fixed charge coverage ratio: | ||||||||
Adjusted EBITDA | $ | 234,785 | $ | 229,627 | ||||
Fixed charges: | ||||||||
Interest expense | $ | 59,573 | $ | 63,586 | ||||
Principal payments | 10,982 | 10,001 | ||||||
Total fixed charges | $ | 70,555 | $ | 73,587 | ||||
Fixed charge coverage ratio | 3.3 | 3.1 | ||||||
Net Debt to Adjusted EBITDA multiple: | ||||||||
Annualized Adjusted EBITDA (2) | $ | 238,183 | $ | 251,878 | ||||
Parkway's share of total debt: | ||||||||
Mortgage notes payable | $ | 1,238,336 | $ | 1,339,450 | ||||
Notes payable to banks | 550,000 | 481,500 | ||||||
Adjustments for noncontrolling interest in real estate partnerships and unconsolidated joint ventures | (203,364 | ) | (214,590 | ) | ||||
Parkway's share of total debt | 1,584,972 | 1,606,360 | ||||||
Less: Parkway's share of cash | (57,974 | ) | (82,353 | ) | ||||
Parkway's share of net debt | $ | 1,526,998 | $ | 1,524,007 | ||||
Net Debt to Adjusted EBITDA multiple | 6.4 | 6.1 | ||||||
(1) | We define Adjusted EBITDA, a non-GAAP financial measure, as net income before interest expense, income taxes, depreciation and amortization, acquisition costs, gains and losses on early extinguishment of debt, impairment of real estate, share-based compensation expense and gains and losses on sales of real estate. Adjusted EBITDA, as calculated by us, is not comparable to Adjusted EBITDA reported by other REITs that do not define Adjusted EBITDA exactly as we do. |
(2) | Annualized Adjusted EBITDA includes the implied annualized impact of any acquisition or disposition activity during the period. |
Net Operating Income ("NOI"), Same-Store NOI ("SSNOI") and Recurring SSNOI
We define net operating income (“NOI”) as income from office properties less property operating expenses. NOI measures 100% of the operating performance of Parkway Properties LP in which Parkway Properties, Inc. owns an interest. We consider NOI to be a useful performance measure to investors and management because it reflects the revenues and expenses directly associated with owning and operating our properties and the impact to operations from trends in occupancy rates, rental rates and operating costs not otherwise reflected in net income.
65
We also evaluate performance based upon same-store NOI (“SSNOI”) and recurring SSNOI. SSNOI reflects the NOI from properties that were owned for the entire current and prior reporting periods presented and excludes properties acquired or sold during those periods, which eliminates disparities in net operating income due to acquisitions and dispositions of properties during such period. Recurring SSNOI includes adjustments for non-recurring lease termination fees or other unusual items. We believe that these measures provide more consistent metrics for the comparison of our properties from period to period.
NOI, SSNOI and recurring SSNOI as reported by us may not be comparable to similar measures reported by other REITs that do not define the measures as we do. NOI, SSNOI and recurring SSNOI are not measures of operating results as measured by GAAP and should not be considered alternatives to net income.
The following table presents a reconciliation of our net income to NOI, SSNOI and recurring SSNOI for the years ended December 31, 2015 and 2014 (in thousands):
Year Ended | |||||||
December 31, | |||||||
2015 | 2014 | ||||||
Net income for Parkway Properties, Inc. | $ | 67,335 | $ | 42,943 | |||
Add (deduct): | |||||||
Interest expense | 71,481 | 66,095 | |||||
Loss on extinguishment of debt | 6,062 | 2,405 | |||||
Depreciation and amortization | 190,387 | 182,955 | |||||
Management company expenses | 9,935 | 20,280 | |||||
Income tax expense | 1,903 | 139 | |||||
General and administrative | 31,194 | 32,660 | |||||
Acquisition costs | 2,074 | 3,463 | |||||
Equity in (earnings) loss of unconsolidated joint ventures | (2,204 | ) | 967 | ||||
Sale of condominium units | (11,065 | ) | (16,554 | ) | |||
Cost of sales - condominium units | 11,120 | 13,199 | |||||
Net income attributable to noncontrolling interests | 27,388 | 1,265 | |||||
Loss from discontinued operations | — | 391 | |||||
Net gains on sale of real estate | (110,732 | ) | (82,667 | ) | |||
Net gains on sale of real estate from discontinued operations | — | (10,463 | ) | ||||
Gain on sale of unconsolidated property | (9,698 | ) | — | ||||
Impairment loss on real estate | 5,400 | 11,700 | |||||
Impairment loss on management contracts | — | 4,750 | |||||
Management company income | (10,321 | ) | (22,140 | ) | |||
Interest and other income | (903 | ) | (1,452 | ) | |||
NOI from consolidated office properties | 279,356 | 249,936 | |||||
Less: NOI from non same-store properties | (60,377 | ) | (60,755 | ) | |||
Add: One Congress Plaza and San Jacinto Center (1) | — | 18,303 | |||||
SSNOI | 218,979 | 207,484 | |||||
Less: non-recurring lease termination fee income | (847 | ) | (871 | ) | |||
Recurring SSNOI | $ | 218,132 | $ | 206,613 | |||
(1) SSNOI for the year ended December 31, 2014 includes the effect of amounts from our One Congress Plaza and San Jacinto Center properties in Austin, Texas as these properties are included as same-store properties for comparative purposes. Previously, the activity from these properties was included in equity in earnings. | |||||||
Inflation
Inflation has not had a significant impact on us because of the relatively low inflation rate in our geographic areas of operation. Additionally, most of our leases require customers to pay their pro rata share of operating expenses, including common area maintenance, real estate taxes, utilities and insurance, thereby reducing our exposure to increases in operating expenses resulting from inflation. Our leases typically have three to seven year terms, which may enable us to replace existing leases with new leases at market base rent, which may be higher or lower than the existing lease rate.
66
ITEM 7A. Quantitative and Qualitative Disclosures About Market Risk.
See information appearing under the caption "Liquidity" appearing in "Item 7. Management's Discussion and Analysis of Financial Condition and Results of Operations."
At December 31, 2015, total outstanding debt was $1.8 billion, of which $231.3 million, or 13.1%, was variable rate debt. If market rates of interest on the variable rate debt fluctuate by 10% (or approximately 20 basis points), the change in interest expense on the variable rate debt would increase or decrease future earnings and cash flows by approximately $388,000 annually.
ITEM 8. Financial Statements and Supplementary Data.
Index to Consolidated Financial Statements | Page |
All other financial schedules are not required under the related instructions, or are inapplicable, and therefore have been omitted. | |
67
REPORT OF INDEPENDENT REGISTERED PUBLIC ACCOUNTING FIRM
THE BOARD OF DIRECTORS AND STOCKHOLDERS
PARKWAY PROPERTIES, INC.
We have audited the accompanying consolidated balance sheets of Parkway Properties, Inc. and subsidiaries (the "Company") as of December 31, 2015 and 2014, and the related consolidated statements of operations and comprehensive income (loss), changes in equity and cash flows for each of the three years in the period ended December 31, 2015. Our audits also included the financial statement schedules listed in the Index at Item 15(a)(2). These financial statements and schedules are the responsibility of the Company's management. Our responsibility is to express an opinion on these financial statements and schedules based on our audits.
We conducted our audits in accordance with the standards of the Public Company Accounting Oversight Board (United States). Those standards require that we plan and perform the audit to obtain reasonable assurance about whether the financial statements are free of material misstatement. An audit includes examining, on a test basis, evidence supporting the amounts and disclosures in the financial statements. An audit also includes assessing the accounting principles used and significant estimates made by management, as well as evaluating the overall financial statement presentation. We believe that our audits provide a reasonable basis for our opinion.
In our opinion, the financial statements referred to above present fairly, in all material respects, the consolidated financial position of the Company at December 31, 2015 and 2014, and the consolidated results of their operations and their cash flows for each of the three years in the period ended December 31, 2015, in conformity with U.S. generally accepted accounting principles. Also, in our opinion, the related financial statement schedules, when considered in relation to the basic financial statements taken as a whole, present fairly in all material respects the information set forth therein.
As discussed in Note 1 to the consolidated financial statements, the Company changed its reporting of discontinued operations as a result of the adoption of the amendments to the FASB Accounting Standards Codification resulting from Accounting Standards Update No. 2014-08, “Presentation of Financial Statements (Topic 205) and Property, Plant and Equipment (Topic 360), Reporting Discontinued Operations and Disclosures of Disposals of Components of an Entity” effective January 1, 2014.
We also have audited, in accordance with the standards of the Public Company Accounting Oversight Board (United States), the Company's internal control over financial reporting as of December 31, 2015, based on criteria established in Internal Control-Integrated Framework issued by the Committee of Sponsoring Organizations of the Treadway Commission (2013 Framework) and our report dated February 25, 2016 expressed an unqualified opinion thereon.
/s/ Ernst & Young LLP
Indianapolis, Indiana
February 25, 2016
68
PARKWAY PROPERTIES, INC.
CONSOLIDATED BALANCE SHEETS
(In thousands, except share and per share data)
December 31, 2015 | December 31, 2014 | ||||||
Assets | |||||||
Real estate related investments: | |||||||
Office properties | $ | 3,332,021 | $ | 3,333,900 | |||
Accumulated depreciation | (308,772 | ) | (309,629 | ) | |||
Total real estate related investments, net | 3,023,249 | 3,024,271 | |||||
Condominium units | — | 9,318 | |||||
Mortgage loan receivable | 3,331 | 3,417 | |||||
Investment in unconsolidated joint ventures | 39,592 | 55,550 | |||||
Cash and cash equivalents | 74,961 | 116,241 | |||||
Receivables and other assets | 309,663 | 285,217 | |||||
Intangible assets, net | 146,688 | 185,488 | |||||
Assets held for sale | 21,373 | 24,079 | |||||
Management contract intangibles, net | 378 | 1,133 | |||||
Total assets | $ | 3,619,235 | $ | 3,704,714 | |||
Liabilities | |||||||
Notes payable to banks | $ | 550,000 | $ | 481,500 | |||
Mortgage notes payable | 1,238,336 | 1,339,450 | |||||
Accounts payable and other liabilities | 193,685 | 202,413 | |||||
Liabilities related to assets held for sale | 1,003 | 2,035 | |||||
Total liabilities | 1,983,024 | 2,025,398 | |||||
Equity | |||||||
Parkway Properties, Inc. stockholders' equity | |||||||
Common stock, $.001 par value, 215,500,000 authorized and 111,631,153 and 111,127,386 shares issued and outstanding in 2015 and 2014, respectively | 112 | 111 | |||||
Limited voting stock $.001 par value, 4,500,000 authorized and 4,213,104 shares issued and outstanding | 4 | 4 | |||||
Additional paid-in capital | 1,854,913 | 1,842,581 | |||||
Accumulated other comprehensive loss | (6,199 | ) | (6,166 | ) | |||
Accumulated deficit | (460,131 | ) | (443,757 | ) | |||
Total Parkway Properties, Inc. stockholders' equity | 1,388,699 | 1,392,773 | |||||
Noncontrolling interests | 247,512 | 286,543 | |||||
Total equity | 1,636,211 | 1,679,316 | |||||
Total liabilities and equity | $ | 3,619,235 | $ | 3,704,714 | |||
See notes to consolidated financial statements.
69
PARKWAY PROPERTIES, INC.
CONSOLIDATED STATEMENTS OF OPERATIONS AND COMPREHENSIVE INCOME (LOSS)
(In thousands, except per share data)
Year Ended December 31, | |||||||||||
2015 | 2014 | 2013 | |||||||||
Revenues | |||||||||||
Income from office properties | $ | 452,597 | $ | 418,007 | $ | 273,434 | |||||
Management company income | 10,321 | 22,140 | 18,145 | ||||||||
Sale of condominium units | 11,065 | 16,554 | — | ||||||||
Total revenues | 473,983 | 456,701 | 291,579 | ||||||||
Expenses | |||||||||||
Property operating expenses | 173,241 | 168,071 | 108,867 | ||||||||
Management company expenses | 9,935 | 20,280 | 19,399 | ||||||||
Cost of sales - condominium units | 11,120 | 13,199 | 15 | ||||||||
Depreciation and amortization | 190,387 | 182,955 | 118,031 | ||||||||
Impairment loss on real estate | 5,400 | 11,700 | — | ||||||||
Impairment loss on management contracts | — | 4,750 | — | ||||||||
General and administrative | 31,194 | 32,660 | 25,653 | ||||||||
Acquisition costs | 2,074 | 3,463 | 13,126 | ||||||||
Total expenses | 423,351 | 437,078 | 285,091 | ||||||||
Operating income | 50,632 | 19,623 | 6,488 | ||||||||
Other income and expenses | |||||||||||
Interest and other income | 903 | 1,452 | 2,236 | ||||||||
Equity in earnings (losses) of unconsolidated joint ventures | 2,204 | (967 | ) | 178 | |||||||
Gain on sale of in-substance real estate | — | 6,289 | — | ||||||||
Net gains on sale of real estate | 110,732 | 76,378 | — | ||||||||
Gain on sale of unconsolidated property | 9,698 | — | — | ||||||||
Loss on extinguishment of debt | (6,062 | ) | (2,405 | ) | — | ||||||
Interest expense | (71,481 | ) | (66,095 | ) | (45,622 | ) | |||||
Income (loss) before income taxes | 96,626 | 34,275 | (36,720 | ) | |||||||
Income tax (expense) benefit | (1,903 | ) | (139 | ) | 1,405 | ||||||
Income (loss) from continuing operations | 94,723 | 34,136 | (35,315 | ) | |||||||
Discontinued operations: | |||||||||||
Loss from discontinued operations | — | (391 | ) | (9,215 | ) | ||||||
Gain on sale of real estate from discontinued operations | — | 10,463 | 32,493 | ||||||||
Total discontinued operations | — | 10,072 | 23,278 | ||||||||
Net income (loss) | 94,723 | 44,208 | (12,037 | ) | |||||||
Net (income) loss attributable to noncontrolling interests-unit holders | (2,947 | ) | (2,089 | ) | 291 | ||||||
Net (income) loss attributable to noncontrolling interests-real estate partnerships | (24,441 | ) | 824 | (7,904 | ) | ||||||
Net income (loss) for Parkway Properties, Inc. | 67,335 | 42,943 | (19,650 | ) | |||||||
Dividends on preferred stock | — | — | (3,433 | ) | |||||||
Dividends on preferred stock redemption | — | — | (6,604 | ) | |||||||
Net income (loss) attributable to common stockholders | $ | 67,335 | $ | 42,943 | $ | (29,687 | ) | ||||
Net income (loss) | $ | 94,723 | $ | 44,208 | $ | (12,037 | ) | ||||
Other comprehensive income (loss) | 1,499 | (3,758 | ) | 9,779 | |||||||
Comprehensive income (loss) | 96,222 | 40,450 | (2,258 | ) | |||||||
Comprehensive income attributable to noncontrolling interests | (28,920 | ) | (1,494 | ) | (15,146 | ) | |||||
Comprehensive income (loss) attributable to common stockholders | $ | 67,302 | $ | 38,956 | $ | (17,404 | ) | ||||
Net income (loss) per common share attributable to Parkway Properties, Inc.: | |||||||||||
Basic: | |||||||||||
Income (loss) from continuing operations attributable to Parkway Properties, Inc. | $ | 0.60 | $ | 0.33 | $ | (0.60 | ) | ||||
Discontinued operations | — | 0.09 | 0.15 | ||||||||
Basic net income (loss) attributable to Parkway Properties, Inc. | $ | 0.60 | $ | 0.42 | $ | (0.45 | ) | ||||
Diluted: | |||||||||||
Income (loss) from continuing operations attributable to Parkway Properties, Inc. | $ | 0.60 | $ | 0.33 | $ | (0.60 | ) | ||||
Discontinued operations | — | 0.09 | 0.15 | ||||||||
Diluted net income (loss) attributable to Parkway Properties, Inc. | $ | 0.60 | $ | 0.42 | $ | (0.45 | ) | ||||
Weighted average shares outstanding: | |||||||||||
Basic | 111,490 | 101,913 | 66,336 | ||||||||
Diluted | 116,691 | 107,319 | 66,336 | ||||||||
Amounts attributable to Parkway Properties, Inc. common stockholders: | |||||||||||
Income (loss) from continuing operations attributable to Parkway Properties, Inc. | $ | 67,335 | $ | 33,223 | $ | (39,522 | ) | ||||
Discontinued operations | — | 9,720 | 9,835 | ||||||||
Net income (loss) attributable to common stockholders | $ | 67,335 | $ | 42,943 | $ | (29,687 | ) | ||||
See notes to consolidated financial statements.
70
PARKWAY PROPERTIES, INC.
CONSOLIDATED STATEMENTS OF CHANGES IN EQUITY
(In thousands, except share and per share data)
Parkway Properties, Inc. Stockholders' Equity | |||||||||||||||||||||||||||||||
Preferred Stock | Common Stock | Common Stock Held in Trust and Limited Voting Stock | Additional Paid-In Capital | Accumulated Other Comprehensive Income (Loss) | Accumulated Deficit | Noncontrolling Interests | Total Equity | ||||||||||||||||||||||||
Balance at December 31, 2012 | $ | 128,942 | $ | 56 | $ | — | $ | 907,254 | $ | (4,425 | ) | $ | (337,813 | ) | $ | 261,992 | $ | 956,006 | |||||||||||||
Net income (loss) | — | — | — | — | — | (19,650 | ) | 7,613 | (12,037 | ) | |||||||||||||||||||||
Other comprehensive income | — | — | — | — | 2,246 | — | 7,533 | 9,779 | |||||||||||||||||||||||
Common dividends declared - $0.6375 per share | — | — | — | — | — | (41,838 | ) | (169 | ) | (42,007 | ) | ||||||||||||||||||||
Preferred dividends declared - $0.63 per share | — | — | — | — | — | (3,433 | ) | — | (3,433 | ) | |||||||||||||||||||||
Dividends on preferred stock redemption | — | — | — | — | — | (6,604 | ) | — | (6,604 | ) | |||||||||||||||||||||
Share-based compensation | — | — | — | 5,725 | — | — | — | 5,725 | |||||||||||||||||||||||
Series D Preferred Stock redemption | (128,942 | ) | — | — | — | — | — | — | (128,942 | ) | |||||||||||||||||||||
Issuance of 11,432 shares to Directors | — | — | — | 220 | — | — | — | 220 | |||||||||||||||||||||||
Issuance of 31,049,976 shares of common stock | — | 31 | — | 540,468 | — | — | — | 540,499 | |||||||||||||||||||||||
Issuance of 26,098 shares pursuant to TPG Management Services Agreement | — | — | — | 450 | — | — | — | 450 | |||||||||||||||||||||||
Buyback of 3,365 shares to satisfy tax withholding obligation in connection with the vesting of restricted stock | — | — | — | (49 | ) | — | — | — | (49 | ) | |||||||||||||||||||||
Issuance of 5,351,461 Operating Partnership units | — | — | — | — | — | — | 96,409 | 96,409 | |||||||||||||||||||||||
Issuance of 238,357 shares of common stock upon redemption of Operating Partnership units | — | — | — | 4,302 | — | — | (4,302 | ) | — | ||||||||||||||||||||||
Issuance of 4,451,461 shares of limited voting stock | — | — | 4 | — | — | — | — | 4 | |||||||||||||||||||||||
Noncontrolling interest attributable to Thomas Properties Group, Inc. Merger | — | — | — | — | — | — | 34,230 | 34,230 | |||||||||||||||||||||||
Distribution of capital to noncontrolling interests | — | — | — | — | — | — | (29,267 | ) | (29,267 | ) | |||||||||||||||||||||
Purchase of noncontrolling interest's share of office properties owned by Parkway Properties Office Fund II, L.P. | — | — | — | (30,344 | ) | — | — | (55,118 | ) | (85,462 | ) | ||||||||||||||||||||
Balance at December 31, 2013 | — | 87 | 4 | 1,428,026 | (2,179 | ) | (409,338 | ) | 318,921 | 1,335,521 | |||||||||||||||||||||
Net income | — | — | — | — | — | 42,943 | 1,265 | 44,208 | |||||||||||||||||||||||
Other comprehensive income (loss) | — | — | — | — | (3,987 | ) | — | 229 | (3,758 | ) | |||||||||||||||||||||
Common dividends declared - $0.75 per share | — | — | — | — | — | (77,362 | ) | (3,900 | ) | (81,262 | ) | ||||||||||||||||||||
Share-based compensation | — | — | — | 6,733 | — | — | — | 6,733 | |||||||||||||||||||||||
Issuance of 16,481 shares to Directors | — | — | — | 309 | — | — | — | 309 | |||||||||||||||||||||||
Issuance of 23,716,900 shares of common stock | — | 24 | — | 417,660 | — | — | — | 417,684 | |||||||||||||||||||||||
Issuance of 19,122 shares pursuant to TPG Management Services Agreement | — | — | — | 375 | — | — | — | 375 | |||||||||||||||||||||||
Issuance of 85,649 Operating Partnership units | — | — | — | — | — | — | 1,546 | 1,546 | |||||||||||||||||||||||
Exercise of Madison Put Option related to merger with Thomas Properties Group, Inc. | — | — | — | (10,522 | ) | — | — | (31,017 | ) | (41,539 | ) | ||||||||||||||||||||
Contribution of capital by noncontrolling interests | — | — | — | — | — | — | 4,175 | 4,175 | |||||||||||||||||||||||
Distributions to noncontrolling interests | — | — | — | — | — | — | (2,713 | ) | (2,713 | ) | |||||||||||||||||||||
Purchase of noncontrolling interest's share of office properties owned by Parkway Properties Office Fund II, L.P. | — | — | — | — | — | — | (1,963 | ) | (1,963 | ) | |||||||||||||||||||||
Balance at December 31, 2014 | — | 111 | 4 | 1,842,581 | (6,166 | ) | (443,757 | ) | 286,543 | 1,679,316 | |||||||||||||||||||||
Net income | — | — | — | — | — | 67,335 | 27,388 | 94,723 | |||||||||||||||||||||||
Other comprehensive income (loss) | — | — | — | — | (33 | ) | — | 1,532 | 1,499 | ||||||||||||||||||||||
Common dividends declared - $0.75 per share | — | — | — | — | — | (83,709 | ) | (3,723 | ) | (87,432 | ) | ||||||||||||||||||||
Share-based compensation | — | — | — | 5,955 | — | — | — | 5,955 | |||||||||||||||||||||||
Issuance of 15,690 shares to Directors | — | — | — | 275 | — | — | — | 275 | |||||||||||||||||||||||
Issuance of 367,257 shares of common stock upon redemption of Operating Partnership units | — | 1 | — | 6,336 | — | — | (6,337 | ) | — | ||||||||||||||||||||||
Contribution of capital by noncontrolling interests | — | — | — | — | — | — | 2,125 | 2,125 | |||||||||||||||||||||||
Distributions to noncontrolling interests | — | — | — | — | — | — | (60,016 | ) | (60,016 | ) | |||||||||||||||||||||
Other | — | — | — | (234 | ) | — | — | — | (234 | ) | |||||||||||||||||||||
Balance at December 31, 2015 | $ | — | $ | 112 | $ | 4 | $ | 1,854,913 | $ | (6,199 | ) | $ | (460,131 | ) | $ | 247,512 | $ | 1,636,211 | |||||||||||||
See notes to consolidated financial statements.
71
PARKWAY PROPERTIES, INC.
CONSOLIDATED STATEMENTS OF CASH FLOWS
(In thousands)
Year Ended December 31, | |||||||||||
2015 | 2014 | 2013 | |||||||||
Operating activities | |||||||||||
Net income (loss) | $ | 94,723 | $ | 44,208 | $ | (12,037 | ) | ||||
Adjustments to reconcile net income (loss) to cash provided by operating activities: | |||||||||||
Depreciation and amortization | 190,387 | 182,955 | 118,031 | ||||||||
Depreciation and amortization-discontinued operations | — | 116 | 4,560 | ||||||||
Net amortization of above (below) market leases | (16,288 | ) | (13,690 | ) | 2,210 | ||||||
Net amortization of above market leases-discontinued operations | — | — | 33 | ||||||||
Amortization of financing costs | 3,112 | 2,845 | 2,448 | ||||||||
Amortization of financing costs-discontinued operations | — | — | 17 | ||||||||
Amortization of debt premium, net | (12,025 | ) | (6,374 | ) | — | ||||||
Non-cash adjustment for interest rate swaps | 136 | (19 | ) | — | |||||||
Share-based compensation expense | 6,230 | 7,417 | 5,730 | ||||||||
Deferred income tax expense (benefit) | 363 | (4,763 | ) | (1,960 | ) | ||||||
Gain on sale of in-substance real estate | — | (6,289 | ) | — | |||||||
Net gains on sale of real estate | (110,732 | ) | (76,378 | ) | — | ||||||
Net gains on sale of real estate-discontinued operations | — | (10,463 | ) | (32,493 | ) | ||||||
Gain on sale of unconsolidated property | (9,698 | ) | — | — | |||||||
Non-cash impairment loss on real estate | 5,400 | 11,700 | — | ||||||||
Non-cash impairment loss on real estate-discontinued operations | — | — | 10,200 | ||||||||
Non-cash impairment loss on management contracts, net of tax | — | 4,750 | — | ||||||||
Loss on extinguishment of debt | 6,062 | — | — | ||||||||
Equity in (earnings) losses of unconsolidated joint ventures | (2,204 | ) | 967 | (178 | ) | ||||||
Distributions of income from unconsolidated joint ventures | 4,490 | 5,338 | — | ||||||||
Increase in deferred leasing costs | (22,589 | ) | (16,742 | ) | (16,117 | ) | |||||
Changes in operating assets and liabilities: | |||||||||||
Change in condominium units | 9,318 | 10,582 | — | ||||||||
Change in receivables and other assets | (54,976 | ) | (65,846 | ) | (25,739 | ) | |||||
Change in accounts payable and other liabilities | (9,061 | ) | (17,310 | ) | 10,381 | ||||||
Cash provided by operating activities | 82,648 | 53,004 | 65,086 | ||||||||
Investing activities | |||||||||||
Issuance of mortgage loan receivable | — | — | (3,523 | ) | |||||||
Proceeds from mortgage loan receivable | 86 | 85 | 21 | ||||||||
Distributions of capital from unconsolidated joint ventures | 28,240 | 251 | 29,405 | ||||||||
Investment in unconsolidated joint ventures | (4,705 | ) | (3,505 | ) | (86,685 | ) | |||||
Investment in real estate | (219,721 | ) | (750,004 | ) | (187,442 | ) | |||||
Acquisition of TPGI, net of cash received | — | — | (54,031 | ) | |||||||
Proceeds from sale of in-substance real estate | — | 24,923 | — | ||||||||
Proceeds from sale of real estate | 420,190 | 382,912 | 191,485 | ||||||||
Real estate development | (29,208 | ) | (14,282 | ) | (745 | ) | |||||
Improvements to real estate | (89,001 | ) | (52,569 | ) | (35,373 | ) | |||||
Cash provided by (used in) investing activities | 105,881 | (412,189 | ) | (146,888 | ) | ||||||
Financing activities | |||||||||||
Principal payments on mortgage notes payable and debt extinguishments | (180,315 | ) | (53,402 | ) | (73,385 | ) | |||||
Proceeds from mortgage notes payable | 30,647 | 481 | 178,000 | ||||||||
Proceeds from bank borrowings | 454,850 | 398,590 | 542,234 | ||||||||
Payments on bank borrowings | (386,350 | ) | (220,090 | ) | (501,234 | ) | |||||
Debt financing costs | (2,960 | ) | (3,893 | ) | (2,749 | ) | |||||
Purchase of Company stock | — | — | (49 | ) | |||||||
Dividends paid on common stock | (83,833 | ) | (76,734 | ) | (41,818 | ) | |||||
Dividends paid on common units of Operating Partnership | (3,723 | ) | (3,848 | ) | — | ||||||
Dividends paid on preferred stock | — | — | (3,433 | ) | |||||||
Acquisition of noncontrolling interests | — | (43,502 | ) | — | |||||||
Contributions from noncontrolling interest partners | 2,125 | 4,175 | — | ||||||||
Distributions to noncontrolling interest partners | (60,016 | ) | (2,713 | ) | (113,178 | ) | |||||
Redemption of preferred stock | — | — | (135,532 | ) | |||||||
Proceeds from stock offerings, net of offering costs | — | 417,684 | 209,768 | ||||||||
Other | (234 | ) | — | — | |||||||
Cash (used in) provided by financing activities | (229,809 | ) | 416,748 | 58,624 | |||||||
Change in cash and cash equivalents | (41,280 | ) | 57,563 | (23,178 | ) | ||||||
Cash and cash equivalents at beginning of year | 116,241 | 58,678 | 81,856 | ||||||||
Cash and cash equivalents at end of year | $ | 74,961 | $ | 116,241 | $ | 58,678 | |||||
See notes to consolidated financial statements.
72
PARKWAY PROPERTIES, INC.
CONSOLIDATED STATEMENTS OF CASH FLOWS (continued)
(In thousands)
Supplemental Cash Flow Information and Schedule of Non-Cash Investing and Financing Activity
Year Ended December 31, | |||||||||||
2015 | 2014 | 2013 | |||||||||
(In thousands) | |||||||||||
Supplemental cash flow information: | |||||||||||
Cash paid for interest | $ | 80,744 | $ | 71,339 | $ | 43,334 | |||||
Cash paid for income taxes | 2,275 | 4,792 | 56 | ||||||||
Supplemental schedule of non-cash investing and financing activity: | |||||||||||
Acquisitions of One Congress Plaza and San Jacinto Center | — | 311,400 | — | ||||||||
Acquisition of One Orlando Centre | — | 54,000 | — | ||||||||
Assets acquired in TPGI merger | — | — | 1,202,732 | ||||||||
Liabilities assumed in TPGI merger | — | — | 122,282 | ||||||||
Noncontrolling interests acquired in TPGI merger | — | — | 34,230 | ||||||||
Shares issued in TPGI merger | — | — | 331,260 | ||||||||
Issuance of limited voting stock in TPGI merger | — | — | 4 | ||||||||
Acquisition of Lincoln Place | — | — | 68,430 | ||||||||
Issuance of Operating Partnership units | — | 1,546 | 96,409 | ||||||||
Transfer of assets classified as held for sale | 21,373 | 24,079 | 16,260 | ||||||||
Transfer of liabilities classified as held for sale | 1,003 | 2,035 | 566 | ||||||||
Mortgage loans assumed in purchases | 56,140 | 301,251 | 727,451 | ||||||||
Operating Partnership units converted to common stock | 6,337 | — | 4,302 | ||||||||
73
PARKWAY PROPERTIES, INC.
NOTES TO CONSOLIDATED FINANCIAL STATEMENTS
December 31, 2015
NOTE 1 - Summary of Significant Accounting Policies
Basis of Presentation and Principles of Consolidation
Parkway Properties, Inc. (the “Company") is a fully integrated, self-administered and self-managed real estate investment trust ("REIT") specializing in the acquisition, ownership, development and management of quality office properties in high-growth submarkets in the Sunbelt region of the United States. At January 1, 2016, the Company owned or had an interest in a portfolio of 36 office properties located in six states with an aggregate of approximately 14.3 million square feet (unaudited) of leasable space. The Company offers fee-based real estate services through its wholly owned subsidiaries, which in total managed and/or leased approximately 2.7 million square feet (unaudited) primarily for third-party property owners at January 1, 2016. Unless otherwise indicated, all references to square feet represent net rentable area.
The Company is the sole general partner of Parkway Properties LP, (the "Operating Partnership" or "Parkway LP") and as of December 31, 2015, owned a 95.9% interest in the Operating Partnership. The remaining 4.1% interest consists of common units of limited partnership interest issued by the Operating Partnership to limited partners in exchange for acquisitions of properties to the Operating Partnership. As the sole general partner of the Operating Partnership, the Company has full and complete authority over the Operating Partnership’s day-to-day operations and management.
The accompanying financial statements are prepared following U.S. generally accepted accounting principles ("GAAP") and the requirements of the Securities and Exchange Commission ("SEC").
The consolidated financial statements include the accounts of the Company, its wholly owned subsidiaries and joint ventures in which the Company has a controlling interest. The other partners' equity interests in the consolidated joint ventures are reflected as noncontrolling interests in the consolidated financial statements. The Company also consolidates subsidiaries where the entity is a variable interest entity (a "VIE") and it is the primary beneficiary and has the power to direct the activities of the VIE and has the obligation to absorb losses or the right to receive benefits from the VIE that could potentially be significant to the VIE. At December 31, 2015 and 2014, the Company did not have any VIEs that required consolidation. All significant intercompany transactions and accounts have been eliminated in the accompanying financial statements.
The Company consolidates certain joint ventures where it exercises control over major operating and management decisions, or where the Company is the sole general partner and the limited partners do not possess kick-out rights or other substantive participating rights. The equity method of accounting is used for those joint ventures that do not meet the criteria for consolidation and where the Company does not control these joint ventures, but exercises significant influence. The cost method of accounting is used for investments in which the Company does not have significant influence. The investments are reviewed for impairment when indicators of impairment exist.
Business
The Company's operations are exclusively in the real estate industry, principally the operation, leasing, acquisition, development and ownership of office buildings.
Use of Estimates
The preparation of financial statements in conformity with GAAP requires management to make estimates and assumptions that affect the reported amounts of assets and liabilities, the disclosure of contingent assets and liabilities at the date of the financial statements and the reported amounts of revenues and expenses during the reporting period. Although the Company believes the assumptions and estimates made are reasonable and appropriate, as discussed in the applicable sections throughout these consolidated financial statements, different assumptions and estimates could materially impact reported results. The current economic environment has increased the degree of uncertainty inherent in these estimates and assumptions; therefore, changes in market conditions could impact the Company's future operating results. The Company's most significant estimates relate to impairments on real estate and other assets and purchase price assignments. Actual results could differ from these estimates.
74
Real Estate Properties
Real estate properties are carried at cost less accumulated depreciation. Cost includes the carrying amount of the Company's investment plus any additional consideration paid, liabilities assumed and improvements made subsequent to acquisition. Depreciation of buildings and building improvements is computed using the straight-line method over the estimated useful lives of the assets. Depreciation of tenant improvements, including personal property, is computed using the straight-line method over the lesser of the useful life or the term of the lease involved. Maintenance and repair expenses are charged to expense as incurred.
Balances of major classes of depreciable assets (in thousands) and their respective estimated useful lives are:
December 31, | ||||||||||
Asset Category | Estimated Useful Life | 2015 | 2014 | |||||||
Land | Non-depreciable | $ | 406,271 | $ | 412,578 | |||||
Buildings and garages | 40 years | 2,519,587 | 2,535,757 | |||||||
Building improvements | 7 to 40 years | 57,381 | 52,715 | |||||||
Tenant improvements | Lesser of useful life or term of lease | 348,782 | 332,850 | |||||||
$ | 3,332,021 | $ | 3,333,900 | |||||||
Depreciation expense, excluding amounts recorded in discontinued operations, related to these assets of $119.2 million, $102.2 million and $69.0 million was recognized in 2015, 2014 and 2013, respectively.
The Company evaluates its real estate assets for impairment upon occurrence of significant adverse changes in its operations to assess whether any impairment indicators are present that affect the recovery of the carrying amount. The carrying amount includes the net book value of tangible and intangible assets and liabilities. Real estate assets are classified as held for sale or held and used. The Company classifies certain assets as held for sale based on management having the authority and intent of entering into commitments for sale transactions to close in the next twelve months. The Company considers an office property as held for sale once it has executed a contract for sale, allowed the buyer to complete its due diligence review and received a substantial non-refundable deposit. Until a buyer has completed its due diligence review of the asset, necessary approvals have been received and substantive conditions to the buyer's obligation to perform have been satisfied, the Company does not consider a sale to be probable. When the Company identifies an asset as held for sale, it estimates the net realizable value of such asset and discontinues recording depreciation on the asset. The Company records assets held for sale at the lower of carrying amount or fair value less cost to sell. If the fair value of the asset net of estimated selling costs is less than the carrying amount, the Company records an impairment loss. With respect to assets classified as held and used, the Company recognizes an impairment loss if the carrying amount is not recoverable and exceeds the sum of undiscounted future cash flows expected to result from the use and eventual disposition of the asset. Upon impairment, the Company recognizes an impairment loss to reduce the carrying value of the real estate asset to the estimate of its fair value. The cash flow and fair value estimates are based on assumptions about employing the asset for its remaining useful life. Factors considered in projecting future cash flows include, but are not limited to: existing leases, future leasing and terminations, market rental rates, capital improvements, tenant improvements, leasing commissions, inflation, discount rates, capitalization rates and other known variables, and contractual purchase and sale agreements. This market information is considered a Level 2 or Level 3 input as defined by the Financial Accounting Standards Board ("FASB") Accounting Standards Codification ("ASC") 820, "Fair Value Measurements and Disclosures," ("ASC 820").
The Company recognizes gains or losses on sales of real estate at times and in amounts determined in accordance with the accounting guidance for sales of real estate. The guidance takes into account the terms of the transaction and any continuing involvement, including in the form of management, leasing of space or financial assistance associated with the properties. If the sales criteria for the full accrual method are not met, then the Company defers gain recognition and accounts for the transaction by applying the deposit, finance, installment or cost recovery methods, as appropriate.
During the year ended December 31, 2015, the Company recognized impairment losses on real estate of $4.4 million and $1.0 million, respectively, for the difference between the carrying value and the estimated fair value in connection with 550 Greens Parkway in Houston, Texas and City Centre in Jackson, Mississippi. During the year ended December 31, 2014, the Company recognized an impairment loss on real estate of $11.7 million in connection with Raymond James Tower in Memphis, Tennessee for the difference between the carrying value and the estimated fair value. During the year ended December 31, 2013, the Company recognized impairment losses on real estate totaling $10.2 million in connection with Waterstone and Meridian in Atlanta, Georgia and Mesa Corporate Center in Phoenix, Arizona. All of these impairment losses were valued by the Company utilizing Level 2 fair value inputs, including contractual purchase and sale agreements.
75
At December 31, 2015, assets held for sale and liabilities related to assets held for sale relate to 5300 Memorial and Town & Country in Houston, Texas. At December 31, 2014, the Company classified Raymond James Tower in Memphis, Tennessee and the Honeywell Building in Houston, Texas as assets held for sale and liabilities related to assets held for sale.
Condominium Units
The Company also consolidates its Murano residential condominium project which it controls. The Company's unaffiliated partner's interest is reflected on its consolidated balance sheets under the "Noncontrolling Interests" caption. The Company's partner has a stated ownership interest of 27%. Net proceeds from the project will be distributed, to the extent available, based on an order of preferences described in the partnership agreement. The Company may receive distributions, if any, in excess of its stated 73% ownership interest if certain return thresholds are met.
Purchase Price Assignment
The Company assigns the purchase price of real estate to tangible and intangible assets and liabilities based on fair value. Tangible assets consist of land, building, garage, building improvements and tenant improvements. Intangible assets and liabilities consist of the value of above and below market leases, lease costs, the value of in-place leases and any value attributable to above or below market debt assumed with the acquisition.
The Company engages independent third-party appraisers to perform the valuations used to determine the fair value of these identifiable tangible and intangible assets. These valuations and appraisals use commonly employed valuation techniques, such as discounted cash flow analyses. Factors considered in these analyses include an estimate of costs during hypothetical expected lease-up periods considering current market conditions and costs to execute similar leases. The Company also considers information obtained about each property as a result of its pre-acquisition due diligence, marketing and leasing activities in estimating the fair value of the tangible and intangible assets acquired. The Company includes real estate taxes, insurance and other operating expenses and estimates of lost rentals at market rates during the expected lease-up periods depending on specific local market conditions and the type of property acquired. Additionally, the Company estimates costs to execute similar leases including leasing commissions, legal and other related expenses.
The fair value of above or below market in-place lease values is the present value of the difference between the contractual amount to be paid pursuant to the in-place lease and the estimated current market lease rate expected over the remaining non-cancelable life of the lease. The capitalized above market lease values are amortized as a reduction of rental income over the remaining term of the respective leases. The portion of the values of the leases associated with below-market renewal options that are likely to be exercised are amortized to rental income over the respective renewal. The capitalized below market lease values are amortized as an increase to rental income over the remaining term of the respective leases. Total amortization for above and below market leases, excluding amounts classified as discontinued operations, was a net increase (reduction) of rental income of $16.3 million, $13.7 million and $(2.2) million for the years ended December 31, 2015, 2014 and 2013, respectively.
As of December 31, 2015, the remaining amortization of net below market leases is projected as a net increase to rental income as follows (in thousands):
Amount | |||
2016 | $ | 7,182 | |
2017 | 5,281 | ||
2018 | 3,854 | ||
2019 | 4,394 | ||
2020 | 4,750 | ||
Thereafter | 15,304 | ||
Total | $ | 40,765 | |
The fair value of in-place leases is the present value associated with re-leasing the in-place lease as if the property was vacant. Factors to be considered include estimates of costs during hypothetical expected lease-up periods considering current market conditions and costs to execute similar leases. In estimating costs, the Company includes estimates of lost rentals at market rates during the expected lease-up periods. The value of at market in-place leases is amortized as a lease cost amortization expense over the expected life of the lease. Total amortization expense for the value of in-place leases, excluding amounts classified as discontinued operations, was $45.3 million, $51.8 million and $26.9 million for the years ended December 31, 2015, 2014 and 2013, respectively.
76
As of December 31, 2015, the remaining amortization expense for the value of in-place leases is projected as follows (in thousands):
Amount | |||
2016 | $ | 28,364 | |
2017 | 20,693 | ||
2018 | 13,804 | ||
2019 | 10,336 | ||
2020 | 8,164 | ||
Thereafter | 16,835 | ||
Total | $ | 98,196 | |
A separate component of the fair value of in-place leases is identified for the lease costs. The fair value of lease costs represents the estimated commissions and legal fees paid in connection with the current leases in place. Lease costs are amortized over the non-cancelable terms of the respective leases as lease cost amortization expense.
In no event does the amortization period for intangible assets exceed the remaining depreciable life of the building. Should a customer terminate its lease, the unamortized portion of the tenant improvement, in-place lease value and lease cost intangibles would be charged to expense. Additionally, the unamortized portion of above market in-place leases would be recorded as a reduction to rental income and the below market in-place lease value would be recorded as an increase to rental income.
The Company calculates the fair value of mortgage notes payable by discounting the remaining contractual cash flows on each instrument at the current market rate for these borrowings.
Capitalization of Costs
Costs related to planning, developing, leasing and constructing a property, including costs of development personnel working directly on projects under development, are capitalized. In addition, the Company capitalizes interest to qualifying assets under development based on average accumulated expenditures outstanding during the period. In capitalizing interest to qualifying assets, the Company first uses the interest incurred on specific project debt, if any, and next uses the Company's weighted average interest rate for non-project specific debt. The Company also capitalizes certain costs of leasing personnel in connection with the completion of leasing arrangements.
Net Income (Loss) Per Common Share
Basic earnings per share ("EPS") is computed by dividing income (loss) attributable to common stockholders by the weighted-average number of common shares outstanding for the year. In arriving at net income (loss) attributable to common stockholders, preferred stock dividends are deducted. Diluted EPS reflects the potential dilution that could occur if share equivalents such as Operating Partnership units, employee stock options, RSUs, restricted shares, deferred incentive share units and LTIP units were exercised or converted into common stock that then shared in the earnings of the Company.
Allowance for Doubtful Accounts
Accounts receivable are reduced by an allowance for amounts that the Company estimates to be uncollectible. The receivable balance is comprised primarily of rent and expense reimbursement income due from the customers. Management evaluates the adequacy of the allowance for doubtful accounts considering such factors as the credit quality of the customers, delinquency of payment, historical trends and current economic conditions. The Company provides an allowance for doubtful accounts for customer balances that are over 90 days past due and for specific customer receivables for which collection is considered doubtful.
Cash Equivalents
The Company considers all highly liquid investments with a maturity of three months or less when purchased to be cash equivalents.
77
Restricted Cash
Restricted cash, which is included in receivables and other assets, primarily consists of security deposits held on behalf of the Company's tenants as well as capital improvements and real estate tax escrows required under certain loan agreements. There are restrictions on the Company's ability to withdraw these funds other than for their specified usage.
Noncontrolling Interest
A noncontrolling interest in a subsidiary is in most cases an ownership interest in the consolidated entity that should be reported as equity in the consolidated financial statements and separate from the parent company's equity. In addition, consolidated net income is required to be reported as amounts that include the amounts attributable to both the parent and the noncontrolling interest and the amount of consolidated net income attributable to the parent and the noncontrolling interest are required to be disclosed on the face of the consolidated statements of operations and comprehensive income (loss).
Certain holders of Operating Partnership units have registration rights with respect to shares of Common Stock issuable upon conversion of such units, or have shares of Common Stock available for issuance under effective registration statements. In cases where the Company is unable to issue registered shares, the Company may deliver unregistered shares of Common Stock. Accordingly, the Operating Partnership units are classified in permanent equity at December 31, 2015 and 2014.
Revenue Recognition
Revenue from real estate rentals is recognized on a straight-line basis over the terms of the respective leases. The cumulative difference between lease revenue recognized under this method and contractual lease payment terms is recorded as straight-line rent receivable on the accompanying balance sheets. The straight-line rent adjustment increased revenue by $37.8 million, $21.0 million and $14.6 million in 2015, 2014 and 2013, respectively.
When the Company is the owner of the tenant improvements, the leased space is ready for its intended use when the tenant improvements are substantially completed, at which point revenue recognition begins. In limited instances, when the tenant is the owner of the customer improvements, straight-line rent is recognized when the tenant takes possession of the unimproved space.
The leases also typically provide for tenant reimbursement of a portion of common area maintenance, real estate taxes and other operating expenses. Property operating cost recoveries from customers ("expense reimbursements") are recognized as revenue in the period in which the expenses are incurred. The computation of expense reimbursements is dependent on the provisions of individual customer leases. Most customers make monthly fixed payments of estimated expense reimbursements. The Company makes adjustments, positive or negative, to expense reimbursement income quarterly to adjust the recorded amounts to the Company's best estimate of the final property operating costs based on the most recent annual estimate. After the end of the calendar year, the Company computes each customer's final expense reimbursements and issues a bill or credit for the difference between the actual amount and the amounts billed monthly during the year. Differences between actual billed amounts and accrued amounts are considered immaterial.
Management company income represents market-based fees earned from providing management, construction, leasing, brokerage and acquisition services to unconsolidated joint ventures, related parties and third parties. Management fee income is computed and recorded monthly in accordance with the terms set forth in the management service agreements. Leasing and brokerage commissions, as well as salary and administrative fees, are recognized pursuant to the terms of the agreements at the time underlying leases are signed, which is the point at which the earnings process is complete and collection of fees is reasonably assured. Fees relating to the purchase or sale of property are recognized when the earnings process is complete and collection of fees is reasonably assured, which usually occurs at closing. All fees on Company-owned properties and consolidated joint ventures are eliminated in consolidation. The Company recognizes its share of fees earned from unconsolidated joint ventures in management company income.
The Company has one high-rise condominium project. Under the provisions of FASB ASC 360-20, "Property, Plant and Equipment" subsection "Real Estate and Sales," revenue and costs for projects are recognized when all parties are bound by the terms of the contract, all consideration has been exchanged, any permanent financing for which the seller is responsible has been arranged and all conditions precedent to closing have been performed. This results in profit from the sale of condominium units recognized at closing. Revenue is recognized on the contract price of individual units. Total estimated costs are allocated to individual units which have closed on a relative value basis.
78
Investment in Unconsolidated Joint Ventures
The Company accounts for its investment in unconsolidated joint ventures under the equity method of accounting as the Company exercises significant influence, but does not maintain a controlling financial interest over these entities. These investments are recorded initially at cost and subsequently adjusted for cash contributions, distributions and equity in earnings (loss) of the unconsolidated joint ventures. Equity in earnings (loss) in unconsolidated joint ventures is allocated based on ownership or economic interest in each joint venture.
In accordance with FASB ASC 323, "Investments—Equity Method and Joint Ventures," the Company's investments in real estate joint ventures are reviewed for impairment when indicators are present. The Company records impairment charges when events or circumstances change indicating that a decline in the fair values below the carrying values has occurred and such decline is other-than-temporary. The ultimate realization of the investment in real estate joint ventures is dependent on a number of factors, including the performance of each investment and market conditions. No impairment charges related to the Company's investments in unconsolidated joint ventures were recorded during the years ended December 31, 2015, 2014, or 2013.
Amortization of Debt Origination Costs and Leasing Costs
Debt origination costs are deferred and amortized using a method that approximates the effective interest method over the term of the loan. Leasing costs are deferred and amortized using the straight-line method over the term of the respective lease.
Loss on Extinguishment of Debt
When outstanding debt is extinguished, the Company expenses any prepayment penalties, unamortized premium/discounts and loan costs.
Derivative Financial Instruments
The Company recognizes all derivative instruments on the balance sheet at their fair value. Changes in the fair value of derivatives are recorded each period in current earnings or other comprehensive loss if a derivative is designated as part of a hedge transaction and, if it is, the type of hedge transaction. The ineffective portion of the hedge, if any, is immediately recognized in earnings.
Share-Based and Long-Term Compensation
Compensation expense, net of estimated forfeitures, for service-based awards is recognized over the expected vesting period of such awards. The total compensation expense for the long-term equity incentive awards is based upon the fair value of the shares on the grant date, adjusted for estimated forfeitures. Time-vesting restricted shares, restricted share units ("RSUs") and deferred incentive share units are valued based on the New York Stock Exchange ("NYSE") closing market price of the Company's common shares as of the date of grant. The grant date fair value for awards that are subject to performance-based vesting and market conditions, including profits interest units ("LTIP units"), performance-vesting RSUs and long-term equity incentive awards, is determined using a simulation pricing model developed to specifically accommodate the unique features of the awards. The total compensation expense for stock options is estimated based on the fair value of the options as of the date of grant using the Black-Scholes model.
Income Taxes
The Company elected to be taxed as a REIT under the Internal Revenue Code of 1986, as amended (the "Code"), commencing with its taxable year ended December 31, 1997. To qualify as a REIT, the Company must meet a number of organizational and operational requirements, including a requirement that it distribute annually at least 90% of its "REIT taxable income," subject to certain adjustments and excluding any net capital gain to its stockholders. It is management's current intention to adhere to these requirements and maintain the Company's REIT status, and the Company believes that it was in compliance with all REIT requirements at December 31, 2015. As a REIT, the Company generally will not be subject to corporate level federal income tax on taxable income it distributes currently to its stockholders. If the Company fails to qualify as a REIT in any taxable year, it will be subject to federal income taxes at regular corporate rates (including any applicable alternative minimum tax) and may not be able to qualify as a REIT for four subsequent taxable years. Even if the Company qualifies for taxation as a REIT, the Company may be subject to certain state and local taxes on its income and property, and to federal income and excise taxes on its undistributed taxable income. In addition, taxable income from non-REIT activities managed through the taxable TRS is subject to federal, state and local income taxes. The Company provides for income taxes based on pretax income and applicable tax rates
79
in the various jurisdictions in which it operates. Our effective tax rate reflects the impact of earnings attributable to REIT operations and noncontrolling interests for which no U.S. income taxes have been provided.
Fair Value Measurements
Level 1 fair value inputs are quoted prices for identical assets or liabilities in active, liquid and visible markets such as stock exchanges. Level 2 fair value inputs are observable information for similar assets or liabilities in active or inactive markets, and appropriately consider counterparty creditworthiness in the valuations. Level 3 fair value inputs reflect the Company's best estimate of inputs and assumptions market participants would use in pricing an asset or liability at the measurement date. These inputs are unobservable in the market and significant to the valuation estimate.
Impairment of Intangible Assets
During 2014, the Company evaluated certain qualitative factors and determined that it was necessary to apply the two-step quantitative impairment test under ASU 2011-8. During the year ended December 31, 2014, the Company determined that the undiscounted cash flows indicated that the carrying amounts of Eola Capital, LLC ("Eola") management contracts were not expected to be recovered and, as a result, the Company recorded a $4.8 million pre-tax non-cash impairment loss related to these management contracts which resulted in the entire remaining balance of the Eola contracts being written off as of December 31, 2014. During the year ended December 31, 2015, no impairment losses were recorded on the Company's intangible assets.
Segment Reporting
The Company's primary business is the ownership and operation of office properties. The Company has accounted for each office property or groups of related office properties as an individual operating segment. The Company has aggregated the individual operating segments into a single reporting segment due to the fact that the individual operating segments have similar operating and economic characteristics, such as being leased by the square foot, sharing the same primary operating expenses and ancillary revenue opportunities and being cyclical in economic performance based on current supply and demand conditions. The individual operating segments are also similar in that revenues are derived from the leasing of office space to customers and each office property is managed and operated consistently in accordance with standard operating procedures. The range and type of customer uses of the properties is similar throughout the portfolio regardless of location or class of building and the needs and priorities of the customers do not vary widely from building to building. Therefore, the management responsibilities do not vary widely from location to location based on the size of the building, geographic location or class.
Reclassifications
Certain reclassifications have been made in the 2014 and 2013 consolidated financial statements to conform to the 2015 classifications with no impact on previously reported net income or equity.
Recent Accounting Pronouncements
Effective January 1, 2014, the Company adopted guidance issued by FASB ASU No. 2014-08, "Reporting Discontinued Operations and Disclosures of Disposals of Components of an Entity." This update amends the criteria for reporting discontinued operations to, among other things, raise the threshold for disposals to qualify as discontinued operations, and only disposals that represent a strategic shift in operations that is material will be presented as discontinued operations. This update is effective for interim and annual reporting periods, beginning after December 15, 2014, with early adoption permitted. The Company presents 2014 and 2015 property sales, and will present future property sales, to the extent they do not represent a strategic shift in operations, in the continuing operations section of the consolidated statements of operations and comprehensive income (loss) with the exception of those properties previously included as held for sale at December 31, 2013. The Company's 2014 sales of the Woodbranch Building and Mesa Corporate Center are included in discontinued operations for the year ended December 31, 2014 as these properties were previously classified as held for sale at December 31, 2013. The Company's 2014 sales of the Schlumberger Building and 525 North Tryon are included in the continuing operations section of the consolidated statements of operations and comprehensive income (loss) as they were not previously classified as held for sale as of December 31, 2013 and do not qualify for inclusion in discontinued operations as they do not represent a strategic shift in the Company's operations. Additionally, none of the Company's 2015 property sales qualify for inclusion in discontinued operations as they do not represent a strategic shift in the Company's operations.
80
In May 2014, the FASB issued ASU No. 2014-09, "Revenue from Contracts with Customers." This update was initiated in a joint project between the FASB and the International Accounting Standards Board to clarify the principles for recognizing revenue and to develop a common revenue standard for GAAP and International Financial Reporting Standards that would: (1) remove inconsistencies and weaknesses in revenue requirements; (2) provide a more robust framework for addressing revenue issues; (3) improve comparability of revenue recognition practices across entities, industries, jurisdictions and capital markets; (4) provide more useful information to users of financial statements through improved disclosure requirements; and (5) simplify the preparation of financial statements by reducing the number of requirements to which an entity must refer. The core principle of the guidance is that an entity should recognize revenue to depict the transfer of promised goods or services to customers in an amount that reflects the consideration to which the entity expects to be entitled in exchange for those goods and services. This update is effective for interim and annual reporting periods, beginning after December 15, 2016, and early application is not permitted. The standard allows for either "full retrospective" adoption, meaning the standard is applied to all of the periods presented, or "modified retrospective" adoption, meaning the standard is applied only to the most recent period presented in the financial statements. The Company is currently assessing this guidance for future implementation.
In August 2015, the FASB issued ASU No. 2015-14, “Revenue from Contracts with Customers,” which deferred the effective date to annual reporting periods beginning after December 15, 2017, including interim reporting periods within that reporting period. Earlier application is permitted only as of annual reporting periods beginning after December 15, 2016, including interim reporting periods within that reporting period.
In August 2014, the FASB issued ASU No. 2014-15, "Presentation of Financial Statements - Going Concern." The amendments in this update provide guidance in GAAP about management's responsibilities to evaluate whether there is substantial doubt about an entity's ability to continue as a going concern and to provide related footnote disclosures. The main provision of the amendments are for an entity's management, in connection with the preparation of financial statements, to evaluate whether there are conditions or events, considered in the aggregate, that raise substantial doubt about the entity's ability to continue as a going concern within one year after the date that the financial statements are issued. Management's evaluation should be based on relevant conditions and events that are known or reasonably knowable at the date the financial statements are issued. When management identifies conditions or events that raise substantial doubt about an entity's ability to continue as a going concern, the entity should disclose information that enables users of the financial statements to understand all of the following: (1) principal conditions or events that raised substantial doubt about the entity's ability to continue as a going concern (before consideration of management's plans); (2) management's evaluation of the significance of those conditions or events in relation to the entity's ability to meet its obligations; and (3) management's plans that alleviated substantial doubt about the entity's ability to continue as a going concern or management's plans that are intended to mitigate the conditions or events that raise substantial doubt about the entity's ability to continue as a going concern. The amendments in this update are effective for interim and annual reporting periods after December 15, 2016 and early application is permitted. The Company is currently assessing this guidance for future implementation.
In January 2015, the FASB issued ASU No. 2015-01, "Income Statement - Extraordinary and Unusual Items (Subtopic 225-20): Simplifying Income Statement Presentation by Eliminating the Concept of Extraordinary Items," (“ASU 2015-01”). ASU 2015-01 eliminates the concept of an extraordinary item from GAAP. As a result, an entity will no longer be required to segregate extraordinary items from the results of ordinary operations, to separately present an extraordinary item on its income statement, net of tax, after income from continuing operations or to disclose income taxes and earnings-per-share data applicable to an extraordinary item. However, ASU 2015-01 will still retain the presentation and disclosure guidance for items that are unusual in nature and occur infrequently. ASU 2015-01 will be effective for the Company’s fiscal year beginning January 1, 2016 and subsequent interim periods. The adoption of ASU 2015-01 is not expected to have a material effect on the Company’s consolidated financial statements.
In February 2015, the FASB issued new consolidation guidance which makes changes to both the variable interest model and the voting model. The new standard specifically eliminates the presumption in the current voting model that a general partner controls a limited partnership or similar entity unless that presumption can be overcome. Generally, only a single limited partner that is able to exercise substantive kick-out rights will consolidate. The new standard became effective for the Company beginning on January 1, 2016. The new standard must be applied using a modified retrospective approach by recording either a cumulative-effect adjustment to equity as of the beginning of the period of adoption or retrospectively to each period presented. While adoption of the new standard did not result in any changes to conclusions about whether a joint venture was consolidated or unconsolidated, the Company has determined that certain of its joint ventures will now qualify as variable interest entities and therefore will require additional disclosures.
In April 2015, the FASB issued ASU No. 2015-03, "Simplifying the Presentation of Debt Issuance Costs." This standard amends existing guidance to require the presentation of debt issuance costs in the balance sheet as a deduction from the carrying amount of the related debt liability instead of a deferred charge. It is effective for annual reporting periods beginning after December 15, 2015, with early adoption permitted. Retrospective application of the guidance set forth in this update is required, and as such,
81
once effective, will result in a reclassification of the deferred financing costs currently recorded in receivables and other assets within the consolidated balance sheet to a direct deduction from the carrying amount of debt within total liabilities.
In September 2015, the FASB issued ASU No. 2015-16, "Business Combinations (Topic 805): Simplifying the Accounting for Measurement-Period Adjustments," ("ASU 2015-16"). ASU 2015-16 requires an acquirer to recognize adjustments to provisional amounts that are identified during the measurement period in the reporting period in which the adjustment amounts are determined. Previously, adjustments to provisional amounts were applied retrospectively. This update requires an entity to present separately on the face of the income statement or disclose in the notes the portion of the amount recorded in current-period earnings by line item that would have been recorded in previous reporting periods if the adjustment to the provisional amounts had been recognized as of the acquisition date. ASU 2015-16 became effective for the Company’s fiscal year beginning January 1, 2016 and subsequent interim periods. The adoption of ASU 2015-16 is not expected to have a material effect on the Company’s consolidated financial statements.
Note 2 - Investment in Office Properties
Included in investment in office properties at December 31, 2015 are 35 consolidated office properties located in six states with an aggregate of 14.1 million square feet (unaudited) of leasable space.
The Company's acquisitions are accounted for using the acquisition method in FASB ASC 805, "Business Combinations." The results of each acquired property are included in the Company's results of operations from their respective purchase dates. The impact of 2015 acquired properties on the Company's consolidated statement of operations and comprehensive income (loss) for the year ended December 31, 2015 was a net income of $2.6 million, including $21.0 million of total revenues. The impact of 2014 acquired properties on the Company's consolidated statement of operations and comprehensive income (loss) for the year ended December 31, 2014 was a net loss of $2.1 million, including $28.9 million of total revenues.
2015 Acquisitions
On January 8, 2015, the Company acquired One Buckhead Plaza, an office building located in the Buckhead submarket of Atlanta, Georgia, for a gross purchase price of $157.0 million.
On September 25, 2015, the Company acquired Harborview Plaza, an office building located in the Westshore submarket of Tampa, Florida, for a gross purchase price of $49.0 million.
On October 1, 2015, the Company acquired Two Buckhead Plaza, an office building located in the Buckhead submarket of Atlanta, Georgia, for a gross purchase price of $80.0 million. The Company assumed the first mortgage secured by the property, which had an outstanding balance of approximately $52.0 million with an interest rate of 6.43% as of October 1, 2015 and a maturity date of October 1, 2017.
The aggregate preliminary purchase price assignment related to tangible and intangible assets and liabilities based on Level 2 and Level 3 inputs for One Buckhead Plaza, Harborview Plaza and Two Buckhead Plaza is as follows (in thousands):
Amount | |||
Land | $ | 41,524 | |
Buildings | 224,716 | ||
Tenant improvements | 11,982 | ||
Lease commissions | 8,210 | ||
Lease in place value | 16,108 | ||
Above market leases | 2,026 | ||
Below market leases | (14,426 | ) | |
Mortgage premium for mortgage assumed | (4,140 | ) | |
The assignment of the purchase price was based on preliminary estimates and is subject to change within the measurement period as valuations are finalized.
82
The Company's unaudited pro forma results of operations after giving effect to the purchases of One Buckhead Plaza, Harborview Plaza and Two Buckhead Plaza as if the purchases had occurred on January 1, 2014 is as follows (in thousands, except per share data):
Year Ended | |||||||
December 31, | |||||||
2015 | 2014 | ||||||
(Unaudited) | |||||||
Revenues | $ | 486,680 | $ | 489,312 | |||
Net income attributable to common stockholders | $ | 67,789 | $ | 45,886 | |||
Basic net income attributable to common stockholders | $ | 0.61 | $ | 0.45 | |||
Diluted net income attributable to common stockholders | $ | 0.61 | $ | 0.45 | |||
2014 Acquisitions
On January 30, 2014, the Company completed the acquisition of the JTB Center, a complex of three office buildings located in the Deerwood submarket of Jacksonville, Florida, for a gross purchase price of $33.3 million. The JTB Center was unencumbered by secured indebtedness and financed through available cash.
On April 10, 2014, the Company completed the acquisition of Courvoisier Centre, a complex of two office buildings located in the Brickell submarket of Miami, Florida, for a gross purchase price of $145.8 million. The acquisition was financed through available cash and borrowings under the Company's unsecured term loans.
On April 14, 2014, the Company commenced construction of Hayden Ferry Lakeside III, a planned office development in the Tempe submarket of Phoenix, Arizona. The Operating Partnership entered into an amendment to the partnership agreement of Parkway Properties Office Fund II L.P. ("Fund II") to, among other things, authorize the Hayden Ferry Lakeside III development and authorize the general partner of Fund II to transfer an interest in the ownership of Hayden Ferry Lakeside III, a subsidiary of Fund II, to the Operating Partnership for $2.0 million. The Company now owns a 70% indirect controlling interest in Hayden Ferry Lakeside III. Costs related to planning, developing, leasing and constructing the property, including costs of development personnel working directly on projects under development, are capitalized. For the year ended December 31, 2014, development costs incurred totaled approximately $24.0 million. On July 2, 2014, Fund II closed on a construction loan secured by Hayden Ferry Lakeside III. See "Note 7—Capital and Financing Transactions—Mortgage Notes Payable" for additional details.
On April 14, 2014, the Company completed the acquisition of One Orlando Centre, an office building located in the central business district of Orlando, Florida, for a gross purchase price of $55.1 million. The Company made an $8.0 million equity investment that will be held in lender reserve accounts to fund the leasing and repositioning of the asset. As part of the purchase price, the Company paid $1.1 million to acquire its 100% interest in the property and simultaneously with the equity investment, the existing $68.3 million first mortgage note secured by the property was restructured into a new $54.0 million first mortgage and a $15.3 million subordinated note. See "Note 7—Capital and Financing Transactions—Mortgage Notes Payable" for additional details.
On July 3, 2014, the Company completed the acquisition of Millenia Park One, an office building located in the Millenia submarket of Orlando, Florida, for a gross purchase price of $25.5 million. The acquisition was funded using available cash and borrowings from the Company's senior unsecured revolving credit facility.
On July 29, 2014, the Company purchased a first mortgage note in an original principal amount of $50.0 million secured by The Forum at West Paces, an office building located in the Buckhead submarket of Atlanta, Georgia. The total purchase price for the note, which was previously under special servicer oversight, was approximately $47.0 million. The note purchase was funded with borrowings under the Company's senior unsecured revolving credit facility. On August 19, 2014, the Company took ownership of The Forum at West Paces with a deed in lieu of foreclosure.
On November 17, 2014, the Company and The California State Teachers' Retirement System ("CalSTRS") terminated their joint venture in Austin, Texas. As part of the agreement, the Company acquired CalSTRS' 60% interest in San Jacinto Center and One Congress Plaza, resulting in 100% ownership of these two assets, and transferred its 40% interest in Frost Bank Tower, 300 West 6th Street and One American Center to CalSTRS. The fair value of the Company's equity interest at November 17, 2014 was $124.7 million, which was determined using Level 2 inputs based on the fair values negotiated between the Company and CalSTRS. In connection with this transaction, the Company received net proceeds of approximately $43.6 million from CalSTRS
83
and recognized a $52.8 million remeasurement gain, which was calculated as the difference between the fair value of the equity interest and the Company's basis in the investment in joint venture, and which is included in gain on sale of real estate in the Company's 2014 consolidated statement of operations and comprehensive income (loss).
On December 9, 2014, the Company acquired Corporate Center I, Corporate Center II and Corporate Center III, located in the Westshore submarket of Tampa, Florida, for a gross purchase price of $240.1 million. The acquisition of the Corporate Center assets was funded through a combination of proceeds received from the Company’s September 2014 public offering of common stock and borrowings under the Company’s senior unsecured revolving credit facility. In conjunction with the closing of the Corporate Center acquisition, the Company completed the purchase and immediate sale of 19 additional office properties located in six states. The Company sold these 19 office assets, which were not consistent with the Company’s current investment strategy, for a gross sale price of $234.8 million at no gain or loss.
On December 30, 2014, the Company purchased a leasehold interest in approximately seven acres of land available for development for a gross purchase price of $4.7 million. On December 31, 2014, the Company acquired approximately 6.5 acres of land available for development for a gross purchase price of $4.8 million. Both land parcels are located in the Westshore submarket of Tampa, Florida adjacent to the Company's Corporate Center I, II, III and IV assets.
The following table summarizes the aggregate purchase price assignments for JTB Center, Courvoisier Centre(1), One Orlando Centre, Millenia Park One, The Forum at West Paces, Corporate Center I, Corporate Center II, Corporate Center III, Corporate Center land and leasehold improvements, One Congress Plaza and San Jacinto Center (in thousands):
Amount | |||
Land | $ | 146,602 | |
Buildings | 617,807 | ||
Tenant improvements | 46,146 | ||
Lease commissions | 17,575 | ||
Lease in place value | 47,070 | ||
Above market leases | 10,272 | ||
Above (below) market ground leases, net | 16,687 | ||
Below market leases | (21,433 | ) | |
Mortgage premium for mortgages assumed | (18,251 | ) | |
(1) The purchase price of Courvoisier Centre was reduced by $5.3 million of credits from the seller.
The unaudited pro forma effect on the Company's results of operations for the purchase of JTB Center, Courvoisier Centre, One Orlando Centre, Millenia Park One, The Forum at West Paces, Corporate Center I, Corporate Center II, Corporate Center III, One Congress Plaza and San Jacinto Center as if the purchases had occurred on January 1, 2013 is as follows (in thousands, except per share data):
Year Ended | |||||||
December 31, | |||||||
2014 | 2013 | ||||||
(Unaudited) | |||||||
Revenues | $ | 493,708 | $ | 370,980 | |||
Net income (loss) attributable to common stockholders | $ | 39,873 | $ | (18,471 | ) | ||
Basic net income (loss) attributable to common stockholders | $ | 0.39 | $ | (0.28 | ) | ||
Diluted net income (loss) attributable to common stockholders | $ | 0.37 | $ | (0.28 | ) | ||
Development Property
The Company has a consolidated joint venture with Fund II for Hayden Ferry Lakeside III, a development property located in Phoenix, Arizona. The Company has a 57.142% direct membership interest in the joint venture with Fund II as a 42.858% investor. In total, the Company is, directly and indirectly, a 70% investor in the joint venture, and TRST is a 30% investor.
84
During the years ended December 31, 2015 and 2014, Fund II increased its investment in the Hayden Ferry Lakeside III development by $37.3 million and $24.0 million, respectively, of which the Company's share was approximately $26.1 million and $16.8 million, respectively. To date, Fund II has invested $61.3 million in the project and expects the total investment to be approximately $68.8 million. As of December 31, 2015, the Company's total investment and its expected total investment were approximately $42.9 million and $48.2 million, respectively.
2015 Dispositions
On January 15, 2015, the Company sold the Raymond James Tower, an office property located in Memphis, Tennessee, for a gross sale price of $19.3 million, providing $8.9 million in buyer credits, and recognized a loss of approximately $117,000 during the year ended December 31, 2015.
On February 4, 2015, the Company sold the Honeywell Building, an office property located in Houston, Texas, for a gross sale price of $28.0 million, and recognized a gain of approximately $14.3 million during the year ended December 31, 2015.
On April 8, 2015, Fund II sold Two Ravinia Drive, an office property located in Atlanta, Georgia, for a gross sale price of $78.0 million, and recognized a gain of approximately $29.0 million during the year ended December 31, 2015, of which $8.7 million was the Company's share. For a discussion of Fund II's paydown of the mortgage debt secured by Two Ravinia Drive, see "Note 7—Capital and Financing Transactions—Mortgage Notes Payable."
On May 8, 2015, the Company sold 400 North Belt, an office property located in Houston, Texas, for a gross sale price of $10.2 million, and recognized a loss of approximately $1.2 million during the year ended December 31, 2015.
On May 13, 2015, the Company sold Peachtree Dunwoody, an office property located in Atlanta, Georgia, for a gross sale price of $53.9 million, and recognized a gain of approximately $14.5 million during the year ended December 31, 2015.
On June 5, 2015, the Company sold Hillsboro I-IV and V, office properties located in Ft. Lauderdale, Florida, for a gross sale price of $22.0 million, and recognized a gain of approximately $2.4 million during the year ended December 31, 2015.
On June 12, 2015, the Company sold Riverplace South, an office property located in Jacksonville, Florida, for a gross sale price of $9.0 million, and recognized a gain of approximately $466,000 during the year ended December 31, 2015.
On July 7, 2015, the Company sold Westshore Corporate Center and Cypress Center I-III, office properties located in Tampa, Florida, and Cypress Center IV, a parcel of land also located in Tampa, Florida, for a gross sale price of $66.0 million, and recognized a gain of approximately $19.2 million during the year ended December 31, 2015.
On July 16, 2015, Fund II sold 245 Riverside, an office property located in Jacksonville, Florida, for a gross sale price of $25.1 million, and recognized a gain of approximately $7.2 million during the year ended December 31, 2015, of which $2.2 million was the Company's share. For a discussion of Fund II's paydown of the mortgage debt secured by 245 Riverside, see "Note 7—Capital and Financing Transactions—Mortgage Notes Payable."
On July 31, 2015, the Company sold 550 Greens Parkway, an office property located in Houston, Texas, for a gross sale price of $2.3 million, and recognized a gain of approximately $37,000 during the year ended December 31, 2015. During the year ended December 31, 2015, utilizing Level 2 fair value inputs, including its purchase and sale agreement dated July 24, 2015, the Company determined the carrying value of 550 Greens Parkway was not recoverable. As a result, the Company recognized an impairment loss on real estate of $4.4 million for the difference between the carrying value and the estimated fair value during the year ended December 31, 2015.
On September 1, 2015, the Company sold Comerica Bank Building, an office property located in Houston, Texas, for a gross sale price of $31.4 million, and recognized a gain of approximately $13.0 million during the year ended December 31, 2015.
On September 3, 2015, the Company sold Squaw Peak I & II, an office property located in Phoenix, Arizona, for a gross sale price of $51.3 million, and recognized a gain of approximately $13.2 million during the year ended December 31, 2015.
On September 11, 2015, the Company sold One Commerce Green, an office property located in Houston, Texas, for a gross sale price of $47.5 million, providing $23.5 million in buyer credits, and recognized a loss of approximately $5.2 million during the year ended December 31, 2015.
85
On September 30, 2015, the Company sold City Centre, an office property located in Jackson, Mississippi, for a gross sale price of $6.2 million, and recognized a loss of approximately $108,000 during the year ended December 31, 2015. The Company recognized an impairment loss on real estate of $1.0 million for the difference between the carrying value and the estimated fair value during the year ended December 31, 2015.
On December 23, 2015, the Company sold Millenia Park One, an office property located in Orlando, Florida for a gross sales price of $28.2 million, and recognized a gain of approximately $3.5 million during the year ended December 31, 2015.
2014 Dispositions
On January 14, 2014, the Company sold the Woodbranch Building, an office property located in Houston, Texas, for a gross sale price of $15.0 million. The Company received approximately $13.9 million in net proceeds, which were used to fund subsequent acquisitions. The Company recorded a gain of approximately $10.0 million during the year ended December 31, 2014.
On January 31, 2014, the Company sold Mesa Corporate Center, an office property located in Phoenix, Arizona, for a gross sale price of $13.2 million. The Company received approximately $12.1 million in net proceeds from the sale, which were used to fund subsequent acquisitions. The Company recorded a gain of approximately $489,000 during the year ended December 31, 2014.
On September 4, 2014, the Company sold the Schlumberger Building located in Houston, Texas. The Company received approximately $17.0 million in gross proceeds. The Company received $16.2 million in net proceeds from the sale, which the Company used to fund subsequent acquisitions. The Company recorded a gain of approximately $6.7 million during the year ended December 31, 2014.
On October 6, 2014, Fund II sold Tempe Town Lake, a parcel of land zoned for a hotel development in Tempe, Arizona, for a gross sale price of $2.0 million. Fund II recognized a gain of $739,000, of which $221,700 was the Company’s share during the year ended December 31, 2014.
On December 29, 2014, the Company sold 525 North Tryon, an office property located in Charlotte, North Carolina, for a gross sale price of $60.0 million. The Company recognized a gain on the sale of approximately $16.1 million during the year ended December 31, 2014.
Contractual Obligations and Minimum Rental Receipts
Obligations for tenant improvement allowances and lease commission costs for leases in place and commitments for building improvements at December 31, 2015 are as follows (in thousands):
2016 | $ | 56,708 | |
2017 | 2,377 | ||
2018 | 10 | ||
2019 | 114 | ||
2020 | 3,007 | ||
Thereafter | 25 | ||
Total | $ | 62,241 | |
Minimum future operating lease payments for various equipment leased at the office properties is as follows for operating leases in place at December 31, 2015 (in thousands):
2016 | $ | 163 | |
2017 | 122 | ||
2018 | 72 | ||
2019 | 9 | ||
2020 | — | ||
Total | $ | 366 | |
86
The following is a schedule by year of future minimum rental receipts under noncancelable leases for office buildings owned at December 31, 2015 (in thousands):
2016 | $ | 358,388 | |
2017 | 361,162 | ||
2018 | 332,595 | ||
2019 | 297,855 | ||
2020 | 267,131 | ||
Thereafter | 1,119,145 | ||
Total | $ | 2,736,276 | |
The following is a schedule by year of future minimum ground lease payments at December 31, 2015 (in thousands):
2016 | $ | 1,264 | |
2017 | 1,294 | ||
2018 | 1,294 | ||
2019 | 1,294 | ||
2020 | 1,296 | ||
Thereafter | 91,378 | ||
Total | $ | 97,820 | |
At December 31, 2015, the Company owned Corporate Center I, Corporate Center II and Corporate Center III in Tampa, Florida, each of which are subject to a ground lease. The leases have remaining terms of approximately 65 years with expiration dates of December 31, 2080. Payments consist of a stated monthly amount that adjusts five percent every tenth anniversary through the expiration date.
At December 31, 2015, the Company owned Corporate Center IV in Tampa, Florida which is subject to a ground lease. The lease has a remaining term of approximately 65 years with an expiration date of December 2080. Payments consist of a stated monthly amount that adjusts annually.
At December 31, 2015, the Company has a leasehold interest in land in Tampa, Florida. The lease has a remaining term of approximately 65 years with an expiration date of December 31, 2080. Payments consist of a stated monthly amount that adjusts five percent every tenth anniversary through the expiration date.
At December 31, 2015, the Company owned NASCAR Plaza in Charlotte, North Carolina, which is subject to a ground lease. The lease has a remaining term of approximately 90 years with an expiration date of December 2105. Payments consist of a stated monthly amount through the expiration date.
At December 31, 2015, the Company owned Lincoln Place in Miami, Florida, which is subject to a ground lease. The lease has a remaining term of approximately 34 years with an expiration date of August 31, 2049. Payments consist of a stated monthly amount through the expiration date.
The Company recognized ground rent expenses for these leases of $1.5 million, $601,000, and $198,000 for the years ended December 31, 2015, 2014 and 2013, respectively.
Note 3 - Mortgage Loan Receivable
On June 3, 2013, the Company issued a $13.9 million first mortgage loan to the US Airways Building Tenancy in Common, which is secured by the US Airways Building, an office building located in Phoenix, Arizona in which the Company owns a 74.6% interest, with US Airways owning the remaining 25.4% interest in the building. The mortgage loan has a fixed interest rate of 3.0% and matures on December 31, 2016. As of December 31, 2015 and 2014, the balance of the mortgage loan was $13.1 million and $13.4 million, respectively. Because the Company acts as both the lender and the borrower for this mortgage loan, its share of the mortgage loan is not reflected on the Company's consolidated balance sheets. As of December 31, 2015 and 2014, the balance of the Company's mortgage loan receivable was $3.3 million and $3.4 million, respectively.
87
Note 4 - Investment in Unconsolidated Joint Ventures
In addition to the 35 office properties included in the consolidated financial statements, the Company was also invested in three unconsolidated joint ventures as of December 31, 2015. Accordingly, the assets and liabilities of the joint ventures are not included on the Company's consolidated balance sheet at December 31, 2015. Information relating to these unconsolidated joint ventures is summarized below (in thousands, except ownership percentages):
Parkway's | December 31, | |||||||||||
Joint Venture Entity | Location | Ownership% | 2015 | 2014 | ||||||||
US Airways Building Tenancy in Common | Phoenix, AZ | 74.58% | $ | 38,472 | $ | 39,760 | ||||||
7000 Central Park JV LLC ("7000 Central Park") | Atlanta, GA | 40.00% | 120 | 15,790 | ||||||||
Tryon Place, LLC | Charlotte, NC | 14.80% | 1,000 | — | ||||||||
$ | 39,592 | $ | 55,550 | |||||||||
US Airways Building Tenancy in Common
On June 3, 2013, the Company purchased a 74.6% interest in the US Airways Building, an office building located in the Tempe submarket of Phoenix, Arizona, for a purchase price of $41.8 million. US Airways owns the remaining 25.4% interest in the building. This office building is adjacent to the Company's Hayden Ferry Lakeside and Tempe Gateway assets and shares a parking garage with Tempe Gateway. The property is the headquarters for US Airways, which has leased 100% of the building through April 2024. US Airways has a termination option on December 31, 2021 with 12 months' prior written notice. At closing, the Company issued a $13.9 million first mortgage loan to the US Airways Building Tenancy in Common, which is secured by the US Airways Building. The mortgage loan has a fixed interest rate of 3.0% and matures on December 31, 2016. As of December 31, 2015 and 2014, the balance of the mortgage loan was $13.1 million and $13.4 million, respectively. Because the Company acts as both the lender and the borrower for this mortgage loan, its share of the mortgage loan is not reflected on the Company's consolidated balance sheets. As of December 31, 2015 and 2014, the balance of the Company's mortgage loan receivable was $3.3 million and $3.4 million, respectively.
7000 Central Park
On November 5, 2013, the Company and its joint venture partner foreclosed and took ownership of 7000 Central Park, an office building located in the Central Perimeter of Atlanta, Georgia. The Company previously acquired a 40% common equity interest in a mortgage note secured by the asset for approximately $45.0 million, comprised of an investment of approximately $37.0 million for a preferred equity interest in the joint venture that acquired the note and an investment of approximately $8.0 million for a 40% common equity interest. On December 13, 2013, the Company and its joint venture partner placed secured financing on the asset in the amount of $30.0 million, the net proceeds of which were used to repay a portion of the Company’s initial preferred equity investment, reducing the preferred equity interest to approximately $7.6 million. The loan has a floating interest rate based on the one-month LIBOR rate plus a spread of 180 basis points, which represents an initial aggregate interest rate of 1.97%. The joint venture also purchased an interest rate hedge that caps LIBOR at 1.75% through December 2016 for the full amount of the loan. The loan has a maturity date of December 2016. On November 6, 2015, the Company and its joint venture partner sold 7000 Central Park for a gross sale price of $85.3 million. The joint venture recognized a gain on the sale of 7000 Central Park of approximately $30.5 million, and the Company recognized a gain on the sale of approximately $9.7 million during the year ended December 31, 2015.
Tryon Place, LLC
On December 23, 2015, the Company entered into a joint venture agreement with a third party investor for the purpose of exploring a development opportunity in Charlotte, North Carolina. The Company's investment in this joint venture was $1.0 million as of December 31, 2015.
PKY/CalSTRS Austin, LLC
On December 19, 2013, in connection with the Company's merger transactions with Thomas Properties Group, Inc. ("TPGI") (such transactions, the "Mergers"), the Company acquired TPGI's interest in PKY/CalSTRS Austin, LLC (the "Austin Joint Venture"). The Company and Madison International Realty ("Madison") owned a 50% interest in the joint venture with CalSTRS, of which the Company's ownership interest was 33%. The Austin Joint Venture owned the following properties: San Jacinto Center; Frost Bank Tower; One Congress Plaza; One American Center; and 300 West 6th Street. The cost of the Austin Joint Venture was adjusted to recognize the Company’s interest in the Austin Joint Venture’s earnings or losses. The difference
88
between (a) the Company’s ownership percentage in the Austin Joint Venture multiplied by its earnings and (b) the amount of the Company’s equity in earnings of the Austin Joint Venture as reflected in the financial statements relates to the amortization or accretion of purchase accounting adjustments made at the time of the Mergers.
On January 24, 2014, pursuant to a put right held by Madison, the Company purchased Madison’s approximately 17% interest in the CalSTRS joint venture for a purchase price of approximately $41.5 million. On February 10, 2014, pursuant to an agreement entered into between CalSTRS and the Company, CalSTRS exercised an option to purchase 60% of Madison's former interest on the same terms as the Company for approximately $24.9 million. After giving effect to these transactions, the Company had a 40% interest in the CalSTRS joint venture and the Austin properties, with CalSTRS owning the remaining 60%.
On November 17, 2014, the Company terminated the Austin Joint Venture. As part of the agreement, the Company acquired CalSTRS' 60% interest in San Jacinto Center and One Congress Plaza, resulting in 100% ownership of two assets, and transferred the Company's 40% interest in Frost Bank Tower, 300 West 6th Street and One American Center to CalSTRS. In connection with this transaction, the Company received net proceeds of approximately $43.6 million from CalSTRS and recognized a $52.8 million gain in 2014.
The following table summarizes the balance sheets of the unconsolidated joint ventures at December 31, 2015 excludes Tryon Place, LLC (in thousands):
US Airways Building | 7000 Central Park (1) | |||||||
Cash | $ | 138 | $ | 421 | ||||
Real estate, net | 46,087 | — | ||||||
Intangible assets, net | 2,265 | — | ||||||
Receivables and other assets | 3,472 | 41 | ||||||
Total assets | $ | 51,962 | $ | 462 | ||||
Mortgage debt | $ | 13,105 | $ | — | ||||
Other liabilities | 381 | 85 | ||||||
Partners' equity | 38,476 | 377 | ||||||
Total liabilities & partners' equity | $ | 51,962 | $ | 462 | ||||
The following table summarizes the income statements of the unconsolidated joint ventures for the year ended December 31, 2015, excludes Tryon Place, LLC (in thousands):
US Airways Building | 7000 Central Park (1) | |||||||
Revenues | $ | 4,504 | $ | 6,840 | ||||
Operating expenses | (8 | ) | (3,376 | ) | ||||
Depreciation and amortization | (2,089 | ) | (3,911 | ) | ||||
Operating income (loss) before other income and expenses | 2,407 | (447 | ) | |||||
Net gains on sale of real estate | — | 30,478 | ||||||
Loss on extinguishment of debt | — | (172 | ) | |||||
Interest expense | (404 | ) | (533 | ) | ||||
Loan cost amortization | — | (720 | ) | |||||
Net income | $ | 2,003 | $ | 28,606 | ||||
(1) The joint venture sold its only asset on November 6, 2015.
89
The following table summarizes the balance sheets of the unconsolidated joint ventures at December 31, 2014 (in thousands):
US Airways Building | 7000 Central Park | |||||||
Cash | $ | 146 | $ | 1,218 | ||||
Restricted cash | — | 269 | ||||||
Real estate, net | 47,632 | 48,532 | ||||||
Intangible assets, net | 5,078 | 4,157 | ||||||
Receivables and other assets | 824 | 2,099 | ||||||
Total assets | $ | 53,680 | $ | 56,275 | ||||
Mortgage debt | $ | 13,441 | $ | 30,000 | ||||
Other liabilities | 370 | 1,561 | ||||||
Partners' equity | 39,869 | 24,714 | ||||||
Total liabilities & partners' equity | $ | 53,680 | $ | 56,275 | ||||
The following table summarizes the income statements of the unconsolidated joint ventures for the year ended December 31, 2014 (in thousands):
US Airways Building | 7000 Central Park | Austin Joint Venture | ||||||||||
Revenues | $ | 4,504 | $ | 7,430 | $ | 86,548 | ||||||
Operating expenses | (3 | ) | (3,856 | ) | (36,467 | ) | ||||||
Depreciation and amortization | (2,089 | ) | (4,352 | ) | (32,877 | ) | ||||||
Operating income (loss) before other income and expenses | 2,412 | (778 | ) | 17,204 | ||||||||
Interest expense | (413 | ) | (593 | ) | (33,671 | ) | ||||||
Loan cost amortization | — | (176 | ) | 565 | ||||||||
Other expenses | — | — | (1 | ) | ||||||||
Net income (loss) | $ | 1,999 | $ | (1,547 | ) | $ | (15,903 | ) | ||||
Note 5 - Receivables and Other Assets
The following represents the composition of Receivables and Other Assets as of December 31, 2015 and 2014:
December 31, | |||||||
2015 | 2014 | ||||||
(In thousands) | |||||||
Rents and fees receivable | $ | 1,491 | $ | 5,892 | |||
Allowance for doubtful accounts | (635 | ) | (1,860 | ) | |||
Straight-line rent receivable | 86,138 | 63,236 | |||||
Other receivables | 9,952 | 20,395 | |||||
Lease costs, net of accumulated amortization of $60,310 and $52,963, respectively | 148,901 | 129,781 | |||||
Loan costs, net of accumulated amortization of $8,746 and $7,321, respectively | 9,954 | 10,185 | |||||
Escrow and other deposits | 40,444 | 28,263 | |||||
Prepaid items | 3,412 | 18,426 | |||||
Cost method investment | 3,500 | 3,500 | |||||
Fair value of interest rate swaps | 474 | 1,131 | |||||
Deferred tax asset, non current | 4,999 | 5,040 | |||||
Other assets | 1,033 | 1,228 | |||||
$ | 309,663 | $ | 285,217 | ||||
Note 6 - Intangible Assets, Net
The following table reflects the portion of the purchase price of office properties assigned to intangible assets, as discussed in "Note 1—Summary of Significant Accounting Policies." The portion of purchase price assigned to below market lease value and the related accumulated amortization is reflected in "Note 9—Accounts Payable and Other Liabilities."
90
December 31, | |||||||
2015 | 2014 | ||||||
(In thousands) | |||||||
Lease in place value | $ | 235,810 | $ | 232,499 | |||
Accumulated amortization | (137,615 | ) | (103,270 | ) | |||
Above market lease value | 52,998 | 80,712 | |||||
Accumulated amortization | (28,889 | ) | (24,536 | ) | |||
Below market ground lease value | 24,889 | — | |||||
Accumulated amortization | (505 | ) | — | ||||
Other intangibles | 3,001 | 3,001 | |||||
Accumulated amortization | (3,001 | ) | (2,918 | ) | |||
$ | 146,688 | $ | 185,488 | ||||
Note 7 - Capital and Financing Transactions
Notes Payable to Banks
At December 31, 2015, the Company had a total of $550.0 million outstanding under the following credit facilities (in thousands):
Credit Facilities | Interest Rate | Maturity | Outstanding Balance | ||||||
$10.0 Million Working Capital Revolving Credit Facility | 1.7 | % | 03/30/2018 | $ | — | ||||
$450.0 Million Revolving Credit Facility | 1.5 | % | 03/30/2018 | — | |||||
$250.0 Million Five-Year Term Loan | 2.6 | % | 03/29/2019 | 250,000 | |||||
$200.0 Million Five-Year Term Loan | 1.5 | % | 06/26/2020 | 200,000 | |||||
$100.0 Million Seven-Year Term Loan | 4.4 | % | 03/31/2021 | 100,000 | |||||
$ | 550,000 | ||||||||
At December 31, 2014, the Company had a total of $481.5 million outstanding under the following credit facilities (in thousands):
Credit Facilities | Interest Rate | Maturity | Outstanding Balance | ||||||
$10.0 Million Working Capital Revolving Credit Facility | 1.7 | % | 03/30/2018 | $ | — | ||||
$250.0 Million Revolving Credit Facility | 1.6 | % | 03/30/2018 | 131,500 | |||||
$250.0 Million Five-Year Term Loan | 2.5 | % | 03/29/2019 | 250,000 | |||||
$100.0 Million Seven-Year Term Loan | 4.3 | % | 03/31/2021 | 100,000 | |||||
$ | 481,500 | ||||||||
Effective April 1, 2014, the Company entered into an Amended, Restated and Consolidated Credit Agreement (the "Amended Agreement") which provides for a $250.0 million senior unsecured revolving credit facility, a $250.0 million five-year unsecured term loan and a $100.0 million seven-year unsecured term loan. The Amended Agreement amended, restated and consolidated the agreements governing the Company's prior $215.0 million senior unsecured revolving credit facility, $125.0 million unsecured term loan and $120.0 million unsecured term loan. The maturity date of the senior unsecured revolving credit facility was extended to March 30, 2018, with an additional one-year extension option, and the $250.0 million five-year unsecured term loan and $100.0 million seven-year unsecured term loan have maturity dates of March 29, 2019 and March 31, 2021, respectively.
The $100.0 million seven-year unsecured term loan tranche had a delayed-draw feature which allowed the Company to draw all or a portion of the $100.0 million commitment in not more than two draws over a 12-month period. The Company drew the full amount on April 8, 2014 and simultaneously repaid in full the first mortgage debt secured by the Bank of America Center in Orlando, Florida, which had an outstanding balance of $33.9 million. The Company recognized a loss on extinguishment of debt of $339,000 on the repayment of the Bank of America Center mortgage.
Additionally, effective April 1, 2014, the Company amended its $10.0 million unsecured working capital credit facility under terms and conditions similar to the Amended Agreement.
91
On January 27, 2015, the Company exercised the accordion feature under its senior unsecured revolving credit facility to increase the facility by $200.0 million to $450.0 million. All other terms and covenants associated with the senior unsecured revolving credit facility remained unchanged as a result of the increase.
On June 26, 2015, the Company entered into a term loan agreement for a $200.0 million five-year unsecured term loan. The unsecured term loan has a maturity date of June 26, 2020, and has an accordion feature that allows for an increase in the size of the unsecured term loan to as much as $400.0 million. Interest on the unsecured term loan is based on LIBOR plus an applicable margin of 0.90% to 1.75% depending on the Company's highest credit rating (with the current margin set at 1.35%). The unsecured term loan has substantially the same operating and financial covenants as required by the Company's $450.0 million senior unsecured revolving credit facility.
The senior unsecured revolving credit facility and unsecured term loans bear interest at LIBOR plus an applicable margin. As a result of the investment grade credit ratings the Company received in January 2015 from the Standard & Poor's Ratings Services and Moody's Investors Service, the Company has changed to a different pricing grid under its existing credit agreement that is based on the Company's most recent credit rating. The new applicable margin for the senior unsecured revolving credit facility is currently1.30% resulting in an all-in rate of 1.49%. The new applicable margin for the $250.0 million five-year unsecured term loan is currently 1.40% resulting in a weighted average all-in rate of 2.56%, after giving effect to the floating-to-fixed-rate interest rate swaps. The new applicable margin for the $100.0 million seven-year unsecured term loan is currently 1.85%, resulting in an all-in rate of 4.41%, after accounting for the floating-to-fixed-rate interest rate swap. For a discussion of interest rate swaps entered into in connection with the Company's unsecured term loans and senior unsecured revolving credit facility, see "—Interest Rate Swaps."
92
Mortgage Notes Payable
A summary of mortgage notes payable at December 31, 2015 and 2014 is as follows (in thousands):
Variable | Fixed | Maturity | Monthly | December 31, | ||||||||||||
Office Properties | Rate | Rate (1) | Date | Payment | 2015 | 2014 | ||||||||||
Wholly Owned | ||||||||||||||||
Westshore Corporate Center | 2.5% | 05/01/2015 | $ | — | $ | — | $ | 14,091 | ||||||||
Teachers Insurance and Annuity Associations (5 properties) | 6.2% | 01/01/2016 | — | — | 68,884 | |||||||||||
John Hancock Facility (2 properties) | 7.6% | 06/01/2016 | — | — | 17,398 | |||||||||||
3350 Peachtree | 7.3% | 03/05/2017 | — | — | 32,185 | |||||||||||
One Orlando Centre | 4.6% | 05/11/2017 | 265 | 54,000 | 54,000 | |||||||||||
One Congress Plaza | 3.2% | 06/11/2017 | 649 | 128,000 | 128,000 | |||||||||||
San Jacinto Center | 3.2% | 06/11/2017 | 509 | 101,000 | 101,000 | |||||||||||
The Pointe | 4.0% | 02/10/2019 | 112 | 23,364 | 23,500 | |||||||||||
Corporate Center IV (2) | 4.6% | 04/08/2019 | 223 | 35,491 | 36,000 | |||||||||||
Citrus Center | 6.3% | 06/01/2020 | 153 | 20,645 | 21,138 | |||||||||||
Stein Mart | 6.5% | 08/01/2020 | 81 | 10,778 | 11,041 | |||||||||||
Phoenix Tower | 3.9% | 03/01/2023 | 417 | 78,555 | 80,000 | |||||||||||
Deerwood North and South | 3.9% | 04/01/2023 | 276 | 84,500 | 84,500 | |||||||||||
Lincoln Place | 3.6% | 06/11/2016 | 293 | 48,030 | 48,670 | |||||||||||
CityWestPlace I & II | 3.5% | 07/06/2016 | 738 | 114,460 | 116,111 | |||||||||||
CityWestPlace III & IV | 4.3% | 03/05/2020 | 512 | 90,334 | 91,889 | |||||||||||
San Felipe Plaza | 4.3% | 12/01/2018 | 576 | 107,877 | 109,585 | |||||||||||
Two Buckhead Plaza | 2.6% | 10/01/2017 | 278 | 52,000 | — | |||||||||||
Total Wholly Owned | 5,082 | 949,034 | 1,037,992 | |||||||||||||
Parkway Properties Office Fund II, LP | ||||||||||||||||
3344 Peachtree | 5.3% | 10/01/2017 | 485 | 80,986 | 82,907 | |||||||||||
Hayden Ferry Lakeside I (2) | 4.5% | 07/25/2018 | 112 | 21,536 | 21,887 | |||||||||||
Hayden Ferry Lakeside II & IV (2) | 4.0% | 07/25/2018 | 227 | 46,064 | 46,875 | |||||||||||
Hayden Ferry Lakeside III | 2.2% | 07/25/2018 | 58 | 31,271 | 481 | |||||||||||
245 Riverside | 5.2% | 03/31/2019 | — | — | 9,166 | |||||||||||
Two Ravinia | 5.0% | 05/20/2019 | — | — | 22,100 | |||||||||||
Two Liberty Place | 5.2% | 06/10/2019 | 495 | 89,567 | 90,200 | |||||||||||
Total Fund II | $ | 1,377 | $ | 269,424 | $ | 273,616 | ||||||||||
Unamortized premium, net | $ | 19,878 | $ | 27,842 | ||||||||||||
Total Mortgage Notes Payable | $ | 6,459 | $ | 1,238,336 | $ | 1,339,450 | ||||||||||
(1) | This represents the net effective interest rate based on GAAP interest expense. |
(2) | Property has entered into an interest rate swap agreement with the Lender associated with these mortgage loans. |
At December 31, 2015 and 2014, the net book value of the office properties collateralizing the mortgage loans was $1.9 billion and $2.0 billion, respectively.
93
The aggregate annual maturities of mortgage notes payable at December 31, 2015 are as follows (in thousands):
Weighted Average GAAP Interest Rate | Total Mortgage Maturities | Balloon Payments | Principal Amortization | ||||||||||
2016 | 3.6% | $ | 175,849 | $ | 161,407 | $ | 14,442 | ||||||
2017 | 3.7% | 426,356 | 412,397 | 13,959 | |||||||||
2018 | 3.9% | 209,724 | 193,500 | 16,224 | |||||||||
2019 | 4.9% | 146,435 | 138,632 | 7,803 | |||||||||
2020 | 4.8% | 115,156 | 110,335 | 4,821 | |||||||||
Thereafter | 3.9% | 144,938 | 135,141 | 9,797 | |||||||||
Total principal maturities | 1,218,458 | $ | 1,151,412 | $ | 67,046 | ||||||||
Fair value premiums on mortgage debt acquired, net | N/A | 19,878 | |||||||||||
Total principal maturities and fair value premium on mortgage debt acquired | 4.0% | $ | 1,238,336 | ||||||||||
On April 8, 2014, the Company repaid the first mortgage debt secured by Bank of America Center and terminated the related $33.9 million floating-to-fixed interest rate swap. The terminated $33.9 million swap had a liability value of $1.9 million which was rolled into the pricing set for the new $100.0 million swap.
On April 14, 2014, the Company purchased One Orlando Centre in Orlando, Florida, and simultaneously restructured the existing first mortgage loan secured by the property. The existing $68.3 million first mortgage note was restructured into a new $54.0 million first mortgage note and a $15.3 million subordinated note. Upon the sale or recapitalization of the property, proceeds are to be distributed first to the lender up to the amount of outstanding principal of the first mortgage note; second, to the Company up to its equity investment; third, to the Company until it receives a 12% annual return on its equity investment; fourth, 60% to the Company and 40% to the lender until the subordinated note is repaid in full; and fifth, to the Company at 100%. At the acquisition date, and as of December 31, 2015, the fair value of the subordinated note was zero.
On July 2, 2014, Fund II closed on a construction loan secured by the Hayden Ferry Lakeside III development in the Tempe submarket of Phoenix, Arizona for $43.0 million, or 62.5% of the total estimated cost of the development, which will be funded subsequent to Fund II's and the Company's equity investment in the development. The loan is initially a 35% recourse loan to Fund II that will be reduced to non-recourse upon stabilization of the property. The loan is cross-collateralized with Fund II's Hayden Ferry Lakeside I, Hayden Ferry Lakeside II, Hayden Ferry Lakeside IV and the adjacent parking garage. The loan matures on July 25, 2018, is interest-only through maturity, and has an interest rate of one-month LIBOR plus 1.80% which decreases to 1.60% upon stabilization. As of December 31, 2015, the balance of the construction loan payable was approximately $31.3 million.
On November 17, 2014, the Company terminated the Austin Joint Venture. As part of the agreement, the Company acquired CalSTRS' 60% interest in One Congress Plaza and San Jacinto Center, resulting in 100% ownership of these two assets. As a result, the Company assumed a mortgage loan with a balance of $128.0 million at December 31, 2014, with an interest rate of 6.1% and a maturity date of June 11, 2017 for One Congress Plaza, and assumed a mortgage loan with a balance of $101.0 million at December 31, 2014, with an interest rate of 6.0% and a maturity date of June 11, 2017 for San Jacinto Center.
On December 31, 2014, the Company extinguished the mortgage loan associated with Raymond James Tower in Memphis, Tennessee with a principal balance of $7.9 million. The Company incurred a loss on extinguishment of debt of approximately $2.1 million as part of the repayment.
On March 5, 2015, the Company extinguished the mortgage note payable associated with Westshore Corporate Center. The balance at the date of payoff was approximately $14.0 million. The Company recognized a gain on extinguishment of debt of approximately $79,000.
On April 3, 2015, the Company paid in full the $68.0 million Teachers Insurance and Annuity Associations mortgage debt secured by Hillsboro I-IV and V, Peachtree Dunwoody, One Commerce Green and the Comerica Bank Building and incurred a $3.0 million prepayment fee as part of the repayments.
On April 6, 2015, the Company paid in full the $31.9 million first mortgage secured by 3350 Peachtree and incurred a $319,000 prepayment fee as part of the repayment.
94
On April 8, 2015, Fund II paid in full the $22.1 million mortgage debt secured by Two Ravinia Drive and incurred a prepayment fee and swap early termination fee of $1.8 million as part of the repayment, of which $525,000 was the Company's share.
On July 16, 2015, Fund II paid in full the $9.1 million mortgage debt secured by 245 Riverside and incurred a prepayment fee and swap early termination fee of $702,000 as part of the repayment, of which $210,000 was the Company's share.
On October 1, 2015, the Company assumed the $52.0 million first mortgage secured by Two Buckhead Plaza. The loan has an interest rate of 6.43% and matures on October 1, 2017.
On December 22, 2015, the Company paid in full the $17.1 million first mortgage debt secured by 5300 Memorial and Town & Country and incurred a $503,000 prepayment fee as part of the repayments.
Interest Rate Swaps
The Company’s objectives in using interest rate derivatives are to add stability to interest expense and to manage its exposure to interest rate movements. To accomplish this objective, the Company primarily uses interest rate swaps and caps as part of its interest rate risk management strategy. Interest rate swaps designated as cash flow hedges involve the receipt of variable amounts from a counterparty in exchange for the Company making fixed-rate payments over the life of the agreements without exchange of the underlying notional amount. Interest rate caps designated as cash flow hedges involve the receipt of variable amounts from a counterparty if interest rates rise above the strike rate on the contract in exchange for an upfront premium.
The Company's interest rate hedge contracts at December 31, 2015 and 2014 are summarized as follows (in thousands):
Asset (Liability) Balance | ||||||||||||||||||||||
Current | December 31, | |||||||||||||||||||||
Type of Hedge | Balance Sheet Location | Associated Loan | Notional Amount | Maturity Date | Reference Rate | Fixed Rate | 2015 | 2014 | ||||||||||||||
Swap | Receivables and Other Assets | 5-year term loan | $ | 50,000 | 09/27/2017 | 1-month LIBOR | 0.7% | $ | 190 | $ | 452 | |||||||||||
Swap | Account payable and other liabilities | 5-year term loan | $ | 120,000 | 06/11/2018 | 1-month LIBOR | 1.6% | (1,515 | ) | (1,438 | ) | |||||||||||
Swap | Account payable and other liabilities | Corporate Center IV | $ | 13,475 | 10/08/2018 | 1-month LIBOR | 3.3% | (68 | ) | (18 | ) | |||||||||||
Swap | Receivables and Other Assets | 5-year term loan | $ | 75,000 | 09/27/2017 | 1-month LIBOR | 0.7% | 284 | 679 | |||||||||||||
Swap | Account payable and other liabilities | Hayden Ferry Lakeside II | $ | 4,316 | 01/25/2018 | 1-month LIBOR | 1.7% | (61 | ) | (71 | ) | |||||||||||
Swap | Account payable and other liabilities | Hayden Ferry Lakeside I | $ | 21,536 | 01/25/2018 | 1-month LIBOR | 4.5% | (655 | ) | (877 | ) | |||||||||||
Swap | Account payable and other liabilities | Hayden Ferry Lakeside II | $ | 41,747 | 01/25/2018 | 1-month LIBOR | 1.5% | (392 | ) | (413 | ) | |||||||||||
Swap | Account payable and other liabilities | 245 Riverside | $ | 9,166 | 09/30/2018 | 1-month LIBOR | 5.2% | — | (617 | ) | ||||||||||||
Swap | Account payable and other liabilities | Corporate Center IV | $ | 22,016 | 10/08/2018 | 1-month LIBOR | 5.4% | (1,295 | ) | (1,613 | ) | |||||||||||
Swap | Account payable and other liabilities | Two Ravinia Drive | $ | 22,100 | 11/18/2018 | 1-month LIBOR | 5.0% | — | (1,317 | ) | ||||||||||||
Swap | Account payable and other liabilities | 5-year term loan | $ | 5,000 | 04/01/2019 | 1-month LIBOR | 1.7% | (76 | ) | (60 | ) | |||||||||||
Swap | Account payable and other liabilities | 7-year term loan | $ | 100,000 | 03/31/2021 | 1-month LIBOR | 2.6% | (4,964 | ) | (4,652 | ) | |||||||||||
$ | (8,552 | ) | $ | (9,945 | ) | |||||||||||||||||
On April 1, 2014, the Company entered into a new $100.0 million floating-to-fixed interest rate swap attributable to one-month LIBOR indexed interest payments made each month. The $100.0 million swap has a fixed rate of 2.6%, an effective date of April 1, 2014 and a maturity date of March 31, 2021. The Company entered into this interest rate swap in connection with its $100.0 million seven-year unsecured term loan that bears interest at LIBOR plus the applicable margin which ranges from 1.75% to 2.30% based on the Company's overall leverage. The current spread associated with the loan is 1.75% resulting in an all-in rate of 4.31%.
The Company designated these swaps as cash flow hedges of the variable interest payments associated with the mortgage loans.
95
Tabular Disclosure of the Effect of Derivative Instruments on the Consolidated Statements of Operations and Comprehensive Income (Loss)
The table below presents the effect of the Company's derivative financial instruments on the Company's consolidated statements of operations and comprehensive income (loss) for the years ended December 31, 2015, 2014 and 2013 (in thousands):
Year Ended | |||||||||||
Derivatives in Cash Flow Hedging Relationships (Interest Rate Swaps) | December 31, | ||||||||||
2015 | 2014 | 2013 | |||||||||
Amount of gain (loss) recognized in other comprehensive income on derivatives | $ | (7,498 | ) | $ | (10,968 | ) | $ | 4,110 | |||
Amount reclassified from accumulated other comprehensive loss into earnings | $ | 7,138 | $ | 7,445 | $ | 5,615 | |||||
Amount of (gain) loss recognized in income on derivatives (ineffective portion, reclassifications of missed forecasted transactions and amounts excluded from effectiveness testing) | $ | 1,859 | $ | (212 | ) | $ | 390 | ||||
Note 8 - Fair Values of Financial Instruments
Fair values of financial instruments were as follows (in thousands):
As of December 31, | |||||||||||||||
2015 | 2014 | ||||||||||||||
Carrying Amount | Fair Value | Carrying Amount | Fair Value | ||||||||||||
Financial Assets: | |||||||||||||||
Cash and cash equivalents | $ | 74,961 | $ | 74,961 | $ | 116,241 | $ | 116,241 | |||||||
Mortgage loan receivable | 3,331 | 3,331 | 3,417 | 3,417 | |||||||||||
Interest rate swap agreements | 474 | 474 | 1,131 | 1,131 | |||||||||||
Financial Liabilities: | |||||||||||||||
Mortgage notes payable | $ | 1,238,336 | $ | 1,235,553 | $ | 1,339,450 | $ | 1,327,637 | |||||||
Notes payable to banks | 550,000 | 548,414 | 481,500 | 477,967 | |||||||||||
Interest rate swap agreements | 9,026 | 9,026 | 11,077 | 11,077 | |||||||||||
The methods and assumptions used to estimate fair value for each class of financial asset or liability are discussed below:
Cash and cash equivalents: The carrying amounts for cash and cash equivalents approximate fair value.
Mortgage notes payable: The fair value of mortgage notes payable is estimated using discounted cash flow analysis, based on the Company's current incremental borrowing rates for similar types of borrowing arrangements. This information is considered a Level 2 input as defined by ASC 820.
Mortgage loan receivable: The carrying amount for the mortgage loan approximates fair value.
Notes payable to banks: The fair value of the Company's notes payable to banks is estimated by discounting expected cash flows at current market rates. This information is considered a Level 2 input as defined by ASC 820.
Interest rate swap agreements: The fair value of the interest rate swaps is determined by estimating the expected cash flows over the life of the swap using the mid-market rate and price environment as of the last trading day of the reporting period. This information is considered a Level 2 input as defined by ASC 820.
Non-financial assets and liabilities recorded at fair value on a non-recurring basis include the following: (1) non-financial assets and liabilities measured at fair value in a business combination; (2) impairment or disposal of long-lived assets measured at fair value; and (3) equity method investments or cost method investments measured at fair value due to an impairment. The fair values assigned to the Company's purchase price assignments utilize Level 2 and Level 3 inputs as defined by ASC 820. The fair value assigned to the long-lived assets for which there was impairment recorded utilize Level 2 inputs as defined by ASC 820.
96
Note 9 - Accounts Payable and Other Liabilities
The following represents the composition of Accounts Payable and Other Liabilities as of December 31, 2015 and 2014:
December 31, | |||||||
2015 | 2014 | ||||||
(In thousands) | |||||||
Office property payables: | |||||||
Accrued expenses and accounts payable | $ | 55,322 | $ | 43,359 | |||
Accrued property taxes | 22,857 | 25,652 | |||||
Prepaid rents | 18,787 | 16,311 | |||||
Deferred revenues | 25 | 105 | |||||
Security deposits | 7,135 | 7,964 | |||||
Below market lease value | 117,718 | 105,504 | |||||
Accumulated amortization – below market lease value | (52,844 | ) | (29,251 | ) | |||
Corporate payables | 4,077 | 11,854 | |||||
Deferred tax liability | 793 | 470 | |||||
Accrued payroll | 4,845 | 3,210 | |||||
Fair value of interest rate swaps | 9,026 | 11,077 | |||||
Interest payable | 5,944 | 6,158 | |||||
$ | 193,685 | $ | 202,413 | ||||
Note 10 - Net Income (Loss) Per Common Share
The computation of diluted EPS is as follows (in thousands, except per share data):
Year Ended | |||||||||||
December 31, | |||||||||||
2015 | 2014 | 2013 | |||||||||
(in thousands, except per share data) | |||||||||||
Numerator: | |||||||||||
Basic net income (loss) attributable to common stockholders | $ | 67,335 | $ | 42,943 | $ | (29,687 | ) | ||||
Effect of net income attributable to noncontrolling interests - unit holders | 2,947 | 2,089 | — | ||||||||
Diluted net income (loss) attributable to common stockholders | $ | 70,282 | $ | 45,032 | $ | (29,687 | ) | ||||
Denominator: | |||||||||||
Basic weighted average shares outstanding | 111,490 | 101,913 | 66,336 | ||||||||
Effect of Operating Partnership Units | 4,903 | 5,200 | — | ||||||||
Effect of RSUs | 205 | 182 | — | ||||||||
Effect of restricted shares | 5 | 13 | — | ||||||||
Effect of deferred incentive share units | 3 | 11 | — | ||||||||
Effect of LTIP units | 85 | — | — | ||||||||
Diluted adjusted weighted average shares outstanding | 116,691 | 107,319 | 66,336 | ||||||||
Basic and diluted net income (loss) per share attributable to Parkway Properties, Inc. | $ | 0.60 | $ | 0.42 | $ | (0.45 | ) | ||||
The computation of diluted EPS for 2015 did not include the effect of employee stock options as their inclusion would have been anti-dilutive. The computation of diluted EPS for 2014 did not include the effect of employee stock options and LTIP units as their inclusion would have been anti-dilutive. The computation of diluted EPS for 2013 did not include the effect of net loss attributable to unit holders in the numerator and Operating Partnership units, employee stock options, RSUs, restricted shares, deferred incentive share units, and LTIP units in the denominator, as their inclusion would have been anti-dilutive. Terms and conditions of these awards are described in "Note 15—Share-Based and Long-Term Compensation Plans."
97
Note 11 - Stockholders' Equity
Common Stock
On January 10, 2014, the Company completed an underwritten public offering of 10.5 million shares of its common stock at the public offering price of $18.15. On February 11, 2014, the Company sold an additional 1.325 million shares of its common stock at the public offering price of $18.15 pursuant to the exercise of the underwriters’ option to purchase additional shares. The net proceeds from the offering, including shares sold pursuant to the underwriters’ option to purchase additional shares, after deducting the underwriting discount and offering expenses payable by the Company, were approximately $205.2 million which the Company used to fund acquisitions, to repay amounts outstanding under the Company’s senior unsecured revolving credit facility, and for general corporate purposes.
On September 26, 2014, the Company completed an underwritten public offering of 10 million shares of its common stock at the public offering price of $18.60. On October 2, 2014, the Company sold an additional 1.5 million shares of its common stock at the public offering price of $18.60 pursuant to the exercise of the underwriters’ option to purchase additional shares. The net proceeds from the offering, including shares sold pursuant to the underwriters' option to purchase additional shares, after deducting the underwriting discount and offering expenses payable by the Company, were approximately $204.8 million. The Company used the net proceeds from the offering, including the net proceeds from the shares sold pursuant to the underwriters' option, to fund acquisitions and to repay amounts under its senior unsecured revolving credit facility.
On May 28, 2014, the Company entered into an ATM Equity OfferingSM Sales Agreement (the "Sales Agreement") with various agents whereby it may sell, from time to time, shares of its common stock having aggregate gross sales proceeds of up to $150.0 million through an "at-the-market" equity offering program. Sales may be made to the agents in their capacity as sales agents or as principals. The Company intends to use the net proceeds for general corporate purposes, which may include repaying temporarily amounts outstanding from time to time under its senior unsecured revolving credit facility, for working capital and capital expenditures and to fund potential acquisitions or development of office properties. The Company is required to pay each agent a commission that will not exceed, but may be lower than, 2.0% of the gross sales price of the shares sold through such agent.
During the year ended December 31, 2014, the Company sold 391,900 shares of common stock under the Sales Agreement for net offering proceeds of approximately $8.0 million after deducting commissions of approximately $122,000. The Company used the net proceeds for general corporate purposes, including repaying amounts outstanding under its senior unsecured revolving credit facility and to fund acquisitions and development of office properties.
During the year ended December 31, 2015, there were no ATM sales under the Sales Agreement.
Note 12 - Noncontrolling Interests
As of December 31, 2015, the Company had an interest in two joint ventures that are included in its consolidated financial statements: Fund II assets and the Murano residential condominium project.
Fund II
The following represents the detailed information on the Fund II assets as of December 31, 2015:
Company's | ||||
Property Name | Location | Ownership % | ||
Hayden Ferry Lakeside I | Phoenix, AZ | 30.0% | ||
Hayden Ferry Lakeside II | Phoenix, AZ | 30.0% | ||
Hayden Ferry Lakeside III | Phoenix, AZ | 70.0% | ||
Hayden Ferry Lakeside IV and adjacent garage | Phoenix, AZ | 30.0% | ||
3344 Peachtree | Atlanta, GA | 33.0% | ||
Two Liberty Place | Philadelphia, PA | 19.0% | ||
98
Fund II, a $750.0 million discretionary fund, was formed on May 14, 2008 and was fully invested at February 10, 2012. Fund II was structured with TRST as a 70% investor and the Company as a 30% investor, with an original target capital structure of approximately $375.0 million of equity capital and $375.0 million of non-recourse, fixed-rate first mortgage debt. Fund II acquired 13 properties in Atlanta, Georgia; Charlotte, North Carolina; Phoenix, Arizona; Jacksonville, Orlando and Tampa, Florida; and Philadelphia, Pennsylvania. In August 2012, Fund II increased its investment capacity by $20.0 million to purchase Hayden Ferry III, IV and V, a 2,500 space parking garage, an office property and a vacant parcel of development land, all adjacent to Hayden Ferry I and Hayden Ferry II, in Phoenix, Arizona. In August 2013, Fund II expanded its investment guidelines solely for the purpose of authorizing the purchase of a parcel of land available for development in Tempe, Arizona. In April 2014, Fund II authorized the development of Hayden Ferry Lakeside III, as well as the transfer of an interest in the owner of Hayden Ferry Lakeside III, a subsidiary of Fund II, to the Operating Partnership, such that the Company owns a 70% indirect interest in Hayden Ferry Lakeside III.
The Company serves as the general partner of Fund II and provides asset management, property management, leasing and construction management services to the fund, for which it is paid fees. Cash is distributed by Fund II pro rata to each partner until a 9% annual cumulative preferred return is received and invested capital is returned. Thereafter, 56% will be distributed to TRST and 44% to the Company. The term of Fund II is seven years from the date the fund was fully invested, or until February 2019, with provisions to extend the term for two additional one-year periods at the Company's discretion.
Other Noncontrolling Interests
The Company’s interest in its properties is held through the Operating Partnership. All decisions relating to the operations and distributions of the Operating Partnership are made by the Company, which serves indirectly as the sole general partner of the Operating Partnership. The Company owns a 95.9% interest in the Operating Partnership at December 31, 2015. Noncontrolling interests in the Operating Partnership represents common Operating Partnership units that are not owned by the Company. Interests in the Operating Partnership are owned by limited partners who contributed properties and other assets to the Operating Partnership in exchange for common Operating Partnership units as part of merger and acquisition activities. Limited partners have the right under the partnership agreement of the Operating Partnership to tender their units for redemption in exchange for cash or shares of the Company’s common stock, as selected by the Company in its sole and absolute discretion. Accordingly, the Company classifies the common Operating Partnership units held by limited partners in permanent equity because the Company may elect to issue shares of its common stock to limited partners exercising their redemption rights rather than using cash.
Noncontrolling interests - unit holders include (a) 554,400 outstanding common units in the Operating Partnership that were issued in connection with the Company's acquisition of Lincoln Place, an office building located in the South Beach submarket in Miami, Florida, and (b) approximately 4.3 million outstanding common units in the Operating Partnership that were issued in exchange for outstanding limited partnership interests in TPGI in connection with the Mergers.
Income is generally allocated to noncontrolling interests based on the weighted average percentage ownership during the year.
Note 13 - Discontinued Operations
All current and prior period income from the following office property dispositions are included in discontinued operations for the years ended December 31, 2015, 2014 and 2013 (in thousands).
Office Properties | Location | Date of Sale | Net Sales Price | Net Book Value of Real Estate | Gain on Sale | Impairment Loss | ||||||||||||||
Atrium at Stoneridge (1) | Columbia, SC | 03/20/2013 | 2,966 | 2,424 | 542 | 3,500 | ||||||||||||||
Waterstone (2) | Atlanta, GA | 07/10/2013 | 3,247 | 3,207 | 40 | 3,000 | ||||||||||||||
Meridian (2) | Atlanta, GA | 07/10/2013 | 6,615 | 6,560 | 55 | 1,600 | ||||||||||||||
Bank of America Plaza | Nashville, TN | 07/17/2013 | 41,093 | 29,643 | 11,450 | — | ||||||||||||||
Lakewood II | Atlanta, GA | 10/31/2013 | 10,240 | 4,403 | 5,837 | — | ||||||||||||||
Carmel Crossing | Charlotte, NC | 11/08/2013 | 36,673 | 22,104 | 14,569 | — | ||||||||||||||
2013 Dispositions (3) | $ | 100,834 | $ | 68,341 | $ | 32,493 | $ | 8,100 | ||||||||||||
Woodbranch Building | Houston, TX | 01/14/2014 | 14,424 | 4,450 | 9,974 | — | ||||||||||||||
Mesa Corporate Center (2) | Phoenix, AZ | 01/31/2014 | 12,257 | 11,768 | 489 | 5,600 | ||||||||||||||
2014 Dispositions (4) | $ | 26,681 | $ | 16,218 | $ | 10,463 | $ | 5,600 | ||||||||||||
(1) The impairment loss on real estate in connection with Atrium at Stoneridge was recognized in discontinued operations during the year ended December 31, 2012.
(2) The impairment loss on real estate recognized in discontinued operations during the year ended December 31, 2013 was comprised of a $4.6 million loss in connection with the Company's Waterstone and Meridian properties that were sold in 2013 and a $5.6 million loss in connection with the valuation of Mesa Corporate Center based on its estimated fair value of the asset, and which was classified as held for sale at December 31, 2013.
99
(3) Total gain on the sale of real estate in discontinued operations recognized during the year ended December 31, 2013 was $32.5 million, of which $18.2 million was the Company's proportionate share.
(4) With the adoption of ASU 2014-08, "Reporting Discontinued Operations and Disposals of Components of an Entity" effective January 1, 2014, the Company's 2014 sales of the Woodbranch Building and Mesa Corporate Center are included in discontinued operations for the year ended December 31, 2014 as these properties were previously classified as held for sale at December 31, 2013. The Company's 2014 sales of the Schlumberger Building and 525 North Tryon are included in the continuing operations section of the consolidated statement of operations and comprehensive income (loss) as they were not previously classified as held for sale in any prior period financial statements.
The amount of revenues and expenses for these office properties reported in discontinued operations for the years ended December 31, 2015, 2014 and 2013 is as follows (in thousands):
Year Ended | |||||||||||
December 31, | |||||||||||
2015 | 2014 | 2013 | |||||||||
Statements of Operations: | |||||||||||
Revenues | |||||||||||
Income from office properties | $ | — | $ | 99 | $ | 14,976 | |||||
Expenses | |||||||||||
Property operating expenses | — | 373 | 6,835 | ||||||||
Management company expenses | — | 1 | (39 | ) | |||||||
Depreciation and amortization | — | 116 | 4,561 | ||||||||
Impairment loss on real estate | — | — | 10,200 | ||||||||
Loss on extinguishment of debt | — | — | 2,149 | ||||||||
Interest expense | — | — | 485 | ||||||||
Total expenses | — | 490 | 24,191 | ||||||||
Loss from discontinued operations | — | (391 | ) | (9,215 | ) | ||||||
Net gains on sale of real estate from discontinued operations | — | 10,463 | 32,493 | ||||||||
Total discontinued operations per Statement of Operations | — | 10,072 | 23,278 | ||||||||
Net income attributable to noncontrolling interest from discontinued operations | — | (352 | ) | (13,443 | ) | ||||||
Total discontinued operations – Parkway's Share | $ | — | $ | 9,720 | $ | 9,835 | |||||
Note 14 - Income Taxes
The Company elected to be taxed as a REIT under the Code, commencing with its taxable year ended December 31, 1997. In January 1998, the Company completed its reorganization into an UPREIT structure under which substantially all of the Company's real estate assets are owned by the Operating Partnership. Presently, substantially all interests in the Operating Partnership are owned by the Company and a wholly owned subsidiary. To qualify as a REIT, the Company must meet a number of organizational and operational requirements, including a requirement that it distributes annually at least 90% of its "REIT taxable income," subject to certain adjustments and excluding any net capital gain to its stockholders. It is management's current intention to adhere to these requirements and maintain the Company's REIT status, and the Company believes that it was in compliance with all REIT requirements at December 31, 2015. As a REIT, the Company generally will not be subject to corporate level U.S. federal income tax on taxable income it distributes currently to its stockholders. If the Company fails to qualify as a REIT in any taxable year, it will be subject to U.S. federal income taxes at regular corporate rates (including any applicable alternative minimum tax) and may not be able to qualify as a REIT for four subsequent taxable years. Even if the Company qualifies for taxation as a REIT, the Company may be subject to certain state and local taxes on its income and property, and to U.S. federal income taxes on its undistributed taxable income.
The Operating Partnership is a pass-through entity generally not subject to U.S. federal and state income taxes, as all of the taxable income, gains and deductions are passed through its partners. However, the Operating Partnership is subject to certain income taxes in Texas.
In addition, the Company has elected to treat certain consolidated subsidiaries as TRSs, which are tax paying entities for income tax purposes and are taxed separately from the Company. TRSs may participate in non-real estate related activities and/or perform non-customary services for customers and are subject to U.S. federal and state income tax at regular corporate tax rates. The income tax benefit (expense) and related income tax assets and liabilities are based on actual and expected future income.
100
As of December 31, 2015 and 2014, the Company recorded net deferred tax assets of $4.2 million and $4.6 million, respectively, related to the TRSs. Deferred tax assets generally represent items that can be used as a tax deduction in the Company's tax returns in future years for which the Company has already recorded a tax benefit in its consolidated statement of operations.
The significant components of the net deferred tax assets (liabilities) as of December 31, 2015 and 2014 are as follows (in thousands):
December 31, | |||||||
2015 | 2014 | ||||||
(In thousands) | |||||||
Deferred tax assets | |||||||
Capitalizable transaction costs | $ | 667 | $ | 784 | |||
Contingent consideration | 1,198 | 1,411 | |||||
Management contracts | 2,022 | 2,377 | |||||
Other | 1,112 | 466 | |||||
Total deferred tax assets | 4,999 | 5,038 | |||||
Deferred tax liabilities | |||||||
Cost method investment | (670 | ) | (469 | ) | |||
Other | (123 | ) | — | ||||
Total deferred tax liabilities | (793 | ) | (469 | ) | |||
Total deferred tax assets, net | $ | 4,206 | $ | 4,569 | |||
The table of deferred tax assets and liabilities as shown above does not include deferred tax assets for the REIT's NOLs. As of December 31, 2015, the Company had NOL carryforwards for U.S. federal income tax purposes of $252.2 million (including $85.8 million of NOLs from the Mergers). On December 10, 2012, the Company believes a change in ownership pursuant to Section 382 of the Code occurred. Accordingly, $160.8 million of NOLs in existence as of December 10, 2012 are subject to an annual Section 382 limitation of $15.4 million. The historic NOLs of TPGI are also subject to Section 382 limitation. The Company's NOL carryforwards (including NOLs of TPGI) are subject to varying expiration dates beginning in 2018 through 2033.
FASB ASC 740-10-30 ("ASC 740-10-30") "Accounting for Income Taxes" subsection "Initial Measurement," requires that deferred tax assets be reduced by a valuation allowance if it is more likely than not that some or all of the deferred tax asset will not be realized. In determining whether the deferred tax asset is realizable, the Company considers all available positive and negative evidence, including future reversal of existing taxable temporary differences, carryback potential, tax-planning strategies and its ability to generate sufficient taxable income in future years. As of December 31, 2015, the Company recorded a full valuation allowance against its deferred tax asset associated with the REIT's NOLs due to the uncertainty of future utilization. The utilization of these NOLs can cause the Company to incur a small alternative minimum tax.
The components of income tax benefit (expense) for the years ended December 31, 2015, 2014 and 2013 are as follows (in thousands):
For the Year Ended | |||||||||||
December 31, | |||||||||||
2015 | 2014 | 2013 | |||||||||
Current: | |||||||||||
Federal | $ | (854 | ) | $ | (2,876 | ) | $ | (488 | ) | ||
State | (686 | ) | (2,026 | ) | (67 | ) | |||||
Total current | (1,540 | ) | (4,902 | ) | (555 | ) | |||||
Deferred: | |||||||||||
Federal | 124 | 3,868 | 1,582 | ||||||||
State | (487 | ) | 895 | 378 | |||||||
Total deferred | (363 | ) | 4,763 | 1,960 | |||||||
Total income tax (expense) benefit | $ | (1,903 | ) | $ | (139 | ) | $ | 1,405 | |||
101
The reconciliation of income tax expense computed at the U.S. statutory income tax rate and the income tax expense in the consolidated statements operations is shown below (in thousands):
For the Years Ended December 31, | ||||||||||||||||||||
2015 | 2014 | 2013 | ||||||||||||||||||
Amount | Percentage | Amount | Percentage | Amount | Percentage | |||||||||||||||
Pre-tax income (loss) from continuing operations | $ | (32,853 | ) | 34.0 | % | $ | (11,654 | ) | 34.0 | % | $ | 12,485 | 34.0 | % | ||||||
REIT earnings without income tax provision | 22,745 | (23.5 | )% | 12,121 | (35.4 | )% | (13,083 | ) | (35.6 | )% | ||||||||||
Noncontrolling interest | 9,312 | (9.6 | )% | 430 | (1.3 | )% | 2,588 | 7.0 | % | |||||||||||
State income tax, net of federal tax benefit | (778 | ) | 0.8 | % | (1,090 | ) | 3.2 | % | 185 | 0.5 | % | |||||||||
Effect of permanent differences | (6 | ) | — | % | (41 | ) | 0.1 | % | (291 | ) | (0.8 | )% | ||||||||
Valuation allowance | — | — | % | 479 | (1.4 | )% | (479 | ) | (1.3 | )% | ||||||||||
Other - Peachtree | — | — | % | (422 | ) | 1.2 | % | — | — | % | ||||||||||
Other | (323 | ) | 0.3 | % | 38 | (0.1 | )% | — | — | % | ||||||||||
Total income tax (expense) benefit | $ | (1,903 | ) | 2.0 | % | $ | (139 | ) | 0.3 | % | $ | 1,405 | 3.8 | % | ||||||
The Company's U.S. federal income tax returns for tax years 2012 through 2015 remain open and subject to examination by the taxing authorities.
FASB ASC 740-10-25, "Accounting for Income Taxes" subsection "Recognition," clarifies the accounting for uncertainty in income taxes recognized in a company's financial statements. The interpretation prescribes a recognition threshold and measurement attribute criteria for the financial statement recognition and measurement of a tax position taken or expected to be taken in a tax return. The interpretation also provides guidance on derecognition, classification, interest and penalties, accounting in interim periods, disclosure and transition. The Company's policy is to recognize interest and penalties related to unrecognized tax benefits as components of income tax expense. As of December 31, 2015, there is no interest or penalty associated with unrecognized tax benefits.
As of December 31, 2015, the Company has recorded unrecognized tax benefits of approximately $6.9 million, acquired as part of the Mergers and, if recognized, would not affect its effective tax rate. The Company has sufficient NOLs to utilize for current or future tax liabilities.
A reconciliation of the Company’s unrecognized tax benefits as of December 31, 2015 and 2014 (in thousands):
December 31, | |||||||
2015 | 2014 | ||||||
(In thousands) | |||||||
Unrecognized Tax Benefits - Opening Balance | $ | 6,857 | $ | 7,999 | |||
Gross increases - current period tax positions | — | — | |||||
Gross decreases - lapse of statute of limitations | — | (1,142 | ) | ||||
Unrecognized Tax Benefits - Ending Balance | $ | 6,857 | $ | 6,857 | |||
The following characterizes distributions paid per common share for the years ended December 31, 2015, 2014 and 2013 (Unaudited):
2015 | 2014 | 2013 | ||||||||||||||||||
Amount | Percentage | Amount | Percentage | Amount | Percentage | |||||||||||||||
Ordinary income | $ | 0.2689 | 35.9 | % | $ | 0.7141 | 95.2 | % | $ | 0.4425 | 69.4 | % | ||||||||
Capital gain | — | — | 0.0359 | 4.8 | % | — | — | |||||||||||||
Unrecaptured Section 1250 gain | — | — | — | — | 0.0831 | 13.0 | % | |||||||||||||
Return of capital | 0.4811 | 64.1 | % | — | — | 0.1119 | 17.6 | % | ||||||||||||
$ | 0.7500 | 100.0 | % | $ | 0.7500 | 100.0 | % | $ | 0.6375 | 100.0 | % | |||||||||
102
On December 19, 2013, the Company completed the Mergers. As set forth in the Merger Agreement, the parties to the Parent Merger intended that the Parent Merger be treated as a reorganization within the meaning of Section 368(a) of the Code. Assuming that, as intended, the Parent Merger qualified as a reorganization, because TPGI was a C corporation, the Company is subject to the rules applicable to REITs acquiring assets with "built-in gain" from C corporations in reorganizations. Pursuant to these rules, the Company is subject to corporate income tax to the extent that unrealized gain on historic TPGI assets (determined at the time of the Parent Merger) is recognized in taxable dispositions of such assets in the ten-year period following the Parent Merger.
Note 15 - Share-Based and Long-Term Compensation Plans
The Company grants share-based awards under the Parkway Properties, Inc. and Parkway Properties LP 2015 Omnibus Equity Incentive Plan (the "2015 Equity Plan") that was approved by the stockholders of the Company on May 14, 2015. The 2015 Equity Plan, which amends and restates the Parkway Properties, Inc. and Parkway Properties LP 2013 Omnibus Equity Incentive Plan (the "2013 Equity Plan"), permits the grant of awards with respect to a number of shares of common stock equal to the sum of (1) 2,500,000 shares, plus (2) the number of shares available for future awards under the 2013 Equity Plan, plus (3) the number of shares related to awards outstanding under the 2013 Equity Plan that terminate by expiration or forfeiture, cancellation, or otherwise without the issuance of such shares of Common Stock.
The 2013 Equity Plan replaced the 2010 Omnibus Equity Incentive Plan (the "2010 Equity Plan"). Outstanding awards granted under the 2010 Equity Plan continue to be governed by the 2010 Equity Plan. All of the employees of the Company and the Operating Partnership, employees of certain subsidiaries of the Company, non-employee directors and any consultants or advisors to the Company and the Operating Partnership are eligible to participate in the 2015 Equity Plan.
The 2015 Equity Plan authorizes the following types of awards: (1) stock options, including nonstatutory stock options and incentive stock options ("ISOs"); (2) stock appreciation rights; (3) restricted shares; (4) RSUs; (5) LTIP units; (6) dividend equivalent rights; and (7) other forms of awards payable in or denominated by reference to shares of common stock. Full value awards, i.e., awards other than options and stock appreciation rights, vest over a period of three years or longer, except that any full value awards subject to performance-based vesting must become vested over a period of one year or longer. The Compensation Committee of the Board of Directors of the Company (the "Board") may waive vesting requirements upon a participant’s death, disability, retirement, or other specified termination of service or upon a change in control.
Through December 31, 2015, the Company had RSUs, LTIP units and stock options outstanding under the 2015 Equity Plan, each as described below. As of December 31, 2015, the Company had restricted shares outstanding under the 2010 Equity Plan, as described below.
Long-Term Equity Incentives
At December 31, 2015, a total of 1,293,750 shares underlying stock options had been granted to officers of the Company and remain outstanding under the 2013 Equity Plan, of which 862,500 shares remain unvested. The stock options are valued at $3.6 million, which equates to an average price per share of $4.18. Each stock option will vest in increments of 25% per year on each of the first, second, third and fourth anniversaries of the grant date, subject to the grantee's continued service. At December 31, 2015, a total of 386,748 time-vesting RSUs had been granted to officers of the Company and remain outstanding. The time-vesting RSUs are valued at $7.0 million, which equates to an average price per share of $18.09. A total of 299,312 time-vesting RSU awards will vest in increments of 25% per year on each of the first, second, third and fourth anniversaries of the grant date and 87,436 time-vesting RSU awards will vest in increments of 33% per year on each of the first, second and third anniversaries of the grant date, subject to the grantee's continued service.
At December 31, 2015, a total of 447,938 LTIP units had been granted to officers of the Company and remain outstanding under the 2013 Equity Plan. LTIP units are a form of limited partnership interest issued by the Operating Partnership, and will be considered earned if, and only to the extent to which applicable total shareholder return, ("TSR"), performance measures are achieved during the performance period. Grant date fair values of the LTIP units and performance-vesting RSUs are estimated using a Monte Carlo simulation model and the resulting expense is recorded regardless of whether the TSR performance measures are achieved if the required service is delivered. The grant date fair values are being amortized over expense over the period from the grant date to the date at which the awards, if any, would become vested. The LTIP units are valued at $3.8 million, which equates to an average price per share of $8.58. At December 31, 2015, a total of 215,527 performance-vesting RSUs had been granted to officers of the Company and remain outstanding under the 2013 Equity Plan. The performance-vesting RSUs are valued at approximately $1.7 million, which equates to an average price per share of $8.11. Grant date fair values of the performance-vesting RSUs units are estimated using a Monte Carlo simulation model and the resulting expense is recorded regardless of whether the TSR performance measures are achieved if the required service is delivered. Each LTIP unit and performance-vesting RSU
103
will vest based on the attainment of total stockholder return targets during the applicable performance period, subject to the grantee's continued service.
At December 31, 2015, a total of 5,189 restricted shares granted to officers of the Company remain outstanding under the 2010 Equity Plan. The restricted shares vest ratably over four years from the date of grant, with the last restricted shares vesting in January 2016. The restricted shares are valued at $71,000, which equates to an average price per share of $13.65.
Total compensation expense related to restricted shares, deferred incentive share units, stock options, RSUs and LTIP units of $6.5 million, $8.2 million and $5.7 million, was recognized in general and administrative expenses on the Company's consolidated statements of operations and comprehensive income (loss) during the years ended December 31, 2015, 2014 and 2013, respectively. Total compensation expense related to non-vested awards not yet recognized was $5.5 million at December 31, 2015. The weighted average period over which this expense is expected to be recognized is approximately one year.
Restricted Shares | Deferred Incentive Share Units | Stock Options | RSUs | LTIP Units | |||||||||||||||||||||
# of Shares | Weighted Average Grant-Date Fair Value | # of Share Units | Weighted Average Grant-Date Fair Value | # of Options | Weighted Average Grant-Date Fair Value | # of Stock Units | Weighted Average Grant-Date Fair Value | # of LTIP Units | Weighted Average Grant-Date Fair Value | ||||||||||||||||
Balance at 12/31/14 | 13,769 | $ | 14.61 | 6,855 | $ | 16.63 | 1,293,750 | $ | 4.17 | 504,534 | $ | 16.03 | 300,636 | $ | 9.26 | ||||||||||
Granted | — | — | — | — | — | — | 267,596 | 13.50 | 147,302 | 7.18 | |||||||||||||||
Vested | (8,580 | ) | 15.20 | (6,130 | ) | 17.08 | (431,250 | ) | 4.17 | (145,854 | ) | 18.45 | — | — | |||||||||||
Forfeited | — | — | (725 | ) | 12.89 | — | — | (24,001 | ) | 10.96 | — | — | |||||||||||||
Balance at 12/31/15 | 5,189 | $ | 13.65 | — | $ | — | 862,500 | $ | 4.17 | 602,275 | $ | 14.52 | 447,938 | $ | 8.58 | ||||||||||
The following table presents the weighted-average assumptions used to estimate the fair values of the options granted in the periods presented:
Year Ended | |||||
December 31, | |||||
2015 | 2014 | 2013 | |||
Risk-free interest rate | — | — | 1.01% | ||
Expected volatility | — | — | 31.0% | ||
Expected life (in years) | — | — | 6 | ||
Dividend Yield | — | — | 4% | ||
Weighted-average estimated fair value of options granted during the year | — | — | $4.17 | ||
Defined Contribution Plan
The Company maintains a 401(k) plan for its employees. The Company makes matching contributions of 50% of the employee's contribution (limited to 10% of compensation as defined by the plan) and may also make annual discretionary contributions. The Company's total expense for this plan was $700,000, $621,000 and $601,000, for the years ended December 31, 2015, 2014 and 2013, respectively.
104
Note 16 - Selected Quarterly Financial Data (Unaudited):
Summarized quarterly financial data for the years ended December 31, 2015 and 2014 are as follows (in thousands, except per share data):
2015 | |||||||||||||||
First | Second | Third | Fourth | ||||||||||||
Revenues (other than gains) | $ | 119,684 | $ | 126,905 | $ | 114,843 | $ | 112,551 | |||||||
Expenses | (107,407 | ) | (115,439 | ) | (101,717 | ) | (98,788 | ) | |||||||
Operating income | 12,277 | 11,466 | 13,126 | 13,763 | |||||||||||
Interest and other income | 170 | 312 | 218 | 203 | |||||||||||
Equity in earnings of unconsolidated joint ventures | 162 | 422 | 339 | 1,281 | |||||||||||
Net gains on sale of real estate | 14,316 | 45,246 | 47,351 | 3,819 | |||||||||||
Gain on sale of unconsolidated property | — | — | — | 9,698 | |||||||||||
Gain (loss) on extinguishment of debt | 79 | (4,919 | ) | (702 | ) | (520 | ) | ||||||||
Interest expense | (19,198 | ) | (17,676 | ) | (17,017 | ) | (17,590 | ) | |||||||
Income tax expense | (192 | ) | (326 | ) | (491 | ) | (894 | ) | |||||||
Net income | 7,614 | 34,525 | 42,824 | 9,760 | |||||||||||
Noncontrolling interests | (339 | ) | (20,393 | ) | (5,573 | ) | (1,083 | ) | |||||||
Net income for Parkway Properties, Inc. and attributable to common stockholders | $ | 7,275 | $ | 14,132 | $ | 37,251 | $ | 8,677 | |||||||
Net income per common share: | |||||||||||||||
Basic: | |||||||||||||||
Income from continuing operations attributable to Parkway Properties, Inc. | $ | 0.07 | $ | 0.13 | $ | 0.33 | $ | 0.08 | |||||||
Discontinued operations | — | — | — | — | |||||||||||
Basic net income attributable to Parkway Properties, Inc. | $ | 0.07 | $ | 0.13 | $ | 0.33 | $ | 0.08 | |||||||
Dividends per common share | $ | 0.1875 | $ | 0.1875 | $ | 0.1875 | $ | 0.1875 | |||||||
Diluted: | |||||||||||||||
Income from continuing operations attributable to Parkway Properties, Inc. | $ | 0.07 | $ | 0.13 | $ | 0.33 | $ | 0.08 | |||||||
Discontinued operations | — | — | — | — | |||||||||||
Diluted net income attributable to Parkway Properties, Inc. | $ | 0.07 | $ | 0.13 | $ | 0.33 | $ | 0.08 | |||||||
Weighted average shares outstanding: | |||||||||||||||
Basic | 111,216 | 111,543 | 111,583 | 111,614 | |||||||||||
Diluted | 116,531 | 116,666 | 116,723 | 116,760 | |||||||||||
2014 | |||||||||||||||
First | Second | Third | Fourth | ||||||||||||
Revenues (other than gains) | $ | 104,113 | $ | 110,460 | $ | 115,747 | $ | 126,381 | |||||||
Expenses | (94,160 | ) | (103,390 | ) | (106,275 | ) | (133,253 | ) | |||||||
Operating income (loss) | 9,953 | 7,070 | 9,472 | (6,872 | ) | ||||||||||
Interest and other income | 368 | 402 | 121 | 561 | |||||||||||
Equity in earnings (loss) of unconsolidated joint ventures | (478 | ) | (496 | ) | 191 | (184 | ) | ||||||||
Gain on sale of in-substance real estate | 6,289 | — | — | — | |||||||||||
Net gains on sale of real estate | — | — | 6,664 | 69,714 | |||||||||||
Loss on extinguishment of debt | — | (339 | ) | — | (2,066 | ) | |||||||||
Interest expense | (15,244 | ) | (16,793 | ) | (16,543 | ) | (17,515 | ) | |||||||
Income tax benefit (expense) | (342 | ) | (257 | ) | (164 | ) | 624 | ||||||||
Income (loss) from continuing operations | 546 | (10,413 | ) | (259 | ) | 44,262 | |||||||||
Discontinued operations: | |||||||||||||||
Loss from discontinued operations | (43 | ) | (50 | ) | (289 | ) | (9 | ) | |||||||
Gain on sale of real estate from discontinued operations | 10,463 | — | — | — | |||||||||||
Total discontinued operations | 10,420 | (50 | ) | (289 | ) | (9 | ) | ||||||||
Net income (loss) | 10,966 | (10,463 | ) | (548 | ) | 44,253 | |||||||||
Noncontrolling interests | (121 | ) | 618 | 63 | (1,825 | ) | |||||||||
Net income for Parkway Properties, Inc. and attributable to common stockholders | $ | 10,845 | $ | (9,845 | ) | $ | (485 | ) | $ | 42,428 | |||||
Net income (loss) per common share: | |||||||||||||||
Basic: | |||||||||||||||
Income (loss) from continuing operations attributable to Parkway Properties, Inc. | $ | — | $ | (0.10 | ) | $ | — | $ | 0.38 | ||||||
Discontinued operations | 0.11 | — | — | — | |||||||||||
Basic net income (loss) attributable to Parkway Properties, Inc. | $ | 0.11 | $ | (0.10 | ) | $ | — | $ | 0.38 | ||||||
Dividends per common share | $ | 0.1875 | $ | 0.1875 | $ | 0.1875 | $ | 0.1875 | |||||||
Diluted: | |||||||||||||||
Income (loss) from continuing operations attributable to Parkway Properties, Inc. | $ | — | $ | (0.10 | ) | $ | — | $ | 0.38 | ||||||
Discontinued operations | 0.11 | — | — | — | |||||||||||
Diluted net income (loss) attributable to Parkway Properties, Inc. | $ | 0.11 | $ | (0.10 | ) | $ | — | $ | 0.38 | ||||||
Weighted average shares outstanding: | |||||||||||||||
Basic | 97,356 | 99,092 | 100,016 | 111,076 | |||||||||||
Diluted | 102,614 | 99,092 | 100,016 | 116,521 | |||||||||||
Note 17 - Commitments and Contingencies
The Company and its subsidiaries are, from time to time, parties to litigation arising from the ordinary course of business. The Company does not believe that any such litigation will materially affect our financial position or operations.
As part of the Mergers, the Company acquired a 1% limited partnership interest in 2121 Market Street. A mortgage loan secured by a first trust deed on 2121 Market Street is guaranteed by the Company up to a maximum amount of $14.0 million expiring in December 2022.
In connection with the closing of the Mergers, on December 19, 2013, Mr. James A. Thomas, the Company's Chairman of the Board, and certain of his related parties, entered into a tax protection agreement with Parkway LP (the “New Tax Protection Agreement”), that replaced an agreement originally entered into between Thomas Properties Group, LP and Mr. Thomas (and certain of his related parties) dated October 13, 2004 (the “Original Tax Protection Agreement”). The New Tax Protection Agreement continued and updated the obligations under the Original Tax Protection Agreement with certain changes, including an undertaking by Parkway LP to offer certain related parties of Mr. Thomas the opportunity to guarantee, in the aggregate, up to $39.0 million
105
of direct or indirect “qualifying” indebtedness of Parkway LP and agreement as to the method that Parkway LP will adopt in allocating depreciation with respect to certain of the properties acquired from TPGI.
Note 18 – Related Party Transactions
On May 18, 2011, the Company closed on the Contribution Agreement pursuant to which Eola contributed its property management company (the “Management Company”) to the Company. In connection with the Eola contribution of its Management Company to the Company, a subsidiary of the Company made a $3.5 million preferred equity investment in an entity 21% owned by Mr. Heistand, and which is included in receivables and other assets on the Company's consolidated balance sheets. This investment provides that the Company will be paid a preferred equity return equal to 7% per annum of the preferred equity outstanding. In 2015, 2014 and 2013 the Company received preferred equity distributions on this investment in the aggregate amounts of approximately $245,000, $265,000 and $225,000, respectively. This preferred equity investment was approved by the Board, and recorded as a cost method investment in receivables and other assets on the balance sheet.
Certain of the Company's executive officers own interests in properties that are managed and leased by the Management Company. The Company recorded $398,000, $3.5 million and $4.0 million in management fees and $869,000, $8.8 million and $10.2 million in reimbursements related to the management and leasing of these assets for the years ended December 31, 2015, 2014 and 2013, respectively. For the years ended December 31, 2015, 2014 and 2013, the Company recorded management fees and reimbursements, net of elimination, related to the unconsolidated joint ventures of $384,000, $4.2 million and zero, respectively.
On June 5, 2012, TPG Pantera acquired 4.3 million shares of common stock at a purchase price of $11.25 per share and 13,477,778 shares of Series E Convertible Cumulative Redeemable Preferred Stock, par value $.001 per share (the “Series E Preferred Stock”), at a purchase price and liquidation preference of $11.25 per share, for an aggregate investment in the Company by TPG Pantera of $200.0 million pursuant to a securities purchase agreement (the “Purchase Agreement”) between the Company and TPG Pantera. At a special meeting of stockholders held on July 31, 2012, the stockholders approved, among other things, the right to convert, at the option of the Company or the holders, shares of the Series E Preferred Stock into shares of common stock. On August 1, 2012, the Company delivered a conversion notice to TPG Pantera and all shares of Series E Preferred Stock were converted into common stock on a one-for-one basis.
In connection with the closing under the Purchase Agreement, the Company and TPG VI Management, LLC ("TPG Management"), an affiliate of TPG Pantera entered into a Management Services Agreement that sets forth certain financial advisory services previously provided by and to be provided by, and fees to be paid to TPG Management, in connection with TPG Pantera’s investment in the Company and TPG Management’s ongoing services to the Company. As provided in the Management Services Agreement, on June 5, 2012 the Company paid TPG Management a transaction fee of $6.0 million and reimbursed TPG Management $1.0 million of its reasonable out-of-pocket expenses incurred by it and its affiliates in connection with TPG Pantera’s investment in the Company. Furthermore, pursuant to the Management Services Agreement and in exchange for certain ongoing advisory and consulting services, the Company agreed to pay to TPG Management a monitoring fee equal to $600,000 for the first year following the closing under the Purchase Agreement and $1.0 million per year thereafter for so long as TPG Pantera has the right to appoint four of the directors of the Board. In each case, the monitoring fee will be reduced proportionately based on TPG Pantera’s Board representation rights under the Stockholders Agreement, dated December 3, 2012, by and between the Company and TPG Pantera, as amended (the "Stockholders Agreement") as described below. On December 15, 2014, the Company and TPG Management amended the Management Services Agreement to provide that the monitoring fee is payable entirely in cash. The monitoring fee, which is paid quarterly when the Company pays its common stock dividend, is in lieu of director fees otherwise payable to the TPG Pantera-nominated members of the Board.
Also in connection with closing under the Purchase Agreement, the Company, TPG Pantera and TPG Management entered into the Stockholders Agreement pursuant to which, among other things, (1) TPG Pantera has the right to nominate a specified number of directors to the Board and to each committee of the Board determined based on its level of ownership in the Company, for so long as TPG Pantera owns 5% or more of the Company’s outstanding common stock, and (2) TPG Pantera has the right to consent to certain actions related to the Company’s corporate existence and governance, including any change in the rights and responsibilities of either the investment committee of the Board or the compensation committee of the Board, for so long as TPG Pantera’s ownership percentage of the Company’s common stock is equal to or greater than 20%, other than in connection with any change in control.
106
On July 3, 2014, the Company acquired Millenia Park One, an office building located in the Millenia submarket of Orlando, Florida, for a gross purchase price of $25.5 million. The seller was partially and indirectly owned by certain officers of the Company. The seller was required to use the entire purchase price of Millenia Park One to satisfy existing debt. Accordingly, those certain officers of the Company with the aforementioned ownership in Millenia Park One received no proceeds from the sale.
On December 8, 2014, the Company sold the retail unit at its Murano residential condominium project to its unaffiliated joint venture partner in the project for a gross sales price of $3.5 million.
Note 19 - Subsequent Events
On January 22, 2016, the Company sold 5300 Memorial, an office property located in Houston, Texas, for a gross sale price of $33.0 million, and expects to recognize a gain in the first quarter of 2016.
On January 22, 2016, the Company sold Town & Country, an office property located in Houston, Texas, for a gross sale price of $27.0 million, and expects to recognize a gain in the first quarter of 2016.
On February 5, 2016, the Company sold 80% of its interest in Courvoisier Centre, a complex of two office buildings located in the Brickell submarket of Miami, Florida, to a joint venture with a third party investor at a gross asset value of $175.0 million. Simultaneous with the closing of the joint venture transaction, the joint venture closed on a $106.5 million first mortgage secured by the asset, which has a fixed interest rate of 4.6%, matures in March 2026 and is interest only through maturity. The recapitalization of Courvoisier Centre resulted in net proceeds to the Company of $154.3 million. The Company retained a 20% noncontrolling ownership interest in the property. The Company expects to recognize a gain in the first quarter of 2016.
107
SCHEDULE II – VALUATIONS AND QUALIFYING ACCOUNTS
(In thousands)
Description | Balance Beginning of Year | Additions Charged to Cost & Expenses | Deductions Written Off as Uncollectible | Balance End of Year | |||||||||||
Allowance for Doubtful Accounts: | |||||||||||||||
Year Ended: | |||||||||||||||
December 31, 2015 | $ | 1,860 | $ | 173 | $ | (1,398 | ) | $ | 635 | ||||||
December 31, 2014 | 2,695 | 717 | (1,552 | ) | 1,860 | ||||||||||
December 31, 2013 | 1,606 | 1,581 | (492 | ) | 2,695 | ||||||||||
108
SCHEDULE III – REAL ESTATE AND ACCUMULATED DEPRECIATION DECEMBER 31, 2015 (In thousands) | ||||||||||||||||||||
Initial Cost to the Company | ||||||||||||||||||||
Description | Encumbrances (1) | Land | Building and Improvements | Subsequent Capitalized Costs | Total Real Estate | |||||||||||||||
Arizona | ||||||||||||||||||||
Hayden Ferry Lakeside I | $ | 21,536 | $ | 2,871 | $ | 30,428 | $ | 6,918 | $ | 40,217 | ||||||||||
Hayden Ferry Lakeside II | 46,064 | 3,612 | 69,246 | 7,746 | 80,604 | |||||||||||||||
Hayden Ferry Lakeside III | 31,271 | 4,024 | 28,383 | 24,326 | 56,733 | |||||||||||||||
Hayden Ferry Lakeside IV and V | — | 5,023 | 8,561 | 1,626 | 15,210 | |||||||||||||||
Tempe Gateway | — | 6,970 | 45,232 | 10,718 | 62,920 | |||||||||||||||
Florida | ||||||||||||||||||||
Stein Mart Building | 10,778 | 1,653 | 16,636 | 7,256 | 25,545 | |||||||||||||||
Lincoln Place | 48,030 | — | 56,997 | 4,988 | 61,985 | |||||||||||||||
Deerwood North | 84,500 | 11,904 | 39,900 | 6,481 | 58,285 | |||||||||||||||
Deerwood South | — | 14,026 | 36,319 | 7,244 | 57,589 | |||||||||||||||
Bank of America Center | — | 8,882 | 38,595 | 11,655 | 59,132 | |||||||||||||||
Citrus Center | 20,645 | 4,000 | 26,712 | 11,904 | 42,616 | |||||||||||||||
Corporate Center I | — | — | 77,997 | 7,319 | 85,316 | |||||||||||||||
Corporate Center II | — | — | 58,493 | 4,738 | 63,231 | |||||||||||||||
Corporate Center III | — | — | 63,633 | 4,463 | 68,096 | |||||||||||||||
Corporate Center IV | 35,491 | — | 31,773 | 8,755 | 40,528 | |||||||||||||||
Corporate Center VI | — | 4,901 | — | — | 4,901 | |||||||||||||||
Courvoisier Centre (3) | — | 48,407 | 74,738 | 11,098 | 134,243 | |||||||||||||||
Harborview Plaza | — | 8,560 | 33,263 | 2,781 | 44,604 | |||||||||||||||
The Pointe | 23,364 | 5,293 | 30,834 | 6,188 | 42,315 | |||||||||||||||
JTB Center | — | 5,376 | 21,494 | 4,722 | 31,592 | |||||||||||||||
One Orlando Centre (2) | 54,000 | 9,828 | 37,555 | 9,316 | 56,699 | |||||||||||||||
Georgia | ||||||||||||||||||||
3344 Peachtree | 80,986 | 7,472 | 127,579 | 12,853 | 147,904 | |||||||||||||||
One Buckhead Plaza | — | 20,031 | 125,204 | 8,644 | 153,879 | |||||||||||||||
Two Buckhead Plaza | 52,000 | 12,934 | 66,249 | 4,048 | 83,231 | |||||||||||||||
3350 Peachtree | — | 3,625 | 57,218 | 20,607 | 81,450 | |||||||||||||||
3348 Peachtree | — | 5,407 | 45,207 | 9,590 | 60,204 | |||||||||||||||
The Forum at West Paces | — | 3,314 | 38,577 | 7,857 | 49,748 | |||||||||||||||
North Carolina | ||||||||||||||||||||
Hearst Tower | — | 4,417 | 200,287 | 35,070 | 239,774 | |||||||||||||||
NASCAR Plaza | — | — | 76,874 | 14,425 | 91,299 | |||||||||||||||
Pennsylvania | ||||||||||||||||||||
Two Liberty Place | 89,567 | 32,587 | 97,585 | 18,020 | 148,192 | |||||||||||||||
Texas | ||||||||||||||||||||
Phoenix Tower | 78,555 | 9,191 | 98,183 | 14,768 | 122,142 | |||||||||||||||
CityWestPlace | 204,794 | 56,785 | 295,869 | 73,018 | 425,672 | |||||||||||||||
San Felipe Plaza | 107,877 | 40,347 | 206,510 | 22,409 | 269,266 | |||||||||||||||
One Congress Plaza | 128,000 | 33,245 | 118,370 | 12,447 | 164,062 | |||||||||||||||
San Jacinto Center | 101,000 | 31,645 | 116,817 | 8,339 | 156,801 | |||||||||||||||
Other | ||||||||||||||||||||
Corporate | — | — | 29 | 6,007 | 6,036 | |||||||||||||||
Total Real Estate Owned | $ | 1,218,458 | $ | 406,330 | $ | 2,497,347 | $ | 428,344 | $ | 3,332,021 | ||||||||||
Assets Held For Sale: | ||||||||||||||||||||
5300 Memorial | $ | — | $ | 682 | $ | 11,744 | $ | 4,547 | $ | 16,973 | ||||||||||
Town & Country | — | 436 | 8,205 | 5,333 | 13,974 | |||||||||||||||
Total Assets Held For Sale: | $ | — | $ | 1,118 | $ | 19,949 | $ | 9,880 | $ | 30,947 | ||||||||||
(1) | Encumbrances represent face amount of mortgage debt and exclude any premiums or discounts. |
(2) | In addition to a $54.0 million first mortgage secured by One Orlando Center, the property also has a $15.3 million B-note, which is subordinated to The Company's equity investment in the property. Upon the sale or recapitalization of the property, proceeds are to be distributed first to the lender up to the amount of outstanding principal of the first mortgage note; second, to the Company up to its equity investment; third, to the Company until it receives a 12% annual return on its equity investment; fourth, 60% to The Company and 40% to the lender until the subordinated B-Note is repaid in full; and fifth to The Company at 100%. As of December 31, 2015, the estimated fair market value of the B-note was zero. |
(3) | On February 5, 2016, the Company transferred 80% of its interest in Courvoisier Centre, a complex of two office buildings located in the Brickell submarket of Miami, Florida, to a joint venture with a third party investor at a gross asset value of $175.0 million. The Company retained a 20% noncontrolling ownership interest in the property. The Company expects to recognize a gain on sale of real estate during the three months ended March 31, 2016. |
.
109
SCHEDULE III – REAL ESTATE AND ACCUMULATED DEPRECIATION – (Continued) DECEMBER 31, 2015 (In thousands) | ||||||||||||||||||||||||||
Gross Amount at Which | ||||||||||||||||||||||||||
Carried at Close of Period | ||||||||||||||||||||||||||
Description | Land | Building and Improvements | Total (1) | Accumulated Depreciation | Net Book Value of Real Estate | Year Acquired | Year Constructed | Depreciable Lives (Yrs.) | ||||||||||||||||||
Arizona | ||||||||||||||||||||||||||
Hayden Ferry Lakeside I | $ | 2,871 | $ | 37,346 | $ | 40,217 | $ | 7,553 | $ | 32,664 | 2011 | 2002 | (2) | |||||||||||||
Hayden Ferry Lakeside II | 3,612 | 76,992 | 80,604 | 10,719 | 69,885 | 2012 | 2007 | (2) | ||||||||||||||||||
Hayden Ferry Lakeside III | 4,024 | 52,709 | 56,733 | 218 | 56,515 | 2012 | 2015 | (2) | ||||||||||||||||||
Hayden Ferry Lakeside IV and V | 5,023 | 10,187 | 15,210 | 1,162 | 14,048 | 2012 | 2007 | (2) | ||||||||||||||||||
Tempe Gateway | 6,970 | 55,950 | 62,920 | 7,204 | 55,716 | 2012 | 2009 | (2) | ||||||||||||||||||
Florida | ||||||||||||||||||||||||||
Stein Mart Building | 1,653 | 23,892 | 25,545 | 8,436 | 17,109 | 2005 | 1985 | (2) | ||||||||||||||||||
Lincoln Place | — | 61,985 | 61,985 | 3,842 | 58,143 | 2013 | 2002 | (2) | ||||||||||||||||||
Deerwood North | 11,904 | 46,381 | 58,285 | 6,918 | 51,367 | 2013 | 1999 | (2) | ||||||||||||||||||
Deerwood South | 14,026 | 43,563 | 57,589 | 6,206 | 51,383 | 2013 | 1999 | (2) | ||||||||||||||||||
Bank of America Center | 8,882 | 50,250 | 59,132 | 9,908 | 49,224 | 2011 | 1987 | (2) | ||||||||||||||||||
Citrus Center | 4,000 | 38,616 | 42,616 | 14,247 | 28,369 | 2003 | 1971 | (2) | ||||||||||||||||||
Corporate Center I | — | 85,316 | 85,316 | 3,181 | 82,135 | 2014 | 1999 | (2) | ||||||||||||||||||
Corporate Center II | — | 63,231 | 63,231 | 2,483 | 60,748 | 2014 | 2002 | (2) | ||||||||||||||||||
Corporate Center III | — | 68,096 | 68,096 | 2,512 | 65,584 | 2014 | 2004 | (2) | ||||||||||||||||||
Corporate Center IV | — | 40,528 | 40,528 | 8,545 | 31,983 | 2011 | 2008 | (2) | ||||||||||||||||||
Corporate Center VI | 4,901 | — | 4,901 | — | 4,901 | 2014 | N/A | (2) | ||||||||||||||||||
Courvoisier Centre | 48,407 | 85,836 | 134,243 | 5,983 | 128,260 | 2014 | 1986/1990 | (2) | ||||||||||||||||||
Harborview Plaza | 8,560 | 36,044 | 44,604 | 441 | 44,163 | 2015 | 2002 | (2) | ||||||||||||||||||
The Pointe | 5,293 | 37,022 | 42,315 | 6,431 | 35,884 | 2012 | 1982 | (2) | ||||||||||||||||||
JTB Center | 5,376 | 26,216 | 31,592 | 2,652 | 28,940 | 2014 | 1999-2001 | (2) | ||||||||||||||||||
One Orlando Centre | 9,828 | 46,871 | 56,699 | 3,629 | 53,070 | 2014 | 1987 | (2) | ||||||||||||||||||
Georgia | ||||||||||||||||||||||||||
3344 Peachtree | 7,472 | 140,432 | 147,904 | 23,304 | 124,600 | 2011 | 2008 | (2) | ||||||||||||||||||
One Buckhead Plaza | 20,031 | 133,848 | 153,879 | 4,392 | 149,487 | 2015 | 1987 | (2) | ||||||||||||||||||
Two Buckhead Plaza | 12,877 | 70,354 | 83,231 | 711 | 82,520 | 2015 | 2006 | (2) | ||||||||||||||||||
3350 Peachtree | 3,625 | 77,825 | 81,450 | 21,213 | 60,237 | 2004 | 1989 | (2) | ||||||||||||||||||
3348 Peachtree | 5,407 | 54,797 | 60,204 | 5,745 | 54,459 | 2013 | 1998 | (2) | ||||||||||||||||||
The Forum at West Paces | 3,314 | 46,434 | 49,748 | 2,087 | 47,661 | 2014 | 2001 | (2) | ||||||||||||||||||
North Carolina | ||||||||||||||||||||||||||
Hearst Tower | 4,417 | 235,357 | 239,774 | 28,938 | 210,836 | 2012 | 2002 | (2) | ||||||||||||||||||
NASCAR Plaza | — | 91,299 | 91,299 | 9,830 | 81,469 | 2012 | 2009 | (2) | ||||||||||||||||||
Pennsylvania | ||||||||||||||||||||||||||
Two Liberty Place | 32,587 | 115,605 | 148,192 | 23,323 | 124,869 | 2011 | 1990 | (2) | ||||||||||||||||||
Texas | ||||||||||||||||||||||||||
Phoenix Tower | 9,191 | 112,951 | 122,142 | 13,887 | 108,255 | 2012 | 1984/2011 | (2) | ||||||||||||||||||
CityWestPlace | 56,785 | 368,887 | 425,672 | 34,906 | 390,766 | 2013 | 1993-2001 | (2) | ||||||||||||||||||
San Felipe Plaza | 40,347 | 228,919 | 269,266 | 16,807 | 252,459 | 2013 | 1984 | (2) | ||||||||||||||||||
One Congress Plaza | 33,245 | 130,817 | 164,062 | 5,389 | 158,673 | 2014 | 1987 | (2) | ||||||||||||||||||
San Jacinto Center | 31,645 | 125,156 | 156,801 | 4,590 | 152,211 | 2014 | 1987 | (2) | ||||||||||||||||||
Other | ||||||||||||||||||||||||||
Corporate | — | 6,036 | 6,036 | 1,380 | 4,656 | N/A | N/A | N/A | ||||||||||||||||||
Total Real Estate Owned | $ | 406,273 | $ | 2,925,748 | $ | 3,332,021 | $ | 308,772 | $ | 3,023,249 | ||||||||||||||||
Assets Held For Sale: | ||||||||||||||||||||||||||
5300 Memorial | $ | 682 | $ | 16,291 | $ | 16,973 | $ | 6,911 | $ | 10,062 | 2002 | 1982 | (2) | |||||||||||||
Town & Country | 436 | 13,538 | 13,974 | 5,874 | 8,100 | 2002 | 1982 | (2) | ||||||||||||||||||
Total Assets Held For Sale | $ | 1,118 | $ | 29,829 | $ | 30,947 | $ | 12,785 | $ | 18,162 | ||||||||||||||||
(1) | The aggregate cost for federal income tax purposes was approximately $3.3 billion (unaudited), and does not include Harborview Plaza. |
(2) | Depreciation of buildings is 40 years from acquisition date. |
110
NOTE TO SCHEDULE III
At December 31, 2015, 2014 and 2013
(In thousands)
A summary of activity for real estate and accumulated depreciation is as follows:
December 31, | |||||||||||
2015 | 2014 | 2013 | |||||||||
Real Estate: | |||||||||||
Office Properties: | |||||||||||
Balance at beginning of year | $ | 3,333,900 | $ | 2,548,036 | $ | 1,762,566 | |||||
Acquisitions and improvements | 409,062 | 894,924 | 911,641 | ||||||||
Impairment on real estate | (5,400 | ) | (11,700 | ) | (24,258 | ) | |||||
Real estate sold, disposed or held for sale | (405,541 | ) | (97,360 | ) | (101,913 | ) | |||||
Balance at close of year | $ | 3,332,021 | $ | 3,333,900 | $ | 2,548,036 | |||||
Accumulated Depreciation: | |||||||||||
Balance at beginning of year | $ | 309,629 | $ | 231,241 | $ | 199,849 | |||||
Depreciation expense | 119,212 | 102,152 | 69,027 | ||||||||
Depreciation expense - discontinued operations | — | 92 | (23,579 | ) | |||||||
Real estate sold, disposed or held for sale | (120,069 | ) | (23,856 | ) | (14,056 | ) | |||||
Balance at close of year | $ | 308,772 | $ | 309,629 | $ | 231,241 | |||||
111
SCHEDULE IV - MORTGAGE LOANS RECEIVABLE ON REAL ESTATE December 31, 2015 (In thousands) | |||||||||||||||||||
Description | Interest Rate | Final Maturity Date | Periodic Payment Term | Prior Liens | Face Amount of Mortgage | Carrying Amount of Mortgage | Principal Amount of Loan Subject to Delinquent Principal and Interest | ||||||||||||
US Airways Building | 3.0% | December 2016 | Principal and interest | None | $ | 3,545 | $ | 3,331 | $ | — | |||||||||
NOTE TO SCHEDULE IV At December 31, 2015, 2014 and 2013 (In Thousands) | ||||||||||||
2015 | 2014 | 2013 | ||||||||||
Balance at beginning of year | $ | 3,417 | $ | 3,502 | $ | — | ||||||
Additions: | ||||||||||||
New mortgage loans | — | 47,000 | 3,523 | |||||||||
Deductions: | ||||||||||||
Mortgage loan payments through deed in lieu of foreclosure | — | (47,000 | ) | — | ||||||||
Mortgage loan payments | (86 | ) | (85 | ) | (21 | ) | ||||||
Balance at end of year | $ | 3,331 | $ | 3,417 | $ | 3,502 | ||||||
112
Item 9. Changes in and Disagreements with Accountants on Accounting and Financial Disclosure.
None.
Item 9A. Controls and Procedures.
Our management, with the participation of our Chief Executive Officer and Chief Financial Officer, has evaluated the effectiveness of our disclosure controls and procedures at December 31, 2015. Based on that evaluation, our Chief Executive Officer and Chief Financial Officer concluded that our disclosure controls and procedures were effective at December 31, 2015. There were no changes in our internal control over financial reporting during the fourth quarter of 2015 that has materially affected, or is reasonably likely to affect, our internal control over financial reporting.
Our internal control system was designed to provide reasonable assurance to our management and Board regarding the preparation and fair presentation of published financial statements. All internal control systems, no matter how well designed, have inherent limitations. Therefore, even those systems determined to be effective can provide only reasonable assurance with respect to the financial statement preparation and presentation.
Management's Report on Internal Control Over Financial Reporting
Our management, with the participation of our Chief Executive Officer and Chief Financial Officer, is responsible for establishing and maintaining adequate internal control over financial reporting. Our management has assessed the effectiveness of our internal control over financial reporting at December 31, 2015. In making this assessment, we used the criteria set forth by the Committee of Sponsoring Organizations of the Treadway Commission (COSO) in Internal Control – Integrated Framework (2013 Framework). Based on our assessment we have concluded that, at December 31, 2015, our internal control over financial reporting is effective based on those criteria. Our internal control over financial reporting has been audited as of December 31, 2015 by Ernst & Young LLP, an independent registered public accounting firm, as stated in their report which is included herein.
113
REPORT OF INDEPENDENT REGISTERED PUBLIC ACCOUNTING FIRM ON INTERNAL CONTROL OVER FINANCIAL REPORTING
THE BOARD OF DIRECTORS AND STOCKHOLDERS
PARKWAY PROPERTIES, INC.
We have audited Parkway Properties, Inc. and its subsidiaries’ (the “Company”) internal control over financial reporting as of December 31, 2015, based on criteria established in Internal Control-Integrated Framework issued by the Committee of Sponsoring Organizations of the Treadway Commission (2013 Framework) (the COSO criteria). The Company's management is responsible for maintaining effective internal control over financial reporting, and for its assessment of the effectiveness of internal control over financial reporting included in the accompanying Management’s Report on Internal Control over Financial Reporting. Our responsibility is to express an opinion on the Company’s internal control over financial reporting based on our audit.
We conducted our audit in accordance with the standards of the Public Company Accounting Oversight Board (United States). Those standards require that we plan and perform the audit to obtain reasonable assurance about whether effective internal control over financial reporting was maintained in all material respects. Our audit included obtaining an understanding of internal control over financial reporting, assessing the risk that a material weakness exists, testing and evaluating the design and operating effectiveness of internal control based on the assessed risk, and performing such other procedures as we considered necessary in the circumstances. We believe that our audit provides a reasonable basis for our opinion.
A company’s internal control over financial reporting is a process designed to provide reasonable assurance regarding the reliability of financial reporting and the preparation of financial statements for external purposes in accordance with generally accepted accounting principles. A company’s internal control over financial reporting includes those policies and procedures that (1) pertain to the maintenance of records that, in reasonable detail, accurately and fairly reflect the transactions and dispositions of the assets of the company; (2) provide reasonable assurance that transactions are recorded as necessary to permit preparation of financial statements in accordance with generally accepted accounting principles, and that receipts and expenditures of the company are being made only in accordance with authorizations of management and directors of the company; and (3) provide reasonable assurance regarding prevention or timely detection of unauthorized acquisition, use or disposition of the company’s assets that could have a material effect on the financial statements.
Because of its inherent limitations, internal control over financial reporting may not prevent or detect misstatements. Also, projections of any evaluation of effectiveness to future periods are subject to the risk that controls may become inadequate because of changes in conditions, or that the degree of compliance with the policies or procedures may deteriorate.
In our opinion, the Company maintained, in all material respects, effective internal control over financial reporting as of December 31, 2015 based on the COSO criteria.
We also have audited, in accordance with the standards of the Public Company Accounting Oversight Board (United States), the consolidated balance sheets of the Company as of December 31, 2015 and 2014, and the related consolidated statements of operations and comprehensive income (loss), changes in equity and cash flows for each of the three years in the period ended December 31, 2015, of the Company and our report dated February 25, 2016, expressed an unqualified opinion thereon.
/s/ Ernst & Young LLP
Indianapolis, Indiana
February 25, 2016
114
Item 9B. Other Information.
None.
115
PART III
Item 10. Directors, Executive Officers and Corporate Governance.
The information regarding directors is incorporated herein by reference from the section entitled "Corporate Governance and Board Matters—Director Qualifications and Biographical Information" in the Company's definitive Proxy Statement ("2016 Proxy Statement") to be filed pursuant to Regulation 14A of the Exchange Act for the Company's Annual Meeting of Stockholders to be held on May 19, 2016. The 2016 Proxy Statement will be filed within 120 days after the end of the Company's fiscal year ended December 31, 2015.
The information regarding executive officers is incorporated herein by reference from the section entitled "Executive Officers" in the Company's 2016 Proxy Statement.
The information regarding compliance with Section 16(a) of the Exchange Act is incorporated herein by reference from the section entitled "Ownership of Company Stock—Section 16(a) Beneficial Ownership Reporting Compliance" in the Company's 2016 Proxy Statement.
Information regarding the Company's code of business conduct and ethics found in the subsection captioned "Available Information" in Item 1 of Part I hereof is also incorporated herein by reference into this Item 10.
The information regarding the Company's audit committee, its members and the audit committee financial experts is incorporated by reference herein from the second paragraph in the section entitled "Corporate Governance and Board Matters—Committees and Meeting Data" in the Company's 2016 Proxy Statement.
Item 11. Executive Compensation.
The information included under the following captions in the Company's 2016 Proxy Statement is incorporated herein by reference: "Compensation of Executive Officers," "Corporate Governance and Board Matters—Compensation of Directors" and "Corporate Governance and Board Matters—Compensation Committee Interlocks and Insider Participation." The information included under the heading "Compensation of Executive Officers—Compensation Committee Report" in the Company's 2016 Proxy Statement is incorporated herein by reference; however, this information shall not be deemed to be "soliciting material" or to be "filed" with the SEC or subject to Regulation 14A or 14C, or to the liabilities of Section 18 of the Exchange Act.
Item 12. Security Ownership of Certain Beneficial Owners and Management and Related Stockholder Matters.
Information regarding securities authorized for issuance under equity compensation plans is incorporated herein by reference from the section entitled "Compensation of Executive Officers—Equity Compensation Plan Information" in the Company's 2016 Proxy Statement.
Information regarding security ownership of certain beneficial owners and management is incorporated herein by reference from the sections entitled "Ownership of Company Stock—Security Ownership of Certain Beneficial Owners" and "Ownership of Company Stock—Security Ownership of Management and Directors" in the Company's 2016 Proxy Statement.
Item 13. Certain Relationships and Related Transactions, and Director Independence.
The information regarding transactions with related persons and director independence is incorporated herein by reference from the sections entitled "Corporate Governance and Board Matters—Independence" and "Certain Transactions and Relationships" in the Company's 2016 Proxy Statement.
Item 14. Principal Accountant Fees and Services.
The information regarding principal auditor fees and services and the audit committee's pre-approval policies are incorporated herein by reference from the section entitled "Audit Committee Matters—Policy for Pre-Approval of Audit and Permitted Non Audit Services" and "Audit Committee Matters—Auditor Fees and Services" in the Company's 2016 Proxy Statement.
116
PART IV
Item 15. Exhibits and Financial Statement Schedules.
(a) | (1) | Consolidated Financial Statements | |
Report of Independent Registered Public Accounting Firm | |||
Consolidated Balance Sheets at December 31, 2015 and 2014 | |||
Consolidated Statements of Operations and Comprehensive Income (Loss) for the years ended December 31, 2015, 2014 and 2013 | |||
Consolidated Statements of Changes in Equity for the years ended December 31, 2015, 2014 and 2013 | |||
Consolidated Statements of Cash Flows for the years ended December 31, 2015, 2014 and 2013 | |||
Notes to Consolidated Financial Statements | |||
(2) | Consolidated Financial Statement Schedules | ||
Schedule II – Valuations and Qualifying Accounts | |||
Schedule III – Real Estate and Accumulated Depreciation | |||
Note to Schedule III | |||
Schedule IV - Mortgage Loans on Real Estate | |||
Note to Schedule IV | |||
All other schedules for which provision is made in the applicable accounting regulation of the Securities and Exchange Commission are not required under the related instructions or are inapplicable and therefore have been omitted. | |||
(3) | Form 10-K Exhibits required by Item 601 of Regulation S-K: | ||
Exhibit | |
No. | Description |
2.1 | Contribution Agreement dated as of April 10, 2011 by and among Eola Capital LLC, Eola Office Partners LLC, Banyan Street Office Holdings LLC, and the members that are parties thereto on one hand, and Parkway Properties, Inc. and Parkway Properties LP on the other hand (incorporated by reference to Exhibit 2.1 to the Company's Form 8-K filed April 13 2011). |
2.2 | Agreement and Plan of Merger by and among Parkway Properties, Inc., Parkway Properties LP, PKY Masters, LP, Thomas Properties Group, Inc. and Thomas Properties Group, L.P., dated September 4, 2013 (incorporated by reference to Exhibit 2.1 to the Company’s Form 8-K filed September 5, 2013). |
3.1 | Articles of Incorporation, as amended, of the Company (incorporated by reference to Exhibit 3.1 to the Company's Form 10-K for the year ended December 31, 2013). |
3.2 | Bylaws of the Company, as amended through August 5, 2010 (incorporated by reference to Exhibit 3.1 to the Company's Form 8-K filed on August 6, 2010). |
10 | Material Contracts: |
10.1 | Limited Partnership Agreement of Parkway Properties Office Fund II, L.P. by and among PPOF II, LLC, Parkway Properties, LP and Teacher Retirement System of Texas (incorporated by reference to Exhibit 10 to the Company's Form 8-K filed May 19, 2008). |
10.2 | First Amendment to Limited Partnership Agreement of Parkway Properties Office Fund II, L.P. dated April 10, 2011 (incorporated by reference to Exhibit 10.3 to the Company's Form 8-K filed April 14, 2011). |
10.3 | Second Amendment to Limited Partnership Agreement of Parkway Properties Office Fund II, L.P. dated August 8, 2012 (incorporated by reference to Exhibit 10.3 to the Company's Form 10-Q for the quarter ended September 30, 2012). |
10.4 | Third Amendment to Limited Partnership Agreement of Parkway Properties Office Fund II, L.P., dated August 8, 2013, by and among PPOF II, LLC, Parkway Properties LP and Teacher Retirement System of Texas (incorporated by reference to Exhibit 10.4 to the Company's Form 10-K for the year ended December 31, 2013). |
10.5 | Fourth Amendment to Limited Partnership Agreement of Parkway Properties Office Fund II, L.P., dated April 10, 2014, by and among PPOF II, LLC, Parkway Properties LP and Teacher Retirement System of Texas (incorporated by reference to Exhibit 10.1 to the Company's Form 8-K filed April 16, 2014). |
10.6 | Master Transaction Agreement dated as of April 10, 2011 by and among Eola Capital LLC, Eola Office Partners LLC, the individuals listed on the signature pages thereto on one hand and Parkway Properties, Inc. and Parkway Properties LP on the other hand (incorporated by reference to Exhibit 10.1 to the Company's Form 8-K filed April 14, 2011). |
10.7 | Comprehensive Amendment Agreement dated as of December 30, 2011 by and among Parkway Properties, Inc., Parkway Properties LP, Banyan Street Office Holdings LLC, Rodolfo Prio Touzet, James R. Heistand, Henry F. Pratt, III, Kyle Burd, Scott Francis, Troy M. Cox, Lorri Dunne, David O'Reilly and James Gray (incorporated by reference to Exhibit 10.1 to the Company's Form 8-K filed January 5, 2012). |
10.8 | Form of Purchase and Sale Agreement by and between Parkway Properties LP, a Delaware limited liability company, and applicable subsidiaries and Hertz Acquisitions Group, LLC, a Delaware limited liability company (incorporated by reference to Exhibit 2.3 to the Company's Form 8-K filed January 5, 2012). |
117
10.9 | Securities Purchase Agreement dated as of May 3, 2012, by and between Parkway Properties, Inc. and TPG VI Pantera Holdings, L.P. (incorporated by reference to Exhibit 10.1 to the Company's Form 8-K filed May 7, 2012). |
10.10 | Stockholders Agreement, dated as of June 5, 2012, by and among Parkway Properties, Inc., TPG VI Pantera Holdings, L.P. and TPG VI Management, LLC (incorporated by reference to Exhibit 10.1 to the Company's Form 8-K filed June 6, 2012). |
10.11 | Amendment No. 1 to Stockholders Agreement, dated December 3, 2012, by and between Parkway Properties, Inc. and TPG VI Pantera Holdings, L.P. (incorporated by reference to Exhibit 10.2 to the Company's Form 8-K filed December 3, 2012). |
10.12 | Amendment No. 2 to Stockholders Agreement, dated September 4, 2013, by and between Parkway Properties, Inc. and TPG VI Pantera Holdings, L.P. (incorporated by reference to Exhibit 10.2 to the Company’s Form 8-K filed September 5, 2013). |
10.13 | Management Services Agreement dated as of June 5, 2012, by and between Parkway Properties, Inc. and TPG VI Management, LLC (incorporated by reference to Exhibit 10.2 to the Company's Form 8-K filed June 6, 2012). |
10.14 | Amendment No. 1 to Management Services Agreement dated as of December 15, 2014, by and between Parkway Properties, Inc. and TPG VI Management, LLC (incorporated by reference to Exhibit 10.14 to the Company's Form 10-K for the year ended December 31, 2014) |
10.15* | Heistand Letter Agreement dated June 5, 2012, by and between the Company and James R. Heistand (incorporated by reference to Exhibit 10.5 to the Company's Form 8-K filed June 6, 2012). |
10.16 | Second Amended and Restated Agreement of Limited Partnership of Parkway Properties, LP, dated February 27, 2013 (incorporated by reference to Exhibit 10.1 to the Company's Form 8-K filed February 27, 2013). |
10.17 | Amendment No. 1 to the Second Amended and Restated Agreement of Limited Partnership of Parkway Properties LP, dated December 19, 2013, between Parkway Properties, Inc. and Parkway Properties General Partners Inc. (incorporated by reference to Exhibit 10.1 to the Company's Form 8-K filed December 24, 2013). |
10.18 | Amendment No. 2 to the Second Amended and Restated Agreement of Limited Partnership of Parkway Properties LP, dated December 31, 2014, between Parkway Properties, Inc. and Parkway Properties General Partners Inc. (incorporated by reference to Exhibit 10.20 to the Company's Form 10-K for the year ended December 31, 2014). |
10.19 | Amendment No. 3 to the Second Amended and Restated Agreement of Limited Partnership of Parkway Properties L.P, dated December 31, 2015, between Parkway Properties, Inc. and Parkway Properties General Partners Inc. (filed herewith). |
10.20 | Tax Protection Agreement dated as of December 19, 2013 by and among Thomas Properties Group, L.P., James A. Thomas, individually and as Trustee of the Lumbee Clan Trust, and the other persons listed on the signature pages thereto (incorporated by reference to Exhibit 10.2 to the Company's Form 8-K filed December 24, 2013). |
10.21 | Tax Protection Agreement dated as of October 13, 2004 by and among Thomas Properties Group, L.P., James A. Thomas, individually and as Trustee of the Lumbee Clan Trust, and the persons listed on the signature pages thereto (incorporated by reference to Exhibit F to Thomas Properties Group, Inc.’s Quarterly Report on Form 10-Q for the period ended September 30, 2004 filed with the Securities and Exchange Commission on November 22, 2004). |
10.22* | Parkway Properties, Inc. Amended and Restated 2010 Omnibus Equity Incentive Plan (incorporated by reference to Exhibit 10.1 to the Company's Form 8-K filed May 18, 2010). |
10.23* | Parkway Properties, Inc. 2006 Employee Stock Purchase Plan, as amended (incorporated by reference to Exhibit 10.1 to the Company's Form 8-K filed August 24, 2006). |
10.24* | Form of Restricted Share Agreement for Time-Based Awards (incorporated by reference to Exhibit 10.1 to the Company's Form 8-K filed on July 15, 2010). |
10.25* | Form of Restricted Share Agreement for Performance-Based Awards (Absolute Return Goal) (incorporated by reference to Exhibit 10.2 to the Company's Form 8-K filed on July 15, 2010). |
10.26* | Form of Restricted Share Agreement for Performance-Based Awards (Relative Return Goal) (incorporated by reference to Exhibit 10.3 to the Company's Form 8-K filed on July 15, 2010). |
10.27* | Parkway Properties, Inc. Long-Term Cash Incentive (incorporated by reference to Exhibit 10.4 to the Company's Form 8-K filed on July 15, 2010). |
10.28* | Parkway Properties, Inc. Long-Term Cash Incentive Participation Agreement (incorporated by reference to Exhibit 10.5 to the Company's Form 8-K filed on July 15, 2010). |
10.29* | Potential 2012 non-equity incentive awards for executive officers of the Company (a written description thereof is set forth in Item 5.02 of the Company's Form 8-K filed February 15, 2012). |
10.30* | Parkway Properties, Inc. 2011 Employee Inducement Award Plan (incorporated by reference to Exhibit 99.1 to the Company's Registration Statement on Form S-8 filed with the SEC on May 18, 2011). |
10.31* | Form of Inducement Award Agreement for Time-Based Awards (incorporated by reference to Exhibit 10.3 to the Company's Form 8-K filed May 18, 2011). |
10.32* | Form of Inducement Award Agreement for Performance-Based Awards (Absolute Return Goal) (incorporated by reference to Exhibit 10.4 to the Company's Form 8-K filed May 18, 2011). |
10.33* | Form of Inducement Award Agreement for Performance-Based Awards (Relative Return Goal) (incorporated by reference to Exhibit 10.5 to the Company's Form 8-K filed May 18, 2011). |
10.34* | Parkway Properties, Inc. and Parkway Properties LP 2013 Omnibus Equity Incentive Plan (incorporated by reference to Exhibit 10.1 to the Company's Form 8-K filed May 21, 2013). |
10.35* | Form of Profits Interest Units (LTIP Units) Agreement under the 2013 Omnibus Equity Incentive Plan (incorporated by reference to Exhibit 10.2 to the Company's Form 8-K filed May 21, 2013). |
10.36* | Form of Restricted Stock Unit Agreement - Performance Vesting under the 2013 Omnibus Equity Incentive Plan (incorporated by reference to Exhibit 10.3 to the Company's Form 8-K filed May 21, 2013). |
118
10.37* | Form of Restricted Stock Unit Agreement - Performance Vesting (2015 form) under the 2013 Omnibus Equity Incentive Plan (filed herewith) |
10.38* | Form of Restricted Stock Unit Agreement - Time Vesting under the 2013 Omnibus Equity Incentive Plan (incorporated by reference to Exhibit 10.4 to the Company's Form 8-K filed May 21, 2013). |
10.39* | Form of Stock Option Award Agreement under the 2013 Omnibus Equity Incentive Plan (incorporated by reference to Exhibit 10.5 to the Company's Form 8-K filed May 21, 2013). |
10.40* | Employment Agreement, dated as of July 8, 2013, by and between Parkway Properties, Inc. and James Heistand (incorporated by reference to Exhibit 10.1 to the Company’s Form 8-K filed July 12, 2013). |
10.41* | Amendment to Employment Agreement, dated as of June 15, 2015, by and between Parkway Properties, Inc. and James R. Heistand (incorporated by reference to Exhibit 10.1 to the Company's Form 8-K filed June 17, 2015). |
10.42* | Employment Agreement, dated as of October 25, 2013, by and between Parkway Properties, Inc. and David O’Reilly (incorporated by reference to Exhibit 10.1 to the Company’s Form 8-K filed October 31, 2013). |
10.43* | Amendment to Employment Agreement, dated as of June 15, 2015, by and between Parkway Properties, Inc. and David R. O'Reilly (incorporated by reference to Exhibit 10.2 to the Company's Form 8-K filed June 17, 2015). |
10.44* | Employment Agreement, dated as of October 25, 2013, by and between Parkway Properties, Inc. and M. Jayson Lipsey (incorporated by reference to Exhibit 10.2 to the Company’s Form 8-K filed October 31, 2013). |
10.45* | Amendment to Employment Agreement, dated as of June 15, 2015, by and between Parkway Properties, Inc. and M. Jayson Lipsey (incorporated by reference to Exhibit 10.3 to the Company's Form 8-K filed June 17, 2015). |
10.46* | Employment Agreement, dated as of October 25, 2013, by and between Parkway Properties, Inc. and Jeremy R. Dorsett (incorporated by reference to Exhibit 10.47 to the Company's Form 10-K for the year ended December 31, 2014). |
10.47* | Amendment to Employment Agreement, dated as of June 15, 2015, by and between Parkway Properties, Inc. and Jeremy R. Dorsett (incorporated by reference to Exhibit 10.4 to the Company's Form 8-K filed June 17, 2015). |
10.48* | Employment Agreement, dated as of December 22, 2014, by and between Parkway Properties, Inc. and Scott E. Francis (incorporated by reference to Exhibit 10.48 to the Company's Form 10-K for the year ended December 31, 2014). |
10.49* | Amendment to Employment Agreement, dated as of June 15, 2015, by and between Parkway Properties, Inc. and Scott E. Francis (incorporated by reference to Exhibit 10.6 to the Company's Form 8-K filed June 17, 2015). |
10.50* | Employment Agreement, dated as of December 22, 2014, by and between Parkway Properties, Inc. and Jason A. Bates (incorporated by reference to Exhibit 10.49 to the Company's 10-K for the year ended December 31, 2014). |
10.51* | Amendment to Employment Agreement, dated as of June 15, 2015, by and between Parkway Properties, Inc. and Jason A. Bates (incorporated by reference to Exhibit 10.5 to the Company's Form 8-K filed June 17, 2015). |
10.52 | Amended, Restated & Consolidated Credit Agreement dated as of April 1, 2014 by and among Parkway Properties LP, Parkway Properties, Inc., Wells Fargo Bank, National Association as Administrative Agent and the lenders party thereto (incorporated by reference to Exhibit 10.1 to the Company's Form 8-K filed April 7, 2014). |
10.53 | First Amendment to Amended, Restated and Consolidated Credit Agreement dated as of December 2, 2014 by and among Parkway Properties LP, Parkway Properties, Inc., Wells Fargo Bank, National Association as Administrative Agent and the lenders party thereto (incorporated by reference to Exhibit 10.1 to the Company's Form 8-K filed December 5, 2014). |
10.54 | Second Amendment to Amended, Restated and Consolidated Credit Agreement dated as of July 10, 2015 by and among Parkway Properties LP, Parkway Properties, Inc., Wells Fargo Bank, National Association as Administrative Agent and the lenders party thereto (incorporated by reference to Exhibit 10.12 to the Company's Form 10-Q filed August 3, 2015). |
10.55 | Amended, Restated & Consolidated Guaranty dated as of April 1, 2014 by Parkway Properties, Inc. and certain subsidiaries of Parkway Properties, Inc. party thereto in favor of Wells Fargo Bank, National Association (incorporated by reference to Exhibit 10.2 to the Company's Form 8-K filed April 7, 2014). |
10.56* | Indemnification Agreement dated June 16, 2014 by and between Parkway Properties, Inc. and David R. O'Reilly (incorporated by reference to Exhibit 10.1 to the Company's Form 8-K filed June 17, 2014). |
10.57* | Indemnification Agreement dated June 16, 2014 by and between Parkway Properties, Inc. and M. Jayson Lipsey (incorporated by reference to Exhibit 10.2 to the Company's Form 8-K filed June 17, 2014). |
10.58* | Indemnification Agreement dated June 16, 2014 by and between Parkway Properties, Inc. and Jeremy R. Dorsett (incorporated by reference to Exhibit 10.3 to the Company's Form 8-K filed June 17, 2014). |
10.59* | Indemnification Agreement dated June 16, 2014 by and between Parkway Properties, Inc. and Henry F. Pratt III (incorporated by reference to Exhibit 10.4 to the Company's Form 8-K filed June 17, 2014). |
10.60* | Indemnification Agreement dated June 16, 2014 by and between Parkway Properties, Inc. and Avi Banyasz (incorporated by reference to Exhibit 10.5 to the Company's Form 8-K filed June 17, 2014). |
10.61* | Indemnification Agreement dated June 16, 2014 by and between Parkway Properties, Inc. and Charles T. Cannada (incorporated by reference to Exhibit 10.6 to the Company's Form 8-K filed June 17, 2014). |
10.62* | Indemnification Agreement dated June 16, 2014 by and between Parkway Properties, Inc. and Edward M. Casal (incorporated by reference to Exhibit 10.7 to the Company's Form 8-K filed June 17, 2014). |
10.63* | Indemnification Agreement dated June 16, 2014 by and between Parkway Properties, Inc. and Kelvin L. Davis (incorporated by reference to Exhibit 10.8 to the Company's Form 8-K filed June 17, 2014). |
10.64* | Indemnification Agreement dated June 16, 2014 by and between Parkway Properties, Inc. and Laurie L. Dotter (incorporated by reference to Exhibit 10.9 to the Company's Form 8-K filed June 17, 2014). |
10.65* | Indemnification Agreement dated June 16, 2014 by and between Parkway Properties, Inc. and James R. Heistand (incorporated by reference to Exhibit 10.10 to the Company's Form 8-K filed June 17, 2014). |
119
10.66* | Indemnification Agreement dated June 16, 2014 by and between Parkway Properties, Inc. and C. William Hosler (incorporated by reference to Exhibit 10.11 to the Company's Form 8-K filed June 17, 2014). |
10.67* | Indemnification Agreement dated June 16, 2014 by and between Parkway Properties, Inc. and Adam S. Metz (incorporated by reference to Exhibit 10.12 to the Company's Form 8-K filed June 17, 2014). |
10.68* | Indemnification Agreement dated June 16, 2014 by and between Parkway Properties, Inc. and Brenda J. Mixson (incorporated by reference to Exhibit 10.13 to the Company's Form 8-K filed June 17, 2014). |
10.69* | Indemnification Agreement dated June 16, 2014 by and between Parkway Properties, Inc. and James A. Thomas (incorporated by reference to Exhibit 10.14 to the Company's Form 8-K filed June 17, 2014). |
10.70* | Separation and General Release Agreement dated December 21, 2014 by and between Parkway Properties, Inc. and Henry F. Pratt, III (incorporated by reference to Exhibit 10.1 to the Company’s Form 8-K filed January 2, 2015). |
10.71 | Purchase and Sale Agreement, dated as of September 19, 2014, by and between PKY SUSP, LLC and Corporate Center One Owner LLC, Corporate Center Two Owner LLC, Corporate Center Three Owner LLC, Deerfield One Owner Corp., Deerfield Two Owner Corp., Greens Crossing II Owner LP, H. River One Owner LLC, H. River Two Owner LLC, H. River Three Owner LLC, Lakeside I Owner Corp., Lakeside II Owner Corp, Paragon Owner Corp., Resource Square One Owner LLC, Resource Square Two Owner LLC, Resource Square Three Owner LLC, Satellite 300 Owner Corp., Satellite 400 Owner Corp., Satellite 600 Owner Corp., Satellite 800 Owner Corp., Stony Point II Owner Corp. and Timberway One Owner LP (incorporated by reference to Exhibit 10.1 to the Company's Form 8-K/A filed September 24, 2014). |
10.72 | Amendment and Ratification to Purchase and Sale Agreement, dated as of October 28, 2014, by and among PKY SUSP, LLC and Corporate Center One Owner LLC, Corporate Center Two Owner LLC, Corporate Center Three Owner LLC, Deerfield One Owner Corp., Deerfield Two Owner Corp., Greens Crossing II Owner LP, H. River One Owner LLC, H. River Two Owner LLC, H. River Three Owner LLC, Lakeside I Owner Corp., Lakeside II Owner Corp, Paragon Owner Corp., Resource Square One Owner LLC, Resource Square Two Owner LLC, Resource Square Three Owner LLC, Satellite 300 Owner Corp., Satellite 400 Owner Corp., Satellite 600 Owner Corp., Satellite 800 Owner Corp., Stony Point II Owner Corp. and Timberway One Owner LP (incorporated by reference to Exhibit 10.69 to the Company's Form 10-K for the year ended December 31, 2014). |
10.73 | Second Amendment and Ratification to Purchase and Sale Agreement, dated as of November 19, 2014, by and among PKY SUSP, LLC and Corporate Center One Owner LLC, Corporate Center Two Owner LLC, Corporate Center Three Owner LLC, Deerfield One Owner Corp., Deerfield Two Owner Corp., Greens Crossing II Owner LP, H. River One Owner LLC, H. River Two Owner LLC, H. River Three Owner LLC, Lakeside I Owner Corp., Lakeside II Owner Corp, Paragon Owner Corp., Resource Square One Owner LLC, Resource Square Two Owner LLC, Resource Square Three Owner LLC, Satellite 300 Owner Corp., Satellite 400 Owner Corp., Satellite 600 Owner Corp., Satellite 800 Owner Corp., Stony Point II Owner Corp. and Timberway One Owner LP (incorporated by reference to Exhibit 10.70 to the Company’s Form 10-K for the year ended December 31, 2014). |
10.74 | Purchase and Sale of Membership Interests Agreement, dated as of October 5, 2014, by and between PKY SUSP, LLC and Banyan Street/GAP SUSP Holdings, LLC (incorporated by reference to Exhibit 10.1 to the Company's Form 8-K filed October 9, 2014). |
10.75 | Amendment and Ratification to Purchase and Sale of Membership Interests Agreement, dated as of October 29, 2014, by and between PKY SUSP, LLC and Banyan Street/GAP SUSP Holdings, LLC (incorporated by reference to Exhibit 10.72 to the Company's Form 10-K for the year ended December 31, 2014). |
10.76 | Second Amendment and Ratification to Purchase and Sale of Membership Interests Agreement, dated as of November 20, 2014, by and between PKY SUSP, LLC and Banyan Street/GAP SUSP Holdings, LLC (incorporated by reference to Exhibit 10.73 to the Company’s Form 10-K for the year ended December 31, 2014). |
10.77 | Third Amendment and Ratification to Purchase and Sale of Membership Interests Agreement, dated as of December 8, 2014, by and between PKY SUSP, LLC and Banyan Street/GAP SUSP Holdings, LLC (incorporated by reference to Exhibit 10.74 to the Company’s Form 10-K for the year ended December 31, 2014). |
10.78 | Membership Interest Purchase Agreement, dated November 17, 2014, by and between PKY Austin Partner, LLC, The California State Teachers' Retirement System, PKY Masters Austin, LLC and PKY/CalSTRS Austin, LLC (incorporated by reference to Exhibit 10.1 to the Company's Form 8-K filed November 17, 2014). |
10.79 | Redemption and Distribution Agreement, dated November 17, 2014, by and between PKY Austin Partner, LLC, The California State Teachers' Retirement System, PKY Masters Austin, LLC and PKY/CalSTRS Austin, LLC (incorporated by reference to Exhibit 10.2 to the Company's Form 8-K filed November 17, 2014). |
10.80 | Agreement Regarding Revolving Commitment Increases dated as of January 27, 2015 by and among Parkway Properties LP, Parkway Properties, Inc., Wells Fargo Bank, National Association as Administrative Agent and the lenders party thereto (incorporated by reference to Exhibit 10.1 to the Company's Form 8-K filed February 2, 2015). |
10.81* | Parkway Properties, Inc. and Parkway Properties LP 2015 Omnibus Equity Incentive Plan (incorporated by reference to Exhibit 10.1 to the Company’s Form 8-K filed May 19, 2015). |
10.82* | Form of Profits Interest Units (LTIP Units) Agreement under the Parkway Properties, Inc. and Parkway Properties LP 2015 Omnibus Equity Incentive Plan (incorporated by reference to Exhibit 10.2 to the Company’s Form 8-K filed May 19, 2015). |
10.83* | Form of Restricted Stock Unit Agreement - Time Vesting under the Parkway Properties, Inc. and Parkway Properties LP 2015 Omnibus Equity Incentive Plan (incorporated by reference to Exhibit 10.3 to the Company’s Form 8-K filed May 19, 2015). |
10.84* | Consulting Agreement, dated as of June 15, 2015, by and between Parkway Properties LP and Henry F. Pratt, III (incorporated by reference to Exhibit 10.7 to the Company's Form 8-K filed June 17, 2015). |
10.85 | Term Loan Agreement dated as of June 26, 2015 by and among Parkway Properties LP, Parkway Properties, Inc., Wells Fargo Bank, National Association as Administrative Agent and the lenders party thereto(incorporated by reference to Exhibit 10.1 to the Company's Form 8-K filed July 1, 2015). |
10.86 | Agreement Regarding Revolving Commitment Increases dated as of January 27, 2015 by and among Parkway Properties LP, Parkway Properties, Inc., Wells Fargo Bank, National Association as Administrative Agent and the lenders party thereto (incorporated by reference to Exhibit 10.1 to the Company’s Form 8-K filed February 2, 2015). |
120
21 | Subsidiaries of the Company (filed herewith). |
23.1 | Consent of Ernst & Young LLP (filed herewith). |
31.1 | Certification of Chief Executive Officer pursuant to Section 302 of the Sarbanes-Oxley Act of 2002 (filed herewith). |
31.2 | Certification of Chief Financial Officer pursuant to Section 302 of the Sarbanes-Oxley Act of 2002 (filed herewith). |
32.1 | Certification of Chief Executive Officer pursuant to Section 906 of the Sarbanes-Oxley Act of 2002 (filed herewith). |
32.2 | Certification of Chief Financial Officer pursuant to Section 906 of the Sarbanes-Oxley Act of 2002 (filed herewith). |
101.1** | The following materials from Parkway Properties, Inc.'s Annual Report on Form 10-K for the year ended December 31, 2015, formatted in XBRL (eXtensible Business Reporting Language): (1) consolidated balance sheets, (2) consolidated statements of operations and comprehensive income (loss), (3) consolidated statement of changes in equity, (4) consolidated statements of cash flows, and (5) the notes to the consolidated financial statements. ** |
* | Denotes a management contract or compensatory plan, contract or arrangement. |
** | Pursuant to Rule 406T of Regulation S-T, the Interactive Data Files on Exhibit 101 hereto are deemed not filed or part of a registration statement or prospectus for purposes of Sections 11 or 12 of the Securities Act of 1933, as amended, are deemed not filed for purposes of Section 18 of the Securities Exchange Act of 1934, as amended, and otherwise are not subject to liability under those sections. |
121
SIGNATURES
Pursuant to the requirements of Section 13 or 15(d) of the Securities Exchange Act of 1934, the Registrant has duly caused this report to be signed on its behalf by the undersigned, thereunto duly authorized.
PARKWAY PROPERTIES, INC. | |
Registrant | |
By: /s/ James R. Heistand | |
James R. Heistand | |
President, Chief Executive Officer and Director | |
February 25, 2016 | |
/s/ David R. O'Reilly | |
David R. O'Reilly | |
Executive Vice President and Chief Financial Officer | |
February 25, 2016 | |
/s/ Scott E. Francis | |
Scott E. Francis | |
Executive Vice President and Chief Accounting Officer | |
February 25, 2016 | |
Pursuant to the requirements of the Securities Exchange Act of 1934, this report has been signed below by the following persons on behalf of the Registrant and in the capacities and on the dates indicated.
/s/ Avi Banyasz | /s/ James R. Heistand |
Avi Banyasz, Director | James R. Heistand |
February 25, 2016 | President, Chief Executive Officer and Director |
February 25, 2016 | |
/s/ Charles T. Cannada | /s/ C. William Hosler |
Charles T. Cannada, Director | C. William Hosler, Director |
February 25, 2016 | February 25, 2016 |
/s/ Edward M. Casal | /s/ Adam S. Metz |
Edward M. Casal, Director | Adam S. Metz, Director |
February 25, 2016 | February 25, 2016 |
/s/ Kelvin L. Davis | /s/ Brenda J. Mixson |
Kelvin L. Davis, Director | Brenda J. Mixson, Director |
February 25, 2016 | February 25, 2016 |
/s/ Laurie L. Dotter | /s/ James A. Thomas |
Laurie L. Dotter, Director | James A. Thomas |
February 25, 2016 | Chairman of the Board and Director |
February 25, 2016 | |
122