Attached files
| file | filename |
|---|---|
| 8-K - 8-K - Globalstar, Inc. | q42015earningsrelease8-k.htm |
| EX-10.1 - EXHIBIT 10.1 - Globalstar, Inc. | gsatex101.htm |
| EX-10.2 - EXHIBIT 10.2 - Globalstar, Inc. | gsatex102.htm |
| EX-99.1 - EXHIBIT 99.1 - Globalstar, Inc. | gsat20151231-ex991.htm |

Earnings Call Presentation Fourth Quarter 2015 February 25, 2016

Safe Harbor Language 1 This presentation contains certain statements that are “forward-looking statements” within the meaning of the Private Securities Litigation Reform Act of 1995. These forward-looking statements are based on current expectations and assumptions that are subject to risks and uncertainties which may cause actual results to differ materially from the forward-looking statements. Forward-looking statements, such as the statements regarding our expectations with respect to actions by the FCC, future increases in our revenue and profitability and other statements contained in this presentation regarding matters that are not historical facts, involve predictions. Any forward-looking statements made in this presentation are accurate as of the date made and are not guarantees of future performance. Actual results or developments may differ materially from the expectations expressed or implied in the forward-looking statements, and we undertake no obligation to update any such statements. Additional information on factors that could influence our financial results is included in our filings with the Securities and Exchange Commission, including our Annual Report on Form 10-K, Quarterly Reports on Form 10-Q and Current Reports on Form 8-K.

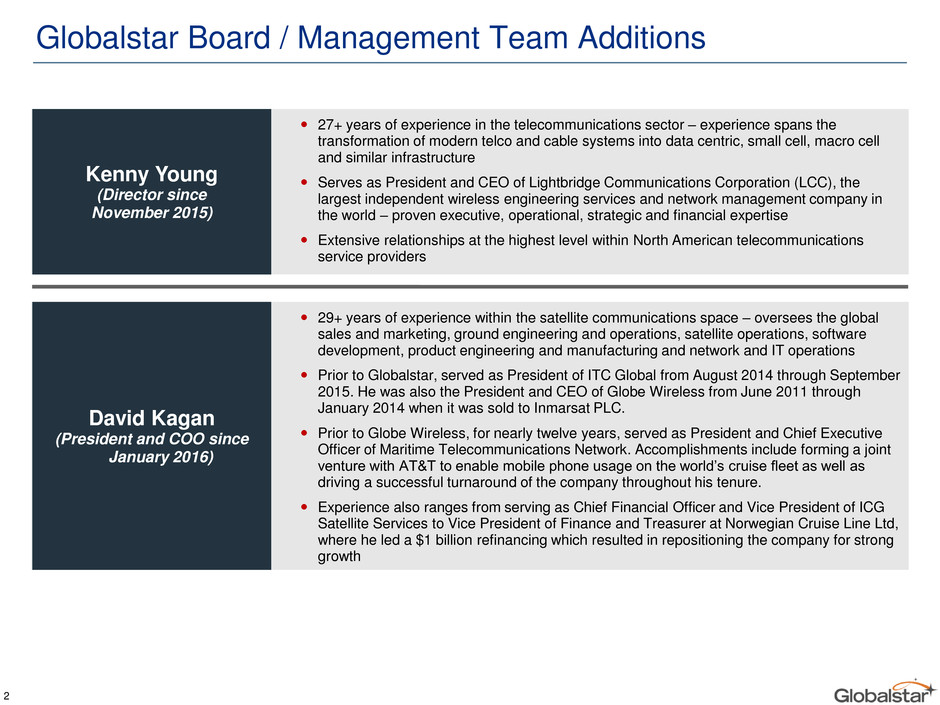
Globalstar Board / Management Team Additions 2 27+ years of experience in the telecommunications sector – experience spans the transformation of modern telco and cable systems into data centric, small cell, macro cell and similar infrastructure Serves as President and CEO of Lightbridge Communications Corporation (LCC), the largest independent wireless engineering services and network management company in the world – proven executive, operational, strategic and financial expertise Extensive relationships at the highest level within North American telecommunications service providers Kenny Young (Director since November 2015) 29+ years of experience within the satellite communications space – oversees the global sales and marketing, ground engineering and operations, satellite operations, software development, product engineering and manufacturing and network and IT operations Prior to Globalstar, served as President of ITC Global from August 2014 through September 2015. He was also the President and CEO of Globe Wireless from June 2011 through January 2014 when it was sold to Inmarsat PLC. Prior to Globe Wireless, for nearly twelve years, served as President and Chief Executive Officer of Maritime Telecommunications Network. Accomplishments include forming a joint venture with AT&T to enable mobile phone usage on the world’s cruise fleet as well as driving a successful turnaround of the company throughout his tenure. Experience also ranges from serving as Chief Financial Officer and Vice President of ICG Satellite Services to Vice President of Finance and Treasurer at Norwegian Cruise Line Ltd, where he led a $1 billion refinancing which resulted in repositioning the company for strong growth David Kagan (President and COO since January 2016)

Global Subscriber Composition 3 Note: Duplex composition for prior period excludes the deactivation of certain subscribers across Latin America during Q3 2015. Two-Way Duplex One-Way SPOT and Simplex Gross Subscriber Additions Composition End of Period Subscriber Composition 2014 2015 2014 2015 2014 2015 2014 2015 North America Non-North America 80% 20% 66% 34% 84% 16% 79% 21% 75% 25% 58% 42% 83% 17% 80% 20% Continued focus on international expansion – as percentage of global subscriber additions, non-North American Duplex, SPOT and Simplex subscriber additions grew from 20%, 30% and 20% in 2014 to 34%, 39% and 56%, respectively in 2015 In 2015, Duplex and SPOT subscriber additions grew 30% and 19%, respectively vs. 2014. Simplex additions dropped from 56,000 to 16,000 due primarily to the economic downturn in the oil and gas sector.

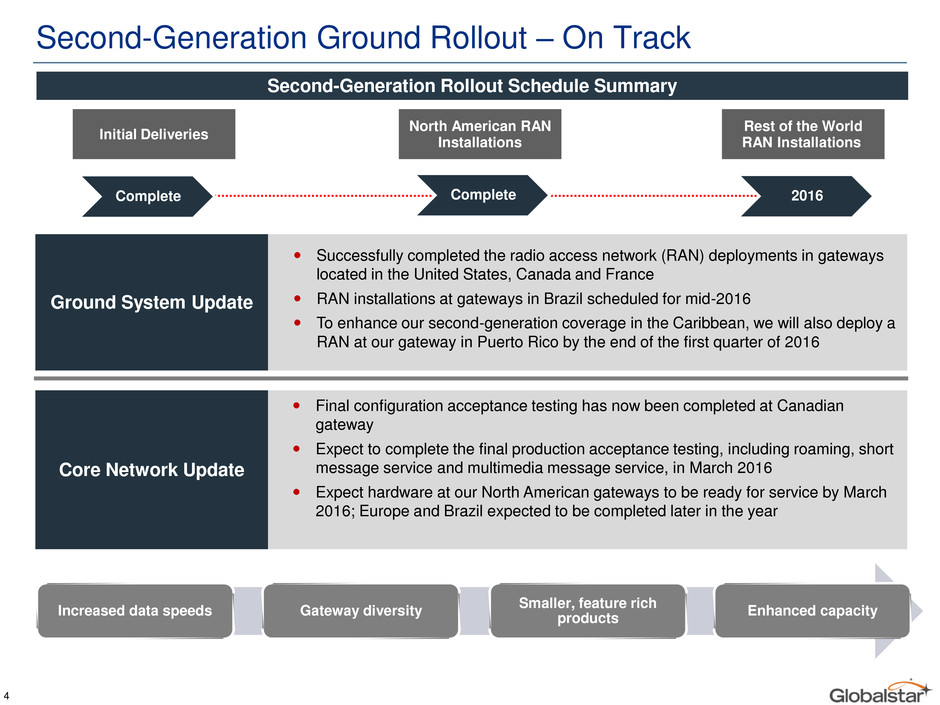
Second-Generation Ground Rollout – On Track Initial Deliveries North American RAN Installations Rest of the World RAN Installations Complete Complete 2016 Second-Generation Rollout Schedule Summary Successfully completed the radio access network (RAN) deployments in gateways located in the United States, Canada and France RAN installations at gateways in Brazil scheduled for mid-2016 To enhance our second-generation coverage in the Caribbean, we will also deploy a RAN at our gateway in Puerto Rico by the end of the first quarter of 2016 Ground System Update Final configuration acceptance testing has now been completed at Canadian gateway Expect to complete the final production acceptance testing, including roaming, short message service and multimedia message service, in March 2016 Expect hardware at our North American gateways to be ready for service by March 2016; Europe and Brazil expected to be completed later in the year Core Network Update 4 Increased data speeds Gateway diversity Smaller, feature rich products Enhanced capacity

Satellite Product Evolution and New Products Existing / Legacy Product Line New Products: Second-Generation Simplex Duplex GSP 1600 GSP 1700 Commercial Sat-Fi Second-Generation Sat-Fi Satellite Transmitter Unit STX2 STX3 Second-Generation Simplex SPOT SPOT Personal Tracker SPOT 2 SPOT Gen3 Turns any Wi-Fi enabled device into a satellite phone; Small form factor vs. commercial Sat-Fi Targets mass market consumers First-of-its-kind, small bit data device Provides command and control functionality Second-Generation SPOT Enhanced data communication device with faster speeds vs. first-generation devices – targeted towards mass market consumers Tracking and texting capabilities for emergency and off-the-grid communications 5

Second-Generation Sat-Fi Capabilities Wi-Fi 6 Hughes-based mass market product that connects any Wi-Fi enabled device to Globalstar’s satellite network for full data services beyond the range of cellular networks, targeting 2/3rds of the planet beyond terrestrial coverage Dimensions – 3” x 4.5” x 1.3” Provides inexpensive satellite capability for people who live, work, play or travel outside terrestrial network Promotes constant data connectivity in and out of cellular range Data speeds up to 256 kbps – 25x first-generation system Leverages near-infinitely expandable capacity of Globalstar’s satellite network for off-the-grid uses Key Product Features and Benefits Second-Generation Sat-Fi Capacity Assessment Item Value Number of Second-Generation Satellites 24 Total data minutes supported per day > 10 million Total number of SMS / text messages per day > 20 billion Second-Generation Sat-Fi Satellite communications device which turns any smartphone, laptop or tablet into a satellite phone / global data device

7 Regulatory Process Overview Nov 2012: GSAT files petition for rulemaking Jan 2013: Conclusion of Comment period for petition Nov 2013: FCC unanimously votes for and releases NPRM Feb 2014: NPRM published in Federal Register May 2014: Comment period end date Jun 2014: Reply comment period end date Mar 2015: Completion of TLPS demonstration at FCC Mar 2015: TLPS characterization testing at FCC laboratory May – Aug 2015: TLPS deployment at a university in Chicago Oct 2015 – Feb 2016: TLPS deployment at Washington School for Girls in DC Nov 2012: FCC places petition on public notice TLPS Regulatory and Significant Milestones Schedule to Date

Financial Results Summary (1) Adjusted to exclude non-cash compensation expense, reduction in the value of assets, foreign exchange (gains)/losses, R&D costs associated with the development of new products and certain other charges. See reconciliation to GAAP Net Income (loss) on Annex A. (2) Duplex ARPU for Q1 2014 and year-end 2014 has been adjusted for deactivation of approximately 26,000 suspended or non-paying subscribers during Q1 2014. 8 ($ in millions except ARPU data) INCOME STATEMENT SUMMARY Q1 2014 Q2 2014 Q3 2014 Q4 2014 2014 Q1 2015 Q2 2015 Q3 2015 Q4 2015 2015 Revenue: Service revenue Duplex $5.9 $6.9 $7.7 $6.5 $27.0 $6.2 $7.0 $7.4 $6.8 $27.4 SPOT 7.0 7.0 7.5 7.5 29.1 7.5 8.3 8.8 8.8 33.5 Simplex 1.9 2.2 2.0 2.3 8.4 2.3 2.2 2.4 2.2 9.1 IGO & Other 1.5 1.7 1.3 0.9 5.4 1.1 1.0 1.1 0.9 4.2 Total Service Revenue $16.2 $17.9 $18.5 $17.2 $69.8 $17.1 $18.6 $19.6 $18.8 $74.1 Equipment sales revenue $4.3 $6.1 $4.9 $4.9 $20.2 $3.9 $4.4 $4.0 $4.0 $16.4 Total revenue $20.5 $24.0 $23.4 $22.1 $90.1 $21.0 $23.0 $23.7 $22.8 $90.5 Cost of services $6.9 $7.1 $7.9 $7.7 $29.7 $7.4 $8.0 $7.8 $7.4 $30.6 Cost of subscriber equipment sales 3.1 4.3 3.8 3.6 14.9 3.1 3.0 2.9 2.8 11.8 Marketing, general, and administrative 7.8 8.2 8.8 8.7 33.5 8.6 10.2 9.7 9.0 37.4 Depreciation, amortization, and accretion 23.3 22.0 21.0 19.8 86.1 19.0 19.3 19.4 19.5 77.2 Reduction in the value of inventory / long-lived assets 0.0 7.3 0.0 14.5 21.8 0.0 0.0 0.0 0.0 0.0 Total operating expenses $41.1 $49.0 $41.5 $54.3 $186.0 $38.2 $40.4 $39.8 $38.7 $157.1 Loss from operations ($20.6) ($25.0) ($18.1) ($32.2) ($95.9) ($17.2) ($17.4) ($16.1) ($15.9) ($66.6) Loss on extinguishment of debt (10.2) (16.5) (12.9) (0.2) (39.8) (0.1) (2.2) 0.0 0.0 (2.3) Derivative gain (loss) (209.4) (376.3) 167.0 132.6 (286.0) (107.9) 237.1 54.2 (1.6) 181.9 Other income (expense) (10.2) (15.0) (6.5) (8.6) (40.2) (4.4) (12.6) (13.9) (8.4) (39.3) Income tax benefit / (expense) (0.2) (1.0) (0.1) 0.4 (0.9) (0.2) (0.1) (0.1) (0.9) (1.4) Net Income (loss) ($250.5) ($433.7) $129.4 $92.0 ($462.9) ($129.7) $204.8 $24.1 ($26.8) $72.3 Adjusted EBITDA (1) $3.8 $5.0 $4.8 $3.8 $17.4 $3.1 $3.2 $4.5 $5.2 $16.0 ARPU Duplex $27.43 $38.41 $40.18 $32.51 $29.69 $30.00 $32.25 $32.80 $29.68 $31.59 Duplex Adjusted ARPU (2) 33.73 38.41 40.18 32.51 36.03 30.00 32.25 32.80 29.68 31.59 SPOT 10.52 10.34 10.73 10.51 10.48 10.29 11.08 11.33 11.16 11.03 Simplex 2.58 2.88 2.46 2.74 2.69 2.65 2.56 2.60 2.39 2.56 IGO / Wholesale 2.32 2.56 1.83 1.93 2.16 1.92 1.40 1.63 1.90 1.71 Adjusted EBITDA was $5.2 million – 37% improvement over Q4 2014 Service revenue increased 9% to $18.8 million in Q4 2015; SPOT service revenue increased by $1.3 million or 18% over prior year period Duplex and SPOT subscriber additions increased 29% and 14%, respectively vs. Q4 2014 Fourth Quarter Highlights Full Year Highlights Total service revenue was $74.1 million – 6% improvement over 2014 SPOT, Simplex and Duplex service revenue increased 15%, 8% and 1% respectively over 2014 Added 50,000 subscribers during the year – approximately 50% of these additions were in the SPOT business

44.4 41.8 287.2 303.6 240.3 265.9 67.4 77.0 - 100.0 200.0 300.0 400.0 500.0 600.0 700.0 800.0 2014 2015 $5.4 $4.2 $8.4 $9.1 $29.1 $33.5 $27.0 $27.4 $0.0 $10.0 $20.0 $30.0 $40.0 $50.0 $60.0 $70.0 $80.0 2014 2015 Service Revenue Highlights 9 Duplex SPOT Simplex IGO / Other ($ in millions) (in thousands) $69.8 $74.1 639.2 688.3 Service Revenue Profile Subscriber Profile 6% 8% EOP subscribers for Duplex, SPOT and Simplex grew 14%, 11% and 6%, respectively, over 2014 Despite FX headwinds, total service revenue improved 6% over prior year period Duplex service revenue and monthly ARPU would have been higher by $2.3 million and $2.67, respectively if FX rates remained at 2014 levels. Key Highlights

8.3 10.6 60.5 59.7 62.4 67.1 14.0 21.6 - 20.0 40.0 60.0 80.0 100.0 120.0 140.0 160.0 180.0 2014 2015 $1.2 $1.1 $6.6 $5.3 $6.3 $5.1 $6.2 $4.9 $0.0 $5.0 $10.0 $15.0 $20.0 $25.0 2014 2015 Equipment Revenue Highlights 10 Duplex SPOT Simplex IGO / Other Equipment revenue decreased year-over-year due primarily to lower selling prices of Duplex and SPOT devices ahead of the launch of second-generation products Number of mobile units sold increased 48% in 2015 vs. 2014 – higher product sales are a leading indicator for future high-margin Duplex service revenue FX impact on total equipment revenue – $1.2 million Key Highlights 159.0 (in thousands) 145.2 Units Sold ($ in millions) $16.4 $20.2 Equipment Revenue

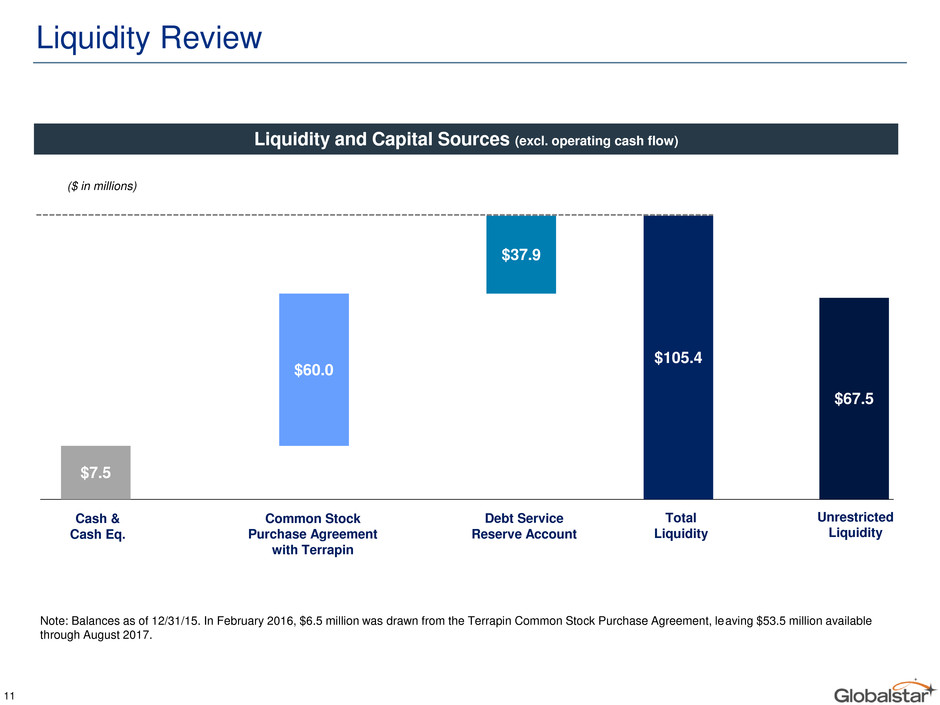
Liquidity Review Liquidity and Capital Sources (excl. operating cash flow) Cash & Cash Eq. Common Stock Purchase Agreement with Terrapin Debt Service Reserve Account Total Liquidity Unrestricted Liquidity $7.5 $60.0 $37.9 $105.4 $67.5 ($ in millions) Note: Balances as of 12/31/15. In February 2016, $6.5 million was drawn from the Terrapin Common Stock Purchase Agreement, leaving $53.5 million available through August 2017. 11

Key Value Drivers 12 Diverse product and service offerings across consumer, commercial and government markets New product offerings – Second-Generation Sat-Fi, Simplex and SPOT devices Operational focus expanded to include new territories, such as Latin America and Southern Africa Second-Generation upgrades materially improve data speeds and applications Significant reduction in product cost – ability to develop low-cost products for the mass consumer Materially improves call quality with built-in redundancies Completion of 2.4 GHz terrestrial authority proceeding Unique globally harmonized position Opportunity to deploy terrestrial services after U.S. approval – leverages worldwide 802.11 standards Core MSS Operations Second-Generation Upgrades Spectrum

Annex A – Reconciliation of Adjusted EBITDA 13 ($ in millions) Q1 2014 Q2 2014 Q3 2014 Q4 2014 2014 Q1 2015 Q2 2015 Q3 2015 Q4 2015 2015 Net Income (loss) ($250.5) ($433.7) $129.4 $92.0 ($462.9) ($129.7) $204.8 $24.1 ($26.8) $72.3 Interest income and expense, net 10.9 13.9 9.1 9.4 43.2 8.5 9.2 9.0 9.1 35.9 Derivative (gain) loss 209.4 376.3 (167.0) (132.6) 286.0 107.9 (237.1) (54.2) 1.6 (181.9) Income tax expense (benefit) 0.2 1.0 0.1 (0.4) 0.9 0.2 0.1 0.1 0.9 1.4 Depreciation, amortization, and accretion 23.3 22.0 21.0 19.8 86.1 19.0 19.3 19.4 19.5 77.2 EBITDA ($6.7) ($20.6) ($7.4) ($11.8) ($46.6) $5.9 ($3.7) ($1.5) $4.3 $5.0 Reduction in the value of long-lived assets & inventory $0.0 $7.3 $0.0 $14.5 $21.8 $0.0 $0.0 $0.0 $0.0 $0.0 Non-cash compensation 0.8 0.6 1.3 1.2 3.9 1.0 0.8 0.7 1.0 3.4 Research and development 0.1 0.1 0.1 0.2 0.5 0.3 0.5 0.5 0.6 1.9 Foreign exchange and other (income) / expense (0.7) 0.3 (2.6) (0.8) (3.8) (4.1) 0.5 2.0 (1.5) (3.2) Loss on extinguishment of debt 10.2 16.5 12.9 0.2 39.8 0.1 2.2 0.0 0.0 2.3 Non-cash adjustment related to international operations 0.0 0.0 0.0 0.4 0.4 0.0 0.0 0.0 0.0 0.0 Write-off of deferred financing costs 0.2 0.0 0.0 0.0 0.2 0.0 0.0 0.0 0.0 0.0 Loss on equity issuance 0.0 0.7 0.0 0.0 0.7 0.0 2.9 2.9 0.8 6.7 Brazil litigation expense accrual 0.0 0.0 0.4 0.0 0.4 0.0 0.0 0.0 0.0 0.0 Adjusted EBITDA $3.8 $5.0 $4.8 $3.8 $17.4 $3.1 $3.2 $4.5 $5.2 $16.0
