Attached files
| file | filename |
|---|---|
| EX-23.1 - EXHIBIT 23.1 - PROS Holdings, Inc. | pro20151231ex231.htm |
| EX-32.1 - EXHIBIT 32.1 - PROS Holdings, Inc. | pro20151231ex321.htm |
| EX-21.1 - EXHIBIT 21.1 - PROS Holdings, Inc. | pro20151231ex211.htm |
| EX-31.1 - EXHIBIT 31.1 - PROS Holdings, Inc. | pro20151231ex311-ceo.htm |
| EX-31.2 - EXHIBIT 31.2 - PROS Holdings, Inc. | pro20151231ex312-cfo.htm |
UNITED STATES
SECURITIES AND EXCHANGE COMMISSION
Washington, D.C. 20549
Form 10-K
(MARK ONE)
ý | ANNUAL REPORT PURSUANT TO SECTION 13 OR 15(d) OF THE SECURITIES EXCHANGE ACT OF 1934 |
For the fiscal year ended December 31, 2015 | |
OR
¨ | TRANSITION REPORT PURSUANT TO SECTION 13 OR 15(d) OF THE SECURITIES EXCHANGE ACT OF 1934 |
For the transition period from to | |
Commission File Number 001-33554

PROS HOLDINGS, INC.
(Exact Name of Registrant as Specified in Its Charter)
Delaware | 76-0168604 |
(State or Other Jurisdiction of Incorporation or Organization) | (I.R.S. Employer Identification No.) |
3100 Main Street, Suite 900, Houston, Texas | 77002 |
(Address of Principal Executive Offices) | (Zip code) |
Registrant’s telephone number, including area code: (713) 335-5151
Securities Registered Pursuant to Section 12(b) of the Act:
Title of Each Class | Name of Each Exchange on Which Registered |
Common Stock, par value $0.001 per share | New York Stock Exchange |
Securities Registered Pursuant to Section 12(g) of the Act:
None
Indicate by check mark if the registrant is a well-known seasoned issuer, as defined in Rule 405 of the Securities Act.
Yes ¨ No ý
Indicate by check mark if the registrant is not required to file reports pursuant to Section 13 or Section 15(d) of the Exchange Act.
Yes ¨ No ý
Indicate by check mark whether the registrant: (1) has filed all reports required to be filed by Section 13 or 15(d) of the Securities Exchange Act of 1934 during the preceding 12 months (or for such shorter period that the registrant was required to file such reports), and (2) has been subject to such filing requirements for the past 90 days.
Yes ý No ¨
Indicate by check mark whether the registrant has submitted electronically and posted on its corporate website, if any, every Interactive Data File required to be submitted and posted pursuant to Rule 405 of Regulation S-T(§232.405 of this chapter) during the preceding 12 months (or for such shorter period that the registrant was required to submit and post such files).
Yes ý No ¨
Indicate by check mark if disclosure of delinquent filers pursuant to Item 405 of Regulation S-K (§229.405 of this chapter) is not contained herein, and will not be contained, to the best of registrant’s knowledge, in definitive proxy or information statements incorporated by reference in Part III of this Form 10-K or any amendment to this Form 10-K.
¨
Indicate by check mark whether the registrant is a large accelerated filer, an accelerated filer, a non-accelerated filer or a smaller reporting company. See definition of "large accelerated filer", "accelerated filer" and "smaller reporting company" in Rule 12b-2 of the Exchange Act.:
Large Accelerated Filer | ý | Accelerated Filer | ¨ |
Non-Accelerated Filer | ¨ (do not check if a smaller reporting company) | Smaller Reporting Company | ¨ |
Indicate by check mark whether the registrant is a shell company (as defined in Rule 12b-2 of the Act). Yes ¨ No ý
The aggregate market value of voting and non-voting common equity held by non-affiliates of the registrant was approximately $525.0 million as of June 30, 2015 based upon the closing price for the registrant’s of the common stock on the New York Stock Exchange. This determination of affiliate status was based on publicly filed documents and is not necessarily a conclusive determination for other purposes.
As of February 16, 2016, there were outstanding 30,079,582 shares of common stock, par value $0.001, of the registrant.
DOCUMENTS INCORPORATED BY REFERENCE
Portions of the registrant’s Proxy Statement relating to its 2016 Annual Stockholders Meeting, to be filed within 120 days of the end of the fiscal year ended December 31, 2015, are incorporated by reference into Part III of this Annual Report on Form 10-K.
1
PROS Holdings, Inc.
Annual Report on Form 10-K
Table of Contents
For the Year Ended December 31, 2015
Item | Description | Page |
1 | ||
1A. | ||
1B. | ||
2 | ||
3 | ||
4 | ||
5 | ||
6 | ||
7 | ||
7A. | ||
8 | ||
9 | ||
9A. | ||
9B. | ||
10 | ||
11 | ||
12 | ||
13 | ||
14 | ||
15 | ||
1
SIGNIFICANT RELATIONSHIPS REFERENCED IN THIS ANNUAL REPORT
The terms "PROS," "we," "us," and "our" refer to PROS Holdings, Inc., a Delaware corporation, and all of its subsidiaries that are consolidated in conformity with the generally accepted accounting principles in the United States of America ("GAAP").
CAUTIONARY STATEMENT REGARDING FORWARD LOOKING STATEMENTS
This Annual Report on Form 10-K contains certain statements that may be deemed to be "forward-looking statements" that anticipate results based on our estimates, assumptions and plans that are subject to uncertainty. These statements are made subject to the safe-harbor provisions of the Private Securities Litigation Reform Act of 1995, Section 27A of the Securities Act of 1933, as amended (the "Securities Act"), and Section 21E of the Securities Exchange Act of 1934, as amended (the "Exchange Act"). All statements in this report not dealing with historical results or current facts are forward-looking and are based on estimates, assumptions and projections. Statements which include the words "believes," "seeks," "expects," "may," "should," "intends," "likely," "targets," "plans," "anticipates," "estimates," or the negative version of those words and similar statements of future or forward-looking nature identify forward-looking statements. The forward-looking statements made herein are only made as of the date hereof, and we undertake no obligation to publicly update such forward-looking statements whether as a result of new information, future events or otherwise.
Numerous important factors, risks and uncertainties affect our operating results, including, without limitation, those contained in this report, and could cause our actual results to differ materially, from the results implied by these or any other forward-looking statements made by us or on our behalf. There can be no assurance that future results will meet expectations. You should pay particular attention to the important risk factors and cautionary statements described in the section of this report entitled "Risk Factors". You should also carefully review the cautionary statements described in the other documents we file from time to time with the Securities and Exchange Commission ("SEC"), specifically all Quarterly Reports on Form 10-Q and Current Reports on Form 8-K. Information contained on our website is not part of this report.
Part I
Item 1. Business
Overview
PROS provides enterprise revenue and profit realization software solutions designed to help business-to-business ("B2B") and business-to-consumer ("B2C") companies accelerate sales, formulate winning pricing strategies and align product, demand and availability. Our revenue and profit realization software solutions assist our customers in growing revenue, supporting profitability and modernizing their business processes. We also provide professional services to implement our software solutions. We have completed over 800 implementations of our solutions in more than 55 countries.
We were incorporated in Texas in 1985. We reincorporated as a Delaware corporation in 1998. In 2002, we reorganized as a holding company in Delaware. Our principal executive offices are located at 3100 Main Street, Suite 900, Houston, Texas 77002. We report as one operating segment with our Chief Executive Officer acting as our chief operating decision maker. Our telephone number is (713) 335-5151. Our website is www.pros.com. Our website and the information contained therein or connected thereto are not intended to be incorporated into this Annual Report on Form 10-K.
Our industry
Data-driven decision making is an important driver of business performance. Intense global competition, market volatility and rising costs put pressure on companies to simultaneously drive top-line and bottom-line results. In response to these pressures, we believe companies are increasingly focused on software solutions that leverage prescriptive analytics to accelerate the process of converting prospects to customers using data science-based decision-making technology. We also believe that market forces, including increasingly complex business models, uncertain demand for products and services, volatile costs, and exponentially increasing enterprise and market data, will accelerate the demand for software solutions that align critical sales, pricing and revenue management processes to help increase visibility, business agility and customer engagement. We believe the market for solutions that address the needs for companies to improve top and bottom-line financial results simultaneously is a large and growing opportunity that spans most major industries.
Our solutions
PROS revenue and profit realization solutions offer what we believe is a holistic approach to improving revenue and
2
profit performance. Our selling and pricing solutions leverage prescriptive analytics designed to accelerate the process of converting prospects to customers, using data science-based decision-making technology. Our solutions are designed to enable companies to move pricing and revenue management strategies to leveraging scaled data-driven pricing strategies that are formulated to help increase profit margins by driving profit expansion and protecting against profit erosion. These data-driven insights help identify which customers and prospects of a company are most likely to buy, and what offers and price points are most likely to result in a closed deal. These insights leverage data science based on a company's historic customer transactions, market and other data to uncover customer buying patterns and preferences. This data science embedded in our solutions provides our customers with predictive and prescriptive guidance on key business decisions that drive growth and profitability, including product mix optimization, price forecasting, price optimization, product configuration recommendations, cross-sell and upsell recommendations, attrition detection, and willingness-to-pay. Our solutions also help to increase visibility, business agility and customer engagement by aligning critical sales, pricing and revenue management processes. As a result, our solutions make it easier for companies to configure the correct product(s), set the right price and get a quote into the hands of a customer faster.
Historically, we primarily offered perpetual license solutions to our customers. For perpetual licenses, our customers received the perpetual right to use our software. Our license agreements provide customers with the right to use licensed solutions within a specific license scope, including but not limited to revenue, geography, users, and business unit. The vast majority of our software license customers also purchased software maintenance and support, generally for an initial period of two years, then annual renewals thereafter. Software maintenance and support include unspecified software updates and enhancements on a when and if available basis, maintenance releases, and patches released during the term of the support period.
We also historically offered some of our solutions as Software-as-a-Service ("SaaS"). However, in mid-2015, we shifted our business to offer our solutions primarily via a SaaS delivery model. Our SaaS and cloud-based solutions enable our customers to implement, access and use our software on the PROS cloud via an internet connection. We believe our cloud solutions allow our customers to reduce their initial investment in third-party software, hardware, and administration requirements over traditional enterprise software, and also allow smaller customers to cost-effectively leverage our enterprise class infrastructure, infrastructure management, security and other best practices. In addition, as we manage all product updates and upgrades of software deployed on the PROS cloud on behalf of our customers, we are able to provide our customers with our latest product innovations in a more uniform way. Over time, we expect that this model will require us to support fewer old versions of our software solutions, which would allow our product development team to focus more effort on creating innovative enhancements to our existing products and developing new products. We offer both single-tenant and multi-tenant solutions under our SaaS model generally via three year subscriptions with pricing generally based on the number of users, data volume and revenue managed by our software.
Our high-performance software architecture supports real-time, high-volume transaction processing and enables us to handle the processing and database requirements of sophisticated customers, including those who need to respond to their customers with sub-second electronic response requirements. We provide standardized configurations of our software based on the industries we serve and offer professional services to configure these solutions to meet the specific needs of each customer. Our software solutions currently operate in large, complex and demanding information technology environments.
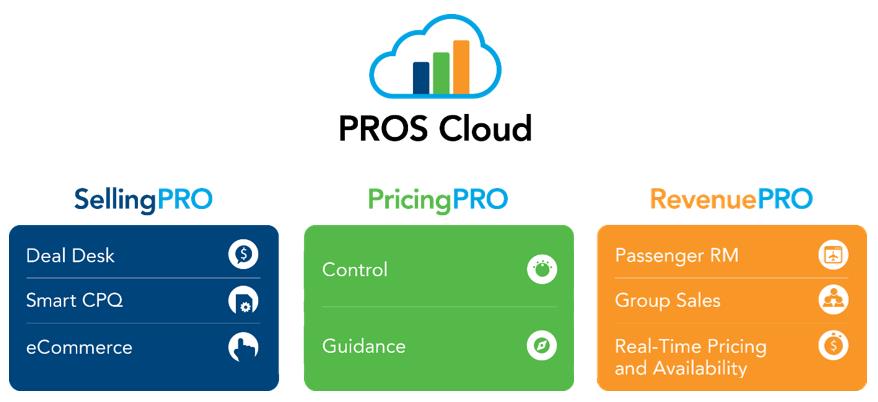
PROS revenue and profit realization software solutions enable companies across many industries that we service to improve top-line and bottom-line financial results simultaneously by aligning sales, pricing, product, demand and availability. Our cloud solutions for revenue and profit realization include SellingPRO, PricingPRO, and RevenuePRO.
3
Solutions for Selling
Our SellingPRO solutions are comprised of a broad set of configuration, quoting and eCommerce capabilities with data science driven, actionable insights to deliver sales proposals through prescriptive selling actions, pricing and offer guidance designed to convert more of the right deals at the right price, and with greater speed, accuracy, scale and consistency across all of the customers sales channels. PROS SellingPRO includes the following editions:
• | SellingPRO Deal Desk edition provides deal analytics to a customer's sales team to quickly analyze a large volume of complex opportunities and instantly create proposals with prescriptive products, services, terms and pricing. SellingPRO Deal Desk edition also simplifies deal approval processes and accelerates responsiveness by automating quote generation and approval workflows. |
• | SellingPRO Smart CPQ edition integrates PROS data science driven price guidance with a customer's existing CRM solution to enable sales teams to quickly create accurate and highly-customized offers for each customer. |
• | SellingPRO eCommerce edition provides offer and pricing guidance through a personalized and consistent customer experience across sales channels including but not limited to customer partner internet portals and eCommerce websites. SellingPRO eCommerce edition also enables companies to efficiently reach new sales markets and add new sales channels from a single product and configuration repository. |
Solutions for Pricing
Our PricingPRO solution delivers insight into pricing practices, enhances control over pricing execution and provides prescriptive pricing recommendations to the sales team. PROS PricingPRO includes the following editions:
• | PricingPRO Control edition helps companies centralize all pricing strategies and execution to create a single source of pricing information, manage and enforce pricing policies, quickly change pricing strategies and eliminate pricing errors. |
• | PricingPRO Guidance edition provides data science-driven, market-based pricing and offer guidance to help sales teams confidently negotiate pricing on each deal. |
Solutions for Revenue Management
PROS revenue management solutions are a set of integrated software solutions that enable enterprises in the travel industry, including the airline, hotel and cruise industries, designed to drive revenue and profit-maximizing business strategies through the application of advanced forecasting, optimization technologies and decision-support capabilities. These big data solutions provide businesses the tools and processes to help maximize revenue and profitability; quickly adapt to changing market conditions and business objectives; differentiate customers by market and sales channel; effectively conduct real-time negotiations; monitor pricing and revenue management performance; and increase customer loyalty by providing the right products and services to the
4
right customer at the right time. PROS RevenuePRO suite of products include the following solutions:
• | PROS Analytics for Airlines identifies hidden revenue opportunities; |
• | PROS Revenue Management manages passenger demand with either leg- or segment-based revenue management; |
• | PROS O&D™ manages passenger demand with passenger name record (PNR), based revenue management; |
• | PROS Real-Time Dynamic Pricing™ determines optimal availability based on real-time evaluations; |
• | PROS Group Sales Optimizer manages the Airline Group booking process by determining optimal Group availability and pricing; |
• | PROS Network Revenue Planning delivers network-oriented fare class segmentation; |
• | PROS PAV provides real-time availability and pricing to distribution channels, and keeps rules, fares and other data synchronized and deployable across multiple data centers; |
• | PROS Cruise Pricing and Revenue Management allows customers to understand their consumers price sensitivities, track competitor behavior, and quickly set prices and availability; and |
• | PROS Hotel Revenue Management helps customers simplify, accelerate and improve pricing decision making. |
Technology
Software Architecture. Our software architecture is based on open standards such as Java, HTML5, JavaScript, Flex, XML, and HTTP. We have created a component-based design in a service-oriented architecture to develop a flexible, layered framework. This framework supports parallel and independent evolution and innovation in technologies and product features.
Service-Oriented Architecture. A comprehensive web services interface is at the heart of our architecture. This interface enables extension onto other platforms and the creation of rich integrated solutions. It is also the foundation of our initiative to bring our solutions to the software (Microsoft Excel® and Microsoft SharePoint®) and hardware (Apple Inc.'s iPhone® and iPad®, Windows Phone®, BlackBerry®, and Android™ phones) tools that many businesses are already using.
Embedded Science. Our robust science-based capabilities such as forecasting, optimization, segmentation, and price guidance allow us to leverage the deep expertise and research of our science and research group in our solutions. These capabilities are industry-independent and are validated using our proprietary verification and testing processes.
Configuration vs. Custom Coding. Our solutions can be configured to meet each customer's business needs through configuration rather than custom code. The configuration capabilities define both a business layer (including definition of user workflows, executive dashboards, analytics views, calculations, approval processes and alerts), as well as a data layer that permits configuration of data structures, including hierarchical dimensions, pricing levels and measures. Much of the configuration can be performed by a business user without information technology personnel involvement. We preserve the configurations as part of an upgrade, allowing our customers to more easily upgrade to new versions of our solutions, when available.
Scalability. We leverage modern big data technologies such as MapReduce and Hadoop®, NoSQL databases such as Cassandra and MongoDB®, and in-memory and column-oriented data stores to scale to large data volumes and high user request rates. The scalability of our software solutions has been tested and validated by third-party vendor benchmark performance centers.
Data Integration. The data needed to execute and optimize sales, quoting, pricing, rebate and revenue management functionality typically resides in multiple sources, such as a company's enterprise resource planning ("ERP"), supply chain management ("SCM"), customer relationship management ("CRM"), reservations and inventory systems, and/or industry-specific transaction systems. In addition, productivity tools such as spreadsheets and external market data sources are common. Our data integration capabilities utilize web services and file-based data interfacing to bring data from disparate sources together into a single cohesive database, both in real time and through scheduled batch tasks. We also provide certified content for integration with SAP® and Oracle® as well as integration development services using industry standard tools.
User Interface. Our technology provides a rich, browser-based interface that supports both local and remote users. This interface supports a wide variety of interactive charts and other data views, and provides a comprehensive data security model based on user role and scope of responsibility. We also offer natively-developed capabilities for multiple mobile devices, tablet, CRM systems, and client applications.
5
Platform Support. Our software solutions run on most standard information technology platforms including Microsoft SQL Server and Oracle databases, 64-bit processors from Intel, AMD, IBM and Oracle, server hardware from HP, Dell, IBM and Oracle, Microsoft Windows, and Linux operating systems, and virtualization technologies such as VMware. Our solutions can be deployed natively in the Salesforce.com CRM environment and on PROS cloud.
Cloud Infrastructure. PROS SaaS solutions are fully architected, scaled and managed by PROS to meet enterprise-class data demands. We currently deliver our solutions from secure co-location datacenters operated by third parties as well as from enterprise cloud computing platform providers. Our infrastructure is designed to achieve high levels of security, scalability, performance and availability. We use commercially available hardware in our data centers. We provide a highly secure computing environment as well as high application availability.
Services
We also provide software-related professional services, including implementation and configuration services, consulting and training.
Implementation and configuration
Our software solution implementations have a standardized and tested implementation process developed through years of experience implementing our software solutions in global enterprises across multiple industries.
Our professional services team works closely with our customers to develop an integrated project plan to help them accelerate time to value. Pursuant to these plans, we provide technical deployment, cloud support, and configuration services related to our solutions. We also assist customers in loading and validating data and supporting organizational activities to assist our customers’ transition from awareness of their pricing challenges to adoption of pricing excellence best practices. In addition to our own internal professional services team, we also work with a team of globally diverse partners who have been certified to implement our software.
Consulting
Our consulting services include discovery and insight consulting to analyze a customer’s current pricing processes and data, identifying and prioritizing specific high-value pricing opportunities, and recommending pricing best practices and strategic pricing services. We also offer change management, pricing process redesign, pricing organizational design, opportunity assessment and performance management consulting. These consulting services enhance our partnerships with our customers and help them achieve their specific pricing goals.
Training
We offer training to both our customers and partners to increase the knowledge and skills to deploy and use the full functionality of our software solutions. We offer an array of live and virtual classroom training, as well as tailored, private on-site classroom training. Our courses include training on all aspects of our software solutions, from introductory on-demand mini-courses to multi-day hands-on deep technical classroom sessions.
Maintenance and support
We offer ongoing maintenance and support services for our software solutions using a global model to support our customers across major geographies. Maintenance enrollment entitles a customer to solicit support through a web-based interface which allows the customer to submit and track issues, access our online knowledge base and receive unspecified upgrades, maintenance releases and bug fixes during the term of the support period on a when-and-if-available basis. In addition, our customer support personnel responds to customer issues using an escalation process that prioritizes reported issues based on a defined set of severity levels, as well as assists customers in deploying our standard releases for each software solution by providing release web seminars and documentation. Maintenance fees are an important source of recurring revenue, and we invest significant resources in providing these services. Revenue from maintenance and support services comprised 38%, 29%, and 32% of our total revenue in 2015, 2014 and 2013, respectively. We expect our maintenance revenue growth will decrease as a result of customers licensing less of our software as we shift to a cloud-first strategy.
SaaS and Cloud-based services
6
Our SaaS solutions generally provide customers access to our software within a cloud-based IT environment that we manage and offer to customers on a subscription basis and allow our customers to reduce infrastructure, installation, and ongoing administration requirements. We also offer cloud-based services to allow existing customers who previously purchased licenses to our software to have access to that software within a cloud-based IT environment that we manage to allow those customers to reduce infrastructure and ongoing administration requirements as an alternative to their on-premise deployment of our software. We generally offer these services via three year contracts with pricing based on the data volumes and service levels requested.
Customers
We sell our software solutions to customers across many industries, including automotive and industrial, B2B services, cargo, chemicals and energy, consumer goods, finance and insurance, food and beverage, healthcare, high tech, travel and hospitality. Our customers are generally large global enterprises, although we also have customers that are much smaller in scope of operations. In each of 2015, 2014 and 2013, we had no single customer that accounted for 10% or more of revenue.
Sales and marketing
We sell and market our software solutions primarily through our direct global sales force and indirectly through resellers and systems integrators. Our sales force is organized by our target markets of manufacturing, distribution, services and travel, and is responsible for the worldwide sale of our solutions to new and existing customers. Our sales force works in concert with our solutions personnel for selling and providing solution demonstrations to new customers.
Our marketing activities consist of a variety of programs designed to generate sales leads and build awareness of our revenue and profit realization cloud solutions. We host conferences for sales, pricing, and revenue management professionals, host informational web seminars and participate in and sponsor other industry and trade conferences and organizations.
International operations
We are a global company that conducts sales, sales support, professional services, product development and support, and marketing around the world. Our headquarters are located in Houston, Texas, and, as of December 31, 2015, we also have offices in London, England; Paris, France; Toulouse, France; Munich, Germany; San Francisco, California; Skokie, Illinois; and Austin, Texas. We also conduct development activities predominantly in France and the United States, and utilize third-party contractors in Bolivia, China, Colombia and India. We plan to continue to expand our operations in international locations to meet the strategic objectives of our business.
Approximately 62%, 56%, and 55% of our total revenue came from customers outside the United States for the years ended December 31, 2015, 2014 and 2013, respectively. Our business, financial condition and results of operations could be adversely impacted by factors, including currency fluctuations or regulatory, political, social and economic developments or instability in the foreign jurisdictions in which we operate. For additional financial information about geographic areas, see Note 16 of the Notes to the Consolidated Financial Statements.
Seasonality
Historically, we have experienced a higher volume of transactions in the quarter ended December 31, which is our fourth fiscal quarter, and to a lesser extent, during other fiscal quarters. However, our transition to cloud-first strategy may change the historical seasonality trends.
Competition
The market for solutions that provide automation, analytics and intelligence to drive sales and profitability is competitive, fragmented and rapidly evolving. For example, we have seen consolidation in the quoting software market with large CRM vendors acquiring smaller quoting companies as they attempt to provide end-to-end solutions to drive sales and profit. Today, we are increasingly competing in sales ecosystem with competitors that all aim to drive effectiveness and efficiency in selling. Our competition has increased in recent years as we expanded into adjacent technologies.
We believe our customers include the following factors when evaluating us against our competition:
• | Large and referenceable global customer base; |
• | Industry domain expertise; |
7
• | Domain management best practices expertise and delivery; |
• | Ability for users to configure the solution to their needs; |
• | Depth of expertise in data and pricing science; |
• | Real-time solutions; |
• | Proven benefits of return on investment, total cost of ownership, and time-to-value; |
• | Organizational change management expertise; |
• | Product architecture, functionality, performance, reliability and scalability; |
• | Ability to offer integrated high-value solutions; |
• | Breadth and depth of product and service offerings; |
• | Services and customer support quality; |
• | Size and quality of partner ecosystem; |
• | Existing customer relationships; and |
• | Vendor viability. |
We compete with a number of larger and smaller companies, which we estimate to be approximately 10 competitors. Most of our competitors compete against individual products of ours, rather than at a strategic level across multiple products. For example, Vendavo and Zilliant, compete against the pricing portion of our revenue and profit realization solutions. Others, such as Apptus, Oracle (through its acquisition of Big Machines), and Salesforce.com (through its acquisition of SteelBrick) compete against the quoting portion of our revenue and profit realization solutions. Yet others, such as Sabre Airline Solutions and Amadeus compete against a portion of our revenue management solutions in the airline industry. Several large enterprise application providers, such as JDA Software, Oracle and SAP, have developed offerings that include limited pricing and revenue management functionality. Our solutions also compete with solutions developed internally by businesses. These businesses generally rely on a combination of manual processes, external consultants, spreadsheets and internally-developed software tools.
We believe these competitors do not provide all of the functionality needed to support an organization interested in optimizing sales growth through data-science driven pricing, quoting and revenue management. In the past, some of these vendors have competed on price and by bundling their pricing and revenue management applications with other enterprise applications, and this may continue into the future. We believe that we distinguish ourselves from these vendors through the breadth and depth of the functionality we offer, the robust integration and configuration capabilities of our solutions, and our proven ability to provide high-value science-based optimization software to our global customer base across multiple industries. In the future, we believe our competition will increase as more companies move into our market segment and as we expand into adjacent market segments.
Intellectual property and other proprietary rights
Our success and ability to compete is dependent in part on our ability to develop and maintain the proprietary aspects of our technology and operate without infringing upon the proprietary rights of others. Due to the rapidly changing nature of applicable technologies and recent changes in U.S. patent law, we believe that for the improvement of existing solutions and development of new solutions, reliance upon trade secrets and unpatented proprietary know-how are generally more advantageous than patent and trademark protection. We also rely on a combination of trade secrets, confidentiality procedures, contractual provisions, patents, trademarks, copyrights and other similar measures to protect our proprietary information.
Research and development
We believe our innovation with respect to our software solutions is the foundation of our business and accordingly have made substantial investments in research and development for the enhancement of existing products and services and the development of new products and services. We also believe that our long-term investment in the scientific analysis of pricing and revenue management differentiates us from our competitors. We are committed to developing high-value, science-based sales, pricing, and revenue management software solutions as evidenced by our continued investment in research and development. In fiscal 2015, 2014 and 2013, we incurred expenses of $46.8 million, $43.2 million and $32.5 million, respectively, in research and development to enhance our existing portfolio of solutions and to develop new solutions. Our research and development expenses include costs associated with our product management, product development and science and research groups. We conduct research and development activities predominantly in the United States and to a lesser extent in France.
8
We employ scientists, most of whom are Ph.D.s, to advance sales, pricing, and revenue management technology and its implementation in our software solutions. These scientists have specialties including, but not limited to, operations research, management science, statistics, econometrics, and computational methods. Our scientists regularly interact with our customers, product development, sales, marketing, and professional services staff to help keep our science efforts relevant to real-world demands.
Employees
As of December 31, 2015, we had 1,033 full time personnel, which included 857 employees and 176 outsourced personnel. None of our employees are represented by a labor union or covered by a collective bargaining agreement. We have not experienced any work stoppages and consider our employee relations to be good.
Website
We maintain a website at www.pros.com. No information on our website is incorporated by reference herein. We make available, free of charge through our website, our Annual Report on Form 10-K, Quarterly Reports on Form 10-Q, Current Reports on Form 8-K, including exhibits thereto, and any amendments to those reports filed or furnished pursuant to Section 13(a) or 15(d) of the Exchange Act, as soon as reasonably practicable after the reports are electronically filed with or furnished to the SEC. Our reports that are filed with, or furnished to, the SEC are also available at the SEC's website at www.sec.gov. You may also read and copy any materials we file with the SEC, free of charge, at the SEC's Public Reference Room at 100 F Street, N.E., Washington, DC 20549. You may obtain information on the operation of the Public Reference Room by calling the SEC at 1-800-SEC-0330.
Annual CEO Certification
Pursuant to Section 303A.12(a) of the New York Stock Exchange ("NYSE") Listed Company Manual, we submitted to the NYSE an annual certification signed by our Chief Executive Officer certifying that he was not aware of any violation by us of NYSE corporate governance listing standards on June 19, 2015.
9
Item 1A. Risk Factors
We operate in a dynamic environment that involves numerous risks and uncertainties. The following section describes some of the risks that may adversely affect our business, financial condition or results of operations, and the trading price of our common stock; these risks are not necessarily listed in terms of their importance or level of risk.
Risks relating to our business and industry:
Our cloud-first strategy and new offerings bring new business and operational risks.
We decided to emphasize a cloud-first strategy starting in 2015. This focus includes continuing to introduce new products and technology initiatives in the area of cloud computing, including our SaaS and cloud-based solutions. Our SaaS and cloud-based solutions provide our customers with existing and new software management through a hosted service as opposed to traditional software deployments. Our SaaS revenue may not be significant in the future despite our investment, and our internal development and customer support teams may find it difficult or costly to support both traditional software installed by customers and software delivered as a service. Our existing customers may have invested substantial personnel and financial resources in legacy software, and may be reluctant or unwilling to use a cloud-based solution. In addition, since our SaaS customers use our service for important aspects of their business, any errors, defects, disruptions in service or other performance problems could hurt our reputation and may damage our customers’ businesses. As a result, customers could elect to not renew, delay or withhold payment to us, we could lose future sales, or customers may make other claims against us, which could result in an increase in our provision for doubtful accounts, an increase in collection cycles for accounts receivable or the expense and risk of litigation.
We are experiencing reduced revenues and corresponding cash flow without a corresponding decrease in expenses as a result of our shift to a cloud-first strategy, which may continue for longer than we expect.
We expect our expenses to substantially exceed our revenues and cash flow in the near term as we make significant investments as part of our cloud-first strategy, particularly in new product development and cloud operations. In addition, we expect our cloud-first strategy to impact our historical revenue model as a shift from providing our software predominantly via licenses to subscriptions will impact our near term revenue and cash flows. Our cloud-first strategy may also give rise to other risks that could harm our business, including:
• | although we intend to continue to support our perpetual license customers, our emphasis on a cloud-first strategy may raise concerns among our installed perpetual license customer base and lead to the loss of customers; |
• | new or existing customers may be reluctant to migrate to a cloud based solution due to the cost, performance, security or privacy concerns associated with our solutions or cloud applications; |
• | we may incur costs at a higher than forecasted rate as we expand our cloud operations; |
• | if we experience a security incident, disruption in delivery, or other problems related to our SaaS and cloud based solutions, we could lose customers, be found liable for damages, and incur other losses; |
• | the enterprise cloud computing market is not as mature as the market for on-premise enterprise software, and it is uncertain whether cloud applications will achieve broad acceptance in the enterprise market; and |
• | our sales cycles may be delayed if we need to educate customers about the benefits of our cloud solutions, including technical capabilities, security, privacy, and return on investment. |
Our ability to return to profitability depends on our ability to: drive more subscription sales; build our sales and marketing and product development organizations; appropriately manage our expenses; identify or acquire companies or assets at attractive valuations; enter into and maintain beneficial channel relationships; develop enhancements to our existing products and develop new products; and successfully execute our marketing and sales strategies. If we are not able to execute on these actions and grow our revenue and corresponding cash flows to offset these expected costs, our business may not grow as we anticipate, our operating results could be adversely affected, we may continue to incur net losses, on a U.S. GAAP basis, in the future. Additionally, as we introduce new cloud-only products, operating margins on our new products may be lower than those we have achieved on our more mature products, and our new initiatives may not generate sufficient revenue and cash flows to recoup our investments in them. If any of these events were to occur, it could adversely affect our business, results of operations and financial condition.
If our security measures are breached and unauthorized access is obtained to a customer’s data or our data or our IT systems, our solutions may be perceived as not being secure, customers may curtail or stop using our solutions and/or we may incur significant legal and financial exposure and liabilities.
Our solutions and services involve the storage, and to a more limited extent, the transmission of our customers’ proprietary information. Despite the implementation of security measures, these systems may still be vulnerable to data theft, computer viruses,
10
malicious software programs, programming errors, attacks by third parties or similar disruptive problems, and could result in someone obtaining unauthorized access to our customers’ data or our data, including our intellectual property and other confidential business information, or our IT systems. Because the techniques used to compromise systems change frequently and may not be recognized until launched, we may be unable to anticipate these techniques or to implement adequate preventative measures. In addition, the costs to prevent, eliminate or alleviate security vulnerabilities, computer viruses, malicious software programs, and other attacks by third parties are significant. Our efforts to address these problems may not be successful and could result in interruptions, delays, cessation of service and loss of existing or potential customers. We cannot predict the extent, frequency or impact of these problems on us. Any security breach could result in a loss of confidence in the security of our solutions and services, damage our reputation, negatively impact our future sales, disrupt our business, increase our information security costs, and lead to indemnity obligations and legal liability.
Interruptions, delays in service, security incidents, or other problems from our third-party data centers, cloud platform providers, or other unrelated service providers which could impair the delivery of our service and negatively affect the market for our cloud solutions.
In the cloud, our products are dependent upon third-party hardware, software and cloud hosting vendors, all of which must inter-operate for end users to achieve their computing goals. We utilize third-party data center hosting facilities, cloud platform providers, and other service providers to host and deliver our subscription services as well as for our own business operations. While we control and generally have exclusive access to our servers and all of the components of our network that are located in our external data centers, we do not control the operation of these facilities and they are vulnerable to damage or interruption from earthquakes, floods, fires, power loss, telecommunications failures and similar events. They may also be subject to security incidents, break-ins, sabotage, intentional acts of vandalism and similar misconduct. Despite our failover capabilities, standard protocols and other precautions taken at these facilities, the occurrence of a natural disaster or an act of terrorism, a decision to close the facilities without adequate notice or other unanticipated problems at these facilities could result in lengthy interruptions in our service.
In addition, these providers have no obligation to renew their agreements with us on commercially reasonable terms, or at all. If we are unable to renew these agreements on commercially reasonable terms, or if one of our data center operators is acquired, we may be required to transfer our servers and other infrastructure to new data center facilities, and we may incur significant costs and possible service interruption in connection with doing so. Any interruptions or delays in these hosted services, or security or privacy breaches, could damage our reputation, negatively impact our future sales, disrupt our business, and lead to legal liability.
Furthermore, certain of our applications are essential to our customers’ ability to price their products or services. Any interruption in our service may affect the availability, accuracy or timeliness of pricing information and as a result could damage our reputation, cause our customers to terminate their use of our solutions, require us to issue service credits to our customers, require us to indemnify our customers against certain losses, and prevent us from gaining additional business from current or future customers.
As we expand our software product portfolio, we could face increased competition as part of entering new markets.
The market for our products is competitive, and we expect competition to increase in the future as we expand our product portfolio and features. We may not compete successfully against future potential competitors, especially those with significantly greater financial resources or brand name recognition. For example, we now compete with sales enablement, configure-price-quote and to a lesser extent, rebate management software. Large companies in these spaces may have advantages over us because of their greater brand name recognition, larger customer bases, broader product portfolios, larger distribution channels, or greater financial, technical and marketing resources. As a result, they may be able to adapt more quickly to new or emerging technologies and changes in customer requirements.
If our new products and product enhancements do not achieve sufficient market acceptance, our results of operations and competitive position could suffer.
We spend substantial amounts of time and money to enhance of our existing products, as well as to research and develop new products. We introduce new products and incorporate additional features, improve functionality or add other enhancements to our existing products in order to meet our customers' demands. Our new products or enhancements could fail to attain sufficient market acceptance for many reasons, including:
•delays in introducing new, enhanced or modified products;
•defects, errors or failures in any of our products;
•inability to operate effectively with the networks of our prospective customers;
11
•inability to protect against new types of attacks or techniques used by hackers;
•negative publicity about the performance or effectiveness of our network security products;
•reluctance of customers to purchase products based on open source software; and
•disruptions or delays in the availability and delivery of our products.
If our new products or enhancements do not achieve adequate acceptance in the market, our competitive position could be impaired, our revenue could be diminished and the effect on our operating results may be particularly acute because of the significant research and development, marketing, sales and other expenses we incurred in connection with the new product.
We focus primarily on sales, pricing and revenue management software, and if the markets for this software develop more slowly than we expect, our business could be harmed.
We derive most of our revenue from providing our solutions for selling, pricing and revenue management, implementation services and ongoing customer support. The sales and pricing market is evolving rapidly, and it is uncertain whether this software could achieve and sustain high levels of demand and market acceptance. Our success would depend on the willingness of businesses in the manufacturing, distribution, services industries to use sales and pricing software.
Some businesses may be reluctant or unwilling to implement sales and pricing software for a number of reasons, including failure to understand the potential returns of improving their processes and lack of knowledge about the potential benefits that such software may provide. Even if businesses recognize the need for improved sales and/or pricing processes, they may not select our solutions because they previously have made investments in internally developed solutions. Some businesses may elect to improve their pricing processes through solutions obtained from their existing enterprise software providers, whose solutions are designed principally to address functional areas other than pricing. These enterprise solutions may appeal to customers that wish to limit the number of software vendors on which they rely and the number of different types of solutions used to run their businesses.
If businesses do not embrace the benefits of sales and pricing software, the sales and pricing software market may not continue to develop or may develop more slowly than we expect, either of which would significantly and adversely affect our revenue and operating results. Because the sales and pricing software market is developing and the manner of its development is difficult to predict, we may make errors in predicting and reacting to relevant business trends, which could harm our operating results.
We are subject to a lengthy sales cycle and delays or failures to complete sales may harm our business and cause our revenue and operating income to decline in the future.
Our sales cycle may take several months to over a year. To sell our solutions successfully and obtain an executed contract, we often have to educate our potential customers about the benefits of our solutions. We expend substantial resources during our sales cycles with no assurance that a sale may ultimately result. The length of each individual sales cycle depends on many factors, a number of which we cannot control. These factors include the customer’s requirements, the level of competition we face for that customer’s business, and the customer's internal approval processes. Any unexpected lengthening of the sales cycle or failure to secure anticipated orders could negatively affect our revenue. Furthermore, a delay in our ability to obtain a signed agreement or to complete certain contract requirements in a particular quarter could materially reduce our revenue or bookings in that quarter. Any significant failure to generate revenue or delays in recognizing revenue after incurring costs related to our sales or services process could also have a material adverse effect on our business, financial condition and results of operations.
Failure to sustain our historical maintenance, support, and subscription renewal rates and pricing would adversely affect our future revenue and operating results.
Maintenance and support agreements are typically for a term of two years, and subscription agreements are typically for a term of three years. Our customers have no obligation to renew their subscriptions for our services after the expiration of their initial subscription period, and some customers elect not to renew. Historically, maintenance and support revenue has represented a significant portion of our total revenue, including approximately 38%, 29% and 32% of our total revenue for the years ended December 31, 2015, 2014 and 2013, respectively. Subscription revenue has represented approximately 17%, 13% and 6% of our total revenue for the years ended December 31, 2015, 2014 and 2013, respectively.
We cannot provide assurance that we will be able to accurately predict future customer renewal rates. Our customers’ renewal rates may decline or fluctuate as a result of a number of factors, including their level of satisfaction with our services, our ability to continue to regularly add functionality, the reliability (including uptime) of our subscription services, the prices of our services, the actual or perceived information security of our systems and services, mergers and acquisitions affecting our customer base, reductions in our customers’ spending levels, or declines in customer activity as a result of economic downturns or uncertainty
12
in financial markets. If our customers choose not to renew their maintenance, support and subscription agreements with us on favorable terms or at all, our business, operating results and financial condition could be harmed. Our opportunity for future growth is also affected by our ability to sell additional features and services to our current customers, which depends on a number of factors, including our customers’ satisfaction with our products and services, the prices of our solutions and general economic conditions. If our efforts to cross-sell and upsell to our customers are unsuccessful, the rate at which our business grows might decline.
Competition from vendors of sales, pricing, revenue management and configure-price-quote solutions as well as from companies internally developing their own solutions could adversely affect our ability to sell our solutions and could result in pressure to price our solutions in a manner that reduces our margins and harms our operating results.
The sales, pricing, revenue management and configure-price-quote software market is competitive and rapidly evolving. Our software solutions compete with both solutions developed internally by businesses as well as those solutions offered by competitors. We believe our principal competition consists of pricing, quoting, rebate and revenue management software vendors, including a number of vendors that provide such software for specific industries; as well as large enterprise application providers that have developed offerings that include sales, pricing and revenue management functionality.
We expect additional competition from other established and emerging companies to the extent the sales, pricing, revenue management and configure-price-quote software market continues to develop and expand. We also expect competition to increase as a result of the entrance of new competitors in the market and industry consolidation, including through a merger or partnership of two or more of our competitors or the acquisition of a competitor by a larger company, such as Salesforce.com through its acquisition of Steelbrick. A number of our current and potential competitors have larger installed bases of users, longer operating histories, broader distribution and greater name recognition than we have. In addition, many of these companies have significantly greater resources than we have. As a result, these companies may be able to respond more quickly to new or emerging technologies and changes in customer demands, and devote greater resources to the development, promotion and sale of their products.
Competition could seriously impede our ability to sell our software solutions and services on terms favorable to us. We do not know how our competition could set prices for their products. Businesses may internally develop solutions, rather than invest in commercially-available solutions. Our current and potential competitors may develop and market new technologies that render our existing or future solutions obsolete, unmarketable or less competitive. In addition, if these competitors develop solutions with similar or superior functionality to our solutions, or if they offer solutions with similar functionality at a substantially lower price than our solutions, we may need to decrease the prices for our solutions in order to remain competitive. If we are unable to maintain our current solutions, services and maintenance pricing due to competitive pressures, our margins could be reduced and our operating results could be adversely affected. We cannot provide assurance that we would be able to compete successfully against current or future competitors or that competitive pressures could not materially and adversely affect our business, financial condition and operating results.
Any unauthorized, and potentially improper, actions of our personnel could adversely affect our business, operating results and financial condition.
The recognition of our revenue depends on, among other things, the terms negotiated in our contracts with our customers. Our personnel may act outside of their authority and negotiate additional terms without our knowledge. We have implemented policies to help prevent and discourage such conduct, but there can be no assurance that such policies would be followed. For instance, in the event that our sales personnel negotiate terms that do not appear in the contract and of which we are unaware, whether such additional terms are written or verbal, we could be prevented from recognizing revenue in accordance with our plans. Furthermore, depending on when we learn of unauthorized actions and the size of the transactions involved, we may have to restate revenue for a previously reported period, which could seriously harm our business, operating results and financial condition.
We made our first two acquisitions in late 2013 and early 2014, and in the future may continue to enter into acquisitions that may be difficult to integrate, fail to achieve our strategic objectives, disrupt our business, dilute stockholder value or divert management attention.
We made our first two acquisitions in late 2013 and early 2014, and in the future may continue to acquire businesses, technologies and products that we intend to complement our existing business, solutions, services and technologies. We cannot provide assurance that the acquisitions we have made or may make in the future could provide us with the benefits or achieve the results we anticipated when entering into the transaction. Acquisitions are typically accompanied by a number of risks, including:
• | difficulties in integrating the operations and personnel of the acquired companies; |
13
• | difficulties in maintaining acceptable standards, controls, procedures and policies, including integrating financial reporting and operating systems, particularly with respect to foreign and/or public subsidiaries; |
• | disruption of ongoing business and distraction of management; |
• | inability to maintain relationships with customers of the acquired business; |
• | impairment of relationships with employees and customers as a result of any integration of new management and other personnel; |
• | difficulties in incorporating acquired technology and rights into our solutions and services; |
• | unexpected expenses resulting from the acquisition; and |
• | potential unknown liabilities associated with the acquisition. |
In addition, we may incur debt, acquisition-related costs and expenses, restructuring charges and write-offs as a result of acquisitions. Acquisitions may also result in goodwill and other intangible assets that are subject to impairment tests, which could result in future impairment charges.
Our recent acquisitions have required, and may continue to require, significant management time and attention during the finalization of the integration processes.
We may enter into negotiations for acquisitions that are not ultimately consummated. Those negotiations could result in diversion of management time and significant out-of-pocket costs. If we fail to evaluate and execute acquisitions successfully, we may not be able to achieve our anticipated level of growth and our business and operating results could be adversely affected.
Any downturn in sales to our target markets could adversely affect our operating results.
Our success is highly dependent upon our ability to sell our software solutions to customers in the manufacturing, distribution, services, and travel industries. If we are unable to sell our software solutions effectively to customers in these industries, we may not be able to grow our business. It is uncertain whether our software solutions may achieve and sustain the levels of demand and market acceptance that we anticipate. Such uncertainty is attributable to, among other factors, the following:
• | it may be more difficult than we currently anticipate to implement our software solutions in certain verticals within our target industries; |
• | it may be more difficult than we currently anticipate to increase our customer base in our target industries; and |
• | our limited experience implementing our software solutions in certain verticals within our target industries. |
Our revenue growth has historically been derived from customers in many major industries. Our revenue growth is highly dependent upon continued growth of market acceptance in these industries, and there can be no assurance our solutions may achieve or sustain widespread acceptance among customers in these industries. Failure to expand market acceptance of our solutions or maintain sales in these industries could adversely affect our operating results and financial condition.
Our software solutions require implementation projects that are subject to significant risks and delays, which if any occurred could negatively impact the effectiveness of our software, resulting in harm to our reputation, business and financial performance.
The implementation of our software solutions can involve complex, large-scale projects that require substantial support operations, significant resources and reliance on factors that are beyond our control. For example, the success of our implementation projects is heavily dependent upon the quality of data used by our software solutions, and the commitment of customers’ resources and personnel to the projects. We may not be able to correct or compensate for weaknesses or problems in data, or any lack of our customers’ commitment and investment in personnel and resources. In addition, implementation of our software solutions can be highly complex and require substantial efforts and cooperation on the part of our customers. If we are unable to successfully manage the implementation of our software solutions such that those products do not meet customer needs or expectations, we may become involved in disputes with our customers and our business, reputation and financial performance may be significantly harmed. For projects accounted for under the percentage-of-completion method, we recognize our license and implementation revenues as implementation services are performed. Any delays in an implementation project or changes in the scope or timing of an implementation project would delay or alter the corresponding revenue recognition and could adversely affect our operating results. In addition, any delays or changes in scope could result in estimated project costs exceeding contracted revenue of which a loss reserve would need to be established which would have an adverse effect on our operating results. If an implementation
14
project for a large customer or a number of customers is substantially delayed or canceled, our ability to recognize the associated revenue and our operating results could be adversely affected.
If our executives and other key personnel are unable to effectively manage our business, or if we fail to attract additional qualified sales, marketing, professional services, product development and other personnel, our revenue and operating results could be adversely affected.
Our future success depends upon the performance and service of our executive officers and other key sales, marketing, development, science and professional services staff. The failure of our executives and key personnel to effectively manage our business or the loss of the services of our executive officers and other key personnel would harm our operations. In addition, our future success could depend in large part on our ability to attract and retain a sufficient number of highly qualified sales, marketing, professional services, product development and other personnel, and there can be no assurance that we may be able to do so. We have continued to add a significant number of new personnel to support our continued growth, and their ability to learn our business and manage it effectively could be important to our continued growth and expansion. In addition, given the highly sophisticated data science included in our solutions, the pool of data scientists and software developers qualified to work on our solutions is limited. The implementation of our software solutions requires highly-qualified personnel, and hiring and retaining such personnel to support our growth may be challenging. Competition for such qualified personnel is intense, and we compete for these individuals with other companies that have greater financial, technical, marketing, service and other resources than we do. If our key personnel are unable to effectively manage our business, or if we fail to attract additional qualified personnel, our operating results could be adversely affected.
Deterioration of general U.S. and global economic conditions could adversely affect our sales and operating results.
We are a global company with customers around the world. Global financial markets have experienced extreme disruption in recent years, including, among other factors, extreme volatility in security prices, limited ability to raise capital in public and private financial markets, severely diminished liquidity, credit unavailability and company rating downgrades. These conditions have a negative impact on our prospects' and customers' ability to raise capital and operate their businesses. In addition, the weak and uncertain U.S. and global economic conditions could impair our customers' ability to pay for our products or services. These factors could delay our revenue recognition or otherwise adversely impact our business overall results and financial condition.
Periodic fluctuations in the U.S. Dollar and other currencies, corporate profits, lower spending, the impact of conflicts throughout the world, terrorist acts, natural disasters, volatile energy costs, the outbreak of diseases and other geopolitical factors have had, and may continue to have, a negative impact on the U.S. and global economies. We are unable to predict the strength, duration or impact of current market conditions.
A significant or prolonged economic downturn may result in our customers or prospects reducing or postponing spending on the solutions we offer, and could result in substantial defaults or slowing of payments by our customers on our accounts receivable.
There are a number of factors, other than our performance, that could affect the size, frequency and renewal rates of our customer contracts. For instance, if economic conditions weaken in any industry in which our customers or prospects are focused, our customers or prospects may reduce or postpone their spending significantly which may, in turn, lower the demand for our solutions and negatively affect our revenue and profitability. As a way of dealing with a challenging economic environment, customers may change their purchasing strategies, including, in some instances, increased negotiation of price, deciding to purchase one solution rather than multiple solutions or purchasing solutions for portions of their business. Customers could also delay their implementations or non-renew their SaaS, cloud, or maintenance contracts. Change in contract terms or the loss of, or any significant decline in business from, our customers may lead to a significant decline in our revenue and operating margins, particularly if we are unable to make corresponding reductions in our expenses in the event of any such loss or decline. Moreover, a significant change in the liquidity or financial position of our customers, or our customers' unwillingness or inability to otherwise make payments in a timely matter could have a material adverse effect on the collectability of our accounts receivable, liquidity, business and operating results.
We incurred indebtedness by issuing Senior Notes, and our debt repayment obligations may adversely affect our financial condition and cash flows from operations in the future.
In December 2014, we issued $143.8 million aggregate principal amount of 2.0% convertible senior notes (the "Senior Notes") due December 1, 2019, unless earlier purchased or converted. Interest is payable semiannually in arrears on June 1 and December 1 of each year, commencing on June 1, 2015. Our indebtedness could have important consequences because it may impair our ability to obtain additional financing in the future for working capital, capital expenditures, acquisitions and general
15
corporate or other purposes, and a portion of our cash flows from operations may have to be dedicated towards repaying the principal beginning in 2019 or earlier if necessary.
Our ability to meet our debt obligations will depend on our future performance, which will be affected by financial, business, economic, regulatory and other factors. We cannot control many of these factors. Our future operations may not generate sufficient cash to enable us to repay our debt. If we fail to make a payment on our debt, we could be in default on such debt. If we are at any time unable to pay our indebtedness when due, we may be required to renegotiate the terms of the indebtedness, seek to refinance all or a portion of the indebtedness or obtain additional financing. There can be no assurance that, in the future, we will be able to successfully renegotiate such terms, that any such refinancing would be possible or that any additional financing could be obtained on terms that are favorable or acceptable to us.
Our projects accounted for on a percentage-of-completion method as well as fixed-fee arrangements are based on our use of estimates, which if inaccurate, could reduce our revenue and profitability.
Timing of our revenue recognition on our contractual arrangements varies based on the nature of the performance obligations in each contract and the associated contract terms. For projects accounted for on a percentage-of-completion method, the effort required to complete our implementation may be difficult to estimate, as the length of the implementation depends on the number of software solutions purchased and the scope and complexity of the customer’s deployment requirements. Similarly, we may price implementation arrangements on a fixed-fee basis. If we underestimate the amount of effort required to implement our software solutions under these fixed-fee arrangements, our profitability could be reduced. Moreover, if the actual costs of completing the implementation exceed the agreed upon fixed price, we could incur a loss on the arrangement. If we are unable to accurately estimate the overall total man-days required to implement our software solutions, such inaccuracies could have a material effect on the timing of our revenue recognition, could adversely impact our quarterly or annual operating results.
Changes in accounting principles or standards, or in the way they are applied, could result in unfavorable accounting charges or effects and unexpected financial reporting fluctuations, and could adversely affect our reported operating results.
We prepare our consolidated financial statements in conformity with U.S. GAAP. These principles are subject to interpretation by the Securities and Exchange Commission ("SEC") and various bodies formed to interpret and create appropriate accounting principles and guidance. A change in existing principles, standards or guidance, in particular those related to revenue recognition, can have a significant effect on our reported results, may retroactively affect previously reported results, could cause unexpected financial reporting fluctuations, and may require us to make costly changes to our operational processes and accounting systems.
The Financial Accounting Standards Board ("FASB") is currently working with the International Accounting Standards Board ("IASB") to converge certain accounting principles and to facilitate more comparable financial reporting between companies that are required to follow U.S. GAAP and those that are required to follow International Financial Reporting Standards ("IFRS"). These projects may result in different accounting principles under U.S. GAAP, which may have a material impact on the way in which we report financial results in areas including, but not limited to, principles for recognizing revenue, lease accounting, and financial statement presentation. In connection with this initiative, the FASB issued a new accounting standard for revenue recognition in May 2014 – Accounting Standards Update ("ASU") 2014-09, "Revenue from Contracts with Customers (Topic 606)" – that supersedes nearly all existing U.S. GAAP revenue recognition guidance. Although we are currently in the process of evaluating the impact of ASU 2014-09 on our consolidated financial statements, it could change the way we account for certain of our sales transactions. Adoption of the standard could have a significant impact on our financial statements and may retroactively affect the accounting treatment of transactions completed before adoption.
In addition, the SEC may make a determination in the future regarding the incorporation of IFRS into the financial reporting system for U.S. companies. Changes in accounting principles from U.S. GAAP to IFRS, or to converged accounting principles, may have a material impact on our financial statements and may retroactively affect the accounting treatment of previously reported transactions.
We might not generate increased business from our customers, which could limit our revenue in the future.
We sell our software solutions to both new customers and existing customers. Many of our existing customers initially purchase our software solutions for a specific business segment or a specific geographic location within their organization and later purchase additional software solutions for the same or other business segments and geographic locations within their organization. These customers might not choose to make additional purchases of our software solutions or to expand their existing software solutions to other business segments. In addition, as we deploy new applications and features for our software solutions
16
or introduce new software solutions, our current customers could choose not to purchase these new offerings. If we fail to generate additional business from our existing customers, our revenue could grow at a slower rate or even decrease.
If we fail to develop or acquire new functionality to enhance our existing software solutions, we may not be able to grow our business and it could be harmed.
The sales, pricing and revenue management software market is characterized by:
• | rapid technological developments; |
• | newly emerging and changing customer requirements; and |
• | frequent solution introductions, updates and functional enhancements. |
We must introduce enhancements to our existing software solutions in order to meet our business plan, maintain or improve our competitive position, keep pace with technological developments, satisfy increasing customer requirements and increase awareness of big data software for sales, pricing and revenue management generally and of our software solutions in particular. Any new functionality we develop may not be introduced in a timely manner and may not achieve market acceptance sufficient to generate material revenue. Furthermore, we believe that our competitors are heavily investing in research and development, and may develop and market new solutions that may compete with, and may reduce the demand for, our software solutions. We cannot provide assurance that we could be successful in developing or otherwise acquiring, marketing and licensing new functionality, or delivering updates and upgrades that meet changing industry standards and customer demands. In addition, we may experience difficulties that could delay or prevent the successful development, marketing and licensing of such functionality. If we are unable to develop or acquire new functionality, enhance our existing software solutions or adapt to changing industry requirements to meet market demand, we may not be able to grow our business and our revenue and operating results would be adversely affected.
In addition, because our software solutions are intended to operate on a variety of technology platforms, we must continue to modify and enhance our software solutions to keep pace with changes in these platforms, as well as develop and maintain relationships with platform providers. Any inability of our software solutions to operate effectively with existing or future platforms, or our inability to develop or maintain relationships with significant platform providers, could reduce the demand for our software solutions, result in customer dissatisfaction and limit our revenue.
Defects or errors in our software solutions could harm our reputation, impair our ability to sell our solutions and result in significant costs to us.
Our software solutions are complex and may contain undetected defects or errors. Several of our solutions have recently been developed and may therefore be more likely to contain undetected defects or errors. In addition, we frequently develop enhancements to our software solutions that may contain defects. We have not suffered significant harm from any defects or errors to date. We have in the past issued, and may in the future need to issue, corrective releases of our solutions to correct defects or errors, but we may not be able to detect and correct any such defects or errors before the final implementation of our software solutions. The occurrence of any defects or errors could result in:
• | delayed market acceptance and lost sales of our software solutions; |
• | delays in payment to us by customers; |
• | injury to our reputation; |
• | diversion of our resources; |
• | legal claims, including product liability claims, against us; |
• | increased maintenance and support expenses; and |
• | increased insurance costs. |
Our agreements with our customers typically contain provisions designed to limit our liability for defects and errors in our software solutions and damages relating to such defects and errors, but these provisions may not be enforced by a court or otherwise effectively protect us from legal claims. Our liability insurance may not be adequate to cover all of the costs resulting from these legal claims. Moreover, we cannot provide assurance that our current liability insurance coverage would continue to be available on acceptable terms. In addition, the insurer may deny coverage on any future claims. The successful assertion against us of one or more large claims that exceeds available insurance coverage, or the occurrence of changes in our insurance policies, including premium increases or the imposition of large deductible or co-insurance requirements, could have a material adverse
17
effect on our business and operating results. Furthermore, even if we prevail in any litigation, we are likely to incur substantial costs and our management’s attention may be diverted from our operations.
Intellectual property litigation and infringement claims may cause us to incur significant expense or prevent us from selling our software solutions.
Our industry is characterized by the existence of a large number of patents, trademarks and copyrights, and by frequent litigation based on allegations of infringement or other violations of intellectual property rights. A third-party may assert that our technology violates its intellectual property rights, or we may become the subject of a material intellectual property dispute. Sales, pricing and revenue management solutions may become increasingly subject to infringement claims as the number of commercially available sales, pricing and revenue management solutions increases and the functionality of these solutions overlaps. In addition, changes in patent laws in the U.S. may affect the scope, strength and enforceability of our patent rights or the nature of proceedings which may be brought by us related to our patent rights. Future litigation may involve patent holding companies or other adverse patent owners who have no relevant product revenue and against whom our own potential patents may therefore provide little or no deterrence. Regardless of the merit of any particular claim that our technology violates the intellectual property rights of others, responding to such claims may require us to:
• | incur substantial expenses and expend significant management efforts to defend such claims; |
• | pay damages, potentially including treble damages, if we are found to have willfully infringed such parties’ patents or copyrights; |
• | cease making, licensing or using products that are alleged to incorporate the intellectual property of others; |
• | distract management and other key personnel from performing their duties for us; |
• | enter into potentially unfavorable royalty or license agreements in order to obtain the right to use necessary technologies; and |
• | expend additional development resources to redesign our solutions. |
Any licenses required as a result of litigation under any patent may not be made available on commercially acceptable terms, if at all. In addition, some licenses may be nonexclusive, and therefore our competitors may have access to the same technology licensed to us. If we fail to obtain a required license or are unable to design around a patent, we may be unable to effectively develop or market our solutions, which could limit our ability to generate revenue or maintain profitability.
Contract terms generally obligate us to indemnify our customers for their use of the intellectual property associated with our software or for other third-party products that are incorporated into our solutions and that infringe the intellectual property rights of others. If we are unable to resolve our legal obligations by settling or paying an infringement claim or a related indemnification claim as described above, we may be required to compensate our customers under the contractual arrangement with such customers. Some of our intellectual property indemnification obligations are contractually capped at a very high amount or not capped at all.
If we fail to protect our proprietary rights and intellectual property adequately, our business and prospects may be harmed.
Our success could depend in part on our ability to protect our proprietary methodologies and intellectual property. We rely upon a combination of trade secrets, confidentiality policies, nondisclosure and other contractual arrangements, and patent, copyright and trademark laws to protect our intellectual property rights. We cannot, however, be certain that steps we take to protect our proprietary rights could prevent misappropriation of our intellectual property, or the development and marketing of similar and competing products and services by third parties.
We rely, in some circumstances, on trade secrets to protect our technology. Trade secrets, however, are difficult to protect. In addition, our trade secrets may otherwise become known or be independently discovered by competitors, and in such cases, we could not assert such trade secret rights against such parties. We seek to protect our proprietary technology and processes, in part, by confidentiality agreements with our employees, consultants, customers, scientific advisors and other contractors. These agreements may be breached, and we may not have adequate remedies for any such breach. To the extent that our employees, consultants or contractors use intellectual property owned by others in their work for us, disputes may arise as to the rights in related or resulting know-how and inventions.
The patent position of technology-oriented companies, including ours, is generally uncertain and involves complex legal and factual considerations. The standards that the United States Patent and Trademark Office use to grant patents are not always applied predictably or uniformly and can change. Accordingly, we do not know the degree of future protection for our proprietary
18
rights or the breadth of claims allowed in any patents that may be issued to us or to others. Our patents may not contain claims sufficiently broad to protect us against third parties with similar technologies or products, or provide us with any competitive advantage. Moreover, our patents and any patent for which we have licensed or may license rights may be challenged, narrowed, invalidated or circumvented. If our patents are invalidated or otherwise limited, other companies may be better able to develop products that compete with ours, which could adversely affect our competitive business position, business prospects and financial condition.
Any patent application we submit may not result in an issued patent. Patent applications in the U.S. are typically not published until at least 18 months after filing or in some cases not at all, and publications of discoveries in industry-related literature lag behind actual discoveries. We cannot be certain that we were the first to invent the technologies claimed in any pending patent applications or that we were the first to file for patent protection. Additionally, the process of obtaining patent protection is expensive and time-consuming, and we may not be able to prosecute all necessary or desirable patent applications at a reasonable cost or in a timely manner. As a result, we may not be able to obtain adequate patent protection.
In addition, despite our efforts to protect our proprietary rights, unauthorized parties may be able to obtain and use information that we regard as proprietary. The issuance of a patent does not guarantee that it is valid or enforceable. As such, even if we obtain patents, they may not be valid or enforceable against third parties. In addition, the issuance of a patent does not guarantee that we have a right to practice the patented invention. Third parties may have blocking patents that could be used to prevent us from marketing or practicing our potentially patented products. As a result, we may be required to obtain licenses under these third-party patents. If licenses are not available to us on acceptable terms, or at all, we may not be able to make and sell our software solutions and competitors would be more easily able to compete with us.
We use open source software in our solutions that may subject our software solutions to general release or require us to re-engineer our solutions, which may cause harm to our business.
We use open source software in our solutions and may use more open source software in the future. From time to time, there have been claims challenging the ownership of open source software against companies that incorporate open source software into their products. As a result, we could be subject to lawsuits by parties claiming ownership of what we believe to be open source software. Some open source licenses contain requirements that we make available source code for modifications or derivative works we create based upon the open source software and that we license such modifications or derivative works under the terms of a particular open source license or other license granting third parties certain rights of further use. If we combine our proprietary software solutions with open source software in a certain manner, we could, under certain of the open source licenses, be required to release the source code of our proprietary software solutions. In addition to risks related to license requirements, usage of open source software can lead to greater risks than use of third-party commercial software, as open source licensors generally do not provide warranties or controls on origin of the software. In addition, open source license terms may be ambiguous and many of the risks associated with usage of open source cannot be eliminated, and could, if not properly addressed, negatively affect our business. If we were found to have inappropriately used open source software, we may be required to seek licenses from third parties in order to continue offering our software, to re-engineer our solutions, to discontinue the sale of our solutions in the event re-engineering cannot be accomplished on a timely basis or take other remedial action that may divert resources away from our development efforts, any of which could adversely affect our business, operating results and financial condition.
We utilize third-party software that we incorporate into our software solutions, and impaired relations with these third parties, defects in third-party software or a third party’s inability or failure to enhance their software over time could adversely affect our operating performance and financial condition.
We incorporate and include third-party software into our software solutions. If our relations with any of these third parties are impaired, or if we are unable to obtain or develop a replacement for the software, our business could be harmed. The operation of our solutions could be impaired if errors occur in the third-party software that we utilize. It may be more difficult for us to correct any defects in third-party software because the software is not within our control. Accordingly, our business could be adversely affected in the event of any errors in this software. There can be no assurance that these third parties may continue to invest the appropriate levels of resources in their products and services to maintain and enhance the capabilities of their software.
Our international sales, and the growth of our international operations, subject us to risks that may adversely affect our operating results.
International operations are subject to risks associated with operating outside of the United States. We may not be able to maintain or increase international market demand for our solutions. For the year ended December 31, 2015, 2014 and 2013, approximately 62%, 56% and 55% of our total revenue, respectively, was derived from outside the United States. We have customers in over 55 countries, and have operations in the United Kingdom, France, Germany, and Australia (through wholly-owned
19
subsidiaries). The financial impact of our international operations to our overall business has been insignificant to date, but we expect our international operations to continue to grow.
To date, the majority of our sales have been denominated in U.S. dollars, although the majority of our expenses that we incur in our international operations are denominated in local currencies. To date, we have not used risk management techniques or "hedged" the risks associated with fluctuations in foreign currency exchange rates. Consequently, our results of operations and financial condition, including our revenue and operating margins, are subject to losses from fluctuations in foreign currency exchange rates.
Managing overseas growth could also require significant resources and management attention and may subject us to new or larger levels of regulatory, economic, foreign currency exchange, tax and political risks. Among the risks we believe are most likely to affect us with respect to our international sales and operations are:
• | economic conditions in various parts of the world; |
• | differing labor and employment regulations, especially in the European Union, where labor laws are generally more advantageous to employees as compared to the United States, including hourly wage and overtime regulations and employee termination restrictions or related costs; |
• | more stringent regulations relating to data privacy and the unauthorized use of, or access to, and retention of commercial and personal information, particularly in the EU, where the regulatory framework for privacy is actively evolving and is likely to remain uncertain for the foreseeable future; |
• | unexpected changes in regulatory requirements; |
• | less protection for intellectual property rights in some jurisdictions; |
• | new and different sources of competition; |
• | costs of compliance and penalties for noncompliance with foreign laws and laws applicable to companies doing business in foreign jurisdictions; |
• | multiple, conflicting and changing tax laws and regulations that may affect both our international and domestic tax liabilities and result in increased complexity and costs; |
• | the difficulty of managing and staffing our international operations and the increased travel, infrastructure and legal compliance costs associated with multiple international locations; |
• | difficulties in enforcing contracts and collecting accounts receivable, especially in developing countries; and |
• | tariffs and trade barriers, import and export controls and other regulatory or contractual limitations on our ability to sell or develop our solutions in certain foreign markets. |
If we continue to expand our business globally, our success could depend, in large part, on our ability to anticipate and effectively manage these and other risks associated with our international operations. For example, any inability to adequately address privacy concerns, even if unfounded, or to comply with more complex and numerous privacy or data protection laws, regulations and privacy standards, could result in additional cost and liability to us, damage our reputation, inhibit sales of our solutions and harm our business. Our failure to manage any of these risks successfully could harm our international operations and reduce our international sales, adversely affecting our business, operating results and financial condition.
Our operations might be affected by the occurrence of a natural disaster or other catastrophic event.
Our headquarters are located in Houston, Texas, from which we base our operations. We also conduct business in other domestic and international locations. Although we have contingency plans in effect for natural disasters or other catastrophic events (including terrorist attacks and hurricanes), these events could disrupt our operations. Even though we carry business interruption insurance and typically have provisions in our contracts that protect us in certain events, we might suffer losses as a result of business interruptions that exceed the coverage available under our insurance policies or for which we do not have coverage. Even a temporary disruption to our business operations may create a negative perception in the marketplace. Any natural disaster or catastrophic event affecting us could have a significant negative impact on our operations.
We incur significant costs as a result of operating as a public company, and our management is required to devote substantial time to compliance initiatives.
As a public company, we incur significant legal, accounting and other expenses. The Sarbanes-Oxley Act of 2002 ("Sarbanes-Oxley") and the Dodd-Frank Wall Street Reform and Consumer Protection Act (the "Dodd-Frank Act"), and rules
20
currently proposed or subsequently implemented by the SEC and NYSE impose heightened requirements on public companies. Our management and other personnel devote a substantial amount of time to these compliance initiatives. We may also need to hire additional personnel to support our compliance requirements. Moreover, these rules and regulations increase our legal and financial costs and make some activities more time-consuming.
If we fail to continue to maintain internal controls over financial reporting in accordance with Section 404 of the Sarbanes-Oxley Act, our market price may be adversely affected.
Section 404 of the Sarbanes-Oxley Act requires our management to assess the effectiveness of our internal control over financial reporting and to provide a report by our registered independent public accounting firm addressing the effectiveness of our internal control over financial reporting. If we are unable to continue to assert that our internal controls over financial reporting are effective, or if a material weakness is identified in our internal controls over financial reporting, or if we are unable to implement internal controls over financial reporting for our acquisitions, our financial results may be adversely affected and we could lose investor confidence in the reliability of our financial statements. Accordingly failure to maintain effective controls over financial reporting may have an adverse effect on the market price of our common stock.
Risks relating to ownership of our common stock and the Senior Notes:
Market volatility may affect our stock price and the value of your investment.
The market price for our common stock, and the software industry generally, has been and is likely to continue to be volatile. Volatility could make it difficult to trade shares of our common stock at predictable prices or times.
Many factors could cause the market price of our common stock to be volatile, including the following:
• | variations in our quarterly or annual operating results; |
• | decreases in market valuations of comparable companies; |
• | fluctuations in stock market prices and volumes; |
• | decreases in financial estimates by equity research analysts; |
• | announcements by our competitors of significant contracts, new solutions or enhancements, acquisitions, distribution partnerships, joint ventures or capital commitments; |
• | departure of key personnel; |
• | changes in governmental regulations and standards affecting the software industry and our software solutions; |
• | sales of common stock or other securities by us in the future; |
• | damages, settlements, legal fees and other costs related to litigation, claims and other contingencies; |
• | deterioration of the general U.S. and global economic condition; and |
• | other risks described elsewhere in this section. |
In the past, securities class action litigation often has been initiated against a company following a period of volatility in the market price of the company’s securities. If class action litigation is initiated against us, we may incur substantial costs and our management’s attention could be diverted from our operations. All of these factors could cause the market price of our stock to decline, and you may lose some or all of your investment.
Historically, shares of our common stock have been relatively illiquid and trading of our shares could adversely affect the market price of our common stock.
Our common stock has historically been thinly traded, and we have a relatively small public float. Our common stock may be less liquid than the stock of companies with a broader public ownership. In addition, sales of a large volume of our common stock by us or our current or future stockholders, or the perception that sales could occur, may also have a significant impact on its trading price.
Our directors, executive officers, and certain significant stockholders hold a significant portion of our outstanding shares.
Our directors and executive officers collectively control approximately16% of our issued and outstanding common shares, and together with certain significant stockholders, including investment funds associated with Brown Capital Management, LLC, Cadian Capital Management, LLC, Riverbridge Partners, LLC, Champlain Investment Partners, LLC and Morgan Stanley, control
21
approximately 61% of our issued and outstanding common shares. As a result, these stockholders could influence matters requiring stockholder approval in ways that may not align with your interest as a stockholder, including the election of directors and approval of significant corporate transactions. This concentration of ownership may have the effect of delaying or preventing a change in control of us even if such change of control would be beneficial to you as a stockholder, and could affect the market price of our shares if there is a sale by this group of stockholders.
If equity research analysts cease to publish research or reports about us or if they issue unfavorable commentary or downgrade our common stock, the price of our common stock could decline.
The trading market for our common stock relies in part on the research and reports that equity research analysts publish about us and our business. The price of our stock could decline if one or more equity research analysts downgrade our stock or if those analysts issue other unfavorable commentary or cease publishing reports about our business.
Anti-takeover provisions in our Certificate of Incorporation and Bylaws and under Delaware law could make an acquisition of us, which may be beneficial to our stockholders, more difficult and may prevent attempts by our stockholders to replace or remove our current management.
Our Certificate of Incorporation and Bylaws and Section 203 of the Delaware General Corporation Law contain provisions that might enable our management to resist a takeover of our company. These provisions include the following:
• | the division of our board of directors into three classes to be elected on a staggered basis, one class each year; |
• | a prohibition on actions by written consent of our stockholders; |
• | the elimination of the right of stockholders to call a special meeting of stockholders; |
• | a requirement that stockholders provide advance notice of any stockholder nominations of directors or any proposal of new business to be considered at any meeting of stockholders; |
• | a requirement that a supermajority vote be obtained to amend or repeal certain provisions of our certificate of incorporation; and |
• | the ability of our board of directors to issue preferred stock without stockholder approval. |
In addition, because we are incorporated in Delaware, we are governed by the provisions of Section 203 of the Delaware General Corporation Law, which limits the ability of stockholders owning in excess of 15% of our outstanding voting stock to merge or combine with us. Although we believe these provisions collectively provide for an opportunity to obtain higher bids by requiring potential acquirors to negotiate with our board of directors, they would apply even if an offer were considered beneficial by some stockholders. In addition, these provisions may frustrate or prevent any attempts by our stockholders to replace or remove our current management by making it more difficult for stockholders to replace members of our board of directors, which is responsible for appointing the members of our management.
We do not intend to pay dividends on our common stock in the foreseeable future.
We do not currently anticipate paying any cash dividends on our common stock in the foreseeable future. We currently anticipate that we will retain all of our available cash, if any, for use as working capital, repayment of debt and for other general corporate purposes. Any payment of future dividends would be at the discretion of our board of directors and would depend upon, among other things, our earnings, financial condition, capital requirements, level of indebtedness, statutory and contractual restrictions applying to the payment of dividends and other considerations that the board of directors deems relevant.
The accounting method for convertible debt securities that may be settled in cash, such as the Senior Notes, could have a material effect on our reported financial results.
In May 2008, FASB, issued FASB Staff Position No. APB 14-1, Accounting for Convertible Debt Instruments That May Be Settled in Cash Upon Conversion (Including Partial Cash Settlement), which has subsequently been codified as Accounting Standards Codification 470-20, Debt with Conversion and Other Options, which we refer to as ASC 470-20. Under ASC 470-20, an entity must separately account for the liability and equity components of the convertible debt instruments (such as the Senior Notes) that may be settled entirely or partially in cash upon conversion in a manner that reflects the issuer's economic interest cost. The effect of ASC 470-20 on the accounting for the Senior Notes is that the equity component is required to be included in the additional paid-in capital section of stockholders' equity on our consolidated balance sheet and the value of the equity component would be treated as original issue discount for purposes of accounting for the debt component of the Senior Notes. As a result, we will be required to record a greater amount of non-cash interest expense in current periods presented as a result of the amortization of the discounted carrying value of the Senior Notes to their face amount over the term of the Senior Notes. We will report lower net income in our financial results because ASC 470-20 will require interest to include both the current period's amortization of
22
the debt discount and the instrument's coupon interest, which could adversely affect our reported or future financial results, the trading price of our common stock and the trading price of the Senior Notes. In addition, under certain circumstances, convertible debt instruments (such as the Senior Notes) that may be settled entirely or partly in cash are currently accounted for utilizing the treasury stock method, the effect of which is that any shares issuable upon conversion of the Senior Notes are not included in the calculation of diluted earnings per share except to the extent that the conversion value of the notes exceeds their principal amount. Under the treasury stock method, for diluted earnings per share purposes, the transaction is accounted for as if the number of shares of common stock that would be necessary to settle such excess, if we elected to settle such excess in shares, are issued. We cannot be sure that the accounting standards in the future will continue to permit the use of the treasury stock method. If we are unable to use the treasury stock method in accounting for the shares issuable upon conversion of the Senior Notes, then our diluted earnings per share would be adversely affected.
Item 1B. Unresolved Staff Comments
None.
Item 2. Properties
Our headquarters are located in Houston, Texas, where we lease approximately 98,000 square feet of office space. As of December 31, 2015, we also lease smaller regional offices in London, England; Paris, France; Toulouse, France; Munich, Germany; San Francisco, California; Skokie, Illinois; and Austin, Texas. We believe our existing facilities are sufficient for our current needs. We may add new facilities and expand our existing facilities as we add employees, and we believe that suitable additional or substitute space will be available as needed to accommodate any such expansion of our operations.
Item 3. Legal Proceedings
In the ordinary course of our business, we regularly become involved in contract and other negotiations and, in more limited circumstances, become involved in legal proceedings, claims and litigation. The outcomes of these matters are inherently unpredictable. We are not currently involved in any outstanding litigation that we believe, individually or in the aggregate, will have a material adverse effect on our business, results of operations or financial condition.
Item 4. Mine Safety Disclosures
Not applicable.
23
Part II
Item 5. Market for Registrant’s Common Equity, Related Stockholders Matters and Issuer Purchases of Equity Securities
Market information, holders and dividends
Our common stock is listed on the NYSE under the symbol "PRO". The following table sets forth the high and low prices for shares of our common stock, as reported by the NYSE for the periods indicated.
Price Range of Common Stock | |||||||
Low | High | ||||||
Year ended December 31, 2015 | |||||||
First Quarter | $ | 23.01 | $ | 27.12 | |||
Second Quarter | $ | 18.03 | $ | 27.15 | |||
Third Quarter | $ | 20.46 | $ | 24.58 | |||
Fourth Quarter | $ | 20.60 | $ | 25.11 | |||
Year ended December 31, 2014 | |||||||
First Quarter | $ | 30.47 | $ | 41.06 | |||
Second Quarter | $ | 21.59 | $ | 32.25 | |||
Third Quarter | $ | 24.01 | $ | 28.52 | |||
Fourth Quarter | $ | 23.08 | $ | 30.39 | |||
On February 16, 2016 there were 61 stockholders of record of our common stock. Since 2007, we have not declared or paid any dividends on our common stock. We currently expect to retain all remaining available funds and any future earnings for use in the operation and development of our business. Accordingly, we do not anticipate declaring or paying cash dividends on our common stock in the foreseeable future.
Performance graph
The following performance graph and related information shall not be deemed "soliciting material" or to be "filed" with the SEC, nor shall such information be incorporated by reference into any future filing under the Securities Act or Exchange Act, except to the extent that we specifically incorporate it by reference into such filing.
The graph below presents a five-year comparison of the relative investment performance of our common stock, the Standard & Poor’s 500 Stock Index ("S&P 500"), and the NASDAQ Computer Index for the period commencing on December 31, 2010, and ending December 31, 2015. The graph is presented pursuant to the SEC rules and is not meant to be an indication of our future performance.
24

(1) | The graph assumes that $100 was invested on December 31, 2010, in our common stock, the S&P 500 and the NASDAQ Computer Index and further assumes all dividends were reinvested. No cash dividends have been paid on our common stock for the periods presented above. |
12/31/2011 | 12/31/2012 | 12/31/2013 | 12/31/2014 | 12/31/2015 | |||||||||||||||
PRO | $ | 130.64 | $ | 160.58 | $ | 350.31 | $ | 241.26 | $ | 202.28 | |||||||||
S&P 500 | $ | 100.00 | $ | 113.40 | $ | 146.97 | $ | 163.71 | $ | 162.52 | |||||||||
NASDAQ Computer Index | $ | 100.49 | $ | 113.03 | $ | 149.13 | $ | 178.78 | $ | 189.94 | |||||||||
Issuer purchase of equity securities
On August 25, 2008, we announced that the Board of Directors authorized a stock repurchase program for the purchase of up to $15.0 million of our common stock. Under the board-approved repurchase program, share purchases may be made from time to time in the open market or through privately negotiated transactions depending on market conditions, share price, trading volume and other factors, and such purchases, if any, will be made in accordance with applicable insider trading and other securities laws and regulations. These repurchases may be commenced or suspended at any time or from time to time without prior notice.
During 2015, we did not make any purchases of our common stock under this program. As of December 31, 2015, $10.0 million remains available under the stock repurchase program.
Recent Sales of Unregistered Securities
There were no unregistered sales of equity securities for the year ended December 31, 2015.
25
Item 6. Selected financial data
The following selected consolidated financial data presented under the captions "Selected consolidated statement of operations data" and "Selected consolidated balance sheet data" are derived from our Consolidated Financial Statements. The selected consolidated financial data set forth below should be read in conjunction with, and is qualified by reference to, "Management’s Discussion and Analysis of Financial Condition and Result of Operations" and our Consolidated Financial Statements and the related Notes included elsewhere in this report. As presented in the table, amounts are in thousands (except per share data).
Year Ended December 31, | ||||||||||||||||||||
2015 | 2014 | 2013 | 2012 | 2011 | ||||||||||||||||
Selected consolidated statement of operations data: | ||||||||||||||||||||
Total revenue | $ | 168,246 | $ | 185,829 | $ | 144,837 | $ | 117,791 | $ | 96,639 | ||||||||||
Gross profit | 106,836 | 127,743 | 101,702 | 84,006 | 70,337 | |||||||||||||||
(Loss) Income from operations | (55,497 | ) | (22,407 | ) | 3,538 | 8,180 | 8,775 | |||||||||||||
Net (loss) income | (65,811 | ) | (37,551 | ) | 3,446 | 4,966 | 6,350 | |||||||||||||
Net (loss) income attributable to common stockholders | $ | (65,811 | ) | $ | (36,644 | ) | $ | 3,446 | $ | 4,966 | $ | 6,350 | ||||||||
Net (loss) income attributable to common stockholders per share: | ||||||||||||||||||||
Basic | (2.23 | ) | (1.27 | ) | 0.12 | 0.18 | 0.24 | |||||||||||||
Diluted | (2.23 | ) | (1.27 | ) | 0.11 | 0.17 | 0.23 | |||||||||||||
Weighted average number of shares: | ||||||||||||||||||||
Basic | 29,578 | 28,915 | 28,004 | 27,366 | 26,832 | |||||||||||||||
Diluted | 29,578 | 28,915 | 30,114 | 28,420 | 27,762 | |||||||||||||||
Selected consolidated balance sheet data: | ||||||||||||||||||||
Cash and cash equivalents, unrestricted | $ | 161,770 | $ | 161,019 | $ | 44,688 | $ | 83,558 | $ | 68,457 | ||||||||||
Working capital | 124,687 | 151,903 | 72,127 | 72,950 | 66,334 | |||||||||||||||
Total assets | 263,722 | 300,125 | 179,828 | 146,479 | 121,259 | |||||||||||||||
Long-term obligations | 121,954 | 112,740 | 3,523 | 3,334 | 2,976 | |||||||||||||||
Total stockholders’ equity | $ | 55,414 | $ | 98,999 | $ | 111,303 | $ | 88,669 | $ | 73,943 | ||||||||||
26
Item 7. Management’s discussion and analysis of financial condition and results of operations
Overview
PROS provides enterprise revenue and profit realization software solutions designed to help business-to-business ("B2B") and business-to-consumer ("B2C") companies accelerate sales, formulate winning pricing strategies and align product, demand and availability. Our revenue and profit realization software solutions allow our customers to grow revenue, sustain profitability and modernize their business processes.
Fiscal 2015 Overview
Fiscal 2015 was a transformational year for PROS, as we shifted from primarily offering perpetual licenses of our solutions to a subscription based cloud-first strategy. As part of this shift, we introduced a number of changes to our business, including creating and introducing new cloud-only packages of our software, training our personnel, and increasing our focus on competitive differentiation in key industry verticals. We believe that the number of changes we implemented as part of cloud-first strategy had a negative impact on the pace of deal execution in the second half of 2015. However, these changes also yielded positive initial results in 2015, as our recurring revenues, which consists of maintenance and subscription revenue, grew by 19% over 2014.
Annualized Recurring Revenue ("ARR") is currently one of our key performance metrics to assess the health and trajectory of our overall cloud business. ARR should be viewed independently of revenue, deferred revenue and any other GAAP measure as ARR is a performance metric and is not intended to be combined with any of these items. ARR is defined as the annualized contracted recurring revenue from subscription and maintenance contracts. Contracted revenue from perpetual license, term license and service agreements are not included within the ARR metric. Total ARR as of December 31, 2015 was $98.2 million, up from $85.0 million as of December 31, 2014, an increase of 16%.
Free cash flow is another one of our key metrics that assess the strength of our business. Free cash flow is a non-GAAP financial measure which is defined as net cash provided by operating activities, less additions to property, plant and equipment and capitalized internal-use software development costs. We believe free cash flow may be useful to investors and other users of our financial information in evaluating the amount of cash generated by business operations, after cash used for additions to property, plant and equipment and capitalized internal-use software development costs. Free cash flow generated for the year ended December 31, 2015 was $8.5 million, up from a use of free cash flow of $8.1 million for the year ended December 31, 2014.
Financial Performance Summary
Total revenue for the year ended December 31, 2015, decreased $17.6 million to $168.2 million from $185.8 million for the year ended December 31, 2014, representing a 9% decrease. This decrease in total revenue was primarily attributable to a decrease in license revenue, which was expected as we transitioned our business towards our subscription-based SaaS and cloud-based solutions.
Total license revenue for the year ended December 31, 2015, decreased $25.8 million to $32.7 million from $58.5 million for the year ended December 31, 2014, representing a 44% decrease. This decrease in license revenue was expected as we transitioned our business towards our subscription-based SaaS and cloud-based solutions.
Total recurring revenue, which is comprised of our subscription and maintenance revenue, was $92.7 million for the year ended December 31, 2015 as compared to $78.1 million for the year ended December 31, 2014, an increase of 19%, as a result of our transition towards our subscription-based SaaS and cloud-based solutions.
Total deferred revenue was $65.3 million as of December 31, 2015, as compared to $58.4 million as of December 31, 2014, an increase of $6.9 million, or 12%, primarily due to an increase in our subscription deferred revenue.
Operating cash flow was $15.5 million for the year ended December 31, 2015, as compared to $1.8 million for the year ended December 31, 2014, an increase of 761%.
Revenue by Geography
The following geographic information is presented for the years ended December 31, 2015, 2014 and 2013. PROS categorizes geographic revenues based on the location of our customer’s headquarters.
27
Year Ended December 31, | ||||||||||||||||||||
2015 | 2014 | 2013 | ||||||||||||||||||
Revenue | Percent | Revenue | Percent | Revenue | Percent | |||||||||||||||
United States of America | $ | 63,754 | 38 | % | $ | 82,086 | 44 | % | $ | 65,072 | 45 | % | ||||||||
Europe | 47,514 | 28 | % | 45,987 | 25 | % | 33,666 | 23 | % | |||||||||||
The rest of the world | 56,978 | 34 | % | 57,756 | 31 | % | 46,099 | 32 | % | |||||||||||
Total revenue | $ | 168,246 | 100 | % | $ | 185,829 | 100 | % | $ | 144,837 | 100 | % | ||||||||
Acquisitions
Acquisitions could be another element to our corporate strategy. We believe future acquisitions could strengthen our competitive position, enhance the products and services that we can offer to customers, expand our customer base, grow our revenues and increase our overall value.
Fiscal 2014 Acquisition
In October 2013, we entered into a tender offer agreement with Cameleon Software SA ("PROS France"). As a result of shares purchased in the market following the completion of the tender in January 2014, the exercise of warrants in July 2014, and second tender completed in November 2014, we controlled 100% of PROS France's common stock as of December 31, 2014. We acquired PROS France for total cash consideration of approximately $32 million, net of cash acquired.
Fiscal 2013 Acquisition
In December 2013, we acquired SignalDemand, Inc. for total cash consideration of $13.5 million.
Financing Activities
In December 2014, we issued $143.8 million aggregate principal amount of 2.0% convertible Senior Notes due December 1, 2019, unless earlier purchased or converted. Interest is payable semiannually in arrears on June 1 and December 1 of each year, commencing on June 1, 2015.
Backlog
Our backlog is derived from agreements that we believe to be firm commitments to provide software solutions and related services in the future. Our backlog is based on significant estimates and judgments that we make regarding total contract values, as well as maintenance renewals and changes to existing maintenance and support agreements. Backlog includes committed maintenance, amounts under maintenance and support agreements that we reasonably expect to renew, as well as deferred revenue.
We compute our backlog as of a specific date, and we update our backlog to reflect changes in our estimates and judgments or subsequent additions, delays, terminations or reductions in our agreements. Backlog can vary significantly from period to period depending on a number of factors including the timing of our sales and the nature of the agreements we enter into with our customers. For example, we have agreements that include non-standard provisions which require us to exercise judgment over the extent to which to include these agreements in our backlog. However, based on our history of successfully implementing our software solutions, we generally include the full estimated value of these agreements in backlog. For these and other reasons, our backlog may not be a meaningful indicator of future revenue to be recognized in any particular quarter, and there can be no assurance that our backlog at any point in time will translate into revenue in any specific quarter. Furthermore, as we continue our migration to a SaaS provider, our historical definition of backlog and the relevance to our future revenues may change.
We had backlog of approximately $209 million as of December 31, 2015 as compared to backlog of approximately $194 million as of December 31, 2014. The portion of our backlog as of December 31, 2015 not reasonably expected to be recognized as revenue within the next twelve months is estimated to be approximately $86 million.
Opportunities, trends and uncertainties
We have noted opportunities, trends and uncertainties that we believe are particularly significant to understand our financial results and condition.
28
• | Cloud-first strategy. We have historically sold the majority of our products via perpetual licenses. We also sold our solutions via term licenses or SaaS, which defers revenue recognition. In connection with our subscription based cloud-first strategy announced in 2015, we expect to sell a lower percentage of perpetual licenses and more subscription-based solutions such as SaaS and subscription cloud-based solutions. Following a transition period, we expect this business model will increase our recurring subscription revenue. We anticipate that this strategy will result in lower license revenue, lower total revenues and lower operating cash flows in 2016. However, we do not anticipate a corresponding decrease in expenses in 2016, which will adversely affect our net income, operating margins and cash flow. |
• | Variability in bookings. Historically, we have experienced the strongest customer demand in fourth and second quarters of each year. However, the size and timing of orders for our products and services varies considerably, which can cause significant fluctuations in our bookings results from quarter to quarter. Due to our average deal sizes, our bookings in any particular quarter have in the past, and may continue in the future, to be dependent on a relatively small number of orders. During 2015, we experienced unanticipated sales execution challenges which we believe stemmed from the pace of change associated with our cloud-first strategy. The timing of our bookings also varies based on a number of factors over which we may have little or no control, including the complexity of the transaction, our customers' internal budgeting and approval processes, our customers purchasing behaviors and the level of competition. |
• | Variability in revenue. The timing of our revenue recognition varies based on the nature and requirements of our contracts. In conjunction with our cloud-first announcement in 2015, we expect to have an increasing number of subscription contracts, which will result in less license revenue recognized in 2016. The timing of our revenue recognition for our SaaS solutions also varies based on the mix of products sold. For example, our SaaS solutions purchased by our travel customers often require more complex implementations which can delay the commencement of subscription revenue recognition. However, as we continue to emphasize our SaaS and cloud-based solutions over perpetual offerings, near term year over year comparisons will likely be muted due to the differences in revenue recognition. Over time, we expect the revenue impact of our shift to cloud-first to adjust, and year over year comparisons will become more comparable and favorable. |
• | Growth opportunities. We believe the market for our enterprise revenue and profit realization software solutions is underpenetrated. Market interest for our software has increased over the past several years providing us with growth opportunities. We have and will continue to invest in our business to more effectively address these opportunities through investment in professional services, research and development, sales, marketing and support functions. In addition to organic growth, we have acquired, and may continue to acquire companies or technologies that can contribute to the strategic, operational and financial growth of our business. We expect to continue to explore both organic and inorganic growth opportunities. |
• | Uncertain global economic conditions. During fiscal 2015, the global economic environment continued to show signs of uncertainty regarding future domestic and global economic growth, and the global financial system included numerous ongoing geopolitical issues around the globe. During uncertain economic conditions, we generally experience longer sales cycles, increased scrutiny on purchasing decisions and overall cautiousness taken by customers. In addition, certain foreign countries continue to face significant economic and political crises, and it is possible that these crises could result in economic deterioration in the markets in which we operate. This economic uncertainty may negatively affect the overall demand environment in fiscal 2016, particularly in Europe. We believe that our expanded offerings of industry-specific solutions and innovative technology will enable us to stay competitive in a challenging economic environment as business leaders continue to focus on projects that quickly deliver value, however the extent to which the current economic conditions will further affect our business is uncertain. |
• | Effective tax rate. The income tax rates vary from the federal and state statutory rates due to the valuation allowances on our deferred tax assets and foreign withholding taxes; changing tax laws, regulations, and interpretations in multiple jurisdictions in which we operate; changes to the financial accounting rules for income taxes; unanticipated changes in tax rates; differences in accounting and tax treatment of our equity-based compensation and the tax effects of purchase accounting for acquisitions. |
Discussion of consolidated financial information
Revenue
Our revenue is derived from the licensing and implementation of software solutions, associated software maintenance and support, subscription-based solutions such as SaaS and cloud-based solutions and professional services. Our arrangements with customers typically include some, but not all, of the following: (a) license fees for the use of our solutions either in perpetuity or over a specified term, (b) subscription fees for our SaaS and cloud-based services (c) professional service fees for configuration,
29
implementation and training services, and (d) maintenance and support fees related to technical support and software updates. If there is significant uncertainty about contract completion or collectability is not reasonably assured, revenue is deferred until the uncertainty is sufficiently resolved or collectability is reasonably assured. In addition, revenue is recognized when persuasive evidence of an arrangement exists, delivery has occurred or performed the service and fees are considered fixed and determinable. Determining when these criteria have been satisfied often involves judgments that can have a significant impact on the timing and amount of revenue we report.
In determining whether professional services revenue should be accounted for separately from license revenue, we evaluate whether the professional services are considered essential to the functionality of the software. This evaluation is based on factors such as: the nature of our software products; whether they are ready for use by the customer upon receipt; the nature of our professional services; the availability of professional services from other vendors; whether the timing of payments for license revenue coincides with performance of services; and whether milestones or acceptance criteria exist that affect the realizability of the software license fee.
License revenue. We derive the majority of our license revenue from the sale of perpetual licenses. For software license arrangements that do not require significant modification or customization of the underlying software, we recognize software licenses revenues at contract provided professional services are not considered essential to the delivery of the software and when: (1) we enter into a legally binding arrangement with a customer for the license of software; (2) we deliver the products; (3) the sale price is fixed or determinable and free of contingencies or significant uncertainties; and (4) collection is probable. Revenues that are not recognized at the time of sale because the foregoing conditions are not met, are recognized when those conditions are subsequently met.
We evaluate the nature and scope of professional services for each arrangement and if we determine that the professional services revenue should not be accounted for separately from license revenue, the license revenue is recognized together with the professional services revenue using the percentage-of-completion method or completed contract method. The completed contract method is also used for contracts where there is a risk over final acceptance by the customer or for contracts that are short-term in nature.
The percentage-of-completion method is measured by the percentage of man-days expended on an implementation during the reporting period as a percentage of the total man-days estimated to be necessary to complete the software implementation. We measure performance under the percentage-of-completion method using the total man-day method based on current estimates of man-days to complete the software implementation. We believe that for each such software implementation, man-days expended in proportion to total estimated man-days at completion represents the most reliable and meaningful measure for determining a software implementation's progress toward completion. In addition, for fixed-fee software implementation arrangements, should a loss be anticipated on a contract, the full amount of the loss is recorded when the loss is determinable. See "Critical accounting policies and estimates" for additional information regarding revenue recognition.
Subscription revenue. We also offer subscription-based solutions such as SaaS and cloud-based solutions. Our SaaS and cloud-based solutions generally provide customers access to certain of our software solution within a cloud-based IT environment that we manage and offer to customers on a subscription basis. Revenues for our SaaS and cloud-based solutions are generally recognized ratably over the contract term commencing with the date our service is made available to customers and all other revenue recognition criteria have been satisfied.
Our SaaS and cloud-based solutions allow our customers to deploy PROS solutions without any significant investment in hardware as PROS software is integrated in cloud-based IT environments that are deployed, supported and managed on our customers' behalf. For arrangements that include cloud-based services, we allocate the arrangement consideration between the cloud-based service and other elements and recognize the cloud services fee ratably beginning on the date the customer commences use of our services and continuing through the end of the contractual cloud services term.
We also license software under term license agreements that typically include maintenance and support during the contractual license term. Our term license agreements typically range from two to five years. Revenue and the associated cost is deferred until the delivery of the licensed solution and recognized ratably over the remaining contractual license term. Revenue from term license agreements represented 2.3%, 2.9%, and 3.6% of total revenue for the years ended December 31, 2015, 2014 and 2013, respectively.
Service revenue. We also provide software-related professional services, including implementation and configuration services, consulting and training. Professional services are generally provided under time and materials contracts and revenues are recognized as the services are provided. However, if we enter into arrangements with a fixed-fee, professional services revenue are recognized based upon a proportionate performance method. When we enter into arrangements where professional services are considered essential to the functionality of the software, professional services revenue is recognized based upon the percentage of completion method. Under this method, revenue is recognized based upon labor hours incurred as the percentage of total
30
estimated labor hours to complete the project. Revenues for professional services that are bundled with license fees are recognized as the services are performed. We also recognize revenue associated with billable expenses when the expenses are incurred.
Maintenance and support revenue. We generate maintenance and support revenue from the sale of maintenance and support services on our software solutions. The vast majority of our software license arrangements include software license updates and product support contracts, generally ranging from one to two years. Software license updates provide customers with rights to unspecified software updates and enhancements on a when and if available basis, maintenance releases and patches released during the term of the support period. Software license updates and product support contracts are generally priced as a percentage of the software licenses fees. Substantially all of our customers renew their software product support contracts annually. Maintenance and support fees are invoiced to our customers generally on an annual basis, although they may be invoiced on a monthly or quarterly basis in certain circumstances.
Cost of revenue
Cost of license. Cost of license consists of third-party fees for our licensed software and an allocation of the amortization of intangibles.
Cost of services. Cost of services includes those costs related to professional services and implementation of our solutions, principally (a) personnel costs, which include our employees and employee benefits and third party contractors, (b) noncash share based compensation expense, (c) billable and nonbillable travel, lodging and other out-of-pocket expenses, and (d) an allocation of depreciation, facilities and information technology ("IT") support costs and other costs incurred in providing professional services to our customers. Cost of providing professional services may vary from quarter to quarter depending on a number of factors, including the amount of professional services required to deploy our solutions.
Cost of subscription. Cost of subscription includes those costs related to supporting our SaaS and cloud-based services, principally (a) personnel costs, which include our employees and third party contractors, (b) noncash share based compensation expense, (c) billable and nonbillable travel, lodging and other out-of-pocket expenses, (d) expenses related to operating our network infrastructure, (e) amortization of capitalized software for internal use, and (f) an allocation of depreciation, amortization of intangibles, facilities and IT support costs, including data center costs, and other costs incurred in providing SaaS and cloud-based services to our customers.
Cost of maintenance and support. Cost of maintenance and support consists largely of personnel related expenses and an allocation of depreciation, amortization of intangibles, facilities and IT support costs and other costs incurred in providing maintenance and support services to our customers.
Operating expenses
Selling and marketing. Selling and marketing expenses principally consist of (a) personnel costs, which include our employees and employee benefits, third party contractors and sales commissions related to selling and marketing personnel, (b) noncash share based compensation expense, (c) sales and marketing programs such as lead generation programs, company awareness programs, conferences, hosting and participation in industry trade shows, and other sales and marketing programs, (d) travel and other out-of-pocket expenses, (e) amortization expenses associated with acquired intangible assets, and (f) an allocation of depreciation, facilities and IT support costs and other costs.
General and administrative. General and administrative expenses consist primarily of expenditures for executive, accounting and finance, legal, information technology, and human resources support functions. General and administrative expenses principally consist of (a) personnel costs, which include our employees and employee benefits and third-party contractors, (b) noncash share based compensation expenses, (c) travel and other out-of-pocket expenses, (d) accounting, legal and other professional fees, and (e) an allocation of depreciation, facilities and IT support costs and other costs.
Research and development. Research and development expenses principally consist of (a) personnel costs, which include our employees and employee benefits and third party contractors, which are comprised of software developers, scientists and product managers working on enhancements of existing solutions, the development of new solutions, scientific research, quality assurance and testing, (b) noncash share based compensation expenses, and (c) an allocation of depreciation, facilities and IT support costs and other costs.
Income taxes
We estimate our income taxes based on the various jurisdictions where we conduct business and we use estimates in determining our provision for income taxes. We estimate separately our deferred tax assets, related valuation allowances, current tax liabilities and deferred tax liabilities. The calculation of our tax liabilities involves dealing with uncertainties in the application
31
of complex tax rules and the potential for future adjustment of our uncertain tax positions by the United States Internal Revenue Service or other taxing jurisdictions. We estimate our current tax liability and assess temporary differences that result from differing treatments of certain items for tax and accounting purposes. These differences result in deferred tax assets and liabilities, which we show on our balance sheet. At December 31, 2015, our deferred tax assets consisted primarily of temporary differences related to noncash share based compensation and net operating losses.
We review the realizability of our deferred tax asset valuation allowances on a quarterly basis, or whenever events or changes in circumstances indicate that a review is required. In determining the requirement for a valuation allowance, the historical and projected financial results of the legal entity or consolidated group recording the net deferred tax asset are considered, along with any other positive or negative evidence. Since future financial results may differ from previous estimates, periodic adjustments to our valuation allowances may be necessary. In the fourth quarter of fiscal 2014, we performed an analysis related to the realizability of our worldwide deferred tax assets. After considering tax planning initiatives and other positive and negative evidence, we determined that it was more likely than not that our deferred tax assets would not be realized. Therefore, we recorded a $19.5 million net valuation allowance as income tax expense in the year ended December 31, 2014. In performing similar analysis throughout 2015, there was not sufficient positive evidence to outweigh the current and historic negative evidence to determine that it was more likely than not that our deferred tax assets would not be realized. Therefore, we continue to have a valuation allowance against net deferred tax assets as of December 31, 2015.
As a part of our accounting for business combinations, intangible assets are recognized at fair value and goodwill is measured as the excess of consideration transferred over the net estimated fair value of assets acquired. Impairment charges associated with goodwill are generally not tax deductible and will result in an increased effective income tax rate in the period that any impairment is recorded. Amortization expenses associated with acquired intangible assets are generally not tax deductible pursuant to our existing tax structure.
Our federal effective tax rate has historically benefited from the application of the research and experimentation ("R&E") tax credit. In prior years Congress passed a series of extensions which enabled us to continue to benefit from the R&E tax credit, but passage of such extensions was always an uncertainty. In December of 2015, Congress passed the Protecting Americans from Tax Hikes Act which, among other things, made the R&E tax credit permanent. We recorded the full benefit of the R&E tax credit in the fourth quarter of 2015.
Deferred revenue and unbilled receivables
For our license and professional service fees, we invoice and are paid based upon contractual payment schedules in each customer arrangement, which in limited circumstances include payments linked to contractual milestones. We record as deferred revenue invoices that have been issued before the corresponding license and implementation revenue is recognized. We record as unbilled receivables any recognized license and implementation revenue in excess of the amount invoiced to the customer. We generally invoice for our maintenance and support services on a monthly, quarterly or annual basis through the maintenance and support period. Deferred revenue does not reflect the total contract value of our customer arrangements at any point in time as we only record deferred revenue if amounts are invoiced in advance of the corresponding recognition of license and implementation revenue. As a result, there is little correlation between the timing of our revenue recognition, the timing of our invoicing and the amount of deferred revenue.
32
Results of operations
Comparison of year ended December 31, 2015 with year ended December 31, 2014
Revenue:
For the Year Ended December 31, | ||||||||||||||||||||
2015 | 2014 | |||||||||||||||||||
(Dollars in thousands) | Amount | Percentage of total revenue | Amount | Percentage of total revenue | Variance $ | Variance % | ||||||||||||||
License | $ | 32,716 | 19 | % | $ | 58,515 | 31 | % | $ | (25,799 | ) | (44 | )% | |||||||
Services | 42,875 | 25 | % | 49,225 | 26 | % | (6,350 | ) | (13 | )% | ||||||||||
Subscription | 28,989 | 17 | % | 23,468 | 13 | % | 5,521 | 24 | % | |||||||||||
Total license, services and subscription | 104,580 | 62 | % | 131,208 | 71 | % | (26,628 | ) | (20 | )% | ||||||||||
Maintenance and support | 63,666 | 38 | % | 54,621 | 29 | % | 9,045 | 17 | % | |||||||||||
Total revenue | $ | 168,246 | 100 | % | $ | 185,829 | 100 | % | $ | (17,583 | ) | (9 | )% | |||||||
License revenue. For the year ended December 31, 2015, license revenue decreased $25.8 million to $32.7 million from $58.5 million for the year ended December 31, 2014, representing a 44% decrease. Our license revenue is dependent on the amount of perpetual licenses sold in the period, as well as the timing of revenue recognition. As a result of our shift to a cloud-first strategy, we experienced a decrease in the sale of perpetual licenses and a corresponding decrease in license revenue, which included a decrease of $18.2 million in license revenue recognized upon software delivery. We recognized $9.0 million and $27.2 million of license revenue upon software delivery for the years ended December 31, 2015 and 2014, respectively. As a result of our shift to a cloud-first strategy, we expect customers will be purchasing more subscription-based solutions such as SaaS and cloud-based solutions, resulting in lower future license revenue.
Services revenue. For the year ended December 31, 2015, services revenue decreased $6.4 million to $42.9 million from $49.2 million for the year ended December 31, 2014, representing a 13% decrease. The decrease in services revenue was primarily attributable to several customer implementations that were completed in 2014 with significant professional services and to a lesser extent certain pre-packaged offerings requiring less professional services. In addition, even though the total number of customers generating services revenue increased to 212 for the year ended December 31, 2015, as compared to 193 in the corresponding period in 2014, an increase of 10%, the decrease in services revenue was also attributed to an overall lower effective services man-day rate.
Subscription revenue. For the year ended December 31, 2015, subscription revenue increased $5.5 million to $29.0 million from $23.5 million for the year ended December 31, 2014, representing a 24% increase. The increase in subscription revenue was primarily attributable to an increase in the number of customers subscribing to our SaaS and cloud-based solutions. The total number of customers generating subscription revenue was 102 for the year ended December 31, 2015, as compared to 90 in the corresponding period in 2014, an increase of 13%. We expect our subscription revenue will continue to increase as a result of our shift to a cloud-first strategy.
Maintenance and support. Maintenance and support revenue increased $9.0 million to $63.7 million for the year ended December 31, 2015 from $54.6 million for the year ended December 31, 2014, representing a 17% increase. The increase in maintenance and support revenue was principally a result of an increase in the number of customers purchasing maintenance and support services related to their licensing of our software. We expect our maintenance revenue growth will decrease as a result of customers licensing less of our software as we shift to a cloud-first strategy.
33
Cost of revenue and gross profit.
For the Year Ended December 31, | ||||||||||||||||||||
2015 | 2014 | |||||||||||||||||||
(Dollars in thousands) | Amount | Percentage of total revenue | Amount | Percentage of total revenue | Variance $ | Variance % | ||||||||||||||
Cost of license | $ | 304 | — | % | $ | 243 | — | % | $ | 61 | 25 | % | ||||||||
Cost of services | 36,147 | 21 | % | 39,955 | 22 | % | (3,808 | ) | (10 | )% | ||||||||||
Cost of subscription | 12,786 | 8 | % | 7,334 | 4 | % | 5,452 | 74 | % | |||||||||||
Total cost of license, services and subscription | 49,237 | 29 | % | 47,532 | 26 | % | 1,705 | 4 | % | |||||||||||
Cost of maintenance and support | 12,173 | 7 | % | 10,554 | 6 | % | 1,619 | 15 | % | |||||||||||
Total cost of revenue | $ | 61,410 | 37 | % | $ | 58,086 | 31 | % | $ | 3,324 | 6 | % | ||||||||
Gross profit | $ | 106,836 | 63 | % | $ | 127,743 | 69 | % | $ | (20,907 | ) | (16 | )% | |||||||
Cost of license. Cost of license primarily consists of third-party fees for licenses. Cost of license increased $0.1 million for the year ended December 31, 2015 to $0.3 million from $0.2 million for the year ended December 31, 2014, representing a 25% increase. License gross profit percentages for the year ended December 31, 2015 and 2014, remained relatively unchanged as a result of limited third-party fees for licensed software incurred over both periods.
Cost of services. Cost of services decreased $3.8 million to $36.1 million for the year ended December 31, 2015 from $40.0 million for the year ended December 31, 2014, representing a 10% decrease. The decrease was primarily attributable to a decrease in personnel costs used in our software implementations of $2.6 million and a decrease in other overhead expenses of $1.2 million. Services gross profit percentages for the years ended December 31, 2015 and 2014, were 16% and 19%, respectively. The percent decrease in services gross profit was primarily driven by the completion of several implementations in 2014 with higher professional services man-day rates and lower professional services utilization during the year ended December 31, 2015. Service gross profit percentages can vary from period to period depending on different factors, including the level of professional services required to implement our software and the utilization of our professional services personnel.
Cost of subscription. Cost of subscription increased $5.5 million to $12.8 million for the year ended December 31, 2015 from $7.3 million for the year ended December 31, 2014, representing a 74% increase. The increase was primarily attributable to a $2.6 million increase in personnel costs and a $2.9 million increase in infrastructure costs to support our current and anticipated future subscription customer base. Our subscription gross profit percentage for the years ended December 31, 2015 and 2014, was 56% and 69%, respectively.
Cost of maintenance and support. Cost of maintenance and support revenue increased $1.6 million to $12.2 million for the year ended December 31, 2015, from $10.6 million for the year ended December 31, 2014, representing a 15% increase. The cost of providing maintenance and support services consists largely of personnel related expenses. The increase in cost of maintenance and support was attributable to an increase in personnel costs associated with the continued growth in our customer maintenance and support function commensurate with our maintenance and support revenue growth. Maintenance and support gross margins were 81% for both years ended December 31, 2015 and 2014.
Gross profit. Gross profit decreased $20.9 million to $106.8 million for the year ended December 31, 2015 from $127.7 million for the year ended December 31, 2014, representing a 16% decrease. The decrease in overall gross profit was principally attributable to the decrease in license revenue during the period.
34
Operating expenses:
For the Year Ended December 31, | ||||||||||||||||||||
2015 | 2014 | |||||||||||||||||||
(Dollars in thousands) | Amount | Percentage of total revenue | Amount | Percentage of total revenue | Variance $ | Variance % | ||||||||||||||
Selling and marketing | $ | 74,146 | 44 | % | $ | 64,528 | 35 | % | $ | 9,618 | 15 | % | ||||||||
General and administrative | 38,517 | 23 | % | 35,389 | 19 | % | 3,128 | 9 | % | |||||||||||
Research and development | 46,780 | 28 | % | 43,174 | 23 | % | 3,606 | 8 | % | |||||||||||
Acquisition-related | — | — | % | 3,019 | 2 | % | (3,019 | ) | (100 | )% | ||||||||||
Impairment charges | 2,890 | 2 | % | 4,040 | 2 | % | (1,150 | ) | (28 | )% | ||||||||||
Total operating expenses | $ | 162,333 | 96 | % | $ | 150,150 | 81 | % | $ | 12,183 | 8 | % | ||||||||
Selling and marketing. Selling and marketing expenses increased $9.6 million to $74.1 million for the year ended December 31, 2015 from $64.5 million for the year ended December 31, 2014, representing a 15% increase. The increase was primarily attributable to an increase of $5.5 million in personnel costs, which included an increase of $2.0 million of noncash share based compensation, and $1.0 million increase in severance expense. The remaining increase of $4.1 million related to non-personnel costs included an increase of $2.1 million in sales and marketing events, $1.4 million in travel expenses, $0.6 million increase in amortization expense on certain intangible assets that became fully amortized, $0.4 million in facility and other overhead expenses partially offset by a decrease of $0.4 million in recruiting expenses.
General and administrative expenses. General and administrative expenses increased $3.1 million to $38.5 million for the year ended December 31, 2015 from $35.4 million for the year ended December 31, 2014, representing a 9% increase. The increase was attributable to an increase of $3.7 million of personnel costs, primarily related to $2.3 million increase in noncash share based compensation expense, which included an acceleration of noncash share based compensation expense of $1.1 million in the first quarter of 2015 due to the change in employment status for our former Chief Financial Officer. The increase in personnel cost was partially offset by a decrease in non-personnel costs of $0.6 million, which primarily included a $0.2 million decrease in professional fees, $0.2 million decrease in bad debt expense and a $0.2 million decrease in facility and other overhead expenses.
Research and development expenses. Research and development expenses increased $3.6 million to $46.8 million for the year ended December 31, 2015 from $43.2 million for the year ended December 31, 2014, representing an 8% increase. The increase was attributable to an increase of $2.4 million in personnel costs which was due primarily to an increase in noncash share based compensation of $0.6 million and an increase of $0.4 million of severance expenses. The remaining increase of $1.2 million was primarily attributable to an increase in facility and other overhead expenses.
Acquisition-related expense. Acquisition-related expenses were zero and $3.0 million for the year ended December 31, 2015 and 2014, respectively, consisting primarily of retention bonuses, advisory and legal fees, accounting and other professional fees related to the acquisition and integration of Cameleon Software SA and SignalDemand.
Impairment charges. During the years ended December 31, 2015 and 2014, we recorded $2.9 million and $4.0 million of impairment charges related to internally developed software. The full impairment resulted from a reduction of projected cash flows for product groups based on revisions to our projections during the year and was recorded to reduce the carrying value to fair value. These reductions reflect changes to our plans for certain product groups in connection with the integration of our acquisitions and changes in future product launches and support.
Other expense, net:
For the Year Ended December 31, | ||||||||||||||||||
2015 | 2014 | |||||||||||||||||
(Dollars in thousands) | Amount | Percentage of total revenue | Amount | Percentage of total revenue | Variance $ | Variance % | ||||||||||||
Convertible debt interest and amortization | (8,914 | ) | (5 | )% | (492 | ) | — | % | (8,422 | ) | nm | |||||||
Other expense, net | (661 | ) | — | % | (2,159 | ) | (1 | )% | 1,498 | (69 | )% | |||||||
Convertible debt interest and amortization. The convertible debt expense for the years ended December 31, 2015 and 2014 related to coupon interest and amortization of debt discount and issuance costs attributable to our Senior Notes issued in December 2014. The increase was attributed to a full year of convertible debt interest and amortization for the year ended December 31, 2015 as compared to a partial year for the year ended December 31, 2014.
35
Other expense, net. Other expense, net decreased by $1.5 million during the year ended December 31, 2015, primarily due to the reduced impact of movements in foreign currency exchange rates during the period, including foreign currency losses on the restricted cash used for the acquisition of Cameleon Software SA that was recognized in 2014.
Income tax provision:
For the Year Ended December 31, | ||||||||||||||
(Dollars in thousands) | 2015 | 2014 | Variance $ | Variance % | ||||||||||
Effective tax rate | (1 | )% | (50 | )% | n/a | 49 | % | |||||||
Income tax provision | $ | 739 | $ | 12,493 | $ | (11,754 | ) | (94 | )% | |||||
Our income tax provision decreased $11.8 million to $0.7 million for the year ended December 31, 2015, from $12.5 million for the year ended December 31, 2014. Our tax provision for the year ended December 31, 2015 primarily consisted of foreign taxes and state taxes not based on pre-tax income.
Our 2015 and 2014 effective tax rates had an unusual relationship to pretax loss from operations as a result of the presence of a valuation allowance on our net deferred tax assets. Due to a $20.9 million increase in our valuation allowance on our net deferred tax assets, our income tax provision in 2015 only includes foreign taxes and state taxes not based on pre-tax income, resulting in an effective tax rate of (1)%. The difference between the effective tax rate and the federal statutory rate of 34% for the year ended December 31, 2015 was primarily due to the increase in our valuation allowance on our net deferred tax assets. Our effective tax rate for 2014 included a $19.5 million net valuation allowance, which was initially established and recorded in the fourth quarter of 2014. The difference between the effective tax rate and the federal statutory rate of 34% for the year ended December 31, 2014 was due primarily to the increase in our valuation allowance and the tax benefit from the reinstatement of the U.S. R&E tax credit of approximately $1.8 million.
As of December 31, 2015 and 2014, we had a valuation allowance on our net deferred tax assets of $44.3 million and $24.0 million, respectively. The increase was principally attributed to an additional valuation allowance recorded on our current year's tax loss and increases in our noncash share based compensation.
Comparison of year ended December 31, 2014 with year ended December 31, 2013
Revenue:
For the Year Ended December 31, | ||||||||||||||||||||
2014 | 2013 | |||||||||||||||||||
(Dollars in thousands) | Amount | Percentage of total revenue | Amount | Percentage of total revenue | Variance $ | Variance % | ||||||||||||||
License | $ | 58,515 | 31 | % | $ | 41,116 | 28 | % | $ | 17,399 | 42 | % | ||||||||
Services | 49,225 | 26 | % | 48,412 | 33 | % | 813 | 2 | % | |||||||||||
Subscription | 23,468 | 13 | % | 9,221 | 6 | % | 14,247 | 155 | % | |||||||||||
Total license, services and subscription | 131,208 | 71 | % | 98,749 | 68 | % | 32,459 | 33 | % | |||||||||||
Maintenance and support | 54,621 | 29 | % | 46,088 | 32 | % | 8,533 | 19 | % | |||||||||||
Total revenue | $ | 185,829 | 100 | % | $ | 144,837 | 100 | % | $ | 40,992 | 28 | % | ||||||||
License revenue. License revenue increased $17.4 million to $58.5 million for the year ended December 31, 2014 from $41.1 million for the year ended December 31, 2013, representing a 42% increase. The increase in license revenue was attributable to an increase in license revenue recognized upon software delivery. We recognized $27.2 million and $5.9 million of license revenue upon software delivery for the years ended December 31, 2014 and 2013, respectively.
Services revenue. Services revenue increased $0.8 million to $49.2 million for the year ended December 31, 2014 from $48.4 million for the year ended December 31, 2013, representing a 2% increase. The $0.8 million increase in services revenue was primarily attributed to $5.9 million of services revenue from our acquisitions, partially offset by a decrease of $5.1 million in organic services revenue. The decrease of $5.1 million was primarily a result of an increase in the number of third parties implementing our software, implementations requiring less implementation services and several customers delaying some services into 2015.
36
Subscription revenue. Subscription revenue increased $14.2 million to $23.5 million for the year ended December 31, 2014 from $9.2 million for the year ended December 31, 2013, representing a 155% increase. The $14.2 million increase in subscription revenue was primarily attributed to $11.3 million of subscription revenue from our acquisitions and an increase in the overall total number of customers generating subscription revenue. The total number of customers generating subscription revenue was 90 for the year ended December 31, 2014, as compared to 36 in the corresponding period in 2013, an increase of 150%.
Maintenance and support. Maintenance and support revenue increased $8.5 million to $54.6 million for the year ended December 31, 2014 from $46.1 million for the year ended December 31, 2013, representing a 19% increase. The $8.5 million increase in maintenance and support revenue was principally a result of an increase in the number of customers purchasing maintenance and support services and included $3.2 million of maintenance and support revenue from our acquisitions.
Cost of revenue and gross profit:
For the Year Ended December 31, | ||||||||||||||||||||
2014 | 2013 | |||||||||||||||||||
(Dollars in thousands) | Amount | Percentage of total revenue | Amount | Percentage of total revenue | Variance $ | Variance % | ||||||||||||||
Cost of license | $ | 243 | — | % | $ | 282 | — | % | $ | (39 | ) | (14 | )% | |||||||
Cost of services | 39,955 | 22 | % | 32,492 | 22 | % | 7,463 | 23 | % | |||||||||||
Cost of subscription | 7,334 | 4 | % | 2,122 | 1 | % | 5,212 | 246 | % | |||||||||||
Total cost of license, services and subscription | 47,532 | 26 | % | 34,896 | 24 | % | 12,636 | 36 | % | |||||||||||
Cost of maintenance and support | 10,554 | 6 | % | 8,239 | 6 | % | 2,315 | 28 | % | |||||||||||
Total cost of revenue | $ | 58,086 | 31 | % | $ | 43,135 | 30 | % | $ | 14,951 | 35 | % | ||||||||
Gross profit | $ | 127,743 | 69 | % | $ | 101,702 | 70 | % | $ | 26,041 | 26 | % | ||||||||
Cost of license. Cost of license primarily consists of third-party fees for licensed software. Cost of license was $0.2 million for the year ended December 31, 2014, compared to $0.3 million for the year ended December 31, 2013. License gross profit percentages for both the year ended December 31, 2014 and 2013, were 100% and 99%, respectively, as a result of limited third-party fees for licensed software incurred over both periods.
Cost of services. Cost of services increased $7.5 million to $40.0 million for the year ended December 31, 2014, from $32.5 million for the year ended December 31, 2013, representing a 23% increase. The increase was primarily attributable to an increase of $7.4 million from our acquisitions. Services gross profit percentages for the years ended December 31, 2014 and 2013, were 19% and 33%, respectively. The decrease in services gross margins was driven by increases in professional services personnel costs, primarily attributable to our acquisitions. In addition, lower service margins from our acquisitions contributed to the decrease in our services gross margins.
Cost of subscription. Cost of subscription increased $5.2 million to $7.3 million for the year ended December 31, 2014, from $2.1 million for the year ended December 31, 2013, representing a 246% increase. The increase was primarily attributable to a $4.5 million increase from our acquisitions, which included $1.4 million of intangible asset amortization. Subscription gross profit percentages for the years ended December 31, 2014 and 2013, were 69% and 77%, respectively. The decrease in subscription gross profit percentage was attributable to our acquisitions.
Cost of maintenance and support. Cost of maintenance and support revenue increased $2.3 million to $10.6 million for the year ended December 31, 2014, from $8.2 million for the year ended December 31, 2013, representing a 28% increase. The cost of providing maintenance and support services consists largely of personnel related expenses. The increase in cost of maintenance was principally attributable to an increase of $1.5 million in personnel costs associated with the continued growth in our customer maintenance and support function commensurate with maintenance and support revenue growth. In addition, there was an increase of $0.8 million related to intangible asset amortization related to our acquisitions. Maintenance and support gross margins were 81% and 82% for the years ended December 31, 2014 and 2013, respectively.
Gross profit. Gross profit increased $26.0 million to $127.7 million for the year ended December 31, 2014, from $101.7 million for the year ended December 31, 2013, representing a 26% increase. The increase in overall gross profit was principally attributable to a 28% increase in total revenue, which included revenue from our acquisitions. Our acquisitions contributed $8.0 million of gross profit for the year ended December 31, 2014.
37
Operating expenses:
For the Year Ended December 31, | ||||||||||||||||||||
2014 | 2013 | |||||||||||||||||||
(Dollars in thousands) | Amount | Percentage of total revenue | Amount | Percentage of total revenue | Variance $ | Variance % | ||||||||||||||
Selling and marketing | $ | 64,528 | 35 | % | $ | 39,478 | 27 | % | $ | 25,050 | 63 | % | ||||||||
General and administrative | 35,389 | 19 | % | 24,046 | 17 | % | 11,343 | 47 | % | |||||||||||
Research and development | 43,174 | 23 | % | 32,467 | 22 | % | 10,707 | 33 | % | |||||||||||
Acquisition-related | 3,019 | 2 | % | 2,173 | 2 | % | 846 | 39 | % | |||||||||||
Impairment charges | 4,040 | 2 | % | — | — | % | 4,040 | — | % | |||||||||||
Total operating expenses | $ | 150,150 | 81 | % | $ | 98,164 | 68 | % | $ | 51,986 | 53 | % | ||||||||
Selling and marketing. Selling and marketing expenses increased $25.1 million to $64.5 million for the year ended December 31, 2014 from $39.5 million for the year ended December 31, 2013, representing a 63% increase. The increase was attributable to an increase of $17.2 million in personnel costs, which included $4.4 million related to our acquisitions. Personnel costs, which include our employees and third-party consulting costs, increased primarily as a result of an increase in headcount in sales and marketing to support our current and future growth objectives and an increase in headcount from our acquisitions. Included in the increase in personnel costs was an increase of $4.3 million in sales commissions resulting from higher revenue levels and an increase of $2.7 million of noncash share based compensation. The remaining increase of $7.9 million included $2.7 million in travel expenses, $2.4 million in intangible assets amortization, $2.3 million in sales and marketing events, $0.3 million in facility and other overhead expenses and $0.2 million in recruiting expenses.
General and administrative expenses. General and administrative expenses increased $11.3 million to $35.4 million for the year ended December 31, 2014, from $24.0 million for the year ended December 31, 2013, representing a 47% increase. The increase was attributable to an increase of $6.3 million in personnel costs, which included $2.5 million related to our acquisitions. Personnel costs, which include our employees and third-party consulting costs, increased primarily as a result of an increase in in headcount in general and administrative to support our current and future growth objectives and an increase in headcount from our acquisitions. Included in the increase in personnel costs was an increase of $0.9 million of noncash share based compensation. The remaining increase of $5.0 million included $3.3 million in facility and other overhead expenses, $0.7 million in travel, $0.6 million in professional fees and $0.4 million in recruiting expenses.
Research and development expenses. Research and development expenses increased $10.7 million to $43.2 million for the year ended December 31, 2014 from $32.5 million for the year ended December 31, 2013, representing a 33% increase. The increase was attributable to an increase of $10.2 million in personnel costs, which included $5.6 million related to our acquisitions. Personnel costs, which include our employees and third-party consulting costs, increased as a result of an increase in headcount from our acquisitions and headcount to support ongoing development activities. Included in the increase in personnel costs was an increase of $1.5 million of noncash share based compensation expense. The remaining increase of $0.5 million was primarily attributable to $0.3 million of facility and other overhead expenses and $0.2 million of travel.
Acquisition-related expense. Acquisition-related expenses were $3.0 million and $2.2 million for the year ended December 31, 2014 and 2013, respectively, consisting primarily of advisory and legal fees related to the acquisition and integration of SignalDemand and Cameleon Software SA.
Impairment charges. During the year ended December 31, 2014, we recorded $4.0 million of impairment charges related to internally developed software. The full impairment resulted from a reduction of projected cash flows for product groups based on revisions to our projections during the year and was recorded to reduce the carrying value to fair value. This reduction reflected changes to our plans for certain product groups in connection with the integration of our acquisitions and changes in future product launches and support.
38
Other expense, net:
For the Year Ended December 31, | ||||||||||||||||||||
2014 | 2013 | |||||||||||||||||||
(Dollars in thousands) | Amount | Percentage of total revenue | Amount | Percentage of total revenue | Variance $ | Variance % | ||||||||||||||
Convertible debt interest and amortization | $ | (492 | ) | — | % | $ | — | — | % | $ | (492 | ) | nm | |||||||
Other expense, net | $ | (2,159 | ) | (1 | )% | $ | (265 | ) | — | % | $ | (1,894 | ) | nm | ||||||
Convertible debt interest and amortization. The convertible debt expense related to coupon interest and amortization of debt discount and issuance costs attributable to our Senior Notes issued in December 2014.
Other expense, net. The increase of $1.9 million in other expense, net included an increase of $1.5 million of foreign currency exchange losses on transactions denominated in currencies other than the functional currency and an increase of $0.4 million of other miscellaneous income and expenses.
Income tax provision:
For the Year Ended December 31, | ||||||||||||||
(Dollars in thousands) | 2014 | 2013 | Variance $ | Variance % | ||||||||||
Effective tax rate | (50 | )% | (5 | )% | n/a | (45 | )% | |||||||
Income tax (benefit) provision | $ | 12,493 | $ | (173 | ) | $ | 12,666 | nm | ||||||
Income tax (benefit) provision. Our income tax provision increased $12.7 million to $12.5 million for the year ended December 31, 2014, from a tax benefit of $0.2 million for the year ended December 31, 2013. Our effective tax rates were (50)% and (5)% for the years ended December 31, 2014 and 2013, respectively. Our effective tax rate for fiscal 2014 included a $19.5 million net valuation allowance recorded in the fourth quarter of 2014 and included tax benefits from the reinstatement of the U.S. R&E tax credit of approximately $1.8 million.
The change in our effective tax rate for fiscal 2014 compared to fiscal 2013 was driven by a $19.5 million net valuation allowance recorded in the fourth quarter of 2014, increases in nondeductible share based compensation expense and nondeductible acquisition costs and decreases in our R&E credit. The 2013 tax provision included a discrete benefit of $1.4 million attributable to the 2012 R&E tax credit recorded in the first quarter of 2013.
Liquidity and capital resources:
At December 31, 2015, we had $161.8 million of unrestricted cash and cash equivalents and $124.7 million of working capital as compared to $161.0 million of cash and cash equivalents and $151.9 million of working capital at December 31, 2014. In addition, we had $2.5 million of short-term investments as of December 31, 2015 and no short-term investments as of December 31, 2014.
Our principal sources of liquidity are our cash and cash equivalents, short-term investments, cash flows generated from operations and potential borrowings under our $50 million secured Credit Agreement with Wells Fargo Bank, N.A. (Revolver). To supplement our overall liquidity position, during the quarter ended December 31, 2014, we issued the Senior Notes. Our material drivers or variants of operating cash flow are net income, noncash expenses (principally share based compensation, intangible amortization and amortization of debt discount and issuance costs) and the timing of periodic invoicing and cash collections related to licenses, subscriptions and support for our software and related services. The primary source of operating cash flows is cash receipts from our customers. Our operating cash flows are also impacted by the timing of payments to our vendors and the payments of our other liabilities. We generally pay our vendors in accordance with the invoice terms and conditions.
We believe our existing cash, cash equivalents and short-term investments balances, including funds provided by the issuance of our Senior Notes, funds available under our Revolver and our current estimates of future operating cash flows, will provide adequate liquidity and capital resources to meet our operational requirements, anticipated capital expenditures and coupon payments for our Senior Notes for the next twelve months. Our future working capital requirements will depend on many factors, including the operations of our existing business, potential growth of our SaaS and cloud-based service solutions, future acquisitions
39
we might undertake, and expansion into complementary businesses. If such need arises, we may raise additional funds through equity or debt financings.
The following table presents key components of our Consolidated Statements of Cash Flows for the years ended December 31, 2015, 2014 and 2013:
For the Year Ended December 31, | |||||||||||
(Dollars in thousands) | 2015 | 2014 | 2013 | ||||||||
Net cash provided by operating activities | $ | 15,532 | $ | 1,754 | $ | 16,971 | |||||
Net cash (used in) provided by investing activities | (9,424 | ) | 7,866 | (58,766 | ) | ||||||
Net cash (used in) provided by financing activities | (5,554 | ) | 106,305 | 2,925 | |||||||
Cash and cash equivalents (beginning of period) | 161,019 | 44,688 | 83,558 | ||||||||
Cash and cash equivalents (end of period) | $ | 161,770 | $ | 161,019 | $ | 44,688 | |||||
Net cash provided by operating activities
Net cash provided by operating activities for the year ended December 31, 2015 was $15.5 million, compared to $1.8 million for the year ended December 31, 2014. Net cash provided by operating activities for the year ended December 31, 2015 was primarily comprised of cash provided from net changes in working capital, including a $32.3 million decrease in accounts receivable due to lower revenue levels and higher collections, partially offset by our $65.8 million net loss and the net effect of non-cash items, including $27.9 million of share-based compensation, $10.4 million of depreciation and amortization, $6.0 million of amortization of debt discount and $2.9 million impairment of internal-use software. The $13.8 million increase in net cash from December 31, 2014 was primarily due to the net impact of working capital changes, mainly driven by a decrease in accounts receivable.
Net cash provided by operating activities for the year ended December 31, 2014 was $1.8 million, primarily comprised of our net loss of $37.6 million, non-cash items including $22.7 million of share based compensation, $10.4 million of depreciation and amortization, $12.6 million of deferred taxes and $4.0 million impairment of internal-use software, partially offset by a $10.5 million use of cash from changes in our working capital. The use of cash from changes in our working capital was principally due to a $14.0 million increase in accounts receivable as a result of higher revenue levels.
Net cash provided by operating activities for the year ended December 31, 2013 was $17.0 million, primarily comprised of our net income prior to non-cash expenses such as depreciation and share based compensation, partially offset by net impact of working capital changes principally due to an increase in accounts receivable due to higher revenue levels.
Net cash (used in) provided by investing activities
Net cash used in investing activities for the year ended December 31, 2015 was $9.4 million compared to net cash provided by investing activities of $7.9 million for the year ended December 31, 2014. Net cash used for investing activities for the year ended December 31, 2015 was primarily comprised of the purchases of property and equipment and the purchases of short-term investments. The $17.3 million increase in the use of cash from December 31, 2014 was principally due to restricted cash related to the Cameleon Software SA acquisition provided during the year ended December 31, 2014, offset by the net purchases of $2.5 million short-term investments during the year ended December 31, 2015.
Net cash provided by investing activities for the year ended December 31, 2014 was $7.9 million. During the year, $39.7 million of previously restricted cash became unrestricted and $22.0 million was used in acquiring Cameleon Software SA. In addition, we purchased $7.5 million of purchases in property and equipment and incurred $2.3 million in capitalized internal-use software development costs on our cloud-based service solutions.
Net cash used from investing activities for the year ended December 31, 2013 was $58.8 million, primarily comprised of $39.4 million of restricted cash for the planned Cameleon Software SA acquisition, $13.1 million (net of cash acquired) for the acquisition of SignalDemand in December 2013, $3.4 million of purchases of property and equipment and $2.9 million in capitalized internal-use software development costs on our cloud-based service solutions.
Net cash (used in) provided by financing activities
Net cash used in financing activities for the year ended December 31, 2015 was $5.6 million compared to net cash provided by financing activities of $106.3 million for the year ended December 31, 2014. Net cash used for financing activities for the year ended December 31, 2015 was primarily comprised of $5.1 million of tax withholding related to share settlement of
40
vested employee share-based awards and $1.3 million of contingent consideration paid that was related to the Cameleon Software SA acquisition.
Net cash provided by financing activities for the year ended December 31, 2014 was $106.3 million, primarily comprised of $138.6 million of proceeds from the issuance of convertible debt, $17.1 million of proceeds from issuance of warrants, partially offset by a $29.4 million purchase of a convertible note hedge and $13.1 million of tax withholding related to share settlement of vested employee share-based awards. In addition, we incurred $6.1 million to the increase in the ownership in Cameleon Software SA after we established control.
Net cash provided by financing activities for the year ended December 31, 2013 consisted of proceeds from stock option exercises of $3.3 million and excess tax benefits from stock based compensation of $2.9 million, partially offset by tax withholding related to share settlement of vestings of employee share-based awards of $3.3 million.
Stock repurchases
In August 2008, we announced that our Board of Directors authorized a stock repurchase program for the purchase of up to $15.0 million of our common stock. No shares were repurchased during the years ended December 31, 2015, 2014 and 2013, respectively. At December 31, 2015, $10.0 million remained available in the stock repurchase program. The repurchase of stock, if continued, will be funded primarily with existing cash balances. The timing of any repurchases will depend upon various factors including, but not limited to, market conditions, the market price of our common stock and management’s assessment of our liquidity and cash flow needs. For additional information on the stock repurchase program see "Market for Registrant’s Common Equity, Related Stockholder Matters and Issuer Purchases of Equity Securities."
Contractual obligations
The following table sets forth our contractual obligations as of December 31, 2015:
Payment due by period | |||||||||||||||||||
(Dollars in thousands) | Total | Less than 1 year | 1 to 3 years | 3 to 5 years | more than 5 years | ||||||||||||||
Convertible debt, including interest | 155,250 | 2,875 | 5,750 | 146,625 | — | ||||||||||||||
Operating leases | 5,354 | 2,804 | 1,601 | 949 | — | ||||||||||||||
Total contractual obligations | $ | 160,604 | $ | 5,679 | $ | 7,351 | $ | 147,574 | $ | — | |||||||||
Operating Leases
In June 2012, we entered into a fourth amendment to our corporate office lease in Houston, TX (the "Lease Amendment"). The Lease Amendment, among other things, provides for an increase in the square footage of our corporate office to 90,389, and provided an option to an additional 7,411 square feet. The term of this lease runs until September 30, 2016. The lease has two options to extend the total term of the lease for an additional 72 months, and provided for an early termination at any time after July 31, 2013. In addition, we lease approximately 14,380 square feet of office space in Toulouse, France, which expires February 24, 2018, 9,666 square feet of office space in Skokie, Illinois, which expires February 28, 2018 with an option to extend the term of the lease for an additional 5 years, and approximately 6,600 square feet in San Francisco, California, which expired at the end of 2015 and was renewed through December 2020 with an option to terminate in 2018. We also lease approximately 3,100 square feet in London, United Kingdom, and 3,300 square feet in Austin, Texas. These leases expire in August 2022, with an option to terminate in August 2017, and September 2016, respectively.
Credit Facility
In July 2012, we, through our wholly owned operating subsidiary, PROS, Inc., entered into the $50 million Revolver with Wells Fargo which matures in July 2017. In connection with the issuance of the Senior Notes, PROS, Inc. amended the Revolver in December 2014 to among, other things, allow for our issuance of the Senior Notes and the associated convertible note hedge and warrant.
Outstanding borrowings under the Revolver bear interest, at the end of the applicable one month, three month or six month interest period, at a rate per annum equal to LIBOR plus an applicable margin of 1.50% to 2.25% or the Federal Funds Rate plus an applicable margin of 1.50% to 2.25%. Borrowings under the Revolver are collateralized by a first priority interest in and lien on all of our material assets.
41
The Revolver contains affirmative and negative covenants, including covenants which restrict our ability to, among other things, create liens, incur additional indebtedness and engage in certain other transactions, in each case subject to certain exclusions. In addition, the Revolver contains certain financial covenants which become effective in the event our availability under the Revolver plus cash and cash equivalents falls below $20.0 million or upon the occurrence of an event of default. As of December 31, 2015, we are in compliance with all financial covenants under the Revolver.
Debt interest expense of $0.2 million was incurred during each of the years ended December 31, 2015, 2014 and 2013, respectively.
There were no outstanding borrowings under the Revolver as of December 31, 2015.
Off-balance sheet arrangements
We do not have any relationships with unconsolidated entities or financial partnerships, such as variable interest entities, which would have been established for the purpose of facilitating off-balance sheet arrangements or other contractually narrow or limited purposes.
Critical accounting policies and estimates
We make estimates and assumptions in the preparation of our Consolidated Financial Statements, and our estimates and assumptions may affect the reported amounts of assets and liabilities and the disclosure of contingent assets and liabilities at the date of the Consolidated Financial Statements, and the reported amounts of revenue and expenses during the reporting periods. Actual results could differ from those estimates. The complexity and judgment of our estimation process and issues related to the assumptions, risks and uncertainties inherent in the application of the percentage-of-completion method of accounting could affect the amounts of revenue, expenses, unbilled receivables and deferred revenue. Estimates are also used for, but not limited to, receivables, allowance for doubtful accounts, useful lives of assets, depreciation, income taxes and deferred tax asset valuation, valuation of stock options, other current liabilities and accrued liabilities. Numerous internal and external factors can affect estimates. Our management has reviewed these critical accounting policies, our use of estimates and the related disclosures with our Audit Committee.
We believe the critical accounting policies listed below affect significant judgment and estimates used in the preparation of our Consolidated Financial Statements.
Revenue recognition
Our revenue is derived from the licensing and implementation of software solutions, associated software maintenance and support, subscription-based solutions such as SaaS and cloud-based solutions and professional services. Our arrangements with customers typically include some, but not all, of the following: (a) license fees for the use of our solutions either in perpetuity or over a specified term, (b) subscription fees for our SaaS and cloud-based services (c) professional service fees for configuration, implementation and training services, and (d) maintenance and support fees related to technical support and software updates. If there is significant uncertainty about contract completion or collectability is not reasonably assured, revenue is deferred until the uncertainty is sufficiently resolved or collectability is reasonably assured. In addition, revenue is recognized when persuasive evidence of an arrangement exists, delivery has occurred and fees are considered fixed and determinable. Determining when these criteria have been satisfied often involves judgments that can have a significant impact on the timing and amount of revenue we report.
In determining whether professional services revenue should be accounted for separately from license revenue, we evaluate whether the professional services are considered essential to the functionality of the software using factors such as: the nature of our software products; whether they are ready for use by the customer upon receipt; the nature of our professional services; the availability of professional services from other vendors; whether the timing of payments for license revenue coincides with performance of services; and whether milestones or acceptance criteria exist that affect the realizability of the software license fee.
License revenue. We derive the majority of our license revenue from the sale of perpetual licenses. For software license arrangements that do not require significant modification or customization of the underlying software, we recognize software licenses revenues upon software delivery the provided professional services are not considered essential to the delivery of the software and when: (1) we enter into a legally binding arrangement with a customer for the license of software; (2) we deliver the products; (3) the sale price is fixed or determinable and free of contingencies or significant uncertainties; and (4) collection is probable. Revenues that are not recognized at the time of sale because the foregoing conditions are not met, are recognized when those conditions are subsequently met.
42
We evaluate the nature and scope of professional services for each arrangement and if we determine that the professional services revenue should not be accounted for separately from license revenue, the license revenue is recognized together with the professional services revenue using the percentage-of-completion method or completed contract method. The completed contract method is also used for contracts where there is a risk over final acceptance by the customer or for contracts that are short-term in nature.
The percentage-of-completion method is measured by the percentage of man-days expended on an implementation during the reporting period as a percentage of the total man-days estimated to be necessary to complete the software implementation. We measure performance under the percentage-of-completion method using the total man-day method based on current estimates of man-days to complete the software implementation. We believe that for each such software implementation, man-days expended in proportion to total estimated man-days at completion represents the most reliable and meaningful measure for determining a software implementation's progress toward completion. In addition, under our fixed-fee software implementation arrangements, should a loss be anticipated on a contract, the full amount of the loss is recorded when the loss is determinable.
Subscription revenue. We also offer subscription-based solutions such as SaaS and cloud-based solutions. Our SaaS and cloud-based solutions generally provide customers access to certain of our software solution within a cloud-based IT environment that we manage and offer to customers on a subscription basis. Revenues for our SaaS and cloud-based solutions are generally recognized ratably over the contract term commencing with the date our service is made available to customers and all other revenue recognition criteria have been satisfied. Any revenue related to up-front activation or set-up fee are deferred and recognized ratably over the estimated period that the customer benefits from the related services. Direct and incremental costs related to up-front activation or set-up activities are capitalized until the date our service is made available and then expensed ratably over the estimated period that the customer benefits from the related services.
Our SaaS and cloud-based solutions allow our customers to deploy PROS solutions without any significant investment in hardware as PROS software is integrated in cloud-based IT environments that are deployed, supported and managed on our customers' behalf. For arrangements that include cloud-based services, we allocate the arrangement consideration between the cloud-based service and other elements and recognize the cloud services fee ratably beginning on the date the customer commences use of our services and continuing through the end of the contractual cloud services term.
We also license software under term license agreements that typically include maintenance and support during the contractual license term. Our term license agreements typically range from two to five years. Revenue and the associated costs are deferred until the delivery of the licensed solution and recognized ratably over the remaining contractual license term.
Service revenue. We also provide software-related professional services, including implementation and configuration services, consulting and training. Professional services are generally provided under time and materials contracts and revenues are recognized as the services are provided. However, if we enter into arrangements with a fixed-fee, professional services revenue are recognized based upon a proportionate performance method. When we enter into arrangements where professional services are considered essential to the functionality of the software, professional services revenue is recognized based upon the percentage of completion method. Under this method, revenue is recognized based upon labor hours incurred as the percentage of total estimated labor hours to complete the project. Revenues for professional services that are bundled with license fees are recognized as the services are performed. We also recognize revenue associated with billable expenses when the expenses are incurred.
For SaaS or cloud-based arrangements that include professional services, we determine whether the professional services have stand-alone value. If we determine that the professional services do not have stand-alone value, we treat the transaction as a single element and the professional services revenue is deferred until the customer commences use of the SaaS or cloud based service and the professional services revenue is recognized over the remaining term of the arrangement.
Maintenance and support revenue. We generate maintenance and support revenue from the sale of maintenance and support services on our software solutions. The vast majority of our software license arrangements include software license updates and product support contracts, generally ranging from one to two years. Software license updates provide customers with rights to unspecified software updates and enhancements on a when and if available basis, maintenance releases and patches are released during the term of the support period. Software license updates and product support contracts are generally priced as a percentage of the software licenses fees. Substantially all of our customers renew their software license updates and product support contracts annually.
Our customer arrangements typically contain multiple elements that include software license, implementation services, and post-implementation maintenance and support. For multiple element arrangements involving our nonsoftware services, we (1) determine whether and when each element has been delivered, (2) determine the fair value of each element using the selling price hierarchy of vendor specific objective evidence ("VSOE") of fair value, third party evidence (“TPE”), or best estimated selling price ("BESP"), as applicable, and (3) allocate the total price among the various elements based on the selling price method.
43
We apply the residual method to recognize revenue for the delivered elements in stand-alone software transactions. Under the residual method, the amount of revenue allocated to delivered elements equals the total arrangement consideration, less the aggregate fair value of any undelivered elements, typically maintenance, provided that VSOE of fair value exists for all undelivered elements. VSOE of fair value is based on the price charged when the element is sold separately or, in the case of maintenance, substantive renewal rates for maintenance.
For multiple-element arrangements that include software and nonsoftware elements such as our cloud-based service solutions, we allocate revenue between the software and software-related elements as a group and any nonsoftware elements based on a relative fair value allocation. We determine fair value for each deliverable using this hierarchy and utilize VSOE of fair value if it exists.
In certain instances, we may not be able to establish VSOE for all deliverables in an arrangement with multiple elements. This may be due to our limited experience selling each element separately, not pricing solutions or services within a narrow range, or only having a limited sales history. In addition, TPE may not be available. When we are unable to establish selling prices using VSOE or TPE, we use BESP in the allocation of arrangement consideration. The objective of BESP is to determine the price at which we would transact a sale if the product or service were sold on a stand-alone basis. For transactions that only include software and software-related elements, we continue to account for such arrangements under the software revenue recognition standards which require it to establish VSOE of fair value to allocate arrangement consideration among multiple deliverables.
Revenue that has been recognized, but for which we have not invoiced the customer, is recorded as unbilled accounts receivables. Invoices that have been issued before revenue has been recognized are recorded as deferred revenue in the accompanying consolidated balance sheets.
Allowance for doubtful accounts
In addition to our initial credit evaluations at the inception of arrangements, we regularly assess our ability to collect outstanding customer invoices. To do so, we make estimates of the collectability of accounts receivable. We provide an allowance for doubtful accounts when we determine that the collection of an outstanding customer receivable is not probable. We also analyze accounts receivable and historical bad debt experience, customer creditworthiness, changes in customer payment history and industry concentration on an aggregate basis when evaluating the adequacy of the allowance for doubtful accounts. If any of these factors change, our estimates may also change, which could affect the level of our future provision for doubtful accounts.
Noncash share based compensation
We have two noncash share based compensation plans, the 1999 equity incentive plan and the 2007 equity incentive plan, which authorize the discretionary granting of various types of stock awards to key employees, officers, directors and consultants. Our 1999 equity incentive plan was terminated in March 2007 for purposes of granting any future equity awards. Our 2007 equity incentive plan was adopted in March 2007. We may provide noncash share based compensation through the grant of: (i) restricted stock awards; (ii) restricted stock unit awards ("RSUs"); (iii) stock options; (iv) stock appreciation rights ("SARs"); (v) phantom stock; and (vi) performance awards. In February 2014, we granted inducement awards in an aggregate amount of up to 308,250 shares in accordance with NYSE Rule 303A.08. These inducement awards were in the form of RSUs and market stock units ("MSUs") granted to our recently appointed Chief Operating Officer and RSUs granted to certain new employees in connection with our acquisitions of Cameleon Software, SA and SignalDemand, Inc.
As of December 31, 2015, we have granted stock options, RSUs, SARs and MSUs. RSUs granted include both time-based awards, as well as performance-based awards in which the number of shares that vest are based upon the revenue expected to be earned by us from binding customer agreements for our configure-price-quote ("CPQ") solutions related to the Cameleon Software SA acquisition.
Noncash share based compensation expense is measured at the grant date based on the fair value of the award and is recognized as expense on a straight-line basis over the requisite service period, which is generally the vesting period.
The fair value of the restricted stock units is based on the closing price of our stock on the date of grant. We estimate the fair value of stock options and SARs, using the Black-Scholes option pricing model, which requires us to use significant judgment to make estimates regarding the expected life of the award, volatility of our stock price, the risk-free interest rate and the dividend yield of our stock over the life of the award. The expected life of the award is a historical weighted average of the expected lives of similar securities of comparable public companies. We estimate volatility using our historical volatility. The risk-free interest rate assumption is based on observed interest rates appropriate for the terms of our awards. The dividend yield assumption is based on our expectation of paying no dividends.
44
As we issue stock options and SARs, we evaluate the assumptions used to value our stock option awards and SARs. If factors change and we employ different assumptions, noncash share based compensation expense may differ significantly from what we have recorded in the past. If there are any modifications or cancellations of the underlying unvested securities, we may be required to accelerate, increase or cancel any remaining unearned noncash share based compensation expense. Future noncash share based compensation expense and unearned noncash share based compensation will increase to the extent that we grant additional equity awards to employees.
We estimate the number of awards that will be forfeited and recognize expense only for those awards that ultimately are expected to vest. Significant judgment is required in determining the adjustment to noncash share based compensation expense for estimated forfeitures. Noncash share based compensation expense in a period could be impacted, favorably or unfavorably, by differences between forfeiture estimates and actual forfeitures.
The MSUs are performance-based awards that cliff vest based on our shareholder return relative to the total shareholder return of the Russell 2000 Index ("Index") over the three year periods ending December 31, 2015, December 31, 2016, December 31, 2017 and March 2, 2018 ("Performance Period"), respectively. The MSUs vest on January 1, 2016, January 1, 2017, January 1, 2018 and March 3, 2018, respectively. The maximum number of shares issuable upon vesting is 200% of the MSUs initially granted based on the average price of our common stock relative to the Index during the Performance Period. We estimate the fair value of MSUs on the date of grant using a Monte Carlo simulation model. The determination of fair value of the MSUs is affected by our stock price and a number of assumptions including the expected volatilities of our stock and the Index, the risk-free interest rate and expected dividends. Our expected volatility at the date of grant was based on the historical volatilities of our stock and the Index over the Performance Period.
We record deferred tax assets for stock based compensation awards that will result in future deductions on our income tax returns, based on the amount of stock based compensation recognized at the statutory tax rate in the jurisdiction in which we will receive a tax deduction. Because the deferred tax assets we record are based upon the stock based compensation expenses in a particular jurisdiction, the aforementioned inputs that affect the fair values of our stock awards may also indirectly affect our income tax expense. In addition, differences between the deferred tax assets recognized for financial reporting purposes and the actual tax deduction reported on our income tax returns are recorded in additional paid-in capital. If the tax deduction is less than the deferred tax asset, the calculated shortfall reduces our pool of excess tax benefits. If the pool of excess tax benefits is reduced to zero, then subsequent shortfalls would increase our income tax expense.
At December 31, 2015, we had $39.3 million of total unrecognized compensation costs related to noncash share based compensation arrangements for stock options, SARs, RSUs and MSUs granted. These costs will be recognized over a weighted-average period of 2.4 years.
Accounting for income taxes
We estimate our income taxes based on the various jurisdictions where we conduct business and we use estimates in determining our provision for income taxes. We estimate separately our deferred tax assets, related valuation allowances, current tax liabilities and deferred tax liabilities. The calculation of our tax liabilities involves dealing with uncertainties in the application of complex tax rules and the potential for future adjustment of our uncertain tax positions by the United States Internal Revenue Service or other taxing jurisdictions. We estimate our current tax liability and assess temporary differences that result from differing treatments of certain items for tax and accounting purposes. These differences result in deferred tax assets and liabilities, which we show on our balance sheet. At December 31, 2015, our deferred tax assets consisted primarily of temporary differences related to noncash share based compensation, R&E tax credit carryforwards and net operating losses.
We review the realizability of our deferred tax asset on a quarterly basis, or whenever events or changes in circumstances indicate that a review is required. In determining the requirement for a valuation allowance, the historical and projected financial results of the legal entity or consolidated group recording the net deferred tax asset are considered, along with any other positive or negative evidence. Since future financial results may differ from previous estimates, periodic adjustments to our valuation allowances may be necessary. In the fourth quarter of fiscal 2014, we performed an analysis related to the realizability of our worldwide deferred tax assets. As a result, and after considering tax planning initiatives and other positive and negative evidence, we determined that it was more likely than not that our deferred tax assets would not be realized. Therefore, we recorded a $19.5 million net valuation allowance as income tax expense in the year ended December 31, 2014. In performing similar analysis throughout 2015, there was not sufficient positive evidence to outweigh the current and historic negative evidence to determine that it was more likely than not that our deferred tax assets would not be realized. Therefore, we continue to have a valuation allowance against net deferred tax assets as of December 31, 2015.
45
We account for uncertain income tax positions recognized in our financial statements in accordance with the Income Tax Topic of the Accounting Standards Codification ("ASC"), issued by the FASB. This interpretation requires companies to use a prescribed model for assessing the financial recognition and measurement of all tax positions taken or expected to be taken in its tax returns. This guidance provides clarification on recognition, classification, interest and penalties, accounting in interim periods, disclosures and transition. Please see Note 12 to the Consolidated Financial Statements for more information.
Business combinations
We record tangible and intangible assets acquired and liabilities assumed in business combinations under the purchase method of accounting. Amounts paid for each acquisition are allocated to the assets acquired and liabilities assumed based on their fair values at the date of acquisition. We then allocate the purchase price in excess of net tangible assets acquired to identifiable intangible assets based on detailed valuations that use information and assumptions provided by management. We allocate any excess purchase price over the fair value of the net tangible and intangible assets acquired and liabilities assumed to goodwill. If the fair value of the assets acquired exceeds our purchase price, the excess is recognized as a gain.
Significant management judgments and assumptions are required in determining the fair value of acquired assets and liabilities, particularly acquired intangible assets. The valuation of purchased intangible assets is based upon estimates of the future performance and cash flows from the acquired business. Each asset is measured at fair value from the perspective of a market participant.
If different assumptions are used, it could materially impact the purchase price allocation and adversely affect our results of operations, financial condition and cash flows.
Intangible assets, goodwill and long-lived assets
When we acquire a business, a portion of the purchase consideration is typically allocated to acquired technology and other identifiable intangible assets, such as customer relationships. The excess of the purchase consideration over the net of the acquisition-date fair value of identifiable assets acquired and liabilities assumed is recorded as goodwill. We estimate fair value primarily utilizing the market approach, which calculates fair value based on the market values of comparable companies or comparable transactions. The amounts allocated to acquired technology and other intangible assets represent our estimates of their fair values at the acquisition date. We amortize our intangible assets that have finite lives using either the straight-line method or, if reliably determinable, the pattern in which the economic benefit of the asset is expected to be consumed utilizing expected undiscounted future cash flows. Amortization is recorded over the estimated useful lives ranging from two to eight years.
We review our intangible assets subject to amortization to determine if any adverse conditions exist or a change in circumstances has occurred that would indicate impairment or a change in the remaining useful life. If the carrying value of an asset exceeds its undiscounted cash flows, we will write down the carrying value of the intangible asset to its fair value in the period identified. In assessing recoverability, we must make assumptions regarding estimated future cash flows and discount rates. If these estimates or related assumptions change in the future, we may be required to record impairment charges. If the estimate of an intangible asset’s remaining useful life is changed, we will amortize the remaining carrying value of the intangible asset prospectively over the revised remaining useful life.
We assess goodwill for impairment as of November 30 of each fiscal year, or more frequently if events or changes in circumstances indicate that the fair value of our reporting unit has been reduced below its carrying value. When conducting our annual goodwill impairment assessment, we use a three step process. The first step is to perform an optional qualitative evaluation as to whether it is more likely than not that the fair value of our reporting unit is less than its carrying value, using an assessment of relevant events and circumstances. In performing this assessment, we are required to make assumptions and judgments including but not limited to an evaluation of macroeconomic conditions as they relate to our business, industry and market trends, as well as the overall future financial performance of our reporting unit and future opportunities in the markets in which it operates. If we determine that it is not more likely than not that the fair value of our reporting unit is less than its carrying value, we are not required to perform any additional tests in assessing goodwill for impairment. However, if we conclude otherwise or elect not to perform the qualitative assessment, we perform a second step for our reporting unit, consisting of a quantitative assessment of goodwill impairment. This quantitative assessment requires us to estimate the fair value of our reporting unit and compare the estimated fair value to its respective carrying value (including goodwill) as of the date of the impairment test. The third step, employed for our reporting unit if it fails the second step, is used to measure the amount of any potential impairment and compares the implied fair value of our reporting unit with the carrying amount of goodwill.
46
Recent accounting pronouncements
See "Note 2 - Summary of Significant Accounting Policies" to the Consolidated Financial Statements included in this report, regarding the impact of certain recent accounting pronouncements on our Consolidated Financial Statements.
Item 7A. Quantitative and qualitative disclosures about market risk
Foreign Currency Exchange Risk
Our contracts are predominately denominated in U.S. dollars; however, we have contracts denominated in foreign currencies and therefore a portion of our revenue is subject to foreign currency risks. The primary market risk we face is from foreign currency exchange rate fluctuations. Our cash flows are subject to fluctuations due to changes in foreign currency exchange rates. The effect of an immediate 10% adverse change in exchange rates on foreign denominated receivables as of December 31, 2015, would have resulted in a $0.2 million loss. We are also exposed to foreign currency risk due to our French subsidiary, PROS France SAS. A hypothetical 10% adverse change in the value of the U.S. dollar in relation to the Euro, which is our single most significant foreign currency exposure, would have changed revenue for the year ended December 31, 2015 by approximately $1.2 million. In addition, as of December 31, 2015, we had operating subsidiaries in Australia, Ireland, Canada, the United Kingdom and Germany. Due to the relative low volume of payments made by us through these foreign subsidiaries, we do not believe we have significant exposure to foreign currency exchange risks, however, fluctuations in currency exchange rates could harm our results of operations in the future.
We currently do not use derivative financial instruments to mitigate foreign currency exchange risks. We continue to review this issue and may consider hedging certain foreign exchange risks through the use of currency futures or options in future years.
Exposure to Interest Rates
Our exposure to market risk for changes in interest rates relates to the variable interest rate on borrowings under our Revolver. As of December 31, 2015, we had no borrowings under the Revolver.
As of December 31, 2015, we had $143.8 million principal amount of Senior Notes outstanding which are fixed rate instruments. Therefore, our results of operations are not subject to fluctuations in interest rates.
Item 8. Financial statements and supplementary data
The consolidated financial statements required to be filed are indexed on page F-1 and are incorporated herein by reference. See Item 15(a)(1) and (2).
Item 9. Changes in and disagreements with accountants on accounting and financial disclosure
None.
Item 9A. Controls and procedures
Evaluation of Disclosure Controls and Procedures
As of the end of the period covered by this report, we carried out an evaluation, under the supervision and with the participation of our management, including our Chief Executive Officer and Chief Financial Officer, of the effectiveness of our disclosure controls and procedures as defined in Rules 13a-15(e) and 15d-15(e) under the Exchange Act. Based on that evaluation as of the period covered by this Annual Report on Form 10-K, our Chief Executive Officer and Chief Financial Officer have concluded that our disclosure controls and procedures were effective to ensure that information we are required to disclose in reports that we file or submit under the Exchange Act (i) is recorded, processed, summarized and reported within the time periods specified in SEC rules and forms, and (ii) is accumulated and communicated to our management, including our Chief Executive Officer and our Chief Financial Officer, as appropriate to allow timely decisions regarding required disclosure.
Changes in Internal Control over Financial Reporting
There have been no changes in our internal control over financial reporting that occurred during most recent fiscal quarter that materially affected, or are reasonably likely to materially affect, our internal control over financial reporting.
47
Management’s Report on Internal Control over Financial Reporting
Our management is responsible for establishing and maintaining adequate internal control over financial reporting (as defined in Rules 13a-15(f) and 15d-15(f) under the Exchange Act). Internal control over financial reporting is a process designed to provide reasonable assurance regarding the reliability of financial reporting and the preparation of financial statements for external purposes in accordance with GAAP. Our internal control over financial reporting is a framework that includes policies and procedures that: (i) pertain to the maintenance of records that, in reasonable detail, accurately and fairly reflect the transactions and dispositions of our assets; (ii) provide reasonable assurance that transactions are recorded as necessary to permit preparation of financial statements in accordance with GAAP, and that our receipts and expenditures are being made only in accordance with authorizations of our management and directors; and (iii) provide reasonable assurance regarding prevention or timely detection of unauthorized acquisition, use, or disposition of our assets that could have a material effect on the financial statements.
Our management, with the participation of our Chief Executive Officer and Chief Financial Officer, has assessed the effectiveness of our internal control over financial reporting as of December 31, 2015, based on the criteria in Internal Control — Integrated Framework (2013) issued by COSO. Based on this evaluation, management concluded that our internal control over financial reporting was effective as of December 31, 2015 based upon the COSO criteria.
The effectiveness of our internal control over financial reporting as of December 31, 2015 has been audited by PricewaterhouseCoopers LLP, an independent registered public accounting firm, as stated in their report, which is included herein.
Item 9B. Other information
None.
48
Part III
Item 10. Directors, executive officers and corporate governance
The information required by this item is incorporated by reference from our proxy statement in connection with our 2016 Annual Meeting of Stockholders, which proxy statement will be filed with the SEC not later than 120 days after the close of our fiscal year ended December 31, 2015.
Item 11. Executive compensation
The information required by this item is incorporated by reference from our proxy statement in connection with our 2016 Annual Meeting of Stockholders, which proxy statement will be filed with the SEC not later than 120 days after the close of our fiscal year ended December 31, 2015.
Item 12. Security ownership of certain beneficial owners and management and related stockholder matters
The information required by this item is incorporated by reference from our proxy statement in connection with our 2016 Annual Meeting of Stockholders, which proxy statement will be filed with the SEC not later than 120 days after the close of our fiscal year ended December 31, 2015.
Item 13. Certain relationships, related transactions and director independence
The information required by this item is incorporated by reference from our proxy statement in connection with our 2016 Annual Meeting of Stockholders, which proxy statement will be filed with the SEC not later than 120 days after the close of our fiscal year ended December 31, 2015.
Item 14. Principal accountant fees and services
The information required by this item is incorporated by reference from our proxy statement in connection with our 2016 Annual Meeting of Stockholders, which proxy statement will be filed with the SEC not later than 120 days after the close of our fiscal year ended December 31, 2015.
49
Part IV
Item 15. Exhibits and financial statements schedules
(a)(1) Financial Statements
Reference is made to the Index to Financial Statements in the section entitled "Financial Statements and Supplementary Data" in Part II, Item 8 of this Annual Report on Form 10-K.
(a)(2) Financial Statement Schedules
Reference is made to Schedule II, Valuation and Qualifying Accounts, as indexed on page F-34.
Schedules not listed above have been omitted because they are not applicable or are not required or the information required to be set forth therein is included in the Consolidated Financial Statements or Notes thereto.
(a)(3) Exhibits
Exhibits are as set forth in the section entitled "Exhibit Index" which follows the section entitled "Signatures" in this Annual Report on Form 10-K. Exhibits which are incorporated herein by reference can be inspected and copied at the public reference rooms maintained by the SEC in Washington, D.C., New York, New York, and Chicago, Illinois, and are also available to the public from commercial document retrieval services and at the website maintained by the SEC at http://www.sec.gov.
50
Signatures
Pursuant to the requirements of Section 13 or 15(d) of the Exchange Act, the Registrant has duly caused this report to be signed on its behalf by the undersigned, thereunto duly authorized, on February 19, 2016.
PROS Holdings Inc. | ||
By: | /s/ Andres Reiner | |
Andres Reiner | ||
President and Chief Executive Officer | ||
KNOW BY THESE PRESENT, that each person whose signature appears below constitutes and appoints each of Andres Reiner and Stefan Schulz, his attorney-in-fact, with the power of substitution, for him in any and all capacities, to sign any amendments to this report on Form 10-K and to file the same, with exhibits thereto and other documents in connection therewith, with the Securities and Exchange Commission, hereby ratifying and confirming all that each of the attorney-in-fact, or his substitute or substitutes, may do or cause to be done by virtue hereof.
Pursuant to the requirement of the Securities and Exchange Act of 1934, this report has been signed below by the following persons on behalf of the Registrant and in the capacities and on the dates indicated.
Signatures | Title | Date | ||
/s/ Andres Reiner | President, Chief Executive Officer, and Director (Principal Executive Officer) | February 19, 2016 | ||
Andres Reiner | ||||
/s/ Stefan Schulz | Executive Vice President and Chief Financial Officer (Principal Accounting Officer) | February 19, 2016 | ||
Stefan Schulz | ||||
/s/ William Russell | Chairman of the Board | February 19, 2016 | ||
William Russell | ||||
/s/ Ellen Keszler | Director | February 19, 2016 | ||
Ellen Keszler | ||||
/s/ Greg B. Petersen | Director | February 19, 2016 | ||
Greg B. Petersen | ||||
/s/ Leslie J. Rechan | Director | February 19, 2016 | ||
Leslie J. Rechan | ||||
/s/ Timothy V. Williams | Director | February 19, 2016 | ||
Timothy V. Williams | ||||
/s/ Mariette M. Woestemeyer | Director | February 19, 2016 | ||
Mariette M. Woestemeyer | ||||
/s/ Ronald F. Woestemeyer | Director | February 19, 2016 | ||
Ronald Woestemeyer | ||||
51
PROS Holdings, Inc.
Index to the Consolidated Financial Statements
Page | |
F-1
Report of Independent Registered Public Accounting Firm
To the Board of Directors and Stockholders of PROS Holdings, Inc.:
In our opinion, the consolidated financial statements listed in the accompanying index present fairly, in all material respects, the financial position of PROS Holdings, Inc. and its subsidiaries at December 31, 2015 and December 31, 2014, and the results of their operations and their cash flows for each of the three years in the period ended December 31, 2015 in conformity with accounting principles generally accepted in the United States of America. In addition, in our opinion, the financial statement schedule listed in the accompanying index presents fairly, in all material respects, the information set forth therein when read in conjunction with the related consolidated financial statements. Also in our opinion, the Company maintained, in all material respects, effective internal control over financial reporting as of December 31, 2015, based on criteria established in Internal Control - Integrated Framework (2013) issued by the Committee of Sponsoring Organizations of the Treadway Commission (COSO). The Company's management is responsible for these financial statements and the financial statement schedule, for maintaining effective internal control over financial reporting and for its assessment of the effectiveness of internal control over financial reporting, included in Management’s Report on Internal Control over Financial Reporting appearing under Item 9A. Our responsibility is to express opinions on these financial statements, on the financial statement schedule, and on the Company's internal control over financial reporting based on our integrated audits. We conducted our audits in accordance with the standards of the Public Company Accounting Oversight Board (United States). Those standards require that we plan and perform the audits to obtain reasonable assurance about whether the financial statements are free of material misstatement and whether effective internal control over financial reporting was maintained in all material respects. Our audits of the financial statements included examining, on a test basis, evidence supporting the amounts and disclosures in the financial statements, assessing the accounting principles used and significant estimates made by management, and evaluating the overall financial statement presentation. Our audit of internal control over financial reporting included obtaining an understanding of internal control over financial reporting, assessing the risk that a material weakness exists, and testing and evaluating the design and operating effectiveness of internal control based on the assessed risk. Our audits also included performing such other procedures as we considered necessary in the circumstances. We believe that our audits provide a reasonable basis for our opinions.
A company’s internal control over financial reporting is a process designed to provide reasonable assurance regarding the reliability of financial reporting and the preparation of financial statements for external purposes in accordance with generally accepted accounting principles. A company’s internal control over financial reporting includes those policies and procedures that (i) pertain to the maintenance of records that, in reasonable detail, accurately and fairly reflect the transactions and dispositions of the assets of the company; (ii) provide reasonable assurance that transactions are recorded as necessary to permit preparation of financial statements in accordance with generally accepted accounting principles, and that receipts and expenditures of the company are being made only in accordance with authorizations of management and directors of the company; and (iii) provide reasonable assurance regarding prevention or timely detection of unauthorized acquisition, use, or disposition of the company’s assets that could have a material effect on the financial statements.
Because of its inherent limitations, internal control over financial reporting may not prevent or detect misstatements. Also, projections of any evaluation of effectiveness to future periods are subject to the risk that controls may become inadequate because of changes in conditions, or that the degree of compliance with the policies or procedures may deteriorate.
/s/ PricewaterhouseCoopers LLP
San Jose, California
February 19, 2016
F-2
PROS Holdings, Inc.
Consolidated Balance Sheets
(In thousands, except share and per share amounts)
December 31, | |||||||
2015 | 2014 | ||||||
Assets: | |||||||
Current assets: | |||||||
Cash and cash equivalents | $ | 161,770 | $ | 161,019 | |||
Short-term investments | 2,500 | — | |||||
Accounts and unbilled receivables, net of allowance of $586 and $868, respectively | 39,115 | 71,095 | |||||
Prepaid and other current assets | 7,656 | 8,075 | |||||
Restricted cash - current | — | 100 | |||||
Total current assets | 211,041 | 240,289 | |||||
Property and equipment, net | 15,777 | 15,788 | |||||
Intangibles, net | 14,191 | 20,195 | |||||
Goodwill | 20,445 | 21,563 | |||||
Other long-term assets | 2,268 | 2,290 | |||||
Total assets | $ | 263,722 | $ | 300,125 | |||
Liabilities and Stockholders’ Equity: | |||||||
Current liabilities: | |||||||
Accounts payable and other liabilities | $ | 8,273 | $ | 10,564 | |||
Accrued liabilities | 4,333 | 5,355 | |||||
Accrued payroll and other employee benefits | 13,084 | 15,154 | |||||
Deferred revenue | 60,664 | 57,313 | |||||
Total current liabilities | 86,354 | 88,386 | |||||
Long-term deferred revenue | 4,665 | 1,121 | |||||
Convertible debt, net | 116,371 | 110,448 | |||||
Other long-term liabilities | 918 | 1,171 | |||||
Total liabilities | 208,308 | 201,126 | |||||
Commitments and contingencies (Note 15) | |||||||
Stockholders’ equity: | |||||||
Preferred stock, $0.001 par value, 5,000,000 shares authorized none issued | — | — | |||||
Common stock, $0.001 par value, 75,000,000 shares authorized; 34,156,561 and 33,477,810 shares issued, respectively; 29,738,976 and 29,060,225 shares outstanding, respectively | 34 | 34 | |||||
Additional paid-in capital | 158,674 | 134,375 | |||||
Treasury stock, 4,417,585 common shares, at cost | (13,938 | ) | (13,938 | ) | |||
Accumulated deficit | (85,034 | ) | (19,223 | ) | |||
Accumulated other comprehensive loss | (4,322 | ) | (2,249 | ) | |||
Total stockholders’ equity | 55,414 | 98,999 | |||||
Total liabilities and stockholders’ equity | $ | 263,722 | $ | 300,125 | |||
The accompanying notes are an integral part of these consolidated financial statements.
F-3
PROS Holdings, Inc.
Consolidated Statements of Comprehensive Income (Loss)
(In thousands, except per share data)
For the Year Ended December 31, | ||||||||||||
2015 | 2014 | 2013 | ||||||||||
Revenue: | ||||||||||||
License | $ | 32,716 | $ | 58,515 | $ | 41,116 | ||||||
Services | 42,875 | 49,225 | 48,412 | |||||||||
Subscription | 28,989 | 23,468 | 9,221 | |||||||||
Total license, services and subscription | 104,580 | 131,208 | 98,749 | |||||||||
Maintenance and support | 63,666 | 54,621 | 46,088 | |||||||||
Total revenue | 168,246 | 185,829 | 144,837 | |||||||||
Cost of revenue: | ||||||||||||
License | 304 | 243 | 282 | |||||||||
Services | 36,147 | 39,955 | 32,492 | |||||||||
Subscription | 12,786 | 7,334 | 2,122 | |||||||||
Total license, services and subscription | 49,237 | 47,532 | 34,896 | |||||||||
Maintenance and support | 12,173 | 10,554 | 8,239 | |||||||||
Total cost of revenue | 61,410 | 58,086 | 43,135 | |||||||||
Gross profit | 106,836 | 127,743 | 101,702 | |||||||||
Operating expenses: | ||||||||||||
Selling and marketing | 74,146 | 64,528 | 39,478 | |||||||||
General and administrative | 38,517 | 35,389 | 24,046 | |||||||||
Research and development | 46,780 | 43,174 | 32,467 | |||||||||
Acquisition-related | — | 3,019 | 2,173 | |||||||||
Impairment of internal-use software | 2,890 | 4,040 | — | |||||||||
(Loss) Income from operations | (55,497 | ) | (22,407 | ) | 3,538 | |||||||
Convertible debt interest and amortization | (8,914 | ) | (492 | ) | — | |||||||
Other expense, net | (661 | ) | (2,159 | ) | (265 | ) | ||||||
(Loss) Income before income tax provision | (65,072 | ) | (25,058 | ) | 3,273 | |||||||
Income tax provision (benefit) | 739 | 12,493 | (173 | ) | ||||||||
Net (loss) income | (65,811 | ) | (37,551 | ) | 3,446 | |||||||
Net loss attributable to non-controlling interest | — | (907 | ) | — | ||||||||
Net (loss) income attributable to PROS Holdings, Inc. | $ | (65,811 | ) | $ | (36,644 | ) | $ | 3,446 | ||||
Net (loss) earnings per share attributable to PROS Holdings, Inc.: | ||||||||||||
Basic | (2.23 | ) | (1.27 | ) | 0.12 | |||||||
Diluted | (2.23 | ) | (1.27 | ) | 0.11 | |||||||
Weighted average number of shares: | ||||||||||||
Basic | 29,578 | 28,915 | 28,004 | |||||||||
Diluted | 29,578 | 28,915 | 30,114 | |||||||||
Other comprehensive (loss) income, net of tax: | ||||||||||||
Foreign currency translation adjustment | (2,076 | ) | (2,249 | ) | — | |||||||
Unrealized gain on short-term investments | 3 | — | — | |||||||||
Other comprehensive loss, net of tax | (2,073 | ) | (2,249 | ) | — | |||||||
Comprehensive (loss) income | (67,884 | ) | (39,800 | ) | 3,446 | |||||||
Comprehensive loss attributable to non-controlling interest | — | (922 | ) | — | ||||||||
Comprehensive (loss) income attributable to PROS Holdings, Inc. | $ | (67,884 | ) | $ | (38,878 | ) | $ | 3,446 | ||||
The accompanying notes are an integral part of these consolidated financial statements.
F-4
PROS Holdings, Inc. Consolidated Statements of Cash Flows (In thousands) | |||||||||||
Year Ended December 31, | |||||||||||
2015 | 2014 | 2013 | |||||||||
Operating activities: | |||||||||||
Net (loss) income | $ | (65,811 | ) | $ | (37,551 | ) | $ | 3,446 | |||
Adjustments to reconcile net income to net cash provided by operating activities: | |||||||||||
Depreciation and amortization | 10,395 | 10,443 | 4,307 | ||||||||
Amortization of debt discount and issuance costs | 6,039 | 329 | — | ||||||||
Share-based compensation | 27,864 | 22,665 | 16,272 | ||||||||
Excess tax benefits on share-based compensation | — | — | (2,940 | ) | |||||||
Tax (shortfall) benefit from share-based compensation | — | (110 | ) | 2,931 | |||||||
Deferred income tax, net | 165 | 12,638 | (2,776 | ) | |||||||
Provision for doubtful accounts | (282 | ) | (192 | ) | 300 | ||||||
Loss on disposal of assets | 167 | — | — | ||||||||
Impairment of internal-use software | 2,890 | 4,040 | — | ||||||||
Changes in operating assets and liabilities: | |||||||||||
Accounts and unbilled receivables | 32,274 | (14,026 | ) | (7,492 | ) | ||||||
Prepaid expenses and other assets | 229 | (3,383 | ) | 1,204 | |||||||
Accounts payable and other liabilities | (4,049 | ) | (3,104 | ) | 2,885 | ||||||
Accrued liabilities | 800 | (1,080 | ) | 1,002 | |||||||
Accrued payroll and other employee benefits | (2,048 | ) | 3,289 | 1,050 | |||||||
Deferred revenue | 6,899 | 7,796 | (3,218 | ) | |||||||
Net cash provided by operating activities | 15,532 | 1,754 | 16,971 | ||||||||
Investing activities: | |||||||||||
Purchase of property and equipment | (6,794 | ) | (7,499 | ) | (3,401 | ) | |||||
Acquisition of SignalDemand, net of cash acquired | — | — | (13,102 | ) | |||||||
Acquisition of Cameleon Software SA, net of cash acquired | — | (22,048 | ) | — | |||||||
Capitalized internal-use software development costs | (233 | ) | (2,305 | ) | (2,874 | ) | |||||
Change in restricted cash | 100 | 39,718 | (39,389 | ) | |||||||
Purchases in short-term investment | (57,697 | ) | — | — | |||||||
Proceeds from maturities of short-term investments | 55,200 | — | — | ||||||||
Net cash (used in) provided by investing activities | (9,424 | ) | 7,866 | (58,766 | ) | ||||||
Financing activities: | |||||||||||
Exercise of stock options | 706 | 1,105 | 3,327 | ||||||||
Excess tax benefits on share-based compensation | — | — | 2,940 | ||||||||
Proceeds from employee stock plans | 839 | 335 | — | ||||||||
Tax withholding related to net share settlement of restricted stock units | (5,124 | ) | (13,089 | ) | (3,342 | ) | |||||
Increase in PROS' ownership in Cameleon Software SA | — | (6,147 | ) | — | |||||||
Payment of contingent consideration for Cameleon Software SA | (1,304 | ) | (2,225 | ) | — | ||||||
Payments of notes payable | (263 | ) | — | — | |||||||
Proceeds from issuance of convertible debt, net | — | 138,631 | — | ||||||||
Proceeds from issuance of warrants | — | 17,106 | — | ||||||||
Purchase of convertible note hedge | — | (29,411 | ) | — | |||||||
Debt issuance costs related to convertible debt | (408 | ) | — | — | |||||||
Net cash (used in) provided by financing activities | (5,554 | ) | 106,305 | 2,925 | |||||||
F-5
PROS Holdings, Inc. Consolidated Statements of Cash Flows (In thousands) | |||||||||||
Effect of foreign currency rates on cash | 197 | 406 | — | ||||||||
Net increase (decrease) in cash and cash equivalents | 751 | 116,331 | (38,870 | ) | |||||||
Cash and cash equivalents: | |||||||||||
Beginning of period | 161,019 | 44,688 | 83,558 | ||||||||
End of period | $ | 161,770 | $ | 161,019 | $ | 44,688 | |||||
Supplemental disclosure of cash flow information: | |||||||||||
Cash (paid) refund during period for: | |||||||||||
Taxes | $ | (3 | ) | $ | (233 | ) | $ | (278 | ) | ||
Interest | $ | (2,932 | ) | $ | (243 | ) | $ | (87 | ) | ||
Noncash investing activities: | |||||||||||
Purchase of property and equipment accrued but not paid | $ | 2,722 | $ | 1,140 | $ | 2,045 | |||||
The accompanying notes are an integral part of these consolidated financial statements.
F-6
PROS Holdings, Inc.
Consolidated Statements of Stockholders’ Equity
(In thousands, except share data)
Common Stock | Additional Paid-In Capital | Treasury Stock | Accumulated (Deficit) Retained Earnings | Accumulated other comprehensive loss | Total Stockholders’ Equity | ||||||||||||||||||||||||
Shares | Amount | Shares | Amount | ||||||||||||||||||||||||||
Balance at December 31, 2012 | 27,548,847 | $ | 32 | $ | 87,693 | 4,417,585 | $ | (13,938 | ) | $ | 14,882 | $ | — | $ | 88,669 | ||||||||||||||
Exercise of stock options | 354,973 | 1 | 3,326 | — | — | — | — | 3,327 | |||||||||||||||||||||
Restricted stock units net settlement | 284,823 | — | (3,342 | ) | — | — | — | — | (3,342 | ) | |||||||||||||||||||
Tax benefit from share-based compensation | — | — | 2,931 | — | — | — | — | 2,931 | |||||||||||||||||||||
Noncash share based compensation | — | — | 16,272 | — | — | — | — | 16,272 | |||||||||||||||||||||
Net income | — | — | — | — | — | 3,446 | — | 3,446 | |||||||||||||||||||||
Balance at December 31, 2013 | 28,188,643 | $ | 33 | $ | 106,880 | 4,417,585 | $ | (13,938 | ) | $ | 18,328 | $ | — | $ | 111,303 | ||||||||||||||
Exercise of stock options | 214,162 | — | 1,105 | — | — | — | — | 1,105 | |||||||||||||||||||||
Restricted and market stock net settlement | 644,028 | 1 | (13,089 | ) | — | — | — | — | (13,088 | ) | |||||||||||||||||||
Tax (shortfall) benefit from share-based compensation | — | — | (110 | ) | — | — | — | — | (110 | ) | |||||||||||||||||||
Proceeds from employee stock plans | 13,392 | — | 335 | — | — | — | — | 335 | |||||||||||||||||||||
Proceeds from issuance of warrants | — | — | 17,106 | — | — | — | — | 17,106 | |||||||||||||||||||||
Equity component of the Senior Notes issuance, net | — | — | 28,714 | — | — | — | — | 28,714 | |||||||||||||||||||||
Purchase of convertible bond hedge | — | — | (29,411 | ) | — | — | — | — | (29,411 | ) | |||||||||||||||||||
Noncash share based compensation | — | — | 22,845 | — | — | — | — | 22,845 | |||||||||||||||||||||
Other comprehensive loss | — | — | — | — | — | — | (2,249 | ) | (2,249 | ) | |||||||||||||||||||
Net loss | — | — | — | — | — | (37,551 | ) | — | (37,551 | ) | |||||||||||||||||||
Net loss attributable to non-controlling interest | — | — | — | — | — | (907 | ) | — | (907 | ) | |||||||||||||||||||
Cumulative earnings previously allocated to non-controlling interest ("NCI") and re-allocated to Parent's equity | — | — | — | — | — | 907 | — | 907 | |||||||||||||||||||||
Balance at December 31, 2014 | 29,060,225 | $ | 34 | $ | 134,375 | 4,417,585 | $ | (13,938 | ) | $ | (19,223 | ) | $ | (2,249 | ) | $ | 98,999 | ||||||||||||
Exercise of stock options | 220,031 | — | 706 | — | — | — | — | 706 | |||||||||||||||||||||
Restricted and market stock net settlement | 421,115 | — | (5,124 | ) | — | — | — | — | (5,124 | ) | |||||||||||||||||||
Proceeds from employee stock plans | 37,605 | — | 839 | — | — | — | — | 839 | |||||||||||||||||||||
Noncash share based compensation | — | — | 27,878 | — | — | — | — | 27,878 | |||||||||||||||||||||
Other comprehensive loss | — | — | — | — | — | — | (2,073 | ) | (2,073 | ) | |||||||||||||||||||
Net loss | — | — | — | — | — | (65,811 | ) | — | (65,811 | ) | |||||||||||||||||||
Balance at December 31, 2015 | 29,738,976 | $ | 34 | $ | 158,674 | 4,417,585 | $ | (13,938 | ) | $ | (85,034 | ) | $ | (4,322 | ) | $ | 55,414 | ||||||||||||
The accompanying notes are an integral part of these consolidated financial statements.
F-7
PROS Holdings, Inc.
Notes to Consolidated Financial Statements
1. Organization and Nature of Operations
PROS Holdings, Inc., a Delaware corporation, through its operating subsidiaries (collectively, the "Company"), provides enterprise revenue and profit realization software solutions designed to help business-to-business ("B2B") and business-to-consumer ("B2C") companies accelerate sales, formulate winning pricing strategies and align product, demand and availability. The Company's revenue and profit realization solutions are designed to assist customers in growing revenue, supporting sustained profitability and modernizing their business processes. The Company provides its solutions to enterprises across a range of industries, including manufacturing, distribution, services, and travel. The Company offers its solutions via a SaaS delivery model as well as on a perpetual or term license basis. The Company also provides professional services to implement its software applications as well as business consulting. In addition, the Company provides product maintenance and support to its customers through which they receive unspecified upgrades, maintenance releases and bug fixes during the term of the support period on a when-and-if-available basis.
2. Summary of Significant Accounting Policies
Principles of consolidation and basis of presentation
The Consolidated Financial Statements include the accounts of the Company, and its wholly-owned subsidiaries. All significant intercompany transactions and balances have been eliminated in consolidation. The Consolidated Financial Statements of the Company have been prepared in accordance with generally accepted accounting principles in the United States ("GAAP").
Certain reclassifications of previously recorded amounts have been made to conform to the current period presentation, such reclassifications impacted the classification of sales and marketing, and general and administrative expenses, but did not have an impact on the Company's results of operations, cash flows, or financial position.
Dollar amounts
The dollar amounts presented in the tabular data within these footnote disclosures are stated in thousands of dollars, except per share amounts, or as noted within the context of each footnote disclosure.
Use of estimates
The Company’s management makes estimates and assumptions in the preparation of its audited Consolidated Financial Statements in conformity with GAAP. These estimates and assumptions may affect the reported amounts of assets and liabilities, the disclosure of contingent assets and liabilities at the date of the audited Consolidated Financial Statements and the reported amounts of revenue and expense during the reporting periods. Actual results could differ from those estimates. The complexity of the estimation process and issues related to the assumptions, risks and uncertainties inherent in the application of the percentage-of-completion method of revenue recognition affects the amount of revenue, expenses, unbilled receivables and deferred revenue. Numerous internal and external factors can affect estimates. Estimates are also used for, but not limited to, receivables, allowance for doubtful accounts, useful lives of assets, depreciation and amortization, the fair value of assets acquired and liabilities assumed for business combinations, income taxes and deferred tax asset valuation, valuation of stock options, other current liabilities and accrued liabilities.
Cash and cash equivalents
The Company considers all highly liquid investments with an original maturity of three months or less at the time of purchase, or the ability to be settled in cash within a period of three months, to be cash equivalents. The Company has a cash management program that provides for the investment of excess cash balances, primarily in short-term money market instruments.
Short-term investments
The Company's investments are available-for-sale commercial paper and certificates of deposit that are recorded at fair value in the Consolidated Balance Sheets. Unrealized gains and losses on available-for-sale securities are recorded, net of tax, as a component of accumulated other comprehensive income (loss), unless impairment is considered to be other-than-temporary. Other-than-temporary unrealized losses on available-for-sale securities are generally recorded in gain (loss) on investments, net, in the Consolidated Statements of Comprehensive Income (Loss) unless certain criteria are met. The primary factors considered when determining if a charge must be recorded because a decline in the fair value of an investment is other-than-temporary include whether: (i) the fair value of the investment is significantly below the Company's cost basis; (ii) the financial condition of the
F-8
issuer of the security has deteriorated; (iii) if a debt security, it is probable that the Company will be unable to collect all amounts due according to the contractual terms of the security; (iv) the decline in fair value has existed for an extended period of time; (v) if a debt security, such security has been downgraded by a rating agency; and (vi) the Company has the intent and ability to retain the investment for a period of time sufficient to allow for any anticipated recovery in fair value. Investments with remaining maturities of twelve months or less are classified as short-term investments. Investments with remaining maturities of more than twelve months are classified as long-term investments. All of the Company's investments had contractual maturities of less than twelve months as of December 31, 2015.
Financial instruments
The carrying amount of the Company’s financial instruments, which include cash equivalents, short-term investments, receivables and accounts payable, approximates their fair values at December 31, 2015 and 2014. For additional information on the Company’s fair value measurements, see Note 9 to the Consolidated Financial Statements.
Allowance for Doubtful Accounts
The Company maintains an allowance for doubtful accounts which reflects the Company's best estimate of potentially uncollectible receivables. The Company regularly reviews the receivables allowances by considering such factors as historical experience, credit-worthiness, the age of the receivable balances and current economic conditions that may affect a customer’s ability to pay and the Company specifically reserves for those deemed uncollectible.
Prepaid expenses and other assets
Prepaid expenses and other assets consist primarily of short-term deferred tax assets, prepaid income taxes, deferred project costs and prepaid third-party license fees.
Property and equipment, net
Property and equipment are recorded at cost, less accumulated depreciation. Maintenance, repairs and minor replacements are charged to expense as incurred. Significant renewals and betterments are capitalized. Depreciation on property and equipment, with the exception of leasehold improvements, is recorded using the straight-line method over the estimated useful lives of the assets. Depreciation on leasehold improvements is recorded using the shorter of the lease term or useful life. When property is retired or disposed of, the cost and related accumulated depreciation are removed from the accounts and any resulting gains or losses are reflected in the Consolidated Statements of Comprehensive Income in the period of disposal.
Internal-use software
Costs incurred to develop internal-use software during the application development stage are capitalized, stated at cost, and depreciated using the straight-line method over the estimated useful lives of the assets. Application development stage costs generally include salaries and personnel costs and third-party contractor expenses associated with internal-use software development, configuration, coding and testing. Capitalization of such costs begins when the preliminary project stage is complete and ceases at the point in which the project is substantially complete and is ready for its intended purpose. Capitalized internal-use software is included in property and equipment, net in the Consolidated Balance Sheets.
Impairment of long-lived assets
Long-lived assets are reviewed for impairment whenever an event or change in circumstances indicates that the carrying amount of an asset or group of assets may not be recoverable. The impairment review includes comparison of future cash flows expected to be generated by the asset or group of assets with the associated assets’ carrying value. If the carrying value of the asset or group of assets exceeds its expected future cash flows (undiscounted and without interest charges), an impairment loss is recognized to the extent that the carrying amount of the asset exceeds its fair value. During the years ended December 31, 2015 and 2014, the Company recorded a full impairment of $2.9 million and $4.0 million, respectively, related to capitalized internal-use software associated with the expected future cash flows. The Company did not record any impairment charges in the year ended December 31, 2013.
Intangible assets and goodwill
Intangible assets that have finite lives are amortized over their useful lives and are reviewed for impairment whenever events or changes in circumstances indicate that the carrying amount of an asset may not be recoverable. During this review, the Company reevaluates the significant assumptions used in determining the original cost and estimated lives of long-lived assets. Although the assumptions may vary from asset to asset, they generally include operating results, changes in the use of the asset,
F-9
cash flows and other indicators of value. Management then determines whether the remaining useful life continues to be appropriate or whether there has been an impairment of long-lived assets based primarily upon whether expected future undiscounted cash flows are sufficient to support the assets’ recovery. If impairment exists, the Company would adjust the carrying value of the asset to fair value, generally determined by a discounted cash flow analysis.
Goodwill represents the excess of the purchase consideration over the net of the acquisition-date fair value of identifiable assets acquired, including identifiable intangible assets, and liabilities assumed in connection with business combinations. Goodwill is not amortized, but is assessed for impairment as of November 30 of each fiscal year, or more frequently if events or changes in circumstances indicate that the fair value of the Company’s reporting unit has been reduced below its carrying value. When conducting the annual goodwill impairment assessment, a three step process is used. The first step is to perform an optional qualitative evaluation as to whether it is more likely than not that the fair value of the Company’s reporting unit is less than its carrying value, using an assessment of relevant events and circumstances. In performing this assessment, the Company is required to make assumptions and judgments including but not limited to an evaluation of macroeconomic conditions as they relate to the business, industry and market trends, as well as the overall future financial performance of the reporting unit and future opportunities in the markets in which it operates. If it is determined that it is not more likely than not that the fair value of the reporting unit is less than its carrying value, no additional tests are required to be performed in assessing goodwill for impairment. However, if the Company concludes otherwise or elects not to perform the qualitative assessment, the Company performs a second step, consisting of a quantitative assessment of goodwill impairment. This quantitative assessment requires us to estimate the fair value of the reporting unit and compare the estimated fair value to its respective carrying value (including goodwill) as of the date of the impairment test. The third step, employed for the reporting unit failing the second step, is used to measure the amount of any potential impairment and compares the implied fair value of the reporting unit with the carrying amount of goodwill. Based on the results of the qualitative review of goodwill performed as of November 30, 2015, the Company did not identify any indicators of impairment. As such, the second and third steps described above were not necessary.
Research and development
Research and development costs for software sold to customers are expensed as incurred. These costs include salaries and personnel costs, including employee benefits, third-party contractor expenses, software development tools, an allocation of facilities and depreciation expenses and other expenses in developing new solutions and upgrading and enhancing existing solutions.
Software Development Costs
Capitalization of software development costs for software to be sold, leased, or otherwise marketed begins upon the establishment of technological feasibility, which is generally the completion of a working prototype that has been certified as having no critical bugs and is a release candidate. Amortization begins once the software is ready for its intended use, generally based on the pattern in which the economic benefits will be consumed. To date, software development costs incurred between completion of a working prototype and general availability of the related product have not been material.
Treasury stock
The Company is authorized to make treasury stock purchases in the open market pursuant to the share repurchase program, which was approved by its Board of Directors on August 28, 2008. The Company accounts for the purchase of treasury stock under the cost method. For additional information on the Company’s stock repurchase program, see Note 10 to the Consolidated Financial Statements. There were no treasury stock repurchases for the years ended December 31, 2015, 2014 and 2013.
Revenue recognition
The Company derives its revenue from the licensing and implementation of software solutions and associated software maintenance and support. The Company also offers SaaS and cloud-based services that do not require customers to host the Company's solutions in their data centers. The Company's arrangements with customers typically include: (a) license or SaaS fees paid for the use of software solutions either in perpetuity or over a specified term and implementation fees for configuration, implementation and training services and (b) maintenance and support fees related to technical support and software updates. If there is significant uncertainty about contract completion or collectability is not reasonably assured, revenue is deferred until the uncertainty is sufficiently resolved or collectability is reasonably assured. In addition, revenue is recognized when persuasive evidence of an arrangement exists, delivery has occurred and fees are fixed or determinable.
License
The Company derives the majority of its license revenue from the sale of perpetual licenses. For software license arrangements that do not require significant modification or customization of the underlying software, the Company recognizes
F-10
software licenses revenues at contract provided professional services are not considered essential to the delivery of the software and when: (1) the Company enters into a legally binding arrangement with a customer for the license of software; (2) the Company delivers the products; (3) the sale price is fixed or determinable and free of contingencies or significant uncertainties; and (4) collection is probable. Revenues that are not recognized at the time of sale because the foregoing conditions are not met, are recognized when those conditions are subsequently met.
The Company evaluates the nature and scope of professional services for each arrangement and if it determines that the professional services revenue should not be accounted for separately from license revenue, the license revenue is recognized together with the professional services revenue using the percentage-of-completion method or completed contract method. The completed contract method is also used for contracts where there is a risk over final acceptance by the customer or for contracts that are short-term in nature.
The percentage-of-completion method is measured by the percentage of man-days incurred during the reporting period as compared to the estimated total man-days necessary for each contract for implementation of the software solutions. The Company measures performance under the percentage-of-completion method using the total man-day method based on current estimates of man-days to complete the project. The Company believes that for each such project, man-days expended in proportion to total estimated man-days at completion represents the most reliable and meaningful measure for determining a project's progress toward completion. Under the Company's fixed-fee arrangements, should a loss be anticipated on a contract, the full amount of the loss is recorded when the loss is determinable.
The Company also licenses software solutions under term license agreements that typically include maintenance during the license term. When maintenance is included for the entire term of the license, there is no renewal rate and the Company has not established vendor specific objective evidence ("VSOE") of fair value for the maintenance on term licenses. For term license agreements, revenue and the associated costs are deferred until the delivery of the solution and recognized ratably over the remaining license term.
Professional Services
In determining whether professional services revenue should be accounted for separately from license revenue, the Company evaluates whether the professional services are considered essential to the functionality of the software using factors such as: the nature of its software products; whether they are ready for use by the customer upon receipt; the nature of professional services; the availability of services from other vendors; whether the timing of payments for license revenue coincides with performance of services; and whether milestones or acceptance criteria exist that affect the realizability of the software license fee.
If the Company determines that professional services revenue should not be accounted for separately from license revenue, the license revenue is recognized together with the professional services revenue using the percentage-of-completion method or completed contract method. The completed contract method is also used for contracts where there is a risk over final acceptance by the customer or for contracts that are short-term in nature.
For SaaS or cloud based services arrangements that include professional services, the Company determines whether the professional services have stand-alone value. If the Company determines the professional services do not have stand-alone value, the Company treats the transaction as a single element and the professional services revenue is deferred until the customer commences use of the SaaS or cloud-based services and the professional services revenue is recognized over the remaining term of the arrangement.
SaaS or Cloud-Based Services
For arrangements that include SaaS or cloud-based services, the Company allocates the arrangement consideration between the service and other elements and recognizes the SaaS or cloud-based services fee ratably beginning on the date the customer commences use of those services and continues through the end of the service term. Any revenue related to up-front activation or set-up fees are deferred and recognized ratably over the estimated period that the customer benefits from the related services. Direct and incremental costs related to up-front activation or set-up activities are capitalized until the date the Company's service is made available and then expensed ratably over the estimated period that the customer benefits from the related services.
Multiple Element Arrangements
The Company applies the residual method to recognize revenue for the delivered elements in stand-alone software transactions. Under the residual method, the amount of revenue allocated to delivered elements equals the total arrangement
F-11
consideration, less the aggregate fair value of any undelivered elements, typically maintenance, provided that VSOE of fair value exists for all undelivered elements. VSOE of fair value is based on the price charged when the element is sold separately or, in the case of maintenance, substantive renewal rates for maintenance.
For multiple element arrangements containing both software and nonsoftware services, the Company must (1) determine whether and when each element has been delivered; (2) determine fair value of each element using the selling price hierarchy of VSOE of fair value, third party evidence ("TPE"), or best estimate of selling price ("BESP"), as applicable; and (3) allocate the total price among the various elements based on the relative selling price method.
For multiple-element arrangements that contain software and nonsoftware elements such as the Company's cloud-based service solutions, the Company allocates revenue between the software and software related elements as a group and any nonsoftware elements based on a relative fair value allocation. The Company determines fair value for each deliverable using the selling price hierarchy described above and utilizes VSOE of fair value if it exists.
In certain instances, the Company may not be able to establish VSOE for all deliverables in an arrangement with multiple elements. This may be due to infrequently selling each element separately, not pricing solutions or services within a narrow range, or only having a limited sales history. In addition, third party evidence may not be available. When the Company is unable to establish selling prices using VSOE or TPE, it uses BESP in the allocation of arrangement consideration. The objective of BESP is to determine the price at which the Company would transact a sale if the product or service were sold on a stand-alone basis. For transactions that only include software and software-related elements, the Company continues to account for such arrangements under the software revenue recognition standards which require it to establish VSOE of fair value to allocate arrangement consideration to multiple deliverables.
Maintenance and Support
Maintenance and support revenue includes post-implementation customer support and the right to unspecified software updates and enhancements on a when and if available basis. The Company recognizes revenue from maintenance arrangements ratably over the period in which the services are provided.
Revenue that has been recognized, but for which the Company has not invoiced the customer, is recorded as unbilled receivables. Invoices that have been issued before revenue has been recognized are recorded as deferred revenue in the accompanying consolidated balance sheets.
Foreign currency
The Company has contracts denominated in foreign currencies and therefore a portion of the Company’s revenue is subject to foreign currency risks. Gains and losses from foreign currency transactions, such as those resulting from the settlement of receivables, are classified in other expense, net included in the accompanying Consolidated Statements of Comprehensive Income (Loss).
The functional currency of PROS France SAS ("PROS France") is its local currency. The financial statements of this subsidiary are translated into U.S. dollars using period-end rates of exchange for assets and liabilities, historical rates of exchange for equity, and average rates of exchange for the period for revenue and expenses. Translation gains (losses) are recorded in accumulated other comprehensive income (loss) as a component of stockholders’ equity.
Noncash share based compensation
The Company has two noncash share based compensation plans, the 1999 Equity Incentive Plan ("1999 Stock Plan") and the 2007 Equity Incentive Plan ("2007 Stock Plan"), which authorize the discretionary granting of various types of stock awards to key employees, officers, directors and consultants. The 1999 Stock Plan was terminated in March 2007 for purposes of granting any future equity awards. The 2007 Stock Plan was adopted in March 2007. The Company may provide noncash share based compensation through the grant of: (i) restricted stock awards; (ii) restricted stock unit awards ("RSUs"); (iii) stock options; (iv) stock appreciation rights ("SARs"); (v) phantom stock; and (vi) performance awards. Also in February 2014, the Company granted inducement awards in an aggregate amount of up to 308,250 shares in accordance with NYSE Rule 303A.08. These inducement awards were in the form of RSUs and market stock units ("MSUs") granted to the recently appointed Chief Operating Officer and RSUs granted to certain new employees in connection with the acquisitions of Cameleon Software SA and SignalDemand Inc.
F-12
To date, the Company has granted stock options, stock appreciation rights, restricted stock units, time based and performance based, and market stock units. The Company issues common stock from its pool of authorized stock upon exercise of stock options, settlement of stock appreciation rights and market stock units or upon vesting of restricted stock units.
The following table presents the number of awards outstanding for each award type as of December 31, 2015 and 2014 (in thousands):
Year Ended December 31, | ||||
Award type | 2015 | 2014 | ||
Stock options | 829 | 961 | ||
Restricted stock units (time based) | 1,915 | 1,830 | ||
Restricted stock units (performance based) | 24 | 34 | ||
Stock appreciation rights | 522 | 673 | ||
Market stock units | 563 | 444 | ||
Stock options. The Company did not grant stock options during 2015 and 2014. The fair value of each stock option was estimated on the date of grant using the Black-Scholes option pricing model.
Restricted stock units. The fair value of the RSUs is based on the closing price of the Company’s stock on the date of grant and is amortized over the vesting period.
Stock appreciation rights. SARs will be settled in stock at the time of exercise and vest over four years from the date grant. The Company used the Black-Scholes option pricing model to estimate the fair value of its SARs. The determination of the fair value of SARs utilizing the Black-Scholes model is affected by the Company’s stock price and a number of assumptions, including expected volatility, expected life, deliver risk-free interest rate and expected dividends. The Company estimates the expected volatility of common stock at the date of grant based on a combination of its historical volatility and the average volatility of comparable companies. The expected life of the SARs noncash share based payment awards is a historical weighted average of the expected lives of similar securities of comparable public companies. The risk-free interest rate assumption is based on observed interest rates appropriate for the terms of the Company’s awards. The dividend yield assumption is based on the Company's expectation of paying no dividends.
Market stock units. MSUs are performance-based awards that vest based upon the Company’s relative shareholder return. The actual number of MSUs that will be eligible to vest is based on the total shareholder return of the Company relative to the total shareholder return of the Russell 2000 Index ("Index") over a three year period ending December 31, 2015, December 31, 2016, December 31, 2017 and March 2, 2018 ("Performance Period"), respectively. The MSUs granted in 2013 vested on January 1, 2016, the MSUs granted in 2014 vest on January 1, 2017, and the MSUs granted in 2015 vest on December 31, 2017 and March 2, 2018, respectively. The maximum number of shares issuable upon vesting is 200% of the MSUs initially granted based on the average price of the Company's common stock relative to the Index during the Performance Period. The Company estimates the fair value of MSUs on the date of grant using a Monte Carlo simulation model. The determination of fair value of the MSUs is affected by the Company’s stock price and a number of assumptions including the expected volatility of the Company’s stock and the Index, its risk-free interest rate and expected dividends. The Company’s expected volatility at the date of grant was based on the historical volatilities of the Company and the Index over the Performance Period.
As the Company issues stock options and SARs, it evaluates the assumptions used to value its stock option awards and SARs. If factors change and the Company employs different assumptions, noncash share based compensation expense may differ significantly from what has been recorded in the past. If there are any modifications or cancellations of the underlying unvested securities, the Company may be required to accelerate, increase or cancel any remaining unearned noncash share based compensation expense. Future noncash share based compensation expense and unearned noncash share based compensation will increase to the extent that the Company grants additional equity awards to employees.
At December 31, 2015, there were an estimated $39.3 million of total unrecognized compensation costs related to noncash share based compensation arrangements. These costs will be recognized over a weighted average period of 2.4 years. For further discussion of the Company’s noncash share based compensation plans, see Note 11 to the Consolidated Financial Statements.
Product warranties
The Company generally issues warranties for 90 days following the first use of the software in a production environment, depending on the contract, for software licenses and implementation services. In the Company’s experience, warranty costs have been insignificant.
F-13
Income taxes
The Company uses the asset and liability method to account for income taxes, including recognition of deferred tax assets and liabilities for the anticipated future tax consequences attributable to differences between financial statement amounts and their respective tax basis. The Company reviews its deferred tax assets for recovery. A valuation allowance is established when the Company believes that it is more-likely than not that some portion of its deferred tax assets will not be realized. Changes in the valuation allowance from period to period are included in the Company’s tax provision in the period of change.
The Company accounts for uncertain income tax positions recognized in an enterprise’s financial statements in accordance with the income tax topic of the ASC issued by the FASB. This interpretation requires companies to use a prescribed model for assessing the financial recognition and measurement of all tax positions taken or expected to be taken in its tax returns. This guidance provides clarification on recognition, classification, interest and penalties, accounting in interim periods, disclosures and transition. The Company recognized accrued interest and penalties related to income taxes as a component of income tax expense. For additional information regarding the Company’s income taxes, see Note 12 to the Consolidated Financial Statements.
Segment reporting
The Company reports as one operating segment with the Chief Executive Officer ("CEO") acting as the Company’s chief operating decision maker. The Company’s CEO reviews financial information presented on a consolidated basis for purposes of allocating resources and evaluating financial performance. The Company has a single reporting unit, and there are no segment managers who are held accountable for operations, operating results or components below the consolidated unit level.
Earnings per share
The Company computes basic earnings (loss) per share by dividing net income (loss) attributable to common stockholders by the weighted average number of common shares outstanding. Diluted earnings (loss) per share is computed by dividing net income (loss) attributable to common stockholders by the weighted average number of common shares and dilutive potential common shares then outstanding. Diluted earnings per share reflect the assumed conversion of all dilutive securities, using the treasury stock method. Dilutive potential common shares consist of shares issuable upon the exercise of stock options, shares of unvested restricted stock units, and settlement of stock appreciation rights. When the Company incurs a net loss, the effect of the Company’s outstanding stock options, stock appreciation rights, restricted stock units and market stock units are not included in the calculation of diluted earnings (loss) per share as the effect would be anti-dilutive. Accordingly, basic and diluted net loss per share are identical.
Recently adopted accounting pronouncements
On November 20, 2015, the Financial Accounting Standards Board (“FASB”) issued Accounting Standards Update ("ASU") 2015-17, "Balance Sheet Classification of Deferred Taxes", requiring all deferred tax assets and liabilities, and any related valuation allowance, to be classified as non-current on the balance sheet. The classification change for all deferred taxes as non-current simplifies entities’ processes as it eliminates the need to separately identify the net current and net non-current deferred tax asset or liability in each jurisdiction and allocate valuation allowances. The Company elected to prospectively adopt the accounting standard in the fourth quarter of fiscal 2015. Prior periods in the Consolidated Financial Statements were not retrospectively adjusted.
Recent accounting pronouncements
In May 2014, the FASB issued ASU 2014-09, "Revenue from Contracts with Customers (Topic 606)," which supersedes nearly all existing revenue recognition guidance under GAAP and permits the use of either the retrospective or cumulative effect transition method. In August 2015, the FASB issued ASU No. 2015-14, Revenue from Contracts with Customers: Deferral of the Effective Date, which deferred the effective date of the new revenue standard for periods beginning after December 15, 2016 to December 15, 2017, with early adoption permitted but not earlier than the original effective date. Accordingly, the updated standard is effective for the Company in the first quarter of fiscal 2018. The Company has not yet selected a transition method and is currently evaluating the effect that the updated standard will have on the Company's consolidated financial statements and related disclosures.
In April 2015, the FASB issued ASU 2015-05, “Intangibles - Goodwill and Other Internal-Use Software”. The amendments in this update provide guidance to customers about whether a cloud computing arrangement includes a software license, and if so, how the software license element of the arrangement should be accounted for by the customer. The new standard will be
F-14
effective for annual period ending after December 15, 2015, and all reporting periods thereafter. The adoption of this standard is not expected to have a material impact on the Company's consolidated financial statements.
In April 2015, the FASB issued ASU 2015-03, "Simplifying the Presentations of Debt Issuance Costs", which requires debt issuance cost to be presented in the balance sheet as a direct deduction from the carrying value of the associated debt liability, consistent with the presentation of a debt discount. This new standard will be effective for interim and annual periods beginning on January 1, 2016, and is required to be retrospectively adopted. Adoption of this new standard is not expected to have a material impact on the Company's consolidated balance sheets or related disclosures.
With the exception of the new standards discussed above, there have been no other recent accounting pronouncements or changes in accounting pronouncements during the year ended December 31, 2015, that are of significance or potential significance to the Company.
3. Business Combination
Cameleon Software, SA
In October 2013, the Company entered into a tender offer agreement with Cameleon Software SA (now PROS France, and referred to in this subsection 3 as "Cameleon"), indicating the Company's intent to acquire Cameleon through the tender offer for all of the outstanding share capital of Cameleon in an all cash tender offer. In January 2014, the Company announced that the initial tender offer for Cameleon was successful and upon completion of the initial tender offer, the Company controlled 81.7% of Cameleon’s common stock and 94.0% of Cameleon’s outstanding warrants, inclusive of the commitments from Cameleon's management regarding their Cameleon free shares. As a result of shares purchased by the Company in the market following the completion of the tender, the Company's exercise of Cameleon warrants in July 2014, and the Company's completion of a second tender in November 2014, the Company now controls 100% of Cameleon's common stock. The Company acquired Cameleon for total cash consideration of approximately $32 million, net of cash acquired.
During the year ended December 31, 2014, the Company incurred acquisition-related costs of $1.7 million, consisting primarily of the cost for the retention of key employees, and advisory and legal fees.
The Company recorded revenue for Cameleon of approximately $11.9 million in the consolidated statement of operations from the acquisition date through December 31, 2014.
All of the assets acquired and the liabilities assumed in the transaction have been recognized at their acquisition date fair values at January 8, 2014.
The acquisition initially resulted in $16.2 million of goodwill. During the year ended December 31, 2014, the fair value of the other tangible assets and liabilities was increased and resulted in a net change in goodwill of $0.5 million.
The allocation of the purchase price for Cameleon is updated as follows (in thousands):
Cash and cash equivalents | $ | 7,086 | |
Accounts receivable | 10,395 | ||
Prepaid and other assets | 1,418 | ||
Intangible assets | 18,653 | ||
Goodwill | 15,717 | ||
Accounts payable and accrued liabilities | (12,539 | ) | |
Deferred revenue | (5,392 | ) | |
Non-controlling interest | (6,204 | ) | |
Net assets acquired | $ | 29,134 | |
The following are the identifiable intangible assets acquired and their respective useful lives (in thousands):
F-15
Useful Life | |||||
Amount | (years) | ||||
Trade Name | $ | 1,020 | 8 | ||
Customer Relationships | 1,455 | 2-5 | |||
Maintenance Relationships | 3,808 | 8 | |||
Developed Technology | 11,147 | 7 | |||
Other | 1,223 | 2 | |||
Total | $ | 18,653 | |||
In performing the purchase price allocation, the Company considered, among other factors, its anticipated future use of the acquired assets, analysis of historical financial performance, and estimates of future cash flows from Cameleon's products and services. The allocation resulted in acquired intangible assets of $18.7 million. The acquired intangible assets consisted of developed technology, customer and maintenance relationships, trade name and other and were valued using the income approach in which the after-tax cash flows are discounted to present value. The cash flows are based on estimates used to price the transaction, and the discount rates applied were benchmarked with reference to the implied rate of return from the transaction model as well as the weighted average cost of capital. Additionally, the Company assumed certain liabilities in the acquisition, including deferred revenue to which a fair value of $5.4 million was ascribed using a cost-plus profit approach.
Liabilities assumed include $2.7 million related to the Company's offer to pay an additional €0.15 per share cash premium to the Cameleon stock and warrant holders tendering their shares and warrants in the initial tender offer if the Company acquired at least 95% of the share capital and voting rights of Cameleon on a fully diluted basis on or before December 31, 2014. The Company recorded this liability at fair value as the Company expected to meet this threshold prior to December 31, 2014 and ultimately settled the contingent liability related to the share premium in December 2014 for $2.2 million. In addition, the net assets acquired include contingent consideration of $1.4 million related to the committed purchase of free shares owned by Cameleon management which was settled in September 2015 for $1.3 million.
Goodwill of $15.7 million represents the excess of the purchase price over the fair value of the underlying net tangible and identifiable intangible assets, and represents the expected synergistic benefits of the transaction, the knowledge and experience of Cameleon's workforce in place, and the expectation that the combined company’s complementary products will significantly broaden the Company’s CPQ solution offering. The Company believes the combined company will benefit from a broader global presence and, with the Company’s direct sales force and larger channel coverage, significant cross selling opportunities. Intangibles and goodwill of $5.8 million are expected to be currently deductible for tax purposes. In accordance with GAAP, goodwill is not amortized but instead is tested for impairment at least annually, or, more frequently if certain indicators are present. In the event that the management of the combined company determines that the value of goodwill has become impaired, the combined company will incur an accounting charge for the amount of the impairment during the fiscal quarter in which the determination is made.
SignalDemand, Inc.
In December 2013, the Company acquired SignalDemand, Inc. ("SignalDemand") for total cash consideration of $13.5 million. All of the assets acquired and the liabilities assumed in the transaction were recognized at their acquisition date fair values at December 16, 2013, which included $7.2 million of goodwill.
Pro Forma Financial Information
The unaudited financial information in the table below summarizes the combined results of operations of the Company, Cameleon and SignalDemand, on a pro forma basis, as though the Company had acquired Cameleon and SignalDemand on January 1, 2013. The pro forma information for all periods presented also includes the effect of business combination accounting resulting from the acquisition, including amortization charges from acquired intangible assets.
Year Ended December 31, | |||||||
(in thousands) | 2014 | 2013 | |||||
Total revenue | $ | 186,081 | $ | 168,974 | |||
Net loss attributable to PROS Holdings, Inc. | (36,776 | ) | (3,647 | ) | |||
Earnings per share - basic and diluted | $ | (1.27 | ) | $ | (0.13 | ) | |
F-16
4. Non-controlling interest
The following table presents a rollforward of the non-controlling interest from the date of acquisition of Cameleon Software SA on January 8, 2014 through December 31, 2014 (in thousands):
Beginning balance as of January 8, 2014 | $ | 6,204 | ||
Change in Parent's ownership in the subsidiary, net of cumulative earnings previously allocated to NCI and re-allocated to Parent's equity | (5,282 | ) | ||
Net loss allocated to non-controlling interest | (907 | ) | ||
Foreign currency translation adjustment | (15 | ) | ||
Ending balance as of December 31, 2014 | $ | — | ||
The Company controlled 100% of Cameleon Software SA as of December 31, 2014 and there were no activities or outstanding balance related to non-controlling interest for the year ended December 31, 2015.
5. Goodwill and Intangible Assets
The change in the carrying amount of goodwill for the years ended December 31, 2015 and 2014, was as follows (in thousands):
Balance as of December 31, 2013 | $ | 7,024 | |
Goodwill acquired | 15,717 | ||
Purchase accounting adjustments | 151 | ||
Foreign currency translation adjustments | (1,329 | ) | |
Balance as of December 31, 2014 | 21,563 | ||
Foreign currency translation adjustments | (1,118 | ) | |
Balance as of December 31, 2015 | $ | 20,445 | |
The increase in goodwill for the year ended December 31, 2014 was primarily the result of the acquisition of Cameleon Software SA. The goodwill balance related to Cameleon Software SA is denominated in local currency.
Intangible assets consisted of the following as of December 31, (in thousands):
December 31, 2014 | |||||||||||||
Weighted average useful life (years) | Gross Carrying Amount | Accumulated Amortization* | Net Carrying Amount | ||||||||||
Developed technology | 7 | $ | 14,567 | $ | 2,082 | $ | 12,485 | ||||||
Internally developed technology and other | 2 | 1,254 | 620 | 634 | |||||||||
Maintenance Relationship | 8 | 3,591 | 788 | 2,803 | |||||||||
Customer relationships | 7 | 4,853 | 1,399 | 3,454 | |||||||||
Trade name | 8 | 952 | 133 | 819 | |||||||||
Total | $ | 25,217 | $ | 5,022 | $ | 20,195 | |||||||
*Cumulative foreign currency translation adjustments, reflecting movement in the currencies of the underlying entities, decreased total intangible assets by approximately $1.5 million as of December 31, 2014.
F-17
December 31, 2015 | |||||||||||||
Weighted average useful life (years) | Gross Carrying Amount | Accumulated Amortization* | Net Carrying Amount | ||||||||||
Developed technology | 7 | $ | 14,567 | $ | 4,897 | $ | 9,670 | ||||||
Internally developed technology and other | 2 | 1,254 | 1,245 | 9 | |||||||||
Maintenance Relationship | 8 | 3,591 | 1,527 | 2,064 | |||||||||
Customer relationships | 7 | 4,853 | 2,405 | 2,448 | |||||||||
Trade name | 2 | 952 | 952 | — | |||||||||
Total | $ | 25,217 | $ | 11,026 | $ | 14,191 | |||||||
*Cumulative foreign currency translation adjustments, reflecting movement in the currencies of the underlying entities, decreased total intangible assets by approximately $1.2 million as of December 31, 2015.
Customer relationships are amortized over a period ranging from two to eight years.
In the third quarter of 2015, the Company determined that the original strategy for the trade name of Cameleon Software SA had changed which caused a change in estimate related to the useful life of the asset and the amortization related to this intangible asset was accelerated and fully recognized at that time.
Intangible asset amortization expense for the years ended December 31, 2015, 2014 and 2013 was $4.8 million, $5.2 million and $0.1 million, respectively. As of December 31, 2015, the expected future amortization expense for the acquired intangible assets for each of the five succeeding years and thereafter was as follows (in thousands):
Year Ending December 31, | Amount | |||
2016 | $ | 2,955 | ||
2017 | 2,709 | |||
2018 | 2,709 | |||
2019 | 2,594 | |||
2020 | 2,564 | |||
2021 and thereafter | 660 | |||
Total amortization expense | $ | 14,191 | ||
6. Accounts receivable and contracts in progress
Accounts receivable at December 31, 2015 and 2014, consists of the following (in thousands):
December 31, | |||||||
2015 | 2014 | ||||||
Accounts receivable | $ | 36,539 | $ | 64,004 | |||
Unbilled receivables | 3,162 | 7,959 | |||||
Total receivables | 39,701 | 71,963 | |||||
Less: Allowance for doubtful accounts | (586 | ) | (868 | ) | |||
Accounts receivable, net | $ | 39,115 | $ | 71,095 | |||
The bad debt expense reflected in general and administrative expenses in the accompanying Consolidated Statements of Comprehensive Income for the years ended December 31, 2015, 2014 and 2013, totaled approximately $(0.3) million, $(0.1) million and $0.4 million, respectively.
Activity related to contracts in progress at December 31, 2015 and 2014, is summarized as follows (in thousands):
F-18
December 31, | |||||||
2015 | 2014 | ||||||
Costs and estimated earnings recognized to date | $ | 415,172 | $ | 349,874 | |||
Progress billings to date | (477,339 | ) | (400,349 | ) | |||
Total | $ | (62,167 | ) | $ | (50,475 | ) | |
The foregoing table reflects the aggregate invoiced amount of all contracts in progress and maintenance as of the respective dates, including amounts that have already been collected.
These amounts are included in the accompanying Consolidated Balance Sheets at December 31, 2015 and 2014, as follows (in thousands):
December 31, | |||||||
2015 | 2014 | ||||||
Unbilled receivables | $ | 3,162 | $ | 7,959 | |||
Deferred revenue | (65,329 | ) | (58,434 | ) | |||
Total | $ | (62,167 | ) | $ | (50,475 | ) | |
At December 31, 2015 and 2014, the Company had approximately $23.1 million and $20.2 million, respectively, in deferred maintenance and support revenue, which is reflected above within deferred revenue and progress billing.
7. Earnings per share
The following table sets forth the computation of basic and diluted earnings per share:
For the Year Ended December 31, | |||||||||||
2015 | 2014 | 2013 | |||||||||
Numerator: | |||||||||||
Net (loss) income attributable to PROS Holdings, Inc. | $ | (65,811 | ) | $ | (36,644 | ) | $ | 3,446 | |||
Denominator: | |||||||||||
Weighted average shares (basic) | 29,578 | 28,915 | 28,004 | ||||||||
Dilutive effect of stock options, restricted stock units and stock appreciation rights | — | — | 2,110 | ||||||||
Weighted average shares (diluted) | 29,578 | 28,915 | 30,114 | ||||||||
Basic earnings per share | $ | (2.23 | ) | $ | (1.27 | ) | $ | 0.12 | |||
Diluted earnings per share | $ | (2.23 | ) | $ | (1.27 | ) | $ | 0.11 | |||
Dilutive potential common shares consist of shares issuable upon the exercise of stock options, settlement of SARs, and the vesting of RSUs and MSUs. Potential common shares determined to be antidilutive and excluded from diluted weighted average shares outstanding were approximately 2.2 million and 2.0 million for the years ended December 31, 2015 and 2014, respectively, and an immaterial number of antidilutive shares for the year ended December 31, 2013. Basic shares were used to calculate loss per share for the years ended December 31, 2015 and 2014.
Since the Company intends to settle the principal amount of its Senior Notes (see Note 13) in cash, the treasury stock method is expected to be used for calculating any potential dilutive effect of the conversion spread on diluted net income per share, if applicable. The conversion spread will have a dilutive impact on diluted net income per share of common stock when the average market price of common stock for a given period exceeds the conversion price of $33.79 per share.
8. Property and equipment, net
Property and equipment, net as of December 31, 2015 and 2014 consists of the following:
F-19
December 31, | |||||||||
Estimated useful life | 2015 | 2014 | |||||||
Furniture and fixtures | 7-10 years | $ | 2,869 | $ | 2,874 | ||||
Computers and equipment | 3-5 years | 19,069 | 15,662 | ||||||
Software | 2-6 years | 5,238 | 5,068 | ||||||
Capitalized internal-use software development costs | 3 years | — | 2,639 | ||||||
Leasehold improvements | Shorter of lease term or useful life | 5,613 | 5,625 | ||||||
Construction in progress | 55 | 5 | |||||||
Property and equipment, gross | 32,844 | 31,873 | |||||||
Less: Accumulated depreciation and amortization | (17,067 | ) | (16,085 | ) | |||||
Property and equipment, net | $ | 15,777 | $ | 15,788 | |||||
Depreciation and amortization was approximately $5.5 million, $5.0 million and $4.2 million for the years ended December 31, 2015, 2014 and 2013, respectively. During the years ended December 31, 2015, 2014 and 2013, the Company disposed of approximately $4.4 million, zero and $1.5 million, respectively, of fully depreciated assets. During the year ended December 31, 2015, the Company recognized approximately $0.2 million of loss on disposal of certain non-fully depreciated assets. No gain or loss on disposal of assets was recognized for the years ended December 31, 2014 and 2013. As of December 31, 2015 and 2014, the Company had approximately $4.1 million and $6.7 million, respectively, of fully depreciated assets in use.
During the years ended December 31, 2015 and 2014, the Company capitalized internal-use software development costs of approximately $0.3 million and $2.5 million, respectively, related to its cloud-based solutions. As of December 31, 2015 and 2014, approximately zero and $1.6 million, respectively, of capitalized internal-use software development costs were subject to amortization. Included in accumulated depreciation and amortization is approximately zero and $0.2 million, respectively, of amortization related to capitalized internal-use software development costs for the years ended December 31, 2015 and 2014.
During the years ended December 31, 2015 and 2014, the Company recorded $2.9 million and $4.0 million of impairment charges related to internally developed software. The impairments resulted from a reduction of projected cash flows for product groups based on revisions to the Company's projections during the year and were recorded to reduce the carrying value to fair value. The impairment in 2015 was triggered by a change in product strategy which resulted in a reduction in projected cash flows. The impairment in 2014 was triggered by the integration of the products acquired from the Company's acquisitions, which resulted in a reduction in projected cash flows. No impairment was recorded for the year ended December 31, 2013.
9. Fair value measurements
The Company adopted fair value measurements guidance for financial and nonfinancial assets and liabilities. The guidance defines fair value, establishes a framework for measuring fair value in GAAP and expands disclosures about fair value measurements.
The guidance defines fair value as the price that would be received to sell an asset, or paid to transfer a liability, in an orderly transaction between market participants. The guidance establishes a fair value hierarchy for valuation inputs that gives the highest priority to quoted prices in active markets for identical assets or liabilities and the lowest priority to unobservable inputs. The fair value hierarchy is as follows:
Level 1: Unadjusted quoted prices in active markets that are accessible at the measurement date for identical, unrestricted assets or liabilities;
Level 2: Quoted prices for similar assets or liabilities in markets that are not active or inputs which are observable, either directly or indirectly, for substantially the full term of the asset or liability; and
Level 3: Prices or valuation techniques that require inputs that are both significant to the fair value measurement and unobservable (i.e., supported by little or no market activity).
A portion of the Company’s existing cash and cash equivalents are invested in short-term interest bearing obligations with original maturities less than 90 days, principally various types of money market funds. In addition, the Company had short-term investments consisting of commercial papers. The Company does not enter into investments for trading or speculative purposes.
F-20
At December 31, 2015 and 2014, the Company had approximately $127.2 million and $135.3 million invested in treasury money market funds, respectively, and $2.5 million and zero in short-term investments, respectively. These investments are required to be measured at fair value on a recurring basis. The fair value of these accounts is determined based on quoted market prices, which represents level 1 in the fair value hierarchy. The Company's diversified money market funds, treasury money market funds and short-term investments have a fair value that is not materially different from its carrying amount. The Company recorded an immaterial amount of unrealized gain related to the short-term investments for the year ended December 31, 2015. Reclassification adjustments for realized gain (loss) on available-for-sale securities in net income were immaterial for the year ended December 31, 2015.
The fair value of the Company's Senior Notes is classified in the Level 2 hierarchy.
10. Stockholders’ equity
Stock repurchase
On August 25, 2008, the Company’s Board of Directors approved a stock repurchase program that authorized the Company to purchase up to $15.0 million of the Company’s outstanding shares of common stock. Under the board-approved repurchase program, share purchases may be made from time to time in the open market or through privately negotiated transactions depending on market conditions, share price, trading volume and other factors, and such purchases, if any, will be made in accordance with applicable insider trading and other securities laws and regulations. These repurchases may be commenced or suspended at any time or from time to time without prior notice.
The Company did not repurchase any shares under this plan for the years ended December 31, 2015 and 2014. The remaining amount available to purchase common stock under this plan was $10.0 million as of December 31, 2015.
11. Noncash share based compensation
Employee noncash share based compensation plans:
The Company has two noncash share based compensation plans; the 1999 Stock Plan and the 2007 Stock Plan. These plans authorize the discretionary granting of various types of stock awards to key employees, officers, directors and consultants. The discretionary issuance of stock awards generally contains vesting provisions ranging from one to four years.
1999 Stock Plan. Under the 1999 Stock Plan, the Company is authorized to grant options to purchase shares of common stock to its employees, directors and consultants at the Company’s discretion. The Company’s 1999 Stock Plan was terminated in March 2007 for purposes of granting any future equity awards. There were issued and outstanding stock options to purchase 33,325 shares of the Company’s common stock under the 1999 Stock Plan as of December 31, 2014. All outstanding options were exercised during the year ended December 31, 2015 and there were no outstanding options remaining as of December 31, 2015.
2007 Stock Plan. The Company’s 2007 Stock Plan was adopted in March 2007. The purpose of the 2007 Stock Plan is to promote the Company’s long-term growth and profitability. The 2007 plan is intended to make available incentives that will help the Company to attract, retain and reward employees whose contributions are essential to its success. Under the 2007 Stock Plan, the Company’s employees, officers, directors and other individuals providing services to the Company or any of its affiliates are eligible to receive awards. The 2007 Stock Plan has an evergreen provision that allows for an annual increase equal to the lesser of (i) 3.5% of the Company’s outstanding shares, (ii) 900,000 shares, or (iii) any lesser amount determined by the Compensation Committee of the Board of Directors. The Company may provide these incentives through the grant of: (i) restricted stock awards; (ii) restricted stock unit awards; (iii) stock options; (iv) stock appreciation rights; (v) phantom stock; and (vi) performance awards.
In January 2015, the Company increased the number of shares available to grant by 900,000 under the evergreen provision in the Company’s 2007 Stock Plan, increasing the number shares reserved for issuance to 9,068,000. As of December 31, 2015, the Company had outstanding equity awards to acquire 3,638,293 shares of its common stock held by the Company’s employees, directors and consultants under the 2007 Stock Plan. Included in the outstanding equity awards are 828,979 of stock options, 1,799,298 RSUs, 521,716 SARs and 488,300 MSUs held by the Company’s employees, directors and consultants. As of December 31, 2015, 1,062,461 shares remain available for grant under the 2007 Stock Plan. As of December 31, 2015, there were no restricted stock awards or phantom stock issued under the 2007 Stock Plan.
In February 2014, the Company granted inducement awards in an aggregate amount of up to 308,250 shares in accordance with NYSE Rule 303A.08. These inducement awards were in the form of RSUs and MSUs granted to the recently appointed Chief
F-21
Operating Officer and RSUs granted to certain new employees in connection with the acquisitions of Cameleon Software SA and SignalDemand. As of December 31, 2015, the Company had outstanding equity inducement awards to acquire 214,663 shares of its common stock held by the Company's employees and officers. Included in the outstanding equity awards are 139,663 RSUs (time and performance based) and 75,000 MSUs.
Noncash share based compensation expense for all noncash share based payment awards granted is determined based on the grant-date fair value of the award. The Company recognizes compensation expense, net of estimated forfeitures, which represents noncash share based awards expected to vest on a straight-line basis over the requisite service period of the award, which is generally the vesting term. Noncash share based awards typically vest over four years. Stock options are generally granted for a ten-year term. The Company estimates forfeiture rates based on its historical experience for grant years where the majority of the vesting terms have been satisfied. Changes in estimated forfeiture rates are recognized through a cumulative catch-up adjustment in the period of change and thus impact the amount of noncash share based compensation expense to be recognized in future periods.
Noncash share based compensation expense is allocated to expense categories on the Consolidated Statements of Comprehensive Income. The following table summarizes noncash share based compensation expense, net of amounts capitalized, for the years ended December 31, 2015, 2014 and 2013 (in thousands).
For the Year Ended December 31, | |||||||||||
2015 | 2014 | 2013 | |||||||||
Share-based compensation: | |||||||||||
Cost of revenue | $ | 3,719 | $ | 3,469 | $ | 2,071 | |||||
Operating expenses: | |||||||||||
Selling and marketing | 8,536 | 6,514 | 3,834 | ||||||||
General and administrative | 10,293 | 8,003 | 7,055 | ||||||||
Research and development | 5,316 | 4,679 | 3,139 | ||||||||
Total included in operating expenses | 24,145 | 19,196 | 14,028 | ||||||||
Total share-based compensation expense | $ | 27,864 | $ | 22,665 | $ | 16,099 | |||||
At December 31, 2015, there was an estimated $39.3 million of total unrecognized compensation costs related to noncash share based compensation arrangements. These costs will be recognized over a weighted average period of 2.4 years.
Stock Options:
The following table summarizes the Company’s stock option activity for the year ended December 31, 2015 (number of shares and intrinsic value in thousands):
Number of shares under option | Weighted average exercise price | Weighted average remaining contractual term (year) | Aggregate intrinsic value (1) | |||||||||
Outstanding, December 31, 2014 | 961 | $ | 11.87 | |||||||||
Granted | — | — | ||||||||||
Exercised | (131) | 10.67 | ||||||||||
Forfeited | — | — | ||||||||||
Expired | (1) | 14.93 | ||||||||||
Outstanding, December 31, 2015 | 829 | $ | 12.06 | 1.82 | $ | 9,105 | ||||||
Vested and exercisable at December 31, 2015 | 829 | $ | 12.06 | 1.82 | $ | 9,105 | ||||||
(1) The aggregate intrinsic value was calculated based on the positive difference between the estimated fair value of the Company’s common stock on December 31, 2015 of $23.04 and the grant date fair value.
For the years ended December 31, 2015 and 2014, respectively, the Company did not grant any stock options. The total intrinsic value of stock options exercised for the years ended December 31, 2015, 2014 and 2013 was $1.6 million, $4.5 million and $5.2 million, respectively.
F-22
RSUs:
The Company has granted RSUs under the 2007 Stock Plan and as part of the February 2014 inducement awards grant. RSUs include both time-based awards as well as performance-based awards in which the number of shares that vest are based upon the revenue expected to be earned by the Company from binding customer agreements for the provision of CPQ solutions. Generally, the time-based RSUs granted to employees, directors and consultants vest in equal annual installments over a one to four year period from the grant date. At December 31, 2015, there were 1,938,961 shares related to RSUs outstanding and unvested.
The following table summarizes the Company's unvested RSUs as of December 31, 2015, and changes during the year then ended, is as follows (number of shares and intrinsic value in thousands):
Number of shares | Weighted average grant date fair value | Weighted average remaining contractual term (year) | Aggregate intrinsic value (1) | |||||||||
Unvested at December 31, 2014 | 1,864 | $ | 26.67 | |||||||||
Granted | 976 | 25.29 | ||||||||||
Vested | (632 | ) | 24.11 | |||||||||
Forfeited | (269 | ) | 27.14 | |||||||||
Unvested at December 31, 2015 | 1,939 | $ | 26.75 | 4.04 | $ | 44,674 | ||||||
Expected to vest at December 31, 2015 | 1,899 | $ | 26.75 | 4.03 | $ | 43,748 | ||||||
(1) The aggregate intrinsic value was calculated based on the fair value of the Company’s common stock on December 31, 2015 of $23.04.
The weighted average grant-date fair value of the RSUs granted during the years ended December 31, 2015, 2014 and 2013 was $25.29, $33.46 and $20.08, respectively.
SARs:
The Company has granted SARs under the 2007 Stock Plan. The SARs will be settled in stock at the time of exercise and vest four years from the date of grant subject to the recipient’s continued employment with the Company. The number of shares issued upon the exercise of the SARs is calculated as the difference between the share price of the Company’s stock on the date of exercise and the date of grant multiplied by the number of SARs divided by the share price on the exercise date.
The following table summarizes the Company's SARs activity for the year ended December 31, 2015 (number of shares and intrinsic value in thousands):
Stock appreciation rights | Weighted average exercise price | Weighted average remaining contractual term (year) | Aggregate intrinsic value (1) | |||||||||
Outstanding, December 31, 2014 | 673 | $ | 10.75 | |||||||||
Granted | — | — | ||||||||||
Exercised | (151 | ) | 10.34 | |||||||||
Forfeited | — | — | ||||||||||
Expired | — | — | ||||||||||
Outstanding, December 31, 2015 | 522 | $ | 10.87 | 4.85 | $ | 6,351 | ||||||
Exercisable at December 31, 2015 | 522 | $ | 10.87 | 4.85 | $ | 6,351 | ||||||
Vested and expected to vest at December 31, 2015 | 522 | $ | 10.87 | 4.85 | $ | 6,351 | ||||||
(1) The aggregate intrinsic value was calculated based on the positive difference between the estimated fair value of the Company’s common stock on December 31, 2015 of $23.04 and the exercise price of the underlying SARs.
The Company did not grant SARs in 2015, 2014 and 2013.
MSUs:
F-23
In 2015, 2014 and 2013, the Company granted MSUs to certain executives and senior level employees under the 2007 Stock Plan as part of the 2014 inducement awards grant. The MSUs are performance-based awards that vest based upon the Company’s relative shareholder return. The actual number of MSUs that will be eligible to vest is based on the total shareholder return of the Company relative to the total shareholder return of the Index over a three year period ending December 31, 2015, December 31, 2016, December 31, 2017 and March 2, 2018 ("Performance Period"), respectively. The MSUs granted in 2013 vested on January 1, 2016, the MSUs granted in 2014 vest on January 1, 2017, and the MSUs granted in 2015 vest on January 1, 2017 and March 2, 2018. The MSUs maximum number of shares issuable upon vesting is 200% of the MSUs initially granted.
The following table summarizes the Company's MSUs activity for the year ended December 31, 2015 (number of shares and intrinsic value in thousands):
Number of unvested awards | Weighted average grant date fair value | Weighted average remaining contractual term (year) | Aggregate intrinsic value (1) | |||||||||
Unvested at December 31, 2014 | 444 | 44.03 | ||||||||||
Granted | 131 | $ | 32.45 | |||||||||
Exercised | — | — | ||||||||||
Forfeited | (12 | ) | 34.08 | |||||||||
Expired | — | — | ||||||||||
Unvested at December 31, 2015 | 563 | $ | 41.55 | 5.07 | $ | 12,978 | ||||||
(1) The aggregate intrinsic value was calculated based on the positive difference between the estimated fair value of the Company’s common stock on December 31, 2015 of $23.04 and the grant date fair value of the underlying MSUs.
The Company estimates the fair value of MSUs on the date of grant using a Monte Carlo simulation model. The determination of fair value of the MSUs is affected by the Company's stock price and a number of assumptions including the expected volatilities of the Company's stock and the Index, its risk-free interest rate and expected dividends. The Company's expected volatility at the date of grant was based on the historical volatilities of the Company and the Index over the Performance Period. The Company did not estimate a forfeiture rate for the MSUs due to the limited size, the vesting period and nature of the grantee population and the lack of history of granting this type of award.
Significant assumptions used in the Monte Carlo simulation model for MSUs granted during the years ended December 31, 2015, 2014 and 2013 are as follows:
For the Year Ended December 31, | |||||
2015 | 2014 | 2013 | |||
Volatility | 42.06% | 50.86% | 56.82% | ||
Risk-free interest rate | 0.89% | 0.68% | 0.35% | ||
Expected option life in years | 2.95 | 2.88 | 2.84 | ||
Dividend yield | — | — | — | ||
The assumptions related to fiscal year 2015 and 2014 are presented on weighted average basis for the various awards granted throughout the period.
Employee stock purchase plan:
In June 2013, the Board of Directors authorized an Employee Stock Purchase Plan (“ESPP”) which provides for eligible employees to purchase shares on an after-tax basis in an amount between 1% and 10% of their annual pay: (i) on June 30 of each year at a 5% discount of the fair market value of the Company's common stock on January 1 or June 30, whichever is lower, and (ii) on December 31 of each year at a 5% discount of the fair market value of the Company's common stock on July 1 or December 31, whichever is lower. An employee may not purchase more than $5,000 in either of the six-month measurement periods described above or more than $10,000 annually. During the year ended December 31, 2015, the Company issued 37,605 shares under the ESPP. As of December 31, 2015, 449,003 shares remain authorized and available for issuance under the ESPP. As of December 31, 2015, the Company held approximately $0.5 million on behalf of employees for future purchases under the ESPP and this amount was recorded in accrued liabilities in the Company's Consolidated Balance Sheet.
F-24
12. Income taxes
The income tax provision (benefit) consisted of the following for the years ended December 31, 2015, 2014 and 2013 (in thousands):
Year Ended December 31, | |||||||||||
2015 | 2014 | 2013 | |||||||||
Current: | |||||||||||
Federal | $ | (51 | ) | $ | (935 | ) | $ | 2,444 | |||
State and Foreign | 621 | 790 | 160 | ||||||||
570 | (145 | ) | 2,604 | ||||||||
Deferred: | |||||||||||
Federal | 159 | 12,334 | (2,651 | ) | |||||||
State | 10 | 304 | (126 | ) | |||||||
Income tax provision (benefit) | $ | 739 | $ | 12,493 | $ | (173 | ) | ||||
The differences between the effective tax rates reflected in the total provision for income taxes and the U.S. federal statutory rate of 34% for the years ended December 31, 2015, 2014 and 2013, respectively, were as follows (in thousands):
Year Ended December 31, | |||||||||||
2015 | 2014 | 2013 | |||||||||
Provision at the U.S. federal statutory rate | $ | (22,124 | ) | $ | (8,520 | ) | $ | 1,113 | |||
Increase (decrease) resulting from: | |||||||||||
State income taxes, net of federal taxes | 74 | 49 | (583 | ) | |||||||
Nondeductible expenses | 1,195 | 653 | 235 | ||||||||
Acquisition-related expense | (4 | ) | 434 | 606 | |||||||
Purchase accounting - Statutory to GAAP income adjustment | 119 | 990 | — | ||||||||
Foreign Tax Expense | 350 | 837 | 135 | ||||||||
Domestic production activities | — | — | (47 | ) | |||||||
Nondeductible noncash share based compensation | 2,201 | 1,784 | 1,308 | ||||||||
Incremental benefits from prior years' tax credits | — | 59 | (1,254 | ) | |||||||
Incremental benefits for tax credits | (1,947 | ) | (3,259 | ) | (2,165 | ) | |||||
Change in tax rate/income subject to lower tax rates and other | (15 | ) | (40 | ) | (30 | ) | |||||
Change in valuation allowance | 20,890 | 19,506 | 509 | ||||||||
Income tax provision (benefit) | $ | 739 | $ | 12,493 | $ | (173 | ) | ||||
The Company’s effective tax rate was a provision of 1%, and 50% for the years ended December 31, 2015 and 2014, respectively, and a benefit of 5% for the year ended December 31, 2013. During the year ended December 31, 2015, the Company's effective tax rate was impacted primarily by a valuation allowance, nondeductible officer's compensation, foreign taxes, and other nondeductible expenses, partially offset by the R&E credit.
As of December 31, 2015 and 2014, the Company had an income tax receivable of approximately $1.0 million and $1.4 million, respectively, which is classified as prepaid and other current assets in the accompanying Consolidated Balance Sheets.
F-25
The tax effects of temporary differences that give rise to significant portions of the deferred tax assets and liabilities as of December 31, 2015 and 2014 are as follows (in thousands):
Year Ended December 31, | |||||||
2015 | 2014 | ||||||
Current deferred tax assets: | |||||||
State deferred | $ | — | $ | 175 | |||
Accruals not currently deductible | — | 341 | |||||
Current deferred revenue | — | 1,664 | |||||
Total current deferred tax assets | — | 2,180 | |||||
Less: valuation allowance | — | (1,972 | ) | ||||
Total current deferred tax assets | — | 208 | |||||
Noncurrent deferred tax liability: | |||||||
Property and equipment | (2,417 | ) | (2,180 | ) | |||
Noncash share based compensation | 10,378 | 8,784 | |||||
State deferred | 249 | 138 | |||||
Capitalized software | (1,538 | ) | (897 | ) | |||
Amortization | (2,289 | ) | (5,540 | ) | |||
R&E tax credit carryforwards | 5,696 | 4,316 | |||||
Deferred revenue | 923 | 64 | |||||
Federal Net Operating Losses ("NOLs") | 20,889 | 4,966 | |||||
State NOLs | 714 | 593 | |||||
State Credits | 1,348 | 1,240 | |||||
Foreign NOLs | 8,457 | 9,119 | |||||
Foreign tax credit carryforward | 1,257 | 837 | |||||
Other | 487 | 317 | |||||
Total noncurrent deferred tax assets | 44,154 | 21,757 | |||||
Less: valuation allowance | (44,321 | ) | (22,055 | ) | |||
Total noncurrent deferred tax liability | (167 | ) | (298 | ) | |||
Total net deferred tax liability | $ | (167 | ) | $ | (90 | ) | |
The current net deferred tax assets and noncurrent net deferred tax liability are classified as prepaids and other current assets, other long-term assets and other noncurrent liabilities, respectively, in the accompanying Consolidated Balance Sheets.
In connection with the January 2014 purchase of Cameleon Software SA, the Company made certain US federal tax elections changing the character of the Cameleon Software SA transaction. Prior to the transaction, Cameleon Software SA recorded deferred tax assets, net of a full valuation allowance. During purchase accounting, the Company maintained there was not sufficient positive evidence to outweigh the historic negative evidence surrounding PROS France before and after the transaction to determine it was more likely than not that PROS France would be unable to fully utilize the deferred tax assets. As a result, the Company continued to record a valuation allowance against all deferred tax assets and there was no net effect on the purchase accounting for deferred taxes.
In the second quarter of 2015, the Company determined that a step-up in tax deductible goodwill had occurred in 2014 and was not reflected in the 2014 financial statements. The result of the step-up in tax deductible goodwill did not have a material impact to the Company’s Consolidated Balance Sheet and Statement of Comprehensive Income (Loss) as the deferred assets continued to be offset by a full valuation allowance, net of $0.1 million deferred tax liability. As a result, the Company has corrected certain items in the schedule of 2014 deferred taxes by decreasing deferred tax assets $4.9 million, and decreasing the resulting valuation allowance by $4.8 million. The Company assessed the materiality of the error and concluded that it was not material to any prior annual or interim periods.
F-26
The Company has federal and state net operating loss carryforwards pursuant to the acquisition of SignalDemand, Cameleon Software SA, and current year losses. Internal Revenue Code Section 382 ("Section 382") places certain limitations on the annual amount of U.S. net operating loss carryforwards that can be utilized when a change of ownership occurs. The Company believes the 2013 acquisition of SignalDemand and the 2014 acquisition of Cameleon Software SA were changes in ownership pursuant to Section 382. According to French law the net operating loss carryforwards of Cameleon Software SA parent company are not subject to ownership change limitations.
The federal and foreign net operating loss and R&E tax credit carryforward amount available to be used in future periods, taking into account the 382 annual limitation and current year losses, is approximately $106.0 million and $8.2 million, respectively. The Company’s net operating losses will begin to expire in 2024, R&E credits will begin to expire in 2031, and foreign tax credits will begin to expire in 2022. Also included in net operating losses are $25.4 million of carryforwards attributable to Cameleon Software SA which have no expiration.
The Company has elected the "with-and-without approach" regarding ordering of windfall tax benefits to determine whether the windfall tax benefit reduced taxes payable in the current year. Under this approach, the windfall tax benefits would be recognized in additional paid-in capital only if an incremental tax benefit is realized after considering all other tax benefits presently available to the Company. The Company’s $30.1 million deferred tax asset related to NOL carryforwards is net of $7.9 million of unrealized excess tax benefits related to stock based compensation. The impact of the excess tax benefit will be recognized in additional paid-in capital upon utilization of the Company’s NOL and tax credits carryforward.
As of December 31, 2014, the Company determined it was more likely than not that it would be unable to fully utilize the majority of its U.S. and state deferred tax assets. As a result, the Company has recorded a valuation allowance against those assets to the extent that they cannot be realized through net operating loss carrybacks to prior years. This valuation allowance will be evaluated periodically and will be reversed partially or in whole if business results and the economic environment have sufficiently improved to support realization of some or all of the Company's deferred tax assets. In performing the analysis throughout 2015, the Company determined that there was no sufficient positive evidence to outweigh the current and historic negative evidence to determine that it was more likely than not that the deferred assets would not be realized. Therefore, the Company continues to have a valuation allowance against net deferred tax assets as of December 31, 2015.
Undistributed earnings of the Company’s foreign subsidiaries are considered permanently reinvested and, accordingly, no provision for U.S. federal or state income taxes has been provided thereon. The cumulative amount of undistributed earnings of the Company’s non-U.S. subsidiaries was immaterial for the year ended December 31, 2015. The determination of the related deferred tax liability, which requires complex analysis of international tax situations related to repatriation, is not practical at this time. The Company is presently investing in international operations located in Europe, North America, and Australia. The Company is funding the working capital needs of its foreign operations through its U.S. operations. In the future, the Company plans to utilize its foreign undistributed earnings, as well as continued funding from its U.S. operations, to support its continued foreign investment.
For the years ended December 31, 2015, 2014 and 2013, the Company had $0.2 million, $0.4 million and $0.3 million, respectively, of net unrecognized tax benefits which, if recognized, would impact the Company's effective tax rate. The Company recorded a net benefit from a previous accrual of $26,000 and expenses of $56,000 and $3,000 for interest and penalties as of December 31, 2015, 2014 and 2013, respectively. The Company believes that it is reasonably possible that there will be no change in the unrecognized tax benefits within the next twelve months.
In the third quarter of 2015, the Company settled an audit with the Internal Revenue Service for an immaterial amount related to its 2009 Research and Experimental ("R&E") tax credit. The Company is not aware of any other significant audits in progress at this time. The Company files tax returns in the United States and various state and foreign jurisdictions. The Company is subject to U.S. federal income tax examination for the calendar tax years 2012, 2013 and 2014 and state and foreign income tax examination for various years depending on the statutes of limitation of those jurisdictions.
The following table sets forth the changes to the Company's unrecognized tax benefit for the year ended December 31, 2015, 2014 and 2013 (in thousands):
F-27
Year Ended December 31, | ||||||||||||
2015 | 2014 | 2013 | ||||||||||
Beginning Balance | $ | 395 | $ | 349 | $ | 349 | ||||||
Changes based on tax positions related to prior year | 21 | 46 | — | |||||||||
Changes due to settlement | (224 | ) | — | — | ||||||||
Ending Balance | $ | 192 | $ | 395 | $ | 349 | ||||||
The table above has been updated to reflect gross tax liability, exclusive of interest and penalties and other offsetting amounts.
13. Convertible Senior Notes
2.0% Convertible Senior Notes Due December 1, 2019
In December 2014, the Company issued $143.8 million aggregate principal amount of 2.0% convertible Senior Notes (the "Senior Notes") due December 1, 2019 unless earlier purchased by the Company or converted. Interest is payable semiannually in arrears on June 1 and December 1 of each year, commencing on June 1, 2015.
The Senior Notes are governed by an Indenture between the Company, as issuer, and Wilmington Trust, National Association, as trustee. The Senior Notes are the Company's general unsecured obligations and will rank senior in right of payment to all of the Company's indebtedness that is expressly subordinated in right of payment to the Senior Notes, will rank equally in right of payment with all of Company's existing and future liabilities that are not so subordinated, will be effectively junior to any of the Company’s secured indebtedness to the extent of the value of the assets securing such indebtedness and will be structurally subordinated to all indebtedness and other liabilities (including trade payables but excluding intercompany obligations owed to the Company or its subsidiaries).
Upon conversion of the Senior Notes, the Company will pay or deliver, as the case may be, cash, shares of the Company's common stock or a combination of cash and shares of common stock, at the Company's election.
The initial conversion rate for the Senior Notes will be 29.5972 shares of common stock per $1,000 in principal amount of Senior Notes, equivalent to a conversion price of approximately $33.79 per share of common stock. Throughout the term of the Senior Notes, the conversion rate may be adjusted upon the occurrence of certain events. Holders of the Senior Notes will not receive any cash payment representing accrued and unpaid interest upon conversion. Accrued but unpaid interest will be deemed to be paid in full upon conversion rather than canceled, extinguished or forfeited. Holders may convert their Senior Notes at their option at any time prior to the close of business on the business day immediately preceding September 1, 2019 only under the following circumstances:
• | during any calendar quarter commencing after the calendar quarter ending on March 31, 2015, if the last reported sale price of the common stock for at least 20 trading days (whether or not consecutive) during a period of 30 consecutive trading days ending on the last trading day of the immediately preceding calendar quarter is greater than or equal to 130% of the conversion price on each applicable trading day; |
• | during the five consecutive business day period immediately following any five consecutive trading day period in which the trading price per $1,000 principal amount of Senior Notes for each trading day of the measurement period was less than 98% of the product of the last reported sale price of the Company's common stock and the conversion rate on each such trading day; or |
• | upon the occurrence of specified corporate events. |
On or after September 1, 2019 to the close of business on the second scheduled trading day immediately preceding the maturity date, holders may convert all or any portion of their Senior Notes regardless of the above. Upon conversion, the Company will pay or deliver cash, shares of its common stock or a combination of cash and shares of its common stock, at its election, as described in the indenture.
As of December 31, 2015, the Senior Notes are not yet convertible.
In accounting for the issuance of the Senior Notes, the Company separated the Senior Notes into liability and equity components. The carrying amount of the liability component was calculated by measuring the fair value of a similar liability that does not have an associated convertible feature. The carrying amount of the equity component representing the conversion option
F-28
was determined by deducting the fair value of the liability component from the face value of the Senior Notes as a whole. The excess of the principal amount of the liability component over its carrying amount ("debt discount") is amortized to interest expense over the term of the Senior Notes. The equity component is not remeasured as long as it continues to meet the conditions for equity classification.
In accounting for the transaction costs related to the Senior Notes issuance, the Company allocated the total amount incurred to the liability and equity components based on their relative values. Issuance costs attributable to the liability component, totaling $4.3 million, are being amortized to expense over the term of the Senior Notes, and issuance costs attributable to the equity component, totaling $1.2 million, were netted with the equity component in stockholders' equity. Additionally, the Company recorded a nominal deferred tax asset on a portion of the equity component transaction costs which are deductible for tax purposes.
The Senior Notes consist of the following (in thousands):
December 31, 2015 | December 31, 2014 | |||||||
Liability component: | ||||||||
Principal | $ | 143,750 | $ | 143,750 | ||||
Less: debt discount, net of amortization | (27,379 | ) | (33,302 | ) | ||||
Net carrying amount | $ | 116,371 | $ | 110,448 | ||||
Equity component (1) | $ | 28,714 | $ | 28,714 | ||||
(1) Recorded in the consolidated balance sheet within additional paid-in capital, net of $1.2 million issuance cost in equity.
The following table sets forth total interest expense recognized related to the Senior Notes (in thousands):
Year Ended December 31, 2015 | Year Ended December 31, 2014 | |||||||
2.0% coupon | $ | 2,875 | $ | 162 | ||||
Amortization of debt issuance costs | 795 | 46 | ||||||
Amortization of debt discount | 5,244 | 283 | ||||||
Total | $ | 8,914 | $ | 491 | ||||
As of December 31, 2015 and 2014, the fair value of the Senior Notes was $114.6 million and $114.7 million, respectively. The fair value was determined based on inputs that are observable in the market or that could be derived from, or corroborated with, observable market data, including the Company's stock price, interest rates and carrying value of the debt instrument (carrying value excludes the equity component of the Company's convertible notes classified in equity).
Note Hedge
To minimize the impact of potential economic dilution upon conversion of the Senior Notes, the Company entered into convertible note hedge transactions with respect to its common stock (the "Note Hedge"). In December 2014, the Company paid an aggregate amount of $29.4 million for the Note Hedge. The Note Hedge will expire upon maturity of the Senior Notes. The Note Hedge is intended to offset the potential dilution upon conversion of the Senior Notes and/or offset any cash payments the Company is required to make in excess of the principal amount upon conversion of the Senior Notes in the event that the market value per share of the Company's common stock, as measured under the Senior Notes, is greater than the strike price of the Note Hedge, which initially corresponds to the conversion price of the Notes and is subject to anti-dilution adjustments substantially similar to those applicable to the conversion rate of the Senior Notes. The Note Hedge is a separate transaction, entered into by the Company and is not part of the Senior Notes or the Warrant, and has been accounted for as part of additional paid-in capital.
Warrant
Separately, in December 2014, the Company entered into warrant transactions (the "Warrant"), whereby the Company sold warrants to acquire shares of the Company's common stock at a strike price of $45.48 per share. The Company received aggregate proceeds of $17.1 million from the sale of the Warrant. If the average market value per share of the Company's common stock for the reporting period, as measured under the Warrant, exceeds the strike price of the Warrant, the Warrant will have a dilutive effect on the Company's earnings per share. The Warrant is a separate transaction, entered into by the Company and is not
F-29
part of the Senior Notes or the Note Hedge, and has been accounted for as part of additional paid-in capital. Holders of the Senior Notes and Note Hedge will not have any rights with respect to the Warrant.
14. Credit Facility
In July 2012, the Company, through its wholly owned subsidiary PROS, Inc., entered into a $50 million secured Credit Agreement (the "Revolver") with Wells Fargo Bank, N.A. ("Wells Fargo"). In connection with the issuance of the Senior Notes, PROS, Inc. amended the Revolver in December 2014 to, among other things, allow for the Company’s issuance of the Senior Notes, Note Hedge and Warrant.
The Revolver is for a five year term, with interest paid at the end of the applicable one month, three month or six month interest period at a rate per annum equal to LIBOR plus an applicable margin of 1.5% to 2.25% or the Federal Funds Rate plus an applicable margin of 1.5% to 2.25%. Borrowings under the Revolver are collateralized by a first priority interest in and lien on all of the Company's material assets.
The Revolver contains affirmative and negative covenants, including covenants which restrict the ability of the Company to, among other things, create liens, incur additional indebtedness and engage in certain other transactions, in each case subject to certain exclusions. In addition, the Revolver contains certain financial covenants which become effective in the event the Company's availability under the revolver plus cash and cash equivalents falls below $20 million or upon the occurrence of an event of default. As of December 31, 2015, the Company was in compliance with all financial covenants in the Revolver.
As of December 31, 2015 and 2014, $0.1 million of unamortized debt issuance costs related to the Revolver is included in other long-term assets in the consolidated balance sheets. For both years ended December 31, 2015 and 2014, $0.1 million of debt issuance cost amortization is included in Other Expense, net in the Consolidated Statements of Comprehensive Income (Loss).
As of December 31, 2015, the Company had no outstanding borrowings under the Revolver.
15. Commitments and contingencies
Litigation:
In the ordinary course of the Company’s business, the Company regularly becomes involved in contract and other negotiations and, in more limited circumstances, becomes involved in legal proceedings, claims and litigation. The outcomes of these matters are inherently unpredictable. The Company is not currently involved in any outstanding litigation that it believes, individually or in the aggregate, will have a material adverse effect on its business, financial condition, results of operations or cash flows.
Indemnification:
The Company’s software agreements generally include certain provisions for indemnifying customers against liabilities if the Company’s software solutions infringe a third party’s intellectual property rights. To date, the Company has not incurred any losses as a result of such indemnifications and has not accrued any liabilities related to such obligations in the Company’s Consolidated Financial Statements.
Lease commitments:
The Company leases office space and office equipment under noncancelable operating leases that expire at various dates. The Company incurred approximately $3.5 million, $3.3 million and $2.1 million of total rent expense for the years ended December 31, 2015, 2014 and 2013, respectively. As of December 31, 2015, the future minimum lease commitments related to lease agreements were as follows:
Year Ending December 31, | Amount | |||
2016 | $ | 2,804 | ||
2017 | 1,054 | |||
2018 | 547 | |||
2019 | 467 | |||
2020 | 482 | |||
2021 and thereafter | — | |||
Total minimum lease payments | $ | 5,354 | ||
F-30
The Company's headquarters are located in Houston, Texas, where it leases approximately 98,000 square feet of office space. The Company also has small regional offices in London, England; Paris, France; Toulouse, France; Munich, Germany; San Francisco, California; Skokie, Illinois; and Austin, Texas. In July 2011, the Company entered into a third amendment to its corporate office lease in Houston, TX (the "Third Lease Amendment"). The Third Lease Amendment, among other things, provides for a five year extension, until September 30, 2016, and an increase in the square footage. The Third Lease Amendment has two options to extend the term of the lease for an additional 72 months. Also, the Third Lease Amendment provides for an early termination at any time after July 31, 2013. In June 2012, the Company entered into a fourth amendment to its corporate office lease in Houston, TX which increased the square footage of the corporate offices to approximately 90,000 square feet, and provided an option to an additional 7,411 square feet.
In August 2012, the Company entered into a ten year lease for approximately 3,100 square feet of office space in London, United Kingdom. The lease provides an option to terminate the lease in August 2017.
In June 2011, the Company entered into a five year lease for approximately 3,300 square feet of office space in Austin, Texas. This lease expires in September 2016.
As part of the SignalDemand acquisition, the Company assumed a lease for approximately 6,600 square feet of office in San Francisco, California. This lease expired at the end of 2015 and was renewed through December 2020.
As part of the Cameleon Software SA acquisition, the Company assumed a lease for approximately 14,380 square feet of office space in Toulouse, France, which expires February 24, 2018. As part of the Cameleon Software SA acquisition, the Company also assumed a lease for approximately 9,666 square feet of office space in Skokie, Illinois, which expires February 28, 2018 with an option to extend the term of the lease for an additional 5 years.
The Company believes its existing facilities are sufficient for its current needs. The Company may add new facilities and expand its existing facilities as it adds employees, and it believes that suitable additional or substitute space will be available as needed to accommodate any such expansion of its operations.
The Company had no capital leases at December 31, 2015 and 2014.
16. Segment and geographic information
Operating segments are the components of an enterprise about which separate financial information is available that is evaluated on a regular basis by the chief operating decision-maker ("CODM") in deciding how to allocate resources to an individual segment and in assessing performance of the segment. The Company’s CODM is its Chief Executive Officer ("CEO"), who reviews financial information presented on a consolidated basis for purposes of allocating resources and evaluating financial performance. The Company sells its pricing and revenue management software to customers in multiple industries and geographies, but has no segment managers who are held accountable for operations, operating results or components below the consolidated unit level. The company does not allocate costs at a level that would give segment managers the ability to meaningfully evaluate financial performance below the level presented to the CODM. Therefore, the Company believes that it operates in one segment and has a single reporting unit.
Revenue by Geography
The Company presents financial information on a consolidated basis and does not assess the profitability of its geographic regions. Accordingly the Company does not attempt to comprehensively assign or allocate costs to these regions and does not produce reports for, or measure the performance of, its geographic regions based on any asset-based metrics.
International revenue for the years ended December 31, 2015, 2014 and 2013, amounted to approximately $104.5 million, $103.7 million and $79.8 million, respectively, representing 62%, 56% and 55%, respectively, of annual revenue.
F-31
The following geographic information is presented for the years ended December 31, 2015, 2014 and 2013. The Company categorizes geographic revenues based on the location of the customer’s headquarters.
Year Ended December 31, | ||||||||||||||||||||
2015 | 2014 | 2013 | ||||||||||||||||||
Revenue | Percent | Revenue | Percent | Revenue | Percent | |||||||||||||||
The Americas: | ||||||||||||||||||||
United States of America | $ | 63,754 | 38 | % | $ | 82,086 | 44 | % | $ | 65,072 | 45 | % | ||||||||
Other | 10,680 | 6 | % | 15,365 | 8 | % | 12,222 | 8 | % | |||||||||||
Subtotal | 74,434 | 44 | % | 97,451 | 52 | % | 77,294 | 54 | % | |||||||||||
Europe | 47,514 | 28 | % | 45,987 | 25 | % | 33,666 | 23 | % | |||||||||||
Asia Pacific | 30,110 | 18 | % | 34,170 | 18 | % | 22,411 | 15 | % | |||||||||||
The Middle East | 14,198 | 8 | % | 6,239 | 3 | % | 9,840 | 7 | % | |||||||||||
Africa | 1,990 | 1 | % | 1,982 | 1 | % | 1,626 | 1 | % | |||||||||||
Total revenue | $ | 168,246 | 100 | % | $ | 185,829 | 100 | % | $ | 144,837 | 100 | % | ||||||||
17. Concentrations of credit risk
For the years ended December 31, 2015, 2014 and 2013, no customer accounted for 10% or more of revenue. For the year ended December 31, 2015, no customer accounted for 10% or more of accounts receivables, net and unbilled.
The Company’s cash and cash equivalents and short-term investments on deposit with any one party and at any point in time may exceed federally insured limits. To date, the Company has not incurred any losses in connection with short-term investments.
18. Related-party transactions
The Company currently has employment agreements with its executive officers. The employment agreements provide for twelve to eighteen months of salary upon termination without cause or, in some cases, for good reason and the vesting of certain stock options or other equity awards.
19. Employee retirement savings plan
The Company sponsors a 401(k) savings plan ("401(k) Plan"). The 401(k) Plan is available to substantially all United States employees and is designed to provide eligible employees with an opportunity to make regular contributions to a long-term investment and savings program. Historically, the Company’s matching contribution is defined as 50% of the first 6% of employee contributions. The Company may also make discretionary contributions. Matching contributions by the Company in 2015, 2014 and 2013 totaled approximately $1.8 million, $1.4 million and $1.1 million, respectively.
20. Quarterly results (Unaudited)
The following table presents certain unaudited quarterly financial data for the years ended December 31, 2015 and 2014. This information has been prepared on the same basis as the accompanying Consolidated Financial Statements and all necessary adjustments have been included in the amounts below to state fairly the selected quarterly information when read in conjunction with the accompanying Consolidated Financial Statements and Notes thereto.
Quarter Ended | |||||||||||||||
December 31, 2015 | September 30, 2015 | June 30, 2015 | March 31, 2015 | ||||||||||||
Total revenue | $ | 42,012 | $ | 40,866 | $ | 41,689 | $ | 43,679 | |||||||
Gross profit | $ | 26,599 | $ | 25,600 | $ | 25,959 | $ | 28,678 | |||||||
Loss from operations | $ | (15,040 | ) | $ | (15,866 | ) | $ | (12,868 | ) | $ | (11,723 | ) | |||
Net loss attributable to PROS Holdings, Inc. | $ | (17,731 | ) | $ | (18,182 | ) | $ | (15,668 | ) | $ | (14,230 | ) | |||
Net loss attributable to common stockholders per share: | |||||||||||||||
Basic | $ | (0.60 | ) | $ | (0.61 | ) | $ | (0.53 | ) | $ | (0.48 | ) | |||
Diluted | $ | (0.60 | ) | $ | (0.61 | ) | $ | (0.53 | ) | $ | (0.48 | ) | |||
F-32
Quarter Ended | |||||||||||||||
December 31, 2014 | September 30, 2014 | June 30, 2014 | March 31, 2014 | ||||||||||||
Total revenue | $ | 53,829 | $ | 46,719 | $ | 44,368 | $ | 40,913 | |||||||
Gross profit | $ | 39,319 | $ | 32,442 | $ | 29,615 | $ | 26,367 | |||||||
Loss from operations | $ | (2,316 | ) | $ | (3,720 | ) | $ | (7,871 | ) | $ | (8,500 | ) | |||
Net loss attributable to PROS Holdings, Inc. | $ | (17,459 | ) | $ | (3,734 | ) | $ | (6,996 | ) | $ | (8,455 | ) | |||
Net loss attributable to common stockholders per share: | |||||||||||||||
Basic | $ | (0.60 | ) | $ | (0.13 | ) | $ | (0.24 | ) | $ | (0.29 | ) | |||
Diluted | $ | (0.60 | ) | $ | (0.13 | ) | $ | (0.24 | ) | $ | (0.29 | ) | |||
F-33
Schedule II
Valuation and Qualifying Accounts
Balance at beginning of period | Additions charged to costs and expenses | Deductions (1) | Other (2) | Balance at end of period | |||||||||||||||
Allowance for doubtful accounts | |||||||||||||||||||
2015 | $ | 868 | $ | 319 | $ | (601 | ) | $ | — | $ | 586 | ||||||||
2014 | $ | 1,060 | $ | 8 | $ | (200 | ) | $ | — | $ | 868 | ||||||||
2013 | $ | 760 | $ | 369 | $ | (69 | ) | $ | — | $ | 1,060 | ||||||||
Valuation allowance | |||||||||||||||||||
2015 | $ | 24,027 | $ | 20,890 | $ | — | $ | (596 | ) | $ | 44,321 | ||||||||
2014 | $ | 1,357 | $ | 19,506 | $ | — | $ | 3,164 | $ | 24,027 | |||||||||
2013 | $ | — | $ | 509 | $ | — | $ | 848 | $ | 1,357 | |||||||||
(1) Deductions column represents the reversal of additions previously charged to costs and expenses and uncollectible accounts written off, net of recoveries.
(2) Additions represent valuation allowance adjustments recorded as part of the purchase accounting allocation related to the SignalDemand and Cameleon Software SA acquisitions as well as cumulative translation adjustment.
F-34
Exhibit Index
Provided | Incorporated by Reference | |||||||
Exhibit No. | Description | Herewith | Form | Filing Date | ||||
3.1 | Amended and Restated Certificate of Incorporation. | S-1/A | 6/15/2007 | |||||
3.2 | Amended and Restated Bylaws. | 8-K | 8/21/2013 | |||||
4.1 | Specimen certificate for shares of common stock. | S-1/A | 6/11/2007 | |||||
4.2 | Indenture, dated December 10, 2014 between Registrant and Wilmington Trust, National Association, as trustee. | 8-K | 12/10/2014 | |||||
4.3 | Global Note, dated December 10, 2014 between Registrant and Wilmington Trust, National Association, as trustee. | 8-K | 12/10/2014 | |||||
10.1+ | 1999 Equity Incentive Plan, as amended to date, and form of stock option agreement. | S-1 | 4/7/2007 | |||||
10.2+ | 2007 Equity Incentive Plan. | S-1/A | 6/11/2007 | |||||
10.3+ | Form of Non-Qualified Stock Option Agreement under the 2007 Equity Incentive Plan. | 10-K | 2/22/2013 | |||||
10.4+ | Form of Stock Appreciation Rights Agreement under the 2007 Equity Incentive Plan. | 10-K | 2/22/2013 | |||||
10.5+ | Form of Restricted Stock Units Agreement under the 2007 Equity Incentive Plan. | 10-K | 2/22/2013 | |||||
10.6+ | Form of Non-Plan Restricted Stock Units Agreement. | S-8 | 2/24/2014 | |||||
10.7+ | Form of Non-Plan Restricted Stock Units Agreement (France). | S-8 | 2/24/2014 | |||||
10.8+ | Form of Non-Plan Restricted Stock Units Agreement (Performance France). | S-8 | 2/24/2014 | |||||
10.9+ | Form of Market Stock Units Agreement under the 2007 Equity Incentive Plan. | 10-Q | 5/2/2013 | |||||
10.10+ | Form of Non-Plan Market Stock Units Agreement. | S-8 | 2/24/2014 | |||||
10.11+ | 2013 Employee Stock Purchase Plan. | 8-K | 6/7/2013 | |||||
10.12+ | Stock Purchase and Stockholders Agreement, dated June 8, 1998, by and among Registrant (as successor in interest to PROS Strategic Solutions, Inc.) and certain stockholders. | S-1 | 4/7/2007 | |||||
10.12.1+ | Amendment to Stock Purchase and Stockholders Agreement dated March 26, 2007 by and among Registrant and certain stockholders. | S-1 | 4/7/2007 | |||||
10.13+ | Registration Rights Agreement, dated June 8, 2007, by and among Registrant, Mariette M. Woestemeyer and Ronald F. Woestemeyer. | S-1/A | 6/11/2007 | |||||
10.14 | Office Lease, dated January 31, 2001, by and between PROS Revenue Management L.P. and Houston Community College System. | S-1 | 4/7/2007 | |||||
10.14.1 | First Amendment to Office Lease, dated March 31, 2006, by and between PROS Revenue Management L.P. and Houston Community College System. | S-1 | 4/7/2007 | |||||
10.14.2 | Second Amendment to Office Lease, dated March 1, 2007, by and between PROS Revenue Management, L.P. and Houston Community College System. | 10-K | 2/22/2013 | |||||
10.14.3 | Third Amendment to Office Lease, dated July 29, 2011, by and between PROS Revenue Management, L.P. and Houston Community College System. | 8-K | 8/3/2011 | |||||
10.14.4 | Fourth Amendment to Office Lease, dated June 27, 2012, by and between PROS Revenue Management, L.P. and Houston Community College System. | 10-K | 2/22/2013 | |||||
10.15+ | Third Amended and Restated Employment Agreement by and between PROS, Inc., PROS Holdings, Inc., and Charles H. Murphy, dated as of January 6, 2015. | 8-K | 1/8/2015 | |||||
10.16+ | Immediately Exercisable Stock Option Grant, dated April 2, 2007, by and between Registrant and Charles Murphy. | S-1/A | 5/15/2007 | |||||
10.17+ | Amended and Restated Employment Agreement, dated May 13, 2013, by and between PROS, Inc., Registrant and Ronald Woestemeyer. | 8-K | 5/5/2013 | |||||
10.18+ | Amended and Restated Employment Agreement, dated May 2, 2013, by and between PROS, Inc., Registrant and Andres Reiner. | 10-Q | 5/2/2013 | |||||
10.19+ | Employment Agreement by and between PROS, Inc., PROS Holdings, Inc. and D. Blair Crump, dated as of February 10, 2014. | 8-K | 2/10/2014 | |||||
10.20+ | Market Stock Units Grant Notice and Market Stock Units Award Agreement by and between PROS Holdings, Inc. and D. Blair Crump, dates as of February 24, 2014. | S-8 | 2/24/2014 | |||||
10.21+ | Offer Letter by and between PROS, Inc. and Stefan Schulz, dated as of January 15, 2015. | 8-K | 1/20/2015 | |||||
10.22+ | Form of Indemnity Agreement entered into among Registrant, its affiliates and its directors and officers. | 8-K | 8/21/2013 | |||||
10.23 | Tender Offer Agreement by and between Registrant and Cameleon Software, dated October 24, 2013. | 8-K | 10/24/2013 | |||||
10.24 | Agreement and Plan of Merger by and among PROS, Inc., Pandora Merger Sub Corporation, SignalDemand, Inc. and Fortis Advisors LLC, dated December 16, 2013. | 8-K | 12/16/2013 | |||||
10.25 | Credit Agreement between PROS, Inc. and Wells Fargo Bank, National Association dated July 2, 2012. | 8-K | 7/9/2012 | |||||
10.25.1 | Third Amendment to Credit Agreement, dated December 3, 2014, by and among Wells Fargo Bank, National Association, as administrative agent, the Lenders party thereto and PROS, Inc. | 8-K | 12/5/2014 | |||||
10.26 | Purchase Agreement, dated December 4, 2014 by and among Registrant, Goldman, Sachs & Co. and Deutsche Bank Securities Inc., as representatives of the several initial purchasers named therein. | 8-K | 12/10/2014 | |||||
10.27 | Base Bond Hedge Confirmation, dated December 4, 2014 by and between Registrant and Goldman, Sachs & Co. | 8-K | 12/10/2014 | |||||
10.28 | Base Bond Hedge Confirmation, dated December 4, 2014 by and between Registrant and Deutsche Bank AG, London Branch. | 8-K | 12/10/2014 | |||||
10.29 | Additional Bond Hedge Confirmation, dated December 5, 2014 by and between Registrant and Goldman, Sachs & Co. | 8-K | 12/10/2014 | |||||
10.30 | Additional Bond Hedge Confirmation, dated December 5, 2014 by and between Registrant and Deutsche Bank AG, London Branch. | 8-K | 12/10/2014 | |||||
10.31 | Base Warrant Confirmation, dated December 4, 2014 by and between Registrant and Goldman, Sachs & Co. | 8-K | 12/10/2014 | |||||
10.32 | Base Warrant Confirmation, dated December 4, 2014 by and between Registrant and Deutsche Bank AG, London Branch. | 8-K | 12/10/2014 | |||||
10.33 | Additional Warrant Confirmation, dated December 5, 2014 by and between Registrant and Goldman, Sachs & Co. | 8-K | 12/10/2014 | |||||
10.34 | Additional Warrant Confirmation, dated December 5, 2014 by and between Registrant and Deutsche Bank AG, London Branch. | 8-K | 12/10/2014 | |||||
10.35+ | Employment Agreement by and between PROS, Inc., PROS Holdings, Inc., and Stefan B. Schulz, dated March 3, 2015. | 8-K | 3/5/2015 | |||||
21.1 | List of Subsidiaries. | X | ||||||
23.1 | Consent of PricewaterhouseCoopers LLP. | X | ||||||
24.1* | Power of Attorney. | X | ||||||
31.1 | Certification of Chief Executive Officer Pursuant to Exchange Act Rule 13a-14(a)/15d-14(a). | X | ||||||
31.2 | Certification of Chief Financial Officer Pursuant to Exchange Act Rule 13a-14(a)/ 15d-14(a). | X | ||||||
32.1** | Certifications of Chief Executive Officer and Chief Financial Officer Pursuant to 18 U.S.C. Section 1350. | X | ||||||
Exhibit No. | Description | |||||||
101.INS | XBRL Instance Document. | |||||||
101.SCH | XBRL Taxonomy Extension Schema Document. | |||||||
101.CAL | XBRL Taxonomy Extension Calculation Linkbase Document. | |||||||
101.DEF | XBRL Taxonomy Extension Definition Linkbase Document. | |||||||
101.LAB | XBRL Taxonomy Extension Label Linkbase Document. | |||||||
101.PRE | XBRL Taxonomy Extension Presentation Linkbase Document. | |||||||
* | Reference is made to page 52 of this Annual Report on Form 10-K. |
** | This certification shall not be deemed "filed" for purposes of Section 18 of the Securities Act of 1934, or otherwise subject to the liability of that Section, nor shall it be deemed to be incorporated by reference into any filing under the Securities Act of 1933 or the Securities Exchange Act of 1934. |
+ | Indicates a management contract or compensatory plan or arrangement. |
F-35