Attached files
| file | filename |
|---|---|
| EX-21.1 - EXHIBIT 21.1 - LaSalle Hotel Properties | lho-2015x1231x10kxex211.htm |
| EX-23.1 - EXHIBIT 23.1 - LaSalle Hotel Properties | lho-2015x1231x10kxex231.htm |
| EX-31.1 - EXHIBIT 31.1 - LaSalle Hotel Properties | lho-2015x1231x10kxex311.htm |
| EX-31.2 - EXHIBIT 31.2 - LaSalle Hotel Properties | lho-2015x1231x10kxex312.htm |
| EX-32.1 - EXHIBIT 32.1 - LaSalle Hotel Properties | lho-2015x1231x10kxex321.htm |
| EX-10.33 - EXHIBIT 10.33 - LaSalle Hotel Properties | lho-2015x1231x10kxex1033.htm |
| EX-10.31 - EXHIBIT 10.31 - LaSalle Hotel Properties | lho-2015x1231x10kxex1031.htm |
| EX-12.1 - EXHIBIT 12.1 - LaSalle Hotel Properties | lho-2015x1231x10kxex121.htm |
UNITED STATES
SECURITIES AND EXCHANGE COMMISSION
Washington, D.C. 20549
FORM 10-K
ý | ANNUAL REPORT PURSUANT TO SECTION 13 OR 15(d) OF THE SECURITIES EXCHANGE ACT OF 1934 |
For the Fiscal Year Ended December 31, 2015
OR
¨ | TRANSITION REPORT PURSUANT TO SECTION 13 OR 15(d) OF THE SECURITIES EXCHANGE ACT OF 1934 |
For the transition period from to .
Commission file number 1-14045
LASALLE HOTEL PROPERTIES
(Exact name of registrant as specified in its charter)
Maryland | 36-4219376 |
(State or other jurisdiction of incorporation or organization) | (IRS Employer Identification No.) |
7550 Wisconsin Avenue, 10th Floor Bethesda, Maryland | 20814 |
(Address of principal executive offices) | (Zip Code) |
(301) 941-1500
(Registrant’s telephone number, including area code)
Securities registered pursuant to Section 12(b) of the Act:
Title of each class | Name of each exchange on which registered | |
Common Shares of Beneficial Interest ($0.01 par value) | New York Stock Exchange | |
7 ½% Series H Cumulative Redeemable Preferred Shares ($0.01 par value) | New York Stock Exchange | |
6 ⅜% Series I Cumulative Redeemable Preferred Shares ($0.01 par value) | New York Stock Exchange | |
Securities registered pursuant to Section 12(g) of the Act: None
Indicate by check mark if the registrant is a well-known seasoned issuer, as defined in Rule 405 of the Securities Act. Yes ý No ¨
Indicate by check mark if the registrant is not required to file reports pursuant to Section 13 or Section 15(d) of the Exchange Act. Yes ¨ No ý
Indicate by check mark whether the registrant (1) has filed all reports required to be filed by Section 13 or 15(d) of the Securities Exchange Act of 1934 during the preceding 12 months (or for such shorter period that the registrant was required to file such reports), and (2) has been subject to such filing requirements for the past 90 days. Yes ý No ¨
Indicate by check mark whether the registrant has submitted electronically and posted on its corporate Web site, if any, every Interactive Data File required to be submitted and posted pursuant to Rule 405 of Regulation S-T (§232.405 of this chapter) during the preceding 12 months (or for such shorter period that the registrant was required to submit and post such files). Yes ý No ¨
Indicate by check mark if disclosure of delinquent filers pursuant to Item 405 of Regulation S-K is not contained herein, and will not be contained, to the best of the registrant’s knowledge, in definitive proxy or information statements incorporated by reference in Part III of this Form 10-K or any amendment to this Form 10-K. ý
Indicate by check mark whether the registrant is a large accelerated filer, an accelerated filer, a non-accelerated filer or a smaller reporting company. See the definitions of “large accelerated filer,” “accelerated filer” and “smaller reporting company” in Rule 12b-2 of the Exchange Act. Check one:
Large accelerated filer x | Accelerated filer o | Non-accelerated filer o | Smaller reporting company o | |||
(Do not check if a smaller reporting company) | ||||||
Indicate by check mark whether the registrant is a shell company (as defined in Rule 12b-2 of the Exchange Act). Yes ¨ No ý
The aggregate market value of the 113,113,901 common shares of beneficial interest held by non-affiliates of the registrant was approximately $4.0 billion based on the closing price on the New York Stock Exchange for such common shares of beneficial interest as of June 30, 2015.
Number of the registrant’s common shares of beneficial interest outstanding as of February 11, 2016: 112,935,218.
DOCUMENTS INCORPORATED BY REFERENCE
Portions of the registrant’s Proxy Statement for its 2016 Annual Meeting of Shareholders to be held on or about May 5, 2016 are incorporated by reference in Part II and Part III of this report as noted therein.
LASALLE HOTEL PROPERTIES
INDEX
Item No. | Form 10-K Report Page | |
PART I | ||
1. | ||
1A. | ||
1B. | ||
2. | ||
3. | ||
4. | ||
PART II | ||
5. | ||
6. | ||
7. | ||
7A. | ||
8. | ||
9. | ||
9A. | ||
9B. | ||
PART III | ||
10. | ||
11. | ||
12. | ||
13. | ||
14. | ||
PART IV | ||
15. | ||
Forward-Looking Statements
This report, together with other statements and information publicly disseminated by LaSalle Hotel Properties (the “Company”), contains certain forward-looking statements within the meaning of Section 27A of the Securities Act of 1933, as amended (the “Securities Act”), and Section 21E of the Securities Exchange Act of 1934, as amended (the “Exchange Act”). The Company intends such forward-looking statements to be covered by the safe harbor provisions for forward-looking statements contained in the Private Securities Litigation Reform Act of 1995 and includes this statement for purposes of complying with these safe harbor provisions. Forward-looking statements, which are based on certain assumptions and describe the Company’s future plans, strategies and expectations, are generally identifiable by use of the words “believe,” “expect,” “intend,” “anticipate,” “estimate,” “project,” “may,” “plan,” “seek,” “should,” “will” or similar expressions. Forward-looking statements in this report include, among others, statements about the Company’s business strategy, including its acquisition and development strategies, industry trends, estimated revenues and expenses, ability to realize deferred tax assets and expected liquidity needs and sources (including capital expenditures and the ability to obtain financing or raise capital). You should not rely on forward-looking statements since they involve known and unknown risks, uncertainties and other factors that are, in some cases, beyond the Company’s control and which could materially affect actual results, performances or achievements. Factors that may cause actual results to differ materially from current expectations include, but are not limited to:
• | risks associated with the hotel industry, including competition for guests and meetings from other hotels and alternative lodging companies, increases in wages, energy costs and other operating costs, potential unionization or union disruption, actual or threatened terrorist attacks, any type of flu or disease-related pandemic and downturns in general and local economic conditions; |
• | the availability and terms of financing and capital and the general volatility of securities markets; |
• | the Company’s dependence on third-party managers of its hotels, including its inability to implement strategic business decisions directly; |
• | risks associated with the real estate industry, including environmental contamination and costs of complying with the Americans with Disabilities Act of 1990, as amended (the “ADA”), and similar laws; |
• | interest rate increases; |
• | the possible failure of the Company to maintain its qualification as a real estate investment trust (“REIT”) for federal income tax purposes and the risk of changes in laws affecting REITs; |
• | the possibility of uninsured losses; |
• | risks associated with redevelopment and repositioning projects, including delays and cost overruns; |
• | the risk of a material failure, inadequacy, interruption or security failure of the Company’s or the hotel managers’ information technology networks and systems; and |
• | the factors discussed under the headings “Risk Factors” and “Management’s Discussion and Analysis of Financial Condition and Results of Operations” in this Annual Report on Form 10-K. |
Accordingly, there is no assurance that the Company’s expectations will be realized. Any forward-looking statement speaks only as of the date on which it is made. New risks and uncertainties arise over time, and it is not possible for the Company to predict those events or how they may affect the Company. Except as otherwise required by law, the Company disclaims any obligations or undertaking to publicly release any updates or revisions to any forward-looking statement contained herein (or elsewhere) to reflect any change in the Company’s expectations with regard thereto or any change in events, conditions or circumstances on which any such statement is based. Accordingly, investors should use caution in relying on past forward-looking statements, which were based on results and trends at the time they were made, to anticipate future events or trends.
The “Company,” “we,” “our” or “us” means LaSalle Hotel Properties and one or more of its subsidiaries (including LaSalle Hotel Operating Partnership, L.P. (the “Operating Partnership”) and LaSalle Hotel Lessee, Inc. (together with its wholly owned subsidiaries, “LHL”)), or, as the context may require, LaSalle Hotel Properties only, the Operating Partnership only or LHL only.
1
PART I
Item 1. | Business |
General
The Company, a Maryland real estate investment trust organized on January 15, 1998, primarily buys, owns, redevelops and leases upscale and luxury full-service hotels located in convention, resort and major urban business markets. The Company is a self-administered and self-managed REIT as defined in the Internal Revenue Code of 1986, as amended (the “Code”). As a REIT, the Company is generally not subject to federal corporate income tax on that portion of its net income that is currently distributed to its shareholders. The income of LHL, the Company’s wholly owned taxable REIT subsidiary (“TRS”), is subject to taxation at normal corporate rates.
As of December 31, 2015, the Company owned interests in 47 hotels with over 12,000 guest rooms located in 10 states and the District of Columbia. Each hotel is leased to LHL under a participating lease that provides for rental payments equal to the greater of (i) a base rent or (ii) a participating rent based on hotel revenues. The LHL leases expire between December 2016 and December 2018. Lease revenue from LHL is eliminated in consolidation. A third-party non-affiliated hotel operator manages each hotel pursuant to a hotel management agreement, the terms of which are discussed in more detail under “—Hotel Managers and Hotel Management Agreements”.
Substantially all of the Company’s assets are held directly or indirectly by, and all of its operations are conducted through, the Operating Partnership. The Company is the sole general partner of the Operating Partnership. The Company owned, through a combination of direct and indirect interests, 99.9% of the common units of the Operating Partnership at December 31, 2015. The remaining 0.1% is held by limited partners who held 145,223 common units of the Operating Partnership at December 31, 2015. Subject to certain limitations, common units in the Operating Partnership are redeemable for cash, or at the Company’s option, for a like number of the Company’s common shares of beneficial interest, $0.01 par value per share.
The Company’s principal offices are located at 7550 Wisconsin Avenue, 10th Floor, Bethesda, Maryland 20814. The Company’s website is www.lasallehotels.com. The Company makes available on its website free of charge its filings with the Securities and Exchange Commission (“SEC”), including its Annual Report on Form 10-K, Quarterly Reports on Form 10-Q, Current Reports on Form 8-K and amendments to those reports. Also posted on the Company’s website, and available in print upon request, are charters of each committee of the Board of Trustees, the Company’s code of business conduct and ethics, the Company’s corporate governance guidelines and the trustee independence standards. Within the time period required by the SEC, the Company will post on its website any amendment to the code of business conduct and ethics and any waiver applicable to any executive officer, trustee or senior financial officer. The information contained on, or otherwise accessible through, the Company’s website is not incorporated into, and does not form a part of, this report or any other report or document we file with or furnish to the SEC.
Strategies and Objectives
The Company’s primary objectives are to provide income to its shareholders through increases in distributable cash flow and to increase long-term total returns to shareholders through appreciation in the value of its common shares of beneficial interest. To achieve these objectives, the Company seeks to:
• | enhance the return from, and the value of, the hotels in which it owns interests and any additional hotels the Company may acquire or develop; and |
• | invest in or acquire additional hotel properties on favorable terms. |
The Company seeks to achieve revenue growth principally through:
• | renovations, repositionings and/or expansions at selected hotels; |
• | acquisitions of full-service hotels located in convention, resort and major urban markets in the U.S. especially upscale and luxury full-service hotels in such markets where the Company perceives strong demand growth or significant barriers to entry; |
• | selective development of hotel properties, particularly upscale and luxury full-service hotels in high barrier-to-entry and high demand markets where development economics are favorable; and |
• | revenue enhancing programs at the hotels. |
2
The Company intends to acquire additional hotels in urban, convention and resort markets, consistent with the growth strategies outlined above and which may:
• | possess unique competitive advantages in the form of location, physical facilities or other attributes; |
• | be available at significant discounts to replacement cost, including when such discounts result from reduced competition for hotels with long-term management and/or franchise agreements; |
• | benefit from brand or franchise conversion or removal, new management, renovations or redevelopment or other active and aggressive asset management strategies; or |
• | have expansion opportunities. |
The Company continues to focus on eight primary urban markets; however, it will acquire assets in other markets if the investment is consistent with the Company’s strategies and return criteria. The primary urban markets are:
• Boston | • San Diego |
• Chicago | • San Francisco |
• Los Angeles | • Seattle |
• New York | • Washington, DC |
Hotel Managers and Hotel Management Agreements
The Company seeks to grow through strategic relationships with premier, internationally recognized hotel operating companies, including Westin Hotels and Resorts, Hilton Hotels Corporation, Outrigger Lodging Services, Noble House Hotels & Resorts, Hyatt Hotels Corporation, Benchmark Hospitality, White Lodging Services Corporation, Davidson Hotel Company, Kimpton Hotel & Restaurant Group, LLC, Accor, Destination Hotels, Commune Hotels and Resorts, HEI Hotels & Resorts, JRK Hotel Group, Inc., Viceroy Hotel Group, Highgate Hotels and Access Hotels & Resorts. The Company believes that having multiple operators creates a network that will generate acquisition opportunities. In addition, the Company believes its acquisition capabilities are enhanced by its considerable experience, resources and relationships in the hotel industry specifically and the real estate industry generally.
As of December 31, 2015, all of our 47 hotels are leased by LHL, and are managed and operated by third parties pursuant to management agreements entered into between LHL and the respective hotel management companies.
Our management agreements for the 47 hotels leased to LHL have the terms described below.
• | Base Management Fees. Our management agreements generally provide for the payment of base management fees between 1.0% and 4.0% of the applicable hotel’s revenues or a fixed amount, as determined in the agreements. |
• | Incentive Management and Other Fees. Some of our management agreements provide for the payment of incentive management fees between 10.0% and 20.0% of gross operating profit or as a percentage of, or in excess of, certain thresholds of net operating income or cash flow of the applicable hotel, if certain criteria are met. Certain of the management agreements also provide for the payment by us of sales and marketing, accounting and other fees. |
• | Terms. The remaining terms of our management agreements range from less than one year to 16 years not including renewals, and less than one year to 46 years including renewals. Only one management agreement has a remaining non-cancelable term of 16 years, with the next longest non-cancelable term of 13 years. |
• | Ability to Terminate. We have 46 management agreements (Park Central Hotel New York and WestHouse Hotel New York operate under one agreement) of which 42 are terminable at will and one is terminable upon sale. The remaining three management agreements are terminable only with cause or after certain anniversary dates. Termination fees range from zero to up to nine times annual base management and incentive management fees, due upon early termination. Only one management agreement has termination fees at nine times, two at eight times, one at seven times and one at six times; with the next highest at two times annual base management and incentive management fees. |
• | Operational Services. Each manager has exclusive authority to supervise, direct and control the day-to-day operation and management of the respective hotel including establishing all room rates, processing reservations, procuring inventories, supplies and services, and preparing public relations, publicity and marketing plans for the hotel. |
3
• | Executive Supervision and Management Services. Each manager supervises all managerial and other employees, reviews the operation and maintenance, prepares reports, budgets and projections, and provides other administrative and accounting support services to the respective hotel. |
• | Chain Services. Our management agreements with major brands require the managers to furnish chain services that are generally made available to other hotels managed by such managers. Such services may, for example, include: (1) the development and operation of computer systems and reservation services; (2) management and administrative services; (3) marketing and sales services; (4) human resources training services and (5) such additional services as may from time to time be more efficiently performed on a national, regional or group level. |
• | Working Capital. Our management agreements typically require us to maintain working capital for a hotel and to fund the cost of supplies such as linen and other similar items. We are also responsible for providing funds to meet the cash needs for the hotel operations if at any time the funds available from the hotel operations are insufficient to meet the financial requirements of the hotel. |
• | Furniture, Fixtures and Equipment Replacements. We are required to provide to the managers all the necessary furniture, fixtures and equipment for the operation of the hotels (including funding any required furniture, fixture and equipment replacements). Our management agreements generally provide that once each year the managers will prepare a list of furniture, fixtures and equipment to be acquired and certain routine repairs to be performed in the next year and an estimate of funds that are necessary therefore, subject to our review and approval. For purposes of funding the furniture, fixtures and equipment replacements, a specified percentage of the gross revenues of each hotel (typically 4.0%) is either deposited by the manager in an escrow account or held by the owner. |
• | Building Alterations, Improvements and Renewals. Our management agreements generally require the managers to prepare an annual estimate of the expenditures necessary for major repairs, alterations, improvements, renewals and replacements to the structural, mechanical, electrical, heating, ventilating, air conditioning, plumbing and vertical transportation elements of the hotels. In addition to the foregoing, the management agreements generally provide that the managers may propose such changes, alterations and improvements to the hotels as required by reason of laws or regulations or, in each manager’s reasonable judgment, to keep each respective hotel in a safe, competitive and efficient operating condition. |
• | Sale of a Hotel. Four of our management agreements limit our ability to sell, lease or otherwise transfer a hotel, unless the transferee assumes the related management agreement and meets specified other conditions and/or unless the transferee is not a competitor of the manager. |
• | Service Marks. During the term of our management agreements, the service mark, symbols and logos currently used by the managers may be used in the operation of the hotels. Any right to use the service marks, logo and symbols and related trademarks at a hotel will terminate with respect to that hotel upon termination of the management agreement with respect to such hotel. |
Recent Developments
On January 4, 2016, the Company repaid without fee or penalty the Westin Michigan Avenue mortgage loan in the amount of $131.3 million plus accrued interest through borrowings under its senior unsecured credit facility. The loan was due to mature in April 2016.
On January 4, 2016, the Company repaid without fee or penalty the Indianapolis Marriott Downtown mortgage loan in the amount of $96.1 million plus accrued interest through borrowings under its senior unsecured credit facility. The loan was due to mature in July 2016.
On February 11, 2016, the Company repaid without fee or penalty The Roger mortgage loan in the amount of $58.8 million plus accrued interest through borrowings under its senior unsecured credit facility. The loan was due to mature in August 2016.
Hotel Renovations
The Company believes that its regular program of capital improvements at the hotels, including replacement and refurbishment of furniture, fixtures and equipment, helps maintain and enhance its competitiveness and maximize revenue growth.
4
Joint Venture
The Company holds a 99.99% controlling interest in The Liberty Hotel. Since the Company holds a controlling interest, the accounts of the joint venture have been included in the consolidated financial statements. The 0.01% interest of the outside partner is included in noncontrolling interests in consolidated entities in the consolidated balance sheets.
Tax Status
The Company has elected to be taxed as a REIT under Sections 856 through 860 of the Code. As a result, the Company generally is not subject to corporate income tax on that portion of its net income that is currently distributed to shareholders. A REIT is subject to a number of highly technical and complex organizational and operational requirements, including requirements with respect to the nature of its gross income and assets and a requirement that it currently distribute at least 90% of its taxable income. The Company may, however, be subject to certain state and local taxes on its income and property.
Effective January 1, 2001, the Company elected to operate its wholly owned subsidiary, LHL, as a TRS. Accordingly, LHL is required to pay corporate income taxes at the applicable rates.
Seasonality
The Company’s hotels’ operations historically have been seasonal. Taken together, the hotels maintain higher occupancy rates during the second and third quarters of each year. These seasonality patterns can be expected to cause fluctuations in the quarterly hotel operations.
Competition
The hotel industry is highly competitive. Each of the hotels is located in a developed area that includes other hotel properties as well as alternative lodging companies. The number of competitive hotel properties in a particular area could have a material adverse effect on occupancy, average daily rate (“ADR”) and room revenue per available room (“RevPAR”) at the Company’s current hotels or at hotels acquired in the future. In addition, the Company may be competing for investment opportunities with entities that have substantially greater financial resources than the Company. These entities may generally be able to accept more risk than the Company can prudently manage, including risks with respect to the amount of leverage utilized, creditworthiness of a hotel operator or the geographic proximity of its investments. Competition may generally reduce the number of suitable investment opportunities offered to the Company and increase the bargaining power of property owners seeking to sell.
Environmental Matters
In connection with the ownership of hotels, the Company is subject to various federal, state and local laws, ordinances and regulations relating to environmental protection. Under these laws, a current or previous owner or operator of real estate may be liable for the costs of removal or remediation of certain hazardous or toxic substances on, under or in such property. Such laws often impose liability without regard to whether the owner or operator knew of, or was responsible for, the presence of hazardous or toxic substances. In addition, the presence of contamination from hazardous or toxic substances, or the failure to remediate such contaminated property properly, may adversely affect the owner’s ability to borrow using such property as collateral. Furthermore, a person who arranges for the disposal or treatment of a hazardous or toxic substance at a property owned by another, or who transports such substance to or from such property, may be liable for the costs of removal or remediation of such substance released into the environment at the disposal or treatment facility. The costs of remediation or removal of such substances may be substantial, and the presence of such substances may adversely affect the owner’s ability to sell such real estate or to borrow using such real estate as collateral. In connection with the ownership of hotels, the Company may be potentially liable for such costs.
The Company believes that its hotels are in compliance, in all material respects, with all federal, state and local environmental ordinances and regulations regarding hazardous or toxic substances and other environmental matters, the violation of which could have a material adverse effect on the Company. The Company has not received verbal or written notice from any governmental authority of any material noncompliance, liability or claim relating to hazardous or toxic substances or other environmental matters in connection with any of the properties currently under its ownership.
Employees
The Company had 35 employees as of February 11, 2016. All persons employed in the day-to-day operations of the hotels are employees of the management companies engaged by the lessees to operate such hotels. None of the Company’s employees is a member of any union; however, some employees of the hotel managers at several of Company’s hotels are currently represented by labor unions and are subject to collective bargaining agreements.
5
Additional Information
All reports filed with the SEC may also be read and copied at the SEC’s public reference room at 100 F Street, NE, Washington, DC 20549. Further information regarding the operation of the public reference room may be obtained by calling 1-800-SEC-0330. In addition, all of our filed reports can be obtained at the SEC’s website at www.sec.gov or through the Company’s website at www.lasallehotels.com. The information contained on, or otherwise accessible through, the Company’s website is not incorporated into, and does not form a part of, this report or any other report or document we file with or furnish to the SEC.
Item 1A. | Risk Factors |
The following risk factors and other information included in this Annual Report on Form 10-K should be carefully considered. The risks and uncertainties described below are not the only ones the Company faces. Additional risks and uncertainties not currently known to the Company or that it may currently deem immaterial also may materially adversely affect the Company. The risks described could affect the Company’s business, financial condition, liquidity, results of operations, cash flows or prospects could be materially adversely affected.
Risks Related to Our Business and the Lodging Industry
Economic conditions may reduce demand for hotel properties and adversely affect our profitability.
The performance of the lodging industry is highly cyclical and has traditionally been closely linked with the performance of the general economy and, specifically, growth in the U.S. gross domestic product (“GDP”), employment, and investment and travel demand. We cannot predict the pace or duration of the global economic cycle or the cycles of the lodging industry. In the event conditions in the industry deteriorate or do not continue to see sustained improvement, or there is an extended period of economic weakness, our occupancy rates, revenues and profitability could be adversely affected. Furthermore, other macroeconomic factors, such as consumer confidence and conditions which negatively shape public perception of travel, may have a negative effect on the lodging industry and may adversely affect our business.
Furthermore, all of our hotels are classified as luxury, upper upscale or upscale. In an economic downturn, these types of hotels may be more susceptible to a decrease in revenue, as compared to hotels in other categories that have lower room rates. This characteristic may result from the fact that upper upscale hotels generally target business and high-end leisure travelers. In periods of economic difficulties, business and leisure travelers may seek to reduce travel costs by limiting travel or seeking to reduce costs on their trips. In addition, in periods of weak demand, as may occur during a general economic recession, profitability is negatively affected by the relatively high fixed costs of operating luxury, upper upscale and upscale hotels. Consequently, any uncertainty in the general economic environment could adversely affect our business.
We will be significantly influenced by the economies and other conditions in the specific markets in which we operate, particularly in the metropolitan areas where we have high concentrations of hotels.
We focus on primary urban markets, including Boston, MA, Chicago, IL, Los Angeles, CA, New York, NY, San Diego, CA, San Francisco, CA, Seattle, WA and Washington, DC. As of December 31, 2015, our hotels were located in 14 markets in 10 states and the District of Columbia, including nine hotels located in Washington, DC, seven hotels located in San Francisco, CA, six hotels located in Los Angeles, CA, five hotels located in San Diego, CA and four hotels located in both Boston, MA and New York, NY. As a result, we are particularly susceptible to adverse market conditions in these geographic areas, including industry downturns, relocation of businesses and any oversupply of hotel rooms or a reduction in lodging demand. Adverse economic developments in the markets in which we have a concentration of hotels, or in any of the other markets in which we operate, or any increase in hotel supply or decrease in lodging demand resulting from the local, regional or national business climate, could adversely affect us.
The return on our hotels depends upon the ability of the hotel operators to operate and manage the hotels.
To maintain our status as a REIT, we are not permitted to operate any of our hotels. As a result, we are unable to directly implement strategic business decisions with respect to the daily operation and marketing of our hotels, such as decisions with respect to the setting of room rates, repositioning of a hotel, food and beverage pricing and certain similar matters. Although LHL consults with the hotel operators with respect to strategic business plans, the hotel operators are under no obligation to implement any of our recommendations with respect to such matters. Thus, even if we believe our hotels are being operated inefficiently or in a manner that does not result in satisfactory occupancy rates, RevPAR, ADR or operating profits, we may not have sufficient rights under our hotel operating agreements to enable us to force the hotel operator to change its method of operation. We generally can only seek redress if a hotel operator violates the terms of the applicable operating agreement, and then only to the extent of the remedies provided for under the terms of the agreement. Some of the operating agreements have lengthy terms and may not be terminable by us before the agreement’s expiration. In the event that we are able to and do replace any of our hotel operators,
6
we may experience significant disruptions at the affected hotels, which may adversely affect our ability to make distributions to our shareholders.
Our hotels are subject to significant competition.
The markets where our hotels are located and the luxury, upper upscale and upscale segments of the hotel business are highly competitive. Our hotels compete on the basis of location, room rates, quality, service levels, reputation, reservations systems and supply and availability of alternative lodging, among many factors. There are many competitors in the luxury, upper upscale and upscale segments in our markets, and many of these competitors may have substantially greater marketing and financial resources than we have. Furthermore, in addition to competing with traditional hotels and lodging facilities, we compete with alternative lodging companies, such as HomeAway and Airbnb, which operate websites that market available furnished, privately-owned residential properties, including homes and condominiums, that can be rented on a nightly, weekly or monthly basis. This competition could reduce occupancy levels and room revenue at our hotels, which would harm our operations. In addition, over-building in the hotel industry may increase the number of rooms available and may decrease occupancy and room rates, which can quickly destabilize a market and existing hotels can experience rapidly decreasing RevPAR and profitability. If such over-building occurs in one or more of our markets, our business, financial condition, results of operations and ability to make distributions to our shareholders could be materially and adversely affected.
Our performance and our ability to make distributions on our shares are subject to risks associated with the hotel industry.
Competition for guests, increases in operating costs, dependence on travel and poor economic conditions could adversely affect our cash flow. Our hotel properties have different economic characteristics than many other real estate assets. A typical office REIT, for example, has long-term leases with third-party tenants, which provide a relatively stable long-term stream of revenue. On the other hand, virtually all hotel guests stay at a hotel for only a few nights at a time, so the rate and occupancy at each of our hotels changes every day. As a result, we may have highly volatile earnings.
In addition, our hotels are subject to all operating risks common to the hotel industry, many of which are beyond our control. These risks include:
• | adverse effects of weak national, regional and local economic conditions; |
• | tightening credit standards; |
• | competition for guests and meetings from other hotels and alternative lodging companies, including competition and pricing pressure from Internet wholesalers and distributors; |
• | an over-supply or over-building of hotels in the markets in which we own properties; |
• | increases in operating costs, including wages, benefits, insurance, property taxes and energy, due to inflation and other factors, which may not be offset in the future by increased room rates; |
• | labor strikes, disruptions or lockouts that may impact operating performance; |
• | dependence on demand from business and leisure travelers, which may fluctuate and be seasonal; |
• | increases in energy costs, airline fares and other expenses related to travel, which may negatively affect traveling; and |
• | terrorism, terrorism alerts and warnings, military actions, pandemics or other medical events which may cause decreases in business and leisure travel. |
These factors could adversely affect the ability of the hotel operators to generate revenues which could adversely affect LHL’s ability to make rental payments to the Operating Partnership pursuant to the participating leases and ultimately impact our liquidity.
Unexpected capital expenditures could adversely affect our cash flow. Hotels require ongoing renovations and other capital improvements, including periodic replacement or refurbishment of furniture, fixtures and equipment. Under the terms of our leases, we are obligated to pay the cost of certain capital expenditures at the hotels, including new brand standards, and to pay for periodic replacement or refurbishment of furniture, fixtures and equipment. If capital expenditures exceed expectations, there can be no assurance that sufficient sources of financing will be available to fund such expenditures.
7
In addition, we have acquired hotels that have undergone significant renovation and may acquire additional hotels in the future that require significant renovation. Renovations of hotels involve numerous risks, including the possibility of environmental problems, construction cost overruns and delays, the effect on current demand, uncertainties as to market demand or deterioration in market demand after commencement of renovation and the emergence of unanticipated competition from other hotels.
The seasonality of the lodging industry may cause fluctuations in our quarterly revenues. The lodging industry is seasonal in nature. This seasonality can be expected to cause quarterly fluctuations in our revenues. Our quarterly earnings may be adversely affected by factors outside our control, including weather conditions and poor economic factors.
The increasing use of Internet travel intermediaries by consumers may reduce our revenues. Some of our hotel rooms are booked through Internet travel intermediaries, such as Travelocity.com, Expedia.com and Priceline.com. As bookings through these intermediaries increase, these intermediaries may be able to obtain higher commissions, reduced room rates or other significant contract concessions from the management companies that operate the hotels we own and acquire. Moreover, some of these Internet travel intermediaries are attempting to offer hotel rooms as a commodity, by increasing the importance of price and general indicators of quality (such as “three-star downtown hotel”), at the expense of brand identification or quality of product or service. These intermediaries hope that consumers will eventually develop brand loyalties to their reservations system rather than to lodging brands or properties. If the amount of bookings made through Internet travel intermediaries proves to be more significant than we expect, profitability may be lower than expected.
The use of business related technology could adversely affect travel and hotel demand. The increased use of teleconference and video-conference technology by businesses could result in decreased business travel as companies increase the use of technologies that allow multiple parties from different locations to participate in meetings without traveling to a centralized meeting location. To the extent that such technologies play an increased role in day-to-day business and the necessity for business related travel decreases, hotel room demand may decrease.
Terrorist attacks, natural disasters, significant military actions, outbreaks of contagious diseases or other events could adversely affect travel and hotel demand.
We own hotels in metropolitan markets that have been, or may in the future be, targets of actual or threatened terrorist attacks, including Boston, MA, Chicago, IL, New York, NY and Washington, DC. Previous terrorist attacks and subsequent terrorist alerts have adversely affected the U.S. travel and hospitality industries over the past several years, often disproportionately to the effect on the overall economy. In addition, we own 22 hotels located in areas of the West Coast that are seismically active and two hotels (Southernmost Beach Resort Key West (formerly Southernmost Hotel Collection) and The Marker Waterfront Resort) in areas that have the potential to, and will continue to, experience hurricanes. Even in the absence of direct physical damage to our hotels, the occurrence of terrorist attacks, natural disasters, significant military actions, outbreaks of diseases, such as Ebola, H1N1 or SARS, or other casualty events, will likely have a material adverse effect on business and commercial travelers and tourists, the economy generally and the hotel and tourism industries in particular.
We may not have enough insurance.
We carry comprehensive liability, fire, flood, earthquake, extended coverage and business interruption policies that insure us against losses with policy specifications and insurance limits that we believe are reasonable. There are certain types of losses, such as losses from environmental problems or terrorism, that management may not be able to insure against or may decide not to insure against since the cost of insuring is not economical. We may suffer losses that exceed our insurance coverage. Further, market conditions, changes in building codes and ordinances or other factors such as environmental laws may make it too expensive to repair or replace a property that has been damaged or destroyed, even if covered by insurance.
Our performance is subject to real estate industry conditions, the terms of our leases and management agreements.
Because real estate investments are illiquid, we may not be able to sell hotels when desired. Real estate investments generally cannot be sold quickly. We may not be able to vary our portfolio promptly in response to economic or other conditions. In addition, provisions of the Code limit a REIT’s ability to sell properties in some situations when it may be economically advantageous to do so.
Liability for environmental matters could adversely affect our financial condition. As an owner of real property, we are subject to various federal, state and local laws and regulations relating to the protection of the environment that may require a current or previous owner of real estate to investigate and clean-up hazardous or toxic substances at a property. These laws often impose such liability without regard to whether the owner knew of or caused the presence of the contaminants, and liability is not limited under the enactments and could exceed the value of the property and/or the aggregate assets of the owner. Persons who arrange for the disposal or treatment facility, whether or not such facility is owned or operated by the person, may be liable for the costs of removal or remediation of such substance released into the environment at the disposal or treatment facility. Even if
8
more than one person were responsible for the contamination, each person covered by the environmental laws may be held responsible for the entire amount of clean-up costs incurred.
Environmental laws also govern the presence, maintenance and removal of asbestos-containing materials. These laws impose liability for release of asbestos-containing materials into the air and third parties may seek recovery from owners or operators of real properties for personal injury associated with asbestos-containing materials. In connection with ownership (direct or indirect) of our hotels, we may be considered an owner or operator of properties with asbestos-containing materials. Having arranged for the disposal or treatment of contaminants, we may be potentially liable for removal, remediation and other costs, including governmental fines and injuries to persons and property.
The costs of compliance with the ADA and other government regulations could adversely affect our cash flow. Under the ADA, all public accommodations are required to meet certain federal requirements related to access and use by disabled persons. A determination that we are not in compliance with the ADA could result in imposition of fines or an award of damages to private litigants. If we are required to make substantial modifications to our hotels, whether to comply with ADA or other government regulation such as building codes or fire safety regulations, our financial condition, results of operations and ability to make shareholder distributions could be adversely affected.
Certain leases and management agreements may constrain us from acting in the best interest of shareholders or require us to make certain payments. The Hyatt Regency Boston Harbor, San Diego Paradise Point Resort and Spa, The Hilton San Diego Resort and Spa, The Roger, Viceroy Santa Monica, The Liberty Hotel, Harbor Court Hotel, Hotel Triton, Southernmost Beach Resort Key West (restaurant facility) and Hotel Vitale are each subject to a ground or land and building lease with a third-party lessor which requires us to obtain the consent of the relevant third party lessor in order to sell any of these hotels or to assign our leasehold interest in any of the ground or land and building leases. Accordingly, if we determine that the sale of any of these hotels or the assignment of our leasehold interest in any of these ground or land and building leases is in the best interest of our shareholders, we may be prevented from completing such a transaction if we are unable to obtain the required consent from the relevant lessor. The Indianapolis Marriott Downtown, Westin Copley Place and Hotel Solamar are each subject to a ground or air rights lease and do not require approval from the relevant third-party lessor. In addition, at any given time, potential investors may be disinterested in buying hotel properties subject to a ground lease and may pay a lower price for such properties than for a comparable property in fee simple, or they may not purchase such properties at any price whatsoever. For these reasons, we may have a difficult time selling a hotel property subject to a ground lease or may receive lower proceeds from a sale. Finally, as the lessee under our ground leases, we are exposed to the possibility of losing the hotel, or a portion of the hotel, upon termination, or an earlier breach by us, of the ground lease.
In some instances, we may be required to obtain the consent of the hotel operator or franchisor prior to selling the hotel. Typically, such consent is only required in connection with certain proposed sales, such as if the proposed purchaser is engaged in the operation of a competing hotel or does not meet certain minimum financial requirements.
Some of our hotels are subject to rights of first offer which may adversely affect our ability to sell those properties on favorable terms or at all.
We are subject to a franchisor’s or operator’s right of first offer, in some instances, with respect to the Embassy Suites Philadelphia - Center City, Harbor Court Hotel, Hilton San Diego Gaslamp Quarter, Hotel Triton, Indianapolis Marriott Downtown, Park Central Hotel New York and WestHouse Hotel New York, Park Central San Francisco, Sofitel Washington, DC Lafayette Square, The Hilton San Diego Resort and Spa, Westin Copley Place and Westin Michigan Avenue. These third-party rights may adversely affect our ability to timely dispose of these properties on favorable terms, or at all.
We consider acquisition opportunities in the ordinary course of our business, which may not perform as anticipated.
In the ordinary course of our business and when our liquidity position permits, we consider acquisition opportunities. The acquisition of hotel properties involves risks, including the risk that the acquired hotel property will not perform as anticipated and the risk that any actual costs for rehabilitating, repositioning, renovating and improving identified in the pre-acquisition process will exceed estimates.
We and our hotel managers rely on information technology in our operations, and any material failure, inadequacy, interruption or security failure of that technology could harm our business.
We and our hotel managers rely on information technology networks and systems, including the Internet, to process, transmit and store electronic information, and to manage or support a variety of business processes, including financial transactions and records, personal identifying information, reservations, billing and operating data. We and our hotel managers purchase some of such information technology from vendors, on whom our systems depend, and the hotel managers rely on commercially available systems, software, tools and monitoring to provide security for processing, transmission and storage of confidential customer
9
information, such as individually identifiable information, including information relating to financial accounts. Although we and our hotel managers have taken steps to protect the security of its information systems and the data maintained in those systems, these safety and security measures may not be able to prevent the systems’ improper functioning or damage, or the improper access or disclosure of personally identifiable information, such as in the event of cyber attacks, which are rapidly evolving and becoming increasingly sophisticated. For example, in February 2014, the hotel manager at the Indianapolis Marriott Downtown announced a suspected security breach of point of access sales systems at food and beverage outlets located at the hotel. Security breaches, including physical or electronic break-ins, computer viruses, attacks by hackers and similar breaches, can create system disruptions, shutdowns or unauthorized disclosure of confidential information. Any failure to maintain proper function, security and availability of our or the hotel managers’ information systems could interrupt our operations; damage our reputation; result in misstated financial reports, violations of loan covenants and/or missed reporting deadlines; result in our inability to properly monitor our compliance with the rules and regulations regarding our qualification as a REIT; require significant management attention and resources to remedy any damages that result; and subject us to liability claims or regulatory penalties.
We are subject to risks associated with the employment of hotel personnel, particularly with hotels that employ unionized labor.
Our third-party hotel managers are responsible for hiring and maintaining the labor force at each of our hotels. Although we do not directly employ or manage employees at our hotels, we are subject to the risks associated with the employment of hotel personnel, particularly at those hotels with unionized labor. From time to time, strikes, lockouts, public demonstrations or other negative actions and publicity may disrupt hotel operations. We also may incur increased legal costs and indirect labor costs as a result of contract disputes or other events. The resolution of labor disputes or new or re-negotiated labor contracts could lead to increased labor costs, either by increases in wages or benefits or by changes in work rules that raise hotel operating costs. Furthermore, labor agreements may limit the ability of the hotel managers to reduce the size of hotel workforces during an economic downturn because collective bargaining agreements are negotiated between the hotel managers and labor unions. We do not have the ability to control the outcome of these negotiations. In addition, we believe that unions are generally becoming more aggressive about organizing workers at hotels in certain locations. Potential labor activities at these hotels could significantly increase the administrative, labor and legal expenses of the third-party management companies operating these hotels and reduce the profits that we receive.
Investments in hotel-related mortgage assets, including mezzanine loans, subject us to the risk of loss.
We may originate or acquire hotel-related mortgage assets, including mezzanine loans. Investments in real estate mortgages and subordinated real estate loans are subject to the risk that one or more borrowers may default and that the collateral securing mortgages may not be sufficient or, in the case of subordinated mezzanine loans, available to enable us to recover our full investment in these loans.
Property ownership through partnerships and joint ventures could limit our control of those investments.
Partnership or joint venture investments may involve risks not otherwise present for investments made solely by us, including among others, the possibility that our co-investors might become bankrupt, might at any time have goals or interests that are different from ours because of disparate tax consequences or otherwise, and may take action contrary to our instructions, requests, policies or objectives, including our policy with respect to maintaining our qualification as a REIT. Other risks of joint venture investments include an impasse on decisions, such as a sale, because neither our co-investors nor we would have full control over the partnership or joint venture. There is no limitation under our organizational documents as to the amount of funds that may be invested in partnerships or joint ventures.
Risks Related to Our Debt and Financing
Our obligation to comply with financial covenants in our unsecured credit facilities, term loans and mortgages on some of our hotel properties could impact our operations, may require us to liquidate our properties and could adversely affect our ability to make distributions to our shareholders.
Our unsecured credit facilities and term loans. We have a $750.0 million senior unsecured credit facility (with an accordion feature that allows us to request an increase in the total commitments of up to $1.05 billion, subject to certain terms and conditions) that matures on January 8, 2018, subject to two six-month extensions that we may exercise at our option, pursuant to certain terms and conditions, including the payment of an extension fee. We also have a $300.0 million unsecured five-year term loan (with an accordion feature that allows us to request an increase in the total commitments of up to $500.0 million, subject to certain terms and conditions) and a $555.0 million unsecured five-year term loan (with an accordion feature that allows us to request an increase in the total commitments of up to $700.0 million, subject to certain terms and conditions). In addition, LHL has a $25.0 million unsecured revolving credit facility, which matures on January 8, 2018, subject to two six-month extensions that LHL may exercise at its option, pursuant to certain terms and conditions, including the payment of an extension fee.
10
Each of the senior unsecured credit facility, the term loans and the LHL unsecured revolving credit facility contain certain financial covenants relating to net worth requirements, debt ratios and fixed charge coverage and other limitations that restrict our ability to make distributions or other payments to our shareholders upon events of default. The senior unsecured credit facility and term loans also contain cross-default provisions that allow the lenders under the credit facility and term loans to stop future extensions of credit and/or accelerate the maturity of any outstanding principal balances under the credit facility or term loans if we are in default under certain other debt obligations, including our non-recourse secured mortgage indebtedness.
If we violate the financial covenants in our credit facilities or term loans, we could be required to repay all or a portion of our indebtedness with respect to such credit facility or term loan before maturity at a time when we might be unable to arrange financing for such repayment on attractive terms, or at all. Moreover, if we are unable to refinance our debt on acceptable terms, including at maturity of our credit facilities and term loans, we may be forced to dispose of hotel properties on disadvantageous terms, potentially resulting in losses that reduce cash flow from operating activities. Failure to comply with our financial covenants contained in our credit facilities and term loans, or our non-recourse secured mortgages described below, could result from, among other things, changes in our results of operations, the incurrence of additional debt or changes in general economic conditions.
Our non-recourse secured mortgages. In addition to our senior unsecured credit facility, our term loans and the LHL unsecured revolving credit facility, we have from time to time entered into non-recourse mortgages secured by specific hotel properties. Under the terms of these debt obligations, a lender’s only remedy in the event of default is against the real property securing the mortgage, except where a borrower has, among other customary exceptions, engaged in an action constituting fraud or an intentional misrepresentation. In those cases, a lender may seek a remedy for a breach directly against the borrower, including its other assets. The Indianapolis Marriott Downtown, Westin Copley Place, Westin Michigan Avenue and The Roger are each mortgaged to secure payment of indebtedness aggregating $511.3 million as of December 31, 2015. The Hyatt Regency Boston Harbor is mortgaged to secure payment of principal and interest on bonds with an aggregate par value of $42.5 million. These mortgages contain debt service coverage tests related to the mortgaged properties. If the debt service coverage ratio for that specific property fails to exceed a threshold level specified in the mortgage, cash flows from that hotel will automatically be directed to the lender to (i) satisfy required payments, (ii) fund certain reserves required by the mortgage and (iii) fund additional cash reserves for future required payments, including final payment. Cash flows will be directed to the lender (“cash trap”) until such time as we again become compliant with the specified debt service coverage ratio or the mortgage is paid off.
If we are unable to meet mortgage payment obligations, including the payment obligation upon maturity of the mortgage borrowing, the mortgage securing the specific property could be foreclosed upon by, or the property could be otherwise transferred to, the mortgagee with a consequent loss of income and asset value to us. We may also elect to sell the property, if we are able to sell the property, for a loss in advance of a foreclosure or other transfer. An event of default under our non-recourse secured mortgage may also constitute an event of default under our senior unsecured credit facility or term loans.
As of December 31, 2015, the Company is in compliance with all debt covenants, current on all loan payments and not otherwise in default under the credit facilities, term loans, bonds payable or mortgages.
Our liquidity may be reduced and our cost of debt financing may be increased because we may be unable to, or elect not to, remarket debt securities related to the Hyatt Regency Boston Harbor for which we may be liable.
We are the obligor with respect to a $37.1 million tax-exempt special project revenue bond and a $5.4 million taxable special project revenue bond, both issued by the Massachusetts Port Authority (collectively, the “Massport Bonds”). The Massport Bonds, which mature on March 1, 2018, bear interest based on weekly floating rates and have no principal reductions prior to their scheduled maturities. The Massport Bonds may be redeemed at any time, at our option, without penalty. U.S. Bank National Association (“U.S. Bank”) provides the supporting letters of credit on the Massport Bonds. The letters of credit expire on September 30, 2016. The letters of credit have two one-year extension options that we may exercise at our option, subject to certain terms and conditions, and are secured by the Hyatt Regency Boston Harbor. The letters of credit cannot be extended beyond the Massport Bonds’ maturity date. If U.S. Bank fails to renew its letters of credit at expiration and an acceptable replacement provider cannot be found, we may be required to pay off the bonds. If we are unable to, or elect not to, issue or remarket the Massport Bonds, we would expect to rely primarily on our available cash and credit facilities to pay off the Massport Bonds. At certain times, we may hold some of the Massport Bonds that have not been successfully remarketed. Our borrowing costs under our senior unsecured credit facility may be higher than tax-exempt bond financing costs. Borrowings under the credit facilities to pay off the Massport Bonds would also reduce our liquidity to meet other obligations.
Increases in interest rates may increase our interest expense.
As of December 31, 2015, $288.5 million of aggregate indebtedness (20.2% of total indebtedness) was subject to variable interest rates, excluding amounts outstanding under our term loans since we hedged their variable interest rates to fixed interest rates. An increase in interest rates could increase our interest expense and reduce our cash flow and may affect our ability to make distributions to shareholders and to service our indebtedness.
11
There is refinancing risk associated with our debt.
Our typical debt contains limited principal amortization; therefore, the vast majority of the principal must be repaid at the maturity of the loan in a so-called “balloon payment.” In the event that we do not have sufficient funds to repay the debt at the maturity of these loans, we will need to refinance this debt. If the credit environment is constrained at the time of our debt maturities, we would have a very difficult time refinancing debt. In addition, we locked in our fixed-rate debt at a point in time when we were able to obtain favorable interest rates, principal amortization and other terms. When we refinance our debt, prevailing interest rates and other factors may result in paying a greater amount of debt service, which will adversely affect our cash flow, and, consequently, our cash available for distribution to our shareholders. If we are unable to refinance our debt on acceptable terms, we may be forced to choose from a number of unfavorable options. These options include agreeing to otherwise unfavorable financing terms on one or more of our unencumbered assets, selling one or more hotels on disadvantageous terms, including unattractive prices or defaulting on the mortgage and permitting the lender to foreclose.
Our hedging strategies may not be successful in mitigating our risks associated with interest rates and could reduce the overall returns on our shareholders’ investment.
We use various derivative financial instruments to provide a level of protection against interest rate risks, but no hedging strategy can protect us completely. These instruments involve risks, such as the risk that the counterparties may fail to honor their obligations under these arrangements, that these arrangements may not be effective in reducing our exposure to interest rate changes and that a court could rule that such agreements are not legally enforceable. These instruments may also generate income that may not be treated as qualifying REIT income for purposes of the 75% or 95% REIT income tests. In addition, the nature and timing of hedging transactions may influence the effectiveness of our hedging strategies. Poorly designed strategies or improperly executed transactions could actually increase our risk and losses. Moreover, hedging strategies involve transaction and other costs. We cannot provide assurance that our hedging strategy and the derivatives that we use will adequately offset the risk of interest rate volatility or that our hedging transactions will not result in losses that may reduce the overall return on our shareholders’ investment.
Risks Related to Our Status as a REIT
Failure to qualify as a REIT would be costly.
We have operated, and intend to continue to operate, in a manner that we believe allows us to qualify as a REIT under the Code beginning with our taxable year ended December 31, 1998. No assurance can be given, however, that we will in fact qualify or remain qualified as a REIT. Qualification as a REIT involves the application of highly technical and complex provisions of the Code. Our qualification as a REIT depends on our satisfaction of certain asset, income, organizational, distribution, shareholder ownership and other requirements on a continuing basis. Moreover, new tax legislation, administrative guidance or court decisions, potentially applicable with retroactive effect, could make it more difficult or impossible for us to qualify as a REIT or could increase our tax liability or reduce our operating flexibility.
For example, among other risks, we would fail to qualify as a REIT if
• | our hotel managers do not qualify as “eligible independent contractors” under the Code, |
• | the leases of our hotel properties to LHL are not respected as true leases for federal income tax purposes, or |
• | the Operating Partnership failed to qualify as a partnership for federal income tax purposes (which would cause it to become subject to federal and state corporate income tax and would reduce significantly the amount of cash available for debt service and for distribution to its partners, including us). |
If we fail to qualify as a REIT in any taxable year, we will be subject to federal income tax (including any applicable alternative minimum tax) on our taxable income at regular corporate rates. Moreover, unless entitled to relief under certain statutory provisions, we also will be disqualified from treatment as a REIT for the four taxable years following the year during which qualification was lost. This treatment would cause us to incur additional tax liabilities, significantly impair our ability to service indebtedness and reduce the amount of cash available to make new investments or to make distributions on our common or preferred shares.
The Operating Partnership owns 100% of the common shares of a subsidiary REIT that elected to be taxed as a REIT under the Code. If our subsidiary REIT were to fail to qualify as a REIT, then our subsidiary REIT would become subject to additional federal income tax and we could in turn fail to qualify as a REIT, unless we could avail ourselves of certain relief provisions.
12
Complying with REIT requirements may cause us to forego otherwise attractive business opportunities or liquidate otherwise attractive investments and may limit our ability to hedge our liabilities effectively and cause us to incur tax liabilities.
To meet the tests applicable to REITs, we may be required to forego or exit investments we might otherwise make or hold. The REIT provisions of the Code also limit our ability to hedge our liabilities. To the extent that we enter into hedging transactions (other than certain transactions to manage risk of interest rate changes, price changes or currency fluctuations with respect to borrowings made or to be made to acquire or carry real estate assets), the income from those transactions is likely to be treated as non-qualifying income for purposes of gross income tests applicable to REITs. As a result of these rules, we may need to limit our use of advantageous hedging techniques or implement those hedges through a TRS. This could expose us to greater risks associated with changes in interest rates than we would otherwise want to bear or increase the cost of our hedging activities because our TRS would be subject to tax on gains.
Our ownership of TRSs involves additional regulation and tax, and our transactions with TRSs will subject us to a 100% penalty tax on certain income or deductions if the transactions are not conducted on arm’s-length terms.
A REIT may own up to 100% of the stock of one or more TRSs, and a TRS may hold assets and earn income that would not be qualifying assets or income if held or earned directly by a REIT. TRSs involve additional regulation, including a rule that no more than 25% of the value of a REIT’s assets may consist of stock or securities of one or more TRSs. Another rule imposes a 100% excise tax on certain transactions between a TRS and its parent REIT not conducted on an arm’s-length basis. TRSs are also subject to applicable federal, foreign, state and local income tax on their taxable income, and their after-tax net income will be available for distribution to us but is not required to be distributed to us.
Risks Related to Our Organization and Structure
Our organizational documents and agreements with our executives and applicable Maryland law contain provisions that may delay, defer or prevent change of control transactions and may prevent shareholders from realizing a premium for their shares.
Our trustees may only be removed for cause and remaining trustees may fill board vacancies. Historically, our Board of Trustees has been divided into three classes of trustees, each serving a staggered three-year term. However, at our 2014 Annual Meeting of Shareholders, the shareholders approved a Board-proposed amendment to our declaration of trust to provide for annual elections of all trustees to be phased-in over time. Starting with the 2015 Annual Meeting of Shareholders, trustees will be elected for a one-year term, so that by the 2017 Annual Meeting of Shareholders, all trustees will be elected annually. The amendment to our declaration of trust did not affect the unexpired three-year terms of the trustees elected in 2013 and 2014. In addition, our trustees may only be removed for cause by the affirmative vote of the holders of a majority of our outstanding common shares. Our declaration of trust and bylaws also provide that a majority of the remaining trustees may fill any vacancy on the Board of Trustees and that only the Board of Trustees may increase or decrease the number of persons serving on the Board of Trustees. These provisions effectively preclude shareholders from removing incumbent trustees, except for cause after a majority affirmative vote, and filling the vacancies created by such removal with their own nominees. Furthermore, we have not adopted trustee term limits or a mandatory retirement age for trustees, which may delay board rejuvenation and the rotation of trustees.
Our Board of Trustees may approve the issuance of shares with terms that may discourage a third party from acquiring the Company. The Board of Trustees has the power under the declaration of trust to classify any of our unissued preferred shares, and to reclassify any of our previously classified but unissued preferred shares from time to time, in one or more series of preferred shares, without shareholder approval. The issuance of preferred shares could adversely affect the voting power, dividend and other rights of holders of common shares and the value of the common shares.
Our declaration of trust prohibits ownership of more than 9.8% of the common shares or 9.8% of any series of preferred shares. To qualify as a REIT under the Code, no more than 50% of the value of our outstanding shares may be owned, directly or under applicable attribution rules, by five or fewer individuals (as defined to include certain entities) during the last half of each taxable year. Our declaration of trust generally prohibits direct or indirect ownership by any person of (i) more than 9.8% of the number or value (whichever is more restrictive) of the outstanding common shares or (ii) more than 9.8% of the number or value (whichever is more restrictive) of the outstanding shares of any class or series of preferred shares. Generally, shares owned by affiliated owners will be aggregated for purposes of the ownership limitation. Unless the ownership limit has been waived by our Board of Trustees, any transfer of shares that would violate the ownership limitation will result in the shares that would otherwise be held in violation of the ownership limit being designated as “shares-in-trust” and transferred automatically to a charitable trust effective on the day before the purported transfer or other event giving rise to such excess ownership. The intended transferee will acquire no rights in such shares. Our Board of Trustees, in its sole discretion, may exempt a proposed transferee from the ownership limits, subject to conditions and limitations and the receipt by our Board of Trustees of certain representations and undertakings. Our Board of Trustees has granted ownership limit waivers to certain shareholders. During the time that such waivers are effective,
13
each excepted holder will be subject to an increased ownership limit. As a condition to granting such waivers, the excepted holders were required to make representations and warranties to us, which are intended to ensure that we will continue to meet the REIT ownership requirements. If any of these representations becomes untrue or is violated, such excepted holder will lose its exemption from the ownership limits.
The Maryland Business Combination Statute applies to us. A Maryland “business combination” statute contains provisions that, subject to limitations, prohibit certain business combinations between us and an “interested stockholder” (defined generally as any person who beneficially owns 10% or more of the voting power of our shares or an affiliate thereof) for five years after the most recent date on which the shareholder becomes an interested stockholder, and thereafter impose special shareholder voting requirements on these combinations.
The Board of Trustees may choose to subject us to the Maryland Control Share Act. A Maryland law known as the “Maryland Control Share Act” provides that “control shares” of a company (defined as shares which, when aggregated with other shares controlled by the acquiring shareholder, entitle the shareholder to exercise one of three increasing ranges of voting power in electing trustees) acquired in a “control share acquisition” (defined as the direct or indirect acquisition of ownership or control of “control shares”) have no voting rights except to the extent approved by the company’s shareholders by the affirmative vote of at least two-thirds of all the votes entitled to be cast on the matter, excluding all interested shares. Our bylaws currently provide that we are not subject to these provisions. However, the Board of Trustees, without shareholder approval, may repeal this bylaw and cause us to become subject to the Maryland Control Share Act.
Other provisions of our organization documents may delay or prevent a change of control of the Company. Among other provisions, our organizational documents provide that the number of trustees constituting the full Board of Trustees may be fixed only by the trustees and that a special meeting of shareholders may not be called by holders of common shares holding less than a majority of the outstanding common shares entitled to vote at such meeting.
Our executive officers have agreements that provide them with benefits in the event of a change in control of the Company. We entered into agreements with our executive officers that provide them with severance benefits if their employment ends under certain circumstances within one year following a “change in control” of the Company (as defined in the agreements) or if the executive officer resigns for “good reason” (as defined in the agreements). These benefits could increase the cost to a potential acquirer of the Company and thereby prevent or deter a change in control of the Company that might involve a premium price for the common shares or otherwise be in our shareholders’ best interests.
We depend on the efforts and expertise of our key executive officers and would be adversely affected by the loss of their services.
We depend on the efforts and expertise of our President and Chief Executive Officer, as well as our other executive officers, to execute our business strategy. The loss of their services, and our inability to find suitable replacements, would have an adverse effect on our business.
A large number of shares available for future sale could adversely affect the market price of our common shares and may be dilutive to current shareholders.
The sales of a substantial number of our common shares, or the perception that such sales could occur, could adversely affect prevailing market prices for our common shares. As of December 31, 2015, there were 200,000,000 common shares authorized under our declaration of trust, as amended, of which 112,959,547 were outstanding. Our Board of Trustees may authorize the issuance of additional authorized but unissued common shares or other authorized but unissued securities at any time, including pursuant to our 2014 Equity Incentive Plan. We also have filed a registration statement with the SEC allowing us to offer, from time to time, an indefinite amount of equity securities (including common or preferred shares) on an as-needed basis and subject to our ability to affect offerings on satisfactory terms based on prevailing conditions. Our ability to execute our business strategy depends on our access to an appropriate blend of debt financing, including unsecured lines of credit and other forms of secured and unsecured debt, and equity financing, including issuances of common and preferred equity. No prediction can be made about the effect that future distributions or sales of our common shares will have on the market price of our common shares.
Holders of our outstanding preferred shares have dividend, liquidation and other rights that are senior to the rights of the holders of our common shares.
Our Board of Trustees has the authority to designate and issue preferred shares with liquidation, dividend and other rights that are senior to those of our common shares. As of December 31, 2015, 2,750,000 shares of our 7 ½% Series H Cumulative Redeemable Preferred Shares (the “Series H Preferred Shares”) and 4,400,000 shares of our 6 ⅜% Series I Cumulative Redeemable Preferred Shares (the “Series I Preferred Shares”) were issued and outstanding. The aggregate liquidation preference with respect to the outstanding preferred shares is approximately $178.8 million, and annual dividends on our outstanding preferred shares are
14
approximately $12.2 million. Holders of our Series H Preferred Shares and Series I Preferred Shares are entitled to cumulative dividends before any dividends may be declared or set aside on our common shares. Upon our voluntary or involuntary liquidation, dissolution or winding up, before any payment is made to holders of our common shares, holders of these preferred shares are entitled to receive a liquidation preference of $25.00 per share plus any accrued and unpaid distributions. This will reduce the remaining amount of our assets, if any, available to distribute to holders of our common shares. In addition, holders of these preferred shares have the right to elect two additional trustees to our Board of Trustees whenever dividends on the preferred shares are in arrears in an aggregate amount equivalent to six or more quarterly dividends, whether or not consecutive. Because our decision to issue securities will depend on market conditions and other factors beyond our control, we cannot predict or estimate the amount, timing or nature of our future preferred offerings. Thus, our shareholders bear the risk of our future securities issuances reducing the market price of our common shares and diluting their interest.
The market price and trading volume of our common shares may be volatile.
The market price of our common shares may be volatile. In addition, the trading volume in our common shares may fluctuate and cause significant price variations to occur. If the market price of our common shares declines significantly, shareholders may be unable to resell their shares at or above the price at which they traded when they acquired them. We cannot provide assurance that the market price of our common shares will not fluctuate or decline significantly in the future. Some of the factors that could negatively affect the market price of our common shares or result in fluctuations in the market price or trading volume of our common shares include:
• | actual or anticipated variations in our quarterly operating results; |
• | changes in our operations or earnings estimates; |
• | publication of research reports about us, the real estate industry or the lodging industry; |
• | changes in our dividend policy; |
• | increases in market interest rates that lead purchasers of our shares to demand a higher yield; |
• | changes in market valuations of similar companies; |
• | adverse market reaction to any additional equity or debt we may issue or incur in the future; |
• | share repurchases under the Company’s previously authorized $100.0 million share repurchase program; |
• | additions or departures of key management personnel; |
• | speculation in the press or investment community; |
• | the realization of any of the other risk factors presented in this Annual Report on Form 10-K; and |
• | general U.S. and worldwide market and economic conditions. |
Item 1B. | Unresolved Staff Comments |
None.
15
Item 2. | Properties |
Hotel Properties
As of December 31, 2015, the Company owned interests in the following 47 hotel properties:
Hotel Properties | Number of Guest Rooms | Location | ||||
1. | Hotel Amarano Burbank | 132 | Burbank, CA | |||
2. | L’Auberge Del Mar | 121 | Del Mar, CA | |||
3. | Hilton San Diego Gaslamp Quarter | 286 | San Diego, CA | |||
4. | Hotel Solamar (1) | 235 | San Diego, CA | |||
5. | San Diego Paradise Point Resort and Spa (1) | 462 | San Diego, CA | |||
6. | The Hilton San Diego Resort and Spa (1) | 357 | San Diego, CA | |||
7. | Harbor Court Hotel (1) | 131 | San Francisco, CA | |||
8. | The Marker San Francisco (formerly Hotel Monaco San Francisco) | 208 | San Francisco, CA | |||
9. | Hotel Triton (1) | 140 | San Francisco, CA | |||
10. | Hotel Vitale (1) | 200 | San Francisco, CA | |||
11. | Park Central San Francisco | 681 | San Francisco, CA | |||
12. | Serrano Hotel | 236 | San Francisco, CA | |||
13. | Villa Florence | 189 | San Francisco, CA | |||
14. | Chaminade Resort and Conference Center | 156 | Santa Cruz, CA | |||
15. | Viceroy Santa Monica (1) | 162 | Santa Monica, CA | |||
16. | Chamberlain West Hollywood | 114 | West Hollywood, CA | |||
17. | Le Montrose Suite Hotel | 133 | West Hollywood, CA | |||
18. | Le Parc Suite Hotel | 154 | West Hollywood, CA | |||
19. | The Grafton on Sunset | 108 | West Hollywood, CA | |||
20. | The Donovan | 193 | Washington, D.C. | |||
21. | Hotel George | 139 | Washington, D.C. | |||
22. | Hotel Madera | 82 | Washington, D.C. | |||
23. | Hotel Palomar, Washington, DC | 335 | Washington, D.C. | |||
24. | Hotel Rouge | 137 | Washington, D.C. | |||
25. | Mason & Rook Hotel (formerly Hotel Helix) | 178 | Washington, D.C. | |||
26. | Sofitel Washington, DC Lafayette Square | 237 | Washington, D.C. | |||
27. | The Liaison Capitol Hill | 343 | Washington, D.C. | |||
28. | Topaz Hotel | 99 | Washington, D.C. | |||
29. | Southernmost Beach Resort Key West (4) | 260 | Key West, FL | |||
30. | The Marker Waterfront Resort | 96 | Key West, FL | |||
31. | Hotel Chicago | 354 | Chicago, IL | |||
32. | Westin Michigan Avenue (2) | 752 | Chicago, IL | |||
33. | Indianapolis Marriott Downtown (1)(2) | 622 | Indianapolis, IN | |||
34. | Hyatt Regency Boston Harbor (1)(2) | 270 | Boston, MA | |||
35. | Onyx Hotel | 112 | Boston, MA | |||
36. | The Liberty Hotel (1) | 298 | Boston, MA | |||
37. | Westin Copley Place (2)(3) | 803 | Boston, MA | |||
38. | Gild Hall | 126 | New York, NY | |||
39. | The Roger (1)(2) | 194 | New York, NY | |||
40. | Park Central Hotel New York | 761 | New York, NY | |||
41. | WestHouse Hotel New York | 172 | New York, NY | |||
42. | The Heathman Hotel | 150 | Portland, OR | |||
43. | Embassy Suites Philadelphia – Center City | 288 | Philadelphia, PA | |||
44. | Westin Philadelphia | 294 | Philadelphia, PA | |||
45. | Lansdowne Resort | 296 | Lansdowne,VA | |||
46. | Alexis Hotel | 121 | Seattle, WA | |||
47. | Hotel Deca | 158 | Seattle, WA | |||
Total number of guest rooms | 12,075 | |||||
16
(1) | Property subject to a long-term ground or land and building lease. |
(2) | Property subject to a mortgage/debt. |
(3) | Property subject to a long-term air rights lease. |
(4) | Property subject to a ground lease on a restaurant facility. |
Each of the Company’s hotels is full service, with 15 classified as “luxury,” 30 classified as “upper upscale” and two classified as “upscale,” as defined by Smith Travel Research (“STR”), a provider of hotel industry data.
Item 3. | Legal Proceedings |
The nature of hotel operations exposes the Company and its hotels to the risk of claims and litigation in the normal course of their business. The Company is not presently subject to any material litigation nor, to the Company’s knowledge, is any litigation threatened against the Company, other than routine actions for negligence or other claims and administrative proceedings arising in the ordinary course of business, some of which are expected to be covered by liability insurance and all of which collectively are not expected to have a material adverse effect on the liquidity, results of operations, business or financial condition of the Company.
Item 4. | Mine Safety Disclosures |
Not applicable.
PART II
Item 5. | Market for Registrant’s Common Equity, Related Shareholder Matters and Issuer Purchases of Equity Securities |
Information about the Company’s equity compensation plans is incorporated by reference to the material in the Company’s Proxy Statement for the 2016 Annual Meeting of Shareholders (the “Proxy Statement”).
Market Information
The common shares of the Company began trading on the New York Stock Exchange (“NYSE”) on April 24, 1998 under the symbol “LHO”. The following table sets forth, for the periods indicated, the high and low sale prices per common share and the cash distributions declared per share:
Calendar Year 2015 | Calendar Year 2014 | ||||||||||||||||||||||
High | Low | Distribution (1) | High | Low | Distribution (1) | ||||||||||||||||||
First Quarter | $ | 43.56 | $ | 36.54 | $ | 0.38 | $ | 33.36 | $ | 28.41 | $ | 0.28 | |||||||||||
Second Quarter | $ | 39.70 | $ | 34.87 | $ | 0.45 | $ | 36.60 | $ | 30.84 | $ | 0.38 | |||||||||||
Third Quarter | $ | 38.46 | $ | 27.70 | $ | 0.45 | $ | 37.33 | $ | 34.05 | $ | 0.38 | |||||||||||
Fourth Quarter | $ | 32.10 | $ | 24.91 | $ | 0.45 | $ | 41.88 | $ | 32.94 | $ | 0.38 | |||||||||||
(1) Amounts are rounded to the nearest whole cent for presentation purposes.
The closing price for the Company’s common shares, as reported by the NYSE on December 31, 2015, was $25.16 per share.
17
SHARE PERFORMANCE GRAPH
The following graph provides a comparison of the cumulative total return on the common shares from December 31, 2010 to the NYSE closing price per share on December 31, 2015 with the cumulative total return on the Standard & Poor’s 500 Composite Stock Price Index (the “S&P 500”) and the FTSE National Association of Real Estate Investment Trusts Equity REITs Index (“FTSE NAREIT Equity Index”). Total return values were calculated assuming a $100 investment on December 31, 2010 with reinvestment of all dividends in (i) the common shares, (ii) the S&P 500 and (iii) the FTSE NAREIT Equity Index.
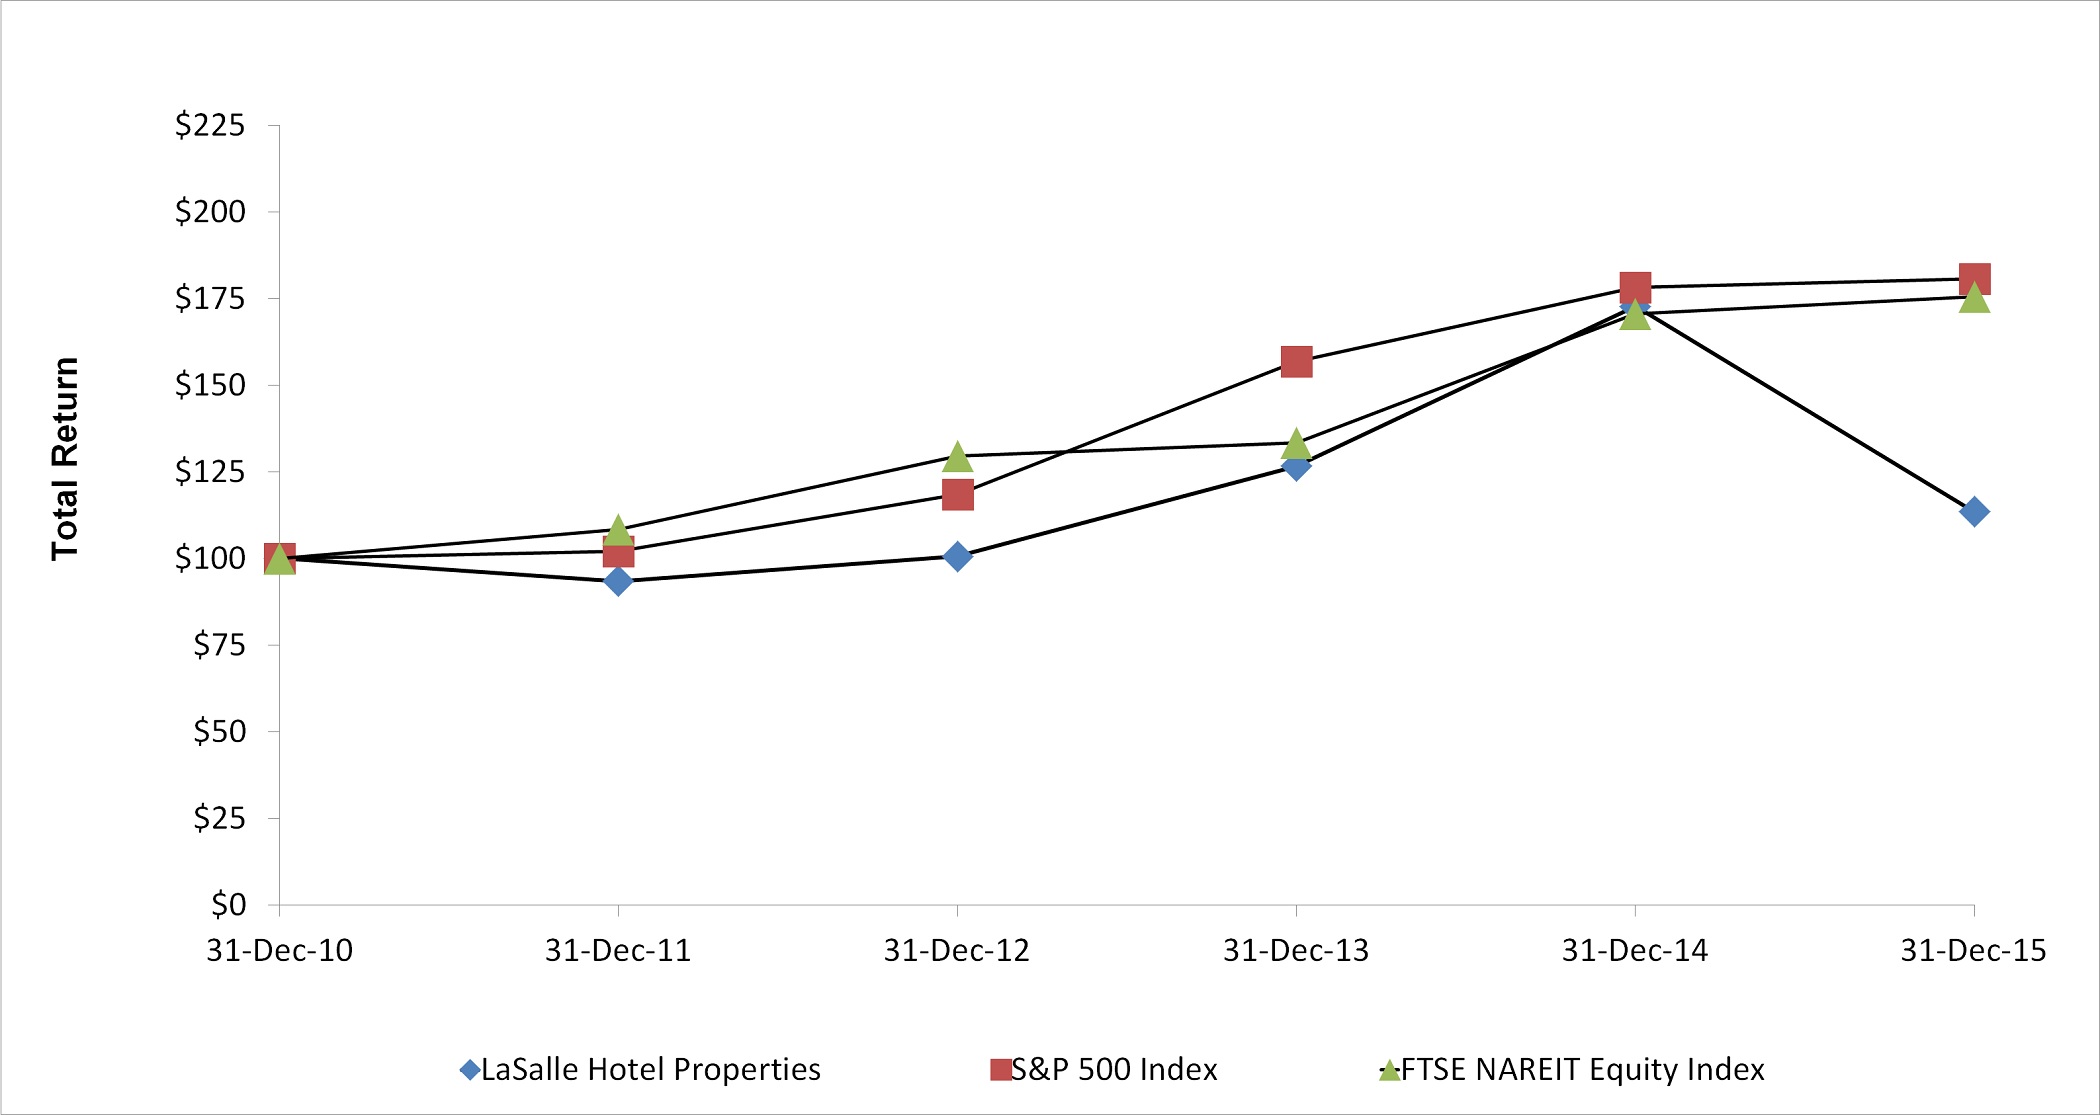
The actual returns on the graph above are as follows:
Name | Value of Initial Investment at December 31, 2010 | Value of Initial Investment at December 31, 2011 | Value of Initial Investment at December 31, 2012 | Value of Initial Investment at December 31, 2013 | Value of Initial Investment at December 31, 2014 | Value of Initial Investment at December 31, 2015 | |||||||||||||||||
LaSalle Hotel Properties | $ | 100.00 | $ | 93.43 | $ | 100.62 | $ | 126.64 | $ | 172.69 | $ | 113.46 | |||||||||||
S&P 500 Index | $ | 100.00 | $ | 102.11 | $ | 118.45 | $ | 156.82 | $ | 178.28 | $ | 180.75 | |||||||||||
FTSE NAREIT Equity Index | $ | 100.00 | $ | 108.28 | $ | 129.62 | $ | 133.32 | $ | 170.68 | $ | 175.51 | |||||||||||
Shareholder Information
As of February 11, 2016, there were 60 record holders of the Company’s common shares of beneficial interest, including shares held in “street name” by nominees who are record holders, and approximately 25,100 beneficial holders.
Distribution Information
For 2015, the Company paid $1.725 per common share/unit in distributions, of which $1.6570 (rounded) was recognized as 2015 distributions for tax purposes and $0.0680 (rounded) will be recognized as 2016 distributions for tax purposes. The entire $1.6570 represented ordinary income. Distributions for 2015 were paid quarterly to the Company’s common shareholders and unitholders at a level of $0.375 per common share/unit for the first quarter and $0.450 per common share/unit for the second, third and fourth quarters.
For 2014, the Company paid $1.405 per common share/unit in distributions, all of which was recognized as 2014 distributions for tax purposes. Additionally, distributions of $0.0506 per common share for 2013 were recognized as 2014 distributions for tax purposes, bringing total 2014 distributions for tax purposes to $1.4556 per common share (rounded), 100% of which represented ordinary income. Distributions for 2014 were paid quarterly to the Company’s common shareholders and unitholders at a level of $0.28 per common share/unit for the first quarter and $0.375 per common share/unit for the second, third and fourth quarters.
18
The Company’s federal and state tax returns for the year ended December 31, 2015 have not been filed. The taxability information presented for the Company’s dividends paid in 2015 is based upon management’s estimate. The distributions for the year ended December 31, 2014 were revised from the Company’s previous estimate and agree to the tax returns filed for the year ended December 31, 2014.
The declaration of distributions by the Company is at the sole discretion of the Company’s Board of Trustees, and depends on the actual cash flow of the Company, its financial condition, capital expenditure requirements for the Company’s hotels, the annual distribution requirements under the REIT provisions of the Code and such other factors as the Board of Trustees deems relevant.
Operating Partnership Units and Recent Sales of Unregistered Securities
The Operating Partnership issued 3,181,723 common units of limited partnership interest to third parties on April 24, 1998 (inception), in conjunction with the Company’s initial public offering. The following is a summary of common unit activity since inception:
Common units issued at initial public offering | 3,181,723 | |
Common units issued: | ||
2000-2006 | 86,667 | |
2011 | 296,300 | |
Common units redeemed: | ||
1999-2015 | (3,419,467 | ) |
Common units outstanding at December 31, 2015 | 145,223 | |
Holders of common units of limited partnership interest receive distributions per unit in the same manner as distributions on a per common share basis to the common shareholders of beneficial interest. Subject to certain limitations, common units of limited partnership interest are redeemable for cash or, at the Company’s option, for a like number of common shares of beneficial interest of the Company.
Common shares issued upon redemption of common units of limited partnership interest were issued in reliance on an exemption from registration under Section 4(a)(2) of the Securities Act and Regulation D promulgated thereunder. The Company relied on the exemption based on factual representations given by the limited partners who received the common shares of beneficial interest.
On December 29, 2011, in connection with the Company’s acquisition of Park Central Hotel New York and as part of the consideration for the hotel acquisition, the Operating Partnership issued 296,300 common units of limited partnership interest. The issuance of the common units was effected in reliance upon an exemption from registration provided by Section 4(a)(2) under the Securities Act and Regulation D promulgated thereunder. The Company relied on the exemption based on representations given by the holders of the common units. On May 13, 2015, the Company issued an aggregate of 151,077 common shares of beneficial interest in connection with the redemption of 151,077 of such common units of limited partnership interest.
19
Item 6. | Selected Financial Data |
The following tables set forth selected historical operating and financial data for the Company. The selected historical operating and financial data for the Company for the years ended December 31, 2015, 2014, 2013, 2012 and 2011 have been derived from the historical financial statements of the Company. The following selected financial information should be read in conjunction with “Management’s Discussion and Analysis of Financial Condition and Results of Operations” and all of the financial statements and notes thereto included elsewhere in this Annual Report on Form 10-K.
LASALLE HOTEL PROPERTIES Selected Historical Operating and Financial Data (Unaudited, in thousands, except share data) | |||||||||||||||||||
For the year ended December 31, | |||||||||||||||||||
2015 | 2014 | 2013 | 2012 | 2011 | |||||||||||||||
Operating Data: | |||||||||||||||||||
Revenues: | |||||||||||||||||||
Hotel operating revenues | $ | 1,208,591 | $ | 1,101,457 | $ | 969,356 | $ | 862,146 | $ | 714,005 | |||||||||
Other income | 7,993 | 8,321 | 7,937 | 4,929 | 5,002 | ||||||||||||||
Total revenues | 1,216,584 | 1,109,778 | 977,293 | 867,075 | 719,007 | ||||||||||||||
Expenses: | |||||||||||||||||||
Hotel operating expenses | 724,531 | 668,790 | 596,241 | 533,237 | 452,838 | ||||||||||||||
Depreciation and amortization | 180,855 | 155,035 | 143,991 | 124,363 | 111,282 | ||||||||||||||
Real estate taxes, personal property taxes and insurance | 65,438 | 57,805 | 53,374 | 44,551 | 35,425 | ||||||||||||||
Ground rent | 16,076 | 14,667 | 11,117 | 8,588 | 7,720 | ||||||||||||||
General and administrative | 25,197 | 23,832 | 22,001 | 19,769 | 17,120 | ||||||||||||||
Acquisition transaction costs | 499 | 2,379 | 2,646 | 4,498 | 2,571 | ||||||||||||||
Other expenses | 17,225 | 7,369 | 9,361 | 3,017 | 2,527 | ||||||||||||||
Total operating expenses | 1,029,821 | 929,877 | 838,731 | 738,023 | 629,483 | ||||||||||||||
Operating income | 186,763 | 179,901 | 138,562 | 129,052 | 89,524 | ||||||||||||||
Interest income | 2,938 | 1,812 | 9,679 | 4,483 | 48 | ||||||||||||||
Interest expense | (54,333 | ) | (56,628 | ) | (57,516 | ) | (52,896 | ) | (39,704 | ) | |||||||||
Loss from extinguishment of debt | (831 | ) | (2,487 | ) | 0 | 0 | 0 | ||||||||||||
Income before income tax benefit (expense) and discontinued operations | 134,537 | 122,598 | 90,725 | 80,639 | 49,868 | ||||||||||||||
Income tax benefit (expense) | 1,292 | (2,306 | ) | (470 | ) | (9,062 | ) | (7,048 | ) | ||||||||||
Income from continuing operations | 135,829 | 120,292 | 90,255 | 71,577 | 42,820 | ||||||||||||||
Net income from discontinued operations | 0 | 0 | 0 | 0 | 796 | ||||||||||||||
Gain on sale of properties | 0 | 93,205 | 0 | 0 | 0 | ||||||||||||||
Net income | 135,829 | 213,497 | 90,255 | 71,577 | 43,616 | ||||||||||||||
Net (income) loss attributable to noncontrolling interests: | |||||||||||||||||||
Redeemable noncontrolling interest in consolidated entity | 0 | 0 | 0 | 0 | 2 | ||||||||||||||
Noncontrolling interests in consolidated entities | (16 | ) | (16 | ) | (17 | ) | 0 | 0 | |||||||||||
Noncontrolling interests of common units in Operating Partnership | (261 | ) | (636 | ) | (303 | ) | (281 | ) | (1 | ) | |||||||||
Net (income) loss attributable to noncontrolling interests | (277 | ) | (652 | ) | (320 | ) | (281 | ) | 1 | ||||||||||
Net income attributable to the Company | 135,552 | 212,845 | 89,935 | 71,296 | 43,617 | ||||||||||||||
Distributions to preferred shareholders | (12,169 | ) | (14,333 | ) | (17,385 | ) | (21,733 | ) | (29,952 | ) | |||||||||
Issuance costs of redeemed preferred shares | 0 | (951 | ) | (1,566 | ) | (4,417 | ) | (731 | ) | ||||||||||
Net income attributable to common shareholders | $ | 123,383 | $ | 197,561 | $ | 70,984 | $ | 45,146 | $ | 12,934 | |||||||||
20
LASALLE HOTEL PROPERTIES Selected Historical Operating and Financial Data (Unaudited, in thousands, except share data) | |||||||||||||||||||
For the year ended December 31, | |||||||||||||||||||
2015 | 2014 | 2013 | 2012 | 2011 | |||||||||||||||
Earnings per Common Share: | |||||||||||||||||||
Net income attributable to common shareholders before discontinued operations and excluding amounts attributable to unvested restricted shares: | |||||||||||||||||||
Basic | $ | 1.09 | $ | 1.89 | $ | 0.73 | $ | 0.52 | $ | 0.15 | |||||||||
Diluted | $ | 1.09 | $ | 1.88 | $ | 0.73 | $ | 0.52 | $ | 0.15 | |||||||||
Net income attributable to common shareholders excluding amounts attributable to unvested restricted shares: | |||||||||||||||||||
Basic | $ | 1.09 | $ | 1.89 | $ | 0.73 | $ | 0.52 | $ | 0.16 | |||||||||
Diluted | $ | 1.09 | $ | 1.88 | $ | 0.73 | $ | 0.52 | $ | 0.16 | |||||||||
Weighted average number of common shares outstanding: | |||||||||||||||||||
Basic | 112,685,235 | 104,188,785 | 97,041,484 | 85,757,969 | 81,155,228 | ||||||||||||||
Diluted | 113,096,420 | 104,545,895 | 97,228,671 | 85,897,274 | 81,326,304 | ||||||||||||||
Balance Sheet Data: | |||||||||||||||||||
Investment in hotel properties, net | $ | 3,817,676 | $ | 3,428,556 | $ | 3,383,188 | $ | 3,053,044 | $ | 2,712,174 | |||||||||
Total assets | 4,074,817 | 3,700,334 | 3,581,038 | 3,256,570 | 2,833,275 | ||||||||||||||
Borrowings under credit facilities | 21,000 | 0 | 220,606 | 153,000 | 265,000 | ||||||||||||||
Term loans | 855,000 | 477,500 | 477,500 | 477,500 | 0 | ||||||||||||||
Bonds payable | 42,500 | 42,500 | 42,500 | 42,500 | 42,500 | ||||||||||||||
Mortgage loans, including unamortized loan premiums | 511,294 | 501,090 | 514,456 | 579,220 | 643,897 | ||||||||||||||
Noncontrolling interests in consolidated entities | 18 | 17 | 18 | 18 | 17 | ||||||||||||||
Noncontrolling interests of common units in Operating Partnership | 3,198 | 6,660 | 6,054 | 5,786 | 5,613 | ||||||||||||||
Preferred shares, liquidation preference | 178,750 | 178,750 | 237,472 | 227,472 | 394,222 | ||||||||||||||
Total shareholders’ equity | 2,374,267 | 2,441,709 | 2,103,391 | 1,853,126 | 1,765,613 | ||||||||||||||
Other Data: | |||||||||||||||||||
Funds from operations (1) | $ | 304,300 | $ | 259,940 | $ | 215,219 | $ | 169,607 | $ | 123,251 | |||||||||
Earnings before interest, taxes, depreciation and amortization (1) | 370,556 | 429,002 | 290,666 | 253,481 | 200,952 | ||||||||||||||
Cash provided by operating activities | 337,519 | 283,236 | 245,565 | 216,364 | 165,495 | ||||||||||||||
Cash used in investing activities | (642,002 | ) | (78,001 | ) | (422,045 | ) | (524,154 | ) | (569,936 | ) | |||||||||
Cash provided by (used in) financing activities | 196,052 | (104,492 | ) | 154,778 | 322,655 | 411,666 | |||||||||||||
Cash dividends declared per common share (2) | $ | 1.73 | $ | 1.41 | $ | 0.96 | $ | 0.71 | $ | 0.44 | |||||||||
(1) | See “Non-GAAP Financial Measures” below in Item 7. Management’s Discussion and Analysis of Financial Condition and Results of Operations for a detailed description and reconciliation of funds from operations and earnings before interest, taxes, depreciation and amortization to net income attributable to common shareholders. |
(2) | Amounts are rounded to the nearest whole cent for presentation purposes. |
21
Item 7. | Management’s Discussion and Analysis of Financial Condition and Results of Operations |
Overview
During 2015, the Company’s hotels continued to operate within a favorable environment. The economic indicators that the Company tracks were generally encouraging. Consumer confidence remained at a high level, despite having an uneven path during the year. Unemployment continued its decline, ending the year at 5.0%, which was the lowest unemployment rate since April 2008. Airline enplanements were steady to slightly up during 2015. Only one of the economic indicators that the Company tracks, corporate profits, weakened during the year, as reported through the third quarter and thus far for the fourth quarter. Overall, the lodging industry benefited from a positive economic landscape. Industry demand increased by 2.9% and was partially offset by a 1.1% increase in supply. The favorable demand-supply picture resulted in a U.S. lodging industry-wide occupancy of 65.6%, a 1.7% improvement over 2014. U.S. lodging industry ADR improved by 4.4%. As such, 2015 U.S. lodging industry RevPAR increased 6.3%. The Company’s portfolio benefited from the operating environment, and RevPAR at the Company’s hotels increased. During 2015, the Company’s funds from operations (“FFO”) per diluted share/unit increased as compared to 2014 due mainly to improvements in the performance of its hotel portfolio. The Company’s earnings before interest, taxes, depreciation and amortization (“EBITDA”) decreased during 2015 as compared to 2014 primarily due to a $93.2 million combined gain on the sales of Hilton Alexandria Old Town and Hotel Viking during 2014.
For 2015, the Company had net income attributable to common shareholders of $123.4 million, or $1.09 per diluted share. FFO was $304.3 million, or $2.69 per diluted share/unit (based on 113,296,279 weighted average shares and units outstanding during the year ended December 31, 2015) and EBITDA was $370.6 million. RevPAR in 2015 was $193.95, and was negatively impacted by the hotel workers’ union (the “Union”) disruption at the Park Central Hotel New York and WestHouse Hotel New York, which is discussed below. The Company considers RevPAR and EBITDA to be key measures of the performance of the individual hotels. RevPAR for the total portfolio increased 1.4% for 2015, and excluding the Union impact at Park Central Hotel New York and WestHouse Hotel New York, RevPAR for the total portfolio increased by 2.6%. During 2015, the Company continued to implement measures that resulted in efficient hotel operations.
The Company transitioned management companies at three of its hotels in San Francisco in July 2015. As a result of these transitions, in late August, the Union alleged health and safety violations at two of the Company’s hotels in Manhattan: Park Central Hotel New York and WestHouse Hotel New York. The Company believes these allegations were a targeted attack against the Company related to the three hotels in San Francisco. Despite the fact that neither hotel had received any New York City or New York State health or safety violations during or since the time the allegations began, both hotels had no choice but to test against all claims.
In order to adequately test for these alleged violations, the Park Central Hotel New York and WestHouse Hotel New York were forced to close many of their available rooms during the final six weeks of the third quarter and for the first three weeks of the fourth quarter.
In order to resolve the dispute at the Park Central Hotel New York and WestHouse Hotel New York, the Company reached an agreement with the Union, and as of October 22, 2015, both hotels were back to normal operations. Pursuant to the agreement, the Company agreed that two of its hotels in San Francisco will be subject to card check neutrality, which will be effective in phases over the next 14 months. In return, the Company received concessions from the Union at both of these hotels as well as certain hotels in other markets.
The temporary interruption at the Park Central Hotel New York and WestHouse Hotel New York negatively impacted the Company’s portfolio-wide results in 2015, decreasing RevPAR by 120 basis points and EBITDA by $9.2 million, based on forecasted performance at the hotels.
Hotel operations depend on the state of the overall economy which can significantly impact hotel operational performance and thus, impact the Company’s financial position. Should any of the hotels experience a significant decline in operational performance, it may affect the Company’s ability to make distributions to its shareholders, service debt or meet other financial obligations.
The Company measures hotel performance by evaluating financial metrics such as RevPAR, FFO and EBITDA. The Company evaluates the hotels in its portfolio and potential acquisitions using these metrics discussed above to determine each portfolio hotel’s contribution or acquisition hotel’s potential contribution toward reaching the Company’s goals of providing income to its shareholders through increases in distributable cash flow and increasing long-term total returns to shareholders through appreciation in the value of its common shares. The Company invests in capital improvements throughout the portfolio to continue to increase the competitiveness of its hotels and improve their financial performance. The Company actively seeks to acquire hotel properties, but continues to face significant competition for acquisitions that meet its investment criteria.
22
Please refer to “Non-GAAP Financial Measures” below for a detailed discussion of the Company’s use of FFO and EBITDA and a reconciliation of FFO and EBITDA to net income attributable to common shareholders, a U.S. generally accepted accounting principles (“GAAP”) measurement.
On July 20, 2015, the Company provided a junior mezzanine loan (the “Mezzanine Loan”) secured by pledges of equity interests in the entities that own the hotel properties, Shutters on the Beach and Casa Del Mar, in Santa Monica, CA. The Company entered into the Mezzanine Loan for a total purchase price of $80.0 million before closing costs. The Mezzanine Loan bears interest at a variable interest rate equal to LIBOR plus 7.75%, which rate was 8.09% as of December 31, 2015. Interest-only payments are to be received monthly with the option of prepayment, pursuant to certain terms and conditions. The Mezzanine Loan matures on August 9, 2017 and has five one-year extension options, subject to conditions. The Mezzanine Loan is subordinate to a $235.0 million first mortgage loan and a $90.0 million senior mezzanine loan secured by the properties that also mature on August 9, 2017.
Critical Accounting Policies
The consolidated financial statements include the accounts of the Company, the Operating Partnership, LHL and their subsidiaries in which they have a controlling interest, including joint ventures. All significant intercompany balances and transactions have been eliminated.
The preparation of the consolidated financial statements in conformity with GAAP requires management to make estimates and assumptions that affect the reported amounts of certain assets and liabilities and the amounts of contingent assets and liabilities at the balance sheet date and the reported amounts of revenues and expenses during the reporting periods. In preparing these financial statements, management has used the information available including the Company’s past history, industry standards and the current economic environment, among other factors, in forming its estimates and judgments of certain amounts included in the consolidated financial statements.
It is possible that the ultimate outcome as anticipated by management in formulating its estimates inherent in these financial statements might not materialize. However, application of the critical accounting policies below involves the exercise of judgment and use of assumptions as to future uncertainties and, as a result, actual results could differ from those estimates. In addition, other companies may determine these estimates differently, which may impact comparability of the Company’s results of operations to those of companies in similar businesses.
Investment in Hotel Properties
Upon acquisition, the Company determines the fair value of the acquired long-lived assets, assumed debt and any intangible assets or liabilities. The Company’s investments in hotel properties are carried at cost and depreciated using the straight-line method over an estimated useful life of 30 to 40 years for buildings, 15 years for building improvements, the shorter of the useful life of the improvement or the term of the related tenant lease for tenant improvements, 7 years for land improvements, 20 years for golf course land improvements, 20 years for swimming pool assets and 3 to 5 years for furniture, fixtures and equipment. For investments subject to land and building leases that qualify as capital leases, assets are recorded at the estimated fair value of the right to use the leased property at acquisition and depreciated over the shorter of the useful lives of the assets or the term of the respective lease. Renovations and/or replacements that improve or extend the life of the asset are capitalized and depreciated over their estimated useful lives.
The Company is required to make subjective assessments as to the useful lives and classification of its properties for purposes of determining the amount of depreciation expense to reflect each year with respect to those properties. These assessments have a direct impact on the Company’s net income. Should the Company change the expected useful life or classification of particular assets, it would result in a change in depreciation expense and annual net income.
The Company reviews each hotel for impairment at the end of each reporting period or as events and circumstances dictate throughout the year. A property is considered impaired when the sum of estimated future undiscounted cash flows over the estimated remaining holding period is less than the carrying amount of a property.
At the end of each reporting period, the Company assesses whether any quantitative or qualitative triggering events have occurred in relation to a property. Examples of situations considered to be triggering events include:
• | a substantial decline in operating cash flows during the period, including declines related to decreased occupancy, ADR or RevPAR; |
• | a current or projected loss from operations; |
23
• | a significant cost accumulation above the original acquisition/development estimate; |
• | a change in plan to sell the property prior to the end of its useful life or holding period; |
• | a significant decrease in market price not in line with general market trends; and |
• | any other quantitative or qualitative events deemed significant by our management or our Board of Trustees. |
If the presence of one or more triggering events as described above is identified at the end of a reporting period or throughout the year with respect to a hotel, the Company performs a recoverability test. In doing so, an estimate of undiscounted future cash flows over the estimated remaining holding period is compared to the carrying amount of the hotel.
Impairment is indicated if the results of a recoverability analysis indicate that the carrying amount of a hotel exceeds the estimated future undiscounted cash flows. An impairment charge is recorded equal to the excess of the carrying value of the hotel over the fair value. When determining the fair value of a property, the Company makes certain assumptions including, but not limited to, consideration of:
• | projected operating cash flows – considering factors such as booking pace, growth rates, occupancy, room rates, property-specific operating costs and future capital expenditures; |
• | projected cash flows from the eventual disposition of the hotel based upon our estimation of a property-specific capitalization rate; |
• | property-specific discount rates; and |
• | comparable selling prices. |
The Company considers a hotel as held for sale when a contract for sale is entered into, a substantial non-refundable deposit has been received from the purchaser and sale is expected to occur within one year.
Upon sale of a hotel, the Company determines its profit from the sale under the full accrual method provided the following applicable criteria are met: a sale is consummated; the buyer’s initial and continuing investments are adequate to demonstrate a commitment to pay for the property; the Company’s receivable, if applicable, is not subject to future subordination; the Company has transferred to the buyer the usual risks and rewards of ownership; and the Company does not have a substantial continuing involvement with the property. If all of these conditions are met, the Company will recognize the full profit on the sale.
Comparison of the Year Ended December 31, 2015 to the Year Ended December 31, 2014
Industry travel was stronger during the year ended December 31, 2015 compared to the prior year, although there were underlying signs of weakening trends. Moderate demand improvements and low supply growth led to an occupancy increase, which has encouraged operators to increase pricing. The year ended December 31, 2015 had solid RevPAR results for the industry, but the pace of RevPAR growth decelerated during each successive quarter of the year. With respect to the Company’s hotels, ADR grew 2.4% during the year ended December 31, 2015, while occupancy decreased 0.9%, which resulted in RevPAR improvement of 1.4% year-over-year. Excluding the impact at Park Central Hotel New York and WestHouse Hotel New York, ADR grew 2.7% during the year ended December 31, 2015, while occupancy decreased 0.1%, which resulted in RevPAR improvement of 2.6% year-over-year.
Hotel Operating Revenues
Hotel operating revenues, including room, food and beverage and other operating department revenues, increased $107.1 million from $1,101.5 million in 2014 to $1,208.6 million in 2015. This increase is due primarily to the hotel operating revenues generated from the 2014 and 2015 hotel acquisitions, which consist of the acquisitions of Hotel Vitale, The Heathman Hotel, Park Central San Francisco and The Marker Waterfront Resort (collectively, the “2014 and 2015 Acquisition Properties”). The 2014 and 2015 Acquisition Properties, which are not comparable year-over-year, contributed $104.5 million to the increase in hotel operating revenues. Additionally, the effects of the moderately improving U.S. economy, which resulted in a 3.0% increase in RevPAR across the portfolio, excluding the Hilton Alexandria Old Town and Hotel Viking (collectively, the “2014 Disposition Properties”) and the Park Central Hotel New York and WestHouse Hotel New York, attributable to a 3.8% increase in ADR, partially offset by a 0.7% decrease in occupancy, contributed to the increase in hotel operating revenues.
The following hotels experienced significant increases in total room, food and beverage and other operating department revenues primarily as a result of the effects of the moderately improving economy:
24
• | $5.5 million increase from Westin Copley Place; |
• | $3.5 million increase from Hotel Chicago; |
• | $3.5 million increase from L’Auberge Del Mar; |
• | $3.4 million increase from Indianapolis Marriott Downtown; |
• | $3.2 million increase from The Hilton San Diego Resort and Spa; |
• | $3.0 million increase from Southernmost Beach Resort Key West; |
• | $2.5 million increase from Hyatt Regency Boston Harbor; and |
• | $2.0 million increase from Hilton San Diego Gaslamp Quarter. |
These increases are partially offset by a $19.0 million decrease related to the sale of the 2014 Disposition Properties. Additionally, total room, food and beverage and other operating department revenues significantly decreased by $9.0 million at the Park Central Hotel New York and WestHouse Hotel New York due to the disruptive Union activity at the hotels. Hotel operating revenue from Westin Philadelphia decreased by $2.2 million due to the completion of the hotel renovation reflecting the significant number of rooms that were out of service during the renovation period.
Hotel operating revenues across the remainder of the portfolio remained relatively constant, increasing a net $6.2 million across 32 additional hotels in the portfolio.
Other Income
Other income decreased $0.3 million from $8.3 million in 2014 to $8.0 million in 2015 primarily due to lower non-operating miscellaneous income, partially offset by increased insurance gains from insurance proceeds related to minor property damage at various properties.
Hotel Operating Expenses
Hotel operating expenses increased $55.7 million from $668.8 million in 2014 to $724.5 million in 2015. This overall increase is primarily due to $64.2 million from the results of the 2014 and 2015 Acquisition Properties, which are not comparable year-over-year.
The overall increase is partially offset by a $11.4 million decrease related to the sale of the 2014 Disposition Properties. Additionally, total room, food and beverage and other direct and other indirect expenses decreased by $2.3 million at the Park Central Hotel New York and WestHouse Hotel New York reflecting the decreased revenue due to the disruptive Union activity at the hotels.
Hotel operating expenses across the remainder of the portfolio remained relatively constant, increasing a net $5.2 million across the 41 additional hotels in the portfolio. Cost savings initiatives throughout the portfolio resulted in decreased operating expenses at selected properties which partially offset overall increases in hotel operating expenses.
Depreciation and Amortization
Depreciation and amortization expense increased $25.9 million from $155.0 million in 2014 to $180.9 million in 2015. Of the increase, $13.4 million is attributable to the 2014 and 2015 Acquisition Properties, which are not comparable year-over-year. Depreciation and amortization expense increased a net $15.1 million across the remaining hotels in the portfolio due to the depreciation of new assets placed into service reflecting the Company’s recent renovation activity. These increases are partially offset by $2.6 million from the 2014 Disposition Properties, which are not comparable year-over-year.
Real Estate Taxes, Personal Property Taxes and Insurance
Real estate taxes, personal property taxes and insurance expenses increased $7.6 million from $57.8 million in 2014 to $65.4 million in 2015. This increase is primarily due to $6.0 million from the 2014 and 2015 Acquisition Properties, which are not comparable year-over-year. The increase is partially offset by a $1.0 million decrease in real estate taxes, personal property taxes and insurance expense attributable to the sale of the 2014 Disposition Properties, which are also not comparable year-over-year. Real estate taxes and personal property taxes increased by $3.1 million across the remaining hotels in the portfolio due primarily to increased property values or tax rates at certain properties, primarily the two Chicago properties, which were slightly offset by successful real estate tax appeals. Insurance expense decreased by $0.5 million reflecting slightly lower premiums throughout the portfolio.
Ground Rent
Ground rent increased $1.4 million from $14.7 million in 2014 to $16.1 million in 2015. Certain hotels are subject to ground rent under operating leases which call for either fixed or variable payments based on the hotel’s performance. Hotel Vitale, which
25
is not comparable year-over-year, contributed $0.8 million to the 2015 increase. The other hotels subject to ground leases contributed a net $0.6 million to the increase due to improved operating results.
General and Administrative
General and administrative expense increased $1.4 million from $23.8 million in 2014 to $25.2 million in 2015 due primarily to increased compensation costs, partially due to additional staffing as a result of portfolio growth.
Acquisition Transaction Costs
Acquisition transaction costs of $2.4 million in 2014 and $0.5 million in 2015 relate to the purchase of the 2014 and 2015 Acquisition Properties and the placing of the Mezzanine Loan.
Other Expenses
Other expenses increased $9.8 million from $7.4 million in 2014 to $17.2 million in 2015 due primarily to an increase of $6.1 million in one-time expenses associated with the alleged health and safety claims by the Union at the Park Central Hotel New York and WestHouse Hotel New York. These expenses include guest relocation expenses, clean up, legal and payroll. A net $3.3 million increase in management transition expenses, severance and pre-opening costs in 2015 was incurred at a number of properties across the portfolio. In addition, losses from property damage, retail lease expenses and other miscellaneous expenses increased by a net $0.4 million.
Interest Income
Interest income increased $1.1 million from $1.8 million in 2014 to $2.9 million in 2015 as a result of the February 10, 2014 repayment of the $72.0 million mezzanine loan which was acquired in July 2012, partially offset by the placing of the new $80.0 million Mezzanine Loan, which was acquired in July 2015.
Interest Expense
Interest expense decreased $2.3 million from $56.6 million in 2014 to $54.3 million in 2015 due to a decrease in the Company’s weighted average interest rate, partially offset by an increase in the weighted average debt outstanding. The Company’s weighted average debt outstanding increased from $1.30 billion in 2014 to $1.42 billion in 2015 due primarily to borrowings for the following:
• | additional borrowings to purchase the 2014 and 2015 Acquisition Properties and the July 2015 Mezzanine Loan; |
• | additional borrowings to redeem the remainder of 7 ¼% Series G Cumulative Redeemable Preferred Shares (the “Series G Preferred Shares”) in July 2014; and |
• | additional borrowings to finance other capital improvements during 2014 and 2015. |
The above borrowings were partially offset by paydowns with proceeds from the following:
• | the repayment of the mezzanine loan in February 2014; |
• | the sale of Hilton Alexandria Old Town in June 2014; |
• | the sale of Hotel Viking in September 2014; |
• | the December 2014 common share offering; and |
• | positive operating results from the hotel properties. |
The Company’s weighted average interest rate, including the effect of capitalized interest, decreased from 4.06% in 2014 to 3.54% in 2015. This decrease is due in part to the repayment of the Westin Copley Place 5.28% fixed rate mortgage loan in June 2015 and replacing it with a variable rate mortgage loan on Westin Copley Place in July 2015, which had a rate of 2.09% as of December 31, 2015. Interest capitalized on renovations increased from $0.4 million in 2014 to $0.9 million in 2015 primarily due to various renovation projects throughout the portfolio.
Loss from Extinguishment of Debt
Loss from extinguishment of debt of $2.5 million in 2014 relates to the write-off of a portion of the unamortized deferred financing costs for the Company’s senior unsecured credit facility and Second Term Loan (as defined below). These costs were recorded in connection with the original agreements that were in effect prior to the Company refinancing its senior unsecured credit facility and Second Term Loan on January 8, 2014. Loss from extinguishment of debt of $0.8 million in 2015 relates to the write-off of the unamortized deferred financing costs for the Company’s First Term Loan (as defined below) due to its repayment prior to maturity on November 5, 2015.
26
Income Tax Benefit
Income tax changed by $3.6 million from an income tax expense of $2.3 million in 2014 to an income tax benefit of $1.3 million in 2015. This change is the result of a decrease in LHL’s net income before income tax expense of $8.5 million from a net income before income tax expense of $3.6 million in 2014 to a net loss before income tax benefit of $4.9 million in 2015. The 2015 income tax benefit also was impacted by the finalization and related adjustments of the 2014 federal and state tax returns during the 2015 period. For the year ended December 31, 2015, LHL’s income tax benefit was calculated using an estimated federal and state tax rate of 42.5%.
Gain on Sale of Properties
The gain on sale of properties of $93.2 million relates to the sale of Hilton Alexandria Old Town on June 17, 2014 for $43.5 million and the sale of Hotel Viking on September 10, 2014 for $49.7 million.
Noncontrolling Interests in Consolidated Entities
Noncontrolling interests in consolidated entities represent the allocation of income or loss to the outside preferred ownership interests in a subsidiary and the outside ownership interest in a joint venture.
Noncontrolling Interests of Common Units in Operating Partnership
Noncontrolling interests of common units in Operating Partnership represent the allocation of income or loss of the Operating Partnership to the common units held by third parties based on their weighted average percentage ownership throughout the period. At December 31, 2015, third party limited partners held 0.1% of the common units in the Operating Partnership.
Distributions to Preferred Shareholders
Distributions to preferred shareholders decreased $2.1 million from $14.3 million in 2014 to $12.2 million in 2015 due to decreased distributions on the Series G Preferred Shares, which were fully redeemed on July 3, 2014.
Issuance Costs of Redeemed Preferred Shares
Issuance costs of redeemed preferred shares of $1.0 million in 2014 represent the offering costs related to the remaining Series G Preferred Shares, which were all redeemed on July 3, 2014. The excess of fair value over carrying value (i.e. offering costs) is included in the determination of net income attributable to common shareholders.
Comparison of the Year Ended December 31, 2014 to the Year Ended December 31, 2013
Industry travel was stronger during the year ended December 31, 2014 compared to the prior year. Demand improvements and limited supply growth led to occupancy growth, which has encouraged operators to increase pricing and resulted in ADR growth. With respect to the Company’s hotels, ADR grew 7.4% during the year ended December 31, 2014, while occupancy increased 1.3%, which resulted in RevPAR improvement of 8.8% year-over-year.
Hotel Operating Revenues
Hotel operating revenues including room, food and beverage and other operating department revenues increased $132.1 million from $969.4 million in 2013 to $1,101.5 million in 2014. This increase is due primarily to the hotel operating revenues generated from the 2013 and 2014 hotel acquisitions, which consist of the acquisitions of Hotel Triton, Harbor Court Hotel, Serrano Hotel, Southernmost Beach Resort Key West, Hotel Vitale and The Heathman Hotel (collectively, the “2013 and 2014 Acquisition Properties”). The 2013 and 2014 Acquisition Properties, which are not comparable year-over-year, contributed $81.4 million to the increase in hotel operating revenues. Additionally, the effects of the continually improving economic environment, which resulted in an 8.8% increase in RevPAR across the portfolio excluding the 2014 Disposition Properties, attributable to a 7.4% increase in ADR and a 1.3% increase in occupancy, contributed to the increase in hotel operating revenues.
The following hotels experienced significant increases in total room, food and beverage and other operating department revenues primarily as a result of the effects of the improving economy:
• | $5.4 million increase from Westin Copley Place; |
• | $4.3 million increase from The Hilton San Diego Resort and Spa; |
• | $4.3 million increase from Hyatt Regency Boston Harbor; |
• | $4.2 million increase from San Diego Paradise Point Resort and Spa; and |
• | $2.8 million increase from The Liberty Hotel. |
27
Additionally, total room, food and beverage and other operating department revenues increased $26.0 million at Park Central Hotel New York and WestHouse Hotel New York resulting from the completion of the hotel renovation in late 2013.
These increases are partially offset by a $14.2 million decrease related to the sale of the 2014 Disposition Properties.
Hotel operating revenues across the remainder of the portfolio also showed improvement, increasing a net $17.9 million across 32 additional hotels in the portfolio.
Other Income
Other income increased $0.4 million from $7.9 million in 2013 to $8.3 million in 2014 due primarily to increased gains of $0.7 million from insurance proceeds related to minor property damage at various properties partially offset by a decrease of $0.3 million related to retail lease income.
Hotel Operating Expenses
Hotel operating expenses increased $72.6 million from $596.2 million in 2013 to $668.8 million in 2014. This overall increase is primarily due to $43.2 million from the results of the 2013 and 2014 Acquisition Properties, which are not comparable year-over-year. To a lesser extent, the increase is a result of increased operating costs associated with higher occupancies at certain properties in the portfolio attributable to the slowly improving economic environment and the completion of the Park Central Hotel New York and WestHouse Hotel New York renovation.
The following hotels experienced significant increases in total room, food and beverage, other direct and other indirect expenses primarily as a result of increased occupancies at the hotels:
• | $18.4 million increase from Park Central Hotel New York and WestHouse Hotel New York (due to completion of the 2013 hotel renovation); |
• | $2.6 million increase from San Diego Paradise Point Resort and Spa; |
• | $2.4 million increase from Hyatt Regency Boston Harbor; |
• | $2.3 million increase from The Hilton San Diego Resort and Spa; and |
• | $2.3 million increase from Westin Copley Place. |
These increases are partially offset by a $8.3 million decrease related to the sale of the 2014 Disposition Properties.
Hotel operating expenses across the remainder of the portfolio increased slightly by a net $9.7 million across 33 additional hotels in the portfolio.
Depreciation and Amortization
Depreciation and amortization expense increased $11.0 million from $144.0 million in 2013 to $155.0 million in 2014. The increase is due, in part, to $8.2 million from the 2013 and 2014 Acquisition Properties, which are not comparable year-over-year. Depreciation and amortization expense increased a net $4.6 million across the remaining hotels in the portfolio due to the depreciation of new assets placed into service, reflecting the renovation activity at several hotels. These increases are partially offset by $1.8 million from the 2014 Disposition Properties, which are not comparable year-over-year.
Real Estate Taxes, Personal Property Taxes and Insurance
Real estate taxes, personal property taxes and insurance expenses increased $4.4 million from $53.4 million in 2013 to $57.8 million in 2014. This increase is primarily due to $3.8 million of taxes and insurance expenses from the 2013 and 2014 Acquisition Properties, which are not comparable year-over-year. Real estate taxes and personal property taxes increased a net $1.1 million across the remaining hotels in the portfolio primarily resulting from increased assessed property values or tax rates at certain properties and to a lesser extent, the completion of the Park Central Hotel New York and WestHouse Hotel New York renovation on which the capitalization of real estate taxes ceased at the end of 2013. These increases are partially offset by successful real estate tax appeals and real estate tax refunds at certain other properties, and a reduction in real estate tax expense attributable to the 2014 Disposition Properties. Insurance expense decreased by $0.5 million between the two periods primarily as a result of the February 10, 2014 repayment of the $72.0 million mezzanine loan acquired in July 2012 which property insurance was placed on to secure the loan.
Ground Rent
Ground rent increased $3.6 million from $11.1 million in 2013 to $14.7 million in 2014. Certain hotels are subject to ground rent under operating leases which call for either fixed or variable payments based on the hotel’s performance. Harbor Court Hotel, Southernmost Beach Resort Key West and Hotel Vitale, which are not comparable year-over-year, contributed $2.6 million to the
28
2014 increase. The other hotels subject to ground leases contributed a net $1.0 million to the increase due to improved operating results.
General and Administrative
General and administrative expense increased $1.8 million from $22.0 million in 2013 to $23.8 million in 2014 due primarily to increased compensation costs and partially due to additional staffing as a result of portfolio growth and professional fees.
Acquisition Transaction Costs
Acquisition transaction costs of $2.4 million in 2014 and $2.6 million in 2013 relate to the purchase of the 2013 and 2014 Acquisition Properties and, to a lesser extent, transaction costs for the April 30, 2014 land parcel purchase adjacent to the Onyx Hotel and the purchase of Park Central San Francisco on January 23, 2015.
Other Expenses
Other expenses decreased $2.0 million from $9.4 million in 2013 to $7.4 million in 2014 due primarily to a net decrease of $2.3 million in pre-opening and management transition expenses, mainly as a result of the completion of the newly renovated Park Central Hotel New York and WestHouse Hotel New York in 2013 which offset 2014 increases at the Serrano Hotel, Hotel Chicago and The Marker San Francisco. This decrease is partially offset by a $0.1 million increase in losses from property damage, which are largely covered by insurance proceeds and a $0.2 million increase in retail lease expenses.
Interest Income
Interest income decreased $7.9 million from $9.7 million in 2013 to $1.8 million in 2014 as a result of the February 10, 2014 repayment of the $72.0 million mezzanine loan which was acquired in July 2012.
Interest Expense
Interest expense decreased $0.9 million from $57.5 million in 2013 to $56.6 million in 2014 due to a decrease in the Company’s weighted average debt outstanding and weighted average interest rate. The Company’s weighted average debt outstanding decreased from $1.33 billion in 2013 to $1.30 billion in 2014 due primarily to paydowns with proceeds from the following:
• | the March 2013 issuance of the Series I Preferred Shares; |
• | the issuance of common shares under the Company’s equity distribution agreement during 2013; |
• | the repayment of the mezzanine loan in February 2014; |
• | the sale of Hilton Alexandria Old Town in June 2014; |
• | the sale of Hotel Viking in September 2014; |
• | the December 2014 common share offering; and |
• | positive operating results from the hotel properties. |
The above paydowns were partially offset by borrowings for the following:
• | additional borrowings to purchase the 2013 and 2014 Acquisition Properties; |
• | additional borrowings to redeem 4,000,000 of the 6,348,888 Series G Preferred Shares in April 2013; |
• | additional borrowings to redeem the remainder of the Series G Preferred Shares in July 2014; and |
• | additional borrowings to finance other capital improvements during 2013 and 2014. |
The Company’s weighted average interest rate, including the impact of capitalized interest, decreased from 4.08% in 2013 to 4.06% in 2014. Interest capitalized on renovations decreased from $0.6 million in 2013 to $0.4 million in 2014 primarily due to the completion of the Park Central Hotel New York and WestHouse New York renovation at the end of 2013, partially offset by various renovation projects throughout the portfolio.
Loss from Extinguishment of Debt
Loss from extinguishment of debt of $2.5 million in 2014 relates to the write-off of a portion of the unamortized deferred financing costs for the Company’s senior unsecured credit facility and Second Term Loan (as defined below). These costs were recorded in connection with the original agreements that were in effect prior to the Company refinancing its senior unsecured credit facility and Second Term Loan on January 8, 2014. There was no loss from extinguishment of debt in the 2013 period.
Income Tax Expense
Income tax expense increased $1.8 million from $0.5 million in 2013 to $2.3 million in 2014. This increase is primarily due to an increase in LHL’s net income before income tax expense of $3.0 million from $0.6 million in 2013 to $3.6 million in 2014 and an increase in state and local incomes taxes on the Operating Partnership and affiliated entities, which are subject to minimum
29
state and local income taxes in applicable jurisdictions. For the year ended December 31, 2014, LHL’s income tax expense was calculated using an estimated federal and state tax rate of 35.4%.
Gain on Sale of Properties
The gain on sale of properties of $93.2 million relates to the gain from sale of Hilton Alexandria Old Town on June 17, 2014 of $43.5 million and the gain from sale of Hotel Viking on September 10, 2014 of $49.7 million.
Noncontrolling Interests in Consolidated Entities
Noncontrolling interests in consolidated entities represent the allocation of income or loss to the outside preferred ownership interests in a subsidiary and the outside ownership interest in a joint venture.
Noncontrolling Interests of Common Units in Operating Partnership
Noncontrolling interests of common units in Operating Partnership represent the allocation of income or loss of the Operating Partnership to the common units held by third parties based on their weighted average percentage ownership throughout the period. At December 31, 2014, third party limited partners held 0.3% of the common units in the Operating Partnership.
Distributions to Preferred Shareholders
Distributions to preferred shareholders decreased $3.1 million from $17.4 million in 2013 to $14.3 million in 2014 due to decreased distributions on the Series G Preferred Shares, which were partially redeemed on April 5, 2013, and the remaining shares were fully redeemed on July 3, 2014.
Issuance Costs of Redeemed Preferred Shares
Issuance costs of redeemed preferred shares of $1.0 million in 2014 represent the offering costs related to the remaining Series G Preferred Shares, which were all redeemed on July 3, 2014, and $1.6 million in 2013 represent the offering costs related to the Series G Preferred Shares, which were partially redeemed on April 5, 2013. The excess of fair value over carrying value (i.e. offering costs) is included in the determination of net income attributable to common shareholders.
Non-GAAP Financial Measures
FFO and EBITDA
The Company considers the non-GAAP measures of FFO and EBITDA to be key supplemental measures of the Company’s performance and should be considered along with, but not as alternatives to, net income or loss as a measure of the Company’s operating performance. Historical cost accounting for real estate assets implicitly assumes that the value of real estate assets diminishes predictably over time. Since real estate values instead have historically risen or fallen with market conditions, most real estate industry investors consider FFO and EBITDA to be helpful in evaluating a real estate company’s operations.
The White Paper on FFO approved by the National Association of Real Estate Investment Trusts (“NAREIT”) in April 2002, as revised in 2011, defines FFO as net income or loss (computed in accordance with GAAP), excluding gains or losses from sales of properties and items classified by GAAP as extraordinary, plus real estate-related depreciation and amortization and impairment writedowns, and after comparable adjustments for the Company’s portion of these items related to unconsolidated entities and joint ventures. The Company computes FFO consistent with standards established by NAREIT, which may not be comparable to FFO reported by other REITs that do not define the term in accordance with the current NAREIT definition or that interpret the current NAREIT definition differently than the Company.
With respect to FFO, the Company believes that excluding the effect of extraordinary items, real estate-related depreciation and amortization and impairments, and the portion of these items related to unconsolidated entities, all of which are based on historical cost accounting and which may be of limited significance in evaluating current performance, can facilitate comparisons of operating performance between periods and between REITs, even though FFO does not represent an amount that accrues directly to common shareholders. However, FFO may not be helpful when comparing the Company to non-REITs.
With respect to EBITDA, the Company believes that excluding the effect of non-operating expenses and non-cash charges, and the portion of these items related to unconsolidated entities, all of which are also based on historical cost accounting and may be of limited significance in evaluating current performance, can help eliminate the accounting effects of depreciation and amortization, and financing decisions and facilitate comparisons of core operating profitability between periods and between REITs, even though EBITDA also does not represent an amount that accrues directly to common shareholders.
FFO and EBITDA do not represent cash generated from operating activities determined by GAAP and should not be considered as alternatives to net income, cash flows from operations or any other operating performance measure prescribed by
30
GAAP. FFO and EBITDA are not measures of the Company’s liquidity, nor are FFO and EBITDA indicative of funds available to fund the Company’s cash needs, including its ability to make cash distributions. These measurements do not reflect cash expenditures for long-term assets and other items that have been and will be incurred. FFO and EBITDA may include funds that may not be available for management’s discretionary use due to functional requirements to conserve funds for capital expenditures, property acquisitions and other commitments and uncertainties. To compensate for this, management considers the impact of these excluded items to the extent they are material to operating decisions or the evaluation of the Company’s operating performance.
The following is a reconciliation between net income attributable to common shareholders and FFO attributable to common shareholders and unitholders for the years ended December 31, 2015, 2014, 2013, 2012 and 2011 (in thousands, except share and unit data):
For the year ended December 31, | |||||||||||||||||||
2015 | 2014 | 2013 | 2012 | 2011 | |||||||||||||||
Net income attributable to common shareholders | $ | 123,383 | $ | 197,561 | $ | 70,984 | $ | 45,146 | $ | 12,934 | |||||||||
Depreciation | 180,346 | 154,585 | 143,560 | 123,809 | 110,760 | ||||||||||||||
Amortization of deferred lease costs | 294 | 347 | 355 | 371 | 318 | ||||||||||||||
Noncontrolling interests: | |||||||||||||||||||
Redeemable noncontrolling interest in consolidated entity | 0 | 0 | 0 | 0 | (2 | ) | |||||||||||||
Noncontrolling interests in consolidated entities | 16 | 16 | 17 | 0 | 0 | ||||||||||||||
Noncontrolling interests of common units in Operating Partnership | 261 | 636 | 303 | 281 | 1 | ||||||||||||||
Less: Gain on sale of properties | 0 | (93,205 | ) | 0 | 0 | (760 | ) | ||||||||||||
FFO attributable to common shareholders and unitholders (1) | $ | 304,300 | $ | 259,940 | $ | 215,219 | $ | 169,607 | $ | 123,251 | |||||||||
Weighted average number of common shares and units outstanding: | |||||||||||||||||||
Basic | 112,885,094 | 104,485,085 | 97,337,784 | 86,054,269 | 81,157,663 | ||||||||||||||
Diluted | 113,296,279 | 104,842,195 | 97,524,971 | 86,193,574 | 81,328,739 | ||||||||||||||
(1) | FFO attributable to common shareholders and unitholders includes the loss from extinguishment of debt of $0.8 million and $2.5 million for the years ended December 31, 2015 and 2014, respectively. |
The following is a reconciliation between net income attributable to common shareholders and EBITDA for the years ended December 31, 2015, 2014, 2013, 2012 and 2011 (in thousands):
For the year ended December 31, | |||||||||||||||||||
2015 | 2014 | 2013 | 2012 | 2011 | |||||||||||||||
Net income attributable to common shareholders | $ | 123,383 | $ | 197,561 | $ | 70,984 | $ | 45,146 | $ | 12,934 | |||||||||
Interest expense | 54,333 | 56,628 | 57,516 | 52,896 | 39,704 | ||||||||||||||
Loss from extinguishment of debt | 831 | 2,487 | 0 | 0 | 0 | ||||||||||||||
Income tax (benefit) expense (1) | (1,292 | ) | 2,306 | 470 | 9,062 | 7,081 | |||||||||||||
Depreciation and amortization | 180,855 | 155,035 | 143,991 | 124,363 | 111,282 | ||||||||||||||
Noncontrolling interests: | |||||||||||||||||||
Redeemable noncontrolling interest in consolidated entity | 0 | 0 | 0 | 0 | (2 | ) | |||||||||||||
Noncontrolling interests in consolidated entities | 16 | 16 | 17 | 0 | 0 | ||||||||||||||
Noncontrolling interests of common units in Operating Partnership | 261 | 636 | 303 | 281 | 1 | ||||||||||||||
Distributions to preferred shareholders | 12,169 | 14,333 | 17,385 | 21,733 | 29,952 | ||||||||||||||
EBITDA (2) | $ | 370,556 | $ | 429,002 | $ | 290,666 | $ | 253,481 | $ | 200,952 | |||||||||
(1) | Includes amounts from discontinued operations. |
(2) | EBITDA includes the gain on sale of Hilton Alexandria Old Town and Hotel Viking of $43.5 million and $49.7 million, respectively, in 2014. EBITDA includes the gain on finalization of the Seaview Resort roof project of $0.8 million in 2011. |
31
The Hotels
The following table sets forth historical comparative information with respect to occupancy, ADR and RevPAR for the total hotel portfolio for the years ended December 31, 2015 and 2014:
Year ended December 31, | |||||||||||
2015 | 2014 | Variance | |||||||||
Occupancy | 81.1 | % | 81.9 | % | -0.9 | % | |||||
ADR | $ | 239.11 | $ | 233.60 | 2.4 | % | |||||
RevPAR | $ | 193.95 | $ | 191.22 | 1.4 | % | |||||
For presentation of comparable information, the above hotel statistics reflect pro forma adjustments to include the results of operations of the Park Central San Francisco under previous ownership for the comparable period in 2014, and exclude (i) the Hotel Viking and the Hilton Alexandria Old Town, which were sold during 2014, (ii) The Marker Waterfront Resort, which opened for business in December 2014, and (iii) the Mason & Rook Hotel for the period the hotel was closed for renovation in 2015 and the comparable period in 2014.
Off-Balance Sheet Arrangements
Reserve Funds for Future Capital Expenditures
Certain of the Company’s agreements with its hotel managers, franchisors and lenders have provisions for the Company to provide funds, generally 4.0% of hotel revenues, sufficient to cover the cost of (a) certain non-routine repairs and maintenance to the hotels and (b) replacements and renewals to the hotels’ capital assets. Certain of the agreements require that the Company reserve this cash in separate accounts. As of December 31, 2015, the Company held a total of $26.4 million of restricted cash reserves, $21.4 million of which was available for future capital expenditures. The Company has sufficient cash on hand and availability on its credit facilities to cover capital expenditures under agreements that do not require that the Company separately reserve cash.
The Company has no other off-balance sheet arrangements.
Liquidity and Capital Resources
The Company’s principal source of cash to meet its cash requirements, including distributions to shareholders, is the operating cash flow from the Company’s hotels. Additional sources of cash are the Company’s senior unsecured credit facility, LHL’s unsecured credit facility, additional unsecured financing, secured financing on one or all of the Company’s 42 unencumbered properties (subject to certain terms and conditions of the credit agreement) as of December 31, 2015, the sale of one or more properties (subject to certain conditions of the management agreements at four of the Company’s properties), equity issuances available under the Company’s shelf registration statement and issuances of common units in the Operating Partnership.
LHL is a wholly owned subsidiary of the Operating Partnership. Payments to the Operating Partnership are required pursuant to the terms of the lease agreements between LHL and the Operating Partnership relating to the properties owned by the Operating Partnership and leased by LHL. LHL’s ability to make rent payments to the Operating Partnership and the Company’s liquidity, including its ability to make distributions to shareholders, are dependent on the lessees’ ability to generate sufficient cash flow from the operation of the hotels.
In addition, cash flow from hotel operations is subject to all operating risks common to the hotel industry. These risks include:
• | adverse effects of weak national, regional and local economic conditions; |
• | tightening credit standards; |
• | competition for guests and meetings from other hotels and alternative lodging companies, including competition and pricing pressures from Internet wholesalers and distributors; |
• | increases in operating costs, including wages, benefits, insurance, property taxes and energy, due to inflation and other factors, which may not be offset in the future by increases in room rates; |
• | labor strikes, union disruptions or lockouts that may impact operating performance; |
• | dependence on demand from business and leisure travelers, which may fluctuate and be seasonal; |
32
• | increases in energy costs, airline fares and other expenses related to travel, which may negatively affect traveling; and |
• | terrorism, terrorism alerts and warnings, military actions, pandemics or other medical events which may cause decreases in business and leisure travel. |
These factors could adversely affect the ability of the hotel operators to generate revenues which could adversely affect LHL’s ability to make rental payments to the Company pursuant to the participating leases and ultimately impact the Company’s liquidity.
The Company’s senior unsecured credit facility, LHL’s unsecured credit facility and the Company’s term loans contain certain financial covenants relating to net worth requirements, debt ratios and fixed charge coverage and other limitations that restrict its ability to make distributions or other payments to its shareholders upon events of default. There are currently no other contractual or other arrangements limiting payment of distributions by the Operating Partnership.
Failure of the Company to comply with the financial covenants contained in its credit facilities, term loans and non-recourse secured mortgages could result from, among other things, changes in our results of operations, the incurrence of additional debt or changes in general economic conditions.
If the Company violates the financial covenants contained in any of its credit facilities or term loans, the Company may attempt to negotiate waivers of the violations or amend the terms of the applicable credit facilities or term loans with the lenders thereunder; however, the Company can make no assurance that it would be successful in any such negotiations or that, if successful in obtaining waivers or amendments, such amendments or waivers would be on terms attractive to the Company. If a default under the credit facilities or term loans were to occur, the Company would possibly have to refinance the debt through additional debt financing, private or public offerings of debt securities, or additional equity financings. If the Company is unable to refinance its debt on acceptable terms, including at maturity of the credit facilities and term loans, it may be forced to dispose of hotel properties on disadvantageous terms, potentially resulting in losses that reduce cash flow from operating activities. If, at the time of any refinancing, prevailing interest rates or other factors result in higher interest rates upon refinancing, increases in interest expense would lower the Company’s cash flow, and, consequently, cash available for distribution to its shareholders.
As of December 31, 2015, the Company is in compliance with all debt covenants, current on all loan payments and not otherwise in default under the credit facilities, term loans, bonds payable or mortgage loans.
Properties Leased to LHL
Effective January 1, 2001, LHL became a wholly owned subsidiary of the Company as provided for under the TRS provisions of the Code. As of December 31, 2015, LHL leased all 47 hotels owned by the Company as follows:
33
Hotel Properties | Location | |||
1. | Hotel Amarano Burbank | Burbank, CA | ||
2. | L’Auberge Del Mar | Del Mar, CA | ||
3. | Hilton San Diego Gaslamp Quarter | San Diego, CA | ||
4. | Hotel Solamar | San Diego, CA | ||
5. | San Diego Paradise Point Resort and Spa | San Diego, CA | ||
6. | The Hilton San Diego Resort and Spa | San Diego, CA | ||
7. | Harbor Court Hotel | San Francisco, CA | ||
8. | The Marker San Francisco | San Francisco, CA | ||
9. | Hotel Triton | San Francisco, CA | ||
10. | Hotel Vitale | San Francisco, CA | ||
11. | Park Central San Francisco | San Francisco, CA | ||
12. | Serrano Hotel | San Francisco, CA | ||
13. | Villa Florence | San Francisco, CA | ||
14. | Chaminade Resort and Conference Center | Santa Cruz, CA | ||
15. | Viceroy Santa Monica | Santa Monica, CA | ||
16. | Chamberlain West Hollywood | West Hollywood, CA | ||
17. | Le Montrose Suite Hotel | West Hollywood, CA | ||
18. | Le Parc Suite Hotel | West Hollywood, CA | ||
19. | The Grafton on Sunset | West Hollywood, CA | ||
20. | The Donovan | Washington, D.C. | ||
21. | Hotel George | Washington, D.C. | ||
22. | Hotel Madera | Washington, D.C. | ||
23. | Hotel Palomar, Washington, DC | Washington, D.C. | ||
24. | Hotel Rouge | Washington, D.C. | ||
25. | Mason & Rook Hotel (formerly Hotel Helix) | Washington, D.C. | ||
26. | Sofitel Washington, DC Lafayette Square | Washington, D.C. | ||
27. | The Liaison Capitol Hill | Washington, D.C. | ||
28. | Topaz Hotel | Washington, D.C. | ||
29. | Southernmost Beach Resort Key West | Key West, FL | ||
30. | The Marker Waterfront Resort | Key West, FL | ||
31. | Hotel Chicago | Chicago, IL | ||
32. | Westin Michigan Avenue | Chicago, IL | ||
33. | Indianapolis Marriott Downtown | Indianapolis, IN | ||
34. | Hyatt Regency Boston Harbor | Boston, MA | ||
35. | Onyx Hotel | Boston, MA | ||
36. | The Liberty Hotel | Boston, MA | ||
37. | Westin Copley Place | Boston, MA | ||
38. | Gild Hall | New York, NY | ||
39. | The Roger | New York, NY | ||
40. | Park Central Hotel New York (shared lease with WestHouse Hotel New York) | New York, NY | ||
41. | WestHouse Hotel New York | New York, NY | ||
42. | The Heathman Hotel | Portland, OR | ||
43. | Embassy Suites Philadelphia - Center City | Philadelphia, PA | ||
44. | Westin Philadelphia | Philadelphia, PA | ||
45. | Lansdowne Resort | Lansdowne,VA | ||
46. | Alexis Hotel | Seattle, WA | ||
47. | Hotel Deca | Seattle, WA | ||
34
Contractual Obligations
The following is a summary of the Company’s obligations and commitments as of December 31, 2015 (in thousands):
Total Amounts Committed | Amount of Commitment Expiration Per Period | |||||||||||||||||||
Obligations and Commitments | Less than 1 year | 1 to 3 years | 4 to 5 years | Over 5 years | ||||||||||||||||
Mortgage loans | $ | 511,294 | $ | 286,294 | $ | 225,000 | $ | 0 | $ | 0 | ||||||||||
Mortgage loans interest (1) | 14,726 | 6,614 | 8,112 | 0 | 0 | |||||||||||||||
Borrowings under credit facilities (2) | 21,000 | 0 | 21,000 | 0 | 0 | |||||||||||||||
Credit facilities interest (2) | 917 | 455 | 462 | 0 | 0 | |||||||||||||||
Rents (3) | 666,522 | 12,804 | 26,222 | 26,716 | 600,780 | |||||||||||||||
Massport Bonds (2) | 42,500 | 0 | 42,500 | 0 | 0 | |||||||||||||||
Massport Bonds interest (2) | 61 | 28 | 33 | 0 | 0 | |||||||||||||||
Term loans (4) | 855,000 | 0 | 0 | 300,000 | 555,000 | |||||||||||||||
Term loans interest (4) | 100,383 | 23,899 | 45,391 | 29,978 | 1,115 | |||||||||||||||
Purchase commitments (5) | ||||||||||||||||||||
Purchase orders and letters of commitment | 55,072 | 55,072 | 0 | 0 | 0 | |||||||||||||||
Total obligations and commitments | $ | 2,267,475 | $ | 385,166 | $ | 368,720 | $ | 356,694 | $ | 1,156,895 | ||||||||||
(1) | Interest expense is calculated based on the variable rate as of December 31, 2015 for Westin Copley Place. |
(2) | Interest expense is calculated based on the variable rate as of December 31, 2015. It is assumed that the outstanding debt as of December 31, 2015 will be repaid upon maturity with interest-only payments until then. |
(3) | Amounts calculated based on the annual minimum future lease payments that extend through the term of the lease. Rents may be subject to adjustments based on future interest rates and hotel performance. |
(4) | The term loans bear interest at floating rates equal to LIBOR plus applicable margins. The Company entered into separate interest rate swap agreements for the Second Term Loan, resulting in a fixed all-in interest rate of 2.38%, at the Company’s current leverage ratio (as defined in the agreements) through August 2, 2017, the interest rate swaps’ maturity date. The Company entered into separate interest rate swap agreements for the Third Term Loan (defined below), resulting in a fixed all-in interest rate of 2.95% at the Company’s current leverage ratio (as defined in the agreements). The $377.5 million portion of the Third Term Loan is fixed through its maturity date of January 29, 2021 and the $177.5 million portion of the Third Term Loan is fixed through May 16, 2019, the interest rate swaps’ maturity date. It is assumed that the outstanding debt as of December 31, 2015 will be repaid upon maturity with fixed interest-only payments through the swapped periods and interest calculated based on the variable rate as of December 31, 2015 for the unswapped period of the term loans. |
(5) | As of December 31, 2015, purchase orders and letters of commitment totaling approximately $55.1 million had been issued for renovations at the properties. The Company has committed to these projects and anticipates making similar arrangements in the future with the existing properties or any future properties that it may acquire. |
35
Debt Summary
Debt as of December 31, 2015 and 2014 consisted of the following (in thousands):
Balance Outstanding as of | ||||||||||||
Debt | Interest Rate | Maturity Date | December 31, 2015 | December 31, 2014 | ||||||||
Credit facilities | ||||||||||||
Senior unsecured credit facility | Floating (a) | January 2018 (a) | $ | 21,000 | $ | 0 | ||||||
LHL unsecured credit facility | Floating (b) | January 2018 (b) | 0 | 0 | ||||||||
Total borrowings under credit facilities | 21,000 | 0 | ||||||||||
Term loans | ||||||||||||
First Term Loan | Floating (c) | - (c) | 0 | 177,500 | ||||||||
Second Term Loan | Floating (c) | January 2019 | 300,000 | 300,000 | ||||||||
Third Term Loan | Floating (c) | January 2021 | 555,000 | 0 | ||||||||
Total term loans | 855,000 | 477,500 | ||||||||||
Massport Bonds | ||||||||||||
Hyatt Regency Boston Harbor (taxable) | Floating (d) | March 2018 | 5,400 | 5,400 | ||||||||
Hyatt Regency Boston Harbor (tax exempt) | Floating (d) | March 2018 | 37,100 | 37,100 | ||||||||
Total bonds payable | 42,500 | 42,500 | ||||||||||
Mortgage loans | ||||||||||||
Westin Copley Place | 5.28% | - (e) | 0 | 210,000 | ||||||||
Westin Michigan Avenue | 5.75% | April 2016 (f) | 131,262 | 133,347 | ||||||||
Indianapolis Marriott Downtown | 5.99% | July 2016 (f) | 96,097 | 97,528 | ||||||||
The Roger | 6.31% | August 2016 (g) | 58,935 | 60,215 | ||||||||
Westin Copley Place | Floating (h) | August 2018 (h) | 225,000 | 0 | ||||||||
Total mortgage loans | 511,294 | 501,090 | ||||||||||
Total debt | $ | 1,429,794 | $ | 1,021,090 | ||||||||
(a) | Borrowings bear interest at floating rates equal to, at the Company’s option, either (i) LIBOR plus an applicable margin, or (ii) an Adjusted Base Rate (as defined in the credit agreement) plus an applicable margin. As of December 31, 2015, the rate, including the applicable margin, for the Company’s outstanding LIBOR borrowing of $21,000 was 2.13%. There were no borrowings outstanding at December 31, 2014. The Company has the option, pursuant to certain terms and conditions, to extend the maturity date for two six-month extensions. |
(b) | Borrowings bear interest at floating rates equal to, at LHL’s option, either (i) LIBOR plus an applicable margin, or (ii) an Adjusted Base Rate (as defined in the credit agreement) plus an applicable margin. There were no borrowings outstanding at December 31, 2015 and December 31, 2014. LHL has the option, pursuant to certain terms and conditions, to extend the maturity date for two six-month extensions. |
(c) | Term loans bear interest at floating rates equal to LIBOR plus an applicable margin. The Company entered into separate interest rate swap agreements for the full seven-year term of the First Term Loan (as defined below) and a five-year term ending in August 2017 for the Second Term Loan (as defined below), resulting in fixed all-in interest rates. On November 5, 2015, the Company repaid the First Term Loan and entered into the Third Term Loan (as defined below). The Company entered into separate interest rate swap agreements with an aggregate notional amount of $377,500 for the full term of the Third Term Loan. The interest rate swaps for the First Term Loan continue to be in place and were redesignated as hedging instruments through May 2019 for the Third Term Loan. At December 31, 2015, the fixed all-in interest rates for the Second Term Loan and Third Term Loan were 2.38% and 2.95%, respectively, at the Company’s current leverage ratio (as defined in the swap agreements). At December 31, 2014, the fixed all-in interest rates for the First Term Loan and Second Term Loan were 3.62% and 2.38%, respectively, at the Company’s current leverage ratio (as defined in the swap agreements). |
(d) | The Massport Bonds are secured by letters of credit issued by U.S. Bank that expire in September 2016. The letters of credit have two one-year extension options and are secured by the Hyatt Regency Boston Harbor. The letters of credit cannot be extended beyond the Massport Bonds’ maturity date. The bonds bear interest based on weekly floating rates. The interest rates as of December 31, 2015 were 0.39% and 0.02% for the $5,400 and $37,100 bonds, respectively. The interest rates as of December 31, 2014 were 0.13% and 0.03% for the $5,400 and $37,100 bonds, respectively. The Company incurs an annual letter of credit fee of 1.35%. |
(e) | The Company repaid the mortgage loan on June 1, 2015 through borrowings on its senior unsecured credit facility. |
36
(f) | The Company repaid the mortgage loans on January 4, 2016 through borrowings on its senior unsecured credit facility. |
(g) | The Company repaid the mortgage loan on February 11, 2016 through borrowings on its senior unsecured credit facility. |
(h) | The mortgage loan matures on August 14, 2018 with three options to extend the maturity date to January 5, 2021, pursuant to certain terms and conditions. The interest-only mortgage loan bears interest at a variable rate ranging from LIBOR plus 1.75% to LIBOR plus 2.00%, depending on Westin Copley Place’s net cash flow (as defined in the loan agreement). The interest rate as of December 31, 2015 was LIBOR plus 1.75%, which equaled 2.09%. The mortgage loan allows for prepayments without penalty after one year, subject to certain terms and conditions. |
A summary of the Company’s interest expense and weighted average interest rates for unswapped borrowings for the years ended December 31, 2015, 2014 and 2013 is as follows (in thousands):
For the year ended December 31, | |||||||||||
2015 | 2014 | 2013 | |||||||||
Interest Expense: | |||||||||||
Interest incurred | $ | 52,604 | $ | 54,859 | $ | 55,912 | |||||
Amortization of deferred financing costs | 2,631 | 2,169 | 2,253 | ||||||||
Capitalized interest | (902 | ) | (400 | ) | (649 | ) | |||||
Interest expense | $ | 54,333 | $ | 56,628 | $ | 57,516 | |||||
Weighted Average Interest Rates for Unswapped Variable Rate Debt: | |||||||||||
Senior unsecured credit facility | 1.89 | % | 1.86 | % | 2.11 | % | |||||
LHL unsecured credit facility | 1.89 | % | 1.86 | % | 2.03 | % | |||||
Massport Bonds | 0.06 | % | 0.35 | % | 0.25 | % | |||||
Mortgage loan (Westin Copley Place) | 2.19 | % | N/A | N/A | |||||||
Credit Facilities
On January 8, 2014, the Company refinanced its $750.0 million senior unsecured credit facility with a syndicate of banks. The credit facility matures on January 8, 2018, subject to two six-month extensions that the Company may exercise at its option, pursuant to certain terms and conditions, including payment of an extension fee. The credit facility, with a current commitment of $750.0 million, includes an accordion feature which, subject to certain conditions, entitles the Company to request additional lender commitments, allowing for total commitments up to $1.05 billion. Borrowings under the credit facility bear interest at floating rates equal to, at the Company’s option, either (i) LIBOR plus an applicable margin, or (ii) an Adjusted Base Rate (as defined in the credit agreement) plus an applicable margin. Additionally, the Company is required to pay a variable unused commitment fee of 0.25% or 0.30% of the unused portion of the credit facility, depending on the average daily unused portion of the credit facility.
On January 8, 2014, LHL also refinanced its $25.0 million unsecured revolving credit facility to be used for working capital and general lessee corporate purposes. The LHL credit facility matures on January 8, 2018, subject to two six-month extensions that LHL may exercise at its option, pursuant to certain terms and conditions, including payment of an extension fee. Borrowings under the LHL credit facility bear interest at floating rates equal to, at LHL’s option, either (i) LIBOR plus an applicable margin, or (ii) an Adjusted Base Rate (as defined in the credit agreement) plus an applicable margin. Additionally, LHL is required to pay a variable unused commitment fee of 0.25% or 0.30% of the unused portion of the credit facility, depending on the average daily unused portion of the LHL credit facility.
The Company’s senior unsecured credit facility and LHL’s unsecured credit facility contain certain financial covenants relating to net worth requirements, debt ratios and fixed charge coverage and other limitations that restrict the Company’s ability to make distributions or other payments to its shareholders upon events of default.
Term Loans
On May 16, 2012, the Company entered into a $177.5 million unsecured term loan (the “First Term Loan”) with a seven-year term maturing on May 16, 2019. The First Term Loan bears interest at a variable rate, but was hedged to a fixed interest rate through May 16, 2019. On November 5, 2015, the Company repaid the First Term Loan and redesignated the interest rate swaps.
37
On January 8, 2014, the Company refinanced its $300.0 million unsecured term loan (the “Second Term Loan”). The Second Term Loan includes an accordion feature, which subject to certain conditions, entitles the Company to request additional lender commitments, allowing for total commitments up to $500.0 million. The Second Term Loan has a five-year term maturing on January 8, 2019 and bears interest at variable rates, but was hedged to a fixed interest rate based on the Company’s current leverage ratio (as defined in the swap agreements), which interest rate was 2.38% at December 31, 2015 through August 2, 2017 (see “Derivative and Hedging Activities” below).
On November 5, 2015, the Company entered into a $555.0 million unsecured term loan (the “Third Term Loan”) with a five-year term maturing on January 29, 2021. The Third Term Loan includes an accordion feature, which subject to certain conditions, entitles the Company to request additional lender commitments, allowing for total commitments up to $700.0 million. The Third Term Loan bears interest at a variable rate, but was hedged to a fixed interest rate based on the Company’s current leverage ratio (as defined in the swap agreements), which interest rate was 2.95% at December 31, 2015 through May 16, 2019 for $177.5 million of the Third Term Loan and through January 29, 2021 for the remaining $377.5 million of the Third Term Loan (see “Derivative and Hedging Activities” below).
The Company’s term loans contain certain financial covenants relating to net worth requirements, debt ratios and fixed charge coverage and other limitations that restrict the Company’s ability to make distributions or other payments to its shareholders upon events of default.
Derivative and Hedging Activities
The Company primarily uses interest rate swaps as part of its interest rate risk management strategy. Interest rate swaps designated as cash flow hedges involve the receipt of variable-rate amounts from a counterparty in exchange for the Company making fixed-rate payments over the life of the agreements without exchange of the underlying notional amount. Unrealized gains and losses on the effective portion of hedging instruments are reported in other comprehensive income (loss) (“OCI”). Ineffective portions of changes in the fair value of a cash flow hedge are recognized as interest expense. Amounts reported in accumulated other comprehensive income (loss) (“AOCL”) related to currently outstanding derivatives are recognized as an adjustment to income (loss) as interest payments are made on the Company’s variable rate debt. Effective May 16, 2012, the Company entered into three interest rate swap agreements with an aggregate notional amount of $177.5 million for the First Term Loan’s full seven-year term, resulting in a fixed all-in interest rate based on the Company’s current leverage ratio (as defined in the swap agreements). As discussed above, the First Term Loan was repaid on November 5, 2015. The interest rate swaps for the First Term Loan continue to be in place and are designated as hedging instruments for the Third Term Loan. Effective August 2, 2012, the Company entered into five interest rate swap agreements with an aggregate notional amount of $300.0 million for the Second Term Loan through August 2, 2017, resulting in a fixed all-in interest rate based on the Company’s current leverage ratio (as defined in the swap agreements), which interest rate was 2.38% at December 31, 2015. Effective November 5, 2015, the Company entered into seven interest rate swap agreements with an aggregate notional amount of $377.5 million for the Third Term Loan’s full five-year term, resulting in a fixed all-in interest rate based on the Company’s current leverage ratio (as defined in the swap agreements). At December 31, 2015, the fixed all-in interest rate based on the Company’s current leverage ratio (as defined in the swap agreements) was 2.95% for the Third Term Loan. The Company has designated its pay-fixed, receive-floating interest rate swap derivatives as cash flow hedges. The interest rate swaps were entered into with the intention of eliminating the variability of the terms loans, but can also limit the exposure to any amendments, supplements, replacements or refinancings of the Company’s debt.
The following table presents the effect of derivative instruments on the Company’s consolidated statements of operations and comprehensive income, including the location and amount of unrealized (loss) gain on outstanding derivative instruments in cash flow hedging relationships, for the years ended December 31, 2015, 2014 and 2013 (in thousands):
Amount of (Loss) Gain Recognized in OCI on Derivative Instruments | Location of Loss Reclassified from AOCL into Net Income | Amount of Loss Reclassified from AOCL into Net Income | |||||||||||||||||||||||||
(Effective Portion) | (Effective Portion) | (Effective Portion) | |||||||||||||||||||||||||
For the year ended | For the year ended | ||||||||||||||||||||||||||
December 31, | December 31, | ||||||||||||||||||||||||||
2015 | 2014 | 2013 | 2015 | 2014 | 2013 | ||||||||||||||||||||||
Derivatives in cash flow hedging relationships: | |||||||||||||||||||||||||||
Interest rate swaps | $ | (5,682 | ) | $ | (8,276 | ) | $ | 8,127 | Interest expense | $ | 4,835 | $ | 4,410 | $ | 4,248 | ||||||||||||
During the years ended December 31, 2015, 2014 and 2013, the Company did not have any hedge ineffectiveness or amounts that were excluded from the assessment of hedge effectiveness recorded in earnings.
38
As of December 31, 2015, there was $0.1 million in cumulative unrealized loss of which $0.1 million was included in AOCL and zero was attributable to noncontrolling interests. As of December 31, 2014, there was $0.8 million in cumulative unrealized gain of which $0.8 million was included in AOCL and an immaterial amount was attributable to noncontrolling interests. The Company expects that approximately $8.1 million will be reclassified from AOCL and noncontrolling interests and recognized as a reduction to income in the next 12 months, calculated as estimated interest expense using the interest rates on the derivative instruments as of December 31, 2015.
Extinguishment of Debt
As discussed above, on January 8, 2014, the Company refinanced its senior unsecured credit facility and Second Term Loan and LHL refinanced its unsecured revolving credit facility. The refinancing arrangements for the senior unsecured credit facility and Second Term Loan were considered substantial modifications. The Company recognized a loss from extinguishment of debt of $2.5 million, which is included in the consolidated statements of operations and comprehensive income for the year ended December 31, 2014. As discussed above, on November 5, 2015, the Company repaid the First Term Loan prior to maturity and recognized a loss from extinguishment of debt of $0.8 million, which is included in the consolidated statements of operations and comprehensive income for the year ended December 31, 2015. The loss from extinguishment of debt represents the unamortized deferred financing costs incurred when the original agreements were executed.
Mortgage Loans
The Company’s mortgage loans are secured by the respective properties. The mortgages are non-recourse to the Company except for fraud or misapplication of funds.
On June 1, 2015, the Company repaid without fee or penalty the Westin Copley Place mortgage loan in the amount of $210.0 million plus accrued interest through borrowings under its senior unsecured credit facility. The loan was due to mature in September 2015. On July 20, 2015, the Company entered into a new $225.0 million mortgage loan secured by the Westin Copley Place. The mortgage loan matures on August 14, 2018 with three options to extend the maturity date to January 5, 2021, pursuant to certain terms and conditions. The interest-only mortgage loan bears interest at a variable rate ranging from LIBOR plus 1.75% to LIBOR plus 2.00%, depending on Westin Copley Place’s net cash flow (as defined in the loan agreement). The mortgage loan allows for prepayments without penalty after one year, subject to certain terms and conditions.
On January 4, 2016, the Company repaid without fee or penalty the Westin Michigan Avenue mortgage loan and the Indianapolis Marriott Downtown mortgage loan. On February 11, 2016, the Company repaid without fee or penalty The Roger mortgage loan.
The Company’s mortgage loans contain debt service coverage ratio tests related to the mortgaged properties. If the debt service coverage ratio for a specific property fails to exceed a threshold level specified in the mortgage, cash flows from that hotel may automatically be directed to the lender to (i) satisfy required payments, (ii) fund certain reserves required by the mortgage and (iii) fund additional cash reserves for future required payments, including final payment. Cash flows may be directed to the lender (“cash trap”) until such time as the property again complies with the specified debt service coverage ratio or the mortgage is paid off.
Financial Covenants
Failure of the Company to comply with the financial covenants contained in its credit facilities, term loans and non-recourse secured mortgages could result from, among other things, changes in its results of operations, the incurrence of additional debt or changes in general economic conditions.
If the Company violates the financial covenants contained in any of its credit facilities or term loans described above, the Company may attempt to negotiate waivers of the violations or amend the terms of the applicable credit facilities or term loans with the lenders thereunder; however, the Company can make no assurance that it would be successful in any such negotiations or that, if successful in obtaining waivers or amendments, such amendments or waivers would be on terms attractive to the Company. If a default under the credit facilities or term loans were to occur, the Company would possibly have to refinance the debt through additional debt financing, private or public offerings of debt securities, or additional equity financings. If the Company is unable to refinance its debt on acceptable terms, including at maturity of the credit facilities and term loans, it may be forced to dispose of hotel properties on disadvantageous terms, potentially resulting in losses that reduce cash flow from operating activities. If, at the time of any refinancing, prevailing interest rates or other factors result in higher interest rates upon refinancing, increases in interest expense would lower the Company’s cash flow, and, consequently, cash available for distribution to its shareholders.
A cash trap associated with a mortgage loan may limit the overall liquidity for the Company as cash from the hotel securing such mortgage would not be available for the Company to use. If the Company is unable to meet mortgage payment obligations, including the payment obligation upon maturity of the mortgage borrowing, the mortgage securing the specific property could be
39
foreclosed upon by, or the property could be otherwise transferred to, the mortgagee with a consequent loss of income and asset value to the Company.
As of December 31, 2015, the Company is in compliance with all debt covenants, current on all loan payments and not otherwise in default under the credit facilities, term loans, bonds payable or mortgage loans.
Fair Value Measurements
In evaluating fair value, GAAP outlines a valuation framework and creates a fair value hierarchy that distinguishes between market assumptions based on market data (observable inputs) and a reporting entity’s own assumptions about market data (unobservable inputs). The hierarchy ranks the quality and reliability of inputs used to determine fair value, which are then classified and disclosed in one of the three categories. The three levels are as follows:
Level 1—Inputs are quoted prices (unadjusted) in active markets for identical assets or liabilities that the entity has the ability to access at the measurement date.
Level 2—Observable inputs, other than quoted prices included in level 1, such as interest rates, yield curves, quoted prices in active markets for similar assets and liabilities, and quoted prices for identical or similar assets or liabilities in markets that are not active.
Level 3—Unobservable inputs that are supported by limited market activity. This includes certain pricing models, discounted cash flow methodologies and similar techniques when observable inputs are not available.
The Company estimates the fair value of its financial instruments using available market information and valuation methodologies the Company believes to be appropriate for these purposes. Considerable judgment and subjectivity are involved in developing these estimates and, accordingly, such estimates are not necessarily indicative of amounts that would be realized upon disposition.
Recurring Measurements
For assets and liabilities measured at fair value on a recurring basis, quantitative disclosure of their fair value is as follows (in thousands):
Fair Value Measurements at | ||||||||||
December 31, 2015 | December 31, 2014 | |||||||||
Using Significant Other Observable | ||||||||||
Inputs (Level 2) | ||||||||||
Description | Consolidated Balance Sheet Location | |||||||||
Derivative interest rate instruments | Prepaid expenses and other assets | $ | 1,605 | $ | 1,520 | |||||
Derivative interest rate instruments | Accounts payable and accrued expenses | $ | 1,702 | $ | 770 | |||||
The fair value of each derivative instrument is based on a discounted cash flow analysis of the expected cash flows under each arrangement. This analysis reflects the contractual terms of the derivative instrument, including the period to maturity, and utilizes observable market-based inputs, including interest rate curves and implied volatilities, which are classified within level 2 of the fair value hierarchy. The Company also incorporates credit value adjustments to appropriately reflect each parties’ nonperformance risk in the fair value measurement, which utilizes level 3 inputs such as estimates of current credit spreads. However, the Company has assessed that the credit valuation adjustments are not significant to the overall valuation of the derivatives. As a result, the Company has determined that its derivative valuations in their entirety are classified within level 2 of the fair value hierarchy.
40
Financial Instruments Not Measured at Fair Value
The following table represents the fair value, derived using level 2 inputs, of financial instruments presented at carrying value in the Company’s consolidated financial statements as of December 31, 2015 and 2014 (in thousands):
December 31, 2015 | December 31, 2014 | ||||||||||||||
Carrying Value | Estimated Fair Value | Carrying Value | Estimated Fair Value | ||||||||||||
Note receivable | $ | 80,000 | $ | 80,000 | $ | 0 | $ | 0 | |||||||
Borrowings under credit facilities | $ | 21,000 | $ | 21,061 | $ | 0 | $ | 0 | |||||||
Term loans | $ | 855,000 | $ | 856,038 | $ | 477,500 | $ | 476,996 | |||||||
Bonds payable | $ | 42,500 | $ | 42,500 | $ | 42,500 | $ | 42,500 | |||||||
Mortgage loans | $ | 511,294 | $ | 511,786 | $ | 501,090 | $ | 510,250 | |||||||
The Company estimated the fair value of its borrowings under credit facilities, term loans, bonds payable and mortgage loans using interest rates ranging from 1.5% to 4.4% as of December 31, 2015 and from 1.6% to 4.3% as of December 31, 2014 with a weighted average effective interest rate of 2.1% and 2.9% as of December 31, 2015 and 2014, respectively. The assumptions reflect the terms currently available on similar borrowings to borrowers with credit profiles similar to the Company’s. At December 31, 2015, the carrying amount of the note receivable was representative of its fair value due to the short-term nature and recent acquisition of this instrument.
At December 31, 2015 and 2014, the carrying amounts of certain of the Company’s financial instruments, including cash and cash equivalents, restricted cash, accounts receivable, accounts payable and accrued expenses and distributions payable were representative of their fair values due to the short-term nature of these instruments and the recent acquisition of these items.
Equity Issuances, Repurchases and Redemptions
On March 4, 2013, the Company issued 4,000,000 Series I Preferred Shares ($0.01 par value) at a price of $25.00 per share and received net proceeds, after deducting underwriting discounts and other offering costs, of $96.7 million. On March 12, 2013, the underwriters exercised their rights to cover overallotments and purchased 400,000 additional Series I Preferred Shares, resulting in additional net proceeds to the Company of $9.7 million. The net proceeds were used to redeem a portion of the Company’s Series G Preferred Shares on April 5, 2013, to pay down amounts outstanding under the Company’s senior unsecured credit facility and for general corporate purposes.
On April 5, 2013, the Company redeemed 4,000,000 of the 6,348,888 outstanding Series G Preferred Shares for $100.0 million ($25.00 per share) plus accrued distributions through April 5, 2013 of $1.9 million. The redemption value of the Series G Preferred Shares exceeded their carrying value by $1.6 million, which is included in the determination of net income attributable to common shareholders for the year ended December 31, 2013. The $1.6 million represents the offering costs related to the redeemed Series G Preferred Shares.
On July 3, 2014, the Company redeemed the remaining 2,348,888 Series G Preferred Shares for $58.7 million ($25.00 per share), plus accrued and unpaid dividends through the redemption date, July 3, 2014, of $1.1 million. The redemption value of the Series G Preferred Shares exceeded their carrying value by $1.0 million, which is included in the determination of net income attributable to common shareholders for the year ended December 31, 2014. The $1.0 million represents the offering costs related to the redeemed Series G Preferred Shares.
On December 12, 2014, the Company completed an underwritten public offering of 7,600,000 common shares of beneficial interest, par value $0.01 per share. On December 24, 2014, an additional 1,140,000 common shares of beneficial interest were issued pursuant to the full exercise of the underwriters’ option to purchase additional shares. After deducting the underwriters’ discounts and commissions and other offering costs, the Company raised net proceeds of $348.5 million. The net proceeds were used to fund the acquisition of The Heathman Hotel on December 18, 2014, to fund a portion of the acquisition of Park Central San Francisco on January 23, 2015, to pay down amounts outstanding under the Company’s senior unsecured credit facility and under the LHL unsecured credit facility, and for general corporate purposes.
The Company’s Board of Trustees previously authorized a share repurchase program (the “Repurchase Program”) to acquire up to $100.0 million of the Company’s common shares of beneficial interest, with repurchased shares recorded at cost in treasury. In August 2015, the Company repurchased 184,742 common shares of beneficial interest under the Repurchase Program for $5.7 million, including commissions of an immaterial amount. As of December 31, 2015, the Company had availability under the Repurchase Program to acquire up to $69.8 million of common shares of beneficial interest. The timing, manner, price and actual number of shares repurchased will depend on a variety of factors including price, corporate and regulatory requirements, market
41
conditions, and other corporate liquidity requirements and priorities. The Repurchase Program may be suspended, modified or terminated at any time for any reason without prior notice. The Repurchase Program does not obligate the Company to acquire any specific number of shares, and all open market repurchases will be made in accordance with applicable rules and regulations setting forth certain restrictions on the method, timing, price and volume of open market share repurchases.
Sources and Uses of Cash
As of December 31, 2015, the Company had $5.7 million of cash and cash equivalents and $26.4 million of restricted cash reserves, $21.4 million of which was available for future capital expenditures. Additionally, the Company had $726.4 million available under the Company’s senior unsecured credit facility, with $2.6 million reserved for outstanding letters of credit, and $25.0 million available under LHL’s unsecured credit facility.
Net cash provided by operating activities was $337.5 million for the year ended December 31, 2015 primarily due to the operations of the hotels, which were partially offset by payments for real estate taxes, personal property taxes, insurance and ground rent.
Net cash used in investing activities was $642.0 million for the year ended December 31, 2015 primarily due to the purchases of the Park Central San Francisco and The Marker Waterfront Resort, the providing of the Mezzanine Loan and outflows for improvements and additions at the hotels.
Net cash provided by financing activities was $196.1 million for the year ended December 31, 2015 primarily due to proceeds from the Third Term Loan, net proceeds from the credit facilities, proceeds from the $225.0 million new mortgage loan secured by Westin Copley Place in July 2015, partially offset by mortgage loan repayments including the $210.0 million early repayment of the Westin Copley Place mortgage loan in June 2015, repayment of the First Term Loan, payment of deferred financing costs, forfeiture of common shares into treasury, payment for the repurchase of common shares of beneficial interest under the Repurchase Program, payment of distributions to the common shareholders and unitholders and payment of distributions to preferred shareholders.
The Company has considered its short-term (one year or less) liquidity needs and the adequacy of its estimated cash flow from operations and other expected liquidity sources to meet these needs. The Company believes that its principal short-term liquidity needs are to fund normal recurring expenses, debt service requirements, distributions on the preferred shares and the minimum distribution required to maintain the Company’s REIT qualification under the Code. The Company anticipates that these needs will be met with available cash on hand, cash flows provided by operating activities, borrowings under the Company’s senior unsecured credit facility or LHL’s unsecured credit facility, additional unsecured financing, secured financing on any of the Company’s 42 unencumbered properties (subject to certain terms and conditions of the credit agreement), potential property sales (subject to certain conditions of the management agreements at four of the Company’s properties), equity issuances available under the Company’s shelf registration statement and issuances of common units in the Operating Partnership. The Company also considers capital improvements and property acquisitions as short-term needs that will be funded either with cash flows provided by operating activities, utilizing availability under the Company’s senior unsecured credit facility or LHL’s unsecured credit facility, additional unsecured financing, secured financing on any of the Company’s 42 unencumbered properties (subject to certain terms and conditions of the credit agreement), potential property sales (subject to certain conditions of the management agreements at four of the Company’s properties) or the issuance of additional equity securities.
The Company expects to meet long-term (greater than one year) liquidity requirements such as property acquisitions, scheduled debt maturities, major renovations, expansions and other nonrecurring capital improvements utilizing availability under the Company’s senior unsecured credit facility or LHL’s unsecured credit facility, additional unsecured financing, secured financing on any of the Company’s 42 unencumbered properties (subject to certain terms and conditions of the credit agreement), potential property sales (subject to certain conditions of the management agreements at four of the Company’s properties), estimated cash flows from operations, equity issuances available under the Company’s shelf registration statement and issuances of common units in the Operating Partnership. The Company expects to acquire or develop additional hotel properties only as suitable opportunities arise, and the Company will not undertake acquisition or development of properties unless stringent acquisition or development criteria have been achieved.
Reserve Funds
The Company is obligated to maintain reserve funds for capital expenditures at the hotels (including the periodic replacement or refurbishment of furniture, fixtures and equipment) as determined pursuant to the operating agreements. Please refer to “Off-Balance Sheet Arrangements” for a discussion of the Company’s reserve funds.
42
Inflation
The Company relies entirely on the performance of the hotels and their ability to increase revenues to keep pace with inflation. The hotel operators can change room rates quickly, but competitive pressures may limit the hotel operators’ abilities to raise rates faster than inflation or even at the same rate.
The Company’s expenses (primarily real estate taxes, property and casualty insurance, administrative expenses and hotel operating expenses) are subject to inflation. These expenses are expected to grow at the general rate of inflation, except for energy costs, liability insurance, property taxes (due to increased rates and periodic reassessments), employee benefits and some wages, which are expected to increase at rates higher than inflation.
Derivatives and Hedging Activities
In the normal course of business, the Company is exposed to the effects of interest rate changes. The Company limits the risks associated with interest rate changes by following established risk management policies and procedures which may include the use of derivative instruments. The Company formally documents all relationships between hedging instruments and hedged items, as well as its risk management objectives and strategies for undertaking various hedge transactions. The Company assesses, both at the inception of the hedge and on an ongoing basis, whether the derivatives that are used in hedging transactions are highly effective in offsetting changes in the cash flows of the hedged items. Instruments that meet these hedging criteria are formally designated as hedges at the inception of the derivative contract and are recorded on the balance sheet at fair value, with offsetting changes recorded to other comprehensive income (loss). Ineffective portions of changes in the fair value of a cash flow hedge are recognized as interest expense. The Company incorporates credit valuation adjustments to reflect both its own nonperformance risk and the respective counterparty’s nonperformance risk in the fair value measurements. The Company does not use derivatives for trading or speculative purposes and currently does not have any derivatives that are not designated as hedging instruments under the accounting requirements for derivatives and hedging.
Item 7A. | Quantitative and Qualitative Disclosures about Market Risk |
Interest Rate Sensitivity
The table below provides information about financial instruments that are sensitive to changes in interest rates, including mortgage obligations, bonds and lines of credit. For debt obligations, scheduled maturities and related weighted average interest rates by expected maturity dates are as follows (in thousands):
2016 | 2017 | 2018 | 2019 | 2020 | Thereafter | Total | |||||||||||||||||||||
Fixed rate debt | $ | 286,294 | $ | 0 | $ | 0 | $ | 0 | $ | 0 | $ | 377,500 | $ | 663,794 | |||||||||||||
Weighted average interest | 5.95 | % | 0.00 | % | 0.00 | % | 0.00 | % | 0.00 | % | 2.95 | % | 4.24 | % | |||||||||||||
Variable rate debt (1) | $ | 0 | $ | 0 | $ | 288,500 | $ | 300,000 | $ | 0 | $ | 177,500 | $ | 766,000 | |||||||||||||
Weighted average interest | 0.00 | % | 0.00 | % | 1.79 | % | 1.85 | % | 0.00 | % | 1.80 | % | 1.82 | % | |||||||||||||
Total | $ | 286,294 | $ | 0 | $ | 288,500 | $ | 300,000 | $ | 0 | $ | 555,000 | $ | 1,429,794 | |||||||||||||
(1) For the Second Term Loan maturing in January 2019 and for $177.5 million of the Third Term Loan maturing in January 2021, it is assumed that the outstanding debt as of December 31, 2015 will be repaid upon maturity which will be during the unhedged period of the loan and, therefore, subject to a variable interest rate.
The table above presents the principal amount of debt maturing each year, including annual amortization of principal, through December 31, 2020 and thereafter and weighted average interest rates for the debt maturing in each specified period. This table reflects indebtedness outstanding as of December 31, 2015 and does not reflect new indebtedness, or revisions to terms of existing indebtedness, incurred after that date. The Company’s ultimate exposure to interest rate fluctuations depends on the amount of indebtedness that bears interest at variable rates, the time at which the interest rate is adjusted, the amount of adjustment, the ability to prepay or refinance variable rate indebtedness and hedging strategies used to reduce the impact of any increases in rates. As of December 31, 2015, the estimated fair value of the Company’s fixed rate debt was $1,142.5 million.
The Company is exposed to market risk from changes in interest rates. The Company seeks to limit the impact of interest rate changes on earnings and cash flows and to lower the overall borrowing costs by closely monitoring the Company’s variable rate debt and converting such debt to fixed rates when the Company deems such conversion advantageous. From time to time, the Company may enter into interest rate swap agreements or other interest rate hedging contracts. While these agreements are intended to lessen the impact of rising interest rates, they also expose the Company to the risks that the other parties to the agreements will not perform, the Company could incur significant costs associated with the settlement of the agreements, the agreements will be unenforceable and the underlying transactions will fail to qualify as highly-effective cash flow hedges under GAAP guidance. As of December 31, 2015, $288.5 million of the Company’s aggregate indebtedness (20.2% of total indebtedness) was subject to
43
variable interest rates, excluding amounts outstanding under the Second Term Loan and Third Term Loan since the Company hedged its variable interest rate to fixed interest rates.
If market rates of interest on the Company’s variable rate long-term debt fluctuate by 0.25%, interest expense would increase or decrease, depending on rate movement, future earnings and cash flows by $0.7 million annually. This assumes that the amount outstanding under the Company’s variable rate debt remains at $288.5 million, the balance as of December 31, 2015.
Item 8. | Consolidated Financial Statements and Supplementary Data |
See Index to Financial Statements on page F-1.
Item 9. | Changes in and Disagreements with Accountants on Accounting and Financial Disclosure |
None.
Item 9A. | Controls and Procedures |
Evaluation of Disclosure Controls and Procedures—The Company has established disclosure controls and procedures to ensure that material information relating to the Company, including its consolidated subsidiaries, is made known to the officers who certify the Company’s financial reports and to the members of senior management and the Board of Trustees.
Based on management’s evaluation as of December 31, 2015, the principal executive officer and principal financial officer of the Company have concluded that the Company’s disclosure controls and procedures (as defined in Rules 13a-15(e) or 15d-15(e) under the Exchange Act) are effective to ensure that the information required to be disclosed by the Company in the reports that it files or submits under the Exchange Act is recorded, processed, summarized and reported within the time periods specified in the rules and forms.
Management’s Report on Internal Control Over Financial Reporting—The Company’s management is responsible for establishing and maintaining adequate internal control over financial reporting, as such term is defined in 13a-15(f) and 15d-15(f) of the Exchange Act. Under the supervision and with the participation of our management, including our principal executive officer and principal financial officer, we conducted an evaluation of the effectiveness of our internal control over financial reporting based on the framework in Internal Control—Integrated Framework (2013) issued by the Committee of Sponsoring Organizations of the Treadway Commission. Based on our evaluation under the framework in Internal Control—Integrated Framework (2013), our management concluded that our internal control over financial reporting was effective as of December 31, 2015.
Independent Registered Public Accounting Firm’s Report on Internal Control Over Financial Reporting—KPMG LLP, an independent registered public accounting firm, has audited the Company’s consolidated financial statements included in this Annual Report on Form 10-K and, as part of its audit, has issued its report, included herein on page F-3, on the effectiveness of our internal control over financial reporting.
Changes in Internal Controls—There was no change to the Company’s internal control over financial reporting during the fourth quarter ended December 31, 2015 that has materially affected, or is reasonably likely to materially affect, the Company’s internal control over financial reporting.
Item 9B. | Other Information |
None.
44
PART III
Item 10. | Trustees, Executive Officers and Corporate Governance |
The information required by this item is incorporated by reference to the material in the Proxy Statement.
Item 11. | Executive Compensation |
The information required by this item is incorporated by reference to the material in the Proxy Statement.
Item 12. | Security Ownership of Certain Beneficial Owners and Management and Related Shareholder Matters |
The information required by this item is incorporated by reference to the material in the Proxy Statement.
Item 13. | Certain Relationships and Related Transactions, and Trustee Independence |
The information required by this item is incorporated by reference to the material in the Proxy Statement.
Item 14. | Principal Accountant Fees and Services |
The information required by this item is incorporated by reference to the material in the Proxy Statement.
PART IV
Item 15. | Exhibits and Financial Statement Schedules |
1. | Financial Statements |
Included herein at pages F-1 through F-39.
2. | Financial Statement Schedules |
The following financial statement schedule is included herein at pages F-40 through F-41.
Schedule III – Real Estate and Accumulated Depreciation
All other schedules for which provision is made in Regulation S-X are either not required to be included herein under the related instructions or are inapplicable or the related information is included in the footnotes to the applicable financial statement and, therefore, have been omitted.
45
3. | Exhibits |
The following exhibits are filed as part of this Annual Report on Form 10-K:
Exhibit Number | Description of Exhibit | |
3.1 | Articles of Amendment and Restatement of Declaration of Trust of the Registrant (including all articles of amendment and articles supplementary)(1) | |
3.2 | Third Amended and Restated Bylaws of the Registrant(2) | |
4.1 | Form of Common Share of Beneficial Interest(3) | |
10.1 | Amended and Restated Agreement of Limited Partnership of LaSalle Hotel Operating Partnership, L.P., dated as of April 29, 1998(4) | |
10.2 | First Amendment to the Amended and Restated Agreement of Limited Partnership of LaSalle Hotel Operating Partnership, L.P., dated as of March 6, 2002(5) | |
10.3 | Second Amendment to the Amended and Restated Agreement of Limited Partnership of LaSalle Hotel Operating Partnership, L.P., dated as of September 30, 2003(6) | |
10.4 | Form of Third Amendment to the Amended and Restated Agreement of Limited Partnership of LaSalle Hotel Operating Partnership, L.P.(7) | |
10.5 | Fourth Amendment to the Amended and Restated Agreement of Limited Partnership of LaSalle Hotel Operating Partnership, L.P., dated as of August 22, 2005(7) | |
10.6 | Fifth Amendment to the Amended and Restated Agreement of Limited Partnership of LaSalle Hotel Operating Partnership, L.P., dated as of February 8, 2006(9) | |
10.7 | Form of Sixth Amendment to the Amended and Restated Agreement of Limited Partnership of LaSalle Hotel Operating Partnership, L.P.(10) | |
10.8 | Seventh Amendment to the Amended and Restated Agreement of Limited Partnership of LaSalle Hotel Operating Partnership, L.P., dated as of November 17, 2006(11) | |
10.9 | Eighth Amendment to Amended and Restated Agreement of Limited Partnership of LaSalle Hotel Operating Partnership, L.P., dated as of April 15, 2009(12) | |
10.10 | Ninth Amendment to Amended and Restated Agreement of Limited Partnership of LaSalle Hotel Operating Partnership, L.P., dated as of January 24, 2011(13) | |
10.11 | Tenth Amendment to Amended and Restated Agreement of Limited Partnership of LaSalle Hotel Operating Partnership, L.P., dated as of March 4, 2013(14) | |
10.12 | Form of Management Agreement(3) | |
10.13 | Form of Lease with Affiliated Lessees(3) | |
10.14 | Form of First Amendment to Lease with Affiliated Lessee(15) | |
10.15 | Form of Second Amendment to Lease with Affiliate Lessee(15) | |
10.16 | LaSalle Hotel Properties 1998 Share Option and Incentive Plan, as amended through April 21, 2005(16)* | |
10.17 | LaSalle Hotel Properties 2009 Equity Incentive Plan(17)* | |
10.18 | LaSalle Hotel Properties 2014 Equity Incentive Plan(18)* | |
10.19 | Amendment to the LaSalle Hotel Properties 2014 Equity Incentive Plan(19)* | |
10.20 | Trustee Fee Deferral Program(20)* | |
10.21 | Form of Time-Based Restricted Share Award Agreement(21)* | |
10.22 | Form of Performance-Based Restricted Share Award Agreement(21)* | |
10.23 | Amended and Restated Severance Agreement between Michael D. Barnello and LaSalle Hotel Properties effective October 19, 2009(22)* | |
46
Exhibit Number | Description of Exhibit | |
10.24 | Severance Agreement between Alfred L. Young and LaSalle Hotel Properties effective November 3, 2009(22)* | |
10.25 | Severance Agreement between Bruce A. Riggins and LaSalle Hotel Properties effective January 24, 2011(23)* | |
10.26 | Offer Letter to Michael D. Barnello(24)* | |
10.27 | Offer Letter to Alfred L. Young(25)* | |
10.28 | Offer Letter to Bruce A. Riggins(26)* | |
10.29 | Form of Indemnification Agreement(27)* | |
10.30 | Amended and Restated Senior Unsecured Credit Agreement, dated January 8, 2014, among LaSalle Hotel Operating Partnership, L.P., LaSalle Hotel Properties, and Citibank, N.A., as Administrative Agent, Bank of Montreal and The Royal Bank of Scotland plc, as Co-Syndication Agents, and the other lenders named therein(28) | |
10.31 | Second Amendment to the Amended and Restated Senior Unsecured Credit Agreement, dated as of November 5, 2015, among LaSalle Hotel Operating Partnership, L.P., LaSalle Hotel Properties, and Citibank, N.A., as Administrative Agent, and the other lenders named therein, and including the First Letter Amendment, dated as of June 20, 2014 | |
10.32 | Senior Unsecured Term Loan Agreement, dated as of January 8, 2014, among LaSalle Hotel Operating Partnership, L.P., LaSalle Hotel Properties, and Citibank, N.A., as Administrative Agent, Compass Bank and U.S. Bank National Association, as Co-Syndication Agents, and the other lenders named therein(28) | |
10.33 | Second Amendment to the Senior Unsecured Term Loan Agreement, dated as of November 5, 2015, among LaSalle Hotel Operating Partnership, L.P., LaSalle Hotel Properties, and Citibank, N.A., as Administrative Agent, and the other lenders named therein, and including the First Letter Amendment, dated as of June 20, 2014 | |
10.34 | Senior Unsecured Term Loan Agreement, dated as of November 5, 2015, among LaSalle Hotel Operating Partnership, L.P., LaSalle Hotel Properties, and Citibank, N.A., as Administrative Agent, Bank of Montreal and U.S. Bank National Association, as Co-Syndication Agents, Citigroup Global Markets Inc., BMO Capital Markets, and U.S. Bank National Association, as Joint Lead Arrangers and Joint Book Running Managers, and the other lenders named therein(29) | |
12.1 | Computation of the Registrant’s Ratios of Earnings to Fixed Charges and Earnings to Combined Fixed Charges and Preferred Share Dividends | |
21.1 | List of Subsidiaries | |
23.1 | Consent of KPMG LLP | |
24.1 | Power of Attorney (included in Part IV of this Annual report on Form 10-K) | |
31.1 | Certification of Chief Executive Officer pursuant to Section 302 of the Sarbanes-Oxley Act of 2002 | |
31.2 | Certification of Chief Financial Officer pursuant to Section 302 of the Sarbanes-Oxley Act of 2002 | |
32.1 | Certification of Chief Executive Officer and Chief Financial Officer pursuant to 18 U.S.C. 1350, as created by Section 906 of the Sarbanes-Oxley Act of 2002 | |
101 | The following financial statements from LaSalle Hotel Properties’ Annual Report on Form 10-K for the year ended December 31, 2015, filed on February 18, 2016, formatted in XBRL: (i) Consolidated Balance Sheets, (ii) Consolidated Statements of Operations and Comprehensive Income, (iii) Consolidated Statements of Equity, (iv) Consolidated Statements of Cash Flows and (v) Notes to Consolidated Financial Statements | |
* | Represents management contract or compensatory plan or agreement. |
(1) | Previously filed as an exhibit to the Registrant's Annual Report on Form 10-K filed with the SEC on February 18, 2015 and incorporated herein by reference. |
(2) | Previously filed as an exhibit to the Registrant’s Current Report on Form 8-K filed with the SEC on February 1, 2010 and incorporated herein by reference. |
(3) | Previously filed as an exhibit to Amendment No. 1 to the Registrant’s Registration Statement on Form S-11 (No. 333-45647) filed with the SEC on April 2, 1998 and incorporated herein by reference. |
(4) | Previously filed as an exhibit to the Registrant’s Quarterly Report on Form 10-Q (No. 001-14045) filed with the SEC on August 14, 1998 and incorporated herein by reference. |
(5) | Previously filed as an exhibit to the Registrant’s Current Report on Form 8-K filed with the SEC on March 12, 2002 and incorporated herein by reference. |
47
(6) | Previously filed as an exhibit to Registrant’s Annual report on Form 10-K filed with the SEC on February 23, 2006 and incorporated herein by reference. |
(7) | Previously filed as an exhibit to Registrant’s Current Report on Form 8-K filed with the SEC on August 16, 2005 and incorporated herein by reference. |
(8) | Previously filed as an exhibit to Registrant’s Current Report on Form 8-K filed with the SEC on August 24, 2005 and incorporated herein by reference. |
(9) | Previously filed as an exhibit to Registrant’s Current Report on Form 8-K filed with the SEC on February 9, 2006 and incorporated herein by reference. |
(10) | Previously filed as an exhibit to Registrant’s Current Report on Form 8-K filed with the SEC on September 28, 2006 and incorporated herein by reference. |
(11) | Previously filed as an exhibit to Registrant’s Current Report on Form 8-K filed with the SEC on November 17, 2006 and incorporated herein by reference. |
(12) | Previously filed as an exhibit to the Registrant’s Current Report on Form 8-K filed with the SEC on April 17, 2009 and incorporated herein by reference. |
(13) | Previously filed as an exhibit to Registrant’s Current Report on Form 8-K filed with the SEC on January 24, 2011 and incorporated herein by reference. |
(14) | Previously filed as an exhibit to the Registrant’s Current Report on Form 8-K filed with the SEC on March 4, 2013 and incorporated herein by reference. |
(15) | Previously filed as an exhibit to the Registrant’s Quarterly Report on Form 10-Q (No. 001-14045) filed with the SEC on May 12, 1999 and incorporated herein by reference. |
(16) | Previously filed as an exhibit to the Registrant’s Registration Statement on Form S-8 (No. 333-125058) filed with the SEC on May 19, 2005 and incorporated herein by reference. |
(17) | Previously filed as an exhibit to the Registrant’s Registration Statement on Form S-8 (No. 333-158873) filed with the SEC on April 28, 2009 and incorporated herein by reference. |
(18) | Previously filed as an exhibit to the Registrant’s Current Report on Form 8-K filed with the SEC on May 9, 2014 and incorporated herein by reference. |
(19) | Previously filed as an exhibit to the Registrant’s Current Report on Form 8-K filed with the SEC on January 28, 2015 and incorporated herein by reference. |
(20) | Previously filed as an exhibit to the Registrant’s Registration Statement on Form S-8 filed with the SEC on May 30, 2014 and incorporated herein by reference. |
(21) | Previously filed as an exhibit to the Registrant’s Quarterly Report on Form 10-Q filed with the SEC on April 23, 2014 and incorporated herein by reference. |
(22) | Previously filed as an exhibit to the Registrant’s Annual Report on Form 10-K filed with the SEC on February 25, 2010 and incorporated herein by reference. |
(23) | Previously filed as an exhibit to the Registrant’s Annual Report on Form 10-K filed with the SEC on February 23, 2011 and incorporated herein by reference. |
(24) | Previously filed as an exhibit to the Registrant’s Current Report on Form 8-K filed with the SEC on June 2, 2008 and incorporated herein by reference. |
(25) | Previously filed as an exhibit to the Registrant’s Current Report on Form 8-K filed with the SEC on October 6, 2009 and incorporated herein by reference. |
(26) | Previously filed as an exhibit to Registrant’s Current Report on Form 8-K filed with the SEC on January 5, 2011 and incorporated herein by reference. |
(27) | Previously filed as an exhibit to the Registrant’s Current Report on Form 8-K filed with the SEC on November 12, 2008 and incorporated herein by reference. |
(28) | Previously filed as an exhibit to the Registrant’s Quarterly Report on Form 10-Q filed with the SEC on April 23, 2014 and incorporated herein by reference. |
(29) | Previously filed as an exhibit to the Registrant’s Current Report on Form 8-K filed with the SEC on November 9, 2015 and incorporated herein by reference. |
48
SIGNATURES
Pursuant to the requirements of Section 13 or 15(d) of the Securities Exchange Act of 1934, the registrant has duly caused this report to be signed on its behalf by the undersigned, thereunto duly authorized.
LASALLE HOTEL PROPERTIES | |||||
Date: | February 18, 2016 | BY: | /S/ BRUCE A. RIGGINS | ||
Bruce A. Riggins Executive Vice President and Chief Financial Officer (Principal Financial Officer and Principal Accounting Officer) | |||||
KNOW ALL MEN BY THESE PRESENTS, that we, the undersigned officers and trustees of LaSalle Hotel Properties, hereby severally constitute Michael D. Barnello, Bruce A. Riggins and Alfred L. Young, and each of them singly, our true and lawful attorneys with full power to them, and each of them singly, to sign for us and in our names in the capacities indicated below, the Form 10-K filed herewith and any and all amendments to said Form 10-K, and generally to do all such things in our names and in our capacities as officers and trustees to enable LaSalle Hotel Properties to comply with the provisions of the Securities Exchange Act of 1934, as amended, and all requirements of the Securities and Exchange Commission, hereby ratifying and confirming our signatures as they may be signed by our said attorneys, or any of them, to said Form 10-K and any and all amendments thereto.
Pursuant to the requirements of the Securities Exchange Act of 1934, this report has been signed below by the following persons on behalf of the registrant and in the capacities and on the dates indicated.
Date | Signature | |||
February 18, 2016 | /s/ MICHAEL D. BARNELLO | Trustee, President and Chief Executive Officer (Principal Executive Officer) | ||
Michael D. Barnello | ||||
February 18, 2016 | /s/ DENISE M. COLL | Trustee | ||
Denise M. Coll | ||||
February 18, 2016 | /s/ JEFFREY T. FOLAND | Trustee | ||
Jeffrey T. Foland | ||||
February 18, 2016 | /s/ DARRYL HARTLEY-LEONARD | Trustee | ||
Darryl Hartley-Leonard | ||||
February 18, 2016 | /s/ WILLIAM S. MCCALMONT | Trustee | ||
William S. McCalmont | ||||
February 18, 2016 | /s/ STUART L. SCOTT | Chairman of the Board of Trustees | ||
Stuart L. Scott | ||||
February 18, 2016 | /s/ DONALD A. WASHBURN | Trustee | ||
Donald A. Washburn | ||||
February 18, 2016 | /s/ BRUCE A. RIGGINS | Executive Vice President and Chief Financial Officer (Principal Financial Officer and Principal Accounting Officer) | ||
Bruce A. Riggins | ||||
49
LASALLE HOTEL PROPERTIES
Index to Financial Statements
F-1
Report of Independent Registered Public Accounting Firm
The Shareholders and Board of Trustees
LaSalle Hotel Properties:
We have audited the accompanying consolidated balance sheets of LaSalle Hotel Properties (the Company) as of December 31, 2015 and 2014, and the related consolidated statements of operations and comprehensive income, equity, and cash flows for each of the years in the three-year period ended December 31, 2015. In connection with our audits of the consolidated financial statements, we also have audited financial statement schedule III. These consolidated financial statements and financial statement schedule are the responsibility of the Company’s management. Our responsibility is to express an opinion on these consolidated financial statements and financial statement schedule based on our audits.
We conducted our audits in accordance with the standards of the Public Company Accounting Oversight Board (United States). Those standards require that we plan and perform the audit to obtain reasonable assurance about whether the financial statements are free of material misstatement. An audit includes examining, on a test basis, evidence supporting the amounts and disclosures in the financial statements. An audit also includes assessing the accounting principles used and significant estimates made by management, as well as evaluating the overall financial statement presentation. We believe that our audits provide a reasonable basis for our opinion.
In our opinion, the consolidated financial statements referred to above present fairly, in all material respects, the financial position of LaSalle Hotel Properties as of December 31, 2015 and 2014, and the results of their operations and their cash flows for each of the years in the three-year period ended December 31, 2015, in conformity with U.S. generally accepted accounting principles. Also in our opinion, the related financial statement schedule, when considered in relation to the basic consolidated financial statements taken as a whole, presents fairly, in all material respects, the information set forth therein.
We also have audited, in accordance with the standards of the Public Company Accounting Oversight Board (United States), LaSalle Hotel Properties’ internal control over financial reporting as of December 31, 2015, based on criteria established in Internal Control—Integrated Framework (2013) issued by the Committee of Sponsoring Organizations of the Treadway Commission (COSO), and our report dated February 18, 2016, expressed an unqualified opinion on the effectiveness of the Company’s internal control over financial reporting.
/s/ KPMG LLP
Chicago, Illinois
February 18, 2016
F-2
Report of Independent Registered Public Accounting Firm
The Shareholders and Board of Trustees
LaSalle Hotel Properties:
We have audited LaSalle Hotel Properties’ (the Company) internal control over financial reporting as of December 31, 2015, based on criteria established in Internal Control—Integrated Framework (2013) issued by the Committee of Sponsoring Organizations of the Treadway Commission (COSO). LaSalle Hotel Properties’ management is responsible for maintaining effective internal control over financial reporting and for its assessment of the effectiveness of internal control over financial reporting, included in the accompanying Management’s Report on Internal Control over Financial Reporting. Our responsibility is to express an opinion on the Company’s internal control over financial reporting based on our audit.
We conducted our audit in accordance with the standards of the Public Company Accounting Oversight Board (United States). Those standards require that we plan and perform the audit to obtain reasonable assurance about whether effective internal control over financial reporting was maintained in all material respects. Our audit included obtaining an understanding of internal control over financial reporting, assessing the risk that a material weakness exists, and testing and evaluating the design and operating effectiveness of internal control based on the assessed risk. Our audit also included performing such other procedures as we considered necessary in the circumstances. We believe that our audit provides a reasonable basis for our opinion.
A company’s internal control over financial reporting is a process designed to provide reasonable assurance regarding the reliability of financial reporting and the preparation of financial statements for external purposes in accordance with generally accepted accounting principles. A company’s internal control over financial reporting includes those policies and procedures that (1) pertain to the maintenance of records that, in reasonable detail, accurately and fairly reflect the transactions and dispositions of the assets of the company; (2) provide reasonable assurance that transactions are recorded as necessary to permit preparation of financial statements in accordance with generally accepted accounting principles, and that receipts and expenditures of the company are being made only in accordance with authorizations of management and directors of the company; and (3) provide reasonable assurance regarding prevention or timely detection of unauthorized acquisition, use, or disposition of the company’s assets that could have a material effect on the financial statements.
Because of its inherent limitations, internal control over financial reporting may not prevent or detect misstatements. Also, projections of any evaluation of effectiveness to future periods are subject to the risk that controls may become inadequate because of changes in conditions, or that the degree of compliance with the policies or procedures may deteriorate.
In our opinion, LaSalle Hotel Properties maintained, in all material respects, effective internal control over financial reporting as of December 31, 2015, based on criteria established in Internal Control—Integrated Framework (2013) issued by the Committee of Sponsoring Organizations of the Treadway Commission (COSO).
We also have audited, in accordance with the standards of the Public Company Accounting Oversight Board (United States), the consolidated balance sheets of LaSalle Hotel Properties as of December 31, 2015 and 2014, and the related consolidated statements of operations and comprehensive income, equity, and cash flows for each of the years in the three-year period ended December 31, 2015, and our report dated February 18, 2016, expressed an unqualified opinion on those consolidated financial statements.
/s/ KPMG LLP
Chicago, Illinois
February 18, 2016
F-3
LASALLE HOTEL PROPERTIES
Consolidated Balance Sheets
(in thousands, except share data)
December 31, 2015 | December 31, 2014 | ||||||
Assets: | |||||||
Investment in hotel properties, net (Note 3) | $ | 3,817,676 | $ | 3,428,556 | |||
Note receivable (Note 3) | 80,000 | 0 | |||||
Property under development (Note 3) | 54,066 | 35,613 | |||||
Cash and cash equivalents | 5,700 | 114,131 | |||||
Restricted cash reserves (Note 5) | 26,443 | 21,570 | |||||
Hotel receivables (net of allowance for doubtful accounts of $355 and $300, respectively) | 39,038 | 30,338 | |||||
Deferred financing costs, net | 8,818 | 6,564 | |||||
Deferred tax assets (Note 9) | 3,566 | 1,832 | |||||
Prepaid expenses and other assets | 39,510 | 61,730 | |||||
Total assets | $ | 4,074,817 | $ | 3,700,334 | |||
Liabilities: | |||||||
Borrowings under credit facilities (Note 4) | $ | 21,000 | $ | 0 | |||
Term loans (Note 4) | 855,000 | 477,500 | |||||
Bonds payable (Note 4) | 42,500 | 42,500 | |||||
Mortgage loans (Note 4) | 511,294 | 501,090 | |||||
Accounts payable and accrued expenses | 181,854 | 162,220 | |||||
Advance deposits | 28,471 | 19,447 | |||||
Accrued interest | 3,276 | 3,729 | |||||
Distributions payable | 53,939 | 45,462 | |||||
Total liabilities | 1,697,334 | 1,251,948 | |||||
Commitments and contingencies (Note 5) | |||||||
Equity: | |||||||
Shareholders’ Equity: | |||||||
Preferred shares of beneficial interest, $0.01 par value (liquidation preference of $178,750), 40,000,000 shares authorized; 7,150,000 shares issued and outstanding (Note 6) | 72 | 72 | |||||
Common shares of beneficial interest, $0.01 par value, 200,000,000 shares authorized; 113,115,442 shares issued and 112,959,547 shares outstanding, and 112,828,536 shares issued and 112,824,508 shares outstanding, respectively (Note 6) | 1,131 | 1,127 | |||||
Treasury shares, at cost (Note 6) | (4,798 | ) | (138 | ) | |||
Additional paid-in capital, net of offering costs of $80,205 and $80,124, respectively | 2,684,010 | 2,673,888 | |||||
Accumulated other comprehensive (loss) income (Note 4) | (97 | ) | 748 | ||||
Distributions in excess of retained earnings | (306,051 | ) | (233,988 | ) | |||
Total shareholders’ equity | 2,374,267 | 2,441,709 | |||||
Noncontrolling Interests: | |||||||
Noncontrolling interests in consolidated entities | 18 | 17 | |||||
Noncontrolling interests of common units in Operating Partnership (Note 6) | 3,198 | 6,660 | |||||
Total noncontrolling interests | 3,216 | 6,677 | |||||
Total equity | 2,377,483 | 2,448,386 | |||||
Total liabilities and equity | $ | 4,074,817 | $ | 3,700,334 | |||
The accompanying notes are an integral part of these consolidated financial statements.
F-4
LASALLE HOTEL PROPERTIES
Consolidated Statements of Operations and Comprehensive Income
(in thousands, except share data)
For the year ended | |||||||||||
December 31, | |||||||||||
2015 | 2014 | 2013 | |||||||||
Revenues: | |||||||||||
Hotel operating revenues: | |||||||||||
Room | $ | 849,523 | $ | 773,801 | $ | 667,444 | |||||
Food and beverage | 274,286 | 253,656 | 238,682 | ||||||||
Other operating department | 84,782 | 74,000 | 63,230 | ||||||||
Total hotel operating revenues | 1,208,591 | 1,101,457 | 969,356 | ||||||||
Other income | 7,993 | 8,321 | 7,937 | ||||||||
Total revenues | 1,216,584 | 1,109,778 | 977,293 | ||||||||
Expenses: | |||||||||||
Hotel operating expenses: | |||||||||||
Room | 215,944 | 196,952 | 170,555 | ||||||||
Food and beverage | 190,069 | 183,530 | 165,855 | ||||||||
Other direct | 17,514 | 23,800 | 22,445 | ||||||||
Other indirect (Note 8) | 301,004 | 264,508 | 237,386 | ||||||||
Total hotel operating expenses | 724,531 | 668,790 | 596,241 | ||||||||
Depreciation and amortization | 180,855 | 155,035 | 143,991 | ||||||||
Real estate taxes, personal property taxes and insurance | 65,438 | 57,805 | 53,374 | ||||||||
Ground rent (Note 5) | 16,076 | 14,667 | 11,117 | ||||||||
General and administrative | 25,197 | 23,832 | 22,001 | ||||||||
Acquisition transaction costs (Note 3) | 499 | 2,379 | 2,646 | ||||||||
Other expenses | 17,225 | 7,369 | 9,361 | ||||||||
Total operating expenses | 1,029,821 | 929,877 | 838,731 | ||||||||
Operating income | 186,763 | 179,901 | 138,562 | ||||||||
Interest income | 2,938 | 1,812 | 9,679 | ||||||||
Interest expense | (54,333 | ) | (56,628 | ) | (57,516 | ) | |||||
Loss from extinguishment of debt (Note 4) | (831 | ) | (2,487 | ) | 0 | ||||||
Income before income tax benefit (expense) | 134,537 | 122,598 | 90,725 | ||||||||
Income tax benefit (expense) (Note 9) | 1,292 | (2,306 | ) | (470 | ) | ||||||
Income before gain on sale of properties | 135,829 | 120,292 | 90,255 | ||||||||
Gain on sale of properties (Note 3) | 0 | 93,205 | 0 | ||||||||
Net income | 135,829 | 213,497 | 90,255 | ||||||||
Net income attributable to noncontrolling interests: | |||||||||||
Noncontrolling interests in consolidated entities | (16 | ) | (16 | ) | (17 | ) | |||||
Noncontrolling interests of common units in Operating Partnership (Note 6) | (261 | ) | (636 | ) | (303 | ) | |||||
Net income attributable to noncontrolling interests | (277 | ) | (652 | ) | (320 | ) | |||||
Net income attributable to the Company | 135,552 | 212,845 | 89,935 | ||||||||
Distributions to preferred shareholders | (12,169 | ) | (14,333 | ) | (17,385 | ) | |||||
Issuance costs of redeemed preferred shares (Note 6) | 0 | (951 | ) | (1,566 | ) | ||||||
Net income attributable to common shareholders | $ | 123,383 | $ | 197,561 | $ | 70,984 | |||||
F-5
LASALLE HOTEL PROPERTIES
Consolidated Statements of Operations and Comprehensive Income - Continued
(in thousands, except share data)
For the year ended | |||||||||||
December 31, | |||||||||||
2015 | 2014 | 2013 | |||||||||
Earnings per Common Share - Basic (Note 11): | |||||||||||
Net income attributable to common shareholders excluding amounts attributable to unvested restricted shares | $ | 1.09 | $ | 1.89 | $ | 0.73 | |||||
Earnings per Common Share - Diluted (Note 11): | |||||||||||
Net income attributable to common shareholders excluding amounts attributable to unvested restricted shares | $ | 1.09 | $ | 1.88 | $ | 0.73 | |||||
Weighted average number of common shares outstanding: | |||||||||||
Basic | 112,685,235 | 104,188,785 | 97,041,484 | ||||||||
Diluted | 113,096,420 | 104,545,895 | 97,228,671 | ||||||||
Comprehensive Income: | |||||||||||
Net income | $ | 135,829 | $ | 213,497 | $ | 90,255 | |||||
Other comprehensive income: | |||||||||||
Unrealized (loss) gain on interest rate derivative instruments (Note 4) | (5,682 | ) | (8,276 | ) | 8,127 | ||||||
Reclassification adjustment for amounts recognized in net income (Note 4) | 4,835 | 4,410 | 4,248 | ||||||||
134,982 | 209,631 | 102,630 | |||||||||
Comprehensive income attributable to noncontrolling interests: | |||||||||||
Noncontrolling interests in consolidated entities | (16 | ) | (16 | ) | (17 | ) | |||||
Noncontrolling interests of common units in Operating Partnership (Note 6) | (259 | ) | (625 | ) | (340 | ) | |||||
Comprehensive income attributable to noncontrolling interests | (275 | ) | (641 | ) | (357 | ) | |||||
Comprehensive income attributable to the Company | $ | 134,707 | $ | 208,990 | $ | 102,273 | |||||
The accompanying notes are an integral part of these consolidated financial statements.
F-6
LASALLE HOTEL PROPERTIES
Consolidated Statements of Equity
(in thousands, except per share/unit data)
Preferred Shares of Beneficial Interest | Common Shares of Beneficial Interest | Treasury Shares | Additional Paid-In Capital | Accumulated Other Comprehensive (Loss) Income | Distributions in Excess of Retained Earnings | Total Shareholders’ Equity | Noncontrolling Interests in Consolidated Entities | Noncontrolling Interests of Common Units in Operating Partnership | Total Noncontrolling Interests | Total Equity | |||||||||||||||||||||||||||||||||
Balance, December 31, 2012 | $ | 91 | $ | 955 | $ | (886 | ) | $ | 2,118,705 | $ | (7,735 | ) | $ | (258,004 | ) | $ | 1,853,126 | $ | 18 | $ | 5,786 | $ | 5,804 | $ | 1,858,930 | ||||||||||||||||||
Issuance of shares, net of offering costs | 44 | 84 | 262 | 354,122 | 0 | 0 | 354,512 | 0 | 0 | 0 | 354,512 | ||||||||||||||||||||||||||||||||
Redemption of preferred shares | (40 | ) | 0 | 0 | (98,394 | ) | 0 | (1,566 | ) | (100,000 | ) | 0 | 0 | 0 | (100,000 | ) | |||||||||||||||||||||||||||
Repurchase of common shares into treasury | 0 | 0 | (3 | ) | 0 | 0 | 0 | (3 | ) | 0 | 0 | 0 | (3 | ) | |||||||||||||||||||||||||||||
Deferred compensation, net | 0 | 0 | 613 | 5,026 | 0 | 0 | 5,639 | 0 | 0 | 0 | 5,639 | ||||||||||||||||||||||||||||||||
Adjustments to noncontrolling interests | 0 | 0 | 0 | (213 | ) | 0 | 0 | (213 | ) | 0 | 213 | 213 | 0 | ||||||||||||||||||||||||||||||
Distributions on earned shares from share awards with market conditions | 0 | 0 | 0 | 0 | 0 | (20 | ) | (20 | ) | 0 | 0 | 0 | (20 | ) | |||||||||||||||||||||||||||||
Distributions on common shares/units ($0.96 per share/unit) | 0 | 0 | 0 | 0 | 0 | (94,538 | ) | (94,538 | ) | 0 | (285 | ) | (285 | ) | (94,823 | ) | |||||||||||||||||||||||||||
Distributions on preferred shares | 0 | 0 | 0 | 0 | 0 | (17,385 | ) | (17,385 | ) | (17 | ) | 0 | (17 | ) | (17,402 | ) | |||||||||||||||||||||||||||
Net income | 0 | 0 | 0 | 0 | 0 | 89,935 | 89,935 | 17 | 303 | 320 | 90,255 | ||||||||||||||||||||||||||||||||
Other comprehensive income: | |||||||||||||||||||||||||||||||||||||||||||
Unrealized gain on interest rate derivative instruments | 0 | 0 | 0 | 0 | 8,103 | 0 | 8,103 | 0 | 24 | 24 | 8,127 | ||||||||||||||||||||||||||||||||
Reclassification adjustment for amounts recognized in net income | 0 | 0 | 0 | 0 | 4,235 | 0 | 4,235 | 0 | 13 | 13 | 4,248 | ||||||||||||||||||||||||||||||||
Balance, December 31, 2013 | $ | 95 | $ | 1,039 | $ | (14 | ) | $ | 2,379,246 | $ | 4,603 | $ | (281,578 | ) | $ | 2,103,391 | $ | 18 | $ | 6,054 | $ | 6,072 | $ | 2,109,463 | |||||||||||||||||||
Issuance of shares, net of offering costs | 0 | 88 | 0 | 348,987 | 0 | 0 | 349,075 | 0 | 0 | 0 | 349,075 | ||||||||||||||||||||||||||||||||
Redemption of preferred shares | (23 | ) | 0 | 0 | (57,757 | ) | 0 | (951 | ) | (58,731 | ) | 0 | 0 | 0 | (58,731 | ) | |||||||||||||||||||||||||||
Repurchase of common shares into treasury | 0 | 0 | (2,936 | ) | 0 | 0 | 0 | (2,936 | ) | 0 | 0 | 0 | (2,936 | ) | |||||||||||||||||||||||||||||
Deferred compensation, net | 0 | 0 | 2,812 | 3,809 | 0 | 0 | 6,621 | 0 | 0 | 0 | 6,621 | ||||||||||||||||||||||||||||||||
Adjustments to noncontrolling interests | 0 | 0 | 0 | (397 | ) | 0 | 0 | (397 | ) | 0 | 397 | 397 | 0 | ||||||||||||||||||||||||||||||
Distributions on earned shares from share awards with market conditions | 0 | 0 | 0 | 0 | 0 | (314 | ) | (314 | ) | 0 | 0 | 0 | (314 | ) | |||||||||||||||||||||||||||||
Distributions on common shares/units ($1.41 per share/unit) | 0 | 0 | 0 | 0 | 0 | (149,657 | ) | (149,657 | ) | 0 | (416 | ) | (416 | ) | (150,073 | ) | |||||||||||||||||||||||||||
Distributions on preferred shares | 0 | 0 | 0 | 0 | 0 | (14,333 | ) | (14,333 | ) | (17 | ) | 0 | (17 | ) | (14,350 | ) | |||||||||||||||||||||||||||
Net income | 0 | 0 | 0 | 0 | 0 | 212,845 | 212,845 | 16 | 636 | 652 | 213,497 | ||||||||||||||||||||||||||||||||
Other comprehensive income: | |||||||||||||||||||||||||||||||||||||||||||
Unrealized loss on interest rate derivative instruments | 0 | 0 | 0 | 0 | (8,252 | ) | 0 | (8,252 | ) | 0 | (24 | ) | (24 | ) | (8,276 | ) | |||||||||||||||||||||||||||
Reclassification adjustment for amounts recognized in net income | 0 | 0 | 0 | 0 | 4,397 | 0 | 4,397 | 0 | 13 | 13 | 4,410 | ||||||||||||||||||||||||||||||||
Balance, December 31, 2014 | $ | 72 | $ | 1,127 | $ | (138 | ) | $ | 2,673,888 | $ | 748 | $ | (233,988 | ) | $ | 2,441,709 | $ | 17 | $ | 6,660 | $ | 6,677 | $ | 2,448,386 | |||||||||||||||||||
F-7
LASALLE HOTEL PROPERTIES
Consolidated Statements of Equity - Continued
(in thousands, except per share/unit data)
Preferred Shares of Beneficial Interest | Common Shares of Beneficial Interest | Treasury Shares | Additional Paid-In Capital | Accumulated Other Comprehensive (Loss) Income | Distributions in Excess of Retained Earnings | Total Shareholders’ Equity | Noncontrolling Interests in Consolidated Entities | Noncontrolling Interests of Common Units in Operating Partnership | Total Noncontrolling Interests | Total Equity | |||||||||||||||||||||||||||||||||
Issuance of shares, net of offering costs | 0 | 2 | 955 | 838 | 0 | 0 | 1,795 | 0 | 0 | 0 | 1,795 | ||||||||||||||||||||||||||||||||
Repurchase of common shares into treasury | 0 | 0 | (7,424 | ) | 0 | 0 | 0 | (7,424 | ) | 0 | 0 | 0 | (7,424 | ) | |||||||||||||||||||||||||||||
Unit conversion | 0 | 2 | 0 | 3,398 | 0 | 0 | 3,400 | 0 | (3,400 | ) | (3,400 | ) | 0 | ||||||||||||||||||||||||||||||
Deferred compensation, net | 0 | 0 | 1,809 | 5,872 | 0 | 0 | 7,681 | 0 | 0 | 0 | 7,681 | ||||||||||||||||||||||||||||||||
Adjustments to noncontrolling interests | 0 | 0 | 0 | 14 | 0 | 0 | 14 | 0 | (14 | ) | (14 | ) | 0 | ||||||||||||||||||||||||||||||
Distributions on earned shares from share awards with market conditions | 0 | 0 | 0 | 0 | 0 | (334 | ) | (334 | ) | 0 | 0 | 0 | (334 | ) | |||||||||||||||||||||||||||||
Distributions on common shares/units ($1.73 per share/unit) | 0 | 0 | 0 | 0 | 0 | (195,112 | ) | (195,112 | ) | 0 | (307 | ) | (307 | ) | (195,419 | ) | |||||||||||||||||||||||||||
Distributions on preferred shares | 0 | 0 | 0 | 0 | 0 | (12,169 | ) | (12,169 | ) | (15 | ) | 0 | (15 | ) | (12,184 | ) | |||||||||||||||||||||||||||
Net income | 0 | 0 | 0 | 0 | 0 | 135,552 | 135,552 | 16 | 261 | 277 | 135,829 | ||||||||||||||||||||||||||||||||
Other comprehensive income: | |||||||||||||||||||||||||||||||||||||||||||
Unrealized loss on interest rate derivative instruments | 0 | 0 | 0 | 0 | (5,668 | ) | 0 | (5,668 | ) | 0 | (14 | ) | (14 | ) | (5,682 | ) | |||||||||||||||||||||||||||
Reclassification adjustment for amounts recognized in net income | 0 | 0 | 0 | 0 | 4,823 | 0 | 4,823 | 0 | 12 | 12 | 4,835 | ||||||||||||||||||||||||||||||||
Balance, December 31, 2015 | $ | 72 | $ | 1,131 | $ | (4,798 | ) | $ | 2,684,010 | $ | (97 | ) | $ | (306,051 | ) | $ | 2,374,267 | $ | 18 | $ | 3,198 | $ | 3,216 | $ | 2,377,483 | ||||||||||||||||||
The accompanying notes are an integral part of these consolidated financial statements.
F-8
LASALLE HOTEL PROPERTIES
Consolidated Statements of Cash Flows
(in thousands)
For the year ended | |||||||||||
December 31, | |||||||||||
2015 | 2014 | 2013 | |||||||||
Cash flows from operating activities: | |||||||||||
Net income | $ | 135,829 | $ | 213,497 | $ | 90,255 | |||||
Adjustments to reconcile net income to net cash provided by operating activities: | |||||||||||
Depreciation and amortization | 180,855 | 155,035 | 143,991 | ||||||||
Amortization of deferred financing costs, mortgage premium and note receivable discount | 2,631 | 1,142 | (348 | ) | |||||||
Loss from extinguishment of debt | 831 | 2,487 | 0 | ||||||||
Gain on sale of properties | 0 | (93,205 | ) | 0 | |||||||
Amortization of deferred compensation | 7,681 | 6,621 | 5,639 | ||||||||
Deferred income tax benefit | (1,734 | ) | (335 | ) | (211 | ) | |||||
Allowance for doubtful accounts | 55 | (44 | ) | (1 | ) | ||||||
Other | 466 | 404 | 449 | ||||||||
Changes in assets and liabilities: | |||||||||||
Restricted cash reserves | 2,332 | (912 | ) | 157 | |||||||
Hotel receivables | (7,384 | ) | (177 | ) | (1,987 | ) | |||||
Prepaid expenses and other assets | (4,965 | ) | (940 | ) | (8,277 | ) | |||||
Accounts payable and accrued expenses | 14,416 | (1,581 | ) | 16,633 | |||||||
Advance deposits | 6,959 | 1,343 | (244 | ) | |||||||
Accrued interest | (453 | ) | (99 | ) | (491 | ) | |||||
Net cash provided by operating activities | 337,519 | 283,236 | 245,565 | ||||||||
Cash flows from investing activities: | |||||||||||
Additions to properties | (129,963 | ) | (97,526 | ) | (58,077 | ) | |||||
Improvements to properties | (12,965 | ) | (4,583 | ) | (61,662 | ) | |||||
Acquisition of properties | (439,157 | ) | (191,111 | ) | (302,135 | ) | |||||
Deposit on acquisition | 25,000 | (25,000 | ) | 0 | |||||||
Purchase of office furniture and equipment | (143 | ) | (799 | ) | (47 | ) | |||||
Acquisition of note receivable | (80,000 | ) | 0 | 0 | |||||||
Repayment of note receivable | 0 | 72,000 | 0 | ||||||||
Restricted cash reserves | (7,205 | ) | (934 | ) | (967 | ) | |||||
Proceeds from sale of properties | 0 | 167,838 | 0 | ||||||||
Property insurance proceeds | 2,431 | 2,114 | 843 | ||||||||
Net cash used in investing activities | (642,002 | ) | (78,001 | ) | (422,045 | ) | |||||
Cash flows from financing activities: | |||||||||||
Borrowings under credit facilities | 830,807 | 537,828 | 478,332 | ||||||||
Repayments under credit facilities | (809,807 | ) | (758,434 | ) | (410,726 | ) | |||||
Borrowings on term loan | 555,000 | 0 | 0 | ||||||||
Repayments of term loan | (177,500 | ) | 0 | 0 | |||||||
Proceeds from mortgage loan | 225,000 | 0 | 0 | ||||||||
Repayments of mortgage loans | (214,796 | ) | (13,325 | ) | (64,687 | ) | |||||
Payment of deferred financing costs | (5,716 | ) | (5,170 | ) | (68 | ) | |||||
Purchase of treasury shares | (7,424 | ) | (2,936 | ) | (3 | ) | |||||
Proceeds from issuance of preferred shares | 0 | 0 | 110,000 | ||||||||
Payment of preferred offering costs | 0 | 0 | (3,648 | ) | |||||||
Proceeds from issuance of common shares | 0 | 352,222 | 251,478 | ||||||||
Payment of common offering costs | (251 | ) | (3,557 | ) | (3,759 | ) | |||||
Distributions on earned shares from share awards with market conditions | (334 | ) | (314 | ) | (20 | ) | |||||
Redemption of preferred shares | 0 | (58,722 | ) | (100,000 | ) | ||||||
Distributions on preferred shares | (12,184 | ) | (15,413 | ) | (17,460 | ) | |||||
Distributions on common shares/units | (186,743 | ) | (136,671 | ) | (84,661 | ) | |||||
Net cash provided by (used in) financing activities | 196,052 | (104,492 | ) | 154,778 | |||||||
Net change in cash and cash equivalents | (108,431 | ) | 100,743 | (21,702 | ) | ||||||
Cash and cash equivalents, beginning of year | 114,131 | 13,388 | 35,090 | ||||||||
Cash and cash equivalents, end of year | $ | 5,700 | $ | 114,131 | $ | 13,388 | |||||
The accompanying notes are an integral part of these consolidated financial statements.
F-9
LASALLE HOTEL PROPERTIES
Notes to Consolidated Financial Statements
(in thousands, except share/unit data)
1. | Organization |
LaSalle Hotel Properties (the “Company”), a Maryland real estate investment trust organized on January 15, 1998, primarily buys, owns, redevelops and leases upscale and luxury full-service hotels located in convention, resort and major urban business markets. The Company is a self-administered and self-managed real estate investment trust (“REIT”) as defined in the Internal Revenue Code of 1986, as amended (the “Code”). As a REIT, the Company is generally not subject to federal corporate income tax on that portion of its net income that is currently distributed to its shareholders. The income of LaSalle Hotel Lessee, Inc. (together with its wholly owned subsidiaries, “LHL”), the Company’s wholly owned taxable REIT subsidiary (“TRS”), is subject to taxation at normal corporate rates.
As of December 31, 2015, the Company owned interests in 47 hotels with over 12,000 guest rooms located in 10 states and the District of Columbia. Each hotel is leased to LHL (see Note 8) under a participating lease that provides for rental payments equal to the greater of (i) a base rent or (ii) a participating rent based on hotel revenues. The LHL leases expire between December 2016 and December 2018. Lease revenue from LHL is eliminated in consolidation. A third-party non-affiliated hotel operator manages each hotel pursuant to a hotel management agreement.
Substantially all of the Company’s assets are held directly or indirectly by, and all of its operations are conducted through, LaSalle Hotel Operating Partnership, L.P. (the “Operating Partnership”). The Company is the sole general partner of the Operating Partnership. The Company owned, through a combination of direct and indirect interests, 99.9% of the common units of the Operating Partnership at December 31, 2015. The remaining 0.1% is held by limited partners who held 145,223 common units of the Operating Partnership at December 31, 2015. See Note 6 for additional disclosures related to common units of the Operating Partnership.
2. | Summary of Significant Accounting Policies |
Basis of Presentation
The consolidated financial statements include the accounts of the Company, the Operating Partnership, LHL and their subsidiaries in which they have a controlling interest, including joint ventures. All significant intercompany balances and transactions have been eliminated.
Use of Estimates
The preparation of the consolidated financial statements in conformity with U.S. generally accepted accounting principles (“GAAP”) requires management to make estimates and assumptions that affect the reported amounts of certain assets and liabilities, the amounts of contingent assets and liabilities at the balance sheet date and the reported amounts of revenues and expenses during the reporting periods. Actual results could differ from those estimates.
Risks and Uncertainties
The state of the overall economy can significantly impact hotel operational performance and thus, impact the Company’s financial position. Should any of the hotels experience a significant decline in operational performance, it may affect the Company’s ability to make distributions to its shareholders, service debt or meet other financial obligations.
Investment in Hotel Properties
Upon acquisition, the Company determines the fair value of the acquired long-lived assets, assumed debt and intangible assets and liabilities. The Company’s investments in hotel properties are carried at cost and depreciated using the straight-line method over an estimated useful life of 30 to 40 years for buildings, 15 years for building improvements, the shorter of the useful life of the improvement or the term of the related tenant lease for tenant improvements, 7 years for land improvements, 20 years for golf course land improvements, 20 years for swimming pool assets and 3 to 5 years for furniture, fixtures and equipment. For investments subject to land and building leases that qualify as capital leases, assets are recorded at the estimated fair value of the right to use the leased property at acquisition and depreciated over the shorter of the useful lives of the assets or the term of the respective lease. Renovations and/or replacements that improve or extend the life of the asset are capitalized and depreciated over their estimated useful lives.
The Company is required to make subjective assessments as to the useful lives and classification of its properties for purposes of determining the amount of depreciation expense to reflect each year with respect to those properties. These assessments have
F-10
a direct impact on the Company’s net income. Should the Company change the expected useful life or classification of particular assets, it would result in a change in depreciation expense and annual net income.
The Company reviews each hotel for impairment at the end of each reporting period or as events and circumstances dictate throughout the year. A property is considered impaired when the sum of estimated future undiscounted cash flows over the estimated remaining holding period is less than the carrying amount of a property.
At the end of each reporting period, the Company assesses whether any quantitative or qualitative triggering events have occurred in relation to a property. Examples of situations considered to be triggering events include:
• | a substantial decline in operating cash flows during the period, including declines related to decreased occupancy, average daily rate or revenue per available room; |
• | a current or projected loss from operations; |
• | a significant cost accumulation above the original acquisition/development estimate; |
• | a change in plan to sell the property prior to the end of its useful life or holding period; |
• | a significant decrease in market price not in line with general market trends; and |
• | any other quantitative or qualitative events deemed significant by the Company’s management or the Company’s Board of Trustees. |
If the presence of one or more triggering events as described above is identified at the end of a reporting period or throughout the year with respect to a hotel, the Company performs a recoverability test. In doing so, an estimate of undiscounted future cash flows over the estimated remaining holding period is compared to the carrying amount of the hotel.
Impairment is indicated if the results of a recoverability analysis indicate that the carrying amount of a hotel exceeds the estimated future undiscounted cash flows. An impairment charge is recorded equal to the excess of the carrying value of the hotel over the fair value. When determining the fair value of a property, the Company makes certain assumptions including, but not limited to, consideration of:
• | projected operating cash flows – considering factors such as booking pace, growth rates, occupancy, room rates, property-specific operating costs and future capital expenditures; |
• | projected cash flows from the eventual disposition of the hotel based upon our estimation of a property-specific capitalization rate; |
• | property-specific discount rates; and |
• | comparable selling prices. |
The Company considers a hotel as held for sale when a contract for sale is entered into, a substantial nonrefundable deposit has been received from the purchaser and sale is expected to occur within one year.
Upon sale of a hotel, the Company determines its profit from the sale under the full accrual method provided the following applicable criteria are met: a sale is consummated; the buyer’s initial and continuing investments are adequate to demonstrate a commitment to pay for the property; the Company’s receivable, if applicable, is not subject to future subordination; the Company has transferred to the buyer the usual risks and rewards of ownership; and the Company does not have a substantial continuing involvement with the property. If all of these conditions are met, the Company will recognize the full profit on the sale.
Intangible Assets
The Company does not amortize intangible assets with indefinite useful lives. Non-amortizable intangible assets are reviewed annually for impairment and more frequently if events or circumstances indicate that the assets may be impaired. If a non-amortizable intangible asset is subsequently determined to have a finite useful life, the intangible asset will be written down to the lower of its fair value or carrying amount and then amortized prospectively, based on the remaining useful life of the intangible asset. As of December 31, 2015 and 2014, the Company did not have amortizable intangible assets or any value attributed to such non-amortizable intangible assets in the accompanying consolidated balance sheets.
F-11
Derivatives and Hedging Activities
In the normal course of business, the Company is exposed to the effects of interest rate changes. The Company limits the risks associated with interest rate changes by following established risk management policies and procedures which may include the use of derivative instruments. The Company formally documents all relationships between hedging instruments and hedged items, as well as its risk management objectives and strategies for undertaking various hedge transactions. The Company assesses, both at the inception of the hedge and on an ongoing basis, whether the derivatives that are used in hedging transactions are highly effective in offsetting changes in the cash flows of the hedged items. Instruments that meet these hedging criteria are formally designated as hedges at the inception of the derivative contract and are recorded on the balance sheet at fair value, with offsetting changes recorded to other comprehensive income (loss). Ineffective portions of changes in the fair value of a cash flow hedge are recognized as interest expense. The Company incorporates credit valuation adjustments to reflect both its own nonperformance risk and the respective counterparty’s nonperformance risk in the fair value measurements. The Company does not use derivatives for trading or speculative purposes and currently does not have any derivatives that are not designated as hedging instruments under the accounting requirements for derivatives and hedging.
Cash and Cash Equivalents
All highly liquid investments with a maturity of three months or less when purchased are considered to be cash equivalents.
Restricted Cash Reserves
The Company classifies certain cash balances as restricted cash reserves, including (i) reserve funds relating to the hotels with leases or operating agreements requiring the Company to maintain restricted cash to fund future capital expenditures, (ii) cash deposited in mortgage escrow accounts pursuant to mortgage obligations to pre-fund a portion of certain operating expenses and debt payments and (iii) cash held by insurance and management companies on the Company’s behalf to be refunded or applied to future liabilities.
Deferred Financing Costs
Financing costs related to long-term debt are recorded at cost and are amortized as interest expense over the life of the related debt instrument, unless there is a significant modification to the debt instrument. Accumulated amortization at December 31, 2015 and 2014 was $5,109 and $3,436, respectively.
Revenue Recognition
The Company recognizes hotel operating revenues on an accrual basis consistent with hotel operations. For retail operations, revenue is recognized on a straight line basis over the lives of the retail leases. Revenue from retail operations is included in other income in the accompanying consolidated statements of operations and comprehensive income.
Participating Leases
The participating leases have non-cancelable terms of three years (from commencement), subject to earlier termination upon the occurrence of certain contingencies, as defined. Each participating lease requires LHL to pay the Operating Partnership or subsidiary the greater of (i) base rent in a fixed amount or (ii) participating rent based on certain percentages of room revenue, food and beverage revenue, telephone revenue and other revenue at the applicable hotel. Participating rent applicable to room and other hotel revenues varies by lease and is calculated by multiplying fixed percentages by the total amounts of such revenues over specified quarterly threshold amounts. Both the base rent and the participating rent thresholds used in computing percentage rents applicable to room and other hotel revenues, including food and beverage revenues, are subject to annual adjustments based on increases in the United States Consumer Price Index published by the Bureau of Labor Statistics of the United States of America Department of Labor, U.S. City Average, Urban Wage Earners and Clerical Workers. Lease revenue from LHL is eliminated in consolidation.
Share-Based Compensation
From time to time, the Company awards shares under the 2014 Equity Incentive Plan (“2014 Plan”), which has approximately eight years remaining, as compensation to executives, employees and members of the Board of Trustees (see Note 7). The shares issued to executives and employees generally vest over three years. The shares issued to members of the Board of Trustees vest immediately upon issuance. The Company recognizes compensation expense for nonvested shares with service conditions or service and market conditions on a straight-line basis over the vesting period based upon the fair value of the shares on the date of issuance, adjusted for forfeitures. Compensation expense for nonvested shares with service and performance conditions is recognized based on the fair value of the estimated number of shares expected to vest, as revised throughout the vesting period, adjusted for forfeitures. The 2014 Plan replaced the 2009 Equity Incentive Plan (“2009 Plan”) in May 2014.
F-12
Noncontrolling Interests
The Company’s consolidated financial statements include entities in which the Company has a controlling financial interest. Noncontrolling interest is the portion of equity (net assets) in a subsidiary not attributable, directly or indirectly, to a parent. Such noncontrolling interests are reported on the consolidated balance sheets within equity, separately from the Company’s equity. On the consolidated statements of operations and comprehensive income (loss), revenues, expenses and net income or loss from less-than-wholly-owned subsidiaries are reported at the consolidated amounts, including both the amounts attributable to the Company and noncontrolling interests. Income or loss is allocated to noncontrolling interests based on their weighted average ownership percentage for the applicable period. Consolidated statements of equity include beginning balances, activity for the period and ending balances for shareholders’ equity, noncontrolling interests and total equity.
However, the Company’s noncontrolling interests that are redeemable for cash or other assets at the option of the holder, not solely within the control of the issuer, must be classified outside of permanent equity. The Company makes this determination based on terms in applicable agreements, specifically in relation to redemption provisions. Additionally, with respect to noncontrolling interests for which the Company has a choice to settle the contract by delivery of its own shares, the Company evaluates whether the Company controls the actions or events necessary to issue the maximum number of shares that could be required to be delivered under share settlement of the contract.
As of December 31, 2015, the consolidated results of the Company include the following ownership interests held by owners other than the Company: (i) the common units in the Operating Partnership held by third parties, (ii) the outside preferred ownership interests in a subsidiary and (iii) the outside ownership interest in a joint venture.
Income Taxes
The Company has elected to be taxed as a REIT under Sections 856 through 860 of the Code commencing with its taxable year ended December 31, 1998. To qualify as a REIT, the Company must meet a number of organizational and operational requirements, including a requirement that it currently distribute at least 90% of its adjusted taxable income to its shareholders. It is the Company’s current intention to adhere to these requirements and maintain the Company’s qualification for taxation as a REIT. As a REIT, the Company generally is not subject to federal corporate income tax on that portion of its net income that is currently distributed to shareholders. If the Company fails to qualify for taxation as a REIT in any taxable year, it will be subject to federal income taxes at regular corporate rates (including any applicable alternative minimum tax) and may not be able to qualify as a REIT for four subsequent taxable years. Even if the Company qualifies for taxation as a REIT, the Company may be subject to certain state and local taxes on its income and property, and to federal income and excise taxes on its undistributed taxable income. In addition, taxable income from non-REIT activities managed through a TRS is subject to federal, state and local income taxes. As a wholly owned TRS of the Company, LHL is required to pay income taxes at the applicable federal, state and local rates.
Deferred tax assets and liabilities are recognized for the estimated future tax consequences attributable to differences between the financial statement carrying amounts of existing assets and liabilities and their respective tax bases. Deferred tax assets and liabilities are measured using enacted tax rates in effect for the year in which those temporary differences are expected to be recovered or settled. The effect on deferred tax assets and liabilities from a change in tax rates is recognized in earnings in the period when the new rate is enacted. However, deferred tax assets are recognized only to the extent that it is more likely than not that they will be realized based on consideration of available evidence, including future reversals of existing taxable temporary differences, future projected taxable income and tax planning strategies. The Company’s deferred tax assets balance consists primarily of net operating loss carryforwards (see Note 9).
Earnings per Common Share
Basic earnings per common share is based on the weighted average number of common shares of beneficial interest outstanding during the year excluding the weighted average number of unvested restricted shares (“participating securities” as defined in Note 11). The basic earnings per share calculation excludes the effect of such participating securities. Diluted earnings per common share is based on the basic weighted average number of common shares of beneficial interest outstanding plus the effect of in-the-money stock options and compensation-related shares. Any anti-dilutive shares are excluded from the diluted earnings per share calculation.
Comprehensive Income
The purpose of reporting comprehensive income is to report a measure of all changes in equity of an entity that result from recognized transactions and other economic events of the period other than transactions with owners in their capacity as owners. Comprehensive income consists of all components of income, including other comprehensive income, which is excluded from net income. For the years ended December 31, 2015, 2014 and 2013, comprehensive income was $134,982, $209,631 and $102,630,
F-13
respectively. As of December 31, 2015, the Company’s accumulated other comprehensive loss was $97 and, as of December 31, 2014, the Company’s accumulated other comprehensive income was $748.
Notes Receivable
Notes receivable are carried at cost, net of any premiums or discounts which are recognized as an adjustment of yield over the remaining life of the note using the effective interest method. Any costs related to notes receivable are expensed as incurred. Interest income is recorded on the accrual basis consistent with the terms of the notes receivable. A note is deemed to be impaired when, based on current information and events, including a review of factors that would impact the fair value of the underlying collateral, it is probable that the Company will be unable to collect all principal and interest contractually due. The Company considers current and projected cash flow, historical payment patterns, general and industry specific economic factors and operating results in determining the probability of default. Interest previously accrued but not collected becomes part of the Company’s recorded investment in the note receivable for purposes of assessing impairment. The Company applies interest payments received on non-accrual notes receivable first to accrued interest and then as interest income. Notes receivable return to accrual status when contractually current and the collection of future payments is reasonably assured.
Recently Issued Accounting Pronouncements
In May 2014, the Financial Accounting Standards Board (“FASB”) issued Accounting Standards Update (“ASU”) No. 2014-09, Revenue from Contracts with Customers, which requires an entity to recognize the amount of revenue to which it expects to be entitled for the transfer of promised goods or services to customers. The ASU will replace most existing revenue recognition guidance in GAAP when it becomes effective. The new standard is effective for the Company on January 1, 2018. Early adoption is permitted. The standard permits the use of either the retrospective or cumulative effect transition method. The Company is evaluating the effect that ASU No. 2014-09 will have on its consolidated financial statements and related disclosures. The Company has not yet selected a transition method nor has it determined the effect of the standard on its ongoing financial reporting.
In February 2015, the FASB issued ASU No. 2015-02, Consolidation (Topic 810): Amendments to the Consolidation Analysis, which changes the way reporting enterprises evaluate the consolidation of limited partnerships, variable interests and similar entities. This standard will be effective for the first annual reporting period beginning after December 15, 2015 with early adoption permitted. The Company is evaluating the effect that ASU No. 2015-02 will have on its consolidated financial statements and related disclosures, but believes it will not have a material impact on its financial reporting.
In April 2015, the FASB issued ASU No. 2015-03, Simplifying the Presentation of Debt Issuance Costs, which requires debt issuance costs to be presented on the balance sheet as a direct deduction from the carrying amount of the debt liability. This standard will be effective for the first annual reporting period beginning after December 15, 2015 with early adoption permitted. The adoption of this standard will only affect the presentation of the Company’s consolidated balance sheet.
In April 2015, the FASB issued ASU No. 2015-05, Intangibles-Goodwill and Other-Internal-Use Software (Subtopic 350-40): Customer’s Accounting for Fees Paid in Cloud Computing Arrangement, which provides guidance on customer evaluation of whether it is obtaining a software license or, instead, a service in a cloud computing arrangement with the same evaluation undertaken by the provider. This standard will be effective for the first annual reporting period beginning after December 15, 2015 with early adoption permitted. The Company is evaluating the effect that ASU No. 2015-05 will have on its consolidated financial statements and related disclosures, but believes it will not have a material impact on its financial reporting.
Reclassification
Certain amounts in the 2013 and 2014 financial statements have been reclassified to conform with the 2015 presentation.
3. | Investment in Properties |
Investment in hotel properties as of December 31, 2015 and 2014 consists of the following:
December 31, 2015 | December 31, 2014 | ||||||
Land | $ | 731,796 | $ | 601,962 | |||
Buildings and improvements | 3,613,724 | 3,295,233 | |||||
Furniture, fixtures and equipment | 701,742 | 596,879 | |||||
Investment in hotel properties, gross | 5,047,262 | 4,494,074 | |||||
Accumulated depreciation | (1,229,586 | ) | (1,065,518 | ) | |||
Investment in hotel properties, net | $ | 3,817,676 | $ | 3,428,556 | |||
F-14
As of December 31, 2015 and 2014, buildings and improvements included capital lease assets of $183,503 and $186,711, respectively, and accumulated depreciation included amounts related to capital lease assets of $20,915 and $15,513, respectively. Depreciation of the capital lease assets is included in depreciation and amortization expense in the accompanying consolidated statements of operations and comprehensive income for all periods presented.
The December 31, 2015 balance of investment in hotel properties excludes $54,066 classified as property under development primarily at Chaminade Resort and Conference Center, Hotel Palomar, Washington, DC, Lansdowne Resort, Mason & Rook Hotel (formerly Hotel Helix), The Liberty Hotel and Westin Michigan Avenue. The December 31, 2014 balance of investment in hotel properties excludes $35,613 classified as property under development primarily at Hotel Chicago, Hyatt Regency Boston Harbor, Sofitel Washington, DC Lafayette Square, The Marker San Francisco (formerly Hotel Monaco San Francisco), Villa Florence, Westin Michigan Avenue and Westin Philadelphia.
Interest, real estate taxes and insurance costs incurred during the renovation or development period are capitalized and depreciated over the lives of the renovated or developed assets. Capitalized interest for the years ended December 31, 2015, 2014 and 2013 was $902, $400 and $649, respectively.
The hotels owned as of December 31, 2015 are located in California (19), the District of Columbia (nine), Florida (two), Illinois (two), Indiana (one), Massachusetts (four), New York (four), Oregon (one), Pennsylvania (two), Virginia (one) and Washington state (two).
Investment in Joint Venture
The Company holds a 99.99% controlling interest in The Liberty Hotel. Since the Company holds a controlling interest, the accounts of the joint venture have been included in the accompanying consolidated financial statements. The 0.01% interest of the outside partner is included in noncontrolling interests in consolidated entities in the accompanying consolidated balance sheets.
Acquisitions
During 2013, the Company acquired 100% interests in four full-service hotels, each of which is leased to LHL. The Company recorded the acquisitions at fair value using model-derived valuations, with the estimated fair value recorded to investment in hotel properties, capital lease obligations and hotel working capital assets and liabilities. In connection with the acquisitions, the Company incurred acquisition transaction costs that were expensed as incurred. The following is a summary of the acquisitions:
Acquisition Transaction Costs | ||||||||||||||||
Hotel Name | Acquisition Date | Number of Rooms | Location | Purchase Price | Manager | For the year ended December 31, 2013 | ||||||||||
Harbor Court Hotel | August 1, 2013 | 131 | San Francisco, CA | $ | 36,875 | Kimpton Hotel & Restaurant Group, LLC (1) | $ | 578 | ||||||||
Hotel Triton | August 1, 2013 | 140 | San Francisco, CA | 10,900 | Kimpton Hotel & Restaurant Group, LLC (1) | 115 | ||||||||||
Serrano Hotel | August 21, 2013 | 236 | San Francisco, CA | 71,500 | Kimpton Hotel & Restaurant Group, LLC (2) | 1,010 | ||||||||||
Southernmost Hotel Collection (2) | August 27, 2013 | 260 | Key West, FL | 184,500 | Highgate Hotels | 943 | ||||||||||
Total | $ | 303,775 | $ | 2,646 | ||||||||||||
(1) Effective July 2015, management transitioned to Outrigger Lodging Services.
(2) Effective January 29, 2014, management transitioned to Access Hotels & Resorts.
(3) Renamed Southernmost Beach Resort Key West.
Harbor Court Hotel and Hotel Triton are subject to leases of land and building, which were determined to be capital leases (see Note 5). Accordingly, at acquisition, the Company recorded capital assets related to its leasehold interests of $54,563 and $37,253 for Harbor Court Hotel and Hotel Triton, respectively, based upon the estimated fair values of the rights to use the leased properties for the remaining terms. The capital assets are included within investment in hotel properties, net. Additionally, the Company recorded furniture, fixtures and equipment and inventory of $736 and $1,399 for Harbor Court Hotel and Hotel Triton, respectively, as part of the acquisitions.
The source of the funding for the 2013 acquisitions was borrowings under the Company’s senior unsecured credit facility. Total revenues and net income from the hotels acquired during 2013 of $26,591 and $2,683, respectively, are included in the accompanying consolidated statements of operations and comprehensive income for the year ended December 31, 2013.
F-15
During 2014, the Company acquired 100% interests in two full-service hotels, each of which is leased to LHL. The Company recorded the acquisitions at fair value using model-derived valuations, with the estimated fair value recorded to investment in hotel properties and hotel working capital assets and liabilities. In connection with the acquisitions, the Company incurred acquisition transaction costs that were expensed as incurred. The following is a summary of the acquisitions:
Acquisition Transaction Costs | ||||||||||||||||
Hotel Name | Acquisition Date | Number of Rooms | Location | Purchase Price | Manager | For the year ended December 31, 2014 | ||||||||||
Hotel Vitale | April 2, 2014 | 200 | San Francisco, CA | $ | 130,000 | Commune Hotels and Resorts | $ | 1,864 | ||||||||
The Heathman Hotel | December 18, 2014 | 150 | Portland, OR | 64,325 | JRK Hotel Group, Inc. | 328 | ||||||||||
Total for 2014 Acquisitions | $ | 194,325 | $ | 2,192 | ||||||||||||
Land purchase (adjacent to Onyx Hotel) | 64 | |||||||||||||||
Park Central San Francisco (1) | 123 | |||||||||||||||
Total | $ | 2,379 | ||||||||||||||
(1) On January 23, 2015, the Company acquired Park Central San Francisco.
The source of the funding for the April 2, 2014 acquisition was borrowings under the Company’s senior unsecured credit facility. The source of funding for the December 18, 2014 acquisition was cash on hand. Total revenues and net income from the hotels acquired during 2014 of $27,988 and $2,018, respectively, are included in the accompanying consolidated statements of operations and comprehensive income for the year ended December 31, 2014.
On April 30, 2014, the Company acquired a parcel of land located adjacent to the Company’s Onyx Hotel in Boston, MA for $2,500. The land is available for future use.
During 2015, the Company acquired 100% interests in two full-service hotels, each of which is leased to LHL. The Company recorded the acquisitions at fair value using model-derived valuations, with the estimated fair value recorded to investment in hotel properties and hotel working capital assets and liabilities. In connection with the acquisitions, the Company incurred acquisition transaction costs that were expensed as incurred. The following is a summary of the acquisitions:
Acquisition Transaction Costs | ||||||||||||||||
Hotel Name | Acquisition Date | Number of Rooms | Location | Purchase Price | Manager | For the year ended December 31, 2015 | ||||||||||
Park Central San Francisco | January 23, 2015 | 681 | San Francisco, CA | $ | 350,000 | Highgate Hotels | $ | 230 | ||||||||
The Marker Waterfront Resort | March 16, 2015 | 96 | Key West, FL | 96,250 | Highgate Hotels | 214 | ||||||||||
Total for 2015 Acquisitions | $ | 446,250 | 444 | |||||||||||||
Mezzanine Loan (1) | 55 | |||||||||||||||
Total | $ | 499 | ||||||||||||||
(1) See “Note Receivable” below.
The sources of the funding for the January 23, 2015 acquisition were cash on hand and borrowings under the Company’s senior unsecured credit facility. The source of funding for the March 16, 2015 acquisition was borrowings under the Company’s senior unsecured credit facility. Total revenues and net income from the hotels acquired during 2015 of $82,884 and $11,705, respectively, are included in the accompanying consolidated statements of operations and comprehensive income for the year ended December 31, 2015.
Dispositions
On June 17, 2014, the Company sold the Hilton Alexandria Old Town for $93,380. This sale does not represent a strategic shift in the Company’s business plan or primary markets, and therefore, does not qualify as discontinued operations. The Company recognized a gain of $43,548 related to the sale of this property, which is included in the accompanying consolidated statements of operations and comprehensive income for the year ended December 31, 2014. The sale of the property was recorded on the full accrual method.
On September 10, 2014, the Company sold the Hotel Viking for $77,000. This sale does not represent a strategic shift in the Company’s business plan or primary markets, and therefore, does not qualify as discontinued operations. The Company recognized a gain of $49,657 related to the sale of this property, which is included in the accompanying consolidated statements of operations and comprehensive income for the year ended December 31, 2014. The sale of the property was recorded on the full accrual
F-16
method. In conjunction with the sale of Hotel Viking, the Company executed a reverse 1031 exchange with Hotel Vitale, which was purchased on April 2, 2014. The reverse 1031 exchange has no effect on the Company’s GAAP financial reporting and does not have a material impact on the Company’s tax positions and expected tax expense.
Note Receivable
On July 20, 2015, the Company provided a junior mezzanine loan (the “Mezzanine Loan”) secured by pledges of equity interests in the entities that own the hotel properties, Shutters on the Beach and Casa Del Mar, in Santa Monica, CA. The Company entered into the Mezzanine Loan for a total purchase price of $80,000 before closing costs. The Mezzanine Loan bears interest at a variable interest rate equal to LIBOR plus 7.75%, which rate was 8.09% as of December 31, 2015. Interest-only payments are to be received monthly with the option of prepayment, pursuant to certain terms and conditions. The Mezzanine Loan matures on August 9, 2017 and has five one-year extension options, subject to conditions. The Mezzanine Loan is subordinate to a $235,000 first mortgage loan and a $90,000 senior mezzanine loan secured by the properties that also mature on August 9, 2017.
4. | Long-Term Debt |
Debt Summary
Debt as of December 31, 2015 and December 31, 2014 consisted of the following:
Balance Outstanding as of | ||||||||||||
Debt | Interest Rate | Maturity Date | December 31, 2015 | December 31, 2014 | ||||||||
Credit facilities | ||||||||||||
Senior unsecured credit facility | Floating (a) | January 2018 (a) | $ | 21,000 | $ | 0 | ||||||
LHL unsecured credit facility | Floating (b) | January 2018 (b) | 0 | 0 | ||||||||
Total borrowings under credit facilities | 21,000 | 0 | ||||||||||
Term loans | ||||||||||||
First Term Loan | Floating (c) | - (c) | 0 | 177,500 | ||||||||
Second Term Loan | Floating (c) | January 2019 | 300,000 | 300,000 | ||||||||
Third Term Loan | Floating (c) | January 2021 | 555,000 | 0 | ||||||||
Total term loans | 855,000 | 477,500 | ||||||||||
Massport Bonds | ||||||||||||
Hyatt Regency Boston Harbor (taxable) | Floating (d) | March 2018 | 5,400 | 5,400 | ||||||||
Hyatt Regency Boston Harbor (tax exempt) | Floating (d) | March 2018 | 37,100 | 37,100 | ||||||||
Total bonds payable | 42,500 | 42,500 | ||||||||||
Mortgage loans | ||||||||||||
Westin Copley Place | 5.28% | - (e) | 0 | 210,000 | ||||||||
Westin Michigan Avenue | 5.75% | April 2016 (f) | 131,262 | 133,347 | ||||||||
Indianapolis Marriott Downtown | 5.99% | July 2016 (f) | 96,097 | 97,528 | ||||||||
The Roger | 6.31% | August 2016 (g) | 58,935 | 60,215 | ||||||||
Westin Copley Place | Floating (h) | August 2018 (h) | 225,000 | 0 | ||||||||
Total mortgage loans | 511,294 | 501,090 | ||||||||||
Total debt | $ | 1,429,794 | $ | 1,021,090 | ||||||||
(a) | Borrowings bear interest at floating rates equal to, at the Company’s option, either (i) LIBOR plus an applicable margin, or (ii) an Adjusted Base Rate (as defined in the credit agreement) plus an applicable margin. As of December 31, 2015, the rate, including the applicable margin, for the Company’s outstanding LIBOR borrowing of $21,000 was 2.13%. There were no borrowings outstanding at December 31, 2014. The Company has the option, pursuant to certain terms and conditions, to extend the maturity date for two six-month extensions. |
(b) | Borrowings bear interest at floating rates equal to, at LHL’s option, either (i) LIBOR plus an applicable margin, or (ii) an Adjusted Base Rate (as defined in the credit agreement) plus an applicable margin. There were no borrowings outstanding at December 31, 2015 and December 31, 2014. LHL has the option, pursuant to certain terms and conditions, to extend the maturity date for two six-month extensions. |
(c) | Term loans bear interest at floating rates equal to LIBOR plus an applicable margin. The Company entered into separate interest rate swap agreements for the full seven-year term of the First Term Loan (as defined below) and a five-year term ending in August 2017 for the Second Term Loan (as defined below), resulting in fixed all-in interest rates. On November 5, |
F-17
2015, the Company repaid the First Term Loan and entered into the Third Term Loan (as defined below). The Company entered into separate interest rate swap agreements with an aggregate notional amount of $377,500 for the full term of the Third Term Loan. The interest rate swaps for the First Term Loan continue to be in place and were redesignated as hedging instruments through May 2019 for the Third Term Loan. At December 31, 2015, the fixed all-in interest rates for the Second Term Loan and Third Term Loan were 2.38% and 2.95%, respectively, at the Company’s current leverage ratio (as defined in the swap agreements). At December 31, 2014, the fixed all-in interest rates for the First Term Loan and Second Term Loan were 3.62% and 2.38%, respectively, at the Company’s current leverage ratio (as defined in the swap agreements).
(d) | The Massport Bonds are secured by letters of credit issued by U.S. Bank National Association (“U.S. Bank”) that expire in September 2016. The letters of credit have two one-year extension options and are secured by the Hyatt Regency Boston Harbor. The letters of credit cannot be extended beyond the Massport Bonds’ maturity date. The bonds bear interest based on weekly floating rates. The interest rates as of December 31, 2015 were 0.39% and 0.02% for the $5,400 and $37,100 bonds, respectively. The interest rates as of December 31, 2014 were 0.13% and 0.03% for the $5,400 and $37,100 bonds, respectively. The Company incurs an annual letter of credit fee of 1.35%. |
(e) | The Company repaid the mortgage loan on June 1, 2015 through borrowings on its senior unsecured credit facility. |
(f) | The Company repaid the mortgage loans on January 4, 2016 through borrowings on its senior unsecured credit facility (see Note 13). |
(g) | The Company repaid the mortgage loan on February 11, 2016 through borrowings on its senior unsecured credit facility (see Note 13). |
(h) | The mortgage loan matures on August 14, 2018 with three options to extend the maturity date to January 5, 2021, pursuant to certain terms and conditions. The interest-only mortgage loan bears interest at a variable rate ranging from LIBOR plus 1.75% to LIBOR plus 2.00%, depending on Westin Copley Place’s net cash flow (as defined in the loan agreement). The interest rate as of December 31, 2015 was LIBOR plus 1.75%, which equaled 2.09%. The mortgage loan allows for prepayments without penalty after one year, subject to certain terms and conditions. |
Future scheduled debt principal payments as of December 31, 2015 are as follows:
2016 | $ | 286,294 | |
2017 | 0 | ||
2018 | 288,500 | ||
2019 | 300,000 | ||
2020 | 0 | ||
Thereafter | 555,000 | ||
Total debt | $ | 1,429,794 | |
A summary of the Company’s interest expense and weighted average interest rates for unswapped variable rate debt for the years ended December 31, 2015, 2014 and 2013 is as follows:
For the year ended December 31, | |||||||||||
2015 | 2014 | 2013 | |||||||||
Interest Expense: | |||||||||||
Interest incurred | $ | 52,604 | $ | 54,859 | $ | 55,912 | |||||
Amortization of deferred financing costs | 2,631 | 2,169 | 2,253 | ||||||||
Capitalized interest | (902 | ) | (400 | ) | (649 | ) | |||||
Interest expense | $ | 54,333 | $ | 56,628 | $ | 57,516 | |||||
Weighted Average Interest Rates for Unswapped Variable Rate Debt: | |||||||||||
Senior unsecured credit facility | 1.89 | % | 1.86 | % | 2.11 | % | |||||
LHL unsecured credit facility | 1.89 | % | 1.86 | % | 2.03 | % | |||||
Massport Bonds | 0.06 | % | 0.35 | % | 0.25 | % | |||||
Mortgage loan (Westin Copley Place) | 2.19 | % | N/A | N/A | |||||||
Credit Facilities
On January 8, 2014, the Company refinanced its $750,000 senior unsecured credit facility with a syndicate of banks. The credit facility matures on January 8, 2018, subject to two six-month extensions that the Company may exercise at its option,
F-18
pursuant to certain terms and conditions, including payment of an extension fee. The credit facility, with a current commitment of $750,000, includes an accordion feature which, subject to certain conditions, entitles the Company to request additional lender commitments, allowing for total commitments up to $1,050,000. Borrowings under the credit facility bear interest at floating rates equal to, at the Company’s option, either (i) LIBOR plus an applicable margin, or (ii) an Adjusted Base Rate (as defined in the credit agreement) plus an applicable margin. Additionally, the Company is required to pay a variable unused commitment fee of 0.25% or 0.30% of the unused portion of the credit facility, depending on the average daily unused portion of the credit facility.
On January 8, 2014, LHL also refinanced its $25,000 unsecured revolving credit facility to be used for working capital and general lessee corporate purposes. The LHL credit facility matures on January 8, 2018, subject to two six-month extensions that LHL may exercise at its option, pursuant to certain terms and conditions, including payment of an extension fee. Borrowings under the LHL credit facility bear interest at floating rates equal to, at LHL’s option, either (i) LIBOR plus an applicable margin, or (ii) an Adjusted Base Rate (as defined in the credit agreement) plus an applicable margin. Additionally, LHL is required to pay a variable unused commitment fee of 0.25% or 0.30% of the unused portion of the credit facility, depending on the average daily unused portion of the LHL credit facility.
The Company’s senior unsecured credit facility and LHL’s unsecured credit facility contain certain financial covenants relating to net worth requirements, debt ratios and fixed charge coverage and other limitations that restrict the Company’s ability to make distributions or other payments to its shareholders upon events of default.
Term Loans
On May 16, 2012, the Company entered into a $177,500 unsecured term loan (the “First Term Loan”) with a seven-year term maturing on May 16, 2019. The First Term Loan bears interest at a variable rate, but was hedged to a fixed interest rate through May 16, 2019. On November 5, 2015, the Company repaid the First Term Loan and redesignated the interest rate swaps.
On January 8, 2014, the Company refinanced its $300,000 unsecured term loan (the “Second Term Loan”). The Second Term Loan includes an accordion feature, which subject to certain conditions, entitles the Company to request additional lender commitments, allowing for total commitments up to $500,000. The Second Term Loan has a five-year term maturing on January 8, 2019 and bears interest at variable rates, but was hedged to a fixed interest rate based on the Company’s current leverage ratio (as defined in the swap agreements), which interest rate was 2.38% at December 31, 2015 through August 2, 2017 (see “Derivative and Hedging Activities” below).
On November 5, 2015, the Company entered into a $555,000 unsecured term loan (the “Third Term Loan”) with a five-year term maturing on January 29, 2021. The Third Term Loan includes an accordion feature, which subject to certain conditions, entitles the Company to request additional lender commitments, allowing for total commitments up to $700,000. The Third Term Loan bears interest at a variable rate, but was hedged to a fixed interest rate based on the Company’s current leverage ratio (as defined in the swap agreements), which interest rate was 2.95% at December 31, 2015 through May 16, 2019 for $177,500 of the Third Term Loan and through January 29, 2021 for the remaining $377,500 of the Third Term Loan (see “Derivative and Hedging Activities” below).
The Company’s term loans contain certain financial covenants relating to net worth requirements, debt ratios and fixed charge coverage and other limitations that restrict the Company’s ability to make distributions or other payments to its shareholders upon events of default.
Derivative and Hedging Activities
The Company primarily uses interest rate swaps as part of its interest rate risk management strategy. Interest rate swaps designated as cash flow hedges involve the receipt of variable-rate amounts from a counterparty in exchange for the Company making fixed-rate payments over the life of the agreements without exchange of the underlying notional amount. Unrealized gains and losses on the effective portion of hedging instruments are reported in other comprehensive income (loss) (“OCI”). Ineffective portions of changes in the fair value of a cash flow hedge are recognized as interest expense. Amounts reported in accumulated other comprehensive income (loss) (“AOCL”) related to currently outstanding derivatives are recognized as an adjustment to income (loss) as interest payments are made on the Company’s variable rate debt. Effective May 16, 2012, the Company entered into three interest rate swap agreements with an aggregate notional amount of $177,500 for the First Term Loan’s full seven-year term, resulting in a fixed all-in interest rate based on the Company’s current leverage ratio (as defined in the swap agreements). As discussed above, the First Term Loan was repaid on November 5, 2015. The interest rate swaps for the First Term Loan continue to be in place and are designated as hedging instruments for the Third Term Loan. Effective August 2, 2012, the Company entered into five interest rate swap agreements with an aggregate notional amount of $300,000 for the Second Term Loan through August 2, 2017, resulting in a fixed all-in interest rate based on the Company’s current leverage ratio (as defined in the swap agreements), which interest rate was 2.38% at December 31, 2015. Effective November 5, 2015, the Company entered into seven interest rate swap agreements with an aggregate notional amount of $377,500 for the Third Term Loan’s full five-year term, resulting in a fixed
F-19
all-in interest rate based on the Company’s current leverage ratio (as defined in the swap agreements). At December 31, 2015, the fixed all-in interest rate based on the Company’s current leverage ratio (as defined in the swap agreements) was 2.95% for the Third Term Loan. The Company has designated its pay-fixed, receive-floating interest rate swap derivatives as cash flow hedges. The interest rate swaps were entered into with the intention of eliminating the variability of the terms loans, but can also limit the exposure to any amendments, supplements, replacements or refinancings of the Company’s debt.
The following table presents the effect of derivative instruments on the Company’s accompanying consolidated statements of operations and comprehensive income, including the location and amount of unrealized (loss) gain on outstanding derivative instruments in cash flow hedging relationships, for the years ended December 31, 2015, 2014 and 2013:
Amount of (Loss) Gain Recognized in OCI on Derivative Instruments | Location of Loss Reclassified from AOCL into Net Income | Amount of Loss Reclassified from AOCL into Net Income | |||||||||||||||||||||||||
(Effective Portion) | (Effective Portion) | (Effective Portion) | |||||||||||||||||||||||||
For the year ended | For the year ended | ||||||||||||||||||||||||||
December 31, | December 31, | ||||||||||||||||||||||||||
2015 | 2014 | 2013 | 2015 | 2014 | 2013 | ||||||||||||||||||||||
Derivatives in cash flow hedging relationships: | |||||||||||||||||||||||||||
Interest rate swaps | $ | (5,682 | ) | $ | (8,276 | ) | $ | 8,127 | Interest expense | $ | 4,835 | $ | 4,410 | $ | 4,248 | ||||||||||||
During the years ended December 31, 2015, 2014 and 2013, the Company did not have any hedge ineffectiveness or amounts that were excluded from the assessment of hedge effectiveness recorded in earnings.
As of December 31, 2015, there was $97 in cumulative unrealized loss of which $97 was included in AOCL and zero was attributable to noncontrolling interests. As of December 31, 2014, there was $750 in cumulative unrealized gain of which $748 was included in AOCL and $2 was attributable to noncontrolling interests. The Company expects that approximately $8,094 will be reclassified from AOCL and noncontrolling interests and recognized as a reduction to income in the next 12 months, calculated as estimated interest expense using the interest rates on the derivative instruments as of December 31, 2015.
Bonds Payable
The Company is the obligor with respect to a $37,100 tax-exempt special project revenue bond and a $5,400 taxable special project revenue bond, both issued by the Massachusetts Port Authority (collectively, the “Massport Bonds”). The Massport Bonds, which mature on March 1, 2018, bear interest based on weekly floating rates and have no principal reductions prior to their scheduled maturities. The Massport Bonds may be redeemed at any time, at the Company’s option, without penalty. The Massport Bonds are secured by letters of credit issued by U.S. Bank, effective September 30, 2014, that expire on September 30, 2016, which replaced similar letters of credit held by the Royal Bank of Scotland. The letters of credit have two one-year extension options that the Company may exercise at its option, subject to certain terms and conditions. The letters of credit cannot be extended beyond the Massport Bonds’ maturity date. The Company incurred an annual letter of credit fee of a variable rate based on an applicable margin as defined in the Company’s senior unsecured credit agreement through September 29, 2014, which is included in interest expense. Effective September 30, 2014, the Company incurs an annual letter of credit fee of 1.35%. The letters of credit are secured by the Hyatt Regency Boston Harbor. If U.S. Bank fails to renew its letters of credit at expiration and an acceptable replacement provider cannot be found, the Company may be required to pay off the bonds.
F-20
Extinguishment of Debt
As discussed above, on January 8, 2014, the Company refinanced its senior unsecured credit facility and Second Term Loan and LHL refinanced its unsecured revolving credit facility. The refinancing arrangements for the senior unsecured credit facility and Second Term Loan were considered substantial modifications. The Company recognized a loss from extinguishment of debt of $2,487, which is included in the accompanying consolidated statements of operations and comprehensive income for the year ended December 31, 2014. As discussed above, on November 5, 2015, the Company repaid the First Term Loan prior to maturity and recognized a loss from extinguishment of debt of $831, which is included in the accompanying consolidated statements of operations and comprehensive income for the year ended December 31, 2015. The loss from extinguishment of debt represents the unamortized deferred financing costs incurred when the original agreements were executed.
Mortgage Loans
The Company’s mortgage loans are secured by the respective properties. The mortgages are non-recourse to the Company except for fraud or misapplication of funds.
On June 1, 2015, the Company repaid without fee or penalty the Westin Copley Place mortgage loan in the amount of $210,000 plus accrued interest through borrowings under its senior unsecured credit facility. The loan was due to mature in September 2015. On July 20, 2015, the Company entered into a new $225,000 mortgage loan secured by the Westin Copley Place. The mortgage loan matures on August 14, 2018 with three options to extend the maturity date to January 5, 2021, pursuant to certain terms and conditions. The interest-only mortgage loan bears interest at a variable rate ranging from LIBOR plus 1.75% to LIBOR plus 2.00%, depending on Westin Copley Place’s net cash flow (as defined in the loan agreement). The mortgage loan allows for prepayments without penalty after one year, subject to certain terms and conditions.
On January 4, 2016, the Company repaid without fee or penalty the Westin Michigan Avenue mortgage loan and the Indianapolis Marriott Downtown mortgage loan. On February 11, 2016, the Company repaid without fee or penalty The Roger mortgage loan. Refer to Note 13.
The Company’s mortgage loans contain debt service coverage ratio tests related to the mortgaged properties. If the debt service coverage ratio for a specific property fails to exceed a threshold level specified in the mortgage, cash flows from that hotel may automatically be directed to the lender to (i) satisfy required payments, (ii) fund certain reserves required by the mortgage and (iii) fund additional cash reserves for future required payments, including final payment. Cash flows may be directed to the lender (“cash trap”) until such time as the property again complies with the specified debt service coverage ratio or the mortgage is paid off.
Financial Covenants
Failure of the Company to comply with the financial covenants contained in its credit facilities, term loans and non-recourse secured mortgages could result from, among other things, changes in its results of operations, the incurrence of additional debt or changes in general economic conditions.
If the Company violates the financial covenants contained in any of its credit facilities or term loans described above, the Company may attempt to negotiate waivers of the violations or amend the terms of the applicable credit facilities or term loans with the lenders thereunder; however, the Company can make no assurance that it would be successful in any such negotiations or that, if successful in obtaining waivers or amendments, such amendments or waivers would be on terms attractive to the Company. If a default under the credit facilities or term loans were to occur, the Company would possibly have to refinance the debt through additional debt financing, private or public offerings of debt securities, or additional equity financings. If the Company is unable to refinance its debt on acceptable terms, including at maturity of the credit facilities and term loans, it may be forced to dispose of hotel properties on disadvantageous terms, potentially resulting in losses that reduce cash flow from operating activities. If, at the time of any refinancing, prevailing interest rates or other factors result in higher interest rates upon refinancing, increases in interest expense would lower the Company’s cash flow, and, consequently, cash available for distribution to its shareholders.
A cash trap associated with a mortgage loan may limit the overall liquidity for the Company as cash from the hotel securing such mortgage would not be available for the Company to use. If the Company is unable to meet mortgage payment obligations, including the payment obligation upon maturity of the mortgage borrowing, the mortgage securing the specific property could be foreclosed upon by, or the property could be otherwise transferred to, the mortgagee with a consequent loss of income and asset value to the Company.
As of December 31, 2015, the Company is in compliance with all debt covenants, current on all loan payments and not otherwise in default under the credit facilities, term loans, bonds payable or mortgage loans.
F-21
5. | Commitments and Contingencies |
Ground, Land and Building, and Air Rights Leases
A summary of the Company’s hotels subject to non-cancelable operating leases as of December 31, 2015 is as follows:
Lease Properties | Lease Type | Lease Expiration Date | ||
Southernmost Beach Resort Key West (Restaurant facility) | Ground lease | April 2019 (1) | ||
Hyatt Regency Boston Harbor | Ground lease | March 2026 (2) | ||
The Hilton San Diego Resort and Spa | Ground lease | December 2045 | ||
San Diego Paradise Point Resort and Spa | Ground lease | May 2050 | ||
Hotel Vitale | Ground lease | March 2056 (3) | ||
Viceroy Santa Monica | Ground lease | September 2056 | ||
Westin Copley Place (4) | Air rights lease | December 2077 | ||
The Liberty Hotel | Ground lease | May 2080 | ||
Indianapolis Marriott Downtown (5) | Ground lease | June 2099 (5) | ||
Hotel Solamar | Ground lease | December 2102 | ||
(1) The Company can begin negotiating a renewal one year in advance of the lease expiration date.
(2) The Company has options, subject to certain terms and conditions, to extend the ground lease for 51 years to 2077.
(3) The Company has the option, subject to certain terms and conditions, to extend the ground lease for 14 years to 2070.
(4) No payments are required through maturity.
(5) Requires future ground rent payments of one dollar per year. The Company has options, subject to certain terms and conditions, to extend the ground lease for 50 years to 2149.
The ground leases at Viceroy Santa Monica, The Liberty Hotel and Hotel Vitale are subject to minimum annual rent increases, resulting in noncash straight-line rent expense of $1,943, $1,820 and $1,305 for the years ended December 31, 2015, 2014 and 2013, respectively, which is included in total ground rent expense. Total ground rent expense for the years ended December 31, 2015, 2014 and 2013 was $16,076, $14,667 and $11,117, respectively. Certain rent payments are based on the hotel’s performance. Actual payments of rent may exceed the minimum required rent due to meeting specified thresholds.
A summary of the Company’s hotels subject to capital leases of land and building as of December 31, 2015 is as follows:
Lease Properties | Estimated Present Value of Remaining Rent Payments (1) | Lease Expiration Date | ||
The Roger | $4,892 | December 2044 | ||
Harbor Court Hotel | $18,424 | April 2048 | ||
Hotel Triton (2) | $25,625 | December 2049 | ||
(1) At acquisition, the estimated present value of the remaining rent payments were recorded as capital lease obligations. These obligations, net of amortization, are included in accounts payable and accrued expenses in the accompanying consolidated balance sheets.
(2) In 2015, the hotel lease was amended, extending the lease expiration date from January 2048 to December 2049. At acquisition, the estimated present value of the remaining payments recorded as a capital lease obligation was $27,752. Due to the lease amendment, the recalculated estimated present value of the remaining rent payments is $25,625, which net of amortization, is included in accounts payable and accrued expenses in the accompanying consolidated balance sheets.
F-22
Future minimum rent payments, including capital lease payments, (without reflecting future applicable Consumer Price Index increases) are as follows:
2016 | $ | 12,804 | |
2017 | 13,039 | ||
2018 | 13,183 | ||
2019 | 13,159 | ||
2020 | 13,557 | ||
Thereafter | 600,780 | ||
$ | 666,522 | ||
Reserve Funds for Future Capital Expenditures
Certain of the Company’s agreements with its hotel managers, franchisors and lenders have provisions for the Company to provide funds, generally 4.0% of hotel revenues, sufficient to cover the cost of (a) certain non-routine repairs and maintenance to the hotels and (b) replacements and renewals to the hotels’ capital assets. Certain of the agreements require that the Company reserve this cash in separate accounts. As of December 31, 2015, $21,402 was available in restricted cash reserves for future capital expenditures. The Company has sufficient cash on hand and availability on its credit facilities to cover capital expenditures under agreements that do not require that the Company separately reserve cash.
Restricted Cash Reserves
At December 31, 2015, the Company held $26,443 in restricted cash reserves. Included in such amounts are (i) $21,402 of reserve funds for future capital expenditures, (ii) $2,620 deposited in mortgage escrow accounts pursuant to mortgage obligations to pre-fund a portion of certain operating expenses and debt payments and (iii) $2,421 held by insurance and management companies on the Company’s behalf to be refunded or applied to future liabilities.
Litigation
The nature of hotel operations exposes the Company and its hotels to the risk of claims and litigation in the normal course of their business. The Company is not presently subject to any material litigation nor, to the Company’s knowledge, is any litigation threatened against the Company, other than routine actions for negligence or other claims and administrative proceedings arising in the ordinary course of business, some of which are expected to be covered by liability insurance and all of which collectively are not expected to have a material adverse effect on the liquidity, results of operations, business or financial condition of the Company.
6. | Equity |
Common Shares of Beneficial Interest
At December 31, 2015 and 2014, there were 200,000,000 authorized common shares under the Company’s declaration of trust, as amended.
On January 1, 2014, the Company issued 13,948 common shares of beneficial interest and authorized an additional 6,064 deferred shares to the independent members of its Board of Trustees for their 2013 compensation. These common shares of beneficial interest were issued under the 2009 Plan.
On January 1, 2014, the Company issued 35,652 nonvested shares with service conditions to executives related to the nonvested share awards with market conditions granted on January 24 and 26, 2011 (see Note 7 for additional details including vesting information). These common shares of beneficial interest were issued under the 2009 Plan.
On January 22, 2014, the Company issued 9,385 common shares of beneficial interest related to the resignation of a former Board of Trustees member who retired from the Board of Trustees for a portion of his accumulated deferred shares granted as compensation for years 1999 through 2013. The accumulated deferred shares balance will be issued in five annual installments beginning January 22, 2014. These common shares of beneficial interest were issued under the 2009 Plan.
On March 20, 2014, the Company issued 77,564 nonvested shares with service conditions to the Company’s executives and employees. The nonvested shares will vest in three annual installments starting January 1, 2015, subject to continued employment. These common shares of beneficial interest were issued under the 2009 Plan.
F-23
On July 1, 2014, the Company issued 59,778 shares to an executive related to the nonvested share awards with market conditions granted on May 31, 2008 (see Note 7 for additional details including vesting information). All of the issued shares vested immediately on July 1, 2014. These common shares of beneficial interest were issued under the 2009 Plan.
On December 12, 2014, the Company issued 16,257 nonvested shares with service conditions to the Company’s employees. The nonvested shares will vest in three annual installments starting January 1, 2016, subject to continued employment. These common shares of beneficial interest were issued under the 2014 Plan.
On December 12, 2014, the Company completed an underwritten public offering of 7,600,000 common shares of beneficial interest, par value $0.01 per share. On December 24, 2014, an additional 1,140,000 common shares of beneficial interest were issued pursuant to the full exercise of the underwriters’ option to purchase additional shares. After deducting the underwriters’ discounts and commissions and other offering costs, the Company raised net proceeds of $348,514. The net proceeds were used to fund the acquisition of The Heathman Hotel on December 18, 2014, to initially pay down amounts outstanding under the Company’s senior unsecured credit facility and under the LHL unsecured credit facility and to fund a portion of the acquisition of the Park Central San Francisco on January 23, 2015.
On January 1, 2015, the Company issued 11,682 common shares of beneficial interest and authorized an additional 4,183 deferred shares to the independent members of its Board of Trustees for their 2014 compensation. These common shares of beneficial interest were issued under the 2014 Plan. Additionally, the Company issued 9,757 common shares of beneficial interest, related to the resignation of a former trustee, for the second of five payouts of his accumulated deferred shares granted as compensation for years 1999 through 2013. These common shares of beneficial interest were issued under the 2009 Plan.
On January 1, 2015, the Company issued 108,779 nonvested shares with service conditions to executives related to the nonvested share awards with market conditions granted on January 26, 2012 (see Note 7 for additional details including vesting information). These common shares of beneficial interest were issued under the 2009 Plan.
On March 19, 2015, the Company issued 62,742 nonvested shares with service conditions to the Company’s executives and employees. The nonvested shares will vest in three annual installments starting January 1, 2016, subject to continued employment. These common shares of beneficial interest were issued under the 2014 Plan.
Common Dividends
The Company paid the following dividends on common shares/units during the year ended December 31, 2015:
Dividend per Share/Unit (1) | For the Quarter Ended | Record Date | Payable Date | |||||
$ | 0.38 | December 31, 2014 | December 31, 2014 | January 15, 2015 | ||||
$ | 0.38 | March 31, 2015 | March 31, 2015 | April 15, 2015 | ||||
$ | 0.45 | June 30, 2015 | June 30, 2015 | July 15, 2015 | ||||
$ | 0.45 | September 30, 2015 | September 30, 2015 | October 15, 2015 | ||||
(1) Amounts are rounded to the nearest whole cent for presentation purposes.
Treasury Shares
Treasury shares are accounted for under the cost method. During the year ended December 31, 2015, the Company received 55,577 common shares of beneficial interest related to employees surrendering shares to pay minimum withholding taxes at the time nonvested shares vested and forfeiting nonvested shares upon resignation.
The Company’s Board of Trustees previously authorized a share repurchase program (the “Repurchase Program”) to acquire up to $100,000 of the Company’s common shares of beneficial interest, with repurchased shares recorded at cost in treasury. In August 2015, the Company repurchased 184,742 common shares of beneficial interest under the Repurchase Program for a total of $5,697, including commissions of $6. As of December 31, 2015, the Company had availability under the Repurchase Program to acquire up to $69,807 of common shares of beneficial interest. The Company is currently authorized by its Board of Trustees to repurchase or offer to repurchase common shares under the Repurchase Agreement.
During the year ended December 31, 2015, the Company re-issued 30,388 treasury shares of beneficial interest related to the resignation of a former Board of Trustees member who retired from the Board of Trustees for the remainder of his accumulated deferred shares granted as compensation for years 1999 through 2013. These accumulated deferred shares are fully issued with no remaining balance as of December 31, 2015. These common shares of beneficial interest were issued under the 2009 Plan and 2014 Plan. The Company also issued 58,064 treasury shares related to the grants of nonvested shares.
F-24
At December 31, 2015, there were 155,895 common shares of beneficial interest in treasury.
Preferred Shares
At December 31, 2015 and 2014, there were 40,000,000 authorized preferred shares under the Company’s declaration of trust, as amended.
On March 4, 2013, the Company issued 4,000,000 6 ⅜% Series I Cumulative Redeemable Preferred Shares ($0.01 par value) (the “Series I Preferred Shares”) at a price of $25.00 per share and received net proceeds, after deducting underwriting discounts and other offering costs, of $96,667. On March 12, 2013, the underwriters exercised their rights to cover overallotments and purchased 400,000 additional Series I Preferred Shares, resulting in additional net proceeds to the Company of $9,685. The net proceeds were used to redeem a portion of the Company’s 7 ¼% Series G Cumulative Redeemable Preferred Shares (the “Series G Preferred Shares”) on April 5, 2013, to pay down amounts outstanding under the Company’s senior unsecured credit facility and for general corporate purposes.
On April 5, 2013, the Company redeemed 4,000,000 of the 6,348,888 outstanding Series G Preferred Shares for $100,000 ($25.00 per share) plus accrued distributions through April 5, 2013 of $1,913. The redemption value of the Series G Preferred Shares exceeded their carrying value by $1,566, which is included in the determination of net income attributable to common shareholders for the year ended December 31, 2013. The $1,566 represents the offering costs related to the redeemed Series G Preferred Shares.
On July 3, 2014, the Company redeemed the remaining 2,348,888 Series G Preferred Shares for $58,722 ($25.00 per share) plus accrued and unpaid dividends through the redemption date, July 3, 2014, of $1,100. The redemption value of the Series G Preferred Shares exceeded their carrying value by $951, which is included in the determination of net income attributable to common shareholders for the year ended December 31, 2014. The $951 represents the offering costs related to the redeemed Series G Preferred Shares.
The following Preferred Shares were outstanding as of December 31, 2015:
Security Type | Number of Shares | ||
7 ½% Series H Preferred Shares | 2,750,000 | ||
6 ⅜% Series I Preferred Shares | 4,400,000 | ||
The 7 ½% Series H Cumulative Redeemable Preferred Shares (the “Series H Preferred Shares”) and the Series I Preferred Shares (collectively, the “Preferred Shares”) rank senior to the common shares of beneficial interest and on parity with each other with respect to payment of distributions. The Company will not pay any distributions, or set aside any funds for the payment of distributions, on its common shares of beneficial interest unless it has also paid (or set aside for payment) the full cumulative distributions on the Preferred Shares for the current and all past dividend periods and, with respect to the Series H Preferred Shares, for the current dividend period. The outstanding Preferred Shares do not have any maturity date, and are not subject to mandatory redemption. The difference between the carrying value and the redemption amount of the Preferred Shares are the offering costs. In addition, the Company is not required to set aside funds to redeem the Preferred Shares.
The Company may not optionally redeem the Series H Preferred Shares and Series I Preferred Shares prior to January 24, 2016 and March 4, 2018, respectively, except in limited circumstances relating to the Company’s continuing qualification as a REIT or as discussed below. After those dates, the Company may, at its option, redeem the Series H Preferred Shares and Series I Preferred Shares, in whole or from time to time in part, by payment of $25.00 per share, plus any accumulated, accrued and unpaid distributions to and including the date of redemption. In addition, upon the occurrence of a change of control (as defined in the Company’s charter), the result of which the Company’s common shares of beneficial interest and the common securities of the acquiring or surviving entity are not listed on the New York Stock Exchange, the NYSE MKT LLC or the NASDAQ Stock Market, or any successor exchanges, the Company may, at its option, redeem the Preferred Shares in whole or in part within 120 days after the change of control occurred, by paying $25.00 per share, plus any accrued and unpaid distributions to and including the date of redemption. If the Company does not exercise its right to redeem the Preferred Shares upon a change of control, the holders of Series H Preferred Shares and Series I Preferred Shares have the right to convert some or all of their shares into a number of the Company’s common shares of beneficial interest based on a defined formula subject to a cap of 4,680,500 common shares and 8,835,200 commons shares, respectively.
F-25
Preferred Dividends
The Company paid the following dividends on preferred shares during the year ended December 31, 2015:
Security Type | Dividend per Share (1) | For the Quarter Ended | Record Date | Payable Date | ||||||
7 ½% Series H | $ | 0.47 | December 31, 2014 | January 1, 2015 | January 15, 2015 | |||||
6 ⅜% Series I | $ | 0.40 | December 31, 2014 | January 1, 2015 | January 15, 2015 | |||||
7 ½% Series H | $ | 0.47 | March 31, 2015 | April 1, 2015 | April 15, 2015 | |||||
6 ⅜% Series I | $ | 0.40 | March 31, 2015 | April 1, 2015 | April 15, 2015 | |||||
7 ½% Series H | $ | 0.47 | June 30, 2015 | July 1, 2015 | July 15, 2015 | |||||
6 ⅜% Series I | $ | 0.40 | June 30, 2015 | July 1, 2015 | July 15, 2015 | |||||
7 ½% Series H | $ | 0.47 | September 30, 2015 | October 1, 2015 | October 15, 2015 | |||||
6 ⅜% Series I | $ | 0.40 | September 30, 2015 | October 1, 2015 | October 15, 2015 | |||||
(1) | Amounts are rounded to the nearest whole cent for presentation purposes. |
Noncontrolling Interests of Common Units in Operating Partnership
On May 13, 2015, the Company issued an aggregate of 151,077 common shares of beneficial interest in connection with the redemption of 151,077 common units of limited partnership interest held by certain limited partners of the Operating Partnership. These common shares of beneficial interest were issued in reliance on an exemption from registration provided by Section 4(a)(2) under the Securities Act of 1933, as amended, and Regulation D promulgated thereunder. The Company relied on the exemption under Section 4(a)(2) based upon factual representations given by the limited partners who received the common shares of beneficial interest.
As of December 31, 2015, the Operating Partnership had 145,223 common units of limited partnership interest outstanding, representing a 0.1% partnership interest held by the limited partners. As of December 31, 2015, approximately $3,654 of cash or the equivalent value in common shares, at the Company’s option, would be paid to the limited partners of the Operating Partnership if the partnership were terminated. The approximate value of $3,654 is based on the Company’s closing common share price of $25.16 on December 31, 2015, which is assumed to be equal to the value provided to the limited partners upon liquidation of the Operating Partnership. Subject to certain limitations, the outstanding common units of limited partnership are redeemable for cash, or at the Company’s option, for a like number of common shares of beneficial interest of the Company.
The following schedule presents the effects of changes in the Company’s ownership interest in the Operating Partnership on the Company’s equity:
For the year ended December 31, | |||||||||||
2015 | 2014 | 2013 | |||||||||
Net income attributable to common shareholders | $ | 123,383 | $ | 197,561 | $ | 70,984 | |||||
Increase (decrease) in additional paid-in capital from adjustments to noncontrolling interests of common units in Operating Partnership | 14 | (397 | ) | (213 | ) | ||||||
Change from net income attributable to common shareholders and adjustments to noncontrolling interests | $ | 123,397 | $ | 197,164 | $ | 70,771 | |||||
7. | Equity Incentive Plan |
The common shareholders approved the 2014 Plan at the 2014 Annual Meeting of Shareholders held on May 7, 2014, which permits the Company to issue equity-based awards to executives, employees, non-employee members of the Board of Trustees and any other persons providing services to or for the Company and its subsidiaries. The 2014 Plan provides for a maximum of 2,900,000 common shares of beneficial interest to be issued in the form of share options, share appreciation rights, restricted or unrestricted share awards, phantom shares, performance awards, incentive awards, other share-based awards, or any combination of the foregoing. In addition, the maximum number of common shares subject to awards of any combination that may be granted under the 2014 Plan during any fiscal year to any one individual is limited to 500,000 shares. The 2014 Plan terminates on February 17, 2024. The 2014 Plan authorized, among other things: (i) the grant of share options that qualify as incentive options under the Code, (ii) the grant of share options that do not so qualify, (iii) the grant of common shares in lieu of cash for trustees’ fees, (iv) grants of common shares in lieu of cash compensation and (v) the making of loans to acquire common shares in lieu of compensation (to the extent permitted by law and applicable provisions of the Sarbanes Oxley Act of 2002). The exercise price of share options is determined by the Compensation Committee of the Board of Trustees, but may not be less than 100% of the fair value of the common shares on the date of grant. Restricted share awards and options under the 2014 Plan vest over a period determined by the Compensation Committee of the Board of Trustees, generally a three year period. The duration of each option
F-26
is also determined by the Compensation Committee, subject to applicable laws and regulations. At December 31, 2015, there were 2,797,762 common shares available for future grant under the 2014 Plan. Upon the approval of the 2014 Plan by the common shareholders on May 7, 2014, the 2014 Plan replaced the 2009 Plan. The Company will no longer make any grants under the 2009 Plan (although awards previously made under the 2009 Plan that are outstanding will remain in effect in accordance with the terms of that plan and the applicable award agreements).
Nonvested Share Awards with Service Conditions
From time to time, the Company awards nonvested shares under the 2014 Plan to executives, employees and members of the Board of Trustees. The nonvested shares issued to executives and employees generally vest over three years based on continued employment. The shares issued to the members of the Board of Trustees vest immediately upon issuance. The Company determines the grant date fair value of the nonvested shares based upon the closing stock price of its common shares on the New York Stock Exchange on the date of grant and number of shares per the award agreements. Compensation costs are recognized on a straight-line basis over the requisite service period and are included in general and administrative expense in the accompanying consolidated statements of operations and comprehensive income.
A summary of the Company’s nonvested shares with service conditions as of December 31, 2015 is as follows:
Number of Shares | Weighted - Average Grant Date Fair Value | |||||
Nonvested at January 1, 2015 | 256,379 | $ | 31.00 | |||
Granted | 63,675 | 38.82 | ||||
Vested | (78,483 | ) | 28.60 | |||
Forfeited | (12,736 | ) | 27.31 | |||
Nonvested at December 31, 2015 (1) | 228,835 | $ | 33.29 | |||
(1) | Amount excludes 84,401 share awards with market conditions which were earned but nonvested due to a service condition as of December 31, 2015. |
As of December 31, 2015 and 2014, there were $3,914 and $5,113, respectively, of total unrecognized compensation costs related to nonvested share awards with service conditions. As of December 31, 2015 and 2014, these costs were expected to be recognized over a weighted–average period of 1.4 and 1.9 years, respectively. The total intrinsic value of shares vested (calculated as number of shares multiplied by vesting date share price) during the years ended December 31, 2015, 2014 and 2013 was $3,152, $5,602 and $8, respectively. Compensation costs (net of forfeitures) related to nonvested share awards with service conditions that have been included in general and administrative expenses in the accompanying consolidated statements of operations and comprehensive income were $3,323, $3,055 and $2,959 for the years ended December 31, 2015, 2014 and 2013, respectively.
Nonvested Share Awards with Market or Performance Conditions
On May 31, 2008, the Company’s Board of Trustees entered into three Performance-Based Share Agreements (the “Share Agreements”), awarding 125,000 nonvested share awards with market conditions, in 25,000, 50,000 and 50,000 increments, of nonvested shares to an executive. The actual amounts of the shares awarded earned for each of the Share Agreements is based on the specified three-year performance measurement periods ending on July 1, 2011, 2014 and 2017, respectively. The actual amounts of the shares awarded are to range from 0% to 200% of the target amounts, depending on the performance analysis stipulated in the Share Agreements, and none of the shares are outstanding until issued in accordance with the Share Agreements.
On July 1, 2014, the Company issued 59,778 shares to an executive who earned 119.6% of the 50,000 target number of shares from the nonvested share awards with market conditions granted on May 31, 2008. All of the shares earned, or 59,778 shares, vested immediately on July 1, 2014. The executive received a cash payment of $239 on the earned shares equal to the value of all dividends paid on common shares from May 31, 2008 until the determination date, July 1, 2014. As of July 1, 2014, the executive is entitled to receive dividends as declared and paid on the earned shares and to vote the shares. These common shares of beneficial interest were issued under the 2009 Plan.
With respect to the remaining 50,000 shares with a performance measurement period ending on July 1, 2017, the fair value of these shares was estimated on July 1, 2014, the beginning of the performance measurement period.
On January 24 and January 26, 2011, the Company’s Board of Trustees granted a target of 8,925 and 35,920 nonvested share awards with market conditions to executives, respectively. On January 1, 2014, the executives earned 79.5% of the target number of shares, or 35,652 shares. The shares representing the difference between 79.5% and 100% of the target, or 9,193 shares, were forfeited on January 1, 2014. Of the earned shares, 11,885 shares vested immediately on January 1, 2014, 11,884 shares vested
F-27
on January 1, 2015 and the remaining 11,883 shares will vest on January 1, 2016 based on continued employment. The executives received cash payments of $75 on the earned shares equal to the value of all dividends paid on common shares from December 31, 2010 until the determination date, January 1, 2014. As of January 1, 2014, the executives are entitled to receive dividends as declared and paid on the earned shares and to vote the shares, including those shares subject to further vesting.
On January 26, 2012, the Company’s Board of Trustees granted a target of 79,823 nonvested share awards with market conditions to executives. On January 1, 2015, the executives earned 136.3% of their 79,823 target number of shares, or 108,779 shares. Of the shares earned, 36,261 shares vested immediately on January 1, 2015, and the remaining 72,518 shares will vest in equal amounts on January 1, 2016 and January 1, 2017 based on continued employment. The executives received a cash payment of $334 on the earned shares equal to the value of all dividends paid on common shares from January 1, 2012 until the determination date, January 1, 2015. As of January 1, 2015, the executives are entitled to receive dividends as declared and paid on the earned shares and to vote the shares.
On January 30, 2013, the Company’s Board of Trustees granted a target of 80,559 nonvested share awards with either market or performance conditions to executives (the “January 30, 2013 Awards”). The actual amounts of the shares awarded with respect to 40,280 of the 80,559 shares will be determined on January 1, 2016, based on the performance measurement period of January 1, 2013 through December 31, 2015, in accordance with the terms of the award agreements. The actual amounts of the shares awarded with respect to the remaining 40,279 of the 80,559 shares will be determined on July 1, 2016, based on the performance measurement period of July 1, 2013 through June 30, 2016, in accordance with the terms of the award agreements. The actual amounts of the shares awarded will range from 0% to 200% of the target amounts, depending on the performance analysis stipulated in the award agreements, and none of the shares are outstanding until issued in accordance with award agreements based on performance. After the actual amounts of the awards are determined (or earned) at the end of the respective performance measurement period, all of the earned shares will be issued and outstanding on those dates. The executives will receive cash payments on the earned shares equal to the value of all dividends paid on common shares from the grant date through the respective determination date. Such amounts will be paid to the awardees on or about January 1, 2016 and July 1, 2016, respectively. Thereafter, the executives will be entitled to receive dividends as declared and paid on the earned shares and to vote the shares. With respect to 40,280 shares, amortization commenced on January 30, 2013, the beginning of the requisite service period, and, with respect to 40,279 shares, amortization commenced on July 1, 2013, the beginning of the requisite service period.
On March 20, 2014, the Company’s Board of Trustees granted a target of 71,967 nonvested share awards with either market or performance conditions to executives (the “March 20, 2014 Awards”). The actual amounts of the shares awarded with respect to 35,983 of the 71,967 shares will be determined on January 1, 2017, based on the performance measurement period of January 1, 2014 through December 31, 2016, in accordance with the terms of the agreements. The actual amounts of the shares awarded with respect to the remaining 35,984 of the 71,967 shares will be determined on July 1, 2017, based on the performance measurement period of July 1, 2014 through June 30, 2017, in accordance with the terms of the agreements. The actual amounts of the shares awarded will range from 0% to 200% of the target amounts, depending on the performance analysis stipulated in the agreements, and none of the shares are outstanding until issued in accordance with award agreements based on performance. After the actual amounts of the awards are determined (or earned) at the end of the respective performance measurement period, all of the earned shares will be issued and outstanding on those dates. The executives will receive cash payments on the earned shares equal to the value of all dividends paid on common shares from the grant date through the respective determination date. Such amounts will be paid to the awardees on or about January 1, 2017 and July 1, 2017, respectively. Thereafter, the executives will be entitled to receive dividends as declared and paid on the earned shares and to vote the shares. With respect to 35,983 shares, amortization commenced on March 20, 2014, the beginning of the requisite service period, and, with respect to 35,984 shares, amortization commenced on July 1, 2014, the beginning of the requisite service period.
On March 19, 2015, the Company’s Board of Trustees granted a target of 61,660 nonvested share awards with either market or performance conditions to executives (the “March 19, 2015 Awards”). The actual amounts of the shares awarded with respect to 30,829 of the 61,660 shares will be determined on January 1, 2018, based on the performance measurement period of January 1, 2015 through December 31, 2017, in accordance with the terms of the agreements. The actual amounts of the shares awarded with respect to the remaining 30,831 of the 61,660 shares will be determined on July 1, 2018, based on the performance measurement period of July 1, 2015 through June 30, 2018, in accordance with the terms of the agreements. The actual amounts of the shares awarded will range from 0% to 200% of the target amounts, depending on the performance analysis stipulated in the agreements, and none of the shares are outstanding until issued in accordance with award agreements based on performance. After the actual amounts of the awards are determined (or earned) at the end of the respective performance measurement period, all of the earned shares will be issued and outstanding on those dates. The executives will receive cash payments on the earned shares equal to the value of all dividends paid on common shares from the grant date through the respective determination date. Such amounts will be paid to the awardees on or about January 1, 2018 and July 1, 2018, respectively. Thereafter, the executives will be entitled to receive dividends as declared and paid on the earned shares and to vote the shares. With respect to 30,829 shares, amortization commenced on March 19, 2015, the beginning of the requisite service period, and, with respect to 30,831 shares, amortization commenced on July 1, 2015, the beginning of the requisite service period.
F-28
The grant date fair values of the above described nonvested share awards with market conditions were determined by the Company using data under the Monte Carlo valuation method provided by a third-party consultant. The terms stipulated in the award agreements used to determine the total amount of the shares awarded for all awards granted prior to 2013 consist of the following three tranches: (1) a comparison of the Company’s “total return” (the increase in the market price of a Company’s common shares plus dividends declared thereon and assuming such dividends are reinvested as calculated by the FTSE NAREIT Equity Index) to the total return of the companies in the FTSE NAREIT Equity Index, (2) a comparison of the Company’s total return to the total returns’ of six companies in a designated peer group of the Company and (3) the Company’s actual performance as compared to a Board-established total return goal.
For the January 30, 2013 Awards, March 20, 2014 Awards and the March 19, 2015 Awards, the nonvested awards consist of three tranches in each performance measurement period described above. Two of the tranches in the award agreements are nonvested share awards with market conditions, consistent with tranches described in (2) and (3) above, and were valued on the grant date via the methodology described above using a third-party consultant. The third tranche is based on “return on invested capital” discussed below, which is a performance condition. The grant date fair values of the tranches with performance conditions were calculated based on the targeted awards, and the valuation is adjusted on a periodic basis. As of December 31, 2015, a change in the Company’s estimate of probable outcome occurred for all the award tranches with performance conditions as the return on invested capital measurement assumptions (see below) was revised from 100% to 200% resulting in a cumulative adjustment to compensation cost.
The capital market assumptions used in the valuations consisted of the following:
• | Factors associated with the underlying performance of the Company’s share price and shareholder returns over the term of the awards including total share return volatility and risk-free interest. |
• | Factors associated with the relative performance of the Company’s share price and shareholder returns when compared to those companies which compose the index including beta as a means to breakdown total volatility into market-related and company specific volatilities. |
• | The valuation has been performed in a risk-neutral framework. |
• | Return on invested capital is a performance condition award measurement. The estimated value was calculated based on the initial face value at the date of grant. The valuation will be adjusted on a periodic basis as the estimated number of awards expected to vest is revised. |
F-29
The assumptions used were as follows for each performance measure:
Volatility | Interest Rates | Dividend Yield | Stock Beta | Fair Value of Components of Award | Weighting of Total Awards | ||||||||||||
March 19, 2015 Awards (performance period starting January 1, 2015) | |||||||||||||||||
Target amounts | 24.40 | % | 0.99 | % | N/A | N/A | $ | 29.25 | 33.40 | % | |||||||
Return on invested capital | N/A | N/A | N/A | N/A | $ | 38.84 | 33.30 | % | |||||||||
Peer companies | 24.40 | % | 0.99 | % | N/A | 1.011 | $ | 40.69 | 33.30 | % | |||||||
March 19, 2015 Awards (performance period starting July 1, 2015) | |||||||||||||||||
Target amounts | 24.40 | % | 0.99 | % | N/A | N/A | $ | 31.86 | 33.40 | % | |||||||
Return on invested capital | N/A | N/A | N/A | N/A | $ | 38.84 | 33.30 | % | |||||||||
Peer companies | 24.40 | % | 0.99 | % | N/A | 1.011 | $ | 41.00 | 33.30 | % | |||||||
May 31, 2008 Awards (performance period starting July 1, 2014) | |||||||||||||||||
Target amounts | 33.30 | % | 0.90 | % | N/A | N/A | $ | 32.57 | 20.00 | % | |||||||
NAREIT index | 33.30 | % | 0.90 | % | N/A | 1.356 | $ | 39.26 | 40.00 | % | |||||||
Peer companies | 33.30 | % | 0.90 | % | N/A | 0.908 | $ | 38.15 | 40.00 | % | |||||||
March 20, 2014 Awards (performance period starting January 1, 2014) | |||||||||||||||||
Target amounts | 33.70 | % | 0.90 | % | N/A | N/A | $ | 31.94 | 33.40 | % | |||||||
Return on invested capital | N/A | N/A | N/A | N/A | $ | 31.82 | 33.30 | % | |||||||||
Peer companies | 33.70 | % | 0.90 | % | N/A | 0.938 | $ | 31.02 | 33.30 | % | |||||||
March 20, 2014 Awards (performance period starting July 1, 2014) | |||||||||||||||||
Target amounts | 33.70 | % | 0.90 | % | N/A | N/A | $ | 31.23 | 33.40 | % | |||||||
Return on invested capital | N/A | N/A | N/A | N/A | $ | 31.82 | 33.30 | % | |||||||||
Peer companies | 33.70 | % | 0.90 | % | N/A | 0.938 | $ | 34.53 | 33.30 | % | |||||||
January 30, 2013 Awards (performance period starting January 1, 2013) | |||||||||||||||||
Target amounts | 38.70 | % | 0.42 | % | N/A | N/A | $ | 29.38 | 33.40 | % | |||||||
Return on invested capital | N/A | N/A | N/A | N/A | $ | 27.20 | 33.30 | % | |||||||||
Peer companies | 38.70 | % | 0.42 | % | N/A | 0.864 | $ | 30.51 | 33.30 | % | |||||||
January 30, 2013 Awards (performance period starting July 1, 2013) | |||||||||||||||||
Target amounts | 38.70 | % | 0.42 | % | N/A | N/A | $ | 27.70 | 33.40 | % | |||||||
Return on invested capital | N/A | N/A | N/A | N/A | $ | 27.20 | 33.30 | % | |||||||||
Peer companies | 38.70 | % | 0.42 | % | N/A | 0.864 | $ | 31.34 | 33.30 | % | |||||||
January 26, 2012 Awards | |||||||||||||||||
Target amounts | 65.30 | % | 0.31 | % | N/A | N/A | $ | 36.22 | 33.40 | % | |||||||
NAREIT index | 65.30 | % | 0.31 | % | N/A | 1.370 | $ | 35.25 | 33.30 | % | |||||||
Peer companies | 65.30 | % | 0.31 | % | N/A | 0.911 | $ | 35.33 | 33.30 | % | |||||||
A summary of the Company’s restricted share awards with either market or performance conditions as of December 31, 2015 is as follows:
Number of Shares | Weighted- Average Grant Date Fair Value | |||||
Nonvested at January 1, 2015 | 311,625 | $ | 33.62 | |||
Granted (1) | 90,616 | 36.38 | ||||
Vested | (53,654 | ) | 35.99 | |||
Forfeited | 0 | 0.00 | ||||
Nonvested at December 31, 2015 | 348,587 | $ | 33.98 | |||
(1) | Amount includes an additional 28,956 shares issued on January 1, 2015 from the January 26, 2012 Grant, which were earned in excess of the target amount. |
As of December 31, 2015 and 2014, there were $5,342 and $6,637, respectively, of total unrecognized compensation costs related to restricted share awards with market or performance conditions. As of December 31, 2015 and 2014, these costs were
F-30
expected to be recognized over a weighted–average period of 1.7 and 2.0 years, respectively. As of December 31, 2015 and 2014, there were 308,069 and 254,415 share awards with market or performance conditions vested, respectively. Additionally, there were 84,401 and 29,276 nonvested share awards with market or performance conditions earned but nonvested due to a service condition as of December 31, 2015 and 2014, respectively. Compensation costs (net of forfeitures) related to nonvested share awards with market or performance conditions are included in general and administrative expenses in the accompanying consolidated statements of operations and comprehensive income were $4,360, $3,567 and $2,681 for the years ended December 31, 2015, 2014 and 2013, respectively.
Board of Trustees’ Compensation
The Company issues common shares of beneficial interest to the independent members of the Board of Trustees for at least half of their compensation in lieu of cash. The Trustees may elect to receive the remaining half in cash or additional common shares. All or a portion of the shares issued may be deferred. The Company issued an aggregate of 18,774, 15,865 and 20,012 shares, including 4,910, 4,183 and 6,064 deferred shares, related to the Trustees’ compensation for the years 2015, 2014 and 2013, respectively.
8. | LHL |
Substantially all of the Company’s revenues are derived from operating revenues generated by the hotels, all of which are leased by LHL.
Other indirect hotel operating expenses consist of the following expenses incurred by the hotels:
For the year ended December 31, | |||||||||||
2015 | 2014 | 2013 | |||||||||
General and administrative | $ | 101,397 | $ | 87,210 | $ | 76,699 | |||||
Sales and marketing | 73,654 | 61,249 | 55,752 | ||||||||
Repairs and maintenance | 39,521 | 37,169 | 33,741 | ||||||||
Management and incentive fees | 39,686 | 36,463 | 32,850 | ||||||||
Utilities and insurance | 34,427 | 32,296 | 29,077 | ||||||||
Franchise fees | 9,836 | 8,346 | 7,601 | ||||||||
Other expenses | 2,483 | 1,775 | 1,666 | ||||||||
Total other indirect expenses | $ | 301,004 | $ | 264,508 | $ | 237,386 | |||||
F-31
As of December 31, 2015, LHL leased all 47 hotels owned by the Company as follows:
Hotel Properties | Location | |||
1. | Hotel Amarano Burbank | Burbank, CA | ||
2. | L’Auberge Del Mar | Del Mar, CA | ||
3. | Hilton San Diego Gaslamp Quarter | San Diego, CA | ||
4. | Hotel Solamar | San Diego, CA | ||
5. | San Diego Paradise Point Resort and Spa | San Diego, CA | ||
6. | The Hilton San Diego Resort and Spa | San Diego, CA | ||
7. | Harbor Court Hotel | San Francisco, CA | ||
8. | The Marker San Francisco | San Francisco, CA | ||
9. | Hotel Triton | San Francisco, CA | ||
10. | Hotel Vitale | San Francisco, CA | ||
11. | Park Central San Francisco | San Francisco, CA | ||
12. | Serrano Hotel | San Francisco, CA | ||
13. | Villa Florence | San Francisco, CA | ||
14. | Chaminade Resort and Conference Center | Santa Cruz, CA | ||
15. | Viceroy Santa Monica | Santa Monica, CA | ||
16. | Chamberlain West Hollywood | West Hollywood, CA | ||
17. | Le Montrose Suite Hotel | West Hollywood, CA | ||
18. | Le Parc Suite Hotel | West Hollywood, CA | ||
19. | The Grafton on Sunset | West Hollywood, CA | ||
20. | Donovan House | Washington, D.C. | ||
21. | Hotel George | Washington, D.C. | ||
22. | Hotel Madera | Washington, D.C. | ||
23. | Hotel Palomar, Washington, DC | Washington, D.C. | ||
24. | Hotel Rouge | Washington, D.C. | ||
25. | Mason & Rook Hotel | Washington, D.C. | ||
26. | Sofitel Washington, DC Lafayette Square | Washington, D.C. | ||
27. | The Liaison Capitol Hill | Washington, D.C. | ||
28. | Topaz Hotel | Washington, D.C. | ||
29. | Southernmost Beach Resort Key West | Key West, FL | ||
30. | The Marker Waterfront Resort | Key West, FL | ||
31. | Hotel Chicago | Chicago, IL | ||
32. | Westin Michigan Avenue | Chicago, IL | ||
33. | Indianapolis Marriott Downtown | Indianapolis, IN | ||
34. | Hyatt Regency Boston Harbor | Boston, MA | ||
35. | Onyx Hotel | Boston, MA | ||
36. | The Liberty Hotel | Boston, MA | ||
37. | Westin Copley Place | Boston, MA | ||
38. | Gild Hall | New York, NY | ||
39. | Hotel Roger Williams | New York, NY | ||
40. | Park Central Hotel New York (shared lease with WestHouse Hotel New York) | New York, NY | ||
41. | WestHouse Hotel New York | New York, NY | ||
42. | The Heathman Hotel | Portland, OR | ||
43. | Embassy Suites Philadelphia - Center City | Philadelphia, PA | ||
44. | Westin Philadelphia | Philadelphia, PA | ||
45. | Lansdowne Resort | Lansdowne,VA | ||
46. | Alexis Hotel | Seattle, WA | ||
47. | Hotel Deca | Seattle, WA | ||
F-32
9. | Income Taxes |
The Company has elected to be taxed as a REIT under Sections 856 through 860 of the Code commencing with its taxable year ended December 31, 1998. To qualify as a REIT, the Company must meet a number of organizational and operational requirements, including a requirement that it currently distribute at least 90% of its adjusted taxable income to its shareholders. It is the Company’s current intention to adhere to these requirements and maintain the Company’s qualification for taxation as a REIT. As a REIT, the Company generally is not subject to federal corporate income tax on that portion of its net income that is currently distributed to shareholders. If the Company fails to qualify for taxation as a REIT in any taxable year, it will be subject to federal income taxes at regular corporate rates (including any applicable alternative minimum tax) and may not be able to qualify as a REIT for four subsequent taxable years. Even if the Company qualifies for taxation as a REIT, the Company may be subject to certain state and local taxes on its income and property, and to federal income and excise taxes on its undistributed taxable income. In addition, taxable income from non-REIT activities managed through a TRS is subject to federal, state and local income taxes. As a wholly owned TRS of the Company, LHL is required to pay income taxes at the applicable federal, state and local rates.
For federal income tax purposes, the cash distributions paid to the Company’s common shareholders of beneficial interest and preferred shareholders may be characterized as ordinary income, return of capital (generally non-taxable) or capital gains. Tax law permits certain characterization of distributions which could result in differences between cash basis and tax basis distribution amounts.
The following characterizes distributions paid per common share of beneficial interest and preferred share on a tax basis for the years ended December 31, 2015, 2014 and 2013:
2015 | 2014 | 2013 | ||||||||||||||||||
$ | % | $ | % | $ | % | |||||||||||||||
Common shares of beneficial interest | ||||||||||||||||||||
Ordinary income | $ | 1.6570 | 100.00 | % | $ | 1.4556 | 100.00 | % | $ | 1.0305 | 100.00 | % | ||||||||
Preferred shares (Series G) | ||||||||||||||||||||
Ordinary income | $ | 0.0000 | 0.00 | % | $ | 0.0000 | 0.00 | % | $ | 1.8125 | 100.00 | % | ||||||||
Preferred shares (Series G redeemed) (1) | ||||||||||||||||||||
Ordinary income | $ | 0.0000 | 0.00 | % | $ | 0.0000 | 0.00 | % | $ | 0.9314 | 100.00 | % | ||||||||
Preferred shares (Series G redeemed) (2) | ||||||||||||||||||||
Ordinary income | $ | 0.0000 | 0.00 | % | $ | 1.3745 | 100.00 | % | $ | 1.8125 | 100.00 | % | ||||||||
Preferred shares (Series H) | ||||||||||||||||||||
Ordinary income | $ | 1.8750 | 100.00 | % | $ | 1.8750 | 100.00 | % | $ | 1.8750 | 100.00 | % | ||||||||
Preferred shares (Series I) | ||||||||||||||||||||
Ordinary income | $ | 1.5938 | 100.00 | % | $ | 1.5938 | 100.00 | % | $ | 0.9784 | 100.00 | % | ||||||||
(1) On April 5, 2013, the Company redeemed a portion of its Series G Preferred Shares (see Note 6).
(2) On July 3, 2014, the Company redeemed its remaining Series G Preferred Shares (see Note 6).
The Company’s federal and state tax returns for the year ended December 31, 2015 have not been filed. The taxability information presented for the Company’s dividends paid in 2015 is based upon management’s estimate. The distributions for the year ended December 31, 2014 were revised from the Company’s previous estimate and agree to the tax returns filed for the year ended December 31, 2014.
F-33
Income tax (benefit) expense was comprised of the following for the years ended December 31, 2015, 2014 and 2013:
For the year ended December 31, | |||||||||||
2015 | 2014 | 2013 | |||||||||
LHL’s income tax (benefit) expense | $ | (2,546 | ) | $ | 1,260 | $ | (308 | ) | |||
Operating Partnership’s income tax expense | 1,254 | 1,046 | 778 | ||||||||
Total income tax (benefit) expense | $ | (1,292 | ) | $ | 2,306 | $ | 470 | ||||
The components of LHL’s income tax (benefit) expense and (loss) income before income tax (benefit) expense for the years ended December 31, 2015, 2014 and 2013 were as follows:
For the year ended December 31, | |||||||||||
2015 | 2014 | 2013 | |||||||||
LHL’s income tax (benefit) expense: | |||||||||||
Federal | |||||||||||
Current | $ | (510 | ) | $ | 912 | $ | (50 | ) | |||
Deferred | (1,251 | ) | 372 | 51 | |||||||
State & local | |||||||||||
Current | 83 | 297 | (47 | ) | |||||||
Deferred | (868 | ) | (321 | ) | (262 | ) | |||||
Total | $ | (2,546 | ) | $ | 1,260 | $ | (308 | ) | |||
LHL’s (loss) income before income tax (benefit) expense | $ | (4,876 | ) | $ | 3,559 | $ | 615 | ||||
LHL’s provision for income taxes differs from the amount of income tax determined by applying the applicable U.S. statutory federal income tax rate to LHL’s pretax income for the years ended December 31, 2015, 2014 and 2013 as a result of the following differences:
For the year ended December 31, | |||||||||||
2015 | 2014 | 2013 | |||||||||
“Expected” federal tax (benefit) expense at statutory rate | $ | (1,658 | ) | $ | 1,210 | $ | 209 | ||||
State income tax (benefit) expense, net of federal income tax effect | (443 | ) | 302 | 50 | |||||||
Other, net | (445 | ) | (252 | ) | (567 | ) | |||||
Income tax (benefit) expense | $ | (2,546 | ) | $ | 1,260 | $ | (308 | ) | |||
LHL’s deferred tax assets (liabilities) as of December 31, 2015 and 2014 were as follows:
December 31, | |||||||
2015 | 2014 | ||||||
Net operating loss carryforwards | $ | 4,175 | $ | 1,618 | |||
Bad debt reserves | 255 | 214 | |||||
Golf membership deferred revenue (1) | (343 | ) | (256 | ) | |||
Straight-line rent (1) | (643 | ) | (129 | ) | |||
Other | 122 | 0 | |||||
Net deferred tax assets | $ | 3,566 | $ | 1,447 | |||
(1) Amounts included in accounts payable and accrued expenses in the accompanying consolidated balance sheets for 2014. For 2015, amounts netted because of the existence of deferred tax assets in both federal and state jurisdictions.
As of December 31, 2015, the Company had net deferred tax assets of $3,566 primarily due to the current year’s federal net operating loss and current and past years’ state tax net operating losses. These loss carryforwards will generally expire in 2016 through 2035 if not utilized by then. The Company analyzes state loss carryforwards on a state by state basis and records a valuation allowance when management deems it more likely than not that future results will not generate sufficient taxable income in the respective state to realize the deferred tax asset prior to the expiration of the loss carryforwards. Management believes that it is more likely than not that the results of future operations will generate sufficient taxable income to realize the deferred tax assets related to federal and state loss carryforwards prior to the expiration of the loss carryforwards and has determined that no valuation
F-34
allowance is necessary. From time to time, the Company may be subject to federal, state or local tax audits in the normal course of business.
Regarding accounting for uncertainty in income taxes, GAAP guidance prescribes a recognition threshold and measurement attribute for the financial statement recognition and measurement of a tax position taken in a tax return. The Company must determine whether it is “more-likely-than-not” that a tax position will be sustained upon examination, including resolution of any related appeals or litigation processes, based on the technical merits of the position. Once it is determined that a position meets the more-likely-than-not recognition threshold, the previously unrecognized benefit associated with the position is recognized in the financial statements. This guidance applies to all positions related to income taxes.
The Company has no material unrecognized income tax benefits as of December 31, 2015 and 2014. As of December 31, 2015, the tax years that remain subject to examination by major tax jurisdictions generally include 2011 through 2015.
10. | Fair Value Measurements |
In evaluating fair value, GAAP outlines a valuation framework and creates a fair value hierarchy that distinguishes between market assumptions based on market data (observable inputs) and a reporting entity’s own assumptions about market data (unobservable inputs). The hierarchy ranks the quality and reliability of inputs used to determine fair value, which are then classified and disclosed in one of the three categories. The three levels are as follows:
Level 1—Inputs are quoted prices (unadjusted) in active markets for identical assets or liabilities that the entity has the ability to access at the measurement date.
Level 2—Observable inputs, other than quoted prices included in level 1, such as interest rates, yield curves, quoted prices in active markets for similar assets and liabilities, and quoted prices for identical or similar assets or liabilities in markets that are not active.
Level 3—Unobservable inputs that are supported by limited market activity. This includes certain pricing models, discounted cash flow methodologies and similar techniques when observable inputs are not available.
The Company estimates the fair value of its financial instruments using available market information and valuation methodologies the Company believes to be appropriate for these purposes. Considerable judgment and subjectivity are involved in developing these estimates and, accordingly, such estimates are not necessarily indicative of amounts that would be realized upon disposition.
Recurring Measurements
For assets and liabilities measured at fair value on a recurring basis, quantitative disclosure of their fair value is as follows:
Fair Value Measurements at | ||||||||||
December 31, 2015 | December 31, 2014 | |||||||||
Using Significant Other Observable | ||||||||||
Inputs (Level 2) | ||||||||||
Description | Consolidated Balance Sheet Location | |||||||||
Derivative interest rate instruments | Prepaid expenses and other assets | $ | 1,605 | $ | 1,520 | |||||
Derivative interest rate instruments | Accounts payable and accrued expenses | $ | 1,702 | $ | 770 | |||||
The fair value of each derivative instrument is based on a discounted cash flow analysis of the expected cash flows under each arrangement. This analysis reflects the contractual terms of the derivative instrument, including the period to maturity, and utilizes observable market-based inputs, including interest rate curves and implied volatilities, which are classified within level 2 of the fair value hierarchy. The Company also incorporates credit value adjustments to appropriately reflect each parties’ nonperformance risk in the fair value measurement, which utilizes level 3 inputs such as estimates of current credit spreads. However, the Company has assessed that the credit valuation adjustments are not significant to the overall valuation of the derivatives. As a result, the Company has determined that its derivative valuations in their entirety are classified within level 2 of the fair value hierarchy.
F-35
Financial Instruments Not Measured at Fair Value
The following table represents the fair value, derived using level 2 inputs, of financial instruments presented at carrying value in the Company’s consolidated financial statements as of December 31, 2015 and 2014:
December 31, 2015 | December 31, 2014 | ||||||||||||||
Carrying Value | Estimated Fair Value | Carrying Value | Estimated Fair Value | ||||||||||||
Note receivable | $ | 80,000 | $ | 80,000 | $ | 0 | $ | 0 | |||||||
Borrowings under credit facilities | $ | 21,000 | $ | 21,061 | $ | 0 | $ | 0 | |||||||
Term loans | $ | 855,000 | $ | 856,038 | $ | 477,500 | $ | 476,996 | |||||||
Bonds payable | $ | 42,500 | $ | 42,500 | $ | 42,500 | $ | 42,500 | |||||||
Mortgage loans | $ | 511,294 | $ | 511,786 | $ | 501,090 | $ | 510,250 | |||||||
The Company estimated the fair value of its borrowings under credit facilities, term loans, bonds payable and mortgage loans using interest rates ranging from 1.5% to 4.4% as of December 31, 2015 and from 1.6% to 4.3% as of December 31, 2014 with a weighted average effective interest rate of 2.1% and 2.9% as of December 31, 2015 and 2014, respectively. The assumptions reflect the terms currently available on similar borrowings to borrowers with credit profiles similar to the Company’s. At December 31, 2015, the carrying amount of the note receivable was representative of its fair value due to the short-term nature and recent acquisition of this instrument.
At December 31, 2015 and 2014, the carrying amounts of certain of the Company’s financial instruments, including cash and cash equivalents, restricted cash, accounts receivable, accounts payable and accrued expenses and distributions payable were representative of their fair values due to the short-term nature of these instruments and the recent acquisition of these items.
11. | Earnings per Common Share |
The limited partners’ outstanding common partnership units in the Operating Partnership (which may be converted to common shares of beneficial interest) have been excluded from the diluted earnings per share calculation as there would be no effect on the amounts since the limited partners’ share of income or loss would also be added back to net income or loss. Any anti-dilutive shares have been excluded from the diluted earnings per share calculation. Unvested share-based payment awards expected to vest that contain nonforfeitable rights to dividends or dividend equivalents (whether paid or unpaid) are participating securities and shall be included in the computation of earnings per share pursuant to the two-class method. Accordingly, distributed and undistributed earnings attributable to unvested restricted shares (participating securities) have been excluded, as applicable, from net income or loss attributable to common shareholders used in the basic and diluted earnings per share calculations. Net income or loss figures are presented net of noncontrolling interests in the earnings per share calculations.
F-36
The computation of basic and diluted earnings per common share is as follows:
For the year ended December 31, | |||||||||||
2015 | 2014 | 2013 | |||||||||
Numerator: | |||||||||||
Net income attributable to common shareholders | $ | 123,383 | $ | 197,561 | $ | 70,984 | |||||
Dividends paid on unvested restricted shares | (542 | ) | (411 | ) | (353 | ) | |||||
Undistributed earnings attributable to unvested restricted shares | 0 | (138 | ) | 0 | |||||||
Net income attributable to common shareholders excluding amounts attributable to unvested restricted shares | $ | 122,841 | $ | 197,012 | $ | 70,631 | |||||
Denominator: | |||||||||||
Weighted average number of common shares - basic | 112,685,235 | 104,188,785 | 97,041,484 | ||||||||
Effect of dilutive securities: | |||||||||||
Compensation-related shares | 411,185 | 357,110 | 187,187 | ||||||||
Weighted average number of common shares - diluted | 113,096,420 | 104,545,895 | 97,228,671 | ||||||||
Earnings per Common Share - Basic: | |||||||||||
Net income attributable to common shareholders excluding amounts attributable to unvested restricted shares | $ | 1.09 | $ | 1.89 | $ | 0.73 | |||||
Earnings per Common Share - Diluted: | |||||||||||
Net income attributable to common shareholders excluding amounts attributable to unvested restricted shares | $ | 1.09 | $ | 1.88 | $ | 0.73 | |||||
12. | Supplemental Information to Statements of Cash Flows |
For the year ended December 31, | |||||||||||
2015 | 2014 | 2013 | |||||||||
Interest paid, net of capitalized interest | $ | 52,155 | $ | 54,558 | $ | 55,754 | |||||
Interest capitalized | 902 | 400 | 649 | ||||||||
Income taxes paid, net | 3,112 | 815 | 2,353 | ||||||||
Increase in distributions payable on common shares | 8,477 | 13,227 | 10,044 | ||||||||
Decrease in distributions payable on preferred shares | 0 | (1,064 | ) | (59 | ) | ||||||
Write-off of fully depreciated furniture, fixtures and equipment | 16,000 | 582 | 7,888 | ||||||||
Write-off of fully amortized deferred financing costs | 131 | 273 | 203 | ||||||||
Increase (decrease) in accrued capital expenditures | 2,334 | (994 | ) | 3,116 | |||||||
Grant of nonvested shares and awards to employees and executives, net | 5,188 | 7,953 | 5,258 | ||||||||
Issuance of common shares for Board of Trustees compensation (1) | 1,874 | 602 | 277 | ||||||||
In conjunction with the sale of properties, the Company disposed of | |||||||||||
the following assets and liabilities: | |||||||||||
Investment in properties, net of closing costs | $ | 0 | $ | 167,921 | $ | 0 | |||||
Other assets | 0 | 1,397 | 0 | ||||||||
Liabilities | 0 | (1,480 | ) | 0 | |||||||
Sale of properties | $ | 0 | $ | 167,838 | $ | 0 | |||||
In conjunction with the acquisition of properties, the Company assumed | |||||||||||
the following assets and liabilities: | |||||||||||
Investment in properties (after credits at closing) | $ | (445,734 | ) | $ | (194,198 | ) | $ | (349,802 | ) | ||
Other assets | (1,897 | ) | (1,361 | ) | (2,509 | ) | |||||
Liabilities | 8,474 | 4,448 | 50,176 | ||||||||
Acquisition of properties | $ | (439,157 | ) | $ | (191,111 | ) | $ | (302,135 | ) | ||
(1) Refer to Note 6 for issuances of previously deferred shares in 2014 and 2015.
F-37
13. | Subsequent Events |
On January 1, 2016, the Company issued 13,864 common shares of beneficial interest and authorized an additional 4,910 deferred shares to the independent members of its Board of Trustees for their 2015 compensation. These common shares of beneficial interest were issued under the 2014 Plan.
On January 4, 2016, the Company received 38,193 common shares of beneficial interest related to executives and employees surrendering shares to pay taxes at the time restricted shares vested.
The Company paid the following common and preferred share dividends subsequent to December 31, 2015:
Dividend per | For the Quarter | Record | Payable | |||||||
Security Type | Share/Unit (1) | Ended | Date | Date | ||||||
Common Shares/Units | $ | 0.45 | December 31, 2015 | December 31, 2015 | January 15, 2016 | |||||
7 ½% Series H Preferred Shares | $ | 0.47 | December 31, 2015 | January 1, 2016 | January 15, 2016 | |||||
6 ⅜% Series I Preferred Shares | $ | 0.40 | December 31, 2015 | January 1, 2016 | January 15, 2016 | |||||
(1) | Amounts are rounded to the nearest whole cent for presentation purposes. |
On January 4, 2016, the Company repaid without fee or penalty the Westin Michigan Avenue mortgage loan in the amount of $131,262 plus accrued interest through borrowings under its senior unsecured credit facility. The loan was due to mature in April 2016.
On January 4, 2016, the Company repaid without fee or penalty the Indianapolis Marriott Downtown mortgage loan in the amount of $96,097 plus accrued interest through borrowings under its senior unsecured credit facility. The loan was due to mature in July 2016.
On February 11, 2016, the Company repaid without fee or penalty The Roger mortgage loan in the amount of $58,831 plus accrued interest through borrowings under its senior unsecured credit facility. The loan was due to mature in August 2016.
14. | Quarterly Operating Results (Unaudited) |
The Company’s unaudited consolidated quarterly operating data for the years ended December 31, 2015 and 2014 (in thousands, except per share data) follows. In the opinion of management, all adjustments (consisting of normal recurring accruals) necessary for a fair presentation of quarterly results have been reflected in the data. It is also management’s opinion, however, that quarterly operating data for hotel enterprises are not indicative of results to be achieved in succeeding quarters or years.
Year Ended December 31, 2015 | |||||||||||||||
First Quarter | Second Quarter | Third Quarter | Fourth Quarter | ||||||||||||
Total revenues | $ | 250,809 | $ | 341,387 | $ | 331,004 | $ | 296,322 | |||||||
Total expenses | 248,071 | 282,376 | 283,462 | 269,784 | |||||||||||
Net income | 2,738 | 59,011 | 47,542 | 26,538 | |||||||||||
Net income attributable to noncontrolling interests | (15 | ) | (147 | ) | (75 | ) | (40 | ) | |||||||
Distributions to preferred shareholders | (3,042 | ) | (3,042 | ) | (3,043 | ) | (3,042 | ) | |||||||
Net (loss) income attributable to common shareholders | $ | (319 | ) | $ | 55,822 | $ | 44,424 | $ | 23,456 | ||||||
Earnings per Common Share—Basic: | |||||||||||||||
Net income attributable to common shareholders excluding amounts attributable to unvested restricted shares | $ | 0.00 | $ | 0.49 | $ | 0.39 | $ | 0.21 | |||||||
Earnings per Common Share—Diluted: | |||||||||||||||
Net income attributable to common shareholders excluding amounts attributable to unvested restricted shares | $ | 0.00 | $ | 0.49 | $ | 0.39 | $ | 0.21 | |||||||
Weighted average number of common shares outstanding: | |||||||||||||||
Basic | 112,647,715 | 112,728,085 | 112,731,358 | 112,633,429 | |||||||||||
Diluted | 112,647,715 | 113,141,908 | 113,137,284 | 113,028,661 | |||||||||||
F-38
Year Ended December 31, 2014 | |||||||||||||||
First Quarter | Second Quarter | Third Quarter | Fourth Quarter | ||||||||||||
Total revenues | $ | 220,653 | $ | 356,663 | $ | 357,661 | $ | 269,818 | |||||||
Total expenses | 225,524 | 265,695 | 256,149 | 243,930 | |||||||||||
Net (loss) income | (4,871 | ) | 90,968 | 101,512 | 25,888 | ||||||||||
Net loss (income) attributable to noncontrolling interests | 6 | (274 | ) | (297 | ) | (87 | ) | ||||||||
Distributions to preferred shareholders | (4,107 | ) | (4,142 | ) | (3,042 | ) | (3,042 | ) | |||||||
Issuance costs of redeemed preferred shares | 0 | (942 | ) | (9 | ) | 0 | |||||||||
Net (loss) income attributable to common shareholders | $ | (8,972 | ) | $ | 85,610 | $ | 98,164 | $ | 22,759 | ||||||
Earnings per Common Share—Basic: | |||||||||||||||
Net (loss) income attributable to common shareholders excluding amounts attributable to unvested restricted shares | $ | (0.09 | ) | $ | 0.82 | $ | 0.94 | $ | 0.22 | ||||||
Earnings per Common Share—Diluted: | |||||||||||||||
Net (loss) income attributable to common shareholders excluding amounts attributable to unvested restricted shares | $ | (0.09 | ) | $ | 0.82 | $ | 0.94 | $ | 0.21 | ||||||
Weighted average number of common shares outstanding: | |||||||||||||||
Basic | 103,691,657 | 103,698,332 | 103,798,853 | 105,550,157 | |||||||||||
Diluted | 103,691,657 | 104,024,472 | 104,133,553 | 105,902,098 | |||||||||||
F-39
LASALLE HOTEL PROPERTIES
Schedule III—Real Estate and Accumulated Depreciation
As of December 31, 2015
(in thousands)
Initial Cost | Cost Capitalized Subsequent to Acquisition (1) | Gross Amounts at Which Carried at Close of Period | Life on Which Depreciation in Statement of Operations is Computed | |||||||||||||||||||||||||||||||||||||||||||||||||||
Encum- brances | Land | Building and Improve- ments | Furniture, Fixtures and Equipment | Land | Building and Improve- ments | Furniture, Fixtures and Equipment | Land | Building and Improve- ments | Furniture, Fixtures and Equipment | Accumu- lated Depre- ciation | Net Book Value | Date of Original Construc- tion | Date of Acqui- sition | |||||||||||||||||||||||||||||||||||||||||
1. | Le Montrose Suite Hotel | $ | 0 | $ | 5,004 | $ | 19,752 | $ | 2,951 | $ | 0 | $ | 5,309 | $ | 14,063 | $ | 5,004 | $ | 25,061 | $ | 17,014 | $ | 27,587 | $ | 19,492 | 1976 | 4/29/1998 | 3-40 years | ||||||||||||||||||||||||||
2. | San Diego Paradise Point Resort and Spa | 0 | 0 | 69,639 | 3,665 | 154 | 41,164 | 33,962 | 154 | 110,803 | 37,627 | 89,290 | 59,294 | 1962 | 6/1/1998 | 3-40 years | ||||||||||||||||||||||||||||||||||||||
3. | Hyatt Regency Boston Harbor | 42,500 | 0 | 66,159 | 5,246 | 16 | 4,785 | 15,066 | 16 | 70,944 | 20,312 | 54,451 | 36,821 | 1993 | 6/24/1998 | 3-40 years | ||||||||||||||||||||||||||||||||||||||
4. | Topaz Hotel | 0 | 2,137 | 8,549 | 0 | 12 | 4,307 | 6,366 | 2,149 | 12,856 | 6,366 | 12,042 | 9,329 | 1963 | 3/8/2001 | 3-40 years | ||||||||||||||||||||||||||||||||||||||
5. | Hotel Madera | 0 | 1,682 | 6,726 | 0 | 15 | 5,559 | 6,442 | 1,697 | 12,285 | 6,442 | 10,673 | 9,751 | 1963 | 3/8/2001 | 3-40 years | ||||||||||||||||||||||||||||||||||||||
6. | Hotel Rouge | 0 | 2,162 | 8,647 | 0 | 17 | 5,071 | 8,187 | 2,179 | 13,718 | 8,187 | 14,019 | 10,065 | 1963 | 3/8/2001 | 3-40 years | ||||||||||||||||||||||||||||||||||||||
7. | Mason & Rook Hotel | 0 | 2,636 | 10,546 | 0 | 14 | 10,048 | 777 | 2,650 | 20,594 | 777 | 9,573 | 14,448 | 1962 | 3/8/2001 | 3-40 years | ||||||||||||||||||||||||||||||||||||||
8. | The Liaison Capitol Hill | 0 | 8,353 | 33,412 | 2,742 | 19 | 15,453 | 22,295 | 8,372 | 48,865 | 25,037 | 44,815 | 37,459 | 1968 | 6/1/2001 | 3-40 years | ||||||||||||||||||||||||||||||||||||||
9. | Lansdowne Resort | 0 | 27,421 | 74,835 | 3,114 | 33,147 | 27,818 | 29,557 | 60,568 | 102,653 | 32,671 | 75,632 | 120,260 | 1991 | 6/17/2003 | 3-40 years | ||||||||||||||||||||||||||||||||||||||
10. | Hotel George | 0 | 1,743 | 22,221 | 531 | 0 | 867 | 8,587 | 1,743 | 23,088 | 9,118 | 14,834 | 19,115 | 1928 | 9/18/2003 | 3-40 years | ||||||||||||||||||||||||||||||||||||||
11. | Indianapolis Marriott Downtown | 96,097 | 0 | 96,173 | 9,879 | 0 | 2,018 | 4,653 | 0 | 98,191 | 14,532 | 51,657 | 61,066 | 2001 | 2/10/2004 | 3-40 years | ||||||||||||||||||||||||||||||||||||||
12. | Chaminade Resort and Conference Center | 0 | 5,240 | 13,111 | 299 | 24 | 9,023 | 11,338 | 5,264 | 22,134 | 11,637 | 18,734 | 20,301 | 1985 | 11/18/2004 | 3-40 years | ||||||||||||||||||||||||||||||||||||||
13. | Hilton San Diego Gaslamp Quarter | 0 | 5,008 | 77,892 | 2,250 | 0 | 1,353 | 11,621 | 5,008 | 79,245 | 13,871 | 30,336 | 67,788 | 2000 | 1/6/2005 | 3-40 years | ||||||||||||||||||||||||||||||||||||||
14. | The Grafton on Sunset | 0 | 1,882 | 23,226 | 431 | 11 | 3,482 | 9,575 | 1,893 | 26,708 | 10,006 | 11,596 | 27,011 | 1954 | 1/10/2005 | 3-40 years | ||||||||||||||||||||||||||||||||||||||
15. | Onyx Hotel | 0 | 6,963 | 21,262 | 445 | 3,561 | 211 | 3,830 | 10,524 | 21,473 | 4,275 | 7,920 | 28,352 | 2004 | 5/18/2005 | 3-40 years | ||||||||||||||||||||||||||||||||||||||
16. | Westin Copley Place | 225,000 | 0 | 295,809 | 28,223 | 0 | 22,512 | 44,179 | 0 | 318,321 | 72,402 | 147,104 | 243,619 | 1983 | 8/31/2005 | 3-40 years | ||||||||||||||||||||||||||||||||||||||
17. | Hotel Deca | 0 | 4,938 | 21,720 | 577 | 0 | 826 | 6,131 | 4,938 | 22,546 | 6,708 | 10,753 | 23,439 | 1931 | 12/8/2005 | 3-40 years | ||||||||||||||||||||||||||||||||||||||
18. | The Hilton San Diego Resort and Spa | 0 | 0 | 85,572 | 4,800 | 122 | 15,834 | 19,005 | 122 | 101,406 | 23,805 | 50,559 | 74,774 | 1962 | 12/15/2005 | 3-40 years | ||||||||||||||||||||||||||||||||||||||
19. | The Donovan | 0 | 11,384 | 34,573 | 0 | 0 | 36,539 | 15,540 | 11,384 | 71,112 | 15,540 | 38,000 | 60,036 | 1972 | 12/16/2005 | 3-40 years | ||||||||||||||||||||||||||||||||||||||
20. | Le Parc Suite Hotel | 0 | 13,971 | 31,742 | 2,741 | 3 | 2,322 | 9,952 | 13,974 | 34,064 | 12,693 | 18,658 | 42,073 | 1970 | 1/27/2006 | 3-40 years | ||||||||||||||||||||||||||||||||||||||
21. | Westin Michigan Avenue | 131,262 | 38,158 | 154,181 | 24,112 | 17 | 17,572 | 28,670 | 38,175 | 171,753 | 52,782 | 85,046 | 177,664 | 1963/1972 | 3/1/2006 | 3-40 years | ||||||||||||||||||||||||||||||||||||||
22. | Hotel Chicago | 0 | 9,403 | 104,148 | 889 | 155 | 27,566 | 28,661 | 9,558 | 131,714 | 29,550 | 57,572 | 113,250 | 1998 | 3/1/2006 | 3-40 years | ||||||||||||||||||||||||||||||||||||||
23. | Alexis Hotel | 0 | 6,581 | 31,062 | 578 | 13 | 10,421 | 8,629 | 6,594 | 41,483 | 9,207 | 19,488 | 37,796 | 1901/1982 | 6/15/2006 | 3-40 years | ||||||||||||||||||||||||||||||||||||||
24. | Hotel Solamar | 0 | 0 | 79,111 | 7,890 | 0 | 415 | 8,111 | 0 | 79,526 | 16,001 | 28,993 | 66,534 | 2005 | 8/1/2006 | 3-40 years | ||||||||||||||||||||||||||||||||||||||
25. | Gild Hall | 0 | 6,732 | 45,016 | 984 | 2 | 3,157 | 10,282 | 6,734 | 48,173 | 11,266 | 22,438 | 43,735 | 1999 | 11/17/2006 | 3-40 years | ||||||||||||||||||||||||||||||||||||||
26. | Hotel Amarano Burbank | 0 | 5,982 | 29,292 | 1,253 | 329 | 6,394 | 7,700 | 6,311 | 35,686 | 8,953 | 12,478 | 38,472 | 2002 | 12/19/2006 | 3-40 years | ||||||||||||||||||||||||||||||||||||||
27. | Sofitel Washington, DC Lafayette Square | 0 | 11,082 | 80,342 | 2,619 | 0 | 409 | 13,344 | 11,082 | 80,751 | 15,963 | 19,005 | 88,791 | 2002 | 3/1/2010 | 3-40 years | ||||||||||||||||||||||||||||||||||||||
28. | The Marker San Francisco | 0 | 11,435 | 53,186 | 3,736 | 0 | 1,884 | 9,375 | 11,435 | 55,070 | 13,111 | 14,400 | 65,216 | 1910/1995 | 9/1/2010 | 3-40 years | ||||||||||||||||||||||||||||||||||||||
29. | Westin Philadelphia | 0 | 35,100 | 106,100 | 3,776 | 0 | 817 | 9,589 | 35,100 | 106,917 | 13,365 | 20,591 | 134,791 | 1990 | 9/1/2010 | 3-40 years | ||||||||||||||||||||||||||||||||||||||
30. | Embassy Suites Philadelphia - Center City | 0 | 13,600 | 62,900 | 2,504 | 0 | 2,135 | 5,011 | 13,600 | 65,035 | 7,515 | 14,472 | 71,678 | 1963/1993 | 9/1/2010 | 3-40 years | ||||||||||||||||||||||||||||||||||||||
31. | The Roger | 58,935 | 0 | 95,079 | 3,509 | 0 | (138 | ) | 12,052 | 0 | 94,941 | 15,561 | 26,265 | 84,237 | 1930/1998 | 10/6/2010 | 3-34 years | |||||||||||||||||||||||||||||||||||||
32. | Chamberlain West Hollywood | 0 | 6,470 | 29,085 | 2,895 | 0 | 303 | 3,994 | 6,470 | 29,388 | 6,889 | 8,120 | 34,627 | 1970/2005 | 12/6/2010 | 3-40 years | ||||||||||||||||||||||||||||||||||||||
33. | Viceroy Santa Monica | 0 | 0 | 75,270 | 4,747 | 0 | 390 | 4,582 | 0 | 75,660 | 9,329 | 15,650 | 69,339 | 1967/2002 | 3/16/2011 | 3-40 years | ||||||||||||||||||||||||||||||||||||||
34. | Villa Florence | 0 | 12,413 | 50,997 | 3,202 | 0 | 0 | 9,864 | 12,413 | 50,997 | 13,066 | 10,273 | 66,203 | 1908 | 10/5/2011 | 3-40 years | ||||||||||||||||||||||||||||||||||||||
35/36. | Park Central Hotel New York/WestHouse Hotel New York | 0 | 135,306 | 250,262 | 9,004 | 0 | 38,270 | 49,434 | 135,306 | 288,532 | 58,438 | 56,922 | 425,354 | 1928 | 12/29/2011 | 3-40 years | ||||||||||||||||||||||||||||||||||||||
37. | Hotel Palomar, Washington, DC | 0 | 26,859 | 111,214 | 5,648 | 0 | 782 | 4,759 | 26,859 | 111,996 | 10,407 | 15,768 | 133,494 | 1962 | 3/8/2012 | 3-40 years | ||||||||||||||||||||||||||||||||||||||
38. | L’Auberge Del Mar | 0 | 13,475 | 59,481 | 3,628 | 0 | 19 | 2,012 | 13,475 | 59,500 | 5,640 | 7,176 | 71,439 | 1989 | 12/6/2012 | 3-40 years | ||||||||||||||||||||||||||||||||||||||
39. | The Liberty Hotel | 0 | 0 | 160,731 | 9,040 | 0 | 263 | 3,980 | 0 | 160,994 | 13,020 | 18,005 | 156,009 | 1851/2007 | 12/28/2012 | 3-40 years | ||||||||||||||||||||||||||||||||||||||
40. | Harbor Court Hotel | 0 | 0 | 54,563 | 714 | 0 | 22 | 288 | 0 | 54,585 | 1,002 | 4,156 | 51,431 | 1926/1991 | 8/1/2013 | 3-35 years | ||||||||||||||||||||||||||||||||||||||
41. | Hotel Triton | 0 | 0 | 37,253 | 1,379 | 0 | (3,188 | ) | 617 | 0 | 34,065 | 1,996 | 3,301 | 32,760 | 1912/1991 | 8/1/2013 | 3-34.5 years | |||||||||||||||||||||||||||||||||||||
42. | Serrano Hotel | 0 | 20,475 | 48,501 | 2,500 | 0 | 173 | 648 | 20,475 | 48,674 | 3,148 | 4,974 | 67,323 | 1928/1999 | 8/21/2013 | 3-40 years | ||||||||||||||||||||||||||||||||||||||
43. | Southernmost Beach Resort Key West | 0 | 101,517 | 79,795 | 3,105 | 0 | 1,328 | 2,438 | 101,517 | 81,123 | 5,543 | 6,727 | 181,456 | 1958-2008 | 8/27/2013 | 3-40 years | ||||||||||||||||||||||||||||||||||||||
44. | Hotel Vitale | 0 | 0 | 125,150 | 4,766 | 0 | (172 | ) | 344 | 0 | 124,978 | 5,110 | 7,173 | 122,915 | 2005 | 4/2/2014 | 3-40 years | |||||||||||||||||||||||||||||||||||||
45. | The Heathman Hotel | 0 | 10,280 | 50,001 | 4,002 | 0 | (174 | ) | 121 | 10,280 | 49,827 | 4,123 | 2,051 | 62,179 | 1927 | 12/18/2014 | 3-40 years | |||||||||||||||||||||||||||||||||||||
46. | Pack Central San Francisco | 0 | 80,640 | 255,105 | 14,057 | 0 | 41 | 976 | 80,640 | 255,146 | 15,033 | 8,538 | 342,281 | 1984 | 1/23/2015 | 3-40 years | ||||||||||||||||||||||||||||||||||||||
47. | The Marker Waterfront Resort | 0 | 48,133 | 41,143 | 6,656 | 0 | 0 | 48 | 48,133 | 41,143 | 6,704 | 1,771 | 94,209 | 2014 | 3/16/2015 | 3-40 years | ||||||||||||||||||||||||||||||||||||||
Total | $ | 553,794 | $ | 694,165 | $ | 3,290,534 | $ | 195,087 | $ | 37,631 | $ | 323,190 | $ | 506,655 | $ | 731,796 | $ | 3,613,724 | $ | 701,742 | $ | 1,229,586 | $ | 3,817,676 | ||||||||||||||||||||||||||||||
(1) Costs of disposals, impairments and reclassifications to property under development are reflected as reductions to cost capitalized subsequent to acquisition. Reclassifications from property under development are reflected as increases to cost capitalized subsequent to acquisition.
F-40
LASALLE HOTEL PROPERTIES
Schedule III—Real Estate and Accumulated Depreciation—Continued
As of December 31, 2015
Reconciliation of Real Estate and Accumulated Depreciation:
Reconciliation of Real Estate: | |||
Balance at December 31, 2012 | $ | 3,885,289 | |
Acquisition of hotel properties | 349,802 | ||
Improvements and additions to hotel properties | 108,034 | ||
Reclassification from property under development | 16,317 | ||
Disposal of assets | (8,369 | ) | |
Balance at December 31, 2013 | $ | 4,351,073 | |
Acquisition of hotel properties | 194,198 | ||
Improvements and additions to hotel properties | 66,706 | ||
Reclassification from property under development | 14,163 | ||
Disposal of hotels | (130,846 | ) | |
Disposal of assets | (1,220 | ) | |
Balance at December 31, 2014 | $ | 4,494,074 | |
Acquisition of hotel properties | 445,734 | ||
Improvements and additions to hotel properties | 93,599 | ||
Reclassification from property under development | 30,343 | ||
Disposal of assets | (16,488 | ) | |
Balance at December 31, 2015 | $ | 5,047,262 | |
Reconciliation of Accumulated Depreciation: | |||
Balance at December 31, 2012 | $ | 832,245 | |
Depreciation | 143,560 | ||
Disposal of assets | (7,920 | ) | |
Balance at December 31, 2013 | $ | 967,885 | |
Depreciation | 154,585 | ||
Disposal of hotels | (56,130 | ) | |
Disposal of assets | (822 | ) | |
Balance at December 31, 2014 | $ | 1,065,518 | |
Depreciation | 180,346 | ||
Disposal of assets | (16,278 | ) | |
Balance at December 31, 2015 | $ | 1,229,586 | |
F-41